assessment of stability and discrimination capacity of
TRANSCRIPT

Assessment of Stability and Discrimination Capacityof Radiomic Features on Apparent Diffusion Coefficient Images
Marco Bologna1 & Valentina D. A. Corino1& Eros Montin1
& Antonella Messina2 & Giuseppina Calareso2&
Francesca G. Greco2& Silvana Sdao2
& Luca T. Mainardi1
Published online: 3 May 2018# The Author(s) 2018
AbstractThe objectives of the study are to develop a new way to assess stability and discrimination capacity of radiomic features withoutthe need of test-retest or multiple delineations and to use information obtained to perform a preliminary feature selection.Apparent diffusion coefficient (ADC) maps were computed from diffusion-weighted magnetic resonance images (DW-MRI)of two groups of patients: 18 with soft tissue sarcomas (STS) and 18 with oropharyngeal cancers (OPC). Sixty-nine radiomicfeatures were computed, using three different histogram discretizations (16, 32, and 64 bins). Geometrical transformations(translations) of increasing entity were applied to the regions of interest (ROIs), and the intra-class correlation coefficient(ICC) was used to compare the features computed on the original and modified ROIs. The distribution of ICC values for minimaland maximal entity translations (ICC10 and ICC100, respectively) was used to adjust thresholds of ICC (ICCmin and ICCmax) usedto discriminate between good, unstable (ICC10 < ICCmin), and non-discriminative features (ICC100 > ICCmax). Fifty-four and 59radiomic features passed the stability-based selection for all the three histogram discretizations for the OPC and STS datasets,respectively. The excluded features were similar across the different histogram discretizations (Jaccard’s index 0.77 ± 0.13 and0.9 ± 0.1 for OPC and STS, respectively) but different between datasets (Jaccard’s index 0.19 ± 0.02). The results suggest that theobserved radiomic features are mainly stable and discriminative, but the stability depends on the region of the body underobservation. The method provides a way to assess stability without the need of test-retest or multiple delineations.
Keywords Apparent diffusion coefficient maps . Radiomics . Radiomic features stability . Magnetic resonance imaging .
Intra-class correlation coefficient
Introduction
Radiomics is an emerging field in quantitative imaging thatuses image features to objectively and quantitatively de-scribe tumor phenotypes [1]. The underlying hypothesis
of radiomics is that such features could capture informationnot currently available using simple radiological analysis[2]. Radiomic features are non-invasively obtained on im-ages that are part of the process of tumor evaluation andtreatment, such as computed tomography (CT), magneticresonance imaging (MRI), and positron emission tomogra-phy (PET). Thus, radiomic analysis could be performedwithout the need of further specific exams. Moreover, tra-ditional histological analysis based on tissue samples, ob-tained through biopsies, cannot capture the heterogeneityof the whole tumor. On the other hand, radiomics, analyz-ing the entire tumor, can provide a complete and quantita-tive description of tumor heterogeneity, which may haveprofound implications for drug therapy in cancer [3]. All ofthe previous advantages make radiomics a technique ofinterest for tumor characterization. As a matter of fact,radiomics has already found a wide range of possible ap-plications [4–14] such as prediction of clinical outcomes
Electronic supplementary material The online version of this article(https://doi.org/10.1007/s10278-018-0092-9) contains supplementarymaterial, which is available to authorized users.
* Marco [email protected]
1 Departement of Electronics, Information and Bioengineering,Milan, Italy
2 Fondazione IRCCS Istituto Nazionale dei Tumori, Milan, Italy
Journal of Digital Imaging (2018) 31:879–894https://doi.org/10.1007/s10278-018-0092-9

and response to treatment, tumor staging, discrimination ofdifferent types of tumor tissues, and assessment of cancergenetics.
The number of features used in radiomic studies mayrange from just a few [15] to several hundred [6].However, not all the hundreds of extracted features bringinformation: some may be irrelevant or unreliable for theclinical question of interest. A process of feature selectionis therefore necessary.
Stability analysis, assessing the robustness of the fea-tures, is a preliminary step in the process of feature selec-tion [6, 12, 16]. Radiomic features stability can be investi-gated in several ways: (1) test-retest [6, 12, 16–23]; (2)multiple delineations of the region of interest (ROI)representing the tumor [6, 18, 21]; (3) change in imagereconstruction and automatic segmentation parameters inPET or CT studies [20–22, 24, 25]; (4) change in imageacquisition techniques [20, 24]; (5) inter-machine repro-ducibility [20, 26]. The most common techniques that areused for preliminary feature selection are typically the firsttwo [6, 12, 16]. However, there are several problemsconcerning the different types of stability analysis.Different acquisitions are required to perform a propertest-retest analysis and the same thing can be said for ana-lyzing stability to acquisition parameters and inter-machinereproducibility. Such requirements make the implementa-tion of those types of analyses in the clinical routine. Theanalysis of stability to multiple delineations does not needmultiple image acquisition, but drawing multiple ROIs onthe same set of images can be very time-consuming. Tosolve the latter problem, alternative approaches may beconsidered. For example, in [12], stability is assessedthrough small geometrical transformations of the ROIs,which are used to mimic multiple manual delineations. In[27], the stability analysis is performed by comparingradiomic features computed on the entire ROI, and on aBdigital biopsy,^ i.e., a small portion of the ROI that is largeenough to capture the heterogeneity of the tumor. Last,comparison of radiomic features obtained with multipleinitialization of a semi-automatic segmentation algorithmor with different segmentation algorithms (like in [28])could potentially be used for stability assessment.Although these approaches strongly reduce the amount ofmanual work necessary for a stability analysis of theradiomic features, they cannot be used to evaluate the dis-criminative power.
In the current study, we perform an analysis similar to theone presented in [12], so that stability of radiomic featurescould be evaluated starting with just one acquisition and oneROI. In addition to ROI transformations that are small andthus can mimic errors due to manual delineation, we applyalso large geometrical transformations to evaluate featuresdiscrimination capacity. Our hypothesis is that features that
do not change their values for large transformations are irrel-evant and should therefore be excluded.
In this study, diffusion-weighted MRI (DW-MRI) of twodifferent tumor types (oropharyngeal cancers and soft tis-sue sarcomas) are analyzed. DW-MRI have been chosenbecause they can be used to compute maps of apparentdiffusion coefficient (ADC), which have been shown tobe very useful for tumor detection and characterization[11, 29, 30], evaluation of treatment response [5, 31], andtumor staging [8, 32]. Also, unlike other types of MRI,ADC maps have been shown to be useful to assess tumorcellularity, even across different scanners [33], providedthat the same range of b values and the same field strengthare used [34, 35].
The aim of the present study is to provide a method toperform a preliminary feature selection based on features sta-bility. An innovative characteristic of the method is that it doesnot require either multiple acquisitions or multiple manualdelineations.
Material and Methods
Study Population
In this study, two different datasets were retrospectivelyanalyzed: the first one contains DW-MRI images of softtissue sarcomas (STS); the second one contains DW-MRIimages of oropharyngeal cancer (OPC). The two datasetsare provided by the Fondazione IRCCS Istituto Nazionaledei Tumori (Milan, Italy).
Both datasets consisted of 18 patients who underwent anMRI acquisition before starting the treatment. Both studieswere approved by the ethical committee of FondazioneIRCCS Istituto Nazionale dei Tumori (Milan, Italy) and con-ducted in accordance with the Helsinki Declaration; all pa-tients gave their written informed consent. All patients’ datawere anonymized prior to the analysis.
Image Acquisition
STS Dataset
DW-MRI images were acquired using Achieva 1.5 T system(Philips Medical system, Eindhoven, Netherlands)—5 pa-tients—or a Magnetom Avanto 1.5 T system (SiemensMedical Solutions, Erlangen, Germany)—13 patients—bothwith a body-matrix coil and spine array coil for signal recep-tion. The data were acquired axially by means of echo planarimaging. The sequences’ parameters (for both equipment) arereported in Table 1. Diffusion-weighted images (DWI) wereacquired using four b values (50, 400, 800, and 1000 s/mm2).
880 J Digit Imaging (2018) 31:879–894

OPC Dataset
DWI were acquired using Magnetom Avanto 1.5 T system(Siemens Medical Solutions, Erlangen, Germany). The se-quence parameters are reported in Table 1. DWI images wereacquired using ten b values 0, 10, 20, 50, 70, 100, 150, 200,500, and 1000 (s/mm2).
Image Processing
For both the datasets, ADCmaps were computed. The ADCwas defined as the slope of the linear regression of thelogarithm of the DWI exponential signal decay on the bvalues [36]. The calculation was performed pixel-wiseusing ITK 4.8 [3].
For the both datasets, the segmentation of the gross tumorvolume (GTV) was performed by an expert radiologist on theDW-MRI computed with the lowest b value, where the tumoris the most visible. The preprocessing steps were performedusing 3D Slicer [37].
Radiomic Feature Extraction
In this study, 69 radiomic features were computed, pertainingto two main categories: (1) intensity-based and (2) texture-based. The complete list is reported in Table 2.
Features belonging to the intensity-based group (first-order statistics or FOS) included statistical informationabout the signal intensity and histogram distribution ofthe pixels in the ROI. The histogram was evaluated be-tween 0 and 4000 *10−6 mm2/s using N bins. In this study,three values of N were tested (16, 32, and 64 bins) toevaluate whether the bin number affects the stability ofthe features.
Texture-based features were computed on the gray-levelco-occurrence matrix (GLCM) [38] and the gray-level runlength matrix (GLRLM) [39]. For a given direction α, theGLCM is a NxN matrix, whose (i, j) element is the counting
of pixels of gray intensity level i which are adjacent (withina distance ρ) to pixels of the gray intensity level j. TheGLRLM is an NxN matrix whose (i, j) element counts thenumber of runs of pixels of gray level i (run step 1) and runlength j in a given direction. The same bin numbers (16, 32,and 64) used for FOS analysis were used for textural fea-tures computation. Range of ADC values for histogramcreation was also the same (0–4000 *10−6 mm2/s). A dis-tance ρ = 1 was used to create the GLCMs and GLRLMs.
For each patient, GLCMs and GLRLMs were created on13 different directions. Textural features of Table 2 werecomputed on each matrix and the results averaged acrossall angles, thus obtaining two sets of features, one for theGLCM and one for the GLRLM. This average of the 13different value is already been used in literature (see sup-plementary material of [6]) and it allows to deal with alower dimensional features space (only one feature is con-sidered instead of 13). All the algorithms were implementedin ITK 4.8 [3, 40].
Globally, 37 FOS, 21 GLCM-based, and 11 GLRLM-based features (69 in total) were considered for this anal-ysis. Fifty-seven features out of 69 were bin-dependentand thus were computed three times, one for each histo-gram discretization.
Stability and Discrimination Capacity Analysis
We developed a framework to assess features stability anddiscrimination capacity that is based on geometrical transfor-mations (translations in particular) of the ROIs representingthe GTV. The entire workflow was implemented inMATLAB2016b (Mathworks, Natick, MA, USA).
First, small entity translations were applied to the ROIs,along both the x (medial-lateral) and y (antero-posterior) di-rections. By small entity, we mean translations of ± 10% of thelength of the bounding box surrounding the ROI in the direc-tion of interest (Fig. 1a). We will also refer to this type oftranslation as minimal entity translation. We assume the
Table 1 MRI sequenceparameters by MRI scanners Sequence parameter STS database OPC database
Siemens Avanto(n = 13)
Philips Achieva(n = 5)
Siemens Avanto(n = 18)
Sequence name ep2d dwi_ssh ep2d
Matrix (pixels) 192 × 192 255 × 255 132 × 132
Resolution (voxel/mm) 1.98 × 198 1.37 × 1.37 1.89 × 1.89
Field of view (mm) 380 × 380 350 × 350 250 × 250
Repetition time (msec) 5400 7410 3300
Echo time (msec) 78 63 64
Slice thickness (mm) 4 (no gap) 5 (no gap) 3 (gap 0.9)
Number of excitations 4 3 3
J Digit Imaging (2018) 31:879–894 881

variability due to such transformations to be comparable to theones that could appear in a multiple delineations test. In total,for each ROI, four minimal entity translations were applied(one positive and one negative for both the x and y directions)and thus four transformed ROIs were obtained. The radiomicfeatures were computed on the four transformed ROIs andcompared to the ones obtained with the original one (the onesegmented by the radiologist). Radiomic features were thencompared using two similarity indexes: (1) percentage varia-tion and (2) intra-class correlation coefficient (ICC).
For each comparison, the absolute percentage variationwith respect to the reference was computed as follows:
Diff% ¼ jFTransf−FOriginaljFOriginal
��
��
� 100 ð1Þ
being FTransf and FOriginal the features computed on thetransformed and original ROIs, respectively.
The ICC was computed as in [41, 42]: it measures the bivar-iate relation of variables representing different measurementclasses and can be used to assess the agreement between data.The maximum value of ICC is 1, which indicates perfect agree-ment. The lower the ICC, the lower the similarity among theelements of the groups. In this study, a two-way mixed effectmodel was used (since the effect of the transformations is fixedand the variability for the different ROIs is random) [42].
For each feature, it is possible to compute 72 percentagevariations (18 ROIs with 4 translations each) and 4 ICCs (onefor each translation) and to compute the mean and standarddeviation for both the distributions. Let us call the meanvalues obtained with such procedure ICCmean and Diff%mean.
We repeat the above-described steps for increasing transla-tion entities ranging from 10% (minimal entity translations) to100% (maximal entity translations) with a step of 10%, andwe computed the ICCmean and Diff%mean of the features foreach translation, to evaluate how the similarity varies with the
Table 2 Radiomic featuresanalyzed in this study, divided bycategory
First-order statistics (FOS)
-Signal energy
-Signal kurtosis
-Signal mean absolute deviation(MAD)
-Signal maximum
-Signal mean
-Signal median
-Signal minimum
-Signal quantile 0.01
-Signal quantile 0.1
-Signal quantile 0.2
-Signal quantile 0.3
-Signal quantile 0.4
-Signal quantile 0.5
-Signal quantile 0.6
-Signal quantile 0.7
-Signal quantile 0.8
-Signal quantile 0.9
-Signal quantile 0.99
-Signal range
-Signal root mean square (RMS)
-Signal skewness
-Signal standard deviation (SD)
-Signal variance
-Histogram entropy
-Histogram kurtosis
-Histogram mean absolute deviation(MAD)
-Histogram maximum
-Histogram mean
-Histogram median
-Histogram minimum
-Histogram range
-Histogram root mean square(RMS)
-Histogram skewness
-Histogram standard deviation(SD)
-Histogram variance
-Histogram uniformity
-Histogram total frequency
Gray-level co-occurrence matrix (GLCM)
-Autocorrelation
-Cluster prominence
-Cluster shade
-Cluster tendency
-Contrast
-Correlation
-Difference entropy
-Dissimilarity
-Energy
-Entropy
-Homogeneity
-Homogeneity 2
-Information measure of correlation 1(IMOC1)
-Information measure of correlation 2(IMOC2)
-Inverse difference moment
-Inverse difference moment 2
-Inertia
-Inverse variance
-Max probability
-Sum average
-Sum entropy
Gray-level run length matrix (GLRLM)
-Gray-level non-uniformity
-High gray-level emphasis
-Long run emphasis
-Long run high gray-level em-phasis
-Long run low gray-level emphasis
-Low gray-level emphasis
-Run length non-uniformity
-Run percentage
-Short run emphasis
-Short run high gray-level em-phasis
-Short run low gray-level em-phasis
882 J Digit Imaging (2018) 31:879–894

entity of the translations. In Fig. 1b, an example of maximalentity (± 100%) translation is represented. As it can be seen,this situation is far from the error range obtainable with mul-tiple delineations. This type of transformation was used toevaluate discrimination capacity because, as previously stated,the underlying hypothesis is that if a feature remains constantindependently on the entity of the translation, that feature isnot going to be a good clinical descriptor.
ICCmean was used to select the features with properties ofstability and discrimination capacity. For this purpose, twoICC thresholds were used: a lower threshold for the ICC forthe minimal entity translations (ICCmin) and an upper ICCthreshold for the maximal entity translations (ICCmax). A fea-ture is considered stable if the ICCmean for the minimal entity
translations (ICC10) is larger than ICCmin (ICC10 ≥ ICCmin),and it is considered discriminative if the mean ICCmean for themaximal entity translations (ICC100) is lower than ICCmax
(ICC100 ≤ ICCmax).The two thresholds were set using information about the
distributions of ICC10 and ICC100. The values of ICC100 forboth the datasets and for all the bin discretizations are puttogether in the same histogram and, from this histogram, acontinuous probability distribution is obtained (see Fig. 2). Inparticular, the probability distribution is a non-parametric ker-nel distribution fitted using MATLAB function fitdist (normalkernel, bandwidth 0.05). The value 0.05 was chosen as a goodtradeoff to guarantee both smoothness of the curve and qualityof the fitting (p > 0.05 for a χ2 test). ICCmax was defined as the
Fig. 2 Continuous distribution fitted on the values of ICC100 (a) and ICC10 (b). In both cases, the reference quantile is marked with a line that divides theplot in two sections (discriminative/non-discriminative and stable/unstable respectively in a and b)
Fig. 1 Example of translationsapplied to the regions of interest(ROIs). a Example of small entitytranslation in the y direction. bExample of maximal entitytranslation in the x direction.Continuous lines represent thecontours of the original ROIs,while the dashed lines representthe contours of the modified ones
J Digit Imaging (2018) 31:879–894 883

quantile 0.9 of the continuous distribution previously defined.A similar procedure was used to define the ICCmin thresholdstarting from the histogram of all the ICC10, with the differencethat the quantile used as a reference was 0.1.
The stability and discrimination capacity analysis is repeat-ed 3 times, using 3 different bin numbers (16, 32, and 64 bins),to assess the effect of histogram discretization on the features.Jaccard’s index [43] was used to evaluate the similarity be-tween the sets of excluded features for the different histogramdiscretizations, but also to compare excluded features in thetwo datasets.
Results
The identified thresholds for ICCmin and ICCmax that wereidentified with the method explained in the previous sectionwere 0.78 and 0.46, respectively.
The heat maps in Figs. 3, 4, 5, 6, 7, and 8 show how thelevel of ICCmean varies with the entity of the translations in thetwo datasets. Figures 3, 4, and 5 show the ICCmean mapsrelated to the OPC dataset using the three different histogramsubdivisions, while Figs. 6, 7, and 8 show the ICCmean mapsfor the STS dataset. In Fig. 9a, examples of Diff%mean plot
Fig. 3 Heat map of the mean ICCmean displayed according to features(rows) and entity of the translations (columns). The heat map refers to theoropharyngeal cancers (OPC) dataset and to the radiomic features
computed with the 16-bin discretization. The features removed by theICC-based feature selection technique are marked with an asterisk inthe first column
884 J Digit Imaging (2018) 31:879–894

(with 95% confidence interval) for an unstable feature (signalquantile 0.1), a non-discriminative feature (short run empha-sis), and a feature that is selected by the algorithm (signalmean) in the STS dataset can be seen. In Fig. 9b, the plot ofICCmean (with 95% confidence interval) for the same featurescan be seen. Since it is not possible to represent all the valuesof percentage variations and ICC, we refer to Tables 1–20 inthe online resources, containing all the values of ICC10 and
ICC100, together with the corresponding percentagevariations.
Table 3 lists the features removed with our ICC-based fea-ture selection method. The six boxes show the results in thetwo datasets with each of the three histogram discretizations.The ICC-based feature selection method removes 8–15 fea-tures. If we consider the features that are stable for all the threehistogram discretizations, the method selects 54 features out
Fig. 4 Heat map of the mean ICCmean displayed according to features(rows) and entity of the translations (columns). The heat map refers to theoropharyngeal cancers (OPC) dataset and to the radiomic features
computed with the 32-bin discretization. The features removed by theICC-based feature selection technique are marked with an asterisk inthe first column
J Digit Imaging (2018) 31:879–894 885

of 69 for the OPC dataset and 59 features out of 69 for the STSdataset. Such features, divided by groups, are shown in theEuler-Venn diagrams in Fig. 10. If we take into account thethree subsets of the excluded features for the three histogramsubdivisions and we compute the Jaccard’s similarity indexfor the three possible combinations, we obtain a value of 0.77± 0.13 for the OPC dataset and 0.9 ± 0.1 for the STS dataset. Ifwe compare the set of excluded features for the OPC and STS
dataset for each of the three histogram discretizations, we get aJaccard’s index of 0.17 ± 0.03.
Discussion
The assessment of features stability is an important preliminarystep in any radiomic analysis. In this study, we developed a
Fig. 5 Heat map of the mean ICCmean displayed according to features(rows) and entity of the translations (columns). The heat map refers to theoropharyngeal cancers (OPC) dataset and to the radiomic features
computed with the 64-bin discretization. The features removed by theICC-based feature selection technique are marked with an asterisk inthe first column
886 J Digit Imaging (2018) 31:879–894

new method to assess the stability and the discrimination ca-pacity of radiomic features computed from medical images (inthis case DW-MRI images). In particular, we proposed a fastway to assess features stability and discrimination capacitywithout the need of multiple acquisitions or multiple delinea-tions, thus performing a preliminary step of feature selection.
Both in STS and OPC datasets, features can be divided inthree groups: (I) features whose ICC decreases gradually butconstantly; (II) features whose ICC sharply decreases; (III)
features that remain similar for all translations. These threegroups can be approximately considered as (I) the stable anddiscriminative features, (II) unstable features, and (III) stableand non-discriminative features, respectively.
In the STS dataset, the ICC-based feature selectionremoves the features in group II (unstable features) and manyof the ones of group III (non-discriminative features).However, there are some features for which ICC100 is slightlyunder the threshold that are therefore not considered as non-
Fig. 6 Heat map of the mean ICCmean displayed according to features(rows) and entity of the translations (columns). The heat map refers to thesoft tissue sarcoma (STS) dataset and to the radiomic features computed
with the 16-bin discretization. The features removed by the ICC-basedfeature selection technique are marked with an asterisk in the first column
J Digit Imaging (2018) 31:879–894 887

discriminant (histogram total frequency and some GLRLM-based features matrix). Some of these features are removed forsome of the histogram discretizations (e.g., short and long runemphasis).
Something similar can be said for the features in the OPCdataset in Figs. 3, 4, and 5. There are features, like signalenergy, gray-level non-uniformity, and run length non-unifor-mity, that are removed because they remain very similar inside
and outside the tumor. There are also features, like signalminimum, that are too unstable and drastically change evenfor small translations. Some features, like the informationmeasures of correlation, present an ICC that is very close tothe threshold and therefore they are excluded just for somehistogram discretizations. Two features (entropy and energy)strongly change their behavior according to histogramdiscretization. It can be seen that for 16-bin discretization,
Fig. 7 Heat map of the mean ICCmean displayed according to features(rows) and entity of the translations (columns). The heat map refers to thesoft tissue sarcoma (STS) dataset and to the radiomic features computed
with the 32-bin discretization. The features removed by the ICC-basedfeature selection technique are marked with an asterisk in the first column
888 J Digit Imaging (2018) 31:879–894
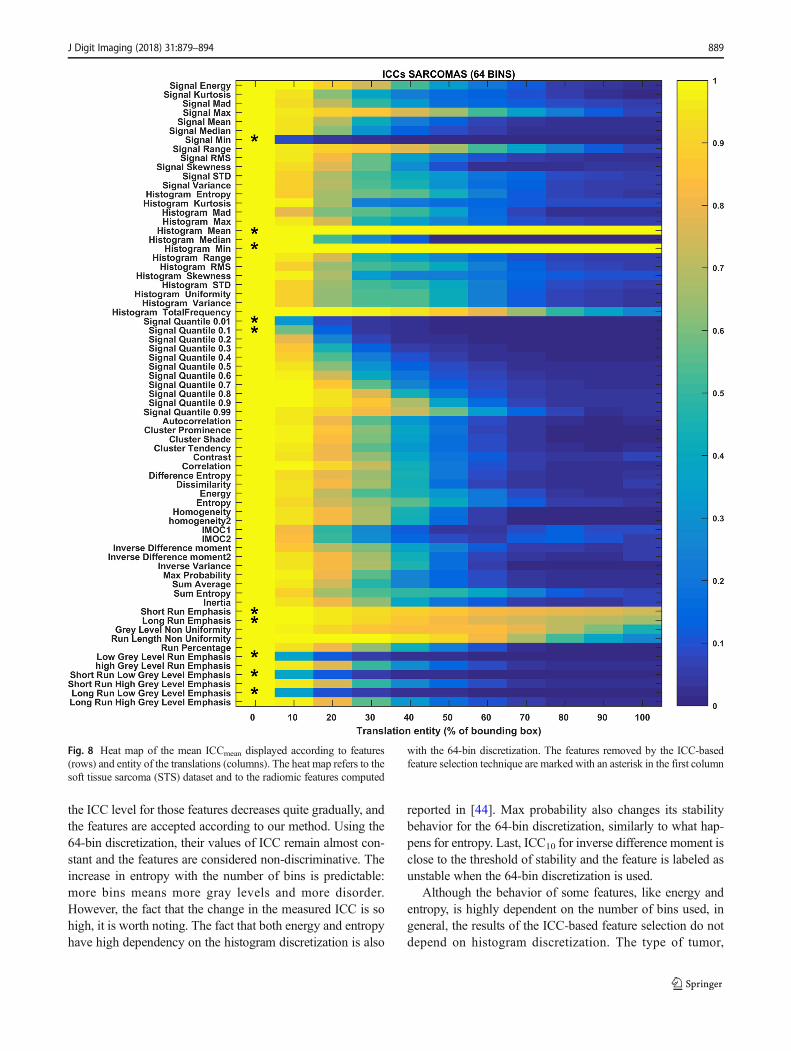
the ICC level for those features decreases quite gradually, andthe features are accepted according to our method. Using the64-bin discretization, their values of ICC remain almost con-stant and the features are considered non-discriminative. Theincrease in entropy with the number of bins is predictable:more bins means more gray levels and more disorder.However, the fact that the change in the measured ICC is sohigh, it is worth noting. The fact that both energy and entropyhave high dependency on the histogram discretization is also
reported in [44]. Max probability also changes its stabilitybehavior for the 64-bin discretization, similarly to what hap-pens for entropy. Last, ICC10 for inverse difference moment isclose to the threshold of stability and the feature is labeled asunstable when the 64-bin discretization is used.
Although the behavior of some features, like energy andentropy, is highly dependent on the number of bins used, ingeneral, the results of the ICC-based feature selection do notdepend on histogram discretization. The type of tumor,
Fig. 8 Heat map of the mean ICCmean displayed according to features(rows) and entity of the translations (columns). The heat map refers to thesoft tissue sarcoma (STS) dataset and to the radiomic features computed
with the 64-bin discretization. The features removed by the ICC-basedfeature selection technique are marked with an asterisk in the first column
J Digit Imaging (2018) 31:879–894 889

instead, strongly affects the excluded features. There are onlythree common features between the datasets. Signal minimumis unstable as it can be expected since it is an extreme value ofa distribution. Histogram mean is always constant throughoutall the translation because it only depends on the number ofbins. Histogram minimum is 0 when there is at least one emp-ty bin in the histogram, which is very common; therefore, thefeature is non-discriminative. This is true at least for the his-togram subdivisions that were used in this study.
To our knowledge, this is the first time that both small andlarge translations of the ROI are used to evaluate fatures sta-bility and discriminative power respectively. It is also the firsttime in which the thresholds of ICC used to distinguish thetype of feature (stable, unstable, or non-discriminative) are notempirically set.
The values of ICC for small transformations computedfor the radiomic features analyzed in this study are around0.9 (median 0.94, quartiles 0.89 and 0.97). In [12], similarvalues of ICC are found for the stable features (median0.97, quartiles 0.92 and 0.99). The Mann-Whitney test re-veals no significant difference between the ICC values ofthe stable features identified in the current study and in [12](p = 0.92). However, a smaller number of features is actu-ally stable (18 out of 79). This could depend from the factthat in the present study and [12], the features set used is notthe same.
Compared to a study in which features stability is assessedthrough multiple manual delineation, like [18], the values of
ICC found for small translations are higher than the onesfound for multiple delineations (median 0.94 vs median0.89,Mann-Whitney test p < 0.01). The initial assumption thatthe low entity translations are equivalent to multiple delinea-tions in terms of evaluating stability seems to be rejected, eventhough the differences in the ICC values could also depend onthe different imaging technique (MRI vs PET) and in the dif-ferent region of the body analyzed (lung vs limbs and headand neck). According to such findings, our method is poten-tially less restrictive for the assessment of stability, but for thisreason, we can be sure that the features that we identify asunstable are indeed unstable. Moreover, if a more restrictivemethod is required, the translation considered for stabilityanalysis could be increased to 15–20% of the bounding box.
In this paper, as opposed to [12], we presented only trans-lations of the ROIs and we did not show the effect of rotation,dilatation, and shrinking. Those types of transformations werealso applied in our investigation but their use did not influencethe results of the ICC-based feature selection method, andtherefore they were not reported (for further details, refer tothe Tables 21–60 of the online resources).
The method presented in this study has some advantagesover other methods of literature. Compared to [27], it doesnot need a digital biopsy, which requires a further segmen-tation step, although a digital biopsy takes less time to besegmented than a normal ROI. Compared to a method basedon [28], it requires no segmentation algorithm, which can bedifficult to design for oropharyngeal tumors. Last, the presented
Fig. 9 Plot representing the variation with respect to entity of translationfor 3 different radiomic features measured on the soft tissue sarcoma(STS) dataset, with 16-bin discretization. aAbsolute percentage variationplot. b ICC variation. One representative of each group of feature is
represented: signal mean (squared markers) is both stable and discrimi-native; signal quantile 0.1 (circular markers) is unstable; short run em-phasis (asterisks) is non-discriminative. Both mean values and 95% con-fidence interval are shown
890 J Digit Imaging (2018) 31:879–894

method allows to evaluate not only stability, but also the dis-criminative power of the features, which is something that, tothe knowledge of the authors, was never considered before.
This study highlights the difference in stability of theradiomic features for tumors in different regions of the body,which is not typically done. As a matter of fact, the majority ofthe studies on stability of radiomic features focuses on tumorsin a specific region of the body: esophagus [17], liver [19],brain [12], lung [22], or kidney [23]. A study analyzing mul-tiple body regions exists [24], but even though the data comefrom multiple sources, they are analyzed all together and dif-ferentiation in the stability behavior for the different bodyregions is not explored. In this paper, we observed thatradiomic features from tumors in the head and neck region(OPC dataset) present in general lower stability to small trans-lations than tumors in the limbs (STS dataset). In fact, thevalues of ICCs for small translations are significantly higherin the STS dataset (Wilcoxon signed rank test p < 0.01; seealso online resources, Tables 1–20). This result could come
from the fact that sarcomas have larger volume and smalltranslations have less effect on features that are computed onthe entire ROI. The opposite happens when we consider theICCs for large transformations (Wilcoxon signed rank testp < 0.01; see also online resources, Tables 1–20). Thiscould depend from the fact that the contrast between tumor-al and healthy tissue in ADC images is different for the twotypes of cancer. As a matter of fact, sarcomas have highercontrast and are much easier to distinguish, rather than headand neck tumors.
We think that the presented study could provide a betterunderstanding of radiomic features stability for DW-MRI. It isworth underlining that this methodology should be used justas a preliminary feature selection. In fact, of the 69 radiomicfeatures that were analyzed, only 8–15 are excluded by ouralgorithm, which is about 10–20% of the total number fea-tures. In order to further reduce the number of selected fea-tures, a possible approach could be to add a correlation-based(as shown in [16]) or a wrapper feature selection method after
Table 3 Features removed by theICC-based feature selectionalgorithm
16 bins 32 bins 64 bins
OPC dataset
-Signal energy
-Signal minimum
-Signal range
-Histogram mean
-Histogram median
-Histogram minimum
-Histogram total frequency
-Information measure ofcorrelation 1 (IMOC1)
-Gray-level non-uniformity
-Run length non-uniformity
-Signal energy
-Signal minimum
-Signal range
-Histogram mean
-Histogram median
-Histogram minimum
-Histogram total frequency
-Information measure ofcorrelation 1 (IMOC1)
-Information measure ofcorrelation 2 (IMOC2)
-Gray-level non-uniformity
-Run length non-uniformity
-Signal energy
-Signal minimum
-Signal range
-Histogram mean
-Histogram median
-Histogram minimum
-Histogram total frequency
-Energy
-Entropy
-Information measure ofcorrelation 1 (IMOC1)
-Information measure ofcorrelation 2 (IMOC2)
-Inverse difference moment
-Max probability
-Gray-level non-uniformity
-Run length non-uniformity
STS dataset
-Signal minimum
-Signal quantile 0.01
-Signal quantile 0.1
-Histogram mean
-Histogram minimum
-Short run emphasis
-Low gray-level run emphasis
-Short run low gray-level emphasis
-Long run low gray-level emphasis
-Signal minimum
-Signal quantile 0.01
-Signal quantile 0.1
-Histogram mean
-Histogram minimum
-Low gray-level run emphasis
-Short run low gray-level emphasis
-Long run low gray-level emphasis
-Signal minimum
-Signal quantile 0.01
-Signal quantile 0.1
-Histogram mean
-Histogram minimum
-Short run emphasis
-Long run emphasis
-Low gray-level run emphasis
-Short run low gray-level emphasis
-Long run low gray-level emphasis
J Digit Imaging (2018) 31:879–894 891

892 J Digit Imaging (2018) 31:879–894

the ICC-based analysis. A limitation of this approach is that itcannot be used for geometrical features like shape and size orlocation (which are also used in [16]) since the shape and sizeof each ROI are kept constant throughout all the experiment,while the ROI location is changed. A possible solution to thiscould be to apply random combination of geometrical trans-formations to mimic the effects of random multiple delinea-tions or ROI registration, and we plan to investigate this infurther studies.
Conclusion
In this study, a method to assess the stability and the discrim-ination capacity of the radiomic features has been developed,using small and large translations of the ROI. The method wasapplied to two independent datasets containing DW-MRI im-ages of different tumors (oropharyngeal tumors and sarco-mas). The proposed method excluded 10–20% of the originalfeatures set.
We think that the presented study could provide a betterunderstanding of radiomic features stability and discrimina-tion capacity for DW-MRI, providing a way to assess featuresstability without the need of multiple acquisitions ordelineations.
Compliance with Ethical Standards
Both studies were approved by the ethical committee of FondazioneIRCCS Istituto Nazionale dei Tumori and conducted in accordance withthe Helsinki Declaration; all patients gave their written informed consent.All patients’ data were anonymized prior to the analysis.
Open Access This article is distributed under the terms of the CreativeCommons At t r ibut ion 4 .0 In te rna t ional License (h t tp : / /creativecommons.org/licenses/by/4.0/), which permits unrestricted use,distribution, and reproduction in any medium, provided you giveappropriate credit to the original author(s) and the source, provide a linkto the Creative Commons license, and indicate if changes were made.
References
1. Yip SSF, Aerts HJWL: Applications and limitations of radiomics.Phys. Med. Biol. 61:R150–R166, 2016
2. Lambin P, Rios-Velazquez E, Leijenaar R, Carvalho S, VanStiphout RGPM, Granton P, Zegers CML, Gillies R, Boellard R,Dekker A, Aerts HJW: Radiomics: extracting more informationfrom medical images using advanced feature analysis. Eur. J.Cancer. 48:441–446, 2012
3. Fisher R, Pusztai L, Swanton C: Cancer heterogeneity: implicationsfor targeted therapeutics. Br. J. Cancer. 108:479–485, 2013
4. Zhang H, Tan S, Chen W, Kligerman S, Kim G, D’Souza WD,SuntharalingamM, LuW: Modeling pathologic response of esoph-ageal cancer to chemoradiotherapy using spatial-temporal 18F-FDG PET features, clinical parameters, and demographics. Int. J.Radiat. Oncol. Biol. Phys. 88:195–203, 2014
5. Lambrecht M, Van Calster B, Vandecaveye V, De Keyzer F,Roebben I, Hermans R, Nuyts S: Integrating pretreatment diffusionweighted MRI into a multivariable prognostic model for head andneck squamous cell carcinoma. Radiother. Oncol. 110:429–434,2014
6. Aerts HJWL, Velazquez ER, Leijenaar RTH, Parmar C, GrossmannP, Cavalho S, Bussink J, Monshouwer R, Haibe-Kains B, RietveldD, Hoebers F, Rietbergen MM, Leemans CR, Dekker A,Quackenbush J, Gillies RJ, Lambin P: Decoding tumour phenotypeby noninvasive imaging using a quantitative radiomics approach.Nat. Commun. 5, 2014
7. Ganeshan B, Skogen K, Pressney I, Coutroubis D, Miles K:Tumour heterogeneity in oesophageal cancer assessed by CT tex-ture analysis: preliminary evidence of an association with tumourmetabolism, stage, and survival. Clin. Radiol. 67:157–164, 2012
8. Kierans AS, Rusinek H, Lee A, Shaikh MB, Triolo M, HuangWC,Chandarana H: Textural differences in apparent diffusion coeffi-cient between low- and high-stage clear cell renal cell carcinoma.Am. J. Roentgenol. 203:W637–W644, 2014
9. Mu, W., Chen, Z., Liang, Y., Shen, W., Yang, F., Dai, R., Wu, N.,Tian, J.: Staging of cervical cancer based on tumor heterogeneitycharacterized by texture features on 18 F-FDG PET images. Phys.Med. Biol. 60, 5123–5139 (2015).
10. Xu, R., Kido, S., Suga, K., Hirano, Y., Tachibana, R., Muramatsu,K., Chagawa, K., Tanaka, S.: Texture analysis on 18F-FDG PET/CT images to differentiate malignant and benign bone and soft-tissue lesions. Ann. Nucl. Med. 28, 926–935 (2014).
11. Wibmer A, Hricak H, Gondo T, Matsumoto K, Veeraraghavan H,Fehr D, Zheng J, Goldman D, Moskowitz C, Fine S, Reuter VE,Eastham J, Sala E, Vargas HA: Haralick texture analysis of prostateMRI: utility for differentiating non-cancerous prostate from prostatecancer and differentiating prostate cancers with different Gleasonscores. Eur. Radiol. 25:2840–2850, 2016
12. Gevaert, O., Mitchell, L. a, Achrol, A.S., Xu, J., Echegaray, S.,Steinberg, G.K., Cheshier, S.H., Napel, S., Zaharchuk, G.,Plevritis, S.K.: Glioblastoma multiforme: exploratoryradiogenomic analysis by using quantitative image features.Radiology. 273, 168–175 (2014).
13. Gutman DA, Dunn WD, Grossmann P, Cooper LAD, Holder CA,Ligon KL, Alexander BM, Aerts HJWL: Somatic mutations asso-ciated with MRI-derived volumetric features in glioblastoma.Neuroradiology. 57:1227–1237, 2015
14. Corino VDA, Montin E, Messina A, Casali PG, Gronchi A,Marchianò A, Mainardi LT: Radiomic analysis of soft tissues sar-comas can distinguish intermediate from high-grade lesions. J.Magn. Reson. Imaging. 47:829–840, 2017
15. King, A.D., Chow, K.-K., Yu, K.-H., Mo, F.K.F., Yeung, D.K.W.,Yuan, J., Bhatia, K.S., Vlantis, A.C., Ahuja, A.T.: Head and necksquamous cell carcinoma: diagnostic performance of diffusion-weighted MR imaging for the prediction of treatment response.Radiology. 266, 531–538 (2013).
16. Balagurunathan, Y., Gu, Y., Wang, H., Kumar, V., Grove, O.,Hawkins, S., Kim, J., Goldgof, D.B., Hall, L.O., Gatenby, R.A.,Gillies, R.J.: Reproducibility and prognosis of quantitative featuresextracted from CT images. Transl. Oncol. 7, 72–87 (2014).
17. Tixier F, Hatt M, Le Rest CC, Le Pogam A, Corcos L, Visvikis D:Reproducibility of tumor uptake heterogeneity characterizationthrough textural feature analysis in 18F-FDG PET. J. Nucl. Med.53:693–700, 2012
Fig. 10 Euler-Venn diagram representing the accepted features dividedby group. a First-order statistics. b Gray-level co-occurrence matrix. cGray-level run length matrix. Selected features are grouped by dataset:the soft tissue sarcoma (STS) dataset and oropharyngeal cancer (OPC)dataset
R
J Digit Imaging (2018) 31:879–894 893

18. Leijenaar RTH, Carvalho S, Velazquez ER, Van Elmpt WJC,Parmar C, Hoekstra OS, Hoekstra CJ, Boellaard R, DekkerALAJ, Gillies RJ, Aerts HJWL, Lambin P: Stability of FDG-PETradiomics features: an integrated analysis of test-retest and inter-observer variability. Acta Oncol. (Madr). 52:1391–1397, 2013
19. Van Velden FHP, Nissen IA, Jongsma F, Velasquez LM, Hayes W,Lammertsma AA, Hoekstra OS, Boellaard R: Test-retest variabilityof various quantitativemeasures to characterize tracer uptake and/ortracer uptake heterogeneity in metastasized liver for patients withcolorectal carcinoma. Mol. Imaging Biol. 16:13–18, 2014
20. Hunter, L. a, Krafft, S., Stingo, F., Choi, H.,Martel,M.K., Kry, S.F.,Court, L.E.: High quality machine-robust image features: identifi-cation in nonsmall cell lung cancer computed tomography images.Med. Phys. 40, 121916 (2013).
21. van Velden FHP, Kramer GM, Frings V, Nissen IA, Mulder ER, deLangen AJ, Hoekstra OS, Smit EF, Boellaard R: Repeatability ofradiomic features in non-small-cell lung cancer [18F]FDG-PET/CTstudies: impact of reconstruction and delineation. Mol. ImagingBiol. 18:788–795, 2016
22. Zhao, B., Tan, Y., Tsai,W.Y., Qi, J., Xie, C., Lu, L., Schwartz, L.H.:Reproducibility of radiomics for deciphering tumor phenotype withimaging. Sci. Rep. 6, 1–7 (2016).
23. Antunes J, Viswanath S, Rusu M, Valls L, Hoimes C, Avril N,Madabhushi A: Radiomics analysis on FLT-PET/MRI for charac-terization of early treatment response in renal cell carcinoma: aproof-of-concept study. Transl. Oncol. 9:155–162, 2016
24. Galavis PE, Hollensen C, Jallow N, Paliwal B, Jeraj R: Variabilityof textural features in FDG PET images due to different acquisitionmodes and reconstruction parameters. Acta Oncol. (Madr). 49:1012–1016, 2010
25. He L, Huang Y, Ma Z, Liang C, Liang C, Liu Z: Effects of contrast-enhancement, reconstruction slice thickness and convolution kernelon the diagnostic performance of radiomics signature in solitarypulmonary nodule. Sci. Rep. 6:34921, 2016
26. Mackin D, Fave X, Zhang L, Fried D, Yang J, Taylor B, Rodriguez-Rivera E, Dodge C, Jones AK, Court L: Measuring computed to-mography scanner variability of radiomics features. Invest. Radiol.50:757–765, 2015
27. Echegaray S, Nair V, Kadoch M, Leung A, Rubin D, Gevaert O,Napel S: A rapid segmentation-insensitive Bdigital biopsy^ methodfor radiomic feature extraction: method and pilot study using CTimages of non–small cell lung cancer. Tomography. 2:283–294,2016
28. Kalpathy-Cramer J, Zhao B, Goldgof D, Gu Y, Wang X, Yang H,Tan Y, Gillies R, Napel S: A comparison of lung nodule segmenta-tion algorithms: methods and results from a multi-institutionalstudy. J. Digit. Imaging. 29:476–487, 2016
29. Holzapfel K, Duetsch S, Fauser C, Eiber M, Rummeny EJ, Gaa J:Value of diffusion-weighted MR imaging in the differentiation be-tween benign and malignant cervical lymph nodes. Eur. J. Radiol.72:381–387, 2009
30. Fruehwald-Pallamar J, Czerny C, Holzer-Fruehwald L, Nemec SF,Mueller-Mang C, Weber M, Mayerhoefer ME: Texture-based anddiffusion-weighted discrimination of parotid gland lesions on MRimages at 3.0 Tesla. NMR Biomed. 26:1372–1379, 2013
31. Sun, Y.S., Zhang, X.P., Tang, L., Ji, J.F., Gu, J., Cai, Y., Zhang,X.Y.: Locally advanced rectal carcinoma treated with preoperativechemotherapy and radiation therapy: preliminary analysis ofdiffusion-weighted MR imaging for early detection of tumor histo-pathologic downstaging. Radiology. 254, 170–178 (2010).
32. Vandecaveye V, De Keyzer F, Vander Poorten V, Dirix P, VerbekenE, Nuyts S, Hermans R: Head and neck squamous cell carcinoma:value of diffusion-weighted MR imaging for nodal staging.Radiology. 251:134–146, 2009
33. Jafar MM, Parsai A, Miquel ME: Diffusion-weighted magneticresonance imaging in cancer: reported apparent diffusion coeffi-cients, in-vitro and in-vivo reproducibility. World J. Radiol. 8:21–49, 2016
34. Belli G, Busoni S, Ciccarone A, Coniglio A, Esposito M, GiannelliM, Mazzoni LN, Nocetti L, Sghedoni R, Tarducci R, Zatelli G,Anoja RA, Belmonte G, Bertolino N, Betti M, Biagini C,Ciarmatori A, Cretti F, Fabbri E, Fedeli L, Filice S, Fulcheri CPL,Gasperi C, Mangili PA, Mazzocchi S, Meliadò G, Morzenti S,Noferini L, Oberhofer N, Orsingher L, Paruccini N, Princigalli G,Quattrocchi M, Rinaldi A, Scelfo D, Freixas GV, Tenori L, Zucca I,Luchinat C, Gori C, Gobbi G: Quality assurance multicenter com-parison of different MR scanners for quantitative diffusion-weighted imaging. J. Magn. Reson. Imaging. 43:213–219, 2016
35. Ye XH, Gao JY, Yang ZH, Liu Y: Apparent diffusion coefficientreproducibility of the pancreas measured at different MR scannersusing diffusion-weighted imaging. J. Magn. Reson. Imaging. 40:1375–1381, 2014
36. Padhani AR, Liu G, Mu-Koh D, Chenevert TL, Thoeny HC,Takahara T, Dzik-Jurasz A, Ross BD, Van Cauteren M, CollinsD, Hammoud DA, Rustin GJS, Taouli B, Choyke PL: Diffusion-weighted magnetic resonance imaging as a cancer biomarker: con-sensus and recommendations. Neoplasia. 11:102–125, 2009
37. Fedorov A, Beichel R, Kalpathy-Cramer J, Finet J, Fillion-RobinJC, Pujol S, Bauer C, Jennings D, Fennessy F, Sonka M, Buatti J,Aylward S, Miller JV, Pieper S, Kikinis R: 3D Slicer as an imagecomputing platform for the Quantitative Imaging Network. Magn.Reson. Imaging. 30:1323–1341, 2012
38. Haralick RM: Statistical and structural approaches to texture. Proc.IEEE. 67:786–804, 1979
39. Tang X: Texture information in run-length matrices. IEEE Trans.Image Process. 7:1602–1609, 1998
40. Yoo TS: Insight into images: principles and practice for segmenta-tion, registration, and image analysis. Natick, MA: AK Peters, 2004
41. Shrout PE, Fleiss JL: Intraclass correlations: uses in assessing raterreliability. Psychol. Bull. 86:420–428, 1979
42. Mcgraw KO: Forming inferences about some intraclass correlationcoefficients. Psychol. Methods. 1:30–46, 1996
43. Jaccard, P.: The distribution of the flora in the alpine zone. NewPhytol. 1912;11(2):37-50. New Phytol. 11, 37–50 (1912).
44. Leijenaar RTH, Nalbantov G, Carvalho S, Van Elmpt WJC, TroostEGC, Boellaard R, Aerts HJWL, Gillies RJ, Lambin P: The effectof SUV discretization in quantitative FDG-PET radiomics: the needfor standardized methodology in tumor texture analysis. Sci. Rep.5:1–10, 2015
894 J Digit Imaging (2018) 31:879–894