assessment of surface water quality using the water ... 225-244 jws-a-17-005.pdf · assessment of...
TRANSCRIPT

1H. Pham et al. / Journal of Water Sustainability 4 (2017) 225-244
Assessment of Surface Water Quality Using the Water Quality
Index and Multivariate Statistical Techniques – A Case Study:
The Upper Part of Dong Nai River Basin, Vietnam
Hung Pham1,4,*, Md. Mostafizur Rahman2, Nguyen Cong Nguyen3, Phu Le Vo4, Trung Le Van4, HuuHao Ngo5
1Department of Natural Resources and Environment Lam Dong Province, Da Lat 670000, Vietnam 2Graduate School of Environmental Science, Hokkaido University, Sapporo, Japan
3Faculty of Environment and Natural Resources, Da Lat University, Da Lat City 670000, Vietnam 4Faculty of Environment and Natural Resources, Ho Chi Minh City University of Technology, HCM 700000,
Vietnam 5School of Civil and Environmental Engineering, Faculty of Engineering and Information Technology, University
of Technology Sydney, Broadway, NSW 2007, Australia
ABSTRACT
Surface water resource in the Upper Part of Dong Nai (UPDN) River Basin has an important role for socio-economic
development of provinces in the Southeast region of Vietnam. The purpose of this paper is to determine the influence
of anthropogenic sources of pollutants on water quality parameters by using the integration solution between the
Water Quality Index (WQI) and multivariate statistical techniques. In this study, eight physico-chemical parameters
of surface water samples were collected from 42 monitoring sites in the UPDN for assessing spatial and temporal
water quality variations during the period of 2012-2016. WQI and the multivariate statistical techniques comprising
hierarchical cluster analysis (HCA), One-way analysis of variance (ANOVA), and Spearman correlation analysis
(SCA) were used to evaluate characteristics of surface water quality. The results revealed that surface water of the
river was moderately polluted and the water quality highly varied between monitoring sites and seasons. The study
also found that the concentrations of Total Suspended Solids (TSS) were the most prominent parameter affecting
water quality in the rainy season (r = -0.85). The proposed solution demonstrated integrated tools rather than the
conventional techniques in assessing the river water quality. This integration technique could be an efficient approach
to communicate information on water quality for the sustainable practices of watershed management in the Upper
Part of Dong Nai River Basin.
Keywords: The Upper Part of Dong Nai river; water quality index (WQI); multivariate statistical techniques
1. INTRODUCTION
The quality of surface water is highly affected by both natural and anthropogenic factors (Pejman et al., 2009). Polluted water carries a significant load of pollutants in dissolved and
particulate phases, that reflects the major influ-ences on the system, including: the lithology of the basin, anthropogenic inputs, atmospheric inputs and climatic conditions (Markicha and Browna, 1998; Shrestha and Kazama, 2007).
Journal of Water Sustainability, Volume 7, Issue 4, December 2017, 225-245
© University of Technology Sydney & Xi’an University of Architecture and Technology
*Corresponding to: [email protected]
DOI: 10.11912/jws.2017.7.4. 225-245

226 H. Pham et al. / Journal of Water Sustainability 4 (2017) 225-245
Human activities are the major factors deter-mining the quality of the surface water through effluent discharges, the use of agricultural chemicals and land use change (Niemi et al., 1990), whereas natural forces such as storm-water runoff events cause soil erosion which is a seasonal phenomenon, and is largely affected by climate, land cover, land slope, and soil resilience (Wischmeier and Smith, 1978). The natural processes and anthropogenic sources are multivariate and complex so that the assess-ment and management of surface water quality require a fundamental understanding of spatial and temporal variations of water characteris-tics, including hydrological regime, chemical and biological parameters (Phung et al., 2015). If the surface water is contaminated, its quality cannot be restored by preventing pollutants from these sources. Hence, a monitoring program, which can provide reliable estimation of water quality parameters, is a necessary scheme to protect water quality (Mullai et al., 2013;Phung et al., 2015; Yisa and Jimoh, 2010).
Along with the development of various statistical software on Windows (Statistical Package for Social Sciences SPSS, R-analysis software and Excel), the multivariate statistical techniques, such as Hierarchical Cluster Anal-ysis (HCA), Principal Component Analysis (PCA), Factor Analysis (FA) and Discriminant Analysis (DA) have widely been applied for characterizing and evaluating surface water quality in many previous studies (Islam et al., 2017; Shammi et al., 2017). These statistical techniques are useful for verifying temporal and spatial variations caused by natural and anthropogenic factors linked to seasonality (Hanh et al., 2010; Pejman et al., 2009;Phung et al., 2015; Shammi et al., 2016; Shrestha and Kazama, 2007;Varol et al., 2012; Wang et al., 2012). Additionally, One-way Analysis of Variance (ANOVA) was used to examine the significance of the mean differences of groups of monitoring sites and seasonal factors (Pham,
2017). Spearman correlation analysis (SCA) was used to assess the relationships among dependent and independent variables (physico-chemical parameters and WQI) (Eddlemon and Boopathy, 2013). In Vietnam, the QCVN 08-MT: 2015/BTNMT is currently being used as the national technical regulation on surface water quality (Pham, 2017). The monitoring program requires a large number of parameters to be measured, analyzed and interpreted using multivariate methods. In another way, the Water Quality Index (WQI), a single number expressing water quality by integrating meas-urement values of many physico-chemical parameters, can be used to indicate the overall status of surface water quality (Cude, 2001; MONRE, 2011; Said et al., 2004).
Worldwide, several national water quality indices have been developed to classify the relative quality of surface water such Canada, USA, and Asian countries. The WQI approach was developed by the US National Sanitation Foundation (NSF) in 1970, which is known as NSF-WQI. The NSF-WQI was firstly proposed by Horton, using the weighted arithmetic mean function based on 10 most commonly used water quality variables. This WQI is calculated by multiplying the value sub-index with the weight of each quality parameter (Hasan et al., 2015; Ichwana et al., 2016;Tyagi et al., 2013). Later, Canadian Council of Ministers of the Environment (CCME) also endorsed its WQI, the so-called CCME-WQI which provides a comprehensive way of expressing complex data on water quality. The CCME-WQI com-bines three aspects to evaluate the quality of water, including: scope, frequency and amplitude which is easily understood by the public, managers and policy makers (Lumbet al., 2006). Ray et al. (2015) applied the CCME WQI method for assessing water quality of Goalichara canal in Bangladesh. Further, the Bharvaga model was applied for developing WQI for surface water and groundwater sources with multiple water use practices such

H. Pham et al. / Journal of Water Sustainability 4 (2017) 225-245 227
as drinking and industrial purposes in India (Jerome and Pius, 2010; Parmar and Parmar, 2010; Ramarishnaiah et al., 2009). The number of selected water quality parameters is different from country to country, but in general, WQI approach is based on the weighted arithmetic method and the most common steps, including: parameter selection, determination of quality function (curve) of each parameter and sub-index aggregation with mathematical expression.
The selection of physico-chemical and biological parameters is carried out by the judgment of professional experts or govern-ment agencies that is determined in the legisla-tive area. It is claimed that the water quality parameters should be selected from 5 commonly recognized impairment categories, comprising (1) oxygen status and demand, (2) physical characteristics, (3) eutrophication, (4) health aspect, and (5) solid and dissolved substances (Nguyenet al., 2013; Tyagi et al., 2013). In fact, nine parameters, including temperature, pH, turbidity, faecal coliform, DO, COD, total phosphates (TP), NO3
--N and TSS were selected to calculate WQI in many river basins in the world (Tyagi et al., 2013). This approach is also widely exercised in Asian countries. Fourteen (14) parameters were selected to evaluate water quality of Perennial River, Tamirabarani, bay of Bengal (Mophin-Kani and Murugesan, 2011). Liou et al. (2004) selected thirteen (13) to generalize water qual-ity in Keya River, Taiwan. Nguyen et al. (2013) also assessed the quality of coastal waters in Ha Long Bay through nine parameters. Eight parameters were selected to determine the quality of Ciambulawung River, Indonesia (Effendi et al., 2015). India and Malaysia determined seven (7) and six (6) parameters to calculate WQI in KankariaLake at Ahmedabad (Kumar and Sharma, 2014) and Pelus River (Hasan et al., 2015), respectively. In generally, no water quality index is universally accepted so that water distributors, managers and policy
makers in different countries may use and adopt it with little modifications (Tyagi et al., 2013). Recently, the combination of WQI and multivariate statistical techniques has showed some certain advantages in the overall assess-ment of surface water quality (Mophin-Kani and Murugesan, 2011).
In Vietnam, Ministry of Natural Resources and Environment (MONRE) developed the WQI method, issued in the Decision No. 879/QD-TCMT, to create a benchmark of the surface water quality for the protection and management of water resources. This WQI method was developed by the combination of weighted arithmetic WQI with river status in-dex (RSI) to suit the conditions in Vietnam (MONRE, 2011). Accordingly, nine (9) water quality parameters, including: DO, BOD5, COD, NH4
+-N, PO43--P; TSS, pH, temperature
and total coliforms, were selected to calculate WQI. The WQI number ranges from 0 to 100, its value range corresponding to color signifies better water quality when it is higher (MONRE, 2011).
The Dong Nai river basin originates in the Central Highland region of Vietnam. The Upper Part of Dong Nai (UPDN) river basin, an environmentally sensitive mountain area, has a crucial role in protecting water resources in the downstream areas. The Dong Nai river basin is the largest national river basin and is the most dynamic economic development region in Vietnam. The basin includes 10 provinces and Ho Chi Minh City forming the southern focal economic zone, which is a highly developed and populous region, with a relatively high income per capita compared with other regions in Vietnam. Water source of the Dong Nai river basin is an dispensable resource for the development of 60 industrial parks and export processing zones at the downstream part (MONRE, 2006;Ringler and Huy, 2004). However, this river basin is facing with water issues in terms of quality and quantity which is posed by human activities.

228 H. Pham et al. / Journal of Water Sustainability 4 (2017) 225-245
Water quality monitoring and assessment is an essential practice to propose solutions for sustainable management of the basin. Both central government and provincial agencies put much effort to management practices over the past decade. Nevertheless, a few studies either related or inadequate on water quality have done in this river basin. Therefore, the purpose of this paper is to identify spatial and temporal variations in surface water quality, and to determine the influence of anthropogenic sources on water quality of the UPDN river basin by integrating WQI and multivariate statistical techniques (HCA, One-way ANOVA, and SCA).
2. MATERIALS AND METHODS
2.1 Study Area
Dong Nai river is the largest inland river in Vietnam, flowing through 11 provinces in the Southeast of Vietnam. The UPDN river basin
belongs to the administrative boundary of Lam Dong province, which plays an important role in socio-economic development of this prov-ince (Fig. 1). The topography of the study area is clearly stratification from North to South. The northeast of the UPDN river basin seats on Langbiang plateau, which has high mountains with an elevation over 1,500 m above sea level. The middle part of the river basin, the low mountains, belongs to Di Linh plateau having an elevation from 700 m to 1000 m above sea level. The transition zone between highlands and plains is 200 m - 700 m above sea level that locates in the southwest of the river basin (Fig. 2). This area has been affected by tropical monsoon climate regimes. There are two distinct seasons, the rainy season lasts from May to November and the dry season is from December to April of the following year. The mean annual temperature was 22oC, annual precipitation and humidity were 2,500 mm and 83%, respectively over the past 33 years, from 1981-2014 (StaB, 2015).
Figure 1 Location and land use map of the Study (DONRE, 2013)

H. Pham et al. / Journal of Water Sustainability 4 (2017) 225-245 229
Figure 2 Digital Elevation Model (DEM) of the Study Area (Hung et al., 2017)
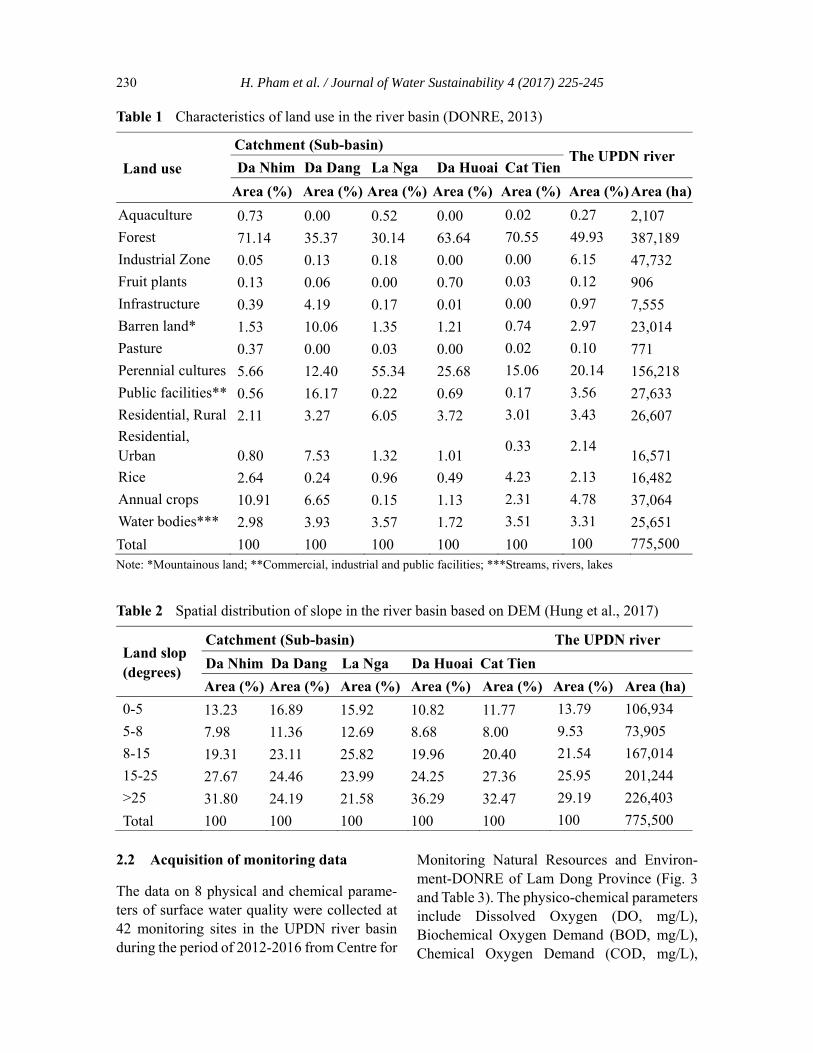
The study area covers 775,500 ha, account-ing about 80% of the total provincial area. The UPDN river basin was divided into 5 sub- basins (Da Nhim, Da Dang, La Nga, Da Huoai, and Cat Tien) in terms of river flow, topology, cascade hydropower plants, and water infrastructure in the main flow of the river. The Da Nhim sub-basin originates in Biduop Nui Ba National Park, and covers an area of 186,605 ha. The Da Dang sub-basin, a right tributary of the main river, flowing through Centre of Da Lat city, covers an area of 157,104 ha. The Cat Tien sub-basin is located downstream of Da Nhim and Da Dang hydro-power reservoirs covering an area of 220,130 ha. Other tributaries of the UPDN river basin are La Nga and Da Huoaisub-basins occupying an area of 132,233 ha and 74,158 ha, respec-tively (DONRE, 2016). Land use pattern in every river sub-basin varies from each other (Table 1), therefore its impact on surface water resources may also be different. Most of these sub-basins are high slope lands in which more than 20% of each sub-basin has a land slope is greater than 25 degree (Table 2).
Fig. 1 and Table 1 show that the area of forest land in the UPDN river basin was the
largest area with occupying 49.93% (387,189 ha) of the total basin area. The second largest area was the perennial cultures land with major crops such as coffee, tea gardens and accounts for 20.14% (156,218 ha) area of the entire basin. The residential land (urban and rural) occupied 5.57% (43,178 ha) of the basin area. The area of annual crops such as tomatoes, carrots, vegetables covered with 4.78% (16.571 ha) of the basin area and the rest was other land types. However, the distribution of land use types in the five sub-basins was not similar. In particular, Da Dang river sub-basin with Da Lat city and Lien Nghia, Dinh Van, Nam Ban towns had the largest residential land (urban and rural), while the La Nga sub-basin had the largest annual crops land that accounted for 55.34% of the total area of this basin. The types of land use are different in the sub-basins so that the impact on surface water quality may be different.
Fig. 2 and Table 2 show that 76.68% area of the total basin has the angle of slope in degrees over 8o, while the slope is between 8o-15o, 15o-25o and more than 25o, accounting for 21.54%, 25.95% and 29.19%, respectively.
Boundary of the Study Area
Langbiang plateau
Di Linh plateau
Transition zone
230 H. Pham et al. / Journal of Water Sustainability 4 (2017) 225-245
Table 1 Characteristics of land use in the river basin (DONRE, 2013)
Land use
Catchment (Sub-basin) The UPDN river
Da Nhim Da Dang La Nga Da Huoai Cat Tien
Area (%) Area (%) Area (%) Area (%) Area (%) Area (%) Area (ha)
Aquaculture 0.73 0.00 0.52 0.00 0.02 0.27 2,107
Forest 71.14 35.37 30.14 63.64 70.55 49.93 387,189
Industrial Zone 0.05 0.13 0.18 0.00 0.00 6.15 47,732
Fruit plants 0.13 0.06 0.00 0.70 0.03 0.12 906
Infrastructure 0.39 4.19 0.17 0.01 0.00 0.97 7,555
Barren land* 1.53 10.06 1.35 1.21 0.74 2.97 23,014
Pasture 0.37 0.00 0.03 0.00 0.02 0.10 771
Perennial cultures 5.66 12.40 55.34 25.68 15.06 20.14 156,218
Public facilities** 0.56 16.17 0.22 0.69 0.17 3.56 27,633
Residential, Rural 2.11 3.27 6.05 3.72 3.01 3.43 26,607 Residential, Urban 0.80 7.53 1.32 1.01
0.33 2.14 16,571
Rice 2.64 0.24 0.96 0.49 4.23 2.13 16,482
Annual crops 10.91 6.65 0.15 1.13 2.31 4.78 37,064
Water bodies*** 2.98 3.93 3.57 1.72 3.51 3.31 25,651
Total 100 100 100 100 100 100 775,500 Note: *Mountainous land; **Commercial, industrial and public facilities; ***Streams, rivers, lakes
Table 2 Spatial distribution of slope in the river basin based on DEM (Hung et al., 2017)
Land slop (degrees)
Catchment (Sub-basin) The UPDN river
Da Nhim Da Dang La Nga Da Huoai Cat Tien
Area (%) Area (%) Area (%) Area (%) Area (%) Area (%) Area (ha)
0-5 13.23 16.89 15.92 10.82 11.77 13.79 106,934
5-8 7.98 11.36 12.69 8.68 8.00 9.53 73,905
8-15 19.31 23.11 25.82 19.96 20.40 21.54 167,014
15-25 27.67 24.46 23.99 24.25 27.36 25.95 201,244
>25 31.80 24.19 21.58 36.29 32.47 29.19 226,403
Total 100 100 100 100 100 100 775,500
2.2 Acquisition of monitoring data
The data on 8 physical and chemical parame-ters of surface water quality were collected at 42 monitoring sites in the UPDN river basin during the period of 2012-2016 from Centre for
Monitoring Natural Resources and Environ-ment-DONRE of Lam Dong Province (Fig. 3 and Table 3). The physico-chemical parameters include Dissolved Oxygen (DO, mg/L), Biochemical Oxygen Demand (BOD, mg/L), Chemical Oxygen Demand (COD, mg/L),
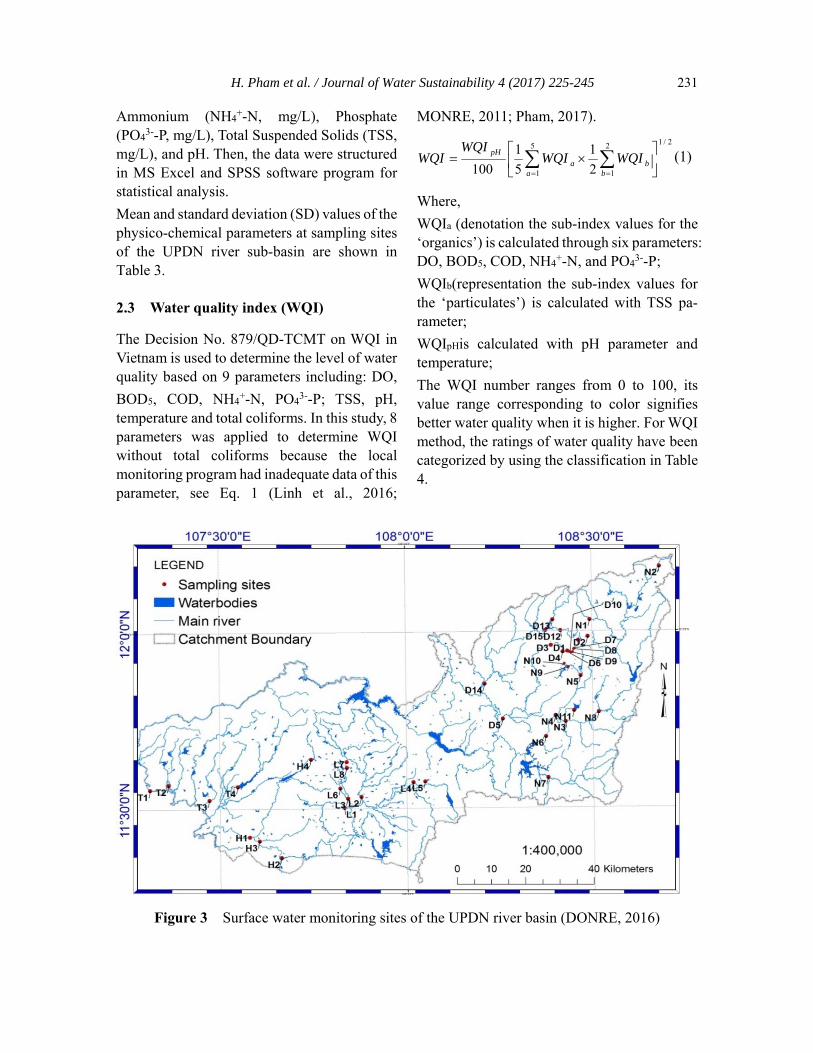
H. Pham et al. / Journal of Water Sustainability 4 (2017) 225-245 231
Ammonium (NH4+-N, mg/L), Phosphate
(PO43--P, mg/L), Total Suspended Solids (TSS,
mg/L), and pH. Then, the data were structured in MS Excel and SPSS software program for statistical analysis.
Mean and standard deviation (SD) values of the physico-chemical parameters at sampling sites of the UPDN river sub-basin are shown in Table 3.
2.3 Water quality index (WQI)
The Decision No. 879/QD-TCMT on WQI in Vietnam is used to determine the level of water quality based on 9 parameters including: DO,
BOD5, COD, NH4+-N, PO4
3--P; TSS, pH, temperature and total coliforms. In this study, 8 parameters was applied to determine WQI without total coliforms because the local monitoring program had inadequate data of this parameter, see Eq. 1 (Linh et al., 2016;
MONRE, 2011; Pham, 2017).
2/12
1
5
1 2
1
5
1
100
bb
aa
pHWQIWQI
WQIWQI (1)
Where,
WQIa (denotation the sub-index values for the ‘organics’) is calculated through six parameters: DO, BOD5, COD, NH4
+-N, and PO43--P;
WQIb(representation the sub-index values for the ‘particulates’) is calculated with TSS pa-rameter;
WQIpHis calculated with pH parameter and temperature;
The WQI number ranges from 0 to 100, its value range corresponding to color signifies better water quality when it is higher. For WQI method, the ratings of water quality have been categorized by using the classification in Table 4.
Figure 3 Surface water monitoring sites of the UPDN river basin (DONRE, 2016)

232 H. Pham et al. / Journal of Water Sustainability 4 (2017) 225-245
Table 3 Mean and standard deviation (SD) values of water quality parameters at different sampling sites of the UPDN (2012-2016)
Sub-basin Code Monitoring site
pH SD DO
(mg/L
)
SD TSS
(mg/L)
SD COD
(mg/L)
SD BOD
(mg/L)
SD NH4+-
N
(mg/L)
SD PO43--
P
(mg/L)
SD Temp.
(oC)
SD
Da Nhim
(11 sites)
N1 Da Sar bridge 6.9 0.45 6.6 0.75 28.0 10.70 16.1 4.87 6.5 3.16 0.35 0.23 0.02 0.01 24.3 1.09
N2 LiengTru bridge 6.9 0.54 6.7 0.65 10.9 8.25 16.6 6.26 5.8 2.93 0.17 0.07 0.01 0.01 21.7 2.08
N3 NT Bo Sua bridge 6.8 0.56 6.5 0.66 48.8 45.75 16.3 2.78 6.1 3.41 0.46 0.34 0.04 0.03 21.5 2.64
N4 Bong Lai bridge 7.0 0.74 6.3 1.00 114.3 167.70 20.4 8.40 9.4 7.43 0.58 0.43 0.04 0.02 25.3 1.79
N5 Prenn bridge 7.4 0.46 6.0 1.07 31.7 23.33 24.1 9.98 10.5 6.23 1.16 1.56 0.10 0.09 24.5 1.43
N6 Phu Hoi bridge 7.0 0.47 6.3 1.07 55.7 48.98 16.2 3.34 7.3 5.27 0.59 0.35 0.04 0.02 24.0 2.28
N7 Bao Dai Ta Hine bridge 6.9 0.53 6.1 0.91 87.5 80.45 17.4 5.96 8.1 5.24 0.60 0.41 0.05 0.06 25.7 2.02
N8 Ka Do bridge 6.8 0.45 5.5 0.64 108.7 166.29 20.8 8.40 7.1 5.37 0.78 0.82 0.06 0.05 26.6 1.11
N9 Tuyen Lam reservoir 1 7.2 0.39 6.1 1.21 17.0 10.39 17.4 6.43 10.6 8.07 0.63 0.44 0.03 0.04 23.6 1.03
N10 Tuyen Lam reservoir 2 6.8 0.46 5.6 0.92 115.1 101.57 25.9 11.49 12.2 9.29 0.90 0.78 0.06 0.04 22.3 2.12
N11 Da Ron reservoir 1 6.9 0.58 6.5 0.51 115.1 112.43 22.2 10.58 10.4 8.45 1.41 1.65 0.09 0.08 24.3 2.36
Da Dang
(15 sites)
D1 Cam Do bridge 7.1 0.45 5.2 1.21 35.1 17.89 34.5 4.05 14.7 4.97 3.30 2.17 0.23 0.24 24.3 1.36
D2 Thai Phien bridge 6.8 0.41 6.4 0.61 12.5 8.74 16.3 6.24 6.0 3.27 0.21 0.10 0.02 0.02 24.8 1.82
D3 Cam Ly bridge 6.9 0.70 6.0 0.70 40.4 25.99 21.6 8.68 9.3 7.26 1.09 0.67 0.08 0.03 23.8 1.40
D4 Cam Ly waterfall 7.1 0.69 5.8 0.90 29.1 19.58 27.0 10.77 13.3 8.44 1.29 0.98 0.11 0.09 23.7 1.41
D5 Hoa Lac bridge 6.7 0.39 5.8 1.02 73.6 41.24 17.2 5.57 8.8 6.68 0.51 0.46 0.06 0.08 24.7 1.63
D6 Xuan Huong lake 1 6.9 0.48 6.5 0.39 32.6 17.86 14.8 5.28 6.0 3.64 0.31 0.17 0.02 0.02 24.5 1.64
D7 Xuan Huong lake 2 6.9 0.71 6.5 0.41 37.4 26.95 15.7 5.57 7.8 5.05 0.25 0.18 0.02 0.02 24.2 1.60
D8 Xuan Huong lake 3 5.7 0.17 5.3 0.63 35.8 13.09 13.9 5.79 6.1 4.74 0.48 0.43 0.02 0.02 20.3 1.60
D9 Xuan Huong lake 4 7.6 0.77 6.7 1.10 17.2 7.31 21.7 6.89 9.6 5.99 0.76 0.52 0.03 0.03 22.8 1.25
D10 Xuan Huong lake 5 7.1 0.47 5.4 1.28 44.0 45.10 26.3 11.18 9.8 7.04 2.53 1.94 0.11 0.07 22.2 2.19
D11 Chien Thang lake 8.4 0.84 7.8 2.29 47.9 19.47 44.7 15.21 15.6 9.32 1.54 0.92 0.07 0.09 22.6 1.41

H. Pham et al. / Journal of Water Sustainability 4 (2017) 225-245 233
Sub-basin Code Monitoring
site
pH SD DO
(mg/L)
SD TSS
(mg/L)
SD COD
(mg/L)
SD BOD
(mg/L)
SD NH4+-N
(mg/L)
SD PO43--P
(mg/L)
SD Temp.
(oC)
SD
Da Dang
(15 sites)
D12 PhuocThanh
bridge 7.4 0.61 4.9 2.00 45.6 25.25 47.6 18.71 21.0 12.83 5.11 4.01 0.21 0.15 21.9 1.52
D13 Dan Kia 7.9 0.67 5.8 2.30 42.4 26.17 57.3 24.94 21.0 8.89 4.33 3.94 0.30 0.32 22.3 1.48
D14 Da Don
bridge 7.3 0.27 6.6 1.31 42.2 23.23 55.5 18.41 22.9 15.33 7.32 5.26 0.33 0.28 22.7 1.03
D15 Dankia lake 7.1 0.49 4.9 1.32 43.2 30.22 55.1 35.98 29.7 27.65 5.79 4.19 0.44 0.53 22.3 1.73
La Nga
(8 sites)
L1 Dai Binh
bridge 7.2 0.27 5.0 1.03 126.7 117.13 57.3 19.94 29.4 16.80 7.80 4.49 0.53 0.25 23.8 1.81
L2 Dai Nga
bridge 6.8 0.44 6.5 0.72 37.3 37.35 23.4 13.31 8.9 7.35 0.38 0.25 0.02 0.02 23.7 2.47
L3 Minh Rong
bridge 6.9 0.44 6.6 1.40 19.7 7.96 32.1 6.01 13.2 8.16 3.17 2.97 0.29 0.29 21.4 0.91
L4 Bobla water-
fall 7.0 0.53 5.5 0.58 35.4 13.74 61.4 12.00 27.1 20.36 2.92 3.30 0.31 0.19 23.3 1.29
L5 Ho Tay reser-
voir 6.9 0.51 6.0 0.69 25.6 8.40 23.9 5.19 9.8 6.15 0.54 0.38 0.02 0.01 25.2 1.68
L6 Nam Phuong
reservoir 6.9 0.43 6.5 0.74 26.0 26.88 16.7 6.82 5.7 2.94 0.55 0.73 0.03 0.02 25.0 1.45
L7 Tan Rai reser-
voir 7.1 0.53 6.3 0.71 9.8 2.94 17.2 6.96 6.4 4.22 0.17 0.14 0.01 0.01 25.4 1.07
L8 Loc Thang
reservoir 7.0 0.51 6.4 0.62 16.1 8.25 20.6 6.49 9.2 5.14 0.38 0.30 0.09 0.16 24.8 0.96
Da Huoai
(4 sites)
H1 Madagui
bridge 6.9 0.31 6.4 0.97 27.5 21.40 19.6 10.73 9.8 7.15 0.31 0.29 0.02 0.02 23.8 1.20
H2 DaHuoai 2 6.8 0.38 6.2 0.81 34.6 35.31 15.0 6.30 7.3 6.57 0.27 0.18 0.02 0.01 24.3 1.54
H3 DaHuoai 3 7.0 0.42 6.3 0.81 25.8 19.02 18.4 4.54 8.2 5.96 0.28 0.25 0.01 0.01 25.2 1.97
H4 KDL Dambri 6.9 0.38 6.1 0.53 7.3 4.85 13.7 3.95 6.7 4.30 0.16 0.12 0.02 0.01 25.5 1.59

234 H. Phamet al. / Journal of Water Sustainability 4 (2017) 225-245
Sub-basin Code Monitoring
site
pH SD DO
(mg/L)
SD TSS
(mg/L)
SD COD
(mg/L)
SD BOD
(mg/L)
SD NH4+-N
(mg/L)
SD PO43--P
(mg/L)
SD Temp.
(oC)
SD
Cat Tien
(4 sites)
T1 CauT re
bridge 7.7 1.21 6.6 1.89 45.6 21.17 25.5 8.20 11.1 6.41 0.32 0.19 0.03 0.02 26.9 2.31
T2 Phuoc Cat
bridge 7.1 0.46 6.3 0.76 64.9 27.07 17.1 8.33 7.3 5.78 0.32 0.34 0.02 0.01 26.0 1.87
T3 Da Mi
bridge 5.8 0.46 5.0 0.93 75.6 139.60 19.3 12.31 11.2 12.60 0.32 0.27 0.02 0.02 21.2 1.42
T4 Da Teh res-
ervoir 7.2 0.48 6.2 0.93 62.3 67.53 16.1 5.30 7.9 5.40 0.56 0.71 0.05 0.06 24.3 1.39
National guidelines* 5.5-9 - ≥4 - <50 - <30 - <15 - 0.9 - 0.3 - - -
Note:*National guidelines: Vietnamese surface water quality standard QCVN 08-MT: 2015/BTNMT (B1). B1: Surface water quality for irrigation or other purposes re-quiring the similar quality of water or other purposes

H. Pham et al. / Journal of Water Sustainability 4 (2017) 225-245 235
Table 4 Surface water quality classification based on WQI
WQI Value/Color Rating Water Quality
91-100 (Blue) Excellent water quality
76-90 (Green) Good water quality
51-75 (Yellow) Medium water quality
26-50 (Orange) Poor water quality
0-25 (Red) Very bad water quality
2.4 Statistical analysis
The box-and-whisker plot was used to compare seasonal changes in water quality of the UPDN river basin. Hierarchical cluster analysis (HCA), which can be employed for grouping either monitoring sites or monitoring parame-ters, has been widely used in several previous studies (Hanh et al., 2010; Pejman et al., 2009; Phung et al., 2015; Shrestha and Kazama, 2007; Varol et al., 2012; Wang et al., 2012).One-way Analysis of Variance (ANOVA; alpha = 0.05) was used to examine the significance of the mean differences of WQI among sites and seasons (Cude, 2001; Eddlemon and Boopathy, 2013; MONRE, 2011; Pham, 2017; Said et al., 2004). Spearman correlation analysis (SCA) was used to assess the relationships among the WQI and physico-chemical parameters (TSS, COD, BOD, NO3
--N, NH4+-N, PO4
3--P; TSS, pH) (Phung et al., 2015). All statistical processes were per-formed by using SPSS 22.0 software package for Windows (Hanh et al., 2010; Yisa and Jimoh, 2010).
3. RESULTS AND DISCUSSION
3.1 Water quality assessment based on physico-chemical parameters
Table 5 presents the percentage of samples that
did not meet the Vietnamese national technical regulation on surface water quality QCVN 08-MT: 2015/BTNMT (B1). In general, surface water of the river system in the study area was contaminated moderately with organic matters (BOD, COD), nutrients (NH4
+-N, PO4
3--P), Total Suspended Solids (TSS) by untreated wastewater discharging from domestic, industrial activities and runoff from agricultural fields. In addition, surface water quality was heavily affected by geographical location, seasonal changes and other factors. This issue was evidenced that the high population density in Urban (Da Lat city) had more polluted water than other areas. The results showed that 10.6% of TSS, 24% of BOD, 10.6% of COD, 22.6% of NH4
+-N, 18.3% of PO4
3--P in the dry season, and 31.3%, 12,0%, 17.8%, 23.6%, respectively in the rainy season, did not meet the permissible levels (the QCVN). In the rainy season, 66.7% of moni-toring sites in the Cat Tien sub-basin had TSS concentration that did not meet the QCVN compared to that parameter with 45.5%, 24%, 17.5%, 15%, respectively, in Da Nhim, Da Dang, La Nga, Da Huoai sub-basins. In the rainy season, the percentage of samples had the concentrations of COD, BOD5, and NH4
+-N in Da Dang exceed the QCVN and were higher than other sub-basins.

236 H. Phamet al. / Journal of Water Sustainability 4 (2017) 225-245
Table 5 Percentage of samples that did not meet the permissible level
Parameter QCVN*
Da Nhim Da Dang La Nga Da Huoai Cat Tien The UPDN
river
Dry
(%)
Rain
(%)
Dry
(%)
Rain
(%)
Dry
(%)
Rain
(%)
Dry
(%)
Rain
(%)
Dry
(%)
Rain
(%)
Dry
(%)
Rain
(%)
pH 5.5-9 0.0 1.8 8.0 1.3 5.0 0.0 0.0 0.0 0.0 0.0 3.9 1.0
DO ≥4 mg/L 1.8 1.8 5.3 13.3 0.0 0.0 0.0 0.0 0.0 0.0 2.4 5.3
TSS <50 mg/L 9.1 45.5 21.3 24.0 2.5 17.5 0.0 15.0 0.0 66.7 10.6 31.3
COD <30 mg/L 9.1 5.5 49.3 20.0 20.0 10.0 0.0 5.0 0.0 11.1 24.0 12.0
BOD5 <15 mg/L 16.4 9.1 42.7 29.3 15.0 10.0 0.0 20.0 0.0 11.1 22.6 17.8
NH4+-N <0.9 mg/L 21.8 27.3 32.0 44.0 2.5 0.0 0.0 0.0 5.6 5.6 18.3 23.6
PO43--P <0.3 mg/L 3.6 0.0 18.7 6.7 2.5 2.5 0.0 0.0 0.0 0.0 8.2 2.9
Note: QCVN*: National technical regulation on surface water quality, QCVN 08-MT: 2015/BTNMT (B1). B1 is the
surface water source for irrigation or other purposes. Dry: Dry season; Rain: Rainy season
Figure 4 Box-and-whisker plots comparing seasonal changes in water quality of the UPDN river basin based on the monitoring parameters. Solid line: Mean values. Dash-dotted line: QCVN 08-MT:
2015/BTNMT, B1

H. Pham et al. / Journal of Water Sustainability 4 (2017) 225-245 237
The Box-and-whisker plots showed that TSS concentrations in the rainy season were significantly higher than in the dry season at all sub-basins. In particular, the greatest seasonal change in TSS concentration was observed at monitoring sites of the Dong Nai river basin. It also showed that monitoring sites in Da Dang sub-basin have higher concentrations of COD, BOD5 and NH4
+-N than Da Nhim, La Nga, Da Huoai and Cat Tien sub-basins. This revealed that the degree of impact caused human activities in Da Dang sub-basin is greater than Da Nhim, La Nga, Da Huoai and Cat Tien sub-basins.
3.2 Water quality assessment
3.2.1 Overall patterns of the WQI
In the dry season, 30.95%, 28.57%, 23.81% and 16.67% (red color and underline numbers in Fig. 5) of monitoring sites were ranked in four categories, namely good, medium, excellent, and poor water quality, respectively. Meanwhile, in the rainy season, 40.48%, 19.05%, 16.67%, 14.29% and 9.52% (blue color and italic numbers in Fig. 5) of monitor-ing sites were ranked corresponding to five categories, namely medium, excellent, poor, good and very bad water quality. For year round, 42.86%, 28.57%, 16.67% and 11.90% (black color and bold numbers in Fig. 5) of monitoring sites were categorized in four groups, including: medium, good, poor and excellent water quality.
The mean values and the ratings of WQI at 5 sub-basins of the UPDN river basin are shown in Fig. 6. Generally, the results of WQI values in every site during the study period indicated that the quality of surface water was moderately polluted and highly varied among sites as well as seasons.
The mean values of WQI at monitoring sites of Da Nhim sub-basin range from 54.8 to 96.0 in the dry season, and from 16.8 to 88.4 in the rainy season. However, Da Dang sub-basin had mean values of WQI ranging from 28.0 to 84.2 in the dry season, and from 22.0 to 82.4 in the rainy season.
At the same time, the La Nga and Cat Tien sub-basin had seasonal mean values of WQI in the dry season and the rainy season are (53.0-85.8 and 26.6-90.0) and (53.0-68.0 and 17-73), respectively. Meanwhile, the WQI of monitor-ing sites at Da Huoai sub-basin had slightly changed between the dry and rainy seasons, 76.7-91.8 and 74.1-85.9, respectively.
The results of Box-and-whisker plots show the WQI at monitoring sites in dry season are significant higher than in the rainy season in all sub-basins. It implies that TSS is a major factor affecting surface water quality in sub-basins in the rainy season. This result is the same as previous studies in which TSS was the most influential parameter to the WQI of the UPDN basin as originating from high mountainous areas. The value of TSS concentration has highly changed in the dry and the rainy seasons (Hanh et al., 2010;Uyen et al., 2014). The concentration of TSS in the surface runoff is affected by eroded particles moving from top soil layer due to heavy rains coupled with a reduction of vegetation cover (Mouri et al., 2013; Mukundan et al., 2013; Turtola et al., 2007).
Additionally, the Box-and-whisker plots revealed that the surface water quality of Da Huoai sub-basin was better than other sub- basins (Fig. 7). It is noted that the surface water quality of sub-basins is ranked in the following order Da Huoai>La Nga>Da Nhim>Cat Tien >Da Dang in terms of WQI.

238 H. Phamet al. / Journal of Water Sustainability 4 (2017) 225-245
Figure 5 Surface water quality of the UPDN based on mean ratings of WQI (2012-2016)
Figure 6 Comparison of WQI in dry and rainy season at 5 sub-basins of the UPDN river ba-sin: (a)Da Nhim; (b)Da Dang; (c)La Nga; (d)Da Huoai; (e)Cat Tien

H. Pham et al. / Journal of Water Sustainability 4 (2017) 225-245 239
Figure 7 Box-and-whisker plots comparing seasonal changes in water quality of the UPDN river basin based on WQI. Solid line: mean values. Dash-dotted line: QCVN 08-MT:
2015/BTNMT, B1
3.2.2 Spatial and temporal variations of monitoring sites (ANOVA, HCA)
The results of One-way ANOVA test show that the mean of WQI in the dry season have been statistically significant difference compared to the rainy season (P <0.05, F = 17.9). The test also revealed that, in general, there was statistically significant difference in the mean of WQI among the monitoring sites (P <0.05; F = 4.8).
The HCA identified 2 main clusters (1- relatively contamination sites; 2-relatively clean sites). Then, the main clusters were divided into 5 sub-clusters (1a, 1b, 2a, 2b1, 2b2), relative representing for 5 water quality groups (very bad, poor, medium, excellent, and good) in accordance with the ratings of WQI (Fig. 8). Cluster 1, the so-called relative contamination sites, includes 4 sites of the Da Nhim sub-basin (N4, N7, N10, N11); 9 sites of the Da Dang river (D1, D3, D4, D5, D9, D10, D11, D12, D13); only 1 site of La Nga sub- basin (L1), and 2 sites of Cat Tien sub-basin (T2, T3). Cluster 1 was divided into two sub-clusters (see the sampling sites in Fig. 3 and cluster analysis in Fig. 8). Cluster 1a, the so-called very bad water quality sites, is formed by 3 sites of Da Nhim sub-basin (N4,
N7, and N10); 4 sites of Da Dang sub-basin (D3, D4, D9, and D12); and 2 sites of Cat Tien sub-basin (T2, T3). Cluster 1b is not as polluted as cluster 1a, the so-called poor water quality sites, formed by 5 sites of Da Dang sub-basin (D1, D5, D10, D11, D13); and 1 site of La Nga (L1).
Cluster 2, the so-called relatively clean group, includes 4 upstream sites (N1, N2, N5, N9) and 3 downstream sites (N3, N6, N8) of Da Nhim sub-basin. This group was also almost all sites of the La Nga sub-basin (L2 to L8); 6 sites of Da Dang sub-basin (D2, D6, D7, D8, D14, D15); 2 sites of Cat Tien sub-basin (T1, T4); and all sites of Da Huoai sub-basin (H1 to H4). Then, cluster 2 was divided into two sub-clusters. Cluster 2a, the so-called medium water quality sites, is formed by 4 sites of Da Nhim sub-basin (N3, N5, N6, N8); 2 sites of Da Dang (D7 and D8); 2 sites of La Nga (L2 and L6); and 1 site of Cat Tien sub-basin (T1). Cluster 2b can be further divided into two sub-clusters. Cluster 2b1, the so-called excel-lent water quality sites, is formed by 2 sites of Da Nhim sub-basin (N2 and N9); 2 sites of Da Huoai sub-basin (H2 and H4); and 1 site of La Nga (L5). Cluster 2b2 is not as clean as cluster 2b1, the so-called good water quality sites. This

240 H. Phamet al. / Journal of Water Sustainability 4 (2017) 225-245
cluster was formed by 1 site of Da Nhim sub-basin (N1); 4 sites of Da Dang sub-basin (D2, D6, D14, D15); 4 sites of La Nga (L3, L4, L7, L8); 1 site of the Cat Tien (T5); and 1 site of the Da Huoai sub-basin (H3).
The results of HCA indicated that the excel-lent water quality only found at sites where covered by forest in the upper part, such as site N2 and N9 of the Da Nhim sub-basin, site H2 and H4 of DaHuoai sub-basin. Whereas, the very bad water quality found at sites located in urban/suburban areas and perennial crops land, such as site D1, D3, D4, D5, D9, D10, D11, D12, and D13 of Da Dang sub-basin. These results may provide evidence of significant
anthropogenic impacts on a part of Da Dang sub-basin, where 10.8% of the area was residential land and 16.17% of the area was public facilities land (Table 1).
In addition, the dilution factor and self- purification of natural conditions are signifi-cant drivers as the surface water flows into reservoirs and downstream. This is evidenced by the WQI of site N10, where received untreated domestic wastewater from urban areas of Da Lat city, is a poor water quality site. In contrast, the WQI of site N9, located in the lower outlet of this reservoir, is an excellent water quality site.
Figure 8 Hierarchical cluster analysis for 42 sampling sites of UPDN river basin
H. Pham et al. / Journal of Water Sustainability 4 (2017) 225-245 241
According to the afore-mentioned results, the number of monitoring sites could also be reduced some sites in the Da Dang river. The sites from D6 to D10 in this river should be only chosen two sites. On the contrast, the monitoring sites should be added some sites in the Cat Tien river sub-basin, at least 2 sites (one in the upper and one in the lower) at the main river flowing into and flowing out of the big hydropower reservoirs. This is needed to assess how the surface water quality changes to impacts of anthropogenic reservoirs such as changing annual flow regime, dilution factor and self-purification of natural environment. Thus, it was evident that the HCA technique was useful in offering a reliable classification of surface waters in the whole region and made it possible to design a future sampling strategy in an optimal manner. In this manner, the num-ber of sampling sites in the monitoring network would be reduced or added, thereby lowering the cost without losing any significance of the outcome (Shrestha and Kazama, 2007; Varol et al., 2012).
3.2.3 Statistical correlations among physico-chemical parameters and the WQI
The Table 6 presents the correlation between WQI and physico-chemical parameters. Over-all patterns of the UPDN river basin, the Spear-man correlative analysis (SCA) result shown that a significant and positive correlation (italic and bold values) was observed between WQI and TSS, COD, BOD, NH4
+-N, PO43--P
concentrations, respectively, r = -0.62, -0.64, -0.54, -0.51, -0.43 in the dry season. However, in the rainy season, the TSS concentration and WQI (bold values) were strongly negatively correlated, r = -0.85 (Varol et al., 2012). Par-tially, there was a strongly negatively correla-tion between WQI and TSS concentration in the Cat Tien and Da Nhim sub-basins, respec-tively, r = -0.96 and r = -0.88. The high and positive correlation was observed in the Da
Dang sub-basin, r = -0.73. Finally, the moder-ately negative correlation was recorded at La Nga and Da Huoai sub-basins, respectively, r = -0.69 and r = -0.58 (Eddlemon and Boopathy, 2013). High land slope (as presented in Table 2) may be the main reason for an increase of the TSS concentration in the rainy season.
The land use of 5 sub-basins (Table 1), the percentage of perennial cultures land in these sub-basins was ranked La Nga>Da Huoai>Cat Tien >Da Dang >Da Nhim, corresponding to 55.34% >25.68% >15.06% >12.4%> 5.66%, respectively. The percentage of annual cultures land in these sub-basins was ranked Da Nhim>Da Dang >Cat Tien>Da Huoai>La Nga, corresponding to 10.91% >6.65% >2.3% >1.13%>0.15%, respectively. This explained why in the rainy season, there is a negative correlation between WQI and PO4
3--P concen-tration at sub-basins in the following order: La Nga>Da Nhim>Da Dang >Da Huoai>Cat Tien, with r = -0.63, -0.50, -0.43, -0.34, and -0.26, respectively. This was also evidenced that annual crops practices contributing PO4
3--P (from runoff) to surface water higher than perennial cultures activities. This result is similar to previous studies (Canada, 2004; Hanh et al., 2010), that the use of fertilizer releasing PO4
3--P into the watershed during the rainy season was insignificant because residual phosphate was formed relatively insoluble forms with many cations.
The percentage of residential land (rural and urban) in the Da Dang sub-basin was higher than other sub-basins. It was ranked Da Dang > La Nga > Da Huoai > Cat Tien > Da Nhim, corresponding to 10.8% >7.37% >4.73% >3.34% >2.91%, respectively. This explained why, there was a significantly negatively correlation between WQI and COD, BOD, NH4
+-N concentration in the dry season, respectively, r = -0.68, -0.63, -0.66 in the Da Dang sub-basin. However, there was slightly correlated or uncorrelated between WQI and

242 H. Phamet al. / Journal of Water Sustainability 4 (2017) 225-245
COD, BOD, NH4+-N concentration in the rainy
season. The results implied dilution effects during the rainy season resulted in a significant benefit in terms of improved water quality in this river sub-basin (Hanh et al., 2010). As seen in Table 6, DO and pH parameters did not
much correlate with WQI because these parameters were quite good quality and meet the permissible level (National technical regulation on surface water quality, QCVN 08-MT: 2015/BTNMT). Hence, the effect of DO and pH on WQI was not significant.
Table 6 Summarized correlation between WQI and seven (7) physico-chemical parameters
Parameters
Catchments (Sub-basins) The UPDN
river Da Nhim Da Dang La Nga Da Huoai Cat Tien
Dry
season
(%)
Rainy
season
(%)
Dry
season
(%)
Rainy
season
(%)
Dry
season
(%)
Rainy
season
(%)
Dry
season
(%)
Rainy
season
(%)
Dry
season
(%)
Rainy
season
(%)
Dry
season
(%)
Rainy
season
(%)
pH 0.03 -0.05 -0.52** 0.06 -0.12 -0.09 -0.09 0.25 0.19 0.28 -0.25** -0.03
DO 0.17* -0.06 0.15 0.25* 0.09 0.10 0.27 -0.10 0.05 -0.11 0.17* 0.06
TSS -0.71** -0.88** -0.76** -0.73** -0.02 -0.69** 0.60** -0.58** -0.67** -0.96** -0.62** -0.85**
COD -0.31** -0.35** -0.68** -0.32** -0.25 -0.22 -0.18 -0.08 -0.45 -0.21 -0.64** -0.35**
BOD -0.22** 0.01 -0.63** -0.35** -0.27 -0.27 -0.04 -0.08 -0.64** -0.03 -0.54** -0.21**
NH4+-N -0.17* -0.58** -0.66** -0.22 0.24 -0.19 -0.54* -.49* -0.20 -0.29 -0.51** -0.46**
PO43--P -0.24** -0.50** -0.48** -0.43** 0.05 -0.63** 0.11 -0.34 -0.02 -0.26 -0.43** -0.53**
Note: (**): Correlation is significant at the 0.01 level (2-tailed);(*): Correlation is significant at the 0.05 level (2-
tailed)
CONCLUSIONS
This study demonstrated that the need of inte-grating Water Quality Index (WQI) and multi-variate statistical techniques (HCA, CA, ANOVA) for the water quality assessment, the pollution sources identification, the pollution factors apportionment as well as an under-standing of the spatial and temporal variations in water quality. It is an effective and useful tool to communicate information on the water quality to citizens and policy makers in many ways in terms of water quality management.
Using WQI, the quality of surface water in sub-basins of the UPDN river basin was ranked as WQI (Da Huoai) >WQI (La Nga) >WQI (Dang Dang>WQI (Cat Tien). This could be attributed to anthropogenic activities such as domestic, agricultural practices and seasonal
change. The concentration of TSS, which rep-resents a result of soil erosion, was the most significant parameter contributing to water quality variations for the entire upper part and for each cluster. According to acquired in-formation of cluster analysis, it is noted that sampling sites of the monitoring plan can be revised and optimized in a reasonable manner.
ACKNOWLEDGMENTS
The authors would like to thank you DONRE of Lam Dong province for its support this study by providing early access to statistical data and reports of local authorities. We also greatly ap-preciate Ho Chi Minh City University of Tech-nology-VNU-HCM for assistance in providing grants for this research (Grant Number: TNCS-MTTN-20161-6).

H. Pham et al. / Journal of Water Sustainability 4 (2017) 225-245 243
REFERENCES
Canada, E. (2004). Canadian guidance framework for the management of phosphorus in fresh water system. Government of Canada, Ottawa, Canada.
Cude, C.G. (2001). Oregon Water Quality Index: A tool for evaluating water quality management ef-fectiveness. Jawra Journal of the American Wa-ter Resources Association, 37(1), 125-137.
DONRE. (2013). Land use planning map phase 2010-2020 of Lam Dong province. Department of Natural Resources and Environment of Lam Dong province, Da Lat,Vietnam.
DONRE. (2016). Report on water quality monitor-ing in Lam Dong province. Department of Natu-ral Resources and Environment of Lam Dong province, Da Lat, Vietnam.
Eddlemon, N. and Boopathy, R. (2013). Water qual-ity and microbial ecology of Upper Barataria Es-tuary in Southeast Louisiana, USA. Journal of Water Sustainability, 3(4), 193-207.
Effendi, H., Romanto and Wardiatno, Y. (2015). Water quality status of Ciambulawung River, Banten Province, based on pollution index and NSF-WQI. Procedia Environmental Sciences, 24, 228-237.
Hanh, P.T.M., Kim, K.W., Hung, N.Q., Sthiannopkao, S. and Ba, D.T. (2010). Anthropo-genic influence on surface water quality of the Nhue and Day sub-river systems in Vietnam. En-vironmental Geochemistry and Health, 32(3), 227-236.
Hasan, H.H., Jamil, N.R. and Aini, N. (2015). Wa-ter quality index and sediment loading analysis in Pelus River, Perak, Malaysia. Procedia Envi-ronmental Sciences, 30, 133-138.
Hung, P., Mostafizurb, R.M., Nguyen, N.C., Man, N.V.M., Phu, L.V. and Trung, L.V. (2017). An-thropogenic influence on surface water quality in the Upper Part of Dong Nai river basin in Vi-etnam. The 5th International Symposium of En-vironmental Analytical Chemistry (ISEAC 5-Asia), 17-20 May, Ho Chi Minh City, Vietnam.
Ichwana, I., Syahrul, S. and Nelly, W. (2016). Water
Quality Index by Using National Sanitation Foundation-Water Quality Index (NSF-WQI) Method at Krueng Tamiang Aceh. International Conference on Technology, Innovation, Univer-sitas Syiah Kuala, Indonesia.
Islam, M., Zahid, A., Rahman, M. and Shammi, M. (2017). Investigation of groundwater quality and its suitability for drinking and agricultural use in the south central part of the coastal region in Bangladesh.Exposure and Health, 9(1), 27-41.
Jerome, C. and Pius, A. (2010). Evaluation of water quality index and its impact on the quality of life in an industrial area in Bangalore, South India. American Journal of Scientific and industrial re-search, 1(3), 595-603.
Kumar, A. and Sharma, M.P, (2014). Application of Water Quality Index and Diversity Index for pol-lution assessment of Kankaria Lake at Ahmeda-bad, India. Journal of Civil and Environmental Engineering, 4(3), 1-4.
Linh, L.T.K., Hien, L.T.D. and Tat, P.V. (2016). Ap-plication GIS for evaluating water quality ac-cording to WQI at Tra An reservoir. Proceedings of the GIS 2016 Application Conference, 8-9 De-cember,2016, Hue, Vietnam.
Liou, S.M., Lo, S.L. and Wang, S.H. (2004). A gen-eralized Water Quality Index for Taiwan. Envi-ronmental Monitoring and Assessment, 96(1-3), 35-52.
Lumb, A., Halliwell, D. and Sharma, T. (2006). Ap-plication of CCME Water quality index to moni-tor water quality: A case of the Meckenzie River basin, Canada. Environmental Monitoring and Assessment, 113(1-3), 411-429.
Markicha, S.J. and Browna, P.L. (1998). Relative importance of natural and anthropogenic influ-ences on the fresh surface water chemistry of the Hawkesbury-Nepean River, south-eastern Aus-tralia. Science of the Total Environment, 217(3), 201-230.
MONRE (Vietnam Ministry of Natural Resources and Environment). (2006). The state of water en-vironment in 3 river basins of Cau, Nhue-Day and Dong Nai river system. Environment report

244 H. Phamet al. / Journal of Water Sustainability 4 (2017) 225-245
of Vietnam 2006, Ha Noi, Vietnam.
MONRE (Vietnam Ministry of Natural Resources and Environment). (2011). Decision No. 879/QD-TCMT on the guidelines issuance for calculation of Water Quality Index (WQI). Viet-nam Ministry of Natural Resources and Environ-ment, Ha Noi, Vietnam.
Mophin-Kani, K. and Murugesan, A.G. (2011). Evaluation and classification of water quality of perennial river Tamirabarani through aggrega-tion of Water Quality Index. International Jour-nal of Environmental Protection, 1(5), 24-33.
Mouri, G., Golosov, V., Chalov, S., Takizawa, S., Oguma, K., Yoshimura, K., Shiiba, M., Hori, T. and Oki, A. (2013). Assessment of potential sus-pended sediment yield in Japan in the 21st cen-tury with reference to the general circulation model climate change scenarios. Global and Planetary Change, 102(3), 1-9.
Mukundan, R., Pradhanang, S.M., Schneiderman, E.M., Pierson, D.C., Anandhi, A., Zion, M.S., Matonse, A.H., Lounsbury, D.G. and Steenhuis, T.S. (2013). Suspended sediment source areas and future climate impact on soil erosion and sediment yield in a New York City water supply watershed, USA. Geomorphology, 183, 110-119.
Mullai, P., Yogeswari, M.K., Oommen, B., Sara-vanakumar, K. and Kathiresan, K. (2013). Mon-itoring of water quality parameters in Uppanar River of Cuddalore District, Tamil Nadu State, India. Journal of Water Sustainability, 3(4), 179-192.
Nguyen, N.T.T., Loan, D.K. and Hoi, N.C. (2013). Development of Water Quality Index for coastal zone and application in the Ha Long bay. VNU Journal of Science: Earth and Environmental Sciences, 29(4), 43-52.
Niemi, G.J., Devore, P., Detenbeck, N., Taylor, D. and Lima, A. (1990). Overview of case studies on recovery of aquatic systems from disturbance. Environmental Management, 14(5), 571-587.
Parmar, K. and Parmar, V. (2010). Evaluation of water quality index for drinking purposes of river
Subernarekha in Singhbhum District. Interna-tional Journal of Environmental sciences, 1, 77-81.
Pejman, A.H., Bidhendi, G.R.N., Karbassi, A.R., Mehrdadi, N. and Bidhendim, M.E. (2009). Evaluation of spatial and seasonal variations in surface water quality using multivariate statisti-cal techniques. International Journal of Environ-mental Science& Technology, 6(3), 467-476.
Pham, T.L. (2017). Comparison between Water Quality Index (WQI) and biological indices, based on planktonic diatom for water quality as-sessment in the Dong Nai River, Vietnam. Pollu-tion, 3(2), 311-323.
Phung, D., Huang, C., Rutherford, S., Dwirahmadi, E., Chu, C., Wang, X., Nguyen, M., Nguyen, N.H., Do, C.M., Nguyen, T.H. and Dinh, T.A.D. (2015). Temporal and spatial assessment of river surfacewater quality using multivariate statistical techniques: a study in Can Tho City, a Mekong Delta area, Vietnam. Environmental Monitor-ing&Assessment, 187(5), 229.
Ramakrishnaiah, C.R., Sadashivaiah, C. and Ranganna, C. (2009). Assessment of Water Qual-ity Index for the groundwater in Tumkur Taluk, Karnataka State, India. Journal of Chemistry, 6(2), 523-530.
Ray, S., Bari, S.H. and Shuvro, S.D. (2015). Assess-ment of water quality of Goalichara: A Water Quality Index based approach. ARPN Journal of Science and Technology, 5(7), 336-340.
Ringler, C. and Huy, N.V. (2004). Water allocation policies for the Dong Nai river basin in Vietnam: An integrated perspective. Environment and Pro-duction Technology Division Discussion Paper No. 127, Washington, D.C. USA.
Said, A., Stevens, D.K. and Sehlke, G. (2004). An innovative index for evaluating water quality in streams. Environmental Management, 34(3), 406-414.
Shammi, M., Karmakar, B., Rahman, M., Islam, M., Rahman, R. and Uddin, M. (2016). Assessment of salinity hazard of irrigation water quality in monsoon season of Batiaghata Upazila, Khulna

H. Pham et al. / Journal of Water Sustainability 4 (2017) 225-245 245
District, Bangladesh and adaptation strategies. Pollution, 2(2), 183-197.
Shammi, M., Rahman, M., Islam, M., Bodrud-Doza, M., Zahid, A., Akter, Y., Quaiyum, S. and Ku-rasaki, M. (2017). Spatio-temporal assessment and trend analysis of surface water salinity in the coastal region of Bangladesh. Environmental Science and Pollution Research, 24(16), 14273-14290.
Shrestha, S. and Kazama, F. (2007). Assessment of surface water quality using multivariate statisti-cal techniques: A case study of the Fuji river ba-sin, Japan. Environmental Modelling & Software, 22(4), 464-475.
StaB (Statistical Bureau of Lam Dong province). 2015. Statistical Yearbook of Lam Dong province. Lam Dong Statistical Office, Da Lat, Vietnam.
Turtola, E., Alakukku, L., Uusitalo, R. and Kaseva, A. (2007). Surface runoff, subsurface drainflow and soil erosion as affected by tillage in a clayey Finnish soil. Agricultural and Food Science, 16(4), 332-351.
Tyagi, S., Sharma, B., Singh, P. and Dobhal, R. (2013). Water quality assessment in terms of Wa-
ter Quality Index. American Journal of Water Re-sources, 1(3), 34-38.
Uyen, N.D.N., Lien, N.D. and Loi, N.K. (2014). Application of SWAT model and water quality in-dex to assess surface water quality in La Nga river basin. Proceedings of National GIS Appli-cation Workshop 2014, 28-24 September, Can Tho, Vietnam.
Varol, M., Gokot, B., Bekleyen, A. and Sen, B. (2012). Water quality assessment and apportion-ment of pollution sources of Tigris River (Turkey) using multivariate statistical-A case study. River Research & Application, 28(9), 1428-1438.
Wang, X., Cai, Q., Ye, L. and Qu, X. (2012). Eval-uation of spatial and temporal variation in stream water quality by multivariate statistical tech-niques: A case study of the Xiangxi River basin, China. Quaternary International, 282, 137-144.
Wischmeier, W.H. and Smith. D.D. (1978). Predict-ing-Rainfall Erosion Losses. U.S. Govern-ment,Washington, D.C, USA.
Yisa, J. and Jimoh, T. (2010). Analytical studies on Water Quality Index of river Landzu. American Journal of Applied Sciences, 7(4), 453-458.