assessment of the effect of induced hypothermia in ... · assessment of the effect of induced...
TRANSCRIPT

Assessment of the Effect of Induced Hypothermia in Experimental Sepsis
Using a Cecal Ligation and Perforation Mouse Model
Karen Yao Luo
Thesis submitted to the Faculty of Graduate and Postdoctoral Studies
In partial fulfillment of the requirements for the
Master of Science degree in Microbiology and Immunology
Department of Biochemistry, Microbiology and Immunology Faculty of Medicine University of Ottawa
© Karen Yao Luo, Ottawa, Canada, 2011
ii
Abstract
Sepsis-induced organ failure is associated with high morbidity and mortality
rates. The onset of an exaggerated host response to microbial invasion and/or trauma, is
believed to be the primary cause of excessive inflammation and the subsequent tissue
hypoperfusion observed in patients with severe sepsis. In our mouse model of sepsis
induced by cecal ligation and perforation (CLP), symptoms indicative of the disease,
including diarrhea, increased ventilation and persistent hypothermia, are present at six
hours after the surgery (T6). In the untreated CLP mice, mortality occurs starting at T15. As
induced hypothermia has shown to exert immunomodulatory effects, this study is aimed at
assessing its potential in attenuating inflammation and improving survival in experimental
sepsis. Our data has shown that deep hypothermia initiated at T6, by means of cold
chamber-induced cooling, prolongs survival. Plasma cytokine quantification by enzyme-
linked immunosorbent assays (ELISA) also reveals that induced deep hypothermia reduces
tumour necrosis factor(TNF)-α and interleukin (IL)-6 production in untreated CLP mice. In
contrast, induced moderate hypothermia does not have such effect. Antibiotic (cefotaxime)
and saline resuscitation initiated immediately following CLP ensures survival. However,
when these supportive treatments are initiated at T6, >50% mortality is observed in the CLP
mice with or without induced hypothermia. In summary, this preliminary study provides
proof for a downregulated inflammatory response mediated by external cooling. However,
to achieve a survival benefit, treatment strategies in addition to cooling and antibiotics may
be required.

iii
Acknowledgment
First of all, I would like to express my gratitude towards my supervisor, Dr. Gary
Garber, for giving me this opportunity to pursue graduate research and take on this
challenging project. I am grateful for his encouragement and support throughout my two
years of study in the program and for his understanding and generosity when I was
experiencing emotionally exhaustive times. I am also in debt to Yang Song, for generously
sharing his knowledge of experimental sepsis with me. In the mean time, a heartfelt “thank
you” to the rest of the Garber Team for teaching me everything around the lab and granting
me space and privacy when I had to conduct overnight experiments.
In addition, a big “thank you” to all of the animal care technicians and veterinarians
who have provided assistance in this project, especially Kim Yates and e Dr. Michelle
Groleau. I would also like to thank my thesis advisory committee, Dr. Lauralyn McIntyre, Dr.
Subash Sad and Dr. Andrew Seely.
To all of my friends, especially Bing, Dione and Shahed and Ye, for being more than
just good friends. I am very grateful for having you in my life. It would have been a very
different experience if you weren’t here.
Last but not least, I would like to dedicate this body of work to my parents, for
everything they gave me, taught me and made me learn on my own.

iv
Table of Contents
ABSTRACT ....................................................................................................................... II
ACKNOWLEDGMENT ...................................................................................................... III
TABLE OF CONTENTS ...................................................................................................... IV
LIST OF ABBREVIATIONS ................................................................................................ VII
LIST OF FIGURES .............................................................................................................. X
LIST OF TABLES .............................................................................................................. XII
INTRODUCTION ............................................................................................................... 1
1.1 Overview of Sepsis .................................................................................................... 1 1.1.1 Epidemiology and Significance ..................................................................................... 1
1.1.2 Diagnosis of Sepsis ........................................................................................................ 2
1.1.3 From Infection to Acute Inflammation ......................................................................... 3
1.1.4 Coagulation in Sepsis .................................................................................................... 8
1.1.5 Organ Dysfunction in Sepsis ....................................................................................... 13
1.1.6 Treatments Approaches ............................................................................................. 15
1.2 Overview of Induced Hypothermia ........................................................................... 19 1.2.1 Hypothermia-associated Physiological Responses..................................................... 19
1.2.2 Therapeutic Hypothermia .......................................................................................... 22
1.3 The Model Systems................................................................................................... 24 1.3.1 Overview of Sepsis Models ......................................................................................... 24
1.3.2 Critical Determinants of CLP ....................................................................................... 27
1.4 Induced Hypothermia in Experimental Sepsis ............................................................ 29 1.4.1 Endotoxemia Models .................................................................................................. 29
1.4.2 The CLP Model ............................................................................................................ 31
1.5 Hypothesis and Objectives ........................................................................................ 32
v
MATERIALS AND METHODS ............................................................................................ 33
2.1 Experimental Animals ............................................................................................... 33
2.2 Cecal Ligation and Perforation .................................................................................. 33 2.2.1 Pre-surgery ................................................................................................................. 33
2.2.2 The CLP Procedure ...................................................................................................... 34
2.2.3 Post-operative Monitoring ......................................................................................... 35
2.3 Treatment Strategies ................................................................................................ 35 2.3.1 Induction of Hypothermia and Rewarming ................................................................ 35
2.3.2 Hypothermia Combined with Antibiotic & Fluid Resuscitation ................................. 36
2.4 Endpoint of Experiment ............................................................................................ 37
2.5 Blood Collection ....................................................................................................... 37 2.5.1 Saphenous Vein Bleed ................................................................................................ 37
2.5.2 Cardiac Puncture ........................................................................................................ 38
2.6 Enzyme Linked Immunosorbent Assays (ELISA) ......................................................... 39
2.7 Organ Collection and H&E Staining ........................................................................... 41
2.8 Other Tests ............................................................................................................... 42 2.8.1 Approximation of Cecal Bacteria Density ................................................................... 42
2.8.2 Quantification of Bacteria in the Blood of CLP Mice .................................................. 43
2.9 Statistical Analysis .................................................................................................... 43
RESULTS ......................................................................................................................... 44
3.1 Effect of Induced Hypothermia on the Control Mice .................................................. 44
3.2 Effect of Induced Hypothermia on the CLP Mice ........................................................ 48 3.2.1 Preliminary CLP Experiments...................................................................................... 48
3.2.2 6-Hour Hypothermia Induced at Two Different Time Points ..................................... 50
3.2.3 Optimizing the Duration of Cooling ............................................................................ 51
3.2.4 ELISA ........................................................................................................................... 53
3.2.5 Histological Assessment ............................................................................................. 57

vi
3.3 Hypothermia & Standard Treatment Strategies ......................................................... 61 3.3.1 The Timing of Antibiotics Administration is Critical ................................................... 61
3.3.2 Duration and Depth Optimization .............................................................................. 62
3.3.3 Why Moderate Hypothermia Doesn’t Work? ............................................................ 64
3.3.4 The Alternative Rewarming Approach ....................................................................... 67
3.4 Resuscitation with Dextrose in Saline ........................................................................ 68 3.4.1 Survivorship ................................................................................................................ 68
3.4.2 ELISA Results ............................................................................................................... 69
3.5 Bacterial Quantification ............................................................................................ 74 3.5.1 An Estimate of Cecal Bacteria Density ....................................................................... 74
3.5.2 Quantification of Bacteria in the Blood of CLP Mice with or without Induced Deep
Hypothermia ........................................................................................................................ 76
DISCUSSION ................................................................................................................... 78
4.1 CLP-induced Sepsis ................................................................................................... 78
4.2 Hypothermia ............................................................................................................ 82 4.2.1 Isofluorane- and Sepsis-Induced Hypothermia .......................................................... 82
4.2.2 Induced Hypothermia ................................................................................................. 84
4.2.3 Deep Hypothermia ..................................................................................................... 86
4.2.4 Moderate Hypothermia .............................................................................................. 87
4.3 Standard Antibiotics and Saline Resuscitation ........................................................... 88
4.4 Dextrose infusion ..................................................................................................... 89
4.5 Limitation of Our Model System ............................................................................... 90
4.6 Future Directions ...................................................................................................... 91
CONCLUSION .................................................................................................................. 92
REFERENCES ................................................................................................................... 93
vii
List of Abbreviations
ACC Animal Care Committee
ALI acute lung injury
APC activated protein C
ARDS acute respiratory distress syndrome
AT antithrombin
BAR bright, alert and response
CARS the compensatory anti-inflammatory response syndrome
CCAC Canadian Council on Animal Care
CFU colony-forming units
CL cecal ligation
CLP cecal ligation and perforation/puncture
CNS central nervous system
ddH2O double-distilled water
DP deep hypothermia
ELISA enzyme linked immunosorbent assay
G gauge
GABA gamma-aminobutyric acid
GAG glycosaminoglycan
H & E hematoxylin and eosin
HMGB1 high-mobility group B1 protein
ICU intensive care unit
I.P. intraperitoneal

viii
I.V. intravenous
IL-1β interleukin - 1β
IL-6 interleukin – 6
IL-10 interleukin – 10
LB lysogeny broth
LBP lipopolysaccharide binding protein
LPS lipopolysaccharide
MAC membrane attack complex
MAMP microbe-associated molecular pattern
MH moderate hypothermia
MN Minnesota
MODS multiple organ dysfunction syndrome
NAC N-acetylcysteine
NF-κB nuclear factor kappa-light-chain-enhancer of activated B cells
NO nitric oxide
PA plasminogen activator
PAI-1 plasminogen activator inhibitor-1
PHP pyridoxylated haemoglobin polyoxyethylene
PRR pattern recognition receptor
q6h every six hours
QC Quebec
ROS reactive oxygen species
RT room temperature
S.C. subcutaneous

ix
SIRS the systemic inflammatory response syndrome
SSC Sepsis Surviving Campaign
SSS the severe sepsis syndrome
TAPI thrombin-activated protein inhibitor
TAT thrombin-antithrombin
TBI traumatic brain injury
TF tissue factor
TF: VIIa complex of tissue factor and factor VIIa
TGF-β transforming growth factor β
TM thrombomodulin
TNF-α tumour necrosis factor-α
TNTC too numerous to count
UO University of Ottawa
U.S. United States of America
# of hours after CLP T#

x
List of Figures
Figure 1. Effect of the Initial Cytokine Response on Infection Progression ............................. 7
Figure 2. The Hemostatic System Balanced by Procoagulant and Anticoagulant Pathways is
Altered in Sepsis ...................................................................................................................... 12
Figure 3. Body Weight and Rectal Temperature of Sham Mice with or without 6-hour
Induced Hypothermia Initiated at T0. ..................................................................................... 45
Figure 4. Body Weight and Rectal Temperature of Mice with Cecal Ligation Only with or
without 6-hour Induced Hypothermia Initiated at T1.. .......................................................... 46
Figure 5. Body Weight and Rectal Temperature of Mice with Cecal Ligation and Perforation
(CLP Mice) in the Absence of Treatments ............................................................................... 49
Figure 6. Rectal Temperature of CLP Mice with 6 Hours of Induced Hypothermia Initiated at
T1 ............................................................................................................................................. 50
Figure 7. Proportionate Survival of CLP Mice with Different Durations of Cooling Initiated at
T6. ............................................................................................................................................ 51
Figure 8. Proportionate Survival of CLP Mice with or without Induced Hypothermia.. ......... 52
Figure 9. Time Required for Induction of Deep Hypothermia in CLP Mice and Subsequent
Rewarming to 30:C ................................................................................................................. 54
Figure 10. Plasma TNF-α Concentration in CLP Mice with or without Induced Deep
Hypothermia at T6 and Rewarming ........................................................................................ 55
Figure 11. Plasma IL-1β Concentration in CLP Mice with or without Induced Deep
Hypothermia at T6 and Rewarming. ....................................................................................... 55
Figure 12. Plasma IL-6 Concentration in CLP Mice with or without Induced Deep
Hypothermia at T6 and Rewarming. ....................................................................................... 56
Figure 13. Plasma IL-10 Concentration in CLP Mice with or without Induced Deep
Hypothermia at T6 and Rewarming. ....................................................................................... 57
Figure 14. H&E Stained Heart from Sham, CLP and CLP with Induced Deep Hypothermia
Mice.. ....................................................................................................................................... 58

xi
Figure 15. H&E Stained Liver from Sham, CLP and CLP with Induced Deep Hypothermia
Mice. ........................................................................................................................................ 59
Figure 16. H&E Stained Spleen from Sham, CLP and CLP with Induced Deep Hypothermia
Mice. ........................................................................................................................................ 60
Figure 17. Proportionate Survival of CLP Mice with Cefotaxime Treatment Initiated at
Different Time Points.. ............................................................................................................ 62
Figure 18. Time Required for Induction of Moderate Hypothermia (27 - 28:C) in CLP mice in
72-hour Survival Experiments ................................................................................................. 63
Figure 19. Proportionate Survival of CLP Mice with Various Degrees and Duration of Induced
Hypothermia Initiated at T6 in Conjuntion with Cefotaxime Treatment ............................... 64
Figure 20. Plasma TNF-α Concentration in CLP Mice with or without Induced Moderate
Hypothermia at T6 and Rewarming. ....................................................................................... 65
Figure 21. Plasma IL-1β Concentration in CLP Mice with or without Induced Moderate
Hypothermia at T6 and Rewarming. ....................................................................................... 65
Figure 22. Plasma IL-6 Concentration in CLP Mice with or without Induced Moderate
Hypothermia at T6 and Rewarming. ....................................................................................... 66
Figure 23. Plasma IL-10 Concentration in CLP Mice with or without Induced Moderate
Hypothermia at T6 and Rewarming.. ...................................................................................... 66
Figure 24. Proportionate Survival of 10% Dextrose-treated CLP Mice with or without
Induced Moderate Hypothermia. ........................................................................................... 69
Figure 25. Plasma TNF-α Concentration in CLP Mice with or without Cefotaxime, Dextrose-
Saline and Induced Moderate Hypothermia at T6.. ................................................................ 70
Figure 26. Plasma IL-1β Concentration in CLP Mice with or without Cefotaxime, Dextrose-
Saline and Induced Moderate Hypothermia at T6. ................................................................. 71
Figure 27. Plasma IL-6 Concentration in CLP Mice with or without Cefotaxime, Dextrose-
Saline and Induced Moderate Hypothermia at T6.. ................................................................ 72
Figure 28. Plasma IL-10 Concentration in CLP Mice with or without Cefotaxime, Dextrose-
Saline and Induced Moderate Hypothermia at T6 .................................................................. 73
xii
List of Tables
Table 1. Core Temperature of CLP Mice with 6 Hours of Induced Hypothermia Initiated at
T6. ............................................................................................................................................ 51
Table 2. Temperature of CLP Mice with 4 Hours of Induced Hypothermia Initiated at T6. ... 53
Table 3. Rectal Temperature of CLP Mice in a Temperature Changing Environment. ........... 68
Table 4. Comparison of CLP Mice with or without the Combination(s) of Treatments. ........ 69
Table 5. The Turbidity Test Results at 24 Hours Post-inoculation .......................................... 74
Table 6. Viable Cell Count of Cecal Bacteria at 24 Hours Post-incubation ............................. 75
Table 7. An Estimate of Bacterial CFUs within a Mouse’s Cecum. ......................................... 75
Table 8. Quantification of Bacteria in the Blood of CLP Mice with or without Induced Deep
Hypothermia. .......................................................................................................................... 77

1
1 Introduction
1.1 Overview of Sepsis
1.1.1 Epidemiology and Significance
Sepsis-associated organ dysfunction is a leading cause of death in the intensive care
unit (ICU) (Shimaoka and Park, 2008). This complex clinical syndrome is characterized by an
exaggerated or damaging host response triggered by microbial invasion or tissue injury,
giving rise to systemic inflammation (Cohen, 2002).
The most common sites of infection are in sterile tissue spaces within the body,
such as the lungs, abdominal cavity and urinary tract; primary bloodstream infections have
also been found (Cohen, 2002). Based on microbiological diagnosis, Gram-negative bacteria
represent the predominant etiologic agent. However, Gram-positive bacteria and fungal
infections have also become increasingly common since the late 1980s (Angus et al., 2001;
Alberti et al., 2002).
According to the Surviving Sepsis Campaign (SSC), over 18 million people worldwide
are affected by sepsis every year (Slade et al., 2003). In the United States (U.S.) alone, there
are approximately 750,000 cases per year (Angus et al., 2001). Although all individuals are
at potential risk for developing sepsis, people with compromised immunity are more
susceptible to microbial infections and therefore, represent the largest population of
individuals presenting with sepsis (Rice and Bernard, 2005).
The overall mortality associated with this infectious disease is approximately 30% in
hospitalized septic patients, and it increases with age and disease severity (Angus et al.,
2
2001). A review of the epidemiology of sepsis in the U.S. between 1979 and 2000 has
reported a rise in the incidence of sepsis at an annualized rate of 8.7%, possibly owing to
the increased use of antibiotics and immunosuppressive drugs, resulting in increased
microbial resistance (Martin et al., 2003). In addition, treatments costs are estimated at
$50, 000 per septic patient in the U.S., which amounts to an annualized cost of $17 billion
(Angus et al., 2001).
In summary, this life-threatening clinical presentation is prevalent and imposes a
heavy burden on the healthcare system. Extensive research efforts have been made in the
last few decades to understand the pathogenesis of sepsis and ways to improve survival.
1.1.2 Diagnosis of Sepsis
Originally, the diagnosis of sepsis required confirmation of blood infection and the
onset of two or more of the following clinical symptoms: 1) hyperthermia (>38°C) or
hypothermia (<36°C), 2) tachycardia (>90 heartbeats/min), 3) tachypnea (>20 breaths/min
or PaCO2 < 32mmHg), or 4) the presence of an abnormal blood leukocyte count (<4 x 10⁹
cells/L or >12 x 109 cells/L). However, bacteria may not be detected in the blood of a
significant number of patients with the symptoms described above by the traditional blood
culturing method because tissue injury can also elicit hyper-activation of the inflammatory
response (Riedemann et al., 2003). Therefore, the term, “systemic inflammatory response
syndrome (SIRS)”, is currently used to describe the onset of sepsis-like symptoms in the
absence of positive blood cultures. Non-culture techniques, such as sequencing of PCR-

3
amplified 16s rDNA, are now being employed for more efficient and accurate etiologic
diagnosis (Shang et al., 2005).
Patients with more severe cases of sepsis may also demonstrate altered organ
function and hypotension as a result of inflammation-induced vascular instability and
coagulopathy (Cohen, 2002). Severe sepsis develops when the patient’s systolic blood
pressure drops below 90 mmHg (Bone et al., 1992). Such low blood pressure is
accompanied by hypoperfusion and metabolic acidosis, leading up to septic shock, which
occurs when the septic patient remains hypotensive in spite of adequate fluid
resuscitation. According to the SSC, the mortality rate associated with septic shock is
approximately 50% in the ICU (SSC, 2011). The terminal stage of sepsis is manifested by
multiple organ dysfunction syndrome (MODS), which irreversibly leads to death.
Thus, these progressive stages of sepsis, namely, SIRS/sepsis, severe sepsis, septic
shock, and MODS, are diagnosed based on the clinical symptoms observed, which, by and
large, reflect the magnitude of the host response and its associated impact on organ
systems in response to an infectious process.
1.1.3 From Infection to Acute Inflammation
The pathogenesis of sepsis begins with the breaching of physical barriers by
microorganisms. In an immunocompetent host, layers of epithelial cells lining the skin and
mucosal surfaces serve as the interface between the host and the exterior, providing both
a physical barrier against the entry of foreign particles and bactericidal functions through
secretion of antimicrobial substances, such as defensins, which perforate bacterial cell
4
membranes (Kolls et al., 2008). Penetration of microbes through an opening in the skin or
a damaged inner mucosal surface, therefore, evades such external defenses, and mobilizes
the immune system in attempt to clear the infection (Cohen, 2002; Lydyard et al., 2009).
Upon entrance into the local tissues, the invading pathogens encounter resident
immune cells, such as macrophages. These large phagocytic cells sense a stimulus through
recognizing the microbe-associated molecular patterns (MAMPs) via their surface pattern
recognition receptors (PRRs) (Lydyard et al., 2009). For instance, the toll-like receptors
(TLRs) present on the surface of macrophages and other immune cells recognize a broad
range of microbial motifs, including bacterial flagellin and the endotoxin lipopolysaccharide
(LPS), which is a lipoprotein-carbohydrate complex found in the cell wall of Gram-negative
bacteria (Aderem and Ulevitch, 2000). Through bridging with lipopolysaccharide binding
protein (LBP) and CD14, this endotoxin-containing complex activates the TLR-4-mediated
intracellular signalling, leading to the activation and nuclear transport of nuclear factor
kappa-light-chain-enhancer of activated B cells (NF-κB) (Wright et al., 1990). NF-κB plays a
key role in regulating the inflammatory response by binding to specific sequences of DNA,
and coordinating the expression of cytokines and other inflammatory mediators.
Among the multifunctional molecules produced downstream of NF-κB activation,
tumour necrosis factor (TNF-α) and interleukin (IL)-1 are among the first mediators
released into the bloodstream by the stimulated mononuclear cells (Cohen, 2002).
Together, these two prototypic inflammatory cytokines upregulate the expression of
endothelial adhesion molecules, increase vascular permeability in preparation for
5
neutrophil recruitment, and induce the expression of tissue factors (Shimaoka and Park,
2008).
In addition, TNF-α activates macrophages and induces their production of reactive
oxygen species (ROS) and nitric oxide (NO) via phagosomal
nicotinamide adenine dinucleotide phosphate (NADPH) oxidase-dependent and
mitochondrial TNF receptor associated factor (TRAF)-6-dependent respiratory burst
(Underhill et al., 2002; West et al., 2011), thereby enhancing the killing of invading
microbes and contributing to further vasodilation (Lydyard et al., 2009). IL-1, on the other
hand, induces the systemic production of IL-6, a pyrogenic factor that has been labelled a
prognostic marker in patients with severe sepsis (Remick et al., 2006). In this way, a
second wave of inflammatory mediators, including cytokines, chemokines and lipid
mediators, such as prostaglandin, are elicited by TNF-α and IL-1 (Riedemann et al., 2003).
IL-6, in conjunction with TNF-α, increases lymphocyte activation and facilitates neutrophil
recruitment. In addition, it is a powerful inducer of coagulation (Cohen, 2002) and the
release of acute phase proteins, which catalyze the activation of the complement system
(Lydyard et al., 2009).
The complement system represents one of the most potent innate defense
mechanisms against bacterial infection. Upon appropriate triggering through one of the
three activation pathways, a cascade of proteolytic events occurs, giving rise to the
formation of the membrane attack complex (MAC) and anaphylatoxins. The insertion of
MAC into a bacterial cell disrupts its cellular integrity, resulting in cell lysis. Anaphylatoxins,
6
on the other hand, have a variety of functions, including opsonisation, neutrophil
chemotaxis and induction of acute inflammation by direct activation of mast cells (Lydyard
et al., 2009)
Mast cells are found in connective tissues close to the blood vessels. Upon binding
to anaphylatoxins, these granulocytes become activated and release histamine-containing
granules, thereby promoting further vasodilation. In addition, it is a potent source of pro-
inflammatory cytokines and chemokines, aggravating inflammation (Lydyard et al., 2009).
Therefore, infection elicits a cytokine response that orchestrates a network of
immune reactions, resulting in widespread activation of the immune system, vascular
changes and infiltration of immune cells into the affected areas. However, when there is an
overabundant production of pro-inflammatory cytokines by the host, a hyperactive
immune response ensues, resulting in the onset of SIRS (Cohen, 2002; Riedemann et al.,
2003).
Increasing evidence has shown that sepsis is a biphasic immune response of
exaggerated magnitude, whereby the initial over-amplified inflammatory response as a
result of the cytokine storm is followed by an immunosuppressive state. Netea et al. (2003)
recently proposed a model to explain this bimodal process. In their model, a number of
host factors, including genetic disorders, concurrent immunosuppressive therapies and the
presence of other underlying diseases, are believed to contribute to this dysregulated
immune response, in which an initial low cytokine response to the local infection provides
an opportunity for the invading pathogens to replicate and disseminate into the
7
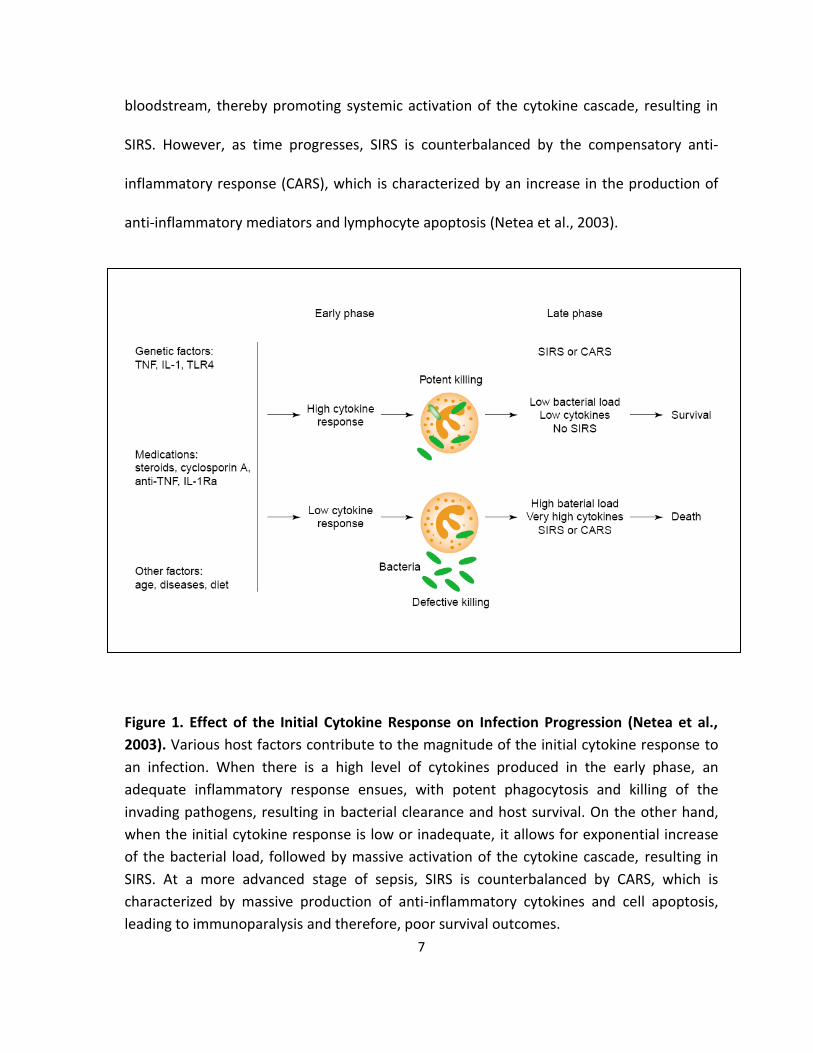
bloodstream, thereby promoting systemic activation of the cytokine cascade, resulting in
SIRS. However, as time progresses, SIRS is counterbalanced by the compensatory anti-
inflammatory response (CARS), which is characterized by an increase in the production of
anti-inflammatory mediators and lymphocyte apoptosis (Netea et al., 2003).
Figure 1. Effect of the Initial Cytokine Response on Infection Progression (Netea et al.,
2003). Various host factors contribute to the magnitude of the initial cytokine response to
an infection. When there is a high level of cytokines produced in the early phase, an
adequate inflammatory response ensues, with potent phagocytosis and killing of the
invading pathogens, resulting in bacterial clearance and host survival. On the other hand,
when the initial cytokine response is low or inadequate, it allows for exponential increase
of the bacterial load, followed by massive activation of the cytokine cascade, resulting in
SIRS. At a more advanced stage of sepsis, SIRS is counterbalanced by CARS, which is
characterized by massive production of anti-inflammatory cytokines and cell apoptosis,
leading to immunoparalysis and therefore, poor survival outcomes.
8
During CARS, elevated levels of anti-inflammatory cytokines, including IL-10 and
transforming growth factor β (TGF-β), inhibit TNF-α production by macrophages and
suppress the expression of co-stimulatory molecules on macrophages and lymphocytes,
reducing their functional capacity (Netea et al., 2003). In doing so, it allows for the
propagation of refractory bacteria that are resistant to the antibiotic treatment,
exacerbating the infection. In addition, apoptosis of lymphocytes and dendritic cells greatly
compromises the host’s innate and adaptive immune responses (Hotchkiss and Nicholson,
2006).
Therefore, a correct balance of inflammation and the subsequent anti-
inflammation, including the intensity and timing of each, has a great impact on the
eradication of infection and survival of the host. While an amplified inflammatory response
gives rise to SIRS, an overwhelming CARS can lead to immunoparalysis.
1.1.4 Coagulation in Sepsis
Besides inflammation, the cytokine storm initiated in response to infection also
induces a pro-coagulant effect. The pro-inflammatory cytokines, including IL-1 and IL-6,
mediate the exposure of tissue factors by endothelial cells, neutrophils and monocytes
(Cohen, 2002). While endotoxin and foreign particles are also capable of initiating blood
clotting, binding of tissue factor (TF) to factor VIIa (TF: VIIa) on the surface of cell
membranes is considered a major player in coagulation initiation and amplification (van’t
Veer and Mann, 1997).
9
The formation of this starter complex, TF: VIIa, brings about a series of protein
activation, resulting in the conversion of a zymogen prothrombin to thrombin (Figure 2).
Thrombin acts to form a positive feedback loop, amplifying both coagulation and
inflammation (Amaral et al., 2004; Cohen, 2002). Besides enhancing platelet activation and
adhesion to the site of injury, thrombin readily activates other tissue factors (eg. factors V
and VIII) and increases the surface expression of P-selectin on the activated platelets,
facilitating cell aggregation (Amaral et al., 2004). However, the most notable function of
thrombin is its ability to activate fibrinogen (Mosesson, 1992). This activated fibrous
protein, fibrin, can then form a mesh network to trap the activated platelets, thereby
producing a hemostatic clot over the wound (Figure 2). The stability of such clot is also
strengthened by thrombin-activated factor XIIIa, which stabilizes the fibrin network by
rendering it more resistant to plasmin-driven degradation (Schwartz et al., 1971). In
summary, thrombin activation is crucial in blood coagulation.
Plasmin, which mediates hydrolysis of fibrin clots (Pizzo et al., 1973), is activated by
the plasminogen activators, including the tissue-type plasminogen activator (t-PA) and
urokinase-type plasminogen activator (u-PA) (Weitz et al., 1999). Therefore, plasminogen
activation represents a critical step in the anti-coagulant pathway and is a main regulator
of coagulation (Figure 2).
Tissue factor pathway inhibitor (TFPI), on the other hand, is responsible for
regulating the pro-coagulant pathway as it is a potent inhibitor of the TF: VIIa complex
(Figure 2) (Amaral et al., 2004). Similarly, antithrombin (AT) downregulates the pro-

10
coagulant pathway; it is an antagonist of thrombin and a number of other factors, such as
factor Xa (Figure 2) (Blajchman et al., 1992). Its function is enhanced by acid
pentasaccharide moieties, such as glycosaminoglycans (GAG), which are present in
abundance on the surface of cells or in the extracellular matrix (Amaral et al., 2004).
The ultimate multifunctional inhibitor of coagulation is activated protein C (APC)
(Figure 2). It is activated from its zymogen, protein C, when thrombin binds to
thrombomodulin (TM) on the vascular endothelial surfaces (Esmon, 1989). Upon
interacting with protein S, a co-factor, APC inactivates factors Va and VIIa, thereby stalling
the cascade of thrombin activation (Kisiel, 1979). In addition, APC is involved in fibrinolysis.
It acts by complexing with plasminogen activator inhibitor-1 (PAI-1), which is an inhibitor of
t-PA and u-PA, to ensure plasminogen activation (Sakata et al., 1986). Moreover, in vitro
studies have shown that APC exerts an anti-inflammatory effect; it downregulates the pro-
inflammatory cytokine production by monocytes and limits the rolling of neutrophils and
monocytes on injured endothelium by binding to the adhesion molecules (Bernard et al.,
2001).
However, protein C, and therefore APC levels, are largely reduced in sepsis (Figure
2), possibly owing to the concomitant reduction of TM on the endothelial surfaces and
increased levels of free soluble TM in the plasma (Conway et al., 1988; Gando et al., 1995;
Moore et al. 1987). In fact, it has been shown that pro-inflammatory cytokines, such as
TNF-α, and LPS are potent inhibitors of TM expression on cell surfaces (Conway et al., 1988;
Moore et al. 1987). Because only cell membrane-associated TM is capable of activating

11
protein C efficiently (Amaral et al., 2004), TM dissociation from the cell membrane
interferes with protein C activation, which in turn, impairs the anti-coagulant pathway. In
addition, AT concentrations are reduced in sepsis as a result of increased activation of
thrombin, resulting in excessive thrombin-antithrombin (TAT) binding (Amaral et al., 2004).
Moreover, AT may be targeted by leukocyte proteases, resulting in a further decline in AT
concentration (Opal, 2000). Expression of GAG has also been shown to be inhibited by pro-
inflammatory cytokines and LPS (Amaral et al., 2004).
On the other hand, increased levels of TF and PAI-1, which contribute to the
initiation of coagulation and inhibition of anti-coagulation, respectively, have been
observed in clinical sepsis (Cohen, 2002). Such disturbance in the hemostatic system leads
to enhanced formation of fibrin clots and vascular thrombosis, compromising tissue
perfusion and oxygen delivery (Figure 2).
In summary, the aberrant expression of pro-inflammatory cytokines, in conjunction
with the presence of MAMPs, triggers blood coagulation. Through upregulating the
expression of adhesion molecules and pro-coagulant proteins, and suppressing the activity
of proteins involved in the anti-coagulation pathway, amplification of coagulation is
achieved. Ultimately, tilting the balance between coagulation and anti-coagulation
orchestrates a positive feedback loop in coagulation and inflammation, in which extensive
inflammation gives rise to coagulopathy that furthers tissue swelling and recruitment of
inflammatory cells.
12
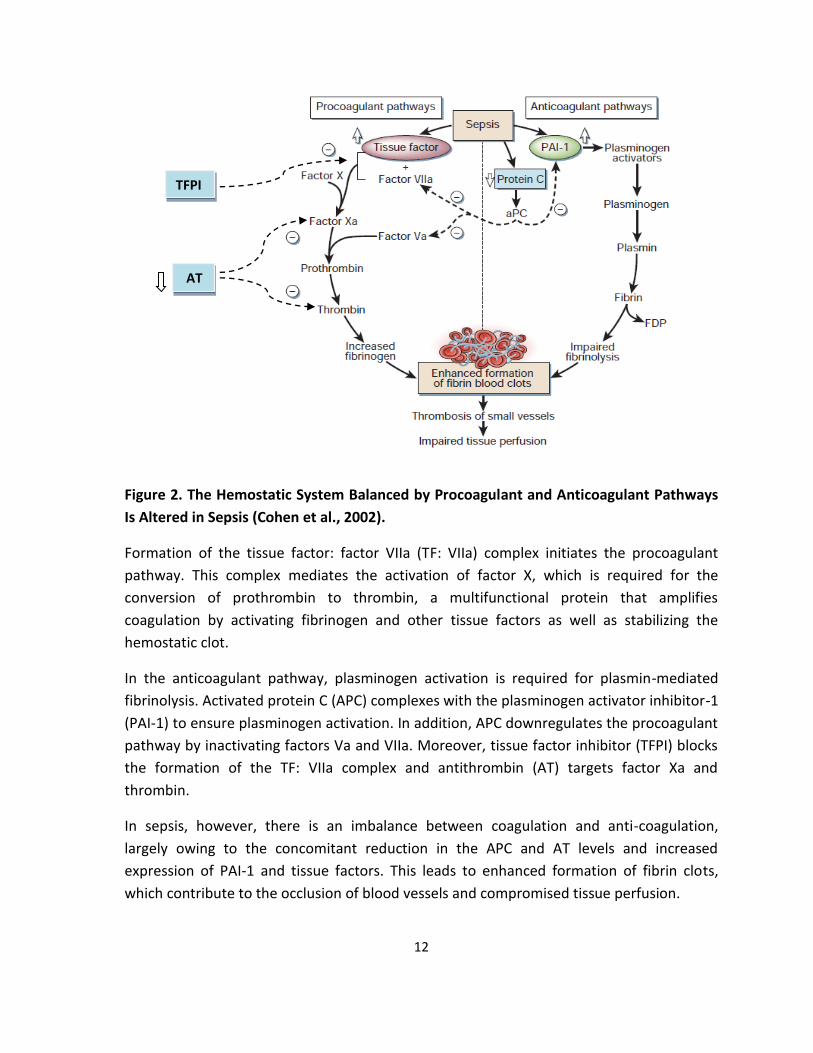
Figure 2. The Hemostatic System Balanced by Procoagulant and Anticoagulant Pathways
Is Altered in Sepsis (Cohen et al., 2002).
Formation of the tissue factor: factor VIIa (TF: VIIa) complex initiates the procoagulant
pathway. This complex mediates the activation of factor X, which is required for the
conversion of prothrombin to thrombin, a multifunctional protein that amplifies
coagulation by activating fibrinogen and other tissue factors as well as stabilizing the
hemostatic clot.
In the anticoagulant pathway, plasminogen activation is required for plasmin-mediated
fibrinolysis. Activated protein C (APC) complexes with the plasminogen activator inhibitor-1
(PAI-1) to ensure plasminogen activation. In addition, APC downregulates the procoagulant
pathway by inactivating factors Va and VIIa. Moreover, tissue factor inhibitor (TFPI) blocks
the formation of the TF: VIIa complex and antithrombin (AT) targets factor Xa and
thrombin.
In sepsis, however, there is an imbalance between coagulation and anti-coagulation,
largely owing to the concomitant reduction in the APC and AT levels and increased
expression of PAI-1 and tissue factors. This leads to enhanced formation of fibrin clots,
which contribute to the occlusion of blood vessels and compromised tissue perfusion.
TFPI
AT

13
1.1.5 Organ Dysfunction in Sepsis
Due to the large-scale production of the inflammatory and pro-coagulant
mediators, microvascular occlusion and cellular infiltrate-mediated tissue damage occur,
contributing to vascular instability and myocardial depression (Cohen, 2002). Such disorder
of microvascular and hemodynamic homeostasis compromises tissue perfusion, resulting in
inadequate oxygenation of tissue organs and impaired cellular function (Brealey et al.,
2002; Cohen, 2002).
This section provides a brief overview of the symptoms associated with changes in
the major physiological systems during sepsis. It is generally believed that the onset of
MODS follows a predictable course, starting with the respiratory system, followed by the
liver, the kidneys and then the heart. Alterations in the central nervous system (CNS),
however, may occur at any stage during the process (Deitch, 1992).
The first symptoms indicative of respiratory involvement in sepsis are characterized
by increased respiratory frequency (tachypnea) and/or increased ventilation volume
(polypnea). Owing to inflammation-mediated increase in vascular permeability, infiltration
of immune cells and extravasation of plasma, the normal pulmonary architecture is no
longer intact. Diffuse alveolar damage brings about impaired gas exchange, which is
characteristic of acute lung injury (ALI) and acute respiratory distress syndrome (ARDS)
(Suter, 2006; Ware and Matthay, 2000). The onset of ARDS is estimated at approximately
20% in septic patients (Fein et al., 1983).
Intrahepatic cholestasis and altered liver metabolism, including reduced
gluconeogenesis and bilirubin abnormalities, are also prevalent complications in septic

14
patients (Franson et al., 1985; Moseley, 1999). Because the liver is a source of
inflammatory mediators (ie. acute phase proteins) and contains the largest mass of
macrophages (ie. Kupffer cells) in the body, it has dual roles in sepsis. Not only does it
participate in regulating the infection-elicited inflammatory response, it is also a target
organ of the inflammatory effects (Szabo et al., 2002). As a result of inflammation and
coagulation, microcirculatory disturbances ensue and they appear to be the initiating event
leading up to hepatic dysfunction (Dhainaut et al., 2001).
Acute renal failure (ARF), which is defined as a reduction in glomerular filtration
rate, is the most common renal manifestation in sepsis (Oppert et al., 2008). It occurs at a
rate of 20% in patients presenting with sepsis, rising to 50% in septic shock (Lucas, 2007). In
parallel with the activation of the immune system, the sympathetic-adrenal axis is
activated in response to the infectious insult, stimulating the renin-angiotensin system to
release angiotensin and aldosterone as part of the host defense mechanism (Thijs and
Thijs, 1998). The increased plasma levels of angiotensin, epinephrine, cytokines and NO
mediate hemodynamic changes that are characterized by changes in the vascular tone and
microcirculatory disturbances, contributing to ischaemic damage and tubular injury
induced by decreased oxygen extraction (Majumdar, 2010; Schrier and Wang, 2004).
The onset of cardiovascular impairment has been associated with a remarkably high
mortality rate of 70% to 90%, compared with 20% in septic patients without myocardial
dysfunction (Parillo et al., 1990). Based on previous animal studies and autopsies, sepsis-
driven cardiac depression is a multi-factorial manifestation and it has been linked to
15
impaired ventricular functions, decreased contractility, impaired myocardial compliance
and metabolic alterations in the myocardium (Dhainaut et al., 1988; Merx and Weber,
2007; Natanson et al., 1986; Parker et al., 1990). Cardiac troponin levels, which represent a
prognostic biomarker in heart diseases, are also elevated in sepsis (Fernandes et al., 1999).
In some patients surviving sepsis, however, no permanent myocardial defect is found,
implying that the damage may be reversible (Levy et al., 2005).
Similarly, sepsis almost always affects the CNS. Impairment of cognitive functions
as a result of cerebral pathologies has been reported in severe septic patients (Lazosky et
al., 2010). The effects of sepsis are also believed to be amplified in individuals with
concomitant brain injury (Stocchetti, 2005). In addition, cerebral infarction, small white
matter haemorrhages and metastatic abscess have been found in fatal cases, alluding to
the fact that these alterations in the CNS are common manifestations in critically ill
patients (Jackson et al., 1985; Wilson and Young, 2003).
In conclusion, due to the imbalance between SIRS and CARS in sepsis, organ
dysfunction is induced. Hence, prompt therapeutic interventions are critical for preventing
systemic deterioration associated with septic shock.
1.1.6 Treatments Approaches
Improved understanding of the pathophysiologic mechanisms of sepsis over the
past few decades has facilitated the development of therapeutic strategies. Besides the
standard treatments, including broad-spectrum antibiotics, fluid resuscitation, vasopressor
and the use of ventilation support, a myriad of chemical agents targeting specific
16
components of the inflammatory and coagulant pathways have been developed and
assessed for their therapeutic potential. These include corticosteroids, pro-inflammatory
mediator antagonists and anti-coagulants.
For decades, corticosteroids, such as hydrocortisone and the synthetic compound
methylprednisolone, have been a popular choice for therapeutic use because this steroid,
in complexing with the glucocorticoid receptor, is believed to exert anti-inflammatory
effects (Greaves, 1976). A 2004 meta-analysis review considering multiple clinical trials of
corticosteroid treatments for severe sepsis and septic shock patients supports the long-
course use of low-dose corticosteroids, providing clinical evidence for its efficacy in
reducing mortality (Minneci et al., 2004). In addition, prolonged treatment of
methylprednisolone in patients with ARDS has shown to resolve inflammation by lowering
TNF-α and IL-6 levels and downregulating NF-κB activation in peripheral blood leukocytes
(Meduri et al., 2002). Hence, intravenous infusion of hydrocortisone at 200-300 mg/day for
severe septic patients who are not responsive to vasopressin or standard fluid resuscitation
is recommended by the SSC. In contrast, high-dose corticosteroid treatment does not
confer such benefits; rather, a high rate of gastrointestinal bleeding was observed
(Bennett, 1963; Lefering and Neugebauer, 1995). Therefore, both the duration and dosage
of steroid supplement are crucial for recovery.
Another popular target in treating sepsis is the pro-inflammatory mediators,
including TNF-α and IL-1. Pre-clinical studies have shown that TNF-α blockade is effective in
animal models of septic shock established by LPS or E. coli infusion (Tracey et al., 1986;

17
Tracey at al., 1987). Similarly, the recombinant IL-1 receptor antagonist gives rise to
reduced mortality in experimental sepsis (Ohisson et al., 1990). Unfortunately, neither
approach was able to translate such experimental efficacy into a successful clinical trial
outcome as a result of genetic differences between mice and humans as well as the
heterogeneity of human septic patients (Reinhart and Karzai, 2001; Fisher et al., 1994).
Nevertheless, effective inhibition or antagonism of other factors involved in inflammation
has been found.
Radicals, namely, NO and ROS, contain bactericidal functions. However, large-scale
production of these molecules is also capable of causing cell and tissue damage during
inflammation. Hence, various antioxidants have been explored to restore the redox
balance within the system (Riedemann and Ward, 2003). NO scavengers, including
pyridoxylated haemoglobin polyoxyethylene (PHP) and methylene blue, have provided
promising results in restoring blood pressure and increasing myocardial functions (Privalle
et al., 2000). N-acetylcysteine (NAC) is a ROS scavenger whose production is dependent on
selenium. In clinical trials, NAC has shown to provide physiological benefits albeit no
obvious improvement in survival (Spies et al., 1994). Selenium replacement therapy, on the
other hand, was promising as preliminary clinical studies have demonstrated its ability to
ameliorate renal disorders in septic patients, resulting in improved overall outcomes
(Angstwurm et al., 1999).
Because inflammation and coagulation are known to walk hand in hand in sepsis, an
anti-coagulant strategy has also proven to be beneficial for treating sepsis. The

18
recombinant human APC product, drotrecogin alfa, has been shown to be effective in
reducing plasma IL-6 and D-dimer levels (Bernard et al., 2001). In fact, drotrecogin alfa was
approved for clinical use for severe sepsis in the U.S. in 2001 (Riedemann et al., 2003). In
contrast, several other anti-coagulants, including AT-III and recombinant TFPI, were not
approved for clinical use as a result of issues concerning their efficacy and safety in spite of
their pre-clinical success (Abraham et al., 2003; Warren et al., 2001).
In addition to these established therapeutic modalities, other strategies have been
continuously sought after, including antagonists of high-mobility group B1 protein
(HMGB1), which is a multifunctional DNA-binding protein that influences nucleosomal
structure, gene expression and cell adhesion (Lotze and Tracey, 2005; Wang et al., 2001).
High plasma concentrations of this late inflammatory mediator have been correlated with
poor outcomes in experimental sepsis (Wang et al. 2001). To date, anti-HMGB1 products,
such as ethyl pyruvate, have shown to provide ameliorative effects in preliminary animal
studies (Ulloa et al. 2002; Yang et al. 2004).
In summary, sepsis is a failure of homeostasis due to unregulated or exaggerated
inflammation and coagulatory cascade activation with adverse physiologic consequences
beginning at the capillary endothelial level. Multiple treatment modalities are likely to be
required for clearing the primary infection and correcting alterations in the disturbed
immunological and hemodynamic state so as to restrain the exaggerated host response.
19
1.2 Overview of Induced Hypothermia
1.2.1 Hypothermia-associated Physiological Responses
Hypothermia is characterized by a decrease in the core body temperature beyond
the normothermic range (36.8 ±0.7 :C) that is required for normal physiological and
metabolic functions. Based on general functional characteristics, hypothermia can be
classified into mild (32.2 - 35°C), moderate (28 – 32.2°C), and severe (<28°C) in humans.
(McCullough and Arora, 2004). While vigorous shivering is a hallmark of mild hypothermia,
the onset of decreased ventilation and cardiac dysrhythmias has been associated with
moderate hypothermia. During severe hypothermia, the body is reported to be in a
comatose state (McCullough and Arora, 2004; Pozos and Danzl, 2002).
In humans, the core temperature is controlled in accordance with changes in the
peripheral or skin temperature. Cold stimuli sensed by the peripheral cold receptors are
translated into electrical signals, which are then transmitted to the brain via the spinal
cords, potentiating the CNS to mediate thermoregulatory responses (Pozos and Danzl,
2002). Within the brain, the hypothalamus serves as a central thermostat. It contains
thermosensitive neurons that are responsive not only to the cold stimuli, but also certain
chemical changes, including low glucose level. Hence, other sensations experienced by the
body may also be interpreted by the brain as cold stress (Iggo, 1969). Regardless of the
original cause, the efferent responses associated with hypothermia lead to
vasoconstriction, and that affects all major physiological systems.

20
First and foremost, the brain senses the temperature change. Behavioural
responses, such as shivering and putting on more clothes, are commonly observed during
mild hypothermia. In addition, negative impact of higher functions, including reduced
hearing, impaired verbal ability and decrease in manual dexterity, have all been
documented in hypothermic victims. As temperature continues to fall, hallucination and
loss of consciousness are believed to occur when the core temperature drops to the
moderately hypothermic range (Pozos and Danzl, 2002). Meanwhile, cerebral blood flow
decreases at a rate of approximately 7% for every centigrade drop in temperature between
25°C and 35 °C (Rosomoff and Holaday, 1954).
In the cardiovascular system, vasoconstriction is believed to cause an increase in
the afterload on the heart, resulting in an initial increase in heart rate (tachycardia) and
therefore more oxygen consumption. With progressive decrease in temperature, however,
myocardial depression occurs, leading to reduced cardiac output. Individuals with a core
temperature near 28 °C have shown to have a decrease in heart rate by 50%. This
reduction in heart rate coincides with ventricular fibrillation and other myocardial
disorders (Pozos and Danzl, 2002).
Similar to the heart, the initial respiratory response to cold stress is tachypnea,
followed by a progressive decrease in the ventilation rate in accordance with the
decreasing metabolism. Simultaneously, the blood is cooled by inhalation of cold air or
water, creating a positive feedback loop in pulmonary activity. In cases of deep
hypothermia, impaired brain stem functions also compromise respiration, leading to
21
retention of carbon dioxide in the system, producing respiratory acidosis (Pozos and Danzl,
2002).
Cold-induced diuresis is another common regulatory response in which peripheral
vasoconstriction induces central hypervolemia. In consequence, the kidneys produce urine
in order to decrease the blood volume. However, when there is a further drop in
temperature, a fall in systemic blood pressure occurs. As the renal flow decreases, renal
vascular resistance increases, thereby minimizing renal flow and glomerular filtration. This
results in depressed renal function (Pozos and Danzl, 2002).
Similar to the renal system, hypothermia causes a decrease in the blood flow to the
gastrointestinal (GI) system, along with a decrease in GI smooth muscle motility, resulting
in gastric dilatation. In addition, pancreatic and gastric lesions are common in victims of
hypothermia, possibly due to the collapse of the organ microvasculature (Mant, 1969).
Moreover, liver dysfunction is reflected by reduced drug and metabolite metabolism in the
hypothermic victims (Pozos and Danzl, 2002).
In the endocrine system, hypothermia promotes catecholamines secretion
(Therminarias and Pellerei, 1987). Catecholamines are a group of `fight or flight` hormones
that prepare the body to handle stressful conditions. Some of their effects include
increasing the heart rate, increasing the blood glucose level and thermogenesis (Pozos and
Danzl, 2002). In addition, elevated plasma corticosteroid concentration has been reported
in hypothermic victims (Maclean and Browning, 1974). However, because corticosteroids
are considered as anti-inflammatory mediators, the augmented secretion of which may
22
have a direct impact on the immune system. Indeed, cold-induced immunosuppression is
commonly observed. It is believed that histamine release from mast cells and neutrophil
migration are impaired during hypothermia (Rodbard et al., 1980, Biggar et al., 1983). As
these two types of immune cells play a central role in inflammation induction (section
1.1.3), reduced activity of such leads to immunosuppression.
In summary, the brain is the master control of thermoregulation. Upon receiving a
cold stimulus, it sends signals to the rest of the body to co-ordinate a series of physiological
responses to conserve heat. In cases of severe hypothermia, however, these physiological
systems become dysregulated, compromising the activity of vital organs.
1.2.2 Therapeutic Hypothermia
Throughout history, hypothermia has also been employed as a therapeutic tool in
medicine (Bernard et al., 2003). Based on the rationale that hypothermia reduces the
body’s metabolism, the potential benefits of induced hypothermia have been assessed in
patients with medical conditions like comatose cardiac arrest, traumatic brain injury (TBI),
and sepsis (Bernard et al., 2003).
As the brain is known to respond poorly to hypoxic events, such as cardiac arrest,
and that the damage incurred during brain hypoxia is oftentimes irreversible, several large
clinical trials considering induction of hypothermia in comatose patients following pre-
hospital cardiac arrest have been undertaken (Bernard et al., 2003). These studies have all
pointed to the conclusion that in comparison to the normothermia control group, long-
term (12 -24 hours) induction of mild hypothermia is effective in improving neurological

23
outcome and survival (Bernard et al., 1997; Bernard et al., 2002; Nagao et al., 2000;
Yanagawa et al., 1998; Zeiner et al., 2000). Therefore, having therapeutic hypothermia as
part of the standard rescue procedure for the comatose cardiac arrest patients has been
recommended by the American Heart Association and adopted by a number of hospitals in
the U.S. (Nolan et al., 2003).
In addition to its success in treating cardiac arrest patients, induced hypothermia
has demonstrated its therapeutic value in treating individuals with TBI. In a systematic
review published in 2003, the therapeutic modality of hypothermia and subsequent
rewarming was illustrated. It showed that induction of mild-moderate hypothermia (32 -
33°C) for ≥24 hours, followed by rapid rewarming (≤24 hours), is effective in ameliorating
neurologic injury (McIntyre et al., 2003).
Half a century ago, Blair et al. also published an article discussing the use of mild
hypothermia in septic shock patients. In this clinical trial, 50% of the patients, who were
deemed moribund prior to the treatment, survived, implying that induction of hypothermia
to reach a core body temperature of 32:C was able to rescue these critically ill patients
(Blair et al., 1961). Unfortunately, the impact of cooling on sepsis progression was not
studied further at the time (Bernard et al., 2003). However, starting from the 1990s,
multiple research teams have employed animal models to investigate the net effect of
induced hypothermia in experimental sepsis - discussed in section 1.3 (Fujimoto et al.,
2008; Huet et al., 2007; L’Her et al., 2007; Lindenblatt et al., 2006; Stewart et al., 2010;
Taniguchi et al., 2003).

24
1.3 The Model Systems
1.3.1 Overview of Sepsis Models
A number of sepsis models have been developed in the past few decades in order
to further our understanding of the complex pathophysiology of this disease. In general,
three types of models have been used: 1) infusion of bacterial endotoxin (eg. LPS), 2)
administration of live bacteria into the animal, and 3) disruption of host barriers (eg. CLP)
(Buras et al., 2005; Deitch, 1998; Wichterman et al., 1980).
LPS, as described previously, is a potent immunogen that activates receptor-
mediated intracellular signalling, resulting in NF-κB activation (Tripathi and Aggarwal,
2006). Hence, infusion of LPS into the animal is effective in provoking an inflammatory
response. In addition, the ability to quantify and standardize the LPS injection dosage gives
rise to its high reproducibility, thereby making the endotoxemia model a popular choice
(Fink and Heard, 1990). However, the major disadvantage of this model is invariably
associated with the isolated use of LPS (Bura et al., 2005). In this rodent model system, a
hypodynamic cardiovascular state is often developed immediately following a large dose of
LPS infusion and that the hemodynamic changes observed in human sepsis are not
reproduced (Deitch, 1998). In addition, a bolus injection of LPS gives rise to a rapid and
transient increase in plasma cytokine levels, which is different from the prolonged
elevation of cytokines observed in human sepsis (Buras et al., 2005). Moreover, rodents are
much more resistant to septic shock induced by LPS than humans (Fink and Heard, 1990).
In conclusion, in spite of its relative ease to construct, the LPS infusion model does not

25
mimic the complex immunological or physiological responses observed in human sepsis,
and therefore has its limited clinical applicability.
Inoculation of pure or mixed cultures of bacteria into animals represents another
popular tool for studying mechanisms of host-pathogen interactions, even though it does
not always reflect human sepsis (Buras et al. 2005). The choice of animal species, which
may differ significantly in their vascular physiology and susceptibility to bacterial
pathogens, in addition to the choice of the infectious agent, are crucial determinants of the
outcome of the infection model. In some bacterial infusion models, symptoms similar to
those resulting from the LPS challenge occur and the cytokine response associated with it is
not reflective of true sepsis in animals or humans that is developed from a single focus of
infection (Cross et al., 1993). Moreover, the route of infection is pivotal in this model. I.P.,
I.V. and intrapulmonary compartments represent the most common sites for exogenous
bacteria inoculation (Buras et al., 2005). However, a site-specific approach primarily
produces a local inflammatory response (eg. peritonitis) while a blood inoculation gives rise
to a more rapid systemic effect, followed by seeding of organs (Buras et al., 2005; Cross et
al., 1993). In one E. coli infusion model, I.V. infusion of live bacteria produced a high and
transient TNF-α peak that was 50 to 100 fold more than the amount detected in the serum
of non-surviving mice with the I.P. injection (Zanetti et al., 1992). Therefore, a number of
confounding factors are associated with this model, including the inoculum dosage,
bacterial strain specificity, animal strain specificity and route of infection, which can all

26
affect the immune response the host evokes (Buras et al. 2005). As such, there is significant
variability in the results seen among these models of sepsis.
The third type of sepsis model is characterized by breaching the host’s protective
barrier in order to allow translocation of colonizing bacteria into the sterile compartments.
The cecal ligation and perforation (CLP) model, which has been developed over 30 years
ago, is a preeminent example of this category (Wichterman et al., 1980). This model
features dual manipulations to the animal’s cecum, namely, ligation of a part of the cecum
below the ileocecal valve after midline laparotomy and needle puncture through the
devitalized part of the cecum (Rittirsch et al., 2009; Wichterman et al., 1980). Since the
cecum is a reservoir of heterogeneous microorganisms, perforation of the cecum creates a
source of bacterial contamination in the peritoneal cavity, which is followed by
translocation of bacteria into the bloodstream, resulting in bacteremia-mediated systemic
activation of the immune system (Rittirsch et al., 2009). The CLP model is known for
exhibiting SIRS and CARS in a biphasic fashion and producing hemodynamic and
physiological alterations in rodents with great resemblance to the clinical symptoms
manifested in septic patients (Wichterman et al., 1980). The rapid surge in plasma TNF-α
concentration following CLP and the sustained high plasma levels of IL-6 in mice with lethal
peritonitis have been considered hallmarks of this model (Rittirsch et al., 2007). In fact, the
predictive power of plasma IL-6 concentration after CLP has been considered as a possible
prognostic marker in BALB/c mice, which is reminiscent of that in human sepsis (Remick et
al., 2002). Moreover, apoptosis of immune cells in the CLP model appears to mimic that in
27
human septic patients. Hence, the CLP model has been considered a gold standard in sepsis
research (Buras et al., 2005; Rittirsch et al., 2009).
Therefore, the CLP model was chosen for the purpose of this study.
1.3.2 Critical Determinants of CLP
The procedure of CLP involves laparotomy, exteriorization of the cecum, cecal
ligation and perforation, expression of cecal content and finally, closure of the wound. The
severity of sepsis induced by this method is assessed through the mortality rate of the
untreated animals that have undergone CLP. It is dependent on four main factors: 1) the
length of the cecum ligated, 2) the size of the needle used in creating such perforation (18G
– 27G), 3) the number of punctures, and 4) the amount of cecal content exuded into the
peritoneal cavity (Wichterman et al., 1980; Rittirsch et al., 2009). By adjusting these
variables, mortality associated with CLP can take place at as early as several hours after the
surgery or days before the animal starts to show sepsis-like symptoms.
It has been shown that the location of cecal ligature strongly influences survival and
that TNF-α and IL-6 levels increase markedly with increasing length of the cecum ligated
(Singleton et al., 2003). In addition, the number and size of needle punctures through the
devitalized cecum also strongly influence survival and the inflammatory response (Ebong et
al., 1999; Song, 2004). Therefore, this sepsis model can be adapted to generate a wide
range of disease severity, allowing for investigation into both acute and chronic forms of
sepsis.
28
Despite the relative ease to induce sepsis by way of CLP and the possibility of
tailoring disease severity by manipulating the factors stated above, variability within the
established CLP model may still be a confounding factor. Since the host response to CLP
entails an initial attempt to contain the infection, a certain percentage of animals may
successfully wall off the infected and inflamed area through creating an intra-abdominal
abscess. Under this circumstance, the animal does not progress into septic shock and may
recover fully (Buras et al., 2005). In addition, the amount of enteric bacteria exuded into
the intraperitoneal space following perforation cannot be controlled, highlighting a
possible difference in the magnitude of intraperitoneal contamination.
In summary, the CLP model represents one of the most clinically relevant animal
models of sepsis. Due to the various determinants discussed above, it is imperative to
perform each surgery with high consistency using standardized parameters.
29
1.4 Induced Hypothermia in Experimental Sepsis
1.4.1 Endotoxemia Models
As mentioned, the endoxemia model characterized by I.V. or I.P. LPS infusion has
been a popular tool for studying the effect of induced hypothermia in experimental sepsis
in spite of its limited clinical applicability.
Previous studies by Taniguchi et al. (2003) showed that an I.V. injection of E.coli-
derived LPS at the concentration of 15mg/kg of body weight into male Wistar rats led to a
60 – 80% mortality at 6 hours after the injection (T6) (Taniguchi et al., 2003). Unlike the
endotoxemic controls, the mortality rates at T6 were 16% and 8% for the mild hypothermia
(34-35:C) and moderate hypothermia (30-31:C) groups, respectively, indicating a
significance increase in animal survival provided by immediate external cooling following
LPS infusion. This survival advantage was linked to the reduced plasma concentrations of
plasma TNF-α, IL-6 and NO (Taniguchi et al., 2003).
Such attenuated cytokine response was also noted in Wistar rats with caerulein-
induced pancreatitis and endotoxemia. In this model, animals were subject to I.P. injection
of 100mg/kg LPS at 1 hour after a series of caerulein injections. Induction of moderate
hypothermia (32:C) was mediated by direct surface cooling using ice-packs, which took
place either immediately or 1 hour after LPS injection. Similar to Taniguchi’s results,
moderate hypothermia, regardless of time of induction, attenuated plasma IL-6
concentration. Induction of hypothermia immediately following LPS infusion also gave rise
to enhanced IL-10 production (Fujimoto et al., 2008).
30
In another rat model of endotoxemia by Huet et al., induction of moderate
hypothermia for a prolonged period of time also enhanced IL-10 production, albeit no
change in plasma TNF-α level (Huet et al., 2007).
However, in a mouse model of endotoxemia employing juvenile male C57BL/6 mice
with an I.P. injection of LPS at 1µg/g, chlorpromazine-mediated cooling immediately
following LPS infusion gave rise to significantly higher levels of plasma IL-6 and IL-10, as
well as an increase in liver TNF-α and IL-6 concentrations, relative to the normothermic
controls. The same patterns of cytokine expression were also observed in endotoxemic
mice cooled in the cold chamber (Stewart et al., 2010).
In summary, results from these four studies described above strongly suggested the
immunomodulatory effects of induced hypothermia, as reflected by changes in the plasma
cytokine concentrations. In the mean time, a study by Lindenblatt et al. (2006) also
highlighted the potential danger of hypothermia-associated coagulopathy.
In this study, male C57BL/6J mice were administered 10 mg/kg LPS intraperitoneally
24 hours before induction of mild (31 :C) or moderate hypothermia (34 :C). Another batch
of endotoxemic animals maintained at 37:C served as the normothermic controls. LPS-
induced endotoxemia, in the presence/absence of induced hypothermia, was associated
with increased endothelial activation and upregulation of a number of intercellular
adhesion molecules and pro-coagulant factors, including p-selectin and PAI-1. Relative to
the normothermic animals, the 34:C group also exhibited a small acceleration of
31
microvascular thrombus formation and the 31:C group demonstrated an even more
pronounced arteriolar occlusion. In addition, both hypothermic groups demonstrated a 2-4
fold increase in soluble PAI-1, which might explain the accelerated thrombus formation
described above (Lindenblatt et al., 2006).
Therefore, increased expression of adhesion molecules in the vascular endothelium
as a result of LPS infusion, along with a more rapid thrombus formation caused by induced
hypothermia, is capable of producing a pro-coagulant effect, contributing to the septic
animals’ morbidity and mortality.
1.4.2 The CLP Model
Despite its greater degree of similarities to human sepsis, the CLP model has been
employed more rarely in assessing the effect of induced hypothermia than the
endotoxemia model. In one study by L’Her et al., induced hypothermia was evaluated from
an energy-related perspective. Male Sprague-Dawley rats undergone CLP were randomized
into 3 temperature groups, namely 32:C, 37 :C, and 42 :C. Among them, the hypothermia
group had the longest survival duration. Nevertheless, the lactate to pyruvate ratio was
increased in both the hypothermic and hyperthermic mice relative to the normothermic
septic control. While the hyperthermia group exhibited a boost in plasma lactate
concentration, the hypothermia group had a larger decrease in pyruvate concentration,
which could mean that hypothermia caused an increase in oxidative demand secondary to
sepsis, resulting in more rapid pyruvate depletion (L’Her et al., 2007).

32
1.5 Hypothesis and Objectives
Hypothermia is effective in modulating the host immune response to infection.
Induction of hypothermia will improve survival and reduce the inflammatory response
associated with CLP-induced sepsis.
The purpose of this study was to:
1) Optimize the cooling approach for our CLP mouse model
2) Assess the impact of hypothermia on the survival of CLP mice
3) Assess the impact of hypothermia on the inflammatory response associated with sepsis
by examining plasma pro- and anti-inflammatory cytokine concentrations and organ
pathology
4) Assess the impact of hypothermia in combination with other treatment strategies (ie.
antibiotic treatment and fluid resuscitation)
33
2 Materials and Methods
2.1 Experimental Animals
Mature male BALB/c mice, imported from Charles River Laboratories (Montreal,
QC), were housed in the animal care facility at the University of Ottawa (UO) for ≥4 days
prior to experimental surgery. Mice with body weight between 23-28g were used. A
maximum of four mice was allowed in each cage, in which food and water were provided
ad libititum. Alternating light and dark cycles were maintained. All experimental
procedures were reviewed and approved by the Animal Care Committee (ACC) at UO and
were in accordance with the standards outlined by the Canadian Council on Animal Care
(CCAC). Two to four cages of mice were used in each experiment. Mice within each cage
were numbered randomly; the cages were numbered randomly prior to the experiment.
Mice from the same cage underwent the same experimental procedure/treatment; they
were distinguished by ear notches.
2.2 Cecal Ligation and Perforation
2.2.1 Pre-surgery
Prior to the surgery, the animals’ baseline weight and core temperature were
recorded. Core temperature was measured using a rectal probe. In addition, 1mL of 0.9%
saline and 30µL of buprenorphine, an analgesic agent provided by the Animal Care Facility
(ACF), were administered subcutaneously (S.C.) approximately half an hour before surgery.
Following the injections, the mouse was anaesthetized with isoflurane, an
inhalational anaesthetic. Meanwhile, BNP (Bacitracin Ophthalmic ointment, Neomycin,

34
Polymyxin B sulphates ointment) was applied to its eyes for protection from possible air
flow- induced damage. The lower half of its abdomen was shaven and then sterilized with
two preparation solutions: 1) Endure 4000 (Chlorhexidine Gluconate 4% solution), and 2)
an antiseptic solution of 2% v/v chlorhexidine gluconate and 70% v/v isopropyl alcohol,
before the mouse was transferred to the operating table.
2.2.2 The CLP Procedure
This CLP model was adapted in the Garber Laboratory by Yang Song (Song, 2007). It
entailed:
1) Laparotomy, in which a 1cm midline incision was made through the abdominal wall,
followed by opening of the peritoneum
2) Exteriorization of the cecum
3) Cecal ligation was performed 1cm from the distal end of the cecum; the position
was identified using a measuring strip
4) A through-and-through puncture (by a 18G needle) in the tied-off portion
5) Extrusion of a small amount of cecal content to ensure flow of content
6) Injection of 1ml sterile water into the peritoneal cavity to spread the infection
7) Wound closure (suture)
8) Removal of inhalational anesthetics
9) Injection of 1ml warm saline S.C. to establish the hyperdynamic phase of sepsis
Sepsis was defined by persistent hypothermia, diarrhea, piloerection, tachypnea,

35
and reduced reaction to touch. In this in vivo sepsis model, two negative control groups
were also included, namely, the sham mice that had laparotomy only (steps 1-2 and 7-9)
and mice that underwent cecal ligation but no perforation (steps 1-3, 7-9).
2.2.3 Post-operative Monitoring
All mice that had undergone CLP were returned to their original cages in the 28:C
incubator and monitored continuously up to 72 hours post-CLP. All negative control groups
were monitored for a day after the surgery. Each mouse’s body weight, core temperature,
and physiological symptoms, including the presence/absence of piloerection, diarrhea,
dehydration and respiratory distress, were recorded every three hours post-surgery. 30µL
of buprenorphine corresponding to a dosage of 0.05mg/kg was administered S.C. every six
hours to alleviate any discomfort resulting from the surgery.
2.3 Treatment Strategies
2.3.1 Induction of Hypothermia and Rewarming
After having explored the options available in the ACF for inducing hypothermia in
mice, the cold chamber was considered the most practical approach for this project. In
accordance with the guidelines from ACC and personal feedback from the veterinarian, the
chamber was set at 12:C to provide external cooling.
Mice were carried in cages from the 28:C incubator to a 12:C cold chamber for
active cooling at a designated time point post-CLP. The duration of cooling was either one
to six hours or to achieve a core body temperature of 21 - 22:C or 27 - 28:C. Upon
reaching the target temperature, each mouse was transferred to the monitoring room and

36
incubated at room temperature (21:C) to sustain hypothermia. However, if the mouse’s
rectal temperature had increased by ≥2°C during incubation at room temperature, it was
transferred back into the cold room for further cooling so as to maintain the target
temperature. In summary, mice were shuttled back and forth between the cold chamber
and the monitoring room so as to maintain hypothermia for a desired period of time. Upon
completion of cooling, mice were returned to the 28:C or 35:C incubator for rewarming.
2.3.2 Hypothermia Combined with Antibiotic & Fluid Resuscitation
In evaluating the combined effect of hypothermia and standard management with
antibiotic and fluid resuscitation, cefotaxime, which is a broad-spectrum antibiotic that
belongs to the cephalosporin family, was administered I.P. every six hours. According to
the dosage calculation done previously by Yang Song of the Garber Lab and Dr. Mark
Lippemann of ACC (Song, 2007), 1g of sterile cefotaxime sodium in powder form (from the
Ottawa Hospital pharmacy) was diluted in 30mL of sterile water and thus, 1.7mg was
administered to the animals every six hours starting at either T0 or T6.
Fluid resuscitation with 1mL of 0.9% saline was given S.C. at T0 and then every six
hours afterwards until time of euthanasia. In experiments aiming at evaluating the
therapeutic function of dextrose infusion, 10% dextrose in saline, which was constituted by
10mL of 50% dextrose fluid with 40mL of 0.9% saline, was administered instead of 0.9%
saline starting at T6.
37
2.4 Endpoint of Experiment
In accordance with the UO’s Animal Care Policy, death was not accepted as the
experimental endpoint. The original surrogate death measure for our sepsis model was
defined by ≥1 hour of moderate hypothermia (≤ 32:C) with concomitant signs of severe
distress, including immobility or grogginess (unable to walk in a straight line), drowsiness
(unresponsive to human touch), severe respiratory distress and dehydration. However,
given that induction of hypothermia involved lowering the animal’s temperature beyond
that defined for the potential mortality endpoint, this temperature standard, therefore,
was not applicable to this project.
In consequence, a new mortality endpoint was established. Euthanization was
authorized when the septic animal demonstrated symptoms of severe distress (as defined
in the original surrogate death measure) and inability to revert itself to a straight standing
position when it was placed on its side or when the animal’s core temperature failed to
rebound to ≥30:C during rewarming in the 28°C incubator.
All mice were sacrificed by cardiac puncture (See Section 2.5.2) or cervical
dislocation following anesthesia.
2.5 Blood Collection
2.5.1 Saphenous Vein Bleed
Saphenous vein bleed was done on a group of CLP mice to measure bacterial
dissemination into the bloodstream. A maximum of 0.3mL of blood was taken from each
animal tested. A hollow plastic tube of 10cm in length, 3cm in diameter and sealed at one

38
end was used to restrain mice. Each mouse was shuffled into this tube with hind legs and
tail exposed to the outside. A finger was placed under the animal’s abdomen to restrain its
body movement. Its right leg was also restrained and shaved, followed by application of
Vaseline to the shaven area to make its vein (which appeared as a dark line beneath the
skin) more visible. A 20G needle was used to access the vein. In case of failed first attempt,
the area was jabbed again. A heparinized tube was used to collect blood. Following
saphenous bleed, the injured area was covered with a piece of cotton gauze to stop
bleeding before the mouse was returned to its cage. Dilutions of the blood samples were
made with sterilized LB broth (section 2.8.2).
2.5.2 Cardiac Puncture
At the time of sacrifice, the animal was anaesthetized with isoflurane. Anaesthesia
was confirmed by foot pinching. An 18G or 20G needle attached to a 1mL syringe was used
to pierce under the diaphragm, and into the chest so as to draw blood from the heart. 0.6 –
1ml of blood was collected from each animal.
In timed sacrifice experiments to delineate cytokine expression patterns, mice in
groups of seven or eight were sacrificed at various time points post-CLP or upon achieving
the desired core temperature range.
Blood samples were collected in microtubes and incubated at 4:C overnight. Plasma
extraction was done on the following morning by centrifuging the microtubes at 2000g for
20 minutes in a THERMOscientific Sorvall centrifuge. The top fractionate was removed with

39
a pipette tip immediately following centrifugation. The plasma was then divided into 50µL
aliquots and stored at -80:C for cytokine ELISA testing.
2.6 Enzyme Linked Immunosorbent Assays (ELISA)
Commercial ELISA kits (Quantikine Immunoassays, R&D Systems, Minneapolis, MN)
were used for plasma TNF-α, IL-1β, IL-6 and IL-10 quantification. The first three cytokines
represent the inflammatory triad while IL-10 is a prototypical anti-inflammatory cytokine.
These four cytokines were chosen so as to provide an insight into the inflammatory status
of the infected host. Each plasma sample was tested in duplicates. ELISA testing was done
in accordance with the procedure described in the kit manual.
The kit control (buffered base protein in powder form) was dissolved in 1.0mL
distilled water. The kit standard stock was prepared by dissolving the stock powder in a
certain volume of calibrator diluents as stated in the manual. A two-fold serial dilution of
the kit standard was made (ie. from the undiluted stock to 1:32 dilution). Each plasma
sample was diluted with the calibrator diluent, resulting in a total volume of up to 200 µL.
For TNF-α, a 1:8 dilution was used; for IL-1β, it was 1:10; for IL-6, it 1:400; and for IL-10, it
was 1:10. The resulting solution was mixed thoroughly using a vortex set at high speed.
50µL of the assay diluent was added to each well in the 96-well plate. Next, 50µL of each of
the kit standard dilutions, calibrator diluent, diluted plasma samples and the kit control
was added to the wells. Duplicates were plated. Following plating, the plate frame was
tapped gently for 1 minute to facilitate mixing and then covered with an adhesive plastic
strip prior to incubation at room temperature (RT) for 2 hours. At the end of the 2-hour
40
incubation period, the strip was removed and each well was washed with diluted wash
buffer 5 times (made by diluting the stock buffer provided in the kit with distilled water at a
ratio of 1:24) and then blotted against paper towel to dry. 100µL of the mouse cytokine
conjugate was then added to each well; the plate was covered again with a new plastic
strip for incubation at RT for another 2 hours.
At the end of the second 2-hour incubation period, the strip was removed and each
well was washed with diluted wash buffer 5 times and then blotted against paper towel to
dry. Meanwhile, equal volumes of colour agents A (hydrogen peroxide) and B (chromogen)
were added together to get a total volume of up to 12mL. The resulting substrate solution
was mixed by vortexing at high speed. 100µL of this substrate solution was then added to
each well, and then the plate was covered with aluminum foil and incubated for 30
minutes at RT. At the end of the 30-minute incubation period, 100µL of stop solution was
added to each well and mixed by gently tapping the plate.
The optical density of the 96-well plates was determined by a microplate reader
with the reading wavelength set at 450nm. A standard curve was constructed using the
Microsoft Excel program by plotting the absorbance value for each standard dilution on the
Y-axis against the concentration values on the X-axis. The line of best fit was determined,
and its equation was used for subsequent calculation to enumerate the protein
concentration in each sample, which was then multiplied by the dilution factor to obtain
the plasma concentration.

41
2.7 Organ Collection and H&E Staining
Tissue perfusion was done before organ extraction to facilitate formaldehyde-
mediated fixation. Prior to perfusion, 0.06mL of the anaesthetic cocktail containing 150mg
ketamine, 30mg xylazine and 5mg acepromazine was administered I.P. to anaesthetize the
mouse. Several foot pinches were done before starting the procedure. A midline incision
below the diaphragm was made through the abdominal walls, and this cut was extended all
the way to the neck by a pair of scissors. The skin was pulled aside to expose the chest
area. A horizontal cut was made beneath the diaphragm (granting access into the thoracic
cavity), from which two additional cuts were made to extend the incision diagonally,
reaching the armpit on each side. The rib cage, now exposed, was clamped to provide a
clear view of the heart.
Meanwhile, a syringe containing 20mL of hep-saline and another syringe containing
20mL of formalin were prepared. The Hep-saline syringe was connected to a needle, which
was inserted into the left atrium of the heart. The right atrium was nicked with a pair of
fine scissors. Following this, the hep-saline syringe was pumped at a rate of 20ml/10min to
draw blood out. Following perfusion, the empty syringe was detached from the needle, and
it was replaced by the formalin-containing syringe. Upon formalin administration at a rate
of 20ml/10min, body tremor occurred as a result of the chemical crosslinking tissues and
organs. At the end of formalin administration, individual organs (heart, liver, and spleen)
were collected and stored in separate containers filled with formalin for H&E staining.
42
Hematoxylin and eosin (H&E) staining was done by technicians in the Department
of Pathology at UO. Slides were examined at 40x, 100x and 200x magnifications under the
microscope (Nikon Eclipse 80i).
2.8 Other Tests
2.8.1 Approximation of Cecal Bacteria Density
A part of the cecum from a BALB/c mouse was excised and collected in a sterile
10mL test tube that was pre-weighed. The net weight of the excised cecum was calculated
and then suspended in 4.5mL of sterile LB broth (10g bacto-tryptone, 5g yeast extract, 10g
sodium chloride in 1L double-distilled water (ddH2O), pH 7.5). The mixture was then
vortexed at high speed for 5 minutes until the cecum turned white and all cell debris
settled to the bottom of the tube. The supernatant was removed from the test tube and
two serial 10-fold dilutions (to the 10-8 dilution) were made from it, in which 0.5mL of the
solution was mixed with 4.5mL of LB broth to create a higher dilution. 0.2mL from each
dilution was plated on a LB plate (containing 20-25mL of sterile LB broth with 15g/L agar,
solidified at room temperature), and was spread using a sterile plastic cell spreader
(commercial brand). These plates were then incubated up-side down in a 5% CO2 box set
at 37°C for 48 hours, together with two negative controls, namely, the empty LB plates and
LB plates with 0.2mL of LB broth added on. The plates were checked after 24 hours of
incubation and bacterial colonies were counted. Since acute sepsis is largely associated
with aerobic bacterial species, only aerobic bacteria were counted.

43
2.8.2 Quantification of Bacteria in the Blood of CLP Mice
Blood samples were taken from a group of septic mice at T6 by saphenous vein
bleed. A 10-fold serial dilution was made (to the 10-2 dilution) for each blood sample. One
LB plate and one blood agar plate (from the Ottawa Hospital) were used for each sample.
Each plate was divided equally into two halves; one half was used for the 10-1 dilution and
the other half was used for 10-2. 0.1mL of each dilution was plated and the sample drops
were allowed to run across the plate and air dried. They were then incubated up-side down
in a 5% CO2 box at 37°C for 24 hours, along with the negative control, 0.1mL of LB broth on
an empty plate.
2.9 Statistical Analysis
Fisher’s exact test was used for survivorship comparison between the CLP mice and
those with induced hypothermia in the presence or absence of cefotaxime and fluid
resuscitation initiated at various time points after CLP. Two tailed student’s t-test was used
for cytokine concentration comparison.
44
3 Results
3.1 Effect of Induced Hypothermia on the Control Mice
The effect of induced hypothermia was first assessed on sham mice. Our rationale
was that if induction of hypothermia by means of cold chamber-induced cooling
compromises the survival and/or welfare of immunocompetent mice, this approach would
likely aggravate illness in the septic mice.
In the first sham experiment, three out of six mice were randomized to the 12:C
chamber immediately following the surgery, that is, at T0. These mice were housed in the
cold chamber for 6 hours, during which their body weight and rectal temperature were
monitored every hour. After the cooling treatment, they were transferred to the 28:C
incubator. Their body weight and core temperature were recorded every three hours for
another day. The other three mice in this experiment were housed in the 28:C incubator
following the surgery for a total of 30 hours.
As shown in Figure 3, both the control and air-conditioned sham mice
demonstrated an initial increase in body weight as a result of the pre-operative fluid
injections; this was followed by a continuous decrease after the surgery. The control sham
mice housed at 28°C post-operatively were mildly hypothermic (about 35:C) at 1 hour after
the surgery (T1). On the other hand, the cold mice exhibited a larger decrease in rectal
temperature, with one mouse reaching the lowest of 27.7:C. However, a quick rebound
ensued starting at T1 and normothermia was re-established in all three mice before the
end of the six-hour cooling treatment. In the cold chamber, these mice also had a tendency
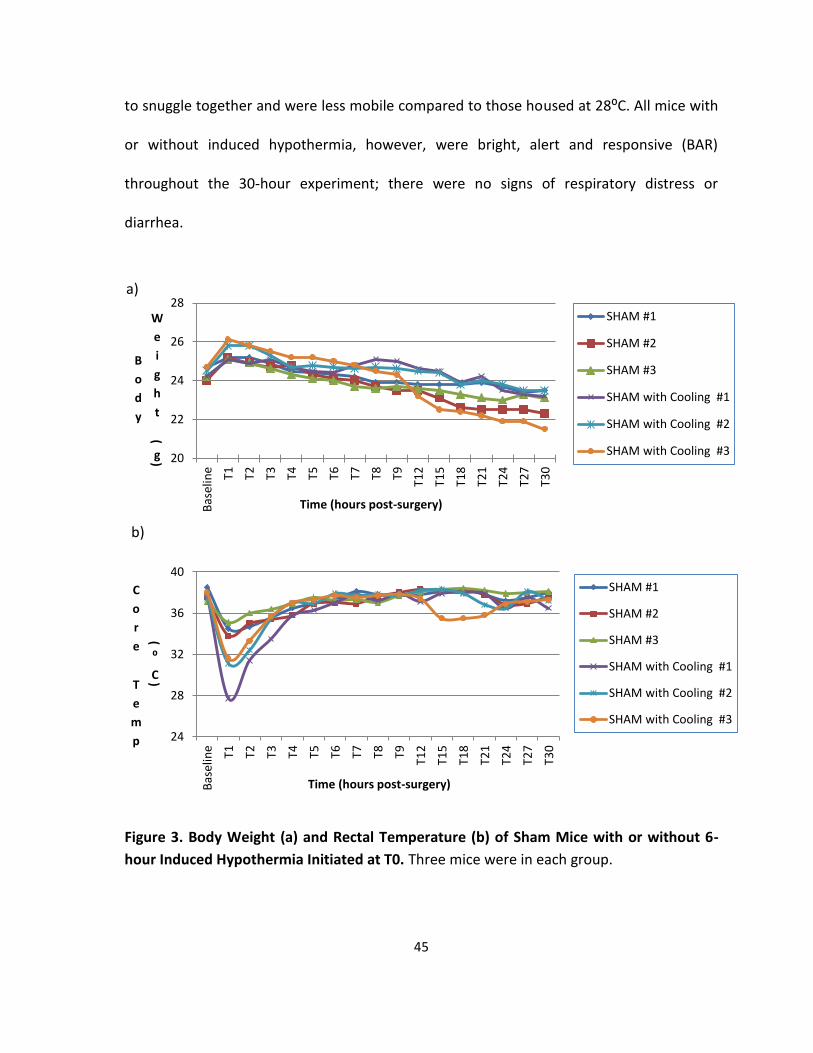
45
to snuggle together and were less mobile compared to those housed at 28:C. All mice with
or without induced hypothermia, however, were bright, alert and responsive (BAR)
throughout the 30-hour experiment; there were no signs of respiratory distress or
diarrhea.
Figure 3. Body Weight (a) and Rectal Temperature (b) of Sham Mice with or without 6-
hour Induced Hypothermia Initiated at T0. Three mice were in each group.
20
22
24
26
28
Bas
elin
e T1 T2 T3 T4 T5 T6 T7 T8 T9
T12
T15
T18
T21
T24
T27
T30
B
o
d
y
W
e
i
g
h
t
(
g)
Time (hours post-surgery)
SHAM #1
SHAM #2
SHAM #3
SHAM with Cooling #1
SHAM with Cooling #2
SHAM with Cooling #3
24
28
32
36
40
Bas
elin
e T1 T2 T3 T4 T5 T6 T7 T8 T9
T12
T15
T18
T21
T24
T27
T30
C
o
r
e
T
e
m
p
(⁰
C)
Time (hours post-surgery)
SHAM #1
SHAM #2
SHAM #3
SHAM with Cooling #1
SHAM with Cooling #2
SHAM with Cooling #3
a)
b)

46
Given that general cooling induced by this method had no apparent long-term
negative impact on the sham mice, the effect of such treatment on mice with cecal ligation
but no perforation (CL) was assessed. We reasoned that CL might not elicit a host response
immediately after the surgery; therefore, the 6-hour cooling treatment was initiated at T1
instead of T0. All mice were monitored for 30 hours after CL (Figure 4).
Figure 4. Body Weight (a) and Rectal Temperature (b) of Mice with Cecal Ligation Only
with or without 6-hour Induced Hypothermia Initiated at T1. Three mice were in each
group.
20
22
24
26
28
30
B
o
d
y
W
e
i
g
h
t
(
g)
Time (hours post-CL)
Cecal ligation #1
Cecal ligation #2
Cecal ligation #3
Cecal ligation with cooling #1
Cecal ligation with cooling #2
Cecal ligation with cooling #3
32
34
36
38
40C
o
r
e
T
e
m
p
(
⁰
C)
Time (hours post-CL)
Cecal ligation #1
Cecal ligation #2
Cecal ligation #3
Cecal ligation with cooling #1
Cecal ligation with cooling #2
Cecal ligation with cooling #3
b)
a)

47
Similar to the body weight changes observed in sham mice, CL mice with or without
induced hypothermia were heavier at the beginning of the experiment and their body
weight dropped gradually after the surgery. A spontaneous drop in temperature was also
observed at T1 for all CL mice. For those that were cooled, a second drop in temperature
occurred while they were in the cold chamber; however, normothermia was re-established
by T9. All six mice were BAR throughout the experiment.
To confirm the inoffensive nature of induced hypothermia to these two groups of
control mice, a third experiment consisting of eight mice randomized into four groups,
namely, sham, cold sham, CL and cold CL, was undertaken. All eight mice were BAR on the
next day after the surgery. Therefore, given that induction of hypothermia did not produce
a harmful effect on the control groups, we then proceeded to examine its effect on mice
with sepsis induced by CLP.
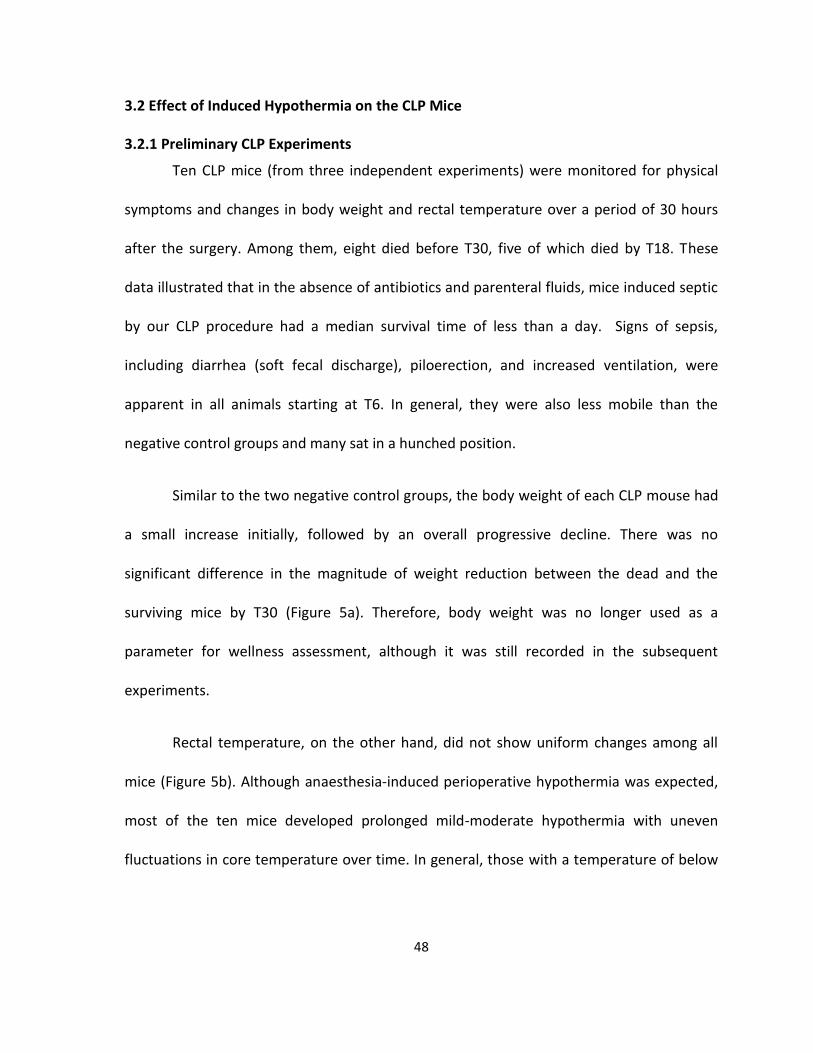
48
3.2 Effect of Induced Hypothermia on the CLP Mice
3.2.1 Preliminary CLP Experiments
Ten CLP mice (from three independent experiments) were monitored for physical
symptoms and changes in body weight and rectal temperature over a period of 30 hours
after the surgery. Among them, eight died before T30, five of which died by T18. These
data illustrated that in the absence of antibiotics and parenteral fluids, mice induced septic
by our CLP procedure had a median survival time of less than a day. Signs of sepsis,
including diarrhea (soft fecal discharge), piloerection, and increased ventilation, were
apparent in all animals starting at T6. In general, they were also less mobile than the
negative control groups and many sat in a hunched position.
Similar to the two negative control groups, the body weight of each CLP mouse had
a small increase initially, followed by an overall progressive decline. There was no
significant difference in the magnitude of weight reduction between the dead and the
surviving mice by T30 (Figure 5a). Therefore, body weight was no longer used as a
parameter for wellness assessment, although it was still recorded in the subsequent
experiments.
Rectal temperature, on the other hand, did not show uniform changes among all
mice (Figure 5b). Although anaesthesia-induced perioperative hypothermia was expected,
most of the ten mice developed prolonged mild-moderate hypothermia with uneven
fluctuations in core temperature over time. In general, those with a temperature of below
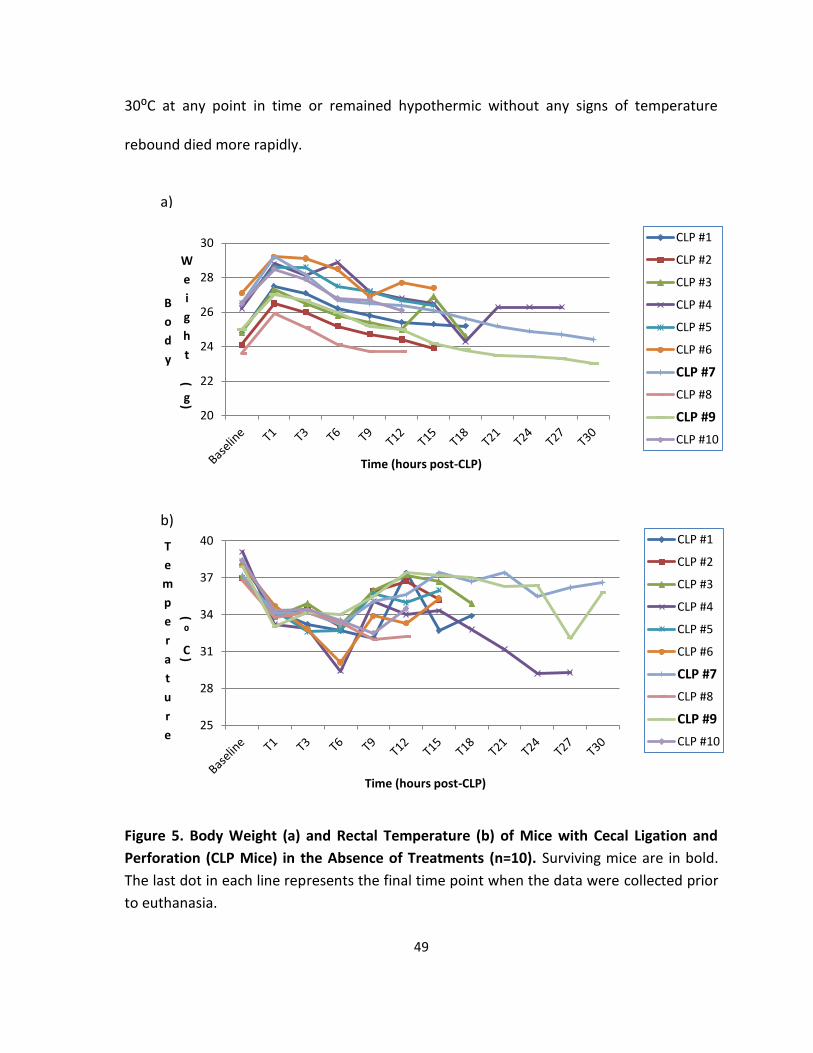
49
30:C at any point in time or remained hypothermic without any signs of temperature
rebound died more rapidly.
Figure 5. Body Weight (a) and Rectal Temperature (b) of Mice with Cecal Ligation and
Perforation (CLP Mice) in the Absence of Treatments (n=10). Surviving mice are in bold.
The last dot in each line represents the final time point when the data were collected prior
to euthanasia.
20
22
24
26
28
30
B
o
d
y
W
e
i
g
h
t
(
g)
Time (hours post-CLP)
CLP #1
CLP #2
CLP #3
CLP #4
CLP #5
CLP #6
CLP #7
CLP #8
CLP #9
CLP #10
25
28
31
34
37
40T
e
m
p
e
r
a
t
u
r
e
(⁰
C)
Time (hours post-CLP)
CLP #1
CLP #2
CLP #3
CLP #4
CLP #5
CLP #6
CLP #7
CLP #8
CLP #9
CLP #10
a)
b)
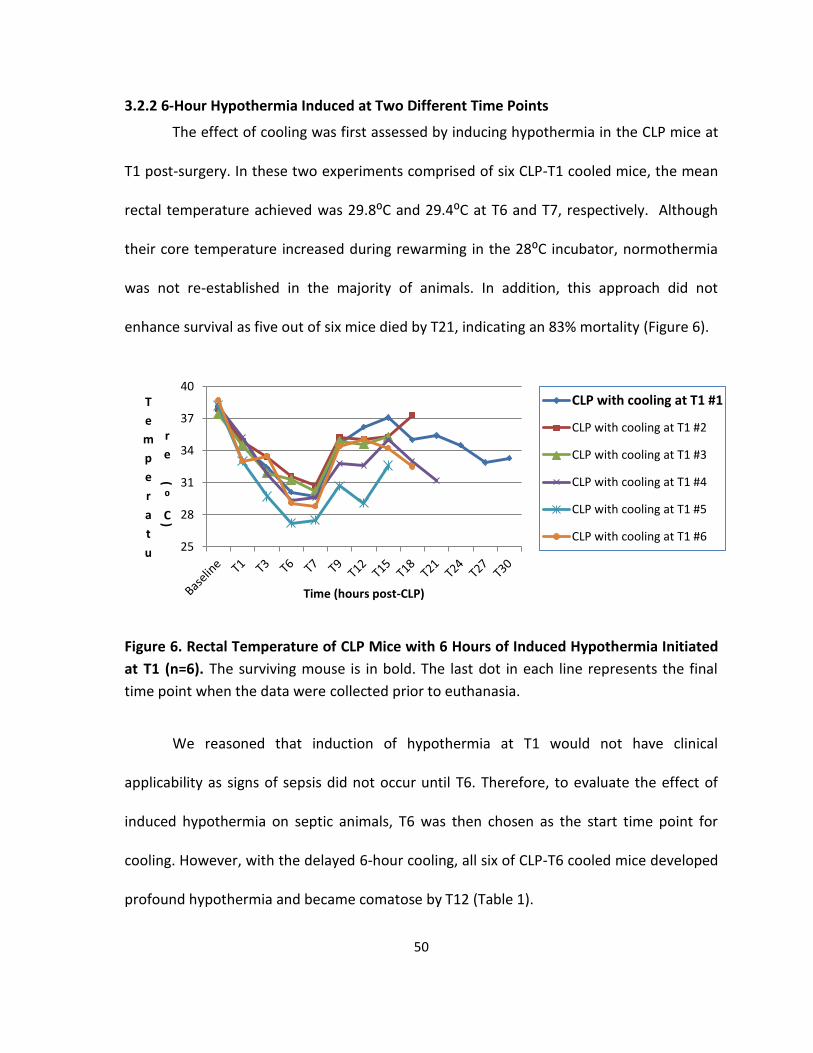
50
3.2.2 6-Hour Hypothermia Induced at Two Different Time Points
The effect of cooling was first assessed by inducing hypothermia in the CLP mice at
T1 post-surgery. In these two experiments comprised of six CLP-T1 cooled mice, the mean
rectal temperature achieved was 29.8:C and 29.4:C at T6 and T7, respectively. Although
their core temperature increased during rewarming in the 28:C incubator, normothermia
was not re-established in the majority of animals. In addition, this approach did not
enhance survival as five out of six mice died by T21, indicating an 83% mortality (Figure 6).
Figure 6. Rectal Temperature of CLP Mice with 6 Hours of Induced Hypothermia Initiated
at T1 (n=6). The surviving mouse is in bold. The last dot in each line represents the final
time point when the data were collected prior to euthanasia.
We reasoned that induction of hypothermia at T1 would not have clinical
applicability as signs of sepsis did not occur until T6. Therefore, to evaluate the effect of
induced hypothermia on septic animals, T6 was then chosen as the start time point for
cooling. However, with the delayed 6-hour cooling, all six of CLP-T6 cooled mice developed
profound hypothermia and became comatose by T12 (Table 1).
25
28
31
34
37
40T
e
m
p
e
r
a
t
u
r
e
(
⁰
C)
Time (hours post-CLP)
CLP with cooling at T1 #1
CLP with cooling at T1 #2
CLP with cooling at T1 #3
CLP with cooling at T1 #4
CLP with cooling at T1 #5
CLP with cooling at T1 #6

51
Table 1. Core Temperature of CLP Mice (n=6) with 6 Hours of Induced Hypothermia
Initiated at T6.
#1 #2 #3 #4 #5 #6 Mean Standard Deviation
Baseline 38.3 38.2 38.3 38.1 38.3 38.5 38.3 0.1
T1 32.6 31.9 32.6 33.7 32.9 31.1 32.5 0.9
T3 32.6 31.7 33.2 31.9 32.2 31.9 32.3 0.6
T6 31.7 29.7 31.3 31.8 31.0 29.2 30.8 1.1
T9 16.9 16.5 18.0 22.0 24.0 24.1 20.3 3.5
T12 12.2 12.1 13.6 12.9 11.7 12.9 12.6 0.7
3.2.3 Optimizing the Duration of Cooling
As 6-hour cooling initiated at T6 was not a practical approach, we then assessed the
effect of 2-hour and 4-hour cooling initiated at the same time point. Eight mice,
randomized into a 2-hour and a 4-hour group, participated in this experiment. Relative to
the 6-hour and the 2-hour groups, mice with 4 hours of cooling demonstrated a longer
survival time post-CLP (Figure 7). Thus, in subsequent experiments, 4 hours became the
standard cooling time for CLP-T6 cooled mice.
Figure 7. Proportionate Survival of CLP Mice with Different Durations of Cooling Initiated
at T6.
0
20
40
60
80
100
T1 T3 T6 T9 T12 T15 T18 T21 T24 T27 T30
%
S
u
r
v
i
v
a
l
Time (hours post-CLP)
2-hour (n=4)
4-hour (n=4)
6-hour (n=6)

52
We compared the proportionate survival of untreated CLP mice with those having
induced hypothermia, that is, one group with 6 hours of cooling initiated at T1 and another
group with 4 hours initiated at T6. Initiating cooling at T1 was to examine the effect of
induced hypothermia on CLP mice before the onset of sepsis. Among the three groups
examined, CLP-T6 cooled mice with 4 hours of cooling had the longest survival duration. At
T18 and T21, the CLP-T6 group demonstrated significantly better survival than the CLP
control mice. The p values were 0.036 and 0.025, respectively, at these two time points
(Figure8).
Figure 8. Proportionate Survival of CLP Mice with or without Induced Hypothermia.
Dashed line represents significant difference in survival between the CLP control and those
with 4-hour cooling initiated at T6 (p<0.05, Fisher`s exact test).
The average temperature of CLP-T6 cooled mice at the end of the 4-hour cooling
period was about 20:C (Table 2). Mice became dormant towards the end of cooling. In
particular, mice #4 and #5, which had a temperature of under 19:C, demonstrated
0
25
50
75
100
T1 T3 T6 T9 T12 T15 T18 T21 T24 T27 T30
%
S
u
r
v
i
v
a
l
Time (hours post-CLP)
Septic control (n=10)
With 6-hour cooling at T1(n=6)
With 4-hour cooling at T6(n=8)
53
impaired locomotive activity, as reflected by their inability to walk steadily in a straight line
when they were removed from the cold chamber. In order to minimize such side effect of
deep hypothermia in subsequent experiments, mice were cooled to a core temperature of
21 - 22:C.
Table 2. Temperature of Mice (n=8) with 4 Hours of Induced Hypothermia Initiated at T6.
#1 #2 #3 #4 #5 #6 #7 #8 Mean Standard Deviation
Baseline 36.6 38.3 36.6 38.2 37.5 38.0 38.5 38.5 37.8 0.8
T1 33.8 34.2 34.3 33.4 33.2 32.8 35.2 33.0 33.7 0.8
T3 34.2 34.5 34.2 33.9 34.3 34.7 34.0 33.9 34.2 0.3
T6 35.4 35.4 33.7 34.5 34.4 32.6 32.9 32.0 33.9 1.3
T10 22.3 20.0 20.5 18.0 17.9 19.9 19.2 23.4 20.2 1.9
3.2.4 ELISA
Since the CLP-T6 cooled mice demonstrated a survival advantage relative to the CLP
control group, we attempted to elucidate the reason behind this occurrence by examining
the effect of induced deep hypothermia on the inflammatory aspect of sepsis reflected in
the plasma concentrations of pro- and anti-inflammatory cytokines. Blood plasma was
extracted from the CLP animals euthanized at specific time points post-CLP (ie. starting at
T6 and every 3 hours until T15, which was the time when mortality started to occur) in
order to examine the patterns of cytokine expression during sepsis progression. Blood
plasma extracted from each deep hypothermic mouse was tested for TNF-α, IL-1β, IL-6 and
IL-10 concentration. In addition, because we wanted to examine whether changes
mediated by deep hypothermia were sustained, a group of deep hypothermic animals
were euthanized immediately after being rewarmed to 30:C for ELISA testing.

54
The CLP-T6 cooled mice reached the target temperature range (21 – 22:C) after
approximately three hours of incubation in the cold chamber (Figure 9). Eight of these
sixteen mice were randomized to undergo rewarming to 30:C, which took an average of 3h
and 20 minutes (Figure 9). By time-correlation, mice reached 21-22:C at roughly T9 and
rewarmed to 30:C at about T12.
Figure 9. Time Required for Induction of Deep Hypothermia in CLP Mice and Subsequent Rewarming to 30⁰C. Sixteen mice randomized into two groups, namely, cooled, and cooled-then-rewarmed, were used in these two independent experiments.
Compared to that in the CLP mice, the four cytokines tested, namely, TNF-α, IL-1β,
IL-6 and IL-10, were virtually undetectable in the sham group by our method. Therefore,
the sham data are not included in the following graphs.
In the CLP control mice, plasma TNF-α concentration remained at a consistently
high level (150 – 400 pg/ml) between T6 and T15 (Figure 10). Induction of deep
hypothermia, however, significantly decreased TNF-α production relative to those CLP
control mice sacrificed at T9 (p=0.021) and T15 (p=0.023). This decrease was sustained
even during rewarming, as reflected by the lower level of TNF-α in the 30:C mice (p=0.042
compared to T9; p=0.034 compared to T15) (Figure 10).
0
40
80
120
160
200
240T
i
m
e
(
m
i
n)
CLP - T6 Cooled Mice
Time Taken Until Cooled to 21:C
Time Taken for Rewarming from 21:C to 30:C
n = 16 n = 8

55
Figure 10. Plasma TNF-α Concentration in CLP Mice with or without Induced Deep Hypothermia at T6 and Rewarming. Seven or eight mice were in each group. * indicates significant difference between the cooled and CLP mice sacrificed at T9 and T15 (p<0.05, t-test).
The plasma IL-1β level, on the other hand, peaked shortly after CLP. Such high
concentration (ie. 3500 pg/ml) declined following the onset of sepsis and stayed relatively
constant between T9 and T15. Deep hypothermia had no statistically significant impact on
systemic IL-1β expression (Figure 11).
Figure 11. Plasma IL-1β Concentration in CLP Mice with or without Induced Deep
Hypothermia at T6 and Rewarming. Seven or eight mice were in each group.
0
100
200
300
400
P
l
a
s
m
a
T
N
F
-
α
(
p
g
/
m
l)
Groups of CLP Mice
CLP @ T6
CLP @ T9
CLP @ T12
CLP @ T15
CLP cooled to 21 deg
CLP cooled to 21 deg -rewarmed to 30 deg
0
1000
2000
3000
4000
5000
P
l
a
s
m
a
I
L
-
1
β
(
p
g
/
m
l)
Groups of Mice
CLP @ T6
CLP @ T9
CLP @ T12
CLP @ T15
CLP cooled to 21 deg
CLP cooled to 21 deg -rewarmed to 30 deg
n = 8
n = 8
n = 8 n = 8 n = 7
n = 7
n = 8
n = 8
n = 8 n = 8
n = 7 n = 7
* *
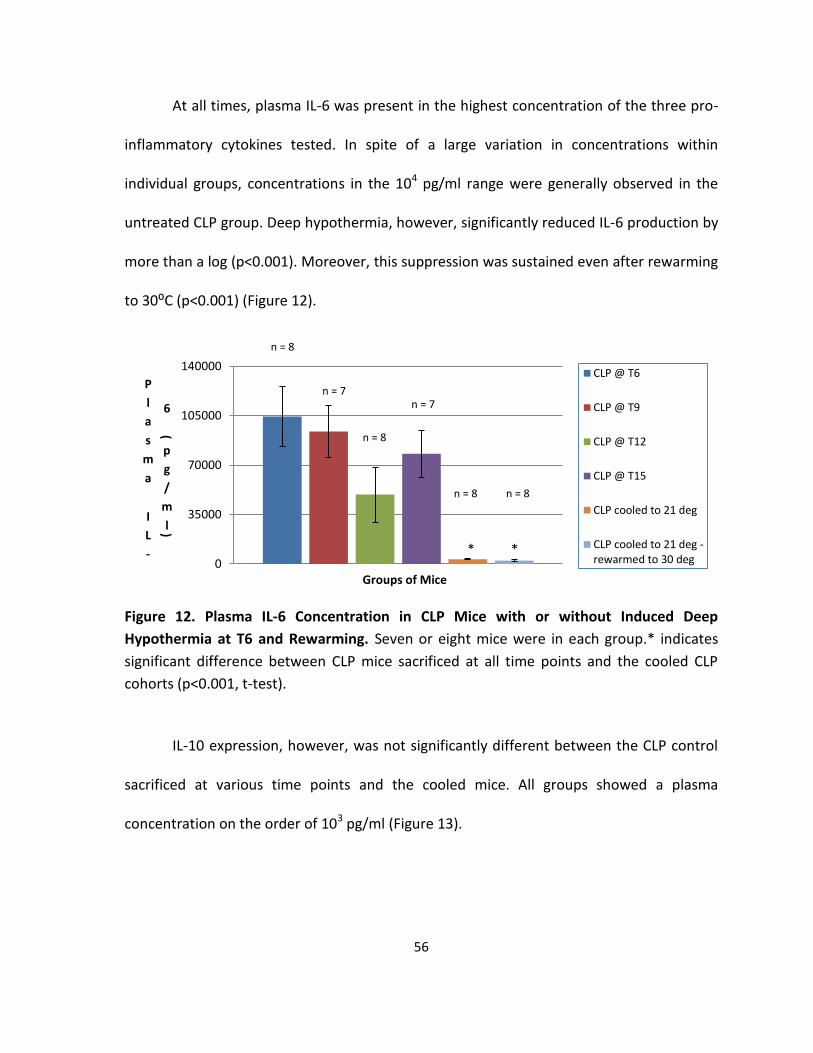
56
At all times, plasma IL-6 was present in the highest concentration of the three pro-
inflammatory cytokines tested. In spite of a large variation in concentrations within
individual groups, concentrations in the 104 pg/ml range were generally observed in the
untreated CLP group. Deep hypothermia, however, significantly reduced IL-6 production by
more than a log (p<0.001). Moreover, this suppression was sustained even after rewarming
to 30:C (p<0.001) (Figure 12).
Figure 12. Plasma IL-6 Concentration in CLP Mice with or without Induced Deep
Hypothermia at T6 and Rewarming. Seven or eight mice were in each group.* indicates
significant difference between CLP mice sacrificed at all time points and the cooled CLP
cohorts (p<0.001, t-test).
IL-10 expression, however, was not significantly different between the CLP control
sacrificed at various time points and the cooled mice. All groups showed a plasma
concentration on the order of 103 pg/ml (Figure 13).
0
35000
70000
105000
140000
P
l
a
s
m
a
I
L
-
6
(
p
g
/
m
l)
Groups of Mice
CLP @ T6
CLP @ T9
CLP @ T12
CLP @ T15
CLP cooled to 21 deg
CLP cooled to 21 deg -rewarmed to 30 deg
* *
n = 8
n = 8
n = 8 n = 8
n = 7 n = 7
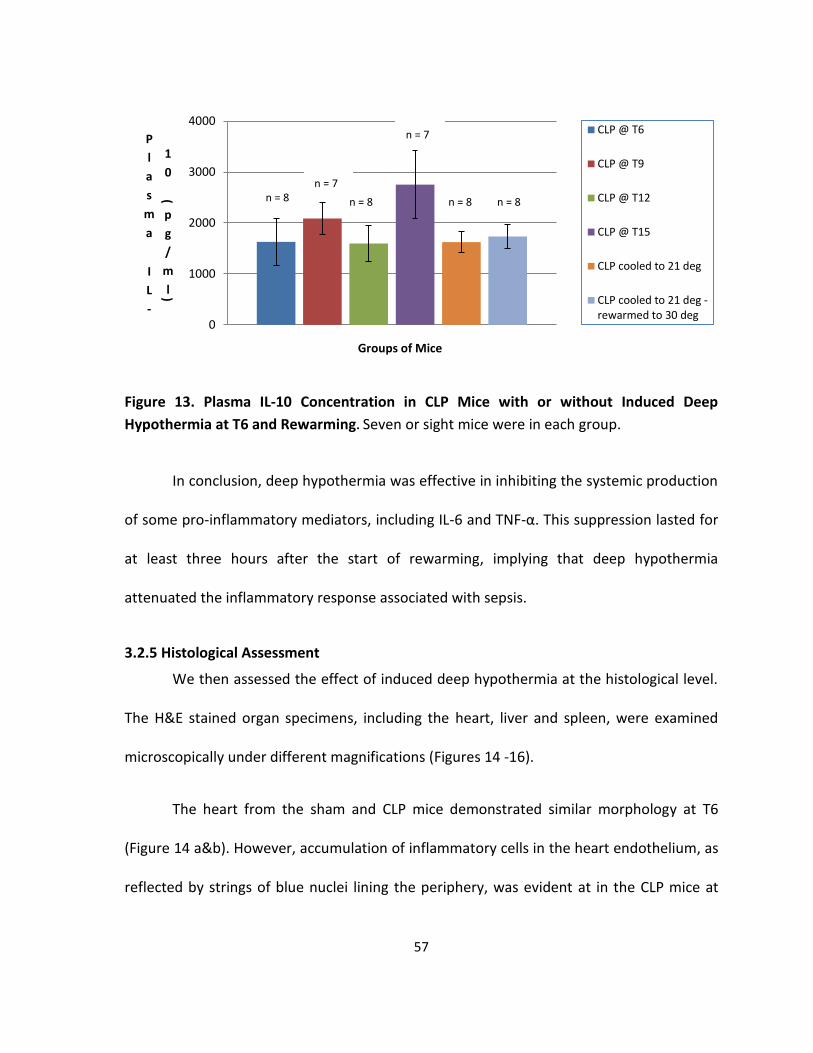
57
Figure 13. Plasma IL-10 Concentration in CLP Mice with or without Induced Deep
Hypothermia at T6 and Rewarming. Seven or sight mice were in each group.
In conclusion, deep hypothermia was effective in inhibiting the systemic production
of some pro-inflammatory mediators, including IL-6 and TNF-α. This suppression lasted for
at least three hours after the start of rewarming, implying that deep hypothermia
attenuated the inflammatory response associated with sepsis.
3.2.5 Histological Assessment
We then assessed the effect of induced deep hypothermia at the histological level.
The H&E stained organ specimens, including the heart, liver and spleen, were examined
microscopically under different magnifications (Figures 14 -16).
The heart from the sham and CLP mice demonstrated similar morphology at T6
(Figure 14 a&b). However, accumulation of inflammatory cells in the heart endothelium, as
reflected by strings of blue nuclei lining the periphery, was evident at in the CLP mice at
0
1000
2000
3000
4000
P
l
a
s
m
a
I
L
-
1
0
(
p
g
/
m
l)
Groups of Mice
CLP @ T6
CLP @ T9
CLP @ T12
CLP @ T15
CLP cooled to 21 deg
CLP cooled to 21 deg -rewarmed to 30 deg
n = 8 n = 8 n = 8 n = 8
n = 7
n = 7
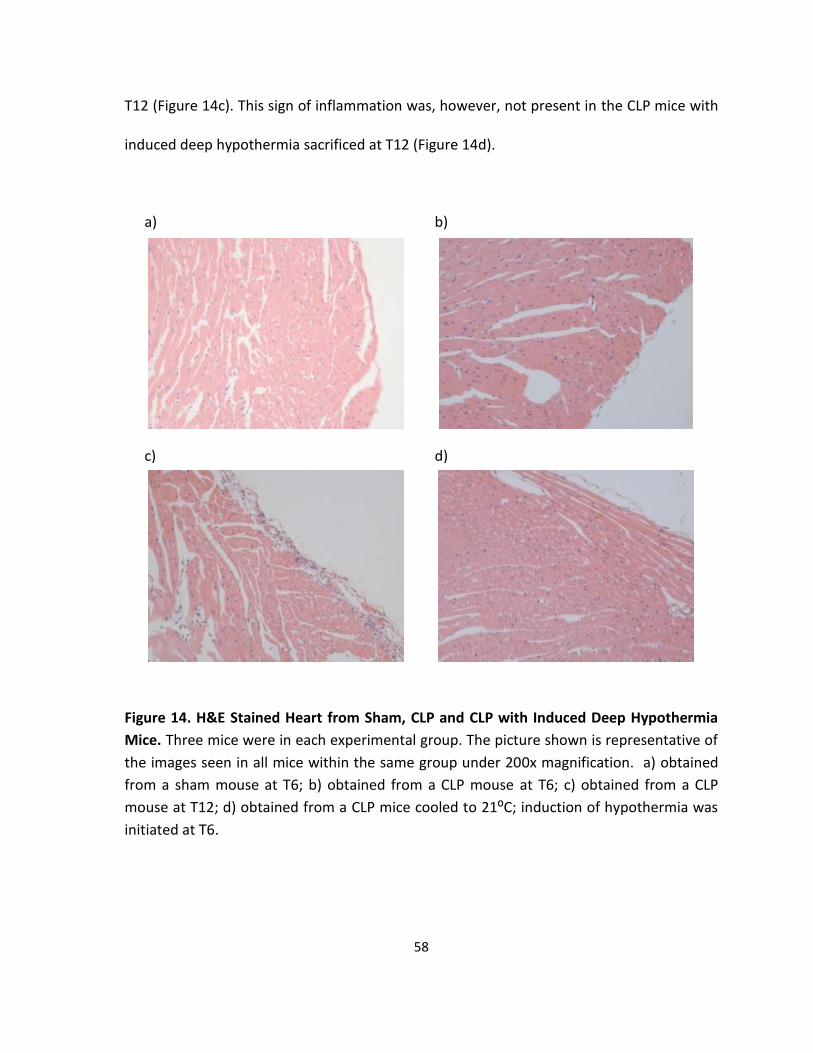
58
T12 (Figure 14c). This sign of inflammation was, however, not present in the CLP mice with
induced deep hypothermia sacrificed at T12 (Figure 14d).
Figure 14. H&E Stained Heart from Sham, CLP and CLP with Induced Deep Hypothermia
Mice. Three mice were in each experimental group. The picture shown is representative of
the images seen in all mice within the same group under 200x magnification. a) obtained
from a sham mouse at T6; b) obtained from a CLP mouse at T6; c) obtained from a CLP
mouse at T12; d) obtained from a CLP mice cooled to 21:C; induction of hypothermia was
initiated at T6.
a) b)
c)
d)
d)
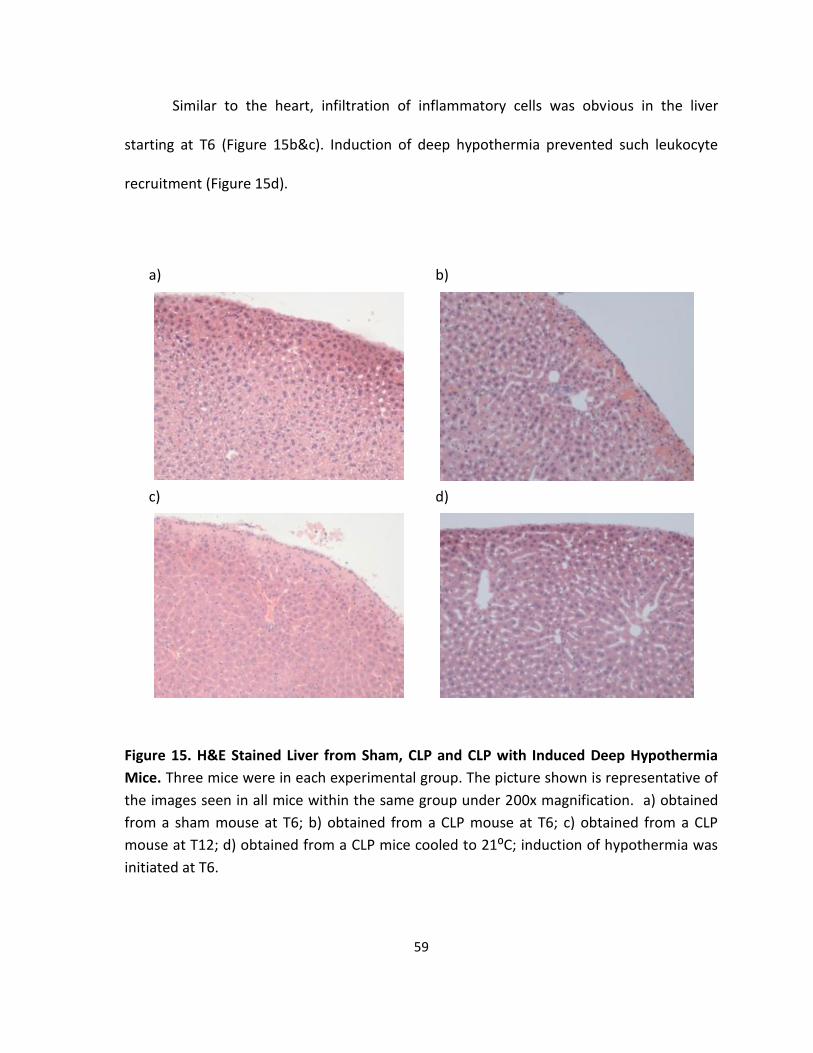
59
Similar to the heart, infiltration of inflammatory cells was obvious in the liver
starting at T6 (Figure 15b&c). Induction of deep hypothermia prevented such leukocyte
recruitment (Figure 15d).
Figure 15. H&E Stained Liver from Sham, CLP and CLP with Induced Deep Hypothermia
Mice. Three mice were in each experimental group. The picture shown is representative of
the images seen in all mice within the same group under 200x magnification. a) obtained
from a sham mouse at T6; b) obtained from a CLP mouse at T6; c) obtained from a CLP
mouse at T12; d) obtained from a CLP mice cooled to 21:C; induction of hypothermia was
initiated at T6.
a) b)
c) d)
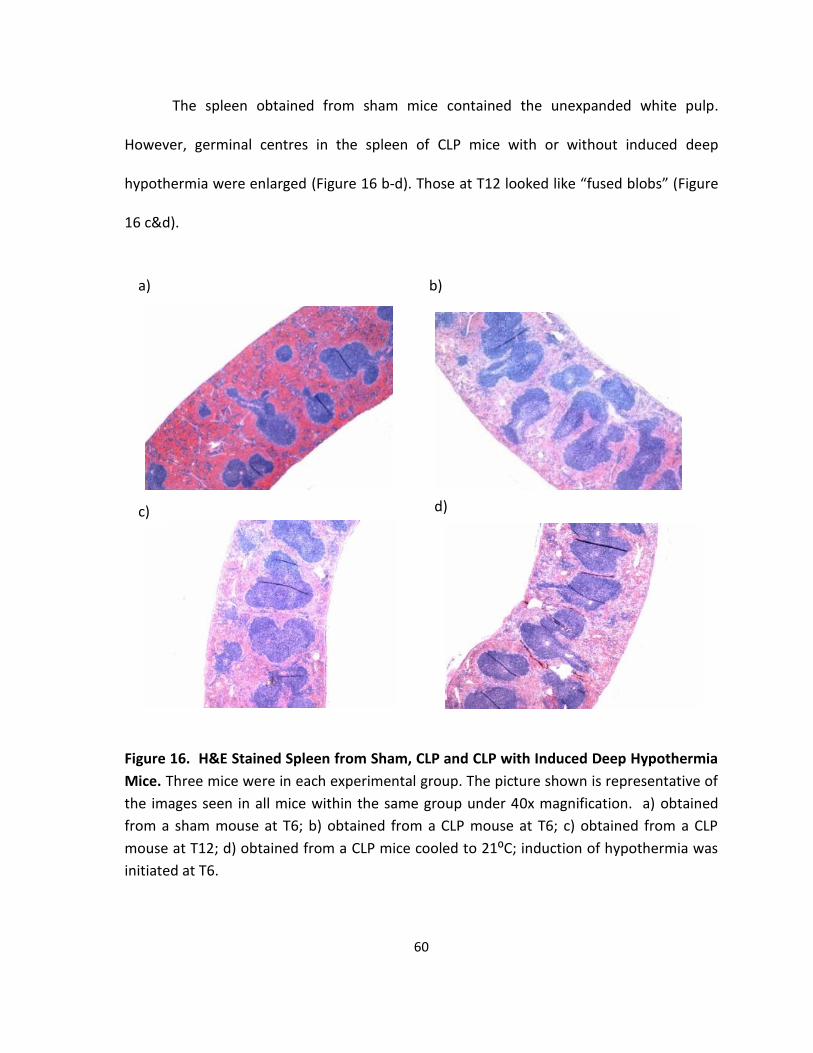
60
The spleen obtained from sham mice contained the unexpanded white pulp.
However, germinal centres in the spleen of CLP mice with or without induced deep
hypothermia were enlarged (Figure 16 b-d). Those at T12 looked like “fused blobs” (Figure
16 c&d).
Figure 16. H&E Stained Spleen from Sham, CLP and CLP with Induced Deep Hypothermia
Mice. Three mice were in each experimental group. The picture shown is representative of
the images seen in all mice within the same group under 40x magnification. a) obtained
from a sham mouse at T6; b) obtained from a CLP mouse at T6; c) obtained from a CLP
mouse at T12; d) obtained from a CLP mice cooled to 21:C; induction of hypothermia was
initiated at T6.
a) b)
c) d)
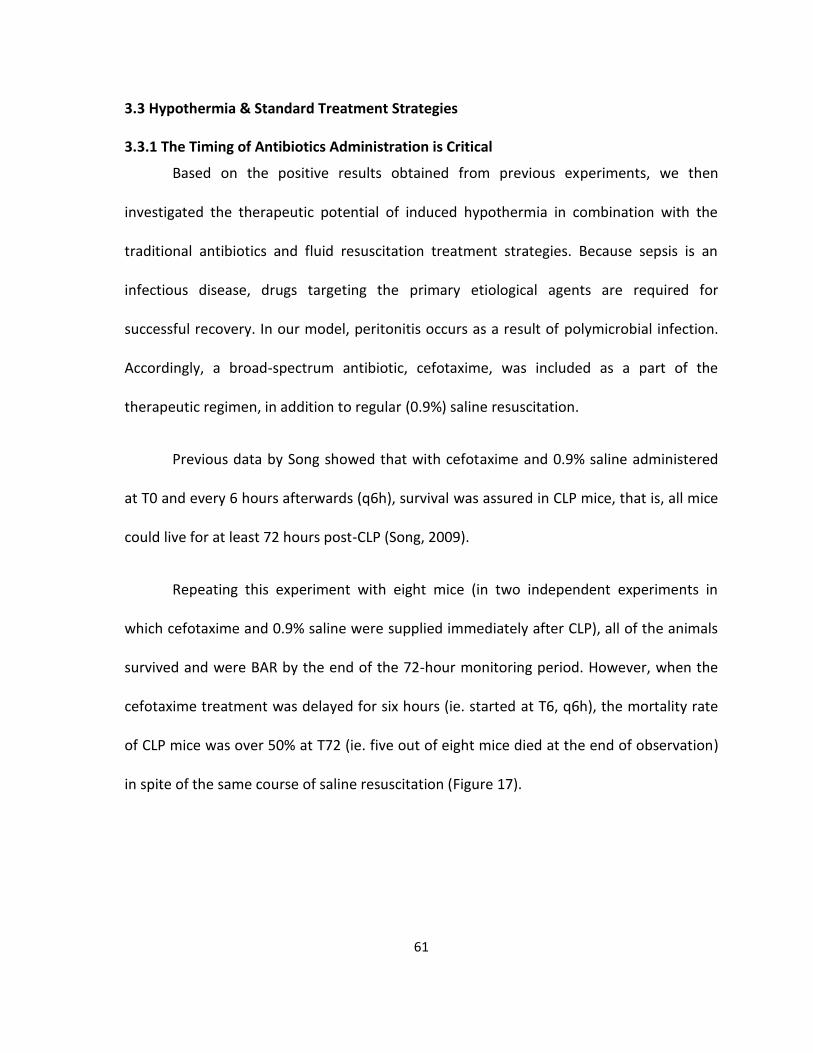
61
3.3 Hypothermia & Standard Treatment Strategies
3.3.1 The Timing of Antibiotics Administration is Critical
Based on the positive results obtained from previous experiments, we then
investigated the therapeutic potential of induced hypothermia in combination with the
traditional antibiotics and fluid resuscitation treatment strategies. Because sepsis is an
infectious disease, drugs targeting the primary etiological agents are required for
successful recovery. In our model, peritonitis occurs as a result of polymicrobial infection.
Accordingly, a broad-spectrum antibiotic, cefotaxime, was included as a part of the
therapeutic regimen, in addition to regular (0.9%) saline resuscitation.
Previous data by Song showed that with cefotaxime and 0.9% saline administered
at T0 and every 6 hours afterwards (q6h), survival was assured in CLP mice, that is, all mice
could live for at least 72 hours post-CLP (Song, 2009).
Repeating this experiment with eight mice (in two independent experiments in
which cefotaxime and 0.9% saline were supplied immediately after CLP), all of the animals
survived and were BAR by the end of the 72-hour monitoring period. However, when the
cefotaxime treatment was delayed for six hours (ie. started at T6, q6h), the mortality rate
of CLP mice was over 50% at T72 (ie. five out of eight mice died at the end of observation)
in spite of the same course of saline resuscitation (Figure 17).
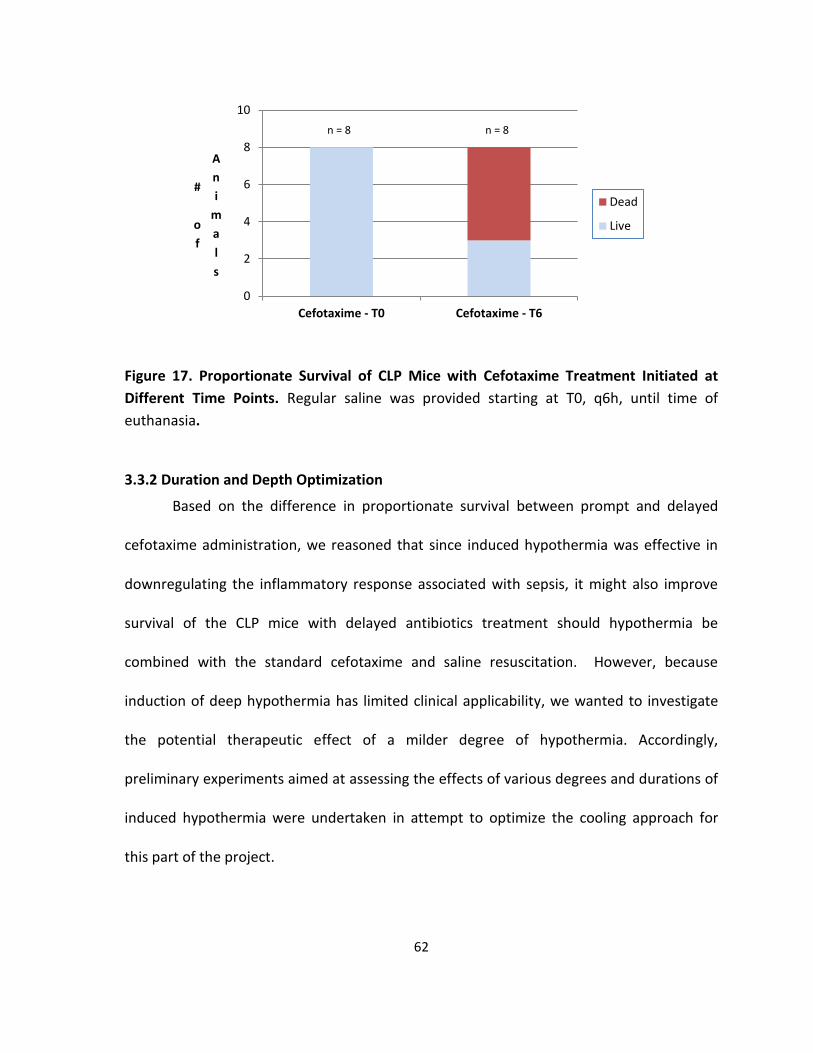
62
Figure 17. Proportionate Survival of CLP Mice with Cefotaxime Treatment Initiated at
Different Time Points. Regular saline was provided starting at T0, q6h, until time of
euthanasia.
3.3.2 Duration and Depth Optimization
Based on the difference in proportionate survival between prompt and delayed
cefotaxime administration, we reasoned that since induced hypothermia was effective in
downregulating the inflammatory response associated with sepsis, it might also improve
survival of the CLP mice with delayed antibiotics treatment should hypothermia be
combined with the standard cefotaxime and saline resuscitation. However, because
induction of deep hypothermia has limited clinical applicability, we wanted to investigate
the potential therapeutic effect of a milder degree of hypothermia. Accordingly,
preliminary experiments aimed at assessing the effects of various degrees and durations of
induced hypothermia were undertaken in attempt to optimize the cooling approach for
this part of the project.
0
2
4
6
8
10
Cefotaxime - T0 Cefotaxime - T6
#
o
f
A
n
i
m
a
l
s
Dead
Live
n = 8 n = 8
63
Induction of moderate hypothermia (27-28:C) at T6 took less than 30 minutes in
the 12:C chamber for most (ie. seven out of ten) CLP mice (Figure 18).
Figure 18. Time Required for Induction of Moderate Hypothermia (27 - 28⁰C) in CLP mice
in 72-hour Survival Experiments. The data were collected from ten CLP mice from three
independent experiments.
One hour of moderate hypothermia resulted in 100% mortality as the four mice
tested died between 24 and 48 hours post-CLP. Prolonging moderate hypothermia for
three hours or longer did not significantly improve survival. In addition, the animals’ rectal
temperature started to fall spontaneously when they were incubated at room temperature
for more than three hours. In contrast, induction of deep hypothermia for one hour gave
rise to a survivorship of 57% at T72 as four out of seven mice survived the challenge (Figure
19).
Therefore, it was concluded that moderate hypothermia induced by our method,
regardless of duration, does not provide a survival advantage. Deep hypothermia, on the
0
2
4
6
8
#
o
f
A
n
i
m
a
l
s
Dead
Live
<30 min 30 min to 2 hours

64
other hand, yielded a similar, if not greater, number of surviving mice than that did by CLP,
followed by administration of cefotaxime at T6 and saline resuscitation at T0 (Figure 17).
Figure 19. Proportionate Survival of CLP Mice with Various Degrees and Duration of
Induced Hypothermia Initiated at T6 (with Cefotaxime Initiated at T6 and Saline Initiated
at T0, q6h). MH = moderate hypothermia; DP = deep hypothermia.
3.3.3 Why Moderate Hypothermia Doesn’t Work?
We then inquired the reason why induction of moderate hypothermia was more
detrimental by measuring the plasma cytokine concentrations of CLP mice that were
cooled to 27-28:C with or without subsequent rewarming to 30:C. Compared to the non-
cooled CLP groups, induction of moderate hypothermia did not cause a significant
reduction in TNF-α or IL-6 levels (Figures 20 and 22), unlike induced deep hypothermia
(Figures 10 and 12). However, during rewarming, plasma IL-6 concentration increased
significantly compared to the CLP control sacrificed at the same time or T12 (p<0.001)
(Figure 22). Similarly, a statistically significant increase in plasma IL-10 concentration was
observed (p=0.019) (Figure 23).
0
2
4
6
8
MH for 1h MH for 3h MH for >3h DP for 1h
#
o
f
A
n
i
m
a
l
s
Dead
Live
n = 4
n = 7
n = 3
n = 7

65
Figure 20. Plasma TNF-α Concentration in CLP Mice with or without Induced Moderate
Hypothermia at T6 and Rewarming. Seven or eight mice were in each group.
Figure 21. Plasma IL-1β Concentration in CLP Mice with or without Induced Moderate
Hypothermia at T6 and Rewarming. Seven or eight mice were in each group.
0
100
200
300
400P
l
a
s
m
a
T
N
F
-
α
(
p
g
/
m
l)
Groups of Mice
CLP @ T6
CLP @ T9
CLP @ T12
CLP @ T15
CLP cooled to 27 deg
CLP cooled to 27rewarmed to 30
0
1000
2000
3000
4000
5000P
l
a
s
m
a
I
L
-
1
β
(p
g
/
m
l)
Groups of Mice
CLP @ T6
CLP @ T9
CLP @ T12
CLP @ T15
CLP cooled to 27 deg
CLP cooled to 27rewarmed to 30
n = 8
n = 8
n = 8
n = 8 n = 7 n = 7
n = 8
n = 8
n = 8
n = 8
n = 7
n = 7
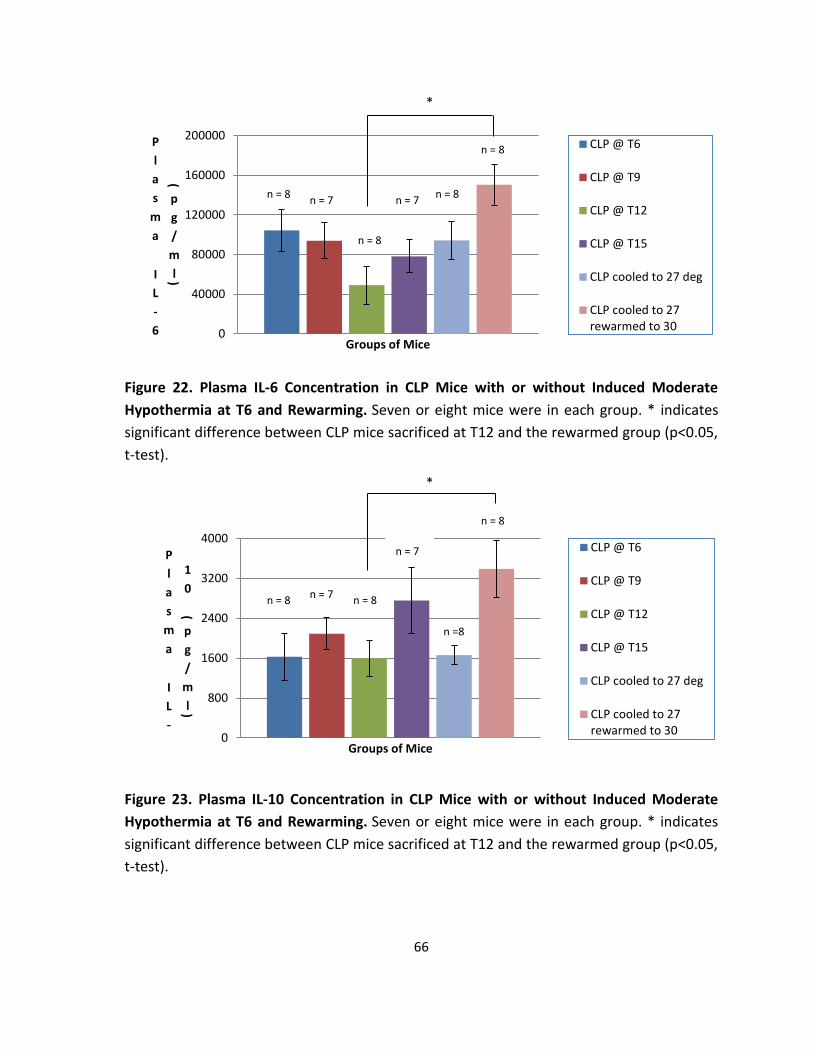
66
Figure 22. Plasma IL-6 Concentration in CLP Mice with or without Induced Moderate
Hypothermia at T6 and Rewarming. Seven or eight mice were in each group. * indicates
significant difference between CLP mice sacrificed at T12 and the rewarmed group (p<0.05,
t-test).
Figure 23. Plasma IL-10 Concentration in CLP Mice with or without Induced Moderate
Hypothermia at T6 and Rewarming. Seven or eight mice were in each group. * indicates
significant difference between CLP mice sacrificed at T12 and the rewarmed group (p<0.05,
t-test).
0
40000
80000
120000
160000
200000P
l
a
s
m
a
I
L
-
6
(
p
g
/
m
l)
Groups of Mice
CLP @ T6
CLP @ T9
CLP @ T12
CLP @ T15
CLP cooled to 27 deg
CLP cooled to 27rewarmed to 30
0
800
1600
2400
3200
4000
P
l
a
s
m
a
I
L
-
1
0
(p
g
/
m
l)
Groups of Mice
CLP @ T6
CLP @ T9
CLP @ T12
CLP @ T15
CLP cooled to 27 deg
CLP cooled to 27rewarmed to 30
n = 8
n = 8
n =8
n = 8
n = 7
n = 7
n = 7
n = 7
n = 8
n = 8
n = 8
n = 8
n = 7
*
*

67
3.3.4 The Alternative Rewarming Approach
Since anaesthetics-mediated hypothermia was inevitable during the surgery and
CLP mice incubated at 28:C in general developed further decrease in temperature
following the surgery, we investigated whether increasing the incubator temperature
would be effective in re-establishing the animals’ core temperature following CLP, thereby
preventing possible immunosuppression associated with perioperative hypothermia. In
addition, induction of mild hypothermia might also be possible with this approach.
Preliminary data by Song showed that a 35:C incubator was able to keep the mouse’s
temperature constant post-CLP albeit no improvement in survival (personal
communication with Song). Therefore, 35:C was used in the experiment.
Indeed, 35:C incubation was able to reduce the extent of perioperative
hypothermia, if not completely restoring the animal’s core temperature, shortly after the
surgery (Table 3). However, 12 hours of incubation at 35:C resulted in more rapid death of
the cooled CLP mice. Regardless of the degree and duration of induced hypothermia, all
twelve CLP-T6 cooled mice with standard saline and cefotaxime treatments died within 30
hours post-CLP. Therefore, in the second experiment consisting of ten mice, the incubator
temperature was lowered to 28:C when the last mouse in the group had had 3 hours of
incubation at 35:C. With the change in incubator temperature, all mice exhibited a
spontaneous drop in core temperature by T6 and most remained moderately hypothermic
(Table 3). Three out of ten mice survived in this experiment, implying that the 35:C
warming approach was not advantageous.

68
Table 3. Rectal Temperature of CLP Mice in a Temperature Changing Environment.
3.4 Resuscitation with Dextrose in Saline
3.4.1 Survivorship
This combination of strategies described above was not successful in improving
survival outcome and thus, we implemented a novel therapeutic idea by incorporating
dextrose-saline into the treatment regimen.
As shown previously by Yang Song, resuscitation with 10% dextrose diluted in saline
provided a better survival outcome than regular saline (Song, 2009). Therefore, 10%
dextrose in saline was used in place of 0.9% saline for this series of experiments. The sugar-
fluid was administered starting at T6, immediately after the first cefotaxime injection, q6h.
Unfortunately, 10% dextrose diluted in 0.9% saline, in spite of our high hope, did
not significantly improve survival. Administration of dextrose in combination with
cefotaxime and induction of moderate hypothermia resulted in approximately 50%
survival, which was better than mice with dextrose and cefotaxime only, albeit not
statistically significant (p=0.31, Fisher’s exact test) (Figure 24).
#1 #2 #3 #4 #5 #6 #7 #8 #9 #10
Incubator temperature set at 35:C
Baseline 39.0 39.2 38.5 39.2 38.5 38.0 38.5 38.4 37.3 37.7
T1 36.0 36.3 36.8 36.7 36.4 35.8 35.4 35.8 34.2 34.1
T2 37.0 36.4 36.5 35.5 37.8 36.4 35.3 36.6 34.7 34.3
T3 36. 36.6 35.9 34.4 37.9 36.6 35.1 35.9 35.2 34.4
Incubator temperature changed to 28:C
T6 30.6 32.7 31 32.9 35.6 34.5 31.8 34.0 31.5 33.3
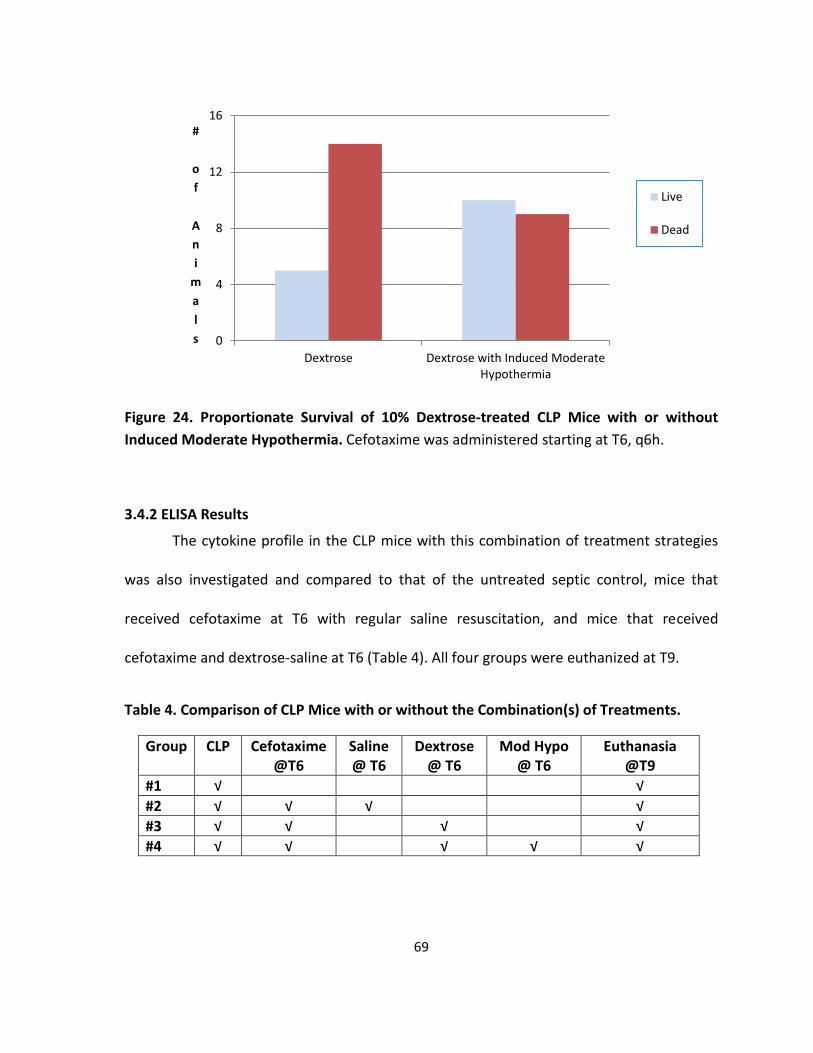
69
Figure 24. Proportionate Survival of 10% Dextrose-treated CLP Mice with or without
Induced Moderate Hypothermia. Cefotaxime was administered starting at T6, q6h.
3.4.2 ELISA Results
The cytokine profile in the CLP mice with this combination of treatment strategies
was also investigated and compared to that of the untreated septic control, mice that
received cefotaxime at T6 with regular saline resuscitation, and mice that received
cefotaxime and dextrose-saline at T6 (Table 4). All four groups were euthanized at T9.
Table 4. Comparison of CLP Mice with or without the Combination(s) of Treatments.
Group CLP Cefotaxime @T6
Saline @ T6
Dextrose @ T6
Mod Hypo @ T6
Euthanasia @T9
#1 √ √
#2 √ √ √ √
#3 √ √ √ √
#4 √ √ √ √ √
0
4
8
12
16
Dextrose Dextrose with Induced ModerateHypothermia
#
o
f
A
n
i
m
a
l
s
Live
Dead
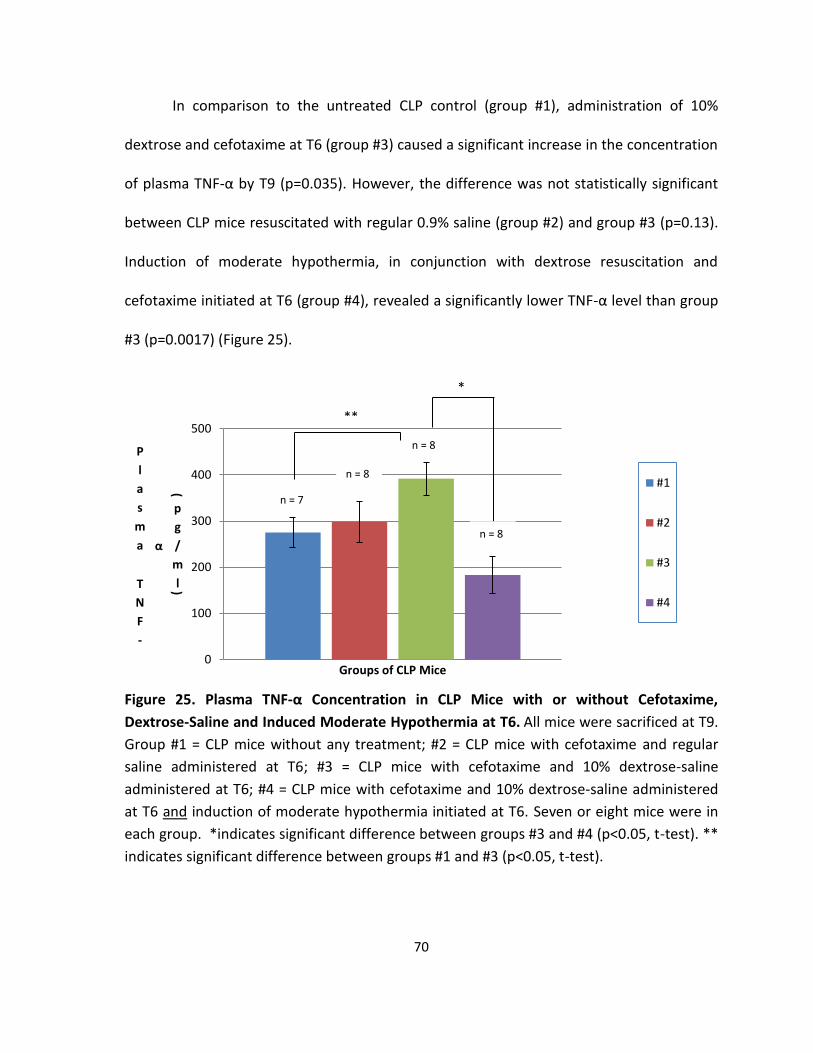
70
In comparison to the untreated CLP control (group #1), administration of 10%
dextrose and cefotaxime at T6 (group #3) caused a significant increase in the concentration
of plasma TNF-α by T9 (p=0.035). However, the difference was not statistically significant
between CLP mice resuscitated with regular 0.9% saline (group #2) and group #3 (p=0.13).
Induction of moderate hypothermia, in conjunction with dextrose resuscitation and
cefotaxime initiated at T6 (group #4), revealed a significantly lower TNF-α level than group
#3 (p=0.0017) (Figure 25).
Figure 25. Plasma TNF-α Concentration in CLP Mice with or without Cefotaxime,
Dextrose-Saline and Induced Moderate Hypothermia at T6. All mice were sacrificed at T9.
Group #1 = CLP mice without any treatment; #2 = CLP mice with cefotaxime and regular
saline administered at T6; #3 = CLP mice with cefotaxime and 10% dextrose-saline
administered at T6; #4 = CLP mice with cefotaxime and 10% dextrose-saline administered
at T6 and induction of moderate hypothermia initiated at T6. Seven or eight mice were in
each group. *indicates significant difference between groups #3 and #4 (p<0.05, t-test). **
indicates significant difference between groups #1 and #3 (p<0.05, t-test).
0
100
200
300
400
500
P
l
a
s
m
a
T
N
F
-
α
(
p
g
/
m
l)
Groups of CLP Mice
#1
#2
#3
#4
*
**
n = 7
n = 8
n = 8
n = 8
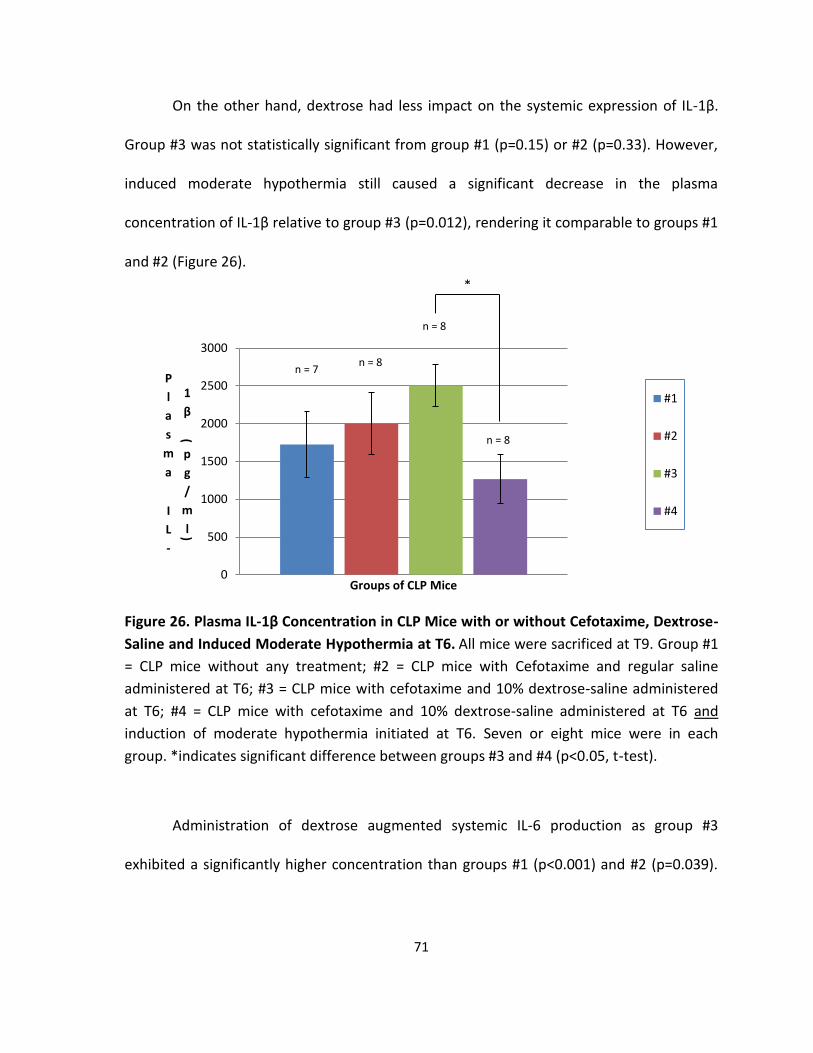
71
On the other hand, dextrose had less impact on the systemic expression of IL-1β.
Group #3 was not statistically significant from group #1 (p=0.15) or #2 (p=0.33). However,
induced moderate hypothermia still caused a significant decrease in the plasma
concentration of IL-1β relative to group #3 (p=0.012), rendering it comparable to groups #1
and #2 (Figure 26).
Figure 26. Plasma IL-1β Concentration in CLP Mice with or without Cefotaxime, Dextrose-
Saline and Induced Moderate Hypothermia at T6. All mice were sacrificed at T9. Group #1
= CLP mice without any treatment; #2 = CLP mice with Cefotaxime and regular saline
administered at T6; #3 = CLP mice with cefotaxime and 10% dextrose-saline administered
at T6; #4 = CLP mice with cefotaxime and 10% dextrose-saline administered at T6 and
induction of moderate hypothermia initiated at T6. Seven or eight mice were in each
group. *indicates significant difference between groups #3 and #4 (p<0.05, t-test).
Administration of dextrose augmented systemic IL-6 production as group #3
exhibited a significantly higher concentration than groups #1 (p<0.001) and #2 (p=0.039).
0
500
1000
1500
2000
2500
3000
P
l
a
s
m
a
I
L
-
1
β
(
p
g
/
m
l)
Groups of CLP Mice
#1
#2
#3
#4
*
n = 7 n = 8
n = 8
n = 8
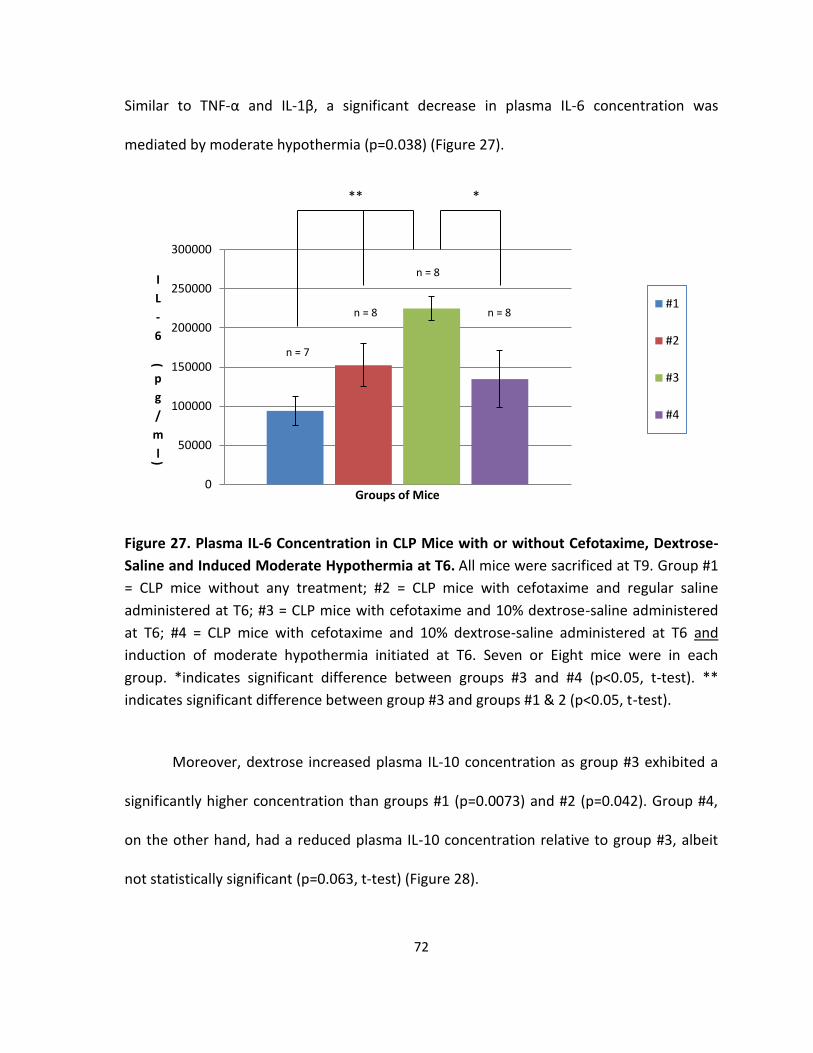
72
Similar to TNF-α and IL-1β, a significant decrease in plasma IL-6 concentration was
mediated by moderate hypothermia (p=0.038) (Figure 27).
Figure 27. Plasma IL-6 Concentration in CLP Mice with or without Cefotaxime, Dextrose-
Saline and Induced Moderate Hypothermia at T6. All mice were sacrificed at T9. Group #1
= CLP mice without any treatment; #2 = CLP mice with cefotaxime and regular saline
administered at T6; #3 = CLP mice with cefotaxime and 10% dextrose-saline administered
at T6; #4 = CLP mice with cefotaxime and 10% dextrose-saline administered at T6 and
induction of moderate hypothermia initiated at T6. Seven or Eight mice were in each
group. *indicates significant difference between groups #3 and #4 (p<0.05, t-test). **
indicates significant difference between group #3 and groups #1 & 2 (p<0.05, t-test).
Moreover, dextrose increased plasma IL-10 concentration as group #3 exhibited a
significantly higher concentration than groups #1 (p=0.0073) and #2 (p=0.042). Group #4,
on the other hand, had a reduced plasma IL-10 concentration relative to group #3, albeit
not statistically significant (p=0.063, t-test) (Figure 28).
0
50000
100000
150000
200000
250000
300000
I
L
-
6
(
p
g
/
m
l)
Groups of Mice
#1
#2
#3
#4
* **
n = 7
n = 8
n = 8
n = 8

73
Figure 28. Plasma IL-10 Concentration in CLP Mice with or without Cefotaxime, Dextrose-
Saline and Induced Moderate Hypothermia at T6. All mice were sacrificed at T9. Group #1
= CLP mice without any treatment; #2 = CLP mice with cefotaxime and regular saline
administered at T6; #3 = CLP mice with cefotaxime and 10% dextrose-saline administered
at T6; #4 = CLP mice with cefotaxime and 10% dextrose-saline administered at T6 and
induction of moderate hypothermia initiated at T6. Seven or Eight mice were in each
group. ** indicates significant difference between group #3 and groups #1 & 2 (p<0.05, t-
test).
In conclusion, administration of dextrose caused a heightened inflammatory
response, as reflected by a significant increase in the plasma concentrations of TNF-α and
IL-6 relative to the untreated or 0.9% saline resuscitated-CLP mice. In addition, dextrose
enhanced IL-10 production. This effect, however, was suppressed by induced moderate
hypothermia.
0
2000
4000
6000
8000
I
L
-
1
0
(
p
g
/
m
l)
Groups of Mice
#1
#2
#3
#4
**
n = 7
n = 8
n = 8
n = 8

74
3.5 Bacterial Quantification
3.5.1 An Estimate of Cecal Bacteria Density
Quantification of cecal bacteria was done as explained in Section 2.5.1. Two sets of
10-fold serial dilutions of 0.06g of cecal content suspended in 4.5ml of sterlized lysogeny
(LB) broth were made. At 24 hours post-inoculation, turbidity was observed in tubes
containing the undiluted bacterial solution as well as in those with 10-1 to 10-6 dilutions.
The control tubes, which contained LB broth only, on the other hand, were clear.
Table 5. The Turbidity Test Results (of Cecal Bacterial Dilution Sets #1 and #2) at 24 Hours Post-inoculation.
Turbidity Dilution of Cecal Bacterial Solution LB control Undiluted 10-1 10-2 10-3 10-4 10-5 10-6 10-7 10-8
Turbid √ √ √ √ √ √ √
Clear √ √ √
0.2ml from each dilution tube (set #1) was also plated on LB agar plates in
duplicates for viable cell count the next day. This was based on the assumption that each
colony on the LB plate, as defined by an ivory glistening dot, was formed by a bacterium
and therefore, one colony-forming unit (CFU). At 24 hours post-incubation in the CO2 box,
there were countless colonies on the undiluted, 10-1, and 10-2 plates; therefore, each of
these plates was recorded as too numerous to count (TNTC). About 200 colonies were
found on the 10-3 plates and 19±3 were found on the 10-4 plates (Table 6). These numbers
were used in the subsequent calculation to provide an estimate of the cecal bacteria
population. No colonies were found on the control plates.

75
Table 6. Viable Cell Count of Cecal Bacteria at 24 Hours Post-incubation.
Dilution Plate #1 Plate #2
Undiluted TNTC TNTC
10-1 TNTC TNTC
10-2 TNTC TNTC
10-3 218 203
10-4 22 16
10-5 6 3
10-6 0 1
10-7 0 0
10-8 0 0
No solution added 0 0
LB broth 0 0
The number of CFU/mL in the original cecal bacterial solution was calculated by
dividing the number of colonies detected on a specific plate by the product of its dilution
number and the volume of the dilution plated, that is, 0.2mL in this case. The calculated
CFU/mL was then multiplied by the volume of the solution, 4.5mL, to obtain the number of
CFUs contained within the excised cecum used for viable bacteria count. Because this part
of the cecum weighed 0.06g, the number of CFU/g of cecal content was also calculated as
listed in Table 7. In conclusion, there are at least 10 million bacteria/gram inside a BALB/c
mouse’s cecum.
Table 7. An Estimate of Bacterial CFUs within a Mouse’s Cecum. 0.2ml of each dilution was plated on an LB agar plate in duplicates.
Dilution #
Plate Count Calculated CFU/mL Total CFU (in 4.5mL)
CFU/g of Cecal content
10-3 #1 218 1.09 x 10⁶ 4.9 x 10⁶ 8.2 x 10⁷
10-3 #2 203 1.02 x 10⁶ 4.6 x 10⁶ 7.6 x 10⁷
10-4 #1 22 1.1 x 10⁶ 5.0 x 10⁶ 8.3 x 10⁷
76
3.5.2 Quantification of Bacteria in the Blood of CLP Mice with or without Induced Deep
Hypothermia
A group of seven mice, randomized into two groups, namely, normothermia (#1-4)
and deep hypothermia (#5-7), were examined for the number of CFU’s present in the blood
before cefotaxime injection (at T6), and during severe septic shock or at the end of the 72-
hour experiment if the animal had recovered from the infection. Saphenous vein bleed was
done as explained in 2.5.1 to collect a maximum of 0.3ml of blood from the hind leg of
each mouse, diluted in LB broth, and then plated on LB and blood agar plates.
Based on the results obtained (Table 8), one mouse from each group survived the
72-hour experiment. Bacteria were not detected in the blood by our method at T6, right
before the cefotaxime injection; however, a large variation in CFUs was found within the
moribund group as well as between the dead and the surviving mice.
Strikingly, the two surviving mice were bacteraemic. In contrast, although no
bacteria were detected in mouse #3, it still died from CLP (Table 8). Thus, the number of
CFUs present in the blood (as detected by our culturing method) could not be used as a
prognostic marker for disease severity.

77
Table 8. Quantification of Bacteria in the Blood of CLP Mice with or without Induced
Deep Hypothermia. 0.1ml of each dilution was plated. L = LB plate, B = Blood Agar plate; T
= TNTC.
Mouse #
Induced deep hypothermia, starting at T6
CFU, at T6 CFU, in moribund state CFU, at T72
10-1 10-2 CFU/
mL
10-1 10-2 CFU/ ml
10-1 10-2 CFU/
mL L B L B L B L B L B L B
1 0 0 0 0 0 2 0 0 0 200 died on Day 3
2 0 0 0 0 0 Survived the experiment
T >60 T 20 >103
3 0 0 0 0 0 0 0 0 0 0 died on Day 2
4 0 0 0 0 0 T T T T TN TC
died on Day 2
5 √ 0 0 0 0 0 T 47
T 10 >103 died on Day 2
6 √ 0 0 0 0 0 Survived the experiment
26 6 25 3 >103
7 √ 0 0 0 0 0 T T T T TN TC
died on Day 2

78
4 Discussion
4.1 CLP-induced Sepsis
The mouse model of sepsis used in this project was adapted in our lab based on
prior literature. In this CLP model with two 18G punctures through the cecum, the cecal
content, which contains at least 107 aerobic bacteria per gram (Table 7, p.75), is expressed
from two portals into the peritoneal cavity, resulting in a polymicrobial infection in the gut.
This disruption of the gastro-intestinal barrier promotes the recruitment of immune cells
into the infectious area, resulting in a necrotic cecal sac or abscess that sets the stage for
SIRS. As the median survival time of the CLP mice was less than a day (ie. approximately 18
hours post-CLP) in the absence of therapeutic interventions (Figure 8, p.52), this acute
model illustrates a rapid disease progression.
Similar to the control mice, namely, the sham and mice with cecal ligation only,
there was a continuous drop in the body weight in all CLP mice, and this was largely due to
their reduced intake of food and water, excretion and progressive dehydration after the
surgery.
In contrast to the two negative control groups, the CLP mice exhibited signs of
physiological distress shortly after the surgery. Symptoms indicative of sepsis, including
diarrhea, hyperventilation and hypothermia, were obvious starting at approximately T6.
The onset of hyperventilation implied progressive metabolic acidosis. Development of
hypothermia was reckoned as a natural host response to infection in rodents (Larson et al.,
1939; Saito et al., 2003).
79
Histological examination of animal organs extracted at T6 also revealed the
systemic impact induced by the intraperitoneal infection (Figures 14–16, pp.58-60). The
presence of abundant inflammatory cells lining the periphery of vital organs and
enlargement of splenic white pulp collectively illustrated the rapid induction of the host
immune response following CLP. This inflammatory response induces changes in the
activity of these organ systems, contributing to, at least partially the lethargy-like
symptoms observed.
The heart, being one of the most central organs within the body, was expected to
exhibit histologic changes in sepsis. Compared to the sham mice, the myocardial
infrastructure was intact in the CLP mice at T6 (Figure 14 a&b, p.58), suggesting that at an
early stage of sepsis, the heart was likely not affected. At T12, however, migration of
inflammatory cells into the heart changed its histology (Figure 14c, p.58), reflecting the
onset of depressed myocardial function observed at a later stage of sepsis.
The liver was examined because it is a potent filter of bacteria and endotoxin (Katz
et al., 1991; Mathison et al., 1979). Mathison et al. showed that in rabbits, 50% of
radiolabelled endotoxin was taken up by the Kupffer cells in five minutes after
intraveneous infusion (Mathison et al., 1979). Upon facing such an infectious insult, the
Kupffer cells upregulate their release of soluble mediators of SIRS, including TNF-α, which
induces upregulation of adhesion molecules and promotes neutrophil adhesion to the
endothelium (Karima et al., 1999). Accordingly, transmigration of leukocytes into the
parenchyma occurs and it can cause hepatic injury by means of oxygen radicals and
80
proteases (Todoroki et al., 2000). Therefore, not surprisingly, accumulation of
inflammatory cells in the hepatic endothelium in the CLP mice was seen early in sepsis, at
around T6 (Figure 15b, p.59), and the migration of leukocytes into the liver parenchyma
was in response to the locally induced factors.
The spleen, being an integral part of the host immune system, was also examined.
As shown in Figure 16 (p.60), the enlargement of the splenic white pulp as a result of
lymphoid hyperplasia indicated the ongoing activation of lymphocytes and antibody
production shortly following CLP. Recently, it has been shown that the spleen is also a
hidden reservoir of undifferentiated monocytes in mice. In response to surgically induced
injuries, such as myocardial ischemia, these naïve monocytes migrated out of the organ,
demonstrating their ability to be deployed to distant injury sites (Swirski et al., 2009).
Therefore, splenic monocyte activation and differentiation was likely to be taking place in
conjunction with the T and B lymphocyte activation in the spleen of the CLP mice.
Although similar clinical symptoms and organ histology were observed within each
group of mice tested, the bacteria associated with sepsis were not present in equal
abundance in the CLP mouse model. In Table 8 (p.77), no bacteria were detected in the
blood of the seven CLP mice tested at T6 by our culturing method, implying that the
common bacterial species, such as E. coli, were not present in the bloodstream of this
cohort of animals at the time of blood sampling despite the onset of an immunological
response. However, as sepsis progressed, some mice became bacteremic while others
seemingly stayed clear of blood infection. However, the amount of bacteria present in the
81
bloodstream could not be correlated with the animal’s survival duration as one mouse
without apparent bacteremia died a day after CLP while two other mice that were found to
have hundreds of CFUs/mL in blood were active and survived for 72 hours post-CLP. With
respect to these results, two conclusions could be drawn: 1) infection is not the only cause
of death as an exaggerated host response can also cause adverse effects; 2) that the
bacteria in blood may not be reflective of the infection in other compartments such as the
peritoneum. Therefore, in this experimental sepsis model, the bacterial concentration in
blood was not representative of disease progression or severity.
The plasma cytokine concentrations, on the other hand, were more representative
of the pathologic condition in the mice. Concentrations of plasma cytokines skyrocketed in
the CLP mice relative to the sham controls, whose values were almost negligible using our
ELISA testing method. By T6, the inflammatory triad concentrations, namely, TNF-α, IL-1β
and IL-6 were elevated (Figures 10–12, pp.55-56). Being an early inflammatory mediator,
IL-1β had reached its peak concentration by T6 and declined after this time point (Figure
11, p.55). In contrast, its synergistic partner, TNF-α, remained at a consistently high level
throughout the observation period (Figure 10, p.55), alluding to the ongoing inflammation
and vascular changes mediated by this cytokine in the untreated CLP mice. However, this
was expected because previous studies had demonstrated a positive correlation between
high levels of TNF-α and IL-6 and adverse outcomes (Brauner et al., 2000; O’Reilly et al.,
1999; Remick et al., 2002). Therefore, the persistent high levels of TNF-α and IL-6 in the

82
untreated CLP mice between T6 and T15 (Figures 10 and 12, pp.55-56), symbolizing hyper-
inflammation associated with CLP prior to death, were expected.
The plasma IL-10 level, on the other hand, stayed relatively constant until T15
(Figure 13, p.57), reflecting the delayed kinetics of this anti-inflammatory cytokine (Lin et
al., 2000).
4.2 Hypothermia
4.2.1 Isofluorane- and Sepsis-Induced Hypothermia
Throughout the CLP surgery, the animal was anaesthetized by means of isofluorane,
a halogenated ether that acts as a neuromuscular blockade to induce muscle relaxation
and reduce pain sensitivity. This anesthetic agent binds to gamma-aminobutyric acid
(GABA), glutamate and glycine receptors and hyperpolarizes the cell membrane (Berg-
Johnsen and Langmoen, 1990). In this way, it disrupts the synaptic transmission of
neurotransmitters and inhibits motor action. In addition, as a result of its inhibitory effects
on the cerebral cortex, the body’s intrinsic ability to thermoregulate is undermined by
isofluorane, resulting in perioperative mild hypothermia experienced by the animal.
However, rapid recover from isoflurane-induced anaesthesia occurs because this volatile
anesthetic has low solubility in blood and tissue and it is largely eliminated by the lung
(Drugbank, 2011). Nevertheless, the animal’s core temperature does not rebound instantly
upon termination of anaesthesia, implying that a complete recovery of thermoregulation
takes time.

83
Our data showed that post-operative warming at 28:C was effective in re-
establishing the normothermic temperature in the two negative control groups within a
few hours (ie. by T6) after the surgery (Figures 3 and 4, pp.45-46). However, normothermia
was not restored in the CLP mice by T6, even though long-range fluctuations in
temperature were observed and in some mice, the temperature did rebound to as high as
37:C at a later time point (Figure 5, p.49). Therefore, the onset of sepsis evoked a
secondary hypothermic response, in addition to that induced by anaesthesia. In other
words, in the CLP mice, mild hypothermia preceded the onset of sepsis and as a natural
host response to the infectious insult, rodents decreased their body temperature as time
progressed (Remick and Xioa, 2006; Saito et al., 2003). As a consequence, the natural
course of sepsis might have been altered in our hypothermic mice by isoflurane, the impact
of which remains to be elucidated. In our model, correction of the perioperative
hypothermia could occur, but the cost of heat-induced rewarming was a more rapid
mortality.
Our attempt to restore the temperature in the CLP mice following the operation by
incubation at 35:C proved to be an effective approach in reversing isoflurane-induced
hypothermia (Table 3, p.68). However, a warmer incubation temperature did not improve
survival. Rather, prolonged incubation at the increased temperature caused the animals to
die even faster, implying that an increase in the septic animals’ metabolic rate facilitated by
a warmer environment was harmful to their general wellbeing. Perhaps this was not
surprising because sepsis is associated with an exaggerated inflammatory response.
84
Ostberg et al. has shown that induction of hyperthermia following LPS infusion enhances
TNF-α and IL-6 production in rodents (Ostberg et al., 2000). Therefore, overactivation of
the immune system in response to infection, in combination with additional heat from the
surroundings, amplifies inflammation; and in our case, it was clearly shown to be
detrimental.
In addition, the animal’s core temperature maintained this way was proven to be
heavily dependent on the heat generated by the incubator. Adjusting the incubator’s
temperature to 28:C elicited an almost immediate drop in their rectal temperature (Table
3, p.68). This shows that warming at a higher temperature is unable to permanently
reverse sepsis-induced hypothermia.
4.2.2 Induced Hypothermia
The therapeutic potential of induced hypothermia was discussed in section 1.2.2
and proven valuable for scenarios involving preserving oxygen consumption. In
experimental sepsis, induction of hypothermia has shown to exert immunomodulatory
effects (section 1.4, pp.29-31). Our approach for inducing hypothermia through incubating
the animals in a cold environment offered general cooling and was effective in lowering the
animal’s core temperature within a short period of time (Figures 9 and 18, pp.54, 63).
We chose to initiate the cooling treatment at T6 in the CLP mice because at this
time point, the animals exhibited symptoms similar to those of SIRS manifested in patients
upon hospital admission. In addition, clinical data have illustrated the importance of
initiation of cooling within an effective window of opportunity (Khurshid et al., 2011).

85
Induced hypothermia has shown to be most effective during the latent phase of injury, that
is, before the onset of symptoms indicative of energy failure (Khurshid et al., 2011), which
seemed to correspond to approximately T6 in our model.
However, the rate of cooling was difficult to control with our method of inducing
hypothermia as some mice were more temperature sensitive than others. Hence, there
was variation in the time taken for the CLP mice to reach the same target temperature
(Figures 9 and 18, pp.54, 63). In particular, those that took longer to reach the desired
temperature, on average, had longer survival duration than the ones that were more
susceptible to the cold stress. A possible explanation to this observation was that there was
a more extensive alteration in thermoregulation in the latter group, owing to bacterial
infection and its related systemic response. However, because each mouse was unique,
variation in the host response to peritonitis was expected.
In addition, overcooling sometimes occurred with prolonged incubation in the cold
chamber. Mice with a rectal temperature of 19:C or less exhibited grogginess as a result of
impaired brain function and those with a temperature of 13:C or less were comatose
(Table 1, p.51). This implied that the BALB/c mice could only withstand temperatures of
≥20:C before hypothermia-associated permanent physical damage occurs. Therefore, a
lower limit of 21-22:C was established for subsequent experiments. Both deep and
moderate hypothermia (with subsequent rewarming) were tested and each evoked a
different alteration in cytokine expression before and during rewarming.

86
4.2.3 Deep Hypothermia
The CLP mice with a core temperature of 21-22:C, in spite of their pale appearance,
had normal locomotive activity and a decreased ventilation rate relative to the CLP control
or those cooled to moderate hypothermia. In addition, these mice had the longest survival
duration compared to other groups (Figure 8, p.52).
Our ELISA data illustrated the significantly decreased plasma levels of TNF-α (Figure
10, p.55) and IL-6 (Figure 12, p.56) in the deep hypothermic mice relative to the untreated
septic controls, which symbolized an attenuated inflammatory response in the cooled
animals. Such cytokine suppression was possibly due to the inactivation or downregulation
of the activity of macrophages and/or mast cells. Since these cells are known to be potent
cytokine producers and are capable of inducing a series of vascular changes, including
vasodilation and increased expression of adhesion molecules, hypothermia-mediated
suppression of their activity might have significantly arrested the cytokine cascade,
preventing the influx of inflammatory cells and tissue injury (Lydyard et al., 2009). At the
histologic level, cellular infiltrate was absent in the endothelium of the heart and liver in
the CLP mice with deep hypothermia (Figure 14 and 15, pp.58-59). It was speculated that in
the cold animals, the amount of local chemoattractants was largely reduced within the
viable organs as a result of the downregulated pro-inflammatory response. This form of
immunosuppression was sustained even during rewarming, accentuating the lasting effect
of deep hypothermia. On the other hand, the plasma IL-10 concentration in the cold mice
with or without rewarming was comparable to those in the CLP control (Figure 13, p.57),
implying that the anti-inflammatory response was relatively less affected in this model.

87
4.2.4 Moderate Hypothermia
Moderate hypothermia did not dampen the inflammatory response associated with
sepsis. Based on our cytokine data, the effect of moderate hypothermia was minimal on
plasma IL-1β, IL-6 and IL-10 concentrations (Figures 21-23, pp.65-66). However, there was a
slight decrease in TNF-α concentration relative to that in the CLP control animals (Figure
20, p.65). Strikingly, rewarming to 30:C from moderate hypothermia was associated with
enhanced IL-6 and IL-10 production (Figures 22 and 23, p.66).
In parallel with our current observation, previous animal studies and clinical
research data have both demonstrated a heightened pro-inflammatory response, including
elevated IL-6 concentration in some cases, during rewarming from hypothermia (Aibiki et
al., 1999; Brancaccio et al., 2005; Hildebrand et al., 2005; Vaagenes et al., 2003). In
addition, induced expression of heat shock proteins upon rewarming has been reported in
in vitro models employing human cell lines (Liu et al., 1994), indicating that increasing the
animal’s core temperature is accompanied by changes at the molecular level, some of
which may affect the pro- and anti-inflammatory responses. It was speculated that the
increase in plasma IL-10 concentration in the rewarmed mice was due to the activation of
the hypothalamus – pituitary – adrenocortical (HPA) axis, giving rise to an increase in the
release of glucocorticoids, which are potent stimulators of IL-10 production (Mozo et al.,
2004).
In conclusion, induction of moderate hypothermia was less effective at restraining
the inflammatory response than deep hypothermia. In addition, rewarming from moderate
88
hypothermia produced a heightened immune response, thereby making it a less effective
strategy.
4.3 Standard Antibiotics and Saline Resuscitation
Cefotaxime is a broad-spectrum antibiotic that is effective against most Gram-
positive and Gram-negative bacteria species by inhibiting their bacterial cell wall synthesis
(Drugbank, 2011). However, it does not confer absolute protection against some bacteria,
such as Pseudomonas aeruginosa (Fung-Tomc et al., 1988).
Our current data has shown that administration of cefotaxime in combination with
0.9% saline immediately after the CLP surgery is successful in preventing sepsis-induced
mortality (Figure 17, p.62). Therefore, this treatment regimen is effective in clearing
bacterial infection when it is initiated early after the infectious insult. On the contrary,
when cefotaxime is delayed until the onset of SIRS, high mortality ensues (Figure 17, p.62),
accentuating the importance of prompt antibiotic treatment. The cytokine profiles of mice
sacrificed at T9 revealed that cefotaxime administration at T6 alone does not change the
course or magnitude of the immune response elicited by CLP (Figures 25-28, pp.70-73).
Incorporating a third dimension into the treatment regimen by inducing
hypothermia at T6 was not sufficient to improve survival of the CLP mice (Figure 19, p.64).
This implied that even in the presence of deep hypothermia-mediated downregulation of
the pro-inflammatory response, these CLP mice were still at a high risk of death. One
possible explanation to this was that induced hypothermia might also have imposed some
negative effects, such as coagulation or increased susceptibility to infection, as well as

89
restraining the inflammatory response (Kheirbek et al., 2009; Lindenblatt et al., 2006).
Thus, hypothermia is a double-edged sword; when it is not modulated carefully, it can
cause adverse outcomes.
In summary, ablating the cytokine response by means of downregulating the
animal`s core temperature is not sufficient to rescue these animals. Therefore, other
therapeutic approaches were deemed necessary in order to improve survival.
4.4 Dextrose infusion
Impaired glucose homeostasis has been well documented in sepsis (Kagansky et al.,
2003). While hyperglycemia is more common at an early stage of sepsis, hypoglycemia may
also occur as sepsis progresses and the onset of hypoglycemia is often associated with a
grave prognosis (Rattarasarn, 1997). As a consequence, resuscitation with dextrose-
supplemented saline instead of regular saline appeared to be an intuitive therapeutic
approach for treating sepsis.
We attempted to assess the effect of 10% dextrose infusion after the onset of SIRS
in the CLP mice. The cytokine profiles illustrated an overall heightened immune response
imposed by dextrose, reflected by the significantly higher plasma levels of IL-6 and IL-10.
Concomitant induction of moderate hypothermia (27-28:C), however, drastically reduced
cytokine production, suggesting that hypothermia was able to, at least in part, suppress the
dextrose-mediated pro-inflammatory effects (Figures 25-28, pp.70-73). In spite of our high
hope, dextrose infusion in combination with cefotaxime and induced hypothermia initiated
at T6 did not improve survival of the CLP mice (Figure 24, p.69), implying that
90
administration of glucose, at least starting from the chosen time point of T6, could not
rescue the septic mice.
Similar to our findings, 5% dextrose resuscitation in a less acute CLP model did not
improve survival of the septic rats. Rather, dextrose infusion caused a decrease in
membrane potential difference as a result of a significant shift of sodium ions into the cells,
giving rise to accumulation of intracellular sodium and reduced extracellular water
(Hannon and Boston, 1990). Therefore, with these negative results obtained from
preliminary animal studies, the therapeutic value of dextrose-saline in treating sepsis
requires further investigation.
4.5 Limitation of Our Model System
In spite of being a clinically relevant model of sepsis, there were also caveats
associated with our CLP model. These included:
1) Variation in bacterial leakage into the peritoneal cavity and therefore in the actual
bacterial inoculum;
2) Variation in the animal’s ability to contain the peritoneal infection, and therefore,
controlling the onset of a systemic immune response;
3) Because only 1mL of blood could be extracted from each mouse, continuous
monitoring of each animal’s plasma cytokine expression over time was impossible.
To circumvent this, multiple mice were sacrificed at each designated time point and
91
compared to cohorts sacrificed at other time points to draw conclusions with
regards to cytokine expression patterns;
4) During induction of hypothermia, the animals were not sedated. Therefore,
bioenergetic consumption as a result of hypothermia-induced behavioural
responses was a possible confounding factor in our study. The extent of this
influence on our assessment of induced hypothermia in sepsis was, however, not
assessed.
4.6 Future Directions
We have demonstrated that the anti-inflammatory effects of induced hypothermia
in our CLP model by exogenous cooling can be used to correct or reduce the exaggerated
inflammatory response that results from a polymicrobial infection. However, side-effects
associated with induction of hypothermia, such as coagulopathy, may be
counterproductive and compromise the animal’s survival. Thus, incorporation of anti-
coagulant therapies, such as APC, into the current treatment regimen may provide better
survival outcomes. In addition, providing sedation to the experimental animals during
induction of hypothermia may control their neuromuscular response to external cooling,
thereby reducing the energy expenditure. Whether we can optimize the benefit of induced
hypothermia by incorporating these additional measures into our current experimental
design remains to be determined in future work. Clearly, a combination of treatment
strategies is required to improve survival outcomes in the CLP mouse model. Once
optimized and approved, these approaches may be applied to treat human sepsis.

92
5 Conclusion
The effect of various degrees of induced hypothermia has been assessed in a
clinically applicable model of acute sepsis induced by cecal ligation and perforation. While
deep hypothermia has shown to be effective in attenuating the inflammatory process and
sustaining such effect, moderate hypothermia does not confer such benefit, suggesting
that an adequate amount of cooling is required for downregulating the amplified
inflammatory response associated with sepsis. This cold-mediated immunosuppression
may, in turn, offer a longer window of opportunity for therapeutic interventions. However,
secondary side effects associated with induced hypothermia-rewarming must be
minimized in order to achieve optimal results. In short, induced hypothermia may
represent a promising therapeutic approach for patients presenting with sepsis but only if
applied conjointly with other treatment strategies, the combination of which will be a
target of future research.
93
6 References
Abraham, E., K. Reinhart, S. Opal, I. Demeyer, C. Doig, A.L. Rodriguez, R. Beale, P. Svoboda,
P.F. Laterre, S. Simon, B. Light, H. Spapen, J. Stone, A. Seibert, C. Peckelsen, C. De Deyne, R.
Postier, V. Pettila, A. Artigas, S.R. Percell, V. Shu, C. Zwingelstein, J. Tobias, L. Poole, J.C.
Stolzenbach, A.A. Creasey, and OPTIMIST Trial Study Group. 2003. Efficacy and safety of
tifacogin (recombinant tissue factor pathway inhibitor) in severe sepsis: a randomized
controlled trial. JAMA. 290:238-247.
Aderem, A., and R.J. Ulevitch. 2000. Toll-like receptors in the induction of the innate
immune response. Nature. 406:782-787.
Aibiki, M., S. Maekawa, T. Nishiyama, K. Seki, and S. Yokono. 1999. Activated cytokine production in patients with accidental hypothermia. Resuscitation. 41:263-268.
Alberti, C., C. Brun-Buisson, H. Burchardi, C. Martin, S. Goodman, A. Artigas, A. Sicignano, M. Palazzo, R. Moreno, R. Boulme, E. Lepage, and R. Le Gall. 2002. Epidemiology of sepsis and infection in ICU patients from an international multicentre cohort study. Intensive Care Med. 28:108-121.
Amaral, A., S.M. Opal, and J.L. Vincent. 2004. Coagulation in sepsis. Intensive Care Med. 30:1032-1040.
Angstwurm, M.W., J. Schottdorf, J. Schopohl, and R. Gaertner. 1999. Selenium replacement
in patients with severe systemic inflammatory response syndrome improves clinical
outcome. Crit.Care Med. 27:1807-1813.
Angus, D.C., W.T. Linde-Zwirble, J. Lidicker, G. Clermont, J. Carcillo, and M.R. Pinsky. 2001.
Epidemiology of severe sepsis in the United States: analysis of incidence, outcome, and
associated costs of care. Crit.Care Med. 29:1303-1310.
Bennett, I.L., M. Finland, M. Hamburger, E.H. Kass, M. Lepper, B.A. Waisbren. 1963. The
effectiveness of hydrocortisone in the management of severe infections. JAMA. 183:462-
465.
Berg-Johnsen, J., and I.A. Langmoen. 1990. Mechanisms concerned in the direct effect of isoflurane on rat hippocampal and human neocortical neurons. Brain Res. 507:28-34.
Bernard, G.R., E.W. Ely, T.J. Wright, J. Fraiz, J.E. Stasek Jr, J.A. Russell, I. Mayers, B.A.
Rosenfeld, P.E. Morris, S.B. Yan, and J.D. Helterbrand. 2001. Safety and dose relationship of
94
recombinant human activated protein C for coagulopathy in severe sepsis. Crit.Care Med.
29:2051-2059.
Bernard, G.R., J.L. Vincent, P.F. Laterre, S.P. LaRosa, J.F. Dhainaut, A. Lopez-Rodriguez, J.S.
Steingrub, G.E. Garber, J.D. Helterbrand, E.W. Ely, C.J. Fisher Jr, and Recombinant human
protein C Worldwide Evaluation in Severe Sepsis (PROWESS) study group. 2001. Efficacy
and safety of recombinant human activated protein C for severe sepsis. N.Engl.J.Med.
344:699-709.
Bernard, S.A., and M. Buist. 2003. Induced hypothermia in critical care medicine: a review.
Crit.Care Med. 31:2041-2051.
Bernard, S.A., T.W. Gray, M.D. Buist, B.M. Jones, W. Silvester, G. Gutteridge, and K. Smith.
2002. Treatment of comatose survivors of out-of-hospital cardiac arrest with induced
hypothermia. N.Engl.J.Med. 346:557-563.
Bernard, S.A., B.M. Jones, and M.K. Horne. 1997. Clinical trial of induced hypothermia in
comatose survivors of out-of-hospital cardiac arrest. Ann.Emerg.Med. 30:146-153.
Biggar, W.D., D.J. Bohn, G. Kent, C. Barker, and G. Hamilton. 1984. Neutrophil migration in
vitro and in vivo during hypothermia. Infect.Immun. 46:857-859.
Blair, E., R.W. Buxton, R.A. Cowley, and A.R. Mansberger Jr. 1961. The use of hypothermia in septic shock. JAMA. 178:916-919.
Blajchman, M.A., R.C. Austin, F. Fernandez-Rachubinski, and W.P. Sheffield. 1992.
Molecular basis of inherited human antithrombin deficiency. Blood. 80:2159-2171.
Bone, R.C., R.A. Balk, F.B. Cerra, R.P. Dellinger, A.M. Fein, W.A. Knaus, R.M. Schein, and W.J.
Sibbald. 1992. Definitions for sepsis and organ failure and guidelines for the use of
innovative therapies in sepsis. The ACCP/SCCM Consensus Conference Committee.
American College of Chest Physicians/Society of Critical Care Medicine. Chest. 101:1644-
1655.
Brancaccio, G., E. Villa, E. Girolami, G. Michielon, C. Feltri, E. Mazzera, D. Costa, G. Isacchi, E. Iannace, A. Amodeo, and R.M. Di Donato. 2005. Inflammatory cytokines in pediatric cardiac surgery and variable effect of the hemofiltration process. Perfusion. 20:263-268.
Brauner, J.S., L.E. Rohde, and N. Clausell. 2000. Circulating endothelin-1 and tumor necrosis
factor-alpha: early predictors of mortality in patients with septic shock. Intensive Care Med.
26:305-313.
95
Brealey, D., M. Brand, I. Hargreaves, S. Heales, J. Land, R. Smolenski, N.A. Davies, C.E.
Cooper, and M. Singer. 2002. Association between mitochondrial dysfunction and severity
and outcome of septic shock. Lancet. 360:219-223.
Buras, J.A., B. Holzmann, and M. Sitkovsky. 2005. Animal models of sepsis: setting the
stage. Nat.Rev.Drug Discov. 4:854-865.
“Cefotaxime.” Drugbank. 12 Mar 2011 <http://www.drugbank.ca/drugs/DB00493>.
Cohen, J. 2002. The immunopathogenesis of sepsis. Nature. 420:885-891.
Conway, E.M., and R.D. Rosenberg. 1988. Tumor necrosis factor suppresses transcription of
the thrombomodulin gene in endothelial cells. Mol.Cell.Biol. 8:5588-5592.
Creasey, A.A., A.C. Chang, L. Feigen, T.C. Wun, F.B. Taylor Jr, and L.B. Hinshaw. 1993. Tissue
factor pathway inhibitor reduces mortality from Escherichia coli septic shock. J.Clin.Invest.
91:2850-2860.
Cross, A.S., S.M. Opal, J.C. Sadoff, and P. Gemski. 1993. Choice of bacteria in animal models
of sepsis. Infect.Immun. 61:2741-2747.
Deitch, E.A. 1998. Animal models of sepsis and shock: a review and lessons learned. Shock.
9:1-11.
Deitch, E.A. 1992. Multiple organ failure. Pathophysiology and potential future therapy.
Ann.Surg. 216:117-134.
Dhainaut, J.F., J.J. Lanore, J.M. de Gournay, M.F. Huyghebaert, F. Brunet, D. Villemant, and
J.F. Monsallier. 1988. Right ventricular dysfunction in patients with septic shock. Intensive
Care Med. 14 Suppl 2:488-491.
Dhainaut, J.F., N. Marin, A. Mignon, and C. Vinsonneau. 2001. Hepatic response to sepsis:
interaction between coagulation and inflammatory processes. Crit.Care Med. 29:S42-7.
Ebong, S., D. Call, J. Nemzek, G. Bolgos, D. Newcomb, and D. Remick. 1999. Immunopathologic alterations in murine models of sepsis of increasing severity. Infect.Immun. 67:6603-6610.
Esmon, C.T. 1989. The roles of protein C and thrombomodulin in the regulation of blood
coagulation. J.Biol.Chem. 264:4743-4746.
96
Esmon, C.T. 2001. Protein C anticoagulant pathway and its role in controlling microvascular
thrombosis and inflammation. Crit.Care Med. 29:S48-51; discussion 51-2.
Fein, A.M., M. Lippmann, H. Holtzman, A. Eliraz, and S.K. Goldberg. 1983. The risk factors,
incidence, and prognosis of ARDS following septicemia. Chest. 83:40-42.
Fernandes, C.J.,Jr, N. Akamine, and E. Knobel. 1999. Cardiac troponin: a new serum marker
of myocardial injury in sepsis. Intensive Care Med. 25:1165-1168.
Fink, M.P., and S.O. Heard. 1990. Laboratory models of sepsis and septic shock. J.Surg.Res.
49:186-196.
Fisher, C.J.,Jr, J.F. Dhainaut, S.M. Opal, J.P. Pribble, R.A. Balk, G.J. Slotman, T.J. Iberti, E.C.
Rackow, M.J. Shapiro, and R.L. Greenman. 1994. Recombinant human interleukin 1
receptor antagonist in the treatment of patients with sepsis syndrome. Results from a
randomized, double-blind, placebo-controlled trial. Phase III rhIL-1ra Sepsis Syndrome
Study Group. JAMA. 271:1836-1843.
Franson, T.R., W.J. Hierholzer Jr, and D.R. LaBrecque. 1985. Frequency and characteristics
of hyperbilirubinemia associated with bacteremia. Rev.Infect.Dis. 7:1-9.
Fujimoto, K., M. Fujita, R. Tsuruta, R. Tanaka, H. Shinagawa, T. Izumi, S. Kasaoka, and T.
Maekawa. 2008. Early induction of moderate hypothermia suppresses systemic
inflammatory cytokines and intracellular adhesion molecule-1 in rats with caerulein-
induced pancreatitis and endotoxemia. Pancreas. 37:176-181.
Fung-Tomc, J., E. Huczko, M. Pearce, and R.E. Kessler. 1988. Frequency of in vitro resistance
of Pseudomonas aeruginosa to cefepime, ceftazidime, and cefotaxime. Antimicrob.Agents
Chemother. 32:1443-1445.
Gando, S., T. Kameue, S. Nanzaki, and Y. Nakanishi. 1995. Cytokines, soluble
thrombomodulin and disseminated intravascular coagulation in patients with systemic
inflammatory response syndrome. Thromb.Res. 80:519-526.
Greaves, M.W. 1976. Anti-inflammatory action of corticosteroids. Postgrad.Med.J. 52:631-
633.
Hannon, R.J., and V.E. Boston. 1990. Hyponatraemia and intracellular water in sepsis: an experimental comparison of the effect of fluid replacement with either 0.9% saline or 5% dextrose. J.Pediatr.Surg. 25:422-425.

97
Hildebrand, F., M. van Griensven, P. Giannoudis, A. Luerig, P. Harwood, O. Harms, M. Fehr, C. Krettek, and H.C. Pape. 2005. Effects of hypothermia and re-warming on the inflammatory response in a murine multiple hit model of trauma. Cytokine. 31:382-393.
Hotchkiss, R.S., and D.W. Nicholson. 2006. Apoptosis and caspases regulate death and
inflammation in sepsis. Nat.Rev.Immunol. 6:813-822.
Huet, O., B. Kinirons, L. Dupic, E. Lajeunie, J.X. Mazoit, D. Benhamou, E. Vicaut, and J.
Duranteau. 2007. Induced mild hypothermia reduces mortality during acute inflammation
in rats. Acta Anaesthesiol.Scand. 51:1211-1216.
Iggo, A. 1969. Cutaneous thermoreceptors in primates and sub-primates. J.Physiol.
200:403-430.
“Isoflurane.” Drugbank. 12 Mar 2011 <http://www.drugbank.ca/drugs/DB00753>.
Jackson, A.C., J.J. Gilbert, G.B. Young, and C.F. Bolton. 1985. The encephalopathy of sepsis.
Can.J.Neurol.Sci. 12:303-307.
Kagansky, N., S. Levy, E. Rimon, L. Cojocaru, A. Fridman, Z. Ozer, and H. Knobler. 2003. Hypoglycemia as a predictor of mortality in hospitalized elderly patients. Arch.Intern.Med. 163:1825-1829.
Karima, R., S. Matsumoto, H. Higashi, and K. Matsushima. 1999. The molecular pathogenesis of endotoxic shock and organ failure. Mol.Med.Today. 5:123-132.
Katz, S., M.A. Jimenez, W.E. Lehmkuhler, and J.L. Grosfeld. 1991. Liver bacterial clearance
following hepatic artery ligation and portacaval shunt. J.Surg.Res. 51:267-270.
Kheirbek, T., A.R. Kochanek, and H.B. Alam. 2009. Hypothermia in bleeding trauma: a friend or a foe? Scand.J.Trauma.Resusc.Emerg.Med. 17:65.
Khurshid F., K.-S. Lee, P. McNamara, H. Whyte, and W. Mak. 2011. Lessons learned during
implementation of therapeutic hypothermia for neonatal hypoxic ischemic encephalopathy
in a regional transport program in Ontario. J.Can.Ped.Soc. 16(3):153-156.
Kisiel, W. 1979. Human plasma protein C: isolation, characterization, and mechanism of
activation by alpha-thrombin. J.Clin.Invest. 64:761-769.
Kolls, J.K., P.B. McCray Jr, and Y.R. Chan. 2008. Cytokine-mediated regulation of antimicrobial proteins. Nat.Rev.Immunol. 8:829-835.

98
Larson, W.P., R.N. Bieter, M. Levine, and W.F. McLimans. 1939. Temperature reactions in
mice infected with pneumococci. Proc. Soc. Exp. Biol. Med. 42:649-651.
Lazosky, A., G.B. Young, S. Zirul, and R. Phillips. 2010. Quality of life after septic illness.
J.Crit.Care. 25:406-412.
Lefering, R., and E.A. Neugebauer. 1995. Steroid controversy in sepsis and septic shock: a
meta-analysis. Crit.Care Med. 23:1294-1303.
Levy , R.J., D.A. Piel, P.D. Acton, R. Zhou, V.A. Ferrari, J.S. Karp, and C.S. Deutschman. 2005.
Evidence of myocardial hibernation in the septic subject. Crit. Care Med. 33:2752-6.
L'Her, E., A. Amerand, A. Vettier, and P. Sebert. 2006. Effects of mild induced hypothermia
during experimental sepsis. Crit.Care Med. 34:2621-2623.
Lin, E., S.E. Calvano, and S.F. Lowry. 2000. Inflammatory cytokines and cell response in
surgery. Surgery. 127:117-126.
Lindenblatt, N., M.D. Menger, E. Klar, and B. Vollmar. 2006. Systemic hypothermia
increases PAI-1 expression and accelerates microvascular thrombus formation in
endotoxemic mice. Crit.Care. 10:R148.
Liu, A.Y.-C., H. Bian, L.E. Huang, and Y.K. Lee. 1994. Transient cold shock induces the heat
shock response upon recovery at 37°C in human cells. J. Bio. Chm. 269(20):14768-14775.
Lotze, M.T., and K.J. Tracey. 2005. High-mobility group box 1 protein (HMGB1): nuclear
weapon in the immune arsenal. Nat.Rev.Immunol. 5:331-342.
Lucas, S. 2007. Mini-symposium: the autopsy in sudden unexpected adult death – the
autopsy pathology of sepsis-related death. Curr. Diag. Path. 13:375-388
Lydyard P., A. Whelan, and M. Fanger. “Cells and Molecules of the Innate Immune System.”
Instant Note in Immunology. 2nd Ed. Taylor & Francis Group, 2009. 15-40.
Maclean, D., and M.C. Browning. 1974. Plasma 11-hydroxycorticosteroid concentrations
and prognosis in accidental hypothermia. Resuscitation. 3:249-256.
Majumdar, A. 2010. Sepsis-induced acute kidney injury. Indian.J.Crit.Care.Med. 14:14-21.
Mant, A.K. 1969. Autopsy diagnosis of accidental hypothermia. J.Forensic Med. 16:126-129.
Martin, G.S., D.M. Mannino, S. Eaton, and M. Moss. 2003. The epidemiology of sepsis in the
United States from 1979 through 2000. N.Engl.J.Med. 348:1546-1554.
99
Mathison, J.C., and R.J. Ulevitch. 1979. The clearance, tissue distribution, and cellular
localization of intravenously injected lipopolysaccharide in rabbits. J.Immunol. 123:2133-
2143.
McCullough, L., and S. Arora. 2004. Diagnosis and treatment of hypothermia.
Am.Fam.Physician. 70:2325-2332.
McIntyre, L.A., D.A. Fergusson, P.C. Hebert, D. Moher, and J.S. Hutchison. 2003. Prolonged therapeutic hypothermia after traumatic brain injury in adults: a systematic review. JAMA. 289:2992-2999.
Meduri, G.U., E.A. Tolley, G.P. Chrousos, and F. Stentz. 2002. Prolonged
methylprednisolone treatment suppresses systemic inflammation in patients with
unresolving acute respiratory distress syndrome: evidence for inadequate endogenous
glucocorticoid secretion and inflammation-induced immune cell resistance to
glucocorticoids. Am.J.Respir.Crit.Care Med. 165:983-991.
Merx, M.W., and C. Weber. 2007. Sepsis and the heart. Circulation. 116:793-802.
Minneci, P.C., K.J. Deans, S.M. Banks, P.Q. Eichacker, and C. Natanson. 2004. Meta-analysis:
the effect of steroids on survival and shock during sepsis depends on the dose.
Ann.Intern.Med. 141:47-56.
Moore, K.L., S.P. Andreoli, N.L. Esmon, C.T. Esmon, and N.U. Bang. 1987. Endotoxin
enhances tissue factor and suppresses thrombomodulin expression of human vascular
endothelium in vitro. J.Clin.Invest. 79:124-130.
Moseley, R.H. 1999. Sepsis and cholestasis. Clin.Liver Dis. 3:465-475.
Mosesson, M.W. 1992. The roles of fibrinogen and fibrin in hemostasis and thrombosis.
Semin.Hematol. 29:177-188.
Mozo, L., A. Suarez, and C. Gutierrez. 2004. Glucocorticoids up-regulate constitutive interleukin-10 production by human monocytes. Clin.Exp.Allergy. 34:406-412.
Nagao, K., N. Hayashi, K. Kanmatsuse, K. Arima, J. Ohtsuki, K. Kikushima, and I. Watanabe.
2000. Cardiopulmonary cerebral resuscitation using emergency cardiopulmonary bypass,
coronary reperfusion therapy and mild hypothermia in patients with cardiac arrest outside
the hospital. J.Am.Coll.Cardiol. 36:776-783.
100
Natanson, C., M.P. Fink, H.K. Ballantyne, T.J. MacVittie, J.J. Conklin, and J.E. Parrillo. 1986.
Gram-negative bacteremia produces both severe systolic and diastolic cardiac dysfunction
in a canine model that simulates human septic shock. J.Clin.Invest. 78:259-270.
Netea, M.G., J.W. van der Meer, M. van Deuren, and B.J. Kullberg. 2003. Proinflammatory
cytokines and sepsis syndrome: not enough, or too much of a good thing? Trends Immunol.
24:254-258.
Nolan, J.P., P.T. Morley, T.L. Hoek, R.W. Hickey, and Advancement Life support Task Force
of the International Liaison committee on Resuscitation. 2003. Therapeutic hypothermia
after cardiac arrest. An advisory statement by the Advancement Life support Task Force of
the International Liaison committee on Resuscitation. Resuscitation. 57:231-235.
Ohlsson, K., P. Bjork, M. Bergenfeldt, R. Hageman, and R.C. Thompson. 1990. Interleukin-1
receptor antagonist reduces mortality from endotoxin shock. Nature. 348:550-552.
Opal, S.M. 2000. Therapeutic rationale for antithrombin III in sepsis. Crit.Care Med. 28:S34-
7.
Opal, S.M., J.E. Palardy, N.A. Parejo, and A.A. Creasey. 2001. The activity of tissue factor
pathway inhibitor in experimental models of superantigen-induced shock and
polymicrobial intra-abdominal sepsis. Crit.Care Med. 29:13-17.
Oppert, M., C. Engel, F.M. Brunkhorst, H. Bogatsch, K. Reinhart, U. Frei, K.U. Eckardt, M.
Loeffler, S. John, and German Competence Network Sepsis (Sepnet). 2008. Acute renal
failure in patients with severe sepsis and septic shock--a significant independent risk factor
for mortality: results from the German Prevalence Study. Nephrol.Dial.Transplant. 23:904-
909.
O'Reilly, M., D.E. Newcomb, and D. Remick. 1999. Endotoxin, sepsis, and the primrose path.
Shock. 12:411-420.
Ostberg, J.R., S.L. Taylor, H. Baumann, and E.A. Repasky. 2000. Regulatory effects of fever-
range whole-body hyperthermia on the LPS-induced acute inflammatory response.
J.Leukoc.Biol. 68:815-820.
Parker, M.M., K.E. McCarthy, F.P. Ognibene, and J.E. Parrillo. 1990. Right ventricular
dysfunction and dilatation, similar to left ventricular changes, characterize the cardiac
depression of septic shock in humans. Chest. 97:126-131.

101
Parrillo, J.E., M.M. Parker, C. Natanson, A.F. Suffredini, R.L. Danner, R.E. Cunnion, and F.P.
Ognibene. 1990. Septic shock in humans. Advances in the understanding of pathogenesis,
cardiovascular dysfunction, and therapy. Ann.Intern.Med. 113:227-242.
Pizzo, S.V., M.L. Schwartz, R.L. Hill, and P.A. McKee. 1973. The effect of plasmin on the
subunit structure of human fibrin. J.Biol.Chem. 248:4574-4583.
Pozos, R.S., and D.F. Danzl. “Human Physiological Responses to Cold Stress and
Hypothermia.” Medical Aspects of Harsh Environments, Volume 1. K.B. Pandoff and R.E.
Burr. Office of the Surgeon General, U.S. Army, 2002. 351-382
Privalle, C., T. Talarico, T. Keng, and J. DeAngelo. 2000. Pyridoxalated hemoglobin
polyoxyethylene: a nitric oxide scavenger with antioxidant activity for the treatment of
nitric oxide-induced shock. Free Radic.Biol.Med. 28:1507-1517.
Rattarasarn, C. 1997. Hypoglycemia in sepsis: risk factors and clinical characteristics. J.Med.Assoc.Thai. 80:760-766.
Reinhart, K., and W. Karzai. 2001. Anti-tumor necrosis factor therapy in sepsis: update on
clinical trials and lessons learned. Crit.Care Med. 29:S121-5.
Remick, D.G., G.R. Bolgos, J. Siddiqui, J. Shin, and J.A. Nemzek. 2002. Six at six: interleukin-6
measured 6 h after the initiation of sepsis predicts mortality over 3 days. Shock. 17:463-
467.
Remick, D.G., and H. Xioa. 2006. Hypothermia and sepsis. Front.Biosci. 11:1006-1013.
Rice, T.W., and G.R. Bernard. 2005. Therapeutic intervention and targets for sepsis.
Annu.Rev.Med. 56:225-248.
Riedemann, N.C., and P.A. Ward. 2003. Anti-inflammatory strategies for the treatment of
sepsis. Expert Opin.Biol.Ther. 3:339-350.
Rittirsch, D., L.M. Hoesel, and P.A. Ward. 2007. The disconnect between animal models of
sepsis and human sepsis. J.Leukoc.Biol. 81:137-143.
Rittirsch, D., M.S. Huber-Lang, M.A. Flierl, and P.A. Ward. 2009. Immunodesign of
experimental sepsis by cecal ligation and puncture. Nat.Protoc. 4:31-36.
Rodbard, D., H. Wachslicht-Rodbard, and S. Rodbard. 1980. Temperature: a critical factor
determining localization and natural history of infectious, metabolic, and immunological
diseases. Perspect.Biol.Med. 23:439-474.
102
Rosomoff, H.L., and D.A. Holaday. 1954. Cerebral blood flow and cerebral oxygen
consumption during hypothermia. Am.J.Physiol. 179:85-88.
Saito, H., E.R. Sherwood, T.K. Varma, and B.M. Evers. 2003. Effects of aging on mortality, hypothermia, and cytokine induction in mice with endotoxemia or sepsis. Mech.Ageing Dev. 124:1047-1058.
Sakata, Y., D.J. Loskutoff, C.L. Gladson, C.M. Hekman, and J.H. Griffin. 1986. Mechanism of
protein C-dependent clot lysis: role of plasminogen activator inhibitor. Blood. 68:1218-
1223.
Schrier, R.W., and W. Wang. 2004. Acute renal failure and sepsis. N.Engl.J.Med. 351:159-
169.
Schwartz, M.L., S.V. Pizzo, R.L. Hill, and P.A. McKee. 1971. The subunit structures of human
plasma and platelet factor XIII (fibrin-stabilizing factor). J.Biol.Chem. 246:5851-5854.
“Septic Shock.” The Surviving Sepsis Campaign. 2011. 20 Apr 2011
<http://www.survivingsepsis.org/Introduction/Pages/default.aspx#whatissepsis>.
Shang, S., G. Chen, Y. Wu, L. DU, and Z. Zhao. 2005. Rapid diagnosis of bacterial sepsis with
PCR amplification and microarray hybridization in 16S rRNA gene. Pediatr.Res. 58:143-148.
Shimaoka, M., and E.J. Park. 2008. Advances in understanding sepsis.
Eur.J.Anaesthesiol.Suppl. 42:146-153.
Singleton, K.D., and P.E. Wischmeyer. 2003. Distance of cecum ligated influences mortality,
tumor necrosis factor-alpha and interleukin-6 expression following cecal ligation and
puncture in the rat. Eur.Surg.Res. 35:486-491.
Slade, E., P.S. Tamber, and J.L. Vincent. 2003. The Surviving Sepsis Campaign: raising
awareness to reduce mortality. Crit.Care. 7:1-2.
Song, Y. 2004. “Rodent Model to Study Severe Sepsis.” (Master’s dissertation) University of
Ottawa, Ottawa, ON.
Song, Y. 2009, February 18. “Rodent Model to Study Severe Sepsis.” Seminar presented in
Room 2154, Roger Guidon Hall, University of Ottawa, Ottawa, ON.
Spies, C.D., K. Reinhart, I. Witt, A. Meier-Hellmann, L. Hannemann, D.L. Bredle, and W.
Schaffartzik. 1994. Influence of N-acetylcysteine on indirect indicators of tissue
103
oxygenation in septic shock patients: results from a prospective, randomized, double-blind
study. Crit.Care Med. 22:1738-1746.
Stewart, C.R., J.P. Landseadel, M.J. Gurka, and K.D. Fairchild. 2010. Hypothermia increases
interleukin-6 and interleukin-10 in juvenile endotoxemic mice. Pediatr.Crit.Care.Med.
11:109-116.
Stocchetti, N. 2005. Brain and sepsis: functional impairment, structural damage, and markers. Anesth.Analg. 101:1463-1464.
Suter, P.M. 2006. Lung Inflammation in ARDS--friend or foe? N.Engl.J.Med. 354:1739-1742.
Swirski, F.K., M. Nahrendorf, M. Etzrodt, M. Wildgruber, V. Cortez-Retamozo, P. Panizzi, J.L. Figueiredo, R.H. Kohler, A. Chudnovskiy, P. Waterman, E. Aikawa, T.R. Mempel, P. Libby, R. Weissleder, and M.J. Pittet. 2009. Identification of splenic reservoir monocytes and their deployment to inflammatory sites. Science. 325:612-616.
Szabo, G., L. Romics Jr, and G. Frendl. 2002. Liver in sepsis and systemic inflammatory
response syndrome. Clin.Liver Dis. 6:1045-66, x.
Taniguchi, T., H. Kanakura, Y. Takemoto, and K. Yamamoto. 2003. Effects of hypothermia
on mortality and inflammatory responses to endotoxin-induced shock in rats.
Clin.Diagn.Lab.Immunol. 10:940-943.
Therminarias, A., and E. Pellerei. 1987. Plasma catecholamine and metabolic changes
during cooling and rewarming in dogs. Exp.Biol. 47:117-123.
Thijs, A., and L.G. Thijs. 1998. Pathogenesis of renal failure in sepsis. Kidney Int.Suppl.
66:S34-7.
Todoroki, H., S. Nakamura, A. Higure, K. Okamoto, S. Takeda, N. Nagata, H. Itoh, and K.
Ohsato. 2000. Neutrophils express tissue factor in a monkey model of sepsis. Surgery.
127:209-216.
Tracey, K.J., B. Beutler, S.F. Lowry, J. Merryweather, S. Wolpe, I.W. Milsark, R.J. Hariri, T.J.
Fahey 3rd, A. Zentella, and J.D. Albert. 1986. Shock and tissue injury induced by
recombinant human cachectin. Science. 234:470-474.
Tracey, K.J., Y. Fong, D.G. Hesse, K.R. Manogue, A.T. Lee, G.C. Kuo, S.F. Lowry, and A.
Cerami. 1987. Anti-cachectin/TNF monoclonal antibodies prevent septic shock during lethal
bacteraemia. Nature. 330:662-664.

104
Tripathi, P. and A. Aggarwal. 2006. NF-ĸB transcription factor: a key player in the
generation of immune response. Curr. Sci. 90(4):519-531.
Ulloa, L., M. Ochani, H. Yang, M. Tanovic, D. Halperin, R. Yang, C.J. Czura, M.P. Fink, and K.J.
Tracey. 2002. Ethyl pyruvate prevents lethality in mice with established lethal sepsis and
systemic inflammation. Proc.Natl.Acad.Sci.U.S.A. 99:12351-12356.
Underhill, D.M., and A. Ozinsky. 2002. Phagocytosis of microbes: complexity in action.
Annu. Rev. Immunol. 20:825-52.
Vaagenes, P., Y. Gundersen, and P.K. Opstad. 2003. Rapid rewarming after mild hypothermia accentuates the inflammatory response after acute volume controlled haemorrhage in spontaneously breathing rats. Resuscitation. 58:103-112.
van 't Veer, C., and K.G. Mann. 1997. Regulation of tissue factor initiated thrombin
generation by the stoichiometric inhibitors tissue factor pathway inhibitor, antithrombin-
III, and heparin cofactor-II. J.Biol.Chem. 272:4367-4377.
Wang, H., H. Yang, C.J. Czura, A.E. Sama, and K.J. Tracey. 2001. HMGB1 as a late mediator of lethal systemic inflammation. Am.J.Respir.Crit.Care Med. 164:1768-1773.
Ware, L.B., and M.A. Matthay. 2000. The acute respiratory distress syndrome.
N.Engl.J.Med. 342:1334-1349.
Warren, B.L., A. Eid, P. Singer, S.S. Pillay, P. Carl, I. Novak, P. Chalupa, A. Atherstone, I. Penzes, A. Kubler, S. Knaub, H.O. Keinecke, H. Heinrichs, F. Schindel, M. Juers, R.C. Bone, S.M. Opal, and KyberSept Trial Study Group. 2001. Caring for the critically ill patient. High-dose antithrombin III in severe sepsis: a randomized controlled trial. JAMA. 286:1869-1878.
Weitz, J.I., R.J. Stewart, and J.C. Fredenburgh. 1999. Mechanism of action of plasminogen
activators. Thromb.Haemost. 82:974-982.
West, A.P., I.E. Brodsky, C. Rahner, D.K. Woo, H. Erdjument-Bromage, P.Tempst, M.C.
Wash, Y. Choi, G.S. Shadel, and S. Ghosh. 2011. TLR signalling augments macrophage
bactericidal activity through mitochondrial ROS. Nature. 472:476-480.
Wichterman, K.A., A.E. Baue, and I.H. Chaudry. 1980. Sepsis and septic shock--a review of
laboratory models and a proposal. J.Surg.Res. 29:189-201.
Wilson, J.X., and G.B. Young. 2003. Progress in clinical neurosciences: sepsis-associated
encephalopathy: evolving concepts. Can.J.Neurol.Sci. 30:98-105.
105
Wright, S.D., R.A. Ramos, P.S. Tobias, R.J. Ulevitch, and J.C. Mathison. 1990. CD14, a
receptor for complexes of lipopolysaccharide (LPS) and LPS binding protein. Science.
249:1431-1433.
Yanagawa, Y., S. Ishihara, H. Norio, M. Takino, M. Kawakami, A. Takasu, K. Okamoto, N.
Kaneko, C. Terai, and Y. Okada. 1998. Preliminary clinical outcome study of mild
resuscitative hypothermia after out-of-hospital cardiopulmonary arrest. Resuscitation.
39:61-66.
Yang, H., M. Ochani, J. Li, X. Qiang, M. Tanovic, H.E. Harris, S.M. Susarla, L. Ulloa, H. Wang,
R. DiRaimo, C.J. Czura, H. Wang, J. Roth, H.S. Warren, M.P. Fink, M.J. Fenton, U. Andersson,
and K.J. Tracey. 2004. Reversing established sepsis with antagonists of endogenous high-
mobility group box 1. Proc.Natl.Acad.Sci.U.S.A. 101:296-301.
Zanetti, G., D. Heumann, J. Gerain, J. Kohler, P. Abbet, C. Barras, R. Lucas, M.P. Glauser, and
J.D. Baumgartner. 1992. Cytokine production after intravenous or peritoneal gram-negative
bacterial challenge in mice. Comparative protective efficacy of antibodies to tumor necrosis
factor-alpha and to lipopolysaccharide. J.Immunol. 148:1890-1897.
Zeiner, A., M. Holzer, F. Sterz, W. Behringer, W. Schorkhuber, M. Mullner, M. Frass, P.
Siostrzonek, K. Ratheiser, A. Kaff, and A.N. Laggner. 2000. Mild resuscitative hypothermia
to improve neurological outcome after cardiac arrest. A clinical feasibility trial.
Hypothermia After Cardiac Arrest (HACA) Study Group. Stroke. 31:86-94.