assessment of the implementation of river informations services … · services (vts) centres are...
TRANSCRIPT
SPIN-TN Strategies to Promote Inland Navigation
Page 1 of 48 G:\PROJEKTE\SPIN\Working Groups (WG)\WG2
Systems & Technologies\Cost-Benefit Analysis RIS\Report\WG2 RIS CBA 0.7.doc
ASSESSMENT OF THE IMPLEMENTATION OF RIVER INFORMATIONS SERVICES
IN EUROPE
Working Paper
Project acronym SPIN–TN
Project full title European Strategies to Promote Inland Navigation
Work Package/Working Group WG2 Systems & Technologies
Author via donau / Dr. Gert-Jan Muilerman
Document version 0.7
Date 31/01/2006
SPIN-TN Strategies to Promote Inland Navigation
Page 2 of 48 G:\PROJEKTE\SPIN\Working Groups (WG)\WG2
Systems & Technologies\Cost-Benefit Analysis RIS\Report\WG2 RIS CBA 0.7.doc
CONTENTS
1 The development of RIS in Europe ..........................................................................5
1.1 Introduction.............................................................................................................5 1.1.1 The history of River Information Services (RIS)............................................................................... 5 1.1.2 European initiatives towards the development and implementation of RIS ..................................... 5
1.2 Overview of RIS-Services .......................................................................................6 1.2.1 Fairway Information Service (FIS) ................................................................................................... 6 1.2.2 Traffic information ............................................................................................................................ 7 1.2.3 Traffic management......................................................................................................................... 7 1.2.4 Calamity abatement support............................................................................................................ 8 1.2.5 Information for transport logistics..................................................................................................... 8 1.2.6 Information for law enforcement ...................................................................................................... 9 1.2.7 Statistics .......................................................................................................................................... 9 1.2.8 Waterway charges and harbour dues .............................................................................................. 9
1.3 RIS technologies.....................................................................................................9
1.4 The need for an analysis of costs and benefits of RIS...........................................10
1.5 The CBA methodology..........................................................................................11
1.6 Outlook .................................................................................................................12
2 Assessment of RIS implementation in Europe......................................................13
2.1 Introduction...........................................................................................................13
2.2 Main benefits of RIS implementation.....................................................................13 2.2.1 Improved vessel utilisation............................................................................................................. 13 2.2.2 Homogeneous cruising speeds...................................................................................................... 13 2.2.3 Reduced delays and waiting times ................................................................................................ 14 2.2.4 Higher safety performance ............................................................................................................ 14 2.2.5 Improved logistics planning for shippers........................................................................................ 15
2.3 Main costs of RIS implementation.........................................................................15
2.4 Pro memoria effects: benefits not taken into account ............................................17 2.4.1 Positive effects of RIS on the efficiency of authorities ................................................................... 17
SPIN-TN Strategies to Promote Inland Navigation
Page 3 of 48 G:\PROJEKTE\SPIN\Working Groups (WG)\WG2
Systems & Technologies\Cost-Benefit Analysis RIS\Report\WG2 RIS CBA 0.7.doc
2.4.2 Improved efficiency at terminals .................................................................................................... 18 2.4.3 Improved security .......................................................................................................................... 18
3 Analysis model........................................................................................................20
3.1 Scope of the model...............................................................................................20
3.2 Model setup ..........................................................................................................21 3.2.1 Input data screens ......................................................................................................................... 21 3.2.2 Annual summary screen ................................................................................................................ 22 3.2.3 Result screen................................................................................................................................. 24
4 Input data.................................................................................................................26
4.1 Transport volumes ................................................................................................26 4.1.1 Transport volume in tonnes (t) ....................................................................................................... 26 4.1.2 Transport performance in tonnes-kilometres (tkm) ........................................................................ 27
4.2 Fleet data..............................................................................................................27
4.3 Stand-by costs ......................................................................................................28
4.4 Operating costs.....................................................................................................28
4.5 External costs .......................................................................................................30
4.6 Costs for land-side investments ............................................................................30
4.7 Costs for on-board investments ............................................................................31
5 Effects of the implementation of RIS .....................................................................33
5.1 Base scenario.......................................................................................................33 5.1.1 Scenario description ...................................................................................................................... 33 5.1.2 Base scenario: parameter settings ................................................................................................ 34 5.1.3 Base scenario: results ................................................................................................................... 35
5.2 Optimised scenario ...............................................................................................37 5.2.1 Scenario description ...................................................................................................................... 37 5.2.2 Optimised scenario: parameter settings ........................................................................................ 38 5.2.3 Optimised scenario: results ........................................................................................................... 38
5.3 Moderate scenario ................................................................................................40 5.3.1 Scenario description ...................................................................................................................... 40 5.3.2 Moderate scenario: parameter settings ......................................................................................... 41 5.3.3 Moderate scenario: results ............................................................................................................ 41
SPIN-TN Strategies to Promote Inland Navigation
Page 4 of 48 G:\PROJEKTE\SPIN\Working Groups (WG)\WG2
Systems & Technologies\Cost-Benefit Analysis RIS\Report\WG2 RIS CBA 0.7.doc
6 Sensitivity analysis .................................................................................................43
6.1 Transport volumes ................................................................................................43 6.1.1 Zero growth.................................................................................................................................... 43 6.1.2 Moderate growth rates................................................................................................................... 43 6.1.3 Optimistic growth rates .................................................................................................................. 44
6.2 Operating costs.....................................................................................................44 6.2.1 Drastic fuel cost rises..................................................................................................................... 44 6.2.2 Improved engine technology.......................................................................................................... 44
6.3 Stand-by costs ......................................................................................................45 6.3.1 Reduced personnel, maintenance and interest costs .................................................................... 45
6.4 On-board investments...........................................................................................45 6.4.1 Double on-board investment costs ................................................................................................ 45
6.5 Land-side investments ..........................................................................................45 6.5.1 25% higher land-side investments ................................................................................................. 45
7 Conclusions.............................................................................................................46
7.1 Main outcome .......................................................................................................46
7.2 Model performance...............................................................................................46
7.3 Further research needs.........................................................................................47 7.3.1 Statistical needs............................................................................................................................. 47 7.3.2 Pro memoria effects....................................................................................................................... 47

SPIN-TN Strategies to Promote Inland Navigation
Page 5 of 48 G:\PROJEKTE\SPIN\Working Groups (WG)\WG2
Systems & Technologies\Cost-Benefit Analysis RIS\Report\WG2 RIS CBA 0.7.doc
1 THE DEVELOPMENT OF RIS IN EUROPE
1.1 Introduction
1.1.1 The history of River Information Services (RIS) A strong increase in the use of information and communication technology (ICT) could be observed in the transport sector – including inland navigation – during the last decades. Onboard PCs with mobile internet connections have already become standard equipment on many vessels operating across Europe, while in the meantime electronic navigational charts and transponders have been developed and introduced. On shore, traffic centres as well as ship reporting systems with interconnected databases are being installed.
Each of these technical systems is capable of supporting several inland navigation services, so-called River Information Services (RIS). RIS are defined as a concept for harmonised information services to support traffic and transport management in inland navigation, including interfaces to other transport modes [CCNR/PIANC, 2004]. RIS are principally not dealing with internal commercial activities between companies, but RIS are open for interfacing with commercial processes [CCNR/PIANC, 2004].
1.1.2 European initiatives towards the development and implementation of RIS Numerous research and development projects have worked on the development of RIS in Europe. A major impetus for the development of RIS concepts was provided by the INDRIS project. This project – funded within the 4th Framework Programme (FP4) for Research, Technical Development and Demonstration of the European Union – described the functions of RIS for all potential users, specified relevant information processes and developed open standards for information content and communication between public and private parties [INDRIS, 2001]. The project was a joint venture between national public authorities, the transport industry, the ICT-industry and research institutes from Austria, Germany, Belgium, France, Italy and the Netherlands. The project started in January 1998 and was formally completed in June 2000.
COMPRIS (FP5) aimed to develop a technical, organisational and functional architecture for River Information Services on a pan-European level, as well as to prepare the steps for the implementation of RIS on the most important European waterways. The COMPRIS project
SPIN-TN Strategies to Promote Inland Navigation
Page 6 of 48 G:\PROJEKTE\SPIN\Working Groups (WG)\WG2
Systems & Technologies\Cost-Benefit Analysis RIS\Report\WG2 RIS CBA 0.7.doc
started in September 2002 and was completed towards the end of 2005. The development and enhancement of standards on information exchange (e.g. Inland ECDIS, electronic ship reporting, AIS) was one of the core elements of COMPRIS.
The challenge facing the inland waterway transport sector therefore lies in integrating the various services and systems into a single European common operational concept. The political foundations for this coordinated approach have been reflected by the European White Paper on Transport, the revised TEN-T Guidelines and last but not least by the RIS Directive. Building upon the results of previous projects, the Masterplan IRIS has created a masterplan for the coordinated implementation of RIS in Europe. Its goal is to define strategies for RIS implementation and identify the scope of RIS implementation in Europe.
1.2 Overview of RIS-Services
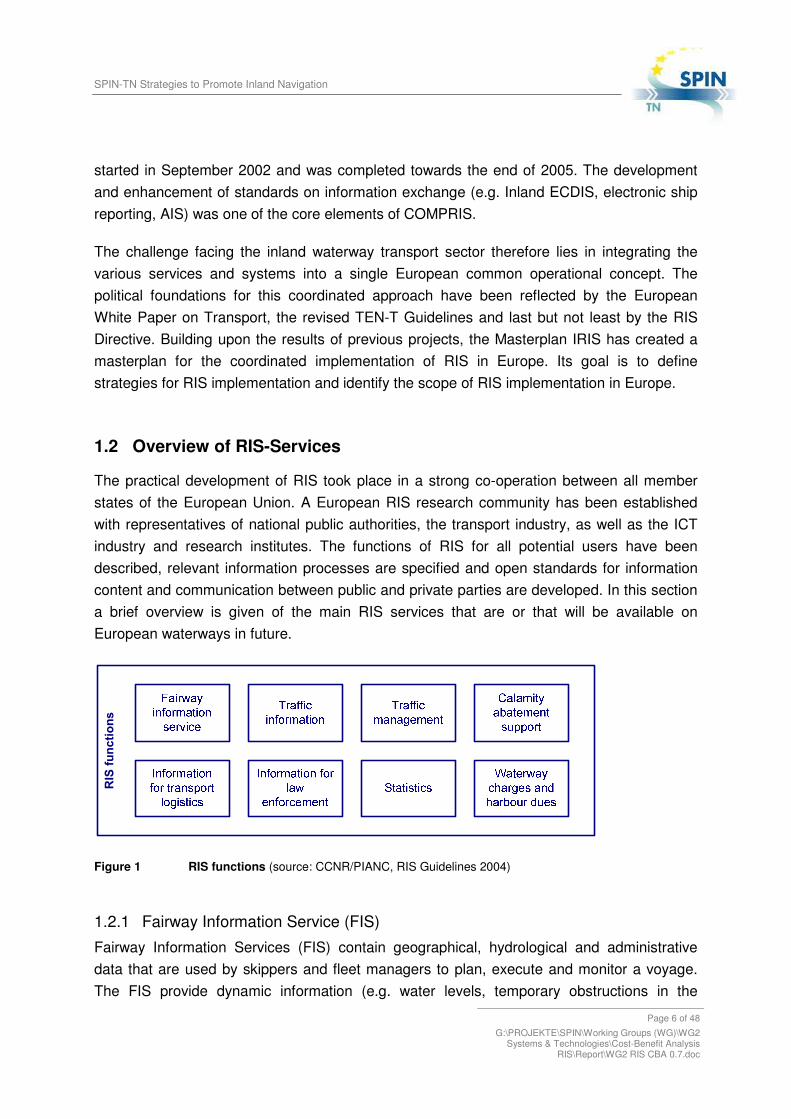
The practical development of RIS took place in a strong co-operation between all member states of the European Union. A European RIS research community has been established with representatives of national public authorities, the transport industry, as well as the ICT industry and research institutes. The functions of RIS for all potential users have been described, relevant information processes are specified and open standards for information content and communication between public and private parties are developed. In this section a brief overview is given of the main RIS services that are or that will be available on European waterways in future.
Figure 1 RIS functions (source: CCNR/PIANC, RIS Guidelines 2004)
1.2.1 Fairway Information Service (FIS) Fairway Information Services (FIS) contain geographical, hydrological and administrative data that are used by skippers and fleet managers to plan, execute and monitor a voyage. The FIS provide dynamic information (e.g. water levels, temporary obstructions in the
SPIN-TN Strategies to Promote Inland Navigation
Page 7 of 48 G:\PROJEKTE\SPIN\Working Groups (WG)\WG2
Systems & Technologies\Cost-Benefit Analysis RIS\Report\WG2 RIS CBA 0.7.doc
fairway) as well as static information (e.g. traffic signs, opening hours of locks) on the conditions of the inland waterway infrastructure. FIS contains data on the waterway infrastructure only – i.e. excluding data on vessel movements. RIS provide standardised electronic charts and standardised Notices to Skippers in a machine readable format and in eleven languages.
1.2.2 Traffic information The information provided in a Tactical Traffic Image (TTI) supports the ship’s master in the immediate navigation decisions in the actual traffic situation. The Tactical Traffic Image allows skippers also to make navigational arrangements with other vessels. The Tactical Traffic Image contains information on vessels’ positions, speed, heading and specific vessel information of all targets identified by radar and – if available – Automatic Identification Systems (AIS) or compatible automatic vessel tracking and tracing systems. The TTI is displayed on a standardised electronic chart; the inland ECDIS (Electronic Chart Display and Information System for Inland Navigation).
The Strategic Traffic Image (STI) on the other hand provides a general overview of the traffic situation in a relatively large area. The Strategic Traffic Image is mainly used for planning and monitoring. The STI will provide the user with information about intended voyages of vessels, (dangerous) cargo and Requested Times of Arrival (RTA) at defined points (e.g. locks, terminals). Traffic Management by waterway authorities aims at optimising the use of the infrastructure as well as facilitating safe navigation. At present so-called Vessel Traffic Services (VTS) centres are installed at some critical points along the European waterway network in the Netherlands and Germany where large amounts of traffic have to be managed.
1.2.3 Traffic management Traffic Management is carried out by waterway administrations aiming at optimal utilisation of the infrastructures and assurance of safe navigation by means of local traffic management (LTM). Vessel Traffic Service (VTS), whose centres are currently installed at some critical points along the European waterway network, are implemented by a Competent Authority to improve the safety and efficiency of vessel traffic, and to protect the environment. The information required by VTS centres is basically gathered by means of permanent shore-based radar stations. AIS can provide additional information, such as the vessel's identity and main dimensions. Traffic management also entails lock and bridge management (LBM). RIS supports lock/bridge operators in their medium-term decisions by providing a strategic traffic image. RIS thereby assists the operators in the calculation of ETAs/ RTAs
SPIN-TN Strategies to Promote Inland Navigation
Page 8 of 48 G:\PROJEKTE\SPIN\Working Groups (WG)\WG2
Systems & Technologies\Cost-Benefit Analysis RIS\Report\WG2 RIS CBA 0.7.doc
(Estimated/Requested Time of Arrival) of vessels. By means of optimal planning of locking operations, the smooth passage of vessels through the locks and bridges, which are considered as inland waterways’ bottlenecks, can be realised. Lock planning can reduce waiting times significantly. In turn, lock operators can inform the individual skipper of his RTA, enabling him to adapt his speed and possibly save on fuel.
1.2.4 Calamity abatement support Calamity abatement services register vessels and their transport data at the beginning of a journey and updates the data during the voyage. In the event of an accident, the authorities are capable of providing data immediately to the rescue and emergency teams. The electronic charts and the traffic image provide the basis for the coordination of rescue forces and nautical measures.
1.2.5 Information for transport logistics Voyage Planning means skippers and fleet managers can plan Estimated Times of Arrival (ETA) based on fairway information. Traditionally this information is specially made available by means of ‘Notices to Skippers’, which provide information on the availability of the waterway infrastructure (e.g. constraints due to construction works).
Transport Management means the management of the transport chain beyond the scope of the navigation, and is driven by freight brokers and transport service quality managers. It is aimed at improving the overall performance of the contracted fleet and terminals, at controlling the progress of the contracted transports, at monitoring unexpected threats to the reliability of these transports, and at finalising the transport (delivery and invoice).
Cargo and fleet management basically comprises two types of information, information on the vessels and the fleet and detailed information on the cargo transported. RIS allows for logistics applications such as fleet planning support, ETA/RTA negotiations between vessels and terminals, tracking and tracing, and electronic market-places.
Intermodal Port and Terminal Management (PTM) represents the provision of ETA information of approaching vessels supports the overall terminal utilisation and allows smooth passage of vessels through the terminal facilities. As a result, the transhipment time can be reduced. In situations when there is insufficient terminal capacity, the terminal operator can inform the individual skipper of his RTA. Better slot management is possible as a result of the exchange of ETA and RTA data.

SPIN-TN Strategies to Promote Inland Navigation
Page 9 of 48 G:\PROJEKTE\SPIN\Working Groups (WG)\WG2
Systems & Technologies\Cost-Benefit Analysis RIS\Report\WG2 RIS CBA 0.7.doc
1.2.6 Information for law enforcement Law enforcement ensures that people within a given jurisdiction adhere to the laws of that jurisdiction. RIS supports law enforcement in inland navigation in the fields of cross-border management (e.g. the movement of people controlled by the immigration service, customs), compliance with the requirements for traffic safety, and compliance with the environmental requirements. It will also reduce waiting times at borders.
1.2.7 Statistics RIS will contribute to a better and easier collection of relevant inland waterway statistical data in the Member States. These are mainly of interest to the waterway authorities for strategic planning and monitoring purposes. Since data already collected for other services can be used, then skippers, terminal and lock operators no longer need to provide special statistics. Electronic data collection will facilitate the process for data providers and statistical offices. The statistics are of interest to the waterway authorities, international organisations and companies engaged in inland navigation for strategic planning and monitoring.
1.2.8 Waterway charges and harbour dues RIS can also assist in levying already existing waterway charges with less administrative burden. The travel data of the ship can be used to automatically calculate the charge and initiate the invoicing procedure, thus facilitating the process for waterway users and authorities.
1.3 RIS technologies
Several RIS-related technological innovations have been introduced in the inland waterway sector during the last decade:
• Inland Electronic Navigational Charts (IENC) and Inland Electronic Chart Display Information System (Inland ECDIS) for visualisation of fairway and ship position information;
• The European standard Inland ECDIS is based on maritime ECDIS. IENCs are already available for large parts of the European inland waterway network;
• Internet applications for Notices to Skippers in 11 languages and machine readable format;
• Electronic ship reporting systems for information collection and distribution on voyage-related data (ship and cargo);
SPIN-TN Strategies to Promote Inland Navigation
Page 10 of 48 G:\PROJEKTE\SPIN\Working Groups (WG)\WG2
Systems & Technologies\Cost-Benefit Analysis RIS\Report\WG2 RIS CBA 0.7.doc
• Vessel tracking and tracing technologies such as Automatic Identification System (AIS) for automatic reporting of the position of ships and other safety relevant data;
• Radar systems with ENC underlay for navigation and traffic monitoring; • Route and voyage planning applications; • Applications for optimising fuel consumption.
1.4 The need for an analysis of costs and benefits of RIS
River Information Services (RIS) are services that support traffic and transport management in inland navigation. These services can be considered as a major step forward, turning inland navigation into a transparent, reliable, flexible and easy-to-access transport mode. RIS therefore significantly contribute to the establishment of inland navigation as a cost-effective and environmentally friendly mode of transportation. In addition to the meaning of RIS for commercial logistics actors, RIS have proven to be invaluable for waterway authorities (e.g. supporting traffic management tasks, dangerous goods monitoring, etcetera). Given the positive contribution of inland navigation to the achievement of transport policy objectives – sustainable and competitive transport – the development of RIS is strongly supported by numerous international bodies and institutions. A major political milestone is marked by the adoption of the RIS Directive by the European Council and Parliament in September 2005.
Because the implementation of RIS in Europe requires public and private investments, solid and quantified information on the social and economic costs and benefits of RIS at the European level needs to be made available. This paper reports on a model that is capable of showing the assumed effects of the implementation of RIS in Europe in a quantitative way. The model has been developed within the Thematic Network SPIN (European Strategies to Promote Inland Navigation) – which is funded by the European Commission (DG-TREN) under the 5th Framework Programme.
First – on the basis of existing research and through own research – a catalogue of costs and benefits is presented. Some of the most important benefits discussed are a reduction of accident costs, delay costs during normal operation, delays at locks, fuel consumption, external costs as well as savings through higher vessel utilisation. The main costs categories taken into account are investments and operating costs for RIS centres, costs for on-shore equipment (e.g. base stations), RIS operating costs, as well the costs for investments on board. The spatial scope of the model is the enlarged European Union, including the candidate countries for 2007 and relevant third countries.
The second part of the paper consists of an overview of the main model assumptions and the general setup of the analysis model. The remainder of the paper entails an elaborate

SPIN-TN Strategies to Promote Inland Navigation
Page 11 of 48 G:\PROJEKTE\SPIN\Working Groups (WG)\WG2
Systems & Technologies\Cost-Benefit Analysis RIS\Report\WG2 RIS CBA 0.7.doc
analysis of different scenarios and model results (sensitivity analysis). By showing the major costs and benefits of different RIS scenarios, the reader will be able to make an informed judgement about the most important elements of current and future RIS implementation. The paper concludes with a series of recommendations based on the analysis.
The above overview of RIS applications show that RIS can prove to be an important instrument for promoting transport over water. RIS can provide inland shipping with a competitive edge over other modes of transportation. RIS makes inland navigation attractive to modern supply chain management and enables inland navigation to provide logistically relevant and cost-reducing services. In addition to the meaning of RIS for commercial logistics actors, RIS facilitate the tasks of the competent authorities, in particular in the field of traffic management and the monitoring of hazardous goods. Through the provision of data to skippers, it improves the basis for immediate navigational decisions. Safety and environmental protection will be enhanced through better information and reduced reaction times in case of emergencies.
The implementation of European RIS requires public and private investments. Information on the commercial and societal costs and benefits of RIS at the European level should be made available to underpin and demonstrate the positive effects of the implementation of RIS in Europe. These commercial and societal benefits of the implementation of RIS have so far not been systematically analysed and quantified for the whole of Europe. Within the framework of SPIN-TN, a macroscopic costs/benefits model was developed specifically for this purpose.
1.5 The CBA methodology
Cost/Benefit Analyses can be used to evaluate the macro-economic and societal pros and cons of a future investment. CBA is a methodology to determine the rate of return or the cost-effectiveness of private and public investments. The methodology thereby takes into account all relevant effects of the investment project. These effects are expressed in monetary terms as much as possible. The effects that can hardly be priced (e.g. the deterioration of a natural habitat) are excluded from the CBA in the narrow sense. They however do appear in the analysis as so-called pm-entries (pro memoria), which describe these potential effects in verbal terms.
CBA can be seen as an iterative process [CPB & NEI, 2000], which starts with an explorative study and ends with an in-depth analysis of costs and benefits to support the final decision-making process. This two-step approach seems sensible in cases where different technical options for the realization of the project can still be chosen (such as the implementation of RIS). In the first phase, the main categories of costs and benefits are identified assuming the
SPIN-TN Strategies to Promote Inland Navigation
Page 12 of 48 G:\PROJEKTE\SPIN\Working Groups (WG)\WG2
Systems & Technologies\Cost-Benefit Analysis RIS\Report\WG2 RIS CBA 0.7.doc
implementation of RIS in Europe by 2005. For these requirements quantitative data are collected. In the second phase the available data were used as input to the quantitative analysis mode.
1.6 Outlook
In this report, first an overview of the identified effects of RIS is presented, including an overview of non-priced effects of the implementation of RIS (Chapter 2). This is followed by an introduction to the setup of the analysis model developed (Chapter 3). Furthermore the most important input data are discussed and presented (Chapter 4). In Chapter 5, the results of three calculated scenarios are presented and discussed, which is followed by a sensitivity analysis of the model. Chapter 7 contains conclusions for the implementation of RIS based on the results of the cost-benefits analysis.
SPIN-TN Strategies to Promote Inland Navigation
Page 13 of 48 G:\PROJEKTE\SPIN\Working Groups (WG)\WG2
Systems & Technologies\Cost-Benefit Analysis RIS\Report\WG2 RIS CBA 0.7.doc
2 ASSESSMENT OF RIS IMPLEMENTATION IN EUROPE
2.1 Introduction
Several studies have been aimed at establishing an overview of the costs and benefits of RIS. Some of these projects include:
• INDRIS: a framework for cost/benefit analysis with example data; • INCARNATION: among others determination of effects of RIS on safety; • CBA/RIS in the Netherlands (AVV); • DoRIS: costs and benefits for RIS operators; and • ALSO Danube: the socio-economic impacts of RIS.
On the basis of the existing literature following categories of benefits have been identified:
2.2 Main benefits of RIS implementation
2.2.1 Improved vessel utilisation RIS can lead to improved utilisation of the inland vessels’ payload through the online availability of accurate fairway information. This allows improved fleet management (optimised deployment of personnel and fleet based on up-to-date information) as well as more detailed trip planning and draught management based on up-to-date information on fairway conditions. Real-time information is provided that can be used to load ships according to the actual navigational conditions. RIS can thereby raise the efficiency of inland navigation; the fuel consumption per tkm can be significantly reduced.
2.2.2 Homogeneous cruising speeds RIS provide planning information that can be used to plan voyages and calculate more reliable time schedules. Based on the current and expected positioning data of the various vessels that are under way in the network, lock/bridge/terminal operators can calculate and communicate the Required Times of Arrival to the individual skippers. While approaching the lock/terminal the skipper can decide to adjust his cruising speed and possibly achieve more homogeneous travel speeds. This also results in lower fuel consumption figures, and consequently in lower operational costs for the skippers. An important side-effect of this

SPIN-TN Strategies to Promote Inland Navigation
Page 14 of 48 G:\PROJEKTE\SPIN\Working Groups (WG)\WG2
Systems & Technologies\Cost-Benefit Analysis RIS\Report\WG2 RIS CBA 0.7.doc
development is the reduction of external costs that depend on fuel consumption. By implementing RIS, therefore, existing transport volumes can be transported in a more environmental-friendly way.
2.2.3 Reduced delays and waiting times The fact that lock/bridge/terminal operators can calculate and communicate Required Times of Arrival to individual skippers will mean that skippers do arrive at locks and terminals according to plan. More reliable lock and terminal planning schedules can be based on this information, which in the end results in a reduction of waiting times at locks and terminals. Terminal and lock operators are capable of producing better planning of terminal resources through receipt of Estimated Times of Arrival (ETA) and additional information (e.g. stowage plans, vessel dimensions) of approaching vessels. These pre-announcement data allow a pro-active approach towards terminal or lock scheduling: before the vessel enters the port or lock, the operator can prepare and schedule the handling activities. For skippers this means a reduction of waiting times and an optimised chain of processes for the entire voyage. As a result, the fixed costs of operating a vessel (incl. personnel costs, maintenance costs, interest rates, etc.) can be reduced on a tkm-basis.
The reduction of these so-called stand-by costs, combined with a reduction of the operational (e.g. fuel costs), will lead to a reduction of the total costs for skippers. On the basis of this cost reduction, skippers can offer more competitive prices to their customers, the shippers. Inland navigation becomes more attractive and will be able to conquer a higher modal share. Such a modal shift can – given the outstanding environmental performance of inland navigation – ultimately contribute to an additional reduction of external costs. RIS contribute to a modal shift of cargo from road to waterway, leading to a reduction of exhausts such as CO2 and NOx but also of noise nuisance.
2.2.4 Higher safety performance With the introduction of RIS, skippers are offered up-to-date and complete overviews of traffic situations. This allows skippers to take well-informed navigational decisions, which will consequently lead to a reduction of incidents and injuries/fatalities. Traditionally, ship masters had for instance to rely on information shown on the radar and verbal information provided by vessel traffic service (VTS) centres in order to take navigational decisions. The application of RIS has dramatically improved this picture: skippers use electronic charts, which are necessarily up-to-date, receive precise positioning data on approaching vessels, and are informed about current fairway and weather conditions electronically. Moreover, RIS enable detailed monitoring of dangerous goods transports, which helps prevent shipping
SPIN-TN Strategies to Promote Inland Navigation
Page 15 of 48 G:\PROJEKTE\SPIN\Working Groups (WG)\WG2
Systems & Technologies\Cost-Benefit Analysis RIS\Report\WG2 RIS CBA 0.7.doc
accidents. These and other data allow safe navigation. Additionally, automated and more efficient customs procedures and security checks – supported by RIS – also contribute to increased safety and security in inland navigation. Finally, RIS provide the possibility to monitor the transport of dangerous goods. This allows timely responses in the event of accidents and potential environmental calamities. Since data on all traffic movements can be stored in a database, reconstruction of incidents can be helpful in the analysis of causes for the accident. All in all, this contributes to environmental protection in relation to inland navigation.
The higher safety performance of inland navigation through the implementation of RIS will lead to lower accident costs for skippers, as well as to lower external accident costs. This can be translated into lower insurance claims and costs, which in turn contribute to lower stand-by costs per tkm.
2.2.5 Improved logistics planning for shippers RIS can contribute to the improved integration of inland navigation in intermodal supply chains in Europe, which is a prerequisite for a higher modal share for inland navigation. RIS enable real-time monitoring of inland navigation fleet and the changing fairway conditions en route. On the basis of RIS data, customers of inland navigation (shippers) will be enabled to set up or support their own tracking and tracing systems. Information generated by these systems can be effectively exploited to generate significant logistics cost reductions. Tracking and tracing information can for instance be used to support floating stock concepts, and thereby contribute to a reduction of inventory costs (e.g. safety stocks can be eliminated, stock-out costs can be reduced).
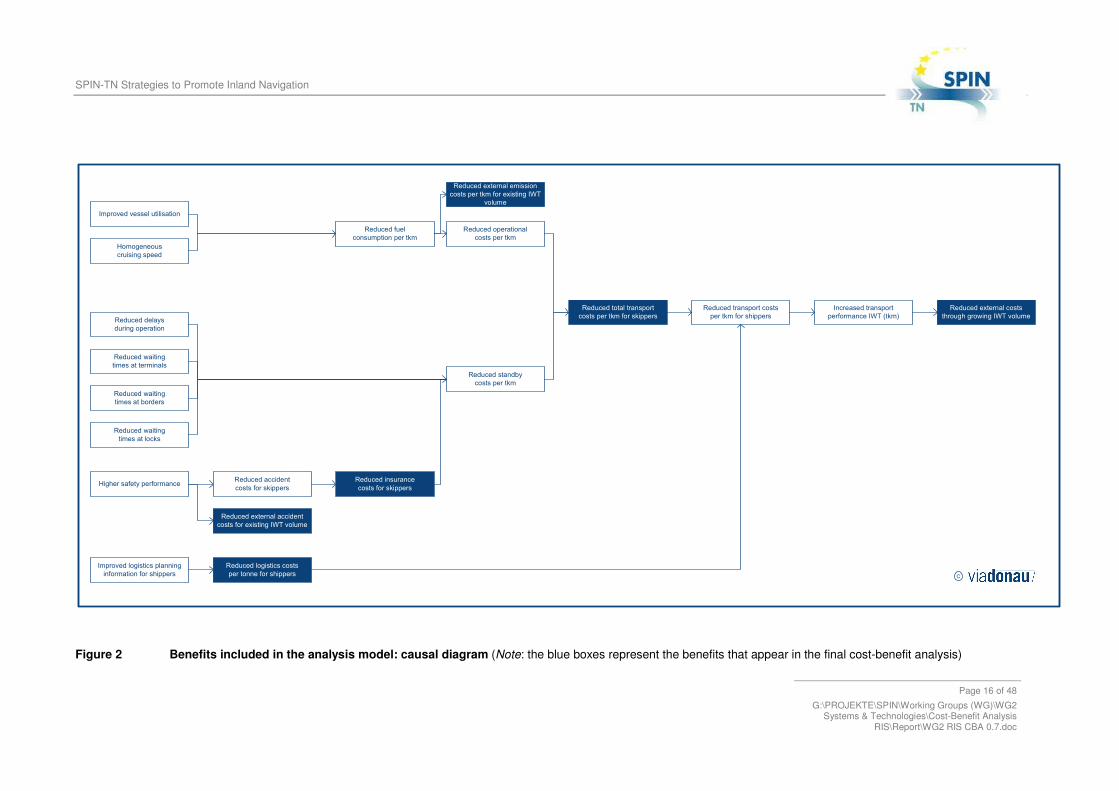
The main benefits – as discussed in the previous section – have been incorporated in the analysis model. Figure 2 displays all model factors and their interconnections.
2.3 Main costs of RIS implementation
The analysis model also contains costs factors. The two main cost categories pertain to land-side and on-board investments. The landside investments for instance deal with the installation of base stations, the creation of Inland ECDIS charts, the operation of RIS centres, etc. These costs are generally borne by the respective waterway authorities. On the other hand, on-board investments typically involve the costs for transponders (incl. installation), personal computers equipped with GPRS modem, costs for Inland ECDIS software and maps, as well as communication costs.
SPIN-TN Strategies to Promote Inland Navigation
Page 16 of 48 G:\PROJEKTE\SPIN\Working Groups (WG)\WG2
Systems & Technologies\Cost-Benefit Analysis RIS\Report\WG2 RIS CBA 0.7.doc
Figure 2 Benefits included in the analysis model: causal diagram (Note: the blue boxes represent the benefits that appear in the final cost-benefit analysis)
SPIN-TN Strategies to Promote Inland Navigation
Page 17 of 48 G:\PROJEKTE\SPIN\Working Groups (WG)\WG2
Systems & Technologies\Cost-Benefit Analysis RIS\Report\WG2 RIS CBA 0.7.doc
2.4 Pro memoria effects: benefits not taken into account
Some effects could not be taken into account in the analysis model either due to a lack of statistical input data or due to a lack of information on the possible positive impacts of the RIS services in question. These factors are called pro memoria effects to reflect the fact that these benefits should be pursued in future efforts to appraise the positive impacts of RIS implementation.
2.4.1 Positive effects of RIS on the efficiency of authorities
2.4.1.1 More efficient custom and law enforcement procedures
The concentration of information in national control centres will lead to streamlined procedures and more effective service performance of national waterway administrations, such as waterway police and customs offices. Information can be shared and exchanged, resulting in a more effective use of personnel resources. Through the implementation of RIS, supervision and law enforcement could be carried out with the same number of personnel, despite steadily rising traffic and transport volumes. Due to a lack of data on the current costs for customs and waterway police, positive effects on these items could not be taken into account in the analysis.
2.4.1.2 More efficient lock and bridge operation
RIS facilitates lock and bridge operation and planning. Lock and bridge operators are supported in their medium-term decisions through data exchange with adjacent locks and bridges. RIS assist further in the calculation of Estimated Times of Arrival (ETAs) and Requested Times of Arrival (RTAs) for a chain of locks. The analysis model does include the positive effects of reduced waiting for skippers, but does not take into account financial benefits for lock operators/waterway authorities.
2.4.1.3 More effective waterway maintenance
Another factor that has been discussed in the literature concerns the postponement of dredging activities and the postponement of investments for mooring places. The improved Inland ECDIS charts would allow preventative dredging, thereby maintaining the performance of the waterway in question. Likewise, the reduction of waiting times at terminals, borders and locks would reduce the need for mooring facilities. More in-depth research would be needed to acquire the current costs levels of national waterway administration and determine the potential reductions of these types of costs.
SPIN-TN Strategies to Promote Inland Navigation
Page 18 of 48 G:\PROJEKTE\SPIN\Working Groups (WG)\WG2
Systems & Technologies\Cost-Benefit Analysis RIS\Report\WG2 RIS CBA 0.7.doc
2.4.1.4 More efficient statistical data collection
The implementation of RIS will lead to massive efficiency gains within national waterway administrations. Information exchange is streamlined, superfluous registration and data entries are eliminated, etc. Additionally, RIS enable the automated collection of statistical and customs data. Traditionally, this is connected with paper work, which is time-consuming and prone to data errors. RIS makes the automatic collection of required data possible in an efficient way, which ultimately results in lower public expenditure.
2.4.2 Improved efficiency at terminals The information gained on vessel positions, estimated times of arrival (ETAs), cargo data etc. enables terminal operators to plan resources in advance and to use these data for scheduling and planning purposes. The implementation of RIS will raise operational efficiency of terminal operators and will consequently reduce the operational costs per tonne transhipped.
2.4.3 Improved security The effects of the implementation of RIS on security have not been priced in the current version of the analysis model. The actual costs for security measures are largely unknown, and can therefore not be estimated. More investigations would be needed to price this positive effect on security costs. Possible negative effects on the privacy of skippers and the availability of sensitive information have not been quantified in this model either.
Figure 3 displays some main benefits of the implementation of RIS in Europe. It describes the types of benefits that have been incorporated in the analysis model (the dark blue boxes) as well as the pro memoria effects (the grey boxes).

SPIN-TN Strategies to Promote Inland Navigation
Page 19 of 48 G:\PROJEKTE\SPIN\Working Groups (WG)\WG2
Systems & Technologies\Cost-Benefit Analysis RIS\Report\WG2 RIS CBA 0.7.doc
Figure 3 Benefits taken into account/not taken into account in the analysis

SPIN-TN Strategies to Promote Inland Navigation
Page 20 of 48 G:\PROJEKTE\SPIN\Working Groups (WG)\WG2
Systems & Technologies\Cost-Benefit Analysis RIS\Report\WG2 RIS CBA 0.7.doc
3 ANALYSIS MODEL
3.1 Scope of the model
The above cost and benefit factors have been quantified in an Excel-based model. The model includes data for the interconnected main waterways of Europe:
• the Rhine corridor; • the East-West corridor; • The South-East corridor; and • The North-South corridor.
Figure 4 Geographical scope of the analysis
Following countries have been included in the model
• EU Member states o Czech Republic o Germany
SPIN-TN Strategies to Promote Inland Navigation
Page 21 of 48 G:\PROJEKTE\SPIN\Working Groups (WG)\WG2
Systems & Technologies\Cost-Benefit Analysis RIS\Report\WG2 RIS CBA 0.7.doc
o France o Luxembourg o Hungary o Netherlands o Austria o Poland o Slovak Republic
• Non-EU Member States o Bulgaria o Croatia o Serbia & Montenegro o Romania o Ukraine o Switzerland
The model has been limited to all waterways in these countries higher or equal to Class IV, and represents more than 95% of all commercial freight transport over inland waterways in Europe.
The model is calculated for the years between 2005 and 2010, since the implementation of RIS has already started and is expected to bear fruits in the short term. The time horizon of the model is sufficient to estimate the costs and benefits in a proper way, without having to rely on future growth prospects too much.
3.2 Model setup
The model is built up of several interconnected calculation screens (see screenshots below). The model makes a clear distinction between input data, assumptions and calculation results. Three types of screens are used in the model:
• Input data screens • Annual summary screens; and • Results screens.
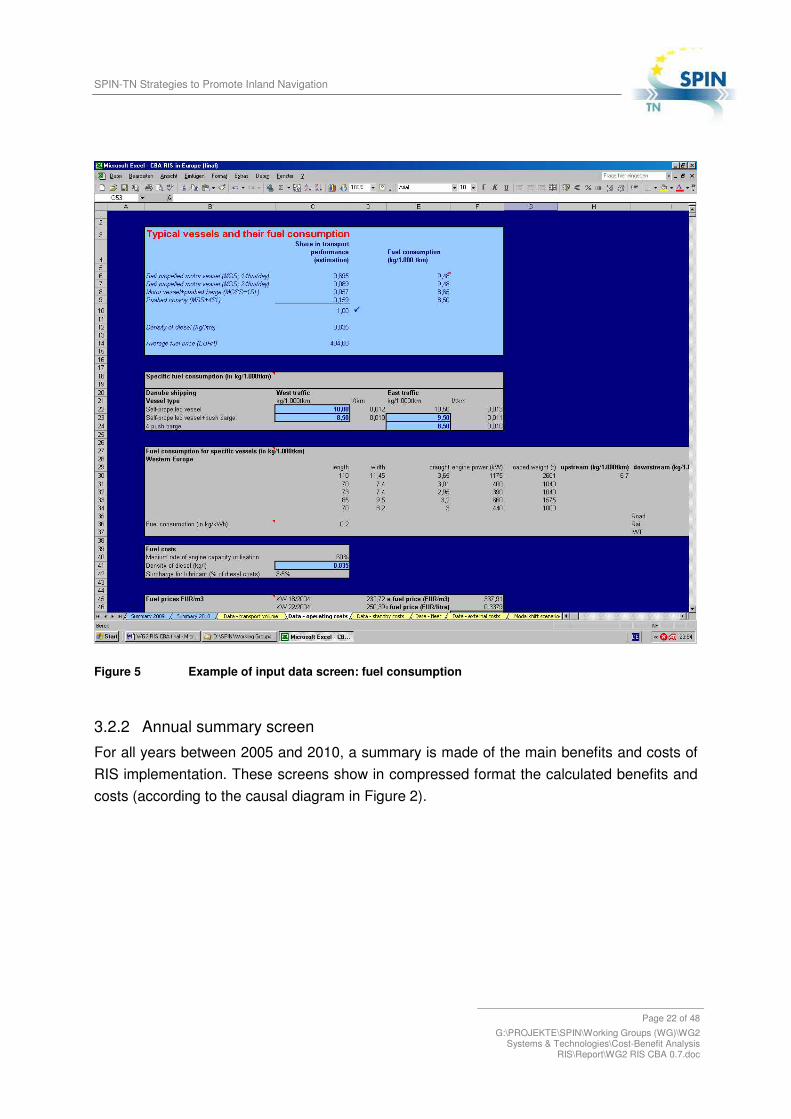
3.2.1 Input data screens Data sheets are marked in yellow. They contain data that were gained during the explorative study and which form the major input to the calculations. An example of such a data screen is shown in Figure 5.
SPIN-TN Strategies to Promote Inland Navigation
Page 22 of 48 G:\PROJEKTE\SPIN\Working Groups (WG)\WG2
Systems & Technologies\Cost-Benefit Analysis RIS\Report\WG2 RIS CBA 0.7.doc
Figure 5 Example of input data screen: fuel consumption
3.2.2 Annual summary screen For all years between 2005 and 2010, a summary is made of the main benefits and costs of RIS implementation. These screens show in compressed format the calculated benefits and costs (according to the causal diagram in Figure 2).
SPIN-TN Strategies to Promote Inland Navigation
Page 23 of 48 G:\PROJEKTE\SPIN\Working Groups (WG)\WG2
Systems & Technologies\Cost-Benefit Analysis RIS\Report\WG2 RIS CBA 0.7.doc
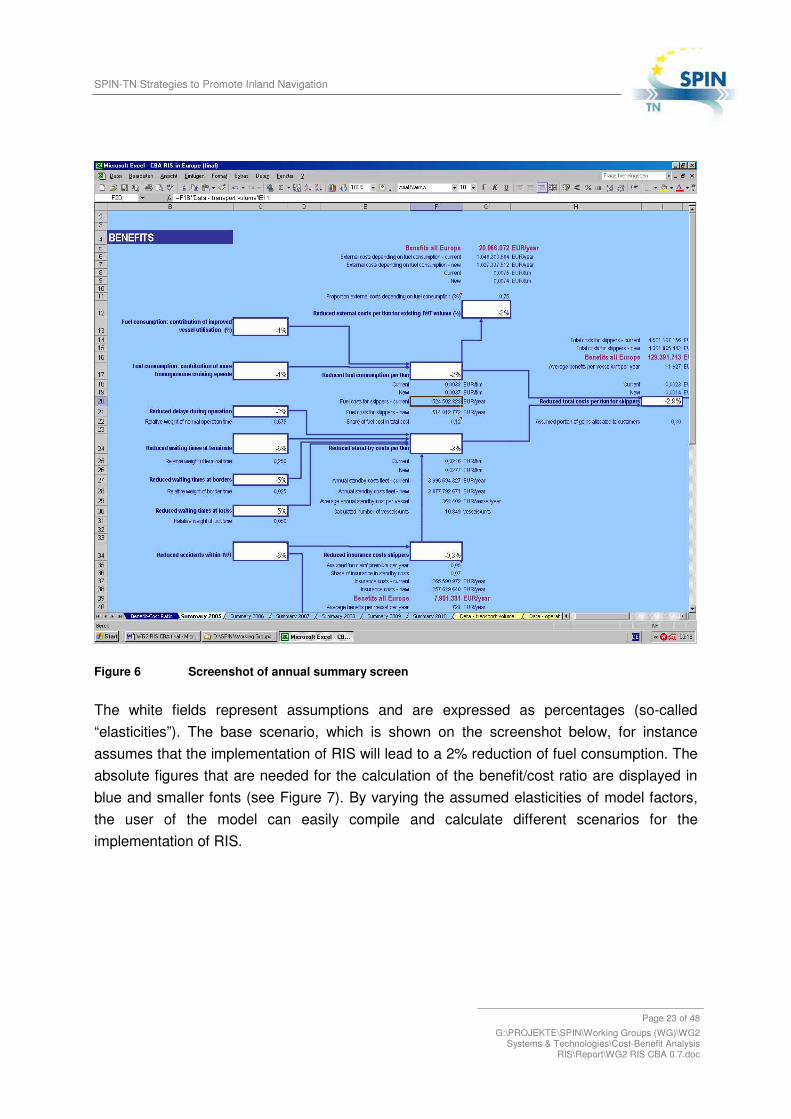
Figure 6 Screenshot of annual summary screen
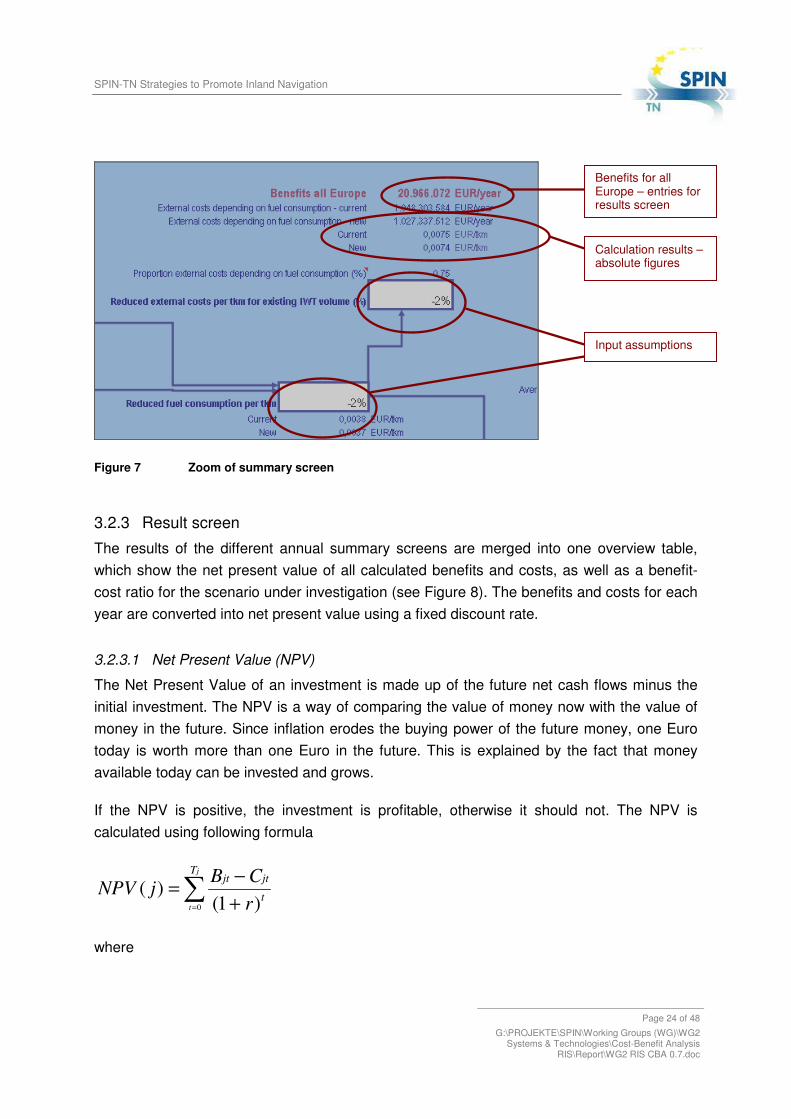
The white fields represent assumptions and are expressed as percentages (so-called “elasticities”). The base scenario, which is shown on the screenshot below, for instance assumes that the implementation of RIS will lead to a 2% reduction of fuel consumption. The absolute figures that are needed for the calculation of the benefit/cost ratio are displayed in blue and smaller fonts (see Figure 7). By varying the assumed elasticities of model factors, the user of the model can easily compile and calculate different scenarios for the implementation of RIS.
SPIN-TN Strategies to Promote Inland Navigation
Page 24 of 48 G:\PROJEKTE\SPIN\Working Groups (WG)\WG2
Systems & Technologies\Cost-Benefit Analysis RIS\Report\WG2 RIS CBA 0.7.doc
Figure 7 Zoom of summary screen
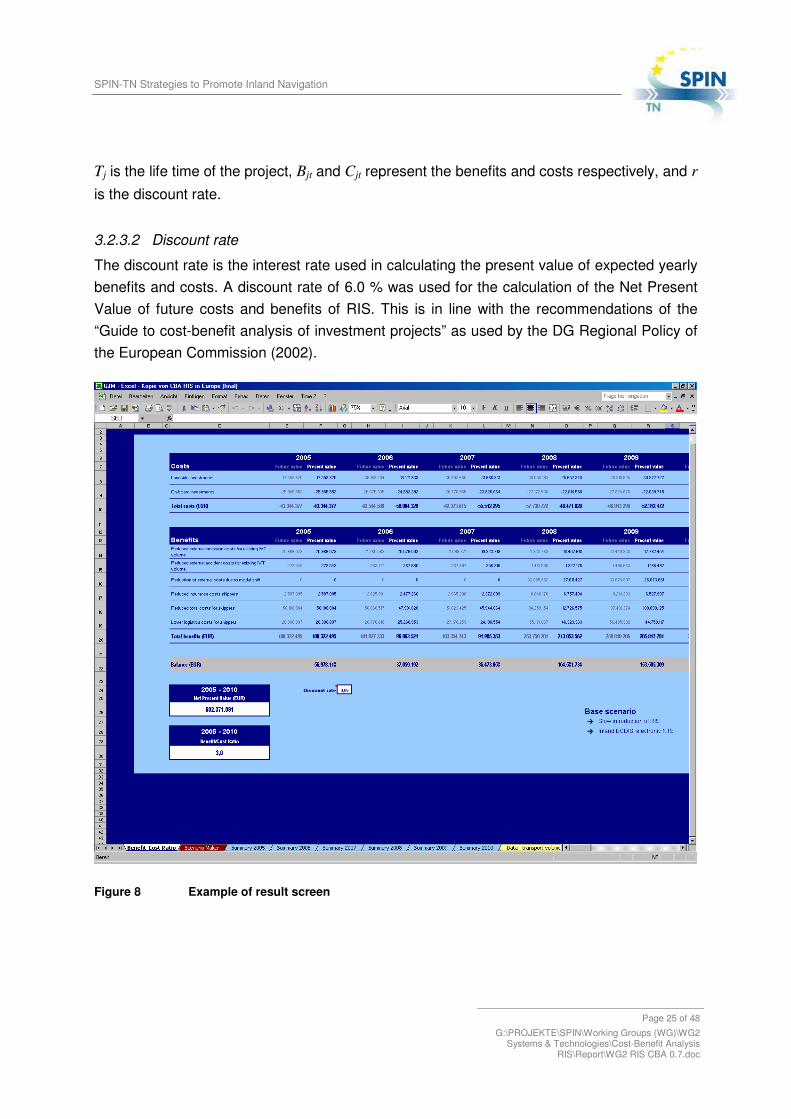
3.2.3 Result screen The results of the different annual summary screens are merged into one overview table, which show the net present value of all calculated benefits and costs, as well as a benefit-cost ratio for the scenario under investigation (see Figure 8). The benefits and costs for each year are converted into net present value using a fixed discount rate.
3.2.3.1 Net Present Value (NPV)
The Net Present Value of an investment is made up of the future net cash flows minus the initial investment. The NPV is a way of comparing the value of money now with the value of money in the future. Since inflation erodes the buying power of the future money, one Euro today is worth more than one Euro in the future. This is explained by the fact that money available today can be invested and grows.
If the NPV is positive, the investment is profitable, otherwise it should not. The NPV is calculated using following formula
= +
!=j
t
T
t
jtjt
rCBjNPV
0 )1()(
where
Calculation results – absolute figures
Input assumptions
Benefits for all Europe – entries for results screen
SPIN-TN Strategies to Promote Inland Navigation
Page 25 of 48 G:\PROJEKTE\SPIN\Working Groups (WG)\WG2
Systems & Technologies\Cost-Benefit Analysis RIS\Report\WG2 RIS CBA 0.7.doc
Tj is the life time of the project, Bjt and Cjt represent the benefits and costs respectively, and r is the discount rate.
3.2.3.2 Discount rate
The discount rate is the interest rate used in calculating the present value of expected yearly benefits and costs. A discount rate of 6.0 % was used for the calculation of the Net Present Value of future costs and benefits of RIS. This is in line with the recommendations of the “Guide to cost-benefit analysis of investment projects” as used by the DG Regional Policy of the European Commission (2002).
Figure 8 Example of result screen
SPIN-TN Strategies to Promote Inland Navigation
Page 26 of 48 G:\PROJEKTE\SPIN\Working Groups (WG)\WG2
Systems & Technologies\Cost-Benefit Analysis RIS\Report\WG2 RIS CBA 0.7.doc
4 INPUT DATA
The search for relevant and up-to-date input data proved to be a difficult process. This chapter describes the main types of input data that were used for the setup of the analysis model.
4.1 Transport volumes
Transport volumes were not readily available on the level of the four main corridors. Data were collected based on national statistics, previous studies and the Market Observatory study by CCNR and the European Commission (2005). A main problem with current statistics is formed by double countings; national transport volumes in tonnes cannot simply be added in order to calculate the transport volumes transported on the various corridors. For instance, one tonne transported between Ukraine and Austria will be reported in the Hungarian and Slovakian national statistics. The input data for transport volumes that were used in SPIN-TN required an in-depth analysis of the various statistical resources, thereby eliminating multiple countings.
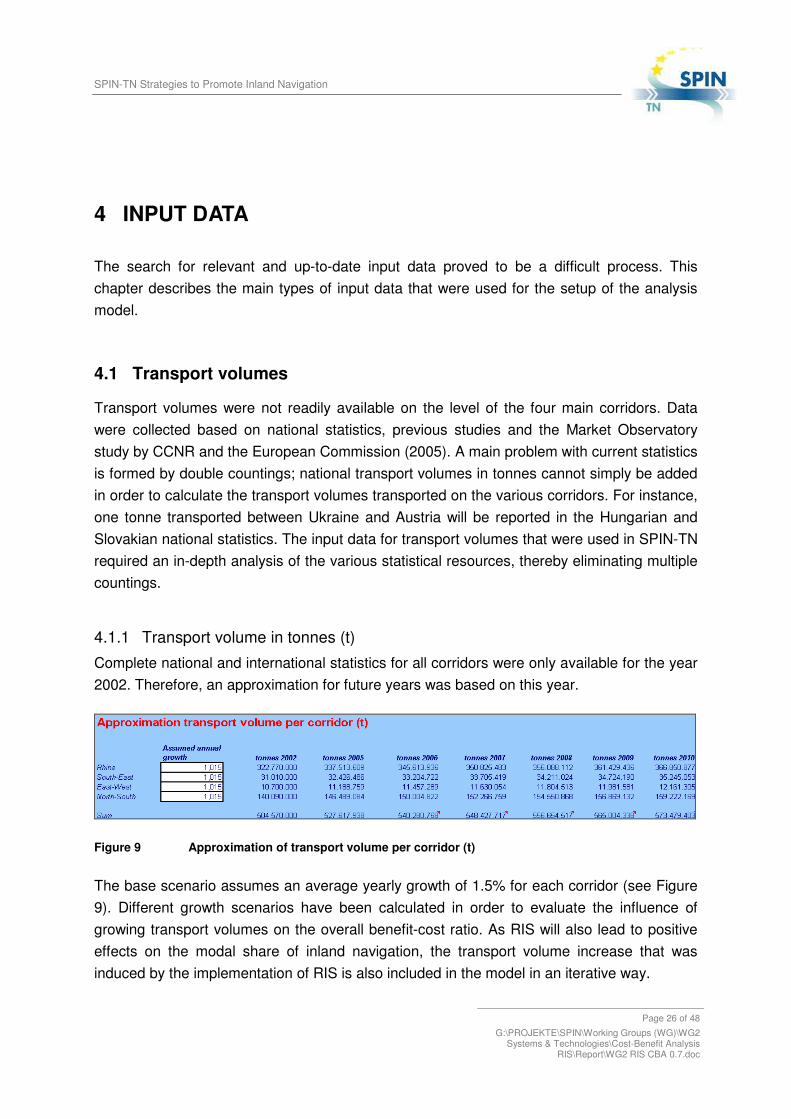
4.1.1 Transport volume in tonnes (t) Complete national and international statistics for all corridors were only available for the year 2002. Therefore, an approximation for future years was based on this year.
Figure 9 Approximation of transport volume per corridor (t)
The base scenario assumes an average yearly growth of 1.5% for each corridor (see Figure 9). Different growth scenarios have been calculated in order to evaluate the influence of growing transport volumes on the overall benefit-cost ratio. As RIS will also lead to positive effects on the modal share of inland navigation, the transport volume increase that was induced by the implementation of RIS is also included in the model in an iterative way.
SPIN-TN Strategies to Promote Inland Navigation
Page 27 of 48 G:\PROJEKTE\SPIN\Working Groups (WG)\WG2
Systems & Technologies\Cost-Benefit Analysis RIS\Report\WG2 RIS CBA 0.7.doc
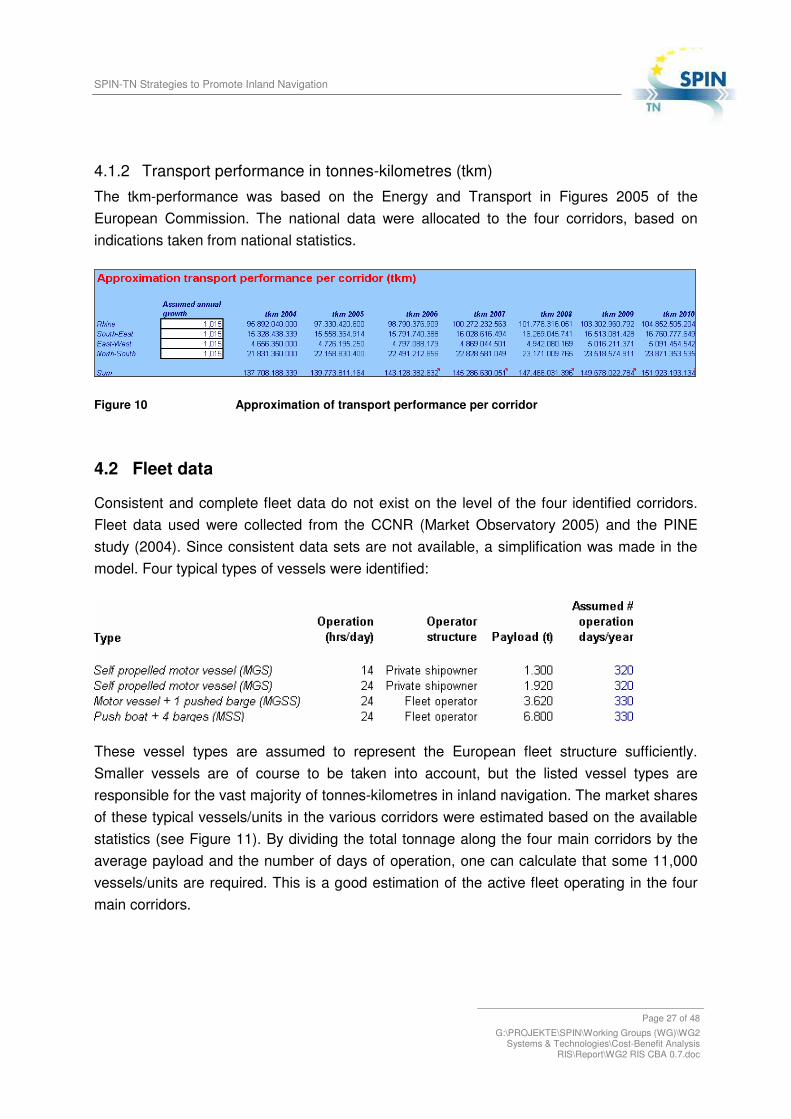
4.1.2 Transport performance in tonnes-kilometres (tkm) The tkm-performance was based on the Energy and Transport in Figures 2005 of the European Commission. The national data were allocated to the four corridors, based on indications taken from national statistics.
Figure 10 Approximation of transport performance per corridor
4.2 Fleet data
Consistent and complete fleet data do not exist on the level of the four identified corridors. Fleet data used were collected from the CCNR (Market Observatory 2005) and the PINE study (2004). Since consistent data sets are not available, a simplification was made in the model. Four typical types of vessels were identified:
These vessel types are assumed to represent the European fleet structure sufficiently. Smaller vessels are of course to be taken into account, but the listed vessel types are responsible for the vast majority of tonnes-kilometres in inland navigation. The market shares of these typical vessels/units in the various corridors were estimated based on the available statistics (see Figure 11). By dividing the total tonnage along the four main corridors by the average payload and the number of days of operation, one can calculate that some 11,000 vessels/units are required. This is a good estimation of the active fleet operating in the four main corridors.

SPIN-TN Strategies to Promote Inland Navigation
Page 28 of 48 G:\PROJEKTE\SPIN\Working Groups (WG)\WG2
Systems & Technologies\Cost-Benefit Analysis RIS\Report\WG2 RIS CBA 0.7.doc
Figure 11 Estimated market shares of typical vessel types
4.3 Stand-by costs
The stand-by costs pertain to the fixed costs of a skipper or shipping operator, i.e. include costs for personnel costs, maintenance/repair costs, depreciation, interest, overheads, and insurance. Efficient use of RIS can lead to lower stand-by costs per tkm, and are therefore quantified in the analysis model. Based on the “Handbuch der Donauschifffahrt” (via donau, 2005) and the PINE-study (2004), the average stand-by costs have been calculated for the four typical vessel types and the four main corridors respectively.
Figure 12 Average stand-by costs in the four main corridors
4.4 Operating costs
The operating costs are the costs that are caused by actual operation of the vessel. The operating costs that are relevant in the context of the implementation of RIS are limited to fuel costs. The implementation of RIS can contribute to a significant reduction of fuel consumption. The values for average fuel consumption (in kg/1,000 tkm) have been taken from the Handbuch der Donauschifffahrt (via donau, 2005) and the CREATING project (2005).
SPIN-TN Strategies to Promote Inland Navigation
Page 29 of 48 G:\PROJEKTE\SPIN\Working Groups (WG)\WG2
Systems & Technologies\Cost-Benefit Analysis RIS\Report\WG2 RIS CBA 0.7.doc
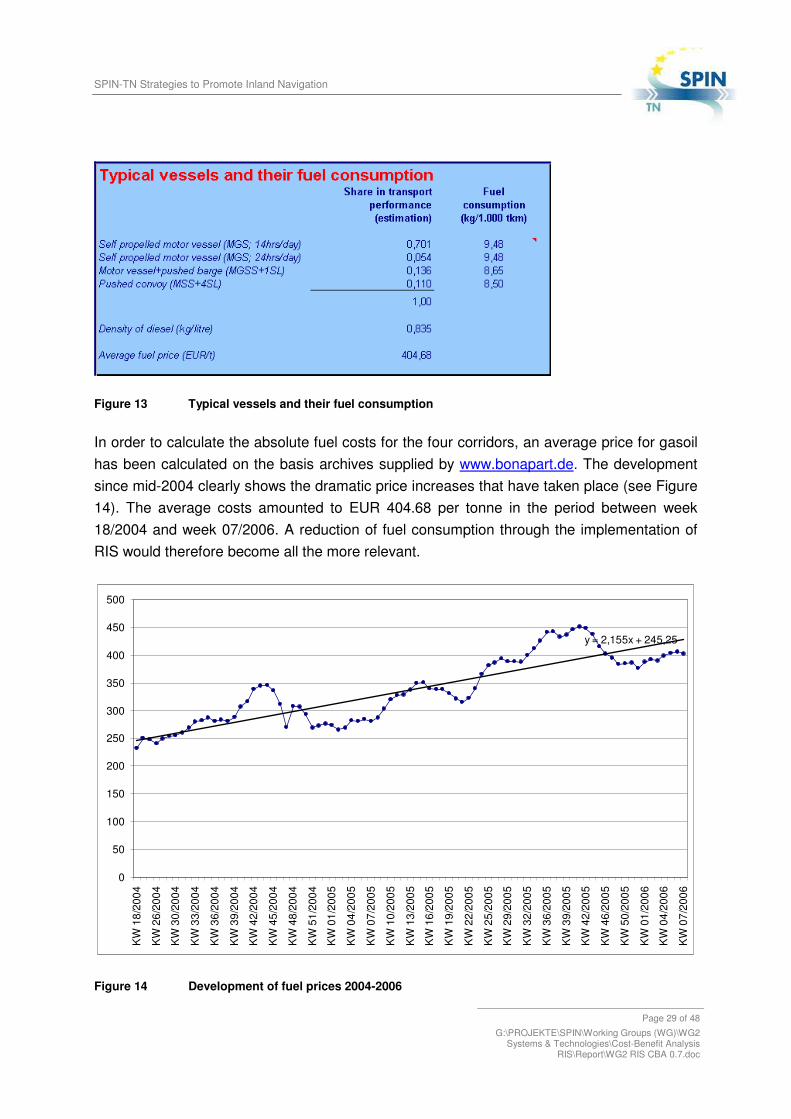
Figure 13 Typical vessels and their fuel consumption
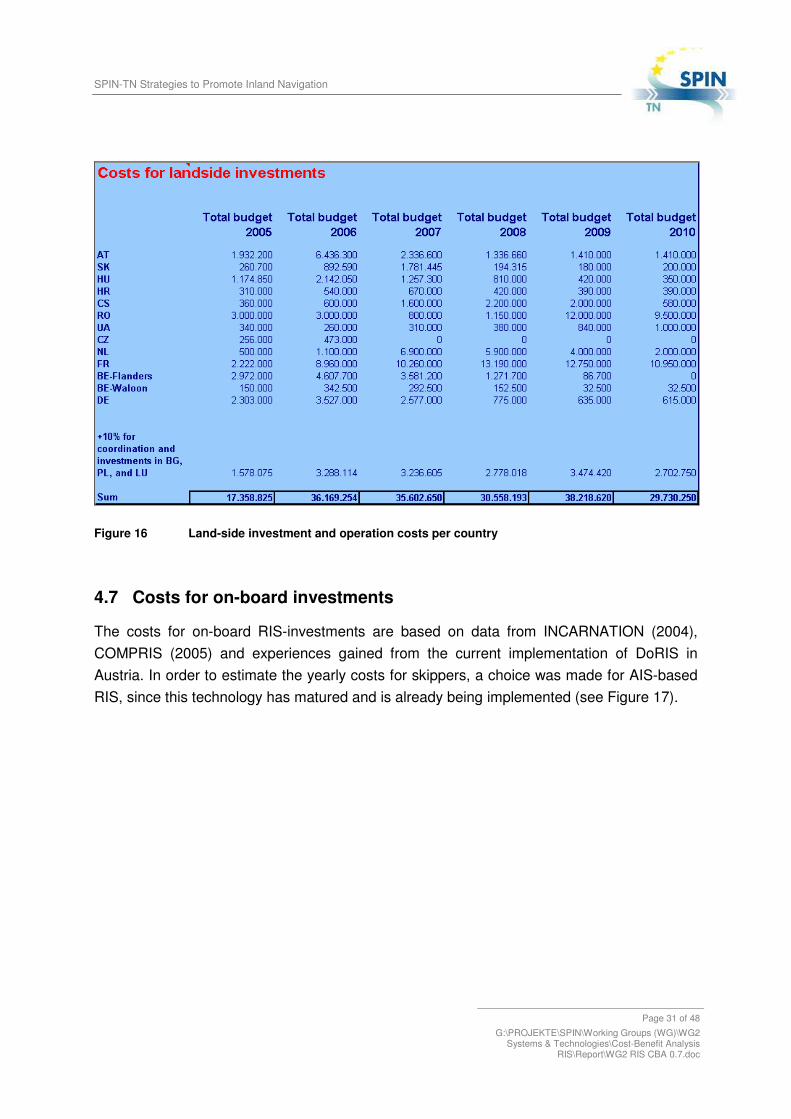
In order to calculate the absolute fuel costs for the four corridors, an average price for gasoil has been calculated on the basis archives supplied by www.bonapart.de. The development since mid-2004 clearly shows the dramatic price increases that have taken place (see Figure 14). The average costs amounted to EUR 404.68 per tonne in the period between week 18/2004 and week 07/2006. A reduction of fuel consumption through the implementation of RIS would therefore become all the more relevant.
y = 2,155x + 245,25
0
50
100
150
200
250
300
350
400
450
500
KW
18/
2004
KW
26/
2004
KW
30/
2004
KW
33/
2004
KW
36/
2004
KW
39/
2004
KW
42/
2004
KW
45/
2004
KW
48/
2004
KW
51/
2004
KW
01/
2005
KW
04/
2005
KW
07/
2005
KW
10/
2005
KW
13/
2005
KW
16/
2005
KW
19/
2005
KW
22/
2005
KW
25/
2005
KW
29/
2005
KW
32/
2005
KW
36/
2005
KW
39/
2005
KW
42/
2005
KW
46/
2005
KW
50/
2005
KW
01/
2006
KW
04/
2006
KW
07/
2006
Figure 14 Development of fuel prices 2004-2006

SPIN-TN Strategies to Promote Inland Navigation
Page 30 of 48 G:\PROJEKTE\SPIN\Working Groups (WG)\WG2
Systems & Technologies\Cost-Benefit Analysis RIS\Report\WG2 RIS CBA 0.7.doc
4.5 External costs
The external costs of inland navigation are the lowest for all land-modes. The figures used for calculating the external costs benefits of RIS are based on the Annex of the 2nd Marco Polo Call (2004), whereby inland waterway transport (IWT) generates external costs worth 10 Euro per 1,000 tkm (see Figure 15). These costs include costs for noise, pollutants, climate costs, accidents, infrastructure and congestion. About ! of the external costs are dependent on fuel consumption and emissions to air.
Figure 15 External costs per 1,000 tkm
4.6 Costs for land-side investments
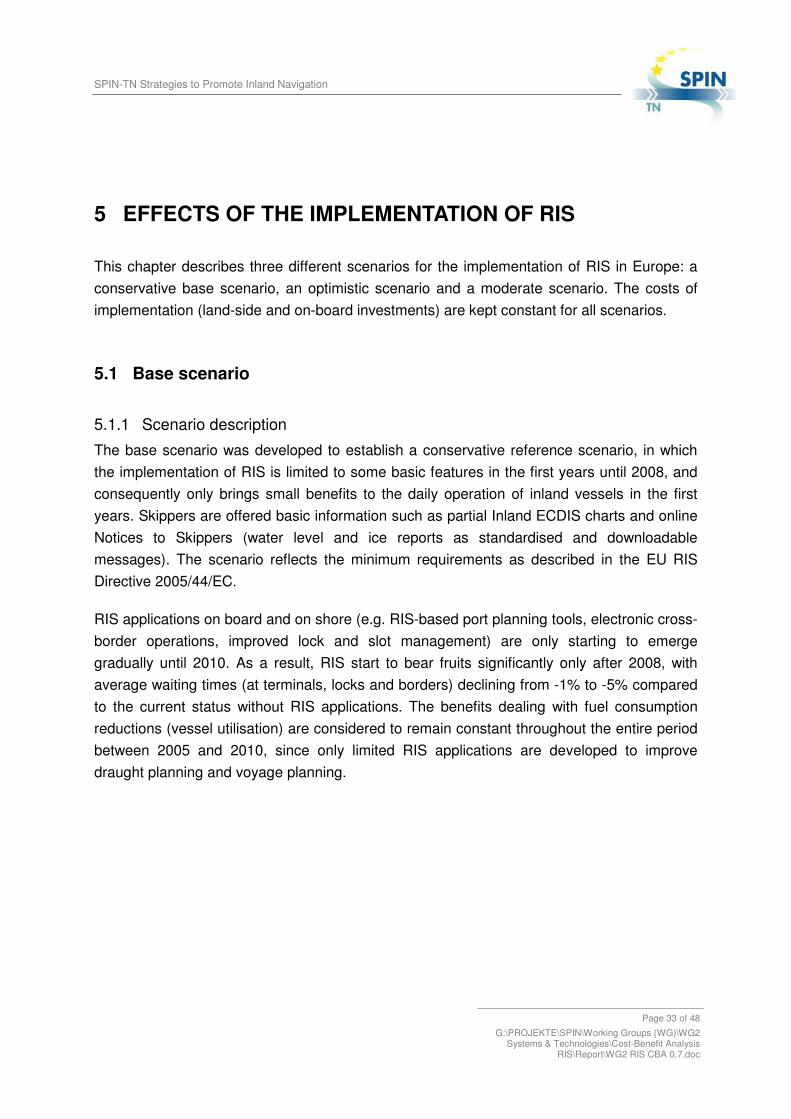
The costs for landside investments (e.g. costs for base stations, RIS centres, Inland ECDIS creation, etc.) were collected on the basis of the IRIS Masterplan (2005). The implementation costs were reported by the national administrations, estimating the sums required for the implementation of RIS in their countries (see Figure 16). For the countries for which no investment costs were reported, a 10% increase of the total budget was estimated. Between 2005 and 2010 around 187 million Euro should be reserved for the land-side investments required for the implementation of RIS in Europe.
SPIN-TN Strategies to Promote Inland Navigation
Page 31 of 48 G:\PROJEKTE\SPIN\Working Groups (WG)\WG2
Systems & Technologies\Cost-Benefit Analysis RIS\Report\WG2 RIS CBA 0.7.doc
Figure 16 Land-side investment and operation costs per country
4.7 Costs for on-board investments
The costs for on-board RIS-investments are based on data from INCARNATION (2004), COMPRIS (2005) and experiences gained from the current implementation of DoRIS in Austria. In order to estimate the yearly costs for skippers, a choice was made for AIS-based RIS, since this technology has matured and is already being implemented (see Figure 17).

SPIN-TN Strategies to Promote Inland Navigation
Page 32 of 48 G:\PROJEKTE\SPIN\Working Groups (WG)\WG2
Systems & Technologies\Cost-Benefit Analysis RIS\Report\WG2 RIS CBA 0.7.doc
Figure 17 Costs of on-board equipment
SPIN-TN Strategies to Promote Inland Navigation
Page 33 of 48 G:\PROJEKTE\SPIN\Working Groups (WG)\WG2
Systems & Technologies\Cost-Benefit Analysis RIS\Report\WG2 RIS CBA 0.7.doc
5 EFFECTS OF THE IMPLEMENTATION OF RIS
This chapter describes three different scenarios for the implementation of RIS in Europe: a conservative base scenario, an optimistic scenario and a moderate scenario. The costs of implementation (land-side and on-board investments) are kept constant for all scenarios.
5.1 Base scenario
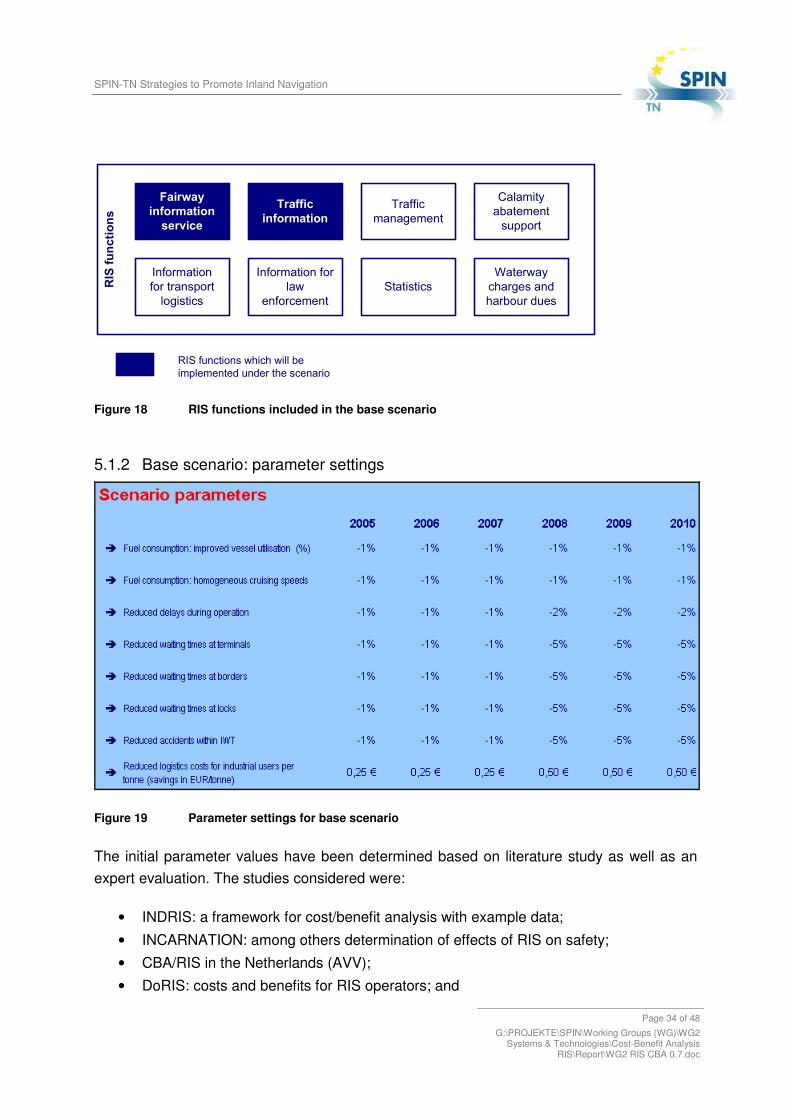
5.1.1 Scenario description The base scenario was developed to establish a conservative reference scenario, in which the implementation of RIS is limited to some basic features in the first years until 2008, and consequently only brings small benefits to the daily operation of inland vessels in the first years. Skippers are offered basic information such as partial Inland ECDIS charts and online Notices to Skippers (water level and ice reports as standardised and downloadable messages). The scenario reflects the minimum requirements as described in the EU RIS Directive 2005/44/EC.
RIS applications on board and on shore (e.g. RIS-based port planning tools, electronic cross-border operations, improved lock and slot management) are only starting to emerge gradually until 2010. As a result, RIS start to bear fruits significantly only after 2008, with average waiting times (at terminals, locks and borders) declining from -1% to -5% compared to the current status without RIS applications. The benefits dealing with fuel consumption reductions (vessel utilisation) are considered to remain constant throughout the entire period between 2005 and 2010, since only limited RIS applications are developed to improve draught planning and voyage planning.
SPIN-TN Strategies to Promote Inland Navigation
Page 34 of 48 G:\PROJEKTE\SPIN\Working Groups (WG)\WG2
Systems & Technologies\Cost-Benefit Analysis RIS\Report\WG2 RIS CBA 0.7.doc
Figure 18 RIS functions included in the base scenario
5.1.2 Base scenario: parameter settings
Figure 19 Parameter settings for base scenario
The initial parameter values have been determined based on literature study as well as an expert evaluation. The studies considered were:
• INDRIS: a framework for cost/benefit analysis with example data; • INCARNATION: among others determination of effects of RIS on safety; • CBA/RIS in the Netherlands (AVV); • DoRIS: costs and benefits for RIS operators; and

SPIN-TN Strategies to Promote Inland Navigation
Page 35 of 48 G:\PROJEKTE\SPIN\Working Groups (WG)\WG2
Systems & Technologies\Cost-Benefit Analysis RIS\Report\WG2 RIS CBA 0.7.doc
• ALSO Danube: the socio-economic impacts of RIS.
5.1.3 Base scenario: results The overall benefit/cost ratio of the base scenario is 3.0, which means that the present value of the benefits is three times higher than the present value of the costs connected to the implementation of RIS. The Net Present Value of the balance between costs and benefits amounts to 602 million Euro. Therefore, the implementation of RIS pays off even in a very conservative scenario. About one half of the benefits are formed by the direct cost reductions for the skippers. In the base scenario logistics costs reductions are not considered large enough to evoke a significant modal shift in the first years. This limits the reduction of external costs due to a modal shift to zero until 2008 (see Figure 20).

SPIN-TN Strategies to Promote Inland Navigation
Page 36 of 48 G:\PROJEKTE\SPIN\Working Groups (WG)\WG2
Systems & Technologies\Cost-Benefit Analysis RIS\Report\WG2 RIS CBA 0.7.doc
Figure 20 Results of base scenario

SPIN-TN Strategies to Promote Inland Navigation
Page 37 of 48 G:\PROJEKTE\SPIN\Working Groups (WG)\WG2
Systems & Technologies\Cost-Benefit Analysis RIS\Report\WG2 RIS CBA 0.7.doc
5.2 Optimised scenario
5.2.1 Scenario description The optimistic scenario creates major savings through higher vessel utilisation. These are generated through tracking and tracing services, which allow better scheduling and dispatching of vessels and their crew. In addition, Inland ECDIS charts for major ports and all waterways higher than Class III have been made available. Dedicated voyage planning software has been developed and adopted within one year. Both voyage planning and ECDIS/Notices to Skippers information source allow improved trip planning and draught planning. Tracking and tracing as well as electronic ship reporting simplify the positioning of vessels and facilitate the exchange of data between supply chain partners. For instance, costs of waiting at borders can be reduced due to border controls and customs clearance through electronic data exchange. Through pre-announcement, RIS enables the minimisation of non-productive waiting times at locks and transhipment locations. This immediately results in significant cost reductions. The implementation of traffic management and calamity abatement services reduces the number of incidents and accidents as well as the costs occurring after accidents.
Figure 21 RIS functions included in the optimised scenario

SPIN-TN Strategies to Promote Inland Navigation
Page 38 of 48 G:\PROJEKTE\SPIN\Working Groups (WG)\WG2
Systems & Technologies\Cost-Benefit Analysis RIS\Report\WG2 RIS CBA 0.7.doc
5.2.2 Optimised scenario: parameter settings
Figure 22 Parameter settings for optimised scenario
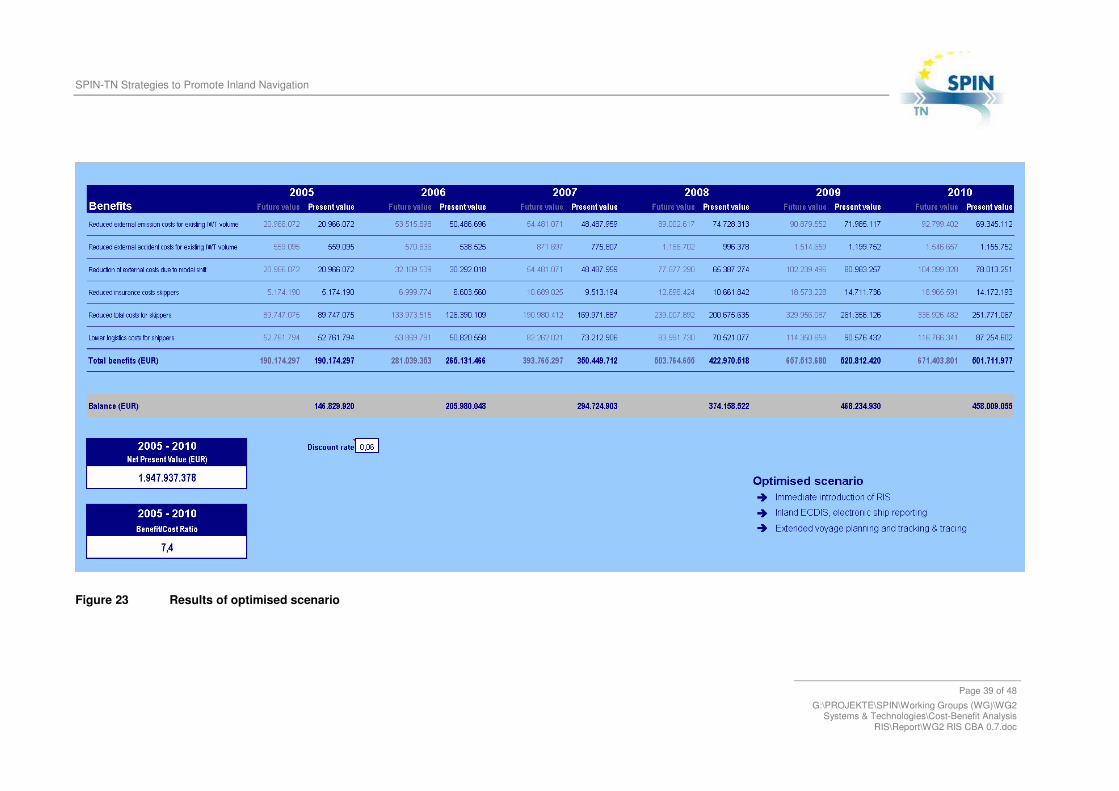
5.2.3 Optimised scenario: results The optimised scenario results in a net present value of the investment of almost 2 billion Euro, and a benefit/cost ratio of 7.4. The strong efforts in the fields of Inland ECDIS, electronic ship reporting, tracking & tracing, as well as voyage planning software result in major cost reductions for skippers (up to 250 million Euro in 2010). Shippers are also rewarded with 90 million Euro cost reductions in 2010, resulting in a higher modal share of inland navigation. The external costs are reduced by almost 80 million Euro in 2010 as a consequence of this modal shift. Furthermore fuel costs can be reduced by almost 70 million Euro in 2010 as a result of the full-blown implementation of RIS on the short term (see Figure 23).
SPIN-TN Strategies to Promote Inland Navigation
Page 39 of 48 G:\PROJEKTE\SPIN\Working Groups (WG)\WG2
Systems & Technologies\Cost-Benefit Analysis RIS\Report\WG2 RIS CBA 0.7.doc
Figure 23 Results of optimised scenario
SPIN-TN Strategies to Promote Inland Navigation
Page 40 of 48 G:\PROJEKTE\SPIN\Working Groups (WG)\WG2
Systems & Technologies\Cost-Benefit Analysis RIS\Report\WG2 RIS CBA 0.7.doc
5.3 Moderate scenario
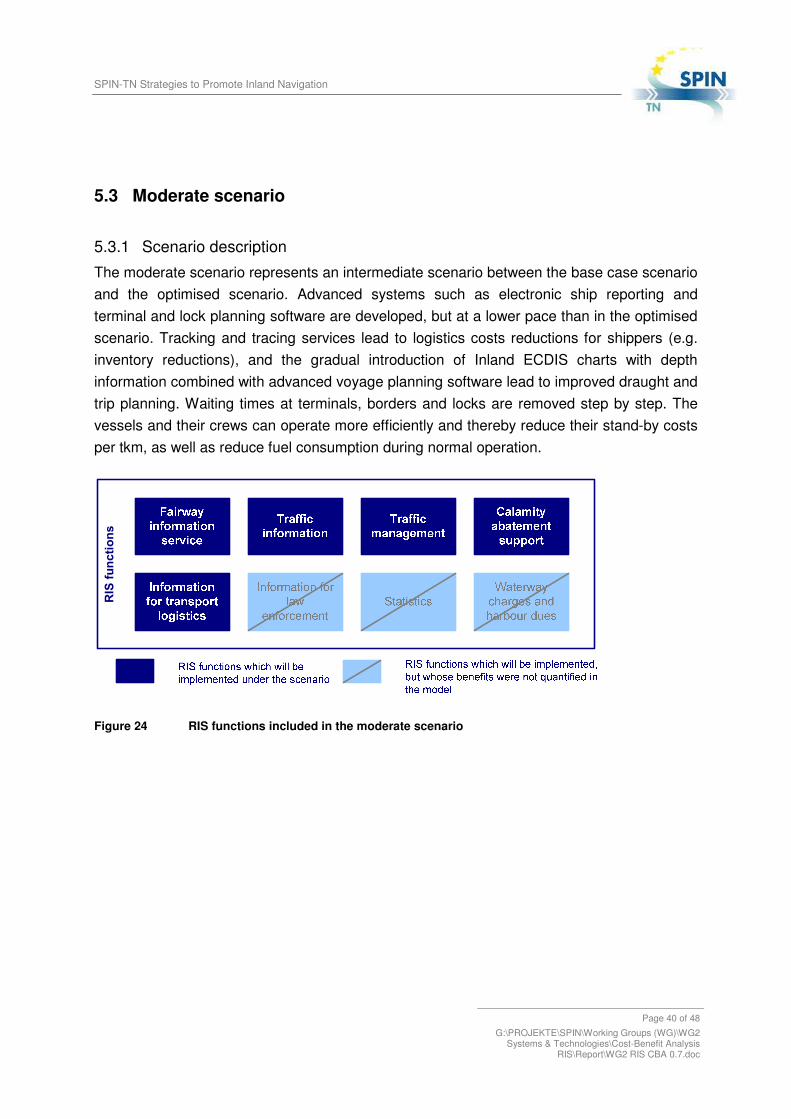
5.3.1 Scenario description The moderate scenario represents an intermediate scenario between the base case scenario and the optimised scenario. Advanced systems such as electronic ship reporting and terminal and lock planning software are developed, but at a lower pace than in the optimised scenario. Tracking and tracing services lead to logistics costs reductions for shippers (e.g. inventory reductions), and the gradual introduction of Inland ECDIS charts with depth information combined with advanced voyage planning software lead to improved draught and trip planning. Waiting times at terminals, borders and locks are removed step by step. The vessels and their crews can operate more efficiently and thereby reduce their stand-by costs per tkm, as well as reduce fuel consumption during normal operation.
Figure 24 RIS functions included in the moderate scenario
SPIN-TN Strategies to Promote Inland Navigation
Page 41 of 48 G:\PROJEKTE\SPIN\Working Groups (WG)\WG2
Systems & Technologies\Cost-Benefit Analysis RIS\Report\WG2 RIS CBA 0.7.doc
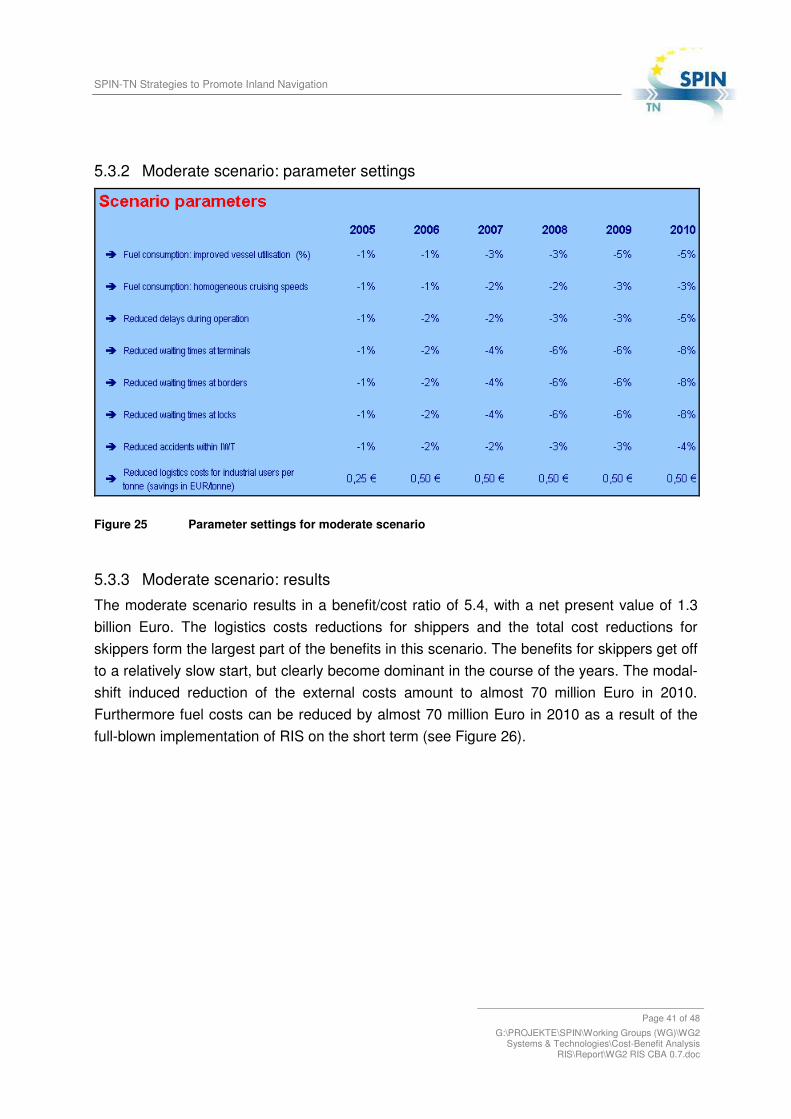
5.3.2 Moderate scenario: parameter settings
Figure 25 Parameter settings for moderate scenario
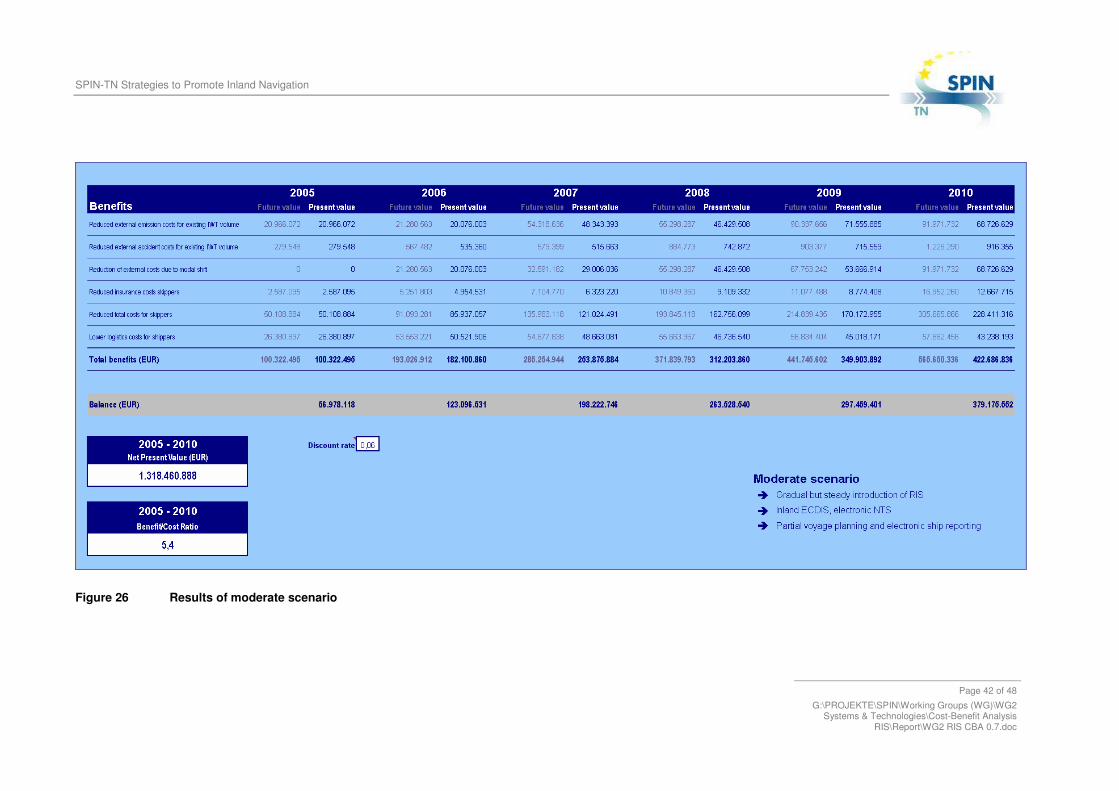
5.3.3 Moderate scenario: results The moderate scenario results in a benefit/cost ratio of 5.4, with a net present value of 1.3 billion Euro. The logistics costs reductions for shippers and the total cost reductions for skippers form the largest part of the benefits in this scenario. The benefits for skippers get off to a relatively slow start, but clearly become dominant in the course of the years. The modal-shift induced reduction of the external costs amount to almost 70 million Euro in 2010. Furthermore fuel costs can be reduced by almost 70 million Euro in 2010 as a result of the full-blown implementation of RIS on the short term (see Figure 26).
SPIN-TN Strategies to Promote Inland Navigation
Page 42 of 48 G:\PROJEKTE\SPIN\Working Groups (WG)\WG2
Systems & Technologies\Cost-Benefit Analysis RIS\Report\WG2 RIS CBA 0.7.doc
Figure 26 Results of moderate scenario
SPIN-TN Strategies to Promote Inland Navigation
Page 43 of 48 G:\PROJEKTE\SPIN\Working Groups (WG)\WG2
Systems & Technologies\Cost-Benefit Analysis RIS\Report\WG2 RIS CBA 0.7.doc
6 SENSITIVITY ANALYSIS
In this chapter, the model’s behaviour will be tested under different assumptions for input data. This is to demonstrate the stability and plausibility of the model. The main input data for which assumptions had to be made will be varied in order to evaluate the influence of different assumptions on the outcome of the model. All sensitivity analyses are performed under the moderate scenario.
6.1 Transport volumes
Assumptions had to be made for the growth of transport volumes in the four corridors. The default assumption included a 1.5% annual growth rate for each corridor. This can be seen as a conservative estimation. Therefore, the growth rates were varied in order to assess the impact of different growth scenarios.
6.1.1 Zero growth The unlikely case of zero growth in the period 2005-2010 for all corridors, i.e. stagnating transport volumes for inland navigation in Europe, the model produces a B/C ratio of 5.1 (compared to the original 5.4 of the moderate scenario). The original scenario assumed an average yearly growth of 1.5% for each corridor.
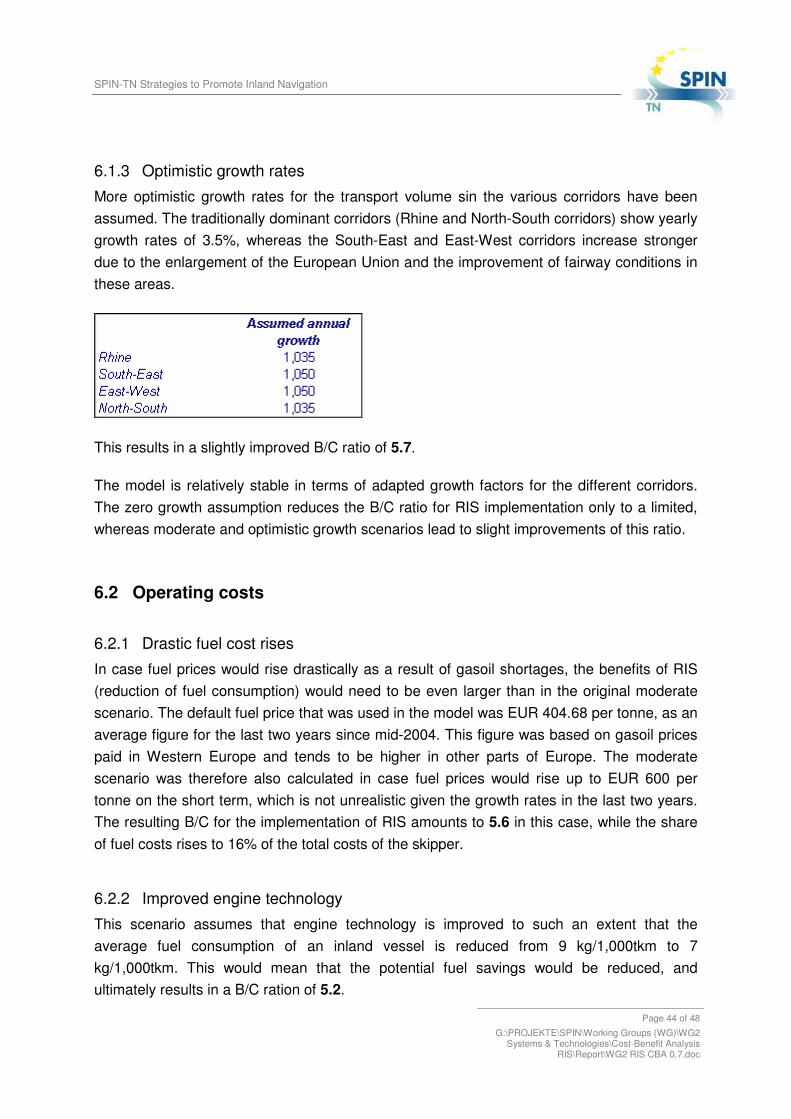
6.1.2 Moderate growth rates In this scenario, differentiated but moderate transport growth factors have been assumed for the four corridors:
This change in assumptions does not significantly influence the outcome of the model (B/C ratio of 5.5), since more vessels will be required and equipped with RIS applications.
SPIN-TN Strategies to Promote Inland Navigation
Page 44 of 48 G:\PROJEKTE\SPIN\Working Groups (WG)\WG2
Systems & Technologies\Cost-Benefit Analysis RIS\Report\WG2 RIS CBA 0.7.doc
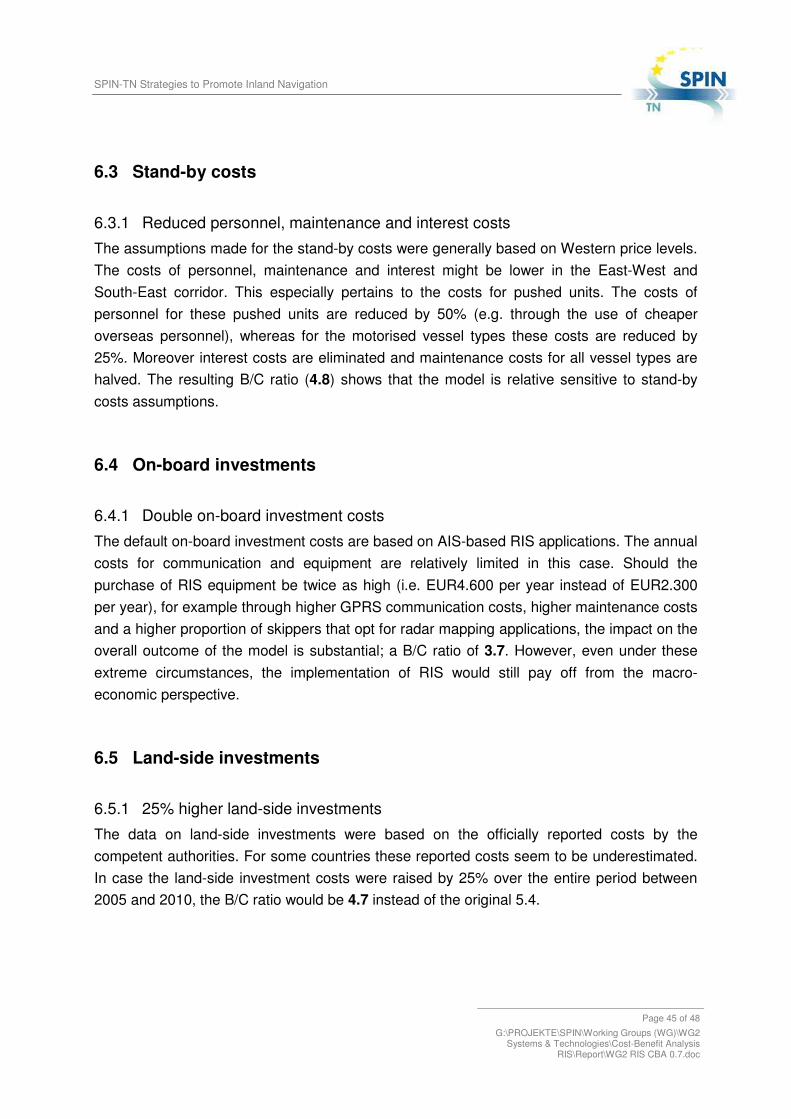
6.1.3 Optimistic growth rates More optimistic growth rates for the transport volume sin the various corridors have been assumed. The traditionally dominant corridors (Rhine and North-South corridors) show yearly growth rates of 3.5%, whereas the South-East and East-West corridors increase stronger due to the enlargement of the European Union and the improvement of fairway conditions in these areas.
This results in a slightly improved B/C ratio of 5.7.
The model is relatively stable in terms of adapted growth factors for the different corridors. The zero growth assumption reduces the B/C ratio for RIS implementation only to a limited, whereas moderate and optimistic growth scenarios lead to slight improvements of this ratio.
6.2 Operating costs
6.2.1 Drastic fuel cost rises In case fuel prices would rise drastically as a result of gasoil shortages, the benefits of RIS (reduction of fuel consumption) would need to be even larger than in the original moderate scenario. The default fuel price that was used in the model was EUR 404.68 per tonne, as an average figure for the last two years since mid-2004. This figure was based on gasoil prices paid in Western Europe and tends to be higher in other parts of Europe. The moderate scenario was therefore also calculated in case fuel prices would rise up to EUR 600 per tonne on the short term, which is not unrealistic given the growth rates in the last two years. The resulting B/C for the implementation of RIS amounts to 5.6 in this case, while the share of fuel costs rises to 16% of the total costs of the skipper.
6.2.2 Improved engine technology This scenario assumes that engine technology is improved to such an extent that the average fuel consumption of an inland vessel is reduced from 9 kg/1,000tkm to 7 kg/1,000tkm. This would mean that the potential fuel savings would be reduced, and ultimately results in a B/C ration of 5.2.
SPIN-TN Strategies to Promote Inland Navigation
Page 45 of 48 G:\PROJEKTE\SPIN\Working Groups (WG)\WG2
Systems & Technologies\Cost-Benefit Analysis RIS\Report\WG2 RIS CBA 0.7.doc
6.3 Stand-by costs
6.3.1 Reduced personnel, maintenance and interest costs The assumptions made for the stand-by costs were generally based on Western price levels. The costs of personnel, maintenance and interest might be lower in the East-West and South-East corridor. This especially pertains to the costs for pushed units. The costs of personnel for these pushed units are reduced by 50% (e.g. through the use of cheaper overseas personnel), whereas for the motorised vessel types these costs are reduced by 25%. Moreover interest costs are eliminated and maintenance costs for all vessel types are halved. The resulting B/C ratio (4.8) shows that the model is relative sensitive to stand-by costs assumptions.
6.4 On-board investments
6.4.1 Double on-board investment costs The default on-board investment costs are based on AIS-based RIS applications. The annual costs for communication and equipment are relatively limited in this case. Should the purchase of RIS equipment be twice as high (i.e. EUR4.600 per year instead of EUR2.300 per year), for example through higher GPRS communication costs, higher maintenance costs and a higher proportion of skippers that opt for radar mapping applications, the impact on the overall outcome of the model is substantial; a B/C ratio of 3.7. However, even under these extreme circumstances, the implementation of RIS would still pay off from the macro-economic perspective.
6.5 Land-side investments
6.5.1 25% higher land-side investments The data on land-side investments were based on the officially reported costs by the competent authorities. For some countries these reported costs seem to be underestimated. In case the land-side investment costs were raised by 25% over the entire period between 2005 and 2010, the B/C ratio would be 4.7 instead of the original 5.4.
SPIN-TN Strategies to Promote Inland Navigation
Page 46 of 48 G:\PROJEKTE\SPIN\Working Groups (WG)\WG2
Systems & Technologies\Cost-Benefit Analysis RIS\Report\WG2 RIS CBA 0.7.doc
7 CONCLUSIONS
7.1 Main outcome
The overall observation that can be made on the basis of the model outcomes is that the implementation of River Information Services in Europe is highly cost-efficient from a macro-economic point of view. Taking into account all measured benefits and costs, the implementation of European RIS between 2005 and 2010 will yield a Benefits/Costs ratio that varies between 3.0 (conservative base scenario just fulfilling the minimum requirements from the RIS Directive) and 7.4 (in an optimised scenario with immediate and full-scale RIS implementation). A moderate introduction of RIS in Europe results in a B/C ratio of 5.4.
Considering that the analysis model incorporates only a subset of the possible benefits of RIS implementation (see Figure 3), the results of the analysis confirm that even limited implementation of River Information Services will bring significant benefits to the users of RIS as well as to society as whole. Extended implementation of RIS thereby clearly pays off: additional services result in additional benefits on the micro- and macro-economic level.
7.2 Model performance
A sensitivity analysis showed that the model is relatively sensitive to changes in land-side and on-board investment costs, and performs relatively stable under different transport volume scenarios. The effects incorporated in the analysis model under all circumstances justify the comprehensive implementation of RIS in Europe.
The model’s setup is flexible and is capable of handling different model scenarios, for instance different growth scenarios (e.g. annual transport volume growth of 1.5%), different costs scenarios, varying technological assumptions (e.g. AIS or other technologies such as AI-IP). Moreover, the fleet data incorporated in the model can be elaborated to reflect the real fleet development in the four main corridors.
SPIN-TN Strategies to Promote Inland Navigation
Page 47 of 48 G:\PROJEKTE\SPIN\Working Groups (WG)\WG2
Systems & Technologies\Cost-Benefit Analysis RIS\Report\WG2 RIS CBA 0.7.doc
7.3 Further research needs
7.3.1 Statistical needs Every model is obviously a simplified version of reality. The analysis model that was developed in the framework of SPIN-TN also had to make compromises due to a partial lack of data. Lacking data were mainly encountered in the following fields:
• Reliable and harmonised origin-destination data regarding international intermodal transport;
• Consistent and up-to-date national and international fleet registers; • Identification of the share of inter-modal and time-critical shipments as opposed to
traditional inland navigation; • Information on standby costs and operational costs for different transport corridors
and fleet types; • Structured information on accidents on a detailed level, in order to determine the
possible effects of RIS more efficiently.
7.3.2 Pro memoria effects Due to a lack of reliable data some potentially large effects have not been taken into account in the model. These factors are called pro memoria effects to reflect the fact that these benefits should be pursued in future efforts to appraise the positive impacts of RIS implementation:
• Positive effects of RIS on the efficiency of authorities o More efficient lock and bridge operation o More efficient statistical data collection o More efficient custom and law enforcement procedures o More effective waterway maintenance
• Improved efficiency at terminals • Improved security
More in-depth research will be needed to calculate current costs levels and to determine the potential reductions of these types of costs.

Page 48 of 48 G:\PROJEKTE\SPIN\Working Groups (WG)\WG2
Systems & Technologies\Cost-Benefit Analysis RIS\Report\WG2 RIS CBA 0.7.doc