assessment of the long steel cartel: rebar overcharge ... · pdf fileassessment of the long...
TRANSCRIPT
1
Assessment of the long steel cartel: rebar overcharge estimates1
Reena Das Nair2, Pamela Mondliwa3, and Andrew Sylvester4
Draft: Not for Citation
[email protected], [email protected], [email protected]
Abstract
The South African competition authorities have successfully prosecuted a number of cartels in various markets since their inception, particularly since the introduction of the Competition Commission’s Corporate Leniency Policy in 2004. There is growing pressure on competition and regulatory bodies to undertake impact assessments of their interventions in markets, and authorities around the world are increasingly attempting to quantify the benefits of interventions for consumers, or conversely, the harm caused by anticompetitive conduct. However, estimates of cartel overcharges have only recently been calculated by the South African authorities and only in a small number of cases. This may explain the low levels of damages claims even though the Competition Act makes provision for such, limiting the strong potential deterrence effect damages claims could have. In this paper, we measure the cartel overcharge in percentage terms and the consequent damages in rand terms in the reinforcing steel bar (rebar) market, a market in which a cartel operated between 1999 and 2008. We do this by applying the ‘difference-in-difference’ methodology, with our primary comparison being the cartelised rebar domestic price over the export rebar price. The results are presented for two counterfactual scenarios based on Bertrand competition and a leader-follower model of competition. We debate the pass-through effect and its impact on the calculated damages. Finally, we highlight the inherent difficulties in interpreting results of such analyses, particularly in industries where there are cartels in multiple levels of the value chain, where there is considerable ‘noise’ given external shocks, and where cartel behaviour is so entrenched that conduct may persist well after the ‘formal’ cartel ends.
1 The views in this paper are solely the authors’ own. 2 Reena das Nair is a Senior Researcher at the Centre for Competition, Regulation and Economic Development (CCRED), University of Johannesburg 3 Pamela Mondliwa is a Researcher at the Centre for Competition, Regulation and Economic Development (CCRED), University of Johannesburg 4 Andrew Sylvester is an Economist at DNA Economics
2
1. Introduction
The South African Competition Commission has had much success in uncovering and
prosecuting cartels in various markets since their inception and particularly since the introduction
of the Competition Commission’s Corporate Leniency Policy (CLP) in 2004. The public is
however more interested in whether successful prosecution of these cartels translates to more
competitive outcomes in markets. Hence there is pressure on competition authorities to quantify
the impact of their interventions in markets and authorities around the world are increasingly
attempting to quantify the benefits of interventions for consumers, or conversely, the harm caused
by anticompetitive conduct. As the Competition Act regards cartels as per se violations there has
been little written on the harm caused by South African cartels. Cartel overcharges thus far have
only been estimated for the concrete pipes, wheat flour and bitumen cartels and all studies have
been done in the last three years.5 Cartel overcharge estimates are not only important to quantify
the impact of the Commission’s work in markets but also serve as useful indicators for victims of
cartel conduct to claim damages against the cartelists.
In South Africa, there have been very few, if any, damage claims even though the Act makes
provision for these. This limits the strong potential deterrence effect that damages claims could
have on anticompetitive conduct. One of the ways that competition authorities contribute to
improved competitive outcomes is by deterring companies from engaging in anticompetitive
conduct such as cartels. The ability to deter future engagement in anticompetitive conduct and to
eliminate financial gain or benefit from non-compliance is key to successful competition policies
(Darji, Grimbeek and Muzata, 2011). Deterrence is to a large extent based on the threat of costs
of engaging in cartels vis-á-vis the expected benefits of the conduct. For the threat of the cost of
engaging in the cartel to be credible, it requires that there is a high probability of detection and
that the sanctions outweigh the benefits.
The Corporate Leniency Policy and general investigative procedures have made headway in
increasing the likelihood of detection and reducing the duration of cartels. However, when it
comes to the sanctions, the focus has largely been limited to the appropriate design of
administrative penalties. Though the penalties are a very important tool for deterrence they are
unlikely to completely remove the gains from anticompetitive conduct, particularly when the
penalties are capped. Literature on optimal deterrence emphasises the need to reclaim the net
cartel gains, once the cartel has been detected (Connor, 2014). Damage claims are a useful
mechanism for victims of the cartel conduct to reclaim the overcharge and the threat of damage
claims over and above the administrative penalties will likely mean that the cost of engaging in
anticompetitive conduct such as cartels outweighs the gains from the conduct.
The size of the cartel harm is positively related to the size of the cartelised market, the duration
of the conduct and the size of the cartel overcharge. Two of these factors are readily available
when the cartel case is finalised, however the size of the overcharge is not. The legal costs
associated with damage claim actions and the uncertainty on the size of the overcharge may
5 The Competition Commission may have conducted more impact assessments but these listed studies are the only ones available in the public domain.
3
leave cartel victims unsure of the benefits of pursuing these actions. Thus the estimations of the
cartel overcharges will encourage firms to pursue damages.
This paper attempts to calculate cartel overcharges and damages in the previously cartelised
reinforcing steel bar (rebar) market in South Africa, where a cartel operated between 1999 and
2008. It explores the possible counterfactual scenarios used to determine what prices would be
in a non-collusive setting and applies the ‘difference-in-difference’ methodology to determine what
the overcharge may be. The paper is structured as follows. Section 2 reflects on theoretical
approaches to estimating cartel overcharges, damage and impact assessments. Section 3 gives
the background to the rebar cartel in South Africa and in Section 4, we estimate actual overcharge
and associated damages. Section 5 highlights the inherent difficulties in interpreting results of
such analyses. Section 6 concludes.
2. Approaches to damages estimations and impact assessments
A cartel is an explicit agreement between a group of similar, independent firms to jointly fix prices,
limit production or to share markets or customers between them. The expectation is that such
agreements will raise prices above the competitive levels. The difference between the cartel price
and the competitive or counterfactual price is known as the cartel overcharge or mark-up.
Cartel overcharges are calculated to estimate the harm that the cartel causes and, as stated
before, are used as a basis for calculating fines and damages. There are a number of
methodologies that can be used to calculate cartel overcharges and there is extensive literature
on the various methods of calculations, including the pros and cons of each (Davies and Ormosi,
2010; van Dijk und Verboven, 2008 and OXERA, 2009).
These methods can be grouped into three main categories: comparator based, financial
performance based and market structure based (OXERA, 2009). Thee comparator based method
is often adopted by competition authorities. It uses either cross-sectional comparisons, time-
series comparisons, or a combination of both approaches in so-called ‘difference-in-differences’
models (Hüschelrath, Müller and Veith, 2012).
Cross sectional comparisons conduct the assessment by comparing different geographic or
product markets, while time series comparisons analyse prices before, during and/or after an
infringement, often referred to as the before-and-after method. The difference-in-difference
method assess the change in price for a cartelised market over time, and compare this change
against the change in price in a non-cartelized market over the same time period. Financial
performance based models use financial information and could include event studies where
financial market data is used to measure the effect of an economic event on the market valuation
of a firm (Davies and Ormosi, 2010). Market structure methods apply industrial organisation (IO)
structural models to simulate the counterfactual price. There is no one-size-fits-all method and
when selecting a method for a study, careful consideration must be given to the input
requirements versus data availability, conceptual complexity, technical complexity and the
applicability of the underlying assumptions to a particular case.
Recently there have been a number of studies that seek to give an impression of “typical” cartel
overcharges. These studies are often in the form of surveys of cartel overcharges over different
4
countries and products. The international averages are widely reported on and typically range
from 0% to 70% with the median at 18% of the cartel price and the mean/average at 20% of the
cartel price (Hüschelrath et al, 2012). Though the South African Competition Commission has
successfully prosecuted a number of cartels since its inception the cartel overcharge has only
been calculated in very few cases. Khumalo, Mashiane and Roberts (2012) estimated cartel
overcharges between 21 and 57% for concrete pipes in Kwa-Zulu Natal and 16.5% in Gauteng.
Mncube (2013) calculated the white bread flour cartel overcharge at 23.7% in the Western Cape
and 13.1% in Gauteng province. Boshoff (2013) conducted his assessment for bitumen and found
that the cartel overcharge was between 18 and 20%. These are all cartels that took place around
the same time as the rebar cartel.
3. Background to the cartel
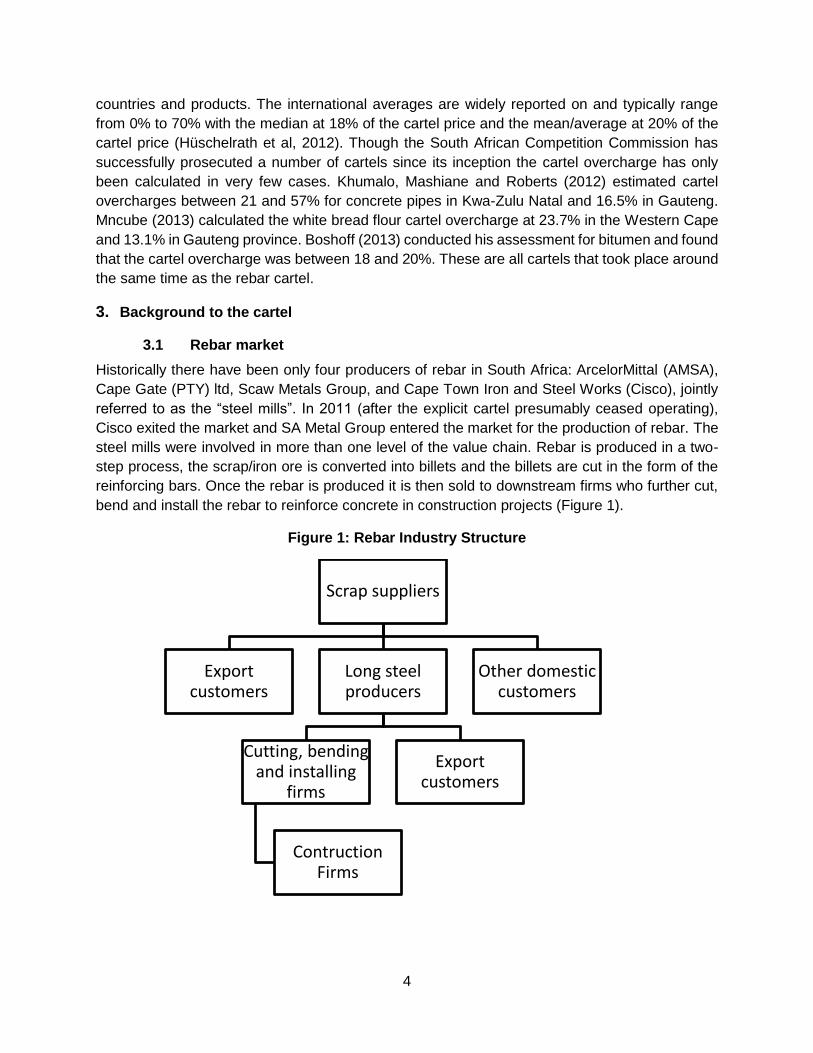
3.1 Rebar market
Historically there have been only four producers of rebar in South Africa: ArcelorMittal (AMSA),
Cape Gate (PTY) ltd, Scaw Metals Group, and Cape Town Iron and Steel Works (Cisco), jointly
referred to as the “steel mills”. In 2011 (after the explicit cartel presumably ceased operating),
Cisco exited the market and SA Metal Group entered the market for the production of rebar. The
steel mills were involved in more than one level of the value chain. Rebar is produced in a two-
step process, the scrap/iron ore is converted into billets and the billets are cut in the form of the
reinforcing bars. Once the rebar is produced it is then sold to downstream firms who further cut,
bend and install the rebar to reinforce concrete in construction projects (Figure 1).
Figure 1: Rebar Industry Structure
Scrap suppliers
Export customers
Long steel producers
Cutting, bending and installing
firms
Contruction Firms
Export customers
Other domestic customers
5
All the producers of rebar except for AMSA process scrap steel in an electric arc furnace, AMSA
uses both iron ore and scrap processed in a blast furnace in the Newcastle plant and an oxygen
furnace in the Vereeniging plant. As a consequence of conversion methodologies, AMSA has a
different cost structure to the rest of the producers.
Estimated rebar production capacity for the steel mills are 200 000 tons per annum for AMSA and
Scaw, Cape Gate and Cisco 180 000 tons per annum SA Metals entered at 54 000 tons per
annum. However, it is noteworthy that the mills can substitute between rebar and wire rod
production with relative ease. Thus the rebar production capacity could be a construct of the
cartel. There is excess capacity of rebar production in South Africa resulting in exports of
approximately 30% of total production.
The industry was relatively stable during the cartel period, with entry and exit only occurring after
the cartel presumably ceased. Also, there appears to have been little change in production
capacity of the existing mills, aside from debottlenecking efforts. In 2001, Scaw built a new
furnace which increased its output by 20% to its present capacity. One would expect more
competitively priced input costs due to the excess supply of scrap steel. The rebar market itself
displayed excess capacity itself with significant exports during and after the cartel.
3.2 Rebar cartel
The alleged cartel began in 1999 and presumably ended after the Commission’s dawn raid in
June-2008. The cartel was primarily a price fixing cartel in contravention of section 4 (b) (i) of the
Competition Act, however, it had elements of market allocation (4(b) (ii)), and the mills had vertical
agreements with the steel merchants that induced merchants not to import cheaper steel into the
country (Njisane, 2011). The Commission found that representatives of the long steel mills
attended formal and informal meetings where levels of prices and discounts were discussed and
agreed upon. The steel mills had a long-standing arrangement that AMSA as the market leader
would announce the prices for various long steel products and other mills would follow the price
increases (Nontombana and Lesofe, 2010). There was effectively one delivered price in the
domestic market, despite the different locations of the rebar producers and other long steel
products such as sections being priced on an ex-works basis. Cape Gate has plants in
Johannesburg and Vanderbijlpark, AMSA has long steel plants in Newcastle and Vereeniging,
Scaw has a plant in Germiston and Cisco had a plant in Cape Town. Johannesburg,
Vanderbijlpark, Germiston, Vereening are in the inland region and Newcastle is approximately
280 km and Cape Town approximately 1400km from this region.
In addition to the price fixing there was a general understanding between the mills that certain
customers belonged to certain mills and that targeting a “traditional” customer of another mill
would result in retaliation against the offender. This constituted dividing markets by allocating
customers.
It was also found that the steel mills reached agreements regarding the supply of long steel
products to downstream contractors/ merchants who had been awarded contracts to supply such
products to three large construction projects. In this regard, the mills agreed to allocate to each
other equal shares of the steel required for each project.
6
The stability of a cartel is dependent on the ability of the members to monitor each other to ensure
that all parties were adhering to the agreement and detect cheaters so as to punish. The rebar
cartel members are likely to have overcome this challenge by exchanging information through the
industry association, South African Iron and Steel industry Association, SAISI. The association
operated in such a manner that all its members submitted highly disaggregated information on
output which was combined by SAISI and then supplied to all members in an aggregated form
monthly. The information disseminated by SAISI to long steel producers was broken down by
product by HS code.6 The members also supplied information regarding the programmes on
capital expenditure twice a year. From this, individual members were able to keep track of their
market share and could pick up easily when cheating had occurred.
The exchange of detailed information through the SAISI platform may have allowed mills to
monitor market shares of their competitors and along with market intelligence, permitting mills to
see who had deviated from the collusive agreements. The information exchange through SAISI
thus may have facilitated the various agreements reached by the mills.
The leniency process revealed that there were punishment mechanisms for players that did not
adhere to the agreements. If it was found that a steel mill was selling to a customer of another
mill, the other mill would retaliate by targeting a customer of the cheating mill. This sort of
behaviour would persist for a period of time until the mills would meet and attempt to sort out the
issue. At times the mills would engage in price wars in an attempt to take customers from the
cheating mill. The above interactions show that there seemed to be the constant threat of price
wars if the mills did not stick to agreed prices or allocated/traditional customers.
4. Estimating the cartel overcharge
4.1 The counterfactual
In our view, the appropriate method used to estimate the counterfactual price during the cartel
period is a comparison with the export price rather than the actual costs of production. This is
because the decision is not between producing the rebar or not, it is between selling it into the
domestic market or the export market. Importantly, it is not assumed that the domestic market
would have been as competitive as the ‘world’ market for rebar but for the cartel, rather the export
price is used as the opportunity cost and thus the comparator for a difference-in-difference
analysis. In other words, we do not simply assume that because this industry exports product that
the domestic price should be the export price. If the market behaves in a fashion similar to
aggressive price or Bertrand competition, then it is indeed possible that the domestic price would
have been very similar to the export price. If, however, the competitive dynamics in the domestic
market are better approximated by Cournot competition, then a premium above the export price
can be expected to have existed during the cartel.
The deepsea export price is the opportunity cost of domestic sales because South African rebar
producers can divert sales volumes from one market to the other. The product specifications are
6 This is the Harmonised System used in trade data to categorize products to a high degree of specificity.
7
exactly the same and South African rebar producers are already exporting significant volumes.
Thus the product is both acceptable on the world markets and customer or trader relationships
already exist. Also, it is the deepsea export price as opposed to Africa overland export prices that
is the opportunity cost of domestic sales because the overland exports are more akin to the
domestic market with the only difference being that they cross political boundaries.
For the deepsea export price to be a legitimate opportunity cost, it should always be at most equal
to the domestic price. If this were not the case and there were many instances where the export
price was higher than the domestic price without simple explanations, then it is likely that there
are differences between the two markets in respect of product characteristics such as quality or
transaction characteristics such as contractual terms or requirements. Firms may also be willing
to offer a firm a price at a discount to what they might be able to receive elsewhere in order to
earn goodwill with that company which will be yield returns in the long run.
The only times when the export price was above the domestic price in the South African rebar
market was when a price war broke out between cartel partners at the end of 2001 and beginning
of 2002, and when domestic price increases were unable to keep up with unprecedented
increases in the world price in 2008. This first instance, the price war, supports the use of the
export price as the opportunity cost because the domestic price would have been dropped to a
very low level in order to punish the firm suspected of cheating on the cartel agreement. The
second instance can be a combination of contractual price stickiness as well as rebar suppliers
not wanting to alienate construction firms with whom they have long term relationships. The
second instance of relatively low domestic prices thus does not undermine the use of the export
price as the opportunity cost.
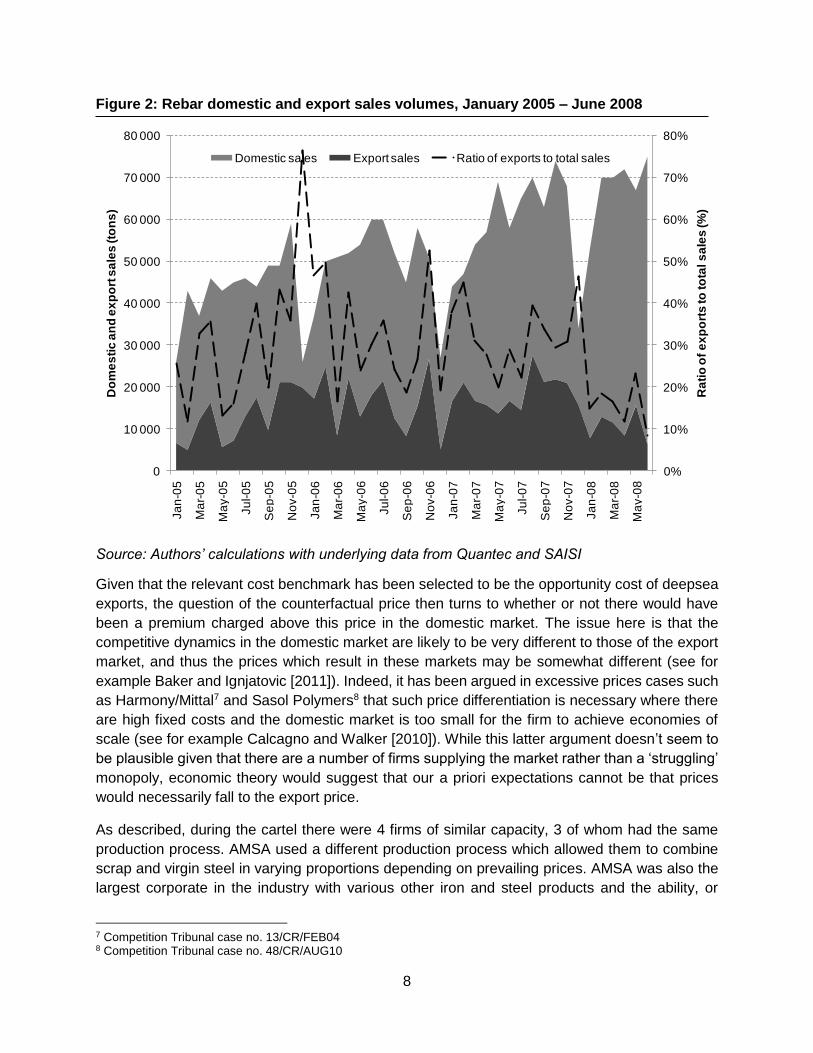
Figure 2 shows the total volumes of rebar output by South African producers divided into domestic
and export sales. The data used to produce this were the total output data collected by SAISI
which was ended in June 2008, and the export volumes from Quantec. Total output grows steadily
over the period with the only significant deviation coming with the shut down for the December
holidays each year. Exports as a percentage of total output fluctuates somewhat, but is above
10% of output in every month of the period but one, and is on average 30% of total output. It
seems then that domestic producers are able to, and have, changed the actual and relative export
volumes month to month. During the cartel this was likely to be done to ensure that the agreed
domestic price was achieved. In a counterfactual competitive market, however, firms would just
as easily have moved sales between domestic and export customers in order to maximise profits
whichever form of competition is assumed. The use of the deepsea export price rather than a
build-up of the costs of production thus seems to be a credible basis for calculating the
counterfactual price.
8
Figure 2: Rebar domestic and export sales volumes, January 2005 – June 2008
Source: Authors’ calculations with underlying data from Quantec and SAISI
Given that the relevant cost benchmark has been selected to be the opportunity cost of deepsea
exports, the question of the counterfactual price then turns to whether or not there would have
been a premium charged above this price in the domestic market. The issue here is that the
competitive dynamics in the domestic market are likely to be very different to those of the export
market, and thus the prices which result in these markets may be somewhat different (see for
example Baker and Ignjatovic [2011]). Indeed, it has been argued in excessive prices cases such
as Harmony/Mittal7 and Sasol Polymers8 that such price differentiation is necessary where there
are high fixed costs and the domestic market is too small for the firm to achieve economies of
scale (see for example Calcagno and Walker [2010]). While this latter argument doesn’t seem to
be plausible given that there are a number of firms supplying the market rather than a ‘struggling’
monopoly, economic theory would suggest that our a priori expectations cannot be that prices
would necessarily fall to the export price.
As described, during the cartel there were 4 firms of similar capacity, 3 of whom had the same
production process. AMSA used a different production process which allowed them to combine
scrap and virgin steel in varying proportions depending on prevailing prices. AMSA was also the
largest corporate in the industry with various other iron and steel products and the ability, or
7 Competition Tribunal case no. 13/CR/FEB04 8 Competition Tribunal case no. 48/CR/AUG10
0%
10%
20%
30%
40%
50%
60%
70%
80%
0
10 000
20 000
30 000
40 000
50 000
60 000
70 000
80 000
Ja
n-0
5
Ma
r-0
5
Ma
y-0
5
Ju
l-0
5
Se
p-0
5
No
v-0
5
Ja
n-0
6
Ma
r-0
6
Ma
y-0
6
Ju
l-0
6
Se
p-0
6
No
v-0
6
Ja
n-0
7
Ma
r-0
7
Ma
y-0
7
Ju
l-0
7
Se
p-0
7
No
v-0
7
Ja
n-0
8
Ma
r-0
8
Ma
y-0
8
Ra
tio
of
ex
po
rts
to
to
tal s
ale
s (%
)
Do
me
sti
c a
nd
ex
po
rt s
ale
s (to
ns
)
Domestic sales Export sales Ratio of exports to total sales

9
perhaps just the perceived ability, to expand rebar output without much difficulty. There is thus
some evidence that the counterfactual dynamic might have been a Cournot oligopoly or tacit
collusion with a price leader.
There are also very good arguments in support of using Bertrand competition in the construct of
the counterfactual. The cartel operated primarily as a price fixing cartel which would suggests that
the strategic variable of interaction might be price and hence a form of Bertrand competition might
have existed but for the cartel. However, there were elements of quantity fixing or market
allocation cartel and the behaviour of the cartelists appeared to be monitored through the
information exchange of sales volumes. Thus quantity was could also be regarded as an
important variable for interaction, suggesting that Cournot competition may have existed but for
the cartel. We note that Cournot competition is predicated upon firms’ ability to accurately predict
their competitors’ supply into the market in order for them to decide on their own profit maximising
quantity to supply. Given that product sold onto the export market is identical to that sold on the
domestic market, it is difficult to predict a competitor’s supply into the domestic market even if
capacity and total output information is perfectly known. If the degree of volatility in the supply to
the export market during the cartel is indicative of what the volatility might have been in the
counterfactual world, then it is difficult to see how firms would have been able to make these
predictions accurately.
We do, however, also know that firms tended to follow AMSA’s pricing during the cartel. It is
possible then that this would have continued after the end of the cartel. This conscious price
parallelism might be thought of as a form of tacit collusion. Though the information exchange
framework maintained by SAISI, was ended in June 2008 with the end of the cartel itself. Firms
might still be incentivised to price in a similar way to existing arrangement by following AMSA.
Post cartel there may be discounting, however, this may not to result in vigorous price competition
between firms that would drive all the way to the export price.
We acknowledge that the firms’ ability to discount on certain projects or to certain customers
without being monitored by competitors to have done so or having to offer the same discounts to
other customers may impede the firms’ ability to maintain some infinite Bertrand type game but
the same could be argued for price leadership model. Discounting will make any infinite Bertrand
game reduce to the same result as a one-shot game for as long as firms have excess capacity.
Firms indeed had excess capacity during the cartel even after taking exports into account. The
industry only started producing at capacity in some months in 2007 and 2008. Even in these
months, however, there were exports that could have been diverted to the domestic market.
These exports can be thought of as excess capacity to supply the domestic market when
considering the Bertrand model of competition. Although it is not, and cannot be, a definitive
conclusion, it seems that the counterfactual form of competition would have been tacit collusion
with price-leadership with AMSA as the price leader. However, given that this conclusion cannot
be definitive, we present markups for both the price leadership model and Bertrand competition
Bertrand competition with excess capacity of a homogenous product. mark-up as a robustness
check.

10
. In the Bertrand counterfactual it would be expected then that the price would have been very
close to costs or, in our analysis, very close to the opportunity cost of the deepsea export price.
4.2 Data used
The estimates of the cartel overcharge are based on comparisons of domestic prices with those
of export prices. The domestic price is sourced from producer data net of volume and settlement
discounts and cross checked against customer data. These data were obtained through various
investigations by the Competition Commission of South Africa and hence the underlying individual
data are confidential. The domestic price data are monthly measures of rebar in Rands per ton.
The export price data were calculated from volume and value of rebar exports collected by
Quantec. It was assumed that the products recorded as H72142000 and H72131000 according
to the harmonised system were all rebar exports. The data were collected and aggregated for
export destinations which would require seaborne trade. This thus excluded exports to Namibia,
Botswana, Zimbabwe, Mozambique, Lesotho, Swaziland, Malawi and Zambia from the data. The
reason for this exclusion was that suppliers from South Africa have transport advantages that
allow them to price in these destinations similarly to their South African prices. Put differently,
these destinations are in the same relevant competition market as South Africa despite political
boundaries. Indeed, many are even within the SADC free trade region. The accuracy of the
Quantec data were cross checked against various producers’ export prices in recent years as well
as historic confidential data collected from the Harmony Mittal9 case. The export data are in Rands
per ton and monthly for the period January 2005 to June 2012 and annual prices from 1999 to
2004 (monthly data were not available from Quantec before January 2005).
4.3 Description of the data and preliminary observations
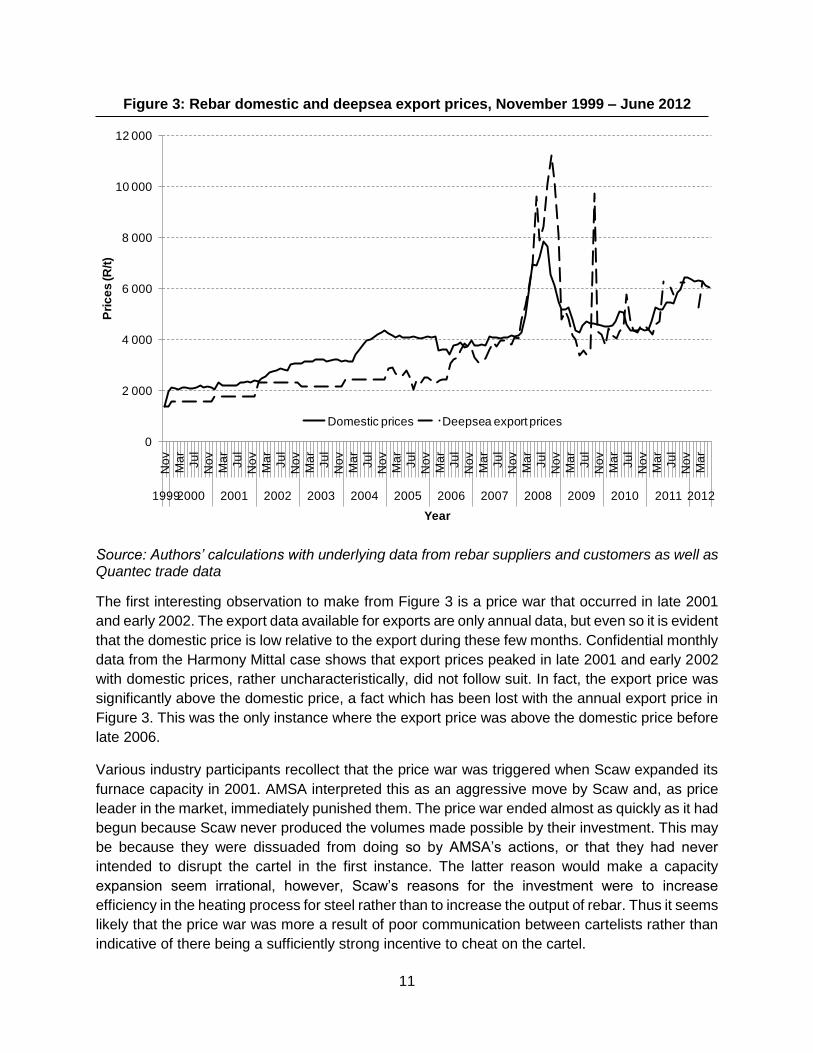
Figure 3 shows the domestic and deepsea export prices for the period from November 1999 to
June 2012. It seems that the domestic price was consistently above the export price until late
2006 and 2007 when they seem to be broadly similar. For most of 2008 the domestic price was
below the export price. For the period after 2009 it seems that the export price and the domestic
price were on average very similar. There are distinct short periods where one is larger than the
other in this later period, however no pattern seems to emerge.
9 Competition Tribunal case no. 13/CR/FEB04
11
Figure 3: Rebar domestic and deepsea export prices, November 1999 – June 2012
Source: Authors’ calculations with underlying data from rebar suppliers and customers as well as Quantec trade data
The first interesting observation to make from Figure 3 is a price war that occurred in late 2001
and early 2002. The export data available for exports are only annual data, but even so it is evident
that the domestic price is low relative to the export during these few months. Confidential monthly
data from the Harmony Mittal case shows that export prices peaked in late 2001 and early 2002
with domestic prices, rather uncharacteristically, did not follow suit. In fact, the export price was
significantly above the domestic price, a fact which has been lost with the annual export price in
Figure 3. This was the only instance where the export price was above the domestic price before
late 2006.
Various industry participants recollect that the price war was triggered when Scaw expanded its
furnace capacity in 2001. AMSA interpreted this as an aggressive move by Scaw and, as price
leader in the market, immediately punished them. The price war ended almost as quickly as it had
begun because Scaw never produced the volumes made possible by their investment. This may
be because they were dissuaded from doing so by AMSA’s actions, or that they had never
intended to disrupt the cartel in the first instance. The latter reason would make a capacity
expansion seem irrational, however, Scaw’s reasons for the investment were to increase
efficiency in the heating process for steel rather than to increase the output of rebar. Thus it seems
likely that the price war was more a result of poor communication between cartelists rather than
indicative of there being a sufficiently strong incentive to cheat on the cartel.
0
2 000
4 000
6 000
8 000
10 000
12 000
No
v
Ma
r
Ju
l
No
v
Ma
r
Ju
l
No
v
Ma
r
Ju
l
No
v
Ma
r
Ju
l
No
v
Ma
r
Ju
l
No
v
Ma
r
Ju
l
No
v
Ma
r
Ju
l
No
v
Ma
r
Ju
l
No
v
Ma
r
Ju
l
No
v
Ma
r
Ju
l
No
v
Ma
r
Ju
l
No
v
Ma
r
Ju
l
No
v
Ma
r
19992000 2001 2002 2003 2004 2005 2006 2007 2008 2009 2010 2011 2012
Pri
ce
s (R
/t)
Year
Domestic prices Deepsea export prices
12
The second event partially evident from Figure 3, and the focal point for this paper, is the ending
of the cartel in June 2008. It is only partially evident because there are a number of other forces
acting on the market in and around this period. The first is a somewhat prolonged spike in the
world price of rebar for most of 2008. Domestic prices also spiked in the same period, but to a
lesser extent. The reason for this may be because of price fluctuation limits in domestic contracts
along with a weakening cartel which was then discovered in the middle of the year. There had
also been a boom in the construction sector which ended after 2008. In addition to these changes
in the market, the competition authorities had put an end to a number of cartel in the construction
industry.
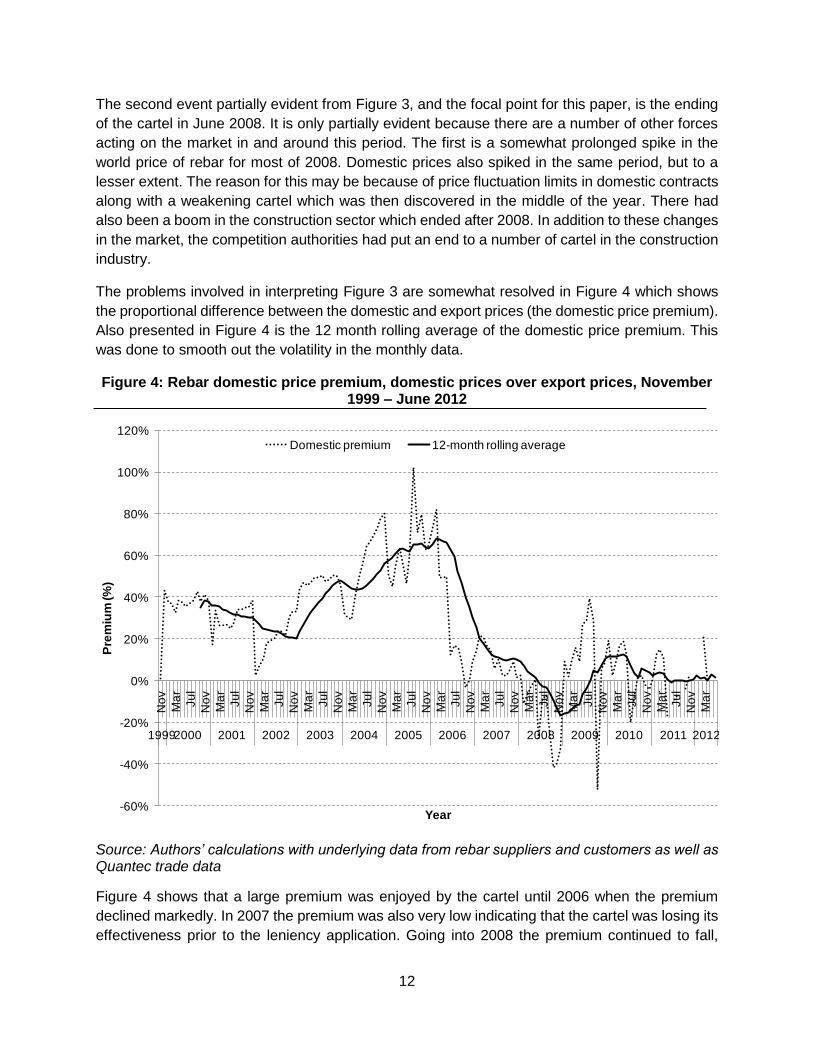
The problems involved in interpreting Figure 3 are somewhat resolved in Figure 4 which shows
the proportional difference between the domestic and export prices (the domestic price premium).
Also presented in Figure 4 is the 12 month rolling average of the domestic price premium. This
was done to smooth out the volatility in the monthly data.
Figure 4: Rebar domestic price premium, domestic prices over export prices, November 1999 – June 2012
Source: Authors’ calculations with underlying data from rebar suppliers and customers as well as Quantec trade data
Figure 4 shows that a large premium was enjoyed by the cartel until 2006 when the premium
declined markedly. In 2007 the premium was also very low indicating that the cartel was losing its
effectiveness prior to the leniency application. Going into 2008 the premium continued to fall,
-60%
-40%
-20%
0%
20%
40%
60%
80%
100%
120%
No
v
Ma
r
Ju
l
No
v
Ma
r
Ju
l
No
v
Ma
r
Ju
l
No
v
Ma
r
Ju
l
No
v
Ma
r
Ju
l
No
v
Ma
r
Ju
l
No
v
Ma
r
Ju
l
No
v
Ma
r
Ju
l
No
v
Ma
r
Ju
l
No
v
Ma
r
Ju
l
No
v
Ma
r
Ju
l
No
v
Ma
r
Ju
l
No
v
Ma
r
19992000 2001 2002 2003 2004 2005 2006 2007 2008 2009 2010 2011 2012
Pre
miu
m (%
)
Year
Domestic premium 12-month rolling average
13
however, this must be viewed in light of large increases in actual prices. The world price was at
record highs and the domestic price likewise. Firms would have been making significant profits
even though the domestic price was at a discount to the export price. Firms would have known
that the spike would be short lived and hence may have been somewhat accommodating to large
domestic customers with whom a long term relationship was more valuable than extra short term
profits.
The world price plummeted from its highs in late 2008 and bottomed out in mid-2009. The
domestic price also fell sharply, however, in early and mid-2009 it was once again at a premium
to the export price. This continued on aggregate for most of 2009 and the first half of 2010,
however, there seems to have been a large degree of instability over this period. The average
premium during this time is similar to the premium enjoyed in 2006 and 2007 when the cartel
seems to have lost its potency. By the latter half of 2010 to the end of our dataset in June 2012
the premium normalised to marginally above zero on aggregate.
The result that domestic prices were above their benchmark immediately following the break-up
of the cartel is not an unusual finding. Cartelists are able to use information learned during the
cartel to achieve a certain degree of coordination. In the absence of effective monitoring and
punishment mechanisms, however, these post cartel premium disappear. This is in the least a
plausible explanation for the evolution of the rebar price premium in this instance.
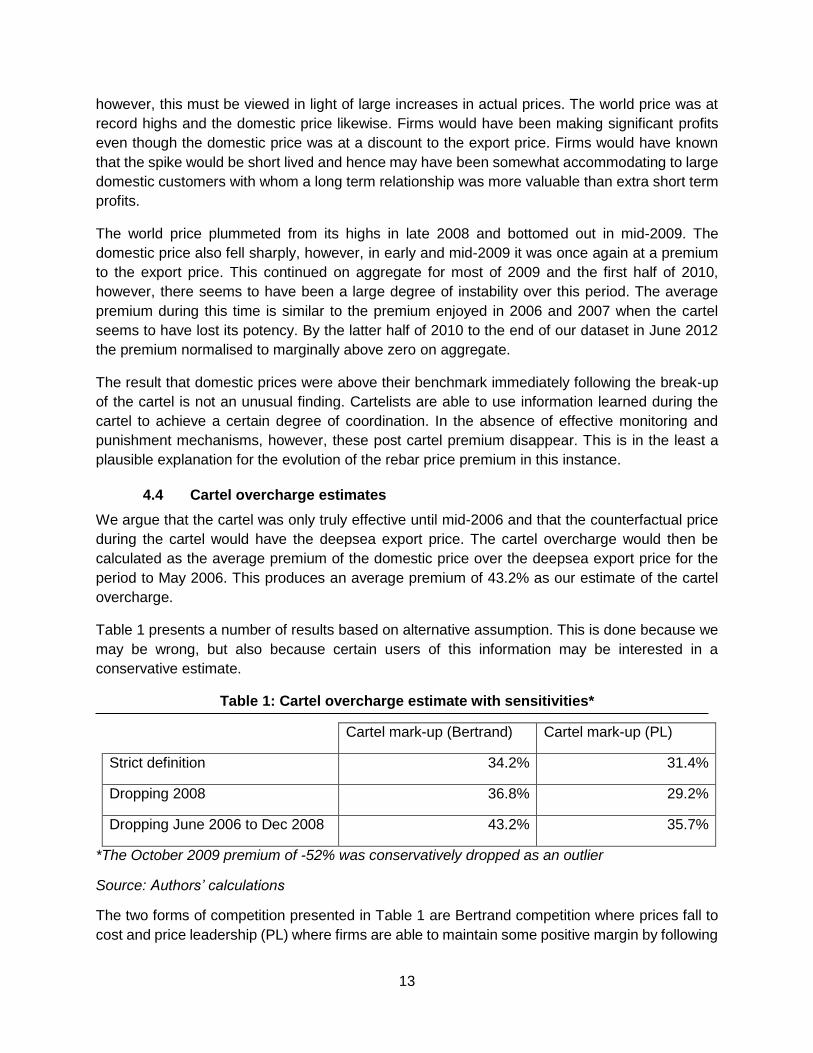
4.4 Cartel overcharge estimates
We argue that the cartel was only truly effective until mid-2006 and that the counterfactual price
during the cartel would have the deepsea export price. The cartel overcharge would then be
calculated as the average premium of the domestic price over the deepsea export price for the
period to May 2006. This produces an average premium of 43.2% as our estimate of the cartel
overcharge.
Table 1 presents a number of results based on alternative assumption. This is done because we
may be wrong, but also because certain users of this information may be interested in a
conservative estimate.
Table 1: Cartel overcharge estimate with sensitivities*
Cartel mark-up (Bertrand) Cartel mark-up (PL)
Strict definition 34.2% 31.4%
Dropping 2008 36.8% 29.2%
Dropping June 2006 to Dec 2008 43.2% 35.7%
*The October 2009 premium of -52% was conservatively dropped as an outlier
Source: Authors’ calculations
The two forms of competition presented in Table 1 are Bertrand competition where prices fall to
cost and price leadership (PL) where firms are able to maintain some positive margin by following
14
AMSA as the price leader. The assumptions made in the Bertrand calculations is that price would
fall to deepsea export prices, and so estimates in that column are the average of the domestic
premium above deepsea exports for the relevant period. The assumption made in the price
leadership column is that the post cartel period is indicative of the counterfactual market-up that
would have been achieved through price leadership as opposed to through the cartel. The
estimates in this column are thus the difference between the average premium during the cartel
and the average premium after the cartel.
The “strict definition” defines the cartel as ending in June 2008. The Bertrand estimate is thus for
the period from November 1999 to June 2008. The price leadership estimate is the premium from
November 1999 to June 2008 less the average premium from July 2008 to June 2012.
The row called “Dropping 2008” treats the 2008 year as an anomaly year given the spike in the
world price and the less than commensurate spike in the domestic price. The Bertrand estimate
is thus ended at December 2007 and the price leadership estimate is the difference between the
premium to December 2007 and the premium from January 2009 to June 2012.
The row called “Dropping June 2006 to Dec 2008” treats the 2008 year as an anomaly year as
well as the June 2006 to December 2007 period as a period in which the cartel was ineffective.
This is no strong evidence that the cartel was losing effectiveness other than the fact that margins
diminished as a result of domestic prices not increasing while export prices did increase. The
Bertrand estimate is calculated as the average premium to May 2006 and the price leadership
estimate is calculated as the difference in the average premium to May 2006 and the average
premium from January 2009 to June 2012.
Note that in all the price leadership estimates presented in Table 1 the October 2009 premium
was dropped as an outlier. This has the effect of increasing the estimate of the average premium
in the post-cartel period and hence reducing the price leadership estimates by 1.3% for the strict
definition and 1.6% for the other two estimates. For this reason we believe this to be the
conservative approach. The treatment of this outlier has no effect on the Bertrand estimates
because this method does not take into account any post cartel mark-up.
4.5 Valuing the cartel overcharge
The economic literature is comfortable with estimating cartel overcharges in percentage terms.
This is because it is the best means of understanding the cartel’s effectiveness in increasing
prices. A damages estimation then takes the overcharge results and applies this to the
transactions that took place during the cartel period. A fully comprehensive (but near impossible)
damages analysis would also take into consideration those transactions that never took place by
virtue of the price premium but would have taken place at the but for price. A second complication
arises where the cartel output is sold to end consumers via one or a number of intermediate
customers. These may be firms that use the product as an input in their own production process
or simply distributors and retailers. The issue here is that some of the cartel overcharge is
absorbed by the intermediary firms and consumers don’t pay the full brunt of the overcharge.
We have conveniently, but we think reasonably, assumed away both these complicating factors
for the purposes of our rebar damages estimation. Rebar demand is derived from demand for

15
large construction projects and is a relatively minor cost component in the overall cost of a project.
It seems unlikely then that demand for rebar would be significantly diminished, or even diminished
at all, by the cartel overcharge. As such the quantity sold under the cartel is likely to be a good
proxy for the quantity sold in the counterfactual.
Again, our dismissal of pass-through effects stems from the nature of transactions in this industry.
Suppliers of large construction projects price projects to fully pass through input costs. Where
projects are forecasted to take a long time to construct the contract includes escalation clauses
for input costs to mitigate the risk that input prices such as rebar increase within the construction
period. Admittedly these clauses are not only to protect the construction firm from increasing input
costs, but also protect the customer from construction firms’ attempts to add margin onto inputs
used in the construction process. It seems likely then that construction firms are able to pass
through the entire cartel price to the end consumer. The full burden of the rebar cartel thus fell on
consumers of construction projects
Given the simplifying assumptions explained above, we performed a straight forward calculation
of quantity multiplied by overcharge to estimate the damages shown in Table 2. The domestic
volume data was collected by SAISI until June 2008, and actual data was used for Jan 2005
onwards. Volume data from Jan 2000 to December 2004 was estimated used supplier data and
assumed that market shares remained at the same levels as those observed between Jan 2005
and June 2008. The overcharge estimates were based on the two scenarios presented in Table
1: Bertrand where the counterfactual price during the cartel is the deepsea export price; and a
price leadership scenario where the counterfactual price is estimated as the average premium in
the post cartel period. The values shown are normalised to December 2012 prices using the PPI
(Reinforcing steel) index produced by Statistics South Africa.
Table 2: Valuations of cartel overcharge, real Dec 2012 prices (PPI Reinforcing steel)
Domestic volumes (t) Bertrand (Rm) Leader-follower (Rm)
2000 194 331 289 254
2001 268 388 351 309
2002 296 356 499 439
2003 321 373 559 492
2004 360 212 604 532
2005 387 792 675 594
2006 (Jan – May) 153 672 260 229
Total 1 982 124 3 237 2 850
Source: Authors’ calculations
The results above should be read in the wider industry context. First of all, rebar is one of a
number of products which formed part of the long steel cartel. Other products which were marked
16
up but did not form part of this estimate include sections, angles and rods. Secondly, various other
inputs into the construction process were cartelised. These include cement, wire mesh, bitumen,
and precast concrete products. Finally, the downstream construction sector, which used all these
cartelised products as inputs, itself operated as a cartel. The rebar damages estimate of between
R2850m and R3237m is simply one, relatively small, component of the overall damages ultimately
paid by customers of construction projects.
5. Problems with interpretation10
As is the case in a number of other intermediate industrial product markets in South Africa,
different levels of the long steel product value chains have been characterised by collusive
activity. A network of mutually reinforcing agreements and relationships has historically existed
between members of the long steel value chain, ranging from input material scrap to end use of
rebar and reinforcing mesh in construction projects. Further, many of the players in the long steel
value chain are vertically integrated from the level of rebar production right through to
construction. The Competition Commission has referred at least five cases in the long steel value
chain to the Competition Tribunal, and is still investigating others.
In scrap, a key input into long steel production in South Africa, the same long steel producers
implicated in the cartel that is the subject of this paper were part of a cartel that fixed purchase
prices of scrap and allocated which scrap suppliers they would buy from. Agreement was reached
between the long steel producers and five of the largest scrap suppliers (New Reclamation Group,
Universal Recycling, Ton Scrap, Ben Jacobs and Rand Scrap) which effectively resulted in the
exclusion of the smaller scrap producers.
In a further downstream level the rebar produced by the long steel producers is cut, bent into the
desired shape and installed in construction projects. A number of corporate leniency applications
were brought to the Commission by Murray and Roberts, implicating companies in cartel activity
in rebar and reinforcing mesh for construction projects. The firms implicated in the rebar related
cartel included Reinforcing Steel Contractors (a subsidiary of construction firm Murray and
Roberts), Reinforcing Mesh Solutions (a subsidiary of construction firm WBHO), Steeledale (a
subsidiary of construction firm Aveng) and a number of smaller players that were not affiliated
with large construction firms. These firms allocated construction projects, fixed prices and
discount bands, and allocated customers in a number of regions in South Africa. Allocations were
mainly based on market share and cover pricing was used as a means of ensuring the selected
member wins the project it is allocated. Similarly, in the mesh cartel case, for which there has
been a Tribunal finding, reinforcing mesh producers BRC Mesh (a subsidiary of construction firm
Murray and Roberts), Steeledale (a subsidiary of construction firm Aveng), Reinforcing Mesh
Solutions (a subsidiary of construction firm WBHO) and a producer unaffiliated with a construction
10 This section draws from das Nair, R., J. Khumalo and S. Roberts, 2012, “Steel, cement and fertiliser: Corporate
cartels in intermediate industrial products”, New Agenda, South African Journal of Social and Economic Policy, Issue
45, First Quarter 2012
17
company, Vulcania Solutions, were found to have fixed price lists, discounts to customer
groupings and allocated customers and projects.
Yet another cartel in mining roof bolts reveals participation by the same main players (Murray and
Roberts’ affiliate RSC Ekusasa and Aveng’s affiliate Duraset) and other players (Dywidag
Systems International and Videx Wire Products). Here, the firms rigged tenders from mines such
that each player maintained their traditional customer base.
These pervasive and multilevel cartels, often with firms from the same group implicated, raise two
important issues.
First, it would appear somewhat unusual and indeed counter-intuitive that cartel members at one
level of the value chain would allow and, from what is evident in the long steel value chain; actively
participate in agreements and arrangements at other levels. After all, an upstream monopolist
would want to ensure a competitive customer base in downstream markets so as to maximise his
profits, with as little buyer power constraining his pricing as possible. From the perspective of
downstream firms, the ideal situation is a number of suppliers of input products competing down
the price. But the widespread cartel conduct at almost every level of the long steel value chain,
anchored by key vertically integrated players, suggests that the motive for such behaviour is likely
to be a desire to ensure overall governance of the value chain by these players. By tying up key
inputs and key customers in a web of cartel activities, new entrants would find it very hard to enter
the long steel value chain thus ensuring the market positions of existing main players.
Second, and of significance to the results in this paper, is the ‘noise’ these multiple cartels create
when interpreting estimates of overcharges. Given the numerous cartels, both upstream and
downstream from rebar production, it is hard to attribute changes in market dynamics following
the end of rebar cartel solely to this event. The scrap, mesh and installation of rebar in construction
projects cartels all allegedly came to an end around the same time as the rebar production cartel.
The effects evidenced may be as a combination of these dynamics. For example, evidence of
new entry in long steel production may be as a result of easier access to scrap following the
desolation of the scrap cartel.
In addition to the above, clean interpretation of the evidenced results is made difficult due to the
following simultaneous events:
The end of the cartel was during the crescendo of the construction boom which began in
2007 and turned sharply down in early 2009.
Load shedding by Eskom would have meant that plants could not run at full capacity
throughout the year (Engineering News, 29 February 2008)
The mothballing of Cisco in 2011 with the simultaneous entry of SA Metals which had a
net reduction in industry capacity of approximately 130,000t per annum.
AMSA had plant shutdowns at the beginning of 2011 and in August 2011 which resulted
in a massive reduction in domestic supply11.
11 See http://www.intranews.co.za/clippings/Mittal%20furnace%20shutdown%20hits%20industry%20hard.pdf
18
The long term nature of contracts in the industry, which are typically 12 to 18 months,
would exacerbate the lagged outcome. The difference in lead times on orders placed and
actual delivery, alternatively, the difference between when contracts were won and when
revenue was booked against them (which may be some time after the contract is done)
may also be a reason for observing some lagged effects.
6. Conclusion
Deterrence is an important aspect of the work of competition authorities and much has been done
to refine the investigative procedures, the design of administrative penalties and the corporate
leniency policy in order to detect and deter cartels. However, the opportunity for deterrence from
damage claims has not been fully exploited in South Africa. Thus far no South African court has
awarded damage claims for harm suffered from anticompetitive conduct (Scallan, Mbikiwa and
Blignaut, 2013) even though there have been some attempts to seek compensation. There is a
need to provide support and encouragement to victims of anticompetitive conduct to successfully
claim damages. Traditionally in competition law administrative penalties are viewed as a
deterrence mechanism while damage claims are regarded as compensation mechanism to
victims of anticompetitive conduct. However, damage claims do assist competition authorities with
deterrence as an appropriately calculated cartel overcharge and damage claim can reclaim most
of the cartel profits. Thus if there is a high likelihood of being caught and damages being awarded,
cartels will be less attractive to firms and there will be more vigilance with compliance.
The calculation of cartel overcharges assists the victims of anticompetitive to take decisions about
seeking compensation. There is some miscommunication about the harm of cartels in markets,
for example, in the construction industry where cover pricing was prevalent and the understanding
by most customers was that it was necessary to allow the construction firms to plan projects and
stay on supplier lists and that this type of conduct did not result in overcharges. However, the
parties to the conduct effectively substituted practical cooperation for the risks of competition and
consequently distorted competition in the tender process. Such conduct undermines the benefits
to the clients of receiving competitively priced bids (Khumalo, Njisane and Nqojela, 2010). These
overcharge calculations are also not just useful to those harmed by anticompetitive conduct but
are a useful way of showing the impact of the work done by competition authorities on the wider
economy.
In this paper, we measure the cartel overcharge in percentage terms and the consequent
damages in rand terms in the reinforcing steel bar (rebar) market, a market in which a cartel
operated between 1999 and 2008. We do this by applying the ‘difference-in-difference’
methodology, with our primary comparison being the cartelised rebar domestic price over the
export rebar price. The results are presented for two counterfactual scenarios, firstly based on a
leader-follower model of competition. and secondly Bertrand competition as a robustness check
on We find that the cartel mark ups were as were as high as 43.2% for the Bertrand counterfactual
and 35.7% for the price leadership counterfactual. The leader-follower overcharge is calculated
by taking the difference between the prices during and after the cartel. This speaks directly to the
impact of the interventions of the Competition Commission.
19
We apply the overcharge results to the transactions that took place during the cartel to get a
valuation of the overcharge in other words an estimate of the damages that could be claimed from
the cartelists. This value amounts to R3.2 billion under the Bertrand counterfactual and R2.8
billion under the leader-follower counterfactual. Given that the demand for rebar is a derived
demand and the cost thereof is a small proportion of the construction projects it is unlikely that
the higher prices dissuaded customers from new construction projects. So the quantity that was
consumed under the cartel is a good proxy for the quantity that would have been sold without the
cartel.
We acknowledge the inherent difficulties in interpreting results of the analyses, particularly in
industries such as steel, where there are cartels in multiple levels of the value chain, considerable
‘noise’ given external shocks, and where cartel behaviour is so entrenched that conduct may
persist well after the ‘formal’ cartel ends. However we note that to address some of these issues
we show result for the strict cartel period as well as the cartel period taking out the years with
anomalies.
20
References
Davies, S.W. and P. L., Ormosi (2010) Assessing Competition Policy: Methodologies, Gaps and Agenda for Future Research, Centre for Competition Policy Working Paper 10-19. Available http://competitionpolicy.ac.uk/documents/107435/107587/Working_Paper_10-19.pdf [Accessed 26/05/2014]
BAKER, S. and IGNJATOVIC, B. (2011) Exporting at a discount: collusive dumping or oligopolistic competition? Available from: http://www.compcom.co.za/fifth-annual-conference-on-competition-law-economics-and-policy-in-south-africa/ [Accessed 02/11/2011]
Boshoff, W.H. (2013). Illegal Cartel Overcharges in Markets with a Legal Cartel History: The South African Bitumen Market. Centre for Competition, Regulation and Economic Development working paper series no 3/2013. Available at: http://www.competition.org.za/working-papers/ [Accessed 27/05/2014]
CALCAGNO, C. and WALKER, M. (2010) Excessive Pricing: Towards Clarity and Economic Coherence, Journal of Competition Law and Economics, Vol. 6, No. 4, pp. 891-910.
Connor, J. M. (2014) Price-Fixing Overcharges: Revised 3rd Edition. Available at SSRN: http://dx.doi.org/10.2139/ssrn.2400780 [Accessed 06/08/2014]
Darji, R., Grimbeek, S. and Muzata, G. (2012). The Impact Of Antitrust Fines On Firm Valuation In South Africa: The Case Of Pioneer Foods, Tiger Brands And Sasol Chemical Industries. Centre for Competition, Regulation and Economic Development working paper series no 2012/5. Available at: http://www.competition.org.za/working-papers/ [Accessed 27/05/2014]
Das Nair, R., J. Khumalo and S. Roberts, 2012, “Steel, cement and fertiliser: Corporate cartels in intermediate industrial products”, New Agenda, South African Journal of Social and Economic Policy, Issue 45, First Quarter 2012
Engineering News, 29 February 2008 Available http://www.engineeringnews.co.za/article/steel-producers-results-raise-the-bar-for-2008-2008-02-29
Hüschelrath, K., Mueller, K. and Veith, T. (2012) Concrete Shoes for Competition - The Effect of the German Cement Cartel on Market Price (2012). ZEW - Centre for European Economic Research Discussion Paper No. 12-035. Available at SSRN: http://dx.doi.org/10.2139/ssrn.2083699
Khumalo, J, J. Mashiane, S. Roberts (2012) ‘Harm and Overcharge in the South African Precast Concrete Products Cartel’, University of Johannesburg Centre for Competition Economics Working paper 6/2012.
Khumalo, J., Njisane, Y. and Nqojela, P. (2010) Cover pricing in the construction industry: understanding the practice within a competition context. Presented at the 4th Annual Conference on Competition Law, Economics and Policy, Mandela Institute, University of the Witwatersrand, September 2010.
Mncube, L. (2013). The South African Wheat Flour Cartel: Overcharges at the Mill, Journal of Industry, Competition and Trade Vol. 13, No. 4.
Njisane, Y. (2011) ‘Rebar Cartel’, Competition News, March, p.6-7.
21
Nontombana, N., and I, Lesofe, I. (2010) ‘Do cartelists change behaviour post-investigations?’ Presented at the Fourth Annual Competition Commission, Competition Tribunal and Mandela Institute Conference on Competition Law, Economics and Policy in South Africa, Johannesburg, 2 September 2010.
OXERA, (2009) Quantifying antitrust damages: Towards non-binding guidance for courts, Study prepared for the European Commission, December
Quantec Trade Statistics, Available http://www.quantec.co.za/
SAISI dataset
Scallan, A., M, Mbikiwa. and L, Blignaut. (2013). Compensating for harm arising from anti-competitive conduct: Follow-on damages litigation, class actions, the relationship between public and private enforcement and models for quantifying harm. Presented at the Seventh Annual Competition Commission, Competition Tribunal and Mandela Institute Conference on Competition Law, Economics and Policy in South Africa, Johannesburg, 5-6 September 2013.
Verboven, F. and T. van Dijk (2009), Cartel Damages Claims and the Passing-on Defence, Journal of Industrial Economics, 57, 457-491.