assessment of the normative and policy framework governing the chinese economy...
TRANSCRIPT

13 August 2015
Final Extended Report
Assessment of the normative and policy framework governing
the Chinese economy and its impact on international competition
For:
AEGIS EUROPE
Cross-sector Alliance Representing European Manufacturing
Brussels
Belgium
THINK!DESK China Research & Consulting
Prof. Dr. Markus Taube & Dr. Christian Schmidkonz GbR
Merzstrasse 18
81679 München
Tel.: +49 - (0)89 - 26 21 27 82
www.thinkdesk.de

© THINK!DESK China Research & Consulting 2015 Seite 2
This report has been prepared by:
Prof. Dr. Markus Taube
Peter Thomas in der Heiden

© THINK!DESK China Research & Consulting 2015 Seite 3
Contents
Executive Summary ························································································· 12
1. Introduction ······························································································ 28
Part I: The Management of the Chinese Economy: Institutional Set-up and Policy
Instruments
2. Centralised Planning and Market Forces in the Chinese Economy ··················· 33
2.1 The Role of Planning in the Chinese Economy ············································ 33
2.1.1 Types of Plans ··············································································· 33
2.1.2 Plans and Complementary Documents················································ 42
2.2 Dedicated Government Programmes for Industry Guidance ··························· 46
2.2.1 Subsidies – An Overview ································································· 46
2.2.1.1 Examples for Preferential Policies and Grant Giving Operations
by Local Governments ································································ 52
2.2.1.2 Recent Initiatives by the Central Government Aimed at Restricting
Local Government Activities ························································· 55
2.2.1.3 Subsidy Disbursements to Chinese Listed Companies ······················· 58
2.2.2 Promotion of Domestic Technology Upgrading and High-tech Sectors ········ 73
2.2.2.1 Policies Targeting Technology Upgrading ········································ 74
2.2.2.2 The High and New Technology Enterprise Programme ······················· 93
2.2.2.3 Preferential lending scheme ························································· 95
2.2.2.4 Local Government Funds Promoting New Technology Related
Research ················································································· 97
2.2.2.5 Forced Localisation of Intellectual Property Rights in the
HNTE-Programme ··································································· 101
2.2.3 Promotion of Strategic Emerging Industries ········································ 102
2.2.3.1 General Concept for the Promotion of Strategic Emerging Industries · 103
2.2.3.2 Implementation of SEI Policies ···················································· 107
2.2.3.3 General Support Measures for SEI Enterprises ······························· 111
2.2.3.4 Internationalisation of SEI ·························································· 122
2.2.3.5 Integration of Foreign Invested Enterprises in the SEI Initiative ··········· 123
2.2.3.6 SEI Initiative – Market-driven or State-directed? ······························ 125
2.2.4 Special Funds for the Revitalisation and Technology Renovation in
Key Industries ············································································· 127
2.2.5 Policies Targeting Green Development ············································· 132
2.2.6 Subsidies from Special Funds for Infrastructure Construction ················· 141
2.3 Industry Associations as Hybrid Institutions Straddling Government Bodies
and the Corporate Sector ····································································· 142
2.4 The Role of Markets in the Chinese Economy ··········································· 148
2.4.1 Markets for Factors of Production ···················································· 148
2.4.1.1 Capital Markets ······································································· 150

© THINK!DESK China Research & Consulting 2015 Seite 4
2.4.1.2 Labour Markets ······································································· 181
2.4.1.3 Land Markets ·········································································· 186
2.4.2 Markets for Goods and Services ······················································ 201
2.4.2.1 Price Controls and Market Distortions in the Field of Utilities ·············· 201
2.4.2.2 Price Controls Targeting Goods and Services ································ 210
2.4.3 Complementary Ordering Mechanisms for Effective Market Coordination ·· 217
2.4.3.1 Anti-Monopoly Regulation ·························································· 218
2.4.3.2 Bankruptcy Regime and Market Exit Mechanisms ··························· 236
2.5 Conclusion: Markets are Sub-ordinated to State Interests ···························· 241
3 The Role of the Chinese Communist Party in Economy and Business ··········· 244
3.1 Embeddedness of CPC Organisations in the Corporate Sector ····················· 244
3.2 Dual Party/Management Careers ··························································· 246
3.3 Government Institutions as Meeting-Points and “Market-Places” for
China’s Elites ····················································································· 257
3.4 Conclusion: China’s State-Business Nexus··············································· 258
Part II The Chinese Economic System at the Interface with the Global Markets
4. International Trade ·················································································· 261
4.1 Organisational Structures of China’s Foreign Trade Administration ················ 261
4.2 Import-Targeting Policy Measures ·························································· 262
4.2.1 Import substitution ········································································ 262
4.2.2 Government Procurement ······························································ 268
4.2.3 Import Cartels ·············································································· 272
4.2.4 State trading ··············································································· 273
4.2.5 Product Testing and the CCC Mark ·················································· 275
4.3 Export-Targeting Policy Measures ·························································· 278
4.3.1 Export Constraints ········································································ 278
4.3.1.1 Value Added Tax Rebates on Exported Goods ······························· 279
4.3.1.2 Export Duties ·········································································· 280
4.3.1.3 State Trading ·········································································· 281
4.3.2 Export Promotion ········································································· 285
4.3.2.1 Export Subsidies Provided by the Chinese Government ························ 285
4.3.2.1 Prizes for Export Performance ···················································· 286
4.3.2.2 Upgrading of companies’ export product portfolios ··························· 287
4.3.2.3 Matching Export Revenues with Subsidies ····································· 288
4.3.2.4 Subsidies for Offsetting Domestic Transportation Costs for
Export Goods ·········································································· 288
4.3.2.5 Subsidies for the Steady Increase of Export Trade ·························· 289
4.3.2.6 Famous Export Brand Programme ··············································· 290
4.3.2.7 Provision of Export Insurance by the State-owned China
Export & Credit Insurance Corporation ········································· 293
4.3.2.8 Export Credit Insurance Assistance and Development Fund ·············· 293
4.3.2.9 Provincial Export Support Funds ················································· 295
© THINK!DESK China Research & Consulting 2015 Seite 5
4.3.2.10 Foreign Trade Transformation and Upgrading Demonstration Bases ··· 298
4.3.2.11 Foreign Trade Common Service Platforms ···································· 303
5. Institutional Set-up and Policy Guidance of Cross- Border Capital Flows ········ 309
5.1 Inward Foreign Direct Investment ··························································· 309
5.1.1 Governmental Steering of FDI Inflows ··············································· 310
5.1.2 Foreign Investor’s Perception of Chinese FDI Regulation ······················ 315
5.2 Outward Foreign Direct Investment ························································· 317
6. Linking-up with the Global Currency System ··············································· 321
Part III The Chinese Economy’s Impact on the Global Economic System
7. Does China Meet the MES-Criteria Criteria Set Out by the EU and
Authorised by the WTO? ·········································································· 326
7.1 MES-Criterion 1 ·················································································· 327
7.2 MES-Criterion 2 ·················································································· 328
7.3 MES-Criterion 3 ·················································································· 328
7.4 MES-Criterion 4 ·················································································· 329
7.5 MES-Criterion 5 ·················································································· 330
7.6 MES – Summary assessment ································································ 331
8. Impact of the Chinese Economic System on the Viability and Effectiveness
of the Global Market Order ········································································ 333
8.1 Trade Defence Investigations Against China ············································· 334
8.1.1 Anti-dumping Proceedings ····························································· 340
8.1.2 Anti-subsidy Proceedings ······························································· 341
8.2 Transmission Channels to, and Impact of Chinese Non-Market Features on
Competition-Based Market Systems ································································· 343
8.2.1 Price Distortions Emanating from the Chinese Economy ······················· 343
8.2.2 Economies of Scale and Scope Created by Non-market Forces in the
Domestic Chinese Economy ········································································ 345
8.2.3 Government Induced Outward Reach of Domestic Enterprises ··············· 348
8.2.4 Distorted Comparative Advantages in China ······································· 350
9. Concluding Analysis: A State Controlled Market System Distorting
the Global Markets ··················································································· 353
References ···································································································· 356
DISCLAIMER ································································································· 388

© THINK!DESK China Research & Consulting 2015 Seite 6
List of Figures
Figure 1: Nominal Exchange Rate of the Renminbi versus the Euro as well
as the US$, 01.01.2000-18.06.2015 (Yuan RMB to 1.00 Euro
respectivey 1.00 US$) 30
Figure 2: Overview of the Chinese Planning System 36
Figure 3: Frequency Distribution of the Amounts of Individual Transfers 60
Figure 4: Frequency Distribution of Subsidy-Net Income Ratios for Chinese
Listed Firms in 2014 62
Figure 5: Subsidy-Net Profit Ratio of 2,251 Enterprises in 2014
(Range 1% - 5,898%) 62
Figure 6: Subsidy-Net Profit Ratio of 2,082 Enterprises in 2014
(Range 1% - 100%) 63
Figure 7: Subsidy-Net Profit Ratio of 574 Enterprises in 2014
(Range 20% - 100%) 63
Figure 8: Proportion of Subsidy Induced Reduction of Net-Losses
of 188 Enterprises 65
Figure 9: Subsidies to Enterprises of Different Ownership Types 67
Figure 10: Year on Year Changes to Total Subsidy Transfers by Ownership Type 67
Figure 11: Development of Chinese FDI Inflows and Outflows, 1980-2014 309

© THINK!DESK China Research & Consulting 2015 Seite 7
List of Tables Table 1: Average Nominal Exchange Rate Renminbi vs. Euro, 2000-2014 31
Table 2: Overview of Selected Guidance Catalogues Maintained at the Central
Government Level 45
Table 3: Overview of Governmental Subsidy Payments to Chinese Listed
Companies from 2010 to 2014 58
Table 4: The Top10 Recipients of Government Grants in 2014 59
Table 5: Individual Subsidy Transfers Exceeding 1 billion RMB in 2014 59
Table 6: Profitable Enterprises with the Highest Subsidy-Net Income
Ratio in 2014 61
Table 7: Enterprises that Reduced their Losses by Means of Subsidy Income
in 2014 64
Table 8: Selected Firm Performance and Subsidisation 66
Table 9: Subsidy Income of BYD Co., Ltd. 68
Table 10: Target Sectors of Subsidy Transfers (in million RMB) 70
Table 11: Regional Differences in Subsidisation in 2014 (in million RMB) 72
Table 12: Total Disbursements of Subsidies for Enterprises Working on Priority
Tasks from the National Science and Technology Support Plan 76
Table 13: Top 10 Recipients of Subsidies for Enterprises taking on Priority Tasks
from the National Science and Technology Support Plan in 2014 77
Table 14: Industries Benefitting from the State Key Technology Renovation Fund
Programme and Follow-up Programmes 80
Table 15: Total Disbursements of Patent Related Subsidies 87
Table 16: Top 10 Recipients of Patent Related Subsidies in 2014 88
Table 17: Total Disbursements of Subsidies under the Three Categories
Programme 90
Table 18: Top 10 Recipients of Subsidies under the Three Categories
Programme in 2014 91
Table 19: Total Disbursements of High and New Technology Enterprise
Subsidies 94
Table 20: Top 10 Recipients of High and New Technology Enterprise
Subsidies in 2014 95
Table 21: Technologies Covered by the Strategic Emerging Industries Strategy 105
Table 22: Participating Chinese Government Organisations in SEI Policies 109
Table 23: Total Disbursements of Subsidies for Strategic Emerging Industries 112
Table 24: Top 10 Recipients of Subsidies for Promoting Strategic Emerging
Industries 113
© THINK!DESK China Research & Consulting 2015 Seite 8
Table 25: Total Disbursements of Subsidies Related to New-Energy Vehicle
Technology Development and Commercialisation under the
SEI Initiative 113
Table 26: Top 10 Recipients of Subsidies Related to New-Energy Vehicle
Technology Development and Commercialisation under the SEI
Initiative in 2014 114
Table 27: Subsidies for the Promotion of New Energy Vehicles (NEV) 115
Table 28: Total Disbursements of Subsidies for the Adjustment and
Revitalization of Key Industries 129
Table 29: Top 10 Recipients of Subsidies for the Adjustment and Revitalization
of Key Industries in 2014 130
Table 30: Total disbursements of Key Industry Subsidies 130
Table 31: Disbursements of Key, Backbone and Dragonhead Enterprise
Subsidies 131
Table 32: Total Subsidies for Environmental Protection (2010-2014) 132
Table 33: Top 10 Individual Subsidy Transfers Promoting Environmental
Protection (2010-2014) 132
Table 34: Total Disbursements of Subsidies for the Synergistic Utilisation
of Resources 139
Table 35: Top 10 Recipients of Subsidies for the Synergistic Utilisation of
Resources in 2014 139
Table 36: Total Disbursements of Treasury Bonds Subsidies 164
Table 37: Top 10 Recipients of Treasury Bonds Subsidies in 2014 165
Table 38: Total Disbursements of Loan Interest Subsidies 165
Table 39: Top 10 Recipients of Loan Interest Subsidies in 2014 166
Table 40: Loans from Policy Banks Obtained by Selected Enterprises 167
Table 41: Total Disbursements Subsidies Related to Labour 185
Table 42: Top 10 Recipients of Subsidies Related to Labour in 2014 185
Table 43: Total Disbursements of Subsidies Related to the Use of Land 194
Table 44: Top 10 Recipients of Subsidies Related to the Use of Land in 2014 195
Table 45: Total Disbursements of Relocation Subsidies 196
Table 46: Top 10 Recipients of Relocation Subsidies in 2014 197
Table 47: Subsidies for Plant Demolition and Relocation 198
Table 48: Top 10 Individual Electricity Subsidies (2010-2014) 205
Table 49: Total Subsidies for Energy Conservation (2010-2014) 205
Table 50: Top 10 Individual Subsidy Transfers Promoting Energy Conservation
(2010-2014) 206
Table 51: Total Water Subsidies (2010-2014) 207
Table 52: Top 10 Individual Water Subsidies (2010-2014) 207
Table 53: Total Coal Subsidies (2010-2014) 208
Table 54: Top 10 Individual Coal Subsidies (2010-2014) 208

© THINK!DESK China Research & Consulting 2015 Seite 9
Table 55: Total Heating Subsidies (2010-2014) 209
Table 56: Top 10 Individual Heating Subsidies (2010-2014) 209
Table 57: Total Natural Gas Subsidies (2010-2014) 209
Table 58: Top 10 Individual Natural Gas Subsidies (2010-2014) 210
Table 59: Government-fixed and Government-guided Prices in 2013 212
Table 60: Announcements of Price Adjustment by NDRC in 2013 216
Table 61: Tasks and Responsibilities of China's Anti-competitive Enforcement
Agencies 219
Table 62: Business Leaders Serving on the 17th CPC Central Committee or the
Central Commission of Discipline Inspection 252
Table 63: Prominent Political Leaders with Administrative Experience in
SASAC Companies and other Large SOEs (2011) 254
Table 64: Import Substitution Provisions Included in Selected Government
Documents Issued at the Sub-central Level 265
Table 65: Imports Under State Trading, 2011-13 274
Table 66: Selected Restrictions on Imports 277
Table 67: Export Products Subject to State-Trading Arrangements, 2011-13 282
Table 68: Total Disbursements of Export Promotion Subsidies 285
Table 69: Top 10 Recipients of Export Promotion Subsidies in 2014 286
Table 70: Total Disbursements of Awards for Export Performance 286
Table 71: Top 10 Recipients of Export Awards in 2014 287
Table 72: Total Disbursements of Export Products Subsidies 287
Table 73: Top 10 Recipients of Subsidies for Upgrading the Export Structure 288
Table 74: Total Disbursements of Subsidies Offsetting Domestic
Transportation Costs for Export Goods 289
Table 75: Total Disbursements of Subsidies for Export Expansion 289
Table 76: Top 10 Recipients of Subsidies for Export Expansion in 2014 290
Table 77: Total Disbursements of Export Brand Subsidies 293
Table 78: Total Disbursements of Subsidies for Export Insurance 295
Table 79: Top 10 Recipients of Subsidies for Export Insurance in 2014 295
Table 80: Total Disbursements of Subsidies for Export Enterprises 296
Table 81: Top 10 Recipients of Subsidies for Export Enterprises in 2014 297
Table 82: Total Disbursements of Export Products Subsidies 297
Table 83: Top 10 Recipients of Export Products Subsidies in 2014 298
Table 84: Distribution of Funds Between Central and Provincial level FTCSP 305
Table 85: FTCSP in Hunan Province in 2013 306
Table 86: Production Potential, Output and Capacity Utilization for Selected
Products in 2014 346

© THINK!DESK China Research & Consulting 2015 Seite 10
List of Boxes Box 1 Incomplete List of Sectoral Five-year Programmes of the 12th Planning
Cycle 37
Box 2 Incomplete List of Key Technology Programmes for the 12th Planning
Cycle 39
Box 3: Chinese Accounting Rules in the Context of Subsidy Payments 50
Box 4: The China Iron & Steel Association (CISA) 144
Box 5: China Chamber of Commerce of Metals, Minerals and Chemicals
Importers and Exporters (CCCMC) 146
Box 6: Government Interventions in Bank Loan Allocation in Hubei Province 157
Box 7: Governmental Interventions in Capital Allocation in Gansu Province 158
Box 8: The Role of PBoC Shanghai Branch Office for the Industrial Policy
Implementation 161
Box 9: AML-Ruling: Mead Johnson Nutrition / Danone / Fonterra / Abbott
Laboratories / FrieslandCampina / Biostime International
(August 2013) 223
Box 10: Various automobile manufacturers (August/September 2014) 224
Box 11: Local Protectionism in the New Energy Vehicle Industry 233
Box 12: Combination of Dedicated Programmes in the Governmental Promotion and
Steering of Specific Industries: The Case of Aluminium Extrusions 335
Box 13: Transmission of Government-induced Price Distortions Between
Sectors: 344
Box 14: Overcapacities and the Takeover oft he Global Markets: The Case of
the Solar Panel Industry 348
Box 15: Outward Foreign Direct Investment: The Case of the Putzmeister-
Takeover 350
Box 16: Distorted Comparative Advantages: The Case of the Glass Fiber
Industry 352

© THINK!DESK China Research & Consulting 2015 Seite 11

© THINK!DESK China Research & Consulting 2015 Seite 12
EXECUTIVE SUMMARY
This study examines the distortions in the Chinese economy that make it unsuitable for con-
sideration as a market economy for the purposes of EU trade defence law.
Among the key elements examined in the Study are:
the continued and central role of the Chinese Communist Party in the economy;
the 71 detailed five-year government plans directing and managing the economy;
the 22 national industrial sector plans;
the Provincial and Local plans implementing national industry plans;
the role of industry associations as arms of the state;
the limited role of markets for consumer goods only;
the absence of markets for capital, labour, land, energy and other factors of produc-
tion;
the pragmatic subordination of markets to state planning;
the absence of true competition rules, bankruptcy laws and market exit mechanisms;
the tools restricting imports into the Chinese market;
the tools managing and directing exports to international markets;
the state control and direction of outward foreign direct investment;
the state direction and control of inward investment and ownership.
By analysing a very substantial number of primary Chinese documents, as well as secondary
sources and academic studies, the study shows the inter-relationship between commercial
enterprises and the Chinese Government as well as the Chinese Communist Party. These
are the principles guiding the actions of these enterprises, not the market. Markets only play
a secondary role.
Economic activity and the allocation of resources in China continue to be predominantly de-
termined by a broad array of governmental programmes, subsidy schemes and arrange-
ments to punish or promote specific behaviour. As a result, nearly fifteen years after acces-
sion to WTO, the patterns of economic interaction in the Chinese economy remain highly
distorted and reflect neither the true scracity of goods and resources nor the competitive
strengths of market players.
Thus, China does not currently meet the criteria used by the European Union to evaluate
whether an economy has made the transition from a state controlled market system to a
normal market economy. The study shows that granting market economy status to China,
when it does not meet the technical criteria to be considered a market economy, will be dev-
astating for manufacturing in the EU. It will hit jobs, growth and innovation in industrial sec-
tors made up of both small and medium sized enterprises and large scale transnational com-
panies.

© THINK!DESK China Research & Consulting 2015 Seite 13
A More Detailed Summary of the Report
The study is divided into three parts covering:
The Chinese Economy: Centralised Planning and Control Mechanisms
The Interface with Global Markets
The Impact of the Chinese Economy on the Global Economic System
Each of the three parts is divided into a series of sections and sub-sections covering more
than 350 pages with 10 Figures, 85 Tables and 13 Boxes illustrating details of the functioning
of the Chinese economy in practice. The tables show, for example, an overview of the State
Planning System. The 85 tables show, for example, the different recipients of different sup-
port programmes with exact amounts of subsidies received. The boxes list for example the
83 five year plans currently framing the development of most sectors of the economy.
Part I: The Management of the Chinese Economy: Institutional Set-up and Policy
Instruments
Chinese government organisations, at all levels of the national hierarchy, seek to control the
economic activities of individual business entities and to direct their behaviour in directions
considered necessary for the realisation of goals already fixed at the national level (Chinese
Communist Party as well as the national government), the local and the individual levels.
This Part of the Report demonstrates that this phenomenon is reflected in the complex sys-
tem of planning documents that guide all economic activities in China (section 2.1) as well as
a substantial number of specific programmes targeting specific objectives and developmental
goals (section 2.2). In this context, the market is nothing more than a complementary instru-
ment with a limited role on the allocation of resources, depending on sectors and products
covered (section 2.3.)
Chapter 2.1: Centralised Planning in the Chinese Economy
Centralised planning has evolved over the years but change does not mean the plans are
any the less centralised or controlling in their nature for that reason. A major change was
implemented with the 10th Five Year Plan (covering the period 2001-2005). At this time the
tradition of providing concrete output-target figures was discontinued. Instead indicative
planning mechanisms and indirect means of control and regulation were introduced. From
the 11th Five Year Programme for Economic and Social Development, covering 2006-2010,
onwards, even the term ‘plan’ has been abandoned and been substituted for the label ‘pro-
gramme’. These new “Five Year Programmes”, however, are no less comprehensive and
complex than their ‘plan’-forerunners. Like their predecessors, they comprise much more
than just China’s central government’s vision and general outline for national economic de-
velopment.

© THINK!DESK China Research & Consulting 2015 Seite 14
The plans operate at all levels of the economy. There are six levels of hierarchy in China
from the Central to the Local. Each sub-level develops its five-year plan on the basis of the
plan of the level above. Plans are also developed along Institutional lines for examples each
government department will have its own plan, as well as on the basis of topics of concern
such as air pollution or water conservation. Finally there are the sectoral plans which are
developed industry sector by sector, again at various levels of the hierarchy and on the basis
of groups of sectors with similar features.
Box I (page 36 of the Report) lists some of the more relevant sectoral plans. It can be seen
that there are plans for Aluminium, Animal Feed, Automobiles, Ball Bearings, Bee Keeping,
Biomass, Cement, etc. ending up with Vegetable Oils and finally the Wind Power Industry.
The report lists 71 plans. No segment of the economy is excluded.
Box 2 (page 38 of the Report) lists the Key Technology Programmes for the 12th Five-year
plan. There are 22 of these plans covering Basic Research, Broad Band Networks, Clean
Coal, Cloud Computing, Commercialisation of new technologies, High Grade Steels etc up to
Tourism, Waste Recycling and Wind Power.
In 2005, the State Council ruled that
“the people's governments of all provinces, autonomous regions, and municipal-
ities directly under the Central Government, the relevant administrative depart-
ments of the state for development and reform, public finance, taxation, land re-
sources, environmental protection, industry and commerce, quality inspection,
banking supervision, electric power supervision, work safety supervision, as
well as the administrative departments of all industries, etc. shall establish and
improve the mechanism for organisation, supervision and inspection of the in-
dustrial structure adjustment work, perform their respective duties, cooperate
with each other closely, form a resultant force, and effectively intensify the ef-
fectiveness of implementing industrial policies” (State Council 2005a in the pre-
amble)
Chapter 2.2: Dedicated Government Programmes for the Guidance of Industry
The Chinese government remains committed to a hands-on approach to economic develop-
ment. Industrial policies are employed to provide guidance to economic actors and steer the
economy towards specific goals. This chapter examines some of the most important policy
programmes. In this context the specific mechanisms that are employed in order to steer
enterprises and whole industries in specific directions are outlined.
Among other features, these programmes provide significant subsidies to Chinese commer-
cial entities. The Report shows that China has not fully reported all subsidy programmes to

© THINK!DESK China Research & Consulting 2015 Seite 15
the WTO as required by its WTO Membership. The first notifications in 2004 were thin and
those in 2011 condemned by many WTO members as being insufficient.
Anti-subsidy investigations in the EU, the US, Canada, Australia and other WTO members
have identified numerous grant giving operations conducted by the Chinese central govern-
ment that were not included in the notification – many of which have been found to violate
anti-subsidy law. Several academic and commercial studies have discovered numerous in-
stances where subsidy programmes, tax breaks, discount loans and related measures have
conferred unfair advantages to selected industries and enterprises (e.g. Price et al 2006;
Price et al. 2007; Dewey & Le Boeuf LLP 2007; Haley 2008; Haley and Haley 2013; Ogilvy
Renault LLP, 2007; Taube and in der Heiden 2009).
China’s 2004 notification provided no information at all about industry support programmes
and grant giving schemes operated by the country’s 33 provincial and about 850 municipal-
level jurisdictions. This fact is particularly relevant as the Chinese political-economic system
transfers most policy implementation matters to the local government level. Furthermore,
provinces, cities, districts and counties bear the responsibility for developing local economies
and use financial incentives to compete for investment projects. Both factors suggest that
subsidisation is prevalent and that most objectionable practices are anchored on lower ad-
ministrative levels. The omission of subsidy programmes administered by sub-central gov-
ernments thus creates a very large blank spot in the notification.
In 2011, China submitted its second subsidy notification which covered the period from 2005
to 2008. The second document displays the same shortcomings as the first and has to be
considered significantly incomplete. Information provided on subsidy schemes administered
by central government authorities was again found to have large gaps and again, not a single
programme run by sub-central government bodies was mentioned. Overall, China did not
honour the commitments it accepted at the time it joined the WTO in a complete, consistent
and transparent fashion. It failed to disclose all relevant information in a timely manner. It
also failed the obligation to publish policy documents on trade-related measures translated
into at least one of the organisation’s official languages in a single official journal.
Recently the United States has initiated WTO dispute settlement against China on the basis
of 300 programmes identified by the US Department of Commerce. In addition. THINK!DESK
has identified a number of subsidy programmes which appear to be unrelated to specific pol-
icy plans.
This Report, from pages 45 to 137 lists a whole series of subsidy programmes that it has
been able to uncover on the basis of published programmes as well as the financial reports
of a series of commercial entities.
A key conclusion is that China backs up its five-year plans with subsidies. However the pro-
vision of subsidies is only one feature of the Chinese way. The very fact of the plans and the
willingness of commercial entities to comply with them is a central cartellising feature of the
Chinese economy.

© THINK!DESK China Research & Consulting 2015 Seite 16
Chapter 2.3: Industry Associations carry out government functions
China’s industry associations differ significantly from the standard concept of the role and
function of industry associations are supposed to fulfil in market economies, as understood in
the OECD framework. They are not restricted to representing the interests of their respective
industries and member firms vis-à-vis the government and other market participants. In addi-
tion, China’s industry associations double as spokespersons for government policies and
interests and undertake regulatory functions on behalf of government. In these organisations
the borderlines between “the regulated” and “the regulator” become blurred.
The role of the industry associations has expanded all the more with the abolition of certain
line ministries. First these became bureaus only and slowly been converted into industry as-
sociations. The historical development of many associations shows the origin in the old Min-
istries. This can be seen for example in the metallurgical industry. In 1998 the Ministry was
downgraded to a bureau and then in 2013 the responsibilities were transferred to the CISA,
the China Iron and Steel Association. Besides data collection and the provision of consulta-
tion services the main responsibility of CISA is to maintain industry discipline. Boxes 4 (on
page 140) and Box 5 (on page 142) of the Report explains this development in detail.
Today, 16 industry associations have formed out of the old line Ministries The private sector
is also organised in the All China Federation of Industry and Commerce. (ACFIC). ACFIC,
however is a bottom-up lobbying organisation in name only. The true role of the Federation
as an agent of the CPC and government is set out on its homepage as follows:
“Established in 1953 under the leadership of the Communist Party of China, the
All-China Federation of Industry and Commerce (ACFIC), also known as the All-
China General Chamber of Industry and Commerce (ACGCIC), is a group of the
masses and a chamber of commerce oriented toward the business circle and
with the enterprises and personages of the non-public economy as its main enti-
ty. It is a channel for the CPC and the government to liaise with the personages
of the non-public economy, and an aide of the government in administering and
serving the non-public economy. The work of ACFIC is a key component of the
CPC’s united front and economic work. The cause of ACFIC is an important part
of Socialism with Chinese characteristics.”
(ACFIC, n. d.)
2.4: The subsidiary role of Markets in China
The litmus-test for the existence of a market system is the prevalence of prices that truly re-
flect relative scarcity, i.e. the relation between demand and supply of the factors of produc-
tion as well as goods and services, based on the preferences of all individuals in an econom-
ic community. In a well-functioning competition-based market economy, scarcity-based pric-

© THINK!DESK China Research & Consulting 2015 Seite 17
es are responsible for the allocation of the resources available in an economy as well as the
economic selection of investments and products.
Since the start of economic reforms in the late 1970s China’s policy makers have gradually
increased the scope that markets and supply-and-demand determined prices are allowed to
play in the national economy. However, even though prices are beginning to have a role, the
extensive network of planning documents and governmental guidance, prices are still not
allowed to play a decisive role for the coordination of economic activity in most areas of the
Chinese economy. Comparing various segments of the Chinese economy, it can be seen
that prices do have an increasing role for consumer goods. However, the further up the value
chain the analysis advances, the more restricted the role of markets and prices becomes.
The prices of raw-materials and basic inputs to the production process continue to be strictly
controlled and guided by the Chinese state and do not fully reflect the true degree of scarcity
in the economy. And with regard to the allocation of the factors of production, i.e. capital,
labour, and land, scarcity-based market prices eventually play only a subordinated role, be-
ing more or less entirely overshadowed by discretionary interventions of government bodies
in the allocation process (Huang 2010a, Chen 2014).
This chapter looks at the role of scarcity-based market prices play in various segments of the
Chinese economy in greater detail. Starting with the function of prices for the allocation of the
factors of production, namely capital, labour and land it moves on to pice setting mechanisms
for raw materials, utilities as well as commercial goods and services.
Box 6 (on page 153 of the Report) looks at how the government controls the allocation of
bank loans in Hubei Province. Box 7 (on page 154 of the Report) does the same for Gansu
Province.
In the Chinese capital markets the price signals generated on the markets are subjected to
government induced distortions first of all due to a repression of interest rates and a manipu-
lation of the exchange rate. Both factors result in a constellation where capital is made avail-
able at too low prices and is utilised excessively by those having access to the formal finan-
cial system – which are China’s state-owned enterprises and those actors upholding close
relationships to local government agencies. According to calculations by IMF staff this has
resulted in an investment ratio ten percentage points above its equilibrium value and costs to
the economy in a range of about 4% of GDP per year (Lee/Syed/Liu 2012, Geng/N’Diaye
2012).
The price of labour continues to hover below its “fair” value due to an expressed low wage
policy by Chinese government – at least until the recent initiative to boost domestic con-
sumption –, highly immature wage bargaining processes and the household registration sys-
tem (hukou) which prevents the constitution of a unified national labour market by effectively
discriminating against labour originating in rural areas. These factors plus an inconsequential
enforcement of social security systems result in a situation where firms are allowed to ac-
quire labour with lower skill levels at bargain prices and expand business models making
extensive use of such labour input.

© THINK!DESK China Research & Consulting 2015 Seite 18
Chinese land markets feature even higher degrees of distortion as on the one hand prices
for commercial land use rights (LUR) are pushed up by local governments in order to gener-
ate high revenues from land sales. While on the other hand inter-jurisdictional competition for
industrial investments pushes prices down for corresponding land uses. As such industrial
LUR have been featuring much lower price increases (multiplied by a factor of 1.55 between
2000 and 2013) than LUR for commercial land (multiplied by a factor of 6.7) and residential
land (multiplied by a factor of 4.5) (Chen 2014). As a result the allocation of land becomes
removed from the true (national) economic necessities and rather favours industrial business
models requiring large stretches of land.
The greatest distortions but in recent years also greatest improvements have been achieved
with respect to the pricing of nature, which economists have in recent years learned to in-
clude in the concept of “land” as an elementary factor of production. After decades of reck-
less growth-fetishism, the wish to contain the on-going degradation of natural environments
and attach a price to environmentally hazardous business activities has eventually become a
major driver of social activism and elite policy making. As such the distortions resulting in an
over-utilisation of natural environments are continuously being dismantled allowing for a bet-
ter allocation of these resources.
The total costs these multifaceted distortions in the allocation of resources convey to the
Chinese economy as a whole can only be estimated. Huang and Tao (2011) estimate the
aggregate costs arising from the governmental interventions in the factor markets to lie in the
range of about 10% of Chinese GDP each year during the first decade of the 21st century.
Chapter 2.4: Competition authorities, bankruptcy and market exit mechanisms
The Chapter also looks at some specific complementary market institutions that have to be in
place in order to make the competition based pricing system work correctly. Markets can only
direct economies towards high levels of welfare and development, if the signals generated
are actually executed in the market place. Complementary institutional arrangements need to
be in place, incentivising economic actors to act according to market signals. In order to up-
hold their capability to signal the best allocation of resources and goods in the economy,
markets must furthermore be protected from a one-sided accumulation of power that might
interfere with efficient competitive processes.
The chapter concludes that China has yet to implement these complementary market func-
tions in a way that incentivises, or guides, economic actors. The state, through the five-year
plans, remains the main guidance and incentive.
Functioning markets rely on the principle that the most productive and “best” players as de-
termined in fair competitive processes are rewarded by being enabled to actually engage in
business transactions and participate in the division of labour. As a consequence, however,
functioning market systems must also make provisions for those market players that are re-

© THINK!DESK China Research & Consulting 2015 Seite 19
jected by the market. Firms which cannot compete successfully must be allowed to leave the
market in an orderly manner.
Bankruptcy cases in China are relatively rare considering the size of the economy and popu-
lation as well as the speed with which the country is transforming itself. Statistics provided by
the Supreme People’s Court indicate that only 2,059 bankruptcy cases have been filed with
Chinese courts in 2014 (Supreme People’s Court 2015). The small number relative to other
countries may be partly explained by the fact that China does not allow for private bankrupt-
cy. However, an even more striking finding is that the number of cases in China has dropped
substantially in recent years. For 2010 and 2012, the case count stands at 3,573 and 2,531
respectively (Supreme People’s Court various years).
A new bankruptcy law went into effect on June 1, 2007 (NPC 2006b). It eliminated provisions
for policy bankruptcy effective January 1st, 2008 and thus reduced the incentives for SOE to
seek bankruptcy protection. However, comparing to bankruptcy regulation in other countries,
the new law is still relatively thin.
While the new law has added essential regulation on the handling of restructuring plans and
debt disposition, it still has several limitations. The new law has a much wider scope as it
covers bankruptcy of SOEs as well as private companies, foreign companies and Sino-
foreign joint ventures. However, there are still no regulations governing insolvency of private
individuals, public institutions or sole proprietorships. Furthermore, the new law offers little
guidance for bankruptcies of banks, securities or insurance companies. Article 134 touches
upon this briefly but refers to other laws and regulations that should be issued by the State
Council.
Chapter 2.5: Markets and market players are subordinated to State interests
The Chinese Communist Party and Chinese government organisations continue to intervene
massively in the economic process. Rather than establishing a sound macro-economic con-
trol system and an industry-oriented regulatory framework in which market forces determine
the patterns of economic interaction, China’s ruling elite believes in its ability to design an
economy by decree which achieves better outcomes and higher economic dynamics. Its stra-
tegic aspirations and normative goals for the economy and its sub-sectors are outlined in a
broad array of planning documents. These are complemented by a large arsenal of dedicat-
ed policy instruments which are designed and employed to steer economic agents towards
these goals. 15 years after accession to WTO markets continue to play only a subordinated
function in the overall working mechanism of the Chinese economy.
The strategic aspirations and normative goals of Chinese government for the economy and
its sub-sectors are outlined in a broad array of planning documents. These are complement-
ed by a large arsenal of dedicated policy instruments which are designed and employed to
steer economic agents towards these goals. 15 years after accession to WTO, markets con-
© THINK!DESK China Research & Consulting 2015 Seite 20
tinue to play only a subordinated function in the overall working mechanism of the Chinese
economy. In the word of renowned China scholar McNally:
“The defining characteristic of [China’s] modern state capitalism in comparison to
liberal market capitalism is in the end a considerable distrust of markets and full-
out economic liberalization. This does not mean that markets are unimportant,
but that markets are used pragmatically.” (McNally 2013, p. 50)
Chapter 3: the Role of the Chinese Communist Party
In addition to Chinese government’s aspiration to guide industrial development, large parts of
the Chinese economy in general and its industry in particular are subject to the direct control
and governance of the Communist Party of China (CPC). The CPC reserves for itself a
prominent role in economic matters, including the operation of commercial entities. 35 years
after the onset of the economic reforms, the CPC has not relinquished its role in shaping
economic behaviour at the grass roots level. The constitution of the CPC provides:
“In a state-owned or collective enterprise, the primary Party organisation acts as
the political nucleus and works for the operation of the enterprise. The primary
Party organisation guarantees and oversees the implementation of the principles
and policies of the Party and the state in its own enterprise and backs the meet-
ing of shareholders, board of directors, board of supervisors and manager (facto-
ry director) in the exercise of their functions and powers according to law. It relies
wholeheartedly on the workers and office staff, supports the work of the con-
gresses of representatives of workers and office staff and participates in making
final decisions on major questions in the enterprise. It works to improve its own
organisation and provides leadership over ideological and political work, efforts
for cultural and ethical progress and the trade unions, the Communist Youth
League and other mass organisations.
In a non-public economic institution, the primary Party organisation carries out
the Party's principles and policies, provides guidance to and oversees the enter-
prise in observing the laws and regulations of the state, exercises leadership over
the trade union, the Communist Youth League organisation and other mass or-
ganisations, rallies the workers and office staff around it, safeguards the legiti-
mate rights and interests of all quarters and stimulates the healthy development
of the enterprise.” (CPC 2013 at 32)
The Report (see page 236 et seq.) details the overlapping roles between individual CPC
members and specific enterprises. A systematic survey on 130 top leaders of SOEs con-
trolled by the central government has been carried out by Li Cheng (2011) before the leader-
ship transition of 2013. Li found that all of the 130 individuals were party members and that
59 simultaneously served as general manager and (deputy) party secretary

© THINK!DESK China Research & Consulting 2015 Seite 21
14 simultaneously served as general manager, board chairman and (deputy) party
secretary
Other top managers of major Chinese corporations are simultaneously directing the opera-
tions of their firms and serving on the CPC Central Committee or the Central Commission of
Discipline Inspection. Tables 62 and 63 (pages 242 and 244 of the Report) document promi-
nent cases of the last years of the Hu/Wen administration.
This peculiar relationship between the Chinese State (i.e. the CPC and the government) and
the business sector highlights the specific character of the Chinese economic system, which
Bai/Hsieh/Song have been classifying as “Crony Capitalism with Chinese Characteristics”
(Bai/Hsieh/Song 2014, 2). They understand that in this system “a sine qua non of successful
capitalists in China is that they need to be cronies of political leaders” (Bai/Hsieh/Song 2014,
2). Given the deficient state of the formal institutional setting in China, the authors judge “the
only way for entrepreneurs to succeed is to form special relationships with political leaders,
which allows them to either break the formal rules or to obtain exclusive access to resources”
(Bai, Hsieh and Song 2014, p. 2).
Part II: The Chinese Economic System at the Interface with the Global Markets
The second p of the Report investigates the organisation of the interface between the Chi-
nese economic system and the global market system. It studies in how far at this critical junc-
tion of the global division of labour Chinese government organisations are intervening in
market processes as well.
Chapter 4: Foreign Trade
The principle agency tasked with all matters related to foreign trade is the Ministry of Com-
merce (MOFCOM). Much of the current regulatory framework for foreign trade policy is laid
out in the Foreign Trade Law of the People’s Republic of China (NPC 2004c). MOFCOM
drafts policies, overseas their implementation and maintains control mechanisms to sanction
rule violations. Like all ministries and commissions of the central government, MOFCOM is
subordinate to the State Council, China’s cabinet. The State Council deals with foreign trade
on a more selective basis and makes decisions on questions of long-term strategic im-
portance for the national economy and public welfare.
The Chinese government also reserves itself the monopoly right to import a variety of com-
modities. Under regulation in force in May 2015, only selected SOEs are approved to handle
imports of certain grains but also of sugar, cotton and tobacco. Table 62 provides a detailed
overview. Other policy programmes identified in the Report include extensive import substitu-
tion schemes and state trading arrangements.
In order to promote export activity as well as steer the composition of China’s total export
volumes, Chinese government agencies continue to employ a broad range of instruments

© THINK!DESK China Research & Consulting 2015 Seite 22
and dedicated policy programmes. This policy programmes include Export Constraints, Val-
ue Added Tax Rebates, Export Duties, State Trading, Export promotion, Export Subsidies,
Prizes for Export performance, matching export performance with subsidies, Famous Brands
export programme, Provincial Export Support Funds, and finally the Demonstration Bases
programme.
Chapter 5.1: Inward Foreign Direct Investment
Throughout the 2000s, China has been the largest recipient of FDI among all emerging mar-
kets and developing countries. Inflows surged after China had joined the WTO in 2001 and
growth rates remained high until the world financial crisis. In 2008, the value of FDI actually
utilised had reached 95.3 billion USD. After a slight dip in 2009, growth resumed, albeit at a
slower pace. Since 2011, inflows have stagnated at about 119 billion USD.
The Chinese government continues to regulate and restrict foreign direct investment in spite
of a stream of previous reforms and liberalisation announcements, e.g. following the third
plenum of the 18th CPC Central Committee in November 2013. After China joined the WTO
in 2001, a large number of sectors were opened to overseas investors and China has acted
largely in line with its liberalisation commitments from the accession protocol. However, by
the time of writing in early 2015, a significant number of business areas still remained closed
off for foreign direct investment (FDI) as the Chinese government sought to protect the mar-
ket position of domestic companies in general and SOEs in particular.
The most recent revision of the Catalogue for Guiding Foreign Investment Industries was
released by the NDRC and the MOFCOM on March 10th 2015 and entered into force one
month later. It contains a total of 349 individual technologies and, like previous documents,
divided them into three categories: encouraged, restricted and prohibited. Overall, the Cata-
logue opens more sectors of the Chinese economy to foreign competition and removes own-
ership restrictions in some areas. The number of restricted and prohibited items was cut
while that of encouraged items increased. Starting from April 10th 2015, foreign invested en-
terprises (FIE) are explicitly encouraged to build and operate urban subways, light rail as well
as other means of rail bound passenger transportation systems. The need for a domestic
joint venture partner was eliminated. Wholly foreign owned accounting and auditing compa-
nies are encouraged as well, as long as the leading partner is a Chinese national. Similarly,
FIE are welcome to construct and operate grids together with a domestic counterpart as the
major shareholder.
The restricted category was streamlined compared to the 2011 document as the number of
restricted areas dropped from 79 to 38. Restrictions were lifted on the production of drugs,
chemicals and general apparatuses as well as several other manufacturing industries. In the
service sector, FIEs are now allowed to build and operate high grade hotels, office buildings
and exhibition centres. The development of land, investment in second hand real estate and
operation of real estate brokerage agencies was upgraded to the permitted category. Im-
portantly, FIEs are free to set up non-bank financial institutions and operate e-commerce

© THINK!DESK China Research & Consulting 2015 Seite 23
platforms independent from a local partner. In basic and value-added telecommunications
services, FIEs may seek ownership shares of 50% and 49% respectively.
Even though the new version of the Catalogue is a marked improvement on past versions, its
arrival has not been met with great excitement. Although welcoming the new revisions, the
European Chamber of Commerce still criticised the Catalogue calling it
“only a small step for the Chinese Government’s own stated ambitions of giving
full play to the market” (EUCCC 2014b).
The American Chamber of Commerce likewise welcomed the changes but immediately
called for even bigger steps to be taken in order to promote freer trade (AmCham China
2015):
“While being a promising first step in the direction of a freer market in China, the
Catalogue still discriminates against foreign businesses, thus making the Chinese
economy a planned economy, not one based on a free priced system. Restricting
which industries foreign companies may enter and subjecting them to different
rules than domestic companies is blatantly protectionist and does not qualify the
country as a market economy.”
Chapter 5.2: Outward Foreign Direct Investment
As early as 1999, the Chinese government introduced the “Going out” strategy to comple-
ment the earlier “Leading in” approach to investment inflows. The Going Out strategy has by
now been fleshed out by a large number of detailed guidelines and administrative measures.
The evolution of a regulatory framework combined with the strategy’s introduction in numer-
ous government plans and programmes. A review of the FYP of provinces, autonomous re-
gions and municipalities under the direct administration of the central government showed
that all regions, with very few exceptions, promoted the Going Out strategy since the 11th
planning period. The initiative has been positioned as an integral part of the Chinese eco-
nomic development model and is frequently referenced in industrial policy guidelines.
The Report illustrates the governmental instrumentalization (and promotion) of outward for-
eign direct investment activities by Chinese firms for the reduction of industrial overcapaciti-
ties in the domestic Chinese economy.
Chapter 6: Exchange Rate Regime
The Report discusses the institutional set up and working principles of China’s currency link-
up to the global currency system. It analyses the exchange rate determination mechanisms
in the Chinese “managed float” regime and the leeway existing for governmental interfer-
ence. The Report concludes its investitgation with the assessment that in its present state

© THINK!DESK China Research & Consulting 2015 Seite 24
the Chinese exchange rate system is neither designed nor able to transmit correct signals
about respective competitive strengths between China and the global market place. As these
signals are distorted the welfare creating function of a global division of labour and highly
diversified international value chains is seriously inhibited.
Part III: China’s impact on the global economic system
Chapter 7: Does China meet the EU’s criteria to be considered a Market Economy?
In order to attain “market economy status” and become eligible for corresponding treatment
in trade disputes, economies must concurrently fulfil all of the following five criteria (Europe-
an Commission 2012):
1. Low degree of government influence over the allocation of resources and decisions of
enterprises, whether directly or indirectly (e.g. public bodies), for example through the
use of state-fixed prices, or discrimination in the tax, trade or currency regimes.
2. Absence of state-induced distortions in the operation of enterprises linked to privati-
sation (i.e. “carry over” from the old system). Absence of use of non-market trading or
compensation systems (such as barter trade).
3. Existence and implementation of a transparent and non-discriminatory company law
which ensures adequate corporate governance (application of international account-
ing standards, protection of shareholders, public availability of accurate company in-
formation).
4. Existence and implementation of a coherent, effective and transparent set of laws
which ensure the respect of property rights and the operation of a functioning bank-
ruptcy regime.
5. Existence of a genuine financial sector which operates independently from the State
and which, in law and practice, is subject to sufficient guarantee provisions and ade-
quate supervision.
In an appraisal conducted in 2008 EC staff concluded that criterion 2 should be assessed as
having been met, while all other four criteria were not fulfilled by China. Summarizing China’s
compliance, or non-compliance, with the EU’s five MES-criteria, the Report shows that to-
day’s Chinese economic system is still far from fulfilling the remaining four of the five criteria:
Chinese government continues to wield substantial influence over the allocation of
resources and the behaviour of individual economic entities thereby relegating mar-
kets into a secondary role (criterion 1).
Chinese companies are embedded in close-meshed networks with representatives of
Chinese government as well as the CPC. These connections prevail over and distort
the existing OECD-style legal framework and result in non-market conforming corpo-
rate governance, accounting and transparency practices (criterion 3).
© THINK!DESK China Research & Consulting 2015 Seite 25
The Chinese laws for the protection of (intellectual) property rights as well as its bank-
ruptcy regime are not yet fully functional. As such “market” outcomes remain distorted
and discriminate against economic subjects relying on the principles of fair competi-
tion (criterion 4).
The Chinese financial sector does not operate independently from government, but
must comply with government directives for capital allocation. The price of capital nei-
ther reflects its true scarcity nor the varying degrees of risk involved in different trans-
actions (criterion 5).
The present Chinese economic system might be highly capital intensive in character, but its
institutional set-up and ordering mechanisms do not comply with the principles present in
competition based markets.
Furthermore, it also has be highlighted that a refusal by the EU to grant MES-status to China
based on China’s non-fulfilment of the criteria outlined above, must not be misinterpreted as
a protectionist measure on behalf of the EU. On the contrary, the welfare creating effects of a
highly fragmented global value chain – in which China should, and can, play an important
role – can only come into existence if the best entrepreneurial ideas and most competitive
enterprises are selected through the functioning of fair competition. Underperforming enter-
prises that are allowed to remain players in the global value chain due to political protection
and irregular cost structures harm global welfare and retard economic development and pro-
gress in all participating societies in all parts of the global economy.
The use of true market-determined external prices for determining whether there is dumping
from non market economies is the only way to calculate the true measure of dumping and to
prevent the distortions in the Chinese system from contaminating market based price setting
in market economies. Any other approach will harm EU industries and discriminate against
enterprises and economies complying with the principles of fair competition-based market
processes worldwide.
Chapter 8: Impact of China on the global market
This study has amply documented the institutional set-up and working principles of the Chi-
nese politico-economic system. The evidence shows that the Chinese economy does not
have the minimum requirements necessary for a competition-based market economy as un-
derstood in OECD terms. Nor does China meet the hands-on MES criteria catalogue of the
WTO and EU.
While China is free to choose the form of an economy that best suits its domestic situation,
problems arise when it engages in international economic exchanges involving economic
actors operating in different market contexts. Normal economic ordering regimes are always

© THINK!DESK China Research & Consulting 2015 Seite 26
based on a set of signals and incentives that, in equilibrium, are designed to coordinate the
interaction of the most number of factors. If one economy does not comply with the normal
signals and incentives distortions appear in every economy touched by it. The functionality of
national economic systems is impaired and contemporary welfare as well as dynamic devel-
opment impulses are lost.
In order to allow incompatible individual markets to continue to function in their own spheres,
institutional air-locks or buffers must be established that neutralise or contain the alien eco-
nomic signals and keep normal signalling intact.
China has been committed to the erection of such institutional air-locks between its domestic
economy and the global market place since it started to re-engage into the global division of
labour in the late 1970s. Specialized trading companies with monopolistic powers, import and
export cartels, trade quota systems, bonded export and foreign investment zones, foreign
investment catalogues, licensing systems for inward and outward bound investment activi-
ties, strict foreign exchange administration, current and capital account currency convertibility
restrictions, a managed (multiple) exchange rate system etc. all constitute such air-locks with
which the Chinese government has been trying to shield the domestic economy from un-
wanted external impulses.
This chapter of the Report – inter alia – analyses the efforts made by market economies to
prevent the distortions from the China economic model from injuring market economies. In
2013 alone, 75 anti-dumping measures were introduced by different countries. In the first six
months of 2014, China accounted for 45% of worldwide anti-subsidy cases.
The Report illustrates various transmission channels by which European firms become ex-
posed to unfair competition from Chinese firms receiving governmental protection and oper-
ating in crony-capitalist structures.
Chapter 9: Concluding analysis
The Report concludes with an overview of the major insights derived in the run of the analy-
sis. It comes to the final assessment that the Chinese economic system must be understood
and classified as a state controlled market system that is distorting the global markets, there-
by inhibiting their welfare creating function. It finds that:
The study has beern able to identify a substantial number of mechanisms by which
Chinese government interferes in the transmission of signals on economic strengths
and competitiveness and also intervenes directly in the composition and intensity of
cross border activities. Ranging from distortions of the exchange rate to explicit sub-
sidies to preferential tax arrangements these governmental interventions distort the
sectoral pattern and product specific structure as well as absolute intensity of China’s
integration in the global division of labour. As a consequence, the role Chinese firms

© THINK!DESK China Research & Consulting 2015 Seite 27
play in product specific global value chains are not compatible with any comparative
advantages in China or and the individual firms’ true competitive strengths. While this
allows Chinese firms to gain unsustifiably large market shares and corresponding
revenue income, other, actually more competitive firms are being crowded out and
must leave the market.
As a consequence the Study comes to the conclusion that
the classification of China as a non-market economy constitutes a necessary “air-
lock” mechanism shielding the European market system from alien, distorting in-
fluences. Only by withholding MES privileges and upholding the third-country-
comparison methodology facilitated by treating China as a non-market economy
can the real scope of price distortions in China’s factor of production and goods
markets be reveiled and true level of dumping be calculated. Any other approach
will harm EU industries and discriminate against firms and economies upholding
the principles of fair competition-based market processes worldwide.
Only by guaranteeing a fair competitive process that selects the best players for participation
in the global value chain and weeds out those which are profiting from irregular practices,
can welfare be created on an equitable and sustainable basis – for all societies participating
– and dynamic economic development on a global scale be promoted.

© THINK!DESK China Research & Consulting 2015 Seite 28
1. INTRODUCTION
The exceptional dynamics of China’s economic development and growth process since the
country’s departure from Maoist ideology and economic development programmes constitute
one of the most remarkable phenomena of the 20th century’s economic history and have con-
tinued to make a salient impression on the global economic development in the early 21st
century. Economists are struggling to understand the underlying forces of China’s unprece-
dentedly quick rise from a deeply underdeveloped economy to one that not only furnishes its
population with considerable welfare but has also become a shaping force in the global divi-
sion of labour. Today the prevailing approach is to highlight China’s institutional transfor-
mations as the key explanatory variable. In the run of three decades the former set of com-
paratively unproductive economic institutions has been gradually replaced by a new set of
institutions that now allow for a much more efficient allocation of resources and which have
made completely new realms of productivity accessible to the Chinese economy.
The point of departure of this institutional transformation is well known, the Maoist system of
central planning. But where have 35 years of institutional reform and transformation led the
Chinese economy? Can the Chinese economic system of today be classified as a competi-
tion-based market economy – a market economy that is based on decentralised market pro-
cesses where myriads of market actors determine their economic activities according to sali-
ent relative scarcities? Moving one step further and elevating the problem at hand to the
global level, the question to be answered is in how far an unconditional, full integration of the
Chinese economic system into the global market system and its decentralized division of
labour can be achieved without any negative repercussions on the functionality and efficien-
cy of this very system.
The study at hand looks exactly into these questions. In order to better understand the work-
ing mechanisms of China’s contemporary economic system the study takes a close look at
the Chinese economy’s institutional set-up and the specific role Chinese government organi-
sations at various levels, the Communist Party of China (CPC) as well as markets play for
the co-ordination of economic transactions.
In the first part of the study, the analysis focuses on the organisation of China’s domestic
economic activities. Chapter 2 looks at the macro-economic coordination of economic inter-
action by analysing the respective role top-down implemented plans and programmes on the
one hand and horizontally designed markets on the other hand command for the allocation of
resources. This analysis is complemented with an examination of the direct impact of the
CPC and its representatives on the microeconomic operations of China’s economy and busi-
ness entities in chapter 3.
Part II of this study is concerned with the organisation of the interface between the Chinese
economic system and the global market system as well as the question in how far the specif-
ic ordering mechanisms of the Chinese economy interact with the organizational patterns of
the global economic system.

© THINK!DESK China Research & Consulting 2015 Seite 29
In order to do so, chapter 4 takes a close look at the institutional set-up and role of active
policy guidance for China’s international goods trade (import and export activities). This ana-
lysis is complemented by a corresponding study of cross border capital flows in chapter 5.
Chapter 6 deepens the analysis by taking a look at the determinants underlying the price of
China’s currency Renminbi vis-à-vis foreign currencies, understanding the exchange rate as
the price linking domestic economies to the rest of the world.
Basing on the analysis of the preceding chapters, Part III of the study deals explicitly with the
impact of the Chinese economic system on the viability and effectiveness of the global eco-
nomic division of labour. Starting point for this endeavour is a benchmarking exercise: By
summing up the insights of the preceding chapters and bringing them into a broader per-
spective, chapter 7 evaluates the institutional set-up of the Chinese economy and its working
mechanisms in the framework of the Market Economy Status (MES) Framework as defined
by WTO and EU statutes. This allows for a comprehensive evaluation of the role market
principles play for economic processes in the Chinese economy and its compatibility with the
global markets regime.
The following analysis (chapter 8) is based on the fundamental understanding that the idea
of global markets hinges on the principle of a fair competitive process that selects the best
players for participation in the global value chain and weeds out those which are profiting
from irregular practices. Only in this institutional framework can welfare be created on an
equitable and sustainable basis – for all societies participating – and dynamic economic de-
velopment on a global scale be promoted. Chinese firms have in recent years become prom-
inent players in the global markets, both as partners in the global value chain as well as
competitors in the market place. But do they share the values of an economic community
highlighting the idea of free and open competition? Given the very specific state-business
nexus out of which Chinese firms are operating, the question arises in how far their unregu-
lated participation in the global markets is promoting global welfare or rather eroding the
functionality of the market system in the longer term.
Chapter 9 concludes the study with an assessment of the general character of the Chinese
economic system and its impact on the global market system.

© THINK!DESK China Research & Consulting 2015 Seite 30
*****
It should to be noted that citations referencing specific pages in financial reports (AR, HYR)
do not refer to the page numbers imprinted on the respective pages, but are taken as dis-
played by Adobe Acrobat. As several reports have more than one counting order and others
lack page numbers altogether this approach was chosen for reasons of practicability and
transparency.
In this report all monetary values are given in nominal Yuan Renminbi, if not indicated other-
wise. During the period covered in this study the value of the Renminbi has been fluctuating
and been subjected to some valuation changes that forbid a simple transformation of
Renmibi values into Euro. In order to provide an indication of the corresponding Euro values
(and US$ equivalents) of the documented Yuan Renminbi figures the following figure 1 doc-
uments the movement of the nominal exchange rate of the Renminbi versus the Euro as well
as the US$.
Figure 1 Nominal Exchange Rate of the Renminbi versus the Euro as well as the
US$, 01.01.2000-18.06.2015 (Yuan RMB to 1.00 Euro respectivey 1.00 US$)
Source: IMF.
0
2
4
6
8
10
12
RMB / USD RMB / EUR

© THINK!DESK China Research & Consulting 2015 Seite 31
For ease of calculation Table 1 provides the yearly average exchange rates between the
Renminbi and the Euro from 2000 to 2015:
Table 1: Average Nominal Exchange Rate Renminbi vs. Euro, 2000-2014
Rank Bid Ask/Offer
2000 7.42115 7.42933
2001 7.72653 7.74853
2002 9.20855 9.23433
2003 10.20163 10.23073
2004 10.32032 10.34904
2005 9.93658 9.96025
2006 10.36966 10.39986
2007 10.34055 10.37502
2008 9.44704 9.47793
2009 9.07375 9.10082
2010 9.02223 9.05071
2011 8.11562 8.14075
2012 8.20844 8.22070
2013 8.23421 8.24187
2014 6.93880 6.96630
Source: IMF, Oanda.

© THINK!DESK China Research & Consulting 2015 Seite 32
Part I
The Management of the Chinese Economy:
Institutional Set-up and Policy Instruments

© THINK!DESK China Research & Consulting 2015 Seite 33
2. CENTRALISED PLANNING AND MARKET FORCES
IN THE CHINESE ECONOMY
Chinese government organisations, at all levels of the national hierarchy, seek to control the
economic activities of individual business entities and to direct their behaviour in directions
considered necessary for the realisation of goals already fixed at the national level (Chinese
Communist Party as well as the national government), the local and the individual levels.
This Part of the Report demonstrates that this phenomenon is reflected in the complex sys-
tem of planning documents that guide all economic activities in China (section 2.1) as well as
a substantial number of specific programmes targeting specific objectives and developmental
goals (section 2.2). In this context, the market is nothing more than a complementary instru-
ment with a limited role for the allocation of resources, depending on sectors and products
covered (section 2.3.)
2.1 The Role of Planning in the Chinese Economy
In the global economic community there are only three major countries left, which employ
complex five-year plans as a key instrument to guide national economic development and
growth: next to India, and Indonesia the PR China is one of them. The character of planning
has changed over time, its relevance for economic development not.
In China a major change has been implemented with the 10th Five Year Plan (covering the
period 2001-2005). With this document the tradition of directive planning, which was provid-
ing concrete output-target figures, has been discontinued. Instead indicative planning mech-
anisms and indirect means of control and regulation are now being deployed. From the 11th
Five Year Programme for Economic and Social Development, covering 2006-2010, onwards,
even the term ‘plan’ has been abandoned and been substituted for the label ‘programme’.
These new “Five Year Programmes”, however, are no less comprehensive and complex than
their ‘plan’-forerunners. Like their predecessors, they comprise much more than just China’s
central government’s vision and general outline for national economic development.
2.1.1 Types of Plans
As a matter of fact these highly publicised national “Five Year Plans/Programmes” (FYP) are
nothing less than the flagship documents of a highly intricate set of planning that permeates
the Chinese economic system. Originating from the national FYP, various sets of pro-
grammes branch off in multiple dimensions. Figure 2 provides a graphic illustration of the
Chinese planning system.
1. Along the administrative hierarchy. Between national and village governments, the
Chinese administrative hierarchy consists of six layers (centre, provinces, cit-

© THINK!DESK China Research & Consulting 2015 Seite 34
ies/prefectures, districts/counties as well as townships and villages in the countryside).
Sub-national governments (for convenience referred to as “local”), draft their own
FYP which are derivatives of the flagship document. Mostly, local FYP reproduce and
translate the broad, macro-economic issues of economic and social development of
the national flagship FYP to local contexts. While drafted within the general confines
defined by the flagship plan, local authorities claim substantial policy space to ad-
dress issues of particular relevance for their respective jurisdictions. In doing so, they
take good care not to challenge the cornerstones of economic policy. However, local
plans are not entirely consistent from beginning to end. Pledges to substantially re-
duce the ecological footprint maybe followed by ringing endorsements for polluting
industries a few pages further on. Similarly, every plan contains language that pro-
motes the role of free markets for factor allocation, income distribution and other is-
sues. At the same time, most plans also emphasise the importance of policy guid-
ance for achieving socially optimal outcomes. In a nutshell, local plans broadly mirror
central level templates, but carry contradictory messages to ascertain local priority is-
sues get treated in the desired manner. Only highly condensed versions, so called
outline documents, are available to the public. The full text of plans/programmes are
treated as secret and no instance is known to THINK!DESK where such documents
were leaked.
2. Along institutional lines. A cascade of plans/programmes is drafted for/by all major
government units. This includes government departments on all but the lowest admin-
istrative levels as well as state-owned enterprises, state-run research institutes and
other state-affiliated organisations throughout the country. While these documents
are not published, the limited information available suggests a neat integration of
such plans/programmes with those of supervising authorities.
3. Along the lines of overarching topical areas. In order to provide additional detail on
objectives and measures, the Chinese government released a large number of com-
plementary FYPs. Such documents exist on issues such as developing indigenous
innovation capabilities, preventing localised air pollution, conserving resources and
reducing emissions, waste water treatment and recycling business or addressing
population aging. These FYPs transcend many topical areas and separate FYPs.
This category also includes FYPs on major national initiatives, like developing central
and western regions, reviving old industrial bases, improving basic public services or
supporting ethnic minorities. While some of these FYPs place the focus on economic
policies, others are more anchored in engineering, geography or other fields.
4. Along sectoral lines. A cascade of dedicated plans/programmes exists for practically
all types of economic activity. Plans for agriculture, industrial development and ser-
vices have been a core element of economic policymaking since the pre-reform era.
At a lower level, these plans are complemented by similar documents on particular
industrial sectors, such as wine making, steel production or courier services. Finally,

© THINK!DESK China Research & Consulting 2015 Seite 35
plans exist to address sub-sectors of particular relevance, such as high grade special
steel.1
Sectoral plans do not appear to be integrated into a comprehensive framework, as provided
by international commodity classification systems. In fact, they seem to be drafted as the
need arises – which implies that while some commodities or economic activities do not have
their “own” plan, others are governed by multiple plans that target individual sub-segments.
Where economic or technology policy initiative transcends or bundles together products and
technologies from various economic sub-sectors special FYPs are drafted as overarching
guideline. This is the case for the ocean economy or strategic emerging industries. Rather
than industrial sectors, the latter span seven topical areas, including energy efficient and en-
vironmental technologies, next generation IT, biotechnology, advanced equipment manufac-
ture or new materials. In addition to an FYP for the development of strategic emerging indus-
tries, each of those “industries” is covered by its sector-specific plan.
There is little consistency across planning cycles. The scope of sectoral FYP may vary as
items are included or assigned otherwise. Similarly, even major industrial sectors, like the
steel industry, do not have an FYP issued in every planning cycle. The 11th FYP (covering the
years 2006-2010) passed without such a document being released. Instead industry specific
Development Policies filled this gap in industries like automobile, cement, steel or pulp and
paper (NDRC 2004; NDRC 2005; NDRC 2006; NDRC 2007). Issued by the NDRC in be-
tween 2004 and 2007, the Development Policies were comprehensive and authoritative
enough to skip work on separate FYPs.
In the case of sectoral plans, it becomes clear that no single government department is in
charge of all plans. While this has been the case prior to China’s reform and opening policy,
for the 12th planning circuit various ministries and commissions have put forth sectoral docu-
ments. For example, the 12th FYP for the natural gas industry was issued by the NDRC. MIIT
is responsible for the petrochemical industry FYP while MOST took charge of the high grade
special steel FYP. State Council, too, has released sectoral plans, such as one for the ener-
gy sector as a whole. Instead of a well integrated and consistent system of FYP, there to
exist a broad array of separate documents that leaves blank some parts of economic activity
while intensely regulating others. As the examples have shown, no universal agency appears
to bundle all planning tasks.
A remarkable feature of sectoral FYP is the large variance in the time of publication. In theory,
the 12th FYP cycle has started on January 1st, 2011. While the national master document
was only ratified by the annual session of the National People’s Congress in March of that
year, other FYPs have come out with a much greater delay. The FYP for the energy sector
was only released in January 2013. Nevertheless, the document’s subtitle clearly indicates it
to be effective starting two years earlier. In fact, such documents seem to come out only
when some department identifies a need. While late publications may suggest a thorough
1 However, there also exist national (sic) FYP for bee keeping and potato processing.

© THINK!DESK China Research & Consulting 2015 Seite 36
coordination and consensus building process between authorities, FYPs often show instanc-
es of overlap and contradiction.
Figure 2: Overview of the Chinese Planning System
Illustration by THINK!DESK.
Overall, it does not appear that FYP for industrial sectors and overarching topical areas are
issued in order to fill blanks in the overall comprehensive FYP matrix. This is different in case
of regional and institution FYPs which are mandatory. However, at the sectoral level, gov-
ernment authorities are not pursuing the comprehensive universality of planning regimes
known from the pre-reform era and the Soviet Union. FYPs are drafted when government
bodies have a manifest interest in the underlying issues and want to specify objectives along
with related measures. As such, FYP continue to be an important instrument of sectoral in-
dustrial policy and should be regarded as means to an end not an ends in themselves. An
incomplete list of sectoral 12th FYPs is presented in box 1. Box 2 adds an incomplete list of
key technology programmes for the 12th planning cycle which complement and provide addi-
tional detail to the sectoral FYPs.

© THINK!DESK China Research & Consulting 2015 Seite 37
Box 1 Incomplete List of Sectoral Five-year Programmes of the 12th Planning Cycle
12th Five-year Programme for the Aluminium Industry
12th Five-year Programme for the Animal Feed Industry
12th Five-year Programme for the Automobile Industry
12th Five-year Programme for the Bearing Manufacturing Industry
12th Five-year Programme for the Bee-keeping Industry
12th Five-year Programme for the Beverage Industry
12th Five-year Programme for the Biomass Industry
12th Five-year Programme for the Cement Industry
12th Five-year Programme for the Chemical Fibre Industry
12th Five-year Programme for the Civil Aviation Industry
12th Five-year Programme for the Civilian-use Explosives Industry
12th Five-year Programme for the Clock and Watch Industry
12th Five-year Programme for the Construction Decoration Industry
12th Five-year Programme for the Construction Materials
12th Five-year Programme for the Construction Industry
12th Five-year Programme for the Cosmetics Industry
12th Five-year Programme for the Dangerous Chemicals Industry
12th Five-year Programme for the Explosion-proof Electrical Industry
12th Five-year Programme for the Fertilizer Industry
12th Five-year Programme for the Fibreglass Industry
12th Five-year Programme for the Fluorine Chemical Industry
12th Five-year Programme for the Food Industry
12th Five-year Programme for the Furniture Industry
12th Five-year Programme for the Grape Wine Industry
12th Five-year Programme for the Healthcare Products Industry
12th Five-year Programme for the High-end Equipment Manufacturing Industry
12th Five-year Programme for the Home Appliances Industry
12th Five-year Programme for the Industrial-use Textile Industry
12th Five-year Programme for the Instruments Industry
12th Five-year Programme for the Integrated Circuit Industry
12th Five-year Programme for the Internal Combustion Engine Industry
12th Five-year Programme for the Internet Industry
12th Five-year Programme for the Leather Industry
12th Five-year Programme for the Light Industry
12th Five-year Programme for the Machine Tool Industry
12th Five-year Programme for the Machinery Industry
12th Five-year Programme for the Mechanical Engineering Industry
12th Five-year Programme for the Medicine
- continued –

© THINK!DESK China Research & Consulting 2015 Seite 38
- continued -
12th Five-year Programme for the Meat Industry
12th Five-year Programme for the Methanol Industry
12th Five-year Programme for the Natural Gas Industry
12th Five-year Programme for the New Materials Industry
12th Five-year Programme for the Non-ferrous Metals industry
12th Five-year Programme for the Non-material Resources Technology Projects
12th Five-year Programme for the Olefin Industry
12th Five-year Programme for the Optical Fibre and Optical Devices Industry
12th Five-year Programme for the Papermaking industry
12th Five-year Programme for the Pesticide Industry
12th Five-year Programme for the Petrochemical and Chemical Industry
12th Five-year Programme for the Plastic Door- and Windowmaking Industry
12th Five-year Programme for the Plate Glass
12th Five-year Programme for the Potato Processing Industry
12th Five-year Programme for the Power Industry
12th Five-year Programme for the Printing Industry
12th Five-year Programme for the Rubber Industry
12th Five-year Programme for the Security Industry
12th Five-year Programme for the Shipbuilding Industry
12th Five-year Programme for the Silkworm Industry
12th Five-year Programme for the Soda Ash Industry
12th Five-year Programme for the Solar Energy Industry
12th Five-year Programme for the Special Purpose Vehicle Industry
12th Five-year Programme for the Steel Industry
12th Five-year Programme for the Strategic and Emerging Industries
12th Five-year Programme for the Sugar Refining Industry
12th Five-year Programme for the Sulphuric Acid Industry
12th Five-year Programme for the Termite Control Industry
12th Five-year Programme for the Textile Industry
12th Five-year Programme for the Traffic and Transportation
12th Five-year Programme for the Vanadium and Titanium Comprehensive
Resource Utilisation
12th Five-year Programme for the Vegetable Oil Processing Industry
12th Five-year Programme for the Wind Power Industry
Compilation by THINK!DESK.

© THINK!DESK China Research & Consulting 2015 Seite 39
Box 2 Incomplete List of Key Technology Programmes for the 12th Planning Cycle
Key Technologies in the Field of Basic Research for Development during the 12th
Five-year Programme
Key Technologies in the Field of Broad Band Networks for Development during the
12th Five-year Programme
Key Technologies in the Field of Clean Coal for Development during the 12th Five-
year Programme
Key Technologies in the Field of Cloud Computing for Development during the 12th
Five-year Programme
Key Technologies in the Field of Commercialisation of High and New Technologies
and Establishing for Development during the 12th Five-year Programme Suitable
Environments
Key Technologies in the Field of High Grade Special Steel for Development during
the 12th Five-year Programme
Key Technologies in the Field of High-speed Railways for Development during the
12th Five-year Programme
Key Technologies in the Field of Intelligent Manufacturing for Development during
the 12th Five-year Programme
Key Technologies in the Field of Lighting for Development during the 12th Five-year
Programme
Key Technologies in the Field of Medical Instruments for Development during the
12th Five-year Programme
Key Technologies in the Field of Modern Services for Development during the 12th
Five-year Programme
Key Technologies in the Field of New Energy Vehicles for Development during the
12th Five-year Programme
Key Technologies in the Field of New-type Display for Development during the 12th
Five-year Programme
Key Technologies in the Field of Regenerative Power for Development during the
12th Five-year Programme
Key Technologies in the Field of Seawater Desalination for Development during the
12th Five-year Programme
Key Technologies in the Field of Semiconductors for Development during the 12th
Five-year Programme
Key Technologies in the Field of Service Robots for Development during the 12th
Five-year Programme
Key Technologies in the Field of Smart Grid for Development during the 12th Five-
year Programme
Key Technologies in the Field of Solar Energy for Development during the 12th Five-
year Programme
- continued –

© THINK!DESK China Research & Consulting 2015 Seite 40
- continued -
Key Technologies in the Field of Tourism Public Service for Development during
the 12th Five-year Programme
Key Technologies in the Field of Waste Recycling for Development during the 12th
Five-year Programme
Key Technologies in the Field of Wind Power for Development during the 12th Five-
year Programme
Compilation by THINK!DESK.
As has been shown, the plethora of FYPs does not represent a puzzle where pieces neatly
connect to each other and show a clear “grand picture”. Rather, FYPs can be grouped by
importance, e. g. depending on the issuing agency’s authority (ranking from highest to low-
est): (1) State Council, (2) NDRC and other central government commissions, (3) MIIT and
other central government ministries as well as provincial level governments.
FYPs can also be grouped by regional scope, implying that – of course – national FYP trump
provincial ones while provincial ones override municipal ones.
Another way to look at it would be to assign preference or priority to the FYP that were re-
leased more recently than others. This implies that more recent outcomes of the consensus
building process carry more authority than older ones. In sectors, like energy, more scholarly
attention is needed to explore the intricate interaction between government bodies and their
respective planning documents.
Other meaningful ways exist to make sense of this complex situation but shall not be ex-
plored here for reasons of brevity. What has become clear, however, is that despite signifi-
cant uncertainty and confusion, all FYP can be located inside a four-dimensional space that
is defined by the factors outlined above, i.e. administrative hierarchy, institutional affiliation,
topical area, sectoral connection. While all planning units enjoy a limited degree of discretion,
they need to ensure their FYP are appropriately placed relative to “adjacent” documents in
the policy space.
While the FYP cycle – by definition – outlines the cornerstones of public policy in the medium
term, several long term plans form an enveloping layer. An example is the 9th National FYP
(1996-2000) which included the Long Range Development Objectives until 2010. The fifth
plenary session of the 14th Central Committee approved and issued both documents at the
same time. This instance was exceptional, as the duration was synchronised with the FYP
cycle. In most cases, these long term visions are issued in the middle of the FYP cycle and
emphasise their strategic importance overrides the conventional five-year rhythm. Examples
include the National Medium to Long-term Development Plans for:

© THINK!DESK China Research & Consulting 2015 Seite 41
– Nanotechnology (2001-2020)
– Nuclear Power (2005-2020)
– Science and Technology (2006-2020)
– Energy Conservation (2006-2020)
– Renewable Energy (2007-2020)
– Food Safety (2008-2020)
– Education Reform (2010-2020)
– Talent (2010-2020)
– Civil Aviation (2013-2020)
– Logistics (2014-2020) or the
– Strategic Action Programme for Energy Sector Development (2014-2020)
This list is by no means complete and would become substantially longer if sub-central gov-
ernment plans were included. Shandong (2006), Fujian (2006), Gansu (2006) and many oth-
er provincial-level jurisdictions have drafted their own Medium to Long-term Development
Plans for Science and Technology (2006-2020). Similarly, Hunan (2010), Guizhou (2013),
Gansu (2010b) are just some of many locations that have released own Medium to Long-
term Development Plans for Talents. Even some companies, such as Wuhan Steel have
been found to draft such documents – customised to their particular business setting.
According to a Wall Street Journal (20.03.2014) report, the MIIT has commenced work on
such a plan for iron ore mining. In early 2015, the drafting process began on various other
long-term plans. In another article, Reuters (06.03.2015) cited National Business Daily
newspaper, stating that China will launch a long-term plan for more efficient coal use and
reduce coal consumption by 160 million tons by 2020.
Xinhua News (04.03.2015) revealed that central government authorities were in the final
stages of compiling a long-term planning for the country’s large manufacturing industries.
The plan, supposedly running until 2025, is jointly prepared by the MIIT and the Chinese
Academy of Engineering. According to the Xinhua report, the plan envisions China to have
achieved comprehensive industrialisation by 2020 and the status of an industrialised country
by 2050. Special emphasis is supposedly being placed on new-generation IT, biomedicine
and bio-manufacturing as well as high-end equipment manufacturing and new energy.
One of the key characteristics of Chinese economic planning is long-term consistency. This
may be due to the unique layout of China’s meritocratic public administration or the absence
of participatory mechanisms that could lead to policy swings or even ruptures. However, the
overlay of medium and long term planning instruments play an important role in maintaining
stable trajectories when it comes to development objectives. While some topics have almost
disappeared, like price regulation, others have gradually grown from footnote to dominating
scheme, like environmental protection, resource conservation and equitable development.
Indigenous innovation is another paramount theme which grew out of the earlier isolationist
strive for national self-sufficiency in output. No longer isolationist but vanguard, trade and

© THINK!DESK China Research & Consulting 2015 Seite 42
investment, China wants to take the lead in generating high tech expertise to become a
global frontrunner in the future.
Since the 1990s, FYPs and long term plans have become increasingly indicative, as stated in
the beginning. There are substantially fewer (hard) targets and the proposed implementation
policies sound vague. Language has been softened considerably since China’s accession to
the WTO to avoid conflicts between its so called Socialist Economy with Chinese Character-
istics and fellow member states over the state’s role in the economy.
2.1.2 Plans and Complementary Documents
The “flagship”-character of the national “Five Year Plans/Programmes” is also exemplified by
their leading role in the three-tiered structure of China’s comprehensive system of planning
and policy implementation. This is constituted by three major types of documents:
Plans and programmes introduce general targets and provide guiding thoughts.
Catalogues translate broadly defined targets into narrowly defined policy objects.
Implementation documents outline the instruments and explicate the procedural detail
necessary for plan implementation.
Ideally, plan and programme targets are accomplished through the successful application of
implementation measures to catalogue items. In the following, the three categories are out-
lined in greater detail:
1. The “Five-Year Plans/Programmes” indicate broad development priorities for the me-
dium term and provide further information as to what region or unit will be in charge of
addressing them. The Plans/Programmes review the development experience and
make an attempt to plan into the future based on a broad understanding of the cur-
rent situation and a set of future expectations. They clarify policy orientation towards
issues deemed important and elaborate on policy tools to meet objectives. Finally,
they assign targets for jurisdictions on lower levels. As economic reforms have pro-
gressed, the FYPs have become less and less specific on individual matters, leaving
more policy space for implementing agencies. Central government plans/programmes
provide the official policy stance that has to be taken up by regional government
when preparing their own plans/programmes. In order to ensure consistence, higher
level government organisations are in charge of reviewing draft plans/programmes of
lower levels before they are published or circulated amongst their target groups.
The national “Five Year Plans/Programmes” are guided by the Central Committee of
the CPC and drafted by the National Development and Reform Commission in a pro-
cess that allows input from other Ministries and provincial governments as well as in-
dustry associations and other NGOs. After the drafting process is complete – a pro-
cedure that takes more than one year – the National People’s Congress, officially

© THINK!DESK China Research & Consulting 2015 Seite 43
China’s highest political decision making body, approves the document during its an-
nual session.
2. The Catalogues for Investment Guidance provide a very detailed listing of products
and government attitudes toward them. The catalogues are structured in three parts,
specifying items to be encouraged, restricted and prohibited. For practical reasons,
products and processes that are not mentioned fall into a fourth category: they are
permitted. The basic function of the catalogues is to
“encourage and support the development of advanced production ca-
pacities, restrict and eliminate outdated production capacities, prevent
blind investments and low-level redundant construction, and effective-
ly propel industrial structure optimisation and upgrading” (State
Council 2005a at preamble).
Underlying themes of current catalogues are indigenous innovation, technological up-
grading, environmental protection and resource conservation – in line with the current
12th Five Year Programme.
How a product is classified has a profound effect on its producers, traders and cus-
tomers because all industrial policies reference to the catalogues. Classifications are
observed by all relevant government departments and thus influence the treatment of
products and enterprises in a profound way. In 2005, the State Council ruled that
“the people's governments of all provinces, autonomous regions, and
municipalities directly under the Central Government, the relevant
administrative departments of the state for development and reform,
public finance, taxation, land resources, environmental protection, in-
dustry and commerce, quality inspection, banking supervision, elec-
tric power supervision, work safety supervision, as well as the admin-
istrative departments of all industries, etc. shall establish and improve
the mechanism for organisation, supervision and inspection of the in-
dustrial structure adjustment work, perform their respective duties,
cooperate with each other closely, form a resultant force, and effec-
tively intensify the effectiveness of implementing industrial policies”
(State Council 2005a in the preamble)
However, much depends on the actual situation and the interests of local authorities
that are tasked with the implementation “according to the local situation” (State Coun-
cil 2005a at preamble). Like passing through a filter, clear cut instructions lose focus –
or get lost completely – as they get passed down the administrative hierarchy.
The two catalogues with the widest reach and the highest impact are the Catalogue
for the Guidance of Structural Adjustment of Industries (NDRC various years) which
directs investment decisions of domestic enterprises and the Catalogue for the Guid-

© THINK!DESK China Research & Consulting 2015 Seite 44
ance of Foreign Investment Industries (NDRC and MOFCOM 2011), which defines
the legal scope of operation for companies with any degree of foreign capital partici-
pation. On the former, the State Council notes:
The Catalogue is the important basis for guiding investment direction
and for government to manage investment projects as well as formu-
late and execute policies on public finance, taxation, credit, land and
foreign trade etc. (State Council 2005a at 3.12).
Typically, both catalogues are updated once during every FYP period.
Additional catalogues exist to direct investments into specific regions, e.g. the Cata-
logue of Priority Industries for Foreign Investment in Central and Western China
(NDRC and MOFCOM, 2013), and subsectors of the economy, e.g. the Guidance
Catalogue for Key Products and Services in Strategic Emerging Industries (NDRC,
2013). Furthermore, some provinces and cities compile their own catalogues to drive
their development agendas according to local conditions.
3. The policy documents drafted by government organisations on all levels complete the
system for regulating business activities. According to the broad objectives defined in
the planning documents and the limitations of business activities specified through
the guidance catalogues, a large number of policy provisions cover all aspects of
business activities.
The following table 2 offers a snapshot of several major Catalogues employed to support the
transformation of the Chinese economy.

© THINK!DESK China Research & Consulting 2015 Seite 45
Table 2: Overview of Selected Guidance Catalogues Maintained at the Central
Government Level
Catalogue Remarks
Catalogue of Public In-
frastructure Projects Eli-
gible for Preferential En-
terprise Income Tax
Treatment (2008)
MOF, SAT and NDRC, 2008a, CaiShui 2008, No. 116.
Catalogue of Priority In-
dustries for Foreign In-
vestment in Central and
Western China (2013)
NDRC and MOFCOM, 2013, Decree 2013, No. 1.
Catalogue of Encour-
aged Technology and
Product Imports (2011)
NDRC, MOF and MOFCOM, 2011, FaGaiChanYe
2011, No. 937.
Catalogue of Compre-
hensive Use of Re-
sources for Preferential
Enterprise Income Tax
Treatment
MOF, SAT, NDRC, 2008b, CaiShui 2008, No. 117.
Catalogue of Imported
Products not subject to
Tax Exemption in For-
eign Investment Projects
GAC, 2008, Report 2008, No. 65.
Catalogue of Chinese
High-Tech Products for
Export (2006)
MOST, 2006, GuoKeFaJiZi 2006, No. 370.
Catalogue for the Guid-
ance of Foreign Invest-
ment Industries
NDRC and MOFCOM, 2011, Order 2011, No. 12
Category of Non-Tax-
Exempted Imported
Items under Domestical-
ly Funded Projects
MOF, NDRC, GAC and SAT, 2012, Report 2012, No.
83.
Source: Based on WTO 2014 at 89-90
© THINK!DESK China Research & Consulting 2015 Seite 46
2.2 Dedicated Government Programmes for Industry Guidance
The Chinese government remains committed to a hands-on approach to economic develop-
ment. Industrial policies are employed to provide guidance to economic actors and steer the
economy towards specific goals. This chapter examines some of the most important policy
programmes are being introduced. In this context the specific mechanisms that are employed
in order to steer enterprises and whole industries in specific directions is outlined.
2.2.1 Subsidies – An Overview
When China joined the WTO on December 11th, 2001, it accepted the organisation’s Agree-
ment on Subsidies and Countervailing Measures. The document defines subsidies as
financial contributions by a government or any public body within the territory of a
member which confers a benefit. All three of these elements must be satisfied in
order for a subsidy to exist.
However, the Agreement only covers subsidies that are specifically provided to an enterprise
or industry or group of enterprises or industries. It outlines that depending on their nature,
subsidies may be actionable or prohibited.
Prohibited subsidies: Those contingent, in law or in fact, whether wholly or as one of sev-
eral conditions, on export performance (“export subsidies”) as well as those contingent,
whether solely or as one of several other conditions, upon the use of domestic over imported
goods (“local content subsidies”). Both kinds are prohibited as they may seriously damage
the economic and trade interests of other member countries.
Actionable subsidies: This group includes most other types of specific subsidies that are
not explicitly prohibited. The WTO allows its members to challenge these subsidies through
countervailing measures imposed on the national level or through dispute settlement pro-
ceedings held in front of a WTO panel. Pursuant to the SCM Agreement (WTO 1994a), con-
fronting actionable subsidies provided by another member requires that one of the following
three conditions have to be met. Proceedings have to conclude that adverse effects from
subsidisation in one member country
causes injury to the domestic industry of another member through imports of subsi-
dised goods.
damages the interests of another member’ industry through displacing the latter’s
products in third country markets (serious prejudice).
leads to the exploitation of improved market access to another member’s market
through undercutting local prices (nullification or impairment)
© THINK!DESK China Research & Consulting 2015 Seite 47
The SCM Agreement introduces comprehensive rules for identifying and challenging prohib-
ited or actionable subsidies. It provides a comprehensive system of laws and procedures that
aims to discourage member countries from tilting the playing field in favour of domestic en-
terprises and help members affected by that practice to offset adverse effects.
In order to ensure a certain degree of transparency, members are required to notify the WTO
of their subsidisation practices on a regular basis. China has accepted this obligation when it
joined the WTO in 2001. However, it has failed to submit regular subsidy notifications. As the
world’s largest exporter and importer of goods this has created significant uncertainty regard-
ing the scale and scope of government grants. China’s first notification was received in 2006,
a full five years after accession, and can at best be regarded as partial fulfilment of obliga-
tions under the SCM Agreement. The file covered the years 2001 to 2004 and was limited to
subsidies provided by central government authorities. For the most part, the notification ad-
dressed support measures for agriculture and investment incentives for foreign invested en-
terprises.
Subsequent countervailing investigations conducted by the E.U., the U.S., Canada, Australia
and other WTO members have identified numerous grant giving operations conducted by the
Chinese central government that were not included in the notification – many of which have
been found to violate the SCM Agreement. Several academic and commercial studies have
discovered numerous instances where subsidy programmes, tax breaks, discount loans and
related measures have conferred unfair advantages to selected industries and enterprises
(e.g. Price et al 2006; Price et al. 2007; Dewey & Le Boeuf LLP 2007; Haley 2008; Ogilvy
Renault LLP, 2007; Taube and in der Heiden 2009).
Furthermore China’s 2006 notification provided no information at all about industry support
programmes and grant giving schemes operated by the country’s 33 provincial and about
850 municipal-level jurisdictions. This fact is particularly relevant as the Chinese political-
economic system transfers most policy implementation matters to the local government level.
Furthermore, provinces, cities, districts and counties bear the responsibility for developing
local economies and use financial incentives to compete for investment projects. Both factors
suggest that subsidisation is prevalent and that most objectionable practices are anchored
on lower administrative levels. The omission of subsidy programmes administered by sub-
central governments thus creates a very large blank spot in the notification.
In 2011, China submitted its second subsidy notification which covered the period from 2005
to 2008. The second document displays the same shortcomings as the first and has to be
considered significantly incomplete. Information provided on subsidy schemes administered
by central government authorities was again found to have large gaps and again, not a single
programme run by sub-central government bodies was mentioned. Overall, China did not
honour the commitments it accepted at the time it joined the WTO in a complete, consistent
and transparent fashion. It failed to disclose all relevant information in a timely manner. It
also failed the obligation to publish policy documents on trade-related measures translated
into at least one of the organisation’s official languages in a single official journal.

© THINK!DESK China Research & Consulting 2015 Seite 48
Considering the high importance of China as trading partner, manufacturing powerhouse,
investment target and consumer market, the need to better understand the Chinese-brand of
state-business interaction can hardly be overstated. The potential and actual adverse effects
of subsidisation practices are of a magnitude that mandates more in-depth research outside
China to compensate for a lack of openness inside it.
In light of the dissatisfactory information disclosure on subsidisation practices, researchers
across OECD countries took the initiative to shed some light onto state-business dealings on
all levels of government. Through the review of numerous government and corporate docu-
ments, several in-depth studies have turned up substantial evidence for continued and, in
fact, ubiquitous subsidisation. The U.S. Department of Commerce, for example, has been
able to locate information on over 300 programmes which had not been disclosed in China’s
two subsidy notifications. In 2011, the Department filed its first counter notification of about
200 individual subsidy schemes that had been missing in China’s own notifications (WTO
2011b). Pursuant to article 25.8 of the SCM Agreement, it requested further information on
the notified programmes but received none from the Chinese side. In 2014, the U.S. submit-
ted a second counter notification under article 25.10 of the SCM Agreement (WTO 2014b).
That document added another 100 programmes which had been identified in the course of
several countervailing duty investigations since the Department’s first counter notification two
years earlier. Another call for comments was filed and is still awaiting response from Chinese
authorities. Information on the roughly 300 programmes published by U.S. authorities con-
firmed earlier findings that sub-central government bodies have been heavily engaged in
drawing up and implementing objectionable subsidy schemes.
A large part of the 300 programmes identified by the U.S. DOC covers policy documents that
were released in the wake of the global financial crisis as part of China’s massive economic
stimulus package. So called Restructuring and Revitalisation Programmes have been issued
by the central government for ten key industries. Provincial and municipal authorities have
drafted their own Restructuring and Revitalisation Programmes to take account of local in-
dustry structures and investment priorities. Such documents contained targets for the devel-
opment of technology and industry as well as domestic and foreign trade. Concrete financial
and non-financial support measures were outlined to ensure successful structural transfor-
mation and upgrading of key industries.
A second part of the subsidy programmes notified by the U.S. covers the national and re-
gional 12th FYP documents for various industries. Valid from 2011 to 2015, the national FYP
represents the most comprehensive blueprint for all policies targeting development of the
economy and society. Local governments have modelled their respective FYP on the nation-
al one. On all levels of the administrative hierarchy, FYP exist to direct the development of
individual industries and key sectors.
A third part addresses promotion measures in place for so called strategic emerging indus-
tries. Conceived by a decision of the State Council in 2010, the cultivation and development
of seven priority industries constitutes the cornerstone of China’s strategy to boost the role of
technology- and knowledge intensive sectors in the economy. As the nurturing of related

© THINK!DESK China Research & Consulting 2015 Seite 49
companies has been universally accepted as priority task by regional governments across
the country, the list of promotion measures and preferential treatments is long.
A fourth part constitutes miscellaneous subsidies that target different aspects of company
development across a large number of sectors. THINK!DESK research confirms that there
exists a large number of economic, environmental and technology policies which involve the
provision of financial incentives to companies which take on designated tasks, can meet cer-
tain performance requirements, or simply undertake their business in line with regulations.
Such programmes provide institutional frameworks that can be understood and interpreted
where underlying policy documents are available. The descriptions of individual subsidy re-
ceipts reported in the income statements of listed companies often indicate that certain
transactions were based on particular support schemes. In this way, it is possible to fine tune
the search for yet unknown subsidisation programmes and that add to the understanding of
the state-business nexus in China. Furthermore, it becomes possible to link individual com-
panies to certain development policies from which they have benefited. From the review of
corporate documents filed with the China Securities Regulatory Commission, it has become
clear that a sizable number of subsidy disbursements are tied to concrete programmes.
Many of them are recurring benefits as a company that has qualified for a particular pro-
gramme remains eligible for receipts in future periods.
However, THINK!DESK has uncovered a substantial number of subsidies which appear to be
unrelated to any specific policy framework. While available information may indicate that
such financial contributions were inspired by the intention to help improve innovative capabili-
ties or support environmental protection, it is not immediately clear which government initia-
tive has provided the regulatory basis for the payment. In some cases, companies disclose
no information on the nature of the subsidies they have received. This makes it particularly
difficult to understand the institutional background for payments that may number in the mil-
lions or even billions of RMB.
Since 2010, most companies have reported subsidy income that relates to specific projects.
Such subsidies are typically made by regional governments and disbursed through the Fi-
nance Departments of either the city or the province where the operations in question are (to
be) located. Most such grants do not take the form of recurrent payments as enterprises are
typically awarded a financial support in a lump sum. This implies that for most companies a
steady flow of government grants forms a basic subsidy income. Across time, the latter dis-
plays some highly erratic development because project specific funds cause total grant in-
come to skyrocket in individual years.
From the above it has to be concluded that a significant share of government grants are
made on an ad hoc basis. In fact, local governments enjoy a significant degree of discretion
when it comes to supporting preferred enterprises. The local 12th FYP typically identifies such
companies as pillar, backbone or “dragonhead” enterprises. Unless the purpose of subsidies
are specified, corporate income statements have to be read together with local plans and
policies in order to deduct the government’s intention behind a subsidy. This greatly compli-

© THINK!DESK China Research & Consulting 2015 Seite 50
cates the work of researchers trying to deepen the understanding of state-business interac-
tion in general and subsidisation practices in particular.
Subsidies come with various labels. Most are designated as subsidies (补助 or 补贴) while
others take the form of awards (奖). Many grants are disbursements from special funds (专项
资金) or offered as loan interest subsidies (贴息). Tax refunds (税返还) and compensations
for enterprise expenses (经费 / 补偿) are common and in some cases particularly large. And
even beyond these various types of categories there exist additional forms of subsidies hid-
den behind China’s specific accounting rules. Box 3 provides some details to this avail.
Box 3: Chinese Accounting Rules in the Context of Subsidy Payments
China’s accounting rules hide the full extent of subsidisation, implicating that subsidy data
presented in this study covers just one part of total subsidy disbursements in China. Three
important limitations exist:
1) Pursuant to PRC GAAP, government grants made as investments by the state are cred-
ited to the capital reserve and not treated as subsidies. Subsidies related to technology
research and upgrading projects are added to the capital reserve once construction of
the underlying assets is complete. In contrast, IFRS stipulates that government grants
related to the purchase or construction of fixed assets are treated as deferred income.
As the underlying assets depreciate over their normal useful lifetime, the subsidy funds
are converted into profit and loss relevant income.
2) Unless noted otherwise - information presented here only covers subsidies recognised
as profit and loss (P/L) relevant income for one particular year. In many instances com-
panies receive grants for use over multiple years. The funds are typically registered at
fair value, credited to a deferred income account and gradually released in subsequent
accounting periods as P/L relevant income:
a) Subsidies relating to assets are registered at fair value of said assets and kept as
deferred income. The grant is then converted into the P/L relevant income in equal
annual instalments over the asset's expected useful life.
b) Subsidies intended to compensate future expenses are booked as deferred income
first and recognised as P/L relevant income in the periods in which the costs to be
compensated are expensed. Subsidies related to cover expenses in the current or
past periods are registered as P/L income directly.
The Chinese tax code provides special provisions on the treatment of deferred income
for when it is received and while it is stored waiting to be spent.
3) Access to financial information in general and subsidy income in particular is limited to
listed companies as only these are legally required to publicly disclose relevant data.
The 2,784 companies listed inside China represent only a small fraction of the country's
enterprise population. It must be noted that listed companies are a very unique subsec-

© THINK!DESK China Research & Consulting 2015 Seite 51
tion of the latter due to their significance for respective home localities. Both economic
rationality and prestige considerations have put these companies in a favourable situa-
tion to benefit from preferential treatment in many regards. Chinese government docu-
ments emphasise the special importance and leadership function of key enterprises.
This is also reflected in the designation individual subsidy payments. Consequently, it
should be assumed that non-listed companies are less likely to receive financial support
and, if they do, amounts are probably smaller. Similarly, SOEs have been found to be
more prone to receive subsidies and, if they do, obtain larger amounts. Among listed
firms, the share of state businesses is higher than in the general economy. This sug-
gests that findings should not be used for simple extrapolation over the total enterprise
population as that will likely overstate the extent of subsidisation.
In most cases, the government does not initiate subsidy payments on its own initiative. In-
stead, companies apply for participation in projects or programmes launched and adminis-
tered by governments on the national and local level. These are predominantly related to
research and development, environmental protection, resource conservation or industry con-
solidation. Naturally, the authorities in charge of most such schemes are the NDRC, the MIIT
and the MOST as well as their subordinate bodies on lower levels. The number, funding vol-
ume, spending targets and other characteristics of subsidy schemes depend on the general
economic situation and work priorities derived by the State Council and CPC Central Com-
mittee.
The objectives of subsidies are highly diverse, although descriptions indicate that most
transactions are geared towards
Technology innovation and commercialisation
Technology renovation and upgrading
Environmental protection (incl. energy conservation, pollution clean-up, emission re-
duction, waste water treatment, desulfurisation of gaseous exhaust)
Transformation and adjustment of the industrial structure (e.g. M&A, relocations,
compensations for enterprises leaving industries with high overcapacities)
Employment and training (e.g. re-settlement of displaced workers, social security
premiums, housing and amenities for employees, maintaining staff levels)
Foreign trade (imports of encouraged goods, general export promotion, export
brands, export insurance, foreign market exploration)
In all, the relationship between enterprises and local state organs is highly complex. Subsi-
dies are not disbursed as a form of minimum income on an indiscriminate basis. Rather, the
specific value of a production plant or service operation for the local economy, the provision
of public services and the government authorities themselves have to be considered.

© THINK!DESK China Research & Consulting 2015 Seite 52
As much as local governments can impact on the operational success and financial perfor-
mance of companies, the connection is far from being a one-way street. Enterprises provide
much needed tax revenues, employment and economic stimulus. Large players are a scarce
resource in a country where tens of thousands of jurisdictions vie for investment-led growth.
Losing major local enterprises to bankruptcy or regulatory violations confronts government
officials and party cadres with formidable challenges. This explains an important phenome-
non of local level subsidisation: strong performance does not always translate into high sub-
sidy incomes. As much as the central government seeks to accelerate the process of struc-
tural change and flush out outdated players, the local level is often found to be supportive to
failing companies – even rescuing them. Faced with the immediate task to safeguard a
steady level of economic growth inside their respective jurisdictions, localities have been
found to retard structural change and “throw good money after bad”.
In terms of the sources of subsidy transactions, local governments are important providers.
Despite their rather limited fiscal resources and high degree of indebtedness, cities and even
counties have been found to find tens of millions of RMB in their budgets to boost competi-
tive enterprises and rescue ailing ones. Unfortunately, the picture is incomplete as not all
companies disclose the source of subsidy income. Furthermore, the picture maybe blurred
by the fact that payouts from higher level government authorities are forwarded and dis-
bursed through the Finance Bureaus at the local level.
2.2.1.1 Examples for Preferential Policies and Grant Giving Operations by
Local Governments
In the following the specific character and operational handling of subsidy disbursements by
local governments are being illustrated by means of selected case studies.
Case 1: Zhejiang Province
Authorities in Zhejiang Province have followed the practice of identifying several leading
backbone industrial enterprises on an annual basis. The provincial government has stated
that it was committed to promoting the development of such enterprises and strove to create
favourable operating conditions. The provincial leadership pledged to fully implement nation-
al fiscal support regulations, tax privileges and other preferential policies promoting enter-
prise development. Furthermore, it announced to introduce its own support measures and
help companies in areas, such as technology innovation and renovation. Local firms are to
be given support and preference in applications for key technology renovation and technolo-
gy innovation projects of Zhejiang Province (2010).
Local policy makers have offered active support for companies applying for projects adminis-
tered at the national level, such as high-technology centres, engineering centres and state
key laboratories. To this end, the allocation and administration of land use rights for major

© THINK!DESK China Research & Consulting 2015 Seite 53
construction projects will be given high priority. Through government promotion, such pro-
jects are to reach implementation, launch and profitability stages earlier than anticipated
(ibid).
To enable smooth favourable access to financial resources and ensure that credit demand
for enterprise development can be met, Zhejiang authorities promised to guide commercial
banks through twinning of companies and banks, expanding credit lines, providing syndicat-
ed loans and other measures. At the same time, enterprises are to enjoy support when listing
at domestic and foreign stock exchanges, issuing corporate bonds or obtaining bridging fi-
nance (ibid).
The supply of coal, oil and electricity as well as transportation services are to be coordinated
in ways that prioritises leading backbone enterprises and safeguards their supply. Compa-
nies are encouraged to invest overseas to set up raw material exploration, establish manu-
facturing centres, expand sales networks and engage in R&D activities (ibid).
Case 2: Jiaxing City
Jiaxing City’s leadership, in its 12th FYP for industry development, outlined the development
objectives for various sectors. Until 2015, companies should put emphasis on new wall mate-
rials, new waterproof building materials, new thermal insulation materials and new building
decoration materials. Companies are urged to focus on deep processing activities in order to
enhance production technology and upgrade product portfolios (Jiaxing City 2011 at 3.1.2).
In addition, the plan for industrial development in Jiaxing city’s Binhai New Area states that
special emphasis should be given to the development of a select number of products. Manu-
facturing enterprises were called to achieve high-technology content, excellent quality and a
broad product spectrum (Jiaxing City 2007 at 3.3). In terms of industry support, the develop-
ment plan announces the drafting of local development guidance catalogues. The document
states that a system of supporting policies touching upon different areas, such as land utilisa-
tion, taxation, investment funding and legislation, should be put in place to support local in-
dustry (Ibid at 3.3).
Case 3: Jiujiang City
Jiujiang’s municipal government in 2008 has set out to vigorously implement a new-type in-
dustrial development strategy. The approach was supposed to (1) focus on the cultivation
and expansion of backbone enterprises in selected industries, (2) introduce large scale in-
dustrial projects and (3) speed up the industrialisation in the locality (ibid.).
Furthermore, Jiujiang city pledged to optimise the provision of important inputs and pledged
that key projects would be prioritised in the provision of resources, energy, land and other
important inputs so as to safeguard a stable supply. The planners outline preferential treat-
ments for core enterprises and key projects regarding the supply of energy and financial re-

© THINK!DESK China Research & Consulting 2015 Seite 54
sources. The latter issue has been given particular emphasis in the strategy roadmap docu-
ment. Policymakers announced that core enterprises and key projects would be made the
main beneficiaries of credit support. More precisely, the Jiujiang municipal authorities an-
nounced their intention to actively coordinate with all commercial banks and actively seek
their cooperation in attributing priority to meeting the financial needs of core enterprises and
important projects (ibid.).
Moreover, Jiujiang city pledged to increase its support in making available land for develop-
ment on a large scale. It assured that land demand of major projects would be given high
priority and incorporated into the local land usage plan. Concerning technological upgrading,
the document’s authors urge the acceleration of the establishment of technology centres fo-
cusing on core enterprises as main parts (Jiujiang Municipality 2008).
The Jiujiang government announced in 2009 a large array of assistance measures to nurture
high-tech industries in general and innovative enterprises in particular. Only a few hand-
picked companies are entitled to take advantage of the provision of financial resources, poli-
cy guidance, management services and other benefits (Jiujiang Municipality 2009).
Case 4: Chengdu City
A policy providing loan interest subsidies to the local new materials industry has proven ad-
vantageous for a significant number of companies. Pursuant to a guideline promulgated in
2007, enterprises with a net increase in liquidity loans during the current year are qualified to
receive liquidity loans at 70 percent of the current central bank benchmark lending rate for
duration of one year. The amount of these special facilities matches the liquidity loans added
during the current year to a maximum of RMB 1 million per company. Enterprises from the
new materials industry that engage in key projects or possess a leading role for the industry
as a whole may claim up to RMB 2 million in preferential loan support. To be deemed eligi-
ble for these preferential loan facilities, however, companies must have paid taxes in excess
of RMB 10 million during either the previous or present reporting period (Chengdu City
2010a at 3) .
Enterprises that pay taxes under RMB 10 million in the current and previous reporting peri-
ods but with sales revenues of RMB 20 million or more from new material products in either
reporting period can benefit from liquidity loans at only 50 percent of the central bank’s
benchmark lending rate to cover newly added liquidity loans. In these cases, the volume of
preferential loans should not surpass RMB 1 million while the time span is set at one year
(ibid.).

© THINK!DESK China Research & Consulting 2015 Seite 55
2.2.1.2 Recent Initiatives by the Central Government Aimed at Restricting
Local Government Activities
Taking account of the facts that (1) local governments hand out substantial amounts of
grants to local companies and that (2) the political intentions behind these payments are not
always conforming to national strategies devised by the central government, the latter has
taken an unusual move in December of 2014. The State Council (2014) issued the Circular
on Clearing and Standardizing Preferential Policies on Taxation and other Areas. The docu-
ment concedes that
“in recent years, to promote the regional economic development, some regions
and departments have provided specific enterprises and the investors (or man-
agers) thereof with preferential policies for taxation, non-taxable and other reve-
nues, and fiscal expenditures (hereinafter referred to as “preferential policies for
taxation and other aspects”), which have promoted the investment growth and in-
dustry concentration to some extent; however, some preferential policies for taxa-
tion and other aspects have disturbed the market order, affected the effects of the
macro-adjustment and control policies of the state, and even are likely to violate
China's commitments to foreign countries and give rise to international trade con-
flicts” (State Council 2014).
In general, localities are warned to strictly implement rules on the administration of fiscal ex-
penditures. All existing preferential policies involving government expenditures, including
refund-after-payment schemes, fiscal rewards or subsidies have to be submitted to the State
Council for review and approval. Similarly, a blanket ban has been put on the widely used
practice of offering financial rewards and tax breaks in order to attract investors.
The document goes on to prohibit regional governments to development preferential tax poli-
cies without the approval of the State Council. It also outlaws the provision of specific prefer-
ential tax policies in the context of other laws, regulations, rules, development plans or as
part of regional development policies (at 3.1). The State Council explicitly forbids localities to
reduce, waive or delay the collection of fees and other charging items. The same rule applies
to the payment of enterprises' portion of social insurance premiums as well as penalties im-
posed for violation of laws, regulations and provisions of the State Council (at 3.2).
With regards to land, cities and counties are barred from assigning LUR for free or at prefer-
ential prices. The exemption or reduction of annual land use fees and any related subsidisa-
tion measures is to be cancelled. Similarly, localities are not allowed to transfer state-owned
assets, equities of state-owned enterprises, mineral resources or other state-owned assets at
a discounted price. Related policies that provide companies with discounts on electricity and
water prices are to be cancelled universally. Furthermore, various preferential policies, like
the payment of social insurance premiums and other operating costs by government bodies
on behalf of enterprises are ruled out.

© THINK!DESK China Research & Consulting 2015 Seite 56
In order to implement the reforms, the State Council demands that all regions conduct an
internal review of preferential policies that may violate the new rules. They are also called to
screen all existing contracts with enterprises in order to locate and revoke incompatible
commitments. This comprehensive review should lead to the termination of all subsidisation
practices and repeal of all related policies. Where localities are confident that their proce-
dures are in conformity with central government policy, they must submit relevant regulation
to the MOF for review. If approved the MOF may file a special request with the State Council
asking to keep the policy in question in place.
Before the end of March 2015, all governments below the provincial level were to comb
through their policies and contracts, minutes of meetings, agreements and other documenta-
tion in order to compile lists of local practices. The lists were subjected to a review by provin-
cial level authorities and the MOF which then report to the State Council.
Resistance to the central government’s initiative to clear out local subsidisation programmes
has been massive, as localities accross China feared a reduction in investments (WSJ
23.06.2015). In May 2015, the State Council (2015b) eventually amended the controversial
policy in a move that can only be describted as complete policy reversal. China’s cabinet
abandoned its clampdown on local investment incentives, leaving most existing support
measures untouched. Instead, the central government applies restrictions only to future ini-
tiatives. Developments surrounding the Chinese domestic anti-subsidy drive were still unfold-
ing at the time of writing. However, the recent withdrawal of restrictions in the face of local
resistance underscores the importance of subsidies and other forms of investment incentives
for maintaining growth.
The most recent central government call to abolish electricity discount schemes on the local
level was issued by the State Council in November 2014. It was part of a document that pro-
hibited subsidization practices of local governments unless they have been vetted by central
authorities. Importantly, the political drive to wind down local schemes that provide goods
and services electricity, gas, water, coal at below market prices should not be interpreted as
a realization on the part of central decision makers that such moves are inefficient and thus
counterproductive per se. Much rather, the key question has been who – meaning which
government bodies on which levels – should exercise the authority to employ them.
The central government itself has made no indication that it indents to stop subsidization of
target industries, products or services. The SEI, which have been outlined in a previous sec-
tion, have illustrated that point. Until the present, regulatory documents are replete with
statements designating strategic sectors, core technologies and key products. Typically, ad-
ministrative measures specify the strategic objectives and outline the type of preferential
treatment that is to be provided. These draw on guidance catalogues which identifying spe-
cific items with detailed description to ensure for targeted support. In the following, brief ac-
counts of three examples for industry specific support measures announced as late as 2014
are being provided.

© THINK!DESK China Research & Consulting 2015 Seite 57
Case 1: The Integrated Circuit Industry
Aiming to boost the competitiveness of China’s rapidly expanding integrated circuit industry,
the MIIT, the NDRC and the MOF have jointly drafted the Guidelines for Promoting the De-
velopment of the National Integrated Circuits Industry. The document, issued in June 2014,
states the objective of promoting China to become a world leader in the industry by 2030. In
order to accomplish this goal, the three central government bodies announce support
measures helping companies expand their footprint in the value chain. This is to be achieved
through the provision of special tax preferences and various means of credit support. Most
importantly, a dedicated support fund will be set up by the MOF that will initially hold 100 bil-
lion RMB. The Guidelines order lower level governments to cooperate and establish own
funds. In total, special support funds for nurturing the integrated circuit industry are aimed to
reach a combined balance of 300 billion RMB.
In December 2013, the MIIT and three other central government bodies have issued the Ad-
ministrative Measures for the Accreditation of Integrated Circuit Design Companies. The
document outlines the government’s intention to cultivate the sector in the long run. It lists
performance requirements that companies have to meet to become eligible for special sup-
port and outlines the vetting procedures to be conducted by the MIIT and the NDRC.
In February 2015, the MOF followed up with detailed accounts of the tax breaks made avail-
able accredited companies in the integrated circuit industry. The Circular concerning Enter-
prise Income Tax Policies for Further Encouraging the Development of the Integrated Circuit
Industry introduces the three-free-two-half system. Enterprise Income Tax will be waived for
the first two years of profitable operation. Over the following three years, qualified enterprises
enjoy a 50 percent discount on the regular tax rate.
Case 2: The Rare Earth Industry
Due to its strategic import in a variety of high technology applications, the rare earth sector
has been singled out a target of reinforced financial support. The Administrative Measures
for Subsidy Funds for Developing the Internet of Things and the Rare Earth Industry, issued
in May 2014, aim, among other things, for technology upgrades throughout the rare earth
value chain. The scope of the policy is very broad, encompassing the promotion of mining,
smelting, processing and R&D activities along with environmental protection measures. The
Administrative Measures identify existing businesses as subsidy target and call for the com-
mercialisation of advanced technologies in support high end applications.
Case 3: Grain Production
In a bid to ensure supply safety for food items and boost agricultural incomes, the central
government pledged subsidies to domestic producers of grain. The measure which was an-
nounced in March 2014, promised disbursements on the order of 100 billion RMB for coming
years (EC 2014 at 14).

© THINK!DESK China Research & Consulting 2015 Seite 58
2.2.1.3 Subsidy Disbursements to Chinese Listed Companies
With well over 2,700 individual equities traded on the two domestic stock exchanges in April
2015 China features a comparatively large number of listed companies. Although transpar-
ency and information disclosure by China’s stock listed companies remains unsatisfactory,
the data made public by these companies provides some insights into the dimensions and
practices of governmental subsidy pay-outs to the Chinese enterprise sector. Table 3 pro-
vides an overview of total subsidy payments to Chinese listed firms during 2010-2014.
Across all listed firms, more than 30,000 individual subsidy transfers were recorded in 2014.
This represents an increase of almost 50 percent compared to just 21,090 transactions in
2010. During the past five years, both the number and the proportion of enterprises that take
advantage of government grants have shown a marked increase. Some companies report
individual subsidy items with great detail while others just provide a general total instead. In
2014, Kingfa Science and Technology Co., Ltd. reported 245 separate grant items while
Jointown Pharmaceutical Group Co., Ltd. registered 190 individual receipts in 2013.
Table 3: Overview of Governmental Subsidy Payments to Chinese Listed
Companies from 2010 to 2014
2010 2011 2012 2013 2014
No. of beneficiaries 2,215 2,366 2,527 2,580 2,625
No. of transactions 21,090 19,635 23,458 28,361 30,338
Average no. of
receipts 9.5 8.2 9.3 11.0 11.6
Source: Wind Data
During the fiscal year 2014, listed companies have benefited from a combined total of subsi-
dies worth 126.1 billion RMB. Annual disbursements of government grants have continuously
risen in previous years – effectively doubling since 2010 (64.7 million RMB).
In 2014, ten companies have been reporting grant receipts in excess of 1 billion RMB. The
following two tables 4 and 5 identify these Top 10 beneficiaries of government transfers in
2014 and – separately – list the nine recipients of individual subsidy items of more than 1
billion RMB.

© THINK!DESK China Research & Consulting 2015 Seite 59
Table 4: The Top10 Recipients of Government Grants in 2014
Rank Company Subsidy income
(in mln RMB)
1 PetroChina Co., Ltd. 10,931
2 China Eastern Airlines Co., Ltd. 3,627
3 China Petroleum & Chemical Co., Ltd. 3,165
4 SAIC Motor Co., Ltd. 2,672
5 Agricultural Bank of China Ltd. 1,969
6 China Yangtze Power Co., Ltd. 1,883
7 China COSCO Holdings Co., Ltd. 1,743
8 China Southern Airlines Co., Ltd. 1,728
9 Metallurgical Corporation of China Ltd. 1,066
10 Air China Ltd. 1,060
Total 29,844
Source: Wind Data
Table 5: Individual Subsidy Transfers Exceeding 1 billion RMB in 2014
Rank Company Subsidy income
(in mln RMB)
1 PetroChina Co., Ltd. 10,931
2 China Petroleum & Chemical Co. 3,165
3 China Eastern Airlines Co., Ltd. 3,054
4 Agricultural Bank of China Ltd. 1,969
5 China Yangtze Power Co., Ltd. 1,881
6 SAIC Motor Co., Ltd. 1,803
7 China Southern Airlines Co., Ltd. 1,728
8 China COSCO Holdings Co., Ltd. 1,584
9 Air China Ltd. 1,060
Total 27,175
Source: Wind Data
These ten enterprises received sizable grants for different reasons. The largest positions for
selected companies are outlined below. Unfortunately, not all enterprises publish a detailed
breakdown of their respective grant incomes:

© THINK!DESK China Research & Consulting 2015 Seite 60
SAIC Motors was transferred 600 million RMB for land in the context of plant reloca-
tions as well as 52 million RMB for purchases of undisclosed fixed assets (SAIC 2014
AR at 118).
The Metallurgical Corporation of China received 164 million RMB as support for
demolishing shantytowns on its land and resettling residents (Metallurgical Corpora-
tion of China 2014 AR at 168).
Chongqing Iron and Steel was awarded 507 million RMB in order to relocate its
production base to the outskirts of Chongqing City. Another 280 million RMB for envi-
ronmental protection, energy conservation and emission reductions (Chongqing Iron
and Steel 2014 AR at 130).
Unlike in the cases of PetroChina and the other enterprises listed in table 5, the vast majority
of subsidy transfers do not exceed 1 million RMB. Figure 3 provides an overview of the sepa-
rate amounts typically disbursed for single grant items.
Figure 3: Frequency Distribution of the Amounts of Individual Transfers
Source: Wind Data
Calculation by THINK!DESK.
Subsidy income plays an important role for many companies who suffer from meagre reve-
nues and lacklustre profits. Grants boost available resources to safeguard liquidity and facili-
tate investment projects which the companies could not realise without outside help. Table 6
9789
3815
5562
3758
2688
2322
1004
615
429
185
88
61
13
6
2
0
1
0 2000 4000 6000 8000 10000
100.000
200.000
500.000
1.000.000
2.000.000
5.000.000
10.000.000
20.000.000
50.000.000
100.000.000
200.000.000
500.000.000
1.000.000.000
2.000.000.000
5.000.000.000
10.000.000.000
20.000.000.000
No. of transfers
RM
B

© THINK!DESK China Research & Consulting 2015 Seite 61
documents the situation of those (profitable) enterprises featuring the highest subsidy-net
income ratio in 2014.
Table 6: Profitable Enterprises with the Highest Subsidy-Net Income Ratio in
2014
Net income
Subsidy in-
come
Subsidy/net
income ratio
Xinjiang Qingsong Building
Materials and Chemicals Co.,
Ltd.
6,442,377 379,992,472 5,898%
Xiamen XGMA Machinery Co.
Ltd. 10,301,839 497,198,884 4,826%
Liaoning SG Automotive
Group Co., Ltd. 10,196,038 239,790,036 2,352%
Chongqing Iron & Steel Co.
Ltd. 51,431,000 923,283,000 1,795%
Tangshan Jidong Cement
Co., Ltd. 34,707,565 503,165,000 1,450%
Shijiazhuang Changshan
Textile Company Limited 24,284,736 348,030,314 1,433%
Jizhong Energy Resources
Co., Ltd. 24,373,979 308,395,003 1,265%
Sunward Intelligent Equip-
ment Co., Ltd. 6,535,518 76,327,027 1,168%
Elec-Tech International Co.,
Ltd. 13,950,995 156,916,546 1,125%
Anhui Ankai Automobile Co.,
Ltd 23,537,516 260,114,316 1,105%
Source: Wind Data
Calculation by THINK!DESK.
The subsidy-net income ratio is significant across a large proportion of enterprises, regard-
less of ownership, industry affiliation or location. The following figure 4 displays the frequency
distribution of ratios across listed firms.

© THINK!DESK China Research & Consulting 2015 Seite 62
Figure 4: Frequency Distribution of Subsidy-Net Income Ratios for Chinese Listed
Firms in 2014
Comment: The diagram depicts only companies with a ratio greater than 1.
Source: Wind Data
Calculation by THINK!DESK.
The following figures 5, 6 and 7 provide illustrations of the frequency distribution of subsi-
dy/net profit ratios.
Figure 5: Subsidy-Net Profit Ratio of 2,251 Enterprises in 2014
(Range 1% - 5,898%)
Source: Wind Data
Calculation by THINK!DESK.
811
418 444
371
187
69 66
0
100
200
300
400
500
600
700
800
900
up to 5% up to 10% up to 20% up to 50% up to 100% up to 200% up to 500%
0%
1000%
2000%
3000%
4000%
5000%
6000%
Su
bs
idy r
ati
o
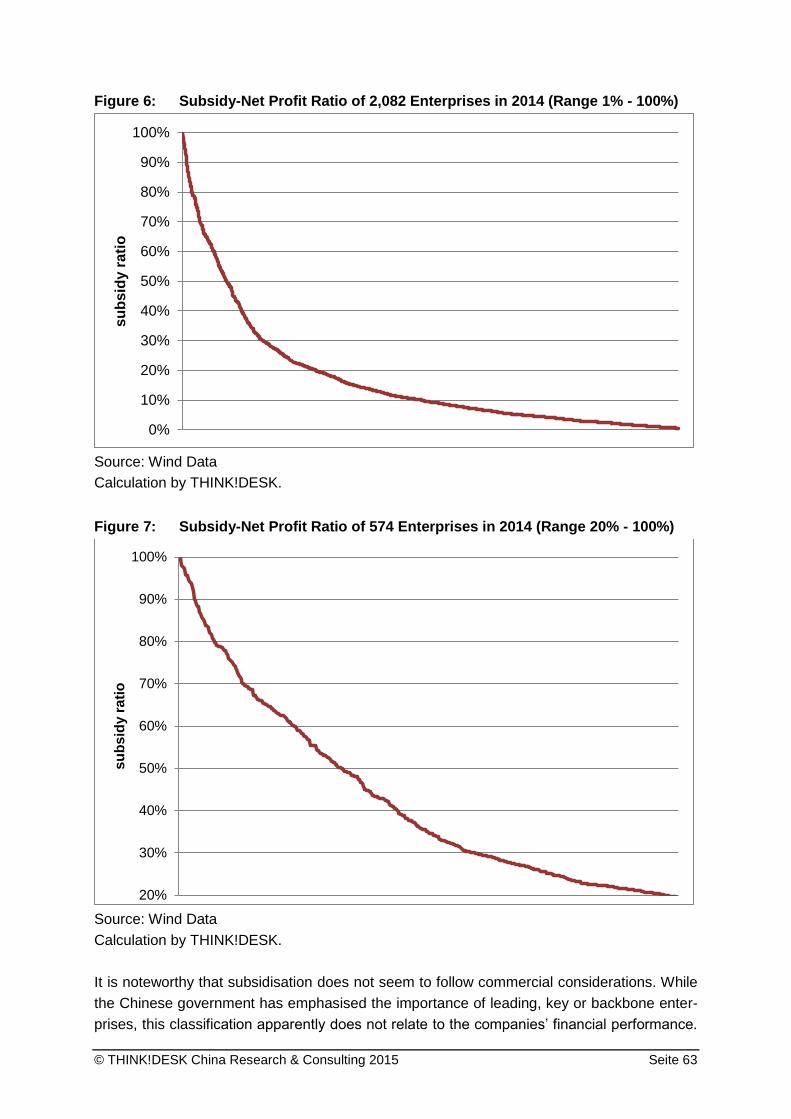
© THINK!DESK China Research & Consulting 2015 Seite 63
Figure 6: Subsidy-Net Profit Ratio of 2,082 Enterprises in 2014 (Range 1% - 100%)
Source: Wind Data
Calculation by THINK!DESK.
Figure 7: Subsidy-Net Profit Ratio of 574 Enterprises in 2014 (Range 20% - 100%)
Source: Wind Data
Calculation by THINK!DESK.
It is noteworthy that subsidisation does not seem to follow commercial considerations. While
the Chinese government has emphasised the importance of leading, key or backbone enter-
prises, this classification apparently does not relate to the companies’ financial performance.
0%
10%
20%
30%
40%
50%
60%
70%
80%
90%
100%s
ub
sid
y r
ati
o
20%
30%
40%
50%
60%
70%
80%
90%
100%
su
bsid
y r
ati
o
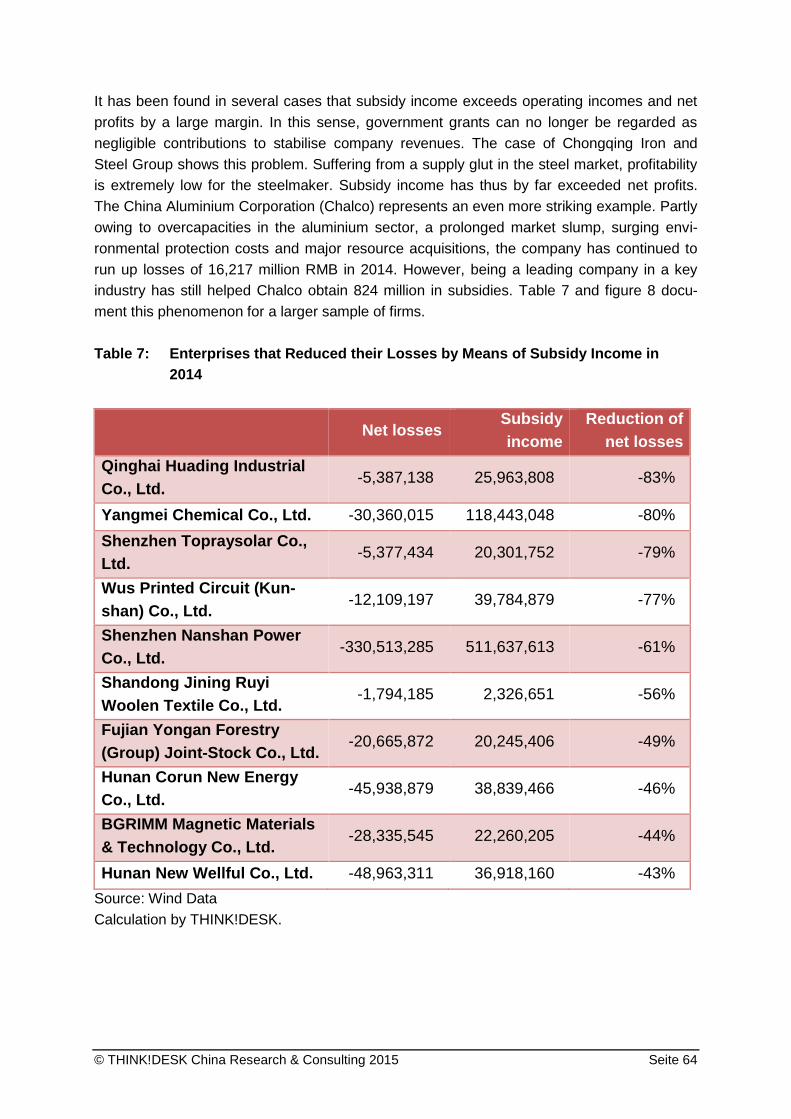
© THINK!DESK China Research & Consulting 2015 Seite 64
It has been found in several cases that subsidy income exceeds operating incomes and net
profits by a large margin. In this sense, government grants can no longer be regarded as
negligible contributions to stabilise company revenues. The case of Chongqing Iron and
Steel Group shows this problem. Suffering from a supply glut in the steel market, profitability
is extremely low for the steelmaker. Subsidy income has thus by far exceeded net profits.
The China Aluminium Corporation (Chalco) represents an even more striking example. Partly
owing to overcapacities in the aluminium sector, a prolonged market slump, surging envi-
ronmental protection costs and major resource acquisitions, the company has continued to
run up losses of 16,217 million RMB in 2014. However, being a leading company in a key
industry has still helped Chalco obtain 824 million in subsidies. Table 7 and figure 8 docu-
ment this phenomenon for a larger sample of firms.
Table 7: Enterprises that Reduced their Losses by Means of Subsidy Income in
2014
Net losses
Subsidy
income
Reduction of
net losses
Qinghai Huading Industrial
Co., Ltd. -5,387,138 25,963,808 -83%
Yangmei Chemical Co., Ltd. -30,360,015 118,443,048 -80%
Shenzhen Topraysolar Co.,
Ltd. -5,377,434 20,301,752 -79%
Wus Printed Circuit (Kun-
shan) Co., Ltd. -12,109,197 39,784,879 -77%
Shenzhen Nanshan Power
Co., Ltd. -330,513,285 511,637,613 -61%
Shandong Jining Ruyi
Woolen Textile Co., Ltd. -1,794,185 2,326,651 -56%
Fujian Yongan Forestry
(Group) Joint-Stock Co., Ltd. -20,665,872 20,245,406 -49%
Hunan Corun New Energy
Co., Ltd. -45,938,879 38,839,466 -46%
BGRIMM Magnetic Materials
& Technology Co., Ltd. -28,335,545 22,260,205 -44%
Hunan New Wellful Co., Ltd. -48,963,311 36,918,160 -43%
Source: Wind Data
Calculation by THINK!DESK.

© THINK!DESK China Research & Consulting 2015 Seite 65
Figure 8: Proportion of Subsidy Induced Reduction of Net-Losses
of 188 Enterprises
Source: Wind Data
Calculation by THINK!DESK.
From the available data it becomes clear that the selection of subsidy targets is not based on
financial performance. In 2014, the proportion of profitable companies benefitting from grant
income (96.3% of all profit making companies) was only slightly higher than the respective
reading for loss making ones (90.2%). More important, however, is to read 2014 subsidy re-
ceipts in the context on past performance. To this end, THINK!DESK has compiled the fol-
lowing table which employs firms’ return on capital as performance benchmark. In order to
provide a more balanced picture, the average value of the years 2012 and 2013 are used
here. Table 8 presents relevant information for some of the largest subsidy beneficiaries in
2014. From this depiction it becomes obvious that these companies are significantly under-
performing in comparison with their peers.
-90%
-80%
-70%
-60%
-50%
-40%
-30%
-20%
-10%
0%
Red
ucti
on
o
f lo
sses

© THINK!DESK China Research & Consulting 2015 Seite 66
Table 8: Selected Firm Performance and Subsidisation
Enterprise Subsidy amount
ROC (aver-
age last 2
years)
Average
8.51
China Eastern Airlines Co., Ltd. 3,627,000,000 3.54
China COSCO Holdings Co., Ltd. 1,742,719,823 -2.60
China Southern Airlines Co., Ltd. 1,728,000,000 3.61
Metallurgical Corporation of China Ltd. 1,066,485,000 -3.29
Air China Ltd. 1,059,996,000 3.68
SDIC Power Holdings Co., Ltd. 1,022,640,419 3.77
Chongqing Iron & Steel Co., Ltd. 923,283,000 -8.05
Huaneng Power International, Inc. 900,371,082 6.49
Datang International Power Generation
Co., Ltd. 834,920,000 3.06
BOE Technology Group Co., Ltd. 830,471,170 3.13
Comment: The average return on capital (ROC) is calculated on the basis of a sample of
2,715 listed firms at the stock exchanges in Shanghai and Shenzhen.
Source: Wind Data
Calculation by THINK!DESK.
Taking a closer look at the ownership structures of companies benefitting from governmental
subsidies it appears that SOE are in an advantaged position. Remarkably, subsidy receipts
by SOEs have not only dominated total such transfers, they also display the largest growth.
SOEs also dominate the top 10 beneficiaries of subsidies. (cf. figures 9 and 10). This obser-
vation is not only based on the fact, that they are owned by government, but also on some
characteristics resulting out of this ownership status. As interaction with government authori-
ties is more frequent and supervision is more intense, such companies are better aware of
support schemes. Furthermore, their business is more aligned with industrial policy than is
the case with private enterprises. Subject to more direction, supervision and information ex-
change with relevant government bodies, SOEs stand a good chance to receive subsidies.

© THINK!DESK China Research & Consulting 2015 Seite 67
Figure 9: Subsidies to Enterprises of Different Ownership Types
Source: Wind Data
Calculation by THINK!DESK.
Figure 10: Year on Year Changes to Total Subsidy Transfers by Ownership Type
Source: Wind Data
Calculation by THINK!DESK.
Private enterprises, on the other hand, can enjoy opportunities for subsidisation if their busi-
ness models are in line with industrial policies. Government allocations are concentrated
primarily in promoted high technology sectors. BYD Co., Ltd. is a good example as the com-
pany has business units in three strategic emerging industries: new energy, new energy ve-
-
20.000
40.000
60.000
80.000
100.000
120.000
140.000
2010 2011 2012 2013 2014
millio
n R
MB
SOE Collective Other
-5.000
0
5.000
10.000
15.000
20.000
25.000
SOE Collective Other Total
millio
n R
MB
2011 2012 2013 2014
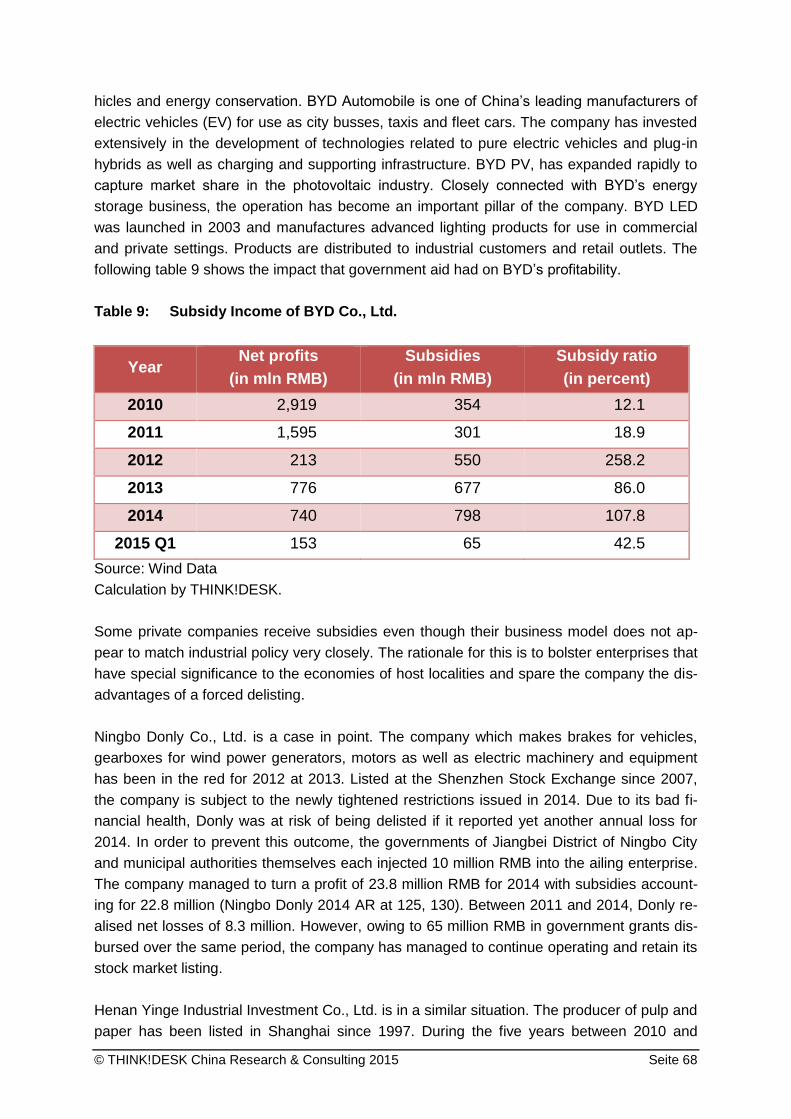
© THINK!DESK China Research & Consulting 2015 Seite 68
hicles and energy conservation. BYD Automobile is one of China’s leading manufacturers of
electric vehicles (EV) for use as city busses, taxis and fleet cars. The company has invested
extensively in the development of technologies related to pure electric vehicles and plug-in
hybrids as well as charging and supporting infrastructure. BYD PV, has expanded rapidly to
capture market share in the photovoltaic industry. Closely connected with BYD’s energy
storage business, the operation has become an important pillar of the company. BYD LED
was launched in 2003 and manufactures advanced lighting products for use in commercial
and private settings. Products are distributed to industrial customers and retail outlets. The
following table 9 shows the impact that government aid had on BYD’s profitability.
Table 9: Subsidy Income of BYD Co., Ltd.
Year Net profits
(in mln RMB)
Subsidies
(in mln RMB)
Subsidy ratio
(in percent)
2010 2,919 354 12.1
2011 1,595 301 18.9
2012 213 550 258.2
2013 776 677 86.0
2014 740 798 107.8
2015 Q1 153 65 42.5
Source: Wind Data
Calculation by THINK!DESK.
Some private companies receive subsidies even though their business model does not ap-
pear to match industrial policy very closely. The rationale for this is to bolster enterprises that
have special significance to the economies of host localities and spare the company the dis-
advantages of a forced delisting.
Ningbo Donly Co., Ltd. is a case in point. The company which makes brakes for vehicles,
gearboxes for wind power generators, motors as well as electric machinery and equipment
has been in the red for 2012 at 2013. Listed at the Shenzhen Stock Exchange since 2007,
the company is subject to the newly tightened restrictions issued in 2014. Due to its bad fi-
nancial health, Donly was at risk of being delisted if it reported yet another annual loss for
2014. In order to prevent this outcome, the governments of Jiangbei District of Ningbo City
and municipal authorities themselves each injected 10 million RMB into the ailing enterprise.
The company managed to turn a profit of 23.8 million RMB for 2014 with subsidies account-
ing for 22.8 million (Ningbo Donly 2014 AR at 125, 130). Between 2011 and 2014, Donly re-
alised net losses of 8.3 million. However, owing to 65 million RMB in government grants dis-
bursed over the same period, the company has managed to continue operating and retain its
stock market listing.
Henan Yinge Industrial Investment Co., Ltd. is in a similar situation. The producer of pulp and
paper has been listed in Shanghai since 1997. During the five years between 2010 and
© THINK!DESK China Research & Consulting 2015 Seite 69
2014, revenues have decreased by about ten percent. Operating incomes have been nega-
tive since 2011 and net incomes have been negative for four out of five years. Following a
net profit of 8 million RMB in 2010, the company has accumulated losses of 1,870 million
RMB since then. Over the same timeframe, various government bodies have supported
Yinge with 471 million RMB.
In terms of the sectoral destination of subsidy transfers, a strong domination of the manufac-
turing sector is striking as documented in table 10.

© THINK!DESK China Research & Consulting 2015 Seite 70
Table 10: Target Sectors of Subsidy Transfers (in million RMB)
2010 2011 2012 2013 2014 Total
Share of
total
Manufacturing 58,582 65,453 81,938 101,337 116,889 424,198 91.9%
Electricity, heating, gas
and water production
and distribution
2,258 2,378 2,172 2,065 2,006 10,879 2.4%
Software and IT 655 643 845 1,086 1,278 4,507 1.0%
Real Estate 547 831 929 548 1,013 3,868 0.8%
Wholesale and retail 632 503 846 853 842 3,677 0.8%
Mining 931 438 492 468 559 2,889 0.6%
Agriculture 314 373 605 644 726 2,662 0.6%
Renting and business
services 142 276 358 536 485 1,798 0.4%
Culture, education and
entertainment 130 139 334 420 607 1,630 0.4%
Water, environment and
public infrastructure
management
127 74 99 484 547 1,331 0.3%
Transportation, storage 126 197 352 332 279 1,285 0.3%

© THINK!DESK China Research & Consulting 2015 Seite 71
2010 2011 2012 2013 2014 Total
Share of
total
and mail services
Construction 112 154 198 280 322 1,066 0.2%
Miscellaneous 63 74 99 140 229 605 0.1%
Financial services 47 166 99 66 218 597 0.1%
Scientific research and
technology services 31 52 57 55 56 251 0.1%
Hospitality 8 5 9 18 82 121 0.0%
Sanitary and social
work 10 2 2 2 6 22 0.0%
Total 64,716 71,757 89,434 109,335 126,144 461,385
Source: Wind Data
Calculation by THINK!DESK.

© THINK!DESK China Research & Consulting 2015 Seite 72
Regional variation is also particularly strong as documented in table 11. Data is only availa-
ble on the location of enterprise headquarters. Depending on different business sectors,
actual production is likely taking place in other locations across the country. As such, it does
not surprise that Beijing and Shanghai host the largest number of firms. The large gap be-
tween average subsidy amounts obtained by enterprises in Beijing and less developed in-
land provinces is striking. Even the average for Shanghai-based firms just barely exceeds
half the level found in Beijing. To a large extent, the difference can be explained by the fact
that Beijing-based firms include many SOEs under the control of the central SASAC. As
previous sections have shown, these companies enjoy preferred access to and obtain larger
amounts of government funds.
Table 11: Regional Differences in Subsidisation in 2014 (in million RMB)
Province Share of national
subsidies
Number of recipi-
ents
Average subsidy
amounts
Beijing 30% 232 161,420,598
Shanghai 13% 199 83,849,068
Guangdong 10% 384 34,415,040
Zhejiang 6% 283 24,479,172
Jiangsu 5% 266 21,555,596
Anhui 4% 84 52,773,095
Shandong 4% 145 32,221,508
Hebei 3% 50 63,345,752
Hubei 3% 79 44,094,976
Sichuan 2% 95 20,209,498
Tianjin 2% 40 74,890,340
Xinjiang 2% 41 46,884,950
Jiangxi 2% 34 55,749,018
Henan 2% 68 34,646,245
Hunan 2% 78 35,962,901
Fujian 2% 93 33,408,544
Liaoning 2% 67 35,216,500
Chongqing 2% 41 50,914,010
Jilin 1% 35 21,589,893
Inner Mongolia 1% 22 43,661,282
Yunnan 1% 27 24,894,598
Guangxi 1% 34 25,992,319
Hainan 1% 20 52,794,609
Guizhou 1% 20 45,398,745

© THINK!DESK China Research & Consulting 2015 Seite 73
Province Share of national
subsidies
Number of recipi-
ents
Average subsidy
amounts
Shaanxi 1% 42 20,051,720
Heilongjiang 1% 30 22,178,647
Ningxia 0.4% 10 45,137,117
Shanxi 0.4% 32 15,803,674
Gansu 0.4% 24 18,624,504
Qinghai 0.3% 9 40,307,423
Tibet 0.1% 10 15,720,405
National Total
2,594 41,877,153
Comment: 31 companies have not been included in the table as their location could not be
ascertained.
Source: Wind Data
Calculation by THINK!DESK.
2.2.2 Promotion of Domestic Technology Upgrading and High-tech Sectors
As the national economy is gradually losing its competitive advantages in labour intensive
manufacturing and assembly trade, the Chinese government is determined to support do-
mestic companies graduate into technology and knowledge intensive sectors. To this end,
authorities have pursued an economic policy that places great emphasis on strengthening
innovation and technology upgrading. As latecomers to many high tech sectors, Chinese
companies find themselves at a disadvantage as their grasp of important technologies is
lagging behind the more established players from the E.U., the U.S. and Japan. Conse-
quently, the government is showing strong determination to help domestic companies catch
up with the international competition in the race for technological development. Both the 11th
and 12th FYP have announced strong incentives to boost innovative capacities. Similarly,
the catalogues for adjusting the industrial structure have been amended in ways that con-
centrate selected high tech products and manufacturing processes in the encouraged cate-
gory. Implementation measures released on all levels of government have introduced a
wide spectrum of financial and non-financial support instruments.
The underlying strategy has a strong nationalistic component as the Chinese government is
making every effort to anchor intellectual property (IP) inside the country. Following this ap-
proach, the entities owning and controlling critical IP should be localised in China. Related
strategies have created a push for “indigenous innovation” which encourages Chinese play-
ers to invest more in own research and build up a portfolio of cutting edge technologies. For
over ten years, FDI policies have been geared towards attracting advanced technology to
China through forced partnerships with domestic counterparts, financial incentives and other

© THINK!DESK China Research & Consulting 2015 Seite 74
means that facilitate technology spill-overs and outright transfers. At the same time, foreign
companies have been invited to establish R&D centres in China and/or transfer their IP to
China-based subsidiaries.
2.2.2.1 Policies Targeting Technology Upgrading
Hoping to jumpstart the country’s nascent high-tech industry, the Chinese government has
been active in supporting local Chinese businesses in their efforts to develop. One way the
government does this is by giving generous financial support for upgrading industrial tech-
nology within Chinese businesses. This section outlines in what ways the Chinese govern-
ment provides incentives for indigenous businesses to develop these technological innova-
tions in a wide variety of areas related to scientific research, technology development,
equipment upgrading, product portfolio, and quality improvement.
A brief review of industrial policy in this field illustrates the reasons behind such substantial
transfers. It should be noted, however, that policy fields addressed in this report have some
overlap. While THINK!DESK has refrained from double counting, it is not possible to deter-
mine to what extent a subsidy for improving energy efficiency, for instance, also serves the
technology upgrading objective. The underlying plant upgrades certainly have a positive
impact on key parameters, like production cost. In classifying subsidies by policy fields,
THINK!DESK has relied on the descriptions provided in financial reports or other company
documents these companies have made available. Considering the very large number of
grant giving operations, it is impossible to independently verify the ultimate purpose of such
funds for each project. Given the sometimes very detailed account of subsidy purposes,
THINK!DESK is confident of the accuracy of the data provided within this report.
During the 1990s, the Chinese government realized that the country lagged significantly
behind the developed world in the areas of science and technology. In order to get ahead,
the Chinese government implemented significant measures in the 10th Five Year Plan (FYP)
(2001-2005). This FYP represented a major policy push towards enhancing China’s abilities
in the field of science and technology. A lack of R&D activities and insufficient innovative
capacities of companies was found to be a major obstacle for domestic companies in ob-
taining strong international competitiveness. Technological backwardness, high import de-
pendence for technologies, and insufficient efforts to develop proprietary technologies were
all regarded as major problems. A dearth of patent registrations and a lack of cooperation
among top researchers, research institutes, universities, and companies compounded the
crisis – which was particularly severe in the less developed central and western regions.
The Chinese leadership perceived other countries to be far ahead regarding investments in
science and technology as well as being more successful in converting advanced research
into competitive products. With the ultimate goal of creating a “moderately well off society” in
mind, the State Council called for urgency and resolve to

© THINK!DESK China Research & Consulting 2015 Seite 75
“place the strengthening of indigenous innovative capability at the core of eco-
nomic restructuring, growth model change, and national competitiveness en-
hancement. Building an innovation-oriented country is therefore a major strategic
choice for China’s future development” (NPC 2001).
As other developing countries have turned to generating innovative economies in order to
advance technologically, China also hopes that prioritizing these policies will strengthen the
Chinese economy’s competitiveness in the global economy.
Emanating from the scientific advancement discourse of the 10th FYP, the State Council
(2005) published the National Medium- and Long-Term Science and Technology Develop-
ment Plan (MLP) (2006-2020) as a major guideline for remedying the endemic problems
that inhibit Chinese businesses’ technological development (MOST 2005b). This program
reiterates the 10th FYP’s stance on the need for promoting science and technology and
warns that technology imports without sufficient assimilation, absorption, and re-innovation
are bound to weaken China’s domestic R&D capability in turn widening the gap between
China and advanced international levels (at preface). In this sense, the program determines
the following general objectives:
“noticeably enhance indigenous innovation capability and S&T [Science and
Technology] level in promoting economic and social development and in main-
taining national security, in an effort to provide powerful support for the building
of a well-to-do society; noticeably improve comprehensive strength in basic re-
search and frontier technology development; and attain a series of high world
impact S&T achievements and join the ranks of innovative countries, thus pav-
ing the way for becoming a world S&T power by mid 21st century” (State Coun-
cil 2005b at 2.2)
Pursuant to this plan, by 2020, Chinese companies in equipment manufacturing should
have mastered critical technologies for raising international competitiveness. Also by 2020,
gross expenditures on R&D should have reached at least 2.5 percent of GDP. Concurrently,
the contribution of science and technology to the general economy should have climbed to
60 percent while import dependence in the technology sphere should have dropped to 30
percent or lower. Should China achieve these goals, towards the end of the planning period,
China will be among the top five countries in the world in successful registration of invention
patents (State Council 2005b at 2.2).
As this plan is rather ambitious, the government laid out an implementation plan within the
MLP to ensure its success. The plan focuses its resources on eleven selected “priority are-
as” then, from within these areas chooses 68 “priority topics” that are each expected to see
major technological breakthroughs. The program announces the initiation of major projects
related to national development objectives that aim to accelerate development and fill holes
in the domestic science and technology landscape. Furthermore, the MLP establishes a
national innovation system as a framework for further policies and instruments (ibid at 2.3).

© THINK!DESK China Research & Consulting 2015 Seite 76
In additional efforts to promote the effective implementation of the National Medium- and
Long-Term Science and Technology Development Plan, the MOST released a complemen-
tary National Science and Technology Support Plan in the same year. In a special circular,
the ministry provides an outline of tasks during the 11th FYP period (2006-2010). Importantly,
the Support Plan does not specify any research focus of its own. Instead, it builds on the
Medium- and Long Term Development Plan and provides more concrete information on
priority tasks selected for the five year period until 2011. These tasks are categorized in
eleven key areas: energy, resources, environment, agriculture, materials, industry, transpor-
tation, IT and modern services, population and health, urbanization and city development as
well as public security and other social services (MOST 2005 at 4.1).
The government has announced its strong support for the adjustment of the industrial struc-
ture and improvement of industrial competitiveness. These measures demand the elimina-
tion of bottlenecks by encouraging technology research and commercial application as well
as the renovation of traditional industries. Special emphasis is placed on breakthroughs in
the fields of energy, natural resources, and environmental protection. The Support Plan
treats proprietary intellectual property as a key factor and urges that the independent inno-
vation capabilities of the corporate sector should improve substantially over the five year
plan term. Enterprises should be guided to increase their R&D investment and become the
main driver of national technology development efforts. The goal is to groom a number of
internationally competitive companies that draw strength from independent innovation, pro-
prietary intellectual property, and strong trademarks (at 2.2).
The MOST and the MOF jointly spelled out more concrete implementation measures in the
Provisional Measures for Managing the National Science and Technology Support Plan
(MOST and MOF 2006). This document establishes the operational framework and intro-
duces the provisions for project application, verification, and supervision procedures. On an
annual basis, budget plans are to be drawn up to indicate the amounts allocated. The two
ministries explain that the plan is to be translated into several projects that are then broken
down into several topics. See table 12.
Table 12: Total Disbursements of Subsidies for Enterprises Working on Priority
Tasks from the National Science and Technology Support Plan
2010 2011 2012 2013 2014 Total
64,215,309 70,522,906 52,546,505 63,376,797 71,886,001 322,547,518
Source: Wind Data
In 2014, at least 52 enterprises have benefitted from government subsidies under this pro-
gramme. The ten largest recipients are listed in the following table 13.

© THINK!DESK China Research & Consulting 2015 Seite 77
Table 13: Top 10 Recipients of Subsidies for Enterprises taking on Priority Tasks
from the National Science and Technology Support Plan in 2014
Rank Enterprise Amount
1 Jiangxi Zhengbang Technology Co.,Ltd. 11,514,889
2 Time Publishing and Media Co., Ltd. 7,220,544
3 Pci-Suntek Technology Co., Ltd. 3,930,000
4 Hongbo Co.,Ltd. 3,864,486
5 Xi'An Tian He Defense Technology Co.,Ltd 3,718,715
6 Shandong Oriental Ocean Sci-Tech Co., Ltd 3,363,133
7 Beijing Chinese All Digital Publishing Co.,Ltd 2,856,667
8 Shandong Rike Chemical Co.,Ltd. 2,500,364
9 CITIC Heavy Industries Co., Ltd. 2,450,000
10 Shanghai DZH Limited 1,920,000
Total 43,338,798
Source: Wind Data
Chinese businesses needed another instrument from which to fund these programs since
many of the aforementioned funding programs were set to expire. After the Adjustment and
Revitalization Programs expired in 2011, all levels of the government rushed to increase
their special funds for technology upgrading during the 12th FYP period (2011-2015).
Through these various plans and funds, the Chinese government directly funds local tech-
nological development. National, state, and local governments all contribute to these funds
and promote these plans. But, these plans also have spawned more indirect support of this
technological development. In the following sections, tax privileges for qualified companies,
and other instrumental schemes are explained.
The new national focus on technological advancement has encouraged government organi-
zations on all levels to initiate policies aimed at spurring technological upgrading. In recent
years, this field has been at the core of industrial policy with every regulatory or planning
document issued stating or reiterating its importance. Since the security of supply for down-
stream users and the international competitiveness of Chinese businesses are deemed to
be issues too important to be left to the market, the Chinese government has actively in-
volved itself in encouraging, supporting, and even forcing companies to improve their capa-
bilities, deepen their expertise, and focus on products with ever higher technological content.
The rest of this section provides an overview of the instruments used to encourage techno-
logical advancement in the private sector.

© THINK!DESK China Research & Consulting 2015 Seite 78
2.2.2.1.1 State Key Technology Renovation Program
In 1999, the State Economic and Trade Commission initiated the State Key Technology
Renovation Program for the purposes of
“implementing the decision of the CPC Central Committee and the State Council
to support the technological renovation of key industries, key enterprises and
key products by means of increasing the issuance of treasury bonds. [Its objec-
tive is] to promote technological advancement of the enterprises, upgrade prod-
uct portfolios, improve product quality, promote import substitution, increase ef-
fective supply, increase domestic demand and safeguard the continuous, stable
development of the national economy…” (SETC, SPC, MOF and PBoC 1999 at
1.1).
The Administrative Measures for State Key Technology Renovation Projects (SETC, SPC,
MOF and PBoC 1999a) and Administrative Measures for Treasury Bond Special Funds for
State Key Technology Renovation Projects (SETC, SPC, MOF and PBoC, 1999b) laid out
the framework for this program. The former defines State Key Technology Renovation Pro-
jects as “technology renovation projects that are organized and allocated by the state” (at
1.2). While the latter defines “Special Treasury Bond Funds” as capital raised from treasury
bonds issued by the central government – either in its own rights or on behalf of local gov-
ernments (SETC, SPC, MOF and PBoC 1999b at 1.3).
According to the SETC, funds dispersed by the government should be allocated to compa-
nies that develop products that are marketable, profitable and competitive. Most importantly,
these products should be able to replace imports. The selection of support targets should be
based on quality, variety, and value in order to boost the prominence of key enterprises, key
enterprises, and key products where the biggest effect can be expected. (SETC, SPC, MOF
and PBoC 1999a at 1.3 and SETC, SPC, MOF and PBoC 1999b at 1.5).
The SETC chooses targets for support from 512 key enterprises, 120 experimental enter-
prise groups, industrial backbone enterprises, and large SOEs with competent leadership
teams, sound management, and high credit ratings. The provisions give preference to com-
panies located in Northeast China’s old industrial areas and in the central part of the country
(SETC, SPC, MOF and PBoC 1999a at 1.4).
There are two forms of support that the SET Commission has announced: bank loans with
subsidized interest rates and investment subsidies (at 1.7). Subsidized loans are to be han-
dled by major commercial banks and the State Development Bank (SETC, SPC, MOF and
PBoC 1999b at 2.6). Enterprises and banks are to establish business interactions on a vol-
untary basis with either side able to take the first step (SETC, SPC, MOF and PBoC 1999a
at 1.5). For further details of loan interest subsidies, see SETC, SPC, MOF and PBoC
1999b (at 3.11).

© THINK!DESK China Research & Consulting 2015 Seite 79
Investment subsidies are calculated to match the total loan interest payable by a project or
company over a two year period. For those located in the old industrial bases of Northeast
or Central China, investment subsidies can be “appropriately raised” to cover interest pay-
ments for three years. In any case, financial support is capped at 15 percent of total invest-
ment (SETC, SPC, MOF and PBoC 1999b at 3.9).
From every administrative level, the government forms leading groups2 to supervise the
program, determine investment directions, coordinate between government departments
and tackle operational issues (SETC, SPC, MOF and PBoC 1999a at 2.8). Even though it
gives away some responsibilities, the State Council reserves for itself the final decision
making authority thereby relieving itself of the duty while keeping the power. Including finan-
cial institutions and industry supervisory departments in the power structure also helps en-
sure compliance with industrial policy objectives.
State-owned-enterprises are also able to subsidize their research, but under different su-
pervision. SOEs seeking funding support from this scheme must apply to the local depart-
ments in charge of economy and trade as well as development and planning who will then
carry out verification and approval procedures. Financial support for companies affiliated
with sub-central governments comes from capital raised on behalf of these authorities by
the central government. According to Chinese law, local governments cannot issue bonds
directly and thus need the cooperation of central authorities. However, support for local en-
terprises is completely financed by debt obligations of supervising local governments SETC,
SPC, MOF and PBoC (1999a at 3.1).
The U.S. International Trade Administration determined in a series of countervailing duty
investigations against Chinese product imports that the following industries have benefitted
from the State Key Technology Renovation Fund Programme and follow up programmes,
see table 14:
2 Leading groups are to include representatives of the State Development and Planning Com-
mission, the State Economic and Trade Commission, the Ministry of Finance, the Industrial and Commercial Bank of China, the China Construction Bank, the Bank of China, the State Development Bank, the Ministry of Information Industry, the China International Engineering Consulting Company and bureaus tasked with the supervision of individual industries of the various jurisdictions on levels of the administrative hierarchy (SETC, SPC, MOF and PBoC 1999a at 2.8).

© THINK!DESK China Research & Consulting 2015 Seite 80
Table 14: Industries Benefitting from the State Key Technology Renovation Fund
Programme and Follow-up Programmes
Period
under
review
Industry
(Subsidy
rate)
Document
01.01.2006
-
31.12.2006
Coated Free
Sheet
(4.11)
Issues and Decision memorandum for the Final De-
termination in the Countervailing Duty Investigation of
Coated Free Sheet from the People’s Republic of
China (U.S. ITA, 2007)
01.01.2006
-
31.12.2006
Raw Flexible
Magnets
(13.36 per-
cent)
Issues and Decision Memorandum for Final Determi-
nation in the Countervailing Duty Investigation of Raw
Flexible Magnets from the People’s Republic of China
(U.S. ITA, 2008)
01.01.2012
-
31.12.2012
Monosodium
Glutamate
(16.12 per-
cent)
Decision Memorandum for the Preliminary Affirmative
Countervailing Duty Determination in the Countervail-
ing Duty Investigation of Monosodium Glutamate from
the People’s Republic of China; and Preliminary Af-
firmative Determination of Critical Circumstances
(U.S. ITA, 2014a)
01.01.2012
-
31.12.2012
Non-oriented
Electrical
Steel
(0.55 per-
cent)
Issues and Decision Memorandum for the Final De-
termination in the Countervailing Duty Investigation of
Non-oriented Electrical Steel from the People’s Re-
public of China (U.S. ITA, 2014b)
01.01.2012
-
31.12.2012
Calcium Hy-
pochlorite
(0.55 per-
cent)
Issues and Decision Memorandum for the Final Af-
firmative Determination in the Countervailing Duty
Investigation of Calcium Hypochlorite from the Peo-
ple’s Republic of China (U.S. ITA, 2014c)
01.01.2012
-
31.12.2012
Narrow Wo-
ven Ribbons
with Woven
Selvedge
(0.55 per-
cent)
Decision Memorandum for Final Results of Counter-
vailing Duty Administrative Review: Narrow Woven
Ribbons with Woven Selvedge from the People’s Re-
public of China (U.S. ITA, 2014d)
01.01.2012 Grain Orient- Issues and Decision Memorandum for the Final Af-

© THINK!DESK China Research & Consulting 2015 Seite 81
Period
under
review
Industry
(Subsidy
rate)
Document
-
31.12.2012
ed Electrical
Steel
(0.55 per-
cent)
firmative Determination in the Countervailing Duty
Investigation of Grain Oriented Electrical Steel from
the People’s Republic of China (U.S. ITA, 2014e)
01.01.2012
-
31.12.2012
Certain Mag-
nesia Carbon
Bricks
(0.55 per-
cent)
Issues and Decision memorandum for Certain Mag-
nesia Carbon Bricks from the People’s Republic of
China: Final Results of the 2012 Administrative Re-
view (U.S. ITA, 2014f)
01.01.2013
-
31.12.2013
Certain Pas-
senger Vehi-
cle and Light
Truck Tires
(0.55 per-
cent)
Decision Memorandum for the Preliminary Affirmative
Countervailing Duty Determination in the Countervail-
ing Duty Investigation of Certain Passenger Vehicle
and Light Truck Tires from the People’s Republic of
China (U.S. ITA, 2014g)
Compilation by THINK!DESK.
In 2004, the Chinese government discontinued and abolished the State Key Technology
Renovation Fund Programme, but its effects can be clearly felt even at present as major
modernization projects were carried out that will continue to benefit their owners for years to
come. Even without this programme, other programmes more or less identical to the State
Key Technology Development Fund continue to exist.3
The Provisional Measures for the Management of Projects Receiving Investment Support
and Loan Interest Subsidies from Funds Included in the Central Government Budget, issued
by the NDRC (2005b), indicated that support schemes should be closely aligned with the
State Key Technology Renovation Fund Programme. This document introduces regulation
3 The very term “State Key Technology Renovation Project” reappeared in the Programme for
Industrial Transformation and Upgrading (2011-2015) (State Council 2011). The document calls for the improvement of the structure of industrial investments and the establishment of a database containing such projects. This is to be complemented by a guidance catalogue com-piled on an annual basis in order to highlight priority areas and direct investments accordingly. Referencing to state support, the Plan urges “to optimize and implement policies supporting enterprises’ technology renovation projects in the area of public finance, financing, land use” (at 3.2). Furthermore, authorities should “support a group of key industries, key areas and large technology renovation projects … to gradually raise the proportion of technology renova-tion investment in total industrial investment” (ibid.). However, no mention is made about par-ticular lending schemes or the use of treasury bonds to finance them.

© THINK!DESK China Research & Consulting 2015 Seite 82
for standardizing the administration and raising the efficiency of projects supported with cen-
tral budget funds (at 1.1), To be sure, the authors define “investment support” as special
funds granted to qualifying projects of enterprises and local governments by the NDRC.
Furthermore, it specifies that “loan interest subsidies” are subsidies granted to qualifying
projects that use medium to long term bank loans to compensate for interest payments. Ar-
ticle 2 states that the provisions are applicable to all projects benefiting from investment
subsidies and loan interest subsidies – including longer term construction investment fi-
nanced by treasury bonds.
Companies that do participate in these “investment support” programs under the Provisional
Measures document stand to lose nothing. The document explicitly states that both support
instruments are offered without the necessity of repayment (i.e. they are subsidies) (at 3).
Under normal circumstances, the maximum subsidy per project is given as 200 million RMB.
Higher amounts may also be granted following additional verification and approval proce-
dures (at 7).
Even though the government wants to encourage growth, not all companies that apply for
such funding are accepted. Eligibility criteria specify that recipients of investment and loan
interest subsidies should mainly be projects that remedy market failures. These occur where
the allocation of resources by the market mechanism is inefficient or undesirable and the
state has to intervene in order to protect economic and social benefits (at 5). While this cer-
tainly captures many investment projects launched by local governments, the policy does
not rule out support for commercial operations, as the list of eligibility criteria includes “in-
vestment projects for protecting and optimizing the ecological environment, investment pro-
jects for promoting economic and social development in less developed regions, investment
projects promoting progress in science and technology and the commercialization of high
technologies and other projects meeting relevant requirements set forth by the state” (at
4.2-5).4
In 2005, the Ministry of Finance released special provisions5 to clarify the administrative
framework for handling the provision of subsidies (MOF 2005a) and loan interest subsidies
(MOF 2005b) from special funds contained in the central government budget. The Ministry
seeks to “strengthen the budgetary administration and enhance the effectiveness of subsidy
funds for fixed asset investment provided from the central budget” (MOF 2005a at 1.1). It
determines that support funds in both forms should be used for projects that
4 In 2013, the NDRC updated the document. The amended version introduces changes to pro-
ject approval and supervision procedures but does not alter the content discussed in the previ-ous paragraphs. However, the NDRC (2013b) dropped the term “provisional” from the title, in-dicating that the Measures the Management of Projects Receiving Investment Support and Loan Interest Subsidies from Funds Included in the Central Government Budget would contin-ue to be effective.
5 The Provisional Measures for the Fiscal and Financial Administration of Subsidy Funds for
Fixed Asset Investments from the Central Budget (MOF 2005a) and the Provisional Measures for the Fiscal and Financial Administration of Loan Interest Subsidy Funds for Fixed Asset In-vestments from the Central Budget (2005b).
© THINK!DESK China Research & Consulting 2015 Seite 83
improve environmental conditions
promote economic and social conditions in less developed regions
promote the progress of science and technology as well as the commercialization of
high and new technologies
Other projects conforming to national policies.
Subsidies are not supposed to exceed half of the total investment volume of the project.
Importantly, the Ministry stipulates that the investment subsidy funds must be matched with
subsidies provided by local authorities, bank loans and other funds (MOF 2005a at 11).
Businesses, obtaining these funds must treat them as capital reserves. Alternatively, enter-
prises may choose to conduct a capital increase and share expansion so the investment
subsidies may be converted into state ownership stakes (at 14.2).
The Interim Administrative Measures for Revitalizing Key Industries and Technology Reno-
vation Project Investment, issued by the NDRC in 2009, expand on the 2005 Provisional
Measures and introduce a subsidy program similar in nature to the State Key Technology
Development Project Fund. The NDRC states that the purpose of this program is
“to implement the policy measures issued by CPC Central Committee and the
state council for expanding domestic demand and promoting economic
growth … make full use of special funds for key industry revitalization and tech-
nology renovation projects, raise the efficiency of fund use, standardize the
management of technology renovation investment projects” (NDRC 2009a at 1).
The document defines special funds for key industry revitalization and technology renova-
tion projects as additional investment from the central government budget to support revital-
ization and technology renovation projects in key industries by means of loan interest subsi-
dies and support grants (NDRC 2009a at 2). Loan interest subsidies are to be made availa-
ble to qualified enterprises that use medium and long term bank loans to finance their pro-
jects. In the case of the older program, the NDRC’s new scheme provides loan interest sub-
sidies according to a company’s actual interest payments over a two year period. The max-
imum amount for loan interest subsidies is stated as 200 million RMB per project (at 3).
Only a few manufacturing industries are eligible. Furthermore, the conformity of supported
projects with industrial policy (as specified in the various Adjustment and Revitalization Pro-
grammes released in 2009) needs to be documented. Furthermore, enterprises seeking
approval have to demonstrate reasonable scale economies, a modern enterprise system,
reputable creditor standing and compliance with all relevant laws and regulations (at 4).
The State Key Technology Development Fund Programme has been followed up by a se-
ries of similar policies. A striking continuity can be found regarding investment subsidies and
loan interest subsidies provided by the state to priority projects. While regulation introducing
the State Key Technology Renovation Fund has been very clear on the terms and condi-

© THINK!DESK China Research & Consulting 2015 Seite 84
tions, more recent schemes are much vaguer. As less information is made available publicly
about statutes and operations, newer schemes are better protected from being discovered
by anti-subsidy investigations. Using similar tactics as this Programme, the State Treasury
Bond Programme for Enterprise Technological Progress and Industrial Upgrading (NDRC
and MOF 2003) has provided subsidies.
Since the passing of the State Key Technology Renovation Programme in 1999, the Chi-
nese government has blatantly subsidized technological research within industries that poli-
ticians deem vital to advancing the economy. None of these subsidies are available to for-
eign companies or even to Chinese industries not regarded as “key.” Through clever ma-
neuvering, these subsidies are also not conspicuously advertised. A lack of publicly-
accessible information and a historically opaque government structure have made these
subsidies difficult to investigate for impartiality.
2.2.2.1.2 Local Technology Funds
As part of the national effort to support local businesses develop new technologies, local
governments have begun to include special funds in government budgets, allocated specifi-
cally to support the technological advancement of local companies. One such example is
the Fund for the Transformation of Industrial Enterprises and Technology Upgrading. This
fund was established according to Several Opinions of the People’s Government of Huzhou
City Concerning the Further Promotion of Industrial Transformation and Upgrading. Access
to the fund, which is jointly administered by the Department of Finance and the Department
of Economy and Information, is limited to local high and new technology companies in a
wide range of industries. Priority support is provided for the development of strategic emerg-
ing industries, specifically in promoting the installation of complete set and core components
of manufacturing equipment. Production equipment investments between 20 million RMB
and 100 million RMB may claim a grant worth 4 percent (up to 2 million RMB) of the cost of
the investment. Larger investments in production equipment are awarded as much as 3 mil-
lion RMB (Huzhou City 2010 at 2.2).
The regulations regarding the disbursement of funds comprise a few other support schemes
(below only the monetary components are listed).
Increasing support for major special industries: grants up to 1 million RMB
Support the development of other highly advanced industries: grants up to 2 million
RMB
Guiding enterprises to conserve land: up to 3 million RMB
Cultivate large enterprises and large business group: grants up to 2 million RMB
Support for industries that are key sources of tax revenues: grants up to 5 million
RMB

© THINK!DESK China Research & Consulting 2015 Seite 85
Support the accelerated development of industrial leading enterprises: monetary
component unspecified
Encourage increasing reinvestments: monetary component unspecified
Attract the establishment of company headquarters: monetary component unspeci-
fied
Strengthen the formation of entrepreneurs: monetary component unspecified
Support enterprises to accelerate technology innovation: monetary component un-
specified
Encourage enterprises to strengthen brand building: monetary component unspeci-
fied
At the provincial level in Zhejiang, the government supports an Innovative Experimental
Enterprise Scheme for cultivating innovative companies. The scheme which was initiated by
the Implementation Plan of Zhejiang Province for Establishing Innovative Enterprises in
2007 is jointly administered by the Province’s Departments in charge of Science and Tech-
nology, Finance, SASAC, Quality and Technology Supervision as well as the Party Commit-
tee for Economy and Trade, its Finance Work Leading Small Group, and the General Trade
Union (ACTFU) of Zhejiang Province. Its stated aim is to “further guide and encourage en-
terprises to reinforce their technology development efforts and further implement tax bene-
fits related to expenses on technology development” (Zhejiang Province 2007 at 5.1). Com-
panies can deduct technology development costs at 150 percent of face value. Scientific
instruments and equipment used in R&D of a unit value less than 300,000 RMB can be in-
cluded in administrative expenses. For items worth more than that, companies can utilize
shortened depreciation periods or accelerated depreciation (at 5.1).
This scheme pledges increased support for the construction and development of innovative
experimental enterprises’ R&D centres, laboratories, and experimental bases within the
province. With this extra support and encouragement, the government hopes that qualified
enterprises will be able to more quickly produce high-tech products and put them on the
market. . In addition, key laboratories of universities and scientific research institutes are
expected to cooperate with the private research centres in order to further promote techno-
logical advancement within the province (at 5.2).
Financial support through the banking system is another important facet of the scheme. The
government explicitly hopes to
“encourage and guide financial institutions to increase credit support for enter-
prises with indigenous innovation. Relevant departments should actively widen
finance channels for enterprises with indigenous innovation. Encourage guaran-
tors to increase their support for the activities of enterprises with indigenous in-
novation. Institutions providing loan guarantees exceeding 70 percent of enter-
prises with indigenous innovation and private science and technology enterpris-
es’ total outstanding loans may enjoy the same preferential policies as those en-
terprises. Encourage insurance companies to develop special insurance prod-

© THINK!DESK China Research & Consulting 2015 Seite 86
ucts for the field of cutting edge science and technology & research and devel-
opment. … Support the creation of enterprise-oriented investment risk compa-
nies or funds that will then benefit from special tax breaks, such as tax exemp-
tions or reductions for investment returns and special deduction opportunities
according to their investment ratio… When providing credit support, financial in-
stitutions should prioritize the innovation projects of Innovative Experimental En-
terprises. Government departments in charge of stock market listings should fo-
cus on cultivating and supporting Innovating and Experimental Enterprises in
raising finance from domestic and international securities markets” (Zhejiang
Province 2007 at 5.4).
In 2007 and 2008, the provincial government selected a total of 150 enterprises for targeted
support.
2.2.2.1.3 Preferential Measures to Award Trademark and Patent Filings
All across China, governmental bodies have instituted special financial provisions to en-
courage the establishment of proprietary patents and well recognized trademarks. Regula-
tion follows the spirit of the 12th FYP in calling for stronger emphasis on developing proprie-
tary intellectual property as a basis for future competitiveness. In its Outline of the Intellec-
tual Property Strategy of Jiangsu Province from 2009, Jiangsu Province plans to raise the
number of all patents by 15 percent and increase the number of invention patents by 20
percent. In comparison, the number of trademark and patent registrations in foreign coun-
tries should rise at an even faster pace of 30 percent per year (Jiangsu Province 2009a at
2.2). The province has set aside financial resources to support breakthrough technologies
that are a result of indigenous innovation (at 3.2). In order to allow for better guidance,
Jiangsu has also compiled a catalogue containing products and technologies on which re-
search activities should focus (at 3.1).
As one tactic in the Intellectual Property Strategy, Jiangsu Province has put a focus on
boosting local invention patents for cutting edge technologies that, when applied to business
operations, can have a strong impact on boosting competitiveness on an international scale.
Much attention is attributed to developing the province’s export business. This plan aspires
to attract 60 famous export brands that could benefit from focused support from the Ministry
of Commerce, hoping to eventually expand this number to 180 brands. (Jiangsu Province
2009a at 2.2). The province pledged to increase assistance for product exports sold under
the companies’ own trademarks and to focus support on enterprises that use their trade-
marks to carry out overseas investments and strive for international operations in the R&D,
production, sales, and services (at 3.2).The province has launched a wide array of related
support policies – many of which confer monetary benefits. It provides special support funds
from the government budget and offers preferential tax policies among other measures (at
4).

© THINK!DESK China Research & Consulting 2015 Seite 87
Zhejiang Province (2001) has issued similar regulations that are less concrete when it
comes to promotion targets and less comprehensive with regard to support instruments.
The province has also established a special fund, dedicated to disbursing financial rewards
to enterprises that can claim patents as a result of independent research. Companies re-
ceive monetary rewards for every invention patent they register – with patents granted in
other countries fetching ten times the regular sum (at 2.7). At the city level Huzhou and oth-
er municipalities have issued their own support policies in addition to the provincial ones.
The Science and Technology Bureau of Wuxing District of Huzhou City is the responsible
authority.
Tianjin Municipality and Shandong Province have issued similar policies for offering finan-
cial rewards by means of transfers, tax breaks, and other instruments. For Shandong Prov-
ince the Interim Measures for the Administration of Special Funds for Developing Patents
(2009) apply while Tianjin City (2012) has introduced similar financial incentives to support
patents registrations.
Chinese listed companies have made ample use of grant programmes connected to patent
registrations. Judging from the financial data filed with the China Securities Regulatory
Commission by listed firms, patent subsidies have been a boon for many companies. The
following table 15 provides key information about these transfers.
Table 15: Total Disbursements of Patent Related Subsidies
2010 2011 2012 2013 2014 Total
112,935,220 160,379,490 247,041,738 367,782,970 200,803,529 1,088,942,947
Source: Wind Data
A total of 816 enterprises obtained subsidies related to patents in 2014. The ten largest re-
cipients are listed in the following table 16.

© THINK!DESK China Research & Consulting 2015 Seite 88
Table 16: Top 10 Recipients of Patent Related Subsidies in 2014
Rank Enterprise Amount
1 Jiangxi Zhengbang Technology Co.,Ltd. 11,514,889
2 Huadian Heavy Industries Co., Ltd. 10,289,395
3 Shanghai CIMIC Holdings Co., Ltd. 10,275,300
4 Ocean'S King Lighting Science & Technology Co., Ltd. 6,043,000
5 Tasly Pharmaceutical Group Co., Ltd. 5,359,890
6 Shandong Wohua Pharmaceutical Co., Ltd. 4,597,909
7 Tsinghua Tongfang Co.,Ltd 4,469,440
8 Sichuan Yahua Industrial Group Co.,Ltd. 3,804,820
9 Sichuan Chemical Company Limited 3,600,000
10 Ningbo Gaofa Automotive Control System Co.,Ltd. 2,402,485
Total 62,357,128
Source: Wind Data
2.2.2.1.4 “Three Categories” Programme
Direct financial support of the costs involved in research and development can be partially
financed by the central government’s Ministry of Finance. Before and after China’s ascen-
sion to the WTO, Chinese businesses have benefited from two specific programmes funded
by the ministry. For Chinese companies, this ministry provides such benefits as funding re-
search expenses and even travel expenses for employees. These benefits clearly provide
unfair advantages to Chinese businesses for developing technologically.
As early as 1996, the Ministry of Finance issued the Interim Measures for the Administration
of Three Categories of Scientific and Technological Expenses. The “three categories” men-
tioned are expenditures for trial manufacture of new products, related experimentation, and
subsidies for key scientific research projects. The scheme is co-financed by central and lo-
cal government budgets and aims to allocate public funds to entities carrying out science
and technology work. These entities include universities, research institutes and SOEs. Al-
locations were planned as part of annual budgets administered by both central and local
governments (MOF 1996).
In addition to the “three categories” program, similar programs administered by provincial
and municipal governments have initiated their own programs to support Chinese business-
es. Thanks to these schemes, SOEs – more than other enterprises – were able to absorb
substantial amounts of government funds as compensation for a wide spectrum of research

© THINK!DESK China Research & Consulting 2015 Seite 89
expenses spanning from equipment purchases to travel expenses. The “three categories”
program was discontinued in 2006, five years after China’s WTO accession.
In order to replace the soon to be discontinued “three categories” program, the Ministry of
Finance and the Ministry of Science and Technology jointly launched a replacement in Jan-
uary 2004: the Interim Measures for the Administration of Applied Technology Research
and Development Funds. The program is jointly managed by the two central ministries and
financed by the central government budget. It aims to support innovation and development
in scientific and technological fields and strengthen the connection with the economic
sphere. The six main components of fund are:
(1) Spark program: Supports the commercialization of agricultural technology through
application projects; promotes technology innovation at township and village enter-
prises; assists in the establishment of platforms for technology dissemination, ser-
vices and training in towns and villages; seeks to create a favourable environment
for technology innovation and commercialization of research results.
(2) Torch program: Support for hi-tech commercialization projects; development of incu-
bators for technology enterprises; establishment of service platforms for hi-tech
commercialization
(3) Engineering technology research centre program: Strengthens the intermediaries in-
volved in the transformation of research results; supports the translation of cutting
edge research results into concrete projects; disseminates information on successful
technology application; raises industrial technology levels; promote the rise of
emerging industries and upgrading of traditional ones
(4) Program for the dissemination of key research results: Supports dissemination ap-
plications and policies for research results in major common-use technologies and
technologies improving public welfare. Establishes service systems for promotion
and conversion of research results
(5) Program for key new products: Support innovative products with high technology
content; plays a significant role in the technological progress of industries; performs
R&D on new products with own intellectual property rights.
(6) Action program for expanding trade through science and technology: Seeks to raise
international competitiveness, develops demonstration projects for improving export
composition based on proprietary hi-technology contents; establishes a platform for
the internationalization of technology-oriented enterprises (at 1.2.2).
This new program mimics the old Three Categories of S&T Expenses Scheme that came
before it by offering two separate means of support: companies may seek refunds on their
expenditures related to eligible projects or they may apply for subsidization of their activities
(at 3.11). Different from its predecessor, the current program is open to enterprises of all
ownership types that possess a strong capability for independent R&D and favourable con-
ditions for carrying out cutting edge research (at 2.4). Similar to the previous Three Catego-
ries of S&T Expenses Scheme, supported companies can seek refunds for a wide variety of

© THINK!DESK China Research & Consulting 2015 Seite 90
project-related expenses, including those for personnel, equipment, energy, and general
administration (at 3.9).
In 2011, the government of Baoshan District has instituted the Special Fund for Innovation
in Science and Technology in order to further the objectives laid out in the National Medium-
and Long-Term Science and Technology Development Plan (2006-2020) introduced earlier
in this study. Information gathered by the U.S. ITA (2014e) in its countervailing duty investi-
gation against Chinese imports of grain-oriented electrical steel proves that the fund sup-
ports projects that involve technology research and the industrial application of its results. It
emphasizes the close coordination between organizations involved in research and produc-
tion activities in the development of technology-intensive industries and the creation of a
local innovation system. The fund was scheduled to operate for a period of two years with
an announced spending volume of 31 million RMB annually.
With this large collection of resources, the Special Fund provide grants and loan interest
subsidies to supported companies. These have to prove eligibility by demonstrating adher-
ence to industrial policies, owning proprietary intellectual property, and pursuing advanced,
innovative approaches to developing technology with high practical relevance. The govern-
ment distinguishes between regular and key projects, which may obtain grants worth up to
300,000 RMB and 500,000 RMB respectively. In the case of loan interest subsidies, the
fund substantially reduces the financing costs of support companies – making it possible to
obtain funding at rates as low as 50 percent of the national benchmark.
In 2014, at least 36 listed enterprises have benefitted from government subsidies under this
programme. Key figures are presented in the following two tables 17 and 18.
Table 17: Total Disbursements of Subsidies under the Three Categories
Programme
2010 2011 2012 2013 2014 Total
632,397,949 1,142,283,227 522,916,987 312,438,774 138,202,962 2,748,239,899
Source: Wind Data

© THINK!DESK China Research & Consulting 2015 Seite 91
Table 18: Top 10 Recipients of Subsidies under the Three Categories Programme
in 2014
Rank Enterprise Amount
1 Sanan Optoelectronics Co.,Ltd. 51,291,900
2 GRG Banking Equipment Co., Ltd. 31,130,792
3 Harbin Gloria Pharmaceuticals Co., Ltd. 12,818,100
4 Shengyi Technology Co.,Ltd. 10,536,935
5 Xiamen Xindeco Ltd. 8,145,985
6 Zijin Mining Group Company Limited 6,945,023
7 Lens Technology Co., Ltd. 3,267,000
8 Sunflower Pharmaceutical Group Co.,Ltd 3,110,900
9 CPT Technology (Group) Co., Ltd. 2,915,132
10 Harbin Gong Da High-Tech Enterprise Development Co.,Ltd 1,655,396
Total 131,817,163
Source: Wind Data
2.2.2.1.5 Subsidization of Financing Costs
Many areas disperse funds to mitigate even financing costs. Zhejiang Province has
launched a series of policies to reduce operating expenses and financing costs for enter-
prises engaged in the development and industrial application of advanced new technologies.
In 2008, the Department of Finance of Zhejiang issued the Interim Measures for the Admin-
istration of Provincial Level Grants and Loan Interest Subsidies for Completed Science and
Technology Development and Commercialization Projects. As the title suggests, the docu-
ment serves to outline ways and means employed by the Finance Department to ease the
burden of financing costs after project completion.
As part of these measures, in 2010, the Departments of Finance and Science and Technol-
ogy issued the Interim Measures for the Administration of Expenses of Provincial Level Sci-
ence and Technology Development and Commercialization Projects (Zhejiang Province
2010). The Interim Measures provide an extensive portfolio of support measures, including
provisions that help companies lower their financing costs through loan interest subsidies
after supported projects have been complete (at 3).
In addition to the system of R&D grants run by the provincial government, municipalities and
districts also offer support for R&D work. Wuxing District of Huzhou Municipality operates its
own R&D assistance grant fund. The programme was launched in late 2005 and is man-

© THINK!DESK China Research & Consulting 2015 Seite 92
aged by the District’s Science and Technology Bureau. The latter selects eligible companies
based on a vague set of criteria relating to innovative capabilities and technology develop-
ment intending to cultivate high technology and pillar industries. These chosen companies
then benefit from government grants for product and technology development, energy con-
servation, quality improvements, and export structure optimization.
2.2.2.1.6 Enterprise Income Tax Rebates for the Purchase of Domestic
Equipment
In 1999, the Chinese government issued provisions allowing companies (including those
with foreign capital participation) to benefit from special income tax credits based on the
purchase of domestic production equipment (MOF 1999; MOF and SAT 2000). This meas-
ure conferred an unfair competitive advantage upon China’s own equipment manufacturing
and introduces tax incentives for industrial enterprises to upgrade their plant equipment.
The program, which is administered by local tax offices, allows companies to directly deduct
40 percent of their expenses for domestic equipment from the increment of income tax of
the year of the purchase compared to the previous year (MOF 1999 at 2). Should procure-
ments costs exceed this increment, companies may carry on the remainder and realize fur-
ther deductions for up to five years after the transaction (at 5). This benefit is preconditioned
on the investment project conforming to relevant industrial policies (at 2).
The government enforces some stipulations in order to utilize these special tax rebates. To
be eligible, such upgrades must aim to raise efficiency, raise product quality, increase varie-
ty of the product portfolio, upgrade products, expand exports, reduce costs, save energy,
improve work safety, and promote the comprehensive utilization of resources. These up-
grades must also help safely dispose of waste gas, waste water, and industrial residues
(MOF 1999 at 6). It is notable that increasing exports is explicitly mentioned as viable rea-
son for the tax benefits. At the same time, the underlying technology renovation project
must involve advanced equipment, embodying new technologies, techniques, and materials.
All this implies a meaningful improvement of existing equipment and production techniques
must be done (at 6). Remarkably, the granting of tax incentive under this program does not
affect companies’ ability to depreciate equipment at its full investment costs (at 9). While the
scheme was not contained in the new enterprise income tax law which entered into force on
January 1st, 2008, it was formally abolished by administrative order 62 of the Ministry of
Finance in 2011.However, several provinces and municipalities, such as Huzhou City, have
introduced special provisions making it possible for local companies to use this program
after the new enterprise income tax came in to force on January 1, 2008.

© THINK!DESK China Research & Consulting 2015 Seite 93
2.2.2.2 The High and New Technology Enterprise Programme
Support for High and New Technology Enterprises (HNTE) is a case in point. Companies
pioneering advanced technology research receive favourable tax conditions under the gov-
ernment’s high-tech promotion initiatives.
The HNTE initiative has its roots in support for knowledge and technology intensive compa-
nies located in High and New Development Zones across the country. In 1991, the former
Science and Technology Development Commission drafted the first regulations in this re-
gard (STDC 1991). Five years later, the initiative was expanded to cover enterprises outside
these zones as well (MOST 1996). Government departments on the provincial level are
tasked with reviewing companies’ applications and administering preferential tax policies. In
order to be awarded HNTE status, enterprises had to engage in one of ten specified fields
of technology research, including microelectronics and IT, aviation and aerospace, life sci-
ence and biotech as well as seven others. Importantly, companies have to conduct their
own research, possess proprietary technology and engage in the commercialisation of their
own IP (STDC 1991 at 4; MOST 1996 at 4).
Furthermore, companies inside zones had to demonstrate that R&D related expenses ac-
counted for 3 percent of gross revenues (4 percent for others). At least half of the latter has
to be generated by marketing proprietary technology itself, through licensing, and sales of
products which incorporate said technology (70 percent for other companies) (STDC 1991
at 5.7; MOST 1996 at 5.7). Furthermore, companies had to demonstrate that no less than
30 percent of their work force had college or university degrees (20 percent for service sec-
tor companies). 10 percent of the employees had to be directly occupied with R&D tasks
(STDC 1991 at 5.4; MOST 1996 at 5.4). Benchmarks facing companies located outside of
High and New Technology Zones were more demanding and comprehensive. However,
requirements for “Zone companies” were raised in 2000 to further sharpen the focus on in-
novation and R&D (MOST 2000).
In mid 2008, shortly after the new EITL went into force, the current form of HNTE regulation
took shape (MOST, MOF and SAT 2008). It draws heavily on previous provisions but puts
away with location specific differences and strengthened regulation for research related
service providers. It introduced a list of 213 favoured technologies, subsumed under eight
National Supported Key High and New Technology Fields, to replace the broadly outlined
ten technology fields of earlier documents. The list is characterised by a high degree of de-
tail and specificity with regard to preferred research areas.
Following the 2008 reform, the MOST is joined by the MOF and the SAT in administering
the HNTE scheme. This move greatly strengthened the implementation of HNTE pro-
grammes as the SAT is tasked with handling tax breaks and the MOF is overseeing the dis-
bursement of subsidies. Together, the three government bodies form a leading small group
with an office based at the MOST (MOST, MOF and SAT 2008 at 2.6).

© THINK!DESK China Research & Consulting 2015 Seite 94
Against this background, the 2008 Enterprise Income Tax Law (EITL) grants HNTEs a re-
duced corporate income tax of 15 percent (instead of the regular 25 percent). Accreditation
and supervisory work is handled by the State Administration of Taxation on the local gov-
ernment level (NPC 2007b).
According to the Circular Concerning the Provision of Transitional Preferential Tax Treat-
ments to High-tech Enterprises Newly Set up in Special Economic Zones and in Pudong
District of Shanghai (State Council 2007a), enterprises in the stated location and recognised
as engaging in high-tech business operations can benefit from special tax breaks since
January 1st, 2006. Corporate income tax was waived for the first two years a company
made profits. For the following three years of profitable operation, profit was taxed at half
the regular rate. Based on the Circular of the State Administration of Taxation on the Issues
Concerning Implementation of the Preferential Income Tax for Hi-Tech Enterprises (MOF,
GAC and SAT 2009), companies recognised as high and new technology enterprises before
the new EITL entered into force on January 1st, 2008, could continue to benefit from the
original terms.
Almost every company reviewed for this report was found to have at least one subsidiary
that has been recognised as HNTE and can benefit from the reduced tax rate of 15 percent.
The significance of this scheme, however, is not limited from favourable taxation provision.
Instead, it has been found that the HNTE certification also serves a signalling function for
other government administered support programmes. Put differently, HNTEs are earmarked
for further support and may use their status as entrance ticket to a wide range of subsidy
schemes and non-financial preferences. While neither the new EITL nor supplementary
regulation provides detailed outlines of the nature of such benefits, THINK!DESK research
has discovered several relevant instruments. Some companies have been found to have
received so called “HNTE grants” as late as 2014. Unfortunately, financial statements do not
provide further information on the government unit disbursing the payment or its ultimate
purpose. The following table 19 contains a list of companies that have benefitted from said
subsidies.
Thanks to their special status, HNTEs have obtained significant subsidies from (mostly local)
government authorities. The following table presents key figures on HNTE subsidies.
Table 19: Total Disbursements of High and New Technology Enterprise Subsidies
2010 2011 2012 2013 2014 Total
121,797,224 124,807,550 96,310,759 99,615,154 56,609,121 499,139,808
Source: Wind Data
In 2014, at least 90 companies have obtained subsidies in recognition of their status as
HNTEs. The ten largest recipients are listed in the following table 20.

© THINK!DESK China Research & Consulting 2015 Seite 95
Table 20: Top 10 Recipients of High and New Technology Enterprise Subsidies
in 2014
Rank Enterprise Amount
1 Loncin Motor Co., Ltd. 4,412,600
2 Ningbo Shanshan Co., Ltd. 4,382,381
3 AISINO CORPORATION 4,033,000
4 Songz Automobile Air Conditioning Co., Ltd. 3,889,500
5 Zhejiang Yankon Group Co., Ltd. 3,312,400
6 Xiamen Savings Environmental Co., Ltd 2,528,300
7 Hubei Dinglong Chemical Co., Ltd. 2,171,222
8 Shanghai Ganglian E-Commerce Holdings Co., Ltd. 2,020,000
9 Xiamen Academy of Building Research Group Co., Ltd. 1,855,008
10 Tongling Jingda Special Magnet Wire Co., Ltd. 1,842,498
Total 30,446,909
Source: Wind Data
2.2.2.3 Preferential lending scheme
In 2006, the CBRC has issued the Guiding Opinions for Commercial Banks to Improve and
Strengthen Financial Services to High and New Technology Enterprises. Directed at all
bank under the Commissions supervision, the document urges preferential treatment for
HNTEs in terms of service quality and credit support. An even higher level of support in line
with sectoral industrial policies and investment policies is to be reserved for HTNEs that
Shortly after the National Medium- and Long-Term Science and Technology Development
Plan (2006-2020) was released, the China Banking Regulatory Commission (CBRC) issued
a circular to
“create a financial environment [suitable] for supporting and encouraging inde-
pendent innovations, lead commercial banks to improve and strengthen the pro-
vision of financial services to high and new technology enterprises (HNTE)”
(CBRC 2006 at preamble).
Banks were ordered to improve their understanding of the financial service requirements of
such enterprises and adjust their work procedures accordingly. The CBRC clearly demands
that commercial banks “actively provide credit support according to national industrial and
investment policies” (at 4). The main beneficiaries were identified as follows:

© THINK!DESK China Research & Consulting 2015 Seite 96
(1) Companies undertaking development work for key areas and priority tasks, major
special projects and cutting edge technologies outlined in the MLP.
(2) Companies engaged in high technology projects initiated at the national or provincial
level upon approval of the State Council. Such enterprises should also have proprie-
tary intellectual property, R&D results of great industrialisation potential in newly
emerging high tech industries
(3) Companies in high-tech content, high value-added or high-growth industries in the
areas of electronics and information (especially software and integrate circuits),
modern agriculture (especially projects of industrialisation of agricultural science and
technology as well as technological extension projects of agricultural scientific re-
search institutes), biological engineering, new medicines, new materials and the ap-
plication thereof, advanced manufacturing, aviation, spaceflight, new energy, high
efficiency, energy conservation, environmental protection, marine engineering, nu-
clear application technologies, etc.;
(4) Companies whose products and technologies are at domestically leading level, who
have good domestic and foreign market foreground, strong market competitive
strength, optimistic economic and social benefits, as well as good credit standing;
and
(5) small scientific and technological enterprises which conform to the industrial policies
of the state, have high technological content, strong creativity, grow well, and face
promising industrial development prospects, especially the small scientific and tech-
nological enterprises which engage in R&D or application of new technologies or
new techniques inside national hi-tech industry development zones, or outside of
such zones if they have been recognised by the science and technology depart-
ments at or above the provincial level (at 4).
Furthermore, an HNTE must operate in accordance with laws, regulations, industrial policies,
state planning in key industries and the MLP. Its general property rights structure must be
clear and control of its IP must not be subject to disputes (at 5).
Commercial banks are specifically ordered to
“make necessary market subdivision of HNTEs and take into account the unique
characteristics of enterprises in different industries and at different development
stages. Bank should … develop financial products and work procedures in order
to meet the demands of HNTEs. Special services should be provided with re-
gards to credit granting, fund settlement, foreign exchange settlement and sale,
issue of bank cards, cash management, financial consulting etc.” (at 6).
Importantly, lenders are called upon to prioritise the provision of loans supporting business
operations and exports products containing independent innovation. HNTEs which export
such goods and have favourable credit ratings should be offered credit limits. Based on
these limits, banks are to provide certain financial services in light of the requirements on
credit and settlement management (at 7).

© THINK!DESK China Research & Consulting 2015 Seite 97
In general, commercial banks should model credit durations and repayment modalities in
accordance with the individual demand profile and cash flow characteristics of HNTEs. They
should exercise flexibility with regards to repayment options, offering repayment of fixed
amounts by instalments, repayment of interest along with the principal and provide grace
periods within which only interest has to be repaid (at 8).
In terms of credit guarantees lenders are to develop various customised service offerings for
HNTEs, like pledges for export-contingent tax refunds, stocks, stock rights, insurance poli-
cies, bonds and warehouse certificates. The use of IP as collateral is also permissible.
Important, information exchanges between government agencies and financial institution is
to be intensified. This should make it possible for banks to
“actively provide credit support to the enterprises which are supported by the
government’s loan interest subsidy programmes, technology innovation funds for
small science and technology enterprises, or guarantees by special government-
invested guarantee institutions” (at 11).
In all, commercial lenders have to develop a strong understanding of the specific drivers of
industry development and technology lifecycles for individual clients. This should banks in a
position to adjust their loan business to in light of the maturity of a HNTE’s technologies. In
this way, banks are supposed to cater to the shifting demand patters of its clients, as the
latter evolve from technology development to commercialisation and mass marketisation
stages (at 12). The task of banks is greatly complicated as they are told to develop the ca-
pability to appraise the IP of new technologies which in turn requires accurate forecasts on
future developments of market and policy trends (at 14). In order to facilitate credit support
for HNTEs, commercial banks were urged to improve risk pricing mechanisms so they may
independently set the loan interest rates (at 15). Following the disbursement of loans, banks
need to closely monitor the technology development process with a view on their client and
the relevant market. This allows for timely adjustments of credit terms in order to limit risk
exposure (at 17).
2.2.2.4 Local Government Funds Promoting New Technology Related
Research
As part of the national effort to support local businesses develop new technologies, local
governments have begun to include special funds in government budgets, allocated specifi-
cally to support the technological advancement of local companies. One such example is
the Fund for the Transformation of Industrial Enterprises and Technology Upgrading. This
fund was established according to Several Opinions of the People’s Government of Huzhou

© THINK!DESK China Research & Consulting 2015 Seite 98
City concerning the Further Promotion of Industrial Transformation and Upgrading. Access
to the fund, which is jointly administered by the Department of Finance and the Department
of Economy and Information, is limited to local high and new technology companies in a
wide range of industries. Priority support is provided for the development of strategic emerg-
ing industries (SEI)6, specifically in promoting the installation of complete set and core com-
ponents of manufacturing equipment. Production equipment investments between 20 million
RMB and 100 million RMB may claim a grant worth 4 percent (up to 2 million RMB) of the
cost of the investment. Larger investments in production equipment are awarded as much
as 3 million RMB (Huzhou City 2010 at 2.2).
The regulations regarding the disbursement of funds comprise a few other support schemes
(below only the monetary components are listed).
Increasing support for major special industries: grants up to 1 million RMB
Support the development of other highly advanced industries: grants up to 2 million
RMB
Guiding enterprises to conserve land: up to 3 million RMB
Cultivate large enterprises and large business group: grants up to 2 million RMB
Support for industries that are key sources of tax revenues: grants up to 5 million
RMB
Support the accelerated development of industrial leading enterprises: monetary
component unspecified
Encourage increasing reinvestments: monetary component unspecified
Attract the establishment of company headquarters: monetary component unspeci-
fied
Strengthen the formation of entrepreneurs: monetary component unspecified
Support enterprises to accelerate technology innovation: monetary component un-
specified
Encourage enterprises to strengthen brand building: monetary component unspeci-
fied
At the provincial level in Zhejiang, the government supports an Innovative Experimental
Enterprise Scheme for cultivating innovative companies. The scheme which was initiated by
the Implementation Plan of Zhejiang Province for Establishing Innovative Enterprises and in
2007 is jointly administered by the Province’s Departments in charge of Science and Tech-
nology, Finance, SASAC, Quality and Technology Supervision as well as the Party Commit-
tee for Economy and Trade, its Finance Work Leading Small Group, and the General Trade
Union (ACTFU) of Zhejiang Province. Its stated aim is to
“further guide and encourage enterprises to reinforce their technology devel-
opment efforts and further implement tax benefits related to expenses on tech-
nology development” (Zhejiang Province 2007 at 5.1).
6 For a detailed account of dedicated SEI promotion see chapter 2.2.3.

© THINK!DESK China Research & Consulting 2015 Seite 99
Companies can deduct technology development costs at 150 percent of face value. Scien-
tific instruments and equipment used in R&D of a unit value less than 300,000 RMB can be
included in administrative expenses. For items worth more than that, companies can utilise
shortened depreciation periods or accelerated depreciation (at 5.1).
This scheme pledges increased support for the construction and development of innovative
experimental enterprises’ R&D centres, laboratories, and experimental bases within the
province. With this extra support and encouragement, the government hopes that qualified
enterprises will be able to more quickly produce high-tech products and put them on the
market. In addition, key laboratories of universities and scientific research institutes are ex-
pected to cooperate with the private research centres in order to further promote technolog-
ical advancement within the province (at 5.2).
Financial support through the banking system is another important facet of the scheme. The
government explicitly hopes to
“encourage and guide financial institutions to increase credit support for enter-
prises with indigenous innovation. Relevant departments should actively widen
finance channels for enterprises with indigenous innovation. Encourage guaran-
tors to increase their support for the activities of enterprises with indigenous in-
novation. Institutions providing loan guarantees exceeding 70 percent of enter-
prises with indigenous innovation and private science and technology enterpris-
es’ total outstanding loans may enjoy the same preferential policies as those en-
terprises. Encourage insurance companies to develop special insurance prod-
ucts for the field of cutting edge science and technology & research and devel-
opment. … Support the creation of enterprise-oriented investment risk compa-
nies or funds that will then benefit from special tax breaks, such as tax exemp-
tions or reductions for investment returns and special deduction opportunities
according to their investment ratio… When providing credit support, financial in-
stitutions should prioritise the innovation projects of Innovative Experimental En-
terprises. Government departments in charge of stock market listings should fo-
cus on cultivating and supporting Innovating and Experimental Enterprises in
raising finance from domestic and international securities markets” (Zhejiang
Province 2010 at 5.4).
In 2007 and 2008, Zhejiang provincial government selected a total of 150 enterprises for
targeted support.
Similarly, the government of Huangshi City (Hubei Province) draws on the support for
HNTEs to rejuvenate its industrial base and drive technology upgrading. In its Guiding Opin-
ions on Financial Support for the Good and Rapid Development of the Economy, the gov-
ernment of Huanshi City (2008) discusses at length how such companies may be the target
of support measures through public funds, tax preferences and guided bank lending. It calls

© THINK!DESK China Research & Consulting 2015 Seite 100
for financial institutions to link monetary policies with market realities and thoroughly re-
search principles of credit support as well as focused and powerful measures.
Financial institutions must do their upmost to satisfy funding needs of new area
construction, high and new technology enterprises, pillar industries, rapidly
growing SMEs, new socialist country and disadvantaged groups. They should
also forcefully support the development of strategic emerging industries, accel-
erate the transformation of the economic development mode and raise the core
competitiveness of industries. All financial institutions must take pillar industries
as focus and, by way of adjusting the credit structure, promote the transfor-
mation of the economy from growth to development. They should provide sup-
port through project construction and vigorously coordinate with functional gov-
ernment departments to carry out a new type of industrialisation (Huangshi City
2008 at 2).
In the same vein, the government of Hubei Province consistently emphasised the im-
portance of HNTE. The 12th FYP of Hubei Province for the Restructuring and Upgrading of
Industry illustrates this phenomenon (Hubei Province 2012a). The Programme identifies
eight pillar industries and highlights that the cultivation of favoured industries had continued
without interruption during the previous 11th FYP period (2006-2010) and will be carried on
into the future (at 1.1.1).
The current Programme emphasises the importance of strengthening the effectiveness of
favourable tax provisions for HNTEs and states that the province would actively pursue var-
ious types of special funds administered at the national level, and comprehensively plan the
allocation and use of special guidance funds administered by the province. In so doing, it
should focus on supporting industrial technology innovation, technology transformation and
other issues. Furthermore, Hubei Province declares in this Programme that priority should
be given to HNTEs when it comes to the allocation of LUR (at 5.5).

© THINK!DESK China Research & Consulting 2015 Seite 101
2.2.2.5 Forced Localisation of Intellectual Property Rights
in the HNTE-Programme
In the aftermath of the 2008 reorganisation of HNTE administration the new regulatory
framework has put a stronger focus than before on the localisation of intellectual property
(IP) inside China. HNTEs must be registered in mainland China and must carry out innova-
tion oriented scientific research to make substantial improvements to technologies, products
and services (at 3.10.4). They have to possess the IP of the core technologies embodied in
their products or services which need to be part of one or more National Supported Key
High and New Technology Fields. Alternatively, companies may hold the exclusive license
to use IP worldwide for no less than five years. 60 percent of annual gross revenues have to
originate from related sales activities (MOST, MOF and SAT 2008 at 3.10.5).
The current regulation maintained previous requirements pertaining to the educational at-
tainment of staff and the condition that 10 percent of the work force had to engage in R&D
work (at 3.10.3). It imposed more flexible benchmarks regarding the required R&D expens-
es relative to gross revenues. Companies with sales revenues in the previous fiscal year of
less than 50 million RMB may not spend less than 6 percent. Those generating over 50 mil-
lion RMB and over 20 million RMB need to spend at least 4 percent and 3 percent respec-
tively. Every company has to prove that 60 percent of R&D expenses have taken place in-
side China (at 3.10.4).
The current regulation results in serious discrimination against foreign enterprises:
Firstly, the combination of R&D and manufacturing operations in a single China-based unit
is not in line with international best practice. HNTE policy makes preferential treatment con-
tingent on the bundling of R&D centres and related production facilities to allow for the most
effective commercialisation of advanced technologies on an industrial scale. This may work
well for Chinese companies with limited or no subsidiaries in other countries. The corporate
structures of large and medium-sised multinationals do not allow a combination of both
functions in a single China-based subsidiary. In many cases, R&D centres are not dedicated
to serving only one production base. This bundling solution is incompatible with modern
globalised business as companies cannot reasonably be expected to create proprietary
technologies in R&D centres attached to every manufacturing subsidiary. The current HNTE
provisions effectively exclude the China subsidiaries of many (of the most advanced) tech-
nology companies from tax breaks and other financial support. This occurs when they (1)
conduct R&D but do not produce locally; (2) have manufacturing operations without at-
tached R&D centres or (3) have both in place but do not sell the product or service inside
China.
Secondly, the market mechanism – not the government policy – should guide IP allocation
in the internationalised world of research and innovation. The localisation of the scheme
presents a number of serious challenges that tilt the playing field by putting foreign enter-
© THINK!DESK China Research & Consulting 2015 Seite 102
prises at a disadvantage. De jure, the scheme is open to all companies registered in China,
including those with foreign investment. De facto, it is incompatible with modern IP man-
agement methods by requiring the localisation of proprietary technologies in mainland China.
In order to be eligible to tax breaks and other means of preferential treatment, companies
have to possess either the core IP for their business or the exclusive right to use it for at
least five years.
This is not feasible for multinational enterprises which manage large and complex IP portfo-
lios. It is unreasonable to demand a transfer of all patents related to a particular technology
or product to their Chinese subsidiary (USCBC 2014). Limitations are particularly severe for
companies in businesses where operation is only permitted through joint ventures with do-
mestic partners. The dangers of losing key technologies – the same that must be localised
under the HNTE regulation – are significant. In these cases, a concentration of IP in China
may put the international company’s global business at risk. In the same vein, company
may worry about a drain in core technologies during the application process with local and
provincial authorities. The latter requires enterprises to provide detailed information on the
technologies in question. Authorities even demand to know the identities of research per-
sonnel. Disclosing sensitive details on general R&D plans and international activities in this
regard may not be in the applicants’ interest as the protection of trade secrets cannot be
guaranteed.
In determining the proper subsidiary and location for holding critical IP, multinationals typi-
cally consider a wide range of factors, like the stability of the legal system, the share of
global manufacturing and sales or the availability of qualified R&D personnel or other vital
resources. Demanding companies to bundle proprietary technologies in their China subsidi-
aries does not take into account the commercial factors that enterprises from market econ-
omies base their allocation decisions on. The intricacies of global R&D networks and cross
border collaboration on future innovations require a high degree of flexibility regarding the
flow of information and personnel. They are hardly compatible with the Chinese govern-
ment’s strategy to attract and accumulate worldwide patents within national borders.
2.2.3 Promotion of Strategic Emerging Industries
Against the backdrop of rising fears that China’s growth and development dynamics might
get stuck in what the World Bank has termed the “middle income trap” (ADB 2012), the Chi-
nese government seeks to localise intellectual property for cutting edge technologies in Chi-
na. While support has been strong for industry-wide upgrading, a special focus has been put
on a carefully selected group of advanced and (potentially) disruptive, path-breaking technol-
ogies. These are considered crucial enablers for profound improvements to future ways of
living and doing business in China and worldwide. Research subsidies in areas like fuel cell
powered transport solutions, the internet of things or satellite technology are not inspired by a
desire to close the gap to more advanced competitors from other countries. Rather than de-
© THINK!DESK China Research & Consulting 2015 Seite 103
velop “me too” products to expand sales of China-made products at the expense of imported
ones, these select few technologies are expected to serve as true paradigm changers.
2.2.3.1 General Concept for the Promotion of Strategic Emerging
Industries
In late 2010, the top leadership of both the CPC and the state decided to prioritise a set of
industries for fast-tracked development. To this end, the State Council released the Deci-
sion of on Accelerating the Cultivation and Development of Strategic Emerging Industries,
identifying the following seven industries for special promotion:
(1) energy conservation and environmental protection,
(2) information technology,
(3) biotechnology,
(4) high-end equipment manufacturing,
(5) renewable energy sources,
(6) new materials and
(7) new energy vehicles (State Council 2010a).
These are broadly elaborated upon as
“knowledge and technology intensive industries with less material resource con-
sumption, huge growth potential and good comprehensive benefits based on sig-
nificant technological breakthroughs and large development demands, playing a
significant leading and driving role in the overall and long-term social and eco-
nomic development. Accelerating the fostering and development of strategic
emerging industries is of great strategic significance in promoting the modernisa-
tion construction of our country” (State Council 2010a at 1)
According to the initiation document, nurturing these industries, respectively technologies,
through state policies is understood to be
“an important measure for promoting the upgrading of the industrial structure and
accelerating the transformation of the economic development mode” (at 1.2) and
“an inevitable choice for accomplishing a well-off society and sustainable devel-
opment” (at 1.1).
The State Council has explained that the practice of nurturing industries of high strategic
relevance had been pioneered by other countries. It argued that the Chinese economy had
developed to a point where such an approach would make a great contribution to sustaining
growth in the future. Escalating environmental vulnerabilities resulting from rapid urbanisa-
tion and industrialisation had brought up the need for new sources of growth in the face of

© THINK!DESK China Research & Consulting 2015 Seite 104
intensifying resource constraints. SEIs are expected to form a nucleus of future develop-
ment, create employment opportunities and support environmental preservation as well as
resource conservation. 7
It is hoped that the outcomes of vigorous SEI promotion will produce spill-over effects in
other sectors and inspire technology upgrades throughout the economy. Consequently, the
SEI strategy is intended to improve the international competitiveness of Chinese products in
a comprehensive manner. This issue reflects concerns that Chinese companies might lose
out to overseas competitors, which, allegedly, have benefitted from systematic support from
their respective governments. It demands to act quickly and forcefully in order to master
core technologies and secure related intellectual property rights.8
A more detailed overview of priority technologies under the umbrella of SEI promotion is
provided in table 21:
7 SC (2010).
8 Ibid.

© THINK!DESK China Research & Consulting 2015 Seite 105
Table 21: Technologies Covered by the Strategic Emerging Industries Strategy
Energy efficiency and environmental conservation
Research, develop, and promote energy-efficient technology products in order to make technology breakthroughs and raise overall
energy efficiency;
Accelerate the R&D and production of broadly applicable technology that can be used for resource recycling and remanufacturing in-
dustrialisation;
Test and promote advanced environmental technologies and products;
Promote a market-oriented service system for environmental protection and energy efficiency;
Employ advanced technology to create a recycling system for waste commodities; and
Promote clean coal and seawater use.
Next generation information technology
Accelerate the construction of vast, integrated, and safe information network facilities, promote the R&D and production of new-
generation mobile communication, as well as core equipment and intelligent terminals for next-generation Internet;
Accelerate the convergence of telecom, broadcasting, Internet networks; promote R&D in the "Internet of things" and cloud computing;
Focus on developing core and basic sectors such as integrated circuits, new-mode displays, high-end software, and high-end servers;
Upgrade software and value-added Internet services; promote smart renovation of infrastructure; and
Develop digital and virtual technologies to promote creative industries.
Biotechnology
Develop biotech-derived pharmaceuticals, new vaccines, diagnostic reagents, chemical drugs, modern Chinese medicine, and innova-
tive drugs that prevent major critical diseases;
Accelerate the R&D, production, and large-scale development of biological and medical engineering products such as medical equip-
ment and medical materials;
Promote bio-agriculture development, including the biological breeding industry, green agriculture, and biological production;
Advance the exploration, demonstration, and application of core technologies in biological manufacturing; and
Accelerate the R&D and production of marine biology technologies and products.

© THINK!DESK China Research & Consulting 2015 Seite 106
High-end equipment manufacturing
Strengthen and expand the aviation industry, focusing on the development of key aviation equipment for trunk line and regional flights
as well as utility aircraft;
Promote aerospace infrastructure construction to develop satellites and related industries;
Develop rail equipment used during the construction of passenger lines and urban metro systems;
Develop marine engineering equipment to develop marine resources; and
Develop intelligent manufacturing equipment with digitally-integrated systems as core components.
New energy
Research and develop new-generation nuclear power technology and advanced reactors;
Accelerate the application of solar-power technologies and explore diversified power-generation markets of solar photovoltaic and
photo-thermal energy;
Improve wind-power technology equipment to promote large-scale development of wind power and to develop an intelligent grid as
well as new-energy systems; and
Explore and use biomass energy according to local conditions.
New materials
Develop new materials such as rare earths, high-performance membrane materials, special glass, functional ceramics, and semicon-
ductor lighting materials;
Develop advanced structural materials, such as high-quality special steel, new-mode alloy material, and engineering plastics;
Develop high-performance fibre and composite materials, such as carbon fibre, aramid fibre, and ultra-high molecular weight polyeth-
ylene; and
Research general and basic materials such as nano-, super-conductor, and intelligent materials.
New-energy vehicles
Make core technology breakthroughs in motor batteries, drive motors, and electronic controls to promote the application and commer-
cialisation of plug-in hybrid and pure electric vehicles; and
Research leading and core technologies for fuel-cell vehicles; and vigorously promote low-emissions, energy-efficient vehicles.
Source: Replicated from USCBC 2013

© THINK!DESK China Research & Consulting 2015 Seite 107
2.2.3.2 Implementation of SEI Policies
In line with established administrative practice, central government departments have drafted
the key policy documents, like FYP programmes, guidance catalogues and implementation
measures. The Special Decision of the State Council served to emphasise the extra-ordinary
importance of the policy and remove any doubts that central government authorities were
serious about putting strategic plans into business practice.
In December 2012, the MOF and the NDRC (2012) jointly issued the Interim Measures for
the Administration of Special Funds for the Development of Strategic Emerging Industries to
clarify the conditions for use of financial support by government agencies. Special funds are
managed by the NDRC, the MOF and other ministries (at 3). They are contained in the cen-
tral government budget and allocated to support technology innovation, the operation of ap-
plication demonstration projects, the development of regional clusters and related tasks (at
2). In defining the scope, the Interim Measures specify that
“We shall select the industries or technologies that are seriously restricted by key
technologies and that are of strong relevance, of fundamental significance and
really concern public welfare, support industrial backbone enterprises in integrat-
ing innovation resources at industrial chains” (at 5.2).
The NDRC and the MIIT have compiled catalogues which go in great detail to outline the SEI
products and technologies subject to special promotion measures. The approach is akin to
other guidance catalogues that identify encouraged investment priorities in order to earmark
them for heightened support.
In 2012, the State Council issued development objectives for IP in SEI. Until 2015, the capa-
bilities for creating, utilizing and managing IP are to improve substantially. In order to meet
these targets, the number of invention patents and patents registered overseas should dou-
ble 2010 values. Furthermore, an integrated IP service system is to be set up. Additionally, a
small group of leading enterprises with advantages in the field of IP should be cultivated and
companies in SEI should form IP alliances spanning across sectoral (State Council 2012a).
Actual implementation work was delegated to provincial and municipal level authorities as
they have more administrative resources available to oversee projects and adjust measures
to local circumstances. Putting local governments in charge of SEI promotion “on the ground”
proved to have both advantages and disadvantages. It was a prudent move as state-
business interaction is much more intense on the local level and both sides can cooperate
closely on carrying out demonstration projects, identifying problems, finding innovative solu-
tions and ensuring the commercialisation of advanced technologies.
With regard to SEI strategy, provincial and municipal government have drafted their own set
of development programmes, guidance catalogues and implementation measures. These do
not uniformly follow the model provided by central authorities but are base on pre-existing
© THINK!DESK China Research & Consulting 2015 Seite 108
industry development plans as well as characteristics of the regional economy. Through con-
sultations with provincial officials, the USCBC found the Hunan Province has substituted
new-energy vehicle industry by cultural innovation. Such deviations from the national strate-
gy appear reasonable as local differences in economic layout imply that regions are not
equally suited to pursue a uniform set of SEI. The same survey has discovered that some
provinces assign different priorities to their SEIs. It cites a practice from Sichuan province
which assigns top priority to next-generation IT and reserves a quarter of provincial support
funding to this sector (USCBC 2013b at 16).
Table 22 below provides an overview of the government agencies tasked with SEI promotion
on both central and local government level along with brief outlines of their respective duties.
Despite of the significant advantages involved in the collective commitment of so many gov-
ernment agencies in the implementation process, substantial coordination problems amongst
all these actors have arisen as well. The initiation document of the SEI strategy emphasised
comprehensive planning and guidance. By way of a national development plan for SEIs in
general, special plans for each SEI as well as the integration with other relevant plans and
policies, it was hoped to maintain a tight grip on the development process. The regular col-
lection of statistical data and compilation of progress reports was intended to facilitate effec-
tive supervision and direction. Furthermore, strong guidance of the local governments’ de-
velopment strategies was announced so as to ensure an optimal regional layout and the for-
mation of comparative advantages through coordinated efforts. Even at this early stage, the
SC warned that blind development and redundant construction could undermine progress
(State Council, 2010a at 8.3).
The high profile nature of the SEI strategy and its continuing endorsement by top govern-
ment decision makers has not prevented a range of coordination shortfalls from impairing
development from the very beginning. In order to avoid such problems, the 12th FYP for the
development of SEI has introduced an inter-departmental working group that includes the
MOST, the MIIT and the MOFCOM and is led by the NDRC. The group monitors develop-
ments trends and coordinates the implementation of policies. However, as the case of new-
energy vehicles shows, the coordination between different government departments – or
rather a lack thereof – has discouraged investments by further adding to the uncertainty.9
Heavy involvement of administrations at and below the provincial level has reduced the con-
trol and sanctioning abilities of central government decision makers. The latter could thus
bring to bear little influence to counter excessive subsidisation as well as anti-competitive
practices. Furthermore, access to accurate information concerning government policies and
procedures becomes more difficult towards the lower rungs of the administrative hierarchy.
With regards to SEI promotion, this has led to low levels of transparency and high levels of
uncertainty – a phenomenon particularly affecting foreign invested enterprises.
9 USCBC, China’s Strategic Emerging Industries: Policy, Implementation, Challenges & Recommen-
dations (2013), 1.

© THINK!DESK China Research & Consulting 2015 Seite 109
Table 22: Participating Chinese Government Organisations in SEI Policies
Central government body Local government body Tasks
National Development and Reform
Commission (NDRC)
Development and Reform
Commissions (DRCs)
Directs SEI policy implementation
Drafts SEI documents, for example the key SEI products
and services catalogue
Ministry of Industry and Infor-
mation Technology (MIIT)
Economic and Information
Technology Commissions
(EITCs)
Involved in SEI policy development, especially for the fol-
lowing SEIs: new materials, next generation information
technology, energy efficient technologies, and equipment
manufacturing
Creates own catalogues
Ministry of Commerce (MOFCOM)
Commerce Commissions
(CCs) or Departments of
Commerce
Collaboration with other organisations to enforce SEI poli-
cies
Ministry of Science and Technolo-
gy (MOST)
Science and Technology
Commissions (STCs)
Assists with R&D for SEIs
Manages national science and technology (S&T) financed
programs
Participates with other organisations in developing SEI
policies, specifically supporting domestic technology and
domestic innovation
Ministry of Finance (MOF) Departments of Finance Controls SEI finances
State Intellectual Property Office
(SIPO)
Intellectual Property Bu-
reau (IPB) or Intellectual
Property Administration
(IPA)
Protects SEI intellectual property rights (IPR) in collabora-
tion with other agencies

© THINK!DESK China Research & Consulting 2015 Seite 110
Source: Replicated from USCBC 2013.

© THINK!DESK China Research & Consulting 2015 Seite 111
2.2.3.3 General Support Measures for SEI Enterprises
The State Council (2010a) pledges to increase financial support to corporate R&D as well as
to technology commercialisation and demonstration projects. It promised to set up a “stable
financial input growth mechanism” and dedicate significant resources from the central gov-
ernment’s budget (at 7.1). Enterprises can benefit from special tax breaks and receive subsi-
dies from the SEI development fund.
Concerning tax incentives, the central government pledged to fully implement all current tax
policies for promoting scientific inputs, commercializing technological breakthroughs and
supporting the development of high-tech industries. At the same time, amendments have
been made to better meet the needs of SEI (ibid).
Regarding bank lending, the Chinese leadership “encourages financial institutions to in-
crease credit support” (at 7.3). Government policies direct banks to tailor credit management
and loan evaluation systems to the specific characteristics of SEI, create innovative financing
solutions and step up support for SEI development.
In May 2015, the Shanghai Stock Exchange revealed plans for establishing a special SEI
board for trading stocks of related companies. Listing will initially be limited to companies that
have been recognised by supervising authorities as engaged in SEI business but may later
be opened to encompass more companies from related high-tech fields. Remarkably, the
official announcement indicated that companies whose financial performance may not war-
rant a stock market listing may take advantage of special financing options under a diversi-
fied rating system (Global Times 20.05.2015).
Since the launch of the SEI initiative, substantial amounts of state funds have been dedicat-
ed to jumpstart technology innovation and facilitate its commercialisation. According to Ren
Zhiwu, Deputy Director General of the High Technology Division at the NDRC, the central
government provides only about a quarter of all SEI financing. (State Council 2010a) Most of
the government’s financial support comes from the budgets of sub-central government in-
stead.
The 12th FYP for SEI development mandates that every province has to create SEI develop-
ment funds with provincial officials in charge of making allocations to localities in line with SEI
policies. Fujian Province, for example, intends to set aside 1 billion RMB for an SEI venture
capital fund. Similarly, Tianjin City created a 970 million RMB fund for high-tech and innova-
tion projects (USCBC 2013b).
Since early 2011, provinces and cities have invested heavily in numerous large-scale
demonstration projects that facilitate the testing of experimental technologies under real life
conditions. Furthermore, major state-funded science and technology projects have provided
opportunities for the application of technological breakthroughs on a large scale (at 4).

© THINK!DESK China Research & Consulting 2015 Seite 112
In fact, provincial governments resort to SEI promotion measures which go beyond what cen-
tral government documents suggest. According to research conducted by the USCBC
(2013b), these include the allocation of LUR at discount prices, preferential access to public
utilities at below market prices, subsidies for attracting skilled professionals or expedited li-
censing approvals.
Despite the large spectrum of support measures introduced by government documents, sub-
sidies and tax incentives have so far served as the principal instruments for promoting tech-
nology development, commercialisation and application in demonstration projects. Both have
conferred substantial benefits on eligible companies during the four and a half years since
the SEI initiative was launched. Table 23 provides an overview of subsidies paid for the de-
velopment and commercialisation of new-energy vehicle technologies to selected companies
in the automobile manufacturing industry:
Enterprises belonging to one or more of the seven SEI can benefit from strong financial
backing of various government bodies. Taken together, all companies listed at stock ex-
changes on the Chinese Mainland have obtained a grant total of 1.08 billion RMB in the five
years between 2010 and 2014. Total disbursements per year have risen quickly during this
time. The following tables illustrate the surge in subsidies for the seven SEI.
Table 23: Total Disbursements of Subsidies for Strategic Emerging Industries
2010 2011 2012 2013 2014 Total
5,250,000 124,267,008 288,454,355 364,868,724 297,370,803 1,080,210,890
Source: Wind Data
In 2014, at least 143 enterprises have benefitted from government subsidies because their
activities for SEIs. The ten largest recipients are listed in the following table 24.

© THINK!DESK China Research & Consulting 2015 Seite 113
Table 24: Top 10 Recipients of Subsidies for Promoting Strategic Emerging
Industries
Rank Enterprise Amount
1 Ningbo Donly Co., Ltd. 20,533,799
2 Jiangsu Yuyue Medical Equipment & Supply Co., Ltd. 14,000,000
3 BYD Company Limited 12,349,000
4 Ourpalm Co., Ltd 12,087,000
5 Sichuan Kexin Mechanical and Electrical Equipment Co., Ltd. 12,000,000
6 Henan Hanwei Electronics Co., Ltd. 12,000,000
7 Yunnan Baiyao Group Co., Ltd. 11,000,000
8 Yunnan Baiyao Group Co., Ltd. 10,000,000
9 Jiangsu Yuyue Medical Equipment & Supply Co., Ltd. 7,000,000
10 Zhejiang Narada Power Source Co., Ltd. 7,000,000
Total 117,969,799
Source: Wind Data
These amounts represent only a fraction of total SEI subsidisation. This is because the des-
ignations of most transfers contain the specific technology project that is to be funded and
not the general term SEI subsidy. Hence it is important to take a closer look at one specific
sector.
Taking the New-energy Vehicle sector as an example, THINK!DESK has calculated that
companies involved in the development and commercialisation of related technologies have
received at least 1.5 billion RMB. Even this number does not yet include the entirety of grants
provided for key technologies, like high performance batteries, electric engines and control
system. See table 25.
Table 25: Total Disbursements of Subsidies Related to New-Energy Vehicle
Technology Development and Commercialisation under the SEI Initiative
2010 2011 2012 2013 2014 Total
29,085,877 193,234,575 246,032,187 476,148,784 597,772,340 1,542,273,763
Source: Wind Data
In 2014, at least 39 enterprises have obtained grants for developing and commercializing key
technologies for application in new-electric vehicles. The ten largest recipients are listed in
the following table 26. See table 27 for further details.

© THINK!DESK China Research & Consulting 2015 Seite 114
Table 26: Top 10 Recipients of Subsidies Related to New-Energy Vehicle
Technology Development and Commercialisation under the SEI
Initiative in 2014
Rank Enterprise Amount
1 Anhui Ankai Automobile Co., Ltd. 221,750,000
2 Beiqi Foton Motor Co., Ltd. 117,843,346
3 BYD Company Limited 105,090,000
4 Beiqi Foton Motor Co., Ltd. 34,119,425
5 Chongqing Changan Automobile Company Limited 17,977,999
6 Lifan Industry (Group) Co., Ltd. 14,690,000
7 Beiqi Foton Motor Co., Ltd. 8,000,000
8 BYD Company Limited 6,166,000
9 Chongqing Changan Automobile Company Limited 5,000,000
10 Qingdao TGOOD Electric Co., Ltd. 4,845,000
Total 535,481,770
Source: Wind Data

© THINK!DESK China Research & Consulting 2015 Seite 115
Table 27: Subsidies for the Promotion of New Energy Vehicles (NEV)
Enterprise Year Description Amount Source
China South-ern Rolling Stock Co. Ltd.
2014 Subsidies from the Finance Department of Zhuzhou City for the development of new-electric vehicles
445,550,000 (DI/NCL)
2014 at 131
Anhui Ankai Automobile Co., Ltd.
2010 Subsidies for R&D on and the commercialisation of key power train technologies of New Energy Busses Amortisation in 2010: 2,375,000 RMB Amortisation in 2011: 2,375,000 RMB Subsidies for R&D on key technologies and complete new energy vehicles
4,750,000 (DI/NCL)
1,200,000 (NOI)
2012 at 121 2011 at 133
2011 Subsidies for R&D and commercialisation of elec-tronic control systems for NEVs Subsidies of Hefei City for projects related to the appli-cation and demonstration of key NEV technologies Amortisation in 2011: 1,333,333 RMB Amortisation in 2012: 666,667 RMB Subsidies for setting up pro-jects for R&D on key tech-nologies related to plug-in hybrid electric busses (com-plete vehicles) and their commercialisation Amortisation in 2011: 1,060,000 RMB Amortisation in 2012 and 2013: 470,000 RMB p.a.
660,000 (NOI)
2,000,000 (DI/NCL)
2,000,000 (DI/NCL)
2011 at 132 2012 at 121 2012 at 121
2012 Subsidies for the develop-ment and commercialisation
3,000,000 (NOI)
2012 at 131

© THINK!DESK China Research & Consulting 2015 Seite 116
Enterprise Year Description Amount Source
of a new generation of core technologies related to NEVs Amortisation of deferred in-come subsidies for NEV R&D promotion Subsidies for innovation on key technologies of plug-in hybrid electric busses Amortisation 2012-2014: 168,100 RMB p.a. Subsidies for industrial 3-high projects Amortisation in 2012 and 2013: 1,600,000 RMB p.a. Amortisation in 2014: 800,000 RMB Subsidies for the commer-cialisation of a new genera-tion of core technologies re-lated to NEVs Amortisation in 2012: 1,000,000 RMB
1,000,000 (NOI)
504,300 (DI/NCL)
4,000,000 (DI/NCL)
2,000,000 (DI/NCL)
2012 at 131 2012 at 121 2012 at 122 2012 at 122
Xiamen King Long Motor Group Co., Ltd.
2011 Subsidies for the “10 Cities 1000 Vehicles” NEV popular-isation and demonstration project. Subsidies from the central government for NEV devel-opment projects Compensation of expenses related to the commercialisa-tion of NEV and hybrid drive technology Subsidies for pure electric bus project Subsidies in compensation of expenses related to new
240,000 (NOI)
1,188,000.00 (NOI)
500,000 (NOI)
800,000 (DI/NCL)
10,000,000 (NOI)
2011 at 80 2011 at 86 2011 at 86 2011 at 80 2011 at 86

© THINK!DESK China Research & Consulting 2015 Seite 117
Enterprise Year Description Amount Source
electric bus platforms in 2010
2012 Investment increase from the central government for NEV projects (amortisation of de-ferred income subsidies) Subsidies for equipment re-lated to R&D on light pure electric busses as well as the commercialisation thereof
1,188,000 (NOI)
800,000 (NOI)
2012 at 86 2012 at 93
2013 Subsidies for components of energy-saving and new en-ergy busses Subsidies for R&D and commercialisation of NEV related technologies Subsidies for promoting the popularisation of NEV Subsidies for the commer-cialisation of complete vehi-cle controls and battery management systems of NEV
51,468,800 (NOI)
3,088,800 (NOI)
600,000 (NOI)
660,000
(NOI)
2014 at 113 2013 at 99 2013 at 99 2013 at 99
2014 Special funds for major tech-nology projects related to pure electric vehicles Subsidies for the commer-cialisation of complete vehi-cle controls and battery management systems of NEV Subsidies for building the capabilities for NEV technol-ogy development and com-mercialisation Subsidies for components of energy-saving and new elec-
1,103,140 (NOI)
382,400 (NOI)
2,482,300 (NOI)
4,719,000 (NOI)
2014 at 107 2014 at 107 2014 at 107 2014 at 113

© THINK!DESK China Research & Consulting 2015 Seite 118
Enterprise Year Description Amount Source
tric busses Subsidies for major technol-ogy and commercialisation projects for NEV
1,635,540
(NOI)
2014 at 113
Zhengzhou Yutong Bus Co., Ltd.
2010 Subsidies for R&D and commercialisation of new energy city busses
7,100,000 (DI/NCL)
2010 at 73
2011 Subsidies for R&D projects related to energy-saving and new-energy busses
13,500,000 (DI/NCL)
2011 at 77
2012 Subsidies for NEV technolo-gy demonstration and opera-tion projects
28,119,000 (DI/NCL)
2012 at 92
2013 Subsidies for energy-saving and new energy bus project NEV Industry Technology Engineering Innovation Award Support funds for new ener-gy bus project Subsidies for NEV technolo-gy innovation engineering project
70,000,000 (DI/NCL)
32,000,000
(DI/NCL)
88,319,600 (NOI)
26,723,200
(NOI)
2013 at 95 2013 at 96 2014 at 118 2014 at 118
2014 Subsidies for the operation of NEV technology develop-ment and demonstration pro-jects Subsidies for the operation of NEV technology develop-ment and demonstration pro-jects Subsidies for R&D and demonstration projects for pure electric commercial ve-hicles
3,000,000 (DI/NCL)
6,606,410 (NOI)
12,000,000 (DI/NCL)
2,100,000 (NOI)
2014 at 110 2014 at 110 2014 at 110 2014 at 118

© THINK!DESK China Research & Consulting 2015 Seite 119
Enterprise Year Description Amount Source
Awards for NEV body
Chongqing Changan Au-tomobile Company Limited
2014 Subsidies for special R&D projects related to NEV NEV subsidies
17,977,999 (NOI)
5,000,000
(NOI)
2014 at 132
Anhui Jianghuai Automobile Co., Ltd.
2012 Subsidies related to NEV technology development and commercialisation
129,770,000 NOI
2012 at 107
2013 Compensation of expenses related to 863 project of the Ministry of Science and Technology (Next generation power trains for pure electric vehicles) Subsidies for development projects for Jianghuai’s fifth generation pure electric ve-hicle platform technologies
1,500,000 (DI/NCL)
191,460,000 (DI/NCL)
2013 at 95 2013 at 95
2014 Subsidies related to NEV development and commer-cialisation Subsidies for projects relat-ing to the development of technology platforms for Jianghuai’s fifth generation new energy passenger car
213,420,000 (NOI)
102,509,000 (DI/NCL)
2014 at 140 2014 at 104
Liaoning SG Automotive Group Co., Ltd.
2010 Special funds for the devel-opment of electric city bus-ses
3,000,000 (NOI)
2010 at 91, 99
2011 Special funds from Chang-zhou City for project devel-opment in Changzhou Inno-vative Science and Technol-ogy Park
16,000,000 (DI/NCL)
2,000,000
2011 at 97 2011 at 105

© THINK!DESK China Research & Consulting 2015 Seite 120
Enterprise Year Description Amount Source
Special funds for the devel-opment of electric city bus-ses
(NOI)
2012 Subsidies for the develop-ment and commercialisation of 12 meter, low-entry pure electric city buses
1,000,000 (NOI)
2012 at 108
2013 Subsidies from a common service platform Loan interest subsidies from the Finance Department of Liaoning Province for tech-nology renovation projects at Huanghai Bus
10,000,000 (special
payables)
30,000,000 (special
payables)
2013 at 97 2013 at 97
Tianjin FAW Xiali Auto-mobile Co., Ltd.
2013 Subsidies for the develop-ment and commercialisation of the V5 pure electric vehi-cle
350,000 (NOI)
2013 at 74
2014 Subsidies for the develop-ment and commercialisation of the V5 pure electric vehi-cle
3,984,102 (NOI)
2014 at 70
Dongfeng Automobile Co., Ltd.
2010 Subsidies for the develop-ment of electric vehicles (Component of the 2010 Sci-ence and Technology Devel-opment Programme of Hubei Province)
3,500,000 (DI/NCL)
2010 at 94
2011 Subsidies from Zhengzhou City compensating for ex-penses on the operation of the NEV demonstration pro-ject in the city Quality award of the gover-nor of Henan Province Subsidies from the Depart-ments of Science and Tech-
1,000,000 (NOI)
1,000,000 (NOI)
2,000,000
(NOI)
2011 at 124 2011 at 124 2011 at 124

© THINK!DESK China Research & Consulting 2015 Seite 121
Enterprise Year Description Amount Source
nology, Finance as well as Industry and Information Technology for the conver-sion of conventional gasoline powered cars
2014 Subsidies for the develop-ment of electric vehicles
875,000 (NIO)
2014 at 93
NOI : Non-operating income
DI/NCL: Deferred income as part of non-current liabilities
Compilation by THINK!DESK.

© THINK!DESK China Research & Consulting 2015 Seite 122
2.2.3.4 Internationalisation of SEI
The Chinese government assigns a large amount of significance to the internationalisation of
SEIs. During the 12th FYP, SEIs are expected to strengthen their competitiveness and in-
crease the scale of international trade and investment. The latter should be accomplished,
inter alia, by establishing overseas high-tech industrial parks, demonstration bases and inno-
vation bases.
Government organisations were urged to subscribe themselves to creating a
“favourable environment for encouraging and directing enterprises to actively ex-
ploit the international market” (MOFCOM et al. 2011 at 1.2).
Targeted trade policy measures are to improve the structure of imports and exports (at
1.4.6). In order to guide and direct trade flows more effectively, special support measures for
encouraged products were announced. A new catalogue covering encouraged SEI products
for import and export was to serve as foundation for more targeted promotion efforts.
In September of 2011, ten ministries and commission of the central governmental together
issued the Guiding Opinions on Promoting the International Development of SEI. The docu-
ment argues that comprehensive internationalisation of R&D, manufacturing, marketing and
other aspects of SEI was deemed paramount for enhancing innovative capabilities and core
competitiveness (ibid at 1).
Export promotion in SEI was announced as well:
“We shall fully leverage institutions stationed abroad, industrial organisations and
other relevant intermediaries to provide international market information services
for enterprises and encourage and support various professional exhibitions and
promotion activities for important export products in a targeted manner” (ibid at
3.15).
However, the Guiding Opinions makes it abundantly clear that raising technology content in
Chinese SEI exports contains a high level of importance (ibid at 3.12).
On top of several general provisions, the Guiding Opinions introduced specific instruments
and instructions for each SEI individually. Support for the new material industry, for example,
targeted overseas M&A transactions as a means to strengthen competitiveness and innova-
tiveness. The policy demanded that the state should increase support for the import of new
material products and technologies, and strengthen the presence of Chinese high value-
added new material products on the world market.
Enterprises are encouraged to set up R&D centres in foreign countries – by M&A, equity or
contractual joint ventures, purchasing shares or other means – and pursue strategic coop-

© THINK!DESK China Research & Consulting 2015 Seite 123
erative partnerships with foreign research institutions and industrial clusters (ibid). The Chi-
nese government also supports companies in establishing overseas marketing centres,
maintenance service outlets and other projects. Special support is available for the registra-
tion of overseas patents (MOFCOM et al. 2011 at 4.22). A small group of leading enterprises
with independent intellectual property rights, well-known brands and strong international
competitiveness are to serve as vanguard. These national champions are to lead the way in
exploring international markets (ibid at 1.3).
Companies from SEI planning to expand overseas can count on state support in public offer-
ings of stocks or bonds. They may also take advantage of more convenient ways for cross
border fund transfers. Furthermore, they are eligible for export insurance and export credit at
preferential conditions (State Council 2010a; MOFCOM et al. 2011).
The central government has promised to adjust the structure of foreign development aid in
order to create favourable investment environments for its companies in foreign countries
(ibid).
It should be pointed out that a significant overlap exists between the group of recognised
HNTEs and companies taking advantage of SEI promotion policies. Other strategic technol-
ogy initiatives, such as the 863 Programme, the 973 Programme, the Torch Programme, the
Spark Programme which provide similar benefits for related projects together lead to a sub-
stantial reduction of tax payments and install technology subsidies as a significant source of
revenue. In fact, the multitude of support schemes oriented towards strengthening capabili-
ties in science and technology has led companies to devote resources to navigating between
numerous available support measures. Various objectives, performance requirements and
eligibility criteria create incentives for adjusting operations in order to maximise subsidy in-
come rather than realise the development of marketable products. Rent seeking behaviour
may thus undermine the freedom to undertake genuine innovation.
2.2.3.5 Integration of Foreign Invested Enterprises in the SEI Initiative
The Chinese government promotes Sino-foreign cooperation and joint investments in SEI
(State Council 2010a at 4.2). The 2015 revision of the Catalogue for Guiding Foreign Invest-
ment has accordingly put a clear focus on technologies related to SEI. Foreign investors are
welcome to form joint ventures with Chinese partners and contribute advanced technologies
and financial resources (MOFCOM et al. 2011 at 1.4.6).
Foreign enterprises are allowed to participate in SEIs. Several high-ranking Chinese officials
such as former Premier Wen Jiaobao stipulated that foreign and Chinese companies will
receive equal treatment. (USCBC 2013b at 7). De jure, foreign firms enjoy equal access to
SEI development benefits as Chinese firms. De facto, international enterprises have encoun-
tered severe difficulty to even obtain necessary information. Companies even had trouble to

© THINK!DESK China Research & Consulting 2015 Seite 124
determine if there are eligible for SEI promotion measures. Additionally, foreign firms have
complained that it is almost impossible for them to tap into the government’s special funds
and access other benefits that are naturally available for domestic companies. Furthermore,
international players are burdened by localisation requirements. As companies have to be
registered in the province in which they file funding applications, branch offices are often ex-
cluded from this opportunity (ibid).
In its 2014 Report on Potentially Trade Restrictive Measures, the European Commission
(EC) has warned against
“provisions that could compel foreign auto-makers that want to produce critical
components (e.g., vehicle traction battery, drive motor, basic materials for com-
plete vehicle control system, battery and motor, etc.) in China to share critical
technologies by requiring the companies to ‘present independent R&D capability
and intellectual property rights, with the equity of the Chinese party no less than
51%’. The recently revised Catalogue for Guidance of Foreign Investment has for
the first time formalised this investment restriction on automotive components but
limited it to the battery systems by stipulating the following: ‘Manufacture of key
parts and components of new energy automobiles: high energy power batteries
(with the proportion of foreign investment not exceeding 50%)’” (EC 2014 at 149).
Participants in a 2013 member survey of the U.S. – China Business Council have reported
mixed success in their efforts to participate in SEI schemes. Only a quarter of respondents
stated they had been successful while 57 percent had met with moderate success (USCBC
2013b at 6).
The Chinese government has introduced SEI product catalogues. All local companies can
apply with relevant authorities to have one or several of their products included. Listed items
enjoy preferential treatment in government procurement and may provide buyers with tax
discounts. While a vast majority of companies that has succeeded to add products to the list
are Chinese firms, a number of Sino-foreign joint ventures have managed to include their
manufactures as well. However, the benefits are often unclear as the catalogues themselves
offer no further information on the nature or extent of associated preferential treatment. Local
officials have reportedly promised access to subsidies to companies that make products con-
tained in local catalogues.
Confusion arises also from the fact that the number of such catalogues has increased in re-
cent years. Soon after the NDRC issued the first national product catalogue, the MIIT re-
leased a separate version. Some of China’s 33 provincial level jurisdictions have compiled
their own catalogues as well. Much confusion surrounds the question of how different cata-
logues are ranked or related.
Even though some foreign companies have succeeded in adding environmentally friendly or
energy-saving products to several lists, limitations for non-Chinese enterprises to enter the

© THINK!DESK China Research & Consulting 2015 Seite 125
government procurement market has put into question the value of such accomplishments
(USCBC 2013b at 11. China’s vast government procurement market does provide for power-
ful ways to promote certain products. However, foreign companies have found themselves at
a disadvantage as they typically do not get the chance to supply government agencies.
Finally, foreign companies have to agree to rigorous requirements for basing (and accumu-
lating) their IP in China. To be eligible for subsidies, tax breaks and other measures, technol-
ogies and associated IP must have been developed and/or owned inside the country. Multi-
national companies that manage large and complex IP portfolios as part of an efficient global
operation may thus not qualified if their core IP is registered in a country other than the Peo-
ple’s Republic of China. Restrictions are akin to those applying to HNTEs. The USCBC has
reported that some provincial jurisdiction have gone even further by restricting access to
government support to companies with enterprise and core IP ownership both registered
inside their territory. (USCBC 2013b at 9).
In the new-energy vehicle market, international brands have been excluded from generous
government support. Foreign enterprises are not eligible for subsidies and have long been
left out of pilot demonstration projects. Vehicles sold under foreign brand names do not quali-
fy for purchase premiums or any other type of monetary or non-monetary incentive scheme.
In fact, if Chinese buyers of electric vehicle opt for an overseas product, they have to pay
import tariffs instead of receiving buying subsidies. A change has occurred with regards to
vehicles manufactured under joint venture brands which are the result of transferred technol-
ogy development and shared intellectual property. Cars marketed under new brands, like
Tantus, may take part in government-sponsored fleet trials and provide their buyers with ac-
cess to purchase incentives.
2.2.3.6 SEI Initiative – Market-driven or State-directed?
Celebrated as a landmark project that is meant to represent the foundation of future econom-
ic success, in the eyes of China’s political leadership the fate of SEI has obviously proven too
important to leave it at the hands of market forces. Even though the State Council promised
to
“give full play to the fundamental role of market, […] actively foster market […]
and create a fair and favourable environment for the sound development of vari-
ous types of enterprises”;
at the same time it set out to
“select important technologies and products in the initial stage of industrialization
with remarkable social benefits where the market mechanism cannot function ef-
fectively”.

© THINK!DESK China Research & Consulting 2015 Seite 126
Market forces play a decidedly subordinate role as the state undertakes
“overall development planning. It determines the sequence of developments and
assists selected firms to achieve innovations.”(State Council 2010a).
In order to turn the SEI initiative into reality, government organisations have intervened
strongly, first by injecting significant funds into the development of prioritised technologies
and later as a means to protect their investments.
The State Council (2010a) highlighted to all Chinese government organisations that policies
such as R&D, taxation and human resources should be put to use for development SEI
(ibid). It pledged to “undertake overall planning and systematic layout on the development of
SEI, clarify the sequence of development, and promote coordinated development” (at 2.2).
Through a “basic pattern of healthy development and coordinated progression” (at 3), SEIs
were envisioned to account for eight percent of national GDP and reach 15 percent by 2020
(ibid). At that time, energy conservation, environmental protection, new generation infor-
mation technology, biology and high-end equipment manufacturing industries will have be-
come the pillar industries of the national economy, while new energy resources, new energy
vehicles and new materials industries will have become the pioneer industries of the national
economy. Until 2030, Chinese companies should have completely closed the developmental
gap separating them from the world’s leading actors and function at the vanguard of techno-
logical development (Proff et al. 2012).
In the vision laid out by the State Council (2010a) enterprises should serve as the principal
actors in a market-oriented technology innovation system. They are to work closely with uni-
versities and research institutes in order to accomplish breakthroughs in core technologies. It
follows that corporate R&D is to assume a key role in promoting indigenous innovation and
advancing SEI development. Key enterprises should take the lead in government-sponsored
projects while scientific research institutions and are to universities participate in the imple-
mentation. In the market-oriented technology innovation system the state is called upon to
propel and direct the SEI promotion process.

© THINK!DESK China Research & Consulting 2015 Seite 127
2.2.4 Special Funds for the Revitalisation and Technology Renovation
in Key Industries
The Chinese government has repeatedly emphasised the importance of restructuring and
upgrading traditional industries. Documents frequently call for encouraging and supporting
the development of the real economy. A focus is put on ten key industries for which Adjust-
ment and Revitalisation Programmes were drafted in the wake of the global financial crisis.
These are coal, steel, non-ferrous metals, petrochemicals, equipment manufacturing, light
industry, IT, textiles, ship building and automobile manufacturing. In time with the release of
the ten Programmes, central authorities created the Special Fund for Revitalisation and
Technology Renovation in Key Industries.
In 2010, the fund allocated subsidies worth 20 billion RMB to 5,051 individual projects (NPC
2011a at 1.3). In 2011, the central government provided a total of 15 billion RMB to support
the rejuvenation of key industries (NPC 2012 at 3.5.2). The funds were distributed to support
over 4,000 corporate technology renovation projects (NPC 2012 at 1.4). According to the
2012 resolution of the NPC, the amount was to increase by another billion RMB in that year.
The Special Fund is complemented by an investment plan which specifies priorities for state
investment across sectors. While the plan itself is not available in the public domain, the MIIT
and the NDRC have issued a variety of policies that provide good insights into its contents.
As such, in 2009, the latter released the Administrative Measures (for Trial Implementation)
concerning Investments related to the Revitalisation and Technology Renovation in Key In-
dustries (NDRC 2009a).
The Administrative Measures provide the regulatory framework for additional government
investments made to strengthen key industries both in the form of investment subsidies or
loan interest subsidies. In any case, the maximum amount of government support per project
is limited to 200 million RMB. The document identifies loan interest subsidies as the pre-
ferred instrument and determines that subsidies should compensate for the actual loan inter-
est of two years. The interest rates should not exceed that normally charged by commercial
banks for medium to long term loans (NDRC 2009a at 2). In order to qualify, projects need to
conform to the development priorities laid out in the respective Adjustment and Revitalisation
Programmes.
Applicant enterprises have to possess economies of scale, operate under the “modern en-
terprise system”, have good financial credentials and must not have violated any laws or
regulations. The NDRC and the MIIT jointly receive and review applications. While SOEs
subordinate to the SASAC of the State Council can submit their applications directly to the
two central government bodies, all other enterprises – regardless of ownership – have to file
their applications with provincial level authorities. Upon initial review and approval, the latter
will then forward the application to the NDRC and MIIT (NDRC 2009a at 6).

© THINK!DESK China Research & Consulting 2015 Seite 128
The MIIT clarified that supported projects should aim to improve product quality and raise
technology levels as well as strengthen companies’ abilities for technology renovation and
innovation. The Ministry stipulated that funds distributed under this scheme and other special
support funds managed by the central government should lead to the development of new
projects, new production processes and quality guarantee management safeguards (MIIT
2011 at 2.4).
In the framework of this programme a large number of firms have received governmental
subsidies. These include e.g., Cuihuaji Co., Ltd., a subsidiary of CPI Yuanda Environmental
Protection (Group) Co., Ltd., which in 2010 has got the green light on 10 million RMB in sub-
sidies for purchasing essential production equipment. 8 million RMB were disbursed to the
company in the same year through the Finance Department of Nan’an District (CPI Yuanda
Environmental Protection (Group) Co., Ltd. 2010 AR at 90, 94, 95; 2011 at 76, 81, 83). In
2011, the company received the remaining 2 million RMB (ibid at 105, 106, 113; 2013 at 69,
70, 75). As the underlying project progressed and expenses were made, the 10 million RMB
deferred income subsidy was gradually amortised and converted into profit and loss relevant
subsidy income. At the end of 2014, the remaining balance was 4,916,667 RMB (ibid 2014 at
91, 92, 98).
In the framework of this study, it is not possible to elaborate on the Adjustment and Revitali-
zation Programmes for all ten key sectors. Instead, the shipbuilding industry will be used as a
case study.
Burgeoning foreign trade was led Chinese shipbuilders to vastly expand capacities in order
to keep up with vessel demand. With two large SOEs dominating the industry, i.e. China
State Shipbuilding Co., Ltd, (CSSC) and China Shipbuilding Industries Co., Ltd. (CSIC), in-
vestments and output skyrocketed. The global financial crisis hit the shipbuilding sector
worldwide and exposed severe overcapacities. Declining orders, project cancellations and
intensifying price competition all led to significant financial losses. In order to key shipbuilders
afloat and prevent mass-layoffs, the Chinese government launched a wide array of support
measures through the Adjustment and Revitalization Programme for the sector (NDRC
2009b). These include
low interest loans to help state-owned shipping companies carry out fleet upgrades
and renewals
low interest loans for overseas buyers and improved access to credit for export cus-
tomers
low interest loans to replenish liquidity of ailing ship builders. Bridge loans at prefer-
ential lending rates were provided to maintain normal operations. Special mortgaging
arrangements were introduced to improve credit access for struggling companies
subsidies supporting purchases of China-made ocean going vessels. Until 2012, cus-
tomers could claim government grants worth up to 17 percent of the ship price.

© THINK!DESK China Research & Consulting 2015 Seite 129
On the demand side, the Programme urged the country’s three largest cargo shippers, all
SOEs, to revoke order cancellation and stand by their pre-crisis plans for fleet expansion and
renewal. On the supply side, the Programme called for a regrouping of shipyards to promote
the formation of larger and more competitive players. The government explicitly encouraged
the creation of a shipbuilding juggernaut through the merger of CSSC and CSIC. In spite of
pre-existing structural weaknesses and uncertain demand prospects, the authors of the Pro-
gramme demanded that shipbuilding capacities increase to 50 million deadweight tons be-
fore the end of 2011 (NDRC 2009b; EC 2014 at 174-175).
THINK!DESK research revealed that numerous companies have benefitted from subsidies
disbursed based on the ten Adjustment and Revitalization Programmes, issued in 2009. A
comprehensive overview for listed companies is presented in tables 28 and 29.
Table 28: Total Disbursements of Subsidies for the Adjustment and Revitalization
of Key Industries
2010 2011 2012 2013 2014 Total
90,130,344 109,995,768 58,108,634 49,066,930 62,129,091 369,430,767
Source: Wind Data
Although the Programmes were issued to guide operations and direct investments until 2011,
THINK!DESK research found evidence that subsidy payouts have continued even until 2014.
During that year, at least 45 enterprises have benefitted from government subsidies for the
adjustment and revitalization of key industries. The ten largest recipients are listed in the
following table 29.

© THINK!DESK China Research & Consulting 2015 Seite 130
Table 29: Top 10 Recipients of Subsidies for the Adjustment and Revitalization of
Key Industries in 2014
Rank Enterprise Amount
1 Shenyang Machine Tool Co., Ltd. 7,560,000
2 Tellhow Sci-Tech Co., Ltd. 7,500,000
3 Zhejiang Yongtai Technology Co., Ltd. 5,141,698
4 Tong Oil Tools Co., Ltd. 2,900,783
5 Yunnan Coal & Energy Co., Ltd. 2,365,000
6 Ningbo Donly Co., Ltd. 2,264,800
7 Beijing New Building Materials Public Limited Company 1,960,000
8 Beijing New Building Materials Public Limited Company 1,948,000
9 Shandong Molong Petroleum Machinery Co., Ltd. 1,808,000
10 Jinxi Axle Company Limited 1,657,143
Total 35,105,424
Source: Wind Data
However, these subsidies represent just a small fraction of the sums that have been trans-
ferred to subsidise preferred industries. Enterprises in key or pillar industries have enjoyed
favourable access to public funds. The following table 30 offers a concise overview.
Table 30: Total disbursements of Key Industry Subsidies
2010 2011 2012 2013 2014 Total
Key
Industries 213,983,645 192,777,426 322,407,619 145,653,872 180,272,353 1,055,094,915
Pillar
Industries 1,800,201 950,050 913,000 372,000 575,000 4,610,251
Source: Wind Data
In 2014, a total of 78 companies have received subsidies thanks to the affiliation with pre-
ferred industrial sectors. Remarkably, the government prioritisation extends to the level of
individual firms. Authorities throughout the administrative hierarchy have the discretion to
label preferred companies as Key, Backbone or Dragonhead enterprises. THINKL!DESK
research has not found any universal recognition principles across jurisdictions. Available
information suggests that government organisations do not differentiate much between the

© THINK!DESK China Research & Consulting 2015 Seite 131
three groups but opt for designations on a rather arbitrary basis. This is to say that the three
categories of preferred enterprises are not differentiated by any clear cut criteria. Owing to
significant freedom to select from the general enterprise population, localities mostly favour
high technology companies. The following table 31 presents essential information on the
subsidy receipts of Key, Backbone and Dragonhead enterprises listed on China’s stock ex-
changes.
Table 31: Disbursements of Key, Backbone and Dragonhead Enterprise Subsidies
2010 2011 2012 2013 2014 Total
Key
Enterprises 67,143,698 33,502,909 265,177,953 237,456,194 258,934,215 862,214,969
Backbone
Enterprises 46,911,818 24,193,976 14,496,900 20,873,724 14,750,835 121,227,253
Dragonhead
enterprises 33,005,182 58,131,175 14,343,167 45,515,335 136,066,579 287,061,438
Source: Wind Data
Subsidy income of these companies is not limited to the grants covered by the table as this
list only contains subsidies that were designated especially for the three preferred enterprise
categories.

© THINK!DESK China Research & Consulting 2015 Seite 132
2.2.5 Policies Targeting Green Development
Due to the considerably high demand and consumption of natural and environmental re-
sources in China, the need to adjust the current growth model towards cleaner production
and resource conservation has become a key concern of the government. During the annual
session of the National People’s Congress in March of 2014, Premier Li Keqiang announced
that the government will “declare war on pollution”. At the same venue one year earlier he
stated that he was “quite upset” about the poor air quality in Beijing and other cities. Follow-
ing the Premier’s statements, in spring of 2014, the Environmental Protection Law (NPC
2014) was revised to provide greater powers to environmental protection agencies on all
levels of government. As documented in tables 32 and 33 below, subsidies formally targeted
at environmental protecton have been very substantial in recent years.
Table 32: Total Subsidies for Environmental Protection (2010-2014)
2010 2011 2012 2013 2014 Total
562,302,617 1,912,356,798 914,091,372 1,023,305,815 1,143,105,084 5,555,161,686
Source: Wind Data
Table 33: Top 10 Individual Subsidy Transfers Promoting Environmental Protection
(2010-2014)
Enterprise Year Amount
Hunan Valin Steel Co., Ltd. 2011 860,000,000
Chongqing Iron & Steel Co., Ltd. 2014 280,000,000
Hunan Valin Steel Co., Ltd. 2011 246,000,000
Tsingtao Brewery Co., Ltd. 2012 196,830,544
Tsingtao Brewery Co., Ltd. 2013 168,456,377
Angang Steel Co., Ltd. 2011 132,000,000
Inner Mongolia Eerduosi Resources Co., Ltd. 2011 118,160,000
Tsingtao Brewery Co., Ltd. 2011 93,027,249
Inner Mongolia Eerduosi Resources Co., Ltd. 2010 79,324,268
Zhejiang Haiyue Co., Ltd. 2012 79,020,654
Total (Top 10 subsidy transfers) 2,252,819,092
Source: Wind Data

© THINK!DESK China Research & Consulting 2015 Seite 133
Green development policies have become increasingly prominent as concerns for the envi-
ronmental protection have grown. The central government is the main driver pushing for
higher emission standards, lower tolerance for violations and increased supervision. Local
governments are more immediately confronted with the economic fallout from continuously
rising green performance benchmarks. They have to compensate the adverse social and
economic consequences when forced plant closures lead to layoffs or reductions in econom-
ic activity. Furthermore, the coincidence of a reduction in tax revenues and an increase in
social welfare spending creates important incentives to protect plants that are harmful to the
environment and operate in violation of national standards.
Since the Chinese environmental policy framework was fleshed out by a large number of
laws and regulations, cities, districts, counties and township governments have proved highly
adept at skirting the rules. At first glance, planning and regulatory documents are replete with
mention of these topics. Goals are formulated and concrete targets are set, both derived
from respective documents of the central, or next higher level of government. As well, there
is by no means a shortage of measures, some of which highlight the local authorities creativi-
ty on how to encourage green growth.
Until at least 2012, concealing the existence of local polluters was a common practice. Not
reporting such companies to higher level authorities offers two important benefits. On the one
hand, the enterprise in question can be spared significant expenses for, e.g. installing parti-
cle filters against air pollution. On the other hand, incomplete statistics understate pollution
problems and overstate environmental performance for the jurisdiction as a whole. As eco-
logical indicators have been included and play an increasing role in the key performance
indicators used to evaluate government officials, concealing dirty operations is beneficial for
personal career advancement.
However, detection risks have increased significantly during the 12th FYP period (2011-2015)
as environmental protection departments have added staff and resources to carry out more
frequent inspections. At the same time, public discontent with heavy smog, polluted water
and contaminated soil – to name only a few ecological crises – has become more vocal. As
the long term consequences of excessive pollution become visible in the form of health de-
fects and other ways, acceptance of pollution has waned. Official complaints and mass pro-
tests have increased in number. In light of these developments, concealing the dirtiest com-
panies has become a lot harder. As a consequence, local governments have stepped up
their subsidization of environmental protection projects. How to alleviate the cost burden of
companies has become a vital component of state-firm interaction on the local level.
This practice has the added benefit that ecologically motivated grants appear less objection-
able than cash injections for, e.g. increasing output volumes. Anecdotal evidence suggests
that in no few cases, subsidies intended to green plant operations have been used for other
purposes, like maintaining liquidity in times of negative cash flows. Even where environmen-
tal protection grants are applied as intended, effects are rarely limited to the shrinking the
ecological footprint. Instead, projects may involve equipment upgrades that increase produc-

© THINK!DESK China Research & Consulting 2015 Seite 134
tivity, lower costs, boost output, improve quality levels or improve the product line up.
Chongqing Iron & Steel Co., Ltd. is a case in point. Between 2012 and 2014, the company
received 2.5 billion RMB for an environmental relocation. While it can be argued that remov-
ing blast furnaces from the vicinity of residential areas is in and of itself environmentally sen-
sible, the new plant set up in a more remote part of the city features some of the most ad-
vanced production equipment available worldwide. Clearly, the move has allowed – and co-
financed – a comprehensive technology upgrade for the overall benefit of the company.
Local government budgets now include special funds for pollution prevention and clean-up. A
wide array of environmental awards and prizes are handed out based on locally defined and
mostly intransparent standards. At the same time support measures for companies are also
heavily relying on tax incentives. For example, the provincial government of Shandong states
that tax incentives will be implemented to put energy saving economic policy into practice.
Income tax and value added tax are to be reduced by increasing the deductions of expenses
on projects relating to the comprehensive utilization of resources, energy-saving equipment
and other environmental protection.
Tax preferences have also been implemented by the central government and at the provin-
cial level for the sake of promoting resource conservation. Sichuan and Shandong are prom-
inent cases where the local administration sought to increase the reuse and recycling of
waste.
The 2008 Enterprise Income Tax Law was superimposed on these provisions as a guidance
framework. It states that
“revenues from the manufacture of products that are consistent with national in-
dustrial policy and involve the synergistic utilization of resources maybe reduced
when calculating taxable income” (NPC 2007b at 33).
The Implementation Rules for the Enterprise Income Tax Law (State Council 2007b) outline
the conditions under which companies may obtain tax benefits. They specify that an enter-
prise can take into account 90 percent of the revenues from the resources identified in the
Catalogue of Preferential Enterprise Income Tax Treatments for the Synergistic Utilization of
Resources (MIIT 2008), e.g. metallurgical slag). This applies to the production of goods that
are not restricted or prohibited by the state and that are in line with the relevant national and
industrial standards (State Council 2007b at 99).
Since the early 2000s, the Chinese government has issued several laws that aim to protect
the environment. Almost all of these documents promise preferential treatments for compa-
nies meeting certain criteria. The following list provides an overview of support measures in
selected laws.

© THINK!DESK China Research & Consulting 2015 Seite 135
Environmental Protection Law of the People’s Republic of China (NPC 2014c)
Government organisations at all levels are ordered to devote more financial re-
sources to the protection and improvement of the environment as well as the preven-
tion and control of pollution and other public nuisances (at 8).
Government authorities are called up to reward entities and individuals for outstand-
ing performance in protecting and improving environment (at 11).
Government organisations are required to adopt policies and measures in finance,
taxation, price, and government procurement, among others, to encourage and sup-
port the development of green industries, like equipment for environmental protection
and environmental services (at 14).
The state is to adopt policies and measures in finance, taxation, price, and govern-
ment procurement, among others, to encourage and support a continuous reduction
in pollutant discharge of enterprises, public institutions, and other businesses that go
beyond statutory requirements (at 22).
Energy Conservation Law of the People’s Republic of China (NPC 2007c)
Special energy conservation funds are to be established drawing on resources from
central and local governments. Funds are to support R&D on energy conservation
technologies, the demonstration and popularization of energy conservation technolo-
gies and products, the implementation of key energy conservation projects and other
measures (at 60)
Tax breaks and other support policies are to be provided in order to promote energy
conservation technologies and products. The State supports the popularization and
use of energy-saving lighting instruments and other energy-saving products through
financial subsidies (at 61).
Tax policies are to be adjusted in order to help conserve energy resources mineral
resources through improving exploitation and utilization capabilities (at 62).
Tax policies and other instruments are to be employed to encourage the import of ad-
vanced energy conservation technologies and equipment. The export of energy and
pollution intensive products is to be restricted (at 63).
Products and equipment that have been certified as energy-saving should receive
priority treatment in government procurement plans.
Financial institutions are ordered to increase credit support to energy conservation
projects. They should provide discount loans to qualified projects conducting R&D on
energy-saving technologies and manufacturing energy-saving products. Furthermore,
the State encourages and guides relevant social funding to invest in energy-saving
projects and speed up technology progress (at 65).
Government departments are tasked to implement price policies favourable to energy
conservation and guide energy consuming entities and individuals to conserve ener-
gy. The State adopts finance, tax, price and other policies to support the populariza-
© THINK!DESK China Research & Consulting 2015 Seite 136
tion of power demand side management, contract energy management, voluntary
energy conservation agreements and other energy conservation measures (at 66).
Authorities at all levels are called to praise and award entities and individuals that
have made outstanding achievements in energy conservation management, re-
search, popularization and application (at 67).
Circular Economy Promotion Law of the People’s Republic of China (NPC 2008b)
The State Council and provincial level governments are tasked to set up special
funds for the development of circular economy in order to support R&D on relevant
technologies, the demonstration and promotion of relevant products, the implementa-
tion of important circular economy projects and complementing information services.
The specific measures shall be formulated by the MOF and other central government
bodies (at 42).
The State Council and provincial level governments are to incorporate the develop-
ment, commercialization, demonstration and application of key green technologies in
their respective development plans for high-technology industry. Furthermore, they
should allocate financial resources to support the implementation of these measures.
Entities using public funds for the development of key circular economy technologies
or equipment have to submit a detailed plan for the digestion, absorption and innova-
tion to supervising government department. The latter will review the plan and – in
case of approval - oversee its implementation. The department are to offer financial
support (at 43).
Government organizations on all levels are tasked to offer tax preferences to industri-
al activities promoting the development of circular economy, and use tax measures to
encourage the import of advanced energy-saving, water-saving and material-saving
technologies, equipment and products. They are also order to limit the export of en-
ergy and pollution intensive products. Enterprises using or producing technologies,
techniques or products listed in the Catalogue of Clean Production, the Catalogue of
Synergistic Utilization of Resources or any other encouraged catalogue are to enjoy
tax preferences in accordance with relevant state provisions (at 44).
Financial institutions are provide credit support for energy-saving, water-saving, land-
saving and material-saving projects as well as projects for the synergistic utilization of
resources that are in line with industrial policies. No financial institution may provide
any form of credit support to enterprises that produce, import, distribute or use any of
the technologies, techniques, equipment, materials or products listed in the “eliminat-
ed” category of catalogues (at 45).
Price policies are to contribute to the conservation and reasonable utilization of re-
sources in order to guide entities and individuals to save water, electricity, gas and
other resources. Government departments tasked with price administration shall ap-
ply restrictive price policies to the restricted items in industries of high resource con-
sumption.

© THINK!DESK China Research & Consulting 2015 Seite 137
Commodity pricing departments are to determine favourable on-grid power prices for
power generation projects that utilize waste heat, waste pressure, coal bed gas, coal
slack, coal slime, refuse and other low-calorie fuels (at 46).
Government procurement policy should be supportive of the circular economy. Enti-
ties and individuals purchasing goods with public funds are to give preference to en-
ergy-saving, water-saving, material-saving and environment-friendly and recycled
products (at 47).
Government organisation at or above the county level are to reward entities and indi-
viduals that have made great contributions to the management, research, develop-
ment, demonstration and promotion of the circular economy (at 48).
Renewable Energy Law of the People's Republic of China (NPC 2009)
A special fund dedicated to the development of renewable energy is to be established
drawing on finances from annual special-purpose funds of the central government
budget and revenues from differential electricity pricing. The mission of the fund was
outline as promoting scientific research, formulating technical standards and organis-
ing demonstration projects. As a key source of financing in the field of renewable en-
ergy, the fund is envisioned to support a large variety of related purposes (at 24).
Financial institutions may offer discount loans for renewable energy development and
utilization projects contained in the renewable energy industry development guidance
catalogue and meeting basic credit requirements (at 25).
Preferential tax policies are to be put in place to support projects listed in the renewa-
ble energy industry development guidance catalogue (at 26).
Cleaner Production Promotion Law of the People’s Republic of China (NPC 2012b)
The government is tasked to set up a cleaner production commendation and award
system. Authorities on all levels of the administrative hierarchy shall commend and
grant awards to entities and individuals with outstanding performance in cleaner pro-
duction (at 30).
Government administration at or above the county level are ordered to provide finan-
cial support for cleaner production research, demonstration, and training. Funding is
to be made available for the implementation of key national technical improvement
projects for cleaner production and technical improvement projects under agreements
on voluntarily conserving resources or reducing discharge of pollutants (at 31).
Enterprises using waste or raw materials reclaimed from waste as inputs shall enjoy
tax preferences (at 33).
In 2010, the MIIT, the MOF and the MOST have launched a joint initiative to guide, support
and monitor 121 manufacturing enterprises from nine different industries in becoming re-

© THINK!DESK China Research & Consulting 2015 Seite 138
source-saving and environmentally-friendly companies. Designated as “two type enterprises”
the companies were to strictly comply with environmental policies and make every effort to
improve their ecological performance. As pilot enterprises, the group was to try out bench-
marking standards for different industries and experiment with different supervision and mon-
itoring methods. The three central government bodies, in turn, pledged to grant preferential
support to the pilot enterprises in the field of energy conservation, clean production, compre-
hensive resource use and other major technology innovation and renovation projects. Ac-
cording to the outline document, government organizations at all levels were tasked to offer
their assistance where needed (MOF, MIIT and MOST 2010). The move is important as pilot
enterprises were predominantly anchored in heavy industry. The selection included most of
the leading producers in sectors like steel, aluminium, cement and petrochemicals. As such,
the list is dominated by large SOEs – many of them owned by the SASAC of the State Coun-
cil. After initial evaluations came back positive, a second batch of companies was added in
2012 (MIIT, MOF and MOST 2012).
One example for a specific programme under the general theme of “green policies” constitute
the so Demonstration Bases for the Synergistic Utilisation of Resources. Enterprises located
inside these bases have to comply with high standards for resource reuse and waste recy-
cling. However, they may benefit from substantial subsidies that help alleviate the cost pres-
sures. In 2011, the MOF and the MLR jointly released the Notice concerning the Construc-
tion of Demonstration Bases for the Synergistic Utilisation of Mineral Resources (MOF and
MLR 2011a). The new scheme targeted seven industrial sectors: (1) oil and gas, (2) coal, (3)
ferrous metals, (4) non-ferrous metals, (5) rare earth elements, (6) non-metals, and (7) ura-
nium. In September of that year, both ministries released the first batch of 40 companies that
were approved to participate in the scheme (MOF and MLR 2011b).
One of them is Jinduicheng Molybdenum Co., Ltd. Between 2011 and 2014, the company
has received a total of 400 million RMB in subsidies. The transfers are registered as deferred
income under non-current liabilities. As the company engages in research and business ac-
tivities covered by the scope of the scheme, the amount is gradually used for expenditures
and thus converted into profit and loss relevant subsidies (Jinduicheng Molybdenum 2011
AR at 104; 2012 at 103; 2013 AR at 102; 2014 AR at 88).
Another example is the Aluminium Corporation of China (Chalco). The subsidiary selected
for participation specialises in the utilisation of low grade bauxite in Guangxi Zhuang Auton-
omous Region. The funds are treated and booked in the same fashion as is the case with
Jinduicheng Molybdenum. Unfortunately, Chalco’s annual reports do not show additions and
deductions of individual items in the deferred income category. Consequently, the extent of
subsidisation is hard to determine. The largest balance was registered for the end of 2012 at
a level of 160 million RMB, indicating that the company has received at least this much
(Chalco 2011 AR at 133; 2012 AR at 149; 2013 AR at 175; 2014 AR at 146).

© THINK!DESK China Research & Consulting 2015 Seite 139
THINK!DESK has found that Chinese companies have received substantial subsidy transfers
in the name of synergistic resource utilisation. The following tables 34 and 35 provide an
overview.
Table 34: Total Disbursements of Subsidies for the Synergistic Utilisation
of Resources
2010 2011 2012 2013 2014 Total
851,466,091 1,585,687,113 1,479,414,484 2,192,474,052 2,622,857,739 8,731,899,479
Source: Wind Data
In 2014, at least 108 companies have obtained subsidies for various projects in the context
of synergistic resource utilisation. 355 million RMB were granted specifically companies rec-
ognised as demonstration bases. The ten largest recipients are listed in the following table
35.
Table 35: Top 10 Recipients of Subsidies for the Synergistic Utilisation
of Resources in 2014
Rank Enterprise Amount
1 Tangshan Jidong Cement Co., Ltd. 440,031,000
2 Anhui Conch Cement Company Limited 325,798,915
3 Henan Tongli Cement Co., Ltd. 202,443,726
4 Ningxia Building Materials Group Co., Ltd. 196,515,925
5 Xinjiang Tianshan Cement Co., Ltd. 189,174,599
6 Huaxin Cement Co., Ltd. 171,117,755
7 China Gezhouba Group Company Limited 156,852,647
8 Hunan Valin Steel Co., Ltd. 131,437,587
9 Henan Yuguang Gold&Lead Co., Ltd. 101,240,157
10 Jiangxi Wannianqing Cement Co., Ltd. 89,387,579
Total 2,003,999,890
Source: Wind Data
The central government also maintains and manages a special fund for handing out prises
for supporting conservation and comprehensive utilisation of mineral resources. Companies
seeking to become eligible for subsidies paid out of this fund have to seek support from pro-
vincial level authorities first which will then make the application with the central government.
© THINK!DESK China Research & Consulting 2015 Seite 140
For example, Binchang Mining, a subsidiary of Shaanxi Coal Co., has received 8 million
RMB out of this facility from the central government. The funds disbursed through the Fi-
nance Department of Shaanxi Province were earmarked for technology renovation and R&D
projects seeking to increase the recovery rate of ores and improve the efficiency of the
dressing process (Shaanxi Coal 2013 AR at 180).

© THINK!DESK China Research & Consulting 2015 Seite 141
2.2.6 Subsidies from Special Funds for Infrastructure Construction
Both central and provincial governments provide major companies in supported industries
with special funds for constructing basic infrastructure. The allocations are made from special
funds dedicated to compensate companies for infrastructure related expenses. The firms
benefitting from such subsidies register them as deferred income under other non-current
liabilities until construction of the infrastructure projects in question is complete. During that
time, the amount is gradually reduced as expenses for buildings and equipment are made.
In 2011, Baotou City Xibao Baowei Medical Systems Co., Ltd., a subsidiary of Northern Rare
Earth, received 13 million RMB from the central government. The funds were dedicated to
help the company commercialise its research results in MRI technology and set up a produc-
tion line capable of manufacturing 300 MRI machines per year. Another 3 million RMB were
contributed by the government of Inner Mongolia Autonomous Region to procure and install
relevant instruments (Baotou City Xibao Baowei Medical Systems 2011 AR at 126).
In 2012, Tongchuan Mining Co., a subsidiary of Shaanxi Coal Co., Ltd., received 53.7 million
RMB from the central government’s fund in order to establish emergency response teams.
Another 10 million RMB were awarded to the same subsidiary for construction of a road. As
work on that road had already been complete by the time of the transfer, it was considered a
subsidy. In the same year, Huangling Mining Co., another subsidiary received 6 million RMB
for dealing with a ground settlement resulting from underground mining. However, the project
had already been concluded before the transfer so that the funds were booked as subsidies
(Shaanxi Coal 2013 AR at 179).
Another one of Shaanxi Coal’s subsidiaries was awarded 4.13 million RMB in order to con-
duct geological research and exploration work on coal deposits (Shaanxi Coal 2013 AR at
180).
Two subsidiaries of Yangquan Coal Co. received a total of 7.84 million RMB to fund con-
struction and renovation works on two coal dressing plants (Yangquan Coal 2010 AR at 122).
In 2012, both projects were completed and put into operation. As a consequence, the subsi-
dy funds which were initially registered as deferred income under non-current liabilities were
amortised based on the expected useful lifetime of the plants. Annual amortisation became
profit and loss relevant subsidies (Yangquan Coal 2012 AR at 123; Yangquan Coal 2013 AR
at 120; Yangquan Coal 2014 AR at 109).

© THINK!DESK China Research & Consulting 2015 Seite 142
2.3 Industry Associations as Hybrid Institutions Straddling Government
Bodies and the Corporate Sector
China’s industry associations differ significantly from the standard concept of the role and
functions of industry associations are supposed to fulfil in market economies, as understood
in the OECD framework. They are not restricted to representing the interests of their respec-
tive industries and member firms vis-à-vis the government and other market participants. In
addition, Chinas industry associations also double as spokespersons for government policies
and interests and take over regulatory functions from government. As already documented
above, in these organisations the borderlines between “the regulated” and “the regulator”
become blurred.
In order to understand the specific characteristics of China’s contemporary industry associa-
tions, it is necessary to look back in time to the very design of China’s central command
economy in the 1950s. With the dissolution of private property of productive assets and – in
line with socialist ideology – the transfer of the means of production to ownership by “all peo-
ple” a constellation was created where the CPC and the Chinese government started to ex-
ercise ownership rights and manage production across the economy. Industrial units now
operated as productive arms of the national government and were subordinate to different
line ministries based on their industry affiliation. Under the central command economy, both
inputs and outputs of production were part of material balances compiled by the State Plan-
ning Commission (SPC). In a bottom-up process, the Commission collected and processed
relevant information that was handed to it by the line ministries. After weighing the political,
social, economic and military priorities specified by the senior leadership, the SPC defined
output targets for individual units and allocated certain inputs to be used in the production.
The latter represents a top-down approach that is commonly believed to be a source of great
power for the SPC. In fact, the Commission was in a reasonably weak position as (the quality
of) its work depended entirely on (the quality of) information fed to it after filtering through
multiple administrative layers. As such, the line ministries which presided over specific indus-
tries enjoyed a strong position by bridging the gap between planning and production.
Although this concept of line ministries may sound like a thing from the distant past, the last
remaining body was dissolved not any earlier than in 2013. The abolition of the Ministry of
Railways, after the discovery of a massive corruption scandal, marked the end point to a pro-
cess that had started twenty year earlier. In 1998, several central line ministries were down-
graded to bureau status, and staff levels were reduced. Five years later, the remaining cen-
tral line ministries – with the sole exception of the railway ministry – were dissolved. Those,
that had become bureaus in 1998 were now deprived of their government status and con-
verted into business associations. Taking the steel industry as an example, the Ministry of
Metallurgical Industry was demoted to the Bureau of Metallurgical Industry in 1998 and then
transferred into the China Iron and Steel Association (CISA) five years later. The created
associations were tasked to act as liaison between the government and respective business
sectors. Their main responsibilities included data collection (taking over roles of the National

© THINK!DESK China Research & Consulting 2015 Seite 143
Bureau of Statistics (NBS)), consultation services and the development of industry standards
as well as the enforcement of policy implementation through maintaining industry discipline.
Originating in the central command economy, industry associations were tied to the state-
owned enterprises they had previously controlled for years or even decades. This legacy
implied a serious disconnect with the private sector which had grown rapidly during the re-
form era. Consequently, such associations cannot be regarded as representing the interest
of their respective industry as a whole. Even after having suffered a series of administrative
downgrades and the loss of government authority, industry associations are powerful play-
ers. Reminiscent of their initial role as linchpins of central planning, they now connect state-
owned enterprises with the central government charged with industrial oversight and policy-
making.
In the late 1990s, then Premier Zhu Rongji introduced a consultation mechanism to include
industry associations in the policymaking process under the general leadership of the SPC.
This approach was of course welcomed by associations, as it offered them a seat the table
for drafting industrial policy. The institutional set-up, however, is not supportive to the inter-
ests of private companies who do not have a voice in consultation mechanisms of the central
government and can only seek to influence policymaking on sub-national levels. It is unclear
if the central government is unprepared or unwilling to allow greater participation of organ-
ised private business interest into this system which evolved as integral part of the state sec-
tor (Shih, 2015). Wei (2008) suggests that the SOE-dominated associations seek to monopo-
lise their position as the only qualified representatives for their respective industrial sectors.
Today there exist 16 industry associations which have grown out of the now defunct line min-
istries. These 16 industry associations are active on the central level, forming umbrella or-
ganisations for 313 smaller federations from across the manufacturing sector. These 313
sub-ordinate federations used to be departments of the very line ministries, which lead them
now in the shape of industry associations.
© THINK!DESK China Research & Consulting 2015 Seite 144
Box 4: The China Iron & Steel Association (CISA)
The China Iron and Steel Association (CISA) is nominally the lobbying arm of China’s steel
industry vis-à-vis the government and other market participants. In reality, however, CISA
stands in the middle between being a lobbyist for industry and a spokesman for government.
CISA has not been founded as a bottom-up initiative by the Chinese steel industry but is
rather a successor organisation of the no longer existing branch ministry for the steel indus-
try. As such CISA has not only inherited the office buildings of the Ministry of Metallurgical
Industries, but also most of its staff und administrative tasks. Formally registered as a non-
profit-organisation, CISA is therefore not only representing the interests of the Chinese steel
industry vis-à-vis other (mostly foreign) market participants, but also exclusively collects
statistical data for the Chinese steel industry (in this function CISA acts in the name of and
for the Chinese National Bureau of Statistics), prepares and coordinates industry develop-
ment guidelines and technical standards, etc.
The semi-governmental role of CISA becomes obvious in the Association’s substantial en-
tanglement in the design and execution of regulatory measures:
– CISA has been entrusted with the supervision and coordination of all import/export
activities of the industry including the administration of value added tax rebates for
steel exporters.10
– In the Circular on Controlling of Total Output, Eliminating of Obsolete Capacity and
Accelerating Structural Adjustment in the Steel Industry, from.2006, CISA is mandat-
ed to ensure that all the various policies outlined in the Iron and Steel Industry De-
velopment Policy (NDRC 2005a) will be implemented as well as to prevent disorderly
competition in and blind development of the industry.
– Since 2005, CISA has not only taken an active part in the definition of the require-
ments Chinese enterprises would have to meet in order to qualify as iron ore import-
ers. In the campaign to reduce the number of then 523 iron ore importers and curb
“blind competition”, i.e. install an iron ore import cartel, CISA has also taken up the
role of checking the qualifications of the importers and determining those enterprises
which would lose their import licenses.11 Steel enterprises wishing to obtain an iron
ore importing license are obliged to formerly report both to CISA and the China
Chamber of Commerce of Metals, Minerals & Chemicals Importers & Exporters
(CCCMC) in how far they comply with the requirements.
– In 2006/7 CISA executive vice president Luo Bingsheng declared that his organisa-
tion would have a say – i.e. veto right – in the approval of M&A transactions involving
foreign steel producers.
How close the relationship between the government and CISA still is may also be seen in
10
Such reported in the outline of the organization’s role and function on the official CISA website. See also WTO 2005, paragraph 5.
11 The number of qualified iron ore importers was cut to 118 in 2006 and 90 in 2007.

© THINK!DESK China Research & Consulting 2015 Seite 145
the continued usage of the internet address belonging to the former Ministry of Metallurgical
Industries, http://www.mmi.gov.cn by CISA. Up to the present day CISA continues to update
the webpage – classified as a government webpage by the suffix “.gov.cn” – with steel in-
dustry relevant news and information.
While not being adequately represented by these 16 line ministries-turned-industry associa-
tions, the private sector is organised in the All China Federation of Industry and Commerce.
(ACFIC). ACFIC, however as well is a bottom-up lobbying organisation by name only. The
Federation rather stresses its function as an agent of the CPC and government. On its
homepage it outlines its self-understanding as follows:
“Established in 1953 under the leadership of the Communist Party of China, the
All-China Federation of Industry and Commerce (ACFIC), also known as the All-
China General Chamber of Industry and Commerce (ACGCIC), is a group of the
masses and a chamber of commerce oriented toward the business circle and
with the enterprises and personages of the non-public economy as its main enti-
ty. It is a channel for the CPC and the government to liaise with the personages
of the non-public economy, and an aide of the government in administering and
serving the non-public economy. The work of ACFIC is a key component of the
CPC’s united front and economic work. The cause of ACFIC is an important part
of Socialism with Chinese characteristics.” (ACFIC, n. d.).

© THINK!DESK China Research & Consulting 2015 Seite 146
Box 5: China Chamber of Commerce of Metals, Minerals and Chemicals Importers and
Exporters (CCCMC)
The China Chamber of Commerce of Metals, Minerals and Chemicals Importers and Ex-
porters (CCCMC), founded in 1988, served to coordinate exports in the metallurgical indus-
try and improve their competitiveness in world markets. Today the chamber defines itself as
a comprehensive service provider to its member (CCCMC 2010). But CCCMC does not con-
form to the Western understanding of industry associations as being platforms. Instead,
CCCMC has assumed some regulatory power from the MOFCOM to support the implemen-
tation of their industrial strategies and engage in active supervision. As such, CCCMC is
under the authority of MOFCOM and acts on its behalf. Several sub-organisations are in
charge of coordination activities regarding various commodities, such as coke and zinc
(USA 2010). These units are authorised to audit member companies to assess their compli-
ance with coordination programs and set penalties for violators.
According to the self-introduction found on the CCCMC website, services include:
“coordination service in metals, minerals, chemicals exports, coordination ser-
vice in bidding commodities, organisation service at the Chinese Export Com-
modities Fair, organizing response to anti-dumping lawsuits, verifying export
prices for customs clearance , Internet information service, overseas exhibition &
training service” (CCCMC 2010)
Export price coordination, i.e. enforcing a minimum price for exports, serves to restrict out-
flows and at the same time maximise returns of such transactions on the national level. In
2014, a WTO panel on Chinese export restraints for coke, zinc and other raw materials con-
firmed this and determined that
“the authority to coordinate export prices and enforce these prices through the
imposition of penalties on exporting enterprises, or on export licensing entities
that issue licences to exporters that do not follow the coordinated export prices,
amounts to a requirement to coordinate export prices for the raw materials at is-
sue. The requirement derives from the fact that failure to comply with the coordi-
nated price will result in punishment that rises to a level to prevent an enterprise
from exporting altogether. In addition, under the measures at issue, export li-
censing entities may be punished for failing to enforce a given coordinated price.
The measures do not permit exporting enterprises to deviate from coordinated
export prices, or otherwise grant discretion to export licensing agencies to make
exceptions. Thus, coordinated export prices must be adhered to whenever set
by the CCCMC.” (WTO 2011a at 7.1064).
In the course of the dispute settlement process, Chinese authorities acknowledged they had
delegated the authority for export price coordination to the Chamber. The officially sanc-

© THINK!DESK China Research & Consulting 2015 Seite 147
tioned mechanisms for setting binging export prices and sanctioning non-compliant traders
implied that CCCMC acted as part of the government.

© THINK!DESK China Research & Consulting 2015 Seite 148
2.4 The Role of Markets in the Chinese Economy
The litmus-test for the existence of a market system is the prevalence of prices that truly re-
flect relative scarcity, i.e. the relation between demand and supply of the factors of produc-
tion as well as goods and services, based on the preferences of all individuals in an econom-
ic community. In a well-functioning competition-based market economy, scarcity-based pric-
es are responsible for the allocation of the resources available in an economy as well as the
economic selection of investments and products.
Since the start of economic reforms in the late 1970s China’s policy makers have gradually
increased the scope that markets and supply-and-demand determined prices are allowed to
play in the national economy. However, even though prices are beginning to have a role, the
extensive network of planning documents and governmental guidance, prices are still not
allowed to play a decisive role for the coordination of economic activity in most areas of the
Chinese economy. Comparing various segments of the Chinese economy, it can be seen
that prices do have an increasing role for consumer goods. However, the further up the value
chain the analysis advances, the more restricted the role of markets and prices becomes.
The prices of raw-materials and basic inputs to the production process continue to be strictly
controlled and guided by the Chinese state and do not fully reflect the true degree of scarcity
in the economy. And with regard to the allocation of the factors of production, i.e. capital,
labour, and land, scarcity-based market prices eventually play only a subordinated role, be-
ing more or less entirely overshadowed by discretionary interventions of government bodies
in the allocation process (Huang 2010a, Chen 2014).
This chapter looks at the role of scarcity-based market prices play in various segments of the
Chinese economy in greater detail. Starting with the function of prices for the allocation of the
factors of production, namely capital, labour and land, in section 2.4.1, the chapter then ex-
amines the role prices in the markets for raw materials, intermediate inputs and final goods in
section 2.4.2. In 2.4.3 the analysis goes a step further and focuses on some specific com-
plementary market institutions that have to be in place in order to make the competition
based pricing system work correctly.
2.4.1 Markets for Factors of Production
Constituting the elementary inputs to any economic activity, the factors of production provide
maximum leverage for governmental bodies intending to steer the economic process towards
pre-determined outcomes. As such government interventions are most pronounced in this
segment of the economy and drive market forces back to subordinated functions. In addition
to discretionary steering mechanisms and governmental interventions in the national econo-
my’s factor allocation, as being documented in chapters 2, 4, and 5 of this report, govern-
ment bodies are also intervening in the price building process at the existing markets. The
following overview highlights the most important features.
© THINK!DESK China Research & Consulting 2015 Seite 149
In the Chinese capital markets the price signals generated on the markets are subjected to
government induced distortions first of all due to a repression of interest rates and a manipu-
lation of the exchange rate. Both factors result in a constellation where capital is made avail-
able at too low prices and is utilised excessively by those having access to the formal finan-
cial system – which are China’s state-owned enterprises and those actors upholding close
relationships to local government agencies. According to calculations by IMF staff this has
resulted in an investment ratio ten percentage points above its equilibrium value and costs to
the economy in a range of about four percent of GDP per year (Lee, Syed and Liu 2012,
Geng and N’Diaye 2012).
The price of labour continues to hover below its “fair” value due to an expressed low wage
policy by Chinese government – at least until the recent initiative to boost domestic con-
sumption –, highly immature wage bargaining processes and the household registration sys-
tem (hukou) which prevents the constitution of a unified national labour market by effectively
discriminating against labour originating in rural areas. These factors plus an inconsequential
enforcement of social security systems result in a situation where firms are allowed to ac-
quire labour with lower skill levels at bargain prices and expand business models making
extensive use of such labour input.
Chinese land markets feature even higher degrees of distortion as on the one hand prices
for commercial land use rights (LUR) are pushed up by local governments in order to gener-
ate high revenues from land sales. While on the other hand inter-jurisdictional competition for
industrial investments pushes prices down for corresponding land uses. As such industrial
LUR have been featuring much lower price increases (multiplied by a factor of 1.55 between
2000 and 2013) than LUR for commercial land (multiplied by a factor of 6.7) and residential
land (multiplied by a factor of 4.5) (Chen 2014). As a result the allocation of land becomes
removed from the true (national) economic necessities and rather favours industrial business
models requiring large stretches of land.
The greatest distortions but in recent years also greatest improvements have been achieved
with respect to the pricing of nature, which economists have in recent years leaned to in-
clude in the concept of “land” as an elementary factor of production. After decades of reck-
less growth-fetishism, the wish to contain the ongoing degradation of natural environments
and attach a price to environmentally hazardous business activities has eventually become a
major driver of social activism and elite policy making. As such the distortions resulting in an
over-utilisation of natural environments are continuously being dismantled allowing for a bet-
ter allocation of these resources.
The total costs these multifaceted distortions in the allocation of resources convey to the
Chinese economy as a whole can only be estimated. Huang and Tao (2011) estimate the
aggregate costs arising from the governmental interventions in the factor markets to lie in the
range of about 10 percent of Chinese GDP each year during the first decade of the 21st cen-
tury.

© THINK!DESK China Research & Consulting 2015 Seite 150
At the same time that these costs are being created in the Chinese economic system – and
are predominantly born by the Chinese consumers – specific industries and individual firms
are standing to profit from this nation-wide phenomenon of distorted factor prices. Further-
more, in addition to these generally manipulated price levels some players can be shown to
profit from even more beneficial conditions which are the result of discretionary interventions
in allocation processes by local governments. In the following this report looks in more detail
at the benefits various industries and specific players have been able to receive from gov-
ernmental interventions in the capital and land markets.
2.4.1.1 Capital Markets
Institutional reorganisation of China’s financial system started comparatively early in the re-
form process. An interbank money market was set up in the 1980s and stock exchanges
opened in the early 1990s while a bond market followed in the early 2000s. In 1983, com-
mercial banking functions were devolved from the People’s Bank of China and shifted to four
state-owned banks. These were transformed into state-owned commercial banks (SOCB) in
1994 as policy related activities were transferred to three dedicated policy banks. The Com-
mercial Bank Law, issued the following year cleared legal and organisation issues to estab-
lish a comprehensive regulatory framework. The China Banking Regulatory Commission was
created in 2003 to supervise the banking industry and improve its performance. Corporate
governance reforms of all major state-owned commercial banks were carried out to allow for
stock market listings of these institutions in the 2000s. Foreign banks have been allowed to
operate in the country since the mid 1980s, but their services were initially limited to foreign
clients in special economic zones and coastal open cities. Market access expanded gradual-
ly and made significant progress after China joined the WTO. However, significant re-
strictions for foreign financial institutions remain in place.
Since the global economic crisis, financial market reform has accelerated but progress only
came in small doses. The breadth and depth of financial markets increased substantially.
China’s stock and bond markets grew to become second and third largest in the world in
2014 (Bloomberg 11.03.2014). Regulation of both markets does not reflect the spirit of free
markets but is influenced by sectoral industrial policy considerations. The China Securities
Law (NPC 2014a) still maintains that
“The state encourages the listing of corporate stocks that comply with the rele-
vant industrial policies and meet the relevant requirements of listing” (at 51).
The law also stipulates that
“the investment of raised funds must comply with the industrial policies of the
state” (NPC 2014a at 16.4).

© THINK!DESK China Research & Consulting 2015 Seite 151
According to research by J. P. Morgan (2014), the Chinese banking sector covers 140 trillion
RMB in deposits spread out over 1 billion customers of about 2,500 individual banking institu-
tions. The industry landscape has changed substantially during the reform era and now in-
cludes state-owned commercial banks, privately-owned joint-stock banks, municipal and ru-
ral commercial banks, various types of credit cooperatives, a postal savings system and for-
eign bank branches.
Commercial banks are no longer bound to treat deposits and loans strictly based on the
PBoC’s benchmark interest rates. Put in place in order to guarantee China’s – pre-
dominantly state-owned – banks comfortable profit margins, it also caused systemic prob-
lems as it limited the space in which banks can compete with one another. Furthermore,
banks naturally sought out the lending clients with the lowest risk profile, i.e. state business-
es and government-backed projects. Privately-owned companies and those with riskier busi-
ness models were practically excluded as clients (WSJ 26.03.2015). Eventually, the PBoC
granted banks limited authority to adjust deposit and loan interests rates within a narrow
band. This band was gradually expanded and lending rates were finally liberalised in 2013.
With regards to deposits, regulators have abolished the floor on rates in 2014 allowing banks
to pay savers as little as they want. On the upside, the rate ceiling was raised to 10 percent
above the PBoC’s benchmark in 2012. Two years later, the ceiling was raised by another 10
percentage points. This already provides for some limited space for commercial bank compe-
tition. However, the weakening of economic activity has led the central bank to lower lending
rates. In order to avoid a squeeze of their profit margin, commercial banks are likely to refrain
from voluntarily offering higher interest rates on savings. Zhou Xiaochuan, the head of Chi-
na’s central bank has announced in early 2014 that the liberalisation of deposit rates would
occur in 2015 or 2016 (The Diplomat 12.03.2014). However, by the time of writing, in March
2015, no time table had been presented.
Until 2015, reforms have not yet produced a free capital market nor have they removed state
intervention. Regulatory and legal frameworks are still patchy and the role of large state-
owned commercial banks in financial intermediation has remained prominent. In fact, the
Commercial Banking Law prescribes that “financial institutions carry out their business in
order to meet the requirements of national economic and social development. They should
develop their lending business under the guidance of sectoral industrial policies of the state”
(NPC 2003 at 4.34). This provision appears to conflict directly with article 41 which provides
that “No entity or individual may coerce a commercial bank into granting loans or providing
guarantee. A commercial bank shall have the right to refuse any entity or individual to force it
to do so.” Pursuant to this rule, the directives of government organisations demanding bank
lending to preferred companies have no legal underpinning.
Nevertheless, government influence on the banking sector has remained significant (J. P.
Morgan 2014). In June 2006, Guo Shuqing, than chairman of China Construction Bank has
complained about Government interference at banks. Guo said that government influence on
the lending business of China’s four large SOCBs was not sufficiently based on commercial

© THINK!DESK China Research & Consulting 2015 Seite 152
considerations (Finanznachrichten.de 29.06.2006). In a 2010 OECD discussion paper, Herd,
Pigott and Hill suggest that
“Active efforts by the authorities to promote greater private control of financial in-
stitutions would help to improve the financial system’s capabilities to serve the
private sector and to eliminate interference by government entities, particularly
local governments, in lending decisions. Consideration should be given to requir-
ing local authorities to reduce their ownership stakes in commercial banks over a
reasonable period” (p. 36).
Local governments commonly offer special assistance to companies or industrial sectors with
large contributions to local industrial value added, tax revenues or employment. The special
appreciation is expressed by local authorities openly or covertly lobbying local bank branches
to expand lending and provide favourable conditions to selected companies. Several exam-
ples for this practice have been identified in a recent study on state intervention in the Chi-
nese seamless tube and pipe industry (Taube and in der Heiden 2015).
Huang (2010a) found that distortions in capital markets have had the largest effects on eco-
nomic growth compared to markets for labour and other production inputs. Distortions in the
financial market are threefold. Firstly, capital was made artificially cheap to stimulate invest-
ment growth. Low interest rates and complementary measures have kept borrowing costs at
disproportionately low levels. Secondly, a strong bias for lending to SOEs and local govern-
ments implied that the availability and cost of capital was far from equal. Finally, access to
capital and the terms at which it is provided serve as important tools for industrial policy mak-
ing. By offering loan interest subsidies, loan guarantees and other means of reducing capital
costs, government organisations seek to direct investment into key projects and industries.
Similarly, in sectors where industrial policies seek the removal of obsolete production capaci-
ties, the closure of polluting plant facilities or the reduction of independent players through
M&A, capital availability is tightened. Lending costs are increased indirectly through direc-
tives asking banks to re-evaluate their exposure to particular industry risks. The following
sections elaborate on these aspects in greater detail:
(i) The costs of capital is kept artificially low
A large body of research emerging since 2001 argues that capital is intentionally underpriced
as a means to stimulate investment-driven economic growth. Huang (2010a) maintains that
an international comparison of the ratio of nominal GDP growth potential and government
bond yields can reveal distortions. The former stands for the average investment returns
while the latter represents risk free investments returns. Under ideal conditions, the two indi-
cators should converge – signifying the absence of distortions. In the case of China, an obvi-
ous gap separates the two: five-year government bond yields averaged 3.2 percent between
2005 and 2014 while nominal economic growth has been around 9.9 percent. The gap of
almost 7 percentage points is significantly larger than comparable data from many other de-

© THINK!DESK China Research & Consulting 2015 Seite 153
veloped countries and emerging markets. This suggests that China does indeed have dis-
torted capital markets (Huang 2010a).
Chen (2014) points to an established causality between economic growth and lending rates.
A faster expansion of economic activity should translate into higher lending rates. Based on
the average GDP growth observed between 1980 and 2010, he calculates that China’s lend-
ing rate should have averaged 7 percent when in fact, it stood at a mere 2 percent.
Commercial banks have fared very well under the semi-reformed financial market conditions.
They accumulate deposits from China’s large population which is also characterised by high
savings rate. As individual savers are unable to make bank deposit or by securities overseas,
due to China’s closed capital account, commercial banks offer a limited portfolio of invest-
ment products. Because savers only need to be compensated with low interest rates, com-
mercial banks enjoy access to a very large pool of very cheap capital as a basis for undertak-
ing their lending business. Aidan Shevlin and Wu Lan, the authors of a recent research note
of investment bank J. P. Morgan (2014 at 13) state that
“The modest interest rate liberalisation implemented by the government, after
more than two decades of financial market reforms, has benefitted only a small
minority of Chinese investors. The majority of China’s 1.4 billion population find
themselves with few investment and interest rate choices beyond time deposits.”
(ii) Local governments and SOEs are the principal beneficiaries
Local governments cannot lend from banks directly. Instead they used to direct special in-
vestment companies owned by them to borrow from banks and finance infrastructure or so-
cial housing projects. These companies have become important vehicles for localities to tap
bank finance since local governments have been prohibited from issuing bonds.12 Squeezed
between rapidly increasing spending obligations and limited revenues, cities have made am-
ple use of this instrument to cover budget short falls. A series of economic stimulus packages
implemented since the onset of the global economic crisis has strained local finances. Fur-
thermore, increasing outlays for healthcare, education, social housing and other public ser-
vices have added to the pressure. Municipal government investment companies are wel-
come loan customers due to their favourable risk profile. Backed by supervising government
agencies, these enterprises are unlike to default on their debt. Explicit and implicit govern-
ment guarantees allow for low financing costs and favourable conditions. As the financing
requirements of Chinese localities have risen, so have the debt load and leverage ratio of
investment companies run by them.
12
In late 2014 this policy has been amended. Now local governments are no longer permitted to raise capital via special investment companies or local state-owned enterprises. Instead they are permitted to emit bonds at the capital markets. Emission of bonds and utilization of funds raised are subjected to a quota system administered by central government.
In earlier years central government had in some specific cases helped localities to raise funds from the bond market by issuing notes in its own name and channelling the money to the re-spective province or city.

© THINK!DESK China Research & Consulting 2015 Seite 154
The privileged status of SOEs as pillar of China’s “Socialist market Economy” manifests itself
in the commercial loan business. Owing to explicit and implicit guarantees by supervising
government organisations, lending to SOEs is regarded as bearing significantly lower risk,
compared to private enterprises. Financial institutions, state- or privately owned, face similar
incentives which work in favour of SOEs. The latter can thus benefit from preferred credit
allocation, lower interest rates, lower collateral requirements, deeper credit lines, less restric-
tive oversight and easier refinancing of existing debt (Gao 2013; Liu and Siu 2006). Through
their analysis of 12,000 companies from across China, Dollar and Wei (2007) have not only
confirmed this finding. They have also calculated that the investment rate could be reduced
by eight percentage points without impairing economic growth under the condition that the
SOE bias in lending was cancelled. Similarly, Lee, Syed and Liu (2012 at 16) argue that
“In China, a large burden of the financing of over-investment is borne by house-
holds, estimated at close to 4 percent of GDP per year, while SMEs are paying a
higher price of capital because of the funding priority given to larger corporations.”
An increasing share of these funds is not bearing productive returns but serves to keep over-
indebted entities afloat. Slowing economic growth and stagnating demand has revealed ex-
cess supply and brought about significant price declines in many industries. As sales reve-
nues have stopped in their upwards trend, liquidity management assumed increased im-
portance – especially as high leverage ratios imply significant costs for meeting repayment
obligations on loan interest and principal. With more capital tied up for debt service, fewer
resources are available to finance R&D and other activities that add value to companies. In
this situation, injecting fresh loans helps SOEs refinance existing debt but creates little eco-
nomic value or public welfare (Quartz 22.07.2014 and 20.09.2013).
2.4.1.1.1 Dividend Policies as a Means of Subsidisation
SOEs may retain most for their profits for internal use and only need to hand over a fraction
to the Ministry of Finance as dividends. As a legacy from the last major wave of SOE reforms
in the late 1990s, this arrangement frees up additional capital for investments. Confronted
with steep losses and escalating leverage ratios of hundreds of thousands of SOEs, the gov-
ernment initiated the “grasp the big, let go of the small” strategy. Across all industries, large
companies had to undergo restructuring and shed loss-making assets. At the same time,
they have received significant subsidies to shore up liquidity and promote modernisation.
Capital injections reduced liabilities and freed up capital that was otherwise reserved for debt
service. Small SOEs were either closed, merged or integrated into bigger ones. The large-
scale rescue operation took about five years to complete and put a heavy burden on the
state budget.
© THINK!DESK China Research & Consulting 2015 Seite 155
The government waived its dividend claims to surviving SOEs in order to shore up their fi-
nancial strength. Retained profits served to repair their balance sheets, upgrade production
technologies and improve competitiveness. As the economy improved in the early 2000s, the
revitalised state business sector registered substantial profits but government budgets did
not benefit. Funding shortfalls in China’s fledgling social security system highlighted the need
to reclaim the right to dividends and in 2007 for modest reforms were initiated. The central
government started to demand dividend payments worth ten percent of after‐tax profits from
SOEs in particularly profitable monopoly industries such as resources, petrochemicals and
tobacco. Companies operating in competitive sectors, e.g. steel, had to pay a reduced rate of
five percent while research and military oriented companies continued to be exempt from
dividend payment (Sina 15.11.2013).
In a second step, dividend regulation was adjusted upwards in 2011, targeting SOEs affiliat-
ed to five central ministries and two enterprise groups (1,631 entities in total) were ordered to
give up variable shares of their after tax profits. The Ministry of Finance increased its divi-
dend claims across the public business sector. Starting from January of 2011, companies in
particularly profitable industries (like telecommunication) were required to submit 15 percent
of their net profits. Steel enterprises and firms in other areas of the economy only needed to
give up ten percent. With just five percent, SOEs involved in the production of military goods
and research focused organisations benefitted from the lowest rate.
Furthermore, all SOEs which had issued shares on China’s stock exchanges between 2006
and 2009 were force to retroactively submit ten percent of the proceeds. These funds were to
be used to shore up the ailing social security system. In November 2012, the Decision of the
Central Committee of the Communist Party of China on Comprehensively and Thoroughly
Addressing Several Key Problems ruled that 30 percent of SOE profits would have to be paid
to the central government by 2020. Again, the social security fund was earmarked as the
principal beneficiary (CPC Central Committee 2013). However, a senior representative of
IMF has called on the Chinese government to increase dividend payments by its SOEs.
Speaking at a press conference in Beijing, David Lipton, first deputy general director of the
Fund has pointed out the need for more complete submission of SOE profits (FT 26.05.2015).
Since the first profit sharing reforms were enacted in 2007, the provinces, autonomous re-
gions and cities directly under the central government have implemented their own dividend
regulation for the SOEs under their control. Most have adopted the central government
standard of 30 percent to be reached by 2020.
The government of Shanxi Province stated that its planned capital budget for state-owned
business operations in 2013 expected 500 million RMB in revenues from immediate profits
and SOE dividends – split almost evenly (MOF 2014). On the expenditure side, Shanxi Prov-
ince prepared to spend the same 500 million RMB for supporting industrial upgrading and
technology improvements across its company portfolio (SASAC 2011).

© THINK!DESK China Research & Consulting 2015 Seite 156
A similar situation exists in Hebei Province where the capital budget for state-owned busi-
ness operations for 2014 is expected to reach 310 million RMB received from transferred
profits. Hebei indicated it will spend the same amount, investing about two thirds of it in the
development of key projects (MOF 2014).
2.4.1.1.2 Industrial Policy Compliance as a Precondition to Access to Low
Cost Capital
Reforms of the banking sector have substantially reduced the opportunities for government
organisations to intervene in normal business operations at commercial banks. Directed
lending to preferred companies led to major inefficiencies (and substantial losses) during the
1980s and 1990s and was thus prohibited in the early 2000s. The reporting and incentive
structures were adjusted to reinforce these reforms. According to law, all banks based their
business on commercial principles only so that the ownership type of either banks or clients
becomes irrelevant for its decision making.
In spite of reforms, the Chinese banking sector has to cooperate with government authorities
in supporting industrial policy. Bank managers have to be aware of industrial policy and con-
duct business operations accordingly. Through directives of the PBoC or the CBRC, the state
continues to order banks to conform to sectoral policies and contribute to the overall policy
implementation effort. Banks are asked to improve their service offering, create customised
solutions and expand lending to strategic emerging, pillar or key industries. At the same time,
they have to scale back or even stop lending to businesses which are operating in violation
of industrial policy for their respective sector. This does not only amount to direct intervention
in the way banks do business. It also puts an additional burden on financial institutions as
they are required to develop both a deep understanding of various sectoral industrial policy
concepts and the ability to determine if its client are conforming or violating such policies.
Producers of goods and services that are especially promoted by the government enjoy eas-
ier access to bank loans. The investment guidance catalogues issued by the central govern-
ment indicate priority areas for industrial development. Products and technologies contained
in the “encouraged” category are regarded as important, if not critical, to successful long term
economic growth. Companies engaged in relevant development or production activities quali-
fy for preferential treatment. In a similar fashion, enterprises anchored in one of the seven
designated strategic emerging industries (SEI) can benefit from favourable arrangements for
meeting their funding needs. In light of this, banks are urged to provide special support and
services. Further details on lending support under the SEI initiative are provided in chapter
2.2.3. In the following boxes 6 and 7, several examples will be presented to illustrate the
subordination of financial services to industrial policy.

© THINK!DESK China Research & Consulting 2015 Seite 157
Box 6: Government Interventions in Bank Loan Allocation in Hubei Province
In its Implementation Measures for the Adjustment and Revitalisation Programme for the
Steel and Non-ferrous Metals Industries (2009-2011) which were cited earlier in this report,
the government of Hubei Province (2010) has indicated its readiness to improve access to
bank loans to key companies in key sectors of the local economy. Other provinces go even
further and introduce more concrete instruments. Gansu Province in Western China is a
case in point. Authorities there have called for establishing an advanced financial system to
the cooperation of local players with the China Development Bank and other financial institu-
tions. Municipal governments are to intensify their cooperation with banks in order to set up
a credit operating system that accommodates the financial requirements of companies
(Gansu Province 2010a at 6.20). Furthermore, the Governor’s Office of Gansu Province
regularly gives awards to financial institutions that have contributed to advancing the devel-
opment of the local industrial economy (Gansu Province 2012 and 2013). The governor’s
prize is a high profile affair and is meant as an expression of gratitude and appreciation for
lending policies that supported local industrial policy strategies. Winners include the local
office of the China Development Bank, as well as the local branches of major commercial
banks, agricultural credit unions and other financial institutions.

© THINK!DESK China Research & Consulting 2015 Seite 158
Box 7: Governmental Interventions in Capital Allocation in Gansu Province
In 2011, Gansu Province has openly announced to “strengthen the refinancing capabilities
of 22 stock market listed companies” based in the province. The list includes Lanzhou
Greatwall Electric Co., Ltd., Gansu Jingyuan Coal Industry and Electric Power Co., Ltd.
and Gansu Jiu Steel Group Hongxing Iron & Steel Co., Ltd. (Gansu Province 2011a).
The authorities of Jiayuguan City (Gansu Province) issue Guiding Opinions on Expanding
Bank Lending on an annual basis, however, only the editions for 2008, 2010 and 2011
were obtained by THINK!DESK (Jiayuguan City 2008, 2010 and 2011). The documents
have proven very instructive and relevant passages from the 2010 and 2011 versions are
reproduced here in translated form:
Strengthen the coordination between credit policies and agricultural industrial
policies. Accelerate the industrial development of agriculture. Increase support
to advantageous industries. Meet the financial needs of leading agricultural in-
dustry companies like Hongfeng Industrial Co., Zixuan Wine industry and
Xingsheng Beer Processing. Support the upgrading of the deep processing of
agricultural commodities at these companies and raise their overall competi-
tiveness. Focus on supporting the cultivation of a group of companies en-
gaged in the deep processing of agricultural commodities that have adapted to
special types of agricultural development, market their products to end con-
sumers and have a strong radiating effect on the industry. Increase financial
support for development the dairy industry. Support the healthy development
of dairy farmers, cooperatives and processing enterprises that can meet credit
conditions (Jiayuguan City 2011 at 3.2).
Focus support on the construction of bases for leading industries and renewa-
ble energy. Continuously promote implementation of the strategy of industrial
strengthening. Banks and financial institutions are to closely adhere to the
provincial government’s and the provincial CPC commission’s general ideas
on “Catch Four with Three Branches of Support” and their “Centre Promotion,
Flying with Two Wings, Group Development and Comprehensive Promotion”
strategy for regional development. Financial institutions should make full use
of their function for adjusting the allocation of resources. They should promote
the structural adjustment and upgrading of industry, actively implement policy
measures for increasing domestic consumption and step up credit support for
key projects relating to indigenous innovation, energy conservation, emissions
reduction and recycling economy. Further promote the optimisation industrial
layout, industrial clusters and extending operations both up- and downstream.
We should seize the opportunity of national revitalisation measures for steel
and nine other pillar industries and continue to expand loan commitments to
developing the steel industry, the equipment manufacturing industry as well as

© THINK!DESK China Research & Consulting 2015 Seite 159
high and new technology industries. Centred on the national demands to
forcefully develop high and new technology industries, we should focus sup-
port on the development of new materials, new energy, sophisticated chemical
engineering and the other advantageous industries which are special to our
city and form a group of new nuclei for economic growth and credit growth.
Firstly, we should offer full support to Jiu Steel Group Co. to continuously raise
its output capacity for products related to high-speed railways, steel and steel
products; support the construction of a 1,800 m³ blast furnace, the second
stage of stainless steel mill, new coking facilities and other key engineering
projects. The value added of output should increase and the company should
realise an operating income of 50 billion RMB. At the same time, we should
continue our support for Jiu Steel Co. issuing short-term bills and medium term
notes.
Secondly, we should establish the accelerated construction of new energy ba-
ses as the centrepiece of our SEI cultivation efforts. By way of injecting credit
finance from banks, we should fully bring to bear our city’s competitive ad-
vantages in solar and wind power resources, comprehensively strengthen the
strategic cooperation with Huandian New energy Co., launch the Jiadong solar
thermal power plant project, diligently form “new energy – high energy –
downstream products” as a new mode for comprehensively developing and
using regional resources. We should promote the construction of several pro-
duction line projects, including 1 million tons of ferroalloys, 100 thousand tons
of chromium salt, 1.6 million tons of new type dry quenched cement.
Thirdly, we should actively do a good job in providing credit support for the
equipment manufacturing industry. Support should be focussed on expanding
production capacities at Western Heavy Industry Co., China Nuclear Power
Jiayuguan Co., Haite Co., Daluqiao Steel Tubes and other companies in the
equipment manufacturing sector. At the same time, taking new energy related
equipment manufacturing as leading sector, we should fully support the devel-
opment of equipment manufacturing and stainless steel deep processing.
Fourthly, we should continue to strengthen credit for the construction of basic
infrastructure in industrial parks, diligently promote the second stage of the
Jiabei project and the third stage of the Jiadong project road network construc-
tion …
Fifthly, we should forcefully promote technology innovation and renovation of
enterprises, upgrade traditional industries, increase nurturing of SEI, imple-
ment the cultivation plan for small and mid-sized enterprises, raise the quality
and effectiveness of the development of the industrial economy.

© THINK!DESK China Research & Consulting 2015 Seite 160
Sixthly, we should step up support for exporting enterprises and companies
with foreign investment. We should promote outward-oriented economic de-
velopment. Increase credit for the service industry and support qualified enter-
prises to attract foreign investment and invest overseas to continuously ex-
pand the development potential of companies. Focus support of Jiu Steel
Group Co. to expand exports, support small and mid-sized enterprises to im-
prove foreign market exploration abilities…. (Jiayuguan City 2010 at 3.1)
The provisions of Gansu Province and Jiayuguan City, illustrated here, showcase the con-
tinued intervention of local governments in the banking sector. Officially, the direction of
lending activities of local banks by local government authorities was outlawed in the early
2000s. Far reaching reforms of accountability and reporting duties have been instituted to
prevent rent seeking behaviour, cronyism and corruption. However, as the examples have
showed, directed lending is continuing even today. It is important to note, that the state-
ments here are not limited to this particular case, but hold broad relevance for local lend-
ing business across the country.
2.4.1.1.3 Governmental Market-Interventions Conducted via the People’s
Bank of China
Government influence over the financial sector is concentrated in the People’s Bank of China
(PBoC), the country’s central bank, as well as three state policy banks, the China Export-
Import Bank and the China Development Bank and the Agricultural Development Bank of
China. Different from central banks in OECD countries, the PBoC is subordinate to the gov-
ernment and reports to the State Council, China’s cabinet. Besides its three main (formal)
duties to address financial risks, maintain financial stability and carry out monetary policy, the
PBoC supports economic development strategies, e.g. sectoral industrial policy, by own
measures. It sets depository and lending benchmark interest rates and determines the re-
quired reserve ratio (RRR), i.e. the share of deposits commercial banks cannot use for mak-
ing loans but have to keep in a central bank account as a precaution against financial risk.
Exchange rate policy is also firmly under the PBoC’s control as the bank carries out open
market operations, window guidance and other measures to keep the external value of the
RMB within a prescribed range relative to other currencies. More on exchange rate related
interventions of the PBoC will be discussed in chapter 6.
Evidence suggests that even the People’s Bank of China (PBoC), the country’s central bank,
is involved in sector-specific lending promotion. In 2010, for example, the bank’s Wuhan
Branch expresses its intent to provide special loan support of ten “key industries”. These
include the automobile industry, the steel industry, the petrochemical industry, light industry,
the textile industry, the non-ferrous metals industry, the equipment manufacturing industry,

© THINK!DESK China Research & Consulting 2015 Seite 161
the shipbuilding industry, the IT industry and the logistics industry. In its Opinions concerning
the Financial Support for the Adjustment and Revitalisation of Ten Key Industries in Hubei
Province, the Wuhan PBoC demand to “increase the financial support for technological trans-
formation and enhance the independent R&D capability of enterprises” (PBoC Wuhan 2010
at 1). The authors have devoted a separate section to outline banking support for the steel
and non-ferrous metals industries, stating that “all financial institutions should improve and
optimise credit services offered to deep processing projects of the steel and non-ferrous
metals industries in order to meet the financial needs of relevant companies with regard to
investment, exports and other vital areas” (PBoC Wuhan 2010 at 4.2).
While the example of Hubei Province and its capital Wuhan documents the involvement of
the PBoC in the implementation of governmental guidance to the economy, the full im-
portance of the PBoC for the transmission of government policies into concrete lending ac-
tivities of the Chinese banking sector becomes even obvious in the case of Shanghai as
documented in box 8.
Box 8: The Role of PBoC Shanghai Branch Office for the Industrial Policy
Implementation
Individual provinces, autonomous regions and cities under the direct administration of the
central government draft their own guidance documents for local banks. Shanghai Munici-
pality is a case in point. The city’s branch of the PBoC has issued annual Credit Orientation
Guidelines in order to align business operations of financial institutions with industrial policy
priorities. The documents spell out in detail the priorities that lenders should set in their work
and draw attention to particular government initiatives that are to be supported (PBoC
Shanghai 2012).
The 2012 document states that its provisions base on the national 12th FYP, the 12th FYP of
Shanghai and various policies documents recently issued by the municipal government. It
orders all financial institutions to pay close attention to national investment policies and sec-
toral industrial policies. They have to familiarise themselves with industrial development
plans and related documents released by the municipal government in order to “correctly
determine the direction of macro-economic policies” (at 1). Banks and other lenders have to
follow the principle of differential treatment of businesses and technologies that are promot-
ed and discouraged by national industrial and investment policies so as to implement rele-
vant national guidelines (at 2).
The document outlines the main requirements for lending activities in 2012 as: thoroughly
implement the spirit of the Central Committee Economic Work Meeting, the National Finan-
cial Work Conference and the PBoC Work Conference. Lenders are to closely align them-
selves with the main line of science and technology promotion as well as economic trans-
formation and restructuring. They should pay more attention to credit and sectoral industrial

© THINK!DESK China Research & Consulting 2015 Seite 162
policies as well as welfare and redistributive policies.
Special credit support is to be granted to SEI according to the 12th FYP for the development
of SEI in Shanghai City. Banks are called to contribute to the implementation of the pro-
gramme in a variety of ways. They are to develop innovative and specialised financial prod-
ucts and services to best meet the demand of SEI firms. The Credit Orientation Guidelines
urge banks to step of credit support and improve services for firms engaged in the develop-
ment of energy-saving and environmental technologies, next generation IT, biotechnology,
high-end equipment manufacturing, new energy, new energy vehicles and new materials.
Through innovative financing products and a stronger focus on increasing support, the bank-
ing sector is urged to help establish national key science and technology infrastructure, na-
tional engineering labs, national engineering technology research centres, nationally certi-
fied enterprise-based technology centres, strategic industry alliances aimed at technology
innovation and other important platforms. Lenders are ordered to expand financing services
to projects contained in the Catalogue of Supported Key Technology Renovation Projects in
Shanghai City 2011 and vigorously develop discount loans and other credit services to ac-
commodate technological renovation (at 1.1).
A key focus of the Credit Orientation Guide is the customisation of financing products to the
needs of technology companies. In this vein, lenders are asked to strengthen their commu-
nication with relevant government departments to come up with new credit solutions. The
Zhangjiang “One Area Twelve Parks” concept is identified as a particular focus of bank lend-
ing support. The construction of Zhangjiang Hi-Tech Park and Zhangjiang Eastern Area are
to be understood as core areas for practicing financing innovation for science and technolo-
gy promotion. Supported regions are to extent to Jiading Park and several other areas (at
1.1).
All financial institutions have to support the development and application of technologies for
environmental protection, energy conservation, emission reduction and materials recycling
as starting point for improving their credit structure and vigorously innovate credit products.
Banks should pay close attention to development and upgrading trends in these industries
and strive to promote the manufacture of energy-saving refrigerators, engines, washing ma-
chines, air conditioners, lighting, hybrid and pure electric vehicles as well as other energy
efficient products (at 1.2). Banks should monitor the progress in solar energy, smart grids,
clean coal, liquid and solid waste treatment as well as the synergistic utilisation of sea water.
They should increase credit support to energy conservation service providers and contract
energy management firms. The Guideline also mentions specific key environmental protec-
tion projects, like the phase 2 expansion project of the waste water treatment plant at
Bailong Port, for which lenders should meet financing demand (1.2).
With regards to other major projects pursued by the Shanghai government, the local PBoC
branch advises local banks to assist the establishment of the Shanghai International Trade
Centre, the Shanghai International Financial Centre and the Shanghai International Shipping

© THINK!DESK China Research & Consulting 2015 Seite 163
Centre. Bank are urged to vigorously development discount loans and other credit products
with medium to long periods to support the importation of advanced technologies, key
equipment and special resources that are in short supply on the domestic market (at 2.1).
The tourism industry serves as another key focus of the PBoC lending strategy. All financial
institutions should capitalise on the city’s historic opportunity to build Shanghai into a world
renowned tourism city. Banks are to contribute by providing various types of financing ser-
vices to famous companies taking part in the Shanghai Tourism Festival and other signature
events. Based on the city government’s Guiding Opinions on Financing Support for Devel-
oping the Tourism Industry, local lenders should explore new services, like pledges of on
entrance ticket earnings. Loss-making companies from the tourism industry possess com-
petitive advantages should receive credit support.
Finally, the cultural industry receives strong attention by the PBoC. Pursuant to the Guiding
Opinions on Financing Support for the Rejuvenation and Prosperous Development of the
Cultural Industry, local financial institutions are asked to further improve their product offer-
ings to related companies. Support targets are identified as the National digital publishing
base, the China (Shanghai) Network Audiovisual Industry Base, the National Music Industry
Base, the National Green Innovative Printing Demonstration Park as well as other national
level cultural industry parks.
With regards to industries restricted by the national investment guidance catalogues, the
PBoC warns banks to strictly control loans to industrial sectors like, cement, plate glass and
coal chemistry as well as to industries with overcapacities, obsolete production plants, high
resource consumption and serious pollution. Banks are called upon to take the initiative and
assist relevant government authorities in flushing out obsolete capacities and stopping the
production of sporadic chemicals, textile dyes, leather manufacturing and other goods. Fur-
thermore, banks should work to contribute to a drastic reduction in the production and stor-
age of dangerous chemicals. Finally, they should help to cut in half the total output of mate-
rials that are electric coated, heat treated, forged or cast.
2.4.1.1.4 Debt-Equity Swaps as a Means to Unburden Corporate Balance
Sheets
Finally, debt-to-equity swaps have rescued several hundred over-indebted SOEs in the run
up to China’s WTO accession in December 2001. Although these transactions date back to
the years 1998-2000 the magnitude of debt relief has been so large that effects can still be
felt today. Up until the late 1990s, SOEs had accumulated debt to a degree that threatened
firm survival. Chinese industrial planners worried about the viability of many large industrial
SOEs after China joined the WTO in December 2001. In order to reduce debt burdens and

© THINK!DESK China Research & Consulting 2015 Seite 164
shore up corporate finances of enterprises in various sectors, the central government resort-
ed to debt to equity swaps. In a massive grant giving operation, all major state-owned mills
could significantly reduce their leverage. Debts held by state-owned commercial banks were
transferred to four Asset Management Companies (AMCs). In return for obtaining the finan-
cial obligations, AMCs were given additional ownership shares in client companies. In other
words, the state, acting as creditor, received an (additional) ownership stake in exchange for
cancelling existing debt at state-owned companies (Taube and in der Heiden 2009).
This approach does not seem to follow commercial considerations, since the government
had already held controlling stakes before the debt-equity swaps took place. Consequently,
the acquisition of additional shares did not influence the government's control rights.
Government agencies would not have regarded the transactions as equity investments be-
cause the desolate condition of the SOEs rendered investment returns a rather distant pro-
spect. It is unlikely that private investors, had they been permitted to acquire ownership
stakes, would have volunteered to obtain SOE shares in return for debt forgiveness. These
transactions can only be regarded as direct cash infusions intended to lower companies’
debt-asset-ratios as purely commercial considerations would have precluded this approach.
2.4.1.1.5 Loan Interest Subsidies and Treasury Bond On-Lending
Treasury bond on-lending is a common way of providing low interest loans to favoured com-
panies. Owing to the lower risk premium of government debt, this financing channel signifi-
cantly reduces the cost of capital. Like access to loans from state policy banks, only selected
companies which comply with government regulations qualify for treasury bond on-lending.
Loan interest subsidies are awarded by government department to promote technological
upgrading and other policy objectives. More information on the volume of the benefits ob-
tained by listed companies is provided in the following tables 36-39.
Table 36: Total Disbursements of Treasury Bonds Subsidies
2010 2011 2012 2013 2014 Total
79,469,980 61,988,574 62,827,566 65,108,482 45,252,002 314,646,604
Source: Wind Data
In 2014, at least 34 enterprises have obtained funds raised through state treasury bonds.
The ten largest recipients are listed in the following table 37.

© THINK!DESK China Research & Consulting 2015 Seite 165
Table 37: Top 10 Recipients of Treasury Bonds Subsidies in 2014
Rank Enterprise Amount
1 Shenyang Chemical Industry Co., Ltd. 20,177,143
2 Sound Environmental Resources Co., Ltd. 4,271,632
3 Guizhou Chitianhua Co., Ltd. 2,293,500
4 Shaanxi Xinghua Chemistry Co., Ltd. 1,428,571
5 Yangmei Chemical Co., Ltd. 1,171,000
6 Qinchuan Machine Tool & Tool Group Share Co., Ltd 1,083,333
7 Shenyang Brilliant Elevator Co., Ltd. 1,080,000
8 Liaoning SG Automotive Group Co., Ltd. 1,019,286
9 Xi’an Shaangu Power Co., Ltd. 1,014,000
10 Shanghai Automation Instrumentation Co., Ltd. 965,900
Total 34,504,365
Source: Wind Data
Table 38: Total Disbursements of Loan Interest Subsidies
2010 2011 2012 2013 2014 Total
2,173,512,395 1,796,559,447 3,147,022,982 2,751,477,410 2,798,043,658 12,666,615,892
Source: Wind Data
In 2014, at least 792 enterprises have benefitted from loan interest subsidies. The ten largest
recipients are listed in the following table 39.

© THINK!DESK China Research & Consulting 2015 Seite 166
Table 39: Top 10 Recipients of Loan Interest Subsidies in 2014
Rank Enterprise Amount
1 China Shipbuilding Industry Company Limited 250,274,000
2 Xiamen XGMA Machinery Company Limited. 230,000,000
3 BOE Technology Group Co., Ltd. 172,327,800
4 Shandong Huatai Paper Co., Ltd. 158,581,952
5 Metallurgical Corporation of China Ltd. 74,490,000
6 Tongling Nonferrous Metals Group Co., Ltd. 74,369,049
7 Ningxia Zhongyin Cashmere Co., Ltd. 71,426,920
8 Huatian Hotel Group Co., Ltd. 65,308,300
9 AVIC Aircraft Co., Ltd. 61,937,700
10 Beijing Capital Retailing Group Co., Ltd. 61,590,000
Total 1,220,305,721
Source: Wind Data
2.4.1.1.6 Loans from State Policy Banks
In 1994, a major overhaul of the banking sector introduced separate entities for policy and
commercial lending. Policy banks are tasked to carry out lending in support of government
policies. Reporting to the State Council, the business operations are guided by national de-
velopment objectives as well as economic and foreign policies. The China Exim Bank pro-
motes foreign trade and investment by handing out concessional loans and providing export
credit. As such, it is a major facilitator of overseas projects related to infrastructure construc-
tion, high technology and other state-endorsed fields. The China Development Bank has a
domestic orientation and supports government strategy for national (economic) development.
Its operations focus on raising funds for large scale (high profile) infrastructure projects, like
the Three Gorges Dam. It supports corporate projects for industrial upgrading and technolo-
gy renovation as well as environmental protection and resource conservation with discounted
loan facilities. As suggested by its name, the Agricultural Development Bank of China is
tasked to support rural and agricultural development projects. The bank offers concessional
finance to its clients which have to be in compliance with government policy. The following
table 40 provides an overview of the loan positions of selected listed companies.

© THINK!DESK China Research & Consulting 2015 Seite 167
Table 40: Loans from Policy Banks Obtained by Selected Enterprises
Enterprise Bank Start date End date Currency Interest rate Amount Source
Shanghai Aero-space Automobile
China EXIM Bank 31.08.2010 31.08.2012 RMB 3.51 190,000,000 2010 AR at 100
Electromechanical Co., Ltd.
China Develop-ment Bank
24.12.2012 23.12.2027 RMB 6.55 104,060,000 2012 AR at 115
China Develop-ment Bank
20.12.2013 19.12.2028 RMB 6.55 143,050,000 2013 AR at 113
China Develop-ment Bank
24.12.2012 23.12.2027 RMB 6.55 102,000,000 2013 AR at 113
China Develop-ment Bank
25.09.2013 24.09.2028 RMB 6.55 101,620,000 2013 AR at 113
TCL Corporation China EXIM Bank Shenzhen Branch
05.2009 12.2010 RMB 5.76 37,500,000 2009 AR at 198
China Develop-ment Bank Guangdong Branch
05.2009 12.2010 RMB 5.76 18,750,000 2009 AR at 198
China EXIM Bank Guangdong Branch
09.2009 08.2011 RMB 3.51 585,000,000 2010 AR at 215
China EXIM Bank Shenzhen Branch
05.2009 03.2014 RMB 5.76 162,500,000 2009 AR at 200
China EXIM Bank Guangdong Branch
09.2009 08.2011 RMB 3.51 160,000,000 2010 AR at 215
China EXIM Bank Guangdong Branch
09.2009 08.2011 RMB 3.51 140,000,000 2010 AR at 215

© THINK!DESK China Research & Consulting 2015 Seite 168
Enterprise Bank Start date End date Currency Interest rate Amount Source
Consortium incl. China EXIM Bank, China Develop-ment Bank
06.2009 09.2012 RMB 5.76 100,000,000 2011 AR at 203
Consortium incl. China EXIM Bank, China Develop-ment Bank
03.2009 09.2012 RMB 6.45 72,000,000 2011 AR at 203
TCL Corporation (continued)
Consortium incl. China EXIM Bank, China Develop-ment Bank
02.2011 02.2019 USD 2.95 5,930,670,000 2011 a 205
China EXIM Bank Guangdong Branch
09.2011 09.2013 RMB 5.48 300,000,000 2011 a 205
China EXIM Bank Guangdong Branch
07.2011 07.2013 RMB 5.48 160,000,000 2011 a 205
Consortium incl. China EXIM Bank, China Develop-ment Bank
02.2011 02.2019 USD LIBOR+2.5% 7,711,834 2012 AR at 209
China Develop-ment Bank Guangdong Branch
10.2013 10.2018 RMB 5.89 430,000,000 2013 AR at 2013
China EXIM Bank Guangdong Branch
06.2013 06.2015 RMB 4.20 300,000,000 2013 AR at 2013

© THINK!DESK China Research & Consulting 2015 Seite 169
Enterprise Bank Start date End date Currency Interest rate Amount Source
China EXIM Bank Guangdong Branch
08.2013 07.2015 RMB 4.20 300,000,000 2013 AR at 2013
Consortium incl. China EXIM Bank, China Develop-ment Bank
02.2011 05.2015 USD 3.01 1,566,464,000 2014 AR at 224
China EXIM Bank Guangdong Branch
06.2014 06.2017 RMB 4.20 500,000,000 2014 AR at 225
China EXIM Bank Guangdong Branch
10.2013 10.2018 RMB 5.89 370,000,000 2014 AR at 225
China Northern Ra-re Earth (Group) High-tech Co., Ltd.
China EXIM Bank 14.10.2011 13.10.2014 RMB Benchmark
rate 180,000,000
2011 AR at 124
China EXIM Bank 30.10.2014 29.10.2016 RMB 5.535 155,000,000 2014 AR at 136
AVIC Heavy Ma-chinery Co., Ltd.
China Develop-ment Bank
15.11.2013 14.11.2028 RMB 6.55 113,000,000 2013 AR at 156
China Develop-ment Bank
09.07.2013 08.07.2028 RMB *1 64,000,000 2013 AR at 157
China EXIM Bank 28.10.2014 28.10.2022 RMB 4.20 55,150,000 2014 AR at 135
China EXIM Bank 01.09.2014 01.09.2022 RMB 4.20 37,229,000 2014 AR at 135
AVIC Aviation En-gine Co.
China Develop-ment Bank Shaanxi Branch
08.11.2007 07.11.2010 RMB 3.60 200,000,000 2010 AR at 117
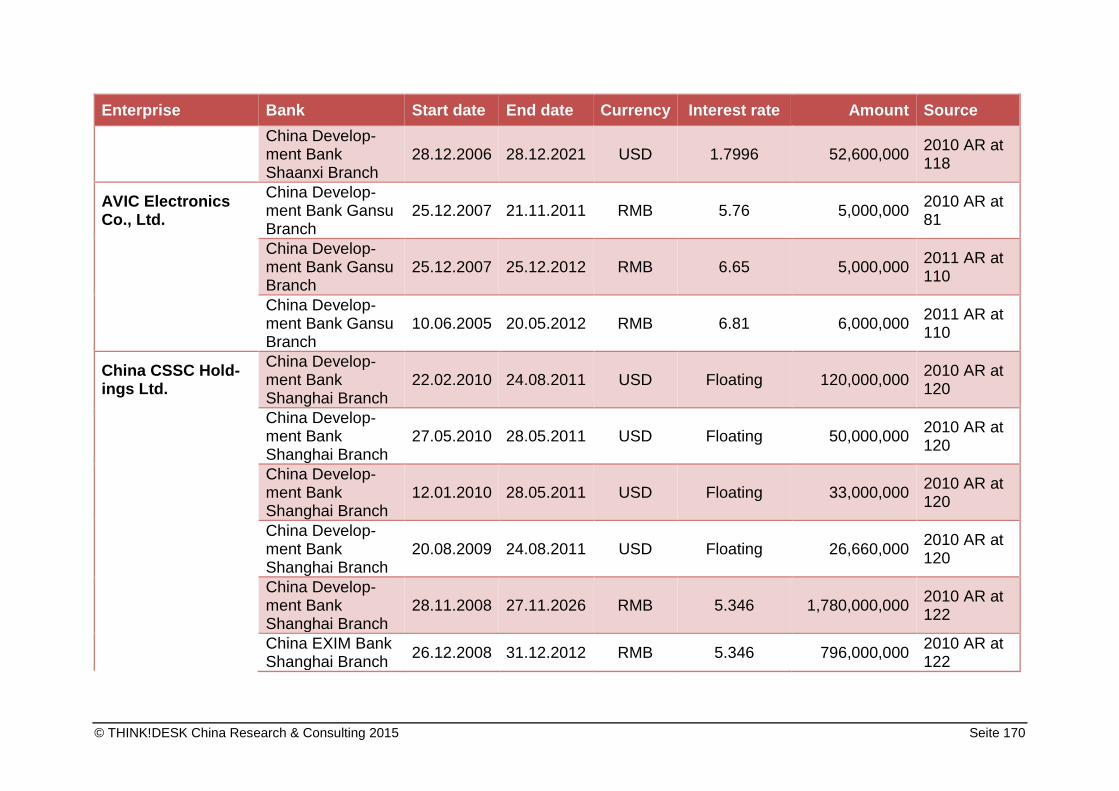
© THINK!DESK China Research & Consulting 2015 Seite 170
Enterprise Bank Start date End date Currency Interest rate Amount Source
China Develop-ment Bank Shaanxi Branch
28.12.2006 28.12.2021 USD 1.7996 52,600,000 2010 AR at 118
AVIC Electronics Co., Ltd.
China Develop-ment Bank Gansu Branch
25.12.2007 21.11.2011 RMB 5.76 5,000,000 2010 AR at 81
China Develop-ment Bank Gansu Branch
25.12.2007 25.12.2012 RMB 6.65 5,000,000 2011 AR at 110
China Develop-ment Bank Gansu Branch
10.06.2005 20.05.2012 RMB 6.81 6,000,000 2011 AR at 110
China CSSC Hold-ings Ltd.
China Develop-ment Bank Shanghai Branch
22.02.2010 24.08.2011 USD Floating 120,000,000 2010 AR at 120
China Develop-ment Bank Shanghai Branch
27.05.2010 28.05.2011 USD Floating 50,000,000 2010 AR at 120
China Develop-ment Bank Shanghai Branch
12.01.2010 28.05.2011 USD Floating 33,000,000 2010 AR at 120
China Develop-ment Bank Shanghai Branch
20.08.2009 24.08.2011 USD Floating 26,660,000 2010 AR at 120
China Develop-ment Bank Shanghai Branch
28.11.2008 27.11.2026 RMB 5.346 1,780,000,000 2010 AR at 122
China EXIM Bank Shanghai Branch
26.12.2008 31.12.2012 RMB 5.346 796,000,000 2010 AR at 122

© THINK!DESK China Research & Consulting 2015 Seite 171
Enterprise Bank Start date End date Currency Interest rate Amount Source
China EXIM Bank Shanghai Branch
26.12.2008 23.12.2019 RMB 6.35 1,002,000,000 2011 AR at 116
China Develop-ment Bank Shanghai Branch
28.11.2008 30.11.2024 RMB 5.895 1,300,000,000 2012 AR at 119
China EXIM Bank 26.12.2008 23.12.2019 RMB 5.895 600,000,000 2012 AR at 119
China EXIM Bank 20.10.2012 20.01.2014 RMB 3.39 300,000,000 2013 AR at 123
China EXIM Bank Shanghai Branch
07.06.2012 31.08.2014 RMB 3.39 250,000,000 2013 AR at 123
China EXIM Bank Shanghai Branch
07.06.2012 20.10.2014 RMB 3.39 250,000,000 2013 AR at 123
China Shipbuilding Industry Co., Ltd.
China EXIM Bank 20.05.2009 20.12.2012 RMB 3.95 900,000,000 2011 AR at 187
China Develop-ment Bank
01.02.2008 31.01.2014 USD 1-yr Li-
bor+180 bp 899,000,000
2011 AR at 188
China Develop-ment Bank
29.10.2009 25.06.2014 USD 3-m Libor+60
bp 150,000,000
2011 AR at 189
China Develop-ment Bank Dalian Branch
01.02.2008 10.11.2013 USD 1-yr Li-
bor+180 bp 600,000,000
2012 AR at 166
China EXIM Bank 24.12.2010 24.12.2013 RMB 3.45 700,000,000 2012 AR at 166
China Develop-ment Bank Dalian Branch
25.06.2008 25.06.2014 USD 3-m Li-
bor+110 bp 397,000,000
2012 AR at 167
China Develop-ment Bank Dalian Branch
01.02.2008 31.01.2014 USD 1-yr Li-
bor+180 bp 299,000,000
2013 AR at 175

© THINK!DESK China Research & Consulting 2015 Seite 172
Enterprise Bank Start date End date Currency Interest rate Amount Source
CPCC China Develop-ment Bank
20.01.2005 20.12.2013 RMB 5.35 10,000,000,000 2010 AR at 153
Zoomlion Heavy Industry Science and Technology Co., Ltd.
China EXIM Bank Hunan Branch
28.04.2007 27.04.2009 RMB 200,000,000 2009 AR at 101
China EXIM Bank Hunan Branch
26.06.2009 28.06.2011 RMB 200,000,000 2010 AR at 136
China EXIM Bank Hunan Branch
21.09.2009 21.09.2011 RMB 100,000,000 2010 AR at 136
China EXIM Bank Hunan Branch
28.04.2009 28.04.2011 RMB 88,480,000 2010 AR at 136
China Develop-ment Bank Hunan Branch
07.05.2010 28.06.2013 USD 60,000,000 2010 AR at 137
China Develop-ment Bank Hunan Branch
28.09.2010 26.09.2012 RMB 230,000,000 2011 AR at 129
China Develop-ment Bank Hunan Branch
23.09.2011 22.09.2014 USD 153,000,000 2011 AR at 130
China Develop-ment Bank Hunan Branch
05.07.2010 28.06.2013 USD 60,000,000 2011 AR at 130
China Develop-ment Bank Hunan Branch
29.06.2010 28.06.2013 USD 40,000,000 2012 AR at 152
China EXIM Bank Hunan Branch
12.09.2012 10.09.2015 RMB 998,000,000 2013 AR at 152

© THINK!DESK China Research & Consulting 2015 Seite 173
Enterprise Bank Start date End date Currency Interest rate Amount Source
China Develop-ment Bank Hunan Branch
13.06.2013 12.06.2016 USD 270,000,000 2013 AR at 152
Weichai Power Co., Ltd.
China EXIM Bank Shaanxi Branch
28.09.2011 09.08.2013 RMB 4.76 100,000,000 2011 AR at 153
China EXIM Bank Shaanxi Branch
12.01.2012 12.09.2013 RMB 4.76 100,000,000 2012 AR at 158
China Develop-ment Bank
27.12.2012 27.12.2020 EUR 2.818 4,608,187,469
(RMB) 2012 AR at 160
China EXIM Bank Shaanxi Branch
16.11.2012 15.11.2014 EUR 4.20 200,000,000
(RMB) 2013 AR at 168
China Develop-ment Bank Hong Kong Branch
27.12.2012 15.10.2014 EUR 2.82 118,701,569
(RMB) 2013 AR at 170
China Develop-ment Bank Hong Kong Branch
15.06.2013 13.06.2014 EUR 3.04 33,674,204
(RMB) 2013 AR at 168, 170
China Develop-ment Bank Honk-ing Branch
15.06.2013 14.06.2021 EUR 3.041 2,489,447,820
(RMB) 2013 AR at 170
China EXIM Bank Shaanxi Branch
10.09.2013 09.09.2015 RMB 4.20 200,000,000 2013 AR at 170
China EXIM Bank Shaanxi Branch
04.12.2013 03.12.2015 RMB 4.20 100,000,000 2013 AR at 170
China First Heavy Industries Co., Ltd.
China EXIM Bank Dalian Branch
22.09.2008 22.09.2010 RMB Floating 480,000,000 2010 AR at 122
China EXIM Bank Heilongjiang Branch
30.08.2012 27.08.2014 RMB 4.20 200,000,000 2012 AR at 113

© THINK!DESK China Research & Consulting 2015 Seite 174
Enterprise Bank Start date End date Currency Interest rate Amount Source
China EXIM Bank Heilongjiang Branch
12.06.2012 11.06.2014 RMB 4.51 200,000,000 2012 AR at 113
China Yangtze Power Co., Ltd.
China Develop-ment Bank
28.10.1997 21.11.2011 USD Libor+0.675% 32,890,447 2010 AR at 105
China Develop-ment Bank
23.09.1997 18.10.2011 USD Libor+0.7% 16,401,843 2010 AR at 105
China Develop-ment Bank
23.09.1997 22.08.2017 USD Libor+0.5% 62,906,039 2010 AR at 105
China Develop-ment Bank
28.10.1997 18.10.2017 USD 7.2% princi-pal / 7.35%
int. 52,972,575
2010 AR at 106
China Develop-ment Bank
28.10.1997 21.05.2012 USD Libor+0.675% 16,445,224 2011 AR at 110
China Develop-ment Bank
23.09.1997 18.10.2012 USD Libor+0.7% 16,401,843 2011 AR at 110
China Develop-ment Bank
23.09.1997 22.08.2012 USD Libor+0.5% 10,484,340 2011 AR at 110
China Develop-ment Bank
23.09.1997 18.10.2013 USD Libor+0.7% 16,401,843 2012 AR at 95
China Develop-ment Bank
02.09.1997 18.10.2015 USD 6.4375 6,997,188 2012 AR at 96
China Develop-ment Bank
20.03.1998 22.08.2017 USD 7.20 5,431,304 2013 AR at 97
Huaneng Power Int. Co., Ltd.
China EXIM Bank 18.03.2008 30.09.2011 RMB 1.44-2.94 417,495,008 2010 AR at 113
China EXIM Bank 18.03.2008 17.03.2023 USD 1.44-2.94 719,100,925 2010 AR at 117
China Develop-ment Bank Yun-
23.11.2005 23.11.2023 RMB 5.35-6.35 6,288,000,000 2011 AR at 134
© THINK!DESK China Research & Consulting 2015 Seite 175
Enterprise Bank Start date End date Currency Interest rate Amount Source
nan Branch
China Develop-ment Bank Beijing Branch
22.04.2011 25.08.2013 RMB 5.54 1,600,000,000 2012 AR at 154
China Develop-ment Bank Yun-nan Branch
23.11.2005 26.11.2028 RMB 5.90-6.55 6,457,780,000 2012 AR at 159
Datang Int. Power Generation Co., Ltd.
China Develop-ment Bank
28.03.2011 27.03.2014 RMB 5.895 1,250,000,000 2013 AR at 130
China Develop-ment Bank Ningbo Branch
24.06.2006 23.06.2014 RMB 5.895 360,000,000 2013 AR at 130
China Develop-ment Bank
30.12.2010 29.12.2028 RMB 5.895 3,055,000,000 2013 AR at 132
Shaanxi Coal In-dustry Co., Ltd.
China Develop-ment Bank Shaanxi Branch
26.03.2010 20.05.2014 RMB 6.00 40,000,000 2013 AR at 176
China Develop-ment Bank Shaanxi Branch
26.03.2010 20.11.2014 RMB 6.00 40,000,000 2013 AR at 176
China Develop-ment Bank Shaanxi Branch
07.03.2011 06.03.2026 RMB 6.55 1,920,000,000 2013 AR at 174
Aluminium Corp. of China Ltd.
China EXIM Bank 30.06.2008 30.06.2011 RMB 4.86 2,000,000,000 2010 AR at 116
China EXIM Bank 29.04.2011 29.04.2013 RMB 6.080 1,000,000,000 2011 AR at 129

© THINK!DESK China Research & Consulting 2015 Seite 176
Enterprise Bank Start date End date Currency Interest rate Amount Source
China EXIM Bank 31.10.2011 31.10.2014 RMB 6.650 1,000,000,000 2011 AR at 129
China Develop-ment Bank
19.04.2012 19.04.2019 USD 6-m Li-
bor+3.3% 2,771,594,000
(RMB) 2012 AR at 145
China Develop-ment Bank
14.02.2012 13.02.2015 RMB 5.535 2,000,000,000 2012 AR at 145
Aluminium Corp. of China Ltd. (continued)
China EXIM Bank 31.10.2011 31.10.2014 RMB 5.535 1,000,000,000 2012 AR at 145
China Develop-ment Bank Ning-xia Branch
31.03.2011 30.03.2014 RMB 6.15 100,000,000 2013 AR at 169
China Develop-ment Bank Ning-xia Branch
23.04.2009 22.04.2024 RMB 5.895 990,400,000 2013 AR at 171
China Develop-ment Bank Ning-xia Branch
14.01.2010 13.01.2030 RMB 6.55 896,000,000 2013 AR at 171
China Develop-ment Bank Ning-xia Branch
28.12.2012 27.11.2027 RMB 6.55 770,000,000 2013 AR at 171
Shanxi Lu'an Envi-ronment Energy Development Co. Ltd.
China Develop-ment Bank
16.03.1994 30.11.2013 RMB 4.68 5,200,000 2010 AR at 98
Tiandi Science & Technology Co. Ltd.
China Develop-ment Bank Inner Mongolia Br.
30.11.2009 29.11.2017 RMB 6.40 58,000,000 2010 AR at 127
Jinduicheng Mo-lybdenum Co., Ltd.
China EXIM Bank Shaanxi Branch
22.12.2014 21.12.2017 RMB 3.90 248,952,000 2014 AR at 87

© THINK!DESK China Research & Consulting 2015 Seite 177
Enterprise Bank Start date End date Currency Interest rate Amount Source
Fiberhome Tele-communication Technology Co., Ltd.
China Develop-ment Bank
22.06.2011 26.11.2012 USD floating 40,000,000 2012 AR at 102
China Develop-ment Bank
01.04.2013 31.03.2016 USD 20,000,000 2013 AR at 105
China EXIM Bank 29.03.2013 29.03.2015 USD 40,000,000 2013 AR at 105
China EXIM Bank 21.05.2013 28.02.2015 USD 17,000,000 2013 AR at 106
China EXIM Bank 30.09.2013 30.09.2015 USD 23,000,000 2013 AR at 106
China EXIM Bank 15.10.2013 31.08.2015 USD 15,000,000 2013 AR at 106
China EXIM Bank 02.12.2013 01.06.2015 USD 19,200,000 2013 AR at 106
China Northern Rolling Stock Co. Ltd.
China Develop-ment Bank
22.12.2005 26.01.2039 EUR 0.20 2,311,000 2010 AR at 151
China Develop-ment Bank
20.12.2005 26.01.2039 EUR 3.37 157,000 2010 AR at 151
China Develop-ment Bank
21.12.2005 26.01.2039 EUR 3.23 71,000 2010 AR at 151
China Develop-ment Bank
26.01.2005 26.01.2039 EUR 0.20-3.37 2,409,000 2011 AR at 170
China EXIM Bank 23.07.2013 22.07.2015 RMB 4.20 400,000,000 2013 AR at 187
China EXIM Bank 23.07.2013 22.07.2015 RMB 4.20 490,000,000 2013 AR at 187

© THINK!DESK China Research & Consulting 2015 Seite 178
Enterprise Bank Start date End date Currency Interest rate Amount Source
China EXIM Bank Heilongjiang Branch
18.02.2013 09.01.2015 RMB 4.20 200,000,000 2013 AR at 187
China EXIM Bank Heilongjiang Branch
01.04.2013 09.01.2015 RMB 4.20 150,000,000 2013 AR at 187
China EXIM Bank Heilongjiang Branch
26.08.2013 09.01.2015 RMB 4.20 150,000,000 2013 AR at 187
Guodian Power Development Co., Ltd.
China Develop-ment Bank
RMB 4,021,125,000 2013 AR at 182
China Develop-ment Bank
RMB 18,445,897,500 2013 AR at 184
Xinjiang Goldwind Science and Tech-nology Co., Ltd.
China Develop-ment Bank Inner Mongolia Branch
26.05.2009 25.05.2024 RMB Floating 257,000,000 2009 AR at 133
China Develop-ment Bank Jilin Branch
13.10.2009 23.05.2024 RMB 5.346 193,000,000 2009 AR at 133
China Develop-ment Bank
26.07.2012 19.07.2013 – 20.11.2013
RMB *2) 20,000,000 2012 AR at 173
China Develop-ment Bank
28.06.2011 20.05.2013 – 20.11.2013
RMB *2) 11,600,000 2012 AR at 173
China Develop-ment Bank
28.05.2010 10.04.2013 – 11.11.2013
RMB *1) 11,400,000 2012 AR at 173
© THINK!DESK China Research & Consulting 2015 Seite 179
Enterprise Bank Start date End date Currency Interest rate Amount Source
China Develop-ment Bank
27.12.2011 23.05.2013 – 27.11.2013
RMB Benchmark
rate 10,500,000
2012 AR at 173
China Develop-ment Bank
11.02.2011 – 08.04.2011
20.04.2013 – 20.10.2013
RMB *1) 10,000,000 2012 AR at 173
Xinjiang Goldwind Science and Tech-nology Co., Ltd. (continued)
China Develop-ment Bank
28.11.2011 20.05.2013 – 20.11.2013
RMB Benchmark
rate 10,000,000
2012 AR at 173
China Develop-ment Bank
28.11.2011 20.05.2013 – 20.11.2013
RMB Benchmark
rate 10,000,000
2012 AR at 173
China Develop-ment Bank
28.06.2011 – 15.06.2012
20.05.2014 – 27.06.2026
RMB *2) 304,400,000 2012 AR at 176
China Develop-ment Bank
08.04.2011 – 09.02.2012
20.04.2014 – 10.02.2026
RMB *1) 303,800,000 2012 AR at 176
China Develop-ment Bank
28.11.2011 – 27.12.2012
20.05.2014 – 20.11.2025
RMB Benchmark
rate 298,000,000
2012 AR at 176
China Develop-ment Bank
28.11.2011 – 27.12.2012
20.05.2014 – 20.11.2024
RMB Benchmark
rate 262,000,000
2012 AR at 176
China Develop-ment Bank
28.05.2010 – 10.11.2010
10.04.2014 – 27.05.2025
RMB *1) 238,600,000 2012 AR at 176
China Develop-ment Bank
26.07.2012 –
20.05.2015 –
RMB *2) 620,000,000 2013 AR at 216
© THINK!DESK China Research & Consulting 2015 Seite 180
Enterprise Bank Start date End date Currency Interest rate Amount Source
04.11.2013 20.05.2022
China Develop-ment Bank
17.05.2012 – 16.05.2013
22.06.2015 – 16.05.2027
RMB Benchmark
rate 297,600,000
2013 AR at 216
Xinjiang Goldwind Science and Tech-nology Co., Ltd. (continued)
China Develop-ment Bank
28.06.2011 – 15.06.2012
20.05.2015 – 27.06.2026
RMB *2) 291,200,000 2013 AR at 216
China Develop-ment Bank
08.04.2011 – 09.02.2012
20.04.2015 – 10.02.2026
RMB *1) 287,800,000 2013 AR at 216
China Develop-ment Bank
26.07.2012 19.07.2014 – 20.11.2014
RMB *2) 40,000,000 2013 AR at 213
China Develop-ment Bank
08.04.2011 20.04.2014 – 20.10.2014
RMB *1) 16,000,000 2013 AR at 213
China Develop-ment Bank
28.06.2011 20.05.2014 – 20.11.2014
RMB *2) 13,200,000 2013 AR at 213
*1) 5-year benchmark interest rate that can float up and down by 10 percent (of that rate)
*2) 5-year benchmark interest rate that can float up and down by 5 percent (of that rate)

© THINK!DESK China Research & Consulting 2015 Seite 181
2.4.1.2 Labour Markets
Given the specific role of labour in the “People’s Republic of China”, the definition of ade-
quate remuneration and the determination of concrete wages and salaries have been and
continue to be subjected to strong ideological doctrines. The implementation of market prin-
ciples in this segment of the economy therefore constitutes a specific challenge.
In contrast to general expectation, strict governmental control of the labour market does not
result in a general preferential treatment of labour, but rather manifests itself in a labour mar-
ket characterised by significant distortions and artificial segmentation. Labour prices are sub-
jected to various government interventions resulting in wages especially for unskilled (mi-
grant) workers being repressed.
As a matter of fact, both government and CPC have long been unwilling to allow independent
bargaining between employees and employers – as well as the formation of independent
organisations that could act as facilitating vehicles. State and party both actively intervene in
the labour market, seeking to perpetuate their monopoly control of representative institutions.
Legal restrictions prohibit the formation of labour unions outside the scope of the All China
Federation of Trade Unions (ACFTU). Founded in 1925, this organisation is closely linked to
the CPC and tasked to coordinate labour relations. In 2008, the labour contract introduced
the right to collective bargaining on the part of workers, but the applicability was limited to
ACFTU and the enterprise union committees under its lead. In fact, ACFTU’s role in lobbying
for higher pay, better working conditions or related issues is insignificant. Instead, the union,
its regional federations and enterprise committees, are enforcing discipline among workers
and safeguard against production disruptions. In this sense, ACFTU operates as an efficient
tool for quelling unrest and grooming labour relations in line with corporate (and arguably
national economic) interests. Besides organizing cultural activities, ACFTU used to adminis-
ter social security benefits until authority for the latter was transferred to provincial govern-
ments. Chinese labour laws have been amended in recent years to improve working condi-
tions and ensure certain minimum standards are met for employment contracts, work safety
and layoffs. However, without effective representation in wage negotiations and deprived of
the right to go on strike, employees have very limited means to press for higher salaries.
Lacking genuine union representation and collective bargaining rights, growing frustration
over unpaid wages and other grievances has sparked labour unrest. This phenomenon grew
more prominent in the aftermath of the global financial crisis. The sometimes violent mass
incidents at Japanese automobile manufacturing plants in Southern China and Taiwanese
electronics makers throughout the country were covered extensively in the media. In fact, the
number of strikes across China more than doubled in 2014 to 1,378, according to information
provided by China Labour Bulletin, labour rights organisation based in Hong Kong. Media
reporting inside China is prohibited and social media are cleansed of references while riot
policy is dispatched to restore order.

© THINK!DESK China Research & Consulting 2015 Seite 182
Attempts at improving the bargaining position of workers have been made in recent years by
the government. However, these initiatives have oftentimes fallen short of expectations as
implementation by companies and enforcement by local governments has been lacking. The
Labour Contract Law (NPC 2007a), in force since January 2008, stipulates that workers must
be given written contracts and strengthens their legal rights against employers in many other
respects. However, the economic downturn brought about by the global financial crisis has
illustrated that enforcement of the (then) new law is weak when local heavyweights complain
and/or economic growth is at risk.
Wary of an upsurge in strikes and riots, the central government has issued a circular in 2015
that warns local authorities to pay greater attention to fostering industrial harmony, even
when economic growth targets are at stake. The document (People Daily, 09.04.2015) re-
flects the growing awareness of implementation shortfalls and reiterates existing regulation
supposed to protect workers’ interests. However, initiatives for genuine labour market liberal-
isations are sparse. In April 2015, the Wall Street Journal (08.04.2015) cited Qiao Jian, a
professor at the China Institute of Industrial Relations, a university affiliated with China’s offi-
cial union federation as saying “The opinion emphasises a state-centric approach to manag-
ing labour relations, based on the rule of law, as directed by the government, and facilitated
by state-controlled trade unions”.
As labour markets continue to be regulated and efficient equilibrium wages cannot form
through the free interaction of market forces, the government has made a limited push for
income increases. The 11th FYP (2006-2010) stipulated average annual income increases of
5 percent (NPC 2006a). The target was over-fulfilled as income growth reached 9.7 percent
and 8.9 percent for urban and rural residents respectively. 13 The 12th FYP raised target for
income growth to 7 percent per year. By 2015, urban and rural incomes were to reach
26,810 RMB and 8,310 RMB respectively (NPC 2011a).
China maintains minimum income standards for monthly and hourly wages that are set at
provincial and municipal levels. Cross regional variation is high because socio-economic
conditions and living expenses differ substantially. In early 2015, the highest minimum wages
were found in Shenzhen with 1,808 RMB per month (17 RMB per hour) while the lowest
were offered by several county level cities in Guangxi Zhuang Autonomous Region with 830
RMB per month (7.5 RMB per hour). The National Employment Promotion Programme re-
quires at least one increase every two years. In 2013, the average rise in minimum wages
across 27 provincial-level jurisdictions was 17 percent while incomplete data suggests in-
creases closer to 10 percent for 2014. The sole exception was Shanghai, which hiked hourly
wages by 21 percent (China Briefing 11.06.2014).
13
Income targets for urban and rural citizens are specified as disposable incomes and net incomes respectively. The differentiation takes account of varying living and working conditions.

© THINK!DESK China Research & Consulting 2015 Seite 183
Minimum levels for monthly salaries and hourly wages are not as low as their designation
suggests. Considering the rate of increases registered so far, employees earning minimum
salary in Shenzhen come close to reaching the national urban income target of the 12th FYP.
The values are not necessarily low when compared to entry level jobs for university gradu-
ates. In a nationwide study conducted in 2014, researchers from Peking University found that
graduates earned 2,443 RMB a month during their first year of employment. In a separate
survey on the income of China’s 274 million migrant workers, the Ministry of Human Re-
sources and Social Security reported average monthly wages of 2,864 RMB (People.com.cn
28.02.2015).
The Chinese labour market is divided in an urban and a rural segment. The separation re-
sults from the household registration system (Hukou in Chinese) that was introduced in 1958
to prevent the free movement of workers around the country. In order to facilitate the central
planning process under the command economy, it was important to prevent labour migration
(Naughton 2007).
At the onset of economic reforms in the early 1980s, the difference between the two labour
forces was substantial. With regards to disposable incomes, living standards, social security
benefits, education opportunities and in many other respects, the urban population fared sig-
nificantly better than their peers in the countryside. Even the abolition of state-purchasing
systems for agricultural products combined with the reintroduction of family farming did not
equal out urban-rural differences. The loss of guaranteed lifetime employment and subsi-
dised amenities for urban dwellers eroded their privileges but the gap between the two labour
markets still remained. Until 2015, the wage differential has narrowed while healthcare, so-
cial security and education provision in the countryside have all improved significantly. Nev-
ertheless, the (registered) urban population still enjoys substantial advantages in all these
regards.
The Hukou system is still in place and despite an extraordinarily large number of labour mi-
grants, it continues to restrict mobility (Liu, Yi and Yu 2014). Several reform steps have
weakened its effectiveness, so unlike in the past, people can relocate freely without fear of
starvation or persecution. However, rural migrants living (and working) in cities are still treat-
ed as second class citizens. They are not covered by local social welfare benefits, like medi-
cal, unemployment, maternity and pension insurance (Huang 2010c). Accessing healthcare,
buying real estate and other elements of ordinary life are fraught with administrative re-
strictions. In most cities, the children of migrant workers are still not allowed to attend munic-
ipal schools and need to stay in the countryside to receive (inferior) education there. Chen
(2014 at 64) concludes that “low-wage policy and the household registration control system
significantly depress the price of labour.”
However, this phenomenon has not taken hold everywhere as large numbers of workers,
especially migrant labourers, continue to be underpaid. Even where migrants perform identi-
cal job functions, they receive half the pay of local residents. However, migrant workers have
often been denied their pay as companies either rejected valid claims or found themselves

© THINK!DESK China Research & Consulting 2015 Seite 184
unable to meet payroll obligations. In his 2015 work report to the annual session of the Na-
tional People’s Congress, Premier Li Keqiang promised the government would undertake
steps to reduce the amount of unpaid wages for migrant workers. “The government is ac-
knowledging the reality of rising worker unrest and wants to make this a bigger priority” (WSJ
08.04.2015).
In addition to wages that seldom meet and often undercut local minimum standards, employ-
ers commonly under-contribute to social security. Even local governments are known to use
reductions in social security premium payments by firms as an incentive to attract investors
to their localities (EIU 2015). Total labour costs would increase by 35-40 percent if social
welfare policies were strictly followed (Huang and Tao 2011). Migrant workers are particularly
vulnerable as they are excluded from the social security systems in the urban areas where
they toil. Those finding work are typically not entitled to any benefits – from healthcare and
pensions to school education for children. Companies can thus save on payroll expenses by
hiring migrants from outside the province. While government documents specify mandatory
increases labour income and government statistics mark a steep rise in absolute wage in-
comes, the picture remains incomplete as a large share of employment is based in grey are-
as where migrant workers form a parallel labour market.
Reforms of the Hukou system have proven very difficult as local governments and local resi-
dents opposed such moves (Chen 2014). The former fear rising expenses for public services
if migrants were awarded equal access. Furthermore, local authorities are concerned about
the loss of competitive advantages should wage differences disappear and social welfare
benefits apply universally. The pool of cheap labour which has supported manufacturing
growth in many areas would dry up quickly with profound implications on the local economy,
tax revenues and employment. Significantly, abolishing the hukou system puts locals and
migrants in competition for jobs, public services and welfare system. (Chen 2014 at 74).
Another segmentation of the urban labour is linked to company ownership. As Liu, Yi and Yu
(2014) have pointed out, employees of SOEs benefit from higher pay, better social welfare
benefits and stronger job security. While workers in state business have lost eligibility for
lifelong tenure in their respective units in the 1980s and 1990s, they are still privileged com-
pared to their peers in private companies. Wang (2015) writes about the dual labour market
in a recent paper proposing that
“a political elite is able to extract surplus from state firms and tax the private sec-
tor, however, it faces a political constraint, that is, support from sufficiently many
citizens. To gain the support, it implements the “divide-and-rule” strategy. It cre-
ates a dual labour market, in which state workers receive high wages and private
workers’ wages are reduced due to the policy distortion. The state workers who
benefit from the policy become the elite’s supporters. Furthermore, to satisfy the
political constraint, the elite finds it optimal to distort the allocation of capital be-
tween state and private sector” (Wang 2015 at 3)

© THINK!DESK China Research & Consulting 2015 Seite 185
In addition to immediate government concerns, private employers are more likely to skirt la-
bour laws, under-pay wages and under-contribute to social security funds. Partly due to
higher business risk, wage arrears are significantly more common and unpaid labourers have
become a source of (localised) unrest.
In order to maintain employment levels, boost training and support contributions to social
security funds, Chinese government organisations, particularly on the local level, are offering
generous financial support to selected companies. The following table 41 presents an outline
of the grants obtained by companies listed in Shanghai and Shenzhen.
Table 41: Total Disbursements Subsidies Related to Labour
2010 2011 2012 2013 2014 Total
1,172,257,042 679,237,166 1,429,016,729 1,221,751,078 766,355,046 5,268,617,061
Source: Wind Data
In 2014, at least 656 enterprises have benefitted from government subsidies depressing the
cost of labour. The ten largest recipients are listed in the following table 42.
Table 42: Top 10 Recipients of Subsidies Related to Labour in 2014
Rank Enterprise Amount
1 Sinoma Science & Technology Co., Ltd. 39,096,500
2 Sanquan Food Co., Ltd. 31,820,607
3 Baoshan Iron & Steel Co., Ltd. 31,503,257
4 Fangda Carbon New Material Co., Ltd. 26,776,400
5 Xinjiang Sayram Modern Agriculture Co., Ltd. 25,152,886
6 Nanning Sugar Industry Co., Ltd. 22,902,077
7 Great Wall Motor Company Limited 20,953,352
8 Ningbo Donly Co., Ltd. 20,533,799
9 Sanan Optoelectronics Co., Ltd. 15,525,709
10 Shanghai Bailian Group Co., Ltd. 11,767,031
Total 246,031,618
Source: Wind Data

© THINK!DESK China Research & Consulting 2015 Seite 186
2.4.1.3 Land Markets
Directly or indirectly, the Chinese government is the sole owner of all land inside the country.
Its prominent status is manifested in the national constitution which provides for a basic legal
framework on questions of ownership, usage and administration. Chinese law segregates
rural and urban land. The difference, however, is not so much rooted in location or type of
usage but centres on the question of ownership. According to the constitution, rural and ur-
ban land is owned and controlled by collectives and the state respectively. In the following,
the terms rural land and collectively-owned land are used as synonyms while the terms ur-
ban land and state-owned land are interchangeable as well.
In the countryside, the land administration distinguishes between agricultural land and rural
construction land. While the former is reserved for farming and animal husbandry, the latter
may be used for development, i.e. the construction of housing, factories and infrastructure. In
urban areas, three usage classes distinguish between residential, commercial and industrial
land. All parcels of land in the country have a particular classification and, according to Chi-
nese law, land may only be utilised for specified purposes.
In the pre-reform era, no land markets existed in China and parcels were allocated at no cost
to whichever unit needed them. A sea change reform occurred in 1986 with the promulgation
of China’s Land Administration Law. It legalised the transfer of land use rights (LUR) to en-
terprises against payment of a fee. In the following year, the city of Shenzhen became pilot
for a land-for-fee scheme that was quickly adopted by other cities. Initially, the objective was
to provide relatively reliable LUR in order to attract investors (Peterson 2006). After the con-
cept had spread, essential regulation on LUR transfers was added to the constitution through
an amendment in 1988. The Provisions (for Trial Implementation) for the Sale and Transfer
of Land Use Rights in Cities and Towns (State Council 1990) clarified critical issues and
strengthened the regulatory framework on the national level. The Urban Real Estate Admin-
istration Law, which went into effect at the beginning of the same year, permitted auctions,
bidding and negotiations as legal procedures for government LUR sales. It also stipulated
that written contracts had to be concluded for any such transaction.
Until spring 2015, China’s land administration reforms have produced a large body of regula-
tory literature. However, the re-basing of land transactions on market principles has re-
mained highly incomplete. Liberalisation has thus far targeted the demand side, allowing
business and other organisations the opportunity to buy and sell LUR. The supply side, on
the other hand, was not subject to meaningful market opening.
State actors exercise strong control over the distribution of LUR and completely dominate the
land market. Urban LUR are transferable and work like financial assets. For rural ones the
transferability is restricted as agricultural land is considered a social security resource for the
people living on and of it. Collectively-owned land cannot be leased or mortgaged (World
Bank and PRC 2014).
© THINK!DESK China Research & Consulting 2015 Seite 187
As the remainder of this section will show, the bifurcation of ownership and usage rights
combined with the duality of collectively-owned rural land and state-owned urban land create
a system that is conducive to selective support for favoured industries and companies.
Important differences exist between “allocated” and “granted” LUR for state-owned LUR:
Allocated LUR represent the traditional form of making parcels available to government (af-
filiated) units without payment and for an indefinite length of time. Land and Resource Bu-
reaus (LRB) at or above the county level can provide allocated LUR for use by government
and military units. The process is also admissible for urban infrastructure as well as energy,
water and transportation projects. Furthermore, projects which are legally allowed and in the
public interest are eligible, too. Allocated LUR cannot be transferred, leased or mortgaged
without the local government’s consent. The latter also has the right to revoke allocated LUR
and retrieve the land at any point without paying compensation. SOEs which date back to the
pre-reform era typically continue to benefit from allocated LUR. Such companies were pro-
vided the land they continue to use at no cost. Due to the expansion of cities and the general
increase in land values, parcels occupied by SOEs have evolved into prime real estate.
With the special permission of local LRBs, allocated LUR may serve as collateral for bank
loans. The reduced default risk translates into lower credit costs and provides SOEs with
financial benefits. When China began a campaign several years ago to move heavy industry
outside densely populated areas, municipal governments did not exercise their right to re-
voke allocated LUR without compensation. Where localities reclaimed and resold land, the
proceeds were then transferred to the enterprise which had to vacate the parcel in question.
Since companies had to relocate to areas further outside the city, the cost for obtaining new
land was substantially less than the funds received for surrendering their original location. In
some cases, local governments provided additional steep price discounts on replacement
land.
WISCO Wuhan River North Co., Ltd. is a case in point. The SOE was asked to give up part
of its production plant in the heart of Wuhan as it had became increasingly incompatible with
local land use plans. The company returned its LUR and established a new production base
in a more remote location. As rapid economic development had driven up land demand over
the years, the value of the operation’s old base had increased significantly. Consequently,
the swap of location turned out to be highly profitable for River North: The land premium paid
for the LUR to its new site cost the company significantly less than the compensation it re-
ceived for giving up its original production base. Consequently, the enterprise was able to
invest the difference on technology upgrades and product development.
Granted LUR are based on contracts between the local government and the land user which
specify the types of economic activity allowed, the duration of the usage period and the
amount of a grant premium that has to be paid in return for LUR. The latter depends on the
size, location, quality, approved usage as well as other characteristics and represents the
LUR price. Premiums have to exceed certain minimum levels specified for every locality or

© THINK!DESK China Research & Consulting 2015 Seite 188
supervisory bodies on the next higher level of government will reject the contract. However,
local governments have significant influence in setting the minimum prices for land use in
different usage classes for their jurisdiction – a policy space which provides them the oppor-
tunity for offering industrial LUR at depressed prices.
After the contract has been signed, the premium paid and all regulatory filings completed, the
LUR bearer may begin to construct buildings and use the land for approved activities as well
as transfer, lease or mortgages it. When LUR are transferred, all terms of the land grant con-
tract the previous holder initially signed with the local LRB are automatically and completely
transferred to the new holder (World Bank and PRC 2014). The buyers and sellers of LUR
cannot determine the price only based on their relative bargaining positions. In fact, the local
government can exercise a pre-emptive right to purchase the LUR in question if the agreed
upon price is significantly below the local average (Xiao and Zhao 2015).
Granted LUR allow their bearer the use of land for only a limited period of time. Residential,
industrial and commercial LUR are valid for a maximum of 70 years, 50 years and 40 years
respectively. If the LUR bearer wants to continue using the land after the valid time has ex-
pired, he needs to file an application with the relevant LRBs at or above the county level. If
approved, a new LUR contract has to be signed and a new land premium has to be paid. In
case the LUR bearer does not file an application or his application is rejected, the local gov-
ernment will retake ownership of the land as well as all buildings on it. The Chinese land ad-
ministration regards LUR and buildings thereon as inseparable. As even the earliest LUR
were only transferred in the late 1980s and expiry is due in the late 2010s there is almost no
experience with LUR renewal procedures.
All LUR bearers have to pay land use tax on an annual basis. The tax is calculated based on
the size of the parcel with square meter prices varying significantly from region to region.
Larger and more developed cities charge significantly higher rates than remote county cities.
While the price in the centre of Shanghai is 30 RMB, land in the suburbs costs only 1.5 RMB
per square meter and year (China Briefing 19.02.2014).
Reforms in recent years have opened up limited opportunities for trading LUR. However,
they can only be transferred within usage categories – not across them. Even though the
final communiqué of the third plenary session of the 18th CPC Central Committee in Novem-
ber 2013 has hinted at reforms towards a unified market for LUR to be established in the
future, the duality between rural and urban land remains. The same applies to sub-categories
in both areas.
2.4.1.3.1 Conversion of Rural Land to Urban Land
The reclamation of agricultural land by local governments has been a source of conflict as
local residents are often not sufficiently compensated for their loss. Chinese land law man-

© THINK!DESK China Research & Consulting 2015 Seite 189
dates that compensation has to base on the expected future income generated under current
usage classification. As returns from agricultural production are low, relative to other types of
use, compensations to farmers are small.
Without physically changing the structure or quality of the parcels involved, local land admin-
istration departments change its usage classification before reselling it to developers or in-
dustrial investors. Due to the substantial price gap between LUR of different usage classifica-
tions, land usage conversion generates windfall profits. This remains true even where locali-
ties offer steep discounts on industrial LUR to new investment projects.
Farmers have little bargaining power in negotiating their compensations as there is no mar-
ket mechanism to assign a universal price for land. Farmers losing land attain an average
compensation of 17 thousand per acre (median is 12 thousand), while the expropriated land
fetches an average price of 778 thousand RMB (median is 200 thousand RMB) (Chen 2014).
Until a few years ago, farmers were not able to buy, sell or mortgage their land. Furthermore,
agricultural land that was not cultivated, for example because peasant farmers had gone to
find work in urban centres, was forcibly reclaimed by the authorities. Recent reforms have
strengthened the property rights regime for rural land and improved its marketability.
Due to the land administration regime, cities have expanded at the expense of agricultural
land. Large industrial and infrastructure projects have reduced the amount of farmland as
well. In order to prevent urban sprawl and arbitrary land reclamation by local governments,
rural-urban land conversion quotas were introduced in the early 2000s (Cai 2012). As mount-
ing environmental problems and rapid urbanisation accelerated the loss of farmland, central
government changed the status of conversion quotas from guiding to binding. Additional
concerns included safeguarding the country’s food supply and preventing social unrest from
forced land takings (Zhang et al. 2014).
This adjusted quota system limits the amount of rural land that localities may convert for ur-
ban use every year. The exact annual quotas for every locality are laid out in their respective
land use plans. All such plans are contained in the National Plan for Land Use 2006-2020.
The latter marks a departure from previous land management practice that endorsed or at
least tolerated the reclamation of arable land for urbanisation and industrialisation for the
benefit of national economic development. In contrast, the National Plan prescribed the
preservation of as much arable land as possible. Planning for a 15 year period from 2006 to
2020, it allowed for only a minute reduction in arable land: from 122.1 million hectares in
2005 to 120 million hectares in 2020. In order to reconcile growing land demand and farm-
land protection, planners called for increased reclamation and consolidation efforts. The
farmland created in this way was supposed to compensate for areas lost to urban develop-
ment (Xiao and Zhao 2015).
The unified, nationwide administration of conversion quotas is reminiscent of the central
command economy. The National Plan is broken down into provincial plans. Provincial au-
thorities then allocate quotas to subordinate prefectures which in turn make allocations for

© THINK!DESK China Research & Consulting 2015 Seite 190
counties under their control. The system is highly rigid and does not sufficiently take into ac-
count the actual economic and social development characteristics which determine the indi-
vidual demand for land conversion (Xiao 2015).
Furthermore, the need for adjustments is significant as the National Plan was drafted based
on development projections dating back to 2005. Considering the long time horizon, it does
not come as surprise that forecasts turned out wrong in many cases. These errors continue
to cause a mismatch between the demand from urban economic activities and the supply of
land that can be converted. Localities where development has been vibrant found their de-
velopment constrained by conversion quotas while other cities converted arable land in the
absence of promising development opportunities. The latter are disadvantaged because un-
der the current system it is impossible to save up unused quotas for future use (Tan 2011).
In order to offset conversions of arable land beyond the quota limitation, localities have to
return an equal area of urban land to farming use. This is irrespective of local geography, soil
quality or the relative scarcity of land. The static nature of land use plans is a major source of
inefficiency as the annual quotas for rural-to-urban land conversion are more based on the
political importance of cities than their economic dynamism (Tan 2011; Xiao and Zhao 2015).
In recent years, local governments have developed creative solutions in order to circumvent
the stifling effect of conversion quotas: markets. Quota markets do allow the trade of unused
conversion quotas across jurisdictions albeit with certain limitations. More importantly, the
concept bases on the creation of “virtual quotas” through increasing the usage intensity of
rural construction land. This frees up more rural areas for agricultural use and thus expands
the conversion limit. Xiao and Zhao (2015) explain that village residents are resettled from
individual farm houses into large apartment buildings which occupy significantly less space.
The old dwellings are then demolished and the rural construction land converted to agricul-
tural use. The resulting increase in farmland can then be credited against an equivalent area
of land for rural-urban conversion.
However, it is important to note that local government organisations and officials still enjoy a
significant degree of discretion in managing LUR. Especially in less developed areas, author-
ities have proven adept at skirting the regulatory straightjacket the central government has
prescribed over the years. In fact, a lack of transparency and public oversight has allowed for
internal directives and policies to influence decisions. Such practices exploit grey areas or
cover up rule violations. Through interviews with local officials, Xiao and Zhao (2015) discov-
ered that industrial parks and SOEs often received preferential treatment outside the regular
conversion quota system. They write
“Quotas allocated to a locality at the beginning of each year, as prescribed in the
annual plan, are only an initial allocation. In fact, higher levels of government of-
ten reserve some quota as a “contingency” for “special case” projects not includ-
ed in the annual plan. How much contingency quota is available and what pro-

© THINK!DESK China Research & Consulting 2015 Seite 191
jects can be considered to be “special” is, not surprisingly, subject to negotiation”
(Xiao and Zhao 2015 at 12).
Before new regulation was released in 2002, local authorities preferred to sell granted
LUR by way of bilateral negotiation rather than auction or bidding. The lack of trans-
parency invited frequent rule violations which led to corruption in the form of cronyism
and embezzlement of public funds. Even though local governments were ordered to
employ auctions and invited bidding in setting the LUR premiums. In fact, however,
localities have often ignored central government regulation and continued to employ
non-transparent negotiations to determine the conditions of LUR transactions. Oppor-
tunities for corrupt behaviour thus survived and allowed decision makers to retain prof-
its (U.S. ITA 2008 at 16). In its final affirmative countervailing duty determination
against imports of laminated woven sacks from China, the U.S. International Trade
Administration concluded that
“There is a wide divergence between the de jure reforms of the market for land-
use rights and the de facto implementation of such reforms. […] Also, commercial
land sales are often conducted illegally” (U.S. ITA 2008 at 16).
2.4.1.3.2 Influence of Sectoral Industrial Policy on Land Regulation
The Land Administration Law orders localities to improve the administration of land use
plans. The latter
“shall be compiled in line with the national economic and social development
plan, the State industrial policies, general plans for land and the actual situation
about the land for construction uses and the land utilisation“(NPC 2004b at 24).
Regarding the allocation of land to different projects, the State Council has urged local gov-
ernments to implement differential treatment which is protecting advantageous projects and
discriminates against others. Relevant departments should formulate and implement stand-
ards for land use in line with national sector industrial policies. LRBs around are ordered to
execute LUR allocations in accordance with industrial guidance catalogues. The affiliation of
a proposed investment project to an industry that is encouraged, permitted, restricted or pro-
hibited, is to determine the treatment received by LBRs (State Council 2004 at 1.18).
In 2012, the MLR released the Opinions on promoting differential administration of land use
plans to affirm its previous stance. The document rules that LUR should first and foremost be
allocated to projects that serve the public interest and are in compliance with sectoral indus-
trial policies and investment policies. Preference is to be given to projects from the SEI as
well as those related to high technology and high added value manufacturing (MLR 2012 at
3.8).
© THINK!DESK China Research & Consulting 2015 Seite 192
Localities have found to be using exemptions from local land use tax as incentive for attract-
ing investors or for rewarding important projects. In 2007, the MOF and the SAT have issued
a circular warning local LBRs to observe national regulation and not to make too generous
concessions.
“Each region shall rigidly control tax reductions and exemptions, and comply with
the relevant state requirements for strengthening land administration, rigidly con-
trol the reduction and exemption of land tax on various development zones, parks
or projects whose development is restricted by State industrial polices; and shall
not reduce or exempt the land tax on the projects inconsistent with the industrial
policies of the state” (MOF and SAT 2007 at 2).
Regulation governing both the allocation of LUR - regardless if by way of negotiation, bid-
ding, auction or quotation - requires local LBRs to consider sectoral industrial policies.
“Where any assignment is based on a base price, The administrative department
of land and resources at the municipal or county level or the organ in charge of
the coordination and decision-making of the assignment of the state-owned land
use right shall, according to the result of land price evaluation, industrial policies
and the current land market, make a collective decision on determining the base
price and the deposits for bid tendering and purchase in a comprehensive man-
ner” (MLR 2006 at 7.2).
The same document contains similar provisions for the verification of the assignment
sum as well as the drafting of assignment plans (MLR 2006 at 6.3.3 and 7.3.3).
2.4.1.3.3 LUR Allocation as Instrument for Selective Subsidisation
Since the early 2000s, the LUR premiums of the three separate usage classes in the urban
context (residential, commercial and industrial use) have followed diverging trends. On the
one hand, residential and commercial LUR have displayed strong price increases. The price
of residential land sold to developers has risen particularly quickly as investment in housing
has skyrocketed across the country. Similarly, prices for commercial land have risen consid-
erably.
In contrast, industrial land has seen a much less pronounced price increase. Cities and sub-
ordinate jurisdictions are locked in an intense competition for investment projects that prom-
ise to boost local GDP, employment and other economic indicators. The latter serve as vital
benchmarks for the annual performance assessment of government and party units as well
as individual government officials and party cadres. Successfully attracting major projects
thus has the potential to boost the standing of the units in charge and propel the careers of
© THINK!DESK China Research & Consulting 2015 Seite 193
relevant staff. Localities are thus weighing the benefits of landing large-scale investment pro-
jects against the costs of providing land use rights at discounted prices. By pushing up the
valuations of residential and commercial land, localities are compensating for revenues for-
gone on free or cheap transfers of industrial land.
As a result of highly investment friendly market intervention, land is not being allocated or
priced based on its true value. Instead, the artificial segmentation of the land market implies
that both aspects are largely determined at the discretion of local officials which guided by a
narrow set of pro-investment incentives.
“The government by virtue of its monopoly position in the land market provides a
lot of cheap industrial land to enterprises, greatly encouraged business enthusi-
asm” (Chen 2014 at 65).
Similarly, the U.S. International Trade Administration found that
“Due to the overwhelming presence of government involvement in the land-use
rights market, as well as the widespread and documented deviation from the au-
thorised methods of pricing and allocating land, purchase of land-use rights in
China is not conducted in accordance with market principles” (U.S. ITA 2008 at
16).
The U.S. International Trade Administration also concluded that the role of private LUR mar-
ket has become stronger. However, the organisation found that favoured enterprises, such
as SOEs benefitted from LUR obtained at little or no cost. Indeed, paragraph 17 of the Land
Administration Law mandates that all levels must take into account the national programme
for economic and social development in drafting their land use plans. More explicitly, para-
graph 24 states that in the preparation of annual land use plans, proper regard should be
given to sectoral industrial policy guidelines.
The provision of land under favourable conditions has been identified as a legitimate incen-
tive for enterprises engagement in M&A by China’s central government. Favourable treat-
ment of land use rights were also confirmed in The Opinions Concerning the Promotion of
Enterprise M&A (State Council, 2010b), in which e.g. steel is classified as a special policy
target. Similarly, the Several Opinions on Further Strengthening Energy Conservation and
Emissions Reduction and Accelerate the Structural Adjustment of the Steel Industry (GOSC
2010) also notes that the field of land use should be utilised by local government policies in
order to promote M&A. In 2013, the MIIT’s Guiding Opinions on Accelerating the Promotion
of M&A for Enterprises in Key Industries required local M&A promotion measures to include
provisions on land administration.
Gansu Province (2011a) announced in its Plan on Accelerating the Development and Coop-
eration of Industrial Enterprises, that “full use should be made of the control over land utilisa-
tion planning to prioritise land usage of key projects”. This plan, based on the lowest national

© THINK!DESK China Research & Consulting 2015 Seite 194
industrial land utilisation price, aims to reduce from 15 up to 50 percent on the fees for
wasteland. Land demand from major industrial projects is to be protected and a “green chan-
nel” is to be established that offers an accelerated approval process for listed companies
(app. 6). Gansu Jiuquan Steel has been identified in several documents as a key provincial
project and it is highly likely that the company is eligible for land use rights on preferential
terms and at reduced prices. Hardly surprising, this mill is owned by the Province.
Shandong Province (2011e) has also committed to the provision of land on favourable condi-
tions. In its Implementation Opinions on Accelerating the Development of Strategic Emerging
Industries, the government requires that “Governments at all levels should give priority to
land demand from projects of strategic emerging industries.” A rebate of up to 30 percent is
promised in the document, based on the lowest land leasing price that was obtained by other
industrial projects (at 6.27).
Subsidies related to land use are substantial and show a consistent increase over the past
five years. In comparison, the annual total for all listed companies in 2010 represents just
one quarter of transfers made in 2014. The following tables 43 and 44 present data to illus-
trate this development.
Table 43: Total Disbursements of Subsidies Related to the Use of Land
2010 2011 2012 2013 2014 Total
552,081,335 859,673,480 1,208,223,808 1,801,106,794 2,305,902,573 6,726,987,990
Source: Wind Data
In 2014, at least 279 enterprises have benefitted from subsidies related to the use of land.
The ten largest recipients are listed in the following table 44.

© THINK!DESK China Research & Consulting 2015 Seite 195
Table 44: Top 10 Recipients of Subsidies Related to the Use of Land in 2014
Rank Enterprise Amount
1 SAIC Motor Corporation Limited 600,360,271
2 Ma’anshan Iron & Steel Company Limited 307,861,681
3 Metallurgical Corporation of China Ltd. 163,563,000
4 Anhui Heli Co., Ltd 100,830,251
5 Guangzhou Zhujiang Brewery Co., Ltd. 98,479,283
6 Yangzhou Asiastar Bus Co., Ltd. 67,000,000
7 Huatian Hotel Group Co., Ltd. 65,308,300
8 Beijing Jingneng Power Co., Ltd. 64,922,404
9 Luoyang Glass Company Limited 60,012,700
10 Tianjin FAW Xiali Automobile Co., Ltd. 55,589,000
Total 1,583,926,890
Source: Wind Data
2.4.1.3.4 Relocation Subsidies
In recent years, the Chinese government – especially lower level authorities – have launched
a major push to remove industrial production from (the vicinity of) city centres and residential
areas. Rapid urban development and economic growth have had a substantial impact on
local land use plans. The expansion and upgrading of metropolitan areas have rendered
many heavy industry bases increasingly incompatible with their surrounding areas. In order
to promote economic development, alleviate pollution pressures in densely populated urban
districts and improving the living environment for the local population industrial plants have
been forced to relocate to more remote sites outside the city. Cities oftentimes sweeten the
deal by sponsoring the compulsory relocation. However, support goes beyond compensating
for lost buildings and moving expenses. In many cases it also includes land use rights at re-
duced cost and the renovation of production technology. These schemes may also include
subsidies for constructing housing for workers and a variety of other cost items.
The case of Jinmu Guangming Co., Ltd. is a case in point. The subsidiary of state-owned
Jinduicheng Molybdenum Co., Ltd. was founded in 1959 and has started the making of tung-
sten and molybdenum products in the early 1970s. Today, the company’s product portfolio
includes pure molybdenum trioxide, molybdenum powder, molybdenum rod, molybdenum
wire and tungsten rods. The company has registered capital of 164 million RMB and employs
over 600 workers at its base in Zibo City, Shandong Province (Jinmu Guangming n.d.). In
2012, the local government announced its plan to convert the area occupied by Jinmu
Guangming’s two production plants into commercial land. It ordered the company to relocate

© THINK!DESK China Research & Consulting 2015 Seite 196
away from its bases east of national road 309 and south of Mihe Road, both in Zhoucun Dis-
trict. In September of the same year, the local government and the company agreed that
former will reclaim the LUR from Jinum Guangming and cover the latter’s expenses for land
and materials up to 44.94 million RMB. In addition, district authorities pledged to waive land
premiums for the new production base up to 2.05 million RMB.
When the agreement was concluded, Jinmu Guangming reported that the two parcels held
buildings and structures of an original cost and book value of 20.24 million RMB and 12.48
million RMB respectively. LUR were registered at original cost and book value of 10.11 RMB
and 8.80 million RMB respectively. By the end of 2014, the company had received relocation
subsidies worth 37.77 million RMB. At the same time, regular depreciation had decreased
the book value of buildings and structures to 16.91 million RMB as the relocation had not yet
taken place (Jinduicheng 2012 AR at 127; 2013 AR at 101 and 2014 AR at 107).
It is difficult to gauge the net effects of the move and related subsidies on the company’s
financial performance. Crucial factors like the cost for dissembling, transporting and re-
assembling production equipment, environmental clean-up or lost production output cannot
be calculated with the little information provided by publicly available company reports. How-
ever, assuming the move took place immediately following the end of fiscal year 2014, the
company appears to have been granted sufficient subsidies to alleviate the financial burden
involved.
Listed companies have received large amounts of relocation subsidies. The following two
tables 45 and 46 offer a detailed account of these transfers.
Table 45: Total Disbursements of Relocation Subsidies
2010 2011 2012 2013 2014 Total
1,596,441,845 1,650,691,478 4,754,555,413 2,916,933,221 4,423,035,152 15,341,657,109
Source: Wind Data
In 2014, at least 211 enterprises have benefitted from grants for moving their facilities to new
locations. The ten largest recipients are listed in the following table 46.

© THINK!DESK China Research & Consulting 2015 Seite 197
Table 46: Top 10 Recipients of Relocation Subsidies in 2014
Rank Enterprise Amount
1 SAIC Motor Corporation Limited 600,360,271
2 Chongqing Iron & Steel Company Limited 506,983,000
3 Shijiazhuang Changshan Textile Company Limited 337,137,312
4 CSR Corporation Limited 241,385,474
5 Metallurgical Corporation of China Ltd. 163,563,000
6 Tsingtao Brewery Company Limited 160,855,912
7 Weifu High-Technology Group Co., Ltd. 152,620,735
8 Nanning Chemical Industry Co., Ltd. 105,090,335
9 AVIC Aero-Engine Controls Co., Ltd. 104,645,799
10 Guangzhou Baiyunshan Pharmaceutical Holdings Company
Limited 97,605,261
Total 2,470,247,099
Source: Wind Data
Unfortunately, financial support for the demolition and relocation is not always visible as part
of non-operating income. For that reason, the following table 47 present information on sub-
sidies as deferred income for selected listed companies.

© THINK!DESK China Research & Consulting 2015 Seite 198
Table 47: Subsidies for Plant Demolition and Relocation
Enterprise Year Amount Source
Zhangzhou Pientzehuang Pharma-
ceutical Co., Ltd.
2008-
2014
9,600,000
(DI/NCL)
2010 at 112
2014 6,712,016
(DI/NCL)
2014 at 117
China United Network Communica-
tions Ltd.
2013 8,964,673
(NIO)
2013 at 145
China National Accord Medicines
Co., Ltd.
2012 120,250,000
(DI/NCL)
28,504,107
(NOI)
2013 at 147
2012 at 154
2013 2,698,409
(NOI)
2013 at 131
2014 2,698,409
(NOI)
2014 at 128
Weifu High-Technology Group Co.,
Ltd.
2013 7,900,000
19,707,000
(both DI/NCL)
509,265
(NOI)
2013 at 138
2013 at 147
2014 152,620,735
(NOI)
2014 at 134
AVIC Aviation Electronics Co., Ltd. 2012 3,191,990
(NOI)
2012 at 140
2013 5,109,953
(NOI)
2013 at 114
Jinduicheng Molybdenum Co., Ltd. 2012 44,940,960
(DI/NCL)
15,000,000
(special paya-
bles)
2012 at 127
2012 at 102
2013 10,000,000
(special paya-
bles)
2013 at 101

© THINK!DESK China Research & Consulting 2015 Seite 199
Enterprise Year Amount Source
16,098,667
(NOI)
2013 at 106
2014 13,083,504
(special paya-
bles)
15,033,929
(NIO)
2014 at 87
2014 at 92
China Resources Double-crane
Pharmaceutical Co., Ltd.
2012 6,500,000
2,549,600
(both NIO)
2012 at 123
2013 744,600
(NIO)
2013 at 125
China Resources Sanjiu Medical &
Pharmaceutical Co., Ltd.
2012 89,601,477
(DI/NCL)
51,591,612
(NIO)
2012 at 126
2012 at 132
2013 551,188
(DI/NCL)
1,010,000
(NIO)
2013 at 147
2013 at 155
China Northern Rolling Stock Co.,
Ltd.
2011 71,258,000
(NIO)
2012 at 183
2012 41,881,000
(NIO)
2012 at 183
2013 39,546,000
(NIO)
2013 at 188
2014 39,266,000
747,000
(both NIO)
2014 at 122
Tianjin Zhonghuan Semiconductor
Co., Ltd.
2011 11,268,808
(NOI)
2011 at 137
2014 2,199,279
(NOI)
2014 at 145
China Southern Rolling Stock Co., 2014 172,848,624 2014 at 151

© THINK!DESK China Research & Consulting 2015 Seite 200
Enterprise Year Amount Source
Ltd. (DI/NCL)
241,385,474
(NOI)
Sinochem International Corporation 2012 6,787,646
(DI/NCL)
2012 at 193
2014 510,000
(DI/NCL)
2014 at 144
China Shipbuilding Industry Co., Ltd. 2012 26,758,524
(DI/NCL)
2012 at 158
2013 26,758,524
(DI/NCL)
2014 at 160
2014 41,463,143
(DI/NCL)
2014 at 160
NOI : Non-operating income
DI/NCL: Deferred income as part of non-current liabilities
Compilation by THINK!DESK.

© THINK!DESK China Research & Consulting 2015 Seite 201
2.4.2 Markets for Goods and Services
Chinese government agencies are not only intervening in the allocation and pricing of the
factors of production capital, labour and land, but also intervene in specific product markets.
The following chapters document the character of these interventions and the instruments
applied.
2.4.2.1 Price Controls and Market Distortions in the Field of Utilities
2.4.2.1.1 Electricity
The price of electricity in China is relatively low. In April 2015, consumers in Sichuan Prov-
ince only paid 0.44 RMB (0.064 Euro) per kilowatt hour (Sichuan 2015). Energy generation
capacity increased at a brisk pace since the turn of the millennium. In 2007, in was reported
that on average China built two large power plants per week (BBC 19.06.2007). As China
possesses large reserves of coal, thermal power plants have traditionally been the mainstay
of electricity production. Between 2005 and 2009, China added coal-fired power plants equal
to the total plant capacity of the United States. The rapid build-up of new capacities led to a
substantial improvement of the supply situation. Supply bottlenecks that had plagued private
households and manufacturing businesses alike since the early 1990s were resolved for the
most part during the 10th FYP period (2001-2005). Following a rapid rise until 2010, the con-
struction of new plants has slowed in the years following the global financial crisis. In 2014,
the average new plants per week dropped to below one. But this rapid expansion has not
only brought about supply safety - it has also contributed to a situation of overcapacity. In
fact, energy demand has been flat in the past two years as industrial activity suffered from a
broad based economic slowdown. Additional pressures come from a rapid policy-driven in-
crease in the output of renewable and nuclear energy. Under the influence of these factors,
the output of coal-fired power plants has actually dropped slightly in 2014 (Greenpeace
2015).
The oversupply situation combined with a sharp drop in coal prices have allowed electricity
prices to stay relatively low – even though an environmental protection fee is levied per kilo-
watt hour. Energy production is concentrated in the hands of a small group of giant SOEs.
This oligopoly controls the electricity production while prices for private and industrial con-
sumers are dictated by the Commodity Pricing Office of the NDRC and the SERC. Power
grids throughout the country are owned and operated by just two enterprises: State Grid and
China Southern Grid. Both are SOEs controlled by the SASAC of the State Council. They do
not compete against each other but divide up the Chinese territory in regional (and exclusive)
spheres. City governments have a limited say in the setting of electricity prices for their juris-
dictions as local social and economic conditions as well as regional variations in the con-
sumer structure are taken into account. Local authorities also have a limited influence on the

© THINK!DESK China Research & Consulting 2015 Seite 202
grid operation and can connect or disconnect individual electricity consumers. As part of the
large portfolio of incentive policies offered to potential investors, cities have granted large
discounts on electricity rates or even arranged for free power supply. High Technology Zones
have been found to provide more or less uniform benefits to resident companies. In many
cases, however, practices have been case specific, meaning that preferential supply ar-
rangements were crafted according to the business model and relative attractiveness of the
new investor. Discounts could be temporary or permanent as the government either agreed
to pay a certain share of an enterprise’s power bill to the grid company or disbursed electrici-
ty subsidies to the enterprise.
Due to the environmental problems associated with China’s heavy reliance on burning coal,
the Chinese government has introduced a series of measures to curb negative externalities
from overly cheap power and discourage excessive consumption. While laws and regulation
on preventing air pollution order power plants to upgrade technologies and install filtering
equipment, electricity users had to meet certain energy conservation standards and abide by
the relevant industrial policies for their sectors. In May 2007, then Premier Wen Jiabao called
for limits on enterprises that waste energy or damage the environment. He emphasized that
reducing energy consumption was a critical element in bringing about a sustainable econom-
ic growth model for the country. China’s official China Daily (08.05.2007) cited Wen as say-
ing that “We are left with no choice but to develop in an economical, clean and safe way”.
Wen blamed the unchecked growth of energy intensive industries like metals, petrochemicals
and building materials for much of the ecological footprint left by the energy sector. In the
same speech, Wen pledged to employ a combination of policy measures in the fields of
commodity pricing, environmental protection, foreign trade and others to confront six indus-
tries that accounted for 70 percent of industrial electricity use. In an unusually direct way,
Wen criticized the broad bandwidth of preferential policies employed by localities to lure in-
vestors in energy intensive industries. In this context, he explicitly warned against the prac-
tice of subsidizing the cost of electricity and underlined the importance of pricing reforms
towards differential energy pricing for different users (China Daily 08.05.2007).
Beginning in 2006, the central government has launched reforms to implement a differential
pricing system for electricity. Similar schemes for natural gas, water and other utilities were
introduced shortly thereafter. In 2006, the NDRC issued the Circular on Opinions concerning
optimizing differential electricity pricing policies. The document established energy pricing as
regular tool for pursuing national industrial policies for fighting overcapacities, eliminating
obsolete capacities, streamlining industrial structures, upgrading production technologies,
cutting power consumption and protecting the environment. The Opinions called on local
governments to monitor and evaluate the performance of enterprises inside their jurisdiction
with regards to energy conservation. Producers of steel, ferroalloys, electrolytic aluminium,
zinc, calcium carbide, caustic soda, phosphorus and cement received special attention. The
NDRC order energy prices increases specifically for companies that employed production
technologies listed in the restricted or prohibited categories of the Catalogue for the Guid-
ance of Structural Adjustment of Industries. A timetable specified exactly when and by how
much electricity rates would have to be raised for said products.

© THINK!DESK China Research & Consulting 2015 Seite 203
Dissatisfied with nationwide implementation efforts, the NDRC and the State Electricity
Regulatory Commission (SERC) issued the Circular on resolutely implementing differential
electricity pricing policies and strictly prohibiting any preferential pricing schemes. It com-
plained that seven provincial level jurisdictions, including Beijing City, had made no visible
efforts in compiling lists of companies to be targeted by increased electricity prices. Another
eight provinces had not even communicated the NDRC’s directive to their local businesses.
Remarkably, 14 regions had continued to negotiate individual power rates with large industri-
al consumers or used other practices to provide electricity discounts. The two commissions
warned municipal governments to observe national policy and ensure their swift implementa-
tion. While cities were largely left to control themselves, the Circular threatened that future
violations would be criticized and reported to the State Council. It warned that the jurisdic-
tions in questions might be punished with reduced investment in their power infrastructures
(NDRC and SERC 2007a).
In the same month, the NDRC and the SERC (2007b) directly addressed 17 provincial Ener-
gy Supervision Commissions demanding status updates on the policy implementation. The
local organizations were to report in detail about their work and the problems encountered.
The document announced that representatives from the two central government commis-
sions would hold meetings with their provincial counterparts to seek more information. The
delegation would be dispatched to meet with provincial energy officials, review available
documentation and make 2-3 inspection visits to randomly selected cities in every province.
Considering the very large number of cities and companies located in the 17 provinces, this
approach proved largely ineffective. Both central government bodies suffered from serious
understaffing which made it almost impossible to safeguard effective supervision and in-
crease detection risks. Municipal officials enjoyed relatively large decision making space and
faced strong disincentives to raise the cost burden of local companies. Local authorities for-
warded central directives, formed leading small groups and appeared to act in line with na-
tional policy while finding creative ways to skirt the very same.
Fifteen months after the differential pricing system was established, progress on the imple-
mentation had been sluggish. Energy consumption from the eight focus sectors had contin-
ued to increase at a fast pace and little success was visible with respect to the ultimate policy
aims, like adjusting the industrial structure or phasing out outdated plant equipment. Imple-
mentation of the mandatory price increases had been patchy as localities either lacked the
information or the resolve necessary. Even where prices had been adjusted, the effects on
company operations had been mostly negligible. Fines for non-compliance were relatively
low as was the detection risk. In September 2007, the NDRC and two other central govern-
ment bodies released the Circular on problems related to the continued implementation of
the differential electricity pricing policy. The document announced some minor changes in
the composition of the industrial processes to be hit by higher energy costs. Importantly, it
tried to increase acceptance on the local level by reserving additional revenues from higher
priced electricity for local usage in energy conservation projects. Importantly, The Circular

© THINK!DESK China Research & Consulting 2015 Seite 204
also announced more inspections to take place later that year (NDRC, MOF and SERC
2007).
In 2008, central government regulators continued to overcome local government resistance
to the highly unpopular measures. Progress was slow and accomplishments had been mod-
est when the global financial crisis threw the Chinese manufacturing industry into turmoil.
Confronted with substantial economic challenges and struggling companies, local govern-
ments became even less willing to enforce the differential pricing approach. After the finan-
cial crisis, the situation improved further and a number of adjustments to the policy greatly
improve its effect.
By 2015, the practice has not only been implemented nationwide, it has also been generally
accepted as a way to guide corporate decision making. While the actual contribution of dif-
ferential energy pricing is hard to gauge and has been overshadowed by changing economic
trends and policy strategies, differential pricing has become a mainstay of the industrial poli-
cy tool box. The number of laws, circulars, opinions, guidelines and measures that include
this concept and similar approaches has increased across a wide range of policy fields. By
the time of writing, the pricing system in place allowed economic policy makers to fine tune
production activities in line with their preferences. Over the years, utility pricing has evolved
to also encourage investment activities in desired areas, e.g. SEI. In retrospect, the
measures employed in 2015 are akin to those used a decade earlier as the provision of utili-
ties at below market prices continues. A change has occurred with regard to the leading ac-
tors. As principal actors, the NDRC and the MIIT have wrest the power of differential pricing
out of the hands of local governments and made it instrumental to national policy. Through
strengthening its ability to supervise and sanction local government behaviour, central au-
thorities have reclaimed the authority to select sectoral investment targets and channel local
resources in the encouraged direction.
As the following table demonstrates, government organizations around the country have con-
tinued to hand out electricity subsidies to prioritized companies. Remarkably, the list of firms
benefitting from these transfers includes major players in energy intensive industries that are
subject to strict industrial policies for overcapacity elimination and industrial streamlining, like
electrolytic aluminium. Many of said companies, like the Aluminium Corporation of China,
Yunnan Aluminium and China Nonferrous Metal Industry, are large SOEs controlled by the
SASAC of the State Council – a fact that highlights a distinct pro-state bias in regulatory re-
strictions. Table 48 identifies the recipients of the largest electricity subsidies.

© THINK!DESK China Research & Consulting 2015 Seite 205
Table 48: Top 10 Individual Electricity Subsidies (2010-2014)
Year
Subsidy in-
come
Aluminium Corporation of China Ltd. 2012 560,376,000
Yunnan Aluminium Co., Ltd. 2013 256,000,000
Inner Mongolia Erduosi Resources Co., Ltd. 2013 176,390,000
Yunnan Aluminium Co., Ltd. 2012 62,401,118
Inner Mongolia Erduosi Resources Co., Ltd. 2014 50,000,000
Zhejiang Xinan Chemical Industrial Group Co., Ltd.
2011 29,326,800
Guangxi Guidong Electric Power Co., Ltd. 2014 25,920,000
Jiangsu Akcome Science & Technology Co., Ltd. 2012 22,063,481
China Nonferrous Metal Industry's Foreign En-gineering and Construction Co., Ltd.
2013 19,152,745
Anhui Huilong Agricultural Means of Production Co., Ltd.
2010 15,000,000
Total (Top 10 subsidy transfers) 1,216,630,144
Source: Wind Data
Remarkably, the ten largest recipients account for almost 80 percent of total electricity subsi-
dies of 1,532 billion RMB. Subsidies included in this analysis are limited to grants intended to
reduce electricity cost of production operations. They do not account for government trans-
fers for cutting residential energy rates for employees. Neither do they include subsidies re-
lated to setting up power lines and related infrastructures. In order ensure accuracy,
THINK!DESK has excluded feed-in tariffs paid to producers of renewable energy.
An even more prominent way for governments to help companies meet tightened energy
conservation requirements is the subsidization of necessary upgrading measures. Such
practices are very common and close to 40 percent of all listed companies have reported
receipts of subsidies related to energy conservation over the past five years. At least one fifth
of listed firms registered such grants in 2014 alone (see tables 49 and 50).
Table 49: Total Subsidies for Energy Conservation (2010-2014)
2010 2011 2012 2013 2014 Total
868,544,356 1,029,164,834 1,270,379,528 1,043,110,150 1,971,629,104 6.182.827.972
Source: Wind Data

© THINK!DESK China Research & Consulting 2015 Seite 206
Table 50: Top 10 Individual Subsidy Transfers Promoting Energy Conservation
(2010-2014)
Enterprise Year Amount
China Merchants Energy Shipping Co., Ltd. 2014 521,621,000
Shanghai Electric Power Co., Ltd. 2011 281,060,000
Chongqing Iron & Steel Co., Ltd. 2014 280,000,000
Lingyuan Iron & Steel Co., Ltd. 2012 150,000,000
China Eastern Airlines Co., Ltd. 2013 114,480,000
Hebei Jinniu Chemical Industry Co., Ltd. 2012 106,000,000
Wanhua Chemical Group Co., Ltd. 2010 105,601,439
China Eastern Airlines Co., Ltd. 2014 104,000,000
Zhongtian Urban Development Group Co., Ltd. 2014 103,931,816
Wanhua Chemical Group Co., Ltd. 2011 93,904,900
Total (Top 10 subsidy transfers) 1,949,986,734
Source: Wind Data
The amounts stated here refer only to subsidies for supporting energy conservation
measures of the benefitting companies. They are exclusive of transfer made to promote the
development and manufacture of energy-saving products, like white goods, brown goods and
vehicles. In the interest of accuracy, THINK!DESK research has also removed payments
supporting the production of certain industrial goods, like renewable power generation
equipment.
2.4.2.1.2 Water
While the administration of electricity prices is mainly controlled by the commodity pricing
offices under the provincial Development Reform Commissions, city governments have a
relatively strong influence on the pricing for fresh and waste water as well as related upkeep
fees. Like electricity charges, water prices have been selectively adjusted to encourage or
discourage investment projects. The basic principles at work are akin to the differential pric-
ing mechanism outlined in the previous section.
Where local governments sought to offer water related price discounts, they could either
lower the prices or provide subsidies as compensation. Unfortunately, pricing data for indi-
vidual industrial users is not available in China. However, THINK!DESK found ample subsidi-
zation in this field as the following tables 51 and 52 will illustrate:

© THINK!DESK China Research & Consulting 2015 Seite 207
Table 51: Total Water Subsidies (2010-2014)
2010 2011 2012 2013 2014 Total
15,886,573 7,921,849 9,380,337 4,323,884 12,009,887 49,522,530
Source: Wind Data
Table 52: Top 10 Individual Water Subsidies (2010-2014)
Enterprise Year Amount
Beijing Capital Co., Ltd. 2010 11,411,573
Heilongjiang Interchina Watertreatment Co., Ltd. 2014 11,409,887
Heilongjiang Interchina Watertreatment Co., Ltd. 2011 5,659,767
Heilongjiang Interchina Watertreatment Co., Ltd. 2010 4,400,000
Jilin Chemical Fibre Co., Ltd. 2012 3,998,200
Heilongjiang Interchina Watertreatment Co., Ltd. 2013 3,206,269
Heilongjiang Interchina Watertreatment Co., Ltd. 2012 2,707,137
Hunan Chendian International Development Share-Holding Co., Ltd.
2012 2,100,000
Hunan Chendian International Development Share-Holding Co., Ltd.
2011 1,494,700
Qian Jiang Water Resources Development Co., Ltd. 2013 942,615
Total (Top 10 subsidy transfers) 47,330,148
Source: Wind Data
The values contained in the table include water users and do not contain subsidies to pro-
ducers. Furthermore, the data was been cleared from subsidies supporting the construction
or improvement of distribution networks and storage facilities.
2.4.2.1.3 Coal
Several companies have received subsidies to reduce the average price paid for coal. Re-
markably, state-owned electricity generators are the main beneficiaries. The following tables
53 and 54 hold more detailed information on coal subsidies.

© THINK!DESK China Research & Consulting 2015 Seite 208
Table 53: Total Coal Subsidies (2010-2014)
2010 2011 2012 2013 2014 Total
121,049,342 576,181,763 152,036,410 152,036,410 152,036,410 1,153,340,335
Source: Wind Data
Table 54: Top 10 Individual Coal Subsidies (2010-2014)
Enterprise Year Amount
Huaneng Power International, Inc. 2011 400,650,000
Huaneng Power International, Inc. 2012 178,703,600
Huadian Power International Co., Ltd. 2012 150,170,000
Huaneng Power International, Inc. 2010 117,960,000
Huadian Power International Co., Ltd. 2011 116,224,000
Huaneng Power International, Inc. 2013 108,210,000
CCS Supply Chain Management Co., Ltd. 2014 68,000,000
Huaneng Power International, Inc. 2014 60,680,000
CPI Yuanda Environmental-Protection (Group) Co., Ltd.
2011 56,520,000
CPI Yuanda Environmental-Protection (Group) Co., Ltd.
2012 37,990,000
Total (Top 10 subsidy transfers) 1,295,107,600
Source: Wind Data
2.4.2.1.4 Heating
State owned companies are responsible for operating centralized heating systems in cities
and towns. Government organizations on different levels provide subsidies to these compa-
nies as the retail price for heating is kept artificially low to reduce the cost of living. The fol-
lowing tables 55 and 56 give an overview of heating subsidies provided between 2010 and
2014.
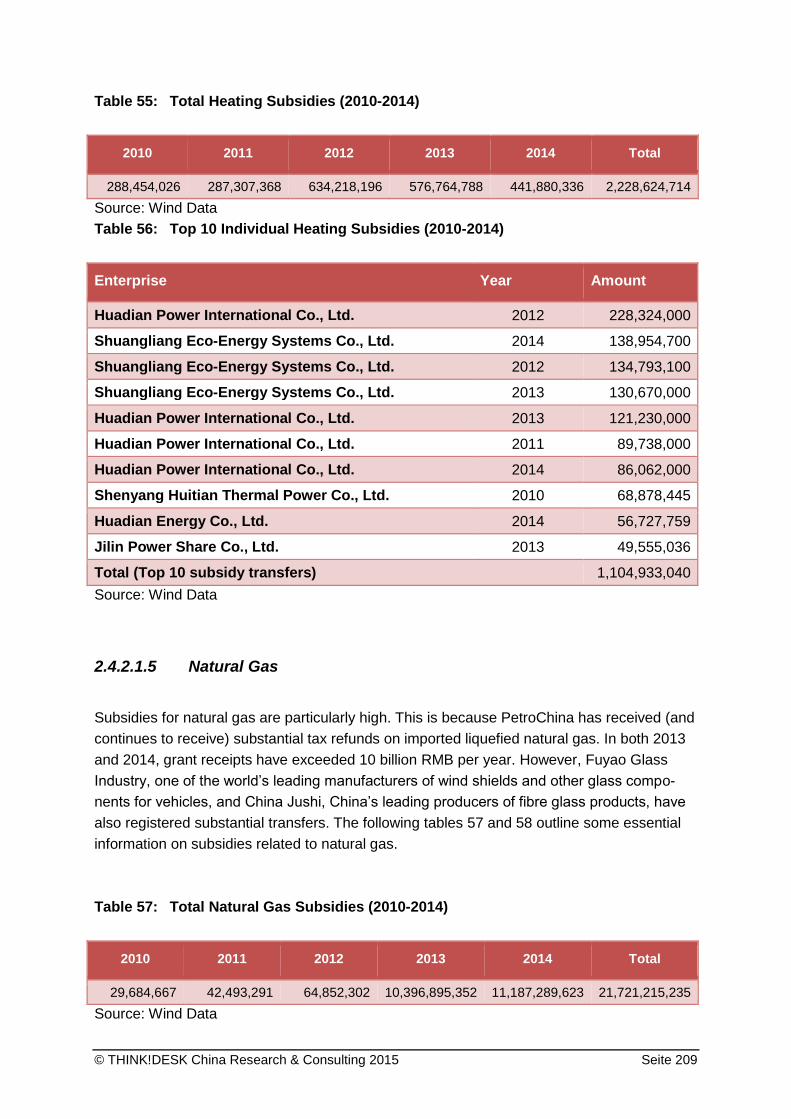
© THINK!DESK China Research & Consulting 2015 Seite 209
Table 55: Total Heating Subsidies (2010-2014)
2010 2011 2012 2013 2014 Total
288,454,026 287,307,368 634,218,196 576,764,788 441,880,336 2,228,624,714
Source: Wind Data
Table 56: Top 10 Individual Heating Subsidies (2010-2014)
Enterprise Year Amount
Huadian Power International Co., Ltd. 2012 228,324,000
Shuangliang Eco-Energy Systems Co., Ltd. 2014 138,954,700
Shuangliang Eco-Energy Systems Co., Ltd. 2012 134,793,100
Shuangliang Eco-Energy Systems Co., Ltd. 2013 130,670,000
Huadian Power International Co., Ltd. 2013 121,230,000
Huadian Power International Co., Ltd. 2011 89,738,000
Huadian Power International Co., Ltd. 2014 86,062,000
Shenyang Huitian Thermal Power Co., Ltd. 2010 68,878,445
Huadian Energy Co., Ltd. 2014 56,727,759
Jilin Power Share Co., Ltd. 2013 49,555,036
Total (Top 10 subsidy transfers) 1,104,933,040
Source: Wind Data
2.4.2.1.5 Natural Gas
Subsidies for natural gas are particularly high. This is because PetroChina has received (and
continues to receive) substantial tax refunds on imported liquefied natural gas. In both 2013
and 2014, grant receipts have exceeded 10 billion RMB per year. However, Fuyao Glass
Industry, one of the world’s leading manufacturers of wind shields and other glass compo-
nents for vehicles, and China Jushi, China’s leading producers of fibre glass products, have
also registered substantial transfers. The following tables 57 and 58 outline some essential
information on subsidies related to natural gas.
Table 57: Total Natural Gas Subsidies (2010-2014)
2010 2011 2012 2013 2014 Total
29,684,667 42,493,291 64,852,302 10,396,895,352 11,187,289,623 21,721,215,235
Source: Wind Data

© THINK!DESK China Research & Consulting 2015 Seite 210
Table 58: Top 10 Individual Natural Gas Subsidies (2010-2014)
Enterprise Year Amount
Petrochina Co., Ltd. 2014 10,931,000,000
Petrochina Co., Ltd. 2013 10,347,000,000
Guanghui Energy Co., Ltd. 2014 208,820,000
Fuyao Glass Industry Group Co., Ltd. 2012 50,000,000
Shanghai CIMIC Holdings Co., Ltd. 2013 21,585,000
Shenzhen Energy Group Co., Ltd. 2010 20,417,067
Fuyao Glass Industry Group Co., Ltd. 2011 16,339,500
China Gezhouba Group Co., Ltd. 2014 12,460,127
China Gezhouba Group Co., Ltd. 2013 10,724,877
China Jushi Co., Ltd. 2012 7,830,000
Total (Top 10 subsidy transfers) 21,626,176,571
Source: Wind Data
2.4.2.2 Price Controls Targeting Goods and Services
China continues to maintain a system of direct price controls. The number of commodities
and services covered, however, has been gradually reduced in recent years. The administra-
tion of prices for goods and services is governed by the Price Law of the People’s Republic
of China which entered into force on May 1st, 1998 (NPC 1997). Until the time of writing, the
government reserved itself the right to enforce price controls for “an extremely small number”
of goods and services that are deemed to be of major importance to national economic de-
velopment and have strong implications for people’s livelihood, plus some rare resources,
natural monopolies as well as major utilities and public services (NPC 1997 at 18). Price con-
trols are not limited to SOE sales but have to be observed by all suppliers of subject goods.
In fact, not all articles that match the criteria of article 18 are still subject to price regulation.
Agricultural and other commodities which are covered under state stockpiling programs ergo
ipso possess the required strategic importance qualifying them for direct price regulation.
However, the procurement for national reserves is carried out through competitive bidding.
Government influence is limited to raising or lowering prices indirectly by adjusting the
amount of purchases.
Direct government price controls fall in two categories: fixed prices and guided prices. The
former imply that a certain amount of RMB has to be charged on a per unit basis. The latter
allows for prices to move within a band delimitated by specified upper and lower bounds. In
2001, the State Development Planning Commission, a precursor of today’s NDRC, issued

© THINK!DESK China Research & Consulting 2015 Seite 211
the Catalogue of Price Controls by the State Planning Commission and other Departments of
the State Council. The catalogue identifies the commodities and services that are subject to
price controls and specifies the central government bodies in charge of price regulation
(SDPC 2001).
The NDRC has inherited responsibility for price controls from the State Planning Commission,
its predecessor which had retained this authority since the time of central planning. In addi-
tion, Commodity Pricing Bureaus attached to provincial-level governments fine tune price
regulation handed down from the central government to take account of the specific socio-
economic conditions of their respective jurisdictions. Supreme authority for any kind of price
regulation rests with the State Council which reviews such moves before they can take effect.
Despite unified price regulation procedures across the country, regional variations exist with
regards to the level of government administered prices.
The central government (through NDRC) has retained immediate control over the prices of
some tobacco products, explosives, edible salt, natural gas, electric power, rail and civil avia-
tion transport as well as postal and telecom services. However, the scope has dropped in
January 2015 as prices for numerous commodities have been freed in early 2015, such as
tobacco leaves. Prices of transportation services have gradually been freed over the years.
In January 2015, the government pulled out of areas like railway bulk cargo, parcel and pri-
vately funded cargo as well passenger transport. At the same time, price administration has
been abolished for air cargo and passenger tickets on some carriers. China Daily
(05.01.2015) reported that price regulation on port service fees, including fees on container
loading, ship rubbish treatment as well as water supply would be scrapped along with factory
prices of explosives for civil use. However, the NDRC has not been willing to completely for-
feit its market influence over these products as the same China Daily article cautions that
“the NDRC will prevent high price volatility and keep a close eye on market order after con-
trols are lifted” (China Daily 05.01.2015).
Provincial-level commodity pricing Bureaus are in charge of setting prices for healthcare ser-
vices, road transport and – in several cases – also for wheat and/or rice (WTO 2014a at 101).
An overview of the commodities and services covered for which the government continued to
determine prices in 2013, is presented in table 59 below.

© THINK!DESK China Research & Consulting 2015 Seite 212
Table 59: Government-fixed and Government-guided Prices in 2013
Product Type of control/rationale
Tobacco, salt
and explosive
materials
Government price. State monopoly. Establishment of purchasing
price of tobacco leaves, wholesale price of salt. Guided price of
explosive materials.
Fertilizers Guided price: benchmark factory prices and fluctuations, port set-
tlement prices.
Educational
material
Government price
The rationale is public interest.
Refined oil
The retail price is government-guided. Managed prices are deter-
mined on the basis of the price of crude oil on the international
market plus the average processing fee, taxes and reasonable
transportation fees in China.
The rationale is the lack of adequate market competition.
Natural gas
The factory price of onshore gas is Central Government-guided
while the pipeline transportation price is Central Government-set.
The sales price of gas is controlled by the local government and is
generally set by the latter.
The rationale for maintaining price controls is that natural gas is
considered a crucial public utility and the need to complete a full
reform of the electricity system before liberalizing prices.
Military
products
Factory government price.
The rationale is defence and national security.

© THINK!DESK China Research & Consulting 2015 Seite 213
Product Type of control/rationale
Electricity
The price of electricity is mainly set by the Government and moni-
tored by the competent price authority. The price of electricity
generated by power grids across provinces, autonomous regions
and municipalities directly under the competent authority of the
State Council at Central Government level and provincial-level
power grids is approved by the competent price authority of the
State Council, and the price of electricity generated by independ-
ent power grids below the provincial level is monitored by the
governments of the provinces, autonomous regions and munici-
palities.
The rationale for maintaining price controls is the nature of elec-
tricity prices as a crucial public utility price, as well as the lack of a
fully completed reform of the electricity system.
Environment
protection
charges
Pollutant discharge levies mainly include sewage, waste gas, solid
wastes and noise-discharge fees and are subject to Central Gov-
ernment-set prices.
The rationale for maintaining price controls is that pollutant dis-
charge levies are administrative charges and hence, must be con-
trolled, as mandated by Article 47 of the Price Law, and stipulated
in Article 36 of the Regulations on Price Control. The specific ra-
tionale for each charge is formulated by the State Council sepa-
rately.
Urban house-
hold garbage
disposal
charges
Prices are set by local governments.
The rationale for maintaining price control is that garbage disposal
is a main public utility.
Water
Urban water prices are subject to price control by local govern-
ments.
The rationale for maintaining this price control is that water supply
is a natural monopoly.
Sewage dis-
posal charges
Set by local governments.
The rationale for maintaining price control is that sewage disposal
is a main public utility.
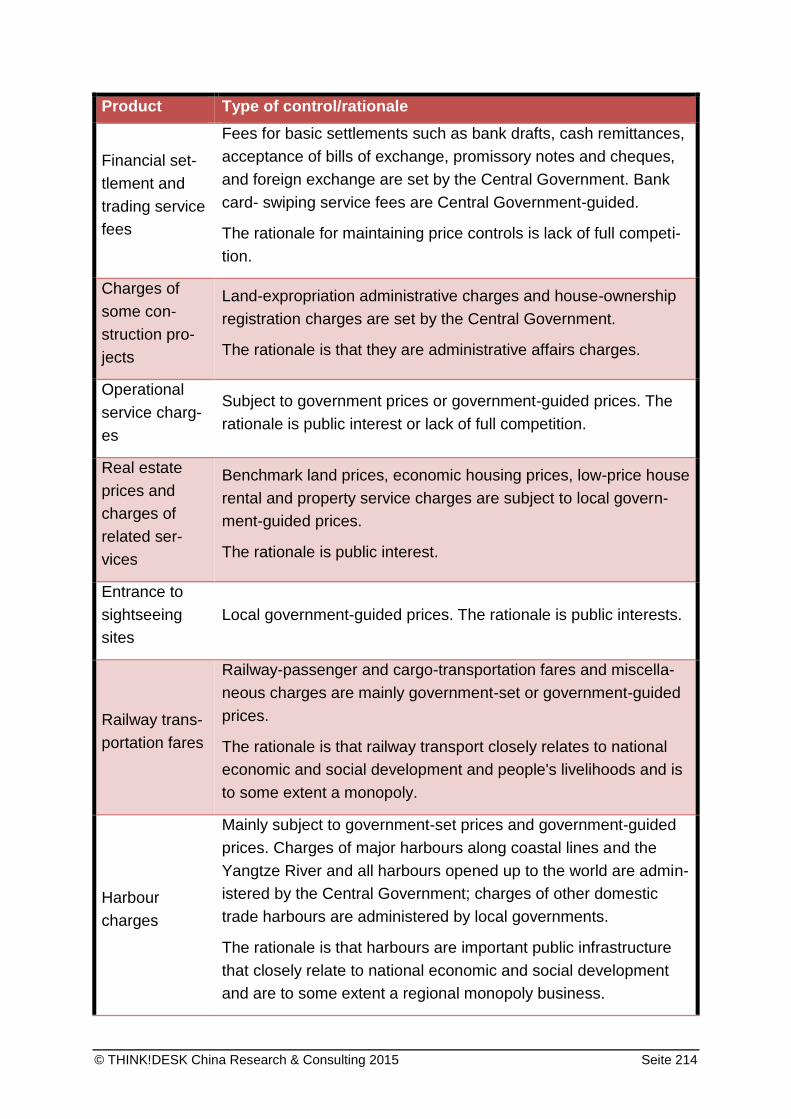
© THINK!DESK China Research & Consulting 2015 Seite 214
Product Type of control/rationale
Financial set-
tlement and
trading service
fees
Fees for basic settlements such as bank drafts, cash remittances,
acceptance of bills of exchange, promissory notes and cheques,
and foreign exchange are set by the Central Government. Bank
card- swiping service fees are Central Government-guided.
The rationale for maintaining price controls is lack of full competi-
tion.
Charges of
some con-
struction pro-
jects
Land-expropriation administrative charges and house-ownership
registration charges are set by the Central Government.
The rationale is that they are administrative affairs charges.
Operational
service charg-
es
Subject to government prices or government-guided prices. The
rationale is public interest or lack of full competition.
Real estate
prices and
charges of
related ser-
vices
Benchmark land prices, economic housing prices, low-price house
rental and property service charges are subject to local govern-
ment-guided prices.
The rationale is public interest.
Entrance to
sightseeing
sites
Local government-guided prices. The rationale is public interests.
Railway trans-
portation fares
Railway-passenger and cargo-transportation fares and miscella-
neous charges are mainly government-set or government-guided
prices.
The rationale is that railway transport closely relates to national
economic and social development and people's livelihoods and is
to some extent a monopoly.
Harbour
charges
Mainly subject to government-set prices and government-guided
prices. Charges of major harbours along coastal lines and the
Yangtze River and all harbours opened up to the world are admin-
istered by the Central Government; charges of other domestic
trade harbours are administered by local governments.
The rationale is that harbours are important public infrastructure
that closely relate to national economic and social development
and are to some extent a regional monopoly business.

© THINK!DESK China Research & Consulting 2015 Seite 215
Product Type of control/rationale
Air transport
prices and
airport charg-
es
Civil domestic flight prices are mainly government-guided prices;
both the benchmark rates and their fluctuation range are deter-
mined by the Central Government.
The rationale is that the civil domestic flight market is still develop-
ing and civil aviation does not fully compete with other means of
transport.
Civil airport
charges
Mainly government-guided, the benchmark rates and fluctuation
range of which are determined by the Central Government.
The rationale is that airports closely relate to national economic
and social development and people's livelihood and are to some
extent natural monopolies.
Basic postal
service fees
Government-set.
The rationale relates to people's livelihoods.
Basic tele-
communica-
tion service
charges
Mainly government-set and government-guided. The rationale is
inadequate competition and close relation to the national econom-
ic and social development and people's livelihood.
Medicines and
medical ser-
vices
Government-set prices or government-guided prices are applied
for medicines listed in the catalogue of medicines covered by the
basic medical insurance and for medicines outside the said cata-
logue but in monopoly operation. Government-guided prices apply
to basic medical services provided by non-profit medical institu-
tions.
The rationale is economic importance and effect on people's live-
lihoods, public interest and, to some extent, lack of market compe-
tition.
Source: WTO 2014, p. 100-1.
Price adjustments are enacted in irregular intervals, but are most frequent in the field of fuels.
Table 60 documents price adjustments as announced by NDRC in 2013. The adjustment of
the prices for oil and refined petroleum products are governed by the Trial Administrative
Measures on Oil Price which went into effect in 2009.14 Fuel prices are determined by the
14
http://news.xinhuanet.com/fortune/2009-05/08/content_11336876.htm

© THINK!DESK China Research & Consulting 2015 Seite 216
NDRC and implemented by China’s three large petroleum companies, i.e. China National
Petroleum Co., Sinopec Co. and China National Offshore Oil Co (Bloomberg 11.11.2013).
During 2013 and 2014, 32 changes occurred. During the first three months of 2015, prices
were raised twice and lowered three times. In order to take into account distribution costs
and buying power, the NDRC sets different vehicle fuel prices for different provinces and
regions. Regional variations are quite low – fluctuating between 5 and 10 percent. According
to an adjustment in April 2015, fuel is most expensive in Chongqing (7,760 RMB per ton) and
cheapest in Xinjiang Autonomous Region (7,325 RMB per ton). In most cases, the respective
prices are universal, i.e. they have to be used throughout the province (NDRC 2015).
Table 60: Announcements of Price Adjustment by NDRC in 2013
Areas Announcement Basic changes
Electrical power Nos. 973 and 1942 of
2013
Adjusting the price categories of elec-
trical power
Regulating the price of nuclear elec-
trical power
Domestic fuels
13 announcements,
the latest being issued
on 28.11.2013
Adjusting the domestic price of pro-
cessed oil and other fuels
Natural gas No. 1246 of 2013 Adjusting the price ceiling of natural
gas
Some key medi-
cines No. 4134 of 2013
Adjusting the price ceiling of some
medicines
Water resources No. 29 of 2013
Formulating the minimum purchase
price of water resources in different
regions
Key reserve ma-
terials of the
State
No. 193 of 2013 Regulating the minimum procurement
prices for rice
No. 947 of 2013
No. 205 of 2013
Regulating the initial minimum pro-
curement prices for wheat
Source: WTO 2014 at 101-2

© THINK!DESK China Research & Consulting 2015 Seite 217
Another heavily regulated sector is the pharmaceutical industry and the industry for medical
equipment. In the pharmaceutical industry, the NRDC, as chief regulator, has ordered price
reductions of 10-40 percent for several thousand individual drugs. These have been con-
tained in 32 batches issued between January 2000 and January 2014. The methodology
employed by the Commission for Fixing Price Ceilings is based on production cost and al-
lows for a limited profit. Procurement of drugs is ruled by the National Essential Drugs List.
However, as the underlying decision making processes are not published and price has been
given overriding importance, high quality drugs are less likely to enter the List (EUCCC 2014
at 34).
International companies especially report to have been negatively affected by price controls
for medical equipment. These are administered on the provincial level which maintains a
narrow focus on the price, sometimes disregarding differences in quality and innovativeness.
In the healthcare equipment industry, prices are determined by the National Pricing Code for
Medical Service Items which is drafted and adjusted by the NDRC. The document is con-
cerned with product affordability and specifies a basic testing method rather than high sensi-
tivity ones (ibid).
The final communiqué of the third plenary session of the 18th CPC Central Committee in No-
vember 2013 stated the intention to further reform in the field of medicine and healthcare.
However, little progress has been made in the time since. Administrative price controls
prevalent in China do not account for the real market value of medical equipment and thus
obstruct the normal operation of market forces. While the financial constraints of the Chinese
healthcare system make it necessary to keep rising costs in check, forced price reductions
and administrative controls run counter to economic efficiency. A narrow focus on prices lim-
its hospitals in their purchasing decisions and hinders improvements in product quality and
performance that would allow for cost savings over the long-term. The latter could result from
better diagnose and treatment options, improved health and higher economic welfare. Price
ceilings that hold back the innovativeness of companies, in final analysis just pitch short-term
savings against long-term gains (EUCCC 2015 at 33)
2.4.3 Complementary Ordering Mechanisms for Effective Market Coordination
Markets can only direct economies towards high levels of welfare and development, if the
signals generated are actually executed in the market place. To this avail complementary
institutional arrangements need to be in place, which incentivise economic actors to act ac-
cording to these market signals. In order to uphold their capability to signal the best alloca-
tion of resources and goods in the economy, markets must furthermore be protected from a
one-sided accumulation of power that might interfere with efficient competitive processes.
The following sections take a closer look at the design of two such ordering mechanisms in
the Chinese economy.

© THINK!DESK China Research & Consulting 2015 Seite 218
2.4.3.1 Anti-Monopoly Regulation
After 13 years of deliberation and multiple rounds of public consultation, the Anti-monopoly
Law (AML) finally went into force on August 1st, 2007. To date, the AML (NPC 2007d) repre-
sents the most comprehensive legal document since the foundation of the People’s Republic
in 1949 in that it addresses competition in a holistic manner. Previous legislation, like the
Law Against Unfair Competition (NPC 1993) and the Price Law (NPC 1997) have been very
limited in scope. Enforcement was hindered by the relevant agencies’ lack of the administra-
tive tools and manpower. The AML spurred the creation of new units in existing agencies
dedicated to supervising market order and fair competition. The responsibilities for monitor-
ing and enforcement were distributed to three separate organisations, the NDRC, the
MOFCOM and the SAIC, that are supervised and coordinated by an Anti-monopoly Commis-
sion. The latter has also been created by the AML (at 9) and is composed of representatives
of the three anti-monopoly enforcement agencies (AMEA) as well as eleven other govern-
ment departments. The AMC is based at the MOFCOM and provides a channel for interde-
partmental communication and coordination. The following table 61 outlines the individual
responsibilities of the three AMEA:

© THINK!DESK China Research & Consulting 2015 Seite 219
Table 61: Tasks and Responsibilities of China's Anti-competitive Enforcement
Agencies
Compe-tent au-thority
Laws, administrative regulations and ministerial rules
Responsibilities Enforce-force-ment delega-tion
MOFCOM
AML
1. Rules of the State Council on Thresholds for Reporting Con-centration of Undertakings.
2. Measures on the Examination of Concentration of Undertak-ings.
3. Measures on the Notification of Concentration of Undertak-ings.
4. Interim Rules on Assessment of Impact of Concentration of Undertakings on Competition
5. Interim Provision on Investiga-tions of Un-notified Concentra-tions of Undertakings.
6. Measures for Calculating the Turnover for the Declaration of Business Concentration in the Financial Industry.
7. Interim Provisions on the Im-plementation of Divestiture of Assets or Businesses for Con-centrations of Undertakings.
Anti-monopoly review of concentrations of undertakings.
No dele-gation.
NDRC
AML; Price Law
1. State Council Provisions on the Administrative Punishment of Price-related Violations.
2. Provisions on Prohibition of Price Monopoly.
3. Procedural Provisions on Ad-ministrative Punishment in re-lation to Prices.
4. Provisions on the Administra-tive Procedures for Law En-forcement against Price Fixing.
1. To investigate and punish price monopoly acts in accordance with the law, including price- related monopoly agreements, abuse of market dominance and abuse of admin-istrative powers to eliminate and restrict competi-tion.
2. To investigate and punish price-related violations
Anti-monopoly enforce-ment may be dele-gated to the au-thorities at or be-low the provincial level.
Price Law enforce-ment may be exer-cised at

© THINK!DESK China Research & Consulting 2015 Seite 220
Compe-tent au-thority
Laws, administrative regulations and ministerial rules
Responsibilities Enforce-force-ment delega-tion
in accordance with the law.
3. To investigate and punish arbi-trarily charged administrative fees in accord-ance with the law.
the local level.
SAIC
AML; Anti-Unfair Competition
1. SAIC Procedural Provisions on Prohibition of the Abuse of Administrative Power to Ex-clude or Restrain Competition.
2. SAIC Provisions on the Prohi-bition of Monopoly Agreement.
3. SAIC Provisions on the Prohi-bition of Abuse of Dominant Market Positions.
4. SAIC Provisions on the Sup-pression of Abuse of Adminis-trative Power to Eliminate and Restrict Competitive Conduct.
5. SAIC Provisions on Investigat-ing and Handling
Cases Concerning Monopoly Agreements and Abuse of Domi-nant Market Positions.
1. Sanctions against non-price-related mo-nopolistic agree-ments.
2. Regulation on non- price-related market dominant abuses.
3. Sanctions against adminis-trative monopo-lies.
Anti-monopoly enforce-ment may be dele-gated to the au-thorities at the provincial level, but not fur-ther down.
Cases must be registered at SAIC before delega-tion.
Source: WTO 2014a at 94-5
The AML represents a cornerstone of China’s competition policy and has been subject to
contention – not least due to the strong concentration of market share in several sectors in
the hands of state business. Article 1 states that the law is enacted for the purpose of pre-
venting and restraining monopolistic conduct, protecting fair competition in the market, en-
hancing economic efficiency, safeguarding the interests of consumers and social public in-
terest. It serves to safeguard against monopolistic agreements among business operators,
abuse of dominant market positions by business operators; and concentration of business
operators that does or may restrict competition (NPC 2007d at 1.2). The document specifies

© THINK!DESK China Research & Consulting 2015 Seite 221
that its provision are applicable to all instances of monopolistic conduct affecting the Chinese
market, regardless whether they are to take place domestically or overseas (ibid at 1.3).
The law has a number of peculiarities which appear inconsistent with international best prac-
tice and are obviously tailored to the idiosyncrasies of the Chinese politico-economic system.
The initial paragraphs emphasise that the law should be enforced in line with the country’s
socialist market economy, which views state businesses as backbone of the economy. The
concept of upholding free market competition based on the socialist market economy pre-
sents some paradoxes which will be highlighted later in this section.
Similarly, the law is influenced by major economic policy strategies. Article 15 allows poten-
tially anti-competitive collaboration between enterprises for the sake of carrying out R&D and
developing cutting edge products. It also permits such arrangements when it comes to con-
serving energy and improving efficiency. M&A, which have been promoted as a major tool for
streamlining industries with fragmentation and overcapacities, are permitted by the AML as a
means to create scale economies (at 5). The endorsement of industry concentration for sup-
porting sectoral industrial policy objectives may prove incompatible to the AML’s mission to
prevent the formation and abuse of market dominance.
In recent years, the authorities in charge of investigating, sanctioning and preventing anti-
competitive behaviour in the market place have greatly increased their efforts. The NDRC,
the MOFCOM and the SAIC have each expanded the number of personnel and administra-
tive capacities to becoming more effective. A flurry of documents has been issued creating a
dense regulatory fabric. This has been complemented by even more measures that outline
administrative procedures specify the concrete instruments for implementation. This has al-
lowed the system to become operational and ensured enforcement. More active investigation
of alleged anti-competitive behaviour has increasingly affected foreign companies and invited
heavy coverage in Western media. This has sparked the question whether or not Chinese
authorities treat foreign companies fairly and on equal footing with home grown competitors.
In July of 2014, a joint statement of the U.S. China Strategic Economic and Economic Dia-
logue stipulated that
“the objective competition policy is to promote consumer welfare and economic
efficiency rather than promote individual competitors or industries, and that en-
forcement of their respective competition laws should be fair, objective, transpar-
ent and non-discriminatory” (USTR 2014b).
2.4.3.1.1 Pricing investigations
With regards to pricing investigations, enforcement activity has surged since 2008. According
to statements by Chinese officials cited by the USCBC (2015 at 18), the NDRC handled a
© THINK!DESK China Research & Consulting 2015 Seite 222
total number of 335 cases between August 2008 and September 2014. Through much of that
year, a spotlight was put on international companies for alleged anti-competitive conduct.
Naturally, international news media have focussed their attention on cases involving interna-
tional companies. However, the domestic reporting by state media has put on intense focus
on alleged rule violations by foreign companies.
Outside China, the large number of investigations targeting domestic companies went unre-
ported and concealed the fact that only a fraction of all cases have involved foreign players.
Sectors subjected to scrutiny by the NDRC for alleged uncompetitive pricing practices in-
clude dairy products, pharmaceuticals, automobile companies and various high technology
industries. The U.S. China Business Council has pointed out that foreign companies were
assessed in the same way as domestic ones, and that sanctions have been determined on
the same basis: sales revenues in the Chinese market. Regarding the investigation out-
comes, the Council found that international players were fined at a higher average rate than
their domestic counterparts: 3.3 percent vs. 1.9 percent (USCBC 2015). So far, Chinese reg-
ulation does not specify the method for calculating the rate of fines – the AML caps fines at
10 percent of relevant revenues.

© THINK!DESK China Research & Consulting 2015 Seite 223
Box 9: AML-Ruling: Mead Johnson Nutrition / Danone / Fonterra / Abbott Laboratories /
FrieslandCampina / Biostime International (August 2013)
The six companies listed above were fined a combined total of 110 USD for fixing prices of
baby formula in the Chinese markets. Following a scandal in 2008 when several hundred
babies became sick from adulterated milk powder that contained industrial chemicals, the
reputation of China’s domestic dairy industry is badly hurt. Formula imports have surged and
foreign products increased their market share in certain segments to about 50 percent.
Much coveted by Chinese consumers, imported infant formula in some cases sells at twice
the price of comparable domestic products. Because China is the world’s largest market for
such product and sales have been growing a pace of about 20 percent in recent years, in-
ternational companies have found their China businesses particularly promising. In its deci-
sion, the NDRC has ruled that eight companies (two were not fined because they had coop-
erated with investigators) had engaged in anti-competitive conduct by enforcing minimum
prices for distributors and punishing non-compliance on their part (Reuters 07.08.2013).
Furthermore, the companies were found to restrict competition by discouraging regional
distributors to sell outside their designated territories. Most companies announced not to
contest the ruling and lowered their retail prices for the product in question. While the fines
were likely part of a larger government strategy to support domestic manufacturers, analysts
have questioned that the forced price reductions of imported formula products would actual-
ly have this effect (SCMP 29.08.2013).

© THINK!DESK China Research & Consulting 2015 Seite 224
Box 10: Various automobile manufacturers (August/September 2014)
The NDRC and its provincial branches have carried out several anti-trust investigations
against automobile manufacturers and part makers. The Commission stated that the com-
panies had overcharged Chinese customers demanding prices significantly higher than in
other markets. The commission was convinced that foreign carmakers had abused their
strong market position to boost profits by fixing prices. Industry representatives justify pricing
policies with unprecedented demand surges and the costs structures of local production in
China. However, a consensus has emerged among market observers that the ultimate aim
is to force down prices of automobiles, spare parts and services (DW 11.09.2014).
A joint venture company of VW and FAW manufacturing Audi limousines was found guilty of
anti-competitive conduct and fined 250 million USD (FT 03.11.2015). Allegedly, the compa-
ny had ordered eight dealerships in Hubei Province to fix prices for cars and after-sales ser-
vices beginning in 2012. The NDRC ruled that the practice had impaired free competition by
hindering dealers to adjust prices according to the market and harmed the interest of con-
sumers. Along with the manufacturer, eight of its dealers were order to pay a combined total
of 30 million RMB (DW 05.08.2014).
Similarly, a sales division of Fiat SPA-owned Chrysler Motors was fined 31.7 million RMB for
allegedly forbidding dealerships in Shanghai to undercut the manufacturer’s reference since
2012. In addition, three dealerships had to pay 2.1 million RMB for violating competition
rules by fixing prices for repairs, spare parts and paint jobs for Chrysler, Jeep and Dodge
branded cars (Xinhua 23.04.2015).
In August 2014, the offices of a joint venture between Daimler and Beijing Automobile Indus-
try Co. offices were raided by NDRC investigators on suspicion of price fixing and anti-
competitive conduct (DW 05.08.2014). The Commission determined that the German com-
pany had enforced minimum prices for its S and E series limousines through phone calls,
personal meetings and dealership conferences. Joined by the Pricing Bureau of Jiangsu
Province, the investigation also fined Mercedes dealerships in Suzhou, Nanjing, Wuxi and
various other cities which had signed up on a price fixing agreement. Based on articles 46
and 49 of the AML, the carmaker was fined seven percent of its 2013 revenues from sales in
Jiangsu Province or 350 million RMB. The cooperating dealerships were order to pay one
percent of their sales revenues during the previous year, or 7.9 million RMB (Xinhua
23.04.2015).
In reaction to the accumulation of probes and rulings, most car makers cut prices of their
vehicles, spare parts and repair services. In August 2014, Daimler implemented a blanket
15 percent discount on spare parts. As a precaution, BMW, which itself had not been target-
ed by the NDRC, reduced prices of 3,300 parts by an average 15 percent the first half of
2014. In August, the company followed up with another 20 percent discount on 2,000 parts.
Following the probe, even unaffected automakers moved quickly to lower prices. Further-
© THINK!DESK China Research & Consulting 2015 Seite 225
more, companies expanded sales channels to make original parts available to independent
garages. (Reuters 08.08.2014).
The developments documented in boxes 9 and 10 above, have led to concerns that foreign
companies may be discriminated on the grounds of protectionist or industrial policy consider-
ations. In fact, the AML (NPC 2007d at 4 and 27) and related regulation stipulate that the
latter must be taken into account during the decision making process. This also includes a
practice whereby industry regulators, such as the MIIT, have to be consulted during the re-
view process. Beyond industrial policy, national security considerations are weighed by gov-
ernment bodies and may stop transactions that would not have been objectionable otherwise
(at 31). Overall, the inclusion of these non-commercial factors adds considerable uncertainty
to investigations as the transparency of interdepartmental consultations is low. The integra-
tion of considerations unrelated to market competition into procedures aimed at upholding
the very same market competition creates opportunities for protectionist behaviour. This is
particularly relevant as the NDRC and other bodies tasked with protecting the market enjoy
considerable discretion in how they choose their targets and conduct their investigations. In
spite of substantial reform efforts, foreign companies are still exposed to a significant degree
of risk. Further reform is necessary to divorce industrial policy from competition policy and
open up the decision making process for greater transparency.
In fact, the review of price related anti-competitive conduct appears to collide at times with
policy considerations. The Chinese banking industry provides a telling example. In October
2013, the NDRC launched a probe to protect bank customers from paying excessive fees.
Based on news reports, the investigation has targeted commercial banks of all types and
resulted in the imposition of fines totalling 825 million RMB (Xinhua 20.02.2014). While this
move was intended to protect the interests of consumers, it seems to contradict more recent
government directions of bank business. When the PBoC lowered its benchmark interest
rates by 25 basis points in mid May 2015, the regulator also eased the restrictions on deposit
rates. This allowed banks to pay their depositors a legal maximum of 1.5 times the PBoC
benchmark rate compared to 1.3 before the move. However, the Wall Street Journal reported
that the central bank had quietly asked banks not to make use of the new space for raising
deposit rates. The paper cited two unnamed bankers saying that the PBoC told them to leave
rates unchanged after a previous round of rate cuts in February (WSJ 14.05.2015).
2.4.3.1.2 Merger reviews (MOFCOM)
In its review of proposed M&A transactions, Chinese authorities also appear to have been
critical critical of international companies. Since the AML entered into force in August 2008,
the MOFCOM has examined well over one thousand such cases. Since the beginning of
2014, the number of proposed deals surged – the six months from October 2014 to March

© THINK!DESK China Research & Consulting 2015 Seite 226
2015 saw 137 separate applications. All of these transactions were approved unconditionally,
and most of them have been examined by the Ministry’s new simplified review procedures
which were introduced in April 2014. The recent pick-up in the number of proposed M&A
deals is likely connected to industrial policies promoting a streamlining of various sectors, like
steel, aluminium and cement, with fiscal resources. Furthermore, the simplified approval pro-
cedures and the prolonged cooling of activity throughout the economy have contributed as
well. Remarkable, all of the 26 transactions which were subjected to conditions or rejected
involved international companies. In the following, two examples of merger reviews involving
E.U. companies are presented.
Glencore/Xstrata (approved with conditions in April 2013). This has been the first deal in
which the MOFCOM ordered divestures of overseas assets as condition for its approval. The
Ministry’s concerns centred on the supply safety of Chinese consumers of copper, copper
concentrate and a variety of other raw materials. It was feared that vertical integration of the
merged entity might have adverse effects on Chinese downstream industries. In order to
remedy the issue, the MOFCOM mandated that Glencore has to divest its Las Bambas pro-
ject until June 30th, 2015 through a binding agreement in place no later than September 30th,
2014. Additionally, the merged entity must sell an annual 900,000 tons of copper concentrate
to Chinese consumers through long term contracts from 2013 to 2020. Prices are largely
based on international benchmarks and quantities are tied to the company’s output. Glencore
must continue selling zinc and lead concentrates to Chinese downstream consumers under
long-term contracts and based on reasonable terms (Poddar 2013; Mayer Brown JSM 2013).
Maersk/MSC/CMA CGM (rejected in June 2014). This was the first time the MOFCOM has
rejected a proposed alliance involving only overseas companies. It also marks a case in
which the Ministry diverged from affirmative rulings issued in the United States and the Euro-
pean Union. Being the world’s top three container shipping lines, the China business of all
companies is extensive. A plan to create an operational alliance under the designation P3,
floated in October 2013, aims for the coordination of shipping business on various routes
through a Network Centre in England and Wales. The MOFCOM objected to the potentially
profound effects the planned coordination might have on trans-pacific, trans-atlantic and
Asia-Europe trade. The Ministry determined that the deal would severely restrict competition.
It argued that the P3 alliance would evolve into a tight consortium where the scale and scope
of cooperation was higher than acceptable. Moreover, it concluded that the combined market
shares of the three parties would translate into anti-competitive market power. The increased
level of concentration along with the increased barriers of entry in container shipping was
regarded as detrimental to free competition.
Consequently, other market players might see their development space significantly reduced
in the long term. Noteworthy is the MOFCOM’s concern for the adverse effects industry con-
centration and resulting market power might have on other players. The documents pub-
lished by the Ministry do not contain detailed explanations or estimates on why and how the
interests of competitors might be hurt. This is especially questionable as Chinese container
shipping line COSCO has entered into similar cooperation agreements with overseas coun-

© THINK!DESK China Research & Consulting 2015 Seite 227
terparts. While article 28 of the AML allows potentially anti-competitive asset deals on the
grounds that they generate efficiencies that serve public interest, cost savings and related
benefits to international trade are not addressed in the Ministry’s decision. In line with stand-
ard practice, the MOFCOM consulted with the NDRC, Chinese industry associations and
domestic container shipping lines as well as other interested parties during the review pro-
cess. Opposition to the P3 alliance was significant and seems to have found manifestation in
the MOFCOM’s final decision. As overcapacities in international shipping have formed since
the onset of the global financial crisis, industry consolidation and streamlining is widely re-
garded as a rational and necessary process (Freshfields Burckhaus Deringer 2014).
2.4.3.1.3 Non-price related anti-monopoly investigations (SAIC)
Information on investigations regarding non-price based abuse of market power is sparse.
According to the USCBC (2015), only two such proceedings have been launched against
Western companies. Probes are ongoing on alleged anti-competitive behaviour by Microsoft
and TetraPak (NYT 05.06.2013). The investigation is ongoing and little information has
emerged to suggest whether or not the Swedish food packaging company will be found guilty.
In a separate case, Microsoft was blamed for designing its Windows operating system in a
way that forces users to purchase more of the American company’s software products. In the
summer of 2014, four of Microsoft’s China offices were raided by SAIC investigators looking
for evidence. Employees were questions and data was seized to inform the investigation
(CNBC 06.08.2014).
2.4.3.1.4 Specific challenges to foreign invested enterprises
While the AMEA have improved the degree of transparency of their anti-monopoly proceed-
ings, affected companies are often still in the dark about the agencies’ work practices and
decision making. In recent years, the NDRC, the SAIC and the MOFCOM have all launched
websites where they post information on relevant regulations and ongoing investigations.
Further improvements are necessary to create the degree of transparency maintained by the
government departments tasked with anti-trust wok in other major economies.
However, a rise in the number of foreign companies under review has sparked worries about
procedural fairness. In its 11th Report on Potentially Trade-restrictive Measures, the EC re-
marked that
“anti-trust proceedings seem to have been polluted by some issues extraneous to
genuine competition considerations, which can seriously affect investment and
business activity of foreign companies” (EC 2014 at 16).

© THINK!DESK China Research & Consulting 2015 Seite 228
The USCBC has pointed out a number of procedural shortcomings and major problems that
U.S. companies had faced with Chinese the AMEA since the AML went into force. These
include:
Pressure to confess. Unaware of the grounds of the investigation and denied the op-
portunity to review the evidence, firms cannot mount any meaningful response. Even
though the charges remained unknown, the AMEA urged company representatives to
admit guilt in order to receive lenient treatment. Still in the dark about the nature of
their case, enterprises are forced to cooperate with the authorities to reduce their
penalties (USCBC 2014).
Denial of legal counsel. Companies reported that regulators arrived at their doorstep
without advance notice and insisted to commence a search of the premises immedi-
ately. In these cases it was not possible to convince the AMEA to wait even a short
while for legal counsel to arrive on the scene. Consequently, agents, raided,
searched and seized at will without allowing the company proper legal representation.
In subsequent meetings, companies were either denied or discouraged from having
their legal counsel present. In at least one instance, the representatives of the foreign
company were told that asking for legal representation during the proceedings would
be regarded as admission of guilt. They were told that not involving lawyers would
make the procedure go more smoothly (USCBC 2014).
2.4.3.1.5 Special Treatment for State-owned Enterprises and Buy-Local
Policies
Taking account of the special situation of state business in the socialist market economy, the
AML reserves special rights
“With respect to the industries controlled by the State-owned economy and con-
cerning the lifeline of national economy and national security or the industries im-
plementing exclusive operation and sales according to law, the state protects the
lawful business operations conducted by the business operators therein. The
state also lawfully regulates and controls their business operations and the prices
of their commodities and services so as to safeguard the interests of consumers
and promote technical progresses. The business operators as mentioned above
shall lawfully operate, be honest and faithful, be strictly self-disciplined, accept
social supervision, shall not damage the interests of consumers by virtue of their
dominant or exclusive positions” (NPC 2007d at 7).
The wording of the Law is vague on which sectors are to remain a domain of SOE monopo-
lies. The term “lifeline of the national economy and security” has been in use since the State-
owned Asset Supervision and Administration Commission (SASAC) came into existence in
2003. Article 2 of its constituting document also promised the government would “maintain
and increase the control power and competitiveness of the state-owned sectors that have
© THINK!DESK China Research & Consulting 2015 Seite 229
bearings on the national economic lifeline and the state security” (State Council 2003a at
14.2). This has not kept SOEs to flourish and even expand into sectors like hotels or real
estate over the past ten years. As late as May 2015, David Lipton, the first deputy managing
director of the IMF, expressed frustration at the slow pace of SOE reforms in China. He em-
phasized that “Levelling the playing field between the private and public sectors is a key goal
of the [reforms]” (cited by FT, 26.05.2015).
However, the AML imposes a constraint on administrative interference. Article 8 explicitly
prohibits “any administrative organ or organisation empowered by a law or administrative
regulation to administer public affairs” to employ their legal authority in order to limit free
competition. They are forbidden to abuse their administrative power to
restrict entities and individuals to operate, purchase or use the commodities provided
by business operators designated by it (at 32).
reject or restrict business operators from outside the locality
- to participate in local tendering and bidding activities by such means as imposing
discriminative qualification requirements or assessment standards or releasing in-
formation in an unlawful manner (at 34)
- to invest or set up branches in the locality by imposing unequal treatment there-
upon compared to that upon local business operators (at 35)
force business operators to engage in the monopolistic conducts (at 36)
set down such provisions in respect of eliminating or restricting competition (at 37)
block free circulation of commodities between regions by imposing:
- discriminative charge items, discriminative charge standards or discriminative
prices upon outside commodities
- different technical requirements and inspection standards on commodities of
the same classification from local and outside sources
- discriminative technical measures, such as repeated inspections or repeated
certifications to outside commodities
- special licensing administration on outside commodities
- barriers to hinder outside commodities from entering the local market or local
commodities from moving outside the local region. All measures intended to
obstruct the free flow of commodities between regions are outlawed (at 33)
If an organisation is found to violate these rules, its superior authority shall order it to make
correction and impose punishments on the people directly liable (at 51). Overall, the AML
specifies some very comprehensive regulation to limit government and party organisations
from infringing on fair competition. However, implementation and enforcement of the law has
to be questioned. Sub-national jurisdictions have continued to issue legislation that codifies
preference for purchases of domestic goods through catalogues of encouraged suppliers,
local content requirements and a variety of other means. Chongqing Municipality located in
Western China is a case in point. In 2012, the local government has launched the Made in
Chongqing Sold Worldwide initiative which seeks to increase the market share of the munici-
pality’s products on domestic and international markets. The approach represents a concert-
© THINK!DESK China Research & Consulting 2015 Seite 230
ed effort supported by various government departments to raise the competitiveness and
profile of local manufactures. With regards to the Chinese market, Chongqing’s Economic
and Informatisation Commission targets to maintain a market share in excess of ten percent
for motorcycles, water heaters and glass fibre products. The policy supports manufacturers
of automobiles and air-conditioners to reach that level.
Buy-local policies have been a vital instrument to improve capacity utilisation and boost sales
for local companies. To this end, the municipality has promulgated the Guidance Catalogue
for Focussed Purchasing of Supported Goods. The accompanying policy document states
that purchasing decisions should be guided towards commodities produced inside Chong-
qing in order to “further increase the level of support for the local economy, help Chongqing
enterprises strengthen their market presence and boost their competitiveness” (Chongqing
City 2012). To become part of the Catalogue, local companies had to apply to the Economic
and Informatisation Commissions and Development and Reform Commissions of their dis-
tricts or counties. The applications were forwarded to the counterparts of these commissions
on the municipal level for evaluation and final approval. The 2012 edition of the Catalogue
lists 683 companies and for each of them specifies a person and/or a phone number to make
contact. The Catalogue features well over one thousand individual products in seven broad
categories15 which are then broken down into 32 sub-categories (Chongqing City 2012).
In the field of electronics and IT products, the Catalogue lists laptop and desktop computer,
printers, servers, displays and various peripherals. While the vast majority of companies con-
tained are Chinese, prominent international companies on the list include HP, Asus, Acer,
CISCO and Toshiba. Large SOEs like Chongqing Iron and Steel Group and Chang’an Auto-
mobile are included.
Under equal conditions, all units are ordered to give preference to companies contained in
the Catalogue when making purchasing decision. Government bodies on all levels are urged
to lean towards manufactures produced inside the city. SOEs and other large enterprises are
asked to follow the principles of proximity and convenience in their purchasing activities. In
order to further strengthen support for local industry coordination and lower costs for inbound
logistics, local equipment manufacturing, automobile and motorcycle manufacturing, elec-
tronics, IT, metallurgy and construction materials industries should be favoured (Chongqing
City 2012).
The logistics and distribution industry and its individual companies are encouraged to step up
purchases of locally manufactured automobiles, motorcycles, consumer goods, electronic
and IT products. Enterprises in areas like public hygiene, education, social security and cul-
ture are called to buy more locally made consumer goods; medical and pharmaceutical
products as well as related equipment; electronic and IT products as well as software. The
municipal government also demands that major contractors involved in the construction of
15
(1) equipment manufacturing; (2) automobile and motor cycle manufacturing; (3) electronics and IT; (4) construction materials; (5) metallurgy; (6) light industry and textiles; and (7) chemical and medical products.

© THINK!DESK China Research & Consulting 2015 Seite 231
key engineering projects in the areas of transportation, electricity, water supply, environmen-
tal protection and other basic infrastructure projects give preference to local suppliers of ma-
chinery, construction materials, electronics, IT and metallurgical products (Chongqing City
2012).
In the steel industry, city governments have struck strategic offtake agreements with local
plants. In 2013, Taiyuan City, the capital of Shanxi Province, has signed such a document
with Shougang Changzhi Iron and Steel Co., Ltd. The company, which had been acquired by
Shougang Group two years earlier, is Shanxi Province’s largest steel mill by output. Owing to
outdated production technology and unfavourable cost structures, the financial performance
of the enterprise has deteriorated rapidly in recent years. The strategic purchasing deal thus
served to support sales and shore up finances of the ailing mill. At the ceremony, representa-
tives of the Taiyuan Municipal government announced to source all steel products required
exclusively from Changzhi (Taiyuan City 2013). Geng Yanbo, the mayor of Taiyuan City,
discussed plans to construct all of the city’s new schools, hospitals, libraries, roads social
housing from materials supplied by Changzhi (Mysteel 15.04.2013). Concluded for an un-
specified number of years, the strategic framework agreement allows the steel mill to take
advantage of high and rising steel demand. It also provides the company with a captive mar-
ket for its output (Taiyuan City 2013). The offtake agreement followed a similar deal conclud-
ed between the same company and Datong City, after Taiyuan the second largest munici-
pality in Shanxi Province (Mysteel 15.04.2013).
In a similar fashion, Benxi City has signed a framework agreement on strategic cooperation
with Benxi Steel Group in April 2012. Two years later, shortly before the demerger of Benxi
Steel Group and Anshan Steel Group was made public, Benxi City struck a strategic offtake
agreement.
In mid-2014 intensive exchanges took place between city authorities and the steel mill that
reviewed the outcomes of previous cooperation. Both sides planned for the future develop-
ment of Benxi City into a “green capital of steelmaking” and Benxi Steel Group as the back-
bone of this strategy. In September 2014, the Economic and Finance Commission of the
city’s People’s Congress, released a comprehensive survey report which is highly instructive
as it showcases in unusual detail the state-business interaction on the local level. The report
explained that the agreements were signed to
“stimulate the adjustment of the industrial structure of Benxi City, further local
economic development and promote the Benxi Iron and Steel to grow large and
strong under the city government’s support” (Benxi City 2014).
“uphold the City’s idea to ‘mobilise all the city’s energy in support of the develop-
ment of Benxi Iron and Steel Group” (ibid).
The Commission urges that greater attention should be paid to explore new mechanisms and
new concepts to continue the closely intertwined development of both city and company. As

© THINK!DESK China Research & Consulting 2015 Seite 232
a “starting point”, problems that have accumulated in the past should be resolved. A phrase
that may relate to the failed merger with Anshan Steel but certainly captures the very high
leverage ratio and weak financial situation of Benxi Steel Group. The “main focus” is to be
placed on creating and optimizing favourable conditions for the company’s development.
Finally, the city government pledges to help Benxi Steel Group to weather the current crisis
and return to healthy development. In return for the locality’s care, the steel mill vigorously
promotes local economic development and progress in social services by contributions relat-
ed to financial cooperation, attracting investment, realizing major projects, establishing indus-
trial parks and constructing basic urban infrastructure. A direct liaison mechanism was estab-
lished between the offices of the city’s mayor and the company’s chairman. One level down,
a direct connection ties the city’s Economic and Informatisation Commission to the compa-
ny’s strategic planning department – as the “standing offices” of both units – to discuss
roadmaps and time schedules of joint projects. As the state-business relationship deepened,
the municipal government set up a special bureau for handling matters of the steelmaker.
Based at the General Office of the Governor the bureau is staffed by a director who doubles
as deputy party secretary.
The standing committee of the city government has made clear that the mayor and his depu-
ties will work closely with Benxi Steel Group in order to effectively solve any problems arising
in the steel mill’s operations or development. When necessary, a high level conference with
the participation of all relevant local government departments will be convened to address
the issues together with the steel mill. While some of Benxi’s districts have established their
own organisations to better serve Benxi Steel Group, all departments under the direct control
of the municipal government are to give full play to their respective functions, like handling
environmental impact assessments, the administration of land use rights or the control of
production factors, to fully support Benxi Steel Group.
In its survey report, the Economic and Finance Committee of the People’s Congress of Benxi
City highlights that the municipal authorities have been very successful in solving problems
put in front of them by the steelmaker. Out of 34 cases in which Benxi Steel Group has
sought the authorities’ assistance, the latter were able to offer basic solutions for 18 and of-
fered their opinion on a further 12.
The same report puts emphasis on the financial contribution Benxi Steel Group has made for
the benefit of local economic development. It explicitly points out that the steelmaker has
provided entrusted loans worth 1.06 billion RMB to the city’s investment company through
the local branches of the China Construction Bank, the Industrial and Commercial Bank of
China, and the Guangdong Development Bank. According to the document, the cost of these
loans has been significantly lower than alternative bank credit alternatives available to Ben-
xi’s investment company. Furthermore, the steelmaker and of its two subsidiaries have con-
tributed 362.9 million RMB as shares to help a concerted debt restructuring of the city’s debt
held by various commercial banks.

© THINK!DESK China Research & Consulting 2015 Seite 233
The Commission expresses its satisfaction that Benxi Steel Group covers a large and grow-
ing part of its procurement needs from local sources. It praises the steelmaker’s contribution
to the local economy as a rising number of local companies supply it with a larger and larger
number of commodities.
Benxi owes its life to steelmaking and the industry has made the locality flourish. The steel
industry represents the city’s most important pillar industry. As one of the largest state-owned
steel mills of Liaoning Province, Benxi Steel Group is to play a leading role in the revamping
of the local industrial base into a “green capital of steelmaking”. For the structural adjustment
of the local economy, the mill is indispensable. Consequently, the city has to rely on Benxi
Steel Group for realizing its development concept. This argument is driven even further by
saying that “supporting development of Benxi Steel Group means supporting development of
Benxi City”.
The spirit of China’s AML is frustrated by the widespread use of local protectionism resulting
in the creation of strictly segregated local markets in which some firms benefit from monopo-
listic market power and exclusive government promotion. The New Energy Vehicle (NEV)
industry constitutes a case in point that is presented in greater detail in Box 11.
Box 11: Local Protectionism in the New Energy Vehicle Industry
Chinese industry experts agreed that local protectionism is the biggest obstacle impeding
NEV market development. Frustration about this is best illustrated by an article authored by
Chinese premier Wen Jiabao that was published in the Chinese Communist Party's bi-
monthly official journal Qiushi (Wen, 2011). In the paper, Wen expresses dissatisfaction at
the oftentimes uncoordinated and incoherent efforts at developing and commercializing
electric drive technology. In this regard, he cited administrative failures, such as the tiao-kuai
problem, as blocking development progress. He concludes that the direction of develop-
ment strategies has not been understood by all stakeholders and demands improvements in
the coordination mechanisms.
The Chinese central government’s efforts to establish a strong national NEV industry have
been substantially inhibited by local authorities have crafted their own localised development
strategies and support incentives. The resulting patchwork of different guidelines has re-
duced the transparency of policy support measures and – more importantly – contributed to
the formation of inter-jurisdictional barriers. Fragmentation of the potentially large national
market was exacerbated by cities’ efforts to reserve local markets for local companies (Sina,
08.09.2012). Local governments use a large variety of methods to advance “their” compa-
nies at the expense of outside competitors.
1. Special incentives were created for encouraging enterprises and individuals to “buy
local”. Zhengzhou City (2011 at 3.3.5), for example, offers purchasing premiums for
locally produced BEVs and PHEVs amounting to RMB 60,000 and RMB 50,000 re-

© THINK!DESK China Research & Consulting 2015 Seite 234
spectively. The cities of Dongguan (2010 at 3.3), Chengdu (2010b at 9) and Zhuhai
(2011 at 5.3.8) have drafted similar regulations.
2. Municipal governments typically prefer local companies in public procurement and
encourage affiliated businesses to follow suit (Ifeng, 13.01.2012). The municipal
governments of Chengdu (2010b at 8), Zhengzhou (2011 at 3.3.4), Nanjing (2012 at
3.8.28), Zhuhai (2011 at 5.3.8) and Hangzhou (2012 at 6.4) have ordered all gov-
ernment departments and affiliated organisations to give preference to locally pro-
duced EVs if the latter can meet national industry standards and has equal perfor-
mance.
3. City government look to expand their local automotive bases and increase outside
sales. The outline of the 12th FYP for Jilin Province (2011b at 3.2.) stipulates that a
major development and production base should be set up with FAW at its centre to
manufacture 200,000 EVs annually and capture a 10 percent share of the domestic
market until 2015. Shanghai (2012 at 3.3.1) even aims to reach a national market
share of 20 percent over the same timeframe.
4. In order to ensure that local suppliers of parts and components capture a sizable
share of the market, numerous provinces and municipalities have introduced local
content regulation. While some regions, such as Jiangsu Province (2012b at 1) and
Shanxi Province (2011 at 5.9.) as well as Nanchang City (2010 at 5.2.4.3) and Wei-
fang City (2010 at 3.5.2), just urge to increase the localisation of key components,
other jurisdictions specify concrete targets. Anhui Province (2011 at 3.1.), for in-
stance, calls on NEV manufacturers to direct more than 70 percent of their procure-
ment volume to local suppliers. Jilin Province (2011a at 3.1) and Hubei Province
(2012b at 2.7.2) as well as Anyang City (2011 at 2.3) set the target ratio at 50 per-
cent while Xi’an City (2011 at 6.1) demands that over 60 percent of inputs are pur-
chased within the city limits. Yet other jurisdictions have drawn up even more elabo-
rate schemes. Zhengzhou City (2011 at 3.2.4) and Chengdu City (2010b at 3), for
example, encourage local NEV manufacturers to purchase locally produced traction
batteries, electric engines, power controls and other key components. As an incen-
tive, authorities pledge to refund a certain proportion of the total purchasing value
from local suppliers.
5. Other means of support for local NEV manufacturers include discounts on locally
administered vehicle taxes and fees for buyers of local products, as in the case of
Nanchang City (2010). Zhengzhou has introduced a practice to reward OEMs with
special grants for achieving a certain number of NEV sales (Zhengzhou City 2011).
For public officials in sub-central government organisations, promoting the local economy
takes top priority as the evaluation of their individual work performance is measured by indi-
cators like GDP growth, tax revenues or job creation. In order to ensure career advance-
ment, officials are forced to devote themselves to attract corporate investments which ad-
dress these requirements (Zhou, 2007). NEV manufacturing is highly welcome, as it is ex-
pected to stimulate economic growth and technological upgrading of its host cities in a pro-
found and lasting way. Furthermore, as the automotive value chain is among the longest in

© THINK!DESK China Research & Consulting 2015 Seite 235
the manufacturing sector, NEV operations are envisioned to bring along a large numbers of
suppliers and related businesses. In terms of employment effects, complete vehicle manu-
facturing looks exceptionally promising as well: for every job created in automobile produc-
tion, 11 more will be created in related industries (Sina, 08.09.2012).
The example of Chengdu shall serve to illustrate local government behaviour. In 2010, au-
thorities announced that supporting policies would be customised to the specific require-
ments of leading local manufacturers of NEVs, traction batteries, electric motors or power
controls. (Chengdu, 2010b at 3.3.2). In some cases, such as Shenzhen, preferential policies
have accelerated the development of “local champions” whose products enjoy special pro-
motion. Despite their short-term benefits for local economies, it is highly uncertain if local
champions can grow into national or even global champions as administrative barriers are
both a blessing and a curse. While protected local markets allow companies to grow in the
beginning, the parcelling of the national market keeps companies from realizing scale econ-
omies and acquiring genuine competitive advantages.
Among the cities taking part in the 10 Cities 1000 Vehicle Program, Hangzhou, Suzhou,
Zhengzhou and Beijing stood out for their achievements in introducing EVs into their fleets.
Collusion between local administrations and companies and “buy local” regulations played a
major role in these cases. While the Program dictated that participating municipalities had to
base vehicle procurement on a formal bidding process (MOF and MOST, 2009 at 3.8), the
experts consulted held the opinion that government favouritism had been strong and wide-
spread. While several cities organised public tender proceedings, Zhengzhou, Changchun,
Wuhan, Xiamen, Guangzhou, Shanghai and four others simply appointed local OEMs to
supply the needed vehicles (Gasgoo, 01.09.2012).
Hangzhou, praised for its relatively high goal attainment of 47 percent, had supported local
Zotye Motors to supply vehicles for use as taxis. Zhengzhou, Suzhou and Beijing had pro-
cured EVs in significant numbers from local bus manufacturers benefitting Yutong (based in
Zhengzhou), Kinglong Higer (based in Suzhou) and Beiqi Foton (based in Beijing) (AutoQQ,
31.07.2012). With the sole exception of Chongqing, it is instructive that cities with goal at-
tainments below 10 percent (Hohot, Haikou, Nantong, Chengdu, Tangshan, Xiangyang and
Jinan) neither host major OEMs nor does the automobile industry play a significant role in
their economies (21st Century Business Herald, 01.10.2012). According to industry experts,
these cities are typically unwilling to experiment with promotion measures and assume a
wait-and-see attitude instead. Officials are said to observe the developments in other cities
to seek out and imitate the most promising approaches. This strategy of playing safe is at-
tractive to many cities without a stake in the auto industry as it prevents the drain of funds
through failed investments.
Source: This box is based on: in der Heiden, Peter (forthcoming): in der Heiden, Peter,
2015, Development Perspectives of the Chinese Electric Vehicles, In: Campen, Antje et
al.,2015, Future Mobility. Springer-Gabler Verlag, Wiesbaden.

© THINK!DESK China Research & Consulting 2015 Seite 236
2.4.3.2 Bankruptcy Regime and Market Exit Mechanisms
Functioning markets rely on the principle that the most productive and “best” players as de-
termined in fair competitive processes are rewarded by being enabled to actually engage in
business transactions and participate in the division of labour. As a consequence, however,
functioning market systems must also make provisions for those market players that are re-
jected by the market. Firms which cannot compete successfully must be allowed to leave the
market in an orderly manner. As highlighted by the World Bank:
A robust bankruptcy system functions as a filter, ensuring the survival of econom-
ically efficient companies and reallocating the resources of inefficient ones. Fast
and cheap insolvency proceedings result in the speedy return of businesses to
normal operation and increase returns to creditors. By improving the expectations
of creditors and debtors about the outcome of insolvency proceedings, well-
functioning insolvency systems can facilitate access to finance, save more viable
businesses and thereby improve growth and sustainability in the economy overall.
(World Bank 2014a, p. 106)
In light of sustained economic cooling, the question of market exit has in recent years as-
sumed increasing prominence in China. It has, however, remained a complicated issue as
legal frameworks are not yet mature. Furthermore, government authorities, especially on the
local level, have taken a strong interest in the issue of firm survival. They have shaped incen-
tive structures and interfered with the regular operation of established institutions. This is
section is to shed some light on bankruptcy laws and their implementation.
Bankruptcy cases in China are relatively rare considering the size of the economy and popu-
lation as well as the speed with which the country is transforming itself. Statistics provided by
the Supreme People’s Court indicate that only 2,059 bankruptcy cases have been filed with
Chinese courts in 2014 (Supreme People’s Court 2015). The small number relative to other
countries may be partly explained by the fact that China does not allow for private bankruptcy.
However, an even more striking finding is that the number of cases in China has dropped
substantially in recent years. For 2010 and 2012, the case count stands at 3,573 and 2,531
respectively (Supreme People’s Court various years).
Most firms that have entered bankruptcy in recent years have been privately-owned. Exam-
ples include Chaori Solar Energy and Zhejiang Xingrun Properties which became unable to
service bank loans, corporate bonds and other debt obligations. In some cases, failing pri-
vate companies have been bailed out by government organisations, as was the case with
Rongsheng Heavy Industry, a major shipbuilder. The main reasons behind those cases are
typically a combination of excess production capacity on the part of the companies combined
with a pronounced market slump. Over-investment has more often than not occurred with the
tacit consent of (local) governments which endorse the addition of new, larger or more mod-
ern plants. Especially in the wake of the financial crisis, investment incentives and other
growth enhancing policies have created an accommodative environment. This has been
© THINK!DESK China Research & Consulting 2015 Seite 237
compounded by the unchecked liberalisation of financial markets through the back door of a
flourishing shadow banking system. The lack of regulatory oversight opened up access to
credit for projects that cannot meet banks regular viability standards and thus cannot – and in
fact should not – obtain loans. Stagnating liberalisation of the formal financial sector has
driven much of the loan business underground where free markets have broken ground.
Explicit and implicit government guarantees have cultivated a tolerance of high leverage rati-
os. In this environment, the continued accumulation of debt appears relatively low-risk. Even
though the new leadership under Xi Jinping and Li Keqiang has urged a more open approach
to addressing loan issues and pledged to gradually remove the government’s safety net, the
priority can be expected to continue to be on avoiding any abrupt changes to the system that
might spark panic.
China’s bankruptcy law is still relatively new and experience is limited. The first bankruptcy
law since the foundation of the People’s Republic was drafted in 1986 and covered only
state-owned enterprises as other ownership types had not yet risen to prominence (NPC
1986). The law was the result of a compromise between conservative and reform-oriented
forces inside the party. As such it is very brief, unspecific and inadequate (Hui 2013). Pursu-
ing to the law, insolvent enterprises should undergo “policy bankruptcy”. In order to file a
case, the insolvent companies can notify the court after obtaining the approval from its su-
pervising authorities. Alternatively, a creditor can initiate the proceeding if he can prove that
the enterprise in question is indeed unable to service its obligations. Both conditions were
relatively hard to meet, so the first case was registered only in 1992 – six years after the law
had entered into force.
A major concern was that failing companies should be restructured in order to continue oper-
ation rather than being dissolved. Fung points out that
“the 1986 Enterprise Bankruptcy Law was not viewed as adequately effective in
regulating bankruptcy issues and was to a general extent applicable only to
State-owned enterprises. As a result, a large number of State-owned enterprises
incurred significant losses, but had their debts and loans written off by State-
controlled banks.” (Fung 2007 at 1).
The treatment of employees which had relied on their insolvent employer for lifelong em-
ployment, social security, housing and other critical issues was a major issue. In order to
protect employee welfare and avoid social unrest, the government would inject funds into the
failing company and state-owned banks would waive (part of) their claims. After the financial
distress had been reduced, attempts would be made to integrate certain assets into other
SOEs.
A new bankruptcy law went into effect on June 1, 2007 (NPC 2006b). It eliminated provisions
for policy bankruptcy effective January 1st, 2008 and thus reduced the incentives for SOE to
seek bankruptcy protection. However, the new law has cleared a number of procedural is-

© THINK!DESK China Research & Consulting 2015 Seite 238
sues which had been subject to criticism about the previous version. However, comparing to
bankruptcy regulation in other countries, the new law is still relatively short and does not pre-
sent the degree of detail understood to be required in mature market economies.
2.4.3.2.1 Implementational Issues
Government agencies enjoy a strong position during the proceeding. Both before and after
June 2007, courts are in charge of appointing a third party to take control of the enterprise in
question and lead debt disposal or work out restructuring plans. Before June 2007, the law
allowed only the selection of government officials to serve on so called liquidation teams.
Complaints about insufficient expertise in business management and bureaucratic working
practices were common. Under the new law, courts appoint a bankruptcy administrator who
may be a government official but is also required to possess relevant expertise. Lawyers,
accountants and other professionals can thus qualify as well (NPC 2006b at 24). The ap-
pointment of bankruptcy administrators at the court’s discretion is very different from the
practice in U.S., Canadian and other countries where creditors have the right of appointment
(Tang 2008). However, in China the administrator may not be an interested party to the case
and has to meet a number of other requirements. Duties involve
assuming control of the failing company’s property, including accounting documents,
seals and other articles
Performing due diligence and compiles reports evaluating the debtor’s assets
Handling internal management affairs
Determining operating costs and necessary expenses
Deciding whether or not to continue operation of the business (before the initial credi-
tor meeting)
Managing and disposing of the debtor company’s assets
Representing the debtor company in legal proceedings
Calling the creditor meeting (NPC 2006b at 25)
The administrator has to report to and answer inquiries from the creditor meeting, which can
request his replacement if he cannot live up to his task or does not perform his duties in ac-
cordance with the law (NPC 2006b at 22 and 23).
There is still a dearth of regulation on the treatment of financial institutions and state-owned
enterprises. While the new bankruptcy law technically covers those companies as well, the
failure of such companies is still a sensitive issue. The high degree of complexity and pro-
found socio-economic implications of such cases have discouraged bankruptcy filings due to
the uncertainty of outcomes.
Similar to its predecessor, the current bankruptcy law sets favourable conditions for restruc-
turing solutions that would allow a company to emerge from insolvency. Court-appointed

© THINK!DESK China Research & Consulting 2015 Seite 239
administrators ensure that the court is well informed about the entire proceedings and they
mitigate the interest of creditors. It is upon the debtor or the administrator to submit a restruc-
turing plan to the court at least six months prior to the scheduled ruling. The order in which
claims are ranked has changed since the first bankruptcy law, as labour claims no longer
come in first positions. Instead, secured claims over specific assets now take precedence
(NPC 2006b at 81).
2.4.3.2.2 Limiting Factors for Bankruptcy Incidences
While the new law has added essential regulation on the handling of restructuring plans and
debt disposition, it still has several limitations. The new law has a much wider scope as it
covers bankruptcy of SOEs as well as private companies, foreign companies and Sino-
foreign joint ventures. However, there are still no regulations governing insolvency of private
individuals, public institutions or sole proprietorships. Furthermore, the new law offers little
guidance for bankruptcies of banks, securities or insurance companies. Article 134 touches
upon this briefly but refers to other laws and regulations that should be issued by the State
Council.
Outside the large cities, experienced professionals, such as judges and lawyers, are not
widely available. Similarly, specialised bankruptcy courts have been few and far between. As
bankruptcy filings have to be submitted to courts on the “grassroots” level, where familiarity
and experience with the intricacies of restructuring plans and debt disposal is limited it may
happen that courts reject bankruptcy applications.
Pedone and Liu (2010) cite the Supreme People’s Court complaining about a lack of experi-
enced and capable administrators. According to that report, many administrators are unable
or unwilling to take decisions by themselves and frequently seek approval of the appointing
court for small matter.
It has been reported that companies exiting the market shun bankruptcy law and prefer in-
stead to “wind down” their business. While this process of solvent liquidation also requires
the services of independent accountants, control over the company remains in the hand of
management and owners. Without a court appointed administrator, the management needs
to seek consensus from stakeholders. While finding an agreeable compromise with creditors
and employees may be difficult, this is not out of the questions. Following a final audit and
deregistration, the company can be terminated.
However, in a number of cases, owners have chosen to commit suicide or flee with the prop-
erty they can take. In any case, China’s legal system is lacking necessary sanctions to pre-
vent enterprises from going out of business without undergoing proper procedures. This im-
plies that many companies do not concern themselves with an orderly exit but just walk away
from their business (Tang 2008).

© THINK!DESK China Research & Consulting 2015 Seite 240
Companies that have become unable to take out additional loans from the banking system
have turned to shadow banking in order to obtain much needed liquidity. This is especially
the case for companies so cash-strapped, that servicing existing loan obligations is problem-
atic. Some industries which are suffering from high leverage ratios and low (or negative) prof-
itability, like steel, have become flashpoints for bankruptcy risks. However, the shadow bank-
ing sector has thus had some impact on reducing the number of bankruptcies or rather a
substantial impact on delaying them.
Similarly, local government intervention has limited the occurrence of bankruptcies as affect-
ed companies were often deemed “too big to fail”. On the one hand, the socio-economic
consequences of plant closures and layoffs spell serious problems for government organisa-
tions and individual officials whose appreciation and careers are tied to stability and growth.
On the other hand, the tradition of state-business interaction at arm’s length precludes the
passive acceptance of bankruptcies. Even in cases involving private companies, local gov-
ernments fear the consequences arising from a legacy of interventions, such as (minority)
ownership stakes, loan guarantees, or subsidy funds. The write down of public resources is
an unattractive prospect that is avoided wherever possible.
Personal ties play a role as well. In some cases, local officials, their relatives or close ac-
quaintances serve as senior management staff in failing businesses. Insufficient confidence
in bankruptcy procedures compounds with personal preference for firm survival to create
strong incentives for mounting rescue efforts. Obviously, increasing government exposure
can fuel a vicious cycle of throwing good money after bad.
Since the global financial crisis hit, the financial position of local governments has weakened
considerably. As key players in mounting China’s economic stimulus policy, local govern-
ments shouldered the bulk of the 4 trillion RMB rescue spending. Large investments in infra-
structure projects, affordable housing and many other areas have kept China out of reces-
sion but caused significant strain on local government finances. Local government debt
surged and has become an economic risk of its own. This phenomenon has greatly weak-
ened the ability of local authorities to prop up failing companies and keep them out of bank-
ruptcy. As the potential for emergency subsidies and other financial support measures
waned, corporate insolvencies have increased.

© THINK!DESK China Research & Consulting 2015 Seite 241
2.5 Conclusion: Markets are Sub-ordinated to State Interests
The discussion above has shown that the Chinese Communist Party and Chinese govern-
ment organisations continue to intervene massively in the economic process. Rather than
establishing a sound macro-economic control system and an industry-oriented regulatory
framework in which market forces determine the patterns of economic interaction, China’s
ruling elite believes in its ability to design an economy by decree which achieves better out-
comes and higher economic dynamics. Its strategic aspirations and normative goals for the
economy and its sub-sectors are outlined in a broad array of planning documents. These are
complemented by a large arsenal of dedicated policy instruments which are designed and
employed to steer economic agents towards these goals. 15 years after accession to WTO
markets continue to play only a subordinated function in the overall working mechanism of
the Chinese economy.
The strategic aspirations and normative goals of Chinese government for the economy and
its sub-sectors are outlined in a broad array of planning documents. These are complement-
ed by a large arsenal of dedicated policy instruments which are designed and employed to
steer economic agents towards these goals. 15 years after accession to WTO, markets con-
tinue to play only a subordinated function in the overall working mechanism of the Chinese
economy. In the word of renowned China scholar McNally:
“The defining characteristic of [China’s] modern state capitalism in comparison to
liberal market capitalism is in the end a considerable distrust of markets and full-
out economic liberalization. This does not mean that markets are unimportant,
but that markets are used pragmatically.” (McNally 2013, p. 50)
The very specific – i.e. non-market – environment in which all economic actors in China are
conducting their businesses, has also been formally documented by Chinese corporations
seeking a listing at Stock Exchanges outside China. In its 2014 IPO filing documents with the
U.S. Securities and Exchange Commission the Chinese e-commerce giant Alibaba describes
the business environment in which it operates as follows:
“Risks Related to Doing Business in the People’s Republic of China
The PRC economy differs from the economies of most developed countries in
many respects, including the extent of government involvement, level of devel-
opment, growth rate, control of foreign exchange and allocation of resources. Alt-
hough the PRC government has implemented measures emphasizing the utilisa-
tion of market forces for economic reform, the reduction of state ownership of
productive assets, and the establishment of improved corporate governance in
business enterprises, a substantial portion of productive assets in China is still
owned by the government. In addition, the PRC government continues to play a
significant role in regulating industry development by imposing industrial policies.
The PRC government also exercises significant control over China’s economic
© THINK!DESK China Research & Consulting 2015 Seite 242
growth by allocating resources, controlling payment of foreign currency-
denominated obligations, setting monetary policy, regulating financial services
and institutions and providing preferential treatment to particular industries or
companies.
[…] The PRC government has implemented various measures to encourage
economic growth and guide the allocation of resources. Some of these measures
may benefit the overall PRC economy, but may also have a negative effect on us.
Our financial condition and results of operation could be materially and adversely
affected by government control over capital investments […].” (Securities and Ex-
change Commission, 2014 at 43)
In the same document Alibaba outlines the role of China’s law system for the company’s op-
erations, thereby highlighting the risks (sic!) of the Chinese law system to the company and
its ability to comply with its obligations agreed upon in contracts closed with its business
partners:
“There are uncertainties regarding the interpretation and enforcement of
PRC laws, rules and regulations.
[…] In 1979, the PRC government began to promulgate a comprehensive system
of laws, rules and regulations governing economic matters in general. The overall
effect of legislation over the past three decades has significantly enhanced the
protections afforded to various forms of foreign investment in China. However,
China has not developed a fully integrated legal system, and recently enacted
laws, rules and regulations may not sufficiently cover all aspects of economic ac-
tivities in China or may be subject to significant degrees of interpretation by PRC
regulatory agencies. In particular, because these laws, rules and regulations are
relatively new, and because of the limited number of published decisions and the
nonbinding nature of such decisions, and because the laws, rules and regulations
often give the relevant regulator significant discretion in how to enforce them, the
interpretation and enforcement of these laws, rules and regulations involve un-
certainties and can be inconsistent and unpredictable. In addition, the PRC legal
system is based in part on government policies and internal rules, some of which
are not published on a timely basis or at all, and which may have a retroactive ef-
fect. As a result, we may not be aware of our violation of these policies and rules
until after the occurrence of the violation.
Any administrative and court proceedings in China may be protracted, resulting in
substantial costs and diversion of resources and management attention. Since
PRC administrative and court authorities have significant discretion in interpreting
and implementing statutory and contractual terms, it may be more difficult to
evaluate the outcome of administrative and court proceedings and the level of le-
gal protection we enjoy than in more developed legal systems. These uncertain-

© THINK!DESK China Research & Consulting 2015 Seite 243
ties may impede our ability to enforce the contracts we have entered into and
could materially and adversely affect our business, financial condition and results
of operations.” (Securities and Exchange Commission, 2014 at 44).
These statements – made by a major non-state-owned Chinese company in a formal docu-
ment addressing the American and global investors community – leave no doubt that the
Chinese economic system is
- neither operating according to the price signals determined by the voluntary interac-
tion of myriads of independent markets actors on market places;
- nor featuring a reliable and transparent system of laws and regulations that should
provide a level playing field for all market participants.
As such it must be postulated that the two key elements constituting a functioning competi-
tion-based market system do not exist in the Chinese economy.

© THINK!DESK China Research & Consulting 2015 Seite 244
3 THE ROLE OF THE CHINESE COMMUNIST PARTY IN
ECONOMY AND BUSINESS
As shown in the preceding chapter the Chinese economy continues to be coordinated by an
intricate web of plans and programmes designed by governments on all levels to steer eco-
nomic activity in specific directions.
In addition to Chinese government’s aspiration to guide industry development, large parts of
the Chinese economy in general and its industry in particular are also subjected to direct
control and governance by the CPC. The party reserves itself a prominent role in economic
matters, including the operation of enterprises. 35 years after the onset of reforms, it has not
relinquished its claims on shaping the economic behaviour at the grass roots level.
3.1 Embeddedness of CPC Organisations in the Corporate Sector
The CPC understands itself as an inalienable constituent and key decision maker in all en-
terprises featuring state as well as collective ownership shares. The CPC constitution clari-
fies:
“In a state-owned or collective enterprise, the primary Party organisation acts as
the political nucleus and works for the operation of the enterprise. The primary
Party organisation guarantees and oversees the implementation of the principles
and policies of the Party and the state in its own enterprise and backs the meet-
ing of shareholders, board of directors, board of supervisors and manager (facto-
ry director) in the exercise of their functions and powers according to law. It relies
wholeheartedly on the workers and office staff, supports the work of the con-
gresses of representatives of workers and office staff and participates in making
final decisions on major questions in the enterprise. It works to improve its own
organisation and provides leadership over ideological and political work, efforts
for cultural and ethical progress and the trade unions, the Communist Youth
League and other mass organisations.
In a non-public economic institution, the primary Party organisation carries out
the Party's principles and policies, provides guidance to and oversees the enter-
prise in observing the laws and regulations of the state, exercises leadership over
the trade union, the Communist Youth League organisation and other mass or-
ganisations, rallies the workers and office staff around it, safeguards the legiti-
mate rights and interests of all quarters and stimulates the healthy development
of the enterprise.” (CPC 2013 at 32).
© THINK!DESK China Research & Consulting 2015 Seite 245
The reach of the CPC into the business sector, however, is not restricted to state-owned or
collective enterprises but permeates all business activities and firms of all ownership types
exceeding a minimum size and relevance for the economic process – including foreign in-
vested enterprises. The CPC has established Party cells in all such firms.
In SOEs, top management typically doubles as party leadership for the enterprise. The indi-
viduals heading China’s SOEs hold different ranks in the party hierarchy. While some are
ranked as ministers or vice-ministers others are only ranked as “bureau chief”. It is important
to note that these titles are unrelated to the government posts of identical designation but
serve to place the country’s 85 million party members along a hierarchical rank ladder. While
party rank has significant influence on the assigned job positions in the corporate sphere,
unfortunately, hardly any information is disclosed in the public domain (Li 2011).
In the policymaking process, the amalgamation of party and state makes it almost impossible
to discern party and government initiatives. The overlap is most complete when it comes to
social policy that is shaping the interaction mechanisms between the leadership and society
as well as between people, e.g. education, culture and ethnic minority issues. However, party
influence transcends economic and industrial policy as well. This is not limited to broad na-
tional strategies but equally includes the more technical areas of macroeconomic policy. The
China Banking Regulatory Commission (CBRC) is a case in point. Instituted in 2003, the
Commission acts as supervisory and regulatory body for the sector. Reporting to the State
Council directly, the CBRC governor is holds cabinet minister rank.
The Commission was instituted based on the Circular of the General Office of the State
Council on Promulgating Regulation on the Main Functions, Internal Institutions and Staffing
of the China Banking Regulatory Commission. It posits that the CBRC should combine “the
supervision and management functions assumed by the People's Bank of China for the
banking financial institutions” with “the relevant functions of the former Central Financial
Work Commission of the People's Communist Party of China” (GOSC 2003 at 1.1 and 1.2).
The internal structure of new regulatory body provides for a strong CPC presence as five of
the 15 departments are under its immediate control.
“General Office (The Office of the Party Committee)
It shall organize and coordinate the routine work of the organ; be responsible for
the drafting of relevant documents, the organisation of important meetings, confi-
dentiality, secretary, documentation, complaint letters and visits, secrecy, infor-
mation synthesis, news release and safety, etc.” (GOSC 2003 at 3.1).
“Personnel Department (Organisation Department of the Party Committee)
It shall create regulations, rules and measures concerning the management of
the human resources of the CBRC and its branches in other places; conduct per-
sonnel management of the CBRC, its branches and the relevant entities; be re-
sponsible for the routine management of the leading groups and leaders of the
© THINK!DESK China Research & Consulting 2015 Seite 246
relevant financial institutions; be responsible for guiding the organisation con-
struction of the Party and the education and management of the Party members
of the entities within its jurisdiction; and shall be responsible for the training of the
carders of the CBRC and the entities within its jurisdiction.
Publicity Department (Publicity Department of the Party Committee)
It shall be responsible for the ideological construction and publicity of the Party
and shall take charge of the ideological and political work and the construction of
spiritual civilisation.
Mass Work Department (Mass Work Department of the Party Committee)
It shall be responsible for the guidance and coordination of the mass work of the
entities within its jurisdiction.
Work Department of the Board of Supervisors
It shall be responsible for the concrete management of the Board of Supervisors;
shall create rules and regulations concerning the work of the Board of Supervi-
sors; be responsible for the review and submission of inspection reports; and
shall be responsible for the coordination work between the Board of Supervisors
and other relevant departments.
The Department Party Committee shall be responsible for the work between the
Party and the masses of the departments of the CBRC and the entities directly
under the CBRC” (GOSC 2003 at 3.12 to 3.15; underlining by THINK!DESK).
Based on these organisational structures, the CPC is in full control of all major decision mak-
ing processes in CBRC and is able to direct its reach into the corporate sector and the econ-
omy in general.
By means of its embedded party organisations, China’s ruling elite – i.e. the CPC leadership
– has established a highly efficient channel of communication and command with the nation-
al corporate sector, allowing for more effective direction, control and sanctioning of corporate
action.
3.2 Dual Party/Management Careers
THINK!DESK investigations into the individual backgrounds of the members of the boards of
directors and the supervisory councils of major industrial enterprises have revealed that a
large majority of them are not only party members, but also hold senior positions in the gov-
ernment and CPC hierarchy – or have done so previous to serving in the corporate sector.
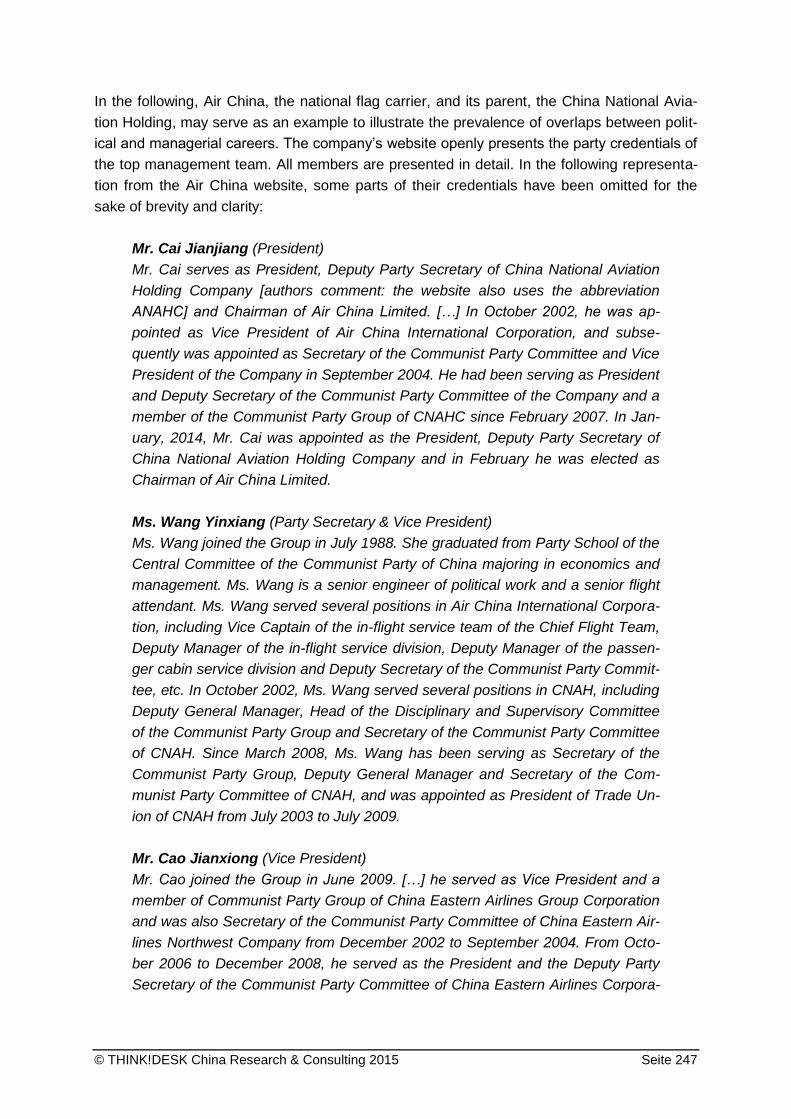
© THINK!DESK China Research & Consulting 2015 Seite 247
In the following, Air China, the national flag carrier, and its parent, the China National Avia-
tion Holding, may serve as an example to illustrate the prevalence of overlaps between polit-
ical and managerial careers. The company’s website openly presents the party credentials of
the top management team. All members are presented in detail. In the following representa-
tion from the Air China website, some parts of their credentials have been omitted for the
sake of brevity and clarity:
Mr. Cai Jianjiang (President)
Mr. Cai serves as President, Deputy Party Secretary of China National Aviation
Holding Company [authors comment: the website also uses the abbreviation
ANAHC] and Chairman of Air China Limited. […] In October 2002, he was ap-
pointed as Vice President of Air China International Corporation, and subse-
quently was appointed as Secretary of the Communist Party Committee and Vice
President of the Company in September 2004. He had been serving as President
and Deputy Secretary of the Communist Party Committee of the Company and a
member of the Communist Party Group of CNAHC since February 2007. In Jan-
uary, 2014, Mr. Cai was appointed as the President, Deputy Party Secretary of
China National Aviation Holding Company and in February he was elected as
Chairman of Air China Limited.
Ms. Wang Yinxiang (Party Secretary & Vice President)
Ms. Wang joined the Group in July 1988. She graduated from Party School of the
Central Committee of the Communist Party of China majoring in economics and
management. Ms. Wang is a senior engineer of political work and a senior flight
attendant. Ms. Wang served several positions in Air China International Corpora-
tion, including Vice Captain of the in-flight service team of the Chief Flight Team,
Deputy Manager of the in-flight service division, Deputy Manager of the passen-
ger cabin service division and Deputy Secretary of the Communist Party Commit-
tee, etc. In October 2002, Ms. Wang served several positions in CNAH, including
Deputy General Manager, Head of the Disciplinary and Supervisory Committee
of the Communist Party Group and Secretary of the Communist Party Committee
of CNAH. Since March 2008, Ms. Wang has been serving as Secretary of the
Communist Party Group, Deputy General Manager and Secretary of the Com-
munist Party Committee of CNAH, and was appointed as President of Trade Un-
ion of CNAH from July 2003 to July 2009.
Mr. Cao Jianxiong (Vice President)
Mr. Cao joined the Group in June 2009. […] he served as Vice President and a
member of Communist Party Group of China Eastern Airlines Group Corporation
and was also Secretary of the Communist Party Committee of China Eastern Air-
lines Northwest Company from December 2002 to September 2004. From Octo-
ber 2006 to December 2008, he served as the President and the Deputy Party
Secretary of the Communist Party Committee of China Eastern Airlines Corpora-

© THINK!DESK China Research & Consulting 2015 Seite 248
tion Limited. Since December 2008, Mr. Cao has been serving as the Deputy
General Manager and a member of Communist Party Group of CNAHC.
Mr. Li Qinglin (Chairman of Disciplinary and Supervisory Committee)
Mr. Li served as Chairman of Disciplinary and Supervisory Committee and mem-
ber of the party group of CNAH. Before joining CNAH, he served as deputy direc-
tor and director of Administration Management Bureau of State Council, deputy
director of Administration Department of State Assets Supervision & Administra-
tion Commission. He graduated in Chinese Language major from Beijing Radio &
TV Broadcasting Institute.
Mr. Song Zhiyong (Member of the Party Group)
Mr. Song serves as Member of the Party Group of China National Aviation Hold-
ing Company and President of Air China Limited. […] in October 2002 he took
the position as Managing Director and Deputy Party Secretary of the General
Flight Fleet. […] Mr. Song has been serving as Vice President and Member of the
Party Group of China National Aviation Holding Company since December 2010.
In January, 2014, He was appointed as Member of the Party Group of China Na-
tional Aviation Holding Company and President of Air China Limited.
Mr. Fan Cheng (Member of the Party Group)
Mr. Fan is Member of the Party Group of China National Aviation Holding Com-
pany and Party Secretary of Air China Limited. From December 2009 to May
2010, he served as Secretary of the Communist Party Committee of Shenzhen
Airlines. Since February 2011, he has served as Secretary of the Communist
Party Committee, Vice President and CFO of Air China Limited. Since April, 2014,
Mr. Fan has been serving as Member of the Party Group of China National Avia-
tion Holding Company, Party Secretary, Vice President and CFO of Air China
Limited.
Mr. Feng Gang (Vice President)
Mr. Feng Gang serves as the Vice President and Member of the Party Group of
China National Aviation Holding Company. He started his career in July, 1984.
He served as Deputy General Manager of China Southwest Airlines in October
1995 and in October 2002 he was assigned as Assistant President of Air China
Limited. In February 2003, Mr. Feng took the position as General Manager and
Party Secretary of China National Aviation Holding Asset Management Company
and in May 2007 he served as Chairman, President and Deputy Party Secretary
of Shandong Airlines Group. In April 2010, Mr. Feng served as Vice President of
Air China Limited and from May 2010 to May 2014, he served as Director, Presi-
dent and Deputy Party Secretary of Shenzhen Airlines simultaneously. Since
April 2014, Mr. Feng has been serving as the Vice President and Member of the
Party Group of CNAH.
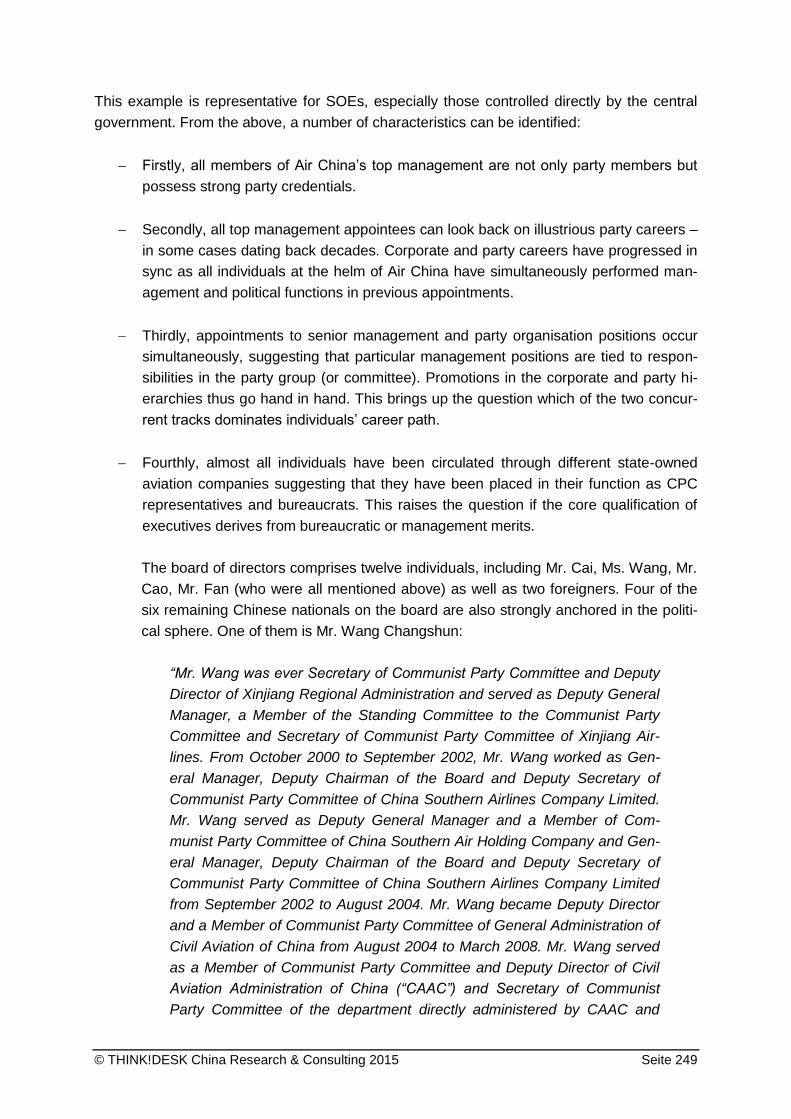
© THINK!DESK China Research & Consulting 2015 Seite 249
This example is representative for SOEs, especially those controlled directly by the central
government. From the above, a number of characteristics can be identified:
Firstly, all members of Air China’s top management are not only party members but
possess strong party credentials.
Secondly, all top management appointees can look back on illustrious party careers –
in some cases dating back decades. Corporate and party careers have progressed in
sync as all individuals at the helm of Air China have simultaneously performed man-
agement and political functions in previous appointments.
Thirdly, appointments to senior management and party organisation positions occur
simultaneously, suggesting that particular management positions are tied to respon-
sibilities in the party group (or committee). Promotions in the corporate and party hi-
erarchies thus go hand in hand. This brings up the question which of the two concur-
rent tracks dominates individuals’ career path.
Fourthly, almost all individuals have been circulated through different state-owned
aviation companies suggesting that they have been placed in their function as CPC
representatives and bureaucrats. This raises the question if the core qualification of
executives derives from bureaucratic or management merits.
The board of directors comprises twelve individuals, including Mr. Cai, Ms. Wang, Mr.
Cao, Mr. Fan (who were all mentioned above) as well as two foreigners. Four of the
six remaining Chinese nationals on the board are also strongly anchored in the politi-
cal sphere. One of them is Mr. Wang Changshun:
“Mr. Wang was ever Secretary of Communist Party Committee and Deputy
Director of Xinjiang Regional Administration and served as Deputy General
Manager, a Member of the Standing Committee to the Communist Party
Committee and Secretary of Communist Party Committee of Xinjiang Air-
lines. From October 2000 to September 2002, Mr. Wang worked as Gen-
eral Manager, Deputy Chairman of the Board and Deputy Secretary of
Communist Party Committee of China Southern Airlines Company Limited.
Mr. Wang served as Deputy General Manager and a Member of Com-
munist Party Committee of China Southern Air Holding Company and Gen-
eral Manager, Deputy Chairman of the Board and Deputy Secretary of
Communist Party Committee of China Southern Airlines Company Limited
from September 2002 to August 2004. Mr. Wang became Deputy Director
and a Member of Communist Party Committee of General Administration of
Civil Aviation of China from August 2004 to March 2008. Mr. Wang served
as a Member of Communist Party Committee and Deputy Director of Civil
Aviation Administration of China (“CAAC”) and Secretary of Communist
Party Committee of the department directly administered by CAAC and

© THINK!DESK China Research & Consulting 2015 Seite 250
Chairman of National Labor Union of Civil Aviation from March 2008 to Oc-
tober 2011. Mr. Wang has served as General Manager and Deputy Secre-
tary of Communist Party Committee of China National Aviation Holding
Company since October 2011” (Air China website).
A fifth notable aspect regards the overlap between CPC/corporate and labour union
offices. During his time at the Civil Aviation Administration of China (CAAC) from
March 2008 until October 2011, Wang Changshun simultaneously acted as
deputy director
member of the CPC committee
secretary of the CPC committee of various departments
chairman of the labour union
Even more impressive, Ms. Wang Yinxiang simultaneously took on many diverse
functions while at CNAHC. Between October 2002 and July 2009 she acted as:
deputy general manager (after 10/2002)
head of the Disciplinary & Supervisory Committee of the CPC group (after
10/2002)
secretary CPC committee (after 10/2002)
president of the labour union (after 7/2003)
It is telling that a deputy general manager who doubles as CPC committee secretary
can also be president of the labour union – especially at a company with high interna-
tional profile like Air China. The prioritisation of goals and responsibilities as well as
the resolution of conflicts between different stakeholders present formidable chal-
lenges to corporate governance.
The information presented here draws on – and is limited to – the official Air China website
as opened on April 19th, 2015. Further research into the individual backgrounds of the indi-
viduals discussed here may yield more detail on overlapping and perhaps contradicting re-
sponsibilities.
A systematic survey on 130 top leaders of SOEs controlled by the central government has
been carried out by Li (2011) before the leadership transition of 2013. Li found that all of the
130 individuals were party members and that
59 simultaneously served as general manager and (deputy) party secretary
14 simultaneously served as general manager, board chairman and (deputy) party
secretary

© THINK!DESK China Research & Consulting 2015 Seite 251
Other top managers of major Chinese corporations are simultaneously directing the opera-
tions of their firms and serving on the CPC Central Committee or the Central Commission of
Discipline Inspection. Table 62 documents prominent cases of the last years of the Hu/Wen
administration.

© THINK!DESK China Research & Consulting 2015 Seite 252
Table 62: Business Leaders Serving on the 17th CPC Central Committee or the
Central Commission of Discipline Inspection
Name Position in 2011 Since
Zhang Qingwei Chairman, Commercial Aircraft Corp. of China 2008
Xiang Junbo Chairman, Agricultural Bank of China 2007
Jiang Jianqing Chairman, Industrial & Commercial Bank of China 2005
Xiao Gang Chairman, Bank of China 2003
Chen Yuan Chairman, China Development Bank 1998
Lou Jiwei Chairman, China Investment Corp. 2007
Wang Xiaochu Chairman, China Telecom 2008
Zhang Guoqing CEO, China North Industries Group Corp. 2004
Xu Lejiang Chairman, Shanghai Baosteel Group Corp. 2007
Zhang Xiaogang GM, Anshan Iron & Steel Group Corp. 2008
Guo Shuqing Chairman, China Construction Bank Corp. 2005
Jiang Jiemin Chairman, China National Petroleum Corp. 2006
Liu Zhenya General Manager, State Grid 2004
Li Changyin GM, China Shipbuilding Industry Corporation 2001
Zhang Ruimin CEO, Haier Group 2000
Liu Shiquan Party secretary, No. 9 Institute of China Aerospace Science & Industry Corp.
2001
Lin Zuoming GM, China First Aviation Industry Corporation 2008
Shi Dahua Chairman, China Railway Engineering Corp. 2006
Yuan Jiajun Deputy General Manager, China Aerospace Sci-ence & Technology Corp,
2007
Jin Zhuanglong GM, Commercial Aircraft Corporation of China 2008
Su Shulin Chairman, Sinopec Group 2007
Li Jincheng Deputy Chief Engineer, China Railway Construc-tion Corp.
2003
Wei Jiafu CEO, China Ocean Shipping Companies Group 1998
Wang Zhigang GM, China Electronics Technology Group Corp. 2003
Xu Dazhe GM, China Aerospace Science & Industry Corp. 2007
Xu Bin GM, China South Industries Group Corp. 2003
Fu Chengyu Chairman, China National Offshore Oil Corp. 2003
© THINK!DESK China Research & Consulting 2015 Seite 253
Source: Li 2011 at 25.
Li’s review found that more than half of state business leaders included in this study was
promoted within the company they headed while a majority of those who were transferred
came from companies within the same industry. The number of leaders in central govern-
ment SOEs who transferred from government positions is relatively small. Prominent exam-
ples includes Zhang Qingwei, who held a cabinet position as head of the Commission for
Science, Technology and Industry for National Defence before becoming Chairman of the
Commercial Aircraft Corporation of China in 2007. After a four year stint at the company, he
was promoted to become governor and deputy party secretary of Hebei Province – positions
he still held in early 2015. Mr. Zhang is currently a member of the 18th CPC Central Commit-
tee and has been part of the 16th and 17th as well.
As a matter of fact, experience as a top manager in China’s leading state-owned enterprises
must be understood as a powerful catalyst for careers in high CPC and government functions.
While some examples are being outlined in greater detail below, table 63 provides a list of
high ranking cadres having served in state-owned enterprise boards before changing into
prestigious CPC or government positions.

© THINK!DESK China Research & Consulting 2015 Seite 254
Table 63: Prominent Political Leaders with Administrative Experience in SASAC
Companies and other Large SOEs (2011)
Name Current position CC member-ship
SASAC/ major company experience
Jia Qinglin
Chairman, Chinese People’s Political Consultative Con-ference
Politburo Stand-ing Committee member
General manager, China Na-tional Machinery & Equipment Import & Export Corporation (1978–1983)
Liu Qi Party secretary, Beijing
Politburo mem-ber
General manager, Wuhan Iron and Steel Company (1990–93)
Wang Qishan
Vice premier Politburo mem-ber
President, China Construction Bank (1994–97)
Xie Xuren
Minister, Finance Full member President, China Agricultural Development Bank (1998–2000)
Wei Liucheng
Party secretary, Hainan Province
Full member Chairman and CEO, China National Offshore Oil Compa-ny (1999–2003)
Zhang Chunxian
Party secretary, Xinjiang
Full member
General Manager, China Na-tional Packaging and Food Machinery Corporation (1993–1995)
Guo Shengkun
Party secretary, Guangxi Province
Alternate mem-ber
General manager, Aluminium Corporation of China (2001–04)
Xiao Ya-qing
Deputy secretary general, State Council
Alternate mem-ber
CEO, Aluminium Corporation of China (2004–09)
Zhu Yanfeng
Executive vice governor, Jilin Province
Alternate mem-ber
General manager, First Auto Work Group Corporation (1999–2007)
Wang Yupu
First secretary, All-China Federation of Trade Unions
Alternate mem-ber
Chairman, Daqing Oilfield Company (2003–09)
Chen Chuan-ping
Party secretary, Taiyuan City
Alternate mem-ber
General manager, Taiyuan Iron and Steel Company (2000–08)
Miao Wei Minister, Industry and Information Technology
Alternate mem-ber
General manager, Dongfeng Auto Corporation (1999–2005)
Li Xiao-Executive vice governor, Shanxi
None General manager, China
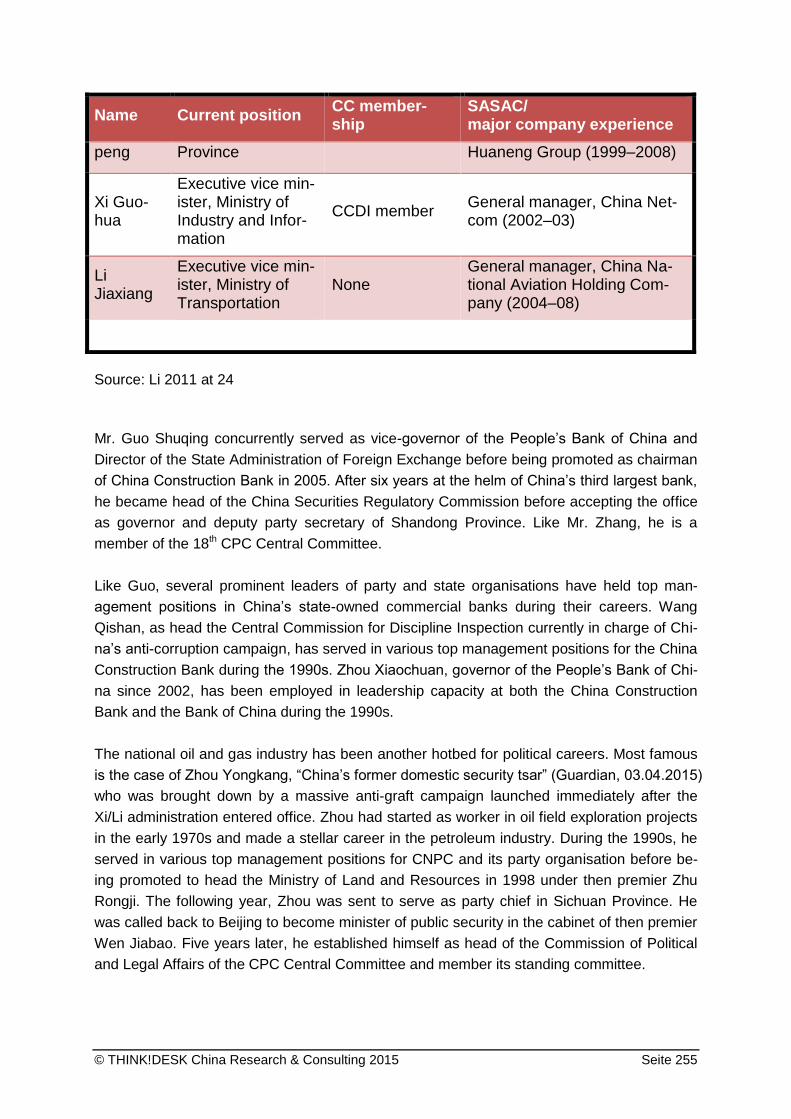
© THINK!DESK China Research & Consulting 2015 Seite 255
Name Current position CC member-ship
SASAC/ major company experience
peng Province Huaneng Group (1999–2008)
Xi Guo-hua
Executive vice min-ister, Ministry of Industry and Infor-mation
CCDI member General manager, China Net-com (2002–03)
Li Jiaxiang
Executive vice min-ister, Ministry of Transportation
None General manager, China Na-tional Aviation Holding Com-pany (2004–08)
Source: Li 2011 at 24
Mr. Guo Shuqing concurrently served as vice-governor of the People’s Bank of China and
Director of the State Administration of Foreign Exchange before being promoted as chairman
of China Construction Bank in 2005. After six years at the helm of China’s third largest bank,
he became head of the China Securities Regulatory Commission before accepting the office
as governor and deputy party secretary of Shandong Province. Like Mr. Zhang, he is a
member of the 18th CPC Central Committee.
Like Guo, several prominent leaders of party and state organisations have held top man-
agement positions in China’s state-owned commercial banks during their careers. Wang
Qishan, as head the Central Commission for Discipline Inspection currently in charge of Chi-
na’s anti-corruption campaign, has served in various top management positions for the China
Construction Bank during the 1990s. Zhou Xiaochuan, governor of the People’s Bank of Chi-
na since 2002, has been employed in leadership capacity at both the China Construction
Bank and the Bank of China during the 1990s.
The national oil and gas industry has been another hotbed for political careers. Most famous
is the case of Zhou Yongkang, “China’s former domestic security tsar” (Guardian, 03.04.2015)
who was brought down by a massive anti-graft campaign launched immediately after the
Xi/Li administration entered office. Zhou had started as worker in oil field exploration projects
in the early 1970s and made a stellar career in the petroleum industry. During the 1990s, he
served in various top management positions for CNPC and its party organisation before be-
ing promoted to head the Ministry of Land and Resources in 1998 under then premier Zhu
Rongji. The following year, Zhou was sent to serve as party chief in Sichuan Province. He
was called back to Beijing to become minister of public security in the cabinet of then premier
Wen Jiabao. Five years later, he established himself as head of the Commission of Political
and Legal Affairs of the CPC Central Committee and member its standing committee.

© THINK!DESK China Research & Consulting 2015 Seite 256
Mr. Jiang Jiemin, who headed the State-owned Asset Supervision and Administration Com-
mission of the State Council for less than a year before being removed on allegation of disci-
pline violations presents another case of a career official who rose through the petroleum
industry. After heading the government departments in charge of the petroleum industry in
various provinces, Liu became vice governor (and later) deputy party secretary of Qinghai
Province. In 2004, he transferred to Beijing to serve as vice general manager and deputy
party secretary of CNPC. Two years later he graduated to become the company’s general
manager and party secretary. In 2013 he was promoted to lead the State-owned Asset Su-
pervision and Administration Commission of the State Council.
The bribery charges against Zhou Yongkang and his eventual expulsion from the party has
led to the downfalls of several senior management and party personnel at CNPC. Besides
Jiang Jiemin, mentioned above, this includes
Shen Dingcheng, vice president and party secretary of PetroChina International,
Wang Daofu, CNPC’s chief geologist,
Wang Yongchun, CNPC’s deputy general manager,
Li Hualin, board secretary of CNPC,
Tao Yuchun, Executive of CNPC’s Kunlun Energy division
However, many other individuals with petroleum industry backgrounds were not brought
down by the campaign. These include
Mr. Wei Liucheng, began working in the petroleum industry in the early 1970s - his work unit
later became part of China National Offshore Oil Corp. (CNOOC). He rapidly progressed in
the company so that by 1999 he was CEO, general manager and party secretary of CNOOC.
In 2003, Wei moved to Hainan Province, where he became governor, party secretary and
chairman of the standing committee of the provincial people’s congress (2007). Wei had
been a member of the 17th CPC Central Committee.
Mr. Su Shulin, too spent a successful career in the petroleum industry, Su was appointed as
deputy general manager and member of the party committee at China National Petroleum
Corp. (CNPC) in 2003. In late 2006, he left the company after being named a member of the
standing committee of the party committee of Liaoning Province and head of the provincial
party committee’s organisation department. In the summer of 2007, Su was appointed presi-
dent and party secretary of Sinopec Group Corp. Four years later he then transferred again
to take his current office as governor of Fujian Province. Su is a member of the 18th CPC
Central Committee.
The automobile industry serves as yet another launch pad for government and party careers,
as the following two examples will illustrate. Mr. Xu Jianyi, served as president and general
manager of FAW, China’s oldest and largest automobile manufacturer, before being detained
on suspected serious violations of party discipline and law in March 2015 (SCMP
19.03.2015). Xu had started his career in the automobile industry in the 1970s and rose

© THINK!DESK China Research & Consulting 2015 Seite 257
through the ranks at FAW based in Changchun City, Jilin Province. In 2004, then a senior
manager, Xu was appointed as Mayor of Jilin City. After two years in office, he was named
party secretary of Jilin Province. In late 2007, Xu returned to FAW as the company’s presi-
dent and general manager.
Mr. Miao Wei, currently head of the MIIT worked in various functions at Dongfeng Automobile
Corp. in Wuhan City, Hubei Province. He was appointed secretary of Dongfeng’s party com-
mittee in 1997 general manager in 1999 – positions he held until 2005. In 2003, Miao joined
the provincial party committee and its standing committee. After leaving Dongfeng, he also
became member of the municipal party committee of Wuhan and the chairman of the city’s
people’s congress. In 2008, he was called to Beijing to serve as vice-minister and deputy
party secretary of the MIIT. After two years in office, he was promoted to lead the ministry
and its party committee.
In sum, it can be postulated that in China’s socio-economic system political and party careers
go hand in hand with corporate careers. As a matter of fact, at least in the state-owned en-
terprise sector, success in the latter sphere is impossible without corresponding accom-
plishments in the CPC hierarchy.
3.3 Government Institutions as Meeting-Points and “Market-Places” for Chi-
na’s Elites
Given the close interdependence between the political (government, CPC) sphere and the
business sector in China, there exists a substantial demand for fora at which representatives
of these two spheres can meet – especially by those who are not already integrated in formal
institutional settings linking politics and business.
The multi-tiered system of People’s Congresses, reaching from the village level via the town-
ship, town, district, and provincial level up to the National People’s Congress, constitute such
meeting points and play an important role for the interaction between entrepreneurs, politi-
cians and administrative bureaucrats in China. Although the National People’s Congress
(NPC), is – in theory – the highest political body in China and holds substantial law-making
powers, membership in the various levels of People’s Congresses is not restricted to mem-
bers of the CPC, but extends to representatives of all groups of the population.16 This allows
these Congresses to function as market places for the elites in the different spheres of social
and economic life in China. It is here that politicians and entrepreneurs, Party members and
non-Party members can meet and explore their respective demand and supply structures.
While entrepreneurs and enterprise leaders look for the resources, business licensees, pro-
motional programmes and protective measures administered discretionarily by (local) politi-
16
De facto the CPC controls all activities of the various People’s Congresses and in real live has degraded the NPC to an entity which exists first of all only to rubber stamp decisions made in the confines of the CPC.

© THINK!DESK China Research & Consulting 2015 Seite 258
cians, the latter are in demand of savvy businessmen that can drive local economic devel-
opment, implement green business models, etc. and thereby help them in their career ad-
vancement.17
It therefore does not come as a surprise that, for example, among the directors of China’s
leading state-owned steel mills, several are delegates (or alternate) delegates to the National
People’s Congress, China’s national legislature. Examples include Zhang Xiaogang, board
chairman and general manager of Anshan Steel and Li Xiaobo, board chairman of Taiyuan
Steel. Chief executives of smaller as well as private companies are often delegates to pro-
vincial or municipal people’s congresses, like Zhou Zhijiang, the chairman of the board of
directors of Jiuli Pipe.
To just a trifle smaller extent the “market-making” function between business, politics and the
Party sphere is also realised in the context of the People’s Political Consultative Conferences
(PPCC) at various levels of the administrative hierarchy. The PPCCs are advisory bodies
present on all administrative levels in China (Teufel-Dreyer 2013). They discuss important
socio-economic issues and are supposed to give groups outside the CPC a (consultative)
voice in the political process. It is common that board members of important local firms are
functioning as representatives in local or higher level PPCC, where they can establish close
relationships with cadres from the government and Party hierarchies. Examples include Zhou
Xinhua, vice chairman of the board and managing director of Kingland Pipe, who simultane-
ously serves as representative of Zhejiang Province’s PPCC.
3.4 Conclusion: China’s State-Business Nexus
The observations made in the preceding sections clearly show that Chinese government
bodies at all levels of hierarchy as well as the CPC as the overpowering ruling body, continue
to exert tremendous influence on the macro- as well as micro-development of China’s econ-
omy and business operations.
This peculiar relationship between the Chinese State (i.e. the CPC and the government) and
the business sector highlights the specific character of the Chinese economic system, which
Bai, Hsieh and Song have been classifying as “Crony Capitalism with Chinese Characteris-
tics” (Bai, Hsieh and Song 2014, p. 2). They understand that in this system “a sine qua non
of successful capitalists in China is that they need to be cronies of political leaders” (Bai,
Hsieh and Song 2014, 2). Given the deficient state of the formal institutional setting in China,
the authors judge “the only way for entrepreneurs to succeed is to form special relationships
with political leaders, which allows them to either break the formal rules or to obtain exclusive
access to resources” (Bai, Hsieh and Song 2014, p. 2)
17
See in this context also: Heberer/Trappel 2013, Edin 2003.

© THINK!DESK China Research & Consulting 2015 Seite 259
The authors of this report fully agree with this assessment, but see a need to extend the un-
derstanding of the Chinese State-Business nexus. It is not only that business representatives
are dependent on government and Party cadres in order to bring their business models to
success. At the same time, (local) cadres have also become reliant on “their” entrepreneurs
and business leaders in order to advance their policy programmes and – last not least – indi-
vidual careers (Xu 2011).
The central institutional arrangement underlying the CPC’s rule of the country and the organ-
isation of the national economy can be understood to be a regime of “regionally decentral-
ised authoritarianism” (Xu 2011), where on the national level the CPC concentrates on ap-
pointing and controlling all major decision making personnel of subnational governments and
key economic entities (i.e. SASAC controlled SOE). This direct control over individual ca-
reers is deemed (and factually appears to be) sufficient to align subnational decision makers
with the general gist of central government policies and therefore allow for a far reaching
delegation of powers to subnational entities in the governance of local economies and opera-
tional guidance of local economic development processes.
The substantial regional autonomy granted in this regime is highly incentivised in so far as
local cadre career advancement is dependent on performance indicators highly biased to-
wards economic goals (Edin 2003) and measured in terms of inter-regional competition. In
this system regions – or rather their decision making elites – are being pitched against each
other in order to push local cadres to ever higher levels of performance (in terms of the per-
formance parameters defined). In order to excel local cadres must rely on their local busi-
ness constituency and their entrepreneurial savvy (Nee and Opper 2012). As such local gov-
ernment officials are willing to provide local firms with any support and protection deemed
necessary to achieve outstanding economic results – irrespective of any negative externali-
ties to other localities or the nation as a whole. Central government interventions to rein in
excessive local activity usually come only very late and then function as ex-post macro-
economic control measures, i.e. only once damage has already been generated.

© THINK!DESK China Research & Consulting 2015 Seite 260
Part II
The Chinese Economic System
at the Interface with the Global Markets
© THINK!DESK China Research & Consulting 2015 Seite 261
4. INTERNATIONAL TRADE
Since the foundation of the PR China, the China’s government has followed a policy of tight
regulation and active control of all international trade activities. In the following the most im-
portant contemporary programmes and policy tools are being discussed.
4.1 Organisational Structures of China’s Foreign Trade Administration
The principle agency tasked with all matters related to foreign trade is the Ministry of Com-
merce (MOFCOM). Much of the current regulatory framework for foreign trade policy is laid
out in the Foreign Trade Law of the People’s Republic of China (NPC 2004c). The MOFCOM
drafts policies, overseas their implementation and maintains control mechanisms to sanction
rule violations. Like all ministries and commissions of the central government, the MOFCOM
is subordinate to the State Council, China’s cabinet. The State Council deals with foreign
trade on a more selective basis and makes decisions on questions of long term strategic
importance for the national economy and public welfare.
Lower level government, like provinces and cities, also have departments for foreign trade
which are generally tasked with monitoring trade related issues within their respective juris-
dictions. These departments supervise policy implementation and enforcement on the local
level and report back to the MOFCOM unit at the next higher hierarchy level.
In its work, MOFCOM maintains close cooperation with the Ministry of Industry and Infor-
mation Technology (MIIT) on matters related to domestic industrial policy. As policies for de-
veloping and upgrading domestic industries are closely connected to foreign trade,
MOFCOM helps to integrate trade policy into the broader industrial policy framework.
MOFCOM thus oversees important aspects of the regulatory framework.
The General Administration of Customs (GAC) has the status of a central government minis-
try but is dealing with implementation policies drafted by MOFCOM. GAC has a variety of
tasks beyond the execution of measures related to foreign trade. However, it is tasked to
supervise inflows and outflows of goods, collect import and export duties as well as value
added tax.

© THINK!DESK China Research & Consulting 2015 Seite 262
4.2 Import-Targeting Policy Measures
4.2.1 Import substitution
The Chinese government actively promotes the localization of technology development and
product manufacturing in order to substitute imports by domestic supply. Since China joined
the WTO in 2001, the number of related promotion programmes and the frequency with
which localization objectives are specified has decreased. Neither the 11th nor the 12th na-
tional FYP explicitly call for the displacement of imports. However, measures targeting the
localization of intellectual property and location specific subsidies create an uneven playing
field for imported goods to compete on. Furthermore, the vanquishing of direct language from
most documents issued by the central government obscures the fact that import substitution
targets can still be found in the policies published on the sub-national level. In the following, a
few instances are presented where local and even central authorities indicate their continued
preference for replacing imports by local supply.
The National Work Safety Administration, for example, has stated that during the up-
coming 13th FYP period, all projects under the 863 National Plan Technology Re-
search should address supply bottlenecks and technological weaknesses in the field
of advanced accident protection equipment. To this end, all players were called upon
to vigorously work towards replacing imports by domestic solutions (NWSA 2015).
In 2014, the MIIT released the Plan for Preventing and Addressing Atmospheric Pol-
lution and the Promotion of Clean Production Technologies in Key Industries. The
document urges to improve technology and quality levels in the field of vanadium sul-
phate catalysts in order to replace imports by local production (MIIT 2014).
In 2013, the MIIT and the MOST jointly released a circular urging companies to put
forth suggestions for a planned revision of the National Catalogue for Encouraging
the Development of Major Technologies and Equipments for Environmental Protec-
tion. Enterprises were invited to submit proposals of products and technologies to be
reviewed by the two ministries. In order to guide corporate inputs, the joint circular
outlined key criteria that suggested technologies would have to meet. The instructions
stipulate that the approval process for technologies and products recommended for
application and popularization would take into account the potential for replacing im-
ports (MIIT and MOST 2013).
In 2013, the MOST released the Guidelines for the Technology Innovation Fund for
Supporting Science and Technology-oriented SMEs. The Guidelines stated that for
new-type control technologies and in the front-end research of new products, that
promoted technologies should meet advanced international levels and companies
need to possess their proprietary intellectual property. Furthermore, they should offer
the potential to replace imports and boost exports (MOST 2013).
In the field of machine components, the policy supports the use of high speed, high
precision heavy rail bearings which allow the displacement of imported goods (ibid).

© THINK!DESK China Research & Consulting 2015 Seite 263
In the field of seawater desalination, the policy calls for significant increases in prod-
uct performance and production scale. Technology breakthroughs and the replace-
ment of imports by domestic supply are to facilitate the application of critical technol-
ogies on a large scale (ibid).
In 2013, the MIIT published the Circular on Applications for Priority Tasks of Major
Science and Technology Projects in the Field of High-grade CNC Machine Tools and
other Manufacturing Equipment. In line with the National Science and Technology
Support Plan, the document outlines (in detail) numerous priority tasks (MIIT 2013b).
Task #31 addresses high speed, high precision, digitally controlled blanking lines for
silicon steel plate. Major research aims include a 5-8 times productivity increase, a 50
percent reduction of energy use, an 80 percent saving in labour inputs, a 50 percent
cut in occupied area and the replacement of imports by domestic output (ibid).
Tasks #60 (and 61) involve demonstration projects for the application of localised
production lines for cylinders and flexible cylinder heads used in medium- (large-)
sized diesel engines. The task descriptions emphasize the importance of relying on
domestic materials, products and technologies for raising local efficiency and quality
to advanced international levels. Implicitly and explicitly, the outline calls for replacing
imports and boosting localization (ibid).
In 2012, the MOF and the State Oceanic Administration (SOA) issued the joint Circu-
lar on the Promoting Regional Demonstration for Oceanic Economic Innovation and
Development. The document identifies several key points for future development un-
der state support. These include new-type marine biology materials. The latter are to
be supported if they are shown to possess unique functionalities or replace imports,
e.g. haemostatic materials, anti-adhesion materials, slow-release materials, emboli-
sation materials (MOF and SOA 2012).
In 2009, the MOST, the NDRC and the MOF jointly issued the Circular on Launching
Accreditation Work for National Indigenous Innovation Products. The document in-
vites companies to submit certification applications for Indigenous Innovation Prod-
ucts based on the National Medium and Long-term Plan for the Development of Sci-
ence and Technology (2006-2020). In the annex, it provides an application form to
collect information and submit applications in a standardized format. One of the first
questions companies have to answer about their products is whether it can contribute
to replacing imports. Complementing instructions specify that “Products have started
selling on the market, possess economic value and relatively large market potential or
can replace imports” (MOST, NDRC and MOF 2009 at 4.7).
The formulation has been adopted almost unchanged from the Administrative
Measures for the Accreditation of National Indigenous Innovation Products (for Trial
Implementation) that was released in 2006. Article 4.7 reads: “The product has poten-
tial economic proceeds and a large market prospect or can be substituted for imports”
(MOST, NDRC and MOF 2006).
© THINK!DESK China Research & Consulting 2015 Seite 264
As can be seen from the preceding paragraphs, central government bodies have not shied
away from calls for substituting imports with local manufactures. As the following table 64
illustrates, such calls are even more common on the provincial and even municipal levels.

© THINK!DESK China Research & Consulting 2015 Seite 265
Table 64: Import Substitution Provisions Included in Selected Government Documents Issued at the Sub-central Level
Regional authority Type of support Target of support Source document
Jiangsu Province Sci-ence and Technology Department
Technology demonstration projects Construction of science and technol-ogy communities Applied research on key technologies
Focus on biotechnology and medical equipment Development of high grade wound dressings, fully digitized diagnostic equipment and artificial organs
Guideline for social development projects under the Science and Technology Support Plan for Jiangsu Province in 2013 SuKeJi 2013, No. 38
Shandong Province Finance Department and Science and Technology Depart-ment
Disbursements of grants from a Spe-cial Fund
Accomplish the displacement of imported medical equipment and generate exports Step up support for key common use technology projects. Special promotion of projects for developing core technologies in key industries to fill banks in the domestic market, replace imported products or break the blockage of foreign patents.
Work distribution for the imple-mentation plan for the Special Fund for Indigenous Innovation of Shandong Province LuCaiJiao 2012, No. 72
Hunan Province Economic and Infor-mation Technology Department
Unspecified promotion measures Special promotion for the localisation of large electric wheel dump truck technologies. R&D and technology industrialization should speed up domestic manufac-turing and replace imports.
Guidance Catalogue for the de-velopment of major key technolo-gies in strategic emerging indus-tries in Hunan Province XiangTuiXinGongBan 2013, No. 13
Shenzhen City
Fiscal support, demonstration pro-jects, promotion of talent develop-ment, branding etc
Replacement of imports in the field of components and complementary products, such as packaging equipment and solid crystals
LED industry development pro-gramme of Shenzhen City (2009-2015) ShenFu 2009, No. 41
Shandong Province
Fiscal support, provision of subsidies from special funds, credit support from financial institutions, streamlin-ing of administrative procedures etc.
Replacement of imports is specified as goal in the field of high performance and high value added cop-per products
Action plan for promoting the transformation and upgrading of industries in Shandong Province (2015-2020) LuZheng BanFa 2015, No. 13
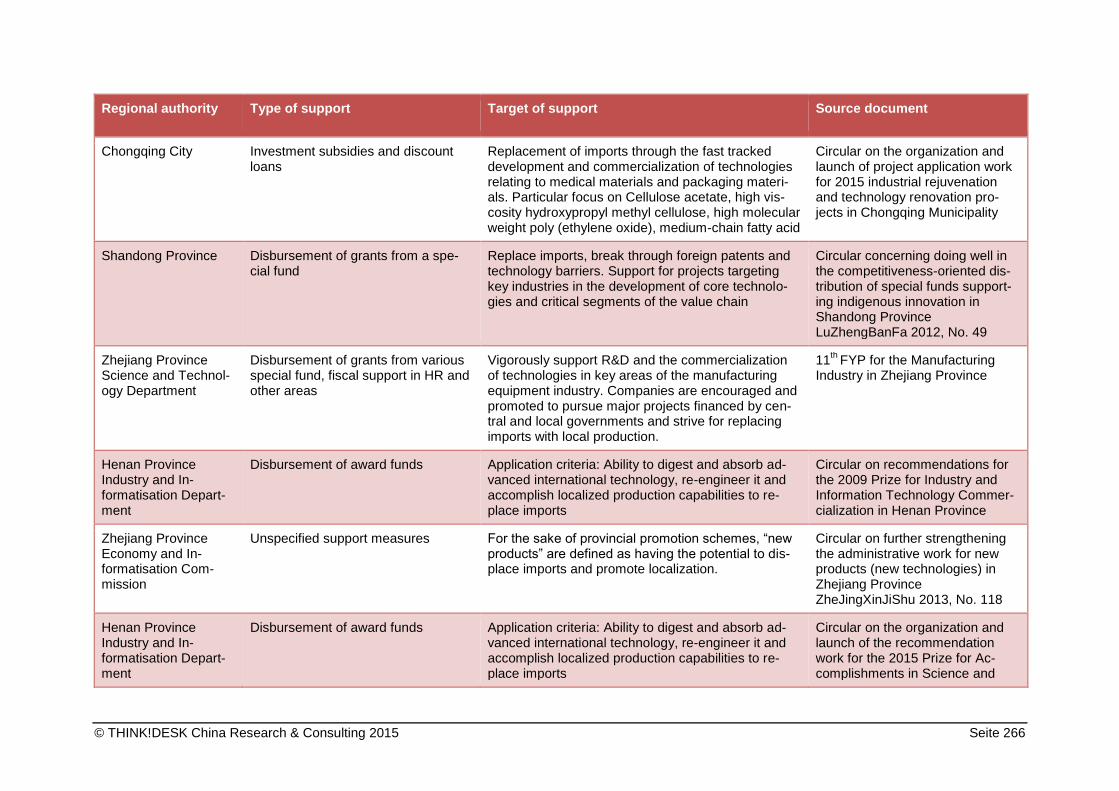
© THINK!DESK China Research & Consulting 2015 Seite 266
Regional authority Type of support Target of support Source document
Chongqing City
Investment subsidies and discount loans
Replacement of imports through the fast tracked development and commercialization of technologies relating to medical materials and packaging materi-als. Particular focus on Cellulose acetate, high vis-cosity hydroxypropyl methyl cellulose, high molecular weight poly (ethylene oxide), medium-chain fatty acid
Circular on the organization and launch of project application work for 2015 industrial rejuvenation and technology renovation pro-jects in Chongqing Municipality
Shandong Province
Disbursement of grants from a spe-cial fund
Replace imports, break through foreign patents and technology barriers. Support for projects targeting key industries in the development of core technolo-gies and critical segments of the value chain
Circular concerning doing well in the competitiveness-oriented dis-tribution of special funds support-ing indigenous innovation in Shandong Province LuZhengBanFa 2012, No. 49
Zhejiang Province Science and Technol-ogy Department
Disbursement of grants from various special fund, fiscal support in HR and other areas
Vigorously support R&D and the commercialization of technologies in key areas of the manufacturing equipment industry. Companies are encouraged and promoted to pursue major projects financed by cen-tral and local governments and strive for replacing imports with local production.
11th
FYP for the Manufacturing Industry in Zhejiang Province
Henan Province Industry and In-formatisation Depart-ment
Disbursement of award funds Application criteria: Ability to digest and absorb ad-vanced international technology, re-engineer it and accomplish localized production capabilities to re-place imports
Circular on recommendations for the 2009 Prize for Industry and Information Technology Commer-cialization in Henan Province
Zhejiang Province Economy and In-formatisation Com-mission
Unspecified support measures For the sake of provincial promotion schemes, “new products” are defined as having the potential to dis-place imports and promote localization.
Circular on further strengthening the administrative work for new products (new technologies) in Zhejiang Province ZheJingXinJiShu 2013, No. 118
Henan Province Industry and In-formatisation Depart-ment
Disbursement of award funds Application criteria: Ability to digest and absorb ad-vanced international technology, re-engineer it and accomplish localized production capabilities to re-place imports
Circular on the organization and launch of the recommendation work for the 2015 Prize for Ac-complishments in Science and

© THINK!DESK China Research & Consulting 2015 Seite 267
Regional authority Type of support Target of support Source document
Technology in Henan Province YuGongXinBanKe 2015, No. 83
Jiangsu Province Science and Technol-ogy Department
Unspecified support measures Priority support under the New Product Plan of Jiangsu Province targets, inter alia, items that gener-ate foreign exchange through exports, displace im-ported products and lead to the localization of pro-duction to a degree of 80 percent or more.
Administrative (trial) measures for the Key New Product Plan for Jiangsu Province SuKeJi 2009, No. 106
Beijing City Administration Com-mittee of the Beijing Economic and Tech-nology Development Zone
Compensation of 10-30 percent of R&D expenses as subsidies
Promotion of projects that are recognized as key Enterprise-Education-Research innovation projects, that generate proprietary intellectual property rights through R&D and those that allow for the displace-ment of imports
Preferential Policies for Compa-nies Located in the Beijing Eco-nomic and Technology Develop-ment Zone 2009
Shandong Province
Disbursement of grants from a spe-cial fund
Conduct R&D in order to displace imports and break international monopoly barriers in fields like integrat-ed circuits, semiconductors and new energy battery materials.
Circular on organizing project applications for the special fund for the development of the IT in-dustry in Shandong Province
Heilongjiang Province
Provision of grants and various other financial benefits. Focus on the culti-vation of a group of champion enter-prises
In the field of heavy machinery, local companies should strive to displace imports and safeguard their leading position in the domestic market.
11th
FYP of Heilongjiang Province for the development of the equip-ment manufacturing industry
Guangdong Province Science and Tech-nology Department, Finance Department
Unspecified support measures Promotion for automated manufacturing equipment for traction batteries as well as the development and commercialization of critical technologies for battery production lines Companies should realize technology breakthroughs to create their own property rights, accomplish locali-zation of technologies and the replacement of im-ports.
Circular on project applications for the 2014 cutting edge and key technology innovation special fund (major provincial science and technology projects) YueKeHanGuiCaiZi 2014, No. 1454

© THINK!DESK China Research & Consulting 2015 Seite 268
4.2.2 Government Procurement
Chinese government is not only implementing import substitution schemes in the way out-
lined above, but is also instrumentalzing government procurement as a means to promote
domestic Chinese firms versus their foreign competitors.
Public procurement policies in China have in recent years been explicitly geared to support
the development of domestic suppliers. China has not signed the WTO Agreement on Gov-
ernment Procurement (GPA) to which most OECD countries, including all 28 European Un-
ion member states, are parties. The Agreement compels signatories to maintain transparent
procedures and practice non-discriminatory in public purchasing. As ratification is not manda-
tory for WTO membership, China has so far refused to fully commit itself to the stringent re-
quirements it imposes.18 The Chinese government thus acts within its legal rights in profess-
ing to buy-local policies. While temporary regulations governing public purchasing have ex-
isted in China since 1999, the current legal basis for all such transactions from the central
government down to the village administration level, is specified by the Government Pro-
curement Law passed in 2002 (NPC 2002). The law mandates that “Government procure-
ment should be based on the procurement of domestic goods, projects and services” (Art.10)
Exceptions are made in cases where articles are unavailable in China or cannot be obtained
under “reasonable commercial circumstances”19 (Art. 10a). Although the Government Pro-
curement Law was amended in 2014 (NPC 2014c) and complemented by a set of Implemen-
tation Conditions (State Council 2015a), new regulations do not change the previous buy-
local bias.
Since 2007, regulation is in place to guide government procurement of imported products
and services. Authorities have also implemented complicated and partly intransparent ap-
proval requirements that complicated bidding by foreign companies. The Administrative
Measures for Government Procurement of Imported Products (MOF 2007a) introduced addi-
tional bureaucratic procedures, requiring the approval of government administrations in
charge of certain industries before purchases can be made. E.g. offices planning to buy for-
eign IT products would have to seek approval from the MIIT. Furthermore, the document
mandates the institution of separate review panels serving to decide on a case by case basis
whether or not a superior bid from a foreign supplier can be accepted. Finally, every individ-
ual transaction has to be reviewed and approved by the MOF and its branch office on the
local level. The market for railway rolling stock is a case in point. Here, highly restrictive qual-
18
Several tentative offers to join the GPA have been rejected by the other parties as not being far reaching and comprehensive enough. By the time of writing, in June 2015, China had observer status at GPA proceedings.
19 A draft version of the Implementation Regulations of the Government Procurement Law clarify
that reasonable circumstances are present as long as the price of a domestic good that meets the required specifications is not more than 20 percent above the lowest offered price for foreign goods (Art. 10). This may only serve as an indication, as until September 2014, the Implementa-tion Regulations had not yet entered into law.

© THINK!DESK China Research & Consulting 2015 Seite 269
ification requirements continued to exclude even leading foreign suppliers from being admit-
ted to participate in public tendering (ibid).
While discrimination against imported products and services remains prevalent, several for-
eign companies have successfully entered the government procurement market. However,
such examples are more the exception than the rule. Even where enterprises have made
inroads in recent years, like in the case of the automobile industry, Chinese authorities at-
tempt to roll back this development. In April of 2012, central authorities published a catalogue
of passenger vehicles approved for government procurement. The list only contained prod-
ucts manufactured under domestic brands (Panjin City 2012). Similarly, new regulations for-
bid military personnel to buy imported vehicles or those manufactured by foreign brands (Si-
na 13.01.2014).
Tensions with international trading partners have erupted after the State Council drafted a
series of laws in the wake of the global financial crisis that tied government procurement to
policies promoting indigenous innovation. The Circular on Further Strengthening the Admin-
istration of Government Procurement Work (GOSC 2009), issued by the State Council in
April 2009, adds further weight to the discrimination against imports prescribed in the Gov-
ernment Procurement Law. It narrows market access for foreign rules by ruling that all
equipment in the field of high technology has to be sourced locally as long as a domestic
supplier is available. The State Council explicitly reinforced the preference of local contrac-
tors and orders government organizations on all levels to abolish any form of discrimination
against domestic suppliers.
The Opinions on the Implementation of Decision Concerning the Expansion of Domestic
Demand, Promotion of Economic Growth and Further Strengthening the Supervision of Ten-
dering and Bidding for Construction Projects jointly passed by the NDRC, MIIT and seven
other ministries the following month reinforce and emphasize the requirement to give prefer-
ence to indigenous innovation products when it comes to state-financed key projects (EC
2014). It is doubtful that local governments needed to be reminded of supporting local com-
panies before all others. As the case of electric vehicles contained in the study illustrates,
provincial and municipal authorities have continuously displayed a strong by-local preference
– to the point where local protectionism has impeded the efficient functioning of a unified
national market.
In recent years, the combination and integration of buy-local and indigenous innovation poli-
cies have been viewed with particular concern by China’s foreign trading partners. Starting
with the promulgation of the Medium and Long-term Science and Technology Development
Plan (2006-2020), the Chinese government has indicated its intention to support domestic
companies active in R&D. It states that
“Implementation regulations for the Government Procurement Law should be
drafted to encourage and protect indigenous innovation.” [and announces that] “A
policy of preferential procurement of high and new technology equipment and

© THINK!DESK China Research & Consulting 2015 Seite 270
products developed by domestic companies that hold relevant intellectual proper-
ty rights would be implemented.” (at 8.3)
The Plan calls for setting technical standards and establishing a coordination mechanism for
state purchases of such products.
During the following year, a flurry of regulatory documents was published, outlining in great
detail the certification criteria and supporting measures for indigenous innovation products.20
Based on the evaluation standards drafted by the MOST, the MOF should compile a cata-
logue, listing all accredited indigenous innovation products that would be
“given priority in government procurement, procurement for national key projects
or other procurement using government funds and will be given further support in
the accreditation process for new- and high-technology enterprises.”
Plans also included a special system for channelling public funds into the procurement of
indigenous innovation products and a minimum threshold of 60 percent to which these need
to be contained in key projects financed by any government organization. Government agen-
cies were supposed to act as first or early buyers of new products in order to advance indus-
trial policy and national development targets. This type of purchasing was largely released
from the constraints of commercial rationality and market competitiveness. It does not come
as a surprise that the buy-local practice is the cause of much inefficiency and corrupt trans-
actions. In a press interview, Liu Kun, head of the Finance Bureau of Guangdong Province,
pointed out that high prices, low quality are common problems (Jingji Cankao Bao
12.08.2009).
Facing stiff resistance from the U.S. and other countries, in early 2011 the Chinese govern-
ment agreed to abandon preferential procurement policies for indigenous innovation products
and in November of that year, the State Council released a circular ordering all local gov-
ernments to stop the practice completely. Provincial and municipal governments, many of
which had made active use of special catalogues and provisions to support local new- and
high technology enterprises, had to repeal any buy-local policies before the end of that year.
While the majority of government organizations have reported back to confirm the elimination
of such provisions, some jurisdictions have not complied with the new directive. In May 2015,
a survey carried out by the US-China Business Council has found, however, that 12 provin-
cial level jurisdictions, including Sichuan and Zhejiang, had not yet formally renounced previ-
ous policies tying indigenous innovation to government procurement. Furthermore, numerous
municipalities had not yet abolished obsolete pieces of regulation (USCBC 2015). While it is
remakable that 12 regions have not complied with central government directives for a full
three years, disregard on the local level is even more pronounced. This is because municipal
20
Circular of Supporting Policies, Trial Measures for Managing the Accreditation of National Indig-enous Innovation Products (MOF 2006a), Evaluation Measures on Indigenous Innovation Prod-ucts for Government Procurement and Administrative Measures for the Government to Initially and Selectively Purchase Indigenous Innovation Products (MOF 2007b).

© THINK!DESK China Research & Consulting 2015 Seite 271
governments control the largest segment of China’s government procurement market. In-
deed, in a recent report, the EC pointed out that
“The nationwide ‘Buy Chinese’ measures have been echoed by numerous ‘Buy
Chinese’ or even ‘Buy Local’ initiatives taken by provincial or municipal authori-
ties” (EC 2014 at 132).
The Government Procurement Law applies to government organization throughout the ad-
ministrative hierarchy, but excludes purchases made by SOEs. The Government Procure-
ment Law thus governs purchases made with fiscal funds by government departments, insti-
tutions and public organizations where the the goods, services and construction projects are
contained in a centralized procurement catalogue. The catalogue is managed by the MOF
and applies to procurement items exceeding a threshold of 500,000 RMB for goods and ser-
vices and 600,000 RMB for construction projects. The thresholds are not uniform across the
country as sub-central governments can adjust them to local conditions.
While the Chinese government has made efforts to improve the transparency of procurement
activities by publishing bidding information online, clarifying procedures through additional
regulation and introducing strong sanctions on rule violations by purchasing officials, major
problems remain. For example, the definition of domestic goods and local content are un-
clear. While the MOF has ruled in 2004 that bidders must be registered in China and their
products manufactured inside the country, it does not appear that China-based subsidiaries
enjoy the same access to government procurement as do local companies. The European
Commission (2014 at 133) has pointed out that “Central and local entities tend to implement
in a very broad manner those provision, going far beyond discrimination already imposed by
the law”.
In executing purchases, some improvement with regard to the adherence to market princi-
ples is reflected in the increasing use of competitive bidding vis-à-vis the other four admissi-
ble methods: selective tendering, competitive negotiations, request for quotation and single-
source procurement. Public tendering has become the most commonly used method, ac-
counting for over 80 percent of all transactions (WTO 2014a).
However, in several industries even the prevalence of competitive bidding has not offered fair
market access to foreign companies manufacturing inside China. The wind power sector is a
case in point. As a report released by the European Commission in 2014 has showed, re-
strictive qualification requirements and opaque bidding procedures threaten to shut out for-
eign player of this important market. Furthermore, a narrow focus on unit prices as key crite-
rium and the disregard of quality, efficiency and lifetime cost considerations amounts to de
facto discrimination against manufacturers of advance equipment (EC 2014).
In the absence of concrete data, the market share of foreign suppliers and contractors is very
hard to gauge. Anecdotal evidence suggests, however, that import penetration in the gov-
ernment procurement market has remained minute.

© THINK!DESK China Research & Consulting 2015 Seite 272
4.2.3 Import Cartels
Until 2013, the Chinese government maintained a system of controls for imports of different
raw materials, like iron ore. The latter case is instructive and is used here to represent similar
practices and arrangements in other areas.
In the mid 2000s, the price of seaborne iron ore skyrocket under the influence of surging
Chinese demand. Rapid expansion of iron and steel smelting strained global iron ore sup-
plies and led miners to a series of strong price hikes. Because the international iron ore trade
was dominated by a narrow oligopoly of only three miners, price setting power was relatively
high. Representative of Chinese steel mills, on the other hand, had little bargaining power
because the number of iron ore importers was large. This situation led the Chinese govern-
ment and the China Iron and Steel Association (CISA) to appoint Baosteel Co. as the sole
legal representative of Chinese iron ore buyers at the international iron ore price talks.
Furthermore, the central government tasked CISA to set up an import coordination scheme
in order to streamline the Chinese iron ore import market and ensure that imported resources
would only be available to approved companies. A catalogue with performance criteria was
drawn up to serve as benchmark for determining which companies would qualify to access
import ores. Responsibility for carrying out the review and approval process was delegated to
the CISA. Once or twice a year, the association released lists identifying the companies
which had been cleared to buy and trade imported ores. A comprehensive regulatory frame-
work on import market guidance mechanisms was set up to establish a buyers’ cartel in the
iron ore market. Most of the administrative tasks and responsibilities have been entrusted to
the CISA and the China Chamber of Commerce of Metals Minerals & Chemicals Importers &
Exporters (CCCMC). The two organisations were granted the permission to act as gatekeep-
ers and restrict market access where they deemed necessary. In order to prevent arbitrary
decision making, the discretion of CISA and CCCMC was curtailed by more or less transpar-
ent criteria for market entry. The criteria, however, required that applicants proved large iron
ore consumption and steel output in previous years. These and several other provisions lim-
ited the scope of eligible companies to only the largest and most potent players. As a conse-
quence the list of qualified iron ore importers and traders displayed a heavy dominance by
SOEs.
The import cartel under the influence of SOEs exercised control over the iron ore market for
only a few years. Since early 2013, iron ore supply from Australia and Brazil surged on the
base of new mining capacities coming on stream. Additional supplies were met by stagnating
steel output growth and lacklustre iron ore demand. Falling iron ore prices and institutional
changes to the way iron ore prices are formed robbed the cartel of its significance. It was
cancelled in July 2013.
While the regulatory framework has been put out of use, it has not vanished. As the institu-
tions tasked with the supervision of imports remain active, import coordination may be re-

© THINK!DESK China Research & Consulting 2015 Seite 273
vived once the economic situation requires decisive action to support local players, e.g. in
the course of a sharp economic downturn.
4.2.4 State trading
According to WTO rules, state trading enterprises (STE) defined as companies “which have
been granted exclusive or special rights or privileges, including statutory or constitutional
powers, in the exercise of which they influence through their purchases or sales the level or
direction of imports or exports” (WTO 1994b at 2). While the WTO permits the operation of
STEs, they have to operate in a non-discriminatory manner and solely according to commer-
cial considerations. Furthermore, WTO members are required to identify such companies in
special notifications to the organization. By the time of writing, China’s last such notification
was submitted in 2003 and is out of date. In August 2014, the US has itself identified 153
Chinese STEs, 44 of which had thus far gone un-notified. These companies are active in
businesses like agriculture, mining and minerals, oil and gas, chemicals, textiles, and ma-
chinery and equipment (Wiley Rein 25.08.2014).
The practice of controlling international trade through STEs has a long tradition in China,
dating back to the days of the central command economy when all cross-border trade was
strictly controlled. Granting the rights to engage in foreign trade to all companies has been an
important reform accomplishment in the context of China’s WTO accession. However, in line
WTO regulation, the 2004 Foreign Trade Law allows the government to subject certain
goods to state trading. The 2014 WTO Trade Policy Review of China identifies the following
reasons for maintaining the practice until the present:
ensure stable supply and prices of the products concerned
safeguard food security
protect exhaustible and non-recyclable natural resources and the environment
The report finds that neither the motives nor the functioning of STEs have undergone much
change in recent years. The products covered by state trading include various types of grain,
vegetable oil, cotton, chemical fertilizer. A detailed overview can be found in the following
table. It should be noted that so called tariff rate quotas reserve only a certain share of import
and export volumes for STEs. Ranging from 10 to 90 percent of the total, non-STEs are al-
lowed to handle the balance.
The non-STE share of trade volumes for every commodity is allocated either by the NDRC or
the MOFCOM. Both central government bodies publish catalogues of qualification require-
ments to determine which non-STE are eligible to receive trading right allocations.

© THINK!DESK China Research & Consulting 2015 Seite 274
Table 65: Imports Under State Trading, 2011-13
Product HS code Percentage of TRQ allocated to state-trading enterprises in
2011 2012 2013
Wheat
10011000; 10019010;
10019090; 11010000;
11031100; 11032100
90
90
90
Maize
10051000; 10059000
11022000; 11031300
11042300
60
60
60
Rice
10061011; 10061019
10061091; 10061099
10062010; 10062090
10063010; 10063090
10064010; 10064090
11023010; 11023090
11031921; 11031929
50 50 50
Cotton 52010000; 52030000 33 33 33
Sugar
17011100; 17011200
17019100; 17019910
17019920; 17019990
70 70 70
Urea 31021000 90 90 90
NPK 31052000 51 51 51
Diammonium phos-phate
31053000
51 51 51
Other chemical ferti-lizer
31022100; 31022900
31023000; 31024000
31025000; 31026000
31027000; 31028000
31029000; 31031000
31032000; 31039000
31041000; 31042000
31043000; 31049000
31051000
n.a. n.a. n.a.

© THINK!DESK China Research & Consulting 2015 Seite 275
Product HS code Percentage of TRQ allocated to state-trading enterprises in
Tobacco
24011010; 24011090
24012010; 24012090
24013000; 24021000
24022000; 24029000
24029000; 24031000
24039100; 24039900
48131000; 48132000
48139000; 55020010
56012210; 84781000
84789000
n.a. n.a. n.a.
Crude oil 27090000 n.a. n.a. n.a.
Processed oil
27100011; 27100013
27100023; 27100024
27100031; 27100033
27100039
n.a. n.a. n.a.
Source: WTO 2014 at 102-3
4.2.5 Product Testing and the CCC Mark
Since 2002 China requires certain products to be approved by the China National Certifica-
tion and Accreditation Administration (CNCAA), the organisation charged with performing
safety testing before a product may be imported or sold in China. Once approved, the
CNCAA allows the product to bear the China Compulsory Certification (CCC) mark. While
this is an important step in ensuring that products sold in China meet certain safety stand-
ards, the CNCAA makes the process unnecessarily difficult for foreign companies’ products
to be approved. The US-China Business Council regularly petitions China to change the ap-
plication procedure as it is inefficient and expensive (USCBC 2013a).
The rules that outline the approval of products for the CCC mark in some cases differ signifi-
cantly from international standards. In 2009, for example, the EU banned cosmetics testing
on animals while in the US, many cosmetics companies have moved away from testing these
same products on animals, largely in response to public pressure. But in order to import
products into China, the CNCAA’s requirements stipulate that the products be tested on ani-
mals by the administration’s own lab technicians in China (HIS 30.06.2014). As of June 2014,
domestic companies are no longer required to test on animals, but products imported into
China or sold by foreign companies must still test the product on animals. Adding even just

© THINK!DESK China Research & Consulting 2015 Seite 276
one more stipulation for foreign companies to comply with can significantly slow down a
company’s product’s factory to market speed, thus making the company less competitive.
The approval process for the CCC mark can also be long and drawn out as it is subject to the
regulatory authorities’ testing centres’ availability. The authorities estimate that the process
can take between 60 and 90 days and in some circumstances longer (Export.gov n.d.). Fur-
thermore, these tests must be carried out in China regardless of a product’s proven safety
record abroad or tests already done by US or EU authorities. This therefore forces the prod-
ucts to undergo multiple tests by various authorities worldwide, which slows companies down
and costs more money. Meanwhile, for many years prior, the CNCAA accredited many Chi-
nese companies to conduct their own safety tests and self-award the CCC mark (EIU 2010 at
7). As of June 2014, foreign companies are now allowed to have this ability as well, but so far,
very few have been approved (ANSI 16.06.2014). The special regulations in order to achieve
the CCC mark are in many cases unnecessary and slow down the process for foreign com-
panies to introduce products into the Chinese market.
Although the Chinese government has implemented numerous reforms in order to make the
domestic market more accessible to foreign goods and services, the list of restrictions on
importers remains long and complex. The following table 66 is based on information collect-
ed by the Directorate General Trade of the EC (2014).

© THINK!DESK China Research & Consulting 2015 Seite 277
Table 66: Selected Restrictions on Imports
Industry Trade barrier / protectionist practice
Food and bever-ages
Since May 2013, imported milk, formula and similar prod-ucts are subject to increased scrutiny for chemical and microbiological contamination. Additionally, every foreign supplier needs to undergo burdensome registration pro-cedures with the State Food and Drug Administration. De-tails on the administrative process are insufficient and murky. The simultaneous implementation of increased checks and intransparent registration procedures consti-tute non-tariff trade barriers.
Additional restrictions, imposed in December 2013, re-quired that producers of baby formula that is based on imported base milk powder relocate their base milk pow-der production lines to other processes.
In February 2014, Chinese authorities forbid imports of pigs and related products from Poland, following the oc-currence of the African Swine Fever in that country. Un-fortunately, the Chinese side did not take account of the very limited scope of the outbreak or comprehensive countermeasures taken by Polish authorities. The import restrictions go against WTO regulations as food safety was guaranteed through strict adherence to international standards. The Chinese food safety administration denied recognition of disease free areas and put in place a blan-ket ban in violation of WTO rules.
Beginning in March 2014, Chinese customs require addi-tional customs certificates for imports of wine. While pre-vious rules demanded certificates on a per brand basis, the revised regulation mandate separate certificates for every production batch.
In May 2014, new regulations introduced the obligation for producers of formula that is based on imported milk powder to combine wet and dry mixing processes in one location.
During the following month, the revised Food Safety Law tightened standards and introduced cumbersome and in-transparent application procedures for food importers. The new regulations are especially obstructive in the field of animal products. Furthermore, they prohibit the prepa-ration of food products based on ingredients from diverse origins.
Since June 2014, imports of alcoholic drinks have been severely impacted by new provisions on the risk assess-ment of phthalates.

© THINK!DESK China Research & Consulting 2015 Seite 278
Cosmetics
In July 2011, the Chinese government has put in place new testing and approval requirements for new ingredi-ents. However, approval procedures have been progress-ing in a very slow fashion and only four new ingredients out of 120 applications filed since 2010 have received the green light. The slow pace of evaluation procedures pos-es significant problems for the industry as innovation in product development is proceeding quickly. This implies that the composition of product exports to China do not incorporate the full extent of product innovation and un-dermine the competitive position of imported cosmetics.
In December 2013, the State Food and Drug Administra-tion ordered that all imported cosmetics also have to be sold in their producer’s home market. Free Sales Certifi-cates were no longer accepted and cargos were rejected.
Power generation equipment
In January 2011, the National Energy Administration (NEA) issued new policy guidelines introducing mandato-ry certificates for wind turbines. This move has damaged the interests of foreign manufacturers and suppliers as relevant authorities only accept certificates issued in Chi-na. Obtaining proper certification under the new stand-ards implies significant efforts on the part of overseas companies. Furthermore, the process is time consuming and removes imported products from the Chinese market until suppliers have been able to complete certification procedures.
Source: EC 2014.
4.3 Export-Targeting Policy Measures
In order to promote export activity as well as steer the composition of China’s total export
volumes, Chinese government agencies continue to employ a broad range of instruments
and dedicated policy programmes. In the following some of the most important of these will
be introduced in some detail.
4.3.1 Export Constraints
Export licenses, quotas, duties and other administrative instruments are regularly used to
direct export business according to policy priorities and macroeconomic situations. In der
Heiden and Taube (2011) have shown that export restrictions have been tightened as au-

© THINK!DESK China Research & Consulting 2015 Seite 279
thorities have tried to curb the outflow of resource-intensive and polluting products. In a flexi-
ble reaction to changing circumstances, authorities relaxed – if not reversed – export re-
strictions during the economic downturn following the global financial crisis so as to accom-
modate ailing enterprises.
4.3.1.1 Value Added Tax Rebates on Exported Goods
In 1994 China has introduced a value added tax (VAT) affecting all enterprises and individu-
als engaged in the sale of goods, the provision of processing, repair and replacement ser-
vices, as well as the import of goods. VAT rates vary depending on product category be-
tween five and 17 percent with steel products and most resources generally taxed at the full
rate. While all imported goods will be subjected to the tax, certain products are eligible for
rebates upon export. These rebates do not apply uniformly to all goods but are administered
on a product-specific basis to support Chinese industry policies. In order to adjust the VAT
rebate scheme to changing macroeconomic environments and development priorities, tax
and customs authorities revise the catalogue of products eligible for rebates and/or change
product specific rebate rates several times per year. Operating such a flexible rebate system
allows economic policy decision makers to align the volume and composition of exports with
industrial policy strategies. Because of their immediate effect on companies’ propensity to
export, rebate rates have proven to be a very effective instrument of foreign trade policy.
Since the VAT rebate program has the effect of influencing export incentives, it can be uti-
lised to adjust the share of exports. In the case of international trade frictions, which have
become increasingly frequent since the global economic downturn, Chinese authorities may
withdraw steel products from export markets and reroute them to the domestic market simply
by lowering or eliminating pre-existing VAT rebates. The opportunity to artificially increase or
reduce the supply of certain goods on the home market also plays a significant role for Chi-
nese industrial policy (Taube and in der Heiden 2009). By pushing up domestic supply, the
government can intensify competitive pressures and drive down prices. While this creates
problems for steel producers, it confers benefits upon steel users in downstream industries.
At the same time, the fierce competition that follows from bottling up supplies in the Chinese
market strains the profitability of companies and forces weaker players to exit. Determined to
reduce the large number of small-scale inefficient operations and to consolidate the industry
around a competitive core of only a few dozen firms, Chinese authorities have consistently
cancelled VAT rebates in the lower market segments worst affected by overcapacities (PWC
2006).
One of the most important reasons for Chinese authorities to resort to VAT rebate adjust-
ments is to discourage the exportation of products commonly referred to as ‘two high, one
resource'. This term is used to characterise energy intensive, resource intensive and pollut-
ing products that are mostly located towards the low end of the market and have a low value
added relative to inputs (GOSC 2010). Chinese policy documents state that it is in the na-

© THINK!DESK China Research & Consulting 2015 Seite 280
tional interest to prevent the exportation of goods that put a large burden on the environment
and resource use while yielding little in the way of profits or learning advantages for compa-
nies. This should also prevent China to play host to the dirtiest, least profitable low tech ele-
ments of the international value chain for steel. While this is of course reasonable for a coun-
try like China, which is already suffering from severe environmental damage, there are also
purely economic reasons shaping this approach as will be demonstrated next.
Reductions and cancellations of VAT rebates on exports have led to sharp drops in export
quantities of raw materials (if export volumes were not already limited by quotas) and a do-
mestic price level which is lower than it should be under normal circumstances. Limiting out-
flows is pursued in line with China’s industrial policy frameworks. Firstly, downstream produc-
tion processes can benefit from cheaper access to an important input. Secondly, market po-
tential and profitability of upstream producers is largely reduced, paving the way for industry
consolidation.
It is important to highlight that the mechanisms used to curb exports in some areas can be
reversed depending on the situation. In the years preceding the world financial crisis, the
Chinese government has undertaken a series of VAT rebate cuts in order to put an end to
soaring exports of raw materials and commodity grade products. The crisis changed hit many
Chinese producers hard as export volumes and prices plummeted. Diminished profit margins
further reduced outflows of commodities already subject to export constraints (Taube and in
der Heiden 2009).
Eventually, the State Council and the MOFCOM decided to rescue distressed industries by
reinstating or re-raising VAT rebates on many products. The caused a rebound in export ac-
tivity as commodities regained competitiveness in major export markets. As China and the
world economy gradually turned toward economic recovery, exports soared again, leading
the government to once again terminate VAT rebates on polluting and low value added
commodities from 2010.
Industrial policies for the aluminium and steel industries established a clear case for product-
specific, technology-sensitive discretionary application of the VAT export rebate system. It
has become clear, that the Chinese government considers VAT rebates a legitimate and
effective tool to steer exports in ways conducive to its industrial policy framework. The real
application of the program closely follows provisions cited in various policy documents. Ex-
port restrictions did not target technology intensive products.
4.3.1.2 Export Duties
Duties take the form of ad valorem taxes levied on the price of certain goods upon exporta-
tion. In many cases, such duties have been imposed in lieu with VAT rebate cancellation in
order to amplify the trade constraining effect. According to Chinese Regulations on Import

© THINK!DESK China Research & Consulting 2015 Seite 281
and Export Duties, duties shall be imposed on any good upon entering or leaving the country
unless decided otherwise by the state council. There are two government agencies trusted
with administering import and export duties: the Customs Tariff Commission is mainly in
charge of determining which goods are subjected to duties and adjusting relevant duty rates
(State Council 2003b). The GAC is tasked with the actual supervision and control of goods
entering or leaving the country. As such, it collects duties as well as other charges related to
goods crossing the border into or out of China.
4.3.1.3 State Trading
The 2004 Foreign Trade Law of the People’s Republic of China, allows the government to
limit international trade in certain goods to state-trading companies. The key reasons for
maintaining these businesses under government control are:
(1) safeguard sufficient supplies to meet domestic demand,
(2) protect the environment,
(3) conserve limited resources,
(4) ensure food security, and
(5) prevent large price fluctuations.
Coal exports can serve as an example here. While imports are not subject to state-trading,
only four enterprises have the legal right to export. The list of approved coal state-trading
enterprises for the coal sector has remained unchanged 2011. It only covers the following
companies:
China National Coal Group Co.
Shanxi Coal Import & Export Group Co.
Shenhua Group Co., Ltd.
China Minmetals Co.
The following table 67 lists all commodities that were still subject to state trading provisions
by late 2014.

© THINK!DESK China Research & Consulting 2015 Seite 282
Table 67: Export Products Subject to State-Trading Arrangements, 2011-13
Product (HS code) Enterprises
Rice
10061011; 10061019; 10061091; 10061099; 10062010; 10062090; 10063010; 10063090;10064010; 10064090
China National Cereals, Oil and Food-stuffs Import & Export Co. (renamed as COFCO in April 2007); and Jilin Grain Group Import & Export Co. Ltd.
Maize
10051000; 10059000; 11042300
China National Cereals, Oil and Food-stuffs Import & Export Co. (renamed as COFCO in April 2007); and Jilin Grain Group Import & Export Co. Ltd.
Cotton
52010000; 52030000
Chinatex Cotton Import & Export Corpo-ration; Xinjiang Uygur Autonomous Re-gion Cotton and Jute Import & Export Co.; Xinjiang NongKen (Group) Import & Export Co. Ltd.; China National Cotton Reserve Corporation.
Coal
27011100; 27011210; 27011290; 27011900; 27021000
China National Coal Group Corporation; Shanxi Coal Import & Export Group Co. Ltd.; Shenhua Group Corporation Ltd.; China Minmetals Corporation.
Crude oil
27090000
SINOCHEM Corporation; China Interna-tional United Petroleum & Chemicals Co.; China National United Oil Co.
Processed oil
27101110 (from 2012, change to 27101210); 27101120 (from 2012, change to 27101220); 27101191 (from 2012, change to 27101291); 27101199 (from 2012, change to 27101299); 27101911; 27101912; 27101919; 27101921; 27101922; 27101929; 27101991; 27101992; 27101999; 27111100; 27102000 (start from 2012)
SINOCHEM Corporation; China Interna-tional United Petroleum & Chemicals Co.; China National United Oil Co.; Chi-na National Offshore Oil Corporation; China National Aviation Fuel Group Corporation.

© THINK!DESK China Research & Consulting 2015 Seite 283
Product (HS code) Enterprises
Tungsten ore and products
26110000; 26209910; 26209090; 28418010; 28418040; 28259012; 28259019; 28259011; 28418020; 28418030; 28499020; 81011000; 81019400; 81019700
STEs are listed in MOFCOM Circular Shang Mao Han No. 1135 of 2012.
Antimony ore and products
26171010; 26171090; 28258000; 81101010; 81101020; 81102000; 81109000
STEs are listed in MOFCOM Circular ShangMaoHan No. 1135 of 2012.
Silver
71061011; 71061019; 71061021; 70161029; 71069110; 71069190; 71069210; 71069290
STEs are listed in MOFCOM Circular ShangMaoHan No. 1135 of 2012.
Tobacco and by-products
55020010; 24011010; 24011090; 24012010; 24012090; 24013000; 24021000; 24022000; 24029000; 24031000; 24039100; 24039900; 48131000; 48132000; 48139000; 56012210; 84781000; 84789000
STEs are listed in MOFTEC An-nouncement No. 44 of 2001a.
Tea
09021010; 09021090; 09022010; 09022090
State trading temporarily abolished since 2005.
Soybeans
12011000; 12019010; 12019020; 12019030; 12019090
China has not applied state trading since it joined the WTO.
Silk
5001; 5002; 5003; 5004; 5005
State trading temporarily abolished since 2005.
Unbleached silk
50071010; 50072011; 50072021; 50072031
China has not applied state trading since it joined the WTO.
Cotton yarn
520411; 5205 (excluding 520528; 520547; 520548); 520710; 520419; 5206; 520790
China has not applied state trading since it joined the WTO.
Woven fabrics of cotton
520811; 520812; 520813; 520819; 520911; 520912; 520919; 521011;
China has not applied state trading since it joined the WTO.
© THINK!DESK China Research & Consulting 2015 Seite 284
Product (HS code) Enterprises
521019; 521111; 521112; 521119
Source: WTO 2014 at 104-5

© THINK!DESK China Research & Consulting 2015 Seite 285
4.3.2 Export Promotion
The following documentation focusses on some of the most important policy instruments
designed to promote export activities of Chinese firms.
4.3.2.1 Export Subsidies Provided by the Chinese Government
As one tactic in its attempt to promote exporting more goods, the Chinese government direct-
ly subsidises companies that export products abroad. Chinese firms from industries such as
solar panel producers, steel makers, and auto makers all receive much international press
for the subsidies they receive in China, a benefit that foreign competition argues is egre-
giously unfair. Should China be given market economy status as some lobbyists in Brussels
desire, penalizing China or Chinese companies for unfairly undercutting foreign competition
would become significantly more difficult as the underlying assumption of a market economy
is that businesses are able to compete equally. Drawing from THINK!DESK’s past studies in
export subsidies, the following paragraphs list the various promotions that the Chinese gov-
ernment offers to companies which engage in significant amounts of foreign trade. The fol-
lowing table 68 provide an overview of subsidy payments.
Table 68: Total Disbursements of Export Promotion Subsidies
2010 2011 2012 2013 2014 Total
387,149,855 356,800,485 481,742,107 725,202,653 502,174,762 2,453,069,862
Source: Wind Data
In 2014, at least 399 enterprises have benefitted from various types of export promotion sub-
sidies. The ten largest recipients are listed in the following table 69.

© THINK!DESK China Research & Consulting 2015 Seite 286
Table 69: Top 10 Recipients of Export Promotion Subsidies in 2014
Rank Enterprise Amount
1 China Railway Group Limited 100,300,000
2 China Greatwall Computer Shenzhen Co., Ltd. 22,551,005
3 Jinjian Cereals Industry Co.,Ltd. 15,522,418
4 Angel Yeast Co.,Ltd 11,706,695
5 Jihua Group Corporation Limited 10,280,000
6 Jiangsu Hengli Highpressure Oil Cylinder Co., Ltd 10,221,867
7 Zhengzhou Yutong Bus Co.,Ltd. 9,860,000
8 Xiamen King Long Motor Group Co.,Ltd. 7,113,032
9 Xiamen ITG Group Corp.,Ltd 7,034,657
10 Xiamen XGMA Machinery Company Limited. 6,444,915
Total 201,034,589
Source: Wind Data
4.3.2.1 Prizes for Export Performance
Government bodies regularly award monetary prizes to export oriented companies. To create
export incentives, the government of Hunan Province has handed out prizes based on export
performance. These were awarded to local companies that registered exceptionally strong
export growth in the preceding year. The program was launched in 2005 and discontinued in
2008 (Hunan Province 2005). Other provinces and cities maintain similar arrangements. The
following table 70 provide data on export performance awards received by companies at
China’s two stock exchanges.
Table 70: Total Disbursements of Awards for Export Performance
2010 2011 2012 2013 2014 Total
2,152,141 1,299,600 909,010 34,180,324 5,981,842 44,522,917
Source: Wind Data
In 2014, at least 17 enterprises have obtained export performance awards. The ten largest
recipients are listed in the following table 71.
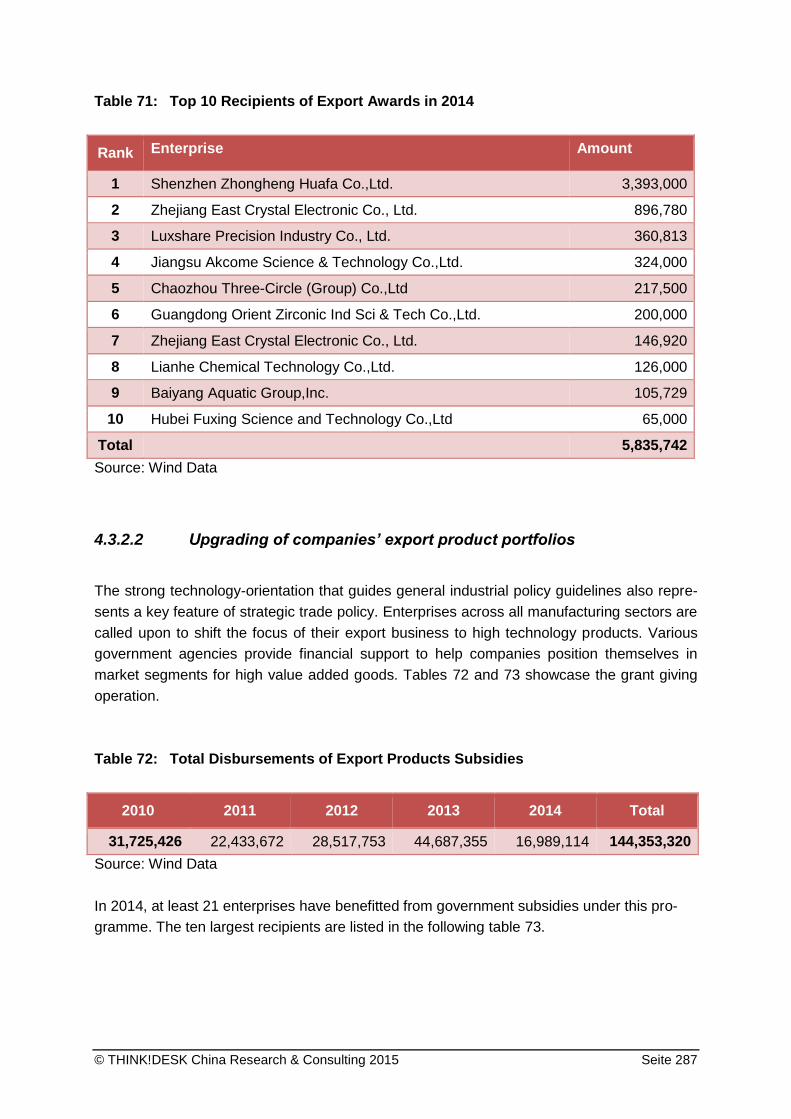
© THINK!DESK China Research & Consulting 2015 Seite 287
Table 71: Top 10 Recipients of Export Awards in 2014
Rank Enterprise Amount
1 Shenzhen Zhongheng Huafa Co.,Ltd. 3,393,000
2 Zhejiang East Crystal Electronic Co., Ltd. 896,780
3 Luxshare Precision Industry Co., Ltd. 360,813
4 Jiangsu Akcome Science & Technology Co.,Ltd. 324,000
5 Chaozhou Three-Circle (Group) Co.,Ltd 217,500
6 Guangdong Orient Zirconic Ind Sci & Tech Co.,Ltd. 200,000
7 Zhejiang East Crystal Electronic Co., Ltd. 146,920
8 Lianhe Chemical Technology Co.,Ltd. 126,000
9 Baiyang Aquatic Group,Inc. 105,729
10 Hubei Fuxing Science and Technology Co.,Ltd 65,000
Total 5,835,742
Source: Wind Data
4.3.2.2 Upgrading of companies’ export product portfolios
The strong technology-orientation that guides general industrial policy guidelines also repre-
sents a key feature of strategic trade policy. Enterprises across all manufacturing sectors are
called upon to shift the focus of their export business to high technology products. Various
government agencies provide financial support to help companies position themselves in
market segments for high value added goods. Tables 72 and 73 showcase the grant giving
operation.
Table 72: Total Disbursements of Export Products Subsidies
2010 2011 2012 2013 2014 Total
31,725,426 22,433,672 28,517,753 44,687,355 16,989,114 144,353,320
Source: Wind Data
In 2014, at least 21 enterprises have benefitted from government subsidies under this pro-
gramme. The ten largest recipients are listed in the following table 73.

© THINK!DESK China Research & Consulting 2015 Seite 288
Table 73: Top 10 Recipients of Subsidies for Upgrading the Export Structure
Rank Enterprise Amount
1 Jiangsu Hengli Highpressure Oil Cylinder Co., Ltd 10,221,867
2 Wuhan Fingu Electronic Technology Co., Ltd. 913,698
3 Lanpec Technologies Limited 700,000
4 Xiamen Kehua Hengsheng Co.,Ltd. 600,000
5 Hubei Dinglong Chemical Co.,Ltd. 586,342
6 Xiamen Kehua Hengsheng Co.,Ltd. 500,000
7 Wuhan Golden Laser Co., Ltd. 498,059
8 Jiangsu Hongda New Material Co.,Ltd. 480,000
9 Fujian Longxi Bearing (Group)Co.,Ltd 426,189
10 Wuhan Guide Infrared Co.,Ltd. 422,769
Total 15,348,924
Source: Wind Data
4.3.2.3 Matching Export Revenues with Subsidies
A company that exports products is in some localities eligible to receive subsidies based on
the value of the goods the company exports. The CPC Working Committee of the Adminis-
trative Committee of Xi’An Economic and Technology Development Zones provides export
incentives by paying exporters 0.01 RMB for every USD they generate in export sales. In this
way, AVIC Aviation Engine obtained 133,510 RMB in 2011 and 2012 (AVIC Aviation Engine
2012 AR at 124, 126). Linking the amount of exported value to the amount of money given in
subsidies is blatantly unfair to foreign companies as it could immediately discount the price of
the goods in proportion to the subsidies they receive.
4.3.2.4 Subsidies for Offsetting Domestic Transportation Costs for Export
Goods
In order to lower the cost of exporting goods, some localities compensate companies for the
domestic component of shipping costs on products to be exported. Shaanxi Province man-
ages a special fund to make disbursement under this scheme. In 2014, Jinduicheng Molyb-
denum Co., Ltd. obtained allocations worth 2 million RMB from this fund through the provin-
cial Finance Department (Jinduicheng Molybdenum 2014 AR at 93). Avic Aviation Engine
Co., Ltd. has received a total of 3,470,900 RMB between 2012 and 2014 from this scheme
(Avic Aviation Engine 2012 AR at 125; 2014 AR at 157, 158). With essentially a “free ship-

© THINK!DESK China Research & Consulting 2015 Seite 289
ping to the border” benefit for these companies, the cost of doing business is significantly
lower. In 2014, at least 11 enterprises have benefitted from government subsidies under this
programme, cf. table 74.
Table 74: Total Disbursements of Subsidies Offsetting Domestic Transportation
Costs for Export Goods
2010 2011 2012 2013 2014 Total
1.195.188 - 5.864.158 2.197.700 6.595.200 15.852.246
Source: Wind Data
4.3.2.5 Subsidies for the Steady Increase of Export Trade
Companies that steadily increase export trade are also rewarded with subsidies to further
increase exports. The government of Shanxi Province has created a programme in this style
to stimulate exports of local businesses. The additional financial incentives are clearly con-
tingent on increasing export volumes. In 2013 and 2014, AVIC Aviation Engine Co., Ltd. has
received a total of 1,007,840 RMB from this scheme (AVIC Aviation Engine 2013 AR at 118;
2014 AR at 157). This policy, along with several other of the aforementioned benefits, clearly
links exports with subsidies.
Export Contingent Subsidies in Xi’An City / Shaanxi Province
In the context of the China Western Development plan, Xi’an has sought to encourage an
export oriented economy like that of the neighbouring eastern provinces that allowed them to
develop more quickly. At both provincial and municipal levels of government, the government
in Shaanxi gives subsidies to companies contingent on their exporting abilities. Weichai
Power Co., Ltd. which is based in Xi’An City of Shaanxi Province reported export related
subsidy income of 40,731,829 RMB. The company has been praised by the economic and
technology development zone as an advanced exporting enterprise, it has received award
funds for steadily expanding exports and obtained grants for compensating transportation
charges of export goods inside China (Weichai Power 2013 AR at 189). The following tables
75 and 76 illustrate these subsidisation practices:
Table 75: Total Disbursements of Subsidies for Export Expansion
2010 2011 2012 2013 2014 Total
11,754,012 33,420,079 57,067,732 141,934,782 118,163,099 362,339,704
Source: Wind Data

© THINK!DESK China Research & Consulting 2015 Seite 290
In 2014, at least 42 enterprises have rewards from the government for expanding their export
business. The ten largest recipients are listed in the following table 76.
Table 76: Top 10 Recipients of Subsidies for Export Expansion in 2014
Rank Enterprise Amount
1 China Railway Group Limited 100,300,000
2 Jiangsu Hengli Highpressure Oil Cylinder Co., Ltd 10,221,867
3 Fangda Carbon New Material Co.,Ltd 2,000,000
4 Gifore Agricultural Machinery Chain Co.,Ltd. 675,700
5 Irico Display Devices Co.,Ltd 434,400
6 Jiangsu Akcome Science & Technology Co.,Ltd. 324,000
7 Ingenious Ene-Carbon New Materials Co.,Ltd. 311,218
8 Yuan Longping High-Tech Agriculture Co.,Ltd. 293,300
9 Qinchuan Machine Tool & Tool Group Share Co., Ltd 250,000
10 China Meheco Co.,Ltd. 249,800
Total 115,060,285
Source: Wind Data
4.3.2.6 Famous Export Brand Programme
In 2005, eight central ministries and administrations have jointly launched a program to build
up and promote famous export brands. This decision was inspired by the strong promotion
effect developed country brands have on the success of their international sales, not least in
China, and based on the experience of Chinese exporting companies. While Chinese brand-
ed products had become successful in the domestic market, almost none were known out-
side China when the program was drafted in 2004. Furthermore, relatively low quality levels,
weak innovative capacity and the absence of established brands had been found to impede
export performance. Consequently, establishing the ‘Key Export Brands to be Cultivated and
Developed by the Ministry of Commerce' (in the following referred to as export brands for
convenience) set out to support Chinese companies in exploring international markets and
expanding exports through building up famous exports brands (MOFCOM et al. 2005). In
order to achieve this aim, the initiating document introduces a very comprehensive set of
preferential policy measures, several of which shall be mentioned briefly.
Exporters participating in the pilot program were encouraged and supported
(1) to upgrade their technologies and innovative capacities,

© THINK!DESK China Research & Consulting 2015 Seite 291
(2) to improve their international marketing abilities and
(3) to expand exports of products with own export brands.
It was envisioned that over the five years until 2010, the share of exporting companies with
proprietary brands and the proportion of exports with proprietary brands should both double
from their 2005 levels to reach 40 percent and 20 percent respectively (MOFCOM et al.
2005). While all exporting companies were encouraged to meet the basic preconditions for
managing proprietary brands by, for example, registering trademarks overseas, undergoing
quality and environmental certification or setting up international sales networks and after
sales services, a small number of major companies were chosen for the formation of suc-
cessful export brands in a lighthouse project. The ‘Export Brand Development Fund' was set
up specifically to support enterprises in the formation of proprietary brands and the develop-
ment of famous export brands (MOFCOM et al. 2005).
Companies selected for participation could benefit from numerous advantages: they were
(1) granted preferential allocation of import and export quotas,
(2) preferred in government procurement activities in all areas and at all levels of public
administration,
(3) supported in enhancing R&D activities and improving innovative capabilities,
(4) assisted in the procurement of advanced technology and key equipment,
(5) helped to continuously increase technology content and value added of famous ex-
port brand products,
(6) granted preferential access to subsidised loans from both the Technology Renovation
Project and the Research and Development Fund for Export Products,
(7) supported in the establishment of state-level technology centres,
(8) given access to the Foreign Trade Development Fund,
(9) encouraged to present themselves at domestic and international trade fairs, conduct
advertising in overseas target markets, establish overseas operations for marketing
and after sales services (MOFCOM et al. 2005).
Furthermore, the Administration of Quality Supervision, Inspection and Quarantine gives pri-
ority to the exemption of famous export brands from inspection if companies can meet cer-
tain conditions. The General Administration of Customs provides a channel to ease and
speed up customs procedures. Banks and insurance companies are encouraged by the gov-
ernment to ease access to financing and insurance services. The China Export Credit Insur-
ance Company is encouraged to treat famous export brand companies as ‘key clients’, de-
velop customised service offerings to cater to their individual needs, grant discounts on rele-
vant fees and give priority to providing value-added services. Chinese embassies and consu-
lates overseas should provide further support by conducting research on industries and mar-
kets and communicating relevant information to famous export brand companies. If one of
these firms plans to launch sales in a particular foreign market, local embassies and consu-
lates should offer guidance and help. They should also seize every opportunity to promote
the famous export brand.

© THINK!DESK China Research & Consulting 2015 Seite 292
Considering the comprehensive nature of this programme, we can expect that participating
companies may benefit substantially. Like all the EP measures presented here, the ‘famous
export brand' policy has a strong bias towards technology-intensive products and could thus
serve to advance upgrading in the steel industry in accordance with general industrial policy.
Research has revealed that at least one steel mill, Tianjin Steel Pipe Company, has been
accepted into the national programme (MOFCOM 2005a). At this stage it is not possible to
determine how successful attempts at establishing famous export brands have been.
The initiating document of the Famous Export Brand programme specifically called for lower
level governments to implement similar programmes and launch their own famous export
brands. The city of Ma’anshan, located in Anhui Province and home to Ma’anshan Iron and
Steel Group, one of China’s largest steelmakers, is such a case. As late as July 2008, the
municipal government released the initiating document for the local version of the famous
export brand programme. While the document largely echoes the original text drafted at the
central government level, citing the same motivations and expressing the same expectations,
the scope of support measures announced is smaller. The assistance measures to be mobi-
lised by local authorities, however, include a one-time cash reward and fiscal support chan-
nelled through a special fund to create famous export brands.
Authorities have pledged assistance to companies pursuing activities such as applying for
international certifications, trademark registrations, marketing campaigns or participation in
Chinese and overseas trade fairs. Since technological upgrading plays a major role in the
programme’s concept, with regard to the procurement of advanced technologies and equip-
ment, the government of Ma’anshan promises to endorse applications of local projects to
support funds administered at the provincial or national level. In the same vein, companies
admitted into the local programme will be recommended for acceptance into the provincial
and national programmes.
After details of the program became known internationally, it was subject to strong criticism.
In December 2008, the U.S. registered a dispute at the WTO to go against the program
which it considered to be in violation of Article 3 of the Agreement on Subsidies and Coun-
tervailing Measures by promising export subsidies to a selected group of companies. In De-
cember 2009, China eventually agreed to discontinue the program (Global Subsidies Initia-
tive 2010).
Magang Group, a large SOE from Anhui Province, was among the first six companies ac-
cepted into the programme in the first selection round (Ma’anshan City 2008). After the regu-
lar two-year participation period had expired at the end of 2010, the company was re-
admitted for another two years. In this way, Ma’anshan Iron and Steel Group was eligible for
the support measures until the end of 2012 (Ma’anshan City 2011). However, table 77 shows
declining payouts under this scheme:

© THINK!DESK China Research & Consulting 2015 Seite 293
Table 77: Total Disbursements of Export Brand Subsidies
2010 2011 2012 2013 2014 Total
1,992,500 700,000 1,415,000 65,100,585 100,000 69,308,085
Source: Wind Data
4.3.2.7 Provision of Export Insurance by the State-owned China Export &
Credit Insurance Corporation
Furthermore, the provision of export insurance by the state-owned China Export & Credit
Insurance Corporation (Sinosure) may be regarded as an additional mechanism creating
export incentives by lowering the risks associated with international sales. Sinosure, estab-
lished in late 2001, is the official export and credit insurance company in China and has a
service network covering the whole country. In 2008, the last year for which data is available,
the sum insured totalled USD 62.8 billion and covered 3.4 per cent of Chinese exports. Ac-
cording to its official website:
“Sinosure is mandated, in accordance with the Chinese government's diplomatic,
international trade, industrial, fiscal and financial policies, to promote Chinese
exports and investments, especially exports of high-tech or high value-added
capital goods, by means of offering export credit insurance against non-payment
risks, and providing services in financing, information and receivables manage-
ment” (Sinosure 2011).
As stated in its company profile, Sinosure’s mission is to promote the export of Chinese
goods, first and foremost in the high-value-added and high-tech segment, in accordance with
government policies including industrial policy. In its 2008 annual report, Sinosure claims to
support the development of key industries, contribute to the upgrade of trade and focus on
promoting exports of high- and new-tech products as defined by the Chinese in the Cata-
logue of Chinese High-tech Export Products (Sinosure 2009). With regard to the steel indus-
try, Sinosure has confirmed that black metal smelting and rolling processing are among a set
of twenty industries serviced. In a nutshell, there is little doubt that Sinosure serves to sup-
port the implementation of industrial policy objectives specifically by assuming commercial
export credit risks and thus facilitating high-tech exports (WTO 2008).
4.3.2.8 Export Credit Insurance Assistance and Development Fund
The MOFCOM and the MOF have established the Fund to improve access to and reduce the
costs of insurance services (MOFCOM 2005b). In 2006, both ministries called (1) to further

© THINK!DESK China Research & Consulting 2015 Seite 294
enhance the effectiveness of the programme, (2) to widely distribute information concerning
its benefits, (3) to motivate more enterprises to take advantage of preferential terms and (4)
to find and solve problems in its implementation (MOFCOM and MOF 2006). Provincial au-
thorities have also made use of the programme to stimulate local export activities. In Jiangsu
Province, the scheme is jointly operated by the department of finance, the economic and
trade department and the Jiangsu branch of Sinosure acting as a co-organizer. According to
an official statement, the Nanjing branch of Sinosure reports accepted projects to the provin-
cial government twice a year. This should serve as an indication of the close relationship
between public administration and Sinosure’s local business units (Jiangsu Province 2003).
As a result, export credit insurance fees are heavily subsidised: enterprises associated with
the provincial government are even entitled to a 50 per cent discount and provincial authori-
ties have urged lower administrative levels to take corresponding measures in their jurisdic-
tions (Jiangsu Province 2003). In 2006, the discount on insurance fees for exporting firms
associated with the provincial government of Jiangsu was reduced to 30 per cent. However,
this discount could be increased by an additional 10 per cent if exports were destined for
emerging markets.
As pointed out earlier, Sinosure’s services are also an important component of the compre-
hensive support package for companies taking part in the Famous Export Brands pro-
gramme. In order to best integrate Sinosure into government dealings with supported com-
panies, effective coordination mechanisms have been established on all administrative lev-
els. These mechanisms then allow Sinosure to facilitate contact with target companies in the
programme, collect information on their individual needs and explore how export credit insur-
ance could contribute to their development. In Jiangsu Province, the departments of finance
and foreign trade and economic cooperation jointly work out specific policy measures to best
apply export credit insurance support to individual companies. This implies that Sinosure’s
insurance fees are subsidised by local authorities. Companies in the brand programme re-
ceive special attention and are regarded as ‘key clients’ by Sinosure. As such, the latter
works out customised service offerings and treats the needs of brand companies with great
care and on an individual basis.
Furthermore, the insurer assists companies in establishing risk management systems and
provides them with risk analyses on overseas target markets. As far as fees are concerned,
Sinosure offers a special discount of 10 per cent on its regular fees for client companies as-
signed to it by central and provincial governments. Due to space restraints, it is not possible
to elaborate further on the close relationship between Sinosure, the authorities and target
companies. However, from this brief outline it is clear that Sinosure is tightly involved or even
co-opted in a system aimed at supporting the firms selected for the Famous Brand Pro-
gramme (MOFCOM and Sinosure 2005; MOFCOM and Jiangsu Province 2006).
On top of providing price discounts for insurance services, various government organisations
have also handed out grants to help keep companies’ costs low. Table 78 provides some
more details.

© THINK!DESK China Research & Consulting 2015 Seite 295
Table 78: Total Disbursements of Subsidies for Export Insurance
2010 2011 2012 2013 2014 Total
63,843,174 108,310,417 123,724,796 155,057,768 122,852,627 573,788,782
Source: Wind Data
In 2014, at least 186 enterprises have obtained grants supporting export insurance. The ten
largest recipients are listed in the following table 79.
Table 79: Top 10 Recipients of Subsidies for Export Insurance in 2014
Rank Enterprise Amount
1 Xiamen King Long Motor Group Co.,Ltd. 7,113,032
2 Xiamen XGMA Machinery Company Limited. 6,444,915
3 Jiangsu Etern Co.,Ltd 5,000,000
4 Ningxia Orient Tantalum Industry Co.,Ltd. 4,773,643
5 Shanxi Taigang Stainless Steel Co.,Ltd 4,270,300
6 Hareon Solar Technology Co.,Ltd. 4,102,200
7 Lifan Industry (Group) Co.,Ltd 3,830,000
8 Jiangsu Highhope Corporation 3,203,234
9 Jiangsu Holly Corporation 3,004,400
10 Shantui Construction Machinery Co.,Ltd. 2,590,000
Total 44,331,724
Source: Wind Data
4.3.2.9 Provincial Export Support Funds
Several Chinese provinces operate special export support funds allocated in the provincial
budged. All schemes identified in the course of the research for this paper are limited to
companies registered inside the respective provinces, engage in the production of either high
value added products and technology intensive products.
Liaoning Province (2001) has launched an Export Development Support Fund in August
2001. The fund is supposed to help reach strategic export targets specified in the 10th Five
Year Plan of Liaoning Province and encourage local enterprises to further expand their ex-
port activities. All projects eligible for funding must stimulate export growth as well as
strengthen and consolidate the position of Liaoning companies in international markets. Par-

© THINK!DESK China Research & Consulting 2015 Seite 296
ticular targets include key products, key enterprises and goods from key regions. More pre-
cisely, funding projects should serve (1) to encourage the exportation of major ‘backbone'
products with a large impact on economic development, (2) to consolidate existing interna-
tional market shares, (3) to defend and develop exports to important customers, (4) to en-
courage the formation of scale advantages in exports and (5) to encourage the export of fa-
mous, high quality and branded products. If all the conditions can be met, the participating
company can receive a six-month – 12 month under certain conditions – loan at privileged
conditions handed out through financial institutions under commission from the government.
Export support funds hand out subsidies to designated enterprises or support the exportation
of special export products. The following table 80 offers an account of the financial dimension
of this practise.
Table 80: Total Disbursements of Subsidies for Export Enterprises
2010 2011 2012 2013 2014 Total
40,092,699 22,281,478 30,450,465 19,637,244 9,647,545 122,109,431
Source: Wind Data
In 2014, at least 29 enterprises have benefitted from government subsidies under this pro-
gramme. The ten largest recipients are listed in the following table 81.

© THINK!DESK China Research & Consulting 2015 Seite 297
Table 81: Top 10 Recipients of Subsidies for Export Enterprises in 2014
Rank Enterprise Amount
1 Beijing Xinwei Telecom Technology Group Co., Ltd 1,530,000
2 Xiamen King Long Motor Group Co.,Ltd. 1,400,000
3 Holitech Technology Co., Ltd. 1,039,800
4 Loncin Motor Co., Ltd. 770,000
5 Zhejiang Hailide New Material Co.,Ltd. 700,000
6 Anhui Xinhua Media Co., Ltd 596,100
7 Porton Fine Chemicals Ltd. 550,000
8 Zhejiang Shengyang Science and Technology Co., Ltd. 400,000
9 Guangbo Group Stock Co.,Ltd. 321,050
10 Jiangsu Lugang Science & Technology Co.,Ltd 300,000
Total 7,606,950
Source: Wind Data
Table 82: Total Disbursements of Export Products Subsidies
2010 2011 2012 2013 2014 Total
10,336,551 10,517,058 6,312,543 2,842,770 4,179,094 34,188,016
Source: Wind Data
In 2014, at least 9 enterprises have benefitted from government subsidies under this pro-
gramme. The ten largest recipients are listed in the following table 83.
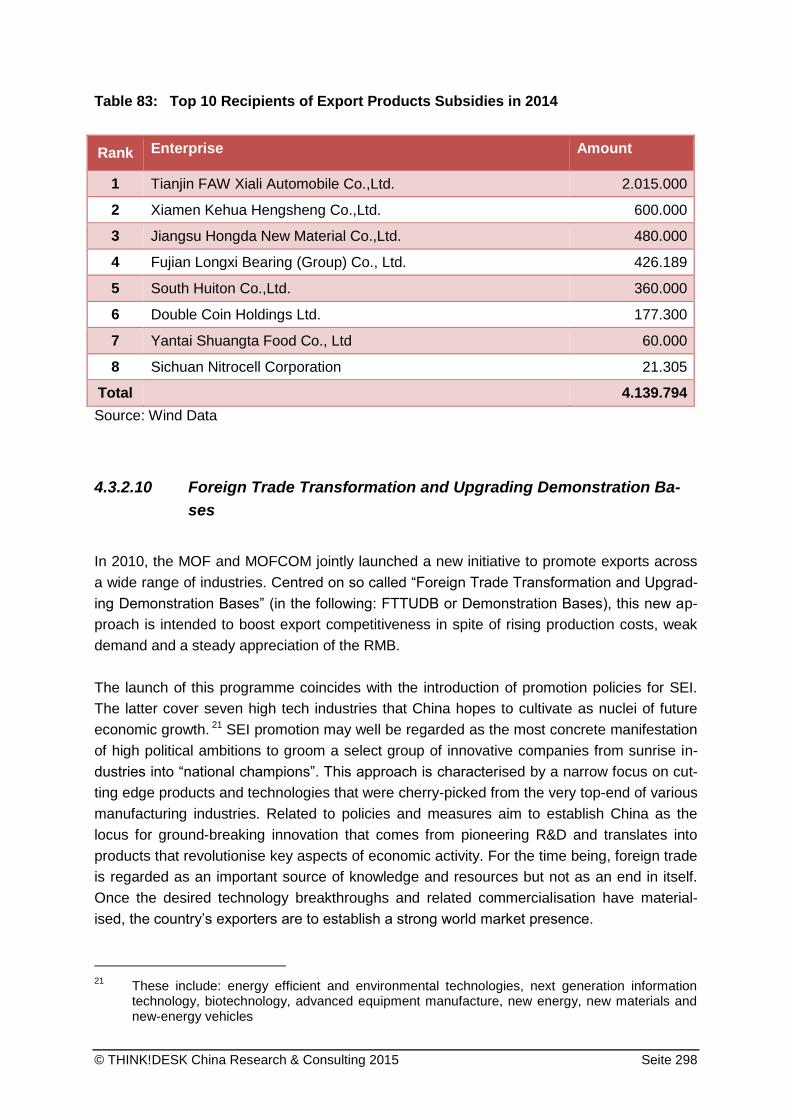
© THINK!DESK China Research & Consulting 2015 Seite 298
Table 83: Top 10 Recipients of Export Products Subsidies in 2014
Rank Enterprise Amount
1 Tianjin FAW Xiali Automobile Co.,Ltd. 2.015.000
2 Xiamen Kehua Hengsheng Co.,Ltd. 600.000
3 Jiangsu Hongda New Material Co.,Ltd. 480.000
4 Fujian Longxi Bearing (Group) Co., Ltd. 426.189
5 South Huiton Co.,Ltd. 360.000
6 Double Coin Holdings Ltd. 177.300
7 Yantai Shuangta Food Co., Ltd 60.000
8 Sichuan Nitrocell Corporation 21.305
Total 4.139.794
Source: Wind Data
4.3.2.10 Foreign Trade Transformation and Upgrading Demonstration Ba-
ses
In 2010, the MOF and MOFCOM jointly launched a new initiative to promote exports across
a wide range of industries. Centred on so called “Foreign Trade Transformation and Upgrad-
ing Demonstration Bases” (in the following: FTTUDB or Demonstration Bases), this new ap-
proach is intended to boost export competitiveness in spite of rising production costs, weak
demand and a steady appreciation of the RMB.
The launch of this programme coincides with the introduction of promotion policies for SEI.
The latter cover seven high tech industries that China hopes to cultivate as nuclei of future
economic growth. 21 SEI promotion may well be regarded as the most concrete manifestation
of high political ambitions to groom a select group of innovative companies from sunrise in-
dustries into “national champions”. This approach is characterised by a narrow focus on cut-
ting edge products and technologies that were cherry-picked from the very top-end of various
manufacturing industries. Related to policies and measures aim to establish China as the
locus for ground-breaking innovation that comes from pioneering R&D and translates into
products that revolutionise key aspects of economic activity. For the time being, foreign trade
is regarded as an important source of knowledge and resources but not as an end in itself.
Once the desired technology breakthroughs and related commercialisation have material-
ised, the country’s exporters are to establish a strong world market presence.
21
These include: energy efficient and environmental technologies, next generation information technology, biotechnology, advanced equipment manufacture, new energy, new materials and new-energy vehicles

© THINK!DESK China Research & Consulting 2015 Seite 299
The Demonstration Bases approach complements the SEI policy in that it covers a much
wider product range. While the orientation is geared towards upgrading production technolo-
gies, improving product quality and optimizing industrial operation across a variety of param-
eters, it targets “traditional industries” that may even strike as mundane when compared to
the seven SEIs. The products and technologies covered in this scheme are selected from the
following industries
(1) agriculture22,
(2) light industry23,
(3) clothing24,
(4) medicine25,
(5) new type materials26,
(6) specialty chemicals27 as well as
(7) hardware and construction materials28.
Unlike in the SEI policy, the Demonstration Bases approach does not draw a clear line
around the supported goods. It is a measure to stimulate export competitiveness in the near
term and lacks the lofty ambitions that characterise SEI promotion. Unfortunately, regulation
on the FTTUDB programme is rather vague and does not offer much clear cut information on
support measures.
The initiation document of the programme (MOFCOM 2011a) only provides for a general
overview of the goals. In line with general industrial policy, it explains that the approach
serves to accelerate the transformative development in the field of foreign trade and consoli-
date China’s position as a major trading country. In order to boost export competitiveness of
Chinese manufactures, industrial clusters are to be formed and cultivated. These FTTUDB
are to attract and concentrate relevant companies and resources from certain industries (and
regions) in order to generate agglomeration economies. Under government guidance, these
Demonstration Bases are to become “lighthouses” for successful development of export
business in their respective industries across China. According to the Ministry’s outline doc-
22
Garlic, apple juice, tea, flowers, poultry meat, live pig and pork, bee products and cashmere 23
Furniture, wood products, bags, toys, sports apparel, eye glasses, rattan and bamboo products, outdoor leisure products, shoes, stationary, musical instruments, clocks, plastic products, glass products, ceramics products (except building and sanitary ceramics), kitchen products, jewel-lery, care products and products from light industry applying special techniques.
24 Clothing for men, women and children, leisure clothing, jeans products, silk products, under-
wear, neckties, sweaters, trousers, cashmere products, bed clothers, towels, curtains, industrial textiles, fabric from synthetic fibre and cotton and special textiles
25 Traditional Chinese medicine, western medicine, medical instruments, healthcare and rehabili-
tation equipment 26
Ferrous and non-ferrous metal products, non-metallic products, products from composite mate-rials and cermics.
27 Dispersed and reactive dyes, fertilizer, electronic chemicals, water treatment agents, flame re-
tardants, surfactants, chemicals for paper production, additives for food and feed, organic fluo-rine materials, silicon fluoride, special rubbers and thermoplastic elastomers, polyurethane, functional polymer materials, carbon fibre materials and adhesives.
28 Hardware, wall windows, bathroom plumbing, metal structures, flooring (except stone), building
and sanitary ceramics as well as stone.

© THINK!DESK China Research & Consulting 2015 Seite 300
ument, after five to ten years of (government) nurturing, the bases should have evolved into
major drivers of China’s export business. By that time, the group of Demonstration Bases
should have developed distinct competitive advantages, fine-tuned their specialisation, opti-
mised Common Service Platforms and cultivated the outstanding role of leading enterprises
(MOFCOM 2011a at 1).
The programme is managed by a small leadership group that takes charge of unified plan-
ning, guidance, direction, coordination and management. The “unified” nature of state sup-
port may be illustrated using the case of the Sichuan Province Panzhihua City Vanadium and
Titanium Industries Base. The Panzhihua municipal government and party commission dis-
patch staff to take leading positions. Because the Base’s management is an arm of the local
government, services for companies can be offered in a very comprehensive way. This arm’s
length interaction between investors and authorities allows for greater convenience, less red
tape, improved public service and other means of support.
As the principal central government body tasked with making foreign trade related industrial
policy, MOFCOM has taken the lead and pledged to bring to bear its unique role in the field
of export promotion (MOFCOM 2012b at preamble). Support measures are targeting ten
areas: staff training, market information, qualification requirements, product innovation, quali-
ty improvements, brand development, market exploration, public relations, emergency re-
sponse and trade facilitation.
Lower level governments are instructed to support MOFCOM’s promotion policies and com-
plement them with own measures. Furthermore, the foreign trade and economic cooperation
departments on sub-national levels are tasked to replicate the Ministry’s approach and estab-
lish their own schemes.
Until March 2015, the MOFCOM has recognised 179 individual Demonstration Bases. Their
names, locations and industry affiliations have been released in batches. The third and most
recent batch was published in December 2013. While most Demonstration Bases are con-
centrated in the economically advanced coastal regions, MOFCOM has approved at least
one FTTUDB in each provincial level jurisdiction on the mainland.
The initiation document of the FTTUDB programme points out that Demonstration Bases
should focus on signature products of their host communities. Consequently, the programme
does not intend the establishment of new industry agglomerations. Rather, it recognises ex-
isting export oriented industry clusters to promote technology upgrading and boost their in-
ternational competitiveness. Thus, FTTUDB are based on economic and technology devel-
opment zones, high and new technology development zones, areas under special customs
supervisions and leading industrial enterprises with a strong sectoral specialisation. Through
strengthening capabilities related to marketing, branding, quality, technology standards and
services, authorities expect to render Demonstration Bases into pillars for sustained export
growth (MOFCOM 2011a at 1).

© THINK!DESK China Research & Consulting 2015 Seite 301
In order to be recognised, clusters must generate a certain volume of exports, possess
strong export potential and high technology levels. The Demonstration Bases have to con-
form to industrial policy which implies that technologies and products are covered in the en-
couraged or permitted categories of the Catalogue for the Guidance of Structural Adjustment
of Industries. Furthermore, operations of FTTUDB must create high added value in the sense
that all resident enterprises taken together can cover a large part of the value chain. The
Demonstration Bases must be able to generate significant agglomeration advantages while
maintaining a clear-cut focus on certain product (MOFCOM 2012b at 4.1; MOFCOM 2013b
at 4.1 and Shandong Province 2011a at 3.1).
Importantly, governments in the hosting locations must set up departments dedicated to
FTTUDB administration. Furthermore, they have to issue special cluster cultivation plans and
draft related supporting policies. In order for a Demonstration Base to be approved by
MOFCOM, local support policies must be translated into concrete promotion measures
(MOFCOM 2012b at 4.2; MOFCOM 2013b at 4.2 and Shandong Province 2011a at 3.2).
Firstly, the promotion of cluster formation aspires to raise efficiency and lower costs due to
the close proximity and arms-length interaction of operations from all parts of the value chain
as well as related and supporting sectors. Because of the high profile nature of the national
Demonstration Bases, local government agencies can be expected to lend their full support
to these undertakings. This likely involves the provision of investment incentives, such as the
allocation of land and resources at below market rates. It would be only consistent with past
practice that companies obtain investment subsidies or subsidised loans.
Secondly, the enhancement of existing clusters as Demonstration Bases implies that signifi-
cant financial resources are made available for upgrading supporting infrastructures. This is
by no means limited to the building of new roads or railway lines. In case of the Panzhihua
base, several new power plants were constructed, a number of national level laboratories
were established and measures were taken to attract highly skilled talent (MOFCOM n.d.).
Finally, the Chinese government has introduced so called “Foreign Trade Common Service
Platforms” (in the following: FTCSP or Platforms) to support enterprises located inside
Demonstration Bases. The next section will provide a detailed account of these vehicles.
The 12th Five-Year Programme for the Development of Foreign Trade expressly urges the
construction of FTTUDB on the basis of existing development zones or industry clusters. The
authors pledge to support FTTUDB to establish common service platforms for R&D, product
design, experimenting and test as well as international marketing among other areas. The
innovative capacity of Base enterprises is to be improved along with their capabilities in mar-
ket exploration and quality management. Overall, their competitiveness and influence in the
international marketplace is to be strengthened (MOFCOM 2012b at 4.5).29 Other 12th Five-
Year Programmes also discuss the FTTUBs approach in various contexts.
29
Additionally, the 12th
Five-Year Programme for the Development of Foreign Trade states that
fiscal policies should support trade promotion mechanisms. Special support should be provided

© THINK!DESK China Research & Consulting 2015 Seite 302
The 12th Five-Year Programme for National-Level Economic and Technology Devel-
opment Zones and Border Economic Cooperation Zones calls for improving the com-
petitiveness in foreign trade and actively promoting the establishment of FTTUDB
(MOFCOM 2012b at 4.8).
The 12th Five-Year Programme for the Development of Central and Western Regions
urges the establishment of FTTUBs in the context of developing and opening border
regions in China’s western provinces. It calls for relevant policies and measures to be
draft to promote cross border economic cooperation zones in order to accelerate de-
velopment (NDRC 2012 at 54).
The general 12th Five-Year Programmes of various provinces, such as Hebei, contain
calls for setting up, strengthening or making full use of FTTUDB.
While the documents released by the MOFCOM contain relatively little concrete information,
provincial documents provide for some useful insights. Across China, government authorities
of provinces, cities and even districts have displayed a high degree of activity. Several pro-
vincial-level jurisdictions have been found to administer their own Demonstration Base pro-
grams. These include Anhui Province, Guangdong Province, Guangxi Zhuang Autonomous
Region, Shandong Province and Shanxi Province.
Based on government documents from various provinces that were obtained by
THINK!DESK since the beginning of the year, it is clear that FTTUDB are regarded as spe-
cial zones for export promotion by sub-national authorities. For convenience reasons regula-
tion in several instances simply refers to “export bases”. Examples include Tianjin City,
Jiangsu Province and Hunan Province (Tianjin City 2011, Jiangsu Province 2012a, Hunan
Province 2013a, Ningbo City 2011).
Shandong Province is one of several sub-national jurisdictions that operate their own
Demonstration Base programmes. The 2011 Opinions concerning Accelerating and Promot-
ing the Establishment of Foreign Trade Transformation and Upgrading Demonstration Bases,
jointly released by the provincial departments of finance and foreign trade, provides some
limited insights. It specifies that funds, technologies, talent and other resources available in
the province should be concentrated in the Demonstration Bases. Ample use should be
made of the Special Fund for Establishing Demonstration Bases managed by the central
government and efforts for claiming more such funds should be redoubled (Shandong Prov-
ince 2011b at 4).
From the above it is clear that the establishment of FTTUDB and Common Service Platforms
are closely intertwined. In a simple analogy, the cluster-based export promotion system may
for common services that upgrade the structure of exports. Similarly, support is to be offered for
international market exploration, brand development, overseas product certification, quality
management systems, drafting of industry standards and other measures (MOFCOM 2012d at
5.2).

© THINK!DESK China Research & Consulting 2015 Seite 303
be likened to a computer system. While the Demonstration Bases constitute the hardware,
the Common Service Platforms represent the software required to make the system opera-
tional.
Great importance is assigned to setting up Common Service Platforms. All locations with
favourable conditions are to receive support in establishing such platforms. This should also
become a spending focus for the Special Fund for Encouraging Foreign Trade and Economic
Cooperation, managed by the provincial Finance department (Shandong Province, 2011b at
4.1). Support should be made available to help Base enterprises take part in trade promotion
activities, such as trade fairs, inside and outside China (Shandong Province, 2011b at 4.2).
From an institutional perspective, the collaboration between the department of Foreign Trade
and those in charge of VAT refunds, quality inspection, customs, taxation and banking are to
be strengthened so that base enterprises may take advantage of simplified procedures when
dealing with various authorities (Shandong Province 2011b at 4).
4.3.2.11 Foreign Trade Common Service Platforms
In 2010, the MOFCOM introduced Foreign Trade Common Service Platforms (in the follow-
ing: FTCSP or Platforms) with funds from the central government’s budget. The special funds
are used to subsidise the provision of services to companies located in FTTUDB. Like
Demonstration Bases, Platforms have to conform to sectoral industrial policy and support the
optimisation of the foreign trade structure, the upgrading of industrial sectors and the cultiva-
tion of brands. Their main objective, however, is to promote the international development of
traditional industries, high and new technology industries as well as strategic emerging in-
dustries with competitive advantages (MOF and MOFCOM 2011 at 1.2). The administration
of FTCSP is in the hands of MOF and MOFCOM. The two ministries jointly draft plans and
the regulatory framework that covers, among other things, the accreditation of platforms,
their supervision and control (MOF and MOFCOM 2011 at 7).
In addition to the central government, provincial-level governments have created special
funds for the promotion of FTCSP. Service providers that want to operate in FTTUDB under
the FTCSP framework, thus have to – among other things – file an application with the pro-
vincial Finance Department for accessing those special funds. A document from Zhejiang
Province (2011) stipulates that
“the main purpose of the special fund is to support enterprise engaged in foreign
trade through the provision of Foreign Trade Common Service Platforms based
on local or provincial levels. … Such platforms are to offer foreign trade enter-
prises services through institutions related to technology innovation, quality test-
ing, management consulting, market exploration, information research, staff train-
ing, shared use of equipment, storage and transportation as well as other areas”
(Zhejiang Province 2011 at 3).
© THINK!DESK China Research & Consulting 2015 Seite 304
According to the MOFCOM (2011a), FTCSP offer a variety of services:
(1) Common testing and detection platforms. Specialised centres for material analysis of-
fer reliable testing and detection services, provide official certificates and relevant
consulting services to resident base enterprises.
(2) Common technology and R&D platforms. Provide prospective and basic R&D on key
common-use technologies, experiment coordination and other services. Strengthen
companies’ ability to independently develop new products, new technologies and new
techniques. Promote technology renovation and upgrading. Raise the technology
content and added value of products.
(3) Common certification and registration service platforms. Offer certification services
relating to domestic and overseas quality management systems, product perfor-
mance and environmental protection. Conduct trademark registrations and technolo-
gy related consulting services.
(4) International marketing services platform. Provide services in the following areas:
world market related trademark policies, popularisation, public relations, enterprise
exchanges, after sales and others.
(5) Common trading platform. Provide trading places related to foreign trade develop-
ment (including specialised marketplaces, domestic and overseas trade fairs etc.).
Offer stable, reliable and convenient internet platforms for negotiating and trading as
well as other business services.
(6) Common product presentation platform. Provide services for showcasing products by
way of demonstration, presentation and advertising.
(7) Common information platform. Set up repositories for materials related to science and
technology, patents, technology standards and others. Provide data analysis, busi-
ness consulting, market information, early warnings on trade conflicts, laws and regu-
lations, industry and trade policy, output-sales ratios and other business services.
(8) Common training platform. Offer training courses for professionals on promoting and
accelerating the transformation of the foreign trade development mode. Provide train-
ing on international trade and confronting trade conflicts for the staff of resident en-
terprises as well as of the department of foreign trade and finance (Jiangsu Province
2012a).
(9) Common logistics platform. Provide transportation, storage and other logistics ser-
vices depending on the demand characteristics of the Bases’ signature industry.
The service providers must possess the necessary financial resources, location, facilities,
equipment and staff to serve a significant proportion of the enterprises inside a Demonstra-
tion Base. Provinces and cities also demand that service providers must have a local pres-
ence through a registered enterprise. Furthermore, such units have to sign an agreement
with relevant government authorities, thereby committing themselves to offering preferential
services to Demonstration Base enterprises. Expenses related to normal business operation
of service providers can be reclaimed from supervising authorities at a rate of 70 percent (for
units located in old industrial bases or central and western regions, like Chongqing, Hunan or

© THINK!DESK China Research & Consulting 2015 Seite 305
Jilin) or 50 percent for all other locations. However, compensation is limited to the following
expenditure items:
Purchases of equipment and technology
Development of systems and technologies
Purchases of technology materials, information materials and statistical materials
Renting or leasing premises used for staff training or trade fairs
Costs for operation, maintenance and advertising (Jiangsu Province 2012a)
The MOFCOM transfers support funds to provincial-level authorities and tasks them with
their distribution across FTCSP/FTTUDB. The number of national-level Demonstration Bases
has a direct impact on the share of funds that can be disbursed to provincial-level Demon-
stration Bases, as displayed in the following table 84:
Table 84: Distribution of Funds Between Central and Provincial level FTCSP
No. of national-level
FTTUDB located inside
the province
Share of MOFCOM special funds assigned to …
national-level
FTTUDB provincial-level FTTUDB
≥ 5 50 % 50 %
3 – 4 70 % 30 %
1 – 2 90 % 10 %
Source: Wind Data
The amounts allocated to individual FTCSP differ across regions. In 2013, Hunan Province
capped the subsidy for each FTCSP, e.g. international marketing, in national-level Demon-
stration Bases at 2 million RMB per year. For provincial-level FTTUDB, the annual maximum
subsidy was fixed at 1.5 million RMB. The province also limited total annual allocations per
FTTUDB to 5 million RMB at national and 3 million RMB at provincial level (Hunan Province,
2013a at3.5).
Hunan Province also offers a good glimpse on the amount of subsidies related to FTCSP.
The province is host to 77 FTCSP serving enterprises located in both national and provincial
level FTTUDB. 16 of the Platforms are recognised at the national-level while another 56 are
operating under the province’s own FTCSP programme. In late 2013, only 27 Platforms had
been complete while the remaining 50 were on different stages of construction. In fact, it ap-
pears that across China, sub-national governments have taken the initiative to expand both
number and operations of FTCSP in recent years. The following table 85 provides some key
information on FTCSP in Hunan Province:

© THINK!DESK China Research & Consulting 2015 Seite 306
Table 85: FTCSP in Hunan Province in 2013
FTCSP
com-
plete
FTCSP
under
construc-
tion
Total In-
vestment
(mln
RMB)
Service
provid-
ers
Reve-
nues
(mln
RMB)
Degree of
subsidisa-
tion
(percent)
Inspection
& detection 3 77.1 9 2.34 15
Technology
& R&D 12 19 1,349.9 388 332.8 24
Experiment-
ing & detec-
tion
4 7 177.1 364 15.8 24
Common-
use tech-
nology &
R&D
3 177.1 3 0.6
Product
presenta-
tion
1 12.0 8 0.7 60
Others 10 18 654.9 1,082 81.5 32
Total 26 51 2,448.1 1,854 433.8 31.0
Source: Hunan Province 2013b.
Since launching the FTCSP programme in 2010, MOF and MOFCOM publish annual guide-
line documents to highlight priorities and clarify operational details. Subsequently, the foreign
trade departments of provincial and municipal governments draft their own guidelines which
typically closely match the central government model. Local FTCSP regulation references –
in most cases even mirrors – the central blueprints until 2013. Since then, differences have
started to emerge.
In 2013, MOF and MOFCOM have repealed a good part of the regulation on the FTCSP pro-
gramme, including the annual outlines for 2011 and 2012 (MOF and MOFCOM 2013b). This
does not imply the programme’s termination but signifies a shift towards a seemingly more
balanced approach for export and import promotion. The 2013 guidelines removed much of
the detail provided in previous versions on FTCSP funding and operation. While FTTUDB are

© THINK!DESK China Research & Consulting 2015 Seite 307
still mentioned explicitly, the import component of trade promotion is mentioned alongside
traditional export supporting measures (MOF and MOFCOM 2013a). In April 2014, the MOF
and MOFCOM (2014) jointly released the Circular concerning the Reporting Work for the
Special Fund for Foreign Trade Development. The document does not include the traditional
promotion of export-oriented manufacturing. Instead, it emphasises overseas investment
projects of Chinese companies, service exports through outsourcing and offshoring as well
as the export of Chinese technology through sales, licensing, joint-venture companies and
other arrangements. The most recent edition also puts a focus on the importation of products
with high technology content and the potential to improve the living standard of the general
population. Neither FTTUDB nor FTCSP are mentioned explicitly as it appears that all poten-
tially objectionable content – in the context of the WTO Agreement on Subsidies and Coun-
tervailing Measures – has been purged (MOF and MOFCOM 2014). Common Services Plat-
form related policies has not stopped since then, but the documents released by the MOF
and MOFCOM since spring 2014 discuss the concept in the context of SME promotion and
other, more market oriented policies.
Judging from the documents issued by provincial-level authorities that were available in Feb-
ruary 2015, sub-national authorities have been slow to make this transition. Annual guide-
lines for 2013 have been generally shorter and less detailed compared to previous ones but
key information on the nature of FTCSP and the cost components for which service providers
may see compensation remain largely unchanged. Jiangsu Province may serve as a case in
point. In 2013, Jiangsu Province, for example started to support FTCSP in “National-level
Integrated Product Marketplaces for Domestic and Foreign Trade” and “National Import
Trade Promotion Innovation Demonstration Bases” (Jiangsu Province 2013a). In Hunan
Province, however, regulation for the same year has largely remained unchanged – main-
taining the previous elements of export promotion policy. Support targets named include var-
ious types of national-level bases and “Export Bases recognised by the Government of Hu-
nan Province” (Hunan Province 2013a).
The Demonstration Bases create agglomeration advantages through improved communica-
tion, learning, trade and other exchanges among resident enterprises. Porter (1990) has ana-
lyzed in detail how the formation of industry clusters can translate into competitive ad-
vantages. Logistics costs are reduced. The sharing of common resources and infrastructures
allows cost benefits for individual enterprises. Frequent interaction with suppliers and con-
sumers at arm’s length helps spur product innovation, makes product development more
efficient and shortens the “time to market”. Increased competition drives improvements in
products and services while, at the same putting pressure on prices. This list is not meant to
be exhaustive, as plenty of other agglomeration advantages maybe conceived of depending
on the actual situation.
However conducive clusters may be for competitiveness, it is the FTCSP that serve to ampli-
fy agglomeration advantages and make them available easier and cheaper. The Platforms
offer an effective leverage point for promotion measures and imply that government support
generates the maximum effect.

© THINK!DESK China Research & Consulting 2015 Seite 308
By way of the FTTUDB approach, Chinese government authorities effectively designate cer-
tain enterprises as key exporters. They then aid these companies by means of providing ser-
vices for free or at discounted prices. As the approval of FTTUDB depends on their export
performance – both in terms of past track record and future potential – the operation of CSPs
should be viewed as provision of export contingent subsidies. These artificially boost the
competitiveness of base enterprises and constitute a violation of China’s WTO Agreement on
Subsidies and Countervailing Measures.
It is important to note, that the FTTUDB programme is but one of several similar schemes.
However, it is the single most important in the field of export promotion. In addition to the
variety of schemes imposed for different purposes, there is also a significant overlap be-
tween them. Since its launch in 2009, over 300 individual NTIIDB have been recognised
across the China. Except for Bases covered by both programmes, operation and supervision
of FTTUDB and NTIIDB has remained largely unconnected.
As the support mechanisms in operation behind these programmes are typically not fully
disclosed, promotion measures are difficult to identify and quantify. Likely, government assis-
tance is less institutionalised and occurs more on an ad-hoc basis than in a steady flow of
benefits. However, the great interest of regional governments, companies and industry asso-
ciations to get included under such programmes suggests net benefits.
Arguably due to the growing number of trade defence case brought against Chinese exports
in recent years, government authorities have softened the language used in regulatory doc-
uments. Fewer concrete solid leads are hidden inside longer manuscripts. Vague and asser-
tions of technology upgrading, market opening and the balancing of social, ecological and
economic needs cloud the view on the persistence of traditional subsidisation practices. The
degree of difficulty in tracking down incriminating content has thus increased substantially.
At the time of writing, in March 2015, it is still unclear what parts of the FTTUDB and FTCSP
programmes are still in operation. Seeking to improve its understanding of FTTUDB and
FTCSP, the U.S. has requested consultations with China at the WTO on February 11th 2015.
Several other countries, including the European Union, Japan and Brazil, have joined the
initiative since then (WTO 2015).
Companies located in FTTUDBs have been selected to benefit from special support policies
for export oriented industry clusters. Since the recognition of Demonstration Bases by both
central and local governments is tied to export performance, it is safe to say that promotion
measures provided for and limited to companies in such Demonstration Bases constitute
export contingent subsidies. Upon its WTO accession, China has signed the Agreement on
Subsidies and Countervailing Measures pledging to forgo export subsidisation. The combina-
tion of policies described here indicates a violation of this protocol.

© THINK!DESK China Research & Consulting 2015 Seite 309
5. INSTITUTIONAL SET-UP AND POLICY GUIDANCE OF CROSS-
BORDER CAPITAL FLOWS
The Chinese government’s approach to foreign direct investment has been one of “two
speeds” where inward FDI have been (cautiously) promoted early on, while outward direct
investment activities remained greatly restricted for more than a quarter century after the
begin of the reform era. Unlike Japan or South Korea, which have experienced decades of
strong growth during the second half of the 20th century but largely discouraged inward for-
eign direct investment (FDI), China has – from the onset of economic reforms – sought to
attract foreign companies to settle in China and serve as source of technological expertise
and management skill. While China only so slowly eased restrictions on the operation of for-
eign invested enterprises (FIE), it did pursue a much more open approach compared to other
high performing East Asian economies, like Taiwan, South Korea, and Japan. A surge in
outward investment occurred only with a lag of about 15 years relative to FDI inflows (see
figure 11).
Figure 11: Development of Chinese FDI Inflows and Outflows, 1980-2014
Source: Bloomberg data
5.1 Inward Foreign Direct Investment
Throughout the 2000s, China has been the largest recipient of FDI among all emerging mar-
kets and developing countries. Inflows surged after China had joined the WTO in 2001 and
growth rates remained high until the world financial crisis. In 2008, the value of FDI actually
utilised had reached 95.3 billion USD. After a slight dip in 2009, growth resumed, albeit at a
slower pace. Since 2011, inflows have stagnated at about 119 billion USD. Under the im-
0
20
40
60
80
100
120
140
Billio
n U
SD
FDI outflows FDI inflows

© THINK!DESK China Research & Consulting 2015 Seite 310
pression of economic cooling in China and still weak fundamentals across much of Europe,
the growth rate has approached zero – a sharp contrast to the double digits of previous years.
It should be noted that the official statistics do not contain FDI in financial services. Adding
the investments of bank, securities firms and insurance companies, would substantially in-
crease the headline numbers (NBS 2015).
With 55 percent of FDI (66.2 billion USD), the service sector has been the most important
target of overseas investments. At 7.8 percent, year on year growth has also been the most
dynamic. Distribution and transport services have featured prominently with a combined in-
flow of 12.2 billion USD. The Agricultural sector attracted a mere 1.5 billion RMB which ac-
counted for only 1.3 percent of the total and also marked a steep decrease of 15.4 percent
against the previous year. Manufacturing related FDI also marked a significant decline: -12.3
percent. However, Chinese factories still received 39.9 billion USD in new FDI – 33.4 percent
of the total. Communications equipment, computer and other electronic equipment and
transportation equipment have been the sub-sector attracting the most investment (CASS
2015).
The sources of China’s FDI inflows are highly concentrated. A total of 112.6 billion USD orig-
inated in one of ten countries – this represents a share of 94.2 percent. These were: Hong
Kong, Singapore, Taiwan, Japan, South Korea, the U.S., Germany, the U.K., France and the
Netherlands. Importantly, FDI inflows from major sources have displayed significant declines.
Investments from Japan, the U.S. and the E.U. dropped by 38.8 percent, 20.6 percent and
5.3 percent respectively (ibid).
The bulk of FDI inflows (82 percent) went to the highly developed coastal provinces in East
China. The poorer Central and Western Regions accounted for the remaining 18 percent.
While the growth rate of FDI inflows in both East and West China stood below the national
average of 1.7 percent, provinces in central China enjoyed an increase of 7.5 percent (ibid).
5.1.1 Governmental Steering of FDI Inflows
The Chinese government continues to regulate and restrict foreign direct investment in spite
of a stream of previous reforms and liberalisation announcements, e.g. following the third
plenum of the 18th CPC Central Committee in November 2013. After China joined the WTO
in 2001, a large number of sectors were opened to overseas investors and China has acted
largely in line with its liberalisation commitments from the accession protocol. However, by
the time of writing in early 2015, a significant number of business areas still remained closed
off for foreign direct investment (FDI) as the Chinese government sought to protect the mar-
ket position of domestic companies in general and SOEs in particular.
While openly protectionist regulation has gradually been abolished, the present legal and
administrative environment is geared to first and foremost strengthen the international com-

© THINK!DESK China Research & Consulting 2015 Seite 311
petitiveness of domestic companies. This is done through a combination of encouraging im-
port substitution and export promotion. Either way, support for technology upgrading and the
build-up of innovative capacities are omnipresent. This policy orientation does not seem
aimed at establishing China as a regional component of an international free market econo-
my and a reliable constituent of the global value chain. Rather, the government is cultivating
a new generation of national champions which it envisions to become future market leaders
in the world market. Foreign investment is invited to play a facilitating role – mainly through
contributing vital knowhow related to technology development and management practices.
The Chinese government imposes limitations on FDI inflows and directs investments to se-
lected industrial sectors and geographic regions where foreign investors can help improve
the capabilities of home-grown companies.
The Catalogue for Guiding Foreign Investment Industries (outlined in section 2.1 of this study)
represents the very foundation of FDI related regulation. Since 1995, the Catalogue serves
as the principal instrument for Chinese government to influence the volume and composition
of incoming FDI. Drafted by the Ministry of Commerce and signed off by the State Council,
the Catalogue has no equivalent on sub-national levels of the administration.
A special Catalogue for Guiding Foreign Investment in Central and Western Regions is man-
aged on the central government level. The designation is misleading in that the document
covers 22 of 33 provincial level jurisdictions including some located in the Eastern part of the
country, like Anhui Province. The regional scope reflects the national strategy to promote the
economy in less developed areas. These are covered in three major regional development
schemes: the Great Western Development, the Rise of Central China and the Revitalisation
of Traditional Industrial Areas and the North East. Each of these provide for special invest-
ment incentives, like tax breaks or loan interest subsidies, for both Chinese and foreign en-
terprises that engage in businesses contained in the Catalogue. The latter specifies 15 to 30
encouraged industries individually for each of the 22 regions.
The policies and administrative measures issued on all levels of government reference the
catalogues to ensure FDI accumulates in designated sectors and regions. Since its first re-
lease, the catalogue has reduced the number of products and technologies that are off limits
for foreign invested enterprises (items listed in the restricted and prohibited categories). In
partial compliance with its WTO commitments, China has opened a growing number of in-
dustrial sectors to foreign capital. Nevertheless, Chinese authorities insist that FDI needs to
be guided in support of national industrial policies. This implies that even the most recent
revision of the Catalogue – issued in March 2015 – forces foreign companies into joint ven-
tures with domestic counterparts. Regulations like these are intended to create opportunities
for technology spillovers and accelerated development of home-grown players. Furthermore,
they allow domestic companies to share the profits overseas investors reap from their sales
in the country.

© THINK!DESK China Research & Consulting 2015 Seite 312
Beyond the implementation of Catalogues, Chinese authorities resort to discretionary
measures in order to demand technology transfer. Investment approval may hinge on estab-
lishing of research facilities in China and/or conducting R&D in certain fields.
The automobile sector is a case in point. The manufacturing of complete vehicles and com-
ponents has been listed in the encouraged category of the Catalogue for many years. The
provisions demanded that foreign carmakers enter joint ventures with domestic peers in or-
der to set up operations inside the country. As local counterparts lacked experience and ex-
pertise in vehicle design, manufacturing and sales, overseas firms had to contribute much of
their own technologies and knowhow in order to ensure smooth operations. From the per-
spective of the multinational company, this arrangement, which can also be found in other
industries, may well be described as trading key technologies for market access.
Following a 2011 revision of the catalogue, all but the most advanced technologies were re-
moved from the encouraged category. In fact, the manufacturing of complete vehicles, spe-
cial purpose automobiles and motorcycles was shifted to the permitted category in 2011 and
moved to the restricted category in 2015.
Most of the remaining automobile items in the encouraged category are related to electric
drive technologies and related infrastructure. Such products and technologies belong to the
New-energy Vehicle field which is prominently supported as a strategic emerging industry
since 2010. While foreign investors are invited to participate in the development of this spe-
cial sector, the Catalogue stipulates that such projects have to be realised together with local
partners. The foreign company may not hold majority ownership in the resulting joint venture.
This arrangement exposes foreign companies to the risk of IP loss with potentially disastrous
consequences for their global operations.
In spite of these practices, the competitiveness and market shares of Chinese vehicles con-
tinued to lag behind foreign brands. Consequently, the government issued a directive, urging
joint ventures to establish new domestic brands instead of boosting foreign ones. Interna-
tional heavy weights like GM and Volkswagen, which had invested heavily in the formation of
brand equity, were then forced to cooperate with their respective partners in China for
launching new brands from scratch. This approach was highly counterproductive for foreign
companies as sales and profits of international brands were registering consistent growth.
The shift in industrial policy thus has to be seen as a means to boost the competitive strength
of domestic players. Confronted with the need to turn their new Chinese brands into com-
mercial successes quickly, foreign OEMs brought to bear their full expertise in marketing and
brand development. The necessary transfer of advanced branding capabilities to China-
based subsidiary of major OEMs created significant learning opportunities for local players.
Through this move, Chinese authorities forced the trade of marketing and branding capabili-
ties for continued market access.
The most recent revision of the Catalogue for Guiding Foreign Investment Industries was
released by the NDRC and the MOFCOM on March 10th 2015 and entered into force one

© THINK!DESK China Research & Consulting 2015 Seite 313
month later. It contains a total of 349 individual technologies and, like previous documents,
divided them into three categories: encouraged, restricted and prohibited. Overall, the Cata-
logue opens more sectors of the Chinese economy to foreign competition and removes own-
ership restrictions in some areas. The number of restricted and prohibited items was cut
while that of encouraged items increased. Starting from April 10th 2015, foreign invested en-
terprises (FIE) are explicitly encouraged to build and operate urban subways, light rail as well
as other means of rail bound passenger transportation systems. The need for a domestic
joint venture partner was eliminated. Wholly foreign owned accounting and auditing compa-
nies are encouraged as well, as long as the leading partner is a Chinese national. Similarly,
FIE are welcome to construct and operate grids together with a domestic counterpart as the
major shareholder.
The restricted category was streamlined compared to the 2011 document as the number of
items dropped from 79 to 38. Restrictions were lifted on the production of drugs, chemicals
and general apparatuses as well as several other manufacturing industries. In the service
sector, FIEs are now allowed to build and operate high grade hotels, office buildings and
exhibition centres. The development of land, investment in second hand real estate and op-
eration of real estate brokerage agencies was upgraded to the permitted category. Important-
ly, FIEs are free to set up non-bank financial institutions and operate e-commerce platforms
independent from a local partner. In basic and value-added telecommunications services,
FIEs may seek ownership shares of 50 percent and 49 percent respectively.
In the prohibited category only minor changes occurred. The sectors newly opened to FIEs
are rather insignificant. Following April 10th, 2015, FIEs are free to invest in the
processing of green tea and special tea with China's traditional crafts (famous tea,
dark tea, etc.)
manufacture of open-lead-acid cells, mercury button type silver oxide cells, paste di-
oxide-zinc battery and nickel cadmium cells
manufacture enamel products
manufacture Xuan-paper (rice paper) and ingot-shaped tablets of Chinese ink
operate golf courses and villas
On the downside, and potentially much more important, FIEs are barred from offering legal
affairs consulting, the only exception being the provision of information about environmental
impact of Chinese law. Furthermore, the wholesale and retail of tobacco leaf, cigarette and
re-dried leaf tobacco as well as other tobacco products is prohibited.
This illustrates the need for a careful review of how individual sectors and technologies rele-
vant to a majority of foreign investors are treated in the Catalogue revisions. Putting empha-
sis on a reduction in the number of restricted and prohibited items, as done by Chinese state
media, may overstate the effective market entry liberalisation for FIEs.
Industry leaders have highly criticised the Catalogue because of its continued discrimination
against foreign companies. An FIE planning to invest in the Chinese market and register an

© THINK!DESK China Research & Consulting 2015 Seite 314
entity must firstly meet the various requirements pertaining to the category in which it fits. In
a second step, its application is subjected to lengthy review procedures handled by various
government supervisory bodies. Ensuring compliance consumes valuable time and funds.
Even though the new version of the Catalogue is a marked improvement on past versions, its
arrival has not been met with great excitement. Although welcoming the new revisions, the
European Chamber of Commerce still criticised the Catalogue calling it
“only a small step for the Chinese Government’s own stated ambitions of giving
full play to the market” (EUCCC 2014).
The American Chamber of Commerce likewise welcomed the changes but immediately
called for even bigger steps to be taken in order to promote freer trade (AmCham China
2015):
“While being a promising first step in the direction of a freer market in China, the
Catalogue still discriminates against foreign businesses, thus making the Chinese
economy a planned economy, not one based on a free priced system. Restricting
which industries foreign companies may enter and subjecting them to different
rules than domestic companies is blatantly protectionist and does not qualify the
country as a market economy.”
Future improvements may be possible through the Foreign Investment Law which may be
approved by the National People’s Congress at its next annual session in spring 2016. A
draft version has been published on the website of the MOFCOM for public deliberation and
solicitation of comments (MOFCOM 19.01.2015). If enacted, the current draft version would
introduce some promising measures, such as a negative list which defines products and
technologies that are off limits for international investors – similar to the negative list which
exists for FIE in the China (Shanghai) Pilot Free Trade Zone.

© THINK!DESK China Research & Consulting 2015 Seite 315
5.1.2 Foreign Investor’s Perception of Chinese FDI Regulation
In its 2014 member survey, the European Union Chamber of Commerce in China found that
doing business in China had become more challenging. Overall, 51 percent of companies
perceived their China business had gotten more difficult within the last few years30. Frustra-
tion was particularly strong at large companies (over 1,000 employees) and China veterans
(operating in China for over ten years) with 68 percent and 62 percent respectively.
The survey also concludes that
“European companies still perceive themselves to be discriminated against in the
Chinese marketplace. It is estimated that European companies that are members
of the European Chamber missed out on EUR 21.3 billion in revenues in FY 2013
due to market access and regulatory barriers” (EUCCC 2014 at 7).
55 percent of respondents stated that foreign-invested enterprises received less favourable
treatment than their domestic competitors. Perceived discrimination against foreign business
was particularly pronounced in the fields of legal and financial services reflected by 90 per-
cent and 68 percent of sector companies respectively. Market access barriers were seen
hindering future business activities by 55 percent (EUCCC 2014 at 15).
“Were the authorities to ‘practice what they preach’ and implement meaningful re-
forms, especially administrative and market-access related ones, European com-
panies are prepared to re-intensify their investment. … More than half (55 per-
cent) of European companies would be more likely to increase investment if
greater market access were afforded to foreign companies” (EUCCC 2014 at 7).
The survey found that the perceived degree of discrimination against foreign business was
higher in industries in which SOEs are major competitors. Examples include financial ser-
vices, transport and logistics as well as utilities. The correlation between both factors may not
be incidental but speaks for a continued preferential treatment of state firms (EUCCC 2014 at
37).
In line with surveys from previous years, almost half of the companies claimed to have lost
out on business opportunities due to either market access or regulatory constraints. 37 per-
cent of companies reported to have missed out on 10-25 percent of their annual revenues
this way.
With regards to IPR, the proportion of companies satisfied with relevant laws and regulations
has declined compared to previous surveys. Whereas the legal framework design is in the
hands of the central government, local authorities are in charge rule enforcement. Member
perceptions on the latter improved as the share of companies rating government perfor-
30
Nine percent believed it had become easier.

© THINK!DESK China Research & Consulting 2015 Seite 316
mance as (very) inadequate dropped from 69 percent in 2011 to 63 percent (EUCCC 2014 at
38).
A survey of the American Chamber of Commerce in China revealed that 60 percent of its
members felt less welcome in China in 2014 compared to the previous year. The 2013, only
41 percent of member companies made that statement. With regards to the application of
Chinas Anti-Monopoly Law, 49 percent of companies felt subject to above-average levels of
scrutiny by enforcing authorities. (WSJ 02.09.2014).
Similarly, the proportion of enterprises finding a preference for local competitors in regulatory
treatment has increased 2014 to 54 percent from 46 percent in 2011. At the same time, the
number of companies rating the regulatory environment of their industry as transparent has
dropped from 21 percent to 14 percent. Lack of clarity ranked at the top of the regulatory
challenges for companies in 2014: 78 percent of enterprises found this to hinder their opera-
tions in China (AmCham Shanghai 2015).
A different – non-survey based – approach to measure the investment climate for foreign
investors in China has been undertaken by the OECD. The OECD’s FDI Regulatory Restric-
tiveness Index provides a benchmarking system to gauge the difficulty that foreign investors
face in different industries. The Index combines all discriminatory measures affecting foreign
investors, including market access restrictions and departures from national treatment. It in-
tegrates four separate indicators: (1) sectoral equity limits; (2) screening procedures; (3) per-
sonnel related restrictions; and (4) other restrictions, e.g. land administration and capital re-
patriation (Thomsen n.d.). The OECD calculates the Index for 58 countries, including all
OECD and G20 countries, and covers 22 sectors. The Index is scaled from 0 to 1, where 0
indicates that there are no regulatory impediments to FDI in a specific sector respectively in
the weighted average over all sectors. A score of 1 implies that foreign investment is fully
restricted in a sector respectively the economy as a whole. I.e. the lower the score, the less
restricted the investment regime is for foreign investors.
Overall, China scored 0.42 which is significantly higher than the OECD average of 0.07. The
regulatory burden is also the highest among BRIC countries where Brazil, India and Russia,
which scored 0.10, 0.26 and 0.18 respectively. While the headline score already indicates
significant regulatory restrictions on the free operation of foreign invested enterprises, the
values for several individual industries can are even higher. Administrative barriers are par-
ticularly high in media, radio, television, telecommunication, utilities as well as legal and in-
surance services. Along with fisheries and maritime business, these sectors also represent
the areas where China shows the most pronounced deviation from the OECD average. On
the positive side of the spectrum are businesses in engineering, architecture, hotels, chemi-
cals and forestry which face the least restrictive regulatory environment.
© THINK!DESK China Research & Consulting 2015 Seite 317
5.2 Outward Foreign Direct Investment
Since the beginning of the 11th FYP, Chinese companies have become increasingly active
investing abroad. This follows on the heels of substantial foreign investment inflows to China
since the early 1980s. Unlike Japan or South Korea, which have experienced decades of
strong growth during the second half of the 20th century but largely discouraged inward for-
eign direct investment (FDI), China has – from the onset of economic reforms – sought to
attract foreign companies to settle in China and serve as source of technological expertise
and management skill. While China only so slowly eased restrictions on the operation of for-
eign invested enterprises (FIE), it did pursue a much more open approach compared to other
high performing East Asian economies, like Taiwan, South Korea, and Japan. A surge in
outward investment occurred with a lag of about 20 years relative to FDI inflows.
Motives have in the early years been dominated by the need to secure access to overseas
raw materials as rapid development had created supply bottlenecks inside the country. Typi-
cal examples include the exploitation of foreign oil, gas, iron ore and other resources. Fur-
thermore, Chinese companies have sought to accelerate the pace of technology develop-
ment and product improvement by snapping up advanced companies and adding their exper-
tise. Increased competition in the domestic market and beginning saturation in some seg-
ments have driven the need for increasing competitiveness quickly. The purchase of
Putzmeister, a leader in the field of concrete pumps may serve as an example. Thirdly, the
need to build up or enhance the brand image has led companies like Galanz, Lenovo, Pearl
River Piano, etc. to take over business units or whole companies from Western companies.
Former president Jiang Zemin has addressed this point in his report to the 16th National
Congress of the CPC in November 2002:
„Implementation of the strategy of "going out" is an important measure taken in
the new stage of opening up. We should encourage and help relatively competi-
tive enterprises with various forms of ownership to invest abroad in order to in-
crease export of goods and labor services and bring about a number of strong
multinational enterprises and brand names. We should take an active part in re-
gional economic exchanges and cooperation. In opening wider to the outside
world, we must pay great attention to safeguarding our national economic securi-
ty” (Xinhua 18.11.2002).
In recent years, however, the pursuit of market access has gained prominence. As important
export markets have erected trade defences against dumping and subsidization practices in
China, the establishment of local production provides a channel to tap foreign markets. Tian-
jin Pipe Co., Ltd., e.g., has set up a production plant in Texas in order to gain access Ameri-
can customers in the petroleum industries for its tubes and pipe products.
While the accelaration of outward foreign direct investment activities is of course to be ex-
pected from an emerging market with high growth rates and an increasingly outward oriented
economic model, the government has proactively promoted this process. As early as 1999,

© THINK!DESK China Research & Consulting 2015 Seite 318
the Chinese government introduced the “Going out” strategy to complement the earlier
“Leading in” approach to investment inflows. While the strategy has in part been inspired by
national prestige, concrete economic needs played a central role. Initially, the approach was
aimed at SOE. The 15th National Congress of the CPC urged state-owned firms to become
more ambitious in their quest for foreign assets. De jure, private companies could pursue
M&A outside China’s borders. At the time, however, most private players lacked the financial
means and management expertise to mount takeover bids and successfully complete trans-
actions. As private companies had not been included in the system of supporting policies,
their prospects remained dim. It took several years for the regulatory framework to put state
and non-state enterprises on equal footing. The Several Opinions on Encouraging, Support-
ing and Guiding Non-public Enterprises to Invest Overseas, issued in 2007, represent a
milestone as it introduced a wide array of support measures to companies of various owner-
ship types.
De jure, the current regulatory framework promotes overseas FDI irrespective of classifica-
tion. De facto, strategic policy considerations with regards to supply safety in energy and
other resources continue to prioritise SOEs. The imbalance is compounded by existing dis-
tortions in the financial markets. Access to bank credit and state funds is often impaired as
private companies lack the low-risk profile naturally enjoyed by SOEs. While the number of
non-state enterprises venturing abroad has increased, these are mostly large and successful
players in the domestic market, like Haier. Financially distressed SOEs in industries like steel,
aluminium and mining do not face constraints as private companies. The Aluminium Corpo-
ration of China and Minmetals are good examples. The country’s leading aluminium smelter
and it’s largest diversified mining company have reported losses for consecutive years.
Thanks to comprehensive government backing, financial performance does not endanger
financing for overseas acquisitions and operations.
Launched in the aftermath of the Asian Crisis, the strategy did not have much traction at first.
At the time, Chinese investments involved relatively few transactions per year that were car-
ried out by large SOEs. One example was the acquisition of the El Hierro Iron Ore Mine in
Peru by Chinese Shougang in 1992. The deal was put on track through intergovernmental
negotiations and lacked some of the commercial character found in OECD countries. As
growth recovered in the early 2000s the government’s push for outward investment became
more effective. By then, the Going Out strategy had been fleshed out by guidelines and ad-
ministrative measures. The evolution of a regulatory framework combined with the strategy’s
introduction in numerous government plans and programmes. A review of the FYP of prov-
inces, autonomous regions and municipalities under the direct administration of the central
government showed that all regions, with very few exceptions, promoted the Going Out
strategy since the 11th planning period. The initiative had been positioned as integral part of
the Chinese economic development model and was frequently referenced in industrial policy
guidelines.
The Going Out strategy has profoundly changed the situation for Chinese companies intend-
ing to invest abroad. Firstly, it has led to the removal of bureaucratic procedures which had

© THINK!DESK China Research & Consulting 2015 Seite 319
previously obstructed such transactions. Complicated review and approval requirements
were scrapped and enterprises received the go-ahead for proposed deals with less effort and
in shorter time. Secondly, it has reduced the financial risks involved in such transactions. As
the Going Out strategy penetrated into every aspect of industrial policy guidance, support
measures were drawn up on all government levels. An important facilitating role was as-
signed to the China Development Bank and the China EXIM Bank. The two policy banks
were tasked to help with innovative financing solutions and support companies’ overseas
ventures. Finally, the state-owned China Export Credit Insurance Corporation (Sinosure)
entered into a cooperation with policy banks in order to complement the spectrum of special-
ized financial services offered (China Africa News 2010). Finally, the amount and quality of
information on entering foreign markets was substantially improved. The MOFCOM and Chi-
nese diplomatic missions abroad collaborated to compile and publish country and industry
specific guidelines. Investors were provided access to inform of risks and opportunities.
The regional distribution of Chinese outward FDI around the world reflects the strong role of
SOEs. Most assets acquired by Chinese companies are concentrated in Latin America and
Africa. Home to large deposits of coal, copper, iron ore as well as oil and gas, investment
volumes in these regions have been exceptionally large. Investments in OECD countries
have shown a remarkable increase in recent years but still compare poorly to the business
and resource interests Chinese companies have accumulated in developing countries
(Economist 31.01.2015; Economist 17.01.2015). The dominating role of SOEs in mining and
heavy industries has led the way for Chinese overseas investments. Construction companies,
manufacturers of telecommunication equipment, railways and cars have followed suit without
ever reaching the investment volumes demonstrated by state-owned resource giants (New
African 2015). Since the beginning of the Going Out strategy, China has made use of general
foreign policy to help its companies enter overseas markets or tap into raw material deposits
(Kind & Wood Mallesons 2011). The Chinese government makes full use of its official devel-
opment aid programmes to help individual companies secure mining concessions. In order to
give weight for domestic companies’ resource bids, the MOFCOM works closely with the
Ministry of Foreign Affairs (MOFA) and policy banks to negotiate aid deals that may involve
the provision of cheap loans, or the construction of telecommunication and transport infra-
structure in the partner country.
Since about 2010, several new motives for overseas investments have emerged. Firstly, ris-
ing wages and increasing shortages in the supply of low-skilled labour have hurt the competi-
tiveness of manufacturers textiles, apparel and other basic labour intensive goods. The situa-
tion is even more challenging for enterprises engaging in pollution or energy intensive indus-
tries. Tightening environmental standards, combined with more frequent inspections and
larger penalties, have made it difficult for polluting industries to operate in China. Stricter
rules prescribe the installation of environmental protection equipment which creates substan-
tial investment costs. Many of these, like steelmakers, aluminium smelters and miners, are
operating in sectors plagued by significant overcapacities. Low profit margins have hurt com-
pany profits and complicated investments in innovation for the future. The steel industry is a
case in point.

© THINK!DESK China Research & Consulting 2015 Seite 320
In November 2014, Hebei Iron and Steel Group, China’s largest steelmaker by output, has
announced ambitious investment plans. The company which is owned by the government of
Hebei Province and has a stock market listed subsidiary, will establish a large integrated
steel plant in South Africa. The new production base is designed for a maximum output of
five million tons of crude steel and steel products – about 11 percent of the current capacity
under steam in Hebei Province.
The move was inspired by industrial policies which emphasize the elimination of obsolete
capacities and streamlining fragmented industries. Among the regions with the most intense
pollution levels, Hebei’s industry has been blamed for much of the heavy smog that has
plagued Beijing for years. The province is also the heartland of the Chinese steel industry,
accounting for 20-25 percent of national output – an amount larger than that of any country in
the world except China itself. In order to restructure the ailing steel industry and improve its
environmental performance, Beijing ordered the provincial government to close down a sig-
nificant share of its steelmaking plants. By 2017, the province plans to eliminate output po-
tential on the order of 60 million tons for steel, 60 million tons for cement and 30 million
weight boxes for glass (China National Radio Online 26.09.2014).
An action plan that was devised by local authorities to organize the removal of industrial as-
sets recommends the physical transfer of plant equipment to new production bases to be
established in other countries. The Province supports these measures with special funds as
it seeks to limit the damage that central clean-up policies have inflicted on important pillars of
the local economy. Until 2023, a total of 20 million tons worth of steel capacity is to be moved
to overseas – the rough equivalent of half the annual output of Germany (People Daily
24.11.2014).
However, steel is not the only industry affected by this move: cement, plate glass and several
other sectors are to be shrunken by administrative fiat. According to Chinese news reports,
exports of industrial capacities are to include 30 million tons of cement and 10 million weight
boxes of glass production until 2023 (Hebei News 15.11.2014). The provincial plan, which
promises financial assistance to participating companies does not answer the question,
where these plants should go and how they would be operate profitably in the future.

© THINK!DESK China Research & Consulting 2015 Seite 321
6. LINKING-UP WITH THE GLOBAL CURRENCY SYSTEM
In the domestic sphere, the relative exchange value (i.e. the prices) of all goods and factors
are set individually. For each individual commercial good, service or factor of production,
prices are determined directly and specify the specific demand and supply, i.e. the relative
scarcity, of these in a given economic community. Whenever commercial goods, services or
factors of production are exchanged across borders, between economic communities which
are upholding their own specific currencies and monetary systems, this is no longer possible.
In this enlarged economic community spanning two currency systems, a direct, one-by-one
determination of scarcity for each individual good, service or factor is not feasible as a com-
mon (monetary) denominator is lacking. As such a new common basis for the exchange has
to be established by determining the relative international value and scarcity of national cur-
rencies, i.e. the international demand for economic goods and resources of a specific eco-
nomic community, as a whole. This is done with the exchange rate between national curren-
cies.
Internationally traded goods, services and factors are accordingly not priced by directly inte-
grating two specific goods markets located in two economic communities in a joint market,
but rather through a filter, the exchange rate, that indicates the relative (international) scarcity
of all goods, services and factors of a given economic community.
Given this constellation it is obvious that the correct determination of exchange rates is cru-
cial for the facilitation of a pattern of international exchange and labour division that promotes
welfare and dynamic economic development amongst all participating economic actors.
“Wrong” exchange rates distort all price relations between interacting economic communities
by sending out incorrect signals to the participating actors and bringing about patterns of
labour division about that are not in line with the actually existing
resource endowments
degrees of competitiveness
absolute and relative productivity levels.
The whole idea of a transnational welfare community linked through a fabric of interwoven
value chains breaks apart and loses its capability to combine the best economic actors
world-wide, if the exchange rates underlying the determination of suitable value chain partici-
pants are wrong.
The question, in how far the Chinese currency Renminbi is linked up with the global currency
system in a way that allows for a correct determination of relative scarcities and a sound in-
ternational structuring of economic processes of labour division is a matter of heated debates
between Chinese government officials and foreign parties. While Chinese government is
taking the position that the country’s exchange rate regime is adequate and reflects the ne-

© THINK!DESK China Research & Consulting 2015 Seite 322
cessities of a developing economy transiting from a planned to a market economy;31 foreign
observers are highly critical of the way the Chinese exchange rate is being determined and
the (wrong) signals it sends out to economic actors in China and the rest of the world.
Aizenman (2015), for example, speaks of China’s buoyant 2000s, brought about by “a mod-
ern version of mercantilism” (at pp. 2-3) and an artificial undervaluation of the Renminbi vis-
á-vis other currencies. In his analysis
“[t]he rapid growth and the growing trade and current account surpluses as a
fraction of the GDP has occurred in tandem with massive hoarding of internation-
al reserves combined with massive sterilization of expanding trade surpluses and
financial inflows. These policies aimed at delaying and slowing the real apprecia-
tion associated with successful rapid growth. While the resultant growth has been
spectacular, it comes with hidden, but growing costs and distortions.” (Aizenman
2015, p. 3)
This evaluation is shared by the majority of Western economists. The U.S. Department of the
Treasury - Office of International Affairs accordingly sees “a RMB exchange rate that re-
mains significantly undervalued” (2014 at p. 16)
Following this line of reasoning, the Chinese government is intervening massively in the na-
tional money and foreign exchange markets in order to keep the Renminbi at an undervalued
level that provides Chinese exporters with an unwarranted price advantage vis-á-vis their
foreign competitors. In consequence Chinese exporters can expand their export volumes and
presence on the global markets beyond their true competitive strength and thereby crowd out
other, actually higher performing, foreign firms.
At the core of these distorted international price signals lies the specific institutional set up of
the Chinese exchange rate regime. The latter is usually characterised as one of “managed
floating” in a framework of horizontal bands.32 According to this arrangement the price of the
Renminbi against foreign currencies is determined by means of a state directed mechanism
in which market forces play a limited, tightly controlled secondary function. The general prin-
ciples run as follows:
Before the start of every trading day the PBoC discretionarily declares a “reference
rate” against the US$.
This “reference rate” defines the centre of a trading band in which all RMB/US$
transactions must be settled on this day. Inside this trading band the forces of de-
31
See for example the comment of the Chinese authorities on the IMF’s Chapter IV evaluation of the country’s exchange rate system as well as the international valuation oft he RMB in IMF (2014 at 34). 32
The present arrangement is in place since July 2010, but follows closely the lines of the exchange rate regime installed between July 2005 and June 2008. Between June 2008 and July 2010 China reverted to a quasi peg to the US$ in order to stabilize the currency in the context of the subprime/Lehman crisis.

© THINK!DESK China Research & Consulting 2015 Seite 323
mand and supply are allowed to determine currency prices. Market forces that would
result in prices outside the trading band are repressed.
The trading band enveloping the central reference rate has been widened several
times since the re-installation of this institutional arrangement in 21 July 2010. In its
latest modification on 17 March 2014 the trading band has been widened from +/- 1
percent to +/- 2 percent. As such the space in which market forces are allowed to
work has been enlarged.
In this institutional framework the PBoC – itself a non-independent organisation under the
State Council – has a broad spectrum of instruments available to steer the external value of
the Renminbi:
The determination of daily the “reference rates” – and thereby indirectly also the up-
per and lower limits of the Renmini’s valuation vis-á-vis other currencies – is in princi-
ple independent from the market outcome of the preceding day and can be set by the
PBoC at its full discretion.33
The PBoC cannot only disallow any transactions beyond the trading band; it can also
directly intervene in the market process by buying or selling currency in the market
and contracting with any business actors.
As there exists no full currency convertibility for the Renminbi on the capital account
and a substantial volume of transactions can be enacted only after permission by the
State Administration of Foreign Exchange (SAFE), the volume of currency supplied
and demanded by economic actors can be directly monitored and steered.
Sterilization activities required to neutralize any domestic monetary supply shocks re-
sulting from PBoC currency transactions on the RMB:US$ market, can be enacted at
will by the PBoC. Thanks to the system of financial repression reining the national fi-
nancial system and the government’s enforcing power vis-á-vis the national banking
sector, which is still primarily state-owned, banks can be forced to engage in any
transactions with the PBoC which the latter deems to be in the best interest of the na-
tional economy.
Given this institutional set up the PBoC is in a position to manipulate the exchange rate of
the Renminbi at its discretion and uphold distorted price levels for a considerable period of
time. These activities are shrouded in a veil of in-transparency as China is not providing any
information about its activities in the currency markets. Foreign exchange market interven-
tions are not disclosed and thereby hide the true extent of governmental interventions in the
exchange market and the setting of the exchange rate. The degree of secrecy is further en-
hanced as China also does not report the level of its foreign exchange and gold reserves
under the IMF’s Special Data Dissemination Standard (SDDS).
33
Officially the determination of the reference rate is based on an undisclosed basket of curren- cies and shall reflect market developments and financial and economic conditions.

© THINK!DESK China Research & Consulting 2015 Seite 324
In its 2014 Chapter IV assessment the IMF accordingly sees substantial deficits and asks for
“[a] flexible, market-determined exchange rate [as] an important part of the reform agenda.”
Referring to the price determination mechanisms documented above the IMF highlights that
„the goal should be to allow greater flexibility and reduce intervention, which
could be achieved by further widening the band and ensuring the central parity
better reflects market conditions.“ (IMF 2014, at 32)
In sum it must be concluded that in its present state the Chinese exchange rate system is
neither designed nor able to transmit correct signals about respective competitive strengths
between China and the global market place. As these signals are distorted the welfare creat-
ing function of a global division of labour and highly diversified international value chains is
seriously inhibited.
The devaluation episode of August 2015, when the PBoC significantly devalued the
Renminbi by fixing the central reference rate for three days in a row at a level that lay signifi-
cantly below market expectations, highlights the non-market character of the Chinese ex-
change rate system and exemplifies its discretionary utilization for economic policy goals. 34
34
Against the background of poor businis cycle data and lagging growth, the PBoC set the cent ral reference rate 1.9 % lower than the preceding day on August 11th, followed by a further reduction by 1.6% on the 12th. PBoC reduced the rate a third time on August 13th by 1.1%. In total these actions resulted in a devaluation oft he Renminbi by 4.53%.
© THINK!DESK China Research & Consulting 2015 Seite 325
Part III
The Chinese Economy’s Impact on the Global Economic

© THINK!DESK China Research & Consulting 2015 Seite 326
7. DOES CHINA MEET THE MES-CRITERIA CRITERIA SET OUT
BY THE EU AND AUTHORISED BY THE WTO?
In compliment to the analysis in this Report of the various macro- and micro-economic struc-
tures present in the Chinese economy, the Report will now address the EU’s specific “market
economy status” (MES) criteria in order to determine if China meets those criteria. The au-
thors note that Article 15(d) of the Protocol of Accession of China to the WTO provides that
to be considered a market economy China must demonstrate that it complies with the criteria
of the importing WTO Member, namely the EU.
The EU MES criteria have been adopted in order to facilitate a meaningful resolution of trade
defence measures (and in particular to address the problem of dumping), wherever exporting
country does not feature market-oriented price structures capable of allocating actual scarci-
ties and costs of domestic production. If prices are not set by the market, the competent au-
thorities of the importing country are permitted to employ “surrogate” or “analogue” country
prices (i.e. the prices found in comparable market economies are used) in order to determine
the “normal” production costs.
When China joined the WTO in December 2001, it agreed that other countries could continue
to treat it as a non-market economy for the purposes of trade defence measures. Since then
the EU has several times examined the validity of this classification and has each time come
to the conclusion, that China did not meet the five MES criteria. As a result, China continues
to be treated as not meeting the MES standards in all trade defence investigations opened
by the EU. The question addressed in this Chapter of this Study is whether there have been
any substantial developments recently, which would warrant a change of this categorisation.
In order to attain “market economy status” and become eligible for treatment as a market
economy in trade defence investigations, economies must concurrently fulfil all of the follow-
ing five criteria (EC 2012):
1. Low degree of government influence over the allocation of resources and decisions of
enterprises, whether directly or indirectly (e.g. public bodies), for example through the
use of state-fixed prices, or discrimination in the tax, trade or currency regimes.
2. Absence of state-induced distortions in the operation of enterprises linked to privati-
sation (i.e. “carry over” from the old system). Absence of use of non-market trading or
compensation systems (such as barter trade).
3. Existence and implementation of a transparent and non-discriminatory company law
which ensures adequate corporate governance (application of international account-
ing standards, protection of shareholders, public availability of accurate company in-
formation).
4. Existence and implementation of a coherent, effective and transparent set of laws
which ensure the respect of property rights and the operation of a functioning bank-
ruptcy regime.

© THINK!DESK China Research & Consulting 2015 Seite 327
5. Existence of a genuine financial sector which operates independently from the State
and which, in law and practice, is subject to sufficient guarantee provisions and ade-
quate supervision.
In order to attain MES status in 2016 or at any time in the future, China must therefore satisfy
all the above criteria cumulatively. According to the latest EU examination of China’s fulfil-
ment or non-fulfilment of these MES criteria in 2011, only the second criterion was found to
have been met as the “absence of barter trade and absence of state-induced distortions in
the operations of enterprises linked to privatisation”35 was postulated. This statement recon-
firmed a finding already made in 2004. But the 2011 Commission Report did not find any
progress towards MES with regard to the other four criteria by the Chinese side during the
intermittent seven years. The following discussion will highlight some of the major parame-
ters underlying China’s failure to become accredited as a “market economy” by the EU.
7.1 MES-Criterion 1
MES-Criterion 1 requires a:
low degree of government influence over the allocation of resources and deci-
sions of enterprises, whether directly or indirectly (e.g. public bodies), for exam-
ple through the use of state-fixed prices, or discrimination in the tax, trade or cur-
rency regimes.
Compliance with this criterion implies that governments do not “exercise undue influence
over the allocation of economic resources in the economy or decisions of companies” – for
example by means of price fixing, obligations to produce for export, restrictions imposed on
exports of raw materials or subsidies for industrial inputs.
Comparing these requirements with the documentation provided in Parts I and II of this
Study, it must be concluded that China does not meet the provisions of the first MES criteri-
on. The data collected in the preceding chapters has clearly shown that Chinese government
bodies at all levels are exerting substantial direct and indirect influence on the resource allo-
cation in the Chinese economy as well as concrete decision making processes in Chinese
enterprises. Such influence is exerted by means of (i) an extensive set of planning docu-
ments, (ii) a broad array of policy programmes to promote or protect specific firms and sec-
tors, (iii) interventions in the price building mechanisms of markets for specific goods and
services, raw materials, production factors as well as the external value of the Chinese cur-
rency Renminbi. Furthermore, (iv) China features a state capitalist system that facilitates a
high degree of collusion (and even identity) between elites in the spheres of the Communist
Party, government and the corporate sector.
35
Cf.: European Parliament 2014 and EC 2012.

© THINK!DESK China Research & Consulting 2015 Seite 328
7.2 MES-Criterion 2
MES-Criterion 2, defined as the
absence of state-induced distortions in the operation of enterprises linked to pri-
vatisation (i.e. “carry over” from the old system) and the absence of use of non-
market trading or compensation systems (such as barter trade)
has been assessed by the EC as having been met. In an appraisal conducted in 2004 EC
staff concluded that state induced distortions in the area of privatisation had been removed,
as had the practice of barter trade (SEC 2008) 2503, p.6.). Up to the present day this re-
mains the only criterion the EC assesses as having been fulfilled by China.36
7.3 MES-Criterion 3
MES-Criterion 3 focusses on the
existence and implementation of a transparent and non-discriminatory company
law which ensures adequate corporate governance (i.e. the application of interna-
tional accounting standards, protection of shareholders, public availability of ac-
curate company information).
In previous MES assessments, the EU applies this criterion in such a way that a state must
demonstrate that companies doing business in said economy are required to operate in
compliance with transparent and rigorous corporate governance legislation, i.e. are subjected
to international accounting standards and international standards for shareholder protection
and transparency.
China does possess quite comprehensive sets of laws and guidelines compelling firms to
uphold market oriented standards with regard to their corporate governance, accounting
practices as well as auditing requirements. These regulations are not one-to-one copies of
OECD regimes, but in general follow the ideas of “Western” market regulation. While the
formal set-up can therefore be understood to be broadly in line with the MES requirements,
their implementation in the day to day activities of commercial enterprises is not. As shown
extensively in chapters 2 and 3 of this study, Chinese firms are subjected to massive inter-
vention by government representatives as well as CPC cadres in their operations. This state-
business nexus undermines the willingness of these enterprises to comply with formal re-
36
European Parliament 2014 and De Gucht 2013.

© THINK!DESK China Research & Consulting 2015 Seite 329
quirements for corporate governance, accounting, shareholder protection as well as trans-
parency. They neither perceive these regulations as compulsory for themselves nor do they
see a necessity to, or benefit from, doing so. A broad body of practice-oriented as well as
academic literature documents the strong institutional incentives for, as well as substantial
empirical proof of, “managed” accounting information, inconsequential auditing exercises,
discrimination of minority shareholders, sub-standard transparency practices all caused by
the enterprise’s strong political connections.37 Given this stark contrast between formal regu-
lation and operational practice the authors of this study see MES criterion 3 as not being ful-
filled.
7.4 MES-Criterion 4
MES-Criterion 4 requires
the existence and implementation of a coherent, effective and transparent set of
laws which ensure the respect of property rights and the operation of a function-
ing bankruptcy regime.
In order to meet this criterion the EU expects (prospective) market economy countries to fea-
ture an effective legal infrastructure that in theory and practice ensures the protection of indi-
vidual property rights, in general, and intellectual property in particular, and furthermore facil-
itates orderly bankruptcy filings.
With the latest revision of the Chinese constitution in 2004, private property (of productive
assets, i.e. commercial enterprises) has – at least on paper – regained the same right of pro-
tection by the state as any other type of ownership. While this new norm is still in the process
of becoming fully implemented and respected by all parties concerned, other manifestations
of property still remaining mired in old regimes that discriminate against certain subjects. The
enforcement of intellectual property rights continues to be a field of consistent non-
compliance (WTO 2014). Even graver problems of un-transparency and discrimination in the
fact of the law are being reported by foreign invested enterprises in various fields of (local)
industrial policy programmes. The foreign invested enterprises complain about laws and im-
plementation guidelines not being published at all or being put into effect retroactively.
A similar constellation exists with regard to the issue of corporate bankruptcies. While a
bankruptcy law is in existence since 1986 (substantially revised in 2007; see chapter 2.4.3.2
for details), its implementation is not yet fully realised. This reality has prompted the IMF in its
2014 Chapter IV Consultation Staff Report to the Chinese government to declare:
37
See for example: Fan, Joseph P.H., Feng Guan and Zhengquan Li, Yong George Yang 2012; Firth, M., O. M. Rui, W. Wu 2011; Gul, K., J. Kim and A. Qiu 2010; Piotroski, J., T. J. Wong 2013; Walter, Carl E. and Fraser Howie 2012.

© THINK!DESK China Research & Consulting 2015 Seite 330
Removing implicit guarantees also requires greater tolerance of corporate de-
faults and bankruptcies, including of SOEs. […] Needed reforms include opening
up to full and fair competition activities currently reserved to SOEs, properly pric-
ing finance and other factor inputs, requiring adequate dividend payments to the
budget, and imposing hard budget constraints. The latter means that those SOEs
that cannot compete successfully on a level playing field should exit. (IMF 2014,
p. 12)
Obviously the Chinese bankruptcy regime is not yet fully functional – not the least, because
the Chinese state-owned enterprise sector continues to exist in a government protected
niche, and is not exposed to the full competitive forces of the market.
On the basis of the information compiled in this study, the authors see China as not fulfilling
the requirements of the fourth MES criterion.
7.5 MES-Criterion 5
MES-Criterion 5 asks for
the existence of a genuine financial sector which operates independently from the
State and which, in law and practice, is subject to sufficient guarantee provisions
and adequate supervision.
In determining compliance with this MES-criterion, the EU expects governments to be able to
demonstrate that the national financial sector operates free from (discretionary) governmen-
tal interference and the cost of capital (i.e. first of all: interest rates) are determined by market
principles. Furthermore the market conformity of the exchange rate system is scrutinised.
The Chinese financial sector is – on paper – operating according to capitalist principles of
profit orientation and risk containment. By law Chinese bank managers have become indi-
vidually liable for the extension of loans to (state-owned) enterprises which do not fulfil cer-
tain minimum criteria of credit worthiness. At the same time, however, the state is intervening
directly in the credit allocation and forces banks to provide loans to enterprises hand-picked
by the government. The intensity of China’s governmental guidance of the financial sector
and its loan decisions usually becomes most apparent in times of crisis. In the height of the
Subprime/Lehman crisis, for example, Chinese government not only issued a set of Adjust-
ment and Revitalisation Plans in order to provide support to key strategic industries. At the
same time the People‘s Bank of China and the China Banking Regulatory Commission jointly
promulgated a complementary Guiding Opinion concerning the further strengthening of credit
structure adjustment to promote a stable development of the national economy. In article 1
the Guiding Opinion decrees that:

© THINK!DESK China Research & Consulting 2015 Seite 331
Financial institutions must, according to the requirements of the respective indus-
trial policy guidelines and according to the particular needs of the special pro-
jects, actively come up with new financial products and service arrangements. Fi-
nancial institutions are to increase the necessary financial support and implement
all relevant financial support and services tasks (PBOC & CBRC 2009).
The Chinese financial sector is not operating independently from the Chinese state, but is
subjected to far reaching governmental intervention in its operations. The documentation in
Parts I and II of this study has provided a multitude of proof and examples of the heavy
handed intervention of Chinese state agencies in the allocation and pricing of loans and capi-
tal in general in the Chinese financial system. As such the Chinese financial system does not
base its business decisions on standard market principles of profit orientation and risk man-
agement, but relies on the steering, and simultaneously protecting, power of Chinese gov-
ernment. One major underlying reason for this reality clearly lies in the still incomplete mar-
ketisation of China’s state-owned enterprise sector. For as long as these SOEsenjoy a privi-
leged, shielded existence, the financial sector cannot mature into a normal market economy
financial sector. This is one of the reasons the IMF recommends China to push state-owned
enterprise reforms forward, take further steps in establishing a more commercially oriented
financial system and establish an underlying market-based monetary policy framework (IMF
2014, WTO 2014).
7.6 MES – Summary assessment
Summarizing China’s compliance, or non-compliance, with the EU’s five MES-criteria, it be-
comes obvious that today’s Chinese economic system is still far from fulfilling four of the five
criteria:
Chinese government continues to wield substantial influence over the allocation of
resources and the behaviour of individual economic entities thereby relegating mar-
kets into a secondary role (criterion 1).
Chinese companies are embedded in close-meshed networks with representatives of
Chinese government as well as the CCP. These connections prevail over and distort
the existing OECD-style legal framework and result in non-market conforming corpo-
rate governance, accounting and transparency practices (criterion 3).
The Chinese laws for the protection of (intellectual) property rights as well as its bank-
ruptcy regime are not yet fully functional. As such “market” outcomes remain distorted
and discriminate against economic subjects relying on the principles of fair competi-
tion (criterion 4).

© THINK!DESK China Research & Consulting 2015 Seite 332
The Chinese financial sector does not operate independently from government, but
must comply with government directives for capital allocation. The price of capital nei-
ther reflects its true scarcity nor the varying degrees of risk involved in different trans-
actions (criterion 5).
The present Chinese economic system might be highly capital intensive in character, but its
institutional set-up and ordering mechanisms do not comply with the principles present in
competition based markets.
Furthermore, it also has be highlighted that a refusal by the EU to grant MES-status to China
based on China’s non-fulfilment of the criteria outlined above, must not be misinterpreted as
a protectionist measure on behalf of the EU. On the contrary, the welfare creating effects of a
highly fragmented global value chain – in which China should, and can, play an important
role – can only come into existence if the best entrepreneurial ideas and most competitive
enterprises are selected through the functioning of fair competition. Underperforming enter-
prises that are allowed to remain players in the global value chain due to political protection
and irregular cost structures harm global welfare and retard economic development and pro-
gress in all participating societies in all parts of the global economy.
The use of true market determined prices for determining whether there is dumping from non
market economies is the only way to calculate the true measure of dumping and to prevent
the distortions in the Chinese system from contaminating market based price setting in mar-
ket economies. Any other approach will harm EU industries and discriminate against enter-
prises and economies complying with the principles of fair competition-based market pro-
cesses worldwide.

© THINK!DESK China Research & Consulting 2015 Seite 333
8. IMPACT OF THE CHINESE ECONOMIC SYSTEM ON THE
VIABILITY AND EFFECTIVENESS OF THE GLOBAL MARKET
ORDER
This study has amply documented the institutional set-up and working principles of the Chi-
nese politico-economic system. As illustrated with an example in Box 12, Chinese firms are
subjected to and benefit from a broad array of governmental programmes and instruments
that detach these firms from the real market contexts and competitive pressures. The evi-
dence shows that the Chinese economy does not have the minimum requirements neces-
sary for a competition-based market economy as understood in OECD terms. Nor does Chi-
na meet the EU’s hands-on MES criteria as allowed by the WTO.
While China is free to choose the form of an economy that best suits its domestic situation,
problems arise when it engages in international economic exchanges involving economic
actors operating in different market contexts. Normal economic ordering regimes are always
based on a set of signals and incentives that, in equilibrium, are designed to coordinate the
interaction of the most number of factors. If one economy does not comply with the normal
signals and incentives distortions appear in every economy touched by it. The functionality of
national economic systems is impaired and contemporary welfare as well as dynamic devel-
opment impulses are lost.
In order to allow incompatible individual markets to continue to function in their own spheres,
institutional air-locks or buffers must be established that neutralise or contain the alien eco-
nomic signals and keep normal signalling intact.
China has been committed to the erection of such institutional air-locks between its domestic
economy and the global market place since it started to re-engage into the global division of
labour in the late 1970s. Specialized trading companies with monopolistic powers, import and
export cartels, trade quota systems, bonded export and foreign investment zones, foreign
investment catalogues, licensing systems for inward and outward bound investment activi-
ties, strict foreign exchange administration, current and capital account currency convertibility
restrictions, a managed (multiple) exchange rate system etc. all constitute such air-locks with
which the Chinese government has been trying to shield the domestic economy from un-
wanted external impulses.
On the other side, the community of competition-based market economies – including the EU
– has been trying to protect the integrity of their economic regime(s) from distorting influ-
ences emanating from the Chinese non-market system first of all by means of trade related
instruments like anti-dumping and countervailing duty measures. At the same time these
countries have been trying to uphold the basic principles of free movements of goods and
factors of production underlying their liberal market orders as far as possible. The will to up-
hold the principle of free market-based competition, while keeping restrictive institutional air-
locks to a minimum is in line with the general academic as well as philosophical concepts
© THINK!DESK China Research & Consulting 2015 Seite 334
underlying the concept of market-based competition. However, there exists the danger that
too few and ineffective air-locks put-up against alien economic regimes will undermine the
very functionality of these economies.
This chapter therefore takes a closer look at the potential disruptions an un-intermediated
exposure to the Chinese economic regime might have on the functionality of the European
competition-base market system, its capacity to create welfare and dynamically develop into
the future. The discussion starts with a view on the intensity with which the implementation of
trade related protective measures has been regarded as necessary in order to keep the Eu-
ropean market system in recent years (chapter 8.1). It continues with an analysis of econom-
ic transmission mechanisms by which non-market features in the Chinese economic regime
might interfere with the European market order (chapter 8.2).
8.1 Trade Defence Investigations Against China
According to WTO statistics, shipments originating from China have triggered the largest
number of trade defence investigations of all countries in recent years. Especially since 2005,
the number of anti-dumping and anti-subsidy cases has dramatically increased. This holds
true for both launched investigations as well as imposed measures. The rise in case num-
bers is driven by proceedings aiming at Chinese exports. This phenomenon has coincided
with a strong export growth performance by companies based in China. Threatened by im-
port competition perceived to be unfairly priced due to dumping or subsidization practices,
industry associations worldwide have sought protective tariffs.
In the following, WTO statistics will be employed to analyse the development of trade de-
fence action against Chinese imports. Unless noted otherwise, the reference period spans 19
years and six months: from January 1st, 1995 – the day the WTO protocol entered into force
– until the end of June 2014.

© THINK!DESK China Research & Consulting 2015 Seite 335
Box 12: Combination of Dedicated Programmes in the Governmental Promotion and
Steering of Specific Industries: The Case of Aluminium Extrusions
Dedicated government programmers for industry guidance are usually coming in bundles of
numerous specific measures designed to direct industries and particular sectors towards
specific goals. The various programmes constituting such programme-packages are set up,
administered and implemented by government organisations at various levels of hierarchy
and may therefore feature some inconsistencies and contradictions. But as governments at
lower levels of hierarchy must design their local programmes in line with the (general) ideas
outlined by national policies, contradictory signals to the corporate sector remain limited.
This box exemplifies this phenomenon by documenting dedicated programmes employed by
Chinese government organisations in order to provide guidance to the aluminium extrusion
sector. The account follows the facts established by the US Department of Commerce in its
“Countervailing Duty Investigation of Aluminium Extrusions from the People’s Republic of
China (PRC)” (2010, period of investigation 01.01.2009-31.12.2009). This investigation fo-
cusses on firms located in Guangdong province, thereby restricting the coverage of relevant
programmes to such implemented on the national as well as Cantonese level. Programmes
that might be set-up and implemented in other Chinese provinces and localities are not cov-
ered.
The following exemptions from normal tax payments based on specific features of the bene-
fitting firms or their business models are to be understood as general financial contributions
in the form of revenue forgone by the government which provide benefits to the recipient
corresponding to the respective savings.
1. Exemption from City Construction Tax and Education Tax for FIEs
The Circular Concerning Temporary Exemption from Urban Maintenance and Construction
Tax and Additional Education Fees for Foreign-Funded and Foreign Enterprises provides
local tax authorities with the capacity to exempt FIEs from the city maintenance and con-
struction tax (normal rate in urban areas: 7 percent on the amount of product tax, VAT,
and/or business tax actually paid by the taxpayer) as well as education fee surcharge (nor-
mal rate in urban areas: 4 percent on the amount of product tax, VAT, and/or business tax
actually paid by the taxpayer).
2. “Two Free, Three Half”-Income Tax Exemptions for FIEs
Pursuant to the Foreign Invested Enterprise and Foreign Enterprise Income Tax Law (1991)
FIE classified as “productive” and scheduled to operate for at least 10 years can be exempt-
ed from income tax in their first two profitable years and pay half of their applicable tax rate
for the following three years.

© THINK!DESK China Research & Consulting 2015 Seite 336
3. Preferential Tax Rates for FIE classified as High and New Technology Enterprises
As outlined in Circular of the State Council Concerning the Approval of the National
Development Zones for New and High Technology Industries and the Relevant Policies and
Provisions FIEs recognised as “High and New Technology Enterprises” (HNTE) and being
located in high and new technology parks can benefit from a reduced income tax rate of 15
percent.
The following programmes are designed in order to facility access to loans from the state-
owned banking sector at preferential terms and therefore function in the same way as “soft-
budget constraints” in centrally planned economies.
4. Policy Loans at Non-Market Conditions
It is established that loans received by the aluminium extrusion industry from the state-
owned commercial banking sector as well as from policy banks were made pursuant to gov-
ernment directives formulated in various planning documents (FYP, industry plans, guidance
catalogues, etc.; see chapter 2.1 of this report).
5. SME Interest Subsidy Grants for SME
Targeting the dynamic development of SME in the province of Guangdong in general, inter-
est subsidy grants are provided in order to promote and support SMEs. The SME Loan In-
terest Assistance Special Fund is administered by the Provincial Department of Finance and
the Guangdong Provincial SME Bureau.
6. SME-Bank Cooperation Project Interest Subsidies
SME eligible for programme participation and accepted by financial institutions as borrowers
are being provided with interest assistance by local government organisations, i.e. the pro-
vincial and city level Departments of Finance and the Bureaus of SMEs. Eligible SME must
possess “great potential” and manufacture key equipment, or pursue creative technologies,
or engage in advanced manufacturing activities backed by both the provincial and the corre-
sponding city government.
The following programmes provide beneficiaries with access to factors of production (ex-
cluding capital) and raw materials at preferential prices, thereby decreasing their general
cost of operations.
7. Tax-Refund of Land-Use Tax in a Specific Industry Zone
Firms locating in the Zhaoqing New and High-Tech Industrial Development Zone have been
subsidised by a one-time land-use tax refund resulting in a reduction of land-use tax actually

© THINK!DESK China Research & Consulting 2015 Seite 337
paid from five RMB per square meter to two RMB per square meter.
8. Provision of Land-Use Rights for Less Than Adequate Remuneration and Land-Use-
related Fee Exemptions in a Specific Industry Zone
Firms locating in the Zhaoqing New and High-Tech Industrial Development Zone and meet-
ing specific criteria with regard to size, technological status and export orientation receive
support by the Zone’s government. Supportive measures include the provision of land-use
rights at negotiated less than adequate remuneration, reduced payments to local resi-
dents/business displaced, discounts on construction application fees, exemptions from ad-
ministrative fees, and reductions in operational charges.
9. Provision of Land-Use Rights for Less Than Adequate Remuneration in a Specific
Industry Zone
Firms locating in South Sanshui Science and Technology Industrial Park (Foshan Municipal-
ity) are subsidised by the Zone’s government in form of access to land-use rights at negoti-
ated, less than adequate remuneration.
10. Provision of Primary Aluminium for Less Than Adequate Remuneration
Firms operating in the aluminium extrusion sector are able to source primary aluminium from
the domestic market at less than adequate remuneration. As documented above in box 13
“Transmission of Government-induced Price Distortions Between Sectors: The Case of the
Aluminium and Bicycle Industries” the domestic aluminium market is distorted by govern-
ment interventions and features an artificially low price level.
The following programmes are designed to promote industrial upgrading and technological
advances in manufacturing. Financial support by government organisations allows benefit-
ting firms to side-step financing and liquidity constraints faced by contenders operating in
true market environments.
11. Import Tariff and VAT Exemptions for Enterprises Using Imported Equipment in
Encouraged Industries
In order to guide industry development in a specific direction and promote technological up-
grading, FIEs and certain domestic enterprises are exempted from VAT and tariffs on im-
ported equipment used in their production so long as the equipment does not fall into pre-
scribed lists of non-eligible (low tech, environmentally hazardous, etc.) items. The pro-
gramme is administered on the national level by the National Development and Reform
Commission (NDRC) and the General Administration of Customs.

© THINK!DESK China Research & Consulting 2015 Seite 338
12. Grants from the Special Fund for Important Science and Technology Projects
Administered by the Guangdong Science and Technology Department grants handed out in
this programme are supposed to support major, generic, and key technology R&D in
Guangdong province and promote technology achievements and the diffusion of technologi-
cal knowledge in the local economy.
13. Grants from a Local Fund for Science and Technology Development
The Science and Technology Bureau of Foshan Municipality and the Finance Bureau of
Foshan Municipality provide grants to firms in order to foster local technological and eco-
nomic development.
14. Grants from a Provincial Fund for Fiscal and Technological Innovation
This programme is administered by the Provincial Department of Finance and Economic
and Trade Commission of Guangdong Province. It provides grants to firms for the purpose
of promoting technological and fiscal innovation.
15. Grants from a Provincial Science and Technology Bureau Project Fund
Universities and firms can receive grants from this fund, if they are seen as worthy of sup-
port for their contributions to industrial development and innovation in Guangdong province.
16. Grants from a Provincial Fund for Energy Saving Technology
Grants amounting to 200 RMB for every one metric ton (MT) of standard coal saved through
increased energy efficiency during a given year are handed out by Department of Finance
and the Economic Trade Commission of Guangdong Province. In order to be eligible for
inclusion in this programme firms must demonstrate annual energy savings equivalent to
2,000 MT of standard coal.
17 Provincial level tax offsets for R&D activities
Firms featuring R&D expenses incurred for developing new products and technologies that
cannot be treated as intangible assets can benefit from a 50 percent deduction of their R&D
expenses as a tax offset. For R&D expenses considered intangible assets, the tax offset can
be amortised based on 150 percent of the R&D expenses.
The following programmes function in such a way as to explicitly promote export activities
and global market penetration by benefiting firms.
18. Grants, Loans, and Other Incentives for Development of Famous Brands and China

© THINK!DESK China Research & Consulting 2015 Seite 339
World Top Brands
The provision of support for the establishment of “brand names” on the international markets
is administered discretionarily by local governments, which can employ grants, preferential
loans, or other measures in order to achieve their goals. The policy is coordinated on a na-
tional level by the central government’s Measures for the Administration of Chinese Top-
Brand Products, which inter alia require applying firms to provide information concerning
their export ratio as well as the extent to which their product quality meets international
standards.
19. International Market Exploration Fund for Small and Medium Sized Enterprises
This programme targets SMEs that are active in foreign trade and supports their future ex-
port activities. The costs and risks of operating in the international markets are reduced by
means of grants provided to firms documenting an already existing minimum proficiency in
export sales.
20. Export Rebate for Mechanic, Electronic, and High-Tech Products
Exports of mechanic, electronic, and high-tech products are eligible for specific government
grants.
21. Development Assistance in a Specific Industry Zone
Export-oriented firms locating in the Zhaoqing New and High-Tech Industrial Development
Zone have been eligible for a one-time development assistance grant from the Zone’s local
authority.
All programmes documented in this box artificially enhance the competitive standing of ben-
efiting firms vis-à-vis their international contenders. As such they obscure real competitive
strengths by global market contenders, distort market signals and twist the path of labour
division in the global value chain.

© THINK!DESK China Research & Consulting 2015 Seite 340
8.1.1 Anti-dumping Proceedings
In the reference period altogether 1,022 anti-dumping investigations have been initiated
against Chinese exports by WTO member countries – an average 52.4 new investigations
per year. This represents 22% of all anti-dumping cases handled worldwide.
The gap separating China from the second and third most frequent country targets is consid-
erable. The Republic of Korea and Chinese Taipei were subject of 341 and 258 cases re-
spectively.
The European Union has introduced 115 cases against imports from China but only ranks
third in the anti-dumping statistics – behind India (165 cases) and the United States (121
cases).
Worldwide, 33 new anti-dumping cases were opened against Chinese exports during the first
half of 2014. During 2013, the last year for which complete data is available, the number
stood at 75. This marked a slight decrease from the WTO’s all-time record of 78 cases com-
menced in a single year against a single country set by China in 2009 and 2010 respectively.
Except for China, the largest number of initiations against a single country in WTO history
was only 35. In 1999, exports originating in the Republic of Korea sparked 35 new cases.
31% of all anti-dumping investigations commenced worldwide during the first six months of
2014 targeted Chinese exports. This number marks a drop from 37% recorded in 2007. Apart
from China, the highest concentration of anti-dumping investigations ever, 11%, was reached
by the Republic of Korea in 2004 and 2012 as well as the U.S. in 2010.
One quarter of the 740 anti-dumping measures put into force worldwide since the start of the
WTO aim to protect national industries from dumped imports originating in China.
72% of investigations against Chinese exporters ended in affirmative dumping determina-
tions and resulted in the imposition of protective border measures. This rate is higher than
the WTO average of 64 percent. Affirmative determinations were made in 74 percent of cas-
es investigated by the European Union and 80 percent of cases investigated by both the
United States and India.
These three countries also account for 42 percent of anti-dumping measures imposed
against Chinese exports: India (132), the United States (97) and the European Union (85).
When excluding China from the picture, the largest number of cumulative measures that any
WTO member country has implemented to shield itself against dumped imports from any
other is 41. This is the number of all measures India has imposed against EU imports since
the beginning of the WTO.
32 percent of all new anti-dumping measures implemented worldwide in the first half of 2014
served to protect against alleged dumping by Chinese companies. This already represents a

© THINK!DESK China Research & Consulting 2015 Seite 341
reduction: In 2010, the share of new measures brought on against China was 10 percentage
points higher. Besides China, the United States (H1 2014: 11 percent) and the Republic of
Korea (2013: 11 percent) were confronted with the largest number of anti-dumping measures
across all year-country combinations.
47 percent of anti-dumping investigations and final measures imposed against Chinese ex-
ports have targeted just two sectoral areas: products of the chemical or allied Industries as
well as base metals and articles thereof. This is in line with the general pattern of all such
proceedings worldwide where the combined share of these sectors accounts for about 50
percent of investigations and measures respectively.
8.1.2 Anti-subsidy Proceedings
During the reference period 84 anti-subsidy investigations were initiated against Chinese
exporters of which 53 were concluded with an affirmative determination and resulted in the
imposition of protection measures. China was the target of about one quarter of all investiga-
tions and measures worldwide respectively.
However, this number greatly understates the role of China as suspected origin of subsidized
exports. Legal battles concerning the admissibility of concurrent anti-dumping and anti-
subsidy measures for the same product delayed the first anti-subsidy cases against China
until 2004. In April of that year, the Canada Border Services Administration (CBSA) initiated
the first China-oriented countervailing duty investigation (carbon steel screws). The proceed-
ing concluded just before the end of 2014 with a positive ruling. Protective tariffs were intro-
duced in the following year. The United State conducted their first countervailing duty investi-
gation in 2006 – targeting coated-free sheet paper. The first anti-subsidy investigation of the
European Union got underway in 2010, also focussing on Chinese exporters of various types
of fine paper.
With no anti-subsidy investigations and measures against Chinese exporters introduced be-
fore 2004, the time frame for the comparative review has to be adjusted accordingly. As such,
during the nine years and six months between January 2004 and June 2014, China account-
ed for 45 percent of investigations launched and 58 percent of border measures implement-
ed worldwide.
Over this period, seven countries have successively initiated a total 84 investigations against
Chinese exports. The EU handled only a small fraction of these cases (8), while the United
States (43), Canada (19) and Australia (10) together undertook 85 percent of investigations.
In each of the years 2007, 2008 and 2010, about 70 percent of anti-subsidy investigations
carried out worldwide were targeting Chinese exports. From 2011 onward, this share has
mitigated – averaging about 40 percent of the world total.

© THINK!DESK China Research & Consulting 2015 Seite 342
China clearly dominates the list of countries targeted as origins of subsidized exports. In
2012 and 2013, the share of measures directed at Chinese exports reached 80 percent and
77 percent respectively. However, the year 2008 witnessed a WTO record, as 91 percent of
all new protective tariffs introduced around the world served to compensate for government
subsidization in China.
WTO data indicates that since 1995 a total of 35 exporting countries and territories have
been targeted by countervailing duties in 193 instances. However, a pronounced concentra-
tion exists as only three out of the 35 were affected in more than ten cases. These are China
(53), India (34) and the EU (12).
Half of the 53 anti-subsidy measures ever introduced against China were implemented by
the United States. Canada, Australia and the EU account for the remaining instances. The
three economies took action in 15, 6 and 4 cases respectively.
Only 10 percent of EU countervailing duties maintained at the end of June 2014 were di-
rected at Chinese exporters. At 34 percent, this ratio is substantially higher for the United
States. However, the Canada Border Services Agency and the Australian Anti-Dumping
Commission confront China with 63 percent and 67 percent of anti-subsidy protection
measures in place.
63 percent of the investigations launched against Chinese exporters have resulted in protec-
tive border measures. This is well above the WTO average of 54 percent.
The sectoral distribution of both anti-subsidy investigations and measures show a striking
sectoral concentration of base metals and products thereof. On a global scale, 40 percent of
investigations and 47 percent of implemented border measures target this product category.
Cases which took aim at goods originating from China show a broadly similar picture. 51
percent of investigations as well as 57 percent of measures target base metals and articles
made from them.
China alone is subject to one third of all border measures instituted in this sector. The 30
cases make up 15.5 percent of all anti-subsidy measures imposed across time, countries
and sectors. As stated earlier, all countervailing duties against imports from China have been
imposed after 2005. By relating the 30 measures affecting base metal products of Chinese
origin, to the total of 83 measures implemented against all countries since 2005, we find a
proportion of 36 percent. Well over one third of all countervailing duty measures introduced
across the world since 2005 seek to protect against subsidized base metal products from
China.

© THINK!DESK China Research & Consulting 2015 Seite 343
8.2 Transmission Channels to and Impact of Chinese Non-Market Features
on Competition-Based Market Systems
As documented in Chapter 8.1, EU policy makers have in recent years seen substantial need
to take recourse to counter measures in order to shield the European market system from
alien, market-distorting impulses emanating from the Chinese economic system.
Such impulses are being created in the context of a considerable number of particular institu-
tional traits characterizing the Chinese politico-economic system. A non-exhaustive account
would have to list the following important features and transmission channels that endanger
the functionality of the European market system:
8.2.1 Price Distortions Emanating from the Chinese Economy
As documented in the preceding chapters, the division of labour and all business interaction
in the Chinese economic system are not based on competition-based scarcity prices. Gov-
ernment agencies are intervening in various different ways either (i) directly in the allocation
of resources and distribution of products, or (ii) indirectly in the determination of the prices
and conditions at which resources and goods are being exchanged. These interventions are
in many cases not happening in a non-discriminatory fashion, but rather target selected firms
or groups of firms operating in specific industries, featuring specific business models and/or
technological expertise, belonging to specific types of ownership, etc.
These interventions result in distortions of markets that do not remain contained within the
specific sector or market segment in which they have been instigated. Instead they permeate
through the economic system – along the value chain as well as across sectors. The result is
a set of “wrong” prices and signals about the existing scarcities and demand structures that
induce investment and consumption decisions by economic actors that are “wrong” and cre-
ate unsustainable economic structures which in the longer run must be corrected in order to
prevent a comprehensive break down of the economy. Such ex post corrections, however,
are extremely costly in terms of financial resources, corporate wealth, employment, and so-
cial welfare.
The negative effects of such distorted price signals are not contained within the Chinese
economy, but are being “exported” to the global market place, whenever such prices are al-
lowed to become the basis for business decisions on cross-border transactions. If this hap-
pens, the “wrong” prices emanating from the Chinese economic system will lead to a general
misdirection of resources, including
an over- or under-consumption of production inputs and goods,
investment decisions that are not in line with the true macro-economic requirements
as well as long-term sustainable economic growth and development.
© THINK!DESK China Research & Consulting 2015 Seite 344
At the same time the distorted “wrong” price signals lead
initially to a situation where not the most productive and cost-efficient firms are partic-
ipating in the respective value chains,
and eventually, to an inadequate selection of firms that are allowed to stay in the
market place or are rather forced to exit.
Box 13 highlights an example, how government induced price distortions in the Chinese alu-
minium sector travel along the value chain towards the bicycle industry and eventually hit the
European economy.
Box 13: Transmission of Government-induced Price Distortions Between Sectors:
The Case of the Aluminium and Bicycle Industries
The pattern by which government-induced price distortions are being transmitted throughout
the economy can be exemplified by the case of the Chinese bicycle industry.
The Chinese bicycle industry is under the scrutiny of European trade authorities since the
early 1990s. In 1993 a definitive anti-dumping duty of 30.6% was imposed on bicycles origi-
nating the PR China (Regulation (EEC) No. 2474/93), which was later extended to cover
certain bicycle parts as well. In 2005 the anti-dumping duty in force was increased to 48.5%
based on an interim review (Regulation (EC) No. 1095/2005). In 2013 this rate was recon-
firmed and extended to cover imports of bicycles and parts consigned from Indonesia,
Malaysia, Sri Lanka and Tunisia. The latter countries were found to be utilized by
Chinese firms as transshipment ports hiding the true (Chinese) origin of the bicycles
shipped. The measures are in force until 2018, when they will be reviewed (Regula-
tion (EU) No. 502/2013).
This assessment of an unfair market constellation, which is providing the Chinese bicycle
industry with unwarranted cost advantages vis-à-vis their international competitors is – inter
alia – based on the observation that important markets for inputs to the production of bicy-
cles are subjected to Chinese government interference and do not reflect the true market
structures of supply and demand. As aluminium and steel hold a share of about 20-25% of
the total cost arising in the production of a bicycle, distortions in these raw material markets
do have a significant impact on the overall cost structure of this sector.
Taking the aluminium market as an example, distortions are arising from the fact that:
The metal is traded exclusively on the Shanghai Futures Exchange (SHFE), to which access
is restricted to Chinese-registered companies and Chinese citizens only and which is con-
trolled by the China Securities Regulatory Commission (CSCR). The price setting mecha-

© THINK!DESK China Research & Consulting 2015 Seite 345
nism fails to mirror true scarcities as:
daily price fluctuations are limited to 4 % above or below the settlement price of the
previous trading day,
trading is conducted only until the 15th day of each month, i.e. conducted at low fre-
quencies,
futures contracts are limited to a duration of no more than 12 months,
Chinese State entities like the State Reserve Bureau participate in the market both
as selling and purchasing parties.
Adding to this set-up the fact, that physical deliveries are only allowed to be enacted in an
approved warehouse within China, it becomes clear that the SHFE is completely insulated
from the global market place. Price arbitrage between the global market places (especially
the worldwide benchmark, London Metals Exchange (LME), is not permitted. As such alu-
minium prices in China are existing in a secluded universe, where government interventions
can lead prices to any level deemed appropriate by government.
The price of aluminium ingots is furthermore subjected to governmental steering due to the
fact that embedded aluminium (e.g. aluminium being processed and becoming a constituent
of a bicycle) is being granted partial VAT refunds in case of export (at the time being the
refund rate for bicycles is 15%), while primary aluminium exports are eligible for no VAT
refunds at all. On the contrary, aluminium exports are subjected to a 17% export tax, provid-
ing further incentives to domestic aluminium producers not to export, but rather sell their
aluminium ingots on the domestic market. Given the high “fines” of exporting, even a de-
pressed price level on the domestic market (in comparison to the global market prices) con-
stitutes the best sales outlet in reach for the domestic producers. As a result, the supply of
comparatively cheap aluminium ingots in the domestic economy is artificially increased and
processing industries, like the bicycle sector, are put in an advantaged position.
8.2.2 Economies of Scale and Scope Created by Non-market Forces in the
Domestic Chinese Economy
The discussion in the preceding chapters has shown that interventions by Chinese govern-
ment in the business process as well as misdirected regulatory (in)activity have led to the
accumulation of production capacities in a considerable number of sectors. The production
capacities created have reached dimensions that are (way) beyond the needs of China’s
domestic as well as the global markets. Table 86 documents the domestic production capaci-
ties of Chinese firms in selected sectors as a multiple of domestic market demand as well as
in its relation to total EU market demand.

© THINK!DESK China Research & Consulting 2015 Seite 346
Table 86: Production Potential, Output and Capacity Utilization for Selected Products in 2014
Capacity
China Output China
Over-capacity
China
Overcapacity in %
Aluminium mln tons 36 28 8 27%
Calcium carbide mln tons 42 26 16 64%
Cement mln tons 3,400 2,476 924 37%
Coke mln tons 680 477 203 43%
Complete vehicles mln units 26 20 6 31%
Crude steel mln tons 1,160 823 337 41%
Crystalline silicon modules gigawatts 70 37 33 89%
Crystalline silicon batteries gigawatts 65 33 32 96%
Ethylene mln tons 26 17 9 53%
Melamine kton 2,300* 830 1125** 136%
Plate glass mln weight boxes
1,290 793 497 63%
Polysilicon gigawatts 23 15 8 51%
Note: *Name plate capacity; **Overcapacity for melamine production calculated based on maximal usable name plate capacity of 85%. Source: THINK!DESK research In functioning market economies the creation of overcapacities of such a magnitude would
automatically start a process of market consolidation in the run of which some firms would
leave the market and the least productive facilities would be eliminated. Due to the specific
constellation of the Chinese politico-economic regime, however, where (i) firms receive pro-
tection by local and central governments, (ii) the existing bankruptcy law is neither compre-
hensively specified nor fully enforced and (iii) profitability considerations do not constitute the
primary goal of many (state-owned) business leaders, this does not happen in the Chinese
economy. Instead firms and their production capacities continue to stay in the market.
In functioning market systems the emergence of overcapacities might trigger a period of in-
tense competition between firms, where products are not sold at full costs, but rather at pric-
es that cover the variable costs of production plus a fraction of the – sunk – fixed costs. As
with such a competitive strategy companies incur a continues stream of losses, such epi-
sodes are short and lead quickly to a consolidation of markets and a return to full cost price
quotations. In the Chinese environment, however, such irregular pricing phenomena are not
short-term occurrences, but rather persist for prolonged periods of time, as companies are
permitted to remain in the market despite of extended periods of negative business results.
Be it by means of subsidization, government directed business, preferential access to capital
and raw materials, energy, etc., governmental waiver of dividend payments, or other mecha-
nisms, these companies are in a position to sell their products for protracted periods of time
at prices that do not correspond to the costs accrued in their production.

© THINK!DESK China Research & Consulting 2015 Seite 347
Distorted supply-and-demand structures like this impact the welfare creating capacity of eco-
nomic regimes in various ways:
capital and resources are bound in unproductive usages and are not available for
other deployments,
depending on actual financing structures non-performing loans and bad assets are
accumulated in the financial sector or in public household budgets,
products for which overcapacities exist are sold at too low prices, resulting in over-
consumption and wrong investment decisions,
downstream products, which employ under-priced overcapacity-products in their pro-
duction, are sold at too low prices, resulting in over-consumption and wrong invest-
ment decisions,
foreign firms operating in such markets, where overcapacities abound and which at
the same time are subjected to regular market discipline, are driven out of the market,
irrespective of their factual competitive strength,
foreign firms operating in downstream sectors, but having no access to under-priced
overcapacity products, are driven out of the market, irrespective of their factual com-
petitive strength.
Global and European markets and business entities are negatively affected by distortions in
the Chinese economy resulting from persistent overcapacities whenever:
products for which overcapacities exist in China are sold at prices, that are discon-
nected from their actual (full) production costs, on the international markets,
downstream products, which employ Chinese under-priced overcapacity-products in
their production, are sold at artificially low prices on the international markets.
The effects of such behaviour on the global and European markets are manifold. They in-
clude:
an unsustainable over-consumption of said products,
a distortion of the relative scarcities (respectively the signalling of the latter) in the
market fabric resulting in a misallocation of respective resources and misleading in-
vestment activities,
a loss of profitability and eventually the demise of domestic companies operating ac-
cording to market discipline in the respective goods markets,
a loss of employment in all sectors affected by distorted prices, caused by Chinese
overcapacities,
a mid- to long-term loss of welfare in the economy and society.
Box 14 presents a case study of how massive overcapacities persisting in the Chinese econ-
omy impact on the European economy.

© THINK!DESK China Research & Consulting 2015 Seite 348
Box 14: Overcapacities and the Takeover oft he Global Markets: The Case of the Solar
Panel Industry
The stellar rise of production capacities in the Chinese solar panel industry during the first
decade of the 21st century is a case in point for the idiosyncrasies of Chinese industrial ca-
pacity building as well as the disastrous consequences wrought on firms active in this sector
world wide. Driven by cheap credit and strong central and local government promotion, huge
production capacities have been built up throughout China since the beginning of the centu-
ry. Between 2009 and 2011 alone Chinese production of solar panels again quadrupled,
resulting in a supply which by far surpassed domestic demand.
The imbalanced domestic supply and demand constellation drove Chinese producers to the
global markets which they flooded with extremely low priced products. Facing global prices
which year after year were further driven down by their Chinese competitors, many produc-
ers in Europe, North-America and elsewhere saw their business cases disappear and were
driven out of the market.
It has to be noted, that these non-chinese firms were forced to shut down, not the Chinese
producers. The latter were allowed to continue their operations even if the various subsidies
and promotional measures handed out by central and local state agencvies could not neu-
tralize operating losses and overall business results entered negative territory. Even “zom-
bie” firms – which in normal market enviroinments would have been forced to close down –
were kept afloat by banks that accepted debt-to-asset ratios of 75% and more as well as
local governments keen on keeping these companies in their constituencies and shielding
them from bankruptcy.
When anti-dumping duties charged by the EU and US investigations in 2012/13 forced a re-
orientation of the official Chinese policy towards the solar panel industry and serious consol-
idation efforts were started, it was far too late for many non-Chinese players. Chinese over-
capacities have since then come down, but the global market remains to be dominated by
Chinese firms, who successfully drove out their competitors in a capacity driven price war.
8.2.3 Government Induced Outward Reach of Domestic Enterprises
Against the backdrop of China’s rapid economic development in the last three decades and
an increasing maturity of Chinese enterprises, Chinese government agencies as well as cor-
porate leaders have started to strategize about stepping out of the domestic market. Conse-
quentially, in recent years they have put the pro-active exploration of global markets high up
on their agenda for corporate development. The idea is to project Chinese business models

© THINK!DESK China Research & Consulting 2015 Seite 349
on a global scale, control access to global product and supply markets and improve the
competitive positioning of Chinese companies vis-á-vis their international contenders.
The concept of internationalization of corporate business models and a pro-active integration
of business activities in a web of international assets constitutes a logical step of successful
corporate development and is fully in line with market based management studies and the
welfare economics of the international division of labour. However, this internationalization
must be based on internal resources and management skills – external resources must be
accessible on the basis of market principles only. In the context of the Chinese politico-
economic system, this pre-condition is not satisfied.
Chinese government is providing discretionary promotion for selected Chinese enterprises in
order to facilitate and promote their “going-out” strategies. These promotional programmes
range from the “standard” instruments of various subsidy disbursements via support for the
establishment of international marketing and brands via the provision of access to under-
priced capital and other inputs to the enrichment of foreign direct investment projects with
complementary Official Development Aid (ODA) disbursements in the target economies.
The government-induced enhancement of corporate capabilities for the internationalisation of
their business scope is directly and primarily impacting upon the global market place and
leads only to secondary distortions on the Chinese domestic market. Effects on the interna-
tional markets include the following:
access to and control of resources (natural resources, factors of production, etc.) by
firms that are not the most competitive and displacement of more productive players,
market penetration and value chain participation by firms that would not prevail in fair
competitive processes,
change of ownership titles of resourceful non-Chinese firms in the context of M&A
transactions by Chinese companies that without government support would not be in
a position to acquire the target firms.
Taken together these effects are not only having a negative effect on contemporary welfare
creation in the global market environment. They can also set up path-dependencies that lead
to long-term reductions in the productivity and welfare generation of the global division of
labour.
Box 15 documents an example of how interventionary activities by Chinese government facil-
itate and promote international operations of Chinese enterprises impact on the European
economy.

© THINK!DESK China Research & Consulting 2015 Seite 350
Box 15: Outward Foreign Direct Investment: The Case of the Putzmeister-Takeover
China has become one of the most dynamic outward investors globally. In recent years it
has ranked continously among the top-5 countries of origin for global FDI according to
UNCTAD statistics. The volume of Chinese annual outward FDI directed at the EU-28
member countries has increased five-fold to 14 billion euro in 2014 (Hanemann, Huotari
2015). The by far largest share of this volume is being invested by Chinese state-owned
enterprises.
A substantial number of these transactions comprise takeovers of European firms in finan-
cial distress. Interestingly, in a number of cases, the financial difficulties encountered by
these European firms find their roots in market distortions in China. The German machinery
producer Putzmeister, for example, used to be the undisputed global technology leader in its
industry (cement related pump technologies and other). Notwithstanding its leading role, it
came into financial distress as the largest market for this kind of products, China, was sys-
tematically protected against foreign market entrants. Putzmeister was prohibited from par-
ticipating in the economies of scale and scope to be generated in this market. In contrast its
Chinese firm Sany, which had based its own product portfolio on intensive re-engineering
efforts, was allowed to gradually monopolize the Chinese market and generate ample cash
reserves. Cash reserves which were eventually employed to takeover Putzmeister and es-
tablish it as the global R&D center of the company.
8.2.4 Distorted Comparative Advantages in China
Discretionary interventions of Chinese government in the economic process are in their ef-
fects not restricted to individual sectors and value chains, but also create significant macro-
economic repercussions. Especially distortions that are brought about at the level of the ex-
change rate, the factors of production as well as basic raw materials and energy resources
have the capacity to substantially change the revealed comparative advantages of the Chi-
nese economy vis-á-vis the rest of the world.
Governmental distortions at this scale massively impact on the logic of economic interaction
in the domestic economy and in consequence alter the positioning and role of the domestic
economy in the global division of labour. The impact of such a constellation on the global
economic system, its capability to coordinate economic interaction and create welfare as well
as its capability to distribute this welfare in a performance-based as well as equitable man-
ner, is profound. In comparison to a non-distorted situation this leads to:
an unsustainable allocation of resources and selection of investment projects that do
not reflect the best possible usage based on real scarcities,

© THINK!DESK China Research & Consulting 2015 Seite 351
a redirection of global investment flows based on “wrong” signals of national resource
endowments and competitive strengths,
a redirection of global goods flows and regional distribution of value chains reflecting
“wrong” scarcities and corporate strengths,
a restructuring of national current account balances.
These effects depress total economic productivity and eventually lead to
a global reduction of welfare created,
a reduction of global development dynamics,
altered regional participation in global value chains as well as economic development
dynamics,
a redistribution of global wealth and social welfare.
As can be deduced from the above, the impact of such a government induced distortion of
national comparative advantages on the remainder of the global economic community and
Europe in particular, is severe. What is at stake, is the economic viability of whole industrial
sectors as well as the livelihood of whole segments of the population featuring specific skill
patterns and labour market characteristics. Firms and labour that according to real market
structures are highly competitive and productive, face the danger of being displaced by eco-
nomic subjects artificially propped up by their government.
Box 16 illustrates this constellation with an example of distorted comparative advantages in
Chinese industry.

© THINK!DESK China Research & Consulting 2015 Seite 352
Box 16: Distorted Comparative Advantages: The Case of the Glass Fiber Industry
One out of many examples for distorted comparative advantages in the Chinese economy is
constituted by the glass fibre industry. In recent years capacities have been enlarged mas-
sively, so that today about 80% of total global glass fibre output is produced in China. These
volumes, however, cannot be fully absorbed in the domestic Chinese market. More than one
third of the Chinese glass fibre production is being exported, with Chinese exports com-
manding a share of about 40% of EU glass fibre imports.
This pattern of a global division of labour is not in line with the real comparative advantages
of the parties involved. The production of glass fibre is a capital intensive process that can-
not take recourse to China’s comparatively rich supply of cheap labour. Instead the industry
has been propped by Chinese government by means of highly subsidised access to finan-
cial capital and energy. For the Chinese producer China Fibreglass Co., Ltd. alone
THINK!DESK has been able to identify governmental subsidies amounting to 64,538,552
RMB just in the year 2011. Furthermore China’s leading glass fibre producers have been
allowed to profit from various tax reduction schemes, ranging from (i) preferential tax rates
for hi-tech firms, to (ii) 50% discounts on the share of income tax retained by the local au-
thorities, to (iii) preferential tax rates for firms in Shenzhen Special Economic Zone or in the
context of the Great Western Development Programme, and (iv) full refund of VAT on export
transactions. All these governmental interferences in the market process result in a reduc-
tion of the costs of capital for Chinese glass fibre producers and endow them with a com-
petitive advantage in the global market place that is not naturally theirs.

© THINK!DESK China Research & Consulting 2015 Seite 353
9. CONCLUDING ANALYSIS: A STATE CONTROLLED MARKET
SYSTEM DISTORTING THE GLOBAL MARKETS
This study has been prepared in order to take a closer look at the specific business environ-
ment in which Chinese firms are operating and to investigate the inter-relationship between
the Chinese economic system and the global market system. By analysing a very substantial
number of primary Chinese documents as well as secondary sources and academic studies
the report has been able to gain insights into the major principles guiding the operations of
Chinese firms as well as their inter-relationship with the Chinese Government and the Chi-
nese Communist Party. The roles of government and markets has been evaluated, indicating
only a secondary role for markets. Economic interaction and the allocation of goods and
rsources in the Chinese economy continue to be predominantly determined by a broad array
of governmental programmes, subsidy schemes and arrangements to punish or promote
specific behaviour. As a result, nearly fifteen years after accession to WTO the patterns of
economic interaction in the Chinese economy remain highly distorted and reflect neither the
true scracities of resources nor the competitive strengths of commercial enterprises.
One important observation this study has been able to make relates to the very close interre-
lationship between top managers of, for example the steel tubes and pipe industry and the
Chinese Communist Party as well as Chinese government agencies. It has been possible to
document that the borderlines between corporate management and state government as well
as Party leadership are blurred to such an extent that any truly independent and purely mar-
ket directed corporate behaviour is not possible. The fundamental characteristic of the Chi-
nese economic system should be understood to be a specific “Crony Capitalism with Chi-
nese Characteristics [where] the only way for entrepreneurs to succeed is to form special
relationships with political leaders, which allows them to either break the formal rules or to
obtain exclusive access to resources” (Bai/Hsieh/Song 2014, pg. 2)
The study has identified a large number of government policy programmes intended to pro-
mote (normatively determined) development of the Chinese industry and direct the economy,
as a whole as well as for specific industries, towards specific goals. These governmental
“industry design” activities have been shown to be based on a large array of subsidies and
preferential tax arrangements, which are handed out to firms complying with the wishes and
objectives of national and local governments. As these benefits are only available to domes-
tic enterprises and are awarded on a non-transparent, highly discretionary basis, this report
can confirm the state of affairs described in earlier studies dealing with the Chinese state-
busines nexus: Chinese firms do not operate in true market environment. The filed is not
level. And even against the background of recent reform announcementzs by the Xi/Li gov-
ernment, there seems to be no indication that this constellation might change in the near
future.

© THINK!DESK China Research & Consulting 2015 Seite 354
As observed by McNally:
“China is […] pursuing a policy package of refurbishing state capitalism. While a
degree of liberalization is likely to be undertaken, the major thrust is one of re-
vamping, restructuring and, ultimately, strengthening state control and guidance
over the political economy.” (McNally 2013, p. 45)
Taking this analysis one step further the study has looked at the interface between Chinese
and global markets. The study has beern able to identify a substantial number of mecha-
nisms by which Chinese government interferes in the transmission of signals on economic
strengths and competitiveness and also intervenes directly in the composition and intensity
of cross border activities. Ranging from distortions of the exchange rate to explicit subsidies
to preferential tax arrangements these governmental interventions distort the sectoral pattern
and product specific structure as well as absolute intensity of China’s integration in the global
division of labour. As a consequence, the role Chinese firms play in product specific global
value chains are not compatible with any comparative advantages in China or and the indi-
vidual firms’ true competitive strengths. While this allows Chinese firms to gain unsustifiably
large market shares and corresponding revenue income, other, actually more competitive
firms are being crowded out and must leave the market. In global perspective this results in
a reduction of global welfare in the present,
reduced dynamics for global economic development and growth and consequentially
reduced levels of global welfare in future periods,
a global redistribution of business activity and employment as well as tax-income
based state capacity.
In general Chinese government, firms and Chinese society as a whole are profiting from this
artificial redistribution of economic activity, while the rest of the world loses more than China
wins.
Against the results of this compehensive analysis of the working mechanisms of the Chinese
polit-economic system, this study has also undertaken an assessment of the the institutional
set up as well as state - business interacton in the Chinese economic system against the
benchmark of the MES criteria as set out by the EU and authorized by the WTO. The result
of this assessment shows that China does not meet the requirements that would warrant
awarding China the status of a “market economy”. In all four criteria, which are at stake, the
situation in China is still far away from the minimum standards of a competition-based market
system free of any discretionary governmental interferences. The authors of this report see
no substantial reason that could justify awarding China the MES-Status. The institutional set-
up as well as the pervasive nexus of the contemporary Chinese economic system with Chi-
nese government and the Chinese Communist Party prove its non-compliance with the work-
ing principles of a competition based market economy. This institutional discrepancy makes
the Chinese economic system incompatible with the established global market system. Any

© THINK!DESK China Research & Consulting 2015 Seite 355
un-mediated and un-controlled integration of the Chinese economic system into the global
division of labour constitutes a threat to the sustained functionality of the latter. As a conse-
quence this report comes to the conclusion that
the classification of China as a non-market economy constitutes a neces-
sary “air-lock” mechanism shielding the European market system from al-
ien, distorting influences. Only by withholding MES privileges and uphold-
ing the third-country-comparison methodology facilitated by treating China
as a non-market economy can the real scope of price distortions in China’s
factor of production and goods markets be reveiled and true level of dump-
ing be calculated. Any other approach will harm EU industries and discrim-
inate against firms and economies upholding the principles of fair competi-
tion-based market processes worldwide.
Only by guaranteeing a fair competitive process that selects the best players for participation
in the global value chain and weeds out those which are profiting from irregular practices,
can welfare be created on an equitable and sustainable basis – for all societies participating
– and dynamic economic development on a global scale be promoted.

© THINK!DESK China Research & Consulting 2015 Seite 356
REFERENCES
21st Century Business Herald, 01.10.2012, Does the ’10 Cities 1000 Vehicles’ Project have a Leak? 25 Demonstration Cities Accomplished 38 Percent of the Target, available from: http://www.21cbh.com/HTML/2012-1-10/1OMDY5XzM5NDQ1OA.html (ac-cessed: 10.02.2012) (in Chinese).
ACFIC – All-China Federation of Industry and Commerce, n. d., About us, available from: http://chinachamber.org.cn/ (accessed: 21.05.2015) (in Chinese).
ADB – Asian Development Bank, 2012, Growing beyond the Low-Cost Advantage. How the People’s Republic of China can avoid the Middle-Income Trap, Manila 2012.
Ahn, Dukgeun and Jieun Lee, 2011, Countervailing Duty against China: Opening a Pando-ra’s Box in the WTO System?, University of Michigan, Gerald Ford School of Man-agement Discussion paper no. 612, available from: http://fordschool.umich.edu/rsie/workingpapers/Papers601-625/r615.pdf (accessed: 10.03.2015).
Air China, n. d. Board directors, available from: http://www.airchina.com.cn/www/en/ html/index/ir/corporate_governance/1428/ (accessed: 15.04.2015).
Air China, n. d. Senior Management, available from: http://www.airchinagroup.com/en/about_us/senior_management/index.shtml (ac-cessed: 15.04.2015).
Aizenman, Joshua, 2015, The Internationalization of the RMB, Capital Market Openness, and Financial Reforms in China, City University of Hong Kong Research Centre for International Economics, Working Paper No. 2015001.
AmCham China – American Chamber of Commerce in China, 2015, AmCham China Mem-bers Seek Greater Cooperation with China on Agriculture, available from: http://www.amchamchina.org/article/13942 (accessed: 10.05.2015).
AmCham Shanghai – American Chamber of Commerce in Shanghai, 2015, China Business Report 2015, available from http://www.amcham-shanghai.org/ftpuploadfiles/Website/CBR/2015/2014-2015-China-Business-Report.pdf (accessed: 01.06.2015).
Anhui Province, 2011, Circular of the People’s Government of Anhui Province on Printing the 12th Five-year Programme for Industrial Development of Anhui Province, WanZheng 2011, No. 79 (in Chinese).
ANSI – American National Standards Institute, 16.06.2014, China Issues International Call for Testing and Certification Providers for Its CCC Mark Program, available from: http://www.ansi.org/news_publications/news_story.aspx?menuid=7&articleid=2078d6d7-83c2-4428-a517-3f74b1a88f35 (accessed: 10.05.2015).
Anyang City, 2011, Several Opinions of the People’s Government of Anyang City on Accel-erating the Development of the Automobile Industry, AnZheng 2011, No. 43 (in Chi-nese).
AutoQQ, 31.07.2012, Concluding Survey of the 10 Cities 1000 Vehicles Project for the Demonstration of New-energy Vehicles, available from: http://auto.qq.com/a/20120731/000262.htm (accessed: 15.02.2015) (in Chinese).
Bai, Chong-En; Hsieh, Chang-Tai; Song, Michael, 2014, Crony Capitalism with Chinese Characteristics, Preliminary Manuscript Version May 2014.
Bank for International Settlements, 2015, BIS Quarterly Review, March 2015, Basel: BIS.

© THINK!DESK China Research & Consulting 2015 Seite 357
Baoshan District, 2011, Administrative Measures for the Special Fund for Innovation in Sci-ence and Technology of Baoshan District (in Chinese).
BBC, 27.09.2013, Shanghai's free trade zone raises hopes, http://www.bbc.com/news/business-24283361 (accessed: 14.05.2015).
BBC, 19.06.2007, China building more power plants, available from: http://news.bbc.co.uk/2/hi/asia-pacific/6769743.stm (accessed: 14.02.2015).
Beijing City, 2009, Preferential Policies for Companies Located in the Beijing Economic and Technology Development Zone 2009 (in Chinese).
Benxi, 2014, Survey Report on the Condition of the Strategic Cooperation Framework be-tween the People’s Government of Benxi City and Benxi Iron and Steel Group, avail-able from: http://www.bxrd.gov.cn/page/topic_6/content/topic_6_content_8103_.html (accessed: 23.04.2015) (in Chinese).
Bloomberg, 08.04.2015, China CNR, CSR Shares Surge After Government Approves Merger, available from: http://www.bloomberg.com/news/articles/2015-04-08/china-cnr-csr-shares-surge-after-merger-wins-regulator-approval (accessed: 17.05.2015).
Bloomberg, 25.03.2015, Watchlist for China Financial Reforms in Market-Opening Campaign, available from: http://www.bloomberg.com/news/articles/2015-03-25/watchlist-for-china-financial-reforms-in-market-opening-campaign (accessed: 10.05.2015).
Bloomberg, 12.02.2015, PBOC Opens Up Capital Account for Companies in Shanghai Zone, available from: http://www.bloomberg.com/news/articles/2015-02-12/pboc-opens-up-the-capital-account-for-companies-in-shanghai-zone (accessed: 10.05.2015).
Bloomberg, 29.01.2015, China to Apply Some Shanghai Free-Trade Zone Policies Nation-wide, available from: http://www.bloomberg.com/news/articles/2015-01-29/china-to-apply-some-shanghai-free-trade-zone-policies-nationwide (accessed: 10.05.2015).
Bloomberg, 29.12.2014, Say Goodbye to ‘Made in China’, available from: http://www.bloombergview.com/articles/2014-12-29/welcome-to-the-era-of-chinese-outsourcing (accessed: 15.02.2015).
Bloomberg, 18.12.2014, China Currency Freedoms Beckon as Shanghai Offers Test, availa-ble from: http://www.bloomberg.com/news/articles/2014-12-18/china-currency-freedoms-beckon-as-shanghai-zone-offers-test-run (accessed: 10.05.2015).
Bloomberg, 12.12.2014, China to Set Up Three More Free Trade Zones After Shanghai, available from: http://www.bloomberg.com/news/articles/2014-12-12/china-to-set-up-three-more-free-trade-zones-after-shanghai (accessed: 10.05.2015).
Bloomberg, 11.03.2014, China approves trial for five new privately owned banks, available from: http://www.bloomberg.com/news/articles/2014-03-11/china-approves-trial-for-five-new-privately-owned-banks (accessed: 01.04.2015).
Bloomberg, 11.11.2013, China May Loosen Energy Price Controls After Planning Meeting, available from: http://www.bloomberg.com/news/articles/2013-11-11/china-may-loosen-energy-price-controls-after-planning-meeting (accessed: 15.04.2015).
Bloomberg, 23.08.2012, China’s Auto Joint Ventures Failing to Build Local Brands, available from: http://www.bloomberg.com/news/articles/2012-08-22/china-s-auto-joint-ventures-failing-to-build-local-brands (accessed: 10.05.2015).
Cai, Meina, Land for Welfare in China, working paper (unpublished).
Caixin, 12.10.2012, China’s Gini Index at 0.61, University report says, available from: http://english.caixin.com/2012-12-10/100470648.html (accessed: 12.01.2015).
Caixin, 2014, Time for Overhaul of China’s Land Market, available from: http://english.caixin.com/2014-01-22/100632179.html (accessed: 10.05.2015).

© THINK!DESK China Research & Consulting 2015 Seite 358
CASS – Chinese Academy of Social Sciences, 16.01.2015, During 2014 the amount of for-eign direct investment actually utilized grew by 1.7 percent, available from: http://ifb.cass.cn/show_news.asp?id=68697 (accessed: 10.05.2015) (in Chinese).
CBRC, 2006, Guiding opinions for commercial banks to improve and strengthen financial services to high and new technology enterprises, YinJianFa 2006, No. 94 (in Chi-nese).
CCCMC, 2010, Brief Introduction to CCCMC, available from: http://www.cccmc.org.cn/EnglishWeb/Company/CmcBrIntro.aspx (accessed 08.02.2014) (in Chinese).
Chen, Yanbin, 2014, The Economic Logic of Factor Market Reforms, in School of Economics, Renmin University of China (eds.), 2014, Analysis and Forecast of China’s Macro Economy (3rd Quarter of 2014) China’s Macro Economy in the Context of Downward Pressures and Stimulus, Beijing: Renmin University, p. 61-76.
Chengdu City, 2010a, Circular concerning the applications of enterprises from the new mate-rials industries for the provision of liquidity loans at subsidized interest rates (in Chi-nese).
Chengdu City, 2010b, Action Plan for the Commercialization of Electric Vehicles in Chengdu City (2010-2012), ChengBanFa 2010, No. 17 (in Chinese).
China Africa News, 11.08.2010, China’s Export Credit Agencies: Managing the Risk of Going Global, available from: http://chinaafricanews.com/chinas-export-credit-agencies-managing-the-risk-of-going-global/ (accessed: 15.06.2015).
China Briefing, 11.06.2014, A Complete Guide to Minimum Wage Levels Accross China 2014, available from: http://www.china-briefing.com/news/2014/06/11/complete-guide-minimum-wage-levels-across-china-2014.html (accessed: 13.04.2015).
China Briefing, 19.02.2014, Obtaining Land-use Rights for FIEs in China, available from: http://www.china-briefing.com/news/2014/02/19/obtaining-land-use-rights-for-fies-in-china.html (accessed: 10.05.2015).
China Business Review, 01.05.2010, Can China’s government procurement market be cracked, available from: http://www.chinabusinessreview.com/can-chinas-government-procurement-market-be-cracked/ (accessed: 10.05.2015).
CCTV – China Central Television, 2012, Most know about the 18th national party congress, available from: http://news.cntv.cn/special/Diagram/01/index.shtmlhttp://news.cntv.cn/special/Diagram/01/index.shtml (accessed: 29.01.2015) (in Chinese).
China Daily, 05.01.2015, China lifts price controls on 24 commodities, services, available from: http://www.chinadaily.com.cn/china/2015-01/05/content_19236054.htm (ac-cessed: 15.04.2015).
China Daily, 17.09.2014, Top 10 Chinese enterprises in 2014, available from: http://en.people.cn/business/n/2014/0917/c90778-8783821.html (accessed: 20.05.2015).
China Daily, 26.11.2012, New Baojun-brand plant for GM joint venture, available from: http://www.chinadaily.com.cn/business/2012-11/26/content_15961779.htm (accessed: 10.05.2015).
China Daily, 18.06.2008, AVIC I & II closer to merger, available from: http://www.chinadaily.com.cn/bizchina/2008-06/18/content_6772893.htm (accessed: 17.05.2015).

© THINK!DESK China Research & Consulting 2015 Seite 359
China Daily, 08.05.2007, Wen calls for reduction in pollution, available from: http://www.chinadaily.com.cn/china/2007-05/08/content_867261.htm (accessed: 12.02.2015).
China Economic Watch, 14.02.2013, Beijing’s 2015 Industry Consolidation Targets: Problem or Solution?, available from: http://blogs.piie.com/china/?p=2303 (accessed: 17.05.2015).
China National Radio Online, 26.09.2014, The PM 2.5 concentration drops by 10.5% - Export: Supervision is key, available from: http://finance.cnr.cn/jjpl/20140926/t20140926_516509864.shtml (accessed: 03.02.2015) (in Chinese).
Chinanews.com, 2015, Hidden rules help steel product exports as export VAT rebate policy of boron added steel products cancelled, available from: http://finance.chinanews.com/cj/2015/03-04/7099668.shtml (accessed: 09.03.2015) (in Chinese).
Chongqing City, 2015, Circular on the organization and launch of project application work for 2015 industrial rejuvenation and technology renovation projects in Chongqing Munici-pality (in Chinese).
Chongqing City, 2012, Guidance Catalogue for Focussed Purchasing of Supported Goods, YuJingXinFa 2012, No. 91 (in Chinese).
Chongqing City, 2011, Circular concerning Reporting on Funding Support for Projects in the context of Establishing Fund Management for Foreign Trade Common Service Plat-forms in 2011, available from: http://www.ft.cq.cn/old/zwgg/17193.htm (accessed: 13.03.2015) (in Chinese).
CISA – China Iron and Steel Association, n. d., about us, available from: http://www.chinaisa.org.cn/gxportal/DispatchAction.do?efFormEname=ECTM40&key=CmkIN1oxVDVWNw84VDMEZQNnAWIDZwA3X2wCMVQ0UmcFFgpFW0BVZwARD0gCFVAw (accessed: 21.05.2015) (in Chinese).
CNBC, 06.08.2014, China anti-trust regulator conducts new raids on Microsoft, Accenture, available from: http://www.cnbc.com/id/101898282 (accessed: 18.05.2015).
CPC, 2013, Full text of the Constitution of Communist Party of China, available from: http://english.cpc.people.com.cn/206972/206981/8188065.html (accessed: 20.02.2015).
CPC Central Committee, 2013, Decision of the Central Committee of the Communist Party of China on Comprehensively and Thoroughly Addressing Several Key Problems (in Chinese).
CSIS, 27.08.2007, Freeman Briefing – Issue in Focus: China’s “GoingOut” Investment Policy, available from: http://csis.org/files/publication/080527_freeman_briefing.pdf (ac-cessed: 12.06.2015).
CSPFTZ, 2015, About SHFTZ, available from: http://en.china-shftz.gov.cn/About-FTZ/Location/ (accessed: 10.05.2015).
CSPFTZ, n.d., Interpretation of the Measures for Administration of the China (Shanghai) Pilot Free Trade Zone, available from: http://en.china-shftz.gov.cn/Government-affairs/Laws/General/174.shtml (accessed: 14.05.2015).
De Gucht, Karel, 2013, Letter from Commissioner De Gucht responding to the correspond-ence received from a European association of manufacturing and services companies on granting MES to China and its implications for trade defence investigations, Ref. Ares(2013)3233151 - 11/10/2013.

© THINK!DESK China Research & Consulting 2015 Seite 360
Deloitte, 2014, China's Pilot Free Trade Zones, available from: http://www2.deloitte.com/cn/en/pages/tax/solutions/china-shanghai-pilot-free-trade-zone.html (accessed: 14.05.2015).
Dewey & Le Boeuf LLP, 2007, China's State-Directed Expansion in Oil Country Tubular Goods Case Study (October 2007).
Diplomat, The, 12.03.2014, China’s Interest Rate Liberalization Plans, available from: http://thediplomat.com/2014/03/chinas-interest-rate-liberalization-plans/ (accessed: 25.02.2015).
Dongguan City, 2010, Implementation Opinions on Promoting the Development of Key Technologies and Industrial Development for Electric Vehicles, DongFu 2010, No. 80 (in Chinese).
Dollar, David and Shangjin Wei, 2007, Das (wasted) Kapital – Firm ownership and invest-ment efficiency in China, NBER Working paper No. 13103.
Dow Jones Newswires, 2015, China Outstanding Total Social Financing at CNY122.86 Tril-lion End-2014, available from: http://www.nasdaq.com/article/china-outstanding-total-social-financing-at-cny12286-trillion-end2014-20150210-00118 (accessed: 15.04.2015).
DW – Deutsche Welle, 02.09.2014, Foreign firms feel 'targeted' in China's anti-monopoly drive, available from: http://www.dw.de/foreign-firms-feel-targeted-in-chinas-anti-monopoly-drive/a-17894827 (accessed: 18.05.2015).
DW – Deutsche Welle, 05.08.2014, Daimler's China office searched in anti-trust probe, avail-able from: http://www.dw.de/daimlers-china-office-searched-in-anti-trust-probe/a-17832304 (accessed: 18.05.2015).
DW – Deutsche Welle, 11.09.2014, China fines Volkswagen, Chrysler for price-fixing, availa-ble from: http://www.dw.de/china-fines-volkswagen-chrysler-for-price-fixing/a-17914370 (accessed: 18.05.2015).
Eaton, Sarah, 2013, Political Economy of the Advancing State: The Case of China's Airlines Reform, in: The China Journal, No. 69, p. 64-86.
EC – European Commission, 07.05.2015, Government Procurement in China, available from: http://madb.europa.eu/madb/barriers_details.htm?barrier_id=960027&version=8 (ac-cessed: 10.05.2015).
EC, 2014, Potentially Trade-restrictive Measures – Indentified in the context of the financial and economic crisis, 1 June 2013-03 June 2014, available from: http://trade.ec.europa.eu/doclib/docs/2014/november/tradoc_152872.pdf (accessed: 15.03.2015).
EC, 2012, Commission Staff Working Document Accompanying The Document Report From The Commission to the European Parliament 30th Annual Report from the Commis-sion to the European Parliament on the EU's Anti-Dumping, Anti-Subsidy and Safe-guard activities (2011) {COM(2012) 599 final}, SWD(2012) 346 final, Brussels.
EC, 2008, Commission Staff working document on Progress by the People's Republic of China towards graduation to Market Economy Status in trade defence investigations, Brussels, 19/09/2008 SEC(2008) 2503, p.6.
Economist, The, 31.01.2015, China’s Financial Diplomace – Rich but rash.
Economist, The, 17.01.2015, China in Africa – One among many.
Economist, The, 05.10.2013, The next Shenzhen?, available from: http://www.economist.com/news/china/21587237-new-enterprise-zone-could-spark-wider-market-reformsbut-only-if-bureaucrats-ease-their-grip (accessed: 14.05.2015).

© THINK!DESK China Research & Consulting 2015 Seite 361
Edin, Maria, 2003, State capacity and local agent control in China: CPC cadre management from a township perspective, in: China Quarterly, Vol. 173, pp. 35-52.
EIU - Economist Intelligence Unit, 2015, China: Government to clean up preferential invest-ment policies, March 24th 2015.Global Times, 20.05.2015, Analysts see disclosure as sign of progress toward launch, available from http://www.globaltimes.cn/content/922665.shtml (accessed: 25.05.2015).
EIU, 2010, China Hand Chapter 2 Trade February 2010, London: Economist Intelligence Unit.
Ernst & Young, 2014, Insights of China (Shanghai) Pilot Free Trade Zone, available from: http://www.ey.com/Publication/vwLUAssets/EY-FTZ-Interpretation-en/$FILE/EY-FTZ-Interpretation-en.pdf (accessed: 14.05.2015).
EUCCC, 2014a, European Business in China Position Paper 2014/2015, available from: http://www.europeanchamber.com.cn/en/publications-position-paper (accessed: 10.05.2015).
EUCCC, 2014b, European Chamber Press Release on the publication of the revised Foreign Investment Catalogue, available from: http://www.europeanchamber.com.cn/en/press-releas-es/2193/european_chamber_press_release_on_the_publication_of_the_revised_foreign_investment_catalogue (accessed: 10.05.2015).
European Parliament, Directorate General for External Policies, 2014, Policy Department in-depth analysis: Trade and economic relations with China, Brussels.
Export.gov, n.d., China Compulsory Certification (CCC Mark), available from: http://export.gov/china/doingbizinchina/eg_cn_027466.asp (accessed: 10.05.2015).
Fan, Joseph P.H., Feng Guan and Zhengquan Li, Yong George Yang, 2012, Relationship Networks and Earnings Informativeness: Evidence from Corruption Cases, in: Journal of Business & Accounting, Vol. 41/7,8, pp. 831-866.
Finanznachrichten, 29.06.2006, China Govt Interference Remains Problem for Bank – CCB Chairman, available from: http://www.finanznachrichten.de/nachrichten-2006-06/6635881-china-govt-interference-remains-problem-for-banks-ccb-chairman-020.htm (accessed: 05.01.2015).
Firth, M., O. M. Rui, W. Wu, 2011, Cooking the book: recipes and cost of falsified financial statements in China, in: Journal of Corporate Finance, vol. 17, pp. 371-390.
FlightGlobal, 17.06.2008, China to ‘re-merge’ AVIC I and AVIC II, available from: https://login.flightglobal.com/?ReturnUrl=http://pro.flightglobal.com/news/articles/china-to-quotre-mergequot-avic-i-and-avic-ii-314320/ (accessed: 17.05.2015).
Forsythe, Michael, 13.10.2010, China Inc., in Bloomberg Markets Magazine, October 2010.
Fortune, 2014, Fortune Global 500 List, available from: http://fortune.com/global500 (ac-cessed: 20.05.2015).
Freshfields Burckhaus Deringer, 2014, MOFCOM blocks the proposed P3 Network shipping alliance, http://www.freshfields.com/en/knowledge/MOFCOM_blocks_the_proposed_P3_Network_shipping_alliance/?LangId=2057 (accessed: 18.05.2015).
FT – Financial Times, 26.05.2015, China currency is ‘no longer undervalued’, says IMF, available from: http://www.ft.com/intl/cms/s/0/11e96e1e-03a7-11e5-b55e-00144feabdc0.html (accesed: 27.05.2015).

© THINK!DESK China Research & Consulting 2015 Seite 362
FT, 23.04.2015, China’s state enterprise reform: Bigger, yes, but better?, available from: http://www.brookings.edu/research/opinions/2015/04/23-chinas-state-enterprise-reform-leutert (accessed: 17.05.2015).
FT, 03.11.2014, China’s antitrust fines for foreign car companies fail to stall growth, http://www.ft.com/cms/s/0/f7bbeaa2-4a4d-11e4-bc07-00144feab7de.html#axzz3azLw6SYn (accessed: 18.05.2015).
FT – Financial Times, The, 05.05.2014, China’s indigenous brand policy backfires, available from: http://www.ft.com/intl/cms/s/0/02756814-cc5a-11e3-9b5f-00144feabdc0.html (accessed: 10.05.2015).
FT – Financial Times, The, 29.09.2009, The party organiser, available from: http://www.ft.com/intl/cms/s/0/ae18c830-adf8-11de-87e7-00144feabdc0.html (ac-cessed: 20.05.2015).
Fujian Province, 2006, Medium and Long-term Plan for the Development of Science and Technology for Fujian Province (2006-2020), available from: www.fjkjt.gov.cn/fjkjt_if/image/62910.doc (accessed: 21.05.2015) (in Chinese).
Fung, W., 2007, Policy-Oriented vs. Market-Oriented Bankruptcy: A Tour on the PRC New Enterprise Bankruptcy Law, available from: http://www.lehmanlaw.com/fileadmin/lehmanlaw_com/Publications/Policy-Oriented_vs._Market-Oriented_Bankruptcy__WF__01282007__ABA_.pdf (accessed: 15.03.2015).
GAC, 2008, Catalogue of Imported Products not subject to Tax Exemption in Foreign In-vestment Projects, Report 2008, No. 65 (in Chinese).
Gansu Province, 2013, Decision of the People's Government of Gansu Province on Com-mending Financial Institutions and Financial Companies for the Outstanding Support for Economic and Social Development in Gansu Province in 2012 (in Chinese).
Gansu Province, 2012, Decision of the People's Government of Gansu Province on Com-mending Financial Institutions and Financial Companies for the Outstanding Support for Economic and Social Development in Gansu Province in 2011 (in Chinese).
Gansu Province, 2011a, Plan on Accelerating the Development and Cooperation of Industrial Enterprises (in Chinese).
Gansu Province, 2011b, Guiding Opinions of the People’s Government of Gansu Province on Promoting Industrial Leapfrog Development, GanZhengFa 2011, No. 17 (in Chi-nese).
Gansu Province, 2010a, Notice of the General Office of the People’s Government of Gansu Province on Publishing the Development Plan for Regional Economic Integration of the Jiuquan-Jiayuguan Area, GanZhengBanFa 2010, No. 160 (in Chinese).
Gansu Province, 2010b, Medium and Long-term Plan for Developing Talent in Gansu Prov-ince, available from: www.gs.osta.org.cn/htm/531/163938.html (accessed: 21.06.2015) (in Chinese).
Gansu Province, 2006, Medium and Long-term Plan for the Development of Science and Technoloogy for Gansu Province (2010-2020), available from: www.gansuinfo.gov.cn/doc/2009_03/6.pdf (accessed: 21.05.2015) (in Chinese).
Gao, Hang, 2013, Factor market distortions in China’s manufacturing industry, paper pre-sented at the Joint conference on Inequality, Growth and the Middle-Income Trap in China, Stockholm China Economic Research Institute, Stockholm School of Econom-ics, China Center for Economic Research and the national School of Development of Peking University held in Beijing, 1-2 July 2013.
© THINK!DESK China Research & Consulting 2015 Seite 363
Gasgoo, 01.09.2012, 10 Cities 1000 Vehicle Project Survey: Some Cities Come Last, availa-ble from: http://auto.gasgoo.com/News/2012/09/010119371937864.shtml, (accessed: 30.03.2015) (in Chinese).
Geng, Nan and N’Diaye, Papa, 2012, Determinants of Corporate Investment in China: Evi-dence from Cross-Country Firm Level Data, IMF Working Paper WP/12/80, Washing-ton.
Germany Trade & Invest, 2015, Wirtschaftsdaten kompakt (various countries), available from: http://www.gtai.de/GTAI/Navigation/DE/trade.html (accessed: 15.04.2015).
Gilley, Bruce and Andrew J. Nathan, 2002, China's New Rulers: The Path to Power, New York Review of Books, Volume 49, Number 14.
Global Subsidies Initiative, 09.02.2010, China agrees to eliminate famous brand subsidies to end WTO dispute, available from: http://www.globalsubsidies.org/en/subsidy-watch/analysis/china-agrees-eliminate-famous-brand-subsidies-end-wto-dispute (ac-cessed 05.04.2015).
Global Times, 20.05.2015, Analysts see disclosure as sign of progress toward launch, avail-able from http://www.globaltimes.cn/content/922665.shtml (accessed: 25.05.2015).
GOSC, 2010, Several opinions concerning further strengthening energy conservation and emissions reduction efforts and accelerating the structural adjustment of the iron and steel industry, GuoBanFa No. 34 (in Chinese).
GOSC, 2009, Circular on Further Strengthening the Administration of Government Procure-ment Work, GuoBanFa 2009 No. 35 (in Chinese).
GOSC, 2006, Circular of the General Office of the State Council on forwarding the guiding opinions of the State-owned Asset Supervision and Administration Commission on promoting the restructuring of state assets and the consolidation of state-owned en-terprises, GuoBanFa 2006, No. 97 (in Chinese).
GOSC, 2003, Circular of the General Office of the State Council on Promulgating Regulation on the Main Functions, Internal Institutions and Staffing of the China Banking Regula-tory Commission, GuoBanFa 2003, No. 30 (in Chinese).
Greenpeace, 23.02.2015, Comment: New coal power plants in China – a (carbon) bubble waiting to burst, available from: http://energydesk.greenpeace.org/2015/02/23/comment-new-coal-power-plants-china-carbon-bubble-waiting-burst/ (accessed: 27.02.2015).
Guardian, The, 03.04.2015, Chinese Former Security Tsar Zhou Yongkang Charged in Cor-ruption Case, available from: http://www.theguardian.com/world/2015/apr/03/china-security-tsar-zhou-yongkang-charged-corruption (accessed: 30.04.2015).
Guangdong Province, 2014, Circular on project applications for the 2014 cutting edge and key technology innovation special fund (major provincial science and technology pro-jects), YueKeHanGuiCaiZi 2014, No. 1454 (in Chinese).
Guizhou Province, 2013, Medium and Long-term Plan for the Development of Science and Technology for Guizhou Province (2013-2020), available from: http://www.gz.hrss.gov.cn/art/2014/9/9/art_31_2289.html (accessed: 21.05.2015) (in Chinese).
Gul, K., J. Kim and A. Qiu, 2010, Ownership concentration, foreign shareholding, audit quali-ty, and stock price synchronicity: evidence from China, in: Journal of Financial Eco-nomics, Vol. 95, pp. 425-442.
Guo et al., 2009, Measuring Income Inequality: Based on average growth point of GINI Coef-ficient, Caijing Theory and Practice, Vol. 5, No. 30, p. 81-85.

© THINK!DESK China Research & Consulting 2015 Seite 364
Haley Usha C. V., 2013, Subsidies to Chinese Industry: State Capitalism, Business Strategy and Trade Policy, Oxford: Oxford University Press.
Haley, Usha C. V. and George T. Haley, 2008, Shedding light on Energy Subsidies in China – Analysis of China’s Steel Industry from 2000-2007, available from: http://www.americanmanufacturing.org/research/entry/shedding-light-on-energy-subsidies-in-china (accessed: 03.01.2015).
Hanemann, Thilo; Huotari, Mikko, 2015, Chinesische Direktinvestitionen in Deutschland und Europa. Eine neue Ära chinesischen Kapitals, Eine Studie des Mercator Institute for China Studies und der Rhodium Group, Berlin.
Hangzhou City, 2012, Circular of the General Office of the People’s Government of Hang-zhou City on Publishing Standards for the Government Procurement Catalogue in 2012, HangZhengBanHan 2012, No. 9 (in Chinese).
Hebei Daily, 05.05.2013, Hebei Province Invests 300 million to Support Technology Upgrad-ing in the Steel Industry during the 12th Five-Year Program, available from: http://www.gov.cn/gzdt/2013-05/05/content_2396015.htm (accessed: 03.10.2014) (in Chinese).
Hebei News, 15.11.2014, Hebei Province vigorously promotes transfers abroad for three large industries with overcapacities, available from: http://hebei.hebnews.cn/2014-11/15/content_4317418.htm (accessed: 16.01.2015) (in Chinese).
Hebei Province, 2012, Circular concerning Doing Well the Administration of Funds for Estab-lishing Foreign Trade Common Service Platforms in 2012, JiCaiQi 2012, No. 96 (in Chinese).
Hebei Province, 2011, Circular concerning Doing Well the Administration of Funds for Estab-lishing Foreign Trade Common Service Platforms in 2011, available from: http://www.fsou.com/html/text/lar/173020/17302044.html (accessed: 14.03.2015) (in Chinese).
Heberer, Thomas and René Trappel, 2013, Evaluation Processes, Local Cadres’ Behaviour and Local Development Processes, in: Journal of Contemporary China, Vol. 22/48, pp. 1048-1066.
Heilongjiang Province, 2006, 11th FYP of Heilongjiang Province for the development of the equipment manufacturing industry (in Chinese).
Henan Province, 2015, Circular on the organization and launch of the recommendation work for the 2015 Prize for Accomplishments in Science and Technology in Henan Prov-ince, YuGongXinBanKe 2015, No. 83 (in Chinese).
Henan Province, 2009, Circular on recommendations for the 2009 Prize for Industry and In-formation Technology Commercialization in Henan Province (in Chinese).
Herd, Richard, Charles Pigott and Sam Hill, 2010, China’s Financial Sector Reforms, OECD Economics Department Working Papers No. 747, available from: http://www.oecd.org/officialdocuments/publicdisplaydocumentpdf/?doclanguage=en&cote=eco/wkp(2010)3 (accessed: 02.02.2015).
HIS – Humane Society International, 30.06.2014, China Implements Rule Change in First Step Towards Ending Animal Testing of Cosmetics, available from: http://www.hsi.org/news/press_releases/2014/06/china-implements-rule-change-063014.html (accessed: 10.05.2015).
Huang, Yiping, 2010a, Dissecting the China Puzzle: Asymmetric Liberalization and Cost Dis-tortion, in Asian Economic Policy Review, 2010, No. 5, p. 281-295.

© THINK!DESK China Research & Consulting 2015 Seite 365
Huang, Yiping, 2010b, China’s Great Ascendancy and structural risks: Consequences of asymmetric market liberalization, in Asian Pacific Economic Literature, Vol. 24, No. 1, p. 65-85.
Huang, Yiping, 2010c, Cost Distortions and Structural Imbalances in China, in China & World Economy, Vol. 18, No. 4, p. 1-16.
Huang, Yiping, 2011, Will China become an engine of growth for the region?, in Ho, Lok Sang and John Wong (eds.), 2011, APEC and the rise of China, Singapore: World Scientific Publishing, p. 67-92.
Huang, Yiping and Kunyu Tao, 2011, Causes of and Remedies for the People’s Republic of China’s External Imbalances: The Role of Factor Market Distortions, Asian Develop-ment Bank Institute Working Paper No. 279.
Huangshi City, 2008, Guiding Opinions on Financial Support for the Good and Rapid Devel-opment of the Economy (in Chinese).
Hubei Province, 2012a, 12th FYP of Hubei Province for the Restructuring and Upgrading of Industry (in Chinese).
Hubei Province, 2012b, 12th Five-year Programme for the Development of Strategic Emerg-ing Industries of Hubei Province, E’ZhengFa 2012, No. 40 (in Chinese).
Hubei Province, 2010, Implementation Measures for the Adjustment and Revitalization Pro-gramme for the Steel and Non-ferrous Metals Industries of Hubei Province (2009-2011) (in Chinese).
Hui, Dennis Lai Hang, 2013, The state and the development of corporate insolvency law in China and Russia - A comparative perspective, Asian Education and Development Studies, Vol. 2, No. 3, pp. 212-224.
Hunan Province, 2013a, Circular concerning Doing Well the Administration of Funds and Reporting Work for Establishing Foreign Trade Common Service Platforms in 2013, XiangShangMaoFa 2013, No. 29 (in Chinese).
Hunan Province, 2013b, Situation Report on the Establishment of Foreign Trade Common Service Platforms in Hunan Province, available from: http://zdqy.hunancom.gov.cn/Modules/xinxi.aspx?GUID=1772e7ad-cb44-4ed5-bf4f-46565499b18a&WaiWangLanMuID= (accessed: 15.03.2015) (in Chinese).
Hunan Province, 2013c, Guidance Catalogue for the development of major key technologies in strategic emerging industries in Hunan Province, XiangTuiXinGongBan 2013, No. 13 (in Chinese).
Hunan Province, 2010, Medium and Long-term Plan for the Development of Science and Technoloogy for Hunan Province (2010-2020), available from: http://www.hnleader.gov.cn/Index/ViewNews/?NewsID=10824153335 (accessed: 21.05.2015) (in Chinese).
Hunan Province, 2005, Notice concerning the promulgation of the preliminary measures of Hunan province for the administration of foreign trade and export development funds (in Chinese).
Huzhou City, 2011, Several Opinions of the People’s Government of Huzhou City concerning the Further Promotion of Industrial Transformation and Upgrading (in Chinese).
Huzhou City, 2010, Circular of the General Office of the People’s Government of Huzhou City concerning the Interim Measures for Evaluation and Administration of the Quality Award of Huzhou Municipal Government (in Chinese).
ICTSD – International Centre for Trade and Sustainable Development, 2011, EU Slaps Anti-Dumping, Countervailing Duties on Chinese Paper, Vol. 15, No. 18, available from:
© THINK!DESK China Research & Consulting 2015 Seite 366
http://www.ictsd.org/bridges-news/bridges/news/eu-slaps-anti-dumping-countervailing-duties-on-chinese-paper (accessed: 10.03.2015).
Ifeng, 13.01.2012, Standardization Project for New-energy Vehicles Hard to Set Off Sector Development, available from: http://auto.ifeng.com/news/domesticindustry/20120113/741651.shtml (accessed: 03.03.2015) (in Chinese).
IMF, 2014, People’s Republic of China: 2014 Article IV Consultation – Staff Report, Washing-ton DC.
in der Heiden, Peter, 2015, Development Perspectives of the Chinese Electric Vehicles, In: Campen, Antje et al.,2015, Future Mobility. Springer-Gabler Verlag, Wiesbaden (forthcoming).
in der Heiden, Peter and Markus Taube, 2011, China’s Iron and Steel Industry at the Global Market Interface: Structural Developments and Industrial Policy Interventions, in The Copenhagen Journal of Asian Studies, Vol. 29, No. 2, p. 110-142.
J. P. Morgan, 2014, China: The Path to Interest Rate Liberalization, available from: https://www.jpmgloballiquidity.com/blobcontent/837/78/1323398925294_WP-GL-China-The-path-to-interest-rate-liberalization.pdf (accessed: 20.05.2015).
Jiangsu Province, 2013a, Circular concerning Doing Well the Administration of Funds for Establishing Foreign Trade Common Service Platforms in 2013, SuCaiGongMao 2013, No. 154 (in Chinese).
Jiangsu Province, 2013b, Guideline for social development projects under the Science and Technology Support Plan for Jiangsu Province in 2013, SuKeJi 2013, No. 38 (in Chi-nese).
Jiangsu Province, 2012a, Circular concerning Doing Well the Administration of Funds for Establishing Foreign Trade Common Service Platforms in 2012, SuCaiGongMao 2012, No. 107 (in Chinese).
Jiangsu Province, 2012b, Circular of the Economic and Information Technology Commission of Jiangsu Province on Printing the 2012 Action Plan for New-energy Vehicles, SuJingXinChanYe 2012, No. 225 (in Chinese).
Jiangsu Province, 2010, Circular concerning the Release of the Provisional Measures for the Administration of Funds for Projects under Commercial Service Platforms, SuCaiQi 2012, No. 41 (in Chinese).
Jiangsu Province, 2009a, Outline of the Intellectual Property Strategy (in Chinese).
Jiangsu Province, 2009b, Administrative (trial) measures for the Key New Product Plan for Jiangsu Province, SuKeJi 2009, No. 106 (in Chinese).
Jiangsu Province, 2003, Several opinions of the People’s Government of Jiangsu Province on further supporting the development of economic opening, SuZhengFa 2003, No. 43 (in Chinese).
Jiaxing City, 2011, 12th five year programme for the development of industry of Jiaxing City (in Chinese).
Jiaxing City, 2007, Plan for the industrial development of Jiaxing Binhai New Area (in Chi-nese).
Jiayuguan City, 2011, Guiding Opinions on Expanding Bank Lending in 2011, JiaZheng-BanFa 2011 No. 59 (in Chinese).
Jiayuguan City, 2010, Guiding Opinions on Expanding Bank Lending in 2010, JiaZheng-BanFa 2010 No. 106 (in Chinese).

© THINK!DESK China Research & Consulting 2015 Seite 367
Jiayuguan City, 2008, Guiding Opinions on Expanding Bank Lending in 2008, JiaZheng-BanFa 2008 No. 66 (in Chinese).
Jilin Province, 2012, Circular concerning Organizing the Reporting on Establishing Fund Management for Foreign Trade Common Service Platforms in Jilin Province in 2012, available from: http://www.jldofcom.gov.cn/tzgg/201209/t20120907_1270313.html (accessed 14.03.2015) (in Chinese).
Jilin Province, 2011a, 12th Five-year Programme for Economic and Social Development of Jilin Province, JiZhengFa 2011, No. 6 (in Chinese).
Jilin Province, 2011b, Cultivation Plan for Strategic Emerging Industries of Jilin Province (2011-2015), JiZhengFa 2011, No. 22 (in Chinese).
Jingji Cankao Bao, 12.08.2009, Guangdong Province passes legislation to solve problems in government procurement, available from: http://jjckb.xinhuanet.com/gnyw/2009-08/12/content_174455.htm (accessed: 12.11.2014) (in Chinese).
Jinmu Guangming Co., Ltd, n. d., About us, available from: http://www.gmwmo.com/Aboutus.asp (accessed: 23.01.2015) (in Chinese).
Jiujiang City, 2009, Notice of the People’s Government of Jiujiang City concerning the publi-cation of the “Implementation opinions concerning the ‘six-one’ project for science and technology innovation promotion” (in Chinese).
Jiujiang City, 2008, Notice of the General Office of the People’s Government of Jiujiang City concerning the publication of the implementation plan for “six 800-1000 and three 300,000 tons” project (in Chinese).
King & Wood Mallesons, 2011, Out of China: The activities of China's export credit agencies and development banks in Africa, available from: http://www.kwm.com/en/uk/knowledge/insights/out-of-china-the-activities-of-chinas-export-credit-agencies-and-development-banks-in-africa-20140723 (accessed: 10.06.2015).
KPMG, 2014, Pilot Free Trade Zone Series — Regulation for China (Shanghai) Pilot Free Trade Zone has been released, China Tax Alert, Issue No. 22, available from: http://www.kpmg.com/CN/en/IssuesAndInsights/ArticlesPublications/Newsletters/ChinaAlerts/Pages/China-tax-alert-1408-22-Regulation-for-China-Shanghai-Pilot-Free-Trade-Zone-released.aspx (accessed: 14.05.2015).
KPMG, 2013, Pilot Free Trade Zone Series — Administrative regulation and other supporting rules for China (Shanghai) Pilot Free Trade Zone, China Tax Alert, Issue No. 28, available from: http://www.kpmg.com/CN/en/IssuesAndInsights/ArticlesPublications/Newsletters/ChinaAlerts/Pages/china-tax-alert-1310-28-Shanghai-pilot-free-trade-zone.aspx (accessed: 14.05.2015).
Lai, D., 2013, The state and the development of corporate insolvency law in China and Russa – A comparative perspective, in Asian Education and Development Studies, Vol. 2, No. 3, p. 212-224.
Lee, Il Houng; Murtaza Syed and Xuenan Liu, 2012, Is China overinvesting and does it mat-ter?, IMF Working paper WP/12/277.
Li, Cheng, 2011, China’s Midterm Jockeying: Gearing Up for 2012 (Part 4: Top Leaders of Major State-Owned Enterprises, Brookings Institution China Leadership Monitor No. 34.
Li, Shaomin and Jun Xia, 2008, The role and performance of state firms and non-state firms in China’s economic transition, in World Development, Vol. 36, No. 1, p. 39-54.

© THINK!DESK China Research & Consulting 2015 Seite 368
Li, Xin and Kjeld E. Brødsgaard, 2013, SOE Reform in China – Past, present and future, in The Copenhagen Journal of Asian Studies, Vol. 31, No. 2, p. 54-76.
Liaoning Province, 2001, Notice concerning the set-up of the Export Development Support Fund of Liaoning Province, LiaoZhengFa 2001, No. 34 (in Chinese).
Lin, Justin Yifu, 2009, Economic Development Transition: Thought, Strategy and Viability, Cambridge: Cambridge University Press.
Liu, Fengliang; Xin Yi and Ze Yu, 2014, The Transition of Industrial Structure in China: Mar-ket’s Endogenous Driving Force vs. Factor Market Distortions, in School of Econom-ics, Renmin University of China (eds.), 2014, Analysis and Forecast of China’s Macro Economy (3rd Quarter of 2014) China’s Macro Economy in the Context of Downward Pressures and Stimulus, Beijing: Renmin University, p. 77-91.
Ma’anshan City, 2011, Notice of the People’s Government of Ma’anshan City Concerning Awarding the Ma’anshan Steel Brand and Eight Other Brands the Title Famous Brand for Export of Ma’anshan, MaZhengMi 2011, No. 1 (in Chinese).
Ma’anshan City, 2008, Notice concerning the award of the title famous brand for export of Ma’anshan to six companies, Available from: http://www.mofcom.gov.cn/aarticle/difang/anhui/200812/20081205978833.html (ac-cessed: 31.03.2015) (in Chinese).
Mayer Brown JSM, 2013, MOFCOM Orders Extraterritorial Divestiture of Key Mining Asset in Glencore/Xstrata Merger: Lessons for Future Notifications, available from: http://www.mayerbrown.com/files/Publication/fe04b528-e457-4b50-a523-c85fc13e4196/Presentation/PublicationAttachment/5976f676-c847-4c7f-a7a1-d769bda1e92b/130506-PRC-AntitrustCompetition-MA-Mining.pdf (accessed: 18.05.2015).
McKinsey Global Institute, Debt and (not much) deleveraging, available from: http://www.mckinsey.com/insights/economic_studies/debt_and_not_much_deleveraging (accessed: 15.03.2015).
McNally, Christopher A., 2013, Refurbishing State Capitalism: A Policy Analysis of efforts to Rebalance China’s Political Economy, in: Journal of Current Chinese Affairs, Vol. 4/2013, pp. 45-71.
MIIT, 2014, Plan for Preventing and Addressing Atmospheric Pollution and the Promotion of Clean Production Technologies in Key Industries, GongXinBuJie 2014, No. 273 (in Chinese).
MIIT, 2013b, Circular on Applications for Priority Tasks of Major Science and Technology Projects in the Field of High-grade CNC Machine Tools and Component Manufactur-ing Equipment (in Chinese).
MIIT, 2012, 12th five-year program for the development of the new materials industry (in Chinese).
MIIT, 2011, Notice on strengthening industrial quality work, GongXinBuKe 2011 No. 114 (in Chinese).
MIIT, 2008, Catalogue of Preferential Enterprise Income Tax Treatments for the Synergistic Utilization of Resources (in Chinese).
MIIT, MOF and MOST, 2012, Approval of the second batch of resource saving and environ-mentally friendly company pilot project proposals (in Chinese).
MIIT and MOST, 2013, Circular on organizing the revision of the National Catalogue for En-couraging the Development of Major Technologies and Equipments for Environmental Protection, GongXinTingLianJie 2013, No. 202 (in Chinese).

© THINK!DESK China Research & Consulting 2015 Seite 369
MIIT, NDRC and MOF, 2014, Guidelines for Promoting the Development of the National In-tegrated Circuits Industry (in Chinese).
MIIT, NDRC, MOF and SAT, 2013, Administrative Measures for the Accreditation of Integrat-ed Circuit Design Companies, GongXinBuLianDianZi 2013, No. 487 (in Chinese).
MLR, 2012, Opinions on promoting differential administration of land use plans, GuoTuZiFa 2012, No. 141.MLR, 2006, Circular on issuing the rules on the assignment of state-owned land use right by bidding, auction and quotation (for trial), GuoTuZiFa 2006, No. 114 (in Chinese).
MLR, 2006, Circular on issuing the rules on the assignment of state-owned land use right by bidding, auction and quotation (for trial), GuoTuZiFa 2006, No. 114 (in Chinese).
MOF, 2015, The Circular concerning Enterprise Income Tax Policies for Further Encouraging the Development of the Integrated Circuit Industry, CaiShui 2015, No. 6 (in Chinese).
MOF, 2014, Budget Report of Shanxi Province for 2014 in The Compilation of Budget Report from Selected Provinces. (in Chinese)
MOF, 2007a, Circular on Administrative Measures for Government Procurement of Imported Products, CaiKu 2007 No. 119 (in Chinese).
MOF, 2007b, Administrative Measures for the Government to Initially and Selectively Pur-chase Independent Innovation Products, CaiKu 2007 No. 120 (in Chinese).
MOF, 2005a, Provisional Measures for the Fiscal and Financial Administration of Subsidy Funds for Fixed Asset Investments from the Central Government Budget, CaiJian 2005 No. 355 (in Chinese).
MOF, 2005b, Provisional Measures for the Fiscal and Financial Administration of Loan Inter-est Subsidy Funds for Fixed Asset Investments from the Central Budget, CaiJian 2005 No. 354 (in Chinese).
MOF, 1999, Provisional Measures for Offsetting Corporate Income Tax through Investments in Domestically Produced Equipment in Technology Renovation Projects, CaiShui 1999 No. 290 (in Chinese).
MOF, 1996, Interim Measures for the Administration of Three Categories of Scientific and Technological Expenses (in Chinese).
MOF, GAC and SAT, 2009, Circular of the State Administration of Taxation on the Issues Concerning Implementation of the Preferential Income Tax for Hi-Tech Enterprises (in Chinese).
MOF and MIIT, 2014, The Administrative Measures for Subsidy Funds for Developing the Internet of Things and the Rare Earth Industry, CaiQi 2014, No. 87 (in Chinese).
MOF, MIIT and MOST, 2010, Circular on the release of the first batch of the list of pilot en-terprises and resource saving and environmentally friendly enterprise work require-ments, GongXinBuLianJie 2010, No. 608 (in Chinese).
MOF and MLR, 2011a, Notice concerning the Construction of Demonstration Bases for the Synergistic Utilization of Mineral Resources, GuoTuZiFa 2011 No. 88 (in Chinese).
MOF and MLR, 2011b, Report on the Name List of the First Batch of Demonstration Bases for the Synergistic Utilization of Mineral Resources, 2011 Report No. 23 (in Chinese).
MOF and MOFCOM, 2014, Circular concerning the Reporting Work for the Special Fund for Foreign Trade Development, (in Chinese).
MOF and MOFCOM, 2013a, Circular concerning Doing Well the Administration of Funds for Establishing Foreign Trade Common Service Platforms in 2013, CaiQi 2013, No. 101 (in Chinese).

© THINK!DESK China Research & Consulting 2015 Seite 370
MOF and MOFCOM, 2013b, Circular concerning Repealing Documents related to the Admin-istration of Funds for Establishing Foreign Trade Common Service Platforms, CaiQi 2013, 293 (in Chinese).
MOF and MOFCOM, 2012, Circular concerning Doing Well the Administration of Funds for Establishing Foreign Trade Common Service Platforms in 2012, CaiQi 2012, No. 147 (in Chinese).
MOF and MOFCOM, 2011, Circular concerning Doing Well the Administration of Funds for Establishing Foreign Trade Common Service Platforms in 2011, CaiQi 2011, No. 88 (in Chinese).
MOF and MOFCOM, 2010, Circular concerning Doing Well the Administration of Funds for Establishing Foreign Trade Common Service Platforms in 2011, CaiQi 2010, No. 166 (in Chinese).
MOF and MOST, 2009, Circular on the Demonstration and Popularization of Energy-saving and New-energy Vehicles, CaiJian 2009, No. 6 (in Chinese).
MOF and MOST, 2004, Interim Measures for the Administration of Applied Technology Re-search and Development Funds, CaiJiao 2004, No. 3 (in Chinese).
MOF and NDRC, 2012, Interim Measures for the Administration of Special Funds for the De-velopment of Strategic Emerging Industries (in Chinese).
MOF, NDRC, GAC and SAT, 2012, Category of Non-Tax-Exempted Imported Items under Domestically Funded Projects, Report 2012, No. 83 (in Chinese).
MOF and SAT, 2007, Circular on implementing the State Council’s decision on amending the interim regulation of the People's Republic of China on city and town land use tax, CaiShui 2007, No. 9 (in Chinese).
MOF and SAT, 2005, Circular on Tax Policies for Companies that were Subject to Debt-to-Equity Swaps, CaiShui 2005 No. 29 (in Chinese).
MOF and SAT, 2000, Circular on Issues of Enterprise Income Tax Credits for Enterprises with Foreign Investment and Foreign Enterprises Purchasing Domestically Produced Equipment, CaiShuiZi 2000, No. 49 (in Chinese).
MOF, SAT and NDRC, 2008a, Catalogue of Public Infrastructure Projects Eligible for Prefer-ential Enterprise Income Tax Treatment, CaiShui 2008, No. 116 (in Chinese).
MOF, SAT and NDRC, 2008b, Catalogue of Comprehensive Use of Resources for Preferen-tial Enterprise Income Tax Treatment, CaiShui 2008, No. 117 (in Chinese).
MOF and SOA, 2012, Circular on the Promoting Regional Demonstration for Oceanic Eco-nomic Innovation and Development, CaiJianHan 2012, No. 12 (in Chinese).
MOFCOM 19.01.2015, Solicitation of opinions on the draft version for public discussion of the Foreign Investment Law of the People’s Republic of China, available from: http://tfs.mofcom.gov.cn/article/as/201501/20150100871010.shtml (accessed: 02.06.2015) (in Chinese).
MOFCOM, 2014, Decisions of Anti-monopoly Review to Prohibit Concentration of Undertak-ings by Prohibiting Maersk, MSC and CMA CGM from Establishing a Network Center, MOFCOM Announcement 2014 No. 46 (in Chinese).
MOFCOM, 2013a, Notice of the Third Batch of the National Foreign Trade Transformation and Upgrading Special Demonstration Base, available from: http://wms.mofcom.gov.cn/article/xxfb/201312/20131200435507.shtml, (accessed: 15.03.2015) (in Chinese).

© THINK!DESK China Research & Consulting 2015 Seite 371
MOFCOM, 2013b, Circular concerning the Organization of Application Materials for the Third Batch of Foreign Trade Transformation and Upgrading Special Demonstration Zones, ShangMaoHan 2013, No. 467 (in Chinese).
MOFCOM, 2012a, Notice of the Second Batch of the National Foreign Trade Transformation and Upgrading Special Demonstration Base, available from: http://wms.mofcom.gov.cn/aarticle/xxfb/201212/20121208479692.html, (accessed: 15.03.2015) (in Chinese).
MOFCOM, 2012b, Notice concerning the Recognition Work for the First Batch of Foreign Trade Transformation and Upgrading Special Demonstration Bases, ShangMaoHanZi 2012, No. 53 (in Chinese).
MOFCOM, 2012c, 12th Five-Year Programme for National-Level Economic and Technology Development Zones and Border Economic Cooperation Zones (2011-2015) (in Chi-nese).
MOFCOM, 2012d, 12th Five-Year Programme for the Development of Foreign Trade (in Chi-nese).
MOFCOM, 2011a, Notice concerning the Development of Foreign Trade Transformation and Upgrading Demonstration Bases, ShangMaoHan 2011, No. 62 (in Chinese).
MOFCOM, 2011b, Notice of the First Batch of the National Foreign Trade Transformation and Upgrading Special Demonstration Base, available from: http://www.mofcom.gov.cn/article/au/ao/201108/20110807685266.shtml, (accessed: 15.03.2015) (in Chinese).
MOFCOM, 2005a, Report No. 3, Beijing: MOFCOM (in Chinese).
MOFCOM, 2005b, Notice of concerning the restructuring of export credit insurance assis-tance development fund policy, ShangGuiFa 2005, No. 61 (in Chinese).
MOFCOM, n. d., Sichuan Province Panzhihua City Vanadium and Titanium Industries Base, available from: http://wmsp.mofcom.gov.cn/Report/Base/Content/23287.shtml (ac-cessed: 28.02.2015) (in Chinese).
MOFCOM and Jiangsu Province, 2006, Implementation Guidelines on Employing Export Credit Insurance in Supporting the Development of Famous Export Brands of Jiangsu Province, SuWaiJingMaoCai 2006, No. 849 (in Chinese).
MOFCOM and MOF, 2006, Notice of MOFCOM and MOF concerning the export credit insur-ance assistance development fund policy in 2006, ShangCaiFa 2006, No. 455 (in Chinese).
MOFCOM and Sinosure, 2005, Notice concerning employing export credit insurance support in supporting the development of famous export brands, ShangMaoFa 2005, No. 332 (in Chinese).
MOFCOM et al., 2011, Guiding Opinions on Promoting the International Development of Strategic Emerging Industries, ShanChanFa 2011 No. 310 (in Chinese).
MOFCOM et al., 2005, Notice concerning the promulgation of the 'Guiding opinions on sup-porting the development of famous export brands, ShangMaoFa 2005, No. 124 (in Chinese).
Mondaq, 20.06.2014, The Pilot Free Trade zone in Shanghai, available from: http://www.mondaq.com/x/322122/international+trade+investment/ (accessed: 10.05.2015).
Mondaq, 22.05.2014, Regulations Released Regarding Outbound Investment Policies for the China (Shanghai) Pilot Free Trade Zone, available from:

© THINK!DESK China Research & Consulting 2015 Seite 372
http://www.mondaq.com/x/315686/international+trade+investment/ (accessed: 10.05.2015).
MOST, 2013, Circular on the Guidelines for the Technology Innovation Fund for Supporting Science and Technology-oriented SMEs, GuoKeFaJi 2013, No. 458 (in Chinese).
MOST, 2009, Notice concerning the drafting of the Catalogue for high and new technology products, GuoKeBanJi 2009, No. 61 (in Chinese).
MOST, 2006, Catalogue of Chinese High-Tech Products for Export (2006), GuoKeFaJiZi 2006, No. 370 (in Chinese).
MOST, 2005, National Science and Technology Support Plan (in Chinese).
MOST, 2000, Conditions and Measures for the Designation of High and New Technology Enterprises in National High and New Technology Industry Development Zones, GuoKeFaHuoZi 2000 No. 324 (in Chinese).
MOST, 1996, Conditions and Measures for the Designation of High and New Technology Enterprises located outside National High and New Technology Industry Develop-ment Zones, GuoKeFaHuoZi 1996 No. 18 (in Chinese).
MOST and MOF, 2006, Provisional Measures for Managing the National Science and Tech-nology Support Plan, GuoKeFaJiZi 2006, No. 331 (in Chinese).
MOST, MOF and SAT, 2008, Administrative measures on the certification of High and New Technology Enterprises, GuoKeFaHuo 2008 No. 172 (in Chinese).
MOST, NDRC and MOF, 2009, Circular on Launching Accreditation Work for National Indig-enous Innovation Products, GuoKeFaJi 2009, No. 618 (in Chinese).
MOST, NDRC and MOF, 2006, Administrative Measures for the Accreditation of National Indigenous Innovation Products (for Trial Implementation), GuoKeFaJiZi 2006, No. 539 (in Chinese).
Mysteel.com, 15.04.2013, The Municipal Government of Taiyuan City and Shougang Chang-zhi Sign Strategic Cooperation Agreement, available from: http://tg.mysteel.com/13/0415/11/7F24B6C8FC9CB594.html (accessed: 10.02.2015) (in Chinese).
Nanchang City, 2010, Plan for the Demonstration and Popularization of Energy-saving and New-energy Vehicles of Nanchang City, HongFuTingZi 2010, No. 74 (in Chinese).
Nanjing City, 2012, Circular on Printing the Opinions of the People’s Government of Nanjing City on Further Deepening the Work on the ‘Early Rise’ Action Plan, NingZhengFa 2012, No. 238 (in Chinese).
Naughton, Barry, 2007, The Chinese Economy – Transitions and Growth, Cambridge Mass.: MIT Press.
New African, The, 2015, Resources, Power & the Myths, March 2015.
NBAR – National Bureau of Asian Research, 2013, The IP Commission Report, reported commissioned by the Commission on the Theft of American Intellectual Property, available from: http://www.ipcommission.org/report/IP_Commission_Report_052213.pdf (accessed: 10.05.2015).
NBS – National Bureau of Statistics, 2015, National Annual Statistics on FDI actually utilized, available from: http://data.stats.gov.cn/workspace/index;jsessionid=5BC820F6E56883B1307CC29A5EAD13F4?m=hgnd (accessed: 10.05.2015).

© THINK!DESK China Research & Consulting 2015 Seite 373
NDRC, 2015, Circular on raising domestic prices of refined petroleum products, FaGaiDian 2015, No. 184 (in Chinese).
NDRC, 2013, Guidance Catalogue for Key Products and Services in Strategic Emerging In-dustries, NDRC Report 2013, No.16 (in Chinese).
NDRC, 2009a, Interim Administrative Measures for Revitalizing Key Industries and Technol-ogy Renovation Project Investment, FaGaiChanYe 2009 No. 795 (in Chinese).
NDRC, 2009b, Adjustment and Revitalization Programme for the Shipbuilding industry (in Chinese).
NDRC, 2007, Development Policy for the Pulp and Paper Industry, NDRC Report 2007, No. 71 (in Chinese).
NDRC, 2006a, Development Policy for the Cement Industry, NDRC Order 2006, No. 50 (in Chinese).
NDRC, 2006b, Circular on Opinions concerning optimizing differential electricity pricing poli-cies, GuoBanFa 2006, No. 77 (in Chinese).
NDRC, 2005a, Development Policy for the Steel Industry, NDRC Order 2005, No. 35 (in Chi-nese).
NDRC, 2005b, Provisional Measures for the Management of Projects Receiving Investment Support and Loan Interest Subsidies from Funds Included in the Central Government Budget, 2005 Order No. 31 (in Chinese).
NDRC, 2004, Development Policy for the Automobile Industry, NDRC Order 2004, No. 8 (in Chinese).
NDRC, various years, Catalogue for the Guidance of Structural Adjustment of Industries (in Chinese).
NDRC and MOF, 2003, State Treasury Bond Programme for Enterprise Technological Pro-gress and Industrial Upgrading, FaGaiTouzi 2003 No. 892 (in Chinese).
NDRC, MOF and MOFCOM, 2011, Catalogue of Encouraged Technology and Product Im-ports, FaGaiChanYe, 2011, No. 937 (in Chinese).
NDRC, MOF and SERC, 2007, Circular on problems related to the continued implementation of the differential electricity pricing policy, FaGaiJiaGe 2007, No. 2655 (in Chinese).
NDRC and MOFCOM, 2013, Catalogue of Priority Industries for Foreign Investment in Cen-tral and Western China, NDRC Decree 2013, No. 1 (in Chinese).
NDRC and MOFCOM, 2011, Catalogue for the Guidance of Foreign Investment Industries, Order 2011, No. 12 (in Chinese).
NDRC and SERC, 2007a, Circular on resolutely implementing differential electricity pricing policies and strictly prohibiting any preferential pricing schemes, FaGaiJiaGe 2007, No. 773 (in Chinese).
NDRC and SERC, 2007b, Circular on carrying out inspections of the implementation of the differential electricity price policy and the strict ban of preferential energy price schemes, FaGaiDian 2007, No. 127 (in Chinese).
Nee, Victor and Sonja Opper, 2012, Capitalism from Below: Markets and Institutional Change in China, Cambridge MA - London.
Ningbo City, 2011, Circular concerning Doing Well the Administration of Funds for Establish-ing Foreign Trade Common Service Platforms in 2011, available from: http://www.nbkfq.gov.cn/doc/gzdt/jjmy/content/294793.shtml (accessed: 13.03.2015).

© THINK!DESK China Research & Consulting 2015 Seite 374
Norton Rose Fulbright, 2014, New 2014 Negative list reduces restrictions for foreign invest-ment in the Shanghai Free Trade Zone, available from: http://www.nortonrosefulbright.com/knowledge/publications/118112/new-2014-negative-list-reduces-restrictions-for-foreign-investment-in-the-shanghai-free-trade-zone (accessed: 12.05.2015).
National People’s Congress – NPC, 2014a, Securities law of the People’s Republic of China, Order of the Chairman 2014 No. 14 (in Chinese).
NPC, 2014b, Environmental Protection Law of the People’s Republic of China, Order of the Chairman 2014, No. 9 (in Chinese).
NPC, 2014c, Government Procurement Law of the People’s Republic of China, Order of the Chairman 2014, No. 14 (in Chinese).
NPC, 2014d, Environmental Protection Law of the People’s Republic of China, Order of the Chairman 2014, No. 9 (in Chinese).
NPC, 2012a, Statement of the fifth conference of the 11th NPC concerning the state of execu-tion of the national economic and social development plan in 2011 and the resolution for the national economic and social development plan in 2012, passed 14.03.2012 (in Chinese).
NPC, 2012b, Cleaner Production Promotion Law of the People’s Republic of China, Order of the Chairman 2012, No. 54 (in Chinese).
NPC, 2011a, Outline of the National 12th Five-Year Programme for Economic and Social Development of the People’s Republic of China (in Chinese).
NPC, 2011b, Statement of the fourth conference of the 11th NPC concerning the state of ex-ecution of the national economic and social development plan in 2010 and the resolu-tion for the national economic and social development plan in 2011, passed 14.03.2011 (in Chinese).
NPC, 2011c, Statement of the fourth conference of the 11th NPC concerning the state of exe-cution of the national economic and social development plan in 2010 and the resolu-tion for the national economic and social development plan in 2011, passed 14.03.2011 (in Chinese).
NPC, 2009, Renewable Energy Law of the People's Republic of China, Order of the Chair-man 2009, No. 23 (in Chinese).
NPC, 2008a, Law of the People’s Republic of China on the State-owned Assets of Enterpris-es, Order of the Chairman 2008, No. 5 (in Chinese).
NPC, 2008b, Circular Economy Promotion Law of the People’s Republic of China, Order of the Chairman 2008, No. 4 (in Chinese).
NPC, 2007a, Labour Contract Law of the People’s Republic of China (in Chinese).
NPC, 2007b, Enterprise Income Tax Law of the People’s Republic of China, Order of the Chairman No. 63 (in Chinese).
NPC, 2007c, Energy Conservation Law of the People’s Republic of China, Order of the Chairman 2007, No. 77 (in Chinese).
NPC, 2007d, Anti-monopoly Law of the People’s Republic of China, Order of the Chairman 2007, No. 68 (in Chinese).
NPC, 2006a, Outline of the National 11th Five-Year Programme for Economic and Social Development of the People’s Republic of China (in Chinese).
NPC, 2006b, Enterprise Bankruptcy Law of the People’s Republic of China, Order of the Chairman 2006, No. 54 (in Chinese).

© THINK!DESK China Research & Consulting 2015 Seite 375
NPC, 2004a, Constitution of the People’s Republic of China (in Chinese).
NPC, 2004b, Land Administration Law of the People’s Republic of China (in Chinese).
NPC, 2004c, Foreign Trade Law, Order of the Chairman 2004, No. 15 (in Chinese).
NPC, 2003, Commercial banking Law of the People’s Republic of China, available from: http://www.cbrc.gov.cn/chinese/home/docView/2421.html (accessed: 23.05.2015) (in Chinese).
NPC, 2002, Government Procurement Law of the People’s Republic of China, Order of the Chairman 2002, No. 68 (in Chinese).
NPC, 2001, Outline of the National 10th Five-Year Programme for Economic and Social De-velopment of the People’s Republic of China (in Chinese).
NPC, 1997, Price Law of the People’s Republic of China, Order of the Chairman 1997, No. 92 (in Chinese).
NPC, 1996, Outline of the National 9th Five-Year Plan for Economic and Social Development of the People’s Republic of China and the Long Range Development Objectives until 2010 (in Chinese).
NPC, 1994, Urban Real Estate Administration Law of the People’s Republic of China (in Chi-nese).
NPC, 1993, Law Against Unfair Competition, Order of the Chairman 1993, No. 10 (in Chi-nese).
NPC, 1991, Foreign Invested Enterprise and Foreign Enterprise Income Tax Law, Order of the Chairman 1991, No. 45 (in Chinese).
NPC, 1986, Enterprise Bankruptcy Law of the People’s Republic of China (for trial Implemen-tation) (in Chinese).
NPC, 1985, Land Administration Law of the People’s Republic of China (in Chinese).
NWSA, 2015, Circular of the Science and Technology Plan Office of the National Work Safe-ty Administration on work requirements for solicitation for national science and tech-nology action projects in the field of work safety during the 13th FYP period (in Chi-nese).
NYT – New York Times, 05.06.2013, Tetra Pak Comes Under Scrutiny in China, available from: http://www.nytimes.com/2013/07/06/business/global/tetra-pak-comes-under-scrutiny-in-china.html?_r=0 (accessed: 18.05.2015).
NYT, 05.06.2013, Tetra Pak Comes Under Scrutiny in China, available from: http://www.nytimes.com/2013/07/06/business/global/tetra-pak-comes-under-scrutiny-in-china.html?_r=0 (accessed: 18.05.2015).
Ogilvy Renault LLP, 2007, The Dumping and Subsidization of Carbon Steel Welded Pipe Originating in or Exported from the People’s Republic of China.
Panjin City, 2012, Catalogue for Government Vehicle Procurement published, all types are Chinese brands, available from: http://pjprtc.panjin.gov.cn/view.php?CODE=20111028111831203820&id=20120305154919221481 (accessed: 15.06.2015) (in Chinese).
PBoC Shanghai, 2012, Credit Orientation Guidelines (in Chinese).
PBoC Wuhan, 2010, Opinions concerning the Financial Support for the Adjustment and Revi-talization of Ten Key Industries in Hubei Province, WuYin 2009, No. 152 (in Chinese).
Pedone, Richard C. and Henry H. Liu, 2010, The Evolution of Chinese Bankruptcy Law: Challenges of a Growing Practice Area, available from: http://law.okcu.edu/wp-

© THINK!DESK China Research & Consulting 2015 Seite 376
content/uploads/2014/06/I.China_Bankruptcy_Law_Pedone.pdf (accessed: 01.06.2015).
People Daily, 09.04.2015, Opinion of the CPC Central Committee and the State Council on Establishing Harmonious Labour Relations, available from: http://paper.people.com.cn/rmrb/html/2015-04/09/nw.D110000renmrb_20150409_2-01.htm (accessed: 10.04.2015) (in Chinese).
People Daily, 28.02.2015, Vice-minister of Human Resources and Social Security: Last year, the average monthly salary of agricultural workers leaving their home towns was 2,864 Yuan, available from: http://finance.people.com.cn/money/n/2015/0228/c218900-26612385.html (accessed: 13.04.2015) (in Chinese).
People Daily, 24.11.2014, Hebei Province rings the bell for going out – Three advantageous industries take the lead to move abroad, available from: http://he.people.com.cn/n/2014/1124/c192235-22989295.html (accessed: 15.02.2015) (in Chinese).
Peterson, George, 2006, Land leasing and land sale as an infrastructure financing option, World Bank Working Paper No. WP S4043, available from: http://elibrary.worldbank.org/doi/pdf/10.1596/1813-9450-4043 (10.05.2015)
Pettis, Michael, 2013, Whats in a Number? In China, Not Much, available from: http://www.bloomberg.com/news/articles/2013-07-21/what-s-in-a-number-in-china-not-much (accessed: 13.04.2015).
Piotroski, J., T. J. Wong, 2013, Institutions and information environment of Chinese listed firms, in: Fan, J. P. H. and R. Morck, (ed.), Capitalizing China, Chicago, pp. 201-242.
Poddar, Dave, 2013, Implications of China's conditional competition approval of Glen-core/Xstrata, available from: http://www.cliffordchance.com/briefings/2013/04/implications_of_chinasconditionalcompetitio.html (accessed: 18.05.2015).
Porter, M., 1990, The Competitive Advantage of Nations, New York, N.Y.: Free Press.
Price, Alan et al., 2007, Money for Metal: A Detailed Examination of Chinese Government Subsidies to its Steel Industry (July 2007).
Price, Alan et al., 2006, The China Syndrome: How subsidies and government intervention created the world’s largest steel industry (July 2006).
Proff, Heike et al., 2012, The competitiveness of the European Automobile Industry in the field of electric vehicles, Report prepared for the European Commission.
PWC – Price Waterhouse Coopers, 2014, China (Shanghai) Pilot Free Trade Zone (SH PFTZ), available from: http://www.pwc.com.au/asia-practice/china/assets/publications/China-SH-PFTZ-Feb-2014.pdf (accessed: 13.05.2015).
PWC, 2006, China VAT Alert: Major Revision of the Chinese VAT Export Refund, available from: http://www.pwc.com/ja_JP/jp/taxnews-customs/assets/china_vat_alert.pdf (ac-cessed: 15.03.2015).
Quartz, 18.03.2015, China’s debt situation is genuinely scare – and getting worse, available from: http://qz.com/364990/chinas-debt-situation-is-genuinely-scary-and-getting-worse/ (accessed: 15.03.2015).
Quartz, 22.07.2014, China’s enourmous bad debts may mean good times for bankruptcy experts, available from: http://qz.com/234779/chinas-enormous-bad-debts-may-mean-good-times-for-bankruptcy-experts/ (accessed: 15.03.2015).

© THINK!DESK China Research & Consulting 2015 Seite 377
Quartz, 20.09.2013, China’s spending 39% of its GDP paying off debts, available from: http://qz.com/126089/chinas-spending-39-of-its-gdp-paying-off-debts/ (accessed: 15.03.2015).
Reuters, 2015, Alibaba steps up China online finance network push with new index, bank, available from: http://www.reuters.com/article/2015/04/09/us-china-alibaba-mybank-idUSKBN0N005N20150409 (accessed: 10.04.2015).
Reuters, 06.03.2015, UPDATE 1-China to reduce coal consumption, lessen pollution – minis-try, available from: http://uk.reuters.com/article/2015/03/06/china-coal-cut-idUKL4N0W834Q20150306 (accessed: 12.01.2015).
Reuters, 30.12.2014, Rival china trainmakers merge to boost high speed rail push abroad, available from: http://www.reuters.com/article/2014/12/30/china-cnr-ma-csr-corp-idUSL5N0SN05020141230 (accessed: 17.05.2015).
Reuters, 08.08.2014, UPDATE 1-BMW cuts auto part prices in China amid anti-monopoly probe, available from: http://www.reuters.com/article/2014/08/08/bmw-chinaprice-idUSL4N0QE1CZ20140808 (accessed: 18.05.2015).
Reuters, 07.08.2013, China fines milk powder makers $110 million for price fixing, available from: http://www.reuters.com/article/2013/08/07/us-meadjohnson-china-idUSBRE97512S20130807 (accessed 18.05.2015).
Rock, Michael T. and Michael Q. Towman, 2015, China’s Technological Catch-Up Strategy: Industrial Development, Energy Efficiency, and CO2 Emissions, New York: Oxford University Press.
SASAC, 2011, The Level of Dividend Payments of Stateowned Enterprises Rises at a Stable Pace, Making an Important Contribution to Public Welfare, available from: http://www.sasac.gov.cn/n1180/n1566/n259730/n6633400/13225460.html (accessed: 02.10.2014) (in Chinese).
SASAC, 2008, Circular on relevant issues concerning the Implementation of the Law on State-owned Assets of Enterprises (in Chinese).
SASAC, 2006, Provisional Measures for the Supervision and Administration of the Invest-ments by Central Enterprises (in Chinese).
SAT, 2008, Trial Measures for Deducting Corporate R&D Expenses from Taxable Income (in Chinese).
SAT, 1994, Circular concerning Temporary Exemption from Urban Maintenance and Con-struction Tax and Additional Education Fees for Foreign-Funded and Foreign Enter-prises, GuoShuiFa 1994, No. 38) (in Chinese).
SCMP – South China Morning Post, 19.03.2015, Chairman of one of China’s biggest car makers ‘under investigation in graft probe’, available from: http://www.scmp.com/news/china/ article/1738523/faw-chairman-xu-jianyi-under-investigation-graft-probe-watchdog-says (accessed: 10.04.2015).
SCMP, 29.08.2013, China fines milk powder makers US$110m for price-fixing, available from: http://www.scmp.com/business/companies/article/1294898/china-fines-milk-powder-makers-us110m-price-fixing (accessed: 18.05.2015).
SCPFTZ, 2015, About SHFTZ, available from: http://en.china-shftz.gov.cn/About-FTZ/Location/ (accessed: 10.05.2015).
SDPC, 2001, Catalogue of Price Controls by the State Planning Commission and other Rel-evant Departments of the State Council, 2001 Order No. 11.

© THINK!DESK China Research & Consulting 2015 Seite 378
Securities and Exchange Commission (2014): Form F-1 Registration Statement under the Securities Act Of 1933: Alibaba Group Holding Limited, Washington, Dc.
SETC, SPC, MOF and PBoC, 1999a, Administrative Measures for State Key Technology Renovation Projects, GuoJingMaoTouZi 1999 No. 886 (in Chinese).
SETC, SPC, MOF and PBoC, 1999b, Administrative Measures for Treasury Bond Special Funds for State Key Technology Renovation Projects, GuoJingMaoTouZi 1999 No. 886 (in Chinese).
Shandong Province, 2015, Notice concerning the Fourth Batch of Foreign Trade Transfor-mation and Upgrading Special Demonstration Bases, available from: http://shandong.mofcom.gov.cn/article/sjtongzhigg/201502/20150200894903.shtml (accessed: 15.02.2015) (in Chinese).
Shandong Province, 2014, Notice concerning the Third Batch of Foreign Trade Transfor-mation and Upgrading Special Demonstration Bases, available from: http://www.mofcom.gov.cn/article/difang/shandong/201401/20140100467317.shtml (accessed: 15.02.2015) (in Chinese).
Shandong Province, 2013, Notice concerning the Second Batch of Foreign Trade Transfor-mation and Upgrading Special Demonstration Bases, available from: http://shandong.mofcom.gov.cn/aarticle/sjtongzhigg/201301/20130108520562.html (accessed: 15.02.2015) (in Chinese).
Shanxi Province, 2012a, Circular concerning the Release of the First Batch of Foreign Trade Transformation and Upgrading Special Demonstration Bases for Shanxi Province, available from: http://ygnl.szdflz.gov.cn/website/dflz/html/shnzc/2012/9f39e83938f34a14b76bdff4f73229a0_0.html (accessed: 15.02.2015) (in Chinese).
Shanxi Province, 2012b, Notice concerning the Recognition Work for the First Batch of For-eign Trade Transformation and Upgrading Special Demonstration Bases of Shanxi Province, available from: http://www.shanxigov.cn/n16/n1233/n1503/n1881/n2833/16384736.html (accessed: 15.02.2015) (in Chinese).
Shandong Province, 2015, Action plan for promoting the transformation and upgrading of industries in Shandong Province (2015-2020), LuZheng BanFa 2015, No. 13 (in Chi-nese).
Shandong Province, 2012c, Work distribution for the implementation plan for the Special Fund for Indigenous Innovation of Shandong Province, LuCaiJiao 2012, No. 72 (in Chinese).
Shandong Province, 2012d, Circular concerning doing well in the competitiveness-oriented distribution of special funds supporting indigenous innovation in Shandong Province, LuZhengBanFa 2012, No. 49 (in Chinese).
Shandong Province, 2011a, Circular concerning the First Batch of Foreign Trade Transfor-mation and Upgrading Special Demonstration Bases, available from: http://www.mofcom.gov.cn/aarticle/h/zongzhi/201112/20111207891536.html (ac-cessed: 15.02.2015) (in Chinese).
Shandong Province, 2011b, Circular concerning the Recognition Work for the First Batch of Foreign Trade Transformation and Upgrading Special Demonstration Bases of Shan-dong Province, available from: http://www.mofcom.gov.cn/aarticle/h/zongzhi/201109/20110907742414.html (ac-cessed: 15.02.2015) (in Chinese).

© THINK!DESK China Research & Consulting 2015 Seite 379
Shandong Province, 2011c, Circular concerning Doing Well the Administration of Funds for Establishing Foreign Trade Common Service Platforms in in 2011, LuCaiQi 2011, No. (in Chinese).
Shandong Province, 2011d, Opinions concerning Accelerating and Promoting the Establish-ment of Foreign Trade Transformation and Upgrading Demonstration Bases, LuShangWuWaiMaoZi 2011, No. 609 (in Chinese).
Shandong Province, 2011e, Implementation Opinions on Accelerating the Development of Strategic Emerging Industries (in Chinese).
Shandong Province, 2009, Interim Measures for the Administration of Special Funds for De-veloping Patents of Shandong Province (in Chinese).
Shandong Province, 2006, Medium and Long-term Plan for the Development of Science and Technoloogy for Shandong Province (2006-2020), available from: http://www.qibebt.cas.cn/kxcb/kpwz/nyzcgh/200906/U020090630565159833644.pdf (accessed: 21.05.2015) (in Chinese).
Shandong Province, n.d., Circular on organizing project applications for the special fund for the development of the IT industry in Shandong Province (in Chinese).
Shanghai City, 2012, 12th Five-year Programme for the Development of the Automobile In-dustry in Shanghai City, HuJingXinZhuang 2012, No. 427 (in Chinese).
Shanxi Province, 2011, Opinions of the People’s Government of Shanxi Province on Accel-erating the Cultivation and Development of Strategic Emerging Industries, JinZheng-Fa 2011, No. 21 (in Chinese).
Shenzhen City, 2009, LED industry development programme of Shenzhen City (2009-2015), ShenFu 2009, No. 41 (in Chinese).
Shih, Lea, 2015, Chinas Industriepolitik von 1978-2013: Programme, Prozesse und Be-schränkungen, Wiesbaden: Springer VS (in German).
Sichuan Province, 20.04.2015, Circular of the Development and Reform Commission of Si-chuan Province on cutting the price of electricity from coal-fired plants on the provin-cial grid for large industrial users, ChuanFaGaiJiaGe 2015, No. 228 (in Chinese).
Sina, 27.10.2014, From a look the top 500 enterprises list, the transformation of the real es-tate sector is visible, available from: http://finance.sina.com.cn/zl/bank/20141027/131520651645.shtml (accessed: 22.05.2015) (in Chinese).
Sina, 13.01.2014, From Today on, Military Officials May Only Choose From Domestic Brands, available from: http://finance.sina.com.cn/chanjing/cyxw/20140113/180517936881.shtml (accessed: 12.06.2015) (in Chinese).
Sina, 15.11.2013, The current situation of dividend disbursements by state‐owned enterpris-es: Five types of ratios with the highest at 20%, 90%, available from: http://finance.sina.com.cn/china/20131115/170417338178.shtml (accessed 02.10.2014) (in Chinese).
Sina, 08.09.2012, Rewards from Unfreezing the New-energy Vehicle Policy to Become Visi-ble Soon, available from: http://auto.sina.com.cn/news/2012-09-08/10031029172.shtml (accessed: 10.01.2015) (in Chinese).
Sinosure, 2011, Company Profile, available from: http://www.sinosure.com.cn/sinosure/english/Company%20Profile.html (accessed 01.05.2013).
Sinosure, various years, Annual Report.

© THINK!DESK China Research & Consulting 2015 Seite 380
State Council, 2015a, Implementation Conditions for the Government Procurement Law of the People’s Republic of China, Order of the State Council 2015, No. 658 (in Chi-nese).
State Council, 2015b, Circular on Issues related to Clearing and Standardizing Preferential Policies on Taxation and other Areas, GuoFa 2015, No. 25 (in Chinese).
State Council, 2014, Circular on Clearing and Standardizing Preferential Policies on Taxation and other Areas, GuoFa 2014, No. 62 (in Chinese).
State Council, 2012a, Opinions on Strengthening Intellectual Property Work in Strategic Emerging Industries, GuoBanFa 2012, No. 28 (in Chinese).
State Council, 2012b, Circular on Printing and Distributing the 12th Five-Year Plan for the Development of Strategic Emerging Industries, GuoFa 2012, No. 28 (in Chinese).
State Council, 2011, Programme for Industrial Transformation and Upgrading (2011-2015), GuoFa 2011 No. 47 (in Chinese).
State Council, 2010a, Decision on Accelerating the Cultivation and Development of Strategic Emerging Industries, GuoFa 2010 No. 32 (in Chinese).
State Council, 2010b, Opinions of the State Council Concerning the Promotion of Enterprise M&A (in Chinese).
State Council, 2007a, Circular concerning the Provision of Transitional Preferential Tax Treatments to High-tech Enterprises Newly Set up in Special Economic Zones and in Pudong District of Shanghai, GuoFa 2007 No. 40 (in Chinese).
State Council, 2007b, Implementation Regulations on the Enterprise Income Tax Law of the People’s Republic of China, GuoWuYuanLin 2007 No. 512 (in Chinese).
State Council, 2007c, Several Opinions on Encouraging, Supporting and Guiding Non-public Enterprises to Invest Overseas, ShangHeFa 2007, No. 94 (in Chinese).
State Council, 2006, Selected Supporting Policies for the 2006-2020 Medium and Long-term Science and Technology Development Plan, GuoFa 2006 No. 6 (in Chinese).
State Council, 2005a, Temporary Provisions on Promoting Industrial Structure Adjustment, GuoFa 2005 No. 40 (in Chinese).
State Council, 2005b, Outline of the National Medium and Long Term Plan for Science and Technology Development (2006 – 2020) (in Chinese).
State Council, 2004, Decision concerning the deepening of reform of managing land use in a strict way, GuoFa 2004, No. 28 (in Chinese).
State Council, 2003a, Circular concerning the Main Functions, Interior Institutions and Staff-ing of the State-owned Assets Supervision and Administration Commission of the State Council, GuoBanFa 2003, No. 28 (in Chinese).
State Council, 2003b. Provisions for Import and Export Duties of the People’s Republic of China, Order of the State Council 2003, No. 392 (in Chinese).
State Council, 1990, Provisions (for Trial Implementation) for the Sale and Transfer of Land Use Rights in Cities and Towns, Order of the State Council 1990 No. 55 (in Chinese).
State Science and Technology Commission, 1991, Conditions and Measures for the Desig-nation of High and New Technology Enterprises in National High and New Technolo-gy Industry Development Zones (in Chinese).
STDC, 1991, Accreditation Measures for Enterprises Located Outside of National High and New Technology Development Zones (in Chinese).

© THINK!DESK China Research & Consulting 2015 Seite 381
Street, The, 04.08.2014, Will China Let a State-Owned Oil Tanker Company Sink?, available from: http://www.thestreet.com/story/12632046/1/will-china-let-a-state-owned-oil-tanker-company-sink.html (accessed: 01.06.2015).
Supreme People’s Court, 2015, Presentation of the Work Report of People’s Courts in 2014, available from: http://www.court.gov.cn/fabu-xiangqing-13848.html (accessed: 20.03.2015) (in Chinese).
Supreme People’s Court, 2013, Presentation of the Work Report of People’s Courts in 2012 (in Chinese).
Supreme People’s Court, 2011, Presentation of the Work Report of People’s Courts in 2010 (in Chinese).
SwissNex, 28.10.2013, China’s 7 Strategic Emerging Industries, available from: http://www.swissnexchinanews.org/innovation/2013/10/27/chinas-7-strategic-emerging-industries (accessed: 20.05.2015).
Szamosszegi, Andrew and Cole Kyle, 2011, An analysis of state-owned enterprises and state capitalism in China, report prepared by Capital Trade Inc. for the U.S. – China Economic and Security Review Commission, Washington: The U.S. – China Econom-ic and Security Review Commission.
Taiyuan City, 2013, City key urban construction projects and Shougang Changzhi Iron and Steel Co. at smooth matchmaking site, available from: http://www.tyzfcg.gov.cn/view.php?nid=286 (accessed: 12.03.2015) (in Chinese).
Tan, Rong, 2011, Rural to urban land conversion in China — How large is the over-conversion and what are its welfare implications?, in China Economic Review, Vol. 22, No. 2, p. 474-484.
Tang, L., 2008, New Issues in Chinese Enterprise Bankruptcy Law, available from: https://insol.org/Turton%20Award/New%20Issues%20in%20Chinese%20Enterprise%20Bankruptcy%20Law%20Final%20Article%206%20Jan.pdf (accessed: 15.03.2015).
Tangshan City, 2011, Circular concerning Doing Well the Administration of Funds for Estab-lishing Foreign Trade Common Service Platforms in 2011 in Tangshan City, available from: http://www.tswaimao.com/view.asp?id=9739&classID=2 (accessed: 14.03.2015) (in Chinese).
Taube, Markus and in der Heiden, 2015, Analysis of industrial policies and discretionary government interventions in the Chinese Steel Tubes and Pipes Industry, Report pre-pared for the European Steel Tube Association.
Taube, Markus and Peter in der Heiden, 2009, The State Business Nexus in China’s Steel Industry – Chinese Market Distortions in Domestic and International Perspective, Think!Desk Report prepared for Eurofer.
Teufel-Dreyer, June, 2013, China’s Political System, New York: Pearson Education Limited.
Thomsen, Stephen, n. d., OECD FDI Regulatory Restrictiveness Index - A tool for bench-marking countries, measuring reform and assessing its impact, available from: http://www.oecd.org/daf/inv/investment-policy/FDIRRIndexPPT.pdf (accessed: 10.05.2015).
Tianjin City, 2012, Tianjin City Patent Support Measures (in Chinese).
Tianjin City, 2011, Circular concerning Doing Well the Administration of Funds for Establish-ing Foreign Trade Common Service Platforms in 2011, JinCaiJianEr 2011, No. 21 (in Chinese).

© THINK!DESK China Research & Consulting 2015 Seite 382
USA, 2010. China–Measures Related to the Exportation of Various Raw Materials. First writ-ten submission to the WTO concerning dispute settlement cases DS394, DS395 and DS398.
U.S. ITA – United States International Trade Administration, 2014a, Decision Memorandum for the Preliminary Affirmative Countervailing Duty Determination in the Countervail-ing Duty Investigation of Monosodium Glutamate from the People’s Republic of China; and Preliminary Affirmative Determination of Critical Circumstances, Case C-570-993, Washington D.C.: U.S. DOC ITA.
U.S. ITA, 2014b, Issues and Decision Memorandum for the Final Determination in the Coun-tervailing Duty Investigation of Non-oriented Electrical Steel from the People’s Repub-lic of China, Case C-570-997, Washington D.C.: U.S. DOC ITA.
U.S. ITA, 2014c, Issues and Decision Memorandum for the Final Affirmative Determination in the Countervailing Duty Investigation of Calcium Hypochlorite from the People’s Re-public of China, Case C-570-009, Washington D.C.: U.S. DOC ITA.
U.S. ITA, 2014d, Decision Memorandum for Final Results of Countervailing Duty Administra-tive Review: Narrow Woven Ribbons with Woven Selvedge from the People’s Repub-lic of China, Case C-570-953, Washington D.C.: U.S. DOC ITA.
U.S. ITA, 2014e, Issues and Decision Memorandum for the Final Affirmative Determination in the Countervailing Duty Investigation of Grain Oriented Electrical Steel from the Peo-ple’s Republic of China, Case C-570-995, Washington D.C.: U.S. DOC ITA.
U.S. ITA, 2014f, Issues and Decision memorandum for Certain Magnesia Carbon Bricks from the People’s Republic of China: Final Results of the 2012 Administrative Review, Case C-570-955, Washington D.C.: U.S. DOC ITA.
U.S. ITA, 2014g, Decision Memorandum for the Preliminary Affirmative Countervailing Duty Determination in the Countervailing Duty Investigation of Certain Passenger Vehicle and Light Truck Tires from the People’s Republic of China, Case C-570-017, Wash-ington D.C.: U.S. DOC ITA.
U.S. ITA, 2010, Issues and Decision Memorandum for the Final Determination in the Coun-tervailing Duty Investigation of Aluminum Extrusions from the People’s Republic of China (PRC). C-570-968, Washington D.C.: U.S. DOC ITA.
U.S. ITA, 2008, Issues and Decision Memorandum for Final Determination in the Counter-vailing Duty Investigation of Raw Flexible Magnets from the People’s Republic of Chi-na, Case C-570-923, Washington D.C.: U.S. DOC ITA.
U.S. ITA, 2007, Issues and Decision memorandum for the Final Determination in the Coun-tervailing Duty Investigation of Coated Free Sheet from the People’s Republic of Chi-na, Case C-570-907, Washington D.C.: U.S. DOC ITA.
USCBC – US-China Business Council, 2015a, Update: Competition Policy & Enforcement, available from: https://www.uschina.org/reports/update-competition-policy-enforcement-china (accessed: 18.05.2015).
USCBC, 2015b, Update: China’s Innovation &Government Procurement Policies, available from: https://www.uschina.org/sites/default/files/2015.05%20USCBC%20Status%20Report%20on%20Indigenous%20Innovation%20and%20Government%20Procurement_0.pdf (accessed: 31.05.2015).
USCBC, 2014, Competition Policy and Enforcement in China, available from: https://www.uschina.org/sites/default/files/AML%202014%20Report%20FINAL_0.pdf (accessed: 18.05.2015).

© THINK!DESK China Research & Consulting 2015 Seite 383
USCBC, 2013a, Rebalancing the Economy: Practical Ways That China Can Increase Im-ports and Boost Consumption, available from: https://www.uschina.org/sites/default/files/Rebalancing%20the%20Economy%20and%20Trade_Practical%20Ways%20That%20China%20Can%20Increase%20Imports_July%2023%202013.pdf (accessed: 10.05.2015).
USCBC, 2013b, China’s Strategic Emerging Industries: Policy, Implementation, Challenges, & Recommendations, available from: https://www.uschina.org/sites/default/files/sei-report.pdf (accessed: 25.05.2015).
USTR, 2015, National Trade Estimate Report on Foreign Trade Barriers, available from: https://ustr.gov/sites/default/files/files/reports/2015/NTE/2015%20NTE%20China.pdf (accessed: 18.05.2015).
USTR, 2014a, U.S.-China Joint Fact Sheet on the 25th U.S.-China Joint Commission on Commerce and Trade, available from: https://ustr.gov/about-us/policy-offices/press-office/fact-sheets/2014/december/us-china-joint-fact-sheet-25th-us (accessed: 18.05.2015).
USTR, 2014b, National Trade Estimate Report on Foreign Trade Barriers, available from: https://ustr.gov/sites/default/files/2014%20NTE%20Report%20on%20FTB%20China.pdf (accessed. 18.05.2015).
USTR, 2013, National Trade Estimate Report on Foreign Trade Barriers, available from: https://ustr.gov/sites/default/files/2013%20NTE%20China%20Final.pdf (accessed: 18.05.2015).
USTR and US DOC (eds), 2015, Subsidies Enforcement - Annual Report to Congress, avail-able from: http://enforcement.trade.gov/esel/reports/seo2015/seo-annual-report-2015.pdf (accessed: 03.05.2015).
Walter, Carl E. and Fraser Howie, 2012, Red Capitalism. The fragile financial foundation of China’s extraordinary rise, Singapore.
Wang, Yikai, 2015, Will China Escape the Middle-income Trap? A Politico-economic Theory of Growth and State Capitalism, Working Paper.
Wangyi, 14.07.2014, 2014 China Top 500 Ranking: Top 10 monopolized by SOEs, available from: http://money.163.com/14/0714/07/A13L4AI300254A65_all.html (accessed: 23.05.2015) (in Chinese).
Washington Post, The, 27.02.2015, China removes top U.S. tech firms from government purchasing list, available from: http://www.washingtonpost.com/world/china-bars-top-us-technology-firms-from-government-list/2015/02/26/ebd4282c-bda1-11e4-9dfb-03366e719af8_story.html (accessed: 10.05.2015).
Wei, Xiangyun, 2008, Survival of the third person: A study of industry associations in China, Beijing: China Society Press (in Chinese).
Weifang City, 2010, Opinions of the People’s Government of Weifang City on Accelerating the Implementation of Emerging Industry Development, WeiZhengFa 2010, No. 26 (in Chinese).
Wen Jiabao, 2011, Concerning Several Problems in Carrying Out Science and Technology Work, in Qiushi, No. 14 (in Chinese).
Wiley Rein LLP, 25.08.2014, United States Identifies More Than 150 Chinese State Trading Enterprises after China’s Failure to Notify, available from: http://www.wileyrein.com/newsroom-articles-3264.html (accessed: 02.05.2015).
World Bank and The People's Republic of China Development Research Center of the State Council, 2014, Urban China: Toward Efficient, Inclusive, and Sustainable Urbaniza-tion. July 2014, 263-336.

© THINK!DESK China Research & Consulting 2015 Seite 384
World Bank, 2014a, Doing Business 2015 - Economy Profile 2015 China, Washington DC: The World Bank.
World Bank, 2014b, World Development Indicators, available from: http://data.worldbank.org/indicator/NE.GDI.TOTL.ZS (accessed: 15.04.2015).
World Coal Association, 2014, Coal and Steel Statistics 2014, available from: http://www.worldcoal.org/bin/pdf/original_pdf_file/coal_steel_facts_2014(12_09_2014).pdf (accessed: 11.03.2015).
WSJ – Wall Street Journal, 23.06.2015, The Whiplash of Xi Jinping’s Top-Down Style, avail-able from: http://www.wsj.com/articles/the-whiplash-of-xis-top-down-style-1435031502 (accessed: 24.06.2015).
WSJ, 14.05.2015, China’s PBOC Asks Banks to Hold Steady on Deposit Rates, available from: http://www.wsj.com/articles/china-central-bank-asks-banks-to-hold-steady-on-deposit-rates-1431592577?cb=logged0.9337321390200503 (accessed: 17.05.2015).
WSJ, 08.04.2015, China Aims to Soothe Labor Unrest, available from: http://www.wsj.com/articles/china-aims-to-soothe-labor-unrest-1428478396 (ac-cessed: 15.04.2015).
WSJ, 26.03.2015, Slowing Chinese Economy Hits Profits of Two Big State Banks, available from: http://www.wsj.com/articles/slowing-chinese-economy-hits-profits-of-two-big-state-banks-1427372707 (accessed: 01.06.2015).
WSJ, 24.03.2015, China to Set More Free-Trade Zones, available from: http://www.wsj.com/articles/china-to-set-more-free-trade-zones-1427199186 (ac-cessed: 10.05.2015).
WSJ, 28.09.2014, One Year On, Shanghai Free-Trade Zone Disappoints, available from: http://www.wsj.com/articles/one-year-on-shanghai-free-trade-zone-disappoints-1411928668 (accessed: 10.05.2015).
WSJ, 07.08.2014, Meet China’s Boomerang Kids: One-Third of Graduates Still Rely on Par-ents, Survey Says, available from: http://blogs.wsj.com/chinarealtime/2014/08/07/meet-chinas-boomerang-kids-one-third-of-graduates-still-rely-on-parents-survey-says/ (accessed: 13.04.2015).
WSJ, 24.04.2014, Cnooc's Nexen Energy CEO Steps Down, available from: http://www.wsj.com/articles/SB10001424052702304788404579521240421725628 (accessed: 14.06.2015).
WSJ, 20.03.2014, China Plans to Create Iron-Ore Mining Giant - Goal is to Limit Depend-ence on Imports, available from: http://www.wsj.com/articles/SB10001424052702303802104579450302588753602 (accessed: 10.01.2015).
WSJ, 03.12.2013, Skepticism on China’s Nonperforming Loans, available from: http://www.wsj.com/news/articles/SB10001424052702304355104579235084041750444 (accessed: 15.03.2015).
WSJ, The, 11.09.2012, Chinese Auto Makers: Joint-Venture Junkies?, available from: http://blogs.wsj.com/chinarealtime/2012/09/11/chinese-automakers-joint-venture-junkies/ (accessed: 10.05.2015).
WTO, 2015, China — Measures Related to Demonstration Bases and common Service Plat-forms Programmes, Overview of Dispute 489, available online: https://www.wto.org/english/tratop_e/dispu_e/cases_e/ds489_e.htm (accessed: 15.03.2015).
WTO – World Trade Organisation, 2015, China — Measures Related to Demonstration Ba-ses and common Service Platforms Programmes, Overview of Dispute 489, available

© THINK!DESK China Research & Consulting 2015 Seite 385
online: https://www.wto.org/english/tratop_e/dispu_e/cases_e/ds489_e.htm (ac-cessed: 15.03.2015).
WTO, 2014a, Trade Policy Review on China, Geneva: The World Trade Organization.
WTO, 2014b, Subsidies – Request from the United States to China pursuant to article 25.10 of the agreement, Committee on Subsidies and Countervailing Measures, Document No. G/SCM/Q2/CHN/51.
WTO, 2011a, China – Measures related to the exportation of various raw materials, Reports of the Panel, Document Nos. WT/DS/394/R, WT/DS/395/R, WT/DS/398/R.
WTO, 2011b, Subsidies – Request from the United States to China pursuant to article 25.10 of the agreement, Committee on Subsidies and Countervailing Measures, Document No. G/SCM/Q2/CHN/42.
WTO, 2008, Trade Policy Review–Report by the Secretariat: China, Document-symbol: WT/TPR/S/199. available from: http://www.wto.org/english/tratop_e/tpr_e/s199-00_e.doc (accessed: 31.05.2015).
WTO, 2006, Subsidies – New and Full Notification Pursuant to Article XVI:1 of the GATT 1994 and Article 25 of the SCM Agreement, Document Id: G/SCM/N/123/CHN, Ge-neva: World Trade Organization, Committee on Subsidies and Countervailing Measures.
WTO, 2004, Subsidies – Request from the United States to China pursuant to Article 25.8 of the Agreement on Subsidies and Countervailing Measures, Document Id: G/SCM/Q2/CHN/9, Geneva: World Trade Organization, Committee on Subsidies and Countervailing Measures.
WTO, 1994a, Agreement on Subsidies and Countervailing Measures (SCM Agreement), available from: https://www.wto.org/english/docs_e/legal_e/24-scm.pdf, (accessed: 23.05.2015).
WTO, 1994b, Understanding on the Interpretation of Article XVII of GATT 1994 in the Uru-guay Round of Trade Negotiations, Geneva: The WTO.
WTO, n. d., Statistics on Subsidies and Countervailing Measures, available from: https://www.wto.org/english/tratop_e/scm_e/scm_e.htm (accessed: 10.04.2015).
WTO, n. d., Statistics on Anti-dumping, available from: https://www.wto.org/english/tratop_e/adp_e/adp_e.htm (accessed: 10.04.2015).
Xi’an City, 2011, Circular of the General Office of the People’s Government of Xi’an City on Printing the 12th Five-year Programme for Industrial Development, ShiZhengBanFa 2011, No. 114.
Xiao, Yuan, 2015, Making Land Fly – Land Quota Markets in Chinese Urbanization, Colum-bia Law School Working Paper No. 22, available from. http://marroninstitute.nyu.edu/uploads/content/Making_Land_Fly_-_Yuan_Xiao.pdf (accessed: 15.03.2015).
Xiao, Yuan and Jinhua Zhao, 2015, Fixing China’s Distorted Urban Land Quota System, Paulson Policy Memorandum, available from: http://www.paulsoninstitute.org/wp-content/uploads/2015/04/PPM_Land-Quotas_Xiao-and-Zhao_English.pdf (accessed: 10.05.2015).
Xie, Yu and Xiang Zhou, 2014, Income inequality in today’s China, in Proceedings of the National Academy of Sciences of the United States of America, Vol. 111, No. 19, p. 6928-6933.
Xinhua, 23.04.2015, Benz fined 350 million RMB in Jiangsu price monopoly probe, several sales branches also hit with fines, available from:

© THINK!DESK China Research & Consulting 2015 Seite 386
http://news.xinhuanet.com/auto/2015-04/23/c_127724270.htm (accessed: 18.05.2015) (in Chinese).
Xinhua, 04.03.2015, China's long-term plan for manufacturing to be submitted to cabinet, available from: http://en.xinfinance.com/html/Industries/Manufacturing/2015/60861.shtml (accessed: 10.03.2015).
Xinhua, 20.02.2014, NDRC’s antimonopoly sword takes 825 million RMB in total sanctions from 64 bank organizations, available from: http://news.xinhuanet.com/fortune/2014-02/20/c_126163897.htm (accessed: 17.05.2015) (in Chinese).
Xinhua, 30.08.2010, Total profits of top 500 private firms no match for two large central SOEs, available from: http://news.xinhuanet.com/fortune/2010-08/30/c_12496387.htm (accessed: 20.05.2015).
Xinhua, 08.05.2009, Trial Administrative Measures on Oil Price, available from: http://news.xinhuanet.com/fortune/2009-05/08/content_11336876.htm (accessed: 04.06.2015) (in Chinese).
Xinhua, 25.10.2007, Constitution of Communist Party of China, available from http://news.xinhuanet.com/english/2007-10/25/content_6944738.htm (accessed: 16.10.2014) (in Chinese).
Xinhua, 18.11.2002, Full text of Jiang Zemin's report at 16th Party congress, available from: http://news.xinhuanet.com/english/2002-11/17/content_632286.htm (accessed: 15.01.2015).
Xu, Chenggang, 2011, The Fundamental Institutions of China’s Reforms and Development, in: Journal of Economic Literature, Vol. 49:4, pp. 1076-1151.
Zhang, Weiwen et al., 2014, Economic development and farmland protection: An assess-ment of rewarded land conversion quotas trading in Zhejiang, China, in Land Use Pol-icy, Vol. 38, May 2014, p. 467-476.
Zhejiang Province, 2013, Circular on further strengthening the administrative work for new products (new technologies) in Zhejiang Province, ZheJingXinJiShu 2013, No. 118 (in Chinese).
Zhejiang Province, 2012a, Circular concerning Reporting on the Foreign Trade Common Service Platforms Project Plan for 2012 in Zhejiang Province, ZheMaoWuLianFa 2012, No. 46 (in Chinese).
Zhejiang Province, 2012b, Circular concerning Strengthening the Establishment of Foreign Trade Common Service Platforms, ZheShangWuLianFa 2012, No. 27 (in Chinese).
Zhejiang Province, 2011, Circular concerning Doing Well in Establishing Fund Management for Foreign Trade Common Service Platforms in 2011, ZheCaiQi 2011, No. 206 (in Chinese).
Zhejiang Province, 2010, Notice of the General Office of the People’s Government of Zhejiang Province concerning the publication of the list of leading industrial backbone enterprises of Zhejiang Province (in Chinese).
Zhejiang Province, 2007, Implementation Plan of Zhejiang Province for Establishing Innova-tive Enterprises (in Chinese).
Zhejiang Province, 2006, 11th FYP for the Manufacturing Industry in Zhejiang Province (in Chinese).
Zhejiang Province, 2001, Interim Measures for the Administration of Special Funds for Pa-tents (in Chinese).
© THINK!DESK China Research & Consulting 2015 Seite 387
Zhengzhou City, 2011, Opinions of the People’s Government of Zhengzhou City on Support-ing the Development of New-energy Vehicles, ZhengZhengWen 2011, No. 205 (in Chinese).
Zhou, L., 2007, Governing China's Local Officials: An Analysis of Promotion Tournament Model, Working Paper of the Guanghua School of Management and IEPR, Peking University.
Zhuhai City, 2011, Circular of the General Office of the People’s Government of Zhuhai City on Printing the Development Programme for New-energy Vehicles of Zhuhai City, ZhuFuBan 2011, No. 11 (in Chinese).

© THINK!DESK China Research & Consulting 2015 Seite 388
DISCLAIMER
The information contained in this report is based upon or derived from sources that are be-
lieved to be reliable; however, no representation is made that such information is accurate or
complete in all material respects, and reliance upon such information as the basis for taking
any actions is neither authorized nor warranted.
This report is intended for the use and assistance of clients of THINK!DESK China Research
& Consulting. It should not be regarded as a substitute for the exercise by the recipient of
their own judgement. THINK!DESK China Research & Consulting and/or any person con-
nected with it accepts no liability whatsoever for any direct or consequential loss of any kind
arising out of the use of this report or any part of its contents.
It should be noted that a variety of factors, including e.g. changes in prices, shifts in demand,
variations in supply, international currency movements, technological developments, gov-
ernmental actions and/or other factors, including our own misjudgements or mistakes, may
cause the statements herein concerning present and future conditions, results and trends to
be inaccurate.