assessment of the potential health impacts of - alaska of the potential health impacts of ... 2.3...
TRANSCRIPT
I
Assessment of the Potential Health Impacts of
Climate Change in Alaska
Contributed by Sarah Yoder, MS, Alaska Section of Epidemiology
January 8, 2018
Acknowledgments: We thank the following people for their contributions to this report:
Dr. Sandrine Deglin and Madison Pachoe, Alaska Section of Epidemiology; Dr. Bob
Gerlach, Alaska Department of Environmental Conservation; Dr. James Fall, Alaska
Department of Fish and Game; Michael Brubaker, Alaska Native Tribal Health
Consortium; Dr. Robin Bronen, Alaska Institute for Justice; Dr. Tom Hennessy, CDC
Arctic Investigations Program; and Dr. Ali Hamade, Dr. Paul Anderson, and Dr. Yuri
Springer, former Alaska Section of Epidemiology staff.
Department of Health and Social Services
Valerie J. Davidson, Commissioner
Division of Public Health
Jay C. Butler, MD, Chief Medical Officer and Director
Editors
Joe McLaughlin, MD, MPH Louisa Castrodale, DVM, MPH
Volume 20 Number 1
3601 C Street, Suite 540
Anchorage, Alaska 99503 http://dhss.alaska.gov/dph/Epi
Local (907) 269-8000
24 Hour Emergency 1-800-478-0084

II
TABLE OF CONTENTS
EXECUTIVE SUMMARY .......................................................................................................................... V
Key Potential Adverse Health Impacts by Health Effect Category .............................................. VII
Summary Recommendations ........................................................................................................... X
1.0 INTRODUCTION AND OVERVIEW ............................................................................................1
1.1 Climate Change Overview and Description ........................................................................1
1.2 HIA Overview .....................................................................................................................1
1.3 Legal Requirements for Health Impact Assessment (HIA) .................................................1
1.4 Purpose of Document ..........................................................................................................1
1.5 HIA Framework and Methodology .....................................................................................1
1.5.1 HIA Definition .......................................................................................................1
1.5.2 HIA Methods ..........................................................................................................2
1.5.3 HIA Scope ..............................................................................................................2
2.0 OBSERVED AND PREDICTED CLIMATE CHANGE ................................................................5
2.1 Climate Change Defined .....................................................................................................5
2.2 Climate Change Indicators ..................................................................................................5
2.3 Evidence of Climate Change in Alaska ...............................................................................6
2.3.1 Temperature ...........................................................................................................6
2.3.2 Precipitation ...........................................................................................................6
2.3.3 Weather Patterns ....................................................................................................6
2.3.4 Sea Ice ....................................................................................................................7
2.3.5 Glaciers...................................................................................................................7
2.3.6 Permafrost ..............................................................................................................8
2.3.7 Sea Levels ..............................................................................................................8
2.4 Climate Change Predictions for Alaska ..............................................................................9
2.4.1 Temperature .........................................................................................................11
2.4.2 Precipitation .........................................................................................................12
2.4.3 Weather Patterns ..................................................................................................12
2.4.4 Sea Ice ..................................................................................................................12
2.4.5 Glaciers.................................................................................................................12
2.4.6 Permafrost ............................................................................................................12
2.4.7 Sea Levels ............................................................................................................13
2.5 Climate Change and Health ...............................................................................................14
2.6 Potentially Affected Communities ....................................................................................15
3.0 PRIORITIZING HEALTH IMPACTS ..........................................................................................16
3.1 Potential Impacts by Health Effect Category ....................................................................17
3.1.1 Mental Health and Wellbeing...............................................................................17
3.1.2 Accidents and Injuries ..........................................................................................19
3.1.3 Exposure to Potentially Hazardous Materials ......................................................21
3.1.4 Food, Nutrition, and Subsistence Activity ...........................................................24
3.1.5 Infectious Diseases and Toxins from Microorganisms ........................................26
3.1.6 Non-communicable and Chronic Diseases ...........................................................30
3.1.7 Water and Sanitation ............................................................................................31
3.1.8 Health Services Infrastructure and Capacity ........................................................33
3.2 Key Potential Health Impacts by Health Effect Category .................................................35
3.3 Monitoring Recommendations and Adaptation Strategies ................................................37

III
3.3.1 Monitoring Recommendations .............................................................................37
3.3.2 Adaptation Strategies ...........................................................................................43
4.0 REFERENCES ...............................................................................................................................45
5.0 APPENDIX 1: CLIMATE CHANGE INDICATORS ...................................................................55
5.1.1 Temperature .........................................................................................................55
5.1.2 Precipitation .........................................................................................................55
5.1.3 Weather Patterns ..................................................................................................55
5.1.4 Sea Ice ..................................................................................................................55
5.1.5 Glaciers.................................................................................................................56
5.1.6 Permafrost ............................................................................................................56
5.1.7 Sea Levels ............................................................................................................56
6.0 APPENDIX 2: EVIDENCE FOR CLIMATE CHANGE OUTSIDE OF ALASKA .....................57
6.1.1 Temperature .........................................................................................................57
6.1.2 Precipitation .........................................................................................................61
6.1.3 Sea Ice ..................................................................................................................64
6.1.4 Glaciers.................................................................................................................64
6.1.5 Sea Levels ............................................................................................................65
7.0 APPENDIX 3: POTENTIAL HEALTH IMPACTS OF CLIMATE CHANGE, BY
CLIMATE CHANGE FACTOR ....................................................................................................66

IV
TABLES
Table 1. Health Effect Categories ................................................................................................... 3
Table 2. Summary of Climate Change Predictions for Alaska ........................................................ 9
Table 3. Example of a System to Rank the Timing and Magnitude of Health Impact Dimension
Criteria ........................................................................................................................................... 35
Table 4. Notional Example of Potential Adverse Health Impacts of Climate Change Statewide, by
Health Effect Category* ................................................................................................................ 36
Table 5. Proposed Health and Environmental Indicators and Monitoring Resources ................... 38
Table 6. Overarching Adaptation Strategy Examples for Communities ....................................... 43
Table 7. Health Effect Category-Specific Adaptation Strategy Examples for Alaska Communities
....................................................................................................................................................... 44
FIGURES
Figure 1. March and September Monthly Average Sea Ice Extent, 1979-2016 .............................. 7
Figure 2. Mean Decadal Annual Temperature for Alaska, by Region .......................................... 11
Figure 3. Climate Change and Human Health ............................................................................... 14

V
EXECUTIVE SUMMARY
Background
Over the past century, the air and water temperatures in Alaska have
warmed considerably faster than in the rest of the United States.
Because Alaska is the only Arctic state in the Nation, Alaskans are
likely to face some climate change challenges that will be different
than those encountered in other states. For example, permafrost
currently underlies 80% of Alaska and provides a stable foundation
for the physical infrastructure of many Alaska communities. As has
already been seen in numerous villages, the groundcover that
overlies permafrost is vulnerable to sinking or caving if the
permafrost thaws, resulting in costly damage to physical
infrastructure. The reliance on subsistence resources is another
contrast to many other states. Many Alaskans depend upon
subsistence harvests of fish and wildlife resources for food and to
support their way of life. Some Alaskans report that the changing
environment has already impacted their traditional practices.
Many past efforts to characterize the potential impacts of climate
change in Alaska have focused primarily on describing expected
changes to the physical environment and the ecosystem, and less on
describing how these changes, in addition to changes in animal and
environmental health, could affect human health. Thus, a careful
analysis of how climate change could affect the health of people
living in Alaska is warranted. The Alaska Division of Public Health
has conducted such an assessment using the Health Impact
Assessment (HIA) framework; the assessment is based on the
current National Climate Assessment (NCA) predictions for Alaska.
The document is intended to provide a broad overview of the
potential adverse human health impacts of climate change in Alaska
and to present examples of adaptation strategies for communities to
consider when planning their own response efforts. This document
does not present a new model for climate change in Alaska, and it
does not offer a critique of the NCA predictions for Alaska.
Finally, while this assessment is focused on the potential adverse
health impacts of climate change in Alaska, it is important to note
that there will likely be some beneficial health impacts of climate
change in Alaska as well. For example, warmer temperatures might
be more conducive to a longer growing season and growing a wider range of agricultural crops,
resulting in increased food security in some areas. Warmer winter temperatures might also lead to
fewer injuries and fatalities related to cold temperatures.
Big Picture Overview
What is already known about this
topic?
Alaska is experiencing changes in
climate, and temperatures in the state
have warmed faster than the rest of
the United States. Climate change has
already affected human health in
Alaska and additional impacts are
likely to occur.
What is added by this report?
The impacts of climate change in
Alaska have been well documented in
historical, environmental, and
regional contexts, but little has been
published on the range of human
health impacts statewide. This report
provides a broad assessment of the
potential adverse human health
impacts of climate change in Alaska.
This report is also intended to serve
as a resource for communities to
determine which adverse impacts of
climate change are most likely to
affect their residents and to help
communities develop their own
adaptation strategies for climate
change.

VI
Climate Change Predictions for Alaska
This HIA is based on assumptions and projections provided in the third NCA report and
supporting documents, including Volume I of the fourth NCA. The NCA frequently refers to
Scenario A2, which assumes increasing concentrations of greenhouse gases in the Earth’s
atmosphere and has been considered as a plausible climate scenario in multiple climate
assessments. This HIA presents a general picture of what climate conditions might look like in
Alaska, based on Scenario A2, as well as additional simulations presented by other agencies.
Highlights of these predictions are below.
Temperature: Compared to 1971–1999, Alaska’s average annual temperature is expected to be
2°–4°F higher in 2050 and 8°–9°F higher in 2100. Moreover, projections indicate that as
temperatures increase, near-surface permafrost will disappear from much of Alaska by 2100 and
the permafrost boundary will move hundreds of miles northward by the end of the century.
Precipitation: The average annual precipitation is predicted to increase by 15%–30% by 2100,
compared to the reference period of 1971–1999. Snowfall amounts are predicted to decrease, but
more areas will likely become wetter due to increased duration and volume of rainfall. Much of
the increased precipitation is likely to evaporate because of increased temperatures. Extreme
storms and extreme precipitation events may also increase.
Sea Ice Extent: Summer sea ice is predicted to disappear in the Chukchi Sea by 2050, and winter
sea ice could decrease by 50% in the Bering and Chukchi Seas by the end of the century.
Climate Change and Potential Health Impacts in Alaska
The Alaska Division of Public Health typically assesses health impacts using health effect
categories (HECs), which have been developed to identify the full spectrum of possible health
impacts related to a specific scenario. Examples are provided below of what has been observed in
each of these categories and what may be expected for the next 20–50 years, given the climate
change predictions for Alaska (note: a wide range of examples of potential adverse health impacts
of climate change in Alaska that are not provided in this executive summary are presented in the
full document). It is important to note that climate-associated health impacts on communities are
magnified by additional social and economic stresses that are not reviewed in this HIA.
Mental Health and Wellbeing: Climate change can affect mental health by causing solastalgia, the
distressing sense of loss that people experience as a result of unwanted environmental changes
that occur close to one’s home, and associated pathologies including anxiety, depression, and
post-traumatic stress disorder that can result from acute events such as fires, floods, and storm
surges, and more protracted changes such as thawing permafrost and coastal erosion. These
effects tend to disproportionately impact those living in low-resource settings, including
indigenous groups. Psychosocial distress and its associated comorbidities will likely continue to
increase in Alaska as communities experience unwanted changes in their environment.
Accidents and Injuries: Accidents and injuries due to extreme weather events, such as droughts,
floods, and storms, are predicted to increase with climate change, and some reports suggest that
such increases are already occurring. Flooding is a particular concern of extreme precipitation
events and coastal storms, as floods are the second only to heat as the deadliest of all weather
hazards in the United States. Extreme precipitation events can also lead to fatal- and non-fatal
injuries due to mudslides, debris flow, and avalanches. Moreover, motor vehicle accidents may
increase as thawing permafrost and the freeze-thaw cycles in the active layer of soil can cause

VII
damage to the transportation infrastructure in Alaska, which includes highways, railroads, and
airstrips.
Potential Exposure to Hazardous Materials: A warming climate is predicted to lead to more
frequent and larger fires in the Arctic. Over 5 million acres burned in Alaska in 2015, making it
one of the worst recorded fire seasons ever. Fairbanks has had multiple air quality advisories in
recent years due to hazardous conditions from wildfire smoke. As large wildfires increase, more
poor air quality events are likely to occur, potentially leading to exacerbations of pre-existing
respiratory and cardiovascular illnesses.
Food, Nutrition, and Subsistence Activity: Diminished food quality and quantity as well as
changing food distribution and subsistence patterns are predicted to continue to arise from climate
change. In Alaska, for example, hunters report thinning sea and river ice, which makes harvesting
wild foods more dangerous. Storing and harvesting wild foods may also become more difficult
with increased temperature and precipitation.
Infectious Diseases and Toxins from Microorganisms: Increasing temperatures and changing
weather patterns could have many implications for infectious diseases in Alaska, especially
waterborne and vectorborne diseases. For example, increased water temperatures could lead to
more outbreaks of Vibrio parahaemolyticus gastroenteritis. Additionally, increased air
temperatures could facilitate the northern spread of insects that can transmit West Nile Virus and
Lyme disease.
Non-communicable and Chronic Diseases: Climate change is predicted to affect allergies and
respiratory health as higher temperatures and changes in precipitation influence the abundance,
seasonality, and distribution of aeroallergens (e.g., plant pollen). As a result, rates of allergic
rhinitis (hay fever) and asthma are predicted to increase due to changes in aeroallergen
concentrations. Warmer average winter temperatures in Alaska might have already contributed to
an increase in patients seeking health care due to reactions from insect (e.g., yellowjacket) stings.
Water and Sanitation: Climate change brings a new complication to the challenge of addressing
Alaska’s existing water and sanitation disparities. Water and sanitation infrastructure damage has
already occurred in some communities due to coastal erosion, thawing permafrost, storm surges,
and flooding. Further damage to drinking water, wastewater, or storm water systems could
adversely impact human health by way of facilitating waterborne diseases and decreasing the
availability and quality of drinking water.
Health Services Infrastructure and Capacity: Thawing permafrost, erosion, wildfires, and flood
events could damage health care infrastructure and decrease access to care by making travel to
clinics more challenging.

VIII
Key Potential Adverse Health Impacts by Health Effect Category
One initial step that local communities can take to prepare for climate change is to identify and
prioritize the potential health impacts that will be most relevant to their community and, for each
identified impact, determine the expected timing and magnitude of the effect. Examples of
criteria that could be used for this application include (a) potential time to impact, (b) geographic
extent of the impact, (c) the number of people directly impacted, (d) the number of people
impacted who might experience serious health problems, and (e) resources needed to adapt to the
impact. These criteria can then be summarized and presented in a simplified visual format such as
a tiered and color-coded table. Next, communities can create a table that displays what the
potential adverse health impacts of climate change might look like in their community for each
health effect category to help prioritize adaptation strategies and resource needs (an example of
what such a table might look like on a statewide basis is presented in the full document).
Summary of Monitoring and Adaptation Recommendations
The monitoring recommendations provided in this HIA are intended to help characterize the
adverse health impacts of climate change over time. Monitoring indicators and resources are
listed to help decision-makers and other stakeholders develop surveillance strategies and identify
agencies currently collecting the relevant health and environmental data. Examples of proposed
monitoring indicators include cases of selected infectious diseases, hospitalizations and deaths
due to climate-related events (e.g., flooding, storm surges, wildfires), and changes in subsistence
food consumption and food security. Examples of monitoring resources provided include the
Scenarios Network for Alaska + Arctic Planning (SNAP) for community profiles on observed and
projected temperatures; the Local Environmental Observer (LEO) Network for postings by local
observers and topical experts about unusual animal, environment, and weather events; and the
Alaska Trauma Registry (ATR) for injury trends. Where possible, this HIA identifies monitoring
strategies that have been developed and tested by other state, federal, and international entities.
The adaptation recommendations provided in this HIA are intended to reduce morbidity and
mortality from climate-related causes. Adaptation as it relates to climate change is defined by the
Intergovernmental Panel on Climate Change as the “adjustment in natural or human systems in
response to actual or expected climatic stimuli or their effects, which moderates harm or exploits
beneficial opportunities.” Examples of proposed overarching adaptation strategies include
developing local and statewide climate change advisory groups, assessments, and adaptation
plans; offering community members opportunities to relay their concerns about climate change
and propose solutions; including human health in community vulnerability assessments for
climate change; and assuring an adequate workforce capable of performing climate change
research, surveillance, and adaptation. More specific adaptation strategies are also provided, such
as reviewing architecture and engineering designs to ensure that plumbing infrastructure can
withstand changes to the underlying permafrost, and if not, consider ways to address the problem;
supporting successful community-based mental health wellness programs; and developing
community response plans for wildfires.

1
1.0 INTRODUCTION AND OVERVIEW
1.1 Climate Change Overview and Description
Climate change refers to both local and global alterations in climate, as well as the secondary effects of
new climate conditions (such as decreasing sea ice). Rising temperatures, changes to precipitation, and
increased frequency of extreme weather events are only a few of the commonly discussed features of
climate change (IPCC, 2012). Each of these features has implications for ecosystems and human health
(Luber et al., 2014; NCA, 2014).
1.2 HIA Overview
This Health Impact Assessment (HIA) provides a review of potential adverse human health impacts
related to climate change in Alaska. It will (1) provide a broad overview of the wide range of potential
adverse climate change impacts on human health in Alaska, (2) present the most current climate change
information, to the extent possible, and (3) present examples of strategies for communities and decision-
makers to consider when planning their own actions in response to climate change.
1.3 Legal Requirements for Health Impact Assessment (HIA)
The State of Alaska developed an HIA Toolkit to guide HIA practitioners in the state (referred to as
Alaska HIA Toolkit; ADHSS, 2015). This Climate Change HIA represents a non-traditional HIA for
Alaska (in that it does not focus on a proposed resource development project), though it still uses the HIA
Toolkit as a guiding framework. As with traditional Alaska HIAs, this document and its related
recommendations are not legally binding for any agency.
1.4 Purpose of Document
This report is intended to identify available information and enhance knowledge on climate change and
how it might negatively impact human health in Alaska. It uses the structure of HIA to characterize and
forecast the potential adverse health impacts of climate change in the state. A review of this type is
especially important because there has not been a statewide comprehensive review or extensive
discussion of potential human health impacts of climate change in Alaska. This report will be useful for
communities and decision-makers in determining how to prioritize monitoring and adaptation strategies
related to climate change.
1.5 HIA Framework and Methodology
1.5.1 HIA Definition
Health Impact Assessment is a combination of procedures, methods, and tools by which a policy,
program, or project may be judged as to its potential effects on the health of a population, and the
distribution of those effects within the population.

2
1.5.2 HIA Methods
Using methodology presented in the Alaska HIA Toolkit (ADHSS, 2015), this HIA
Reviews components of climate change based on climate change predictions for Alaska,
Reviews the physical and general environmental setting of predicted changes,
Identifies potential adverse health impacts using a set of defined health effect categories (HECs),
Provides a perspective of the wide range of potential climate change impacts on human health in
the state, and
Provides examples of monitoring recommendations and adaptation strategies tied to potential
health impacts.
1.5.3 HIA Scope
This HIA reviews the potential health impacts of climate change in Alaska primarily based on the
following information:
State of Alaska (SOA) databases and reports
The National Climate Assessment (NCA) and associated documents
The United States Global Change Research Program’s (USGCRP) Climate and Health
Assessment, 2016
General methodologic parameters developed by the Alaska HIA Toolkit
1.5.3.1 Areas Outside the Scope of the HIA
While this HIA is focused on the potential adverse health impacts of climate change in Alaska, it is
important to note that there will likely be beneficial health impacts of climate change in Alaska as well.
For example, warmer temperatures could be more conducive to a longer growing season and growing a
wider range of agricultural crops, which would increase food security in some areas. Warmer winter
temperatures might also lead to fewer injuries and fatalities related to cold temperatures. That said, the
instances of potential benefits of climate change are likely to be limited in number and smaller in
magnitude than the adverse consequences (e.g., the increase in food security from the ability to grow new
crops is likely to be smaller than the decrease in food security resulting from the decreased availability of
some subsistence resources; USGCRP, 2016). Local communities can maximize potential positive health
impacts of climate change by prioritizing their adaptation strategies and taking timely action steps.
1.5.3.2 Health Effect Categories (HECs)
The Alaska-specific HECs are a standard set of health effect categories that have been developed and
discussed in the Alaska HIA Toolkit (Table 1). HECs have been developed to identify the full spectrum of
possible health impacts related to a specific project or, in the case of this HIA, a set of climate change
predictions. This climate change HIA adapted the Alaska HECs to better suit a discussion of climate
change. As such, the Social Determinants of Health—the conditions in which people are born, grow up,
live, work, and age (USDHHS, 2017)—are discussed as a constellation of factors that have implications
within each HEC, rather than as a separate HEC, and Mental Health and Wellbeing was added as a new
HEC. Finally, the advantage of the HEC structure is completeness, the disadvantage is occasional
redundancy as some of the HECs overlap (e.g., mental health and wellbeing can be related to food,
nutrition, and subsistence activities).

3
Table 1. Health Effect Categories
Health Effect Category Pathway Description
Mental Health and
Wellbeing
This category pertains to outcomes and determinants related to
mental health, substance use, social exclusion, psychosocial
distress, historical trauma, family dynamics, economic stressors,
and social support systems.
The key outcomes considered are increases and decreases in
psychosocial distress and its associated comorbidities, adverse
health behaviors (such as substance abuse), anxiety, depression,
and suicide.
Accidents and Injuries This category pertains to health outcomes and determinants
related to accidents and injuries.
The key outcomes considered are increases and decreases in
intentional and unintentional injuries with fatal and nonfatal
results. The key determinants in this category include items such
as the presence of law enforcement, traffic patterns, alcohol
involvement, distance to emergency services, and the presence
of prevention programs.
Exposure to Potentially
Hazardous Materials
This category pertains to health outcomes and determinants that
may arise from exposure to hazardous materials.
The key health outcomes considered are increases and decreases
in documented illnesses or exacerbation of illnesses commonly
associated with pollutants of potential concern. These may be
mediated through inhalation, ingestion, or physical contact.
Food, Nutrition, and
Subsistence Activity
This category pertains to health outcomes and determinants
related to food security, dietary choices, and the consumption of
subsistence foods.
The key health outcomes considered are nutrient levels,
malnutrition or improvements in nutrient intake, and the
subsequent increases or decreases in related diseases. The key
determinants include diet composition, food security, and the
consumption of subsistence foods.
Infectious Diseases and
Toxins from
Microorganisms
This category pertains to health outcomes and determinants that
result from infectious diseases.
The key health outcomes include rates of increase or decrease
for a range of infectious diseases, such as sexually transmitted
infections (STI), respiratory illnesses, or skin infections.
Important health determinants may include immunization rates
and the presence of infectious disease prevention efforts.
Water and Sanitation
This category pertains to changes to access, quantity, and quality
of water supplies.
4
Table 1. Health Effect Categories
Health Effect Category Pathway Description
Key determinants reviewed may include distance to clean water,
water fluoridation, indoor plumbing, water treatment facilities,
adequate volume of water resources, and the existence of
community facilities, such as a washeteria and/or community.
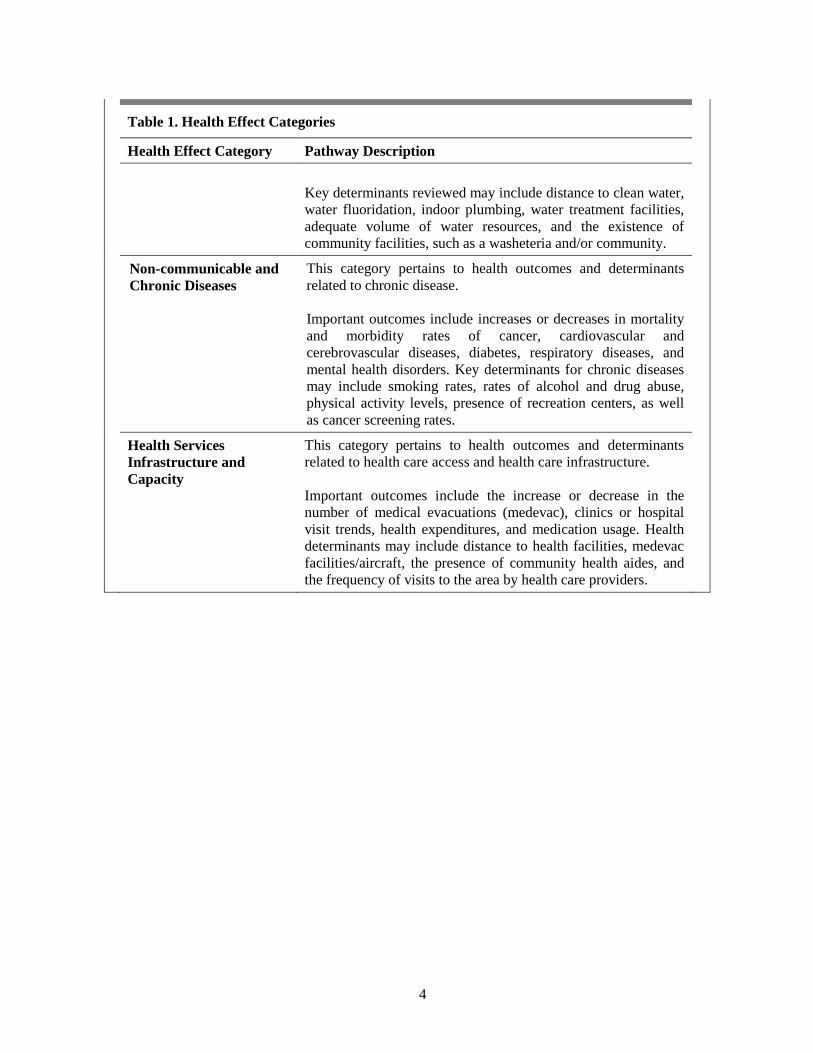
Non-communicable and
Chronic Diseases
This category pertains to health outcomes and determinants
related to chronic disease.
Important outcomes include increases or decreases in mortality
and morbidity rates of cancer, cardiovascular and
cerebrovascular diseases, diabetes, respiratory diseases, and
mental health disorders. Key determinants for chronic diseases
may include smoking rates, rates of alcohol and drug abuse,
physical activity levels, presence of recreation centers, as well
as cancer screening rates.
Health Services
Infrastructure and
Capacity
This category pertains to health outcomes and determinants
related to health care access and health care infrastructure.
Important outcomes include the increase or decrease in the
number of medical evacuations (medevac), clinics or hospital
visit trends, health expenditures, and medication usage. Health
determinants may include distance to health facilities, medevac
facilities/aircraft, the presence of community health aides, and
the frequency of visits to the area by health care providers.
5
2.0 OBSERVED AND PREDICTED CLIMATE CHANGE
2.1 Climate Change Defined
What is climate?
Climate is the long-term average variation in weather measured over an extended period (i.e., several
decades; NWS, 2009).
What is weather?
Weather is the state of the atmosphere in terms of wind, temperature, cloudiness, humidity, etc. at a given
time. Climate refers to the average weather conditions over a longer period of time (NWS, 2009).
What is climate change?
According to the U.S. Environmental Protection Agency (EPA), “climate change refers to any substantial
change in measures of climate (such as temperature or precipitation) lasting for an extended period
(decades or longer)” (EPA Climate Change Indicators, 2016). It is important to note that climate change is
not synonymous with global warming. Global warming refers to the average increase in temperature of
the atmosphere, which is just one potential indicator of climate change.
General Theory of Climate Change
Climate change is influenced by human activities and natural processes (IPCC, 2014; USGCRP, 2017).
Normally, when solar radiation reaches the Earth, some is reflected by the atmosphere, but most is
absorbed and warms the Earth’s surface. Some of the absorbed solar radiation is re-emitted as infrared
radiation and absorbed by greenhouse gas molecules in the atmosphere (e.g., water vapor, CO2, methane,
nitrous oxide, and chlorofluorocarbons [NASA, 2017]), which re-emits the radiation back towards the
Earth, warming the Earth’s surface. As the Earth’s atmosphere changes and greenhouse gas emissions
increase, less solar radiation can escape, which leads to further warming. This extra heat then impacts
various components of climate (e.g., air and ocean temperatures, weather patterns; NCA, 2014).
2.2 Climate Change Indicators
This HIA defines seven key indicators most relevant to climate change in Alaska. These indicators are
tied to the potential effects of climate change and facilitate tracking these effects to obtain a better picture
of the various components of climate change in Alaska. This climate change HIA is focused on the
following indicators:
Temperature
Precipitation
Weather patterns
Sea ice
Glaciers
Permafrost
Sea levels
A detailed discussion of these indicators and how they are measured can be found in Appendix 1.
6
2.3 Evidence of Climate Change in Alaska
Globally, temperature trends show evidence of a warming planet. The annual average global surface
temperature has risen at an average rate of 0.15°F per decade since 1901 (EPA Climate Change
Indicators, 2016). Ocean temperatures, precipitation, and sea levels have also increased globally. A more
detailed discussion of the changes among the indicators on a global and national scale can be found in
Appendix 2.
Trends in the Arctic related to climate change are typically more pronounced than in other parts of the
world. Arctic regions are predicted to see rapid and substantial climate changes (ACIA, 2005). Over the
past several decades in Alaska, the only Arctic region in the United States, temperatures have risen,
precipitation has increased, sea ice has declined, and permafrost has thawed at an increasing rate (EPA
Climate Impacts, 2016; Stewart et al., 2013; Richter-Menge et al., 2017).
2.3.1 Temperature
Alaska warmed twice as fast as the rest of the United States from 1949–2011 (EPA Climate Impacts,
2016; Chapin et al., 2014). While there is substantial variation in year-to-year temperatures, clear trends
exist (Stewart et al., 2013). Overall, Alaska now experiences more extremely hot days (warmest 1% of
daily high temperatures since 1950) and fewer extremely cold days (coldest 1% of daily low temperatures
since 1950; NCA, 2014; Stewart et al., 2013; Blunden & Arndt, 2017). Statewide, the average annual air
temperature has increased by 3°F and the average winter temperature has increased by 6°F since the
1950s (Chapin et al., 2014). Much of the warming has occurred in the winter and spring (Stewart et al.,
2013). Alaska had record-setting warmth during the cold season of 2015–2016 (from October through
April). Average temperatures during the 2015–2016 cold season exceeded the period-of-record (1925–
2016) mean by more than 8.4°F; the Interior region experienced the greatest increase in temperatures
(Stewart et al., 2013; Walsh et al., 2017).
2.3.2 Precipitation
Long-term trends show average precipitation from 1945–1965, followed by approximately 15 years of
below average precipitation totals. Subsequently, the average annual precipitation has increased statewide
by approximately 10% in recent decades (Stewart et al., 2013).
Extreme precipitation events, defined as the heaviest 1% of 3-day precipitation totals for each calendar
year, have increased in the spring in the southeast and west-central portions of the state. The northern
region has experienced a decrease in extreme precipitation events in all seasons except fall. All regions in
Alaska, except the Arctic, have seen an increase in extreme precipitation events during the summer
months (Stewart et al., 2013).
2.3.3 Weather Patterns
An analysis of Alaska storm information from the National Centers for Environmental Predictions storm
track database during 1953–2010 showed no significant change in the overall frequency of strong storm
events. Along the northern and northwestern coasts, however, strong storm events have increased in the
summer and fall months when there is no protective sea ice cover (Stewart et al., 2013).

7
2.3.4 Sea Ice
Sea ice extent has declined substantially in the Arctic and some of the fastest loss has been along the
Alaskan coast (USGCRP, 2017). Based on satellite-based sea ice records, which began in 1979, end of
summer sea ice from 2007–2012 was lower than any prior time (Stewart et al., 2013). The average annual
Arctic sea ice extent has decreased 3.5–4.1% per decade since 1979 (USGCRP, 2017). In 2012, the
September sea ice coverage was roughly 50% less than in the 1980s (Figure 1. ; EPA Climate Change
Indicators, 2016). The March 2017 sea ice extent was approximately 8% less than the 1981–2010 average
for that month (Richter-Menge et al., 2017). The September 2017 sea ice extent was approximately 25%
less than the 1981–2010 average for that month. The sea ice is also younger and thinner (factors that
make sea ice more vulnerable to summer melt) than any time on record (Chapin et al., 2014; Stewart et
al., 2013). The greatest reduction in sea ice has been in the Pacific side of the Arctic. Researchers believe
that increased heat inflow through the Bering Strait from the North Pacific is a key contributing factor to
the retreat of sea ice since the 1980s (Stewart et al., 2013).
Figure 1. March and September Monthly Average Sea Ice Extent, 1979-2016
Source: EPA Climate Change Indicators, 2016
2.3.5 Glaciers
Alaska is experiencing the fastest loss of glacier ice on Earth (NCA, 2014). According to the National
Climate Assessment, “from 2005 to 2010, Alaskan glacier losses made up one-third of the world’s ice
sheet losses, even though Alaska has 20 times fewer ice-covered areas than Greenland” (NCA, 2014).
Additionally, Alaska’s glaciers lose approximately 75 gigatons of water each year, which contributes
0.008 inches to the global annual sea level rise as well as a relative sea level fall in some parts of Alaska,
such as in the southeast, as the land in these glacial regions rebounds (Meier et al., 2007; Vaughan et al.,
2013).

8
2.3.6 Permafrost
Permafrost is ground that remains frozen for a period of at least 2 consecutive years. It has an active layer,
which thaws downward from the surface during warm seasons, and refreezes during the fall. Underneath
the active layer is a stable layer that remains frozen; the depth of this layer depends on average annual
temperatures, snow depth, soil properties, and ground slope (Stewart et al., 2013). Additionally, large
quantities of organic carbon are stored in permafrost. As permafrost thaws, it can release greenhouse
gases such as carbon dioxide (CO2) and methane (Schuur et al., 2015).
Permafrost is critical for the basic existence of many communities and ecosystems in Alaska. Eighty
percent of Alaska is underlain by permafrost, and seventy percent of this land is vulnerable to subsidence
(caving in or sinking) if the permafrost becomes unstable (Chapin et al., 2014; Jafarov et al., 2012). As
temperatures have increased, permafrost has begun to thaw. Since the 1970s, permafrost near the Arctic
coast has warmed 4–5°F at the 65-foot depth (Chapin et al., 2014). In 2016, record high temperatures
were observed at the 20 meter depth at all permafrost observatories on Alaska’s North Slope, with the
exception of Deadhorse (Blunden & Arndt, 2017; Ritcher-Menge et al., 2017).
2.3.7 Sea Levels
While sea levels have risen in much of the world, levels in parts of Alaska have fallen. Scientists believe
the decrease in sea level is due to changing vertical tectonic motion. Large earthquakes in Alaska’s recent
history have also impacted sea level calculations (separate sea level trends are calculated using data from
before and after the earthquakes in 1957, 1964 and 1988). There is considerable regional variability in
current sea level trends in Alaska. For example, Yakutat, Skagway, and Juneau have recorded the largest
decreases in sea level (-15 to -18 millimeters/year from 1975–2014). Sand Point, Prudhoe Bay, and Prince
Rupert have experienced small increases in sea level (+0 to 3 millimeters/year from 1975–2014; NOAA
Tides and Currents). There are limited tidal gages in Alaska (e.g., there are no tidal gages from Bristol
Bay to Norton Sound) and thus there is considerable uncertainty in determining the relative changes in sea
level statewide (USGCRP, 2017).

9
2.4 Climate Change Predictions for Alaska
This HIA is based on assumptions and projections provided in the third National Climate Assessment
(NCA, 2014) and supporting documents including Volume I of the fourth NCA (Volume II was not yet
available at the time of publication of this HIA; USGCRP, 2017). The NCA frequently refers to Scenario
A2, which was released by the Intergovernmental Panel on Climate Change (IPCC, 2000); this scenario
assumes increasing concentrations of greenhouse gases (e.g., water vapor, CO2, methane, nitrous oxide,
and chlorofluorocarbons [NASA, 2017]) in the Earth’s atmosphere and has been considered as a plausible
climate scenario in multiple climate assessments. This HIA presents a general picture of what climate
conditions might look like in Alaska, based on Scenario A2, as well as additional simulations presented
by other agencies. It is important to underscore the inherent difficulty in making climate change
predictions due to a wide range of variables, including changes in emissions, population, economics,
technology, etc. However, the use of such a scenario, where the potential changes of various indicators
are predicted from the same set of climate model simulations, provides a consistent climate picture to
forecast potential health impacts to a population (Stewart et al, 2013). A summary of the projections for
Alaska, focusing on seven measurable climate indicators, is provided below (Table 2; refer to Section 2.6
for additional region-specific information). This document does not present a new model for climate
change or contain any new data or analyses; rather, it is a review of existing literature.
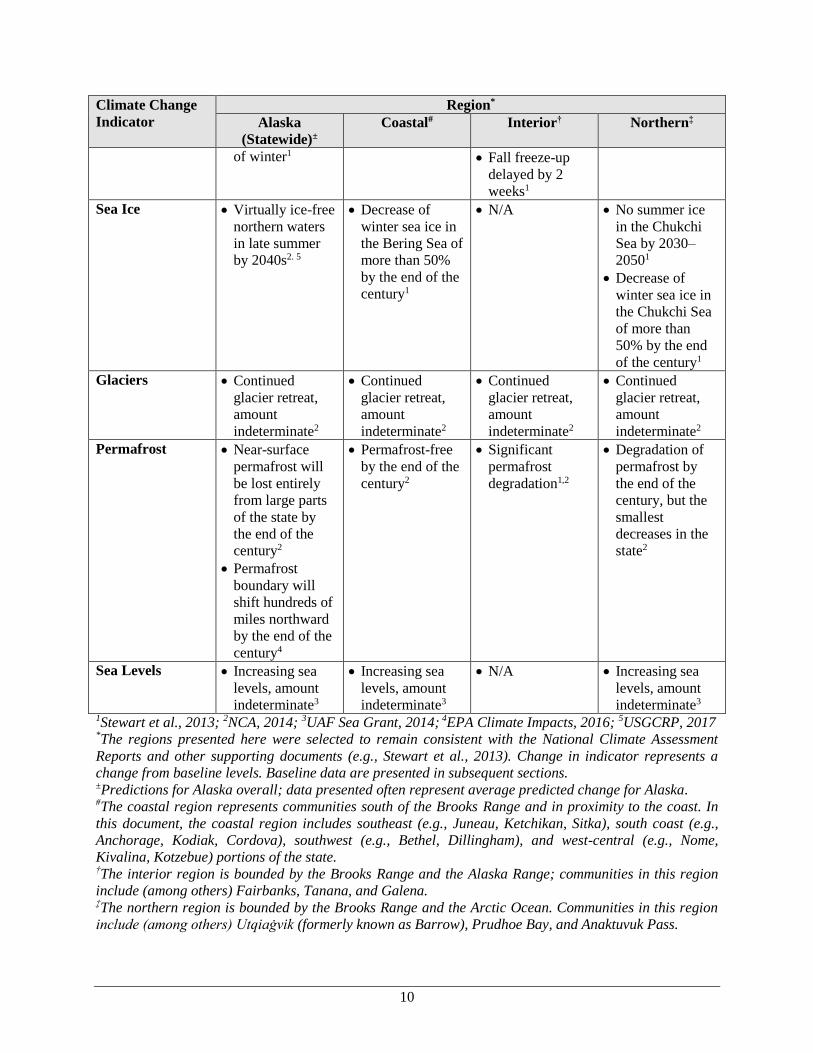
Table 2. Summary of Climate Change Predictions for Alaska
Climate Change
Indicator
Region*
Alaska
(Statewide)±
Coastal# Interior† Northern‡
Temperature Increase of 2–
4°F by 20502
Increase of 8.6°F
by 20851
Increase of 6–
8°F by the end of
the century2
(least amount of
warming in
southeast AK)
Increase of 8–
10°F by the end
of the century2
Increase of
approximately
10–12°F by the
end of the
century2
Precipitation Increase of 0–
15% by 20351
Increase of 10–
35% by 20851
Increased heavy
precipitation
events, amount
indeterminate
Wetter winters
and drier
summers4
Increase of 5–
15% by 20351
Increase of 15–
35% by 20851
Largest increases
in northwestern
coastal region,
smallest
increases in
southeast AK1,2
Increase of 0–5%
by 20351
Increase of 20–
30% by 20851
Increase of 0–
15% by 20351
Increase of 25–
35% by 20851
Weather Increased storm
intensity,
amount
indeterminate3
Change to winter
storms is
uncertain2
Increased length
of summer1
Decreased length
Increased storm
intensity,
amount
indeterminate3
Change to winter
storms is
uncertain2
Fall freeze-up
delayed by 40–
60 days1
Increased storm
intensity,
amount
indeterminate3
Change to winter
storms is
uncertain2
Spring thaw date
advanced by 2–3
weeks1
Increased storm
intensity,
amount
indeterminate3
Change to winter
storms is
uncertain2
Fall freeze-up
delayed by one
month1
10
Climate Change
Indicator
Region*
Alaska
(Statewide)±
Coastal# Interior† Northern‡
of winter1 Fall freeze-up
delayed by 2
weeks1
Sea Ice Virtually ice-free
northern waters
in late summer
by 2040s2. 5
Decrease of
winter sea ice in
the Bering Sea of
more than 50%
by the end of the
century1
N/A No summer ice
in the Chukchi
Sea by 2030–
20501
Decrease of
winter sea ice in
the Chukchi Sea
of more than
50% by the end
of the century1
Glaciers Continued
glacier retreat,
amount
indeterminate2
Continued
glacier retreat,
amount
indeterminate2
Continued
glacier retreat,
amount
indeterminate2
Continued
glacier retreat,
amount
indeterminate2
Permafrost Near-surface
permafrost will
be lost entirely
from large parts
of the state by
the end of the
century2
Permafrost
boundary will
shift hundreds of
miles northward
by the end of the
century4
Permafrost-free
by the end of the
century2
Significant
permafrost
degradation1,2
Degradation of
permafrost by
the end of the
century, but the
smallest
decreases in the
state2
Sea Levels Increasing sea
levels, amount
indeterminate3
Increasing sea
levels, amount
indeterminate3
N/A Increasing sea
levels, amount
indeterminate3 1Stewart et al., 2013; 2NCA, 2014; 3UAF Sea Grant, 2014; 4EPA Climate Impacts, 2016; 5USGCRP, 2017 *The regions presented here were selected to remain consistent with the National Climate Assessment
Reports and other supporting documents (e.g., Stewart et al., 2013). Change in indicator represents a
change from baseline levels. Baseline data are presented in subsequent sections. ±Predictions for Alaska overall; data presented often represent average predicted change for Alaska. #The coastal region represents communities south of the Brooks Range and in proximity to the coast. In
this document, the coastal region includes southeast (e.g., Juneau, Ketchikan, Sitka), south coast (e.g.,
Anchorage, Kodiak, Cordova), southwest (e.g., Bethel, Dillingham), and west-central (e.g., Nome,
Kivalina, Kotzebue) portions of the state. †The interior region is bounded by the Brooks Range and the Alaska Range; communities in this region
include (among others) Fairbanks, Tanana, and Galena. ‡The northern region is bounded by the Brooks Range and the Arctic Ocean. Communities in this region
include (among others) Utqiaġvik (formerly known as Barrow), Prudhoe Bay, and Anaktuvuk Pass.

11
2.4.1 Temperature
Recent models predict that compared to 1971–1999, Alaska’s average annual temperatures will be 2°–4°F
higher in 2050 and 8°–9°F higher in 2100 (Stewart et al., 2013). Compared to 2000–2009, from 2060–
2069, northern and interior Alaska are expected to experience greater increases in mean decadal
temperature than other regions in the state (Figure 2). These regions are predicted to increase by
approximately 10°F. Statewide, mean winter temperatures are predicted to increase by approximately 4°F
by 2035, 8°F by 2050, and more than 12°F by 2085 (Stewart et al., 2013; Walsh et al., 2017).
Figure 2. Mean Decadal Annual Temperature for Alaska, by Region
CRU: past data collected by the Climatic Research Unit; SRES B1: lower emissions scenario;
SRES A2: higher emissions scenario. Source: NCA, 2014; Stewart et al., 2013
12
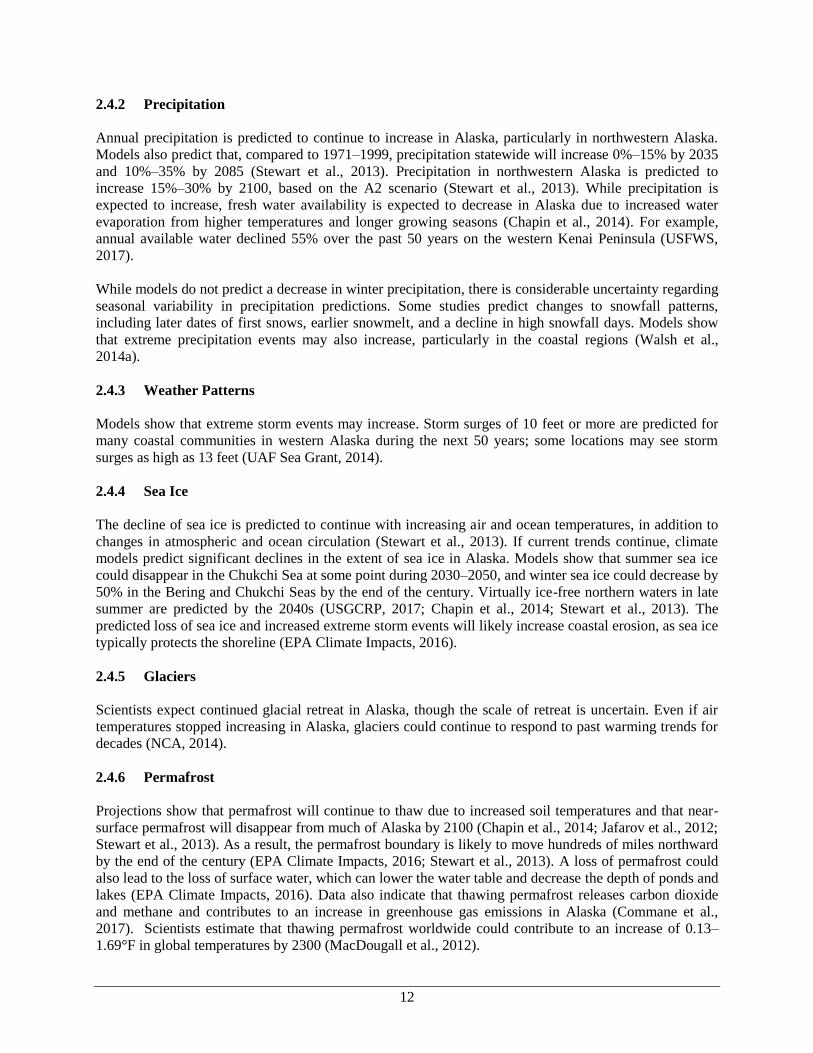
2.4.2 Precipitation
Annual precipitation is predicted to continue to increase in Alaska, particularly in northwestern Alaska.
Models also predict that, compared to 1971–1999, precipitation statewide will increase 0%–15% by 2035
and 10%–35% by 2085 (Stewart et al., 2013). Precipitation in northwestern Alaska is predicted to
increase 15%–30% by 2100, based on the A2 scenario (Stewart et al., 2013). While precipitation is
expected to increase, fresh water availability is expected to decrease in Alaska due to increased water
evaporation from higher temperatures and longer growing seasons (Chapin et al., 2014). For example,
annual available water declined 55% over the past 50 years on the western Kenai Peninsula (USFWS,
2017).
While models do not predict a decrease in winter precipitation, there is considerable uncertainty regarding
seasonal variability in precipitation predictions. Some studies predict changes to snowfall patterns,
including later dates of first snows, earlier snowmelt, and a decline in high snowfall days. Models show
that extreme precipitation events may also increase, particularly in the coastal regions (Walsh et al.,
2014a).
2.4.3 Weather Patterns
Models show that extreme storm events may increase. Storm surges of 10 feet or more are predicted for
many coastal communities in western Alaska during the next 50 years; some locations may see storm
surges as high as 13 feet (UAF Sea Grant, 2014).
2.4.4 Sea Ice
The decline of sea ice is predicted to continue with increasing air and ocean temperatures, in addition to
changes in atmospheric and ocean circulation (Stewart et al., 2013). If current trends continue, climate
models predict significant declines in the extent of sea ice in Alaska. Models show that summer sea ice
could disappear in the Chukchi Sea at some point during 2030–2050, and winter sea ice could decrease by
50% in the Bering and Chukchi Seas by the end of the century. Virtually ice-free northern waters in late
summer are predicted by the 2040s (USGCRP, 2017; Chapin et al., 2014; Stewart et al., 2013). The
predicted loss of sea ice and increased extreme storm events will likely increase coastal erosion, as sea ice
typically protects the shoreline (EPA Climate Impacts, 2016).
2.4.5 Glaciers
Scientists expect continued glacial retreat in Alaska, though the scale of retreat is uncertain. Even if air
temperatures stopped increasing in Alaska, glaciers could continue to respond to past warming trends for
decades (NCA, 2014).
2.4.6 Permafrost
Projections show that permafrost will continue to thaw due to increased soil temperatures and that near-
surface permafrost will disappear from much of Alaska by 2100 (Chapin et al., 2014; Jafarov et al., 2012;
Stewart et al., 2013). As a result, the permafrost boundary is likely to move hundreds of miles northward
by the end of the century (EPA Climate Impacts, 2016; Stewart et al., 2013). A loss of permafrost could
also lead to the loss of surface water, which can lower the water table and decrease the depth of ponds and
lakes (EPA Climate Impacts, 2016). Data also indicate that thawing permafrost releases carbon dioxide
and methane and contributes to an increase in greenhouse gas emissions in Alaska (Commane et al.,
2017). Scientists estimate that thawing permafrost worldwide could contribute to an increase of 0.13–
1.69°F in global temperatures by 2300 (MacDougall et al., 2012).

13
2.4.7 Sea Levels
Currently, the land surface in southern Alaska is rising faster than the global rise in sea level, leading to a
continued decrease in sea level (O’Harra, 2010). Scientists anticipate that global sea rise will eventually
exceed the rate of rising land surface in Alaska and that the State’s entire coastline will eventually be
affected by sea level rise, though the sea level rise is projected to be less than the global average
(O’Harra, 2010; UAF Sea Grant, 2014; USGCRP, 2017). Much of Alaska’s coastal land surface is
predicted to rise 0.1–1.0 meter by 2100, whereas the projected global mean sea level (GMSL) rise is 0.3–
2.5 meters (Sweet et al., 2017).

14
2.5 Climate Change and Health
Climate change can affect human health (Patz et al., 2014; USGCRP, 2016). Many international agencies
(e.g., WHO, World Bank) and national groups (e.g., CDC, NOAA, and NASA) have discussed the
current implications of climate change on human health and the potential for future health impacts.
Although there are exceptions, climate change generally appears to exacerbate existing health challenges
at both the community and individual levels (Smith et al., 2014). There are several different pathways by
which climate change can affect health, including direct impacts such as injuries caused by fires or storm
surges, and indirect impacts such as changes in quantity and quality of subsistence foods (Figure 3).
Moreover, it is important to note that climate-associated health impacts on communities are magnified by
additional social and economic stresses.
Figure 3. Climate Change and Human Health
Source: USGCRP, 2016; modified from U.S. Environmental Protection Agency
The potential human health impacts related to the climate change predictions for Alaska are discussed in
this section. A health impact is a positive or negative change in a specific health outcome or health
determinant that is characterized by specific health outcomes or determinants (not general statements
about health status) and quantifiable data, whenever possible.
Each HEC contains health impacts that fit the criteria above. The following sections describe the
interaction between the potential factors of climate change and human health. It is important to note that
health outcomes and indicators in Alaska will change over time, regardless of climate change; this HIA
focuses only on the potential health impacts from climate change. Future health impacts could be more or
less substantial than what is discussed in this HIA, depending on changes in Alaska not directly tied to
climate (e.g., economic changes).

15
2.6 Potentially Affected Communities
The Alaska HIA Toolkit defines a potentially affected community (PAC) as an area, community, or
village where health impacts may occur. This HIA commonly refers to four regions of PACs where
impacts due to climate change are predicted.
Climate change regions
Alaska: General predictions are available for Alaska (statewide) for most of the climate change indicators.
Not all data are available at the regional level. This is noted where applicable.
Coastal: This region consists of communities where maritime strongly influences climate. In this HIA, the
coastal region includes the Southeast (e.g., Juneau, Ketchikan, Sitka), South coast (e.g., Anchorage,
Kodiak, Cordova), Southwest (e.g., Bethel, Dillingham, communities in the Aleutian Islands), and west-
central (e.g., Nome, Kivalina, Kotzebue) portions of the state.
Interior: Interior Alaska is bounded by the Brooks and Alaska mountain ranges. This region experiences a
continental climate with large temperature variability, low humidity, and relatively light precipitation
(Stewart et al., 2013). Communities in this region include (among others) Fairbanks, Tanana, and Galena.
Northern: This region is north of the Brooks Range and is bordered on the north by the Arctic Ocean. This
region is considered Alaska’s Arctic and has the lowest average annual temperatures in the state.
Communities in this region include (among others) Utqiaġvik (formerly Barrow), Prudhoe Bay, and
Anaktuvuk Pass.

16
3.0 PRIORITIZING HEALTH IMPACTS
The following sub-sections describe the interaction between the potential factors of climate
change (based on the climate change predictions from Section 2.4) and provide examples of
potential adverse health outcomes. Appendix 3 presents a comprehensive summary table of the
potential interactions between climate change and health in Alaska.
The potential impacts identified in this section are reviewed according to climate change-specific
health impact dimension criteria and are presented in a color-coded table in Section 3.2.
Communities can identify and evaluate potential health impacts from climate change using a
similar framework.
Populations of Concern
Climate change has impacts across various population groups in the United States and some
populations may be particularly vulnerable to specific impacts. According to the World Health
Organization, “vulnerability is the degree to which a population, individual or organization is
unable to anticipate, cope with, resist and recover from the impacts of disasters” (Wisner and
Adams, 2002). In terms of climate change, “vulnerability is the tendency or predisposition to be
adversely affected by climate-related health effects, and encompasses three elements: exposure,
sensitivity or susceptibility, and the capacity to adapt to or to cope with change” (USCGRP,
2016). Population groups that are particularly vulnerable to the impacts of climate change include
people with low incomes, those with less literacy proficiency, indigenous groups, immigrant
groups, children and pregnant women, the elderly, and persons with pre-existing or chronic
medical conditions (Patz et al., 2014; USGCRP, 2016).
Rural Alaska has some of the highest rates of poverty in the United States as well as some of the
highest costs for food and fuel. In 2014, the percent of residents living below the federal poverty
level in the state was 10.2%, while the percent of people living below the federal poverty level in
rural Alaska was over 60% (ACS Study, 2015). People who live in poverty may be particularly
vulnerable to climate change because they have fewer resources to cope with adversity, relocate,
evacuate, or respond in other ways (e.g., to increases in the cost of food and other resources; EPA
Climate Impacts, 2016; NCA, 2014).
Alaska Native people living in rural areas may also be at increased risk for adverse health impacts
from climate change, in part due to their close cultural ties to the land and subsistence food
resources, such as salmon, caribou and whale (EPA Climate Impacts, 2016). Stresses to
traditional practices, which encompass a way of life, as well as cultural, spiritual, and personal
identity, could have significant social impacts in Alaska (ADEC, 2010); some villages report such
changes have already begun (Bell et al., 2010; Cochran et al., 2013).
Children and the elderly are also important populations vulnerable to the impacts of climate
change (Smith et al., 2014; USGCRP, 2016). Older adults may have added difficulty coping with
climate change, due in part to mobility issues in a time of emergency, such as an extreme weather
event. Children are also vulnerable due to mobility issues (they are reliant on others to care for
them in disaster situations).

17
3.1 Potential Impacts by Health Effect Category
3.1.1 Mental Health and Wellbeing
Mental health and stress-related disorders are important health outcomes that are influenced by
climate change (Luber et al., 2014; USGCRP, 2016). For example, climate change can affect
mental health by causing solastalgia, the distressing sense of loss that people experience as a
result of unwanted environmental changes that occur close to one’s home (Albrecht et al., 2007),
and associated pathologies such as anxiety, depression, and post-traumatic stress disorder that can
result from acute events such as fires, floods, and storm surges, as well as more protracted
changes such as thawing permafrost and coastal erosion (Patz et al., 2014; Watts et al. 2015;
USGCRP, 2016). These effects disproportionately impact those living in low-resource settings,
including indigenous groups (Berry et al., 2010). Climate change can also influence interpersonal
violence, community conflict, and can impact mental health and wellbeing through changes in
factors such as family structure, economic status, and cultural continuity (Cochran et al., 2013;
USGCRP, 2016).
Psychosocial distress and associated health outcomes may also increase among emergency
workers and first responders, due to the nature of their jobs. These workers respond to disasters
involving death and injury and work in stressful environments, which put them at risk for post-
traumatic stress disorder, depression, and panic disorder (USGCRP, 2016).
In Alaska, many residents have expressed concern and a feeling of depression related to the
uncertainty of the scope and magnitude of potential climate change (ADEC, 2010). Residents
have expressed anxiety about the potential impact of climate change on culture, subsistence
resources, traditional knowledge and ways of knowing, infrastructure damage, the economy,
community relocation, cultural and burial sites, recreational activities, future generations, and the
‘Alaskan way of life’ (ADEC, 2010). Based on the climate change predictions for Alaska, there
may be continued impacts on mental health, community wellness, family structure, and
“maladaptive” coping behaviors, such as alcohol use, substance abuse, and suicidality.
Psychosocial distress, the stress and anxiety that arise over factors such as economic issues,
relocation, and uncertainty over infrastructure stability, has already increased among some
residents (Cochran et al., 2013). Psychosocial distress and its associated comorbidities is
predicted to continue to increase as community relocation becomes more imminent, mental
illness could be exacerbated because of factors such as decreased food security, damaged
infrastructure and associated economic costs, water quality concerns, and extreme storm events
(NCA, 2014; USGCRP, 2016).
Effects of Thawing Permafrost
Permafrost is found in over 80% of Alaska (Chapin et al., 2014; GAO, 2009). An estimated
100,000 Alaskans (roughly 14% of the Alaska population) live in areas sensitive to permafrost
degradation (EPA Climate Impacts, 2016; USARC, 2013). As permafrost disappears and the
landscape changes, roads may become damaged, subsistence resources may become more scarce
and more difficult to access, and communities may need to relocate (Chapin et al., 2014; Cochran
et al., 2013). Additional discussion on community relocation can be found in Sea Level Changes,
below.
Thawing permafrost also increases the susceptibility of soil to erosion, which is a concern during
intense storms along the coast, as well as in communities located along riverbanks. As the melted
water in the soil drains away, the remaining soil becomes soft and porous, resulting in loss of
18
surface water (including estuaries, ponds, lakes, streams, and rivers). When this soil comes into
contact with waves or river currents, it easily erodes, sometimes in large quantities. Eroded
coastline can lead to damaged infrastructure, including the potential loss of housing, medical
clinics, water sanitation systems, roads, cultural and burial sites, and entire communities.
Damaged infrastructure, and uncertainty regarding the scope of thawing permafrost, could lead to
psychosocial distress (e.g., anxiety or depression).
Effects of Sea Level Changes
Nearly 90% of Alaska Native communities are located on the coast (NPR, 2013). As sea levels
continue to rise, several coastal Alaska villages have become inundated with tidal waters and
have suffered extensive erosion and damaged infrastructure. Thawing permafrost has also led to
coastal and riverbank erosion and infrastructure damage. In Shishmaref, for example, entire
houses have been destroyed due to erosion. The United States Army Corps of Engineers
(USACE) determined that Shishmaref and 183 of 213 (86%) other Alaska Native communities
are at risk of flooding and erosion. According to the United States Government Accountability
Office (GAO), 31 Alaska Native villages face imminent threats from flooding and erosion, both
of which may worsen due to climate change (Bronen, 2011; GAO, 2009). Of these communities,
at least 12 have decided to relocate (either partially or entirely), or at least consider the relocation
process; several communities, such as Newtok, have already begun the relocation process (GAO,
2009). The threat and process of community relocation is stressful for residents and could result
in a variety of adverse health outcomes related to psychosocial distress (Bronen, 2011).
Effects of Gradual Temperature Changes and Ecosystem Properties
In addition to extreme weather events causing psychosocial impacts, gradual climate change
could also impact mental health. The gradual impacts of climate change may exacerbate existing
mental health conditions or cause new ones (USGCRP, 2016). For example, climate change could
lead to a distressing sense of loss—called solastalgia—as a person’s land and way of life (culture)
is changed (Smith et al., 2014). Studies on the mental health impacts from gradual and cumulative
climate change are still limited and are less robust than the research on short-term extreme
weather events, but there is some indication that long-term climate change could produce mental
health impacts. The literature has focused on the effects of long-term temperature change, but
some emerging studies show that changes to air quality, water quality, changing disease vectors,
and food sources may also lead to adverse mental health outcomes (USGCRP, 2016).
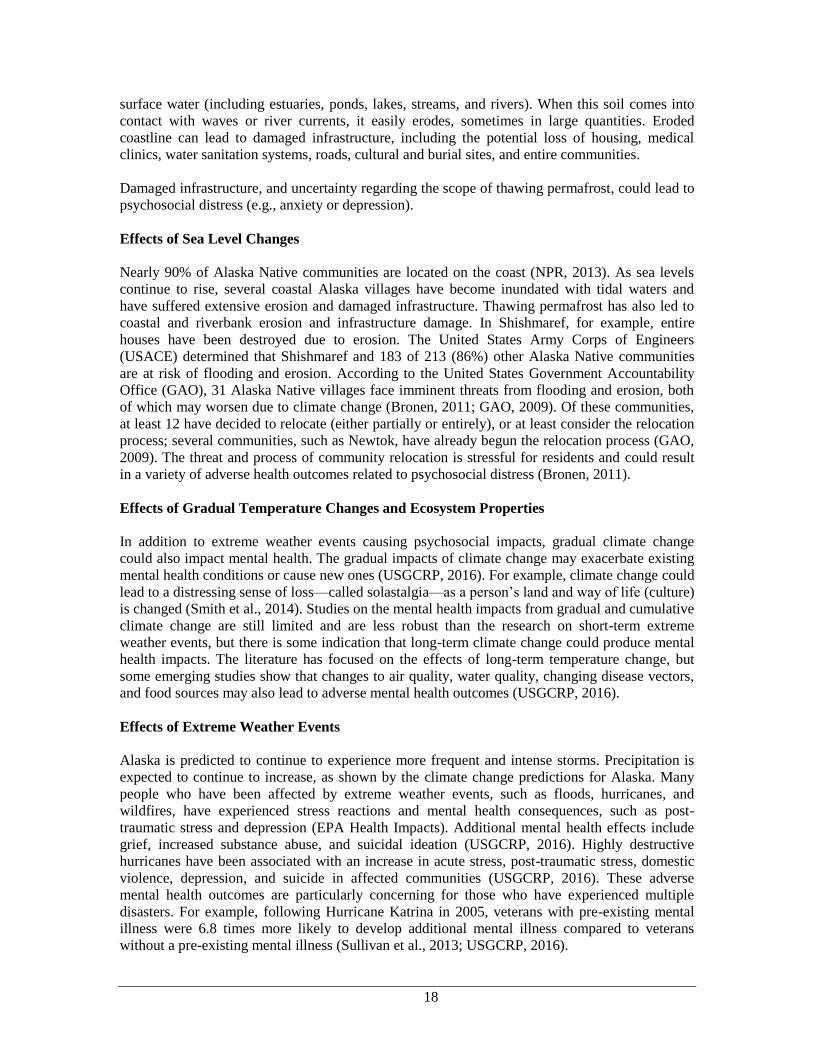
Effects of Extreme Weather Events
Alaska is predicted to continue to experience more frequent and intense storms. Precipitation is
expected to continue to increase, as shown by the climate change predictions for Alaska. Many
people who have been affected by extreme weather events, such as floods, hurricanes, and
wildfires, have experienced stress reactions and mental health consequences, such as post-
traumatic stress and depression (EPA Health Impacts). Additional mental health effects include
grief, increased substance abuse, and suicidal ideation (USGCRP, 2016). Highly destructive
hurricanes have been associated with an increase in acute stress, post-traumatic stress, domestic
violence, depression, and suicide in affected communities (USGCRP, 2016). These adverse
mental health outcomes are particularly concerning for those who have experienced multiple
disasters. For example, following Hurricane Katrina in 2005, veterans with pre-existing mental
illness were 6.8 times more likely to develop additional mental illness compared to veterans
without a pre-existing mental illness (Sullivan et al., 2013; USGCRP, 2016).

19
Anxiety and depression are also commonly reported outcomes of climate-related disaster events
that involve significant life disruptions, including the loss of life, resources, and social support
networks (USGCRP, 2016; Luber et al., 2014). Long-term depression and anxiety has been
associated with flood events, as well as increased aggression in children (USGCRP, 2016; Ahern
et al., 2005). Interpersonal violence often increases after extreme weather events, as well as
suicidal behavior and substance abuse (Smith et al., 2014; USGCRP, 2016).
Effects of Weather Pattern Changes
With increased air temperatures, tourism, recreational, and subsistence activities may be
impacted. Warmer temperatures can decrease the number of days when recreational snow
activities such as skiing and snow machining can occur. Increased wildfires could impact hiking
and other recreational activities in summer months. As tourism patterns change, communities that
support themselves through these recreational activities may experience economic impacts.
Alaskans who rely on these recreational activities for exercise and mental health may incur
adverse health consequences if their recreational opportunities become more limited.
3.1.2 Accidents and Injuries
Climate change can cause direct and indirect impacts to the health outcomes and determinants
related to accidents and injuries. Relevant health outcomes include unintentional fatal and non-fatal
injuries, such as motor vehicle crashes and falls.
Effects of Temperature Changes
Climate change is projected to increase the frequency and duration of heat waves and the number of
high-temperature days in Alaska (Stewart et al., 2013). In the past 60 years, average annual
temperatures in Alaska have increased by 3°F and average winter temperatures have increased by
6°F (Chapin et al., 2014). On average, summers in Alaska have increased by more than 2.3°F over
the past 50 years (Stewart et al. 2013), and the average annual temperatures in Alaska could be 2°–
4°F higher by 2050 (Chapin et al., 2014). Alaska now experiences more extremely hot days and
fewer extremely cold days than in previous decades (Chapin et al., 2014; Stewart et al., 2013).
Heat stress is the most direct health effect of a warming planet due to climate change (Patz et al.,
2014). Prolonged exposure to heat can cause heat exhaustion, heat cramps, and heat stroke (Portier
et al., 2010). Fatalities from extreme heat result from heat stroke and related conditions. Extreme
heat also exacerbates preexisting conditions, such as cardiovascular, cerebrovascular, and
respiratory diseases (Luber et al., 2014). Nationwide, heat-related deaths represent more deaths than
from all other weather events combined, such as flooding or tornadoes (Luber and McGeehin, 2008;
Patz et al., 2014; Portier et al., 2010). Roughly 700 deaths, on average, are attributed to heat-related
causes in the United States annually (Portier et al., 2010). An estimated 35,000 excess deaths
occurred during the European heat wave in 2003 (Patz et al., 2014).
While the temperatures in Alaska are not predicted to be nearly as high as in many other parts of
the country, Alaskans may be more vulnerable to increasing temperatures than those living in
other regions of the country due to a general lack of air conditioning or other means of cooling
buildings and houses (Berner et al., 2005; Brubaker et al., 2013; Brubaker et al., 2011). One study
found that cities with cooler climates tend to experience more heat-related deaths than those with
warmer climates because populations in warmer climates can better acclimatize to heat and are
more likely to have access to air conditioning (Portier et al., 2010). In the summer of 2013, for

20
example, temperatures in Nondalton hovered around 70°–80°F for multiple weeks; there was a
shortage of fans in the community, and several cases of heat stress were reportedly seen at the
clinic (Brubaker et al., 2013).
Alaskan seniors and those with preexisting illnesses such as heart disease and diabetes may
experience a higher burden of morbidity and mortality due to heat stress. Socioeconomic factors
have also been found to determine vulnerability—economically disadvantaged and socially
isolated people face higher burdens of death from heat (Portier et al., 2010). As such, rural Alaska
communities may experience more challenges in adapting to warmer temperatures.
Effects of Extreme Weather Events
Extreme weather events such as droughts, floods and storms are predicted to increase with
climate change and some reports suggest that change is already occurring. The frequency and
intensity of extreme precipitation events is projected to increase in Alaska (Stewart et al., 2013).
Flooding is typically the primary concern of extreme precipitation events and coastal storms, as
floods are the second-deadliest of all the weather hazards in the United States (Patz et al., 2014;
USGCRP, 2016).
Extreme precipitation events can also lead to fatal- and non-fatal injuries due to rock falls,
mudslides, debris flow and avalanches. Extreme weather events, such as intense storms, could
lead to increased risk of injury and death by more vessels capsizing from higher seas, more motor
vehicle accidents caused by icier roads, etc. Extreme weather events may also cause infrastructure
damage (Larsen et al., 2008). For example, buildings can collapse from heavy snow loads and
supersaturated ground (IPCC, 2012). Infrastructure damage could lead to an increased risk of
injury and death.
Storm surges—extreme high-water events caused by high winds and low atmospheric pressure—
and stronger winter storms are predicted to increase in Alaska. Storm surges have already been
causing increasing damage, particularly on the Bering Sea coast and in the Arctic (UAF Sea Grant,
2014). Damage includes receding shoreline due to erosion, infrastructure damage, and flooding.
These consequences can lead to drowning, as well as fatal and non-fatal injuries (Brubaker et al.,
2010; USGCRP, 2016).
In Alaska, a community-based surveillance study found that unintentional injury was significantly
more likely to occur during months when participants reported unseasonable environmental
conditions (e.g., heavier than average precipitation, increased variability in ice conditions); self-
reported unintentional injuries were even more likely if participants had to change their travel plans
(e.g., take a different route) in response to the unseasonable conditions (Driscoll et al., 2016)
Effects of Thawing Permafrost
The thawing and freezing cycles of permafrost often cause damage to the transportation
infrastructure in Alaska, including roads, railroads, airstrips, and trails (EPA Health Impacts). Many
of Alaska’s roadways are built on permafrost. Roads and bridges can be damaged due to frost
heaves or the subsidence of permafrost; motor vehicle accidents may result as unsuspecting drivers
encounter this damage. Damaged roads, in addition to damaged airstrips and railroads, could also
impede access to a number of facilities, including health clinics in emergency situations (Brubaker
et al., 2012; Schwartz et al., 2014). See Section 3.1.8, Health Services Infrastructure and Capacity,
for more information regarding the potential health impacts of damaged health facilities due to
thawing permafrost.
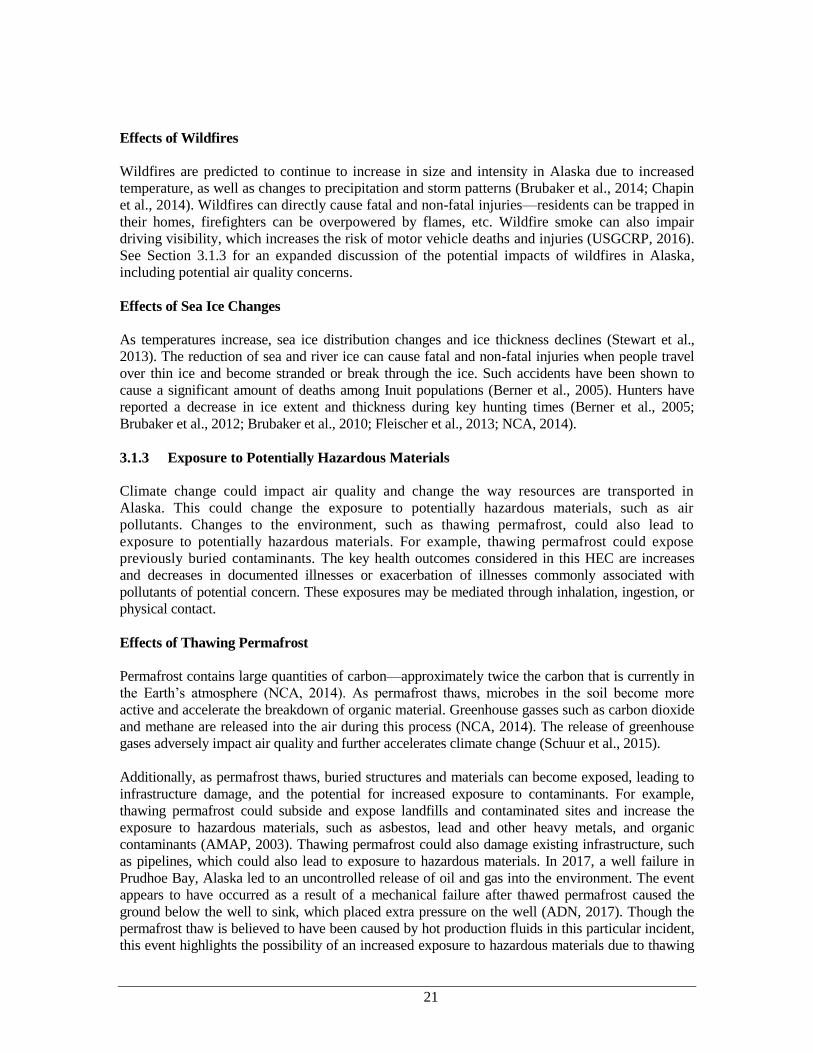
21
Effects of Wildfires
Wildfires are predicted to continue to increase in size and intensity in Alaska due to increased
temperature, as well as changes to precipitation and storm patterns (Brubaker et al., 2014; Chapin
et al., 2014). Wildfires can directly cause fatal and non-fatal injuries—residents can be trapped in
their homes, firefighters can be overpowered by flames, etc. Wildfire smoke can also impair
driving visibility, which increases the risk of motor vehicle deaths and injuries (USGCRP, 2016).
See Section 3.1.3 for an expanded discussion of the potential impacts of wildfires in Alaska,
including potential air quality concerns.
Effects of Sea Ice Changes
As temperatures increase, sea ice distribution changes and ice thickness declines (Stewart et al.,
2013). The reduction of sea and river ice can cause fatal and non-fatal injuries when people travel
over thin ice and become stranded or break through the ice. Such accidents have been shown to
cause a significant amount of deaths among Inuit populations (Berner et al., 2005). Hunters have
reported a decrease in ice extent and thickness during key hunting times (Berner et al., 2005;
Brubaker et al., 2012; Brubaker et al., 2010; Fleischer et al., 2013; NCA, 2014).
3.1.3 Exposure to Potentially Hazardous Materials
Climate change could impact air quality and change the way resources are transported in
Alaska. This could change the exposure to potentially hazardous materials, such as air
pollutants. Changes to the environment, such as thawing permafrost, could also lead to
exposure to potentially hazardous materials. For example, thawing permafrost could expose
previously buried contaminants. The key health outcomes considered in this HEC are increases
and decreases in documented illnesses or exacerbation of illnesses commonly associated with
pollutants of potential concern. These exposures may be mediated through inhalation, ingestion, or
physical contact.
Effects of Thawing Permafrost
Permafrost contains large quantities of carbon—approximately twice the carbon that is currently in
the Earth’s atmosphere (NCA, 2014). As permafrost thaws, microbes in the soil become more
active and accelerate the breakdown of organic material. Greenhouse gasses such as carbon dioxide
and methane are released into the air during this process (NCA, 2014). The release of greenhouse
gases adversely impact air quality and further accelerates climate change (Schuur et al., 2015).
Additionally, as permafrost thaws, buried structures and materials can become exposed, leading to
infrastructure damage, and the potential for increased exposure to contaminants. For example,
thawing permafrost could subside and expose landfills and contaminated sites and increase the
exposure to hazardous materials, such as asbestos, lead and other heavy metals, and organic
contaminants (AMAP, 2003). Thawing permafrost could also damage existing infrastructure, such
as pipelines, which could also lead to exposure to hazardous materials. In 2017, a well failure in
Prudhoe Bay, Alaska led to an uncontrolled release of oil and gas into the environment. The event
appears to have occurred as a result of a mechanical failure after thawed permafrost caused the
ground below the well to sink, which placed extra pressure on the well (ADN, 2017). Though the
permafrost thaw is believed to have been caused by hot production fluids in this particular incident,
this event highlights the possibility of an increased exposure to hazardous materials due to thawing

22
permafrost from a warming climate.
Effects of Global and Local Air Pollution
Climate change could impact air pollutant concentrations in a variety of ways. Climate influences
weather components such as temperature, humidity, wind patterns and precipitation; each of these
climate factors can influence air quality (NCA, 2014; USGCRP, 2016). Additional climate-driven
metrological changes, such as wildfires and wind-blown dust, can also influence air quality. Poor air
quality has been linked to adverse cardiovascular and respiratory health, premature death, and an
increase in all-cause mortality (Lim et al., 2012; UNEP, 2011). This section focuses on the role of
climate change in air pollution and associated human health outcomes.
Ozone
Ozone occurs naturally in Earth’s stratosphere and is also formed by human-made activities.
Ozone in the stratosphere is beneficial; it prevents harmful ultraviolet radiation from reaching
Earth’s surface. Ozone at ground level is a powerful oxidant and a lung irritant (USGCRP, 2016).
Ground-level ozone is an air pollutant that is created by chemical reactions between nitrogen
oxides (NOx) and volatile organic compounds (VOCs); ozone is a component of smog (EPA
Ozone, 2016; Luber et al., 2014). Ground-level ozone is associated with adverse health outcomes,
such as decreased lung function, increased premature deaths, and aggravated respiratory
conditions (e.g., asthma, chronic bronchitis, and emphysema; EPA Ozone, 2016; Luber et al.,
2014).
Ozone formation can increase with higher temperatures and sunlight. Ozone can also be affected
by changes in weather patterns and humidity (Portier et al., 2010). Climate change may have
already impacted ground-level ozone concentrations in some regions of the United States
(Bloomer et al., 2009; Leibensperger et al., 2008; USGCRP, 2016). Worldwide, projections show
that increasing temperatures from climate change could increase the number of days with
unhealthy levels of ozone (EPA Climate Impacts, 2016).
However, ozone’s warming effect on the Arctic, including Alaska, appears to be less significant
than in other regions of the world. Modeling ozone changes in the Arctic has a lot of uncertainty
when drawing conclusions about ozone levels and their effect on the Arctic (AMAP, 2015).
Particulate Matter (PM)
Particulate matter is a complex mix of solid particles and liquid droplets found in the air. PM can
include, among other components, organic chemicals, metals, dust particles, and acids (i.e., nitrates
and sulfate). Particulate matter is categorized by the size of particles. Particulate matter that is 10
micrometers (µm, PM10) or smaller in aerodynamic diameter can be inhaled and enter a person’s
lungs. Fine PM (PM2.5) is a subset of PM10 and refers to particles that are 2.5 µm or smaller in
aerodynamic diameter, which are small enough to be inhaled deep into the alveoli in the lungs.
PM is known to cause adverse health effects. Recent literature shows that exposure to PM2.5 has
stronger associations to adverse health effects than PM of a larger size. Smaller particles can be
inhaled more deeply into the lungs and are more likely to deposit in the lungs because they are not
as readily expelled through sneezing or coughing.
Due to the complexity of particulate matter, researchers have not been able to predict whether
23
climate change will increase or decrease fine particulate matter concentrations in the United States
(EPA Climate Impacts, 2016). Humidity and temperature are known to play a role in the formation
of PM2.5 (Portier et al., 2010). Increased rainfall could decrease particulate matter suspended in the
air (less dust), but other climate change factors could lead to an increase in PM, such as wildfires,
melting glaciers (increased glacial dust), and wind patterns (EPA Climate Impacts, 2016).
In Alaska, there are several features of climate change that could lead to an increase in PM
concentrations. Receding glaciers, for example, can lead to increased glacial dust. Strong winds,
which may increase with climate change, can suspend glacial dust and lead to elevated ambient PM
levels (primarily PM10). This is already an issue in parts of Alaska; for example, PM10 in the
Matanuska-Susitna Valley is primarily wind-blown silt from river basins. This phenomenon may
worsen as glaciers continue to retreat. PM2.5 could also increase in Alaska due to larger and more
frequent wildfires (discussed in greater detail below).
Wildfires
Primarily due to increasing temperatures and changing precipitation and weather, Alaska’s wildfire
season is getting longer and fires are occurring more frequently and growing larger (UAF, 2013;
USGCRP, 2017). Studies show that warmer temperatures could cause droughts, and therefore cause
an increased risk of wildfires in various regions of the United States (Patz et al., 2014). Western
states, including Alaska, are predicted to be particularly affected by more frequent large wildfires
(Bennett et al., 2014; USGCRP, 2017). Record-breaking forest fire seasons have been seen in recent
years; over 5 million acres burned in Alaska in 2015, one of the worst recorded fire seasons in the
state (AICC, 2015). There have also been unusually large tundra fires in recent years. For example,
the 2007 Anaktuvuk River fire burned 1,039 acres on the Alaskan tundra and released more carbon
than had been absorbed by the entire circumpolar Arctic in the past 25 years (Chapin et al., 2014).
Adverse health outcomes are predicted to increase in association with increased wildfires in many
regions of the United States (Luber et al., 2014; USGCRP, 2016). In addition to morbidity and
mortality directly from wildfires (see Section 3.1.2: Accidents and Injuries), pollution exposure
could also affect the population. Wildfire emissions can significantly exceed national air quality
guidelines for several pollutants (such as PM). Wildfire smoke (comprised of particulate matter,
nitrogen oxides, carbon monoxide, volatile organic compounds, and heavy metals such as mercury)
has air pollution implications far beyond the actual location of the fire (Luber et al., 2014; Naeher et
al., 2007). Communities near wildfires and thousands of miles downwind of fires can be exposed to
wildfire emissions (smoke) ranging from days to months while the fire is active (Smith et al., 2014;
USGCRP, 2016).
Exposure to smoke from wildfires has been associated with multiple adverse health effects, such as
low birth weight, increased hospitalizations due to respiratory and cardiovascular conditions, and
premature death (USGCRP, 2016). Worldwide, an estimated 339,000 premature deaths per year are
attributed to air pollution from forest fires (Patz et al., 2014). Particulate matter can exacerbate
existing conditions, such as asthma, COPD, and cardiovascular conditions (Delfino et al., 2009;
Naeher et al., 2007; USGCRP, 2016). Wildfires are commonly associated with increased hospital
admissions for exacerbated conditions, such as asthma and COPD. During the 2007 fire in San
Diego, the odds of a person seeking emergency care increased by approximately 50% during
periods of peak PM concentrations when compared with non-fire conditions (Thelen et al., 2013).
Climate modeling suggests that a warming climate might lead to more frequent and larger fires in
the Arctic (ACIA, 2005). Future climate change may further increase the risk of wildfires in Alaska,
thereby increasing wildfire emissions and negatively impacting human health (Chapin et al., 2014).

24
As large wildfires increase, more poor air quality events may result, potentially leading to
exacerbations of pre-existing respiratory and cardiovascular illnesses.
Effects of Sea Ice Changes
A reduction in sea ice extent could make the Arctic Ocean more accessible for marine traffic.
Shipping routes could increase, as well as oil and gas exploration and cruise ship travel in new
areas. These changes could increase the risk of exposure to hazardous materials during a maritime-
related accident, though the risk could also decrease given that marine vessels would have greater
access to safer ice-free waters (NCA, 2014). Air and ocean pollution may also increase with more
traffic in the Arctic Ocean; ports and marine vessels are major sources of black carbon and PM
(Azzara and Rutherford, 2015).
Effects of Gradual Temperature Changes and Ecosystem Properties
Pesticides can be used to control nuisance or potentially disease-carrying pests, such as
mosquitoes and ticks. They can also be used to protect agricultural crops from pests. Health
effects vary depending on the type of pesticide. For example, some pesticides can affect the
nervous and endocrine systems; some can cause lung, eye, or skin irritation; and some may cause
cancer (EPA, 2017). Increased temperature, as well as other predicted ecosystem and weather
pattern changes, such as increased precipitation, may facilitate pest migration to Alaska or an
expansion of existing pest populations in the state (Rosenzweig et al., 2001). Pesticide use may
increase in Alaska in response to changing pest populations, which could lead to increased human
exposure to pesticides.
3.1.4 Food, Nutrition, and Subsistence Activity
Alaska state law defines subsistence use as “the noncommercial, customary and traditional uses
of wild, renewable resources by a resident domiciled in a rural area of the state for direct personal
or family consumption as food, shelter, fuel, clothing, tools, or transportation, for the making and
selling of handicraft articles out of nonedible by-products of fish and wildlife resources taken for
personal or family consumption, and for the customary trade, barter, or sharing for personal or
family consumption” (State of Alaska, 2016: AS 16.05.940 [34]). The Alaska Federation of
Natives (AFN) describes subsistence as “the hunting, fishing, and gathering activities which
traditionally constituted the economic base of life for Alaska's Native peoples and which continue
to flourish in many areas of the state today” (AFN, 2012).
Subsistence is part of a rural economic system, called a “mixed, subsistence-market” economy,
wherein families invest money into small-scale, efficient technologies to harvest wild foods.
Fishing and hunting for subsistence resources provide a reliable economic base for many rural
regions. Subsistence is focused toward meeting the self-limiting needs of families and small
communities (Wolfe and Walker, 1987; Fall, 2016). Subsistence fishing and hunting are
important sources of employment and nutrition in almost all rural Alaska communities, regardless
of race. Traditional and cultural activities also support a healthy diet and contribute to residents’
overall wellbeing (ADF&G, 2016; Norton-Smith, 2016).
Rising food prices, challenges to food quality and quantity, and changing food distribution
patterns are all factors that could be impacted by climate change (Luber et al,. 2014; Patz et al.,
2014). Due to the specialized dietary patterns in Alaska with a heavy reliance on subsistence
resources, changes to key food sources could lead to food insecurity and associated health

25
consequences. Many Alaska communities have already reported various changes to subsistence
harvest, such as salmon die-offs related to warmer ocean waters, shifting caribou migration,
decline and range change in sea mammals, and increased variability in berry harvest (berry
changes have been both positive and negative; Brubaker et al., 2014; Brubaker et al., 2012; Hupp
et al., 2015).
Notable potential impacts of climate change on food, nutrition, and subsistence activity in
Alaska include a northward shift in seal, walrus, and fish species; thinning sea and river ice, which
can make harvesting wild foods more precarious; increasing ocean temperatures; and permafrost
changes that could alter spring run-off patterns (Cochran et al., 2013). If these changes continue to
occur, the consumption of local food sources might decrease (though the consumption of some local
food sources could increase if a species moves into a new area).
Effects of Thawing Permafrost
In Alaska, permafrost changes could make travel and thus the harvesting of subsistence foods more
difficult. Areas once stabilized by permafrost have started to subside, damaging transportation
infrastructure and posing challenges for local populations harvesting subsistence resources (Norton-
Smith et al., 2016). Subsistence harvesters in Kivalina report that thawing permafrost and related
erosion have decreased stream water quality, resulting in a decrease in Arctic char populations.
Salmon populations have increased in the area, but the traditional preference is for char (Brubaker
et al., 2010). These challenges have led to smaller reported food harvests. If changes such as these
continue to occur, the consumption of local food sources might decrease (though the consumption
of some local food sources could increase if a species moves into a new area).
Thawing permafrost creates an additional challenge to the availability of traditional foods.
Traditional ice cellars are failing in some Arctic communities (Brubaker et al., 2010b). Ice cellars,
formed by digging a storage area into the permafrost, are an important component of subsistence
food storage for some residents in the communities of Nuiqsut, Kivalina, Point Hope, Point Lay,
Utqiaġvik, Wainwright, and Kaktovik. Alaska Native people have used ice cellars for thousands of
years to store food and families have used the same ice cellars for generations (Brubaker et al.,
2010). As soil temperatures increase and permafrost begins to thaw, ice cellars are more likely to
fail and result in food spoilage. Cellar failure could lead to foodborne illnesses from consuming
spoiled food (see Section 3.1.5) and could also lead to a crucial shortage of food for a household.
Such shortages could increase food insecurity in communities (Brubaker et al, 2009b).
Effects of Gradual Temperature Changes and Ecosystem Properties
The various components of climate change, such as increasing temperatures, could impact
ecosystems in Alaska. An example of such an impact is the expansion of plant species that were
once limited to a specific part of the state due to temperature. Gradual changes to the ecosystem
could also impact subsistence resources, and therefore potentially impact the availability of certain
foods for residents (NCA, 2014). Some ecosystem changes could lead to population declines for
some resources (e.g., less food available for caribou herds and the introduction of invasive species).
Migration patterns of subsistence resources, such as caribou, have changed and may to change due
to ecosystem changes. These migration changes could make harvesting subsistence resources more
difficult in some communities (i.e., people will need to travel further to find a caribou), but could
lead to more successful subsistence harvests in some areas (i.e., a resource moving into new
habitat—such as deer) (Struzik, 2010). Warming temperatures might also lead to an increase in
parasites in subsistence resources, such as caribou, which could potentially affect the availability of
certain foods in Alaska (ADF&G, 2008; Bradley et al., 2005).
26
Ocean acidification, rising ocean temperatures, and declining sea ice are additional components of
climate change that may interact to affect the location and abundance of marine fish, including
those used for subsistence. Due to declining sea ice, subsistence hunters report needing to travel
increasingly large distances to hunt marine mammals, such as bearded, spotted, ringed, and ribbon
seals, whose reproduction and survival rates are known to fluctuate with climate changes (Ferguson
et al., 2005).
3.1.5 Infectious Diseases and Toxins from Microorganisms
Researchers predict that climate change will cause a variety of temperature and ecosystem
changes at both the global and local levels. Increasing temperatures and changing weather
patterns can affect the incidence and spread of infectious diseases, especially vectorborne and
waterborne diseases. Such implications include altered population size and range of hosts,
vectors, and pathogens; duration of the transmission season; and outbreak timing and persistence
(Parkinson et al., 2005). This section focuses on vectorborne, waterborne, and foodborne diseases
that may be linked to climate change and are relevant to Alaska.
Vectorborne and Zoonotic Diseases: Effects of Temperature Changes, Extreme Weather
Events, and Changing Weather Patterns
Vectorborne diseases are illnesses that are caused by pathogens and parasites in human
populations (WHO, 2016). Common arthropod vectors include mosquitoes, ticks, and fleas.
Climate change could impact vector ecology in several ways. Changes to weather patterns and the
frequency of extreme weather events can affect vector population size, density, and survival rates.
Climate change could also influence the reproduction and survival rate of pathogens in the host,
as well as the size of the host population (Gage et al., 2008). Increases in temperature could also
impact vector development; this may hinder or aid in vector survival, depending on the vector
(ADEC, 2010). For example, an increase in temperature could allow for mosquitoes to survive
longer in a previously inhospitable environment (Patz et al., 2014). In Alaska, increasing
temperature and precipitation are potential driving factors for changes in the occurrence of
vectorborne diseases.
Zoonotic diseases are diseases that can be spread between animals and humans. Since many
people interact with animals frequently in their daily lives, some zoonotic diseases are common in
human populations.
West Nile Virus
West Nile virus (WNV) was first observed in the United States in 1999. Since then, WNV has
been documented in 48 states and has been spreading across the Canadian provinces as far west
as Yukon Territory. Thus far, no locally-acquired cases of WNV have been recorded in Alaska.
The normal lifecycle of WNV involves mosquitoes and birds. When a mosquito feeds on an
infected bird, it becomes infected with WNV and then transmits the virus by feeding on another
bird, human, or horse. Humans and horses represent dead end hosts; probably because the level of
viremia that develops is not high enough to allow mosquitoes that subsequently bite them to
become infected (ADHSS, 2002). Of the 35 mosquito species known to carry WNV, several of
those species are endemic or have been found in Alaska (e.g., Aedes canadiensis, A. vexans,
Culex pipiens, and C. restruans) (ADHSS, 2002). However, given our relatively cool, short
summers and brief mosquito season, experts feel that Alaska does not currently have favorable
27
climatic conditions to support ongoing transmission of the virus, though this could change with a
changing climate. The ideal temperature for WNV carriage in mosquitoes is at least 86° (30°C)
over a 10 day period (NY ClimAid).
Climate change predictions for Alaska show an increase in temperatures across the state,
particularly in the Interior and Northern regions. Summer temperatures in Interior Alaska already
exceed 80°F for several days annually, and it is reasonable to assume that with the predicted
temperature change for Interior Alaska, there is potential to meet this temperature requirement by
the mid- to late-century (Chapin et al., 2014; Stewart et al., 2013).
Lyme Disease and Other Tick-borne Diseases
Ticks are restricted to specific geographic locations where climatic conditions, such as
temperature and precipitation, are suitable for them to complete their life cycles (Gage et al.,
2008). Tick habitat is also related to the abundance of host species, such as white tailed deer and
white-footed mice. In the Lower 48, warmer air temperatures have increased the reproduction rate
and range of the blacklegged ticks, Ixodes scapularis (deer tick) and I. pacificus (western
blacklegged tick; EPA Climate Impacts, 2016). These ticks are vectors for the bacteria Borrelia
burgdorferi, which causes Lyme disease (CDC Lyme Transmission, 2015).
There have been no known locally-acquired cases of Lyme disease in Alaska (Alaska does not
currently have favorable climatic conditions to support the tick species that transmit the disease).
Tick surveillance demonstrates that I. scapularis currently has an established range from the
eastern U.S. into southern Manitoba, Canada (Bouchard et al., 2015). Climate-based models
indicate that as temperatures increase, the I. scapularis population could continue to expand
northward through Canada, and potentially to Alaska (Brownstein et al., 2005; Gage et al., 2008;
McPherson et al. 2017). Moreover, recent surveillance efforts have identified I. scapularis on
some Alaska dogs with recent travel outside of Alaska. There is no indication that I. scapularis is
currently established in Alaska; however, further introduction of these ticks into the state could
eventually result in an established population (Durden et al, 2016). Other non-native species can
also survive if they are introduced to certain parts of the state (Woodford, 2012). For example,
Dermacenter variabilis (the American dog tick, a vector for the pathogens that cause Rocky
Mountain spotted fever, tularemia, Q fever, and bovine anaplasmosis) has been identified on
Alaska dogs without a history of recent travel outside of Alaska. D. variabilis is not established in
Alaska, but it does have eventual invasion potential, given the right set of climatic conditions
(current northern range limit is below 52° North latitude in southern Canada [Dergousoff et al.,
2013]; Durden et al., 2016; Woodford, 2012).
Rabies Virus
Rabies is a zoonotic disease caused by a family of viruses that infect mammals. The majority of
animal rabies cases in the U.S. occur in wild animals, such as foxes, skunks, bats, and raccoons.
Rabies is most commonly transmitted to humans via the bite of a rabid animal (CDC Rabies,
2016).
Rabies is enzootic (consistently present) among the fox populations of northern and western
coastal Alaska. In Alaska, rabies infection most commonly occurs in foxes, although dogs,
wolves, and bats occasionally become infected as well (ADHSS, 2011). Most cases occur in early
fall through spring. During this time, foxes move inland from the sea ice. Climate changes could
lead to conditions that support an increase in the Arctic fox population (Kim et al., 2014).
Increasing temperature could facilitate an expansion of rabid Arctic fox populations, but

28
predictions are complicated by modeled regional differences in precipitation (Kim et al., 2014).
Decreased sea ice could limit the movement of Arctic foxes, which could lead to decreased
opportunity for rabies transmission (Kim et al., 2014), but may also result in Arctic foxes
foraging closer to villages and thereby might increase the likelihood of contact with humans and
domestic pets.
Rabies from bats is common in the continental United States and several Canadian provinces.
There are only six bat species in Alaska, and most have ranges that do not extend beyond
southeast Alaska (ADHSS, 2016). The geographic range of bats is tied to several factors,
including climate (particularly average temperatures; Kim et al., 2014). Of note for Alaska, the
short duration of darkness in the summer limits foraging activities for bats, thereby limiting their
northern range (ADHSS, 2006). This limiting factor would remain, regardless of climate change.
Echinococcosis
Echinococcosis is a zoonotic infection caused by tapeworms from the genus Echinococcus.
Echinococcosis occurs sporadically in Alaska and reported cases have decreased in recent
decades. Cystic echinococcosis, caused by infection with Echinococcus granulosus, has been
reported in all regions in Alaska except the Aleutians. Alveolar echinococcosis, caused by
infection with E. multilocularis, has only been reported in Alaska in the North Slope region and
St. Lawrence Island. Warmer temperatures could support the expansion of foxes and voles, which
are common carriers of E. multilocularis, though warmer temperatures might also make it harder
for E. multilocularis eggs to survive (Parkinson and Evengård, 2009; Rausch, 2003; Jenkins et al.,
2013).
Food- and Waterborne Diseases: Effects of Temperature Changes, Extreme Weather
Events, and Ecosystem Properties
Climate change may alter the incidence of food- and waterborne disease by way of increased
temperatures, extreme weather events, and changing availability of fresh food and drinking water.
Increased temperatures can directly affect pathogens by influencing their survival, persistence,
and virulence (ADEC, 2010; Fleury et al., 2006). For example, increased air temperatures may
lead to thawing permafrost, which could impact the safety of traditional forms of food storage in
Alaska (Brubaker et al., 2010b).
Extreme weather events, such as floods and droughts, can reduce the availability of safe drinking
water, fresh food, and sewer services. Increased precipitation and associated runoff can also
change the spread of pathogens that cause food and waterborne diseases (Parkinson and Butler,
2005). Flooding and heavy rainfall could cause overflows from sewage treatment facilities into
fresh water sources and overflows could contaminate food crops with pathogen-containing feces
(EPA Climate Impacts, 2016).
Botulism
Foodborne botulism is caused by ingesting the neurotoxin made by the bacterium Clostridium
botulinum. Improperly canning, fermenting, aging, or putrefying foods can create an anaerobic
environment, which promote the growth and toxin production of C. botulinum; this can happen at
temperatures greater than 39°F (4°C; Parkinson and Butler, 2005). Cases of botulism in Alaska
are relatively uncommon and have decreased in recent years, but the rate of foodborne botulism is
higher in Alaska than anywhere else in the Nation (CDC Botulism, 2017). All foodborne botulism
cases in Alaska have occurred among Alaska Native people who consumed traditional Alaska

29
Native foods (ADHSS, 2017b). These include “fermented” foods, dried foods, and traditionally
prepared condiments, such as seal oil. Traditional foods, such as sea mammals, are not technically
fermented because they lack adequate carbohydrates to enable fermentation; instead, these foods
are usually putrefied (ADHSS, 2017b). Because of the temperature dependency of spore
germination, it is possible that warmer ambient air temperatures in Alaska could result in an
increase in cases of foodborne botulism if foods are not able to be properly prepared and stored in
a manner that prevents spoilage (Parkinson and Evengård, 2009).
Paralytic Shellfish Poisoning
Paralytic shellfish poisoning (PSP) is a potentially fatal neuroparalytic condition that results from
ingesting saxitoxin, a marine toxin produced by dinoflagellate algae. In the right conditions,
saxitoxin accumulates in bivalve mollusks (e.g., mussels, scallops, and clams). Increasing
temperatures promote harmful algal bloom (HAB) events in freshwater and saltwater, although
PSP is a risk year-round (Paerl et al., 2011; Smith et al., 2014). Outbreaks of PSP have been
reported world-wide and have increased in frequency and range. PSP cases occur in Alaska and
could occur with greater frequency and broader range due to increasing ocean temperatures
(Parkinson and Butler, 2005). HAB events can also involve domoic acid, a toxin produced by
dinoflagellates that can cause amnesiac shellfish poisoning (ASP) when ingested by humans
(NOAA Fisheries, n.d.). Climate change projections show HAB events in Puget Sound occurring
2 months sooner and lasting up to a month longer than at present. In Alaska waters, HAB events
may also occur more frequently and last longer (UAF Sea Grant, 2014).
Giardiasis
Giardiasis is a diarrheal illness caused by the ingestion of Giardia lamblia cysts found in
contaminated soil, food, or water, as well as by fecal-oral spread from an infected person (CDC
Giardia, 2015). Alaska has some of the highest annual rates of giardiasis in the United States
(Yoder et al., 2010; Painter et al., 2015). The incidence of giardiasis could increase with climate
change as northern habitats become more suitable for animals that carry the protozoan (e.g.,
beaver; Brubaker et al., 2010; Parkinson and Evengård, 2009; Jenkins et al., 2013).
Other Gastrointestinal Illnesses
Vibrio parahaemolyticus is a leading cause of seafood-associated gastroenteritis in the United
States. V. parahaemolyticus in Alaska has been associated with the consumption of raw oysters
gathered in warm-water estuaries (McLaughlin et al., 2005). V. parahaemolyticus thrives in
warmer water temperatures (e.g., >15°C; ADHSS, 2004b). Warm water temperature also appears
to have led to Alaska’s first documented outbreak of V. parahaemolyticus in 2004, which was a
particularly warm summer (ADHSS, 2004). The prevalence of V. parahaemolyticus may increase
in Alaska waters with increasing water temperatures, though there are effective means to prevent
an outbreak. Following the 2004 outbreak, the Alaska Department of Environmental
Conservation developed a control plan for V. parahaemolyticus. As part of this plan, shellfish
harvesters must monitor water temperatures. If the temperature reaches ≥60°F, harvesters must
take corrective action; such an action may include lowering oyster gear below the thermocline
(temperatures ˂60°F; ADEC, 2017). The control plan and increased awareness of V.
parahaemolyticus in the state are likely reasons why an outbreak in Alaskan waters has not
occurred since 2004. (Note: potential impacts related to water and sanitation, such as

30
gastrointestinal illness due to damaged water systems, will be addressed in Section 3.1.7, Water
and Sanitation.)
Effects of Other Infectious Diseases and Toxins
Infectious Respiratory Diseases
The distribution of viruses with a wild bird host, such as influenza, could be impacted by climate
change—particularly as ecosystems gradually change in response to factors such as changing
temperatures (Berner et al., 2005). The impact of these potential factors on human cases of
influenza, however, is unpredictable (Gilbert et al., 2008).
Other Toxins
Naturally occurring toxins may also be mobilized into the environment due to thawing permafrost,
which could increase exposure to contaminants. In 2016, for example, an outbreak of anthrax
occurred in the Siberian region of Russia and resulted in the hospitalization of dozens of people and
the death of a child. Historically, many outbreaks of anthrax have occurred in reindeer and cattle in
this region. Some researchers speculated that the cause of the outbreaks in 2016 was thawing
permafrost that led to previously frozen and buried dead animals thawing and rising to the surface,
and subsequently releasing anthrax spores that had been previously immobilized in the carcasses
(NPR, 2016).
3.1.6 Non-communicable and Chronic Diseases
Climate change could also impact chronic non-communicable diseases due to lifestyle changes
(e.g., leisure-time activity and diet) and aeroallergen and air quality changes (the potential effects
of air pollution are addressed in Section 3.1.3).
Effects of Thawing Permafrost, Temperature Changes, and Ecosystem Properties
Changing Food Consumption Patterns
As discussed in Section 3.1.4, climate change could lead to a decrease in the consumption of
subsistence foods and a decrease in food-secure households in Alaska. Shifting from subsistence
foods can lead to an increase in the consumption of store-bought foods of lesser nutritional value
(Johnson et al., 2008). Diets with more unhealthy and/or less nutrient-rich foods could lead to
several chronic non-communicable conditions, such as obesity, diabetes, certain types of cancer,
and cardiovascular disease (ADEC, 2010; Eyre et al., 2004). If diets change in Alaska due to
climate change, rates of these chronic diseases could increase over time.
Changing Access to Recreational and Subsistence Activities
Warmer temperatures could decrease the number of days when recreational snow activities such
as skiing and snow machining can occur, as well as some subsistence activities (e.g., hunting on
the ice or snow). Increased wildfires could impact recreational activities (such as hiking) and
subsistence activities during the summer months. Alaska residents who rely on these recreational
and subsistence activities for exercise and mental health may be adversely affected if their
opportunities become more limited.
Insect Bites and Stings
31
Increased temperatures may influence insect bites and stings in Alaska. Warmer average winter
temperatures in Alaska might have already contributed to an increase in patients seeking health
care for insect bite and sting reactions. In Alaska, there was a statistically significant increase in
patients seeking care for insect reactions (e.g., yellowjacket stings) over a 14-year period
(Demain et al., 2009). The most northern regions in the study had the largest percentage of
increases in patients seeking health care for insect reactions and experienced the largest increases
in winter temperatures, averaging at least 6°F. Researchers believe that warmer temperatures may
have been a contributing factor to the increase in insect bites and stings (ADEC, 2010; Demain et
al., 2009).
Effects of Aeroallergen Changes
Climate change could affect allergies and respiratory health as higher temperatures and changes
in precipitation influence the abundance, seasonality, and distribution of aeroallergens (such as
birch pollen; NCA, 2014). Warmer temperatures in Alaska could lead to greater pollen exposures
due to earlier and longer pollen seasons. As a result, rates of allergic rhinitis (hay fever) and
asthma could be impacted by these changes to aeroallergens.
A community-based surveillance study in Alaska observed that allergic asthma symptoms from
outdoor sources were significantly more likely in months when participants reported unseasonable
environmental conditions, such as pollen changes or increased precipitation (Driscoll et al., 2016;
AMAP, 2017). In 2014 and 2016, tree pollen counts in Anchorage and Fairbanks were the some of
the highest the world and may have been the result of an early, dry spring (ADHSS, 2017; ADN
2016). This increase in tree pollen counts may have resulted in more reported allergy symptoms in
both communities (ADN, 2016).
3.1.7 Water and Sanitation
The World Health Organization (WHO) lists unsafe drinking water combined with inadequate
sanitation and hygiene as one of the top 10 health risk factors leading to disease, disability, and
death worldwide (Berner et al., 2005; WHO, 2009). The WHO estimated that these risk factors
contribute to approximately 88% of the deaths from diarrheal diseases (CDC WASH, 2015). An
estimated 900,000 people fall ill and up to 900 die each year in the United States from diseases
resulting from drinking contaminated water (APHA, 2011). In Alaska, the lack of adequate
sanitation is associated with increased transmission of communicable diseases such as respiratory
infections, skin infections, meningitis, and gastroenteritis in rural communities (Berner et al.,
2005; Hennessy, 2008; Wenger et al., 2010; Thomas et al., 2015).
Drinking water distribution in Alaska currently consists of several methods, including piped
utility systems, community-haul, and self-haul (Warren et al., 2005). Sewage systems in Alaska
include piped facilities, septic systems, pit privies (outhouses), community haul and self-haul.
Approximately 80% of rural community housing units have in-home water and wastewater
services (Thomas et al., 2015). The remaining 20% (approximately 30 communities) use
alternative methods, such as honey buckets (a honey bucket is a container placed in the house and
used as a toilet; disposal requires carrying the container outside to be emptied at a designated
spot, which may or may not be a sewage lagoon; Berner et al., 2005).

32
Climate change could impact water and sanitation facilities, and rates of associated disease, in a
number of ways. Flooding, thawing permafrost, increased temperatures, and changing weather
patterns are all examples of climate change components that could impact human health. In
Alaska, water and sanitation infrastructure damage has already occurred in some communities
due to coastal and riverbank erosion, thawing permafrost, storm surges, and flooding (including
flooding from spring ice breakup). Further damage to drinking water, wastewater, and/or storm
water systems could adversely impact human health by way of facilitating waterborne diseases
(such as giardiasis) and decreasing the availability and quality of water used for personal hygiene
and drinking water.
Effects of Thawing Permafrost
Thawing permafrost can damage water and sewer infrastructure, leading to an increase in
waterborne diseases, such as cryptosporidiosis and giardiasis. Thawing permafrost has already
been implicated in damage to water and sewer systems in rural Alaska communities.
Kwigillingok, for example, reported the loss of an aquifer due to the disappearance of permafrost
(ADEC, 2010). As permafrost continues to thaw in Alaska, water and sewer infrastructure may
suffer damage, which could increase waterborne and water-washed diseases (diseases caused by
lack of clean water for washing, such skin and eye infections; ADEC, 2010).
Thawing permafrost could also lead to the drainage of surface water sources (AMAP, 2017).
Lakes in permafrost regions in Alaska have already begun to change; some lakes have decreased
in size and others have disappeared (Evengård et al., 2011). Because many communities in the
Arctic rely on surface water sources, including Alaska’s North Slope, changes to these sources
could impact the availability of potable water and impact human health. For example, limited
access to water is associated with an increase in skin infections and pediatric hospitalization rates
for pneumonia, influenza, and respiratory syncytial virus infections (Wenger et al., 2010; Thomas
et al., 2015; Hennessy et al., 2008).
Effects of Weather Pattern Changes
Increased precipitation, particularly heavy rainfall events, can overwhelm water and sewage
systems, leading to waterborne infections (see Section 3.1.5 for an expanded discussion of
waterborne disease and climate change; CDC, 2011; USGCRP, 2016; ADEC, 2010; Patz et al.,
2014). In 1993, the largest outbreak of Cryptosporidium in the United States was preceded by the
heaviest rainfall event in 50 years. This outbreak in Milwaukee caused approximately 403,000
illnesses and 50 deaths (MacKenzie et al., 1994; Patz et al., 2008). Extreme storm events have
been tied to human illness in the Arctic (Evengård et al., 2011; Warren et al., 2005).
Extreme storm events can also damage infrastructure for drinking water, wastewater, and storm
water systems (USGCRP, 2016). Heavy precipitation can lead to flooding and surface runoff and
can increase pathogen loads in water sources and promote harmful algal blooms (USGCRP,
2016). Heavy precipitation events can also exacerbate existing issues with inadequate or
deteriorating infrastructure.
Nationally, researchers predict that hurricanes and rainfall will increase in intensity, thus increasing
the risk of flooding in coastal and inland regions. In Alaska, storms are predicted to increase in
frequency and intensity. This predicted change, combined with increased coastal and riverbank
erosion, could lead to damaged water and sanitation infrastructure, as well as contaminated surface
water sources due to flooding. Storm damage to Kivalina in 2004, for example, damaged the
community’s leach field system for the washeteria (which is the only structure providing public

33
showers, laundry facilities, and flush toilets, as Kivalina does not have piped water and sewer) and
resulted in the closure of the washeteria for the entire winter (Brubaker et al., 2010). The rate of
respiratory infections in Kivalina increased after 2004, possibly due to the washeteria’s prolonged
closure (Thomas et al., 2013). A community-based surveillance study in Alaska found that water
insecurity (reduced amount of water usually used) was significantly more likely in months when
participants reported unusual weather (Driscoll et al., 2016).
Effects of Sea Level Changes
Rising sea levels can increase coastal erosion, worsen storm surges and flood areas, and damage
infrastructure (Patz et al., 2014). While sea levels are decreasing in some parts of Alaska, levels
are increasing near some communities. Additionally, coastal erosion and storm surges are already
challenges in some communities. Storm surges in vulnerable coastal regions could lead to sea
water overtopping and contaminating freshwater sources (ADEC, 2010). As discussed in the
climate change predictions for Alaska, the state may be adversely impacted once the rate of sea
level rise exceeds the rate of rising land surface, though the scale and timing of this change is
uncertain (O’Harra, 2010; UAF Sea Grant, 2014).
Effects of Temperature and Precipitation Changes
Though precipitation in the form of rain is expected to increase for much of Alaska, some models
predict that the availability of potable water will decrease due to climate change (ADEC, 2010).
For example, tundra lakes and ponds in some parts of Alaska have already been shrinking due in
part to increased evaporation and increased drainage as permafrost thaws (Riordan et al., 2006).
For a community-specific example, water operators in Point Hope reported that during the
summers of 2007 and 2008, there was a disruption in drinking water treatment due to drought and
a temperature-driven increase in organic material in an Arctic tundra lake, which was the source
of drinking water for the community (Brubaker et al., 2009). There was no evidence of an impact
to the rates of waterborne illness in the community during this incident; however, substantial
increases in organic material can raise the cost of water treatment (due to more frequent filter
changes), sometimes limiting a community’s ability to provide safe drinking water (Brubaker et
al., 2009).
3.1.8 Health Services Infrastructure and Capacity
Health services infrastructure and capacity refers to physical infrastructure, staffing levels, staff
competencies, and technical capabilities of health care facilities. Access to health care and health
care capacity is often influenced by natural disasters. This can occur if an influx in patients
overwhelms health service capacity, thus limiting residents’ access to health care. If large-scale
incidents occur that involve multiple individuals, existing health services could be overwhelmed,
as many clinics and regional health centers have limited capacity.
Currently, about half of all Alaska Native people reside in small communities that are isolated
from regional hospitals and health centers due to large distances, weather events, and geographic
barriers. Many of these communities are not accessible by road, and can only be accessed via
boat, snow machine, or small aircraft.
Climate change could impact access to health care services. For example, thawing permafrost
could damage a health clinic structure, a road accessing a clinic, or village runways. Extreme
storm events and wildfire smoke can decrease access to health services. Communities without
34
access to health care services may be adversely affected by climate variability and climate change
(Frumkin et al., 2008; Smith et al., 2014).
Effects of Thawing Permafrost
Thawing permafrost could damage health care infrastructure and directly impact health care
services—more people requiring medical assistance because of accidents and injuries due to
failing infrastructure. Water supply systems and wastewater systems are further examples of
infrastructure that could be damaged from thawing permafrost and result in adverse health effects.
Effects of Extreme Weather Events
In Alaska, scientists predict more frequent and intense storms due to climate change. As
mentioned above, large-scale incidents, such as extreme weather events, could overwhelm
existing health services, especially in communities where the capacity of health care resources are
already strained. Extreme weather events could also preclude access to health services—e.g.,
storms can impede air and boat travel.
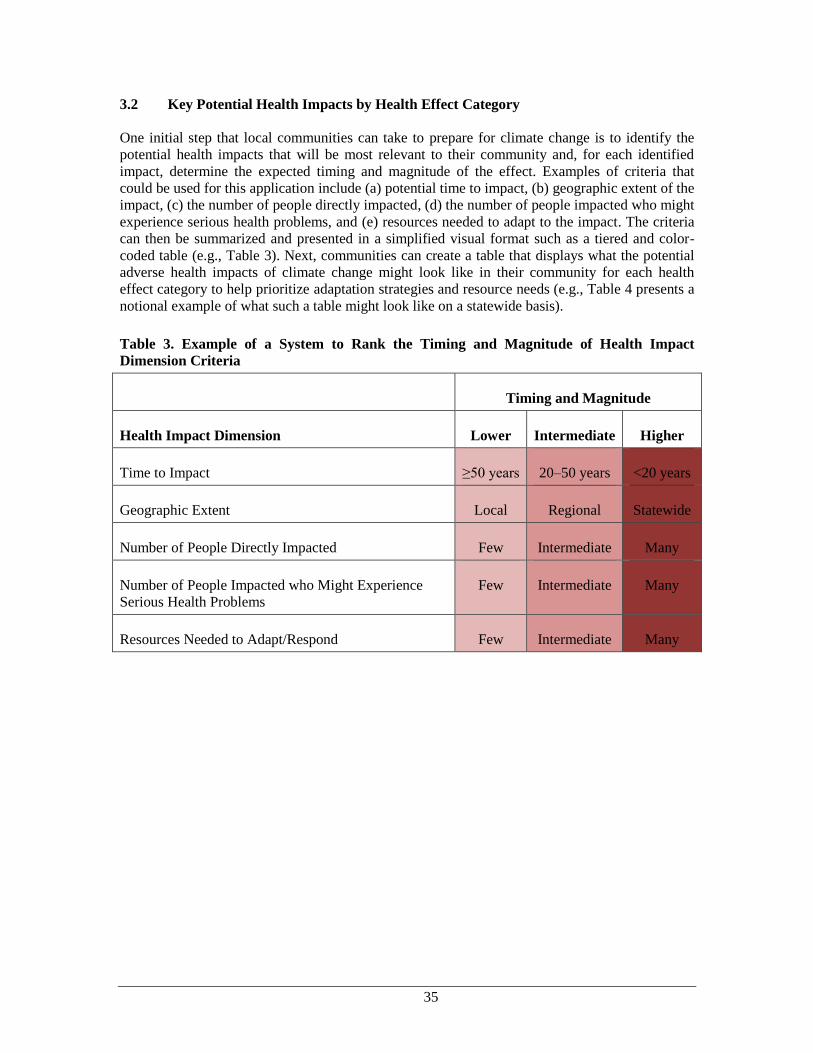
35
3.2 Key Potential Health Impacts by Health Effect Category
One initial step that local communities can take to prepare for climate change is to identify the
potential health impacts that will be most relevant to their community and, for each identified
impact, determine the expected timing and magnitude of the effect. Examples of criteria that
could be used for this application include (a) potential time to impact, (b) geographic extent of the
impact, (c) the number of people directly impacted, (d) the number of people impacted who might
experience serious health problems, and (e) resources needed to adapt to the impact. The criteria
can then be summarized and presented in a simplified visual format such as a tiered and color-
coded table (e.g., Table 3). Next, communities can create a table that displays what the potential
adverse health impacts of climate change might look like in their community for each health
effect category to help prioritize adaptation strategies and resource needs (e.g., Table 4 presents a
notional example of what such a table might look like on a statewide basis).
Table 3. Example of a System to Rank the Timing and Magnitude of Health Impact
Dimension Criteria
Timing and Magnitude
Health Impact Dimension Lower Intermediate Higher
Time to Impact ≥50 years 20–50 years <20 years
Geographic Extent Local Regional Statewide
Number of People Directly Impacted Few Intermediate Many
Number of People Impacted who Might Experience
Serious Health Problems
Few Intermediate Many
Resources Needed to Adapt/Respond Few Intermediate Many
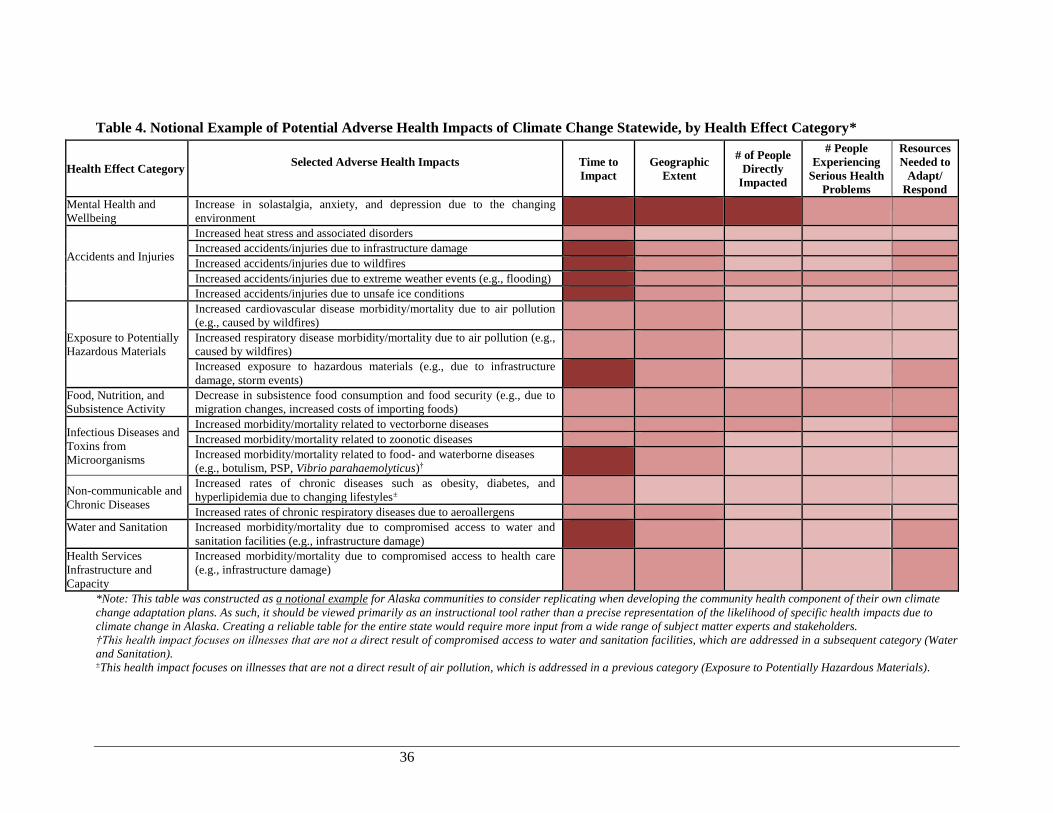
36
Table 4. Notional Example of Potential Adverse Health Impacts of Climate Change Statewide, by Health Effect Category*
Health Effect Category Selected Adverse Health Impacts
Time to
Impact
Geographic
Extent
# of People
Directly
Impacted
# People
Experiencing
Serious Health
Problems
Resources
Needed to
Adapt/
Respond
Mental Health and
Wellbeing
Increase in solastalgia, anxiety, and depression due to the changing
environment
Accidents and Injuries
Increased heat stress and associated disorders
Increased accidents/injuries due to infrastructure damage
Increased accidents/injuries due to wildfires
Increased accidents/injuries due to extreme weather events (e.g., flooding)
Increased accidents/injuries due to unsafe ice conditions
Exposure to Potentially
Hazardous Materials
Increased cardiovascular disease morbidity/mortality due to air pollution
(e.g., caused by wildfires)
Increased respiratory disease morbidity/mortality due to air pollution (e.g.,
caused by wildfires)
Increased exposure to hazardous materials (e.g., due to infrastructure
damage, storm events)
Food, Nutrition, and
Subsistence Activity
Decrease in subsistence food consumption and food security (e.g., due to
migration changes, increased costs of importing foods)
Infectious Diseases and
Toxins from
Microorganisms
Increased morbidity/mortality related to vectorborne diseases
Increased morbidity/mortality related to zoonotic diseases
Increased morbidity/mortality related to food- and waterborne diseases
(e.g., botulism, PSP, Vibrio parahaemolyticus)†
Non-communicable and
Chronic Diseases
Increased rates of chronic diseases such as obesity, diabetes, and
hyperlipidemia due to changing lifestyles±
Increased rates of chronic respiratory diseases due to aeroallergens
Water and Sanitation Increased morbidity/mortality due to compromised access to water and
sanitation facilities (e.g., infrastructure damage)
Health Services
Infrastructure and
Capacity
Increased morbidity/mortality due to compromised access to health care
(e.g., infrastructure damage)
*Note: This table was constructed as a notional example for Alaska communities to consider replicating when developing the community health component of their own climate
change adaptation plans. As such, it should be viewed primarily as an instructional tool rather than a precise representation of the likelihood of specific health impacts due to
climate change in Alaska. Creating a reliable table for the entire state would require more input from a wide range of subject matter experts and stakeholders.
†This health impact focuses on illnesses that are not a direct result of compromised access to water and sanitation facilities, which are addressed in a subsequent category (Water
and Sanitation). ±This health impact focuses on illnesses that are not a direct result of air pollution, which is addressed in a previous category (Exposure to Potentially Hazardous Materials).

37
3.3 Monitoring Recommendations and Adaptation Strategies
The monitoring recommendations and adaptation strategies discussed in this section are provided
as suggestions based on the examples of potential health impacts identified in this statewide HIA.
3.3.1 Monitoring Recommendations
The monitoring recommendations provided here are intended to help characterize the adverse
health impacts of climate change over time. Monitoring indicators and resources are listed to help
decision-makers and other stakeholders develop surveillance strategies and identify agencies
currently collecting the relevant health and environmental data. This section presents monitoring
recommendations and resources for each HEC.
An effective monitoring strategy requires the development of a suite of measurable and objective
indicators. Fortunately, numerous public health surveillance systems exist and robust sets of
climate change indicators have been developed by agencies such as the U.S. Environmental
Protection Agency (EPA Climate Change Indicators, 2016) and the Council of State and
Territorial Epidemiologists (CSTE Climate Change Indicators, n.d.).
This HIA proposes health and environmental indicators to (1) characterize how well the state is
performing for several health outcomes in each health effect category, and (2) monitor future
change (Table 5). Table 5 also presents monitoring resources to help improve situational
awareness related to potential climate change impacts. These resources are listed to help decision-
makers and other stakeholders develop surveillance strategies and identify agencies currently
collecting the relevant health and environmental data; however, agencies may not have
designated staff for ongoing monitoring and the list of monitoring resources is not exhaustive.
More resources will need to be developed to comprehensively monitor all potential indicators
statewide. Where possible, this HIA identifies monitoring strategies that have been developed and
tested by other state, federal, and international entities. For example, this HIA suggests
monitoring many of the health and environmental indicators proposed and pilot tested as
indicators by CSTE (CSTE Climate Change Indicators, n.d.).

38
Table 5. Proposed Health and Environmental Indicators and Monitoring Resources
Potential Impact Health and Environmental Indicators Examples of Existing Monitoring Resources
Mental Health and Wellbeing
Increase in psychosocial distress
(e.g., anxiety or depression) due to
the changing environment
Health indicators
Hospital/clinic visits due to distress following a
climate-associated event (e.g., flooding, storm surge,
wildfire)
Environmental indicators
Tidal gauges (to monitor sea-level rise)
Health resources
Alaska Trauma Registry (ATR) for injury trends:
http://dhss.alaska.gov/dph/Emergency/Pages/trauma/r
egistry.aspx
Alaska Health Facilities Data Reporting Program
(HFDR) for hospital diagnoses trends:
http://dhss.alaska.gov/dph/HealthPlanning/Pages/Disc
hargeData.aspx
Environmental resources
NOAA Sea Level Trends:
http://tidesandcurrents.noaa.gov/sltrends/sltrends.html
Accidents and Injuries
Increased heat stress and associated
disorders
Health indicators
Deaths due to heat (number, rate)*
Hospitalizations due to heat (number, rate)*
ER visits due to heat (number, rate)*
Environmental indicators
Daily maximum and minimum temperatures
Health resources
ATR for injury trends
Alaska HFDR for hospital diagnoses trends
Environmental resources
Scenarios Network for Alaska + Arctic Planning
(SNAP) for community profiles on observed and
projected temperatures:
https://www.snap.uaf.edu/tools-and-data/all-analysis-
tools

39
Potential Impact Health and Environmental Indicators Examples of Existing Monitoring Resources
Increased accidents/injuries due to
infrastructure damage (e.g., motor
vehicle accidents)
Health indicators
Injuries and deaths from transportation (number, rate)
Environmental indicators
Daily maximum and minimum temperatures
Soil temperatures
Health resources
ATR for injury trends
Alaska HFDR for hospital diagnoses trends
Alaska Department of Transportation (DOT) reports
on fatal and nonfatal motor vehicle accidents
Environmental resources
SNAP for community profiles on observed and
projected temperatures
Increased accidents/injuries due to
wildfires
Health indicators
Injuries and deaths due to wildfire (number, rate)*
Environmental indicators
Air mass stagnation events (number)*
Total number of wildland fires*
Total number of acres affected by wildland fires*
Health resources
ATR for injury trends
Alaska HFDR for hospital diagnoses trends
Environmental resources
BLM wildfire webpage: http://fire.ak.blm.gov
Increased accidents/injuries from
extreme weather events (e.g.,
flooding)
Health indicators
Injuries and deaths due to severe storms (number,
rate)*
Environmental indicators
Meteorological event data, such as extent and timing
of unusual events
Health resources
ATR for injury trends
Alaska HFDR for hospital diagnoses trends
Environmental resources
SNAP for observed and projected extreme weather
data
Alaska Shoreline Change Tool:
http://maps.dggs.alaska.gov/shoreline/#-
16434084:9589812:5
Increased accidents/injuries due to
unsafe ice conditions
Health indicators
Injuries and deaths due to ice break-through events
(number, rate)
Environmental indicators
Ice thickness, timing of ice break-up and ice-free
waters
Health resources
ATR for injury trends
Alaska HFDR for hospital diagnoses trends
Environmental resources
SNAP for observed and projected sea ice coverage
Local Environmental Observer (LEO) Network for
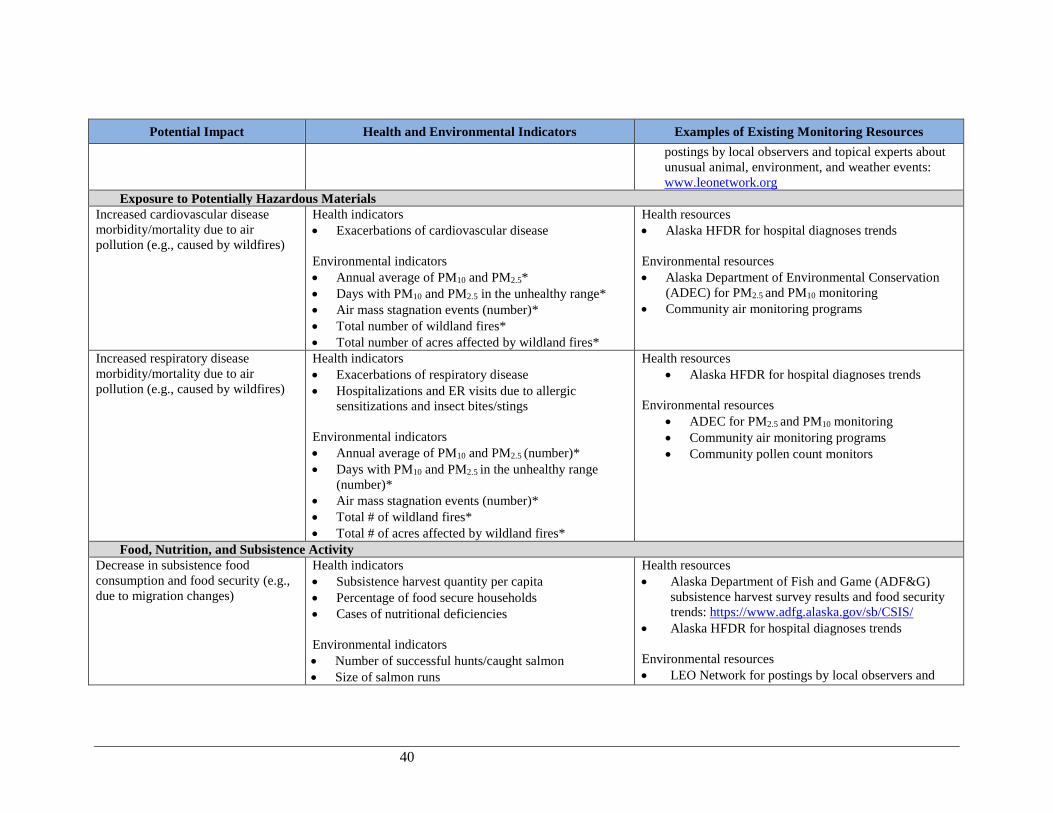
40
Potential Impact Health and Environmental Indicators Examples of Existing Monitoring Resources
postings by local observers and topical experts about
unusual animal, environment, and weather events:
www.leonetwork.org
Exposure to Potentially Hazardous Materials
Increased cardiovascular disease
morbidity/mortality due to air
pollution (e.g., caused by wildfires)
Health indicators
Exacerbations of cardiovascular disease
Environmental indicators
Annual average of PM10 and PM2.5*
Days with PM10 and PM2.5 in the unhealthy range*
Air mass stagnation events (number)*
Total number of wildland fires*
Total number of acres affected by wildland fires*
Health resources
Alaska HFDR for hospital diagnoses trends
Environmental resources
Alaska Department of Environmental Conservation
(ADEC) for PM2.5 and PM10 monitoring
Community air monitoring programs
Increased respiratory disease
morbidity/mortality due to air
pollution (e.g., caused by wildfires)
Health indicators
Exacerbations of respiratory disease
Hospitalizations and ER visits due to allergic
sensitizations and insect bites/stings
Environmental indicators
Annual average of PM10 and PM2.5 (number)*
Days with PM10 and PM2.5 in the unhealthy range
(number)*
Air mass stagnation events (number)*
Total # of wildland fires*
Total # of acres affected by wildland fires*
Health resources
Alaska HFDR for hospital diagnoses trends
Environmental resources
ADEC for PM2.5 and PM10 monitoring
Community air monitoring programs
Community pollen count monitors
Food, Nutrition, and Subsistence Activity
Decrease in subsistence food
consumption and food security (e.g.,
due to migration changes)
Health indicators
Subsistence harvest quantity per capita
Percentage of food secure households
Cases of nutritional deficiencies
Environmental indicators
Number of successful hunts/caught salmon
Size of salmon runs
Health resources
Alaska Department of Fish and Game (ADF&G)
subsistence harvest survey results and food security
trends: https://www.adfg.alaska.gov/sb/CSIS/
Alaska HFDR for hospital diagnoses trends
Environmental resources
LEO Network for postings by local observers and
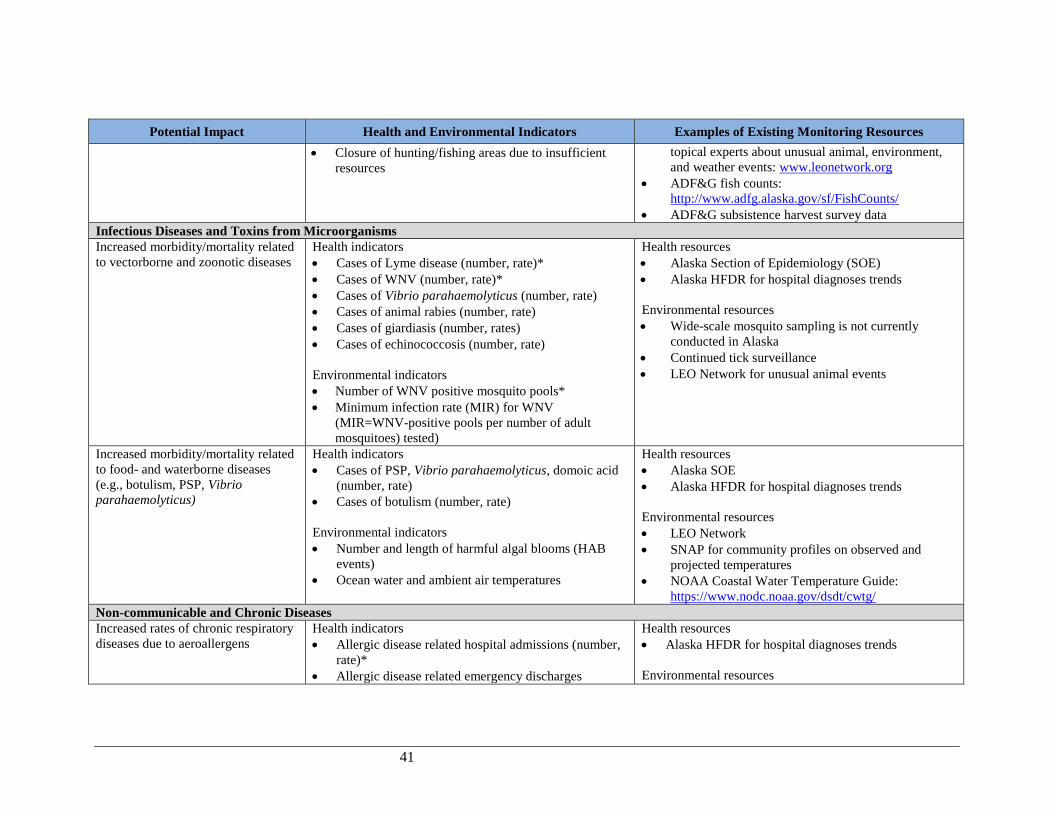
41
Potential Impact Health and Environmental Indicators Examples of Existing Monitoring Resources
Closure of hunting/fishing areas due to insufficient
resources
topical experts about unusual animal, environment,
and weather events: www.leonetwork.org
ADF&G fish counts:
http://www.adfg.alaska.gov/sf/FishCounts/
ADF&G subsistence harvest survey data
Infectious Diseases and Toxins from Microorganisms
Increased morbidity/mortality related
to vectorborne and zoonotic diseases
Health indicators
Cases of Lyme disease (number, rate)*
Cases of WNV (number, rate)*
Cases of Vibrio parahaemolyticus (number, rate)
Cases of animal rabies (number, rate)
Cases of giardiasis (number, rates)
Cases of echinococcosis (number, rate)
Environmental indicators
Number of WNV positive mosquito pools*
Minimum infection rate (MIR) for WNV
(MIR=WNV-positive pools per number of adult
mosquitoes) tested)
Health resources
Alaska Section of Epidemiology (SOE)
Alaska HFDR for hospital diagnoses trends
Environmental resources
Wide-scale mosquito sampling is not currently
conducted in Alaska
Continued tick surveillance
LEO Network for unusual animal events
Increased morbidity/mortality related
to food- and waterborne diseases
(e.g., botulism, PSP, Vibrio
parahaemolyticus)
Health indicators
Cases of PSP, Vibrio parahaemolyticus, domoic acid
(number, rate)
Cases of botulism (number, rate)
Environmental indicators
Number and length of harmful algal blooms (HAB
events)
Ocean water and ambient air temperatures
Health resources
Alaska SOE
Alaska HFDR for hospital diagnoses trends
Environmental resources
LEO Network
SNAP for community profiles on observed and
projected temperatures
NOAA Coastal Water Temperature Guide:
https://www.nodc.noaa.gov/dsdt/cwtg/
Non-communicable and Chronic Diseases
Increased rates of chronic respiratory
diseases due to aeroallergens
Health indicators
Allergic disease related hospital admissions (number,
rate)*
Allergic disease related emergency discharges
Health resources
Alaska HFDR for hospital diagnoses trends
Environmental resources
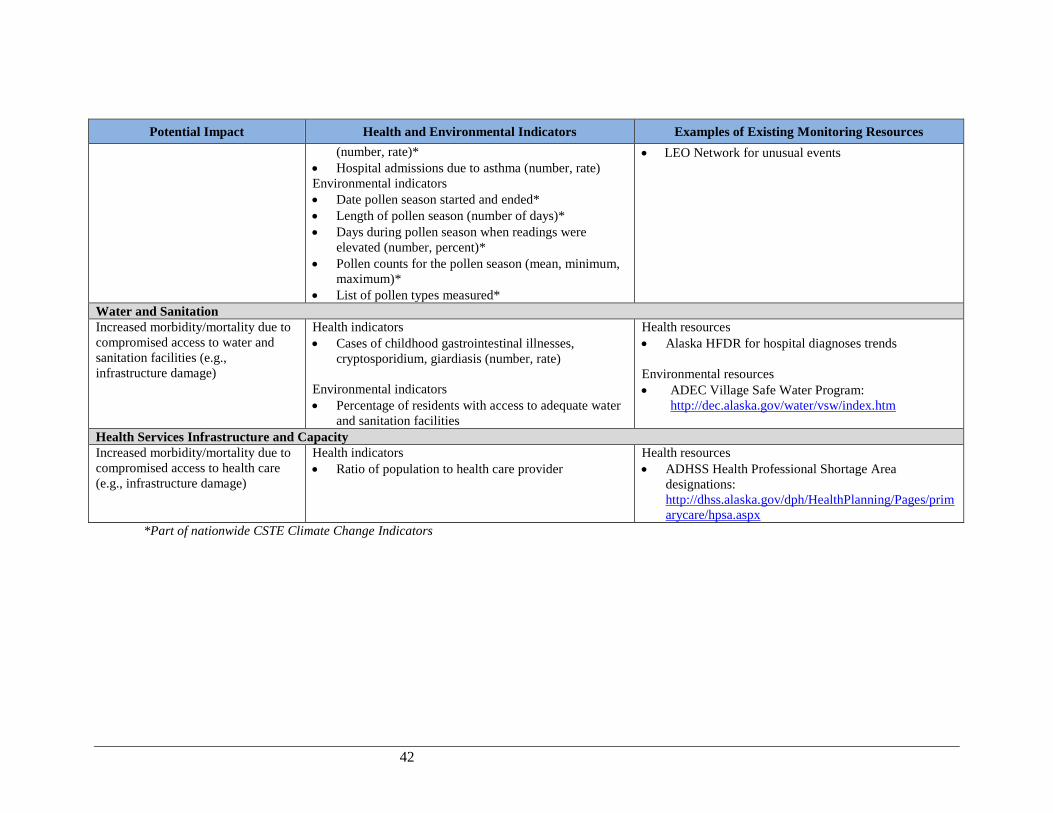
42
Potential Impact Health and Environmental Indicators Examples of Existing Monitoring Resources
(number, rate)*
Hospital admissions due to asthma (number, rate)
Environmental indicators
Date pollen season started and ended*
Length of pollen season (number of days)*
Days during pollen season when readings were
elevated (number, percent)*
Pollen counts for the pollen season (mean, minimum,
maximum)*
List of pollen types measured*
LEO Network for unusual events
Water and Sanitation
Increased morbidity/mortality due to
compromised access to water and
sanitation facilities (e.g.,
infrastructure damage)
Health indicators
Cases of childhood gastrointestinal illnesses,
cryptosporidium, giardiasis (number, rate)
Environmental indicators
Percentage of residents with access to adequate water
and sanitation facilities
Health resources
Alaska HFDR for hospital diagnoses trends
Environmental resources
ADEC Village Safe Water Program:
http://dec.alaska.gov/water/vsw/index.htm
Health Services Infrastructure and Capacity
Increased morbidity/mortality due to
compromised access to health care
(e.g., infrastructure damage)
Health indicators
Ratio of population to health care provider
Health resources
ADHSS Health Professional Shortage Area
designations:
http://dhss.alaska.gov/dph/HealthPlanning/Pages/prim
arycare/hpsa.aspx
*Part of nationwide CSTE Climate Change Indicators
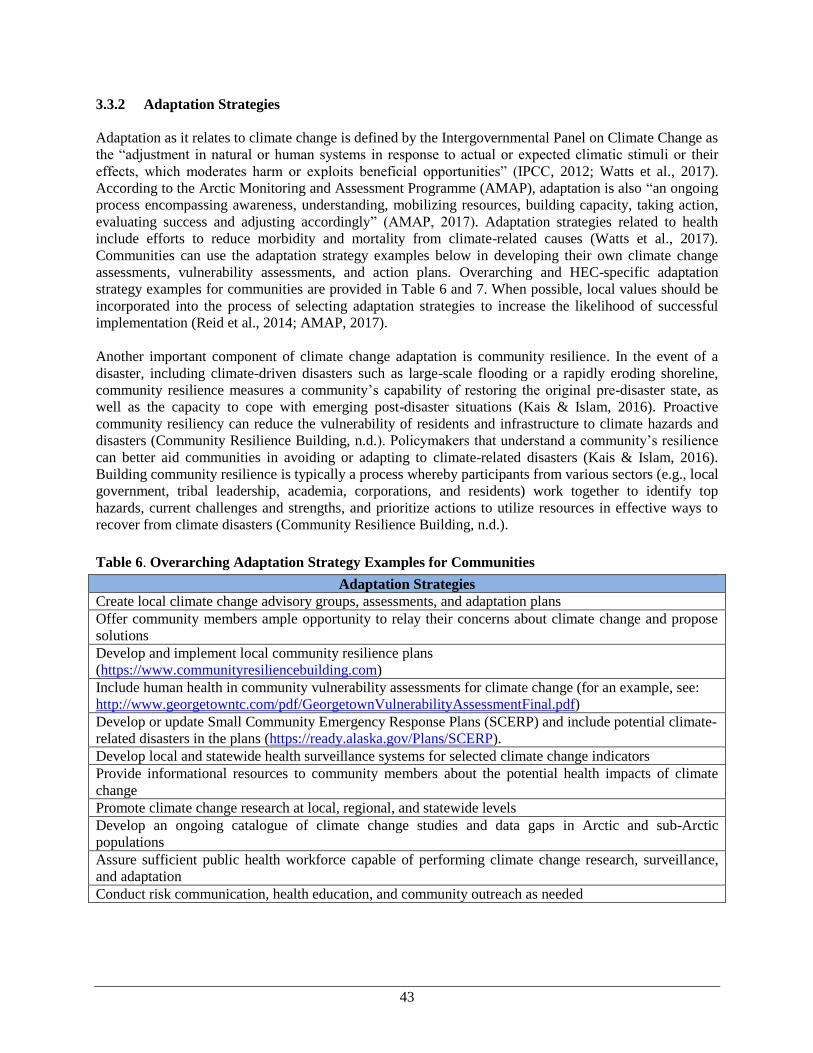
43
3.3.2 Adaptation Strategies
Adaptation as it relates to climate change is defined by the Intergovernmental Panel on Climate Change as
the “adjustment in natural or human systems in response to actual or expected climatic stimuli or their
effects, which moderates harm or exploits beneficial opportunities” (IPCC, 2012; Watts et al., 2017).
According to the Arctic Monitoring and Assessment Programme (AMAP), adaptation is also “an ongoing
process encompassing awareness, understanding, mobilizing resources, building capacity, taking action,
evaluating success and adjusting accordingly” (AMAP, 2017). Adaptation strategies related to health
include efforts to reduce morbidity and mortality from climate-related causes (Watts et al., 2017).
Communities can use the adaptation strategy examples below in developing their own climate change
assessments, vulnerability assessments, and action plans. Overarching and HEC-specific adaptation
strategy examples for communities are provided in Table 6 and 7. When possible, local values should be
incorporated into the process of selecting adaptation strategies to increase the likelihood of successful
implementation (Reid et al., 2014; AMAP, 2017).
Another important component of climate change adaptation is community resilience. In the event of a
disaster, including climate-driven disasters such as large-scale flooding or a rapidly eroding shoreline,
community resilience measures a community’s capability of restoring the original pre-disaster state, as
well as the capacity to cope with emerging post-disaster situations (Kais & Islam, 2016). Proactive
community resiliency can reduce the vulnerability of residents and infrastructure to climate hazards and
disasters (Community Resilience Building, n.d.). Policymakers that understand a community’s resilience
can better aid communities in avoiding or adapting to climate-related disasters (Kais & Islam, 2016).
Building community resilience is typically a process whereby participants from various sectors (e.g., local
government, tribal leadership, academia, corporations, and residents) work together to identify top
hazards, current challenges and strengths, and prioritize actions to utilize resources in effective ways to
recover from climate disasters (Community Resilience Building, n.d.).
Table 6. Overarching Adaptation Strategy Examples for Communities
Adaptation Strategies
Create local climate change advisory groups, assessments, and adaptation plans
Offer community members ample opportunity to relay their concerns about climate change and propose
solutions
Develop and implement local community resilience plans
(https://www.communityresiliencebuilding.com)
Include human health in community vulnerability assessments for climate change (for an example, see:
http://www.georgetowntc.com/pdf/GeorgetownVulnerabilityAssessmentFinal.pdf)
Develop or update Small Community Emergency Response Plans (SCERP) and include potential climate-
related disasters in the plans (https://ready.alaska.gov/Plans/SCERP).
Develop local and statewide health surveillance systems for selected climate change indicators
Provide informational resources to community members about the potential health impacts of climate
change
Promote climate change research at local, regional, and statewide levels
Develop an ongoing catalogue of climate change studies and data gaps in Arctic and sub-Arctic
populations
Assure sufficient public health workforce capable of performing climate change research, surveillance,
and adaptation
Conduct risk communication, health education, and community outreach as needed

44
Table 7. Health Effect Category-Specific Adaptation Strategy Examples for Alaska Communities
Health Effect Category Potential Adaptation Strategies
Mental Health and
Wellbeing Raise awareness about solastalgia (the distressing sense of loss that people
experience as a result of unwanted environmental changes that occur close to one’s
home) and promote strategies that mediate public risk perceptions, psychological
and social impacts, coping responses, and behavioral adaptation (Resser et al. 2011)
Implement community-based strategies to promote mental health and wellbeing
(e.g., https://www.preventioninstitute.org/taxonomy/term/124)
Implement and strengthen existing community-based behavioral health programs
that aim to prevent mental/behavioral health problems (e.g., anxiety/depression,
substance abuse, suicide, and violence prevention programs)
Accidents and Injuries Review architecture and engineering designs to ensure that infrastructure can
withstand changes to the underlying permafrost and extreme weather events, and if
not, consider ways to address the problem
Support surveillance and communication networks to warn community members of
dangerous travelling conditions (e.g., thin ice, frost heaves in roads, storm surges)
Develop risk-appropriate storm shelters for Alaska communities
Develop a plan to create access to cooling centers during extreme heat events (e.g.,
in interior Alaska; often cooling centers are located in buildings with the capacity to
provide cooler environments, such as an air-conditioned school or library)
Exposure to Potentially
Hazardous Materials Review architecture and engineering designs to ensure that infrastructure can
withstand changes to the underlying permafrost, and if not, consider ways to
address the problem
Assess location-based vulnerabilities to wildfires, mitigate high-risk areas, and
develop community response plans, such as the Firewise Community Program
(http://forestry.alaska.gov/fire/firewise)
Develop a plan to create access to clean air centers during wildfires
(https://www3.epa.gov/airnow/wildfire_may2016.pdf)
Food, Nutrition, and
Subsistence Activity Establish community-based monitoring programs for subsistence resources, such as
the Local Environmental Observer (LEO) Network and the Alaska Native Tribal
Health Consortium (ANTHC) Rural Alaska Monitoring Program (RAMP);
https://anthc.org/what-we-do/community-environment-and-health/climate-change-
food-security)
Provide support for community freezers and other food safety programs to ensure
access to safe and healthy traditional foods in Arctic communities
Conduct risk communication, health education, and community outreach regarding
the presence of potential contaminants in subsistence foods Infectious Diseases and
Toxins from
Microorganisms
Support programs such as LEO Network, the One Health Group, and RAMP
Conduct ongoing, active monitoring for harmful algal blooms (HABs)
Expand surveillance efforts for cases of vectorborne diseases and presence of
associated vectors
Chronic and Non-
communicable Diseases Support monitoring efforts for seasonal patterns of respiratory and cardiovascular
disease exacerbations that might be associated with wildfire smoke or aeroallergens
Water and Sanitation Review architecture and engineering designs to ensure piping infrastructure can
withstand changes to the underlying permafrost, and if not, consider ways to
address the problem
Collaborate with water utilities and water resource managers to assess expected
performance of infrastructure and natural systems under changing climate
conditions
Health Services
Infrastructure and
Capacity
Review architecture and engineering designs to ensure health care infrastructure
can withstand changes to the underlying permafrost, and if not, consider ways to
address the problem
45
4.0 REFERENCES
ACIA. Arctic climate impact assessment. National Science Foundation (U.S.) and United States. National Oceanic
and Atmospheric Administration; Cambridge University Press; New York, N.Y. 2005: 1042 pp.
ACS Study. American Community Survey. 2015. Available at: https://www.census.gov/programs-
surveys/acs/data/summary-file.2015.html
AFN, 2012. Alaska Federation of Natives, The right to subsist: federal protection of subsistence in Alaska.
Available at: http://www.nativefederation.org/wp-content/uploads/2012/10/2010-april8-the-right-to-
subsistence.pdf
Ahern M, Kovats RS, Wilkinson P, et al. Global health impacts of floods: epidemiologic evidence. Epidemiol Rev.
2005; 27:36-46.
ADEC, 2017. Alaska Department of Environmental Conservation, Food Safety and Sanitation Program. Vibrio
Parahaemolyticus Control Plan. Available at: http://dec.alaska.gov/eh/pdf/fss/resources-shellfish-guide-vibrio-
control-plan.pdf
ADEC Health and Culture. Alaska Department of Environmental Conservation. Chapter 7: Health and Culture –
Draft final report. Alaska Department of Environmental Conservation. 2010. Available at:
http://www.climatechange.alaska.gov
ADF&G, 2008. Alaska Department of Fish and Game. Caribou and climate change: the Nelchina caribou herd,
lichens and fire. Alaska Fish & Wildlife News. March, 2008. Available at:
http://www.adfg.alaska.gov/index.cfm?adfg=wildlifenews.view_article&articles_id=356
ADF&G, 2016. Alaska Department of Fish and Game. Subsistence in Alaska: A Year 2014 Update. Available at:
http://www.adfg.alaska.gov/static/home/subsistence/pdfs/subsistence_update_2014.pdf
ADHSS. 2002. The threat of West Nile Virus in Alaska. Bulletin No. 20, August 21, 2002. Available at:
http://epibulletins.dhss.alaska.gov/Document/Display?DocumentId=493
ADHSS. 2002b. Interim recommendations regarding West Nile Virus surveillance in Alaska. Bulletin No. 21,
September 9, 2002. Available at:
http://epibulletins.dhss.alaska.gov/Document/Display?DocumentId=489
ADHSS. 2004. Outbreak of Vibrio parahaemolyticus gastroenteritis associated with consumption of Alaskan
oysters – Summer, 2004. Bulletin No. 18, August 20, 2004. Available at:
http://epibulletins.dhss.alaska.gov/Document/Display?DocumentId=393
ADHSS. 2004b. Outbreak of Vibrio parahaemolyticus gastroenteritis associated with consumption of Alaskan
oysters – Part 2. Bulletin No. 24, October 24, 2004. Available at:
http://epibulletins.dhss.alaska.gov/Document/Display?DocumentId=387
ADHSS. 2011. 2011 Animal rabies in northwestern Alaska. Bulletin No. 6, March 25, 2011. Available at:
http://epibulletins.dhss.alaska.gov/Document/Display?DocumentId=157
ADHSS, 2015. Alaska HIA Toolkit. Technical Guidance for Health Impact Assessment in Alaska. 2015. Available
at: http://dhss.alaska.gov/dph/Epi/hia/Documents/AlaskaHIAToolkit.pdf
ADHSS. 2016. Update on bat rabies in Alaska. Bulletin No. 9, 2016. Available at:
http://www.epi.alaska.gov/bulletins/docs/b2016_09.pdf

46
ADHSS. 2017. Pollen and outdoor mold season update. No. 10, April 18, 2017. Available at:
http://www.epi.alaska.gov/bulletins/docs/b2017_10.pdf
ADHSS, 2017b. Botulism in Alaska. Available at:
http://dhss.alaska.gov/dph/Epi/id/SiteAssets/Pages/Botulism/Monograph.pdf
ADN 2016. Alaska birch pollen is getting so bad, even those without allergies might suffer. September 28, 2016.
Available at: https://www.adn.com/health/article/wave-birch-pollen-brings-health-concerns-
anchorage/2016/05/04/
ADN 2017. Prudhoe Bay spill in April leads to wider review, suspension of 14 wells. July 17, 2017. Available at:
https://www.adn.com/business-economy/energy/2017/07/17/prudhoe-bay-spill-in-april-leads-to-wider-review-
suspension-of-14-wells//
Alaska Statutes, 2016. Available at: http://www.akleg.gov/basis/statutes.asp#16.05.940
Albrecht G, Sartore GM, Connor L, et al. "Solastalgia: the distress caused by environmental change". Australasian
Psychiatry. 15 (1): S95–S98.
AMAP, 2017. Adaptation actions for a changing arctic: Perspectives from the Bering-Chukchi-Beaufort Region.
Arctic Monitoring and Assessment Programme (AMAP), Oslo, Norway. xiv + 255pp.
AMAP, 2015. Summary for Policy-makes: Arctic Pollution Issues 2015. Arctic Monitoring and Assessment
Programme (AMAP), Oslo, Norway. 12 pp. 2015; Available at:
http://www.amap.no/documents/doc/%20summary-for-policy-makers-arctic-pollution-issues-2015/1195
AMAP, 2003. AMAP Assessment 2002: The Influence of Global Change on contaminant pathways to, within, and
from the Arctic. Arctic Monitoring and Assessment Programme (AMAP), Oslo, Norway. xi+65 pp.
APHA, 2011. Available at: https://www.apha.org/policies-and-advocacy/public-health-policy-statements/policy-
database/2014/07/14/13/22/drinking-water-quality-and-public-health-position-paper
Ashley ST & Ashley WS. Flood fatalities in the United States. Journal of Applied Meteorology and Climatology.
2007; 47:805-818. doi:10.1175/2007JAMC1611.1
Azzara S & Rutherford D. Air pollution from marine vessels in the U.S. High Artic in 2025. International Council
on Clean Transportation. 2015; Available at: http://arcticjournal.com/sites/default/files/icct_air-pollution-us-
arctic-2025_20150130.pdf
Bell J, Brubaker M, Graves K, et al. Climate change and mental health: Uncertainty and vulnerability for Alaska
Natives. Center for Climate Change and Health. 2010; CCH Bulletin No. 3:1-10.
Bennett TM, Maynard NG, Cochran P, et al. Chapter 12: Indigenous peoples, lands, and resources. Climate Change
Impacts in the United States: The Third National Climate Assessment. 2014. [Melillo JM, Richmond TC, Yohe
GW (eds.)]. U.S. Global Change Research Program. 2014; 297-317. doi:10.7930/J09G5JR1.
Berner J, Furgal C, Bjerregaard P, et al. Chapter 15: Human health. Arctic Climate Impact Assessment. 2005.
Cambridge University Press. pp 863-906.
Berry HL, Bowen K, Kjellstrom T. Climate change and mental health: a causal pathways framework. Int J Public
Health. 2010; 55:123-32.
Bloomer BJ, Stehr JW, Piety CA, et al. Observed relationships of ozone air pollution with temperature and
emissions. Geophysical Research Letters. 2009: 36, doi:10.1029/2009g1037308.

47
Blunden J & Arndt DS, Eds., 2017: State of the Climate in 2016. Bull Amer Meteor Soc. 2017; 98 (8),
Si–S277, doi:10.1175/2017BAMSStateoftheClimate.1.
Bouchard C, Leonard E, Koffi JK, et al. The increasing risk of Lyme disease in Canada. Can Vet J. 2015; 56(7):693-
699.
Bradley MJ, Kutz SJ, Jenkins E, O’Hara TM. The potential impact of climate change on infectious diseases of
Arctic fauna. International Journal of Circumpolar Health. 2005; 64(5); 468-477. doi:10.3402/ijch.v64i5.18028.
Bronen R. Climate-induced community relocations: creating an adaptive governance framework based in human
rights doctrine. NYU Rev. L. & Soc. Change. 2011; 35: 375.
Brownstein JS, Holford TR, Fish D. Effect of climate change on Lyme disease risk in North America. EcoHealth.
2005; 2:38-46, doi:10.007/s10393-004-0139-x.
Brubaker M, Bell J, Dingman H, et al. Climate Change in Atqasuk, Alaska, Strategies for Community Health.
ANTHC, 2014. Available at: http://anthc.org/what-we-do/community-environment-and-health/center-for-
climate-and-health/climate-health-3/
Brubaker M, Berner J, Black M, et al. Climate Change in Selawik, Alaska, Strategies for Community Health.
ANTHC, 2012. Available at: http://anthc.org/what-we-do/community-environment-and-health/center-for-
climate-and-health/climate-health-3/
Brubaker M, Berner J, Bell J, et al. Climate Change in Noatak, AK, Strategies for Community Health. ANTHC,
2011. Available at: http://anthc.org/what-we-do/community-environment-and-health/center-for-climate-and-
health/climate-health-3/
Brubaker M, Berner J, Bell J, Warren J. Climate Change in Kivalina, Alaska, Strategies for Community Health.
ANTHC, 2010. Available at: http://anthc.org/what-we-do/community-environment-and-health/center-for-
climate-and-health/climate-health-3/
Brubaker M, Dingman H, Leavitt P, Romanovsky V. Climate change effects on traditional food cellars in Barrow,
Alaska. Center for Climate and Health. CCH Bulletin. 2010b; 4.
Brubaker M, Flensburg S, Balluta C, Skarada J. Climate Change in Nondalton, Alaska, Strategies for Community
Health. ANTHC, 2013. Available at: http://anthc.org/what-we-do/community-environment-and-health/center-
for-climate-and-health/climate-health-3/
Brubaker M, Rolin A, Bell J, Warren J. Source drinking water challenges changes to and Arctic tundra lake. Center
for Climate and Health. CCH Bulletin. 2009; 2.
CDC, 2011. Surveillance for waterborne disease outbreaks associated with drinking water --- United States, 2007—
2008. Morbidity and Mortality Weekly Report. 60:38-68. Available at:
http://www.cdc.gov/mmwrhtml/ss5709a4htm
CDC Botulism. 2017. Available at: http://www.cdc.gov/nationalsurveillance/botulism-surveillance.html
CDC Giardia. 2015. Available at: http://www.cdc.gov/parasites/giardia/
CDC Lyme Transmission. 2015. Available at: http://www.cdc.gov/lyme/transmission/
CDC Rabies. 2016. Available at: http://www.cdc.gov/rabies/
CDC WASH. 2015. Available at: http://www.cdc.gov/healthywater/global/wash_statistics.html
CDC Zoonotic Diseases. 2013. Available at: http://www.cdc.gov/onehealth/zoonotic-diseases.html
48
Chapin, FS III, Trainor SF, Cochran P, et al. Ch. 22: Alaska. Climate Change Impacts in the United States: The
Third National Climate Assessment. [Melillo JM, Richmond TC, Yohe GW (eds.)]. U.S. Global Change
Research Program. 2014; 514-536. doi:10.7930/J00Z7150.
Cochran P, Huntington OH, Pungowiyi C, et al. Indigenous frameworks for observing and responding to climate
change in Alaska. Climatic Change. 2013; 120:557-567, doi:10.1007/s10584-013-0735-2.
Commane R, Lindaas J, Benmergui J, et al. Carbon dioxide sources from Alaska driven by increasing early winter
respiration from Arctic tundra. PNAS. 2017;21:5361-5366. doi:10.1017/pnas.1618567114.
Community Resilience Building. Available at: https://www.communityresiliencebuilding.com/
CSTE Climate Change Indicators. Available at: http://www.cste.org/?page=EHIndicatorsClimate
Delfino RJ, Brummel S, Wu J, et al. The relationship of respiratory and cardiovascular hospital admissions to the
southern California wildfires of 2003. Occupational and Environmental Medicine. 2009; 66:189-197,
doi:10.1136/oem.2008.041376.
Demain JG, Gessner BD, McLaughlin JB, et al. Increasing insect reactions in Alaska: is this related to climate
change? Allergy and Asthma. 2009; 30(3):238-243(6).
Dergousoff SJ, Galloway TD, Lindsay LR, et al. Range expansion of Dermacentor variabilis and Dermacentor
andersoni (Acari: Ixodidae) near their norther distributional limits. Journal of Medical Entomology. 2013;
50(3):510-520. doi:10.1603/ME12193.
Doney, S., Rosenberg AA, Alexander M, et al. Climate Change Impacts in the United States: The Third National
Climate Assessment [Melillo JM, Richmond TC, Yohe GW (eds.)], U.S. Global Change Research Program,
557-578. doi:10.7930/J0RF5RZW.
Driscoll DL, Mitchell E, Barker R, et al. Assessing the health effects of climate change in Alaska with community-
based surveillance. Climatic Change. 2016. doi: 10.1007/s10584-016-1687-0.
Durden LA, Beckmen KB, Gerlach RF. New records of ticks (Acari: Ixodidae) from dogs, cats, humans, and some
wild vertebrates in Alaska: Invasion potential. Journal of Medical Entomology. 2016; 53(6):1391-1395. doi:
10.1093/jme/tjw128.
Evengård B, Berner J, Brubaker M, et al. Climate change and water security with a focus on the Arctic. Global
Health Action. 2011; 4:8449, doi: 10.3402/gha.v4i0.8449.
EPA, 2017. Human health issues related to pesticides. Available at: https://www.epa.gov/pesticide-science-and-
assessing-pesticide-risks/human-health-issues-related-pesticides.
EPA Climate Change Indicators. 2016. Climate change indicators in the United States, 2016. Fourth edition. EPA
430-R-16-004. Available at: www.epa.gov/climate-indicators
EPA Climate Impacts. 2016. Available at: https://archive.epa.gov/epa/climate-impacts/climate-impacts-alaska.html
EPA Ozone. 2016. Available at: https://www.epa.gov/ozone-pollution/ozone-basics#effects
Eyre H, Kahn R, Robertson RM, and the ACS/ADA/AHA Collaborative Writing Committee, Clark NG, Doyle C,
Gansler T, et al. Preventing Cancer, Cardiovascular Disease, and Diabetes: A Common Agenda for the
American Cancer Society, the American Diabetes Association, and the American Heart Association. CA: A
Cancer Journal for Clinicians, 2004; 54: 190–207. doi: 10.3322/canjclin.54.4.190.

49
Fall, JA. Regional patterns of fish and wildlife harvests in contemporary Alaska. Arctic. 2016; 69(1):47-64. doi:
10.14430/arctic4547
Ferguson SH, Stirling I, McLoughlin P. Climate change and ringed seal (Phoca hispida) recruitment in western
Hudson Bay. Marine Mammal Science. 2005; 21(1):121-135. doi:10.111/j.1748-7692.2005.tb01210.x.
Fleischer N, Melstrom P, Yard E, et al. Morbidity and mortality associated with unintentional falls through the ice in
Alaska. Intr J Circumpolar Health. 2013; 72:22447.
Fleury M, Charron DF, Holt JD, et al. A time series analysis of the relationship of ambient temperature and common
bacterial enteric infections in two Canadian provinces. International Journal of Biometeorology 2006;
50(6):385-391. doi:10.1007/s00484-006-0028-9.
Frumkin H, Hess J, Luber G, et al. Climate change: the public health response. Amer J Public Health. 2008;
98(3):435-445.
Gage KL, Burkot TR, Eisen RJ, Hayes EB. Climate and vectorborne diseases. American Journal of Preventative
Medicine. 2008; 35:436-450, doi:10.1016/j.amepre.2008.08.030.
GAO, 2009. United States Government Accountability Office. Alaska Native villages: limited progress has been
made on relocating villages threatened by flooding and erosion. Available at:
http://www.gao.gov/assets/300/290468.pdf
Gilbert M, Slingenbergh J, Xiao X. Climate change and avian influenza. Rev Sci Tech. 2008; 27(2): 459-466.
Hartmann DL, Klein Tank AMG, Rusticucci M, et al. 2013: Observations: Atmosphere and Surface. In: Climate
Change 2013: The Physical Science Basis. Contribution of Working Group I to the Fifth Assessment Report of
the Intergovernmental Panel on Climate Change [Stocker TF, Qin D, Plattner GK, et al (eds.)]. Cambridge
University Press, Cambridge, United Kingdom and New York, NY, USA.
Hennessey TW, Ritter T, Holman RC, et al. The relationship between in-home water service and the risk of
respiratory tract, skin, and gastrointestinal tract infections among rural Alaska Natives. American Journal of
Public Health. 2008; 98(11): 2072-2078.
Hupp J, Brubaker M, Wilkinson K, Williamson J. How are your berries? Perspectives of Alaska’s environmental
managers in wild berry abundance. Int J Circumpolar Health. 2015; 74: 28704.
IPCC, 2000. Emissions scenarios: Special report of working group III of the Intergovernmental Panel on Climate
Change. [Nakicenovic N and Swart R (eds.)]. 2000. Cambridge University Press, Cambridge, United Kingdom
and New York, NY, USA.
IPCC, 2012. Managing the risks of extreme events and disasters to advance climate change adaptation. A special
report of working groups I and II of the Intergovernmental Panel on Climate Change [Field CB, Barros V,
Stocker TF, et al (eds.)]. 2012. Cambridge University Press, Cambridge, United Kingdom and New York, NY,
USA.
IPCC, 2014. Climate Change 2014: Synthesis Report. Contribution of Working Groups I, II and III to the Fifth
Assessment Report of the Intergovernmental Panel on Climate Change [Core Writing Team, R.K. Pachauri and
L.A. Meyer (eds.)]. IPCC, Geneva, Switzerland, 151 pp
Jafarov EE, Marchenko SS, Romanovsky VE. Numerical modeling of permafrost dynamics in Alaska using a high
spatial resolution dataset. The Cryosphere Discuss. 2012; 6:89-124. doi:10.5194/tcd-6-89-2012.

50
Jenkins EJ, Castrodale LJ, de Rosemond SJ, et al. Tradition and transition: parasitic zoonoses of people and animals
in Alaska, northern Canada, and Greenland. Adv Parasitol. 2013; 82:33-201. doi:10.1016/B978-0-12-407706-
5.00002-2.
Johnson JS, Nobmann ED, Asay E, Lanier AP. Dietary intake of Alaska Native people in two regions and
implications for health: the Alaska native dietary and subsistence food assessment project. IJCH. 2008; 68(2):
109-122.
Kais SM & Islam MS. Community capitals as community resilience climate change: Conceptual connections. Int. J.
Environ. Res. Public Health. 2016; 13:1211. doi:10.3390/ijerph13121211.
Kim BI, Blanton JD, Gilbert A, et al. A conceptual model for the impact of climate change on fox rabies in Alaska,
1980-2010. Zoonoses Public Health. 2014; 61(1):72-80.
Larsen PH, Goldsmith S, Smith O, et al. Estimating future costs for Alaska public infrastructure at risk from climate
change. Global Environmental Change. 2008; doi:10.1010/j.gloenvcha.2008.03.005.
Leibensperger EM, Mickley LJ, Jacob DJ. Sensitivist of US air quality to mid-latitude cyclone frequency and
implications of 1980-2006 climate change. Atmospheric Chemistry and Physics. 2008; 8:7075-7086,
doi:10.5194/acp-8-7075-2008.
Lim SS, Vos T, Flaxman AD, et al. 2012:A comparative risk assessment of burden of disease and injury attributable
to 67 risk factors and risk factor clusters in 21 regions, 1990-2010: a systematic analysis for the Global Burden
of Disease Study 2010. Lancet, 2012; 380(9859): 2224-2260.
Luber G, Knowlton K, Balbus J, et al. 2014: Ch. 9: Human Health. Climate Change Impacts in the United States:
The Third National Climate Assessment, J. M. Melillo, Terese (T.C.) Richmond, and G. W. Yohe, Eds., U.S.
Global Change Research Program, 220-256. doi:10.7930/J0PN93H5.
Luber G & McGeehin M. Climate change and extreme heat events. Am J Prev Med. 2008; 35(5):429-435.
MacDougall AH, Avis CA, Weaver AJ. Significant contribution to climate warming from the permafrost carbon
feedback. Nature Geoscience. 2012; 5:719-721. doi:10.1038/ngeo1573.
Mac Kenzie WR, Hoxie NJ, Proctor ME, et al. A massive outbreak in Milwaukee of cryptosporidium infection
transmitted through the public water supply. NEJM. 1994; 331:161-167. doi:10.1056/NEJM199407213310304.
McLaughlin JB, DePaola A, Bopp CA, et al. Outbreak of vibrio parahaemolyticus gastroenteritis associated with
Alaskan oysters. NEJM. 2005; 353:1463-1470.
McPherson M, Garcia-Carcia A, Cuest-Valero F, et al. Expansion of the Lyme disease vector Ixodes Scapularis in
Canada inferred from CMIP5 climate projections. Environ Health Perspect. 2017; 125. doi:10.1289/EHP57.
Meier MF, Dyurgerov MB, Rick UK, et al. Glaciers dominate eustatic sea-level rise in the 21st century. Science.
2007; 317:1064-1067.
Naeher LP, Brauer M, Lipsett M, et al. Woodsmoke health effects: a review. Inhalation Toxicology. 2007; 19:67-
106, doi:10.1080/08958370600985875.
NASA, 2005. NASA – What’s the difference between weather and climate? Available at: https://www.nasa.gov/
mission_pages/noaa-n/climate/climate_weather.html
NASA, 2017. Global Climate Change Facts: Causes. NASA Jet Propulsion Laboratory, California Institute of
Technology. Available at: https://climate.nasa.gov/causes/

51
NWS, 2009. National Weather Service. National Oceanic and Atmospheric Administration’s National Weather
Service. National Weather Service Glossary. Available at: http://www.nws.noaa.gov/glossary/
NCA 2014. National Climate Assessment. U.S. Global Change Research Program. Available at:
http://nca2014.globalchange.gov/report
NOAA Fisheries. HABs and Marine Biotoxins Overview. Available at:
https://www.nwfsc.noaa.gov/%20research/divisions/efs/microbes/hab/habs_toxins/index.cfm
NOAA Tides and Currents. Available at: http://tidesandcurrents.noaa.gov/sltrends/sltrends.shtml
Norton-Smith K, Lynn K, Chief K, et al. 2016. Climate change and indigenous peoples: a synthesis of current
impacts and experiences. Gen. Tech. Rep. PNW-GTR-944. Portland, OR: U.S. Department of Agriculture,
Forest Service, Pacific Northwest Research Station. 136 p.
NPR 2016. Anthrax outbreak in Russia thought to be result of thawing permafrost. NPR. August 3, 2016. Available
at: http://www.npr.org/sections/goatsandsoda/2016/08/03/488400947/anthrax-outbreak-in-russia-thought-to-be-
result-of-thawing-permafrost
NPR 2013. Impossible choice faces America’s first ‘climate refugees. NPR. May 19, 2013. Available at:
http://www.npr.org/2013/05/18/185068648/impossible-choice-faces-americas-first-climate-refugees
O’Harra D. Southern Alaskan sea levels defy worldwide trends. Alaska Dispatch News. December 27, 2010.
Available at: http://www.adn.com/article/southern-alaskan-sea-levels-defy-worldwide-trends
Parkinson AJ & Butler JC. Potential impacts of climate change on infectious diseases in the Arctic. International
Journal of Circumpolar Health. 2005; 64(5):478-486.
Parkinson AJ & Evengard B. Climate change, its impact on human health in the Arctic and the public health
response of emerging infectious diseases. Global Health Action. 2009; 2. doi:10.3402/gha.v2i0.2075.
Patz JA, Frumkin H, Holloway T, et al. Climate change: Challenges and opportunities for public health. JAMA.
2014; E1-E16.
Patz JA, Vavrus SJ, Uejio CK, McLellan SL. Climate change and waterborne disease risk in the Great Lakes region
of the US. American Journal of Preventative Medicine. 2008; 35:451-458. doi:10.1016/j.amepre.2008.08.026.
Paerl HW, Hall NS, Calandrino ES. Controlling harmful cyanobacterial blooms in a world experiencing
anthropogenic and climatic-induced change. Science of the Total Environment. 2011; 409(10):1739-1745.
doi:10.1016/j.scitotenv.2011.02.001.
Painter JE, Gargano JW, Collier SA, Yoder JS. Giardiasis surveillance – United States, 2011-2012. 2015;
64(SS03):15-25. Available at: https://www.cdc.gov/mmwr/preview/mmwrhtml/ss6403a2.htm
Portier CJ, Thigpen Tart K, Carter SR, et al. 2010. A Human Health Perspective On Climate Change: A Report
Outlining the Research Needs on the Human Health Effects of Climate Change. Research Triangle Park, NC:
Environmental Health Perspectives/National Institute of Environmental Health Sciences.
doi:10.1289/ehp.1002272.
Rausch RL. Cystic echinococcosis in the Arctic and Sub-Arctic. Parasitology. 2003; 123: S73-S85.
Reid MG, Hamilton C, Reid SK, et al. 2014. Indigenous climate change adaptation planning using a values-focused
approach: a case study with the Gitga’at Nation. Journal of Ethnobiology. 34:401–424.
52
Reser JP, Swim JK. Adapting to and coping with the threat and impacts of climate change. Am Psychol. 2011;
66:277–89.
Rhein, M., Rintoul SR, Aoki S, et al. 2013: Observations: Ocean. In: Climate Change 2013: The Physical Science
Basis. Contribution of Working Group I to the Fifth Assessment Report of the Intergovernmental Panel on
Climate Change [Stocker, T.F., D. Qin, G.-K. Plattner, M. Tignor, S.K. Allen, J. Boschung, A. Nauels, Y. Xia,
V. Bex and P.M. Midgley (eds.)]. Cambridge University Press, Cambridge, United Kingdom and New York,
NY, USA.
Richter-Menge J, Overland JE, Mathis JT, Osborne E, (eds.) 2017 Arctic report card. Available at:
http://www.arctic.noaa.gov/Report-Card
Riordan B, Verbyla D, McGuire AD. Shrinking ponds in subarctic Alaska based on 1950-2002 remotely sensed
images. Journal of Geophysical Research. 2006; 111. doi:10.1029/2005JG000150.
Rosenzweig C, Iglesius A, Yang XB, et al. 2001. Climate change and extreme weather events: Implications for food
production, plant diseases, and pests. NASA Publications. 24:90-104.
Schuur EAG, McGuire AD, Schadel C, et al. Climate change and the permafrost carbon feedback. Nature. 2015;
520:171-179, doi:10.1038/nature/14338.
Schwartz HG, Meyer M, Burbank CJ, et al A. 2014. Ch. 9: Human Health. Climate Change Impacts in the United
States: The Third National Climate Assessment, J. M. Melillo, Terese (T.C.) Richmond, and G. W. Yohe, Eds.,
U.S. Global Change Research Program, 220-256. doi:10.7930/J0PN93H5.
Smith KR, Woodward A, Campbell-Lendrum D, et al. 2014: Human health: impacts, adaptation, and co-benefits. In:
Climate Change 2014: Impacts, Adaptation, and Vulnerability. Part A: Global and Sectoral Aspects.
Contribution of Working Group II to the Fifth Assessment Report of the Intergovernmental Panel on Climate
Change [Field CB, Barros VR, Dokken DJ, et al (eds.)]. Cambridge University Press, Cambridge, United
Kingdom and New York, NY, USA, pp. 709-754.
Stewart BC, Kunkel KE, Stevens LE, et al. 2013. Regional climate trends and scenarios for the U.S. National
Climate Assessment. Part 7. Climate of Alaska, NOAA technical Report NESDIS 142-147, 60 pp.
Struzik E. A troubling decline in the caribou herds of the Arctic. 2010. Available at: http://e360.yale.edu/features/
a_troubling_decline_in_the_caribou_herds_of_the_arctic
Sullivan G, Vasterling JJ, Han X, et al. Preexisitng mental illness and risk for developing a new disorder after
hurricane Katrina. J Nerv Ment Dis. 2013; 201:161-166. doi:10.1097/NMD.0b013e31827f636d.
Sweet WV, Kopp RE, Weaver CP, et al. 2017. Global and Regional Sea Level Rise Scenarios for the United States.
National Oceanic and Atmospheric Administration, National Ocean Service, Silver Spring, MD. 75 pp.
Accessed online at https://tidesandcurrents.noaa.gov/publications/techrpt83_Global_and_Regional_SLR_
Scenarios_for_the_US_final.pdf
Thelen B, French NHF, Koziol BW, et al. Modelling acute respiratory illness during the 2007 San Diego wildland
fires using a coupled emissions-transport system and generalized additive modeling. Environmental Health;
2013; 12(94), doi:10.1186/1476-069x-12-94.
Thomas TK, Bell J, Bruden D, et al. Washeteria closures, infectious disease and community health in rural Alaska: a
review of clinical data in Kivalina, Alaska. Int J Circumpolar Health. 2013; 72. doi: 10.3402/ijch.v72i0.21233.
Thomas TK, Ritter T, Bruden D, et al. Impact of providing in-home water service on the rates of infectious diseases:
results from four communities in Western Alaska. Journal of Water and Health. 2015. Available at:
doi:10.2166/wh.2015.110.
53
UAF, 2013. University of Alaska Fairbanks. Wildfires. Available online at: https://www.uaf.edu/files/ces/
publications-db/catalog/cred/ACC-00100.pdf
UAF Sea Grant. 2014. Storm surges. Available at: https://seagrant.uaf.edu/map/climate/docs/sea-level.php
UNEP 2008. Available at: http://www.grid.unep.ch/glaciers/
UNEP, 2011: Integrated Assessment of Black Carbon and Tropospheric Ozone. United Nations Environment
Programme (UNEP) andWorld Meteorological Organization (WMO), UNEP, Nairobi, Kenya and WMO,
Geneva, Switzerland, 249 pp.
USDHHS, 2017. Healthy People 2020: Social Determinants of Health. Washington, DC: U.S. Department of Health
and Human Services, Office of Disease Prevention and Health Promotion. Available at: https://www.healthy
people.gov/2020/topics-objectives/topic/social-determinants-of-health
USARC 2013. U.S. Arctic Research Commission Permafrost Task Force (2003) Climate Change, Permafrost, and
Impacts on Civil Infrastructure. Special Report 01-03, U.S. Arctic Research Commission, Arlington, Virginia.
USFWS 2017. United States Fish and Wildlife Service. 2017. Kenai National Wildlife Refuge: Climate Adaptation.
Available at: https://www.fws.gov/refuge/Kenai/what_we_do/resource_management/climate_adaptation .html
USGCRP, 2016: The Impacts of Climate Change on Human Health in the United States: A Scientific Assessment
[Crimmins A, Balbus J, Gamble JL, et al (eds)]. U.S. Global Change Research Program, Washington, DC, 312
pp. Available at: http://dx.doi.org/10.7930/J0R49NQX
USGCRP, 2017: Climate Science Special Report: Fourth National Climate Assessment, Volume I [Wuebbles DJ,
Fahey DW, Hibbard KA, et al (eds)]. U.S. Global Change Research Program, Washington, DC, 470 pp. doi:
10/7930/J0J964J6.
Vaughan DG, Comiso JC, Carrasco J, et al. 2013; Observations: Cryosphere. In: Climate Change 2013: The
Physical Science Basis. Contribution of Working Group I to the Fifth Assessment Report of the
Intergovernmental Panel on Climate Change [Stocker TF, Qin D, Plattner GK, et al (eds.)]. Cambridge
University Press, Cambridge, United Kingdom and New York, NY, USA.
Walsh JE, Bieniek PA, Brettschneider B, et al. The exceptionally warm winter of 2015/16 in Alaska. J. Climate.
2017; 30:2069-2088. Available online at doi: 10.1175/JCLI-D-16-0473.1.
Walsh J, Wuebbles D, Hayhoe K, et al. 2014a. Ch. 2: Our Changing Climate. Climate Change Impacts in the United
States: The Third National Climate Assessment [Melillo JM, Richmond TC, Yohe GW (eds.)], U.S. Global
Change Research Program, 19-67. doi:10.7930/J0KW5CXT.
Walsh J, Wuebbles D, Hayhoe K, et al. 2014b. Appendix 3: Climate science supplement. Climate Change Impacts in
the United States: The Third National Climate Assessment [Melillo JM, Richmond TC, Yohe GW (eds.)], U.S.
Global Change Research Program, 735-789. doi:10.7930/J0KS6PHH.
Warren JA, Berner JE, Curtis T. Climate change and human health: infrastructure impacts to small remote
communities in the north. International Journal of Circumpolar Health. 2005; 64(5):487-497.
Watts N, Adger WN, Agnolucci P, et al. Health and climate change: policy responses to protect public health.
Lancet. 2015; 386:1861-1914. http://dx.doi.org/10.1016/S0140-6736(15)60854-6
Wenger JD, Zulz T, Bruden D, et al. Invasive pneumococcal disease in Alaskan children: Impact of the seven-valent
pneumococcal conjugate vaccine and the role of water supply. PIDJ. 2010; 29(3):251-256. doi:
10.1097/INF.0b013e3181bdbed5.
54
WHO, 2009. Global health risks: morbidity and burden of disease attributable to selected major risks. Available at:
http://www.who.int/healthinfo/global_burden_disease/GlobalHealthRisks_report_full.pdf
WHO, 2016. Vectorborne diseases. Available at: http://www.who.int/mediacentre/factsheets/fs387/en/
Wisner B & Adams J. Environmental health in emergencies and disasters: a practical guide. World Health
Organization. 2002. Available at: http://www.who.int/water_sanitation_health/hygiene/emergencies/em2002
intro.pdf
Wolfe R. & Walker R. Subsistence Economies in Alaska: Productivity, Geography, and Development Impacts.
Arctic Anthropology. 1987; 24(2):56-81.
Woodford R. Ticks in Alaska. Alaska Fish & Wildlife News. 2012, Available at:
http://www.adfg.alaska.gov/index.cfm?adfg=wildlifenews.view_article&articles_id=557
Yoder JS, Harral C, Beach MJ. Giardiasis Surveillance – United States, 2006-2008. MMWR Surveill Summ. 2010;
59(6):15-25. Available at: http://www.cdc.gov/mmwr/preview/mmwrhtml/ss5906a2.htm

55
5.0 APPENDIX 1: CLIMATE CHANGE INDICATORS
5.1.1 Temperature
This indicator focuses on air, surface, and ocean temperature patterns over time. Air temperature is
measured at fixed locations over land and a mixture of ship- and buoy-based systems over the water.
Thermometer and other instrument-based surface temperature records date back hundreds of years in
some locations (NCA, 2014).
This indicator also examines trends in unusual temperatures from (a) the changes in average annual
temperatures, (b) the size and frequency of prolonged heat waves, (c) unusually hot summer temperatures
and cold winter temperatures, and (d) the changes in record high and low temperatures. To determine
whether an observation is ‘unusual’ in terms of temperature, data are averaged over a particular month or
season of interest; the coldest 10% of years are considered ‘unusually cold’, and the warmest 10% are
considered ‘unusually hot’ (EPA Climate Change Indicators, 2016). Extremely hot and cold days are also
reviewed; extremely hot days are considered the warmest 1% of daily high temperatures and extremely
cold days are considered the coldest 1% of daily low temperatures (Stewart et al., 2013).
5.1.2 Precipitation
This indicator entails precipitation patterns, based on rainfall and snowfall measurements from land-based
weather stations worldwide. Reliable statewide records are available for Alaska from 1925 to present
(EPA Climate Change Indicators, 2016).
An extreme precipitation event is an episode of abnormally high rain or snow; the definition of ‘extreme’
varies based on location, season, and the length of the historical record.
5.1.3 Weather Patterns
This indicator includes climate features tied to weather patterns; season lengths, frequency/intensity of
storms, and timing/amount of storm events are all considered. Roughly defined, weather is “the
conditions of the atmosphere over a short period of time” (NASA, 2005). Climate, in comparison, is the
behavior of the atmosphere over longer periods of time.
5.1.4 Sea Ice
This indicator describes the extent and age of Arctic sea ice. Data for this indicator are typically gathered
by the National Snow and Ice Center using satellite imaging technology (EPA Climate Change Indicators,
2016). Extensive measurements of Arctic sea ice through satellite imaging began in 1979.
Sea ice extent is defined as the area of ocean where at least 15% of the surface is frozen. This indicator
focuses on the average sea ice extent during peak freezing and peak melting months. Sea ice extent
typically reaches its annual minimum in September and its maximum in March (EPA Climate Change
Indicators, 2016).
The age of sea ice is determined by tracking ice as it moves over time through a combination of daily
satellite images, wind measurements, and data from surface buoys (EPA Climate Change Indicators,
2016).

56
5.1.5 Glaciers
A glacier is a large mass of snow and ice, present year-round, which has accumulated over many years.
Glaciers accumulate snow, which eventually becomes compressed into ice, and at lower elevations, the
ice naturally loses mass because of melting and calving (ice breaking off and floating away). A glacier
that does not increase or decrease in size when melting/calving is balanced by new snow accumulation
(EPA Climate Change Indicators, 2016).
A world glacier inventory was created in the 1970s, based primarily on aerial photographs and maps. This
inventory contains more than 100,000 glaciers, which cover an approximate area of 240,000 km2 (UNEP,
2008).
This indicator describes the change in glacier mass balance, which is measured as the average change in
thickness across the surface of a glacier. Glaciers provide visible evidence of changes in temperature and
precipitation and can contribute to sea level rise if they lose more ice than they can accumulate through
new snowfall (EPA Climate Change Indicators, 2016).
5.1.6 Permafrost
Permafrost is a layer of soil below the surface in which the temperature continuously remains below
freezing (NWS, 2009). The upper layer of permafrost, the active layer, may thaw and refreeze seasonally.
The active layer lies above the continually frozen permafrost layer. Permafrost consists of soil, rocks, and
frozen water. Large quantities of carbon dioxide and methane are stored in permafrost (Chapin et al,
2014).
This indicator describes the extent of permafrost in Alaska. Permafrost extent is measured by soil
temperature. The University of Alaska Fairbanks Geophysical Institute has been monitoring temperatures
and depth of permafrost since 1976 (Stewart et al., 2013).
5.1.7 Sea Levels
This indicator encompasses trends in sea level based on measurements from tide gauges and from satellite
imagery. Tide gauges measure relative sea level change along the coast and satellites measure absolute
sea level change over the ocean surface. Many tide gauges have collected data for more than 100 years.
Satellites have collected data since the early 1990s (EPA Climate Change Indicators, 2016). Sea level
data for much of Alaska are available from 1975 to present (NOAA Tides and Currents).
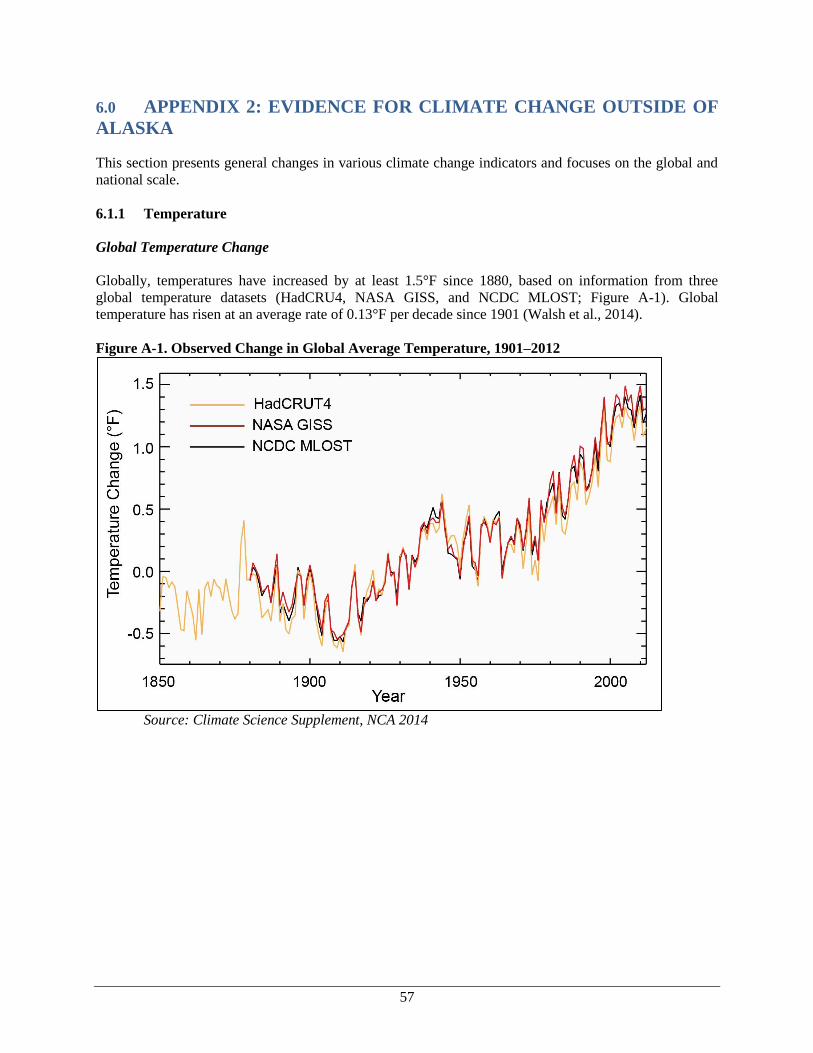
57
6.0 APPENDIX 2: EVIDENCE FOR CLIMATE CHANGE OUTSIDE OF
ALASKA
This section presents general changes in various climate change indicators and focuses on the global and
national scale.
6.1.1 Temperature
Global Temperature Change
Globally, temperatures have increased by at least 1.5°F since 1880, based on information from three
global temperature datasets (HadCRU4, NASA GISS, and NCDC MLOST; Figure A-1). Global
temperature has risen at an average rate of 0.13°F per decade since 1901 (Walsh et al., 2014).
Figure A-1. Observed Change in Global Average Temperature, 1901–2012
Source: Climate Science Supplement, NCA 2014

58
Average temperatures have risen more rapidly since the 1970s (range: +0.26–0.43°F per decade; Figure
A-2). The time period of 2005–2014 was the warmest decade since thermometer-based records began in
the 1900s, and 2016 was the warmest year on record worldwide (EPA Climate Change Indicators, 2016;
Blunden et al., 2017). Arctic regions have seen temperatures increase at twice the rate of temperatures
elsewhere in the world (NCA, 2014).
Figure A-2. Average Change in Annual Temperatures Worldwide, 1901–2015
Source: EPA Climate Change Indicators, 2016

59
United States Temperature Change
In the United States, temperatures have risen more quickly in the North, the West, and in Alaska than in
the rest of the country (EPA Climate Change Indicators, 2016). The average temperature in the United
States has increased by 1.2–1.8°F for the period 1986–2016 relative to 1901–1960, at an average rate of
0.14°F per decade, though most of this change has occurred since 1970 (USGCRP, 2017; Walsh et al.,
2014; EPA Climate Change Indicators, 2016; Figure A-3).
Figure A-3. Rate of Temperature Change in the United States, 1901–2015
Source: EPA Climate Change Indicators, 2016

60
Ocean Temperature Change
The average sea surface temperature has increased globally. Temperatures rose at an average rate of
0.13°F per decade, from 1901–2014 (EPA Climate Change Indicators, 2016; Figure A-4).
Figure A-4. Change in Sea Surface Temperature, 1901–2015
Source: EPA Climate Change Indicators, 2016

61
6.1.2 Precipitation
Global Precipitation Change
Overall, precipitation has increased worldwide (Figure A-5). While there are regions experiencing
drought, the average global precipitation has increased at a rate of 0.08 inches per decade (EPA Climate
Change Indicators, 2016).
Figure A-5. Precipitation Worldwide, 1901–2015
Source: EPA Climate Change Indicators, 2016
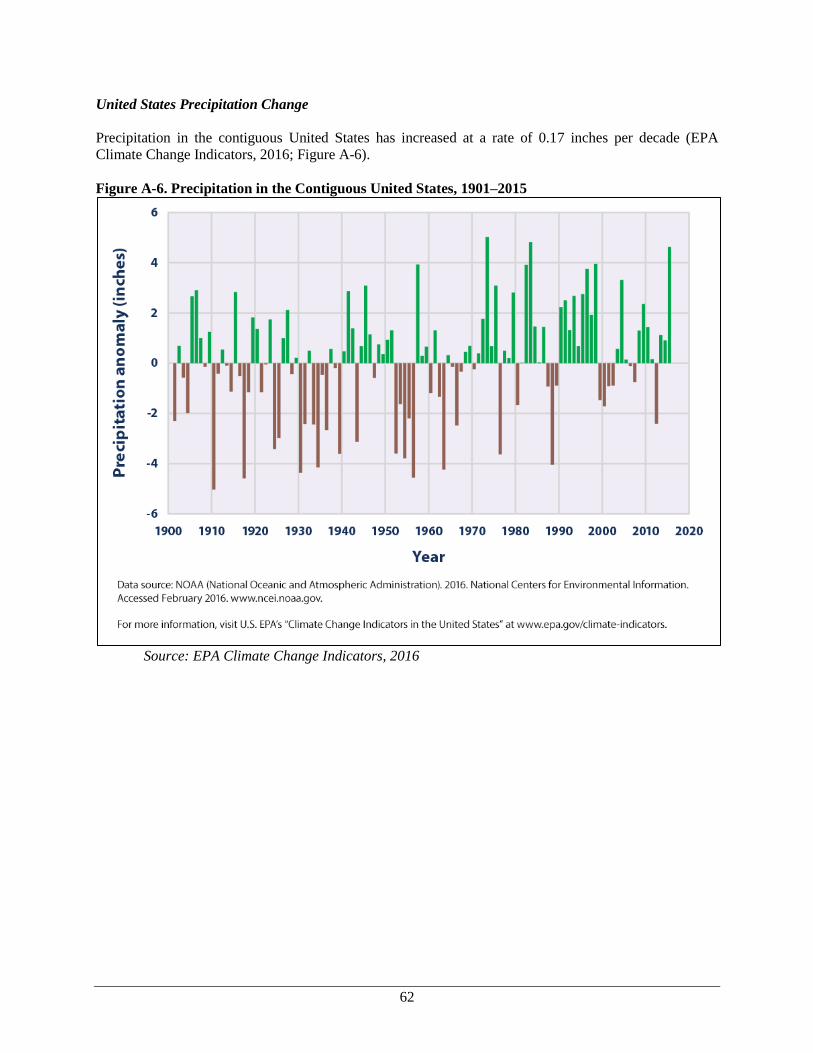
62
United States Precipitation Change
Precipitation in the contiguous United States has increased at a rate of 0.17 inches per decade (EPA
Climate Change Indicators, 2016; Figure A-6).
Figure A-6. Precipitation in the Contiguous United States, 1901–2015
Source: EPA Climate Change Indicators, 2016

63
While the United States has seen a general increase in precipitation, particularly in the Midwest and
Northeast, areas such as the Southwest have experienced a decrease in precipitation (EPA Climate
Change Indicators, 2016; Figure A-7).
Figure A-7. Change in Precipitation in the United States, 1901–2015
Source: EPA Climate Change Indicators, 2016

64
Heavy Precipitation
Recently in the United States, a larger percentage of precipitation has come from intense single-day
events (EPA Climate Change Indicators, 2016; Figure A-8).
Figure A-8. Extreme One-day Precipitation Events in the Contiguous 48 States, 1910–2015
Source: EPA Climate Change Indicators, 2016
6.1.3 Sea Ice
Sea ice forms at approximately 28.8°F and melts from exposure to sunlight, warm air, and ocean currents.
Arctic sea ice has been declining since satellite measurements began in 1979. Typically, sea ice reaches
its minimum in September in the Arctic (Stewart et al., 2013). Sea ice extent in the Arctic has decreased
at an average rate of 3% per decade. Models predict seasonally nearly ice-free northern waters by the
2030s or 2040s (Doney et al., 2014; USGCRP, 2017).
6.1.4 Glaciers
Globally, the amount of ice contained in glaciers has been declining every year for more than 20 years.
This lost mass partially contributes to the observed rise in sea level (Hartmann et al., 2013). Current
climate change scenarios predict continued rapid glacier retreat and may possibly lead to deglaciation of
many areas in the next several decades (UNEP, 2008).

65
6.1.5 Sea Levels
The Global Mean Sea Level (GSML) has risen by about 7–8 inches since the late 1800s (Walsh et al.,
2014; USGCRP, 2017) and has been rising at a rate of 0.14 inches per year since the early 1990s (Walsh
et al., 2014; Rhein et al., 2013). According to the Intergovernmental Panel on Climate Change (IPCC), the
rate of sea level rise from 1993–2003 was significantly higher than the average rate in the preceding 80
years (Rein et al., 2013). Models predict that if warming continues unabated, oceans could rise 0.3–0.6
feet by 2030, 0.5–1.2 feet by 2050, and 1.0–4.3 feet by 2100 (USGCRP, 2017).

66
7.0 APPENDIX 3: POTENTIAL HEALTH IMPACTS OF CLIMATE
CHANGE, BY CLIMATE CHANGE FACTOR
Climate Change
Factor
Health/Environmental
Determinant
Potential Health Impact
Mental Health and Wellbeing
Temperature/
Ecosystem changes Changes to subsistence
resources, transportation
infrastructure, etc.
Changing recreational
opportunities (positive and
negative)
Changes to economic
opportunities
Increased cases of stress disorders, anxiety,
depression
Increased rates of “maladaptive” coping,
e.g., increased substance/drug (including
alcohol) use
Increased economic indicators, such as
median household income
Weather pattern
changes Infrastructure damage due to
extreme weather events
Increased cases of stress disorders, anxiety,
depression
Increased rates of “maladaptive” coping,
e.g., increased substance/drug (including
alcohol) use
Permafrost changes
Infrastructure damage Increased cases of stress disorders, anxiety,
depression
Increased rates of “maladaptive” coping,
e.g., increased substance/drug (including
alcohol) use
Sea level changes
Erosion
Infrastructure damage
Increased cases of stress disorders, anxiety,
depression
Increased rates of “maladaptive” coping,
e.g., increased substance/drug (including
alcohol) use
Accidents and Injuries
Temperature/
Ecosystem changes Decreased exposure to cold
Increased high temperature
days
Increased wildfires (may
decrease in some locations)
Decrease in fatalities from cold-related
exposures
Increase in heat-related hospitalizations
Increased burn injuries or deaths
Weather pattern
changes Increase in flooding events
Potential increase in rock
slides and avalanches (due to
extreme weather events)
Increase in injuries or drownings
Increase in accidents/injuries from rock
slides, avalanches, etc.
Sea ice changes Increased “break-through” on
waterways
Decreased sea ice extent
Increase in fatalities due to drowning
Increased animal bite/exposures (with
changes to wild fox habitat range)
Permafrost changes
Increased damage to
transportation infrastructure
Increased accidents/injuries

67
Climate Change
Factor
Health/Environmental
Determinant
Potential Health Impact
Exposure to Potentially Hazardous Materials
Temperature/
Ecosystem changes Increased ozone
Increased rates, range and
season for allergens
Increased dust
Increase of PM10
Increase of PM2.5
Increase of CO2
Increased rates of respiratory disease
Increased rates of cardiovascular disease
Sea ice changes Increased exposure to spills
Increase of PM10
Increase of PM2.5
Increase of CO2
Increase of NOx
Increase of SOx
Increase of black carbon
Increased morbidity/mortality from
exposure to hazardous materials (air, water,
and soil hazards; natural and man-made)
Increased rates of respiratory disease
Increased rates of cardiovascular disease
Permafrost changes
Increased mobilization and
exposure to ground
contamination (e.g., legacy
wells, contaminated sites, salt
water intrusion)
Increased potential for
infrastructure damage (e.g.,
pipeline damage) and
exposure to related materials
(e.g., diesel)
Increased contamination
levels in subsistence resources
Decreased air quality
Decreased surface and ground
water
Increased morbidity/mortality from
exposure to hazardous materials (air, water,
and soil hazards; natural and man-made
Decreased consumption of local food
sources
Decreased access to health facilities (due to
damaged infrastructure
Decreased rates of adequate water and
sewer services (due to damaged
infrastructure)
Food, Nutrition, and Subsistence Activity
Temperature/
Ecosystem changes Changes to food security
(changes in availability of
local food sources)
o Crop yields
o Animal migration patterns
o Plant diseases
o Food costs
Decreased food quality
(increased presence of
contaminants
Decreased food quantity
(increased presence of
contaminants)
o Decreased food security
(increased presence of
contaminants)
Changes to consumption of local food
sources (could increase or decrease,
depending on resource)

68
Climate Change
Factor
Health/Environmental
Determinant
Potential Health Impact
Sea ice changes Changes to food security
(changes in availability of
local food sources)
Decrease in consumption of local food
sources
Decreased access to safe food resources
Permafrost changes Decreased food security
(decreased ability to store
food [ice cellars, drying fish,
etc.], decreased access to
resources)
Decrease in consumption of local food
sources
Decreased access to safe food resources
Infectious Diseases and Toxins from Microorganisms
Temperature/
Ecosystem changes
(esp. changes in
vector ecology);
weather pattern
changes
Increased zoonotic
diseases/vectors (e.g., bats)
Increased vectorborne
diseases/vectors (e.g.,
mosquitoes, ticks)
Increased foodborne diseases
Increased waterborne diseases
(flooding, etc.)
Introduction of new diseases
Increased rates of vectorborne diseases e.g.,
rabies, West Nile Virus, Lyme disease
Increased rates of foodborne diseases e.g.,
PSP, domoic acid, Vibrio parahaemolyticus,
botulism
Increased rates of waterborne diseases e.g.,
cryptosporidiosis, giardiasis
Permafrost changes Increased breeding ground for
mosquitoes
Decreased adequate water and
sewer services in households
(due to damaged
infrastructure)
Exposure to grave sites
Increased rates of vectorborne diseases, e.g.,
West Nile Virus
Increased rates of waterborne diseases, e.g.,
cryptosporidium, childhood gastrointestinal
illnesses
Non-communicable and Chronic Diseases
Temperature/
Ecosystem changes Changing access to and
availability of subsistence
resources (shift from
subsistence food
consumption)
Changing access to
recreational activities (could
increase or decrease,
depending on the activity
Insect bites/stings (e.g., wasp,
bee)
Increased fungi, molds, etc.
Increased production of pollen
and other allergens
Changes to abundance and
seasonality of allergens
Decrease in consumption of local food
sources
Increased rates of obesity
Increased rates of diabetes
Change in leisure time physical activity
(could increase or decrease)
Increased allergic sensitizations
Increased asthma episodes
Increased rates of respiratory disease
Permafrost changes
Decreased food security
(decreased ability to store
food [ice cellars, drying fish,
etc.], decreased access to
resources)
Change in consumption of local food
sources (could increase or decrease,
depending on resource)
Increased rates of obesity
Increased rates of diabetes
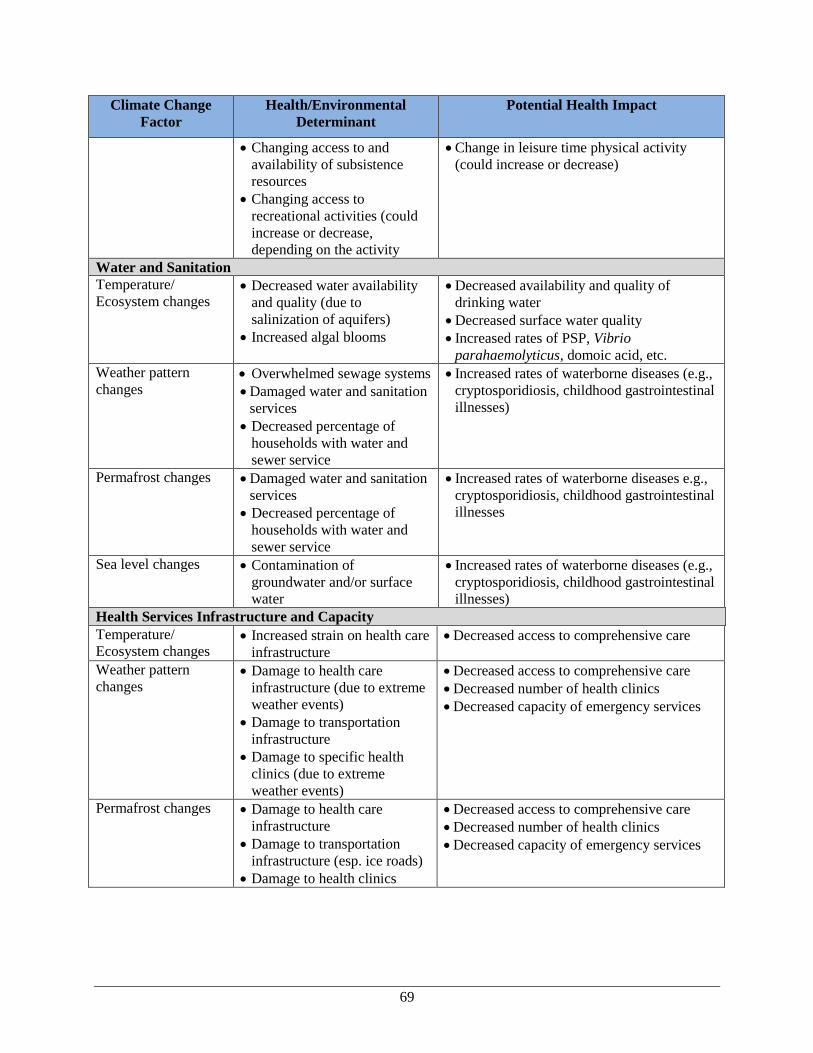
69
Climate Change
Factor
Health/Environmental
Determinant
Potential Health Impact
Changing access to and
availability of subsistence
resources
Changing access to
recreational activities (could
increase or decrease,
depending on the activity
Change in leisure time physical activity
(could increase or decrease)
Water and Sanitation
Temperature/
Ecosystem changes Decreased water availability
and quality (due to
salinization of aquifers)
Increased algal blooms
Decreased availability and quality of
drinking water
Decreased surface water quality
Increased rates of PSP, Vibrio
parahaemolyticus, domoic acid, etc.
Weather pattern
changes Overwhelmed sewage systems
Damaged water and sanitation
services
Decreased percentage of
households with water and
sewer service
Increased rates of waterborne diseases (e.g.,
cryptosporidiosis, childhood gastrointestinal
illnesses)
Permafrost changes
Damaged water and sanitation
services
Decreased percentage of
households with water and
sewer service
Increased rates of waterborne diseases e.g.,
cryptosporidiosis, childhood gastrointestinal
illnesses
Sea level changes Contamination of
groundwater and/or surface
water
Increased rates of waterborne diseases (e.g.,
cryptosporidiosis, childhood gastrointestinal
illnesses)
Health Services Infrastructure and Capacity
Temperature/
Ecosystem changes Increased strain on health care
infrastructure
Decreased access to comprehensive care
Weather pattern
changes Damage to health care
infrastructure (due to extreme
weather events)
Damage to transportation
infrastructure
Damage to specific health
clinics (due to extreme
weather events)
Decreased access to comprehensive care
Decreased number of health clinics
Decreased capacity of emergency services
Permafrost changes
Damage to health care
infrastructure
Damage to transportation
infrastructure (esp. ice roads)
Damage to health clinics
Decreased access to comprehensive care
Decreased number of health clinics
Decreased capacity of emergency services