assessment of the socio-economic and agricultural aspects...
TRANSCRIPT

Assessment of the socio-economic and agricultural aspects in waterresources using GIS: a case study from Egypt
Maherzi K., Afify A., Motaleb M.A., Hamdy A.
in
Lamaddalena N. (ed.), Bogliotti C. (ed.), Todorovic M. (ed.), Scardigno A. (ed.). Water saving in Mediterranean agriculture and future research needs [Vol. 3]
Bari : CIHEAMOptions Méditerranéennes : Série B. Etudes et Recherches; n. 56 Vol.III
2007pages 99-111
Article available on line / Article disponible en ligne à l’adresse :
--------------------------------------------------------------------------------------------------------------------------------------------------------------------------
http://om.ciheam.org/article.php?IDPDF=800207
--------------------------------------------------------------------------------------------------------------------------------------------------------------------------
To cite th is article / Pour citer cet article
--------------------------------------------------------------------------------------------------------------------------------------------------------------------------
Maherzi K., Afify A., Motaleb M.A., Hamdy A. Assessment of the socio-economic and agricultural
aspects in water resources using GIS: a case study from Egypt. In : Lamaddalena N. (ed.),
Bogliotti C. (ed.), Todorovic M. (ed.), Scardigno A. (ed.). Water saving in Mediterranean agriculture and
future research needs [Vol. 3]. Bari : CIHEAM, 2007. p. 99-111 (Options Méditerranéennes : Série B.
Etudes et Recherches; n. 56 Vol.III)
--------------------------------------------------------------------------------------------------------------------------------------------------------------------------
http://www.ciheam.org/http://om.ciheam.org/

99
ASSESSMENT OF THE SOCIO-ECONOMIC AND AGRICULTURAL ASPECTS IN WATER RESOURCES USING GIS, A CASE STUDY FROM EGYPT
K. Maherzi *, A. Afify **, M. A. Motaleb *** and A. Hamdy **** *M. Sc. Student, Mediterranean Agronomic Institute of Bari, Italy.
** Research Associate Professor, Strategic Research Unit, National Water Research Center, P.O. Box 6, 13621 Qalubia, Egypt.
*** Research Professor, Director, Water Resources Research Institute, National Water Research Center, Egypt.
****Professor Emeritus, Mediterranean Agronomic Institute of Bari, Italy.
SUMMARY - The evaluation of the socio-economic and agricultural aspects related to any water resources system requires a detailed and diverse data. In a previous study, socio-economic and agricultural indicators were developed aiming at the evaluation of water resources current status in Egypt. The objective of the current study is to assess the status quo of the Egypt water resources system through evaluation indices for the agricultural, socio-economic and water aspects under a GIS platform. In addition, a GIS software application tool is developed to visually present the indicators and indices in a user-friendly way. The user-friendly interface was designed and implemented under the Arc view environment using the Avenue programming language. A case study for Egypt is also demonstrated via the developed tool. The results from the study show powerful capabilities of the developed GIS software in presenting the indicators and indices for each category (agricultural, socio-economic, and water), using the user interface. Finally the developed GIS tool and indicators can give the decision maker a good idea about the current status of the water resources system for the whole country.
Kewords: Indicators, socio-economic, agriculture, water resources, GIS. INTRODUCTION
Recently, there has been a considerable effort devoted to utilizing GIS to enhance the
development of spatially distributed input data and to visualizing the results of simulation models (Srinivasan and Engel, 1991a). In particular, several studies have been carried out to demonstrate the integration of GIS with different models (Srinivasan and Engel, 1991b; Zhou and Fulcher, 1997) in watershed management. A graphical user interface was developed to incorporate the Soil and Water Assessment Tool, (SWAT), with ARC/INFO. The menu interface provided a tool to identify the relative contribution of sub-watershed areas to agricultural non-point source pollution and evaluate the effects of alternative land use management practices on surface and ground water quality at the watershed scale (Zhou and Fulcher, 1997).
Another study by Afify et al. (2003) for the assessment of the Nile river water quality aimed to develop a GIS based decision support tool capable of water quality data management, where a customized User Interface application was fully designed and implemented as a part of the GIS tool to facilitate accessibility and management of the Nile river water quality data for both technical and non-technical users. Spatial analysis and visualization of water quality data was presented and demonstrated through the developed interface (Afify et al., 2003).
A beta version of a Decision Support System (DSS) for water resources planning was implemented to assist water policy makers in evaluating impacts of proposed development measures. The DSS described by Tawfik et al. (2002) considers the integration of environmental and socio-economic aspects through the analysis of water resources development measures and scenarios. The DSS is composed of three main components; a database component linked to a Geographic Information System (GIS) component to provide all required data and information to the modeling component. Besides, there is a Graphical User Interface (GUI) developed under AVS/Express (1998) environment to allow the integration between the three components of the DSS as mentioned by Tawfik et al. (2002). The link between the database and GIS components of the DSS was
100
demonstrated under the GUI using AVS/Express environment software, where the link proved to be capable of analyzing different queries and displaying the results (Afify and Abdel-Motaleb, 2002).
A study by Afify et al. (2005) aimed at developing applied indicators for the evaluation of socio-
economic and agricultural aspects as related to water resources in Egypt. The results of the socio-economic and agricultural indicators were presented for selected governorates of Egypt, while water indicators were presented on a regional scale. The aggregation of such a huge amount of information on different spatial scales requires building a Geographic Information System (GIS) to be able to present the indicators' results on a user friendly interface. Therefore the current study aimed to the assessment of the status quo of the Egypt's water resources system through indices for the agricultural, socio-economic and water aspects, and building a GIS application tool along with a user interface to demonstrate the results. The developed application was used to illustrate the difference in the results under two cases considering agricultural water as an influencing factor in one case.
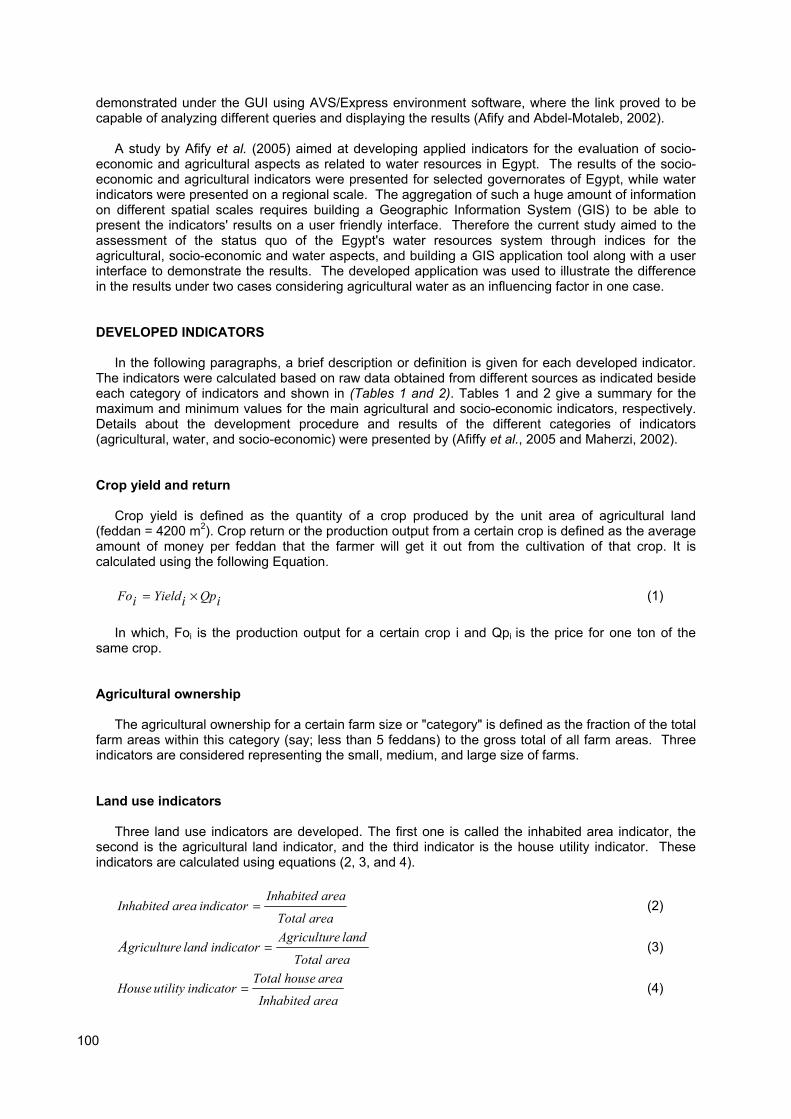
DEVELOPED INDICATORS In the following paragraphs, a brief description or definition is given for each developed indicator.
The indicators were calculated based on raw data obtained from different sources as indicated beside each category of indicators and shown in (Tables 1 and 2). Tables 1 and 2 give a summary for the maximum and minimum values for the main agricultural and socio-economic indicators, respectively. Details about the development procedure and results of the different categories of indicators (agricultural, water, and socio-economic) were presented by (Afiffy et al., 2005 and Maherzi, 2002).
Crop yield and return Crop yield is defined as the quantity of a crop produced by the unit area of agricultural land
(feddan = 4200 m2). Crop return or the production output from a certain crop is defined as the average
amount of money per feddan that the farmer will get it out from the cultivation of that crop. It is calculated using the following Equation.
iQpiYieldiFo ×= (1)
In which, Foi is the production output for a certain crop i and Qpi is the price for one ton of the
same crop.
Agricultural ownership
The agricultural ownership for a certain farm size or "category" is defined as the fraction of the total farm areas within this category (say; less than 5 feddans) to the gross total of all farm areas. Three indicators are considered representing the small, medium, and large size of farms.
Land use indicators Three land use indicators are developed. The first one is called the inhabited area indicator, the
second is the agricultural land indicator, and the third indicator is the house utility indicator. These indicators are calculated using equations (2, 3, and 4).
area Total
area Inhabitedindicator area Inhabited = (2)
area Total
land eAgriculturindicator land gricultureA = (3)
area nhabitedI
area house Totalindicatorutility House = (4)

101
Table 1. Summary for the maximum and minimum values of main agricultural indicators.
Category@
Indicator Units Min Value
Max.
Value
Small (0-5 fedans) % 28 74
Medium (5-50 fedans) % 15 49 Agricultural ownership
1
Large (More than 50) % 4 60
Inhabited area fraction 0 1
Agricultural land fraction 0 .86 Land use3
House utility fraction 0 .36
Wheat Ton/fed 0 3
Summer maize Ton/fed 0 3.6
Rice Ton/fed 0 3.75
Nile maize Ton/fed 0 3
Barley Ton/fed 0 2.1
Crop Yield4
Beans Ton/fed 0 1.5
@ As indicated, for each category of indicators, row data needed to calculate the indicators comes from different sources;
1 (CAPMAS, 1997),
3 (EDB, 1997),
4 (AEB, 1997).
Demography This category constitutes four different indicators: 1) population density, which is defined as the
number of inhabitants by square kilometer; 2) average household density, which is defined as the average number of households per each building; 3) agricultural power stock fraction, which is defined as the fraction of people ready to work in the agricultural field to the total labor force (power stock); and 4) employment fraction, which is defined as the number of the employees divided by the total labor force.
Agricultural owner size The agricultural owner size for a certain farm-size or category is defined as the fraction of the total
number of owners within this category to the total number of owners. Similarly, three indicators are considered within this group representing the small, medium, and large size of farms.
Drinking water services Drinking water service is a group of three indicators, which is defined as the percentage of
households belonging to a certain category of drinking water connection or service (say; tap inside the apartment, only inside the building, or public tap outside the building) to the total number of households. This group of indicators is evaluated for both urban and rural areas.
Sewerage services Sewerage service is a group of three indicators, which is defined as the percentage of buildings
having a certain type of sewerage connection (public sewerage, other, and no sewer) to the total number of buildings. These indicators are also evaluated for both urban and rural areas.

102
Table 2. Summary for the maximum and minimum values of main socio-economic indicators.
Category@
Indicator Units Min Value
Max.
Value
Population density Inhab/Km2 0 1200
Average household density Households/Building
0.75 3.6
Fraction of the Agricultural power stock fraction 0.24 0.28
Demography1
Employment fraction fraction 0.79 .98
Small (0-5 fedans) % 89 98
Medium (5-50 fedans) % 1.4 10 Agricultural owner size
1
Large (More than 50) % 0 0.8
Urban buildings with public sewerage % 1 74
Urban buildings with other sewerage connection
% 0. 4 87
Urban buildings without sewerage % 6 49
Rural buildings with public sewerage % 0 34
Rural buildings with other sewerage connection
% 37 92.5
Sewerage services
1
Rural buildings without sewerage % 2 60
Urban households with tap water inside their apartments
Households % 56 98
Urban households with water inside their buildings
Households % 65 99
Rural households with tap water inside their apartments
Households % 9 92.6
Drinking water services
2
Rural households with water inside their buildings
Households % 15 95
@ As indicated, for each category of indicators, row data needed to calculate the indicators comes from different sources;
1 (CAPMAS, 1997),
2 (METAP, 1997).
DEVELOPMENT OF GIS APPLICATION
The developed GIS application consists of two different types of information; topographic
information and attributed database. The topographic information includes elements such as lakes, the Nile River, canals, country borders, governmental borders, and any other water bodies. In general, raw data requires an additional effort of data processing and coding by geographic location to build and attributed database, so that each item of information can be associated with specific geographic location on the map. Therefore the analyst can display an image that shows the pattern of variation of a certain raw data, calculated group of indicators, or an index for each topographical location. The procedure of developing GIS attributed database have passed through two main steps; first normalization for all the values of the indicators using equation 5, and second calculation of the index using equation 6. This procedure is discussed in the following section. Finally, GIS attributed database files (dbf) are basically constructed to include all raw data for each governorate, calculated indicators and the normalized indicators.
Index calculation In a previous study by Afify et al. (2005), applied indicators were developed for the evaluation of
the socio-economic and agricultural aspects related to water resources in Egypt. In what follows, a generalized index is estimated from the aggregation of the relevant indicators. Aggregation of the different indicators requires that all indicators are unit less. A normalization procedure for all indicators is required since they are not all in similar units, for example the population density and the consumed drinking water are of different units. The normalized indicators were estimated using equation 5. Equation 5 allowed to obtain all the different indicators on a fixed scale (0-100), where the zero is for

103
the least value of the indicator, and 100 is for the maximum score of the same indicator from all records.
minmax
100min)(
RR
RRaRn
−
×−
= (5)
In the above equation; Rn is the normalized indicator, Ra is the real value for the indicator, Rmax
and, Rmin are the maximum and minimum values for the same indicator for all the records, respectively. A generalized index is estimated from the aggregation of the normalized indicators. The generalized index is calculated by using a weighted average for all the normalized indicators as shown by Equation 6.
∑=
×=
m
iRniwiI
1 , and
11
=∑=
m
iwi (6)
In which, I is the generalized index, Rni is the normalized value for each indicator, wi is the weight
associated with the same indicator, and m is the number of relevant indicators. As indicated by Equation 6, the summation of all weights should be equal to one.
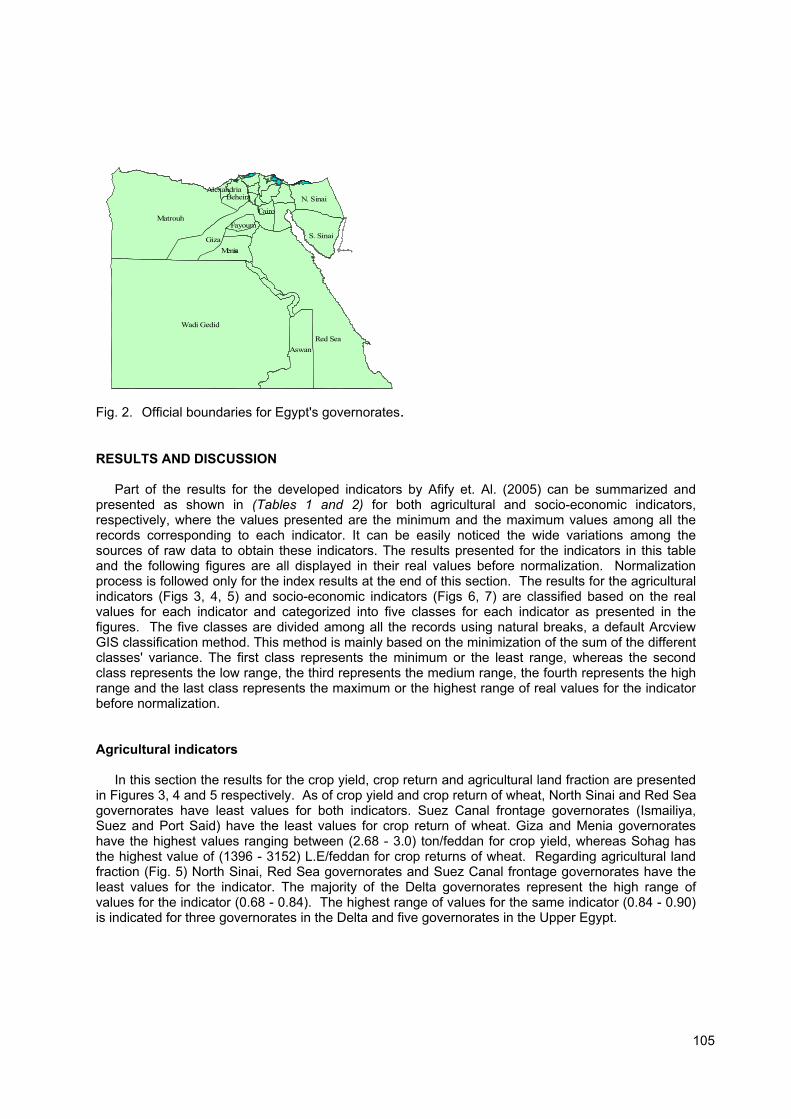
GIS interface design and implementation The main interface (Fig. 1) was designed and implemented under the Arc View 3.1 software to be
the default interface that the user will get when he opens the system. In the view area, an abstracted map of Egypt is displayed. Figure 2 demonstrates a map of Egypt with the official boundaries of the governorates. At the top menu, there are other elements added to suite the application developed by Maherzi (2002). The added elements (Fig. 1) are mainly: buttons of indicators' categories, menu bar, and index calculator tool. Each button of the indicators' categories displays only the related main menu for the selected category. The menu bar represents the different indicators; it shows all the different indicators under a specific category, where sub-menus are further created under each main menu. In what follows, a brief list of main menus developed by Maherzi (2002) for the different indicators within each specific category; agricultural, socio-economic, and water indicators' category.
Agricultural indicators main menu This category contains the following items: 1) cropping pattern for main crops; 2) agricultural
ownership for small, medium and large farm size; 3) land use indicators; 4) crop yield and farm output for main crops; 5) production costs for main crops; and 6) cropping pattern performance indicators.
Socio-economic indicators main menu This category contains the following items: 1) Demography, including the urban population fraction,
the rural population fraction, the population density, the average household density, the employment fraction, and the fraction of the agricultural power stock; 2) agricultural owner size for small, medium and large farm size; 3) sewerage services for both urban and rural areas, obtained as a percentage of buildings with either a public, other, or no sewerage connection; and 4) drinking water services provided to households for both urban and rural areas.
Water indicators main menu This category contains the following items: 1) drinking water, including consumed and produced
water, as well as network efficiency; 2) agricultural water needed during the year; 3) agricultural water available during the year; and fraction of agricultural water availability during the year.

104
Index calculator tool The index calculator is a powerful tool that helps the decision maker to first calculate the
generalized index as given by eqns. 5 and 6, and secondly visualize directly the results on the map. The index is calculated based on the aggregation of the selected indicators from the three main categories as displayed in the calculator tool menu (Fig. 1). The user has a complete freedom of choice between more than one category and indicator at a time. The decision maker should make only an enquiry to determine the different weights assigned for each indicator, which are entered to the program to calculate the generalized index.
The only constraint on the choice of the weights is that the total summation of them should be
equal to one hundred, other wise the program will recalculate new weights based on the percentage of weight given to each indicator compared to the total summation of all weights, (Maherzi, 2002).
The procedure is started by just a click on the index calculator icon on the tools' bar menu, where a new window will be displayed as shown at the lower right corner of Figure 1 to further choose one category, or all categories of indicators that the user wants to include in the calculation of the index.
Implementation of the GIS interface
The interface as described earlier is just a mask which will help the user at the end to perform certain tasks. However, this feature is not possible unless the interface is activated or implemented. For this purpose, a series of scripts was written by Maherzi (2002) to perform a list of actions that the compiler should execute when a button or a menu is selected. These scripts were written in the avenue programming language, which is compatible with ArcView 3.1. The scripts are in three categories, the first category of scripts is related to the buttons that display the menus, the second category is related to the menus which display the indicators, and the last category contains only one script that calculates the index. This script is linked to the index calculator button.
Fig. 1. Main interface with indicators categories and index calculator.
105
Wadi Gedid
Red Sea
Matrouh
Giza
Asw an
S. Sinai
N. Sinai
Mensi a
Beheira
Fay oum
Cairo
Alexandria
Fig. 2. Official boundaries for Egypt's governorates. RESULTS AND DISCUSSION
Part of the results for the developed indicators by Afify et. Al. (2005) can be summarized and presented as shown in (Tables 1 and 2) for both agricultural and socio-economic indicators, respectively, where the values presented are the minimum and the maximum values among all the records corresponding to each indicator. It can be easily noticed the wide variations among the sources of raw data to obtain these indicators. The results presented for the indicators in this table and the following figures are all displayed in their real values before normalization. Normalization process is followed only for the index results at the end of this section. The results for the agricultural indicators (Figs 3, 4, 5) and socio-economic indicators (Figs 6, 7) are classified based on the real values for each indicator and categorized into five classes for each indicator as presented in the figures. The five classes are divided among all the records using natural breaks, a default Arcview GIS classification method. This method is mainly based on the minimization of the sum of the different classes' variance. The first class represents the minimum or the least range, whereas the second class represents the low range, the third represents the medium range, the fourth represents the high range and the last class represents the maximum or the highest range of real values for the indicator before normalization.
Agricultural indicators In this section the results for the crop yield, crop return and agricultural land fraction are presented
in Figures 3, 4 and 5 respectively. As of crop yield and crop return of wheat, North Sinai and Red Sea governorates have least values for both indicators. Suez Canal frontage governorates (Ismailiya, Suez and Port Said) have the least values for crop return of wheat. Giza and Menia governorates have the highest values ranging between (2.68 - 3.0) ton/feddan for crop yield, whereas Sohag has the highest value of (1396 - 3152) L.E/feddan for crop returns of wheat. Regarding agricultural land fraction (Fig. 5) North Sinai, Red Sea governorates and Suez Canal frontage governorates have the least values for the indicator. The majority of the Delta governorates represent the high range of values for the indicator (0.68 - 0.84). The highest range of values for the same indicator (0.84 - 0.90) is indicated for three governorates in the Delta and five governorates in the Upper Egypt.

106
Fig. 3. Spatial distribution for the Wheat's crop yield.
Fig. 4. Spatial distribution for the Wheat's crop return.

107
Fig. 5. Spatial distribution for the agricultural land fraction.
Fig. 6. Spatial distribution for the employment fraction.

108
Fig. 7. Distribution for the agricultural owner size fraction for low class (0-5 feddan). Socio-economic indicators
In this section the results for the employment fraction and agricultural owner size are presented in
Figures 6 and 7. As of employment fraction (Fig. 6), South Sinai governorate has the highest value of (0.93 � 0.98) and Aswan has the least value of 0.79. Regarding the owner size fraction for low class (0-5 feddans), the highest range of values (0.97 � 0.99) is indicated for Giza and Cairo governorates. The least values for the same indicator (0.89 - 0.93) are indicated for Suez Canal frontage governorates besides three others in the Delta.
Water indicators Sample of the results for the agricultural water availability during the month of September is
presented in (Fig. 8). The results show that Middle Delta has the least availability of water; East Delta has average availability of water, while West Delta has highest availability of water for that month. This result may seem to be not realistic; however this may be due to the assumptions followed in earlier study by Maherzi (2002) for estimating water requirements.
Index results
In this section index results using the developed index calculator tool for two cases are presented, where the normalized indicators for each record are calculated using equation 1 and the index is obtained from equation 2. The presented indicators in the previous sections are selected for aggregation to obtain the index for the first case. For the second case, same indicators are selected together with the agricultural water availability indicator during the month of September to see the effect of this indicator on the index results.
The first case (Fig. 9) considers the aggregation of the previous indicators (crop yield and crop
return for Wheat, agricultural land fraction, employment fraction, and agricultural owner size) with equal weights for each indicator. The results of the investigated case as shown in Fig. 9 show that both Red Sea and Matrouh governorates have the least value for the index, others such as Aswan and Suez have a low range of value for the index. Both Giza and Menia governorates have the highest range of value for the index. Almost all other governorates in the Delta have the medium range of value for the index.

109
The second case considers the aggregation of all the indicators mentioned for the first case, including the agricultural water availability indicator. Weights are assigned to be 50% for the water availability indicator and equal weights for the rest of the indicators. The results of the investigated case as shown in Figure 10 are almost as close as the results of the first case for the whole country. Middle Delta remained in the medium range of value for the index, whereas in the West Delta, Beheira Governorate has the highest range of value for the index. Little change is also observed in the East Delta from the first case. The changes in this case from the first one are mainly due to the magnification of the role of water availability indicator as compared to other indicators.
CONCLUSIONS AND RECOMMENDATIONS
GIS plays a key role in the developed application, where all raw data after processing are stored within the GIS application to display the results for the different indicators. Since the values of these indicators are wide spread and are obtained in different units, normalization for their values is adopted before aggregation under GIS platform. It can be concluded from the study that a combination of GIS and indicators can be very helpful in the evaluation of the agricultural aspects of water resources system in Egypt. The developed application is also very useful, where a user friendly interface facilitate the application for non-technical users. Finally the developed GIS tool and indicators can give the decision maker a good idea about the current status of the water resources system for the whole country and a powerful tool to compare among possible alternatives.
Fig. 8. Distribution for the fraction of agricultural water availability for the month of September.

110
Fig. 9. Distribution of the calculated index for case 1 with equal weights.
Fig. 10. Distribution of the calculated index for case 2 with non-equal weights.
REFERENCES
AEB, (1997). Agro economic Bulletin "in Arabic". Ministry of Agriculture and Land Reclamation, Year Book, 1997.
Assem Afify and Mohammed Abdel-Motaleb, (2002). Enhancing Information Systems, A Geo-Relational Database Application Using Advanced Visual Systems. In: Cluckie, I.D., Han, D., Davis J.P., and Heslop, S. (Eds.), Software Tools and Management Systems, Volume 2. Proceedings of the 5
th International Conference on Hydro Informatics, 1
st -5
th July, 2002, Cardiff, UK. Decision
Support and Management, 929-938.
111
Assem Afify, Alaa E. Abdin and Amgad Elmahdy, (2003). Development of a GIS-Based Decision Support Tool for Data Management and Assessment of the Nile River Water Quality. Ain Shams University, Faculty of Engineering Scientific Bulletin, Vol. 38, No.4 December 2003.
Assem Afify, Khalef Maherzi, Mohammed Abdel-Motaleb, and Atef Hamdy, (2005). Applied indicators for evaluation the socio-economic and agricultural aspects related to water resources in Egypt. In: Badr, M.A., Abd El Halim, M.S., El-Azizy, I.M., and Abbas, A. (Eds.), Volume I. Proceedings of the First Ain-Shams International Conference on Environmental Engineering (ASCEE-1), 9-11 April 2005, Cairo, Egypt. Section WA-I: Water Resources Management, 523-535.
AVS/Express, 1998. Visualization Techniques. Advanced Visual System Inc. Release 4.0, July, 1998. CAPMAS, (1992-1996) and (1996-1997). Statistical Yearly Books. Arab Republic of Egypt Central
Agency for Public Mobilization and Statistic. EDB, (1997). Egypt Description by Numbers "In Arabic". Information Center and Decision Support of
the Prime Minister Head Cabinet, Year Book in Arabic, 1997. Maha Tawfik, Alaa E. Abdin and Assem Afify, (2002). A Decision Support System for Water
Resources Planning in Egypt. In: Al-Rashed, M., Singh, V.P., and Sherif, M.M. (Eds.), Water Resources Development and Management, Volume 4. Proceeding of the International Conference on Water Resources Mangement in Arid Regions (WaRMAR), 23-27 March, 2002, Kuwait. Section 4: Decision support systems, 189-203.
Maherzi, Khalef, (2002). A GIS Platform for the Evaluation of a Water Resources System (Case Study from Egypt). M. Sc. Thesis, International Center for Advanced Mediterranean Agronomic Studies. CIHEAM, BARI, Italy.
METAP, (1997). Water supply and Sanitation in Rural Egypt. Mediterranean Environmental Technical Assistance Program (META/PPU). Final Report, Egypt Nov. 1997.
Srinivasan and Engel, (1991a). GIS: A Tool for Visualization and Analayzation. American Society of Agricultural Engineers. ASAE Paper No. 91-7574, St. Joseph, Michigan.
Srinivasan R. and B.A. Engel, (1991b). A Knowledge Based Approach to Extract Input Data form GIS. American Society of Agricultural Engineers, ASAE Paper No. 91-7045 St. Joseph, Michigan.
Yan Zhou and Chris Fulcher, (1997). A Watershed management Tool Using SWAT and ARC/INFO. Environmental Systems Research Institute (ESRI) User Conference, 1997.