assessment of the stage of change for …digital.library.okstate.edu/etd/umi-okstate-2354.pdf ·...
TRANSCRIPT

ASSESSMENT OF THE STAGE OF CHANGE FOR
INCREASING FRUIT AND VEGETABLE
AVAILABILITY AND ACCESSIBILITY
IN LOW-INCOME FAMILIES WITH
PRESCHOOL AGE CHILDREN
By
DEANA A. HILDEBRAND
Bachelor of Science in Vocational Consumer Home Economics Education
Central State University Edmond, Oklahoma
1978
Master of Science in Nutrition and Food Management
Central State University Edmond, Oklahoma
1988
Submitted to the Faculty of the Graduate College of
Oklahoma State University in partial fulfillment of
the requirements for the Degree of
DOCTOR OF PHILOSOPHY July, 2007

ii
ASSESSMENT OF THE STAGE OF CHANGE FOR
INCREASING FRUIT AND VEGETABLE
AVAILABILITY AND ACCESSIBILITY
IN LOW-INCOME FAMILIES WITH
PRESCHOOL AGE CHILDREN
Dissertation Approved:
Nancy M. Betts
Dissertation Adviser
Gail Gates
Tay S. Kennedy
Stephany P. Parker
William Warde
A. Gordon Emslie
Dean of the Graduate College

iii
ACKNOWLEDGMENTS
I wish to express sincere appreciation to my chair, Dr. Nancy M. Betts, for her
guidance and shared expertise. I would also like to thank my committee members, Dr.
Tay Kennedy, Dr. Gail Gates, Dr. Stephany Parker, and Dr. William Warde for their
tutorage and encouragement to ‘keep thinking’ throughout the process. In addition, the
dissertation research project would not have been possible without the collaboration of
colleagues at the Oklahoma State Department of Health WIC Service, Tulsa City County
Health Department, Variety Health Care Services, Chickasha WIC and the Oklahoma
Cooperative Extension Service. Special acknowledgment is extended to the Oklahoma
Dietetic Association for the award of scholarship monies to fund research related
expenses.
Secondly, I would like to express thanks to my family, Don, Seth and Rachel,
who are the wind beneath my wings. Without their steadfast support, unwavering
confidence and generous patience my academic journey could not have been achieved.
And lastly, I would like to acknowledge Bill and Charlsie Martin, my parents and first
teachers, who nurtured a value for learning and to whom I am forever grateful.

iv
TABLE OF CONTENTS
Chapter Page I. INTRODUCTION......................................................................................................1
Significance of the Study .........................................................................................4 Objectives and Hypotheses ......................................................................................5 Assumptions of the Study ........................................................................................7 Limitations of the Study...........................................................................................7 Definitions of Terms and Abbreviations..................................................................8 II. REVIEW OF LITERATURE.................................................................................. 13 Obesity Trends. ......................................................................................................14 Benefits of Fruit and Vegetable Consumption.......................................................15
Fruit and Vegetable Recommendation and Consumption Trends .........................17 Determinants of Fruit and Vegetable Consumption ..............................................19
Fruit and Vegetable Intervention Projects .............................................................23 Transtheoretical Model of Behavior Change.........................................................29 Summary ................................................................................................................37
III. METHODOLOGY ...............................................................................................40
Sampling Procedures .............................................................................................40 Data Collection and Instrumentation .....................................................................41 Statistical Analysis.................................................................................................46
IV. FINDINGS.............................................................................................................48 Demographics ........................................................................................................48 Staging of Subjects ................................................................................................50 Fruit and Vegetable Availability............................................................................51

v
Chapter Page Decisional Balance.................................................................................................58 Self-Efficacy ..........................................................................................................64 Processes of Change ..............................................................................................67 V. DISCUSSION, CONCLUSIONS AND IMPLICATIONS ....................................72 Fruit and Vegetable Availability............................................................................74 Theoretical Constructs ...........................................................................................76 Conclusions............................................................................................................84 Implications for Nutrition Education .....................................................................85 Implications for Research ......................................................................................86 REFERENCES ............................................................................................................89 APPENDICES .............................................................................................................98 Appendix A: Oklahoma State University Institutional Review Board..................99 Appendix B: Written Consent..............................................................................101 Appendix C: Script for Surveyor for Explaining Agreement to Participate........102 Appendix C: Fruit and Vegetable Survey............................................................105 VITA..........................................................................................................................114

vi
LIST OF TABLES
Table Page 4.1 Demographic characteristics of low-income parents/caregivers. .......................49 4.2 Results of staging algorithm ...............................................................................50 4.3 Total juice and fruit and total vegetables: mean servings served to children by PPC demographic characteristic ....................................................................52 4.4 Fruit and vegetable subgroups: mean servings by stage of change ...................55 4.5 Decisional balance scales: mean scores by stage of change ..............................59 4.6 Decisional balance items: mean scores by stage of change...............................61 4.7 Self-efficacy items: mean scores by stage of change.........................................65 4.8 Experiential processes of change: mean scores for frequency of use by stage of change....................................................................................................68 4.9 Behavioral processes of change: mean scores for frequency of use by stage of change....................................................................................................69
LIST OF FIGURES Figure Page 2.1 Five stages of change representative of the Transtheoretical Model ..................30 2.2 Theoretical progression of the processes of change across stages......................34 4.1 Fruit and vegetable servings: mean servings served to children by stage of change....................................................................................................56 4.2 Decisional balance: mean pro and con scale scores by stage of change.............60 4.3 Decisional balance: mean con item scores across by stage of change................62 4.4 Decisional balance: mean pro item scores by stage of change ...........................63 4.5 Self-efficacy: mean item scores by stage of change ..........................................66

1
CHAPTER I
INTRODUCTION
In 2005, a new set of Dietary Guidelines for Americans was released
recommending in part that Americans increase their fruit and vegetable consumption
(United States Department of Health and Human Services and United States Department
of Agriculture [USDHH & USDA], 2005). Recommendations increased from three to
five servings per day to four to ten servings per day depending on specified energy levels
designed to meet the nutrient needs of people aged two years and older according to their
sex, age, and level of activity. The increases were, in part, a result of the Institute of
Medicine establishing Adequate Intake (AI) levels for fiber and potassium (Institute of
Medicine [IOM], 2002, 2004a), both of which are prevalent in many fruits and
vegetables. Epidemiological data indicate that intake of these nutrients may be low
enough to be of concern for children and adolescents, as well as adults (USDHH &
USDA, 2005; Dwyer, Suitor & Hendricks, 2004; IOM, 2004b). While the newest
Dietary Guidelines are in keeping with the related research, they further broaden the gap
between fruit and vegetable consumption behaviors and recommendations (Guenther,
Dodd, Reedy & Krebs-Smith, 2006; Cook & Friday, 2004).

2
The health benefits of eating fruit and vegetable are well established (Hyson,
2002; Ness & Powles, 1997; Steinmetz & Potter, 1996; Van Duyn & Pivonka, 2000).
Diets rich in fruit and vegetable have been associated with decreased risk for chronic
diseases, including cardiovascular disease and hypertension, diabetes, obesity and certain
types of cancer. Joshipura and colleagues (2001) used data from the Nurses’ Health
Study and found that women who consumed diets rich in fruit and vegetable, especially
leafy greens and vitamin C-rich fruit and vegetable, had a twenty percent lower risk for
cardiovascular disease. Increased intake of vegetables by women was also found to be
associated with decreased prevalence of Type 2 diabetes (Williams et al., 1999; Colditz et
al., 1992). Multiple studies have found the high fiber and low-energy density of fruit and
vegetable to have benefits in weight management (Tohill, Seymour, Serdula, Kettel-Khan
& Rolls, 2004; Epstein et al., 2001; Bell & Rolls, 2001). Clearly, the evidence supports a
dietary pattern rich in fruit and vegetable can reduce risks for chronic disease and
contribute to overall health (USDHHS & USDA, 2005).
Despite the millions of dollars in public and private funds expended for
interventions to understand eating behaviors and increase fruit and vegetable intake,
nationally conducted food consumption surveys continue to indicate that Americans are
falling short of the national nutrition guidelines (Guenther et al., 2006; Cook & Friday,
2004; Serdula et al., 2004). Researchers who studied fruit and vegetable consumption in
children and adolescents found availability of and preferences for fruit and vegetable to
be consistent predictors of the behavior (Cullen et al., 2003). After studying the
development of eating behaviors in children, Birch and Fisher (1998) concluded “the
extent to which fruit and vegetable are made available and accessible to children shape

3
their liking for and consumption of those foods” (p. 542). A parent or primary
caregiver’s (PPC) role in purchasing, preparing and serving the household’s food supply
frequently serves as a major determinant to the availability of fruit and vegetable, and in
turn the child’s development of preferences for the taste of fruit and vegetable (Havas et
al., 1998; Parker, 2002; Reicks et al., 1994; Shankar & Klassen, 2001).
In an effort to maintain consistency between federal food assistance program
benefits, current nutrition research, and dietary recommendations, the United States
Department of Agriculture, Food and Nutrition Service recently charged the Institute of
Medicine (IOM) with assessing the supplemental nutrition needs of population subgroups
participating in the Special Supplemental Nutrition Program for Women, Infants, and
Children (WIC) and to evaluate the WIC food packages (Institute of Medicine [IOM],
2005). The IOM findings recommended, in part, including cash value vouchers for fresh
or processed fruit and vegetable in food packages issued to pregnant and post-partum
women and children aged one to five years of age. The move is not only in keeping with
current nutrition research but also further reduces economic barriers to fruit and vegetable
consumption for low-income children at a critical time when the development of taste
preferences and eating behaviors are being formed (Birch & Fisher, 1998). However, it
does not address psychosocial factors of the parent or primary caregiver (PPC) that
influence their decisions related to assuring that fruit and vegetable are in the home and
served to children. Previous research found these factors to include beliefs about the
benefits of fruit and vegetable consumption, a person’s level of self-efficacy in making
the change, and the development of skills needed to perform the behavior (Reicks et al.,
1994; Havas et al., 1998; Henry et al., 2003; Birmingham, Shultz & Edlefsen, 2004;

4
Henry et al., 2006). For the 2005 Dietary Guidelines for Americans and IOM
recommendations to be effective in increasing fruit and vegetable consumption it is
important for nutrition educators to understand the mediating factors influencing the
PPC’s role in actually making the fruit and vegetable available to their children, and in-
turn develop and deliver tailored nutrition education programs.
Significance of the Study
The aim of our research was to utilize the Transtheoretical Model of Behavior
Change to assess the psychosocial factors of decisional balance, self-efficacy and
processes of change (Prochaska, Norcross & DiClemente, 1994) used by low-income
parents and primary caregivers (PPC) related to increasing availability and accessibility
of fruit and vegetable to their preschool age children. The presence of fruit and vegetable
during this developmental time is important because it is when food preferences are being
formed; and these preferences have potential to impact life-long dietary quality and risk
for obesity and diet related chronic disease (Skinner, Ziegler, Pac & Devaney, 2004).
Questions addressed by our study included: Are low-income parents in different stages
of change for increasing availability and accessibility of fruit and vegetable to children?
Are there differences between households in the types and quantities of fruit and
vegetable available? Are there differences between households in the factors influencing
decisions to serve fruit and vegetable, and if so what are they? Are there differences
between households in their confidence for serving fruit and vegetable in different
situations, and if so what are the situations? Are there differences between households in
their use of processes to serve fruit and vegetable, and which are used most frequently?

5
The answers to these questions not only contribute to the existing literature, but
also provide nutrition educators with a better understanding of the factors influencing and
differences between low-income parents who serve adequate amounts of fruit and
vegetable and those that fall short. The information can be used to match interventions
aimed at increasing availability and accessibility of fruit and vegetable to preschool age
children to the stage of readiness of their PPC. The implications for nutrition education
are appropriate for use in WIC, EFNEP, Head Start and other nutrition education
programs serving low-income families with young children in Oklahoma.
Objectives and Hypotheses
The specific objectives of the study and corresponding hypotheses were:
1. Identify the proportion of the survey population that is in each of the five stages of change for increasing availability of fruit and vegetable to preschool age children.
2. Identify and compare between stages the availability of fruit and vegetable as
measured by the number of servings being served to preschool age children and as self-reported in a fruit and vegetable frequency questionnaire.
H0: µ1 = µ2 = µ3 = µ4 = µ5 There will be no differences between PPCs in the different stages of change in the number of servings of fruit and vegetable served to preschool age children. H1: µi ≠ µg for some i There will be differences between PPCs in the different stages of change in the number of servings of fruit and vegetable served to preschool age children.
3. Identify and compare between PPCs in the different stages the factors related to decisional balance for increasing availability of fruit and vegetable to preschool age children.
H0: µ1 = µ2 = µ3 = µ4 = µ5 There will be no differences between PPCs in the different stages of change in decisional balance for increasing fruit and vegetable availability to preschool age children.

6
H1: µi ≠ µg for some i There will be differences between PPCs in the different stages of change in decisional balance for increasing fruit and vegetable availability to preschool age children.
4. Identify and compare between PPCs in the different stages of change the factors affecting level of self-efficacy for increasing availability of fruit and vegetable to preschool age children. H0: µ1 = µ2 = µ3 = µ4 = µ5 There will be no differences between PPCs in the different stages of change in self-efficacy for increasing fruit and vegetable availability to preschool age children. H1: µi ≠ µg for some i There will be differences between PPCs in the different stages of change in self-efficacy for increasing fruit and vegetable availability to preschool age children.
5. Identify and compare between PPCs in the different stages of change the use
of processes utilized to serve fruit and vegetable to preschool age children.
H0: µ1 = µ2 = µ3 = µ4 = µ5 There will be no differences between PPCs in the different stages of change in the use of processes for increasing fruit and vegetable availability to preschool age children. H1: µi ≠ µg for some i There will be differences between PPCs in the different stages of change in the use of processes for increasing fruit and vegetable availability to preschool age children.

7
Assumptions of the Study
Parents and primary caregivers accurately reported their intention to increase
availability of fruit and vegetable to their preschool age children.
Parents and primary caregivers accurately scored their beliefs and practices
concerning factors related the TTM constructs.
Parents and primary caregivers accurately reported the frequency and serving
sizes of fruit and vegetable normally served to preschool age children.
Limitations of the Study
The data collected through the fruit and vegetable frequency questionnaire
(FVFQ) and used to measure availability of fruit and vegetable was self-reported. It is
commonly accepted that parents will frequently over-report amounts of food served to
children (Johnson & Hankin, 2003).
The data was collected during April 2006. As such, respondents may have been in
greater anticipation of increased availability of seasonal fruit and vegetable as well as
harvests from home gardens. For this reason intention to increase fruit and vegetable
consumption may have been biased upward.
The study respondents were all participating in federal nutrition education
programs at the time of data collection, creating potential for intent to improve dietary
quality and practice of recommended dietary behaviors to be greater than those of the
general low-income population. Therefore, generalization of the findings of our study
should be limited to PPC who are participating in federal nutrition programs.

8
In spite of the limitations the findings do have applicability for nutrition education
interventions targeting low-income families with young children who are participating in
federal nutrition education programs and aimed at increasing fruit and vegetable
availability.
Definitions of Terms and Abbreviations
Action stage: A term used in this study to identify parents and primary caregivers (PPC)
who were serving five or more servings of fruit and vegetable daily to their
preschool age children. It is a combination of PPC who staged as either action or
maintenance stage (Prochaska, Norcross & DiClemente, 1994).
Adequate intake (AI): A term defined by the Institute of Medicine as a guide for nutrient
intake when a Recommended Dietary Allowance cannot be established (Institute
of Medicine, 2002).
At risk for overweight: A term used by the Centers for Disease Control and Prevention to
describe children aged two to twenty years who have a BMI-for-age that is
between the eighty-fifth and ninety-fifth percentiles when plotted on the CDC
growth chart and compared to other children of the same gender and age (CDC,
2007b).
Body mass index (BMI): A measurement defined and used by the Centers for Disease
Control as an index of a person’s weight in relation to height. It is determined by
dividing the weight, in kilograms, by the square of the height, in meters (CDC
2007b).

9
Centers for Disease Control and Prevention (CDC): A component of the United States
Department of Health and Human Services. It utilizes public health strategies to
prevent and control infectious and chronic diseases, workplace injuries and
hazards and environment health threats (CDC, 2007a).
Decisional balance: A construct of the Transtheoretical Model (TTM) of behavior
change that describes a person’s perceptions of the positive versus negative
aspects of making a specific behavior change. Decisional balance serves as an
outcome measure in TTM based interventions aimed at increasing intent for a
specified behavior change (Prochaska, Norcross & DiClemente, 1994).
Expanded Food and Nutrition Education Program (EFNEP): A federally funded program
administered through the United States Department of Agriculture Cooperative
State Research, Education and Extension Service. It is designed to serve low-
income populations in developing knowledge, skills, attitudes and changed
behavior leading to nutritional well-being (Cooperative State Research Education
& Extension Service, 2007).
Farmer’s Market Nutrition Program (FMNP): A federally funded program associated
with the Special Supplemental Nutrition Program for Women, Infants and
Children (WIC). It provides fresh, unprepared, locally grown produce to WIC
participants (Food and Nutrition Service [FNS], 2007a).
Food Stamp Nutrition Education (FSNE): A federally funded program targeted to Food
Stamp recipients designed to improve nutrition-related skills, especially those
related to planning, purchasing and preparing low-cost, nutritional foods (FNS,
2007b).

10
Fruit and vegetable frequency questionnaire (FVFQ): An instrument used in this study to
assess the frequency and typical amounts of fruit and vegetable sub-groups being
served to preschool age children by their parent or primary caregiver.
Institute of Medicine (IOM): A non-governmental component of the National Academy
of Sciences providing science-based advice and information related to biomedical
science, medicine and health to decision makers (IOM, 2007).
Obesity: A term used to describe a physical state characterized by excessively high
adipose tissue in relation to lean body tissue. The Centers for Disease Control
and Prevention use BMI greater than 30 to identify obesity (CDC, 2007b).
Overweight: A term used by the Centers for Disease Control and Prevention to describe
children aged two to twenty years whose BMI-for-age is equal to or above the
ninety-fifth percentile when plotted on the CDC growth chart and compared to
other children of the same gender and age. Overweight, rather than obesity, is the
preferred term for pediatric populations (CDC, 2007b).
Parent/Primary Caregiver (PPC): A term used in this study to describe the person who
serves as the main gatekeeper or decision-maker for foods made available to the
preschool age child.
Preaction stage: A term used in this study to identify parents and primary caregivers
(PPC) who were serving less than five servings of fruit and vegetable daily to
their preschool age children and were not considering changing within the next
six months. It is a combination of PPC who staged as either precontemplative or
contemplative (Prochaska, Norcross & DiClemente, 1994).

11
Preparation stage: A term used in this study to identify parents and primary caregivers
(PPC) who were serving less than five servings of fruit and vegetable daily to
their preschool age children. They differed from PPC in the preaction stage in
that they intended to increase availability of fruit and vegetable to five servings
daily within the next thirty days (Prochaska, Norcross & DiClemente, 1994).
Processes of change: A construct of the Transtheoretical Model (TTM) of Behavior
Change. They are covert, cognitive thoughts and overt behaviors that help a
person progress from a lower level of readiness to make a behavior change to a
higher level. Processes serve as independent variables in TTM based
interventions; and should be matched to a person’s level of readiness for making a
change (Prochaska, Norcross & DiClemente, 1994).
Self-efficacy: A construct of the Transtheoretical Model (TTM) of Behavior Change
describing a person’s level of confidence in being able to perform a particular
behavior in a variety of situations. Self-efficacy serves as an outcome measure in
TTM based interventions (Prochaska, Norcross & DiClemente, 1994).
Stages of change (SOC): Stages of change are the major construct of the Transtheoretical
Model (TTM) of Behavior Change. The two terms are frequently used
interchangeably. There are five well-defined stages that describe a person’s intent
for making a specific behavior change. The two terms, SOC and TTM, are
frequently interchanged (Prochaska, Norcross & DiClemente, 1994).
Transtheoretical Model of Behavior Change (TTM): A theory that uses a combination of
constructs from various behavior-change theories to explain how people make

12
behavioral changes over time by progressing through five well defined stages
(Prochaska, Norcross & DiClemente, 1994).

13
CHAPTER II
REVIEW OF LITERATURE
The food that we eat plays a major role in our health and the prevention of
chronic, diet related diseases such as cardiovascular disease, hypertension, diabetes, some
cancers and obesity. In 2004, cardiovascular disease was the leading cause of death both
nationally and in Oklahoma (Oklahoma State Board of Health [OSBH], 2006). Eight
percent of Oklahomans, as compared to seven percent nationally, had been told by their
physician they had diabetes (OSBH, 2006). Over sixty percent of both the state and
national population were overweight (National Center for Health Statistics [NCHS],
2004). Of greater concern is not only the number of children who are becoming
overweight, but also that a disproportionally higher number of these children are in low-
income subpopulations (Anderson & Butcher, 2006). The reason for the alarm is the
evidence that overweight children are more inclined to become overweight adults
(American Academy of Pediatrics [AAP], 2003). Excess adiposity not only increases
medical morbidities and psychological stress during childhood (AAP, 2003; Pariskova &
Hills, 2001; Mullen & Shield, 2004), it also contributes to the risk of developing diet
related, chronic diseases later in life (AAP, 2003; Pariskova & Hills, 2001).
The economic impact of obesity related health care costs is staggering. Based on
1998 National Health Accounts and 1998-2000 Behavioral Risk Factor Surveillance

14
Survey (BRFSS) data, the annual costs were $78.5 billion nationally and $854 million in
Medicare and Medicaid for Oklahomans (Centers for Disease Control [CDC], 2007c). It
seems logical that improving dietary behaviors that help maintain healthy weights would
also contribute to decreased morbidity and mortality rates attributed to diet related
chronic disease.
Obesity Trends
The increasing rates of overweight and obesity have become one of the nation’s
greatest health care challenges (USDHHS, 2001). The United States Department of
Health and Human Services Centers for Disease Control and Prevention (CDC) uses
Body Mass Index (BMI) as a measure of overweight and obesity (CDC, 2007b). BMI is
a ratio of height to weight. For people twenty years and older overweight is defined as
having a BMI greater than or equal to twenty five, while obesity is defined as a BMI
greater than or equal to thirty. Because children’s body weight and composition varies as
they grow and develop, their BMI-for-age is plotted on growth charts and compared to
children of the same age and gender. Children, aged two to twenty years, falling between
the eighty-fifth percentile and ninety-fifth percentile are considered to be at risk for
overweight. Those at or above the ninety-fifth percentile are defined as overweight.
The Pediatric Nutrition Surveillance System (PedNSS) reflects that overweight in
children aged two to five years increased from eleven percent in 1995 to fifteen percent
in 2004, representing a thirty-four percent increase (PedNSS, 2004). Children at risk for
overweight increased from fourteen percent to sixteen percent for the same time period.
In older children, aged six to eleven years, the prevalence of overweight has increased

15
four-fold in the last thirty-five years, increasing from four percent in the early 1970s to
over nineteen percent of children as reported in the 2003-2004 National Health and
Nutrition Examination Survey (NHANES) (NCHS, 2004). Overweight in youth aged
twelve to nineteen years has almost tripled, increasing from six percent in the early 1970s
to seventeen percent in 2003-2004. These trends give reason for nutrition professionals
and health care providers to investigate factors contributing to overweight, obesity and
related health conditions.
Benefits of Fruit and Vegetable Consumption
A combination of epidemiological, observational and experimental research has
shown that increased intakes of fruit and vegetable are related to decreased risk of obesity
and chronic diseases including cardiovascular disease, hypertension, diabetes and some
cancers (Hyson, 2002; Ness & Powles, 1997; Steinmetz & Potter, 1996; Van Duyn &
Pivonka, 2000). The best understood explanation of these associations point to the
antioxidant nutrients and phytochemicals found in fruit and vegetable that protect against
the oxidative stresses associated with cardiovascular disease, cancer and aging processes
(Hyson, 2002; Van Duyn & Pivonka, 2000). Epidemiological data from the Nurses’
Health study revealed an inverse relationship between intake of vegetables and the
development of diabetes (Colditz et al., 1992). A study conducted in England with non-
obese participants found those who ate salad and raw vegetables more often had a lower
incidence of type 2 diabetes (Williams et al., 1999). Multiple studies found the high fiber
and low energy density of fruit and vegetable to be associated with benefits in weight
management (Van Duyn & Pivonka, 2000; Epstein et al., 2001; Tohill et al., 2004; Bell &

16
Rolls, 2001). A review of research conducted by the CDC suggests that these
characteristics provide for high satiety and a feeling of fullness that helps to limit energy
intake (CDC, 2005). This was demonstrated by Epstein and colleagues who investigated
the effects of eating patterns using families consisting of at least one obese parent and a
non-obese child (Epstein et al., 2001). Families were randomly assigned to one of two
behavioral-based weight management programs. One group was encouraged to increase
fruit and vegetable consumption while the second focused on decreasing high-fat and
high-sugar food, with no calorie restrictions for children in either group. At the end of
one year, parents who intentionally increased fruit and vegetable had a significantly
greater weight loss than the parents who intentionally decreased energy-dense foods.
Further, the parents and children who increased fruit and vegetable consequently
decreased high-fat and high-sugar foods. In contrast, the second group who decreased
high-fat, high-sugar foods, had not increased fruit and vegetable consumption. The
findings suggest that targeting parents and focusing on behaviors that increase fruit and
vegetable consumption can simultaneously reduce intake of energy-dense, low-nutrient
foods by the family.
In summary, although it is the composition of fruit and vegetable and the number
of active compounds they contain that provides protective factors against disease, it is the
level of consumption of fruit and vegetable that provides the strongest relationship
between diet and disease (AAP, 2003).

17
Fruit and Vegetable Consumption Recommendations and Trends
Less than half of all Americans are eating enough fruit and vegetable to realize
the health benefits of these foods (Guenther et al., 2006). The Dietary Guidelines for
Americans provides dietary health information based on the most recent scientific
evidence (USDHHS & USDA, 2005). The guidelines are appropriate for healthy
Americans aged two years and older, and are intended to provide the nutrients needed for
normal growth and development during childhood and to help people of all ages reduce
risk of chronic disease. Unlike previous editions, the 2005 edition provides twelve food
intake patterns based on specific age, gender and activity levels. The suggested
quantities of nutrient-dense foods to consume from each food group are based on Dietary
Reference Intakes established by the Institute of Medicine (IOM, 2002, 2004a). For
example, the recommended calories for moderately active male children aged two to five
years ranges from 1,000 to 1,400 calories. The recommendation for fruit intake for this
calorie level ranges from 1 to 1½ cups; vegetable intake also ranges from 1 to 1½ cups.
The standard reference used for Nutrition Fact labeling on food products is a 2,000
calorie diet for which the fruit intake recommendation is 2 cups and vegetable intake is
2½ cups. Further guidance defines a serving of fruit and vegetable as one-half cup of
cooked or raw, chopped fruit and vegetable. A serving of dried fruit and vegetable is
one-fourth cup, and a serving of raw leafy greens is two cups.
Nationally conducted food consumption surveys consistently indicate fruit and
vegetable consumption practices fall short of the recommended quantities. Cook and
Friday (2004) used food intake data from the National Health and Nutrition Examination
Surveys (NHANES) conducted between 1999 and 2002 to estimate the number of

18
Pyramid servings being consumed. Their report reflected that all individuals two years of
age and over were eating 3.2 servings daily of vegetables. For male and female children
aged two to five years the number of vegetable servings averaged 2.2 servings daily. It
should be noted that vegetables consisted of all subgroups including vegetable chips.
Fruit consumption, including fruit juice, for all individuals over the age of two was 1.6
servings daily, with 2.4 servings daily for children aged two to five years. Overall, fruit
and vegetable intake was about one-half the quantities recommended by the 2005 Dietary
Guidelines for Americans. Guenther and colleagues (2006) used the same data to
determine the proportion of subpopulations by age meeting the 2005 Dietary Guidelines
fruit and vegetable recommendations. They estimated slightly less than half (48 percent)
of children two to three years met the fruit and vegetable recommendation. The
subpopulation with the lowest percentage of adequacy was males fourteen to eighteen
years (0.7 percent). For all other age groups less than twenty percent met their age and
gender specific recommendations.
The trends are no better in Oklahoma. The Behavioral Risk Factor Surveillance
System (BRFSS) was established by the Centers for Disease Control and tracks health
risks of United States residents by state. The BRFSS data reported in 2005 reflected that
84.3 percent of Oklahomans failed to consume five servings of fruit and vegetable each
day. When the data was grouped by income level, 84.9 percent of lower-income
Oklahomans (those earning less than $15,000 annually) were eating less than five
servings of fruit and vegetable per day, compared to 79 percent nationally (BRFSS,
2005). This data ranks Oklahoma 50th in the nation in terms of fruit and vegetable
consumption (BRFSS, 2005; Oklahoma State Department of Health [OSDH], 2006). The

19
trends in fruit and vegetable consumption leave no doubt of the need for effective
nutrition and health initiatives that will positively influence the consumption of these
health promoting foods.
Determinants of Fruit and Vegetable Consumption
Availability is a major determinant in the consumption of fruit and vegetable and
it is influenced by a number of factors. Reicks, Randall and Haynes (1994) conducted
focus groups with low-income mothers of young children to identify their attitudes and
perceptions about fruit and vegetable consumption. The responses, cited as barriers to
including fruit and vegetable in the diet, were grouped into three categories. The first
category addressed income specific environmental restraints, including access, cost,
availability and storage space. The comments of the focus group members reinforced the
premise that adherence to dietary recommendations for fruits, vegetables, and grains is
problematic for low-income populations. The second category included influences related
to the food, such as taste, appearance, convenience and health. Participants shared that
easy, quick recipes to improve the taste of vegetables would be helpful in improving
consumption. Social and psychological dimensions comprised the third category. These
factors included the mother’s role as gatekeeper in purchasing, preparing and serving
foods; ages and developmental stages of children; and role modeling of the adult male in
the home.
In other related studies, Havas et al. (1998) looked at the factors associated with
fruit and vegetable consumption in women participating in WIC and determined that self-
efficacy, attitudes, and cost were the most significant predictors of fruit and vegetable

20
consumption. Parker (2002) conducted semi-structured group and individual interviews
with low-income women in Oklahoma. The women shared that expense and family
preferences were barriers to purchasing fruit and vegetable. Limiting food waste was
another major consideration for low income households when making food purchasing
decisions (Parker, 2002; Shankar & Klassen, 2001). To limit food waste, women only
purchased food acceptable to the family and avoided purchasing foods that were highly
perishable, especially fresh fruit and vegetable. Similar barriers were found by
Birmingham, Shultz and Edlefsen (2004) who studied factors related to the frequency
with which fruit and vegetable were served to children and consumed by mothers in low-
income households. Taste preferences and lack of interest in trying new fruit and
vegetable were significantly related to the frequency with which they were served and
consumed. The cost and convenience of preparing fruit and vegetable was more
negatively related with the mother’s intake as compared to the frequency they served fruit
and vegetable to their children. Furthermore, fruit and vegetable intakes were lower in
households reporting food insecurity. The women in Parker’s (2002) study reported that
monies available toward the end of the pay period or food benefit allocation period, when
food supplies were low, were used for purchasing staples such as bread, milk, meat and
cheese to stretch the remaining food items rather than purchasing fruit and vegetable.
James, Nelson, Ralph and Leather (1997) found that low-income households were
efficient in making food purchases in that they purchase less-expensive, higher energy
foods that satisfy hunger. These foods were typically high in fat and sugar. Accordingly,
less money was spent on nutrient dense foods, especially fruits, vegetables and whole
grains. As the evidence points out, availability and accessibility of foods are heavily

21
influenced by cost, convenience and preferences; which consequently limits fruit and
vegetable in low income households.
Availability and accessibility are key factors in not only the consumption of fruit
and vegetable, but also in the development of taste preferences for these foods (Birch &
Fisher, 1998). Low availability of nutrient dense foods and ready availability of high-fat,
sweet and salty foods can result in the development of food intake patterns that are low in
fruit and vegetable consumption.
Infants are born with a predisposition for sweet foods and develop a disposition
for salty foods by about 4 months (Birch, 1998). During the first five years of life,
children learn their hierarchy of food preferences through associative learning and
imitation of parents and caregivers (Birch, 1998). In researching the development of
eating behaviors in children, Birch and Fisher (1998) found that the food environment the
parent provides shapes children’s food preference and acceptance patterns. Early,
frequent exposure to fruit and vegetable in a pleasant setting is an important factor in
helping children accept and prefer these foods (Birch and Fisher, 1998). Research
conducted by Kratt, Reynolds and Shewchuk (2000) concluded that homes in which fruit
and vegetable were more available had a stronger set of motivating factors for
consumption of these foods than homes with lower availability. For example, parents
had higher intake and provided more positive influences compared to households where
children consumed less fruit and vegetable. Findings from a study conducted with
elementary school age students also revealed that both availability and accessibility were
significantly correlated with fruit, juice and vegetable consumption by children (Cullen et

22
al., 2003). Succinctly stated, children like and eat what is familiar to them, and what is
familiar is what is available in their environment (Birch & Fisher, 1998).
In addition to availability, Nicklas et al. (2001) reported that food modeling by
parents and caregivers and their feeding practices played an important role in the
development of food preferences of two to five year olds. Children and toddlers were
more likely to try and accept new foods when they were able to follow the example of
parents and caregivers. Findings from the Feeding Infants and Toddlers Study (FITS)
(Skinner et al., 2004) indicated meals and snacks for the age group frequently do not
contain fruit and vegetable; and therefore do not provide opportunity for young children
to observe modeling of healthy eating behaviors. After evaluating food records revealing
parental feeding practices and meal and snack patterns of toddlers, the researchers
concluded that many toddler meals and snacks did not meet the recommendations of Five
a Day for Better Health. Forty to fifty percent of toddlers had no fruit or fruit juice for
breakfast; fifty percent did not have fruit for lunch; and sixty percent had no fruit at
dinner. Furthermore, fruit was not common at snacks throughout the day. The
availability of vegetables was similar to fruits. More than fifty percent of toddlers had no
vegetables for lunch and more than thirty percent had no vegetables for dinner.
Vegetables that were eaten most often included corn, French fries and green beans. Less
than five percent of the food records included vegetables for breakfasts or snacks. The
lack of opportunity for children to observe modeling of healthy food behaviors, along
with the body of research associating availability of foods with the development of food
preferences, helps to explain the poor consumption of fruit and vegetable by children.

23
Fruit and Vegetable Intervention Projects
To change the established consumption behaviors, researchers and educators
conducted an array of extensive nutrition education and intervention projects providing
varying results and perspectives. In a 2004 study, Horodynski, Hoerr and Coleman pilot
tested and evaluated the effects of a nutrition education intervention titled Nutrition
Education Aimed at Toddlers. It was hypothesized that increasing caregivers’ knowledge
of feeding toddlers and enhancing their attitudes about toddler feeding would result in
improved feeding practices of caregivers and dietary intake of toddlers. Six months after
participating in the nutrition education program, three-fourths of the caregivers in both
the intervention and control groups had accurate knowledge concerning the feeding of
toddlers. Furthermore, attitudes concerning toddler feeding were positive with little
variability between the two groups. In contrast, the food intake of both the mothers and
infants was poor, with only nine percent of the toddlers eating at least one serving of food
from each of the five food groups. The researchers concluded that knowledge alone is
insufficient to change eating habits, and recommended studying other avenues to enhance
feeding practices of toddlers. Kumanyika (2001) and Glanz et al. (1995) suggested
approaches that modify the environment in which food choices are made and policy
changes to support the environmental changes may be more effective than interventions
that depend upon individual cognitions to bring about sustainable behavior change.
One such program is the Special Supplemental Nutrition Program for Women,
Infants and Children (WIC) Farmers’ Market Nutrition Program (FMNP) (USDA, 2003).
Participation is left to the discretion of each state agency administering the federally
funded program. Participants are issued FMNP coupons in addition to the standard WIC

24
food package. These coupons can be used to buy fresh, unprepared fruits, vegetables and
herbs from farmers or farmers’ markets that have been approved by the state agency to
accept FMNP coupons.
Several studies have examined the effects of the WIC FMNP. A study of the
Connecticut Farmers’ Market (Anliker, Winne & Drake, 1992) found subjects who
received coupons were significantly more likely to use the farmers’ markets than control
subjects who did not receive coupons. There was no evidence of an effect on fruit and
vegetable consumption. In contrast, an evaluation of the Michigan Farmers’ Market
Program (Anderson et al., 2001) demonstrated low-income populations were more likely
to increase fruit and vegetable consumption when affordability was increased through the
issuance of coupons. The Michigan project was comprised of three interventions. The
first group received both the coupons and an education intervention addressing
purchasing and benefits of consuming fruit and vegetable. The second group received
only the nutrition education, while the third group received only the coupons. Consistent
with Horodynski et al.’s (2004) research, the education component itself had no
significant direct effect on consumption changes, but did result in a significant change in
attitudes about fruit and vegetable. The coupon intervention was associated with
significant increases in fruit and vegetable consumption. A combination of the two
interventions resulted in the greatest impact. Researchers noted that participants
completing the post intervention questionnaire were more likely to have transportation to
the farmers’ markets.
Herman, Harrison and Jenks (2006) provided supplemental financial support to
WIC households specifically for the purpose of purchasing fresh fruit and vegetable. The

25
purpose of the study was to determine if WIC participants would use the funds to
increase purchases of fruit and vegetable, and if so, what fruit and vegetable were
purchased. Two intervention groups and one control group participated over a six month
period. One intervention group redeemed vouchers at a full-service grocery store while
the second shopped at a year-round farmers’ market. Purchases were determined by
voucher redemption rates. Based on pre/post and intermittent 24-hour dietary recalls,
ninety percent of the study participants increased intake of fruit and vegetable. The most
frequently purchased items were oranges, apples, bananas, peaches, grapes, tomatoes,
carrots, lettuce, broccoli, and potatoes. A limitation of the study was the subsidy of $40
per month was greater than what is feasible in the federally funded WIC program.
Although the study demonstrated that participants would use the full amount of the
subsidy, it does not demonstrate that lesser amounts proposed by the IOM
recommendation (IOM, 2005) would be considered worthwhile. The study was not
designed to determine if the practice of purchasing increased quantities of fruit and
vegetable was sustained after the intervention or eligibility period for benefits ended.
The most recent research interest for healthy eating behaviors looked at the
association between home/locally produced fruit and vegetable and consumption by
preschool age children and their parents (Nanney, Johnson, Elliott & Haire-Joshu, 2007).
The study was a cross-sectional design conducted in rural Missouri with parents who
were enrolled in parent education programs. Researchers used telephone interviews to
determine the frequency at which parents and their child ate home/locally grown fruit and
vegetable and classified them into one of three groups consisting of always/almost
always, sometimes, and rarely/never. These groups served as the independent variables.

26
Dependent variables were intake patterns of parents and children and characteristics of
the food environment, including parental role-modeling, availability and accessibility of
healthful foods, frequency of fast food meals, and weekly grocery expenses. Parents who
always/almost always ate home/locally grown produce were significantly more likely to
eat five servings of fruit and vegetable daily; and the same held true for their children.
There were no significant differences between the groups in the number of fast food
meals eaten or the amount spent on weekly groceries. The findings led the researchers to
conclude promotion of home and community gardens as a viable strategy to increase fruit
and vegetable consumption.
Other nutrition education interventions and research have utilized the
Transtheoretical Model (TTM) of Behavior Change, often referred to as Stages of
Change, to study factors effecting fruit and vegetable consumption. (A thorough
discussion of the theory is in the next section.) Anliker, Damron, Ballesteros, and
Langenberg (1999) used TTM to develop Get Clued in to Fruit and vegetable Guidebook
for use with the Maryland Special Supplemental Nutrition Program for Women, Infants,
and Children (WIC). The primary purpose of the project was to increase WIC
participants’ fruit and vegetable consumption by helping them move through the stages of
change. The guidebook was distributed to participants and used in a series of three
bimonthly nutrition sessions scheduled at WIC voucher pick-up times. Because of
scheduling constraints, participants were not grouped by stage of change. An advantage
of this method allows people at higher levels to share their ideas and experiences with
those at lower levels, reinforcing their own positive behaviors. The first lesson used the
consciousness awareness process of change by addressing the importance of eating fruit

27
and vegetable. Activities included a self-assessment of fruit and vegetable consumption
and setting a personal goal for increasing consumption. The second section addressed
barriers to and strategies for reaching their goals identified in the first lesson. The last
section addressed action and maintenance stages by discussing possible causes of relapse,
ways to maintain goal behaviors, and self-reward systems. Evaluation of the project
revealed that participants who read the guidebook or attended the classes were
significantly more likely than other respondents to increase fruit and vegetable
consumption. In addition, intervention participants had significantly greater movement
across the stages of change than did control group participants.
Henry et al. (2003) matched decision-making factors affecting the purchase and
preparation of fruit and vegetable to stage of change. Their methodology consisted of
collecting verbalized data as low-income, African-American mothers with young children
shopped and prepared foods in their homes. The two factors that varied by stage of
change were preferences and specific meal planning needs. Women in the later stages
used meal-planning skills to successfully incorporate fruit and vegetable into meals. The
researchers concluded that interventions focusing on the behaviors of purchasing and
preparing fruit and vegetable and tailored on the stages of change could contribute to
greater changes in intake.
In a follow-up study Henry, Reimer, Smith and Reicks (2006) used the identified
purchasing and preparation issues to develop a survey regarding decisional balance,
processes of change, and self-efficacy. The purpose was to determine the relationship
between stage of change and TTM constructs influencing low-income, African-American
mothers’ fruit and vegetable consumption. The three major findings included 1) people

28
in later stages used more processes, or strategies, to increase fruit and vegetable
consumption; 2) recognition of the health benefits of eating fruit and vegetable was
stronger in the later stages; and 3) the degree of self-efficacy was strongly and
consistently associated with a higher consumption of fruit and vegetable in the target
population. In conclusion, stage of change differentiated levels of decisional balance,
self-efficacy and processes used by people at various stages of change for increasing fruit
and vegetable consumption.
The findings and conclusion of Henry et al.’s (2006) second project are supported
by the work of Nothwehr, Snetselaar, Yang and Wu (2006) who examined the use of
behavioral strategies for healthy eating across stages of change. They found a positive
linear trend and concluded that the use of experiential and behavioral strategies
consistently increase across groups and those behavioral strategies are helpful in
distinguishing readiness to change. Researchers at the University of Nebraska-Lincoln
examined the stages of change in relation to decisional balance and self-efficacy for fruit
and vegetable consumption in young adults (Ma et al., 2002). They also found self
efficacy increased across the stages and consumption of fruit and vegetable followed the
trend. In addition, as stages advanced the perceived importance of eating fruit and
vegetable increased and disadvantages decreased. In conclusion, the study lends
evidence to the applicability of TTM for evaluating the factors related to fruit and
vegetable consumption in young adults.
TTM based interventions and education components use a combination of
theoretical constructs that customize the message to meet a population subgroup’s
readiness to change by addressing the advantages and disadvantages of making the
29
behavior change and building needed skills for performing the new behavior. Using
TTM to build individual skills and readiness in combination with environmental and
policy interventions may provide the broad base needed for increasing fruit and vegetable
availability to young children in low-income households; thus increasing consumption in
the youngest generation and ultimately reflect a positive change in national consumption
trends.
Transtheoretical Model of Behavior Change
The Transtheoretical Model of Behavior Change provides a framework for
understanding a person’s intention for making a healthy behavior change and how they
act upon that intention (Prochaska, Norcross & DiClemente, 1994). It recognizes that for
any given change individuals are at different levels of motivational readiness; and the
process of changing occurs over a period time. Developed by psychologists James
Prochaska, John Norcross, and Carlo Diclemente (1994), it is the result of an analysis of
eighteen psychotherapy systems that identified common processes of change. It
postulates that interventions designed to promote healthy behavior changes are most
effective when they are matched to the person’s stage or readiness to change. TTM is
transtheoretical in that it integrates key constructs of multiple behavior change theories
into one to facilitate progression from one stage of change to the next (Prochaska,
Norcross & DiClemente, 1994; Velicer, Prochaska, Fava, Norman & Redding, 2004).
Moving from lower to higher stages is dependent on three constructs; 1) belief that the
benefits, or positive aspects, of the specific behavior change outweigh the disadvantages,
or negative aspects, which is referred to as decisional balance; 2) the perceived level of

30
self-confidence, or self-efficacy, in having the ability to make the change; and 3) using a
wide range of strategies, or processes.
TTM is based on the premise that behavioral change follows a series of
predictable, well-defined stages facilitated by activities, referred to as processes of
change, that are associated with each stage (Prochaska, Norcross & DiClemente, 1994).
There are five stages of change including precontemplation, contemplation, preparation,
action, and maintenance. As illustrated in Figure 2.1, the first three stages are
characterized by intent to change behavior, while the latter three, again including
preparation, are characterized by behavior change (Velicer et al., 2004).
Behavior Intention
Precontemplation Contemplation Preparation Action Maintenance
Behavior Change
Figure 2.1 Five stages of change representative of the Transtheoretical Model (Prochaska, Norcross & DiClemente, 1994)
Precontemplation is the stage in which people do not intend to make changes in
the foreseeable future, usually measured as the next six months (Prochaska, Norcross &
DiClemente, 1994). People do not recognize their behavior as detrimental to themselves
or others because they fail to acknowledge, are uninformed, or under-informed of the
consequences of their behavior. People may also be in the stage because they have tried
to change a particular behavior in the past with little or no success. As a result, they may
have become demoralized and have a very low self-efficacy in regards to resolving the
problem behavior. They refuse to read, discuss, or think about the problem and in short,

31
are resistant to change. When others around them try to address the issue, the response is
defensiveness and placement of responsibility for the behavior is on external factors such
as genetics, society or family. Interventions utilizing cognitive or experiential processes,
rather than action oriented processes are most effective for this stage.
People in the contemplation stage have indefinite intention to take action with in
the next six months (Prochaska, Norcross & DiClemente, 1994). The stage is
characterized by awareness of the problem and, unlike precontemplation, an eagerness to
discuss the behavior and possible change. There is an acute awareness of the positive
aspects of the change, but the negative aspects, perceived as the amount of energy, time,
and other resources required to make the change continue to have greater influence in
their decision making. This is referred to as decisional balance and helps to explain why
people do or do not become motivated to change. Prochaska identified the phenomenon
when comparing profiles of fifteen different behaviors for the relationship of positive and
negative aspects of the change to each of the five stages of change (Prochaska, Norcross
& DiClemente, 1994). He realized perceived pros of changing increased with movement
from precontemplation to contemplation, and that cons of change decreased as movement
progressed from contemplation to action. The shift between the perceived importances of
the positive over the negative aspects is derived from accepted models of decision
making (Greene et al., 1999), and is essential for moving beyond
contemplation into action oriented stages.
Preparation is the pivotal stage in which people plan for sustainable changes to be
made in the immediate future, usually defined as one month. During preparation there
continues to be an evaluation of pros and cons. For some people preparation will consist
32
of developing a plan for action while others will begin to make a series of small changes
(Finckenor & Bredbenner, 2000). Most important for moving from preparation into the
action stage is a public commitment to change (Prochaska, Norcross & DiClemente,
1994). People in this stage are most receptive to action-oriented behavior change
programs.
The action stage occurs when behavior change becomes overt and a preset
criterion for performance is being met. Examples of diet and health related criteria
include increasing vegetable servings to two and one-half cups per day, using only
reduced or low-fat milk products, or walking briskly for thirty minutes each day. It is
also the stage at which relapse is most probable, therefore requiring a great deal of effort
and commitment (Prochaska, Norcross & DiClemente, 1994).
Maintenance is the extension of action into a long-term behavior. It requires
continued effort and commitment to perpetuate the change and avoid relapse. Prochaska
contends that maintenance is a critically important stage that can be as brief as six months
to a lifetime (Prochaska, Norcross & DiClemente, 1994). For changes in dietary
behaviors, Bowen, Meschke and Tomoyasu (1994) have suggested maintenance of the
changed behavior for two years as an appropriate criterion for defining sustainable
change. The reason for the extended period is that dietary behaviors are more complex
and consist of more variables than do more dichotomous addictive behaviors. Dietary
changes frequently involve changing multiple behaviors, such as meal planning,
purchasing and preparing foods; as well as affecting multiple people who live within the
household.

33
The key to successful use of TTM is identifying the particular stage of change and
applying the process or matched treatment that has been found to be most effective for
the stage (Prochaska, Norcross & DiClemente, 1994). Prochaska defines processes of
change as any covert or overt activity utilized to initiate or help modify thinking, feeling,
or behavior (Prochaska, Norcross & DiClemente, 1994). They serve as the variables that
people apply or practice. There are nine processes, each representing a category of
similar intervention activities or techniques designed to facilitate behavior change and
progression through the stages (Finckenor & Bredbenner, 2000). They serve as the
independent variables and provide important guides for intervention programs (Velicer et
al., 2004).
The processes can be divided into two categories, experiential and behavioral
(Velicer et al., 2004). The experiential processes focus on cognitive thoughts, feelings,
and experiences, and are used more frequently during the early stages of change.
Behavioral processes focus on behaviors and reinforcement. Because they are action
oriented they are effective in the action and maintenance stages of change (See Figure
2.2, page 33).
Consciousness raising is used to increase the level of knowledge or awareness of
the problem behavior. Interventions using this process include feedback, education,
confrontation, interpretation, and media campaigns (Velicer et al., 2004). Although it is the most widely used process and used by the majority of the major therapies, it is most
effectively used in the precontemplation and contemplation stages (Prochaska, Norcross
& DiClemente, 1994).
Social liberation uses the external environment to start or continue the behavior

34
Precontemplation Contemplation Preparation Action Maintenance
Consciousness Raising Social Liberation Helping Relationships
Emotional Arousal Reevaluation Commitment Reward Countering Stimulus Control
Figure 2.2 Theoretical progression of the processes of change (Prochaska, Norcross & DiClemente, 1994)
change. Because the processes are external, they will be perceived differently based on
the stage of change a person is in (Prochaska, Norcross & DiClemente, 1994). Some
people will be resistant while others will find it to be empowering. Examples include no
smoking zones, the inclusion of fruit and vegetable into the WIC supplemental food
package and addition of salad bars to school nutrition programs. These opportunities are
especially helpful to populations that are relatively deprived or oppressed (Velicer et al.,
2004) and are best matched to precontemplation, contemplation, preparation, and action
(Finckenor & Bredbenner, 2000).
Helping relationships are useful in all stages and consist of the openness, caring,
support, and assistance of significant people in the person’s life. The process is used
frequently in behavior change treatment programs and is also of significant importance to
self-changers. Self-changers have found the process most beneficial during
contemplation, preparation, and action (Prochaska, Norcross & DiClemente, 1994).
Techniques include support groups, rapport building, counselor calls, and buddy systems
(Velicer et al., 2004).

35
Emotional arousal, sometimes referred to as dramatic relief, is similar to
consciousness raising but works on a deeper emotional level. This process is occasionally
the result of real-life tragedies. Other techniques include role playing, personal
testimonies, dramatic films, explicit public-service announcements or media campaigns,
(Prochaska, Norcross & DiClemente, 1994). It enables people to become aware of their
defenses against change (Prochaska, Norcross & DiClemente, 1994) and is best matched
to the contemplation and preparation stages (Finckenor & Bredbenner, 2000).
Reevaluation uses both cognitive and affective appraisal of what life holds
without and with behavior change (Velicer et al., 2004; Finckenor & Bredbenner, 2000),
not only for themselves but also for other people in their life. It allows for a comparison
of the unhealthy behavior to one’s personal value system (Prochaska, Norcross &
DiClemente, 1994). The result is both a belief and attitude that the behavior change is
advantageous, shifting the decisional balance in favor of the behavior change.
Techniques include empathy training, documentaries, and family interventions (Velicer et
al., 2004). The process is best matched with the contemplation and preparation stages
(Finckenor & Bredbenner, 2000).
Commitment is a process used after a person has made the decision and accepts
responsibility for the behavior change. While the first phase of commitment is private, it
is the second phase, going public or sharing the decision to change that is the most
powerful (Prochaska, Norcross & DiClemente, 1994). Commitment is most effective in
the preparation, action, and maintenance stages (Finckenor & Bredbenner, 2000).
Rewards, such as self-praise or gifts, recognize and reinforce desirable behavior.
Other techniques include contingency contracts and group recognition (Velicer et al.,

36
2004). Prochaska notes that in some regions and cultures people may have a negative
reaction to the reward process because they feel they are being rewarded for modifying
behaviors that should have not been acquired (Prochaska, Norcross & DiClemente,
1994). Rewards are most effective in the action and maintenance stages (Finckenor &
Bredbenner, 2000).
Countering is the process of substituting healthy behaviors for unhealthy ones.
An example is using the stairs rather than the elevator, or exercising when the urge to
snack prevails. Since all behavior is conditional, the challenge is to find a counter activity
that is appealing (Prochaska, Norcross & DiClemente, 1994). Developing the skill of
countering increases self-efficacy and reduces the temptation of relapse (Velicer et al.,
2004). The process is most effective in the later stages of change.
Stimulus control is also action oriented in that it restructures the environment to
reduce the risk of problem-behavior (Prochaska, Norcross & DiClemente, 1994).
Examples include purchasing fruit and vegetable for snacking rather than
cookies or chips, or placing art displays in stair wells to encourage physical activity.
Environmental control differs from countering in that it changes the stimuli while
countering changes the individual’s response to the stimuli (Prochaska, Norcross &
DiClemente, 1994). As with countering, environmental control is effective in the action
and maintenance stages.
Prochaska (2004) believes that TTM can be used to develop interventions for the
general population, including dietary behaviors. It is feasible because most people in
group settings who need to change a behavior are in a preaction stage, and preaction
stages share many of the same characteristics (Prochaska, 2004). Finckenor and

37
Bredbenner (2000) found the most cost effective way to provide matched treatments for
group settings is to design group intervention programs that are oriented to the preaction
stages. This method improves both the recruitment and retention of self-changers, and
therefore long-term success (Prochaska, 2004; Finckenor & Bredbenner, 2000).
Summary
Closing the gap between food behaviors and federal intake recommendations is
challenging at best. A variety of epidemiological, observational and experimental
research supports the contention that diets rich in fruit and vegetable are associated with
reduced risk for chronic disease and have characteristics beneficial for maintaining
healthy weight (Hyson, 2002; Van Duyn & Pivonka, 2000). In contrast, national food
consumption surveys reflect that most Americans, including preschool age children, fail
to meet the dietary recommendations established to promote health (Cook & Friday,
2004; Guenther et al., 2006; Serdula et al., 2004).
A broad general theme of the determinants that help nutrition and health care
professionals better understand and explain the gap between recommendations and actual
intake is availability and accessibility of fruit and vegetable. Factors that influence
availability and accessibility include environmental constraints such as limited resources
for purchasing fruit and vegetable and psychosocial factors such as low self-efficacy,
perceived health benefits, and practices used to increase fruit and vegetable intake. The
importance of fruit and vegetable being available in households where preschool age
children reside is related to the child’s development of taste preferences for these foods

38
(Birch, 1998; Birch & Fisher, 1998) and the influence it can have on their lifelong food
intake behaviors (Skinner et al., 2004).
Interventions designed to impact awareness and knowledge have not been
effective in changing behaviors and researchers have recommended approaches be
broadened (Kumanyika, 2001; Glanz et al., 1995). Interventions designed to change the
environment by increasing availability of fruit and vegetable have shown mixed results
(Anliker, Winne & Drake, 1992; Anderson et al., 2001; Herman, Harrison & Jenks,
2006). TTM shows promise for increasing fruit and vegetable consumption in that it
combines multiple constructs derived from a variety of theoretical models and matches
them to the target population’s stage of readiness to make a behavior change. Further,
there is a growing body of evidence that TTM is appropriate for assessing a population’s
stage of readiness for dietary change and designing nutrition education interventions
matched to the mediating factors characterizing the stage (Henry et al., 2006; Nothwehr
et al., 2006, Ma et al., 2002). Because parents and primary caregivers (PPC) have a
strong influence on the development of food preferences; and because these preferences
develop very early in life (Birch, 1998), it is logical that interventions designed to
increase the fruit and vegetable consumption in young children should target the
parent/caregiver and be comprised of multiple strategies tailored to match their
perceptions and the psychosocial factors mediating the change.
The cited research has addressed the appropriateness of using TTM and its
constructs in various populations in relation to fruit and vegetable consumption. While
this information is beneficial for designing interventions to encourage PPC to increase
availability of fruit and vegetable, there has been little if any research conducted in

39
Oklahoma to assess low-income PPC’s intent to increase availability of fruit and
vegetable to their preschool age children. The current literature provides evidence that
diets rich in fruit and vegetable contribute to good health but that most people are not
eating enough fruit and vegetable to realize the benefits. For this trend to change it is
essential for fruit and vegetable to be available to young children when taste-preferences
and food behaviors are being formed. Since children are dependent on their parents and
caregivers to provide fruit and vegetable, it is essential that the nutrition community
understand to the fullest extent possible the factors influencing parent and caregivers’
decisional balance, self-efficacy and use of strategies to make fruit and vegetable
available to their children. This information will contribute to the existing body of
knowledge and will be of assistance as interventions and programs are designed to
support federal nutrition recommendations and initiatives promoting fruit and vegetable
consumption in children.

40
CHAPTER III
METHODOLOGY
The purpose of the study was to utilize TTM for assessing the stage of change,
level of self-efficacy, processes of change, and decisional balance of low-income parents
and caregivers for making fruit and vegetable available and accessible to their preschool
age children. This was achieved using a cross-sectional, quantitative design. The sample
size estimation (Warde, 1990; Malec, 1993) of three hundred was based on a 95 percent
confidence interval, a 5 percent margin of error, and previous research that found
approximately 75 percent of the population to be in preaction stages (Eivens, 2005). The
Oklahoma State University Institutional Review Board reviewed and approved the
protocol February 20, 2006 (Appendix A).
Sampling Procedures
The target population for the study was low-income parents and primary
caregivers (PPC) of preschool children aged one to five years residing in Oklahoma.
Low-income was defined as being at or below 185 percent of the federal poverty level.
The survey population consisted of PPC of children aged one to five years enrolled in
federal assistance nutrition education programs, including the Special Supplemental

41
Nutrition Program for Women, Infants and Children (WIC), the Expanded Food and
Nutrition Education Program (EFNEP), or the Food Stamp Nutrition Education Program
(FSNE) referred to as Oklahoma Nutrition Education (ONE); and being a parent or
primary caregiver of a child aged one to five years. These programs have income
eligibility criteria meeting our definition of low-income. The convenience sample was
recruited from three independent WIC clinics and eight EFNEP/ONE units. Two of the
WIC clinics were located in urban areas while the third was located in a rural community.
Two of the EFNEP/ONE units were in urban counties and six were comprised of multiple
rural counties, representing 51 percent (39 of 77) of the state’s counties. Subjects were
enrolled in and attending nutrition education classes offered through these programs.
Duplicate responses were eliminated by excluding those that were marked yes to having
completed the survey at another location.
Data Collection and Instrumentation
Data were collected through survey instruments completed by subjects attending
nutrition education sessions during the month of April, 2006. Surveys were administered
to the subjects by trained nutrition educators indigenous to the targeted population. The
educators were available for questions and clarification while the surveys were being
completed. Training for the data collection was conducted in March, 2006. A train-the-
trainer session was conducted with EFNEP/ONE area coordinators, who in turn trained
the paraprofessionals. WIC nutrition paraprofessionals were trained in individual
sessions. Informed consent information (Appendix B) was provided to the subjects both
verbally and in writing. A written script was provided to the nutrition professionals for

42
the purpose of explaining consent to participate in the study (Appendix C). Consent was
implied by submission of a completed survey.
Low respondent burden was important in the design of the survey. Factors
included length and time to complete, minimal response choices, and easy reading level.
A stage of change instrument validated by Cynthia Eivens (2005) as part of a multi-state
research project, NC 219R, was used with minor modifications. Selection of questions
was based on psychosocial factors related to fruit and vegetable consumption in low-
income households identified in previous research (Reicks, Randall & Haynes, 1994;
Havas, 1998; Parker, 2002; Shankar & Klassen, 2001). The wording of some questions
was slightly modified to better reflect a family situation. The resulting survey consisted
of six parts including socio-demographics, staging algorithm, pros and cons (decisional
balance scales), confidence (self-efficacy scales), strategies (processes), and a fruit and
vegetable frequency questionnaire (FVFQ). An expert panel of four WIC registered
dietitians, one WIC paraprofessional, and university nutritional sciences faculty reviewed
the survey for content validity. Modifications, based on the expert panel’s input,
included reduction in the number of responses in the confidence (self-efficacy) section,
reduction in the number of fruit and vegetable items in the FVFQ from twenty-six items
to eight, and reduction in the number of processes questions from thirty to thirteen. It
should be noted that legumes were not included in the vegetable food list because they
were a food item already included in the WIC supplemental food package. Juice was
included to more accurately assess the type of fruit being served. Processes of change
were selected based on factor analysis loadings from Eiven’s (2005) validation process
and suitability of the process for family situations. Overall format, clarity of instructions,
43
and time to complete the survey were tested during July 2005 with low-income residents
attending group parenting/nutrition education classes conducted in a county Cooperative
Extension office. Further revisions to the survey were made based on feedback from the
county extension educator and the researcher’s review of the returned surveys.
Assessment of income status was changed from income categories to asking if the subject
participated in WIC, EFNEP, or ONE. All three nutrition programs have low-income
eligibility requirements and participants met for inclusion criteria. Arrows were added to
the stage of change algorithm to guide subjects’ responses. Clarity in responding to the
pros and cons questions was added by bolding the statement “If you disagree with a
statement, or are not sure of how to answer it, the statement is probably not important to
you”. The food frequency questionnaire was changed from a table format completed by
the subject to two-part questions for each fruit and vegetable group.
Demographics. Two questions were asked to assure respondents met the definition of the
survey population. Subjects answered yes or no to “Are you the parent or main caregiver
of a child that is one to five years old?”, and marked the public assistance nutrition
education program (WIC, EFNEP or ONE) in which they were currently participating.
More than one program could be marked indicating possible duplicates in the survey
population. To correct for duplicates, subjects marked yes or no to the question “If you
marked more than one, have you filled out this survey somewhere else?” Other
demographic information collected was race, ethnic background, age, gender, education
and employment status.
Intention to Serve Fruit and Vegetable. This section assessed the subject’s stage of
change to increase availability and accessibility of fruit and vegetable. The assessment
44
included using a two-stage algorithm based on number of servings and intention.
Subjects were first asked to circle the number of servings, ranging from zero to nine, of
fruit and vegetable they usually served their family each day. Subjects who served four
or less servings were classified by stage: if they did not plan to serve more fruit and
vegetable (precontemplation), were planning to serve more in the next six months
(contemplation), or were planning to serve more in the next thirty days (preparation).
Those who were serving five or more servings each day were classified by stage: if they
had been serving that amount for less than six months (action) or if they had been serving
that amount for more than six months (maintenance).
Pros and Cons. This section measured the subject’s perceptions of the advantages and
disadvantages, or decisional balance, of serving more fruit and vegetable to their
children. Six questions (three pros and three cons) were measured on a five-point
response Likert scale where 1 = not important in deciding to serve more fruit and
vegetable and 5 = extremely important in deciding to serve more fruit and vegetable. Pro
items included protecting the family from diseases like cancer and heart disease, keeping
the family from getting sick with colds and infections, and helping family members have
a healthy weight. Con items included barriers such as expense, time to prepare, and more
trips to the grocery store.
Confidence. This section measured self-efficacy in the parent/caregiver’s ability to serve
fruit and vegetable under different situations. Five questions addressed preparing meals
at home, eating meals away from home, using tasty recipes, having limited money to buy
food, and having limited time. The items were measured with a four-point Likert scale
where 1 = not at all confident and 4 = very confident.

45
Strategies for Serving More Fruit and Vegetable. This section measured processes used
by parents and caregivers in different stages of intent to serve more fruit and vegetable to
children. Experiential processes included looking for tips to add fruit and vegetable to
meals, noticing more ready-to-eat fruit and vegetable in the grocery store, noticing more
fruit and vegetable where the family eats out, role-modeling fruit and vegetable eating,
awareness that fruit and vegetable are advantageous to family health, feeling bad when
realizing that not enough fruit and vegetable were being served, and commitment to
serving more fruit and vegetable. Behavioral processes included serving fruit and
vegetable instead of junk foods, having easy access to fruit for snacks, talking to other
people about eating more fruit and vegetable, reminders to serve two vegetables with
main meals, serving fruit instead of sweets for dessert, and feeling pleased when others
provided praise for serving fruit and vegetable. Use of these strategies was measured
with a five-point Likert scale where 1 = not at all to 5 = all of the time.
Fruit and Vegetable Frequency Questionnaire (FVFQ). The FVFQ had a three-fold
purpose. First, it was used to objectively assess the accuracy of the number of fruit and
vegetable servings reported in the staging algorithm section of the survey. Second, the
self-reported data was used to determine if PPC were serving adequate amounts of fruit
and vegetable when compared to the 2005 Dietary Guidelines recommendations for fruit
and vegetable based on a 1200 calorie diet. Third, it was used to identify differences
between stages in the amount of fruit and vegetable made available to children by their
PPC.
Fruit and vegetable were divided into eight sub-groups including 100% juice,
whole fruit, lettuce salad, starchy vegetables, dark green vegetables, orange vegetables,

46
tomatoes or salsa, and other vegetables. Legumes were not included because they were a
food item already widely available to the target population through the WIC
supplemental food package. Subjects were asked to select from seven frequency choices
to indicate how often each sub-group of fruit and vegetable was served. Response
choices ranged from never to two or more times a day. If the foods were served, subjects
were asked for “how much was usually served to your one to five year old.” Three
serving size response options included small, medium and large. Medium serving sizes
were consistent with standard amounts referenced in the Dietary Guidelines (USDHHS &
USDA, 2005). Visual aids were available as references to assist subjects with
determining serving sizes.
For the purpose of statistical analysis and determining if adequate amounts of
vegetables were being made available, the categories of salad, tomato/salsa and other
vegetables were combined and referred to as total vegetables. To evaluate availability of
fruit and vegetable by demographic characteristic, juice and whole fruit were combined
and referred to as total fruit. Adequate amounts of vegetable sub-groups were defined by
dividing the weekly recommended servings of each group (USDHHS & USDA, 2005) by
seven days to determine the daily recommendation. This procedure was consistent with
that used by Guenther et al. (2006) in determining the proportions of the American
population meeting the recommended amounts of fruit and vegetable.
Statistical Analysis
Analyses were performed using SPSS 14.0 for Windows. Frequencies of all
variables were run to detect questionable data, which were ascertained to be either entry

47
errors and were corrected, or verified as correct. Descriptive analysis defined the survey
population’s demographic characteristics and the proportion of subjects in each stage of
change. A paired t-test was used to examine the relationship between fruit and vegetable
servings reported for staging and the servings reported by the FVFQ. Using the
demographic characteristics of geographical local, employment status and educational
level as independent variables, one-way analyses of variance (ANOVA) were used to test
for differences in the number of fruit and vegetable servings. The decisional balance con
and pro item scores were summed to achieve pro and con scales, and converted to T-
scores. The scores of the five self-efficacy items were summed to achieve a self-efficacy
scale. One-way analyses of variance were used to identify differences among stages for
the decisional balance and self-efficacy scales, as well as the scores for the individual
decisional balance and self-efficacy items. Cronbach’s Alpha was used to measure the
internal reliability of the items measuring decisional balance and self efficacy.
Multivariate analysis of variance (MANOVA) was conducted to evaluate differences
among stages of change on the use of the processes of change. When appropriate, Tukey
HSD post hoc tests were used to identify pair-wise significance between stages.
Discriminate function analyses were conducted to clarify interpretation of the major
dimensions of the self-efficacy and processes of change constructs. The significance
level for all analyses was set at P < 0.05.

48
CHAPTER IV
FINDINGS
A total of 274 of 330 (83 percent) surveys were returned, of which 238 (86.9
percent) were complete and eligible for analysis. Nineteen (6.9 percent) of the returned
surveys did not meet inclusion criteria, fifteen (5.5 percent) were incomplete responses,
and two (0.7 percent) indicated they were duplicate responses.
Demographics
Demographic characteristics of the study participants are summarized in Table 4.1
(page 49). Females represented 97.1 percent of the eligible respondents. The average
age of the respondents was twenty-seven years, ranging from eighteen to sixty-one years.
All eligible subjects were the parent or primary caregiver (PPC) of a child one to five
years of age and enrolled in a federal nutrition education assistance program, thus
meeting the low-income inclusion criteria. About 52 percent were participants in the
Special Supplemental Nutrition Program for Women, Infants and Children (WIC)
program, 3.4 percent participated in Expanded Food and Nutrition Education Program
(EFNEP), 14.7 percent participated in the Oklahoma Nutrition Education (ONE), and
almost 30 percent participated in a combination of WIC and either EFNEP or ONE.
Average length of participation in WIC was three years, two months. Length of

49
Table 4.1 Demographic characteristics of low-income parents/caregivers. n = 238. Demographic Characteristic n % Mean ± SD Gender Female 231 97.1 Male 7 2.9 Age Mean age in years 238 100.0 27.6 ± 7.7 years Nutrition Education* WIC 124 52.1 38.4 ± 27.7 months WIC & EFNEP 53 22.3 ONE 35 14.7 3.3 ± 2.3 months WIC & ONE 18 7.6 EFNEP 8 3.4 3.7 ± 2.8 months Residential Locale Rural 133 55.9 Urban 105 44.1 Race/Ethnicity White 130 54.6 Black or African American 51 21.4 American/Alaskan Indian 30 12.6 Hispanic 24 10.1 Asian or Pacific Islander 3 1.3 Education High school or GED 119 50.0 Some college or college graduate 65 27.3 Less than high school 51 21.4 Non-response for item 3 1.3 Employment Do not work outside the home 132 55.5 Full time (32 hours or more/week) 65 27.3 Part time (Less than 32 hours/week) 37 15.5 Non-response for item 4 1.7
*WIC – Special Supplemental Nutrition Program for Women, Infants and Children EFNEP – Expanded Food and Nutrition Education Program FSNE – Food Stamp Nutrition Education participation in EFNEP and ONE was 3.7 and 3.3 months, respectively. Slightly more
than half of the subjects, 55.9 percent, resided in rural areas of the state with the balance,
44.1 percent, residing in the urban regions. Race and ethnic groups were
disproportionably represented in the sample, but the percentages were compared to and
found to be reflective of statewide participation in the federal food stamp assistance

50
program (Oklahoma State Department of Human Services [OSDHS], 2006). Over half of
the subjects, 54.6 percent, were white, 21.4 percent were African American, 12.6 percent
were American or Alaskan Indian, 10.1 percent reported Hispanic ethnicity, and 1.3
percent were Asian or Pacific Islander. Fifty percent had a high school education or
General Equivalency Diploma (GED), 21.4 percent reported less than a high school
education, and 27.3 percent reported having some college or being a college graduate.
The majority of subjects, 55.5 percent, reported not working outside of the home while
15.5 percent worked part time and 27.3 percent reported working full time.
Staging of Subjects
Use of the two-stage algorithm to categorize subjects into five stages of change
placed 24 subjects (10 percent) in the precontemplation stage, 78 subjects (33 percent) in
contemplation, 69 subjects (29 percent) in preparation, 8 subjects (3 percent) in action,
and 59 subjects (25 percent) in the maintenance stage. Table 4.2 (below) summarizes the
results of the staging algorithm.
Table 4.2 Results of staging algorithm. Stage of Change n % Precontemplation 24 10 Contemplation 78 33 Preparation 69 29 Action 8 3 Maintenance 59 25 Total 238 100
To achieve a more equal distribution of groups for statistical analysis and to better
reflect the stages of the target population, the precontemplation and contemplation stages

51
and action and maintenance stages were collapsed to form three stages of change,
consisting of precontemplation/contemplation, hereafter referred to as preaction;
preparation; and action/maintenance, hereafter referred to as action. This move is
supported by work conducted by Ma, Betts and Horacek (2001), who examined the
appropriateness of the theoretical five-stages for use in dietary behaviors, specifically
fruit and vegetable consumption. Their findings suggested that a three-stage pattern may
be more representative of the temporal process for changing fruit and vegetable dietary
patterns.
In summary, low-income PPCs were in different stages of change for increasing
availability (as measured by number of servings served) of fruit and vegetable to their
pre-school age children. The majority of parents (72 percent) surveyed reported serving
less than five servings of fruit and vegetable daily. Of these, almost two thirds (62
percent) reported intention to serve more fruit and vegetable within the next month to six
months. Slightly more than one-fourth (27 percent) of the total respondents reported
serving five or more servings of fruit and vegetable to their preschool age children, with
25 percent of the total having done so for six months or longer.
Fruit and Vegetable Availability
Availability and accessibility of fruit and vegetable were measured by the number
of servings served by PPC to their pre-school age children as reported in the fruit and
vegetable frequency questionnaire (FVFQ). The survey used two measures to determine
the number of servings. The first was the staging algorithm asking for the number of
fruit and vegetable servings PPC served to their family each day. The second was an
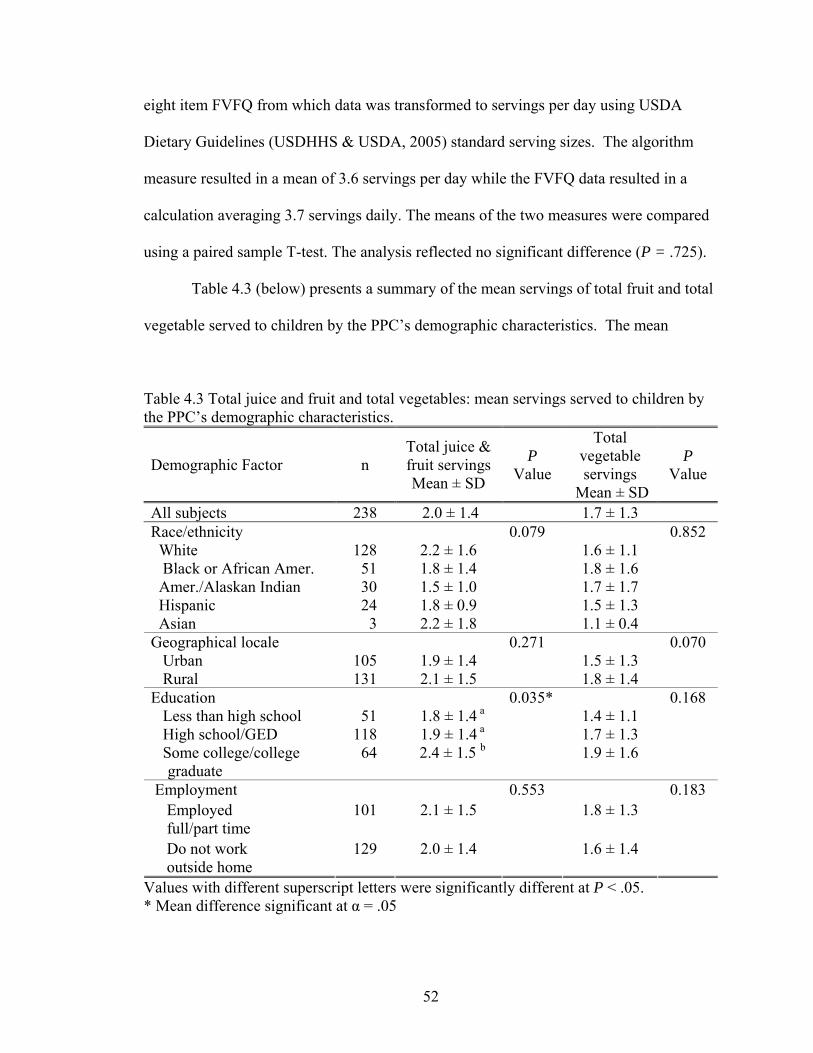
52
eight item FVFQ from which data was transformed to servings per day using USDA
Dietary Guidelines (USDHHS & USDA, 2005) standard serving sizes. The algorithm
measure resulted in a mean of 3.6 servings per day while the FVFQ data resulted in a
calculation averaging 3.7 servings daily. The means of the two measures were compared
using a paired sample T-test. The analysis reflected no significant difference (P = .725).
Table 4.3 (below) presents a summary of the mean servings of total fruit and total
vegetable served to children by the PPC’s demographic characteristics. The mean
Table 4.3 Total juice and fruit and total vegetables: mean servings served to children by the PPC’s demographic characteristics.
Demographic Factor n Total juice & fruit servings Mean ± SD
P Value
Total vegetable servings
Mean ± SD
P Value
All subjects 238 2.0 ± 1.4 1.7 ± 1.3 Race/ethnicity 0.852 White 128 2.2 ± 1.6 1.6 ± 1.1 Black or African Amer. 51 1.8 ± 1.4 1.8 ± 1.6 Amer./Alaskan Indian 30 1.5 ± 1.0 1.7 ± 1.7 Hispanic 24 1.8 ± 0.9 1.5 ± 1.3 Asian 3 2.2 ± 1.8
0.079
1.1 ± 0.4
Geographical locale Urban 105 1.9 ± 1.4 1.5 ± 1.3 Rural 131 2.1 ± 1.5
0.271
1.8 ± 1.4
0.070
Education 0.168 Less than high school 51 1.8 ± 1.4 a 1.4 ± 1.1 High school/GED 118 1.9 ± 1.4 a 1.7 ± 1.3 Some college/college
graduate 64 2.4 ± 1.5 b
0.035*
1.9 ± 1.6
Employment 0.183 Employed full/part time
101 2.1 ± 1.5 1.8 ± 1.3
Do not work outside home
129 2.0 ± 1.4
0.553
1.6 ± 1.4
Values with different superscript letters were significantly different at P < .05. * Mean difference significant at α = .05

53
number of servings of total fruit served to children was 2.0 servings and the mean of total
vegetables served was 1.7 servings, totaling an average of 3.7 servings of fruit and
vegetable available to low-income preschool age children per day. There were no
significant differences among PPC of different race/ethnicity and the amount of fruit and
vegetable they served their children. Parents in rural areas served slightly more fruit and
vegetable when compared to those living in urban residences, but the differences were
not significant. PPC who were employed full or part-time served slightly more fruit and
vegetable, but not significantly more, than PPC who did not work outside the home. PPC
who were college graduates or had some college education served significantly more total
fruit (P = .035) each day when compared to PPC with lower levels of education. Further
investigation revealed servings of whole fruit, rather than juice, accounted for the
significant variance. PPC who had graduated from college or had some college credit
served 1.2 servings whole fruit daily compared to PPC with a high school or less
education who were serving 0.7 serving whole fruit daily (P = .003).
Just as demographic characteristics, with the exception of education, did not
account for significant differences in availability of fruit and vegetable; neither were they
associated with the stage of change. Using race, geographical location, education and
employment as fixed factors and stage of change as the dependent variable, the analyses
of variance did not reveal any significant differences between categories within each
demographic characteristic.
Evaluation of fruit and vegetable availability by stage of change was conducted
for total fruit and vegetable, as well as the separate items of juice, whole fruit and
vegetable sub-groups as identified in the USDA Dietary Guidelines for Americans

54
(USDHHS & USDA, 2005). The vegetable survey items of lettuce salad, tomatoes/salsa
and other vegetables were combined and referred to as other vegetables, resulting in four
vegetable sub-groups; dark-green, orange, starchy and other. To determine if the
amounts of fruit and vegetable available to children were adequate, the numbers of
servings reported in the FVFQ were compared to the 2005 Dietary Guideline
recommendations for a 1200 calorie diet (USDHHS & USDA, 2005). This is the calorie
level for moderately active (30 to 60 minutes physical activity/day), children aged two to
three years, which represents the middle of the age range in our study’s population of
interest. Table 4.4 (page 55) summarizes the servings of juice, whole fruit and vegetable
served to children by the PPC’s stage of change.
There were significant differences among the stages for the total amount of fruit
and vegetable available to children. The average amount served by PPC in all stages was
3.7 servings, which was 1 serving less than the recommendation of 4.7 servings,
excluding legumes (USDHHS & USDA, 2005). PPC in the preaction stage were serving
3 servings daily, which was significantly less (P < .001) than the number of servings
served by PPC in the preparation and action stages of 4.1 and 4.3 servings, respectively.
The average amount of total fruit served by PPCs in all stages was 2.0 servings
which met the USDA recommendation of 2 servings per day (USDHHS & USDA, 2005).
However, there were significant differences among the stages for the number of total fruit
servings (P < .001). PPC in the preaction stage served 1.5 serving which was
significantly less (P = .013) than PPC in preparation and action stages, who were serving
2.2 and 2.4 servings, respectively. The difference in availability of total fruit was due to
whole fruit servings rather than 100% juice. Figure 4.1 (page 56) illustrates the

55
Table 4.4 Fruit and vegetable sub-groups: mean servings by stage of change.
Food Item Stage of Change n
Mean Servings
± SD
P Value
Between stages
Rec. Servings
/Day/ 1200
calories Preaction 100 3.0 ± 2.0 a Preparation 69 4.1 ± 2.7 b Action 65 4.3 ± 2.2 b
Total fruit & vegetable (excluding legumes)
Total 234 3.7 ± 2.3
0.001*
4.7 Preaction 100 1.5 ± 1.2 a Preparation 69 2.2 ± 1.6 b Action 65 2.4 ± 1.4 b
Total fruit
Total 234 2.0 ± 1.4
0.001*
2.0 Preaction 100 0.9 ± 0.9 Preparation 69 1.2 ± 1.0 Action 65 1.2 ± 0.9
100% juice
Total 234 1.1 ± 0.9
0.102
Preaction 100 0.6 ± 0.6 a Preparation 69 1.0 ± 0.8 b Action 65 1.2 ± 0.8 b
Whole fruit
Total 234 0.9 ± 0.8
0.001*
Preaction 100 1.4 ± 1.2 a Preparation 69 1.9 ± 1.5 b Action 65 1.8 ± 1.2 ab
Total vegetables (excluding legumes)
Total 234 1.7 ± 1.3
0.036*
2.7 Preaction 100 0.5 ± 0.6 Preparation 69 0.5 ± 0.4 Action 65 0.5 ± 0.5
Starchy vegetables
Total 234 0.5 ± 0.5
0.880
0.7 Preaction 100 0.2 ± 0.4 a Preparation 69 0.4 ± 0.4 ab Action 65 0.5 ± 0.5 b
Dark green vegetables
Total 234 0.3 ± 0.4
0.006*
0.4 Preaction 100 0.2 ± 0.2 Preparation 69 0.2 ± 0.3 Action 65 0.3 ± 0.3
Orange vegetables
Total 234 0.2 ± 0.3
0.149
0.3 Preaction 100 0.5 ± 0.5 a Preparation 69 0.8 ± 1.0 b Action 65 0.6 ± 0.5 ab
Other vegetables
Total 234 0.6 ± 0.7
0.005*
1.3 Values with different superscript letters were significantly different at P < .05. * Mean difference significant at α = .05

56
Figure 4.1 Fruit and vegetable servings: mean number of servings served to preschool age children by stage of change.
differences in 100% juice and whole fruit availability by stage of change. PPC in all
groups were serving appropriate amounts of juice (AAP, 2001) and there was no
significant difference between groups (P = .102). In contrast, PPC in the preparation and
action stages served almost twice the amount of whole fruit as PPC in the preaction
stage, resulting in a significant difference between stages (P < .001).
Average vegetable availability was measured at 1.4 servings for PPCs in the
preaction stage, increased to 1.9 servings in the preparation stage, and dropped slightly to
1.8 servings in the action stage. The differences between the stages was significant (P =
actionpreparationpreaction
Stages of Change
1.20
1.00
0.80
0.60
0.40
0.20
0.00
Mea
n
other vegetable servings/day
orange vegetable servings/day
dark green vegetable servings/day
starchy vegetable servings/day
fruit servings/day juice servings/day

57
.036), with the significant difference being between the preaction and preparation stages
(P = .045). None of the average servings of fruit and vegetable served by PPCs in each
of the stages met the recommendation of 2.7 servings (legumes excluded) (USDHHS &
USDA, 2005).
Figure 4.1 (page 56) illustrates the vegetable sub-group servings by stage of
change. The other vegetable sub-group accounted for the drop in availability of total
vegetables between the preparation and action groups from 0.8 servings to 0.6 servings,
respectively. While this difference was not significant, PPC in the preparation stage
served significantly more (P = .004) other vegetables than PPC in the preaction stage,
who were serving an average of 0.5 serving daily. The average number of other
vegetable servings served by PPCs in each stage fell below the recommended amount of
1.3 servings per day (USDHHS & USDA, 2005).
There were significant differences between the stages (P = 0.006) in the
availability of dark-green vegetables, with the significance being between preaction and
action stages (P = 0.006). PPCs in the preaction stage served an average of 0.2 serving
daily compared to the preparation and action stages who were serving an average of 0.4
and 0.5 serving, respectively. PPCs in the preparation and action stages were serving
sufficient amounts of dark green vegetables to meet the recommendation of 0.4 serving
daily (USDHHS & USDA, 2005).
There were no significant differences between the stages in the amount of starchy
and orange vegetables being made available. The number of servings of starchy
vegetables was constant across stages at 0.5 serving each day, which was less than the
recommended daily amount of 0.7 serving (USDHHS & USDA, 2005). There was an

58
insignificant but small increase in availability of orange vegetables across the stages.
PPC in the preaction and preparation stages were short a slight 0.1 serving of the 0.3
recommendation, while PPC in the action stage were serving the recommended number
of daily servings.
In summary, preschool age children of PPC in preparation and action stages had
significantly greater availability and accessibility of fruit and vegetable than children of
PPC in preaction stages. The findings result in a statistical decision to fail to accept the
second objective’s null hypothesis in favor of the alternate. When fruit and vegetable
items were evaluated separately, whole fruit, dark green vegetables and other vegetables
accounted for the variance in availability.
Decisional Balance
Decisional balance was measured using six items. Three items measured negative
aspects, or cons, of serving more fruit and vegetable; and three measured the positive
aspects, referred to as pros, of serving fruit and vegetable. The lower the score the less
importance the item had in the PPC’s decision to serve fruit and vegetable. The
Cronbach’s Alpha coefficient for the con scale items was r = 0.69, and r = 0.86 for the
pro scale items.
Decisional balance con and pro item scores were converted to T-scores, and each
set was averaged to derive the respective pro and con scales. Results are reported in
Table 4.5 (page 59). PPC in the preaction stage had a higher T-score for the con scale
when compared to the pro scale, while the reverse was true for PPC in the preparation
and action stages. The point at which the pro scale score surpassed the con scale score

59
Table 4.5 Decisional balance scales: mean scores by stage of change. Decisional Balance Scales
Stage of Change n Mean T-Scores
± SD P Value
Con Scales Preaction 102 51.9 ± 9.7 .037* Preparation 69 48.8 ± 9.7 Action 67 48.3 ± 10.4 Total 238 50.0 ± 10.0 Pro Scales Preaction 102 48.2 ± 9.8 .061 Preparation 69 51.3 ± 9.3 Action 67 51.3 ± 10.1 Total 238 50.0 ± 10.0
Scale: 1 = not important; 2 = slightly important; 3 = somewhat important; 4 = very important; 5 = extremely important Values with different superscript letters were significantly different at P < .05. * Mean difference significant at α = .05
occurred prior to the preparation stage. This reversal of scores is illustrated in Figure 4.2
(page 60).
Using stage of change as the fixed variable and the con and pro scale T-scores
as dependent variables, an analysis of variance resulted in a small but significant
difference between stages for the con scales (P = 0.037), but not for the pro scale
(P = 0.061). For the con scale, the preaction stage had a decisional balance mean score
of 51.9 compared to preparation and action mean scores of 48.8 and 48.3, respectively. A
Tukey post hoc test resulted in no significant differences between any two stages for the
con variable.
To further investigate the negative and positive items influencing decisional
balance for serving fruit and vegetable, the con and pro items were evaluated using one-
way analyses of variance. The results are reported in Table 4.6 (page 61). The three con
items measured factors related to time and expense associated with purchasing and
preparing fruit and vegetable. As with the con scale, mean scores for each con item
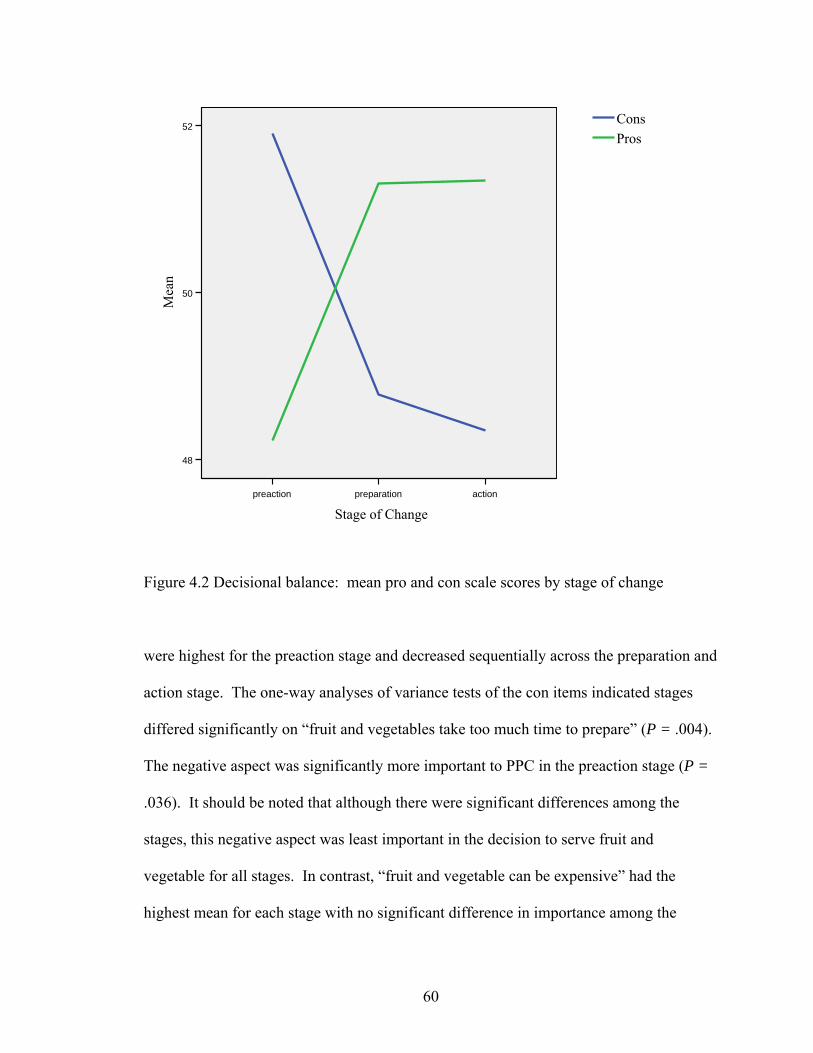
60
Figure 4.2 Decisional balance: mean pro and con scale scores by stage of change
were highest for the preaction stage and decreased sequentially across the preparation and
action stage. The one-way analyses of variance tests of the con items indicated stages
differed significantly on “fruit and vegetables take too much time to prepare” (P = .004).
The negative aspect was significantly more important to PPC in the preaction stage (P =
.036). It should be noted that although there were significant differences among the
stages, this negative aspect was least important in the decision to serve fruit and vegetable for all stages. In contrast, “fruit and vegetable can be expensive” had the highest mean for each stage with no significant difference in importance among the
actionpreparationpreaction
Stage of Change
52
50
48
Mea
n
ProsCons
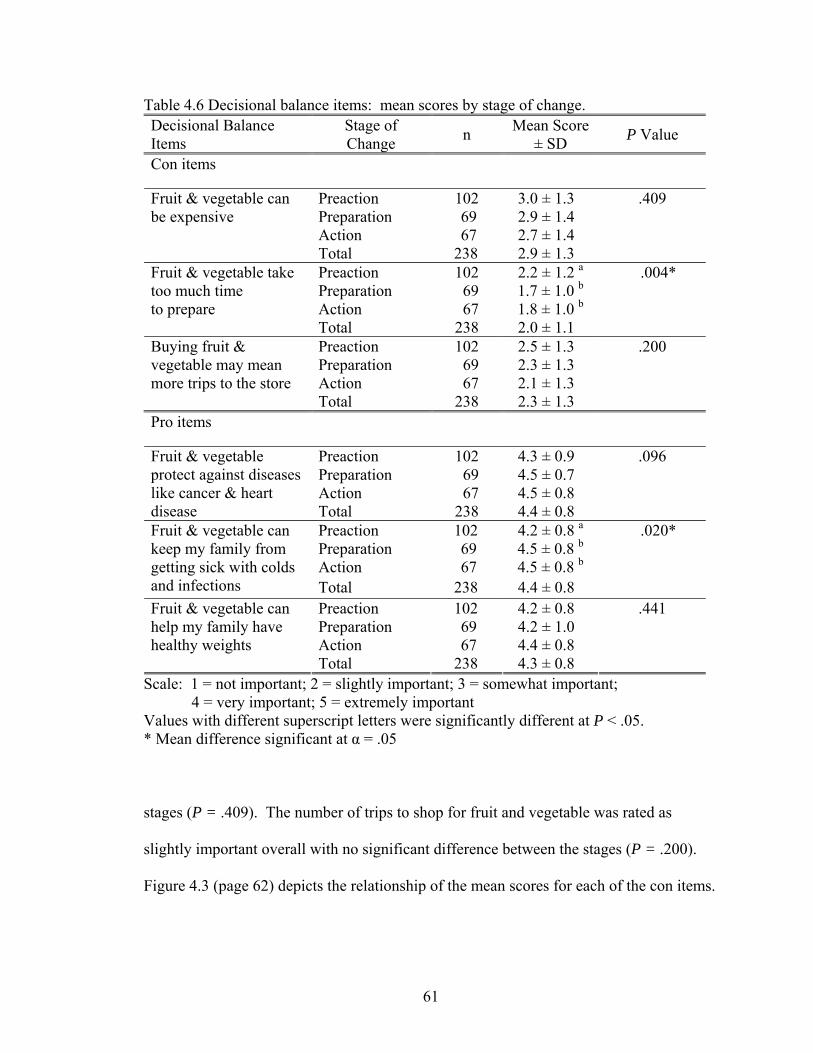
61
Table 4.6 Decisional balance items: mean scores by stage of change. Decisional Balance Items
Stage of Change n Mean Score
± SD P Value
Con items
Preaction 102 3.0 ± 1.3 Preparation 69 2.9 ± 1.4 Action 67 2.7 ± 1.4
Fruit & vegetable can be expensive
Total 238 2.9 ± 1.3
.409
Preaction 102 2.2 ± 1.2 a Preparation 69 1.7 ± 1.0 b Action 67 1.8 ± 1.0 b
Fruit & vegetable take too much time to prepare
Total 238 2.0 ± 1.1
.004*
Preaction 102 2.5 ± 1.3 Preparation 69 2.3 ± 1.3 Action 67 2.1 ± 1.3
Buying fruit & vegetable may mean more trips to the store
Total 238 2.3 ± 1.3
.200
Pro items
Preaction 102 4.3 ± 0.9 Preparation 69 4.5 ± 0.7 Action 67 4.5 ± 0.8
Fruit & vegetable protect against diseases like cancer & heart disease Total 238 4.4 ± 0.8
.096
Preaction 102 4.2 ± 0.8 a Preparation 69 4.5 ± 0.8 b Action 67 4.5 ± 0.8 b
Fruit & vegetable can keep my family from getting sick with colds and infections Total 238 4.4 ± 0.8
.020*
Preaction 102 4.2 ± 0.8 Preparation 69 4.2 ± 1.0 Action 67 4.4 ± 0.8
Fruit & vegetable can help my family have healthy weights
Total 238 4.3 ± 0.8
.441
Scale: 1 = not important; 2 = slightly important; 3 = somewhat important; 4 = very important; 5 = extremely important Values with different superscript letters were significantly different at P < .05. * Mean difference significant at α = .05
stages (P = .409). The number of trips to shop for fruit and vegetable was rated as
slightly important overall with no significant difference between the stages (P = .200).
Figure 4.3 (page 62) depicts the relationship of the mean scores for each of the con items.

62
Figure 4.3 Decisional balance: mean con item scores by stage of change. Scale: 1 = not important; 2 = slightly important; 3 = somewhat important;
4 = very important; 5 = extremely important
The pro items measured acute and chronic health prevention benefits and ability
of fruit and vegetable to maintain healthy weights. Figure 4.4 (page 63) illustrates the
mean scores by stage for the pro items. Each of the stages had similar scores for
the three items, and all were very important in the PPC’s decision to make fruit and
vegetable available to their children. In contrast to the con items, pro item means were
lowest for the preaction stage and increased slightly across the stages. The one-way
analyses of variance of the pro items revealed a small but significant increase (P =.020)
actionpreparationpreaction
Stages of Change
5
4.5
4
3.5
3
2.5
2
1.5
1
Mea
n
fruits and vegs may mean more trips to the store
fruits and vegs take too much time to prepare
fruits and vegs can be expensive

63
Figure 4.4 Decisional balance: mean pro item scores by stage of change. Scale: 1 = not important; 2 = slightly important; 3 = somewhat important; 4 = very important; 5 = extremely important
in the importance of “fruit and vegetable can keep my family from getting sick with colds
and infections.” The importance was greater for PPC in the preparation stage when
compared to PPC in the preaction stage (P = .036), but not when compared to the action
stage.
In summary, there were small but significant differences among PPC in the stages
of change for decisional balance related to increasing fruit and vegetable availability to
their preschool age children. The findings result in a statistical decision to fail to accept
the third objective’s null hypothesis in favor of the alternate. Specifically, the negative
actionpreparationpreaction
Stages of Change
5
4.5
4
3.5
3
2.5
2
1.5
1
Mea
n
fruits and vegs can help maintain healthy weight
fruits and vegs can keep family from getting sick with colds and infections
fruits and vegs protect against diseases like cancer and heart disease

64
aspects associated with making fruit and vegetable available accounted for the
differences. The negative item that differentiated PPC in the preaction stage from PPC in
the preparation and action stages was time related to preparing fruit and vegetable.
Furthermore, the negative aspects were more important to PPC in the preaction stage,
while the positive aspects of serving fruit and vegetable were more important to PPC in
the preparation and action stages.
Self-Efficacy
The theoretical construct of self-efficacy was measured using a series of five
items. The Cronbach Alpha coefficient for the items was measured at r = 0.80. When the
item scores were summed and averaged, self-efficacy was lowest for the preaction stage
and increased significantly as intent to serve fruit and vegetable increased (P < .001).
Table 4.7 (page 65) summarizes the changes for both overall self-efficacy and the mean
scores for the individual items measuring the construct.
A review of the scores for the individual items revealed PPC were confident in
serving meals at home and in preparing tasty, easy recipes using fruit and vegetable,
with confidence increasing from preaction to action. Self-efficacy was lower when meals
were eaten away from home, money was insufficient to purchase food and time was
limited. Specific to stage, PPC in the preaction and preparation stages had the lowest
confidence in their ability to serve fruit and vegetable when money was low for buying
food; while PPC in the action stage had the least confidence for serving fruit and
vegetable when eating meals away from home. These relationships are illustrated in
Figure 4.5 (page 66).

65
Table 4.7 Self-efficacy items: mean scores by stage of change. Self-Efficacy Scale & Items
Stage of Change n Mean Score ± SD P Value*
Preaction 102 2.6 ± 0.6 a Preparation 69 2.8 ± 0.6 b Action 67 3.1 ± 0.6 c
Self-Efficacy Scale
Total 238 2.8 ± 0.6
.001*
Preaction 102 3.0 ± 0.8 a Preparation 69 3.3 ± 0.8 b Action 67 3.5 ± 0.6 b
Serving fruit & vegetable when preparing meals at home
Total 238 3.2 ± 0.7
.001*
Preaction 102 2.4 ± 0.8 Preparation 69 2.6 ± 0.9 Action 67 2.7 ± 0.9
Serving fruit & vegetable when eating meals away from home
Total 238 2.5 ± 0.9
.070
Preaction 102 2.8 ± 0.9 a Preparation 69 3.1 ± 0.9 b Action 67 3.4 ± 0.7 b
Preparing tasty, easy recipes using fruit & vegetable
Total 238 3.0 ± 0.8
.001*
Preaction 102 2.4 ± 0.9 a Preparation 69 2.4 ± 0.8 a Action 67 2.9 ± 0.9 b
Serving fruit & vegetable when low on money for buying food
Total 238 2.5 ± 0.9
.001*
Preaction 102 2.5 ± 0.9 a Preparation 69 2.8 ± 0.8 b Action 67 3.0 ± 0.7 b
Serving fruit & vegetable when not enough time to prepare fruit & vegetable Total 238 2.7 ± 0.8
.001*
Scale: 1 = not at all confident; 2 = somewhat confident; 3 = confident; 4 = very confident Values with different superscript letters were significantly different at P < .05. * Mean difference significant at α = .05
The one-way analyses of variance resulted in significant differences in four of the
five items (P < 0.001); with the item reflecting non-significant differences being “serving
fruit and vegetable when eating meals away from home.” Of the four with
significant differences, PPC in preparation and action stages were significantly more
confident than preaction PPC when preparing meals at home; preparing tasty, easy

66
actionpreparationpreaction
Stages of Change
4
3.5
3
2.5
2
1.5
1
Mea
n
serving fruit & veg when not enough time to prepare fruit & veg
serving fruit & veg when low on money for buying food
preparing tasty, easy recipes using fruit & veg
serving fruit & veg when eating meals away from home
serving fruit & veg when preparing meals at home
Figure 4.5 Self-efficacy: mean item scores by stage of change Scale: 1 = not at all confident; 2 = somewhat confident; 3 = confident; 4 = very confident
recipes using fruit and vegetable; and when time was limited. For the item measuring
confidence in “serving fruit and vegetable when low on money for buying food”, PPC in
the preparation stage had confidence levels more like PPC in the preaction stage rather
than the action stage.
A discriminate function analysis of the items resulted in two extracted functions,
with the first accounting for 90.8 percent of the variance between groups. The item with
the highest correlation (r = .841) with the function and best defining the differences in
self-efficacy between the stages was confidence in preparing tasty, easy recipes using

67
fruit and vegetable. An analysis of variance using the discriminate function score as the
dependent variable resulted in significant differences between each combination of stages
(P = .013).
In summary, there were significant differences among PPC in the stages
of change for self-efficacy in serving fruit and vegetable to their preschool age children in
a variety of situations. Confidence in preparing easy and tasty recipes best described
differences between PPC in each of the stages. The findings result in a statistical
decision to fail to accept the fourth objective’s null hypothesis in favor of the alternate.
Specific to individual self-efficacy items, PPC in the preparation and action stages had
more self-efficacy than PPC in the preaction stage. An exception was when money was
low to buy food, and then PPC in preparation stage had self-efficacy levels similar to the
preaction rather than action stage.
Processes of Change
Table 4.8 and Table 4.9 (pages 68 and 69) report the mean scores by stage of
change for each of the thirteen items used to measure the use of experiential and
behavioral processes of change evaluated in our study. The use of the experiential
processes of reevaluation and social liberation and the behavioral processes of stimulus
control and countering were measured using two items each. Use of all processes
increased across the stages with one exception; the experiential process of reevaluation,
defined as self-image and measured by “feeling bad for not serving enough fruit and
vegetable.” The process was used “sometimes” by PPC in the preaction stage and
declined in use as stage advanced and more fruit and vegetable were served.

68
Table 4.8 Experiential processes of change: mean scores for frequency of use by stage of change.
Experiential Processes of Change
Stage of Change n Mean Score
± SD P Value
Preaction 102 2.8 ± 1.0 a Preparation 69 3.6 ± 1.2 b Action 67 3.5 ± 1.0 b
Consciousness Raising (self motivation-look for tips on adding fruit & vegetable to meals) Total 238 3.1 ± 1.1
.001*
Preaction 102 3.4 ± 1.0 Preparation 69 3.6 ± 1.2 Action 67 3.8 ± 0.9
Social Liberation (changing availability-notice grocery stores have more ready-to-eat fruit & vegetable)
Total 238 3.6 ± 1.1
.054
Preaction 102 2.9 ± 1.0 a Preparation 69 3.1 ± 1.2 ab Action 67 3.5 ± 1.1 b
Social Liberation (changing availability- notice more healthy vegetables at places where family eats out)
Total 238 3.1 ± 1.1
.001*
Preaction 102 3.6 ± 0.9 a Preparation 69 3.9 ± 1.0 b Action 67 4.0 ± 0.8 b
Reevaluation (role modeling-eat fruit & vegetable because it sets a good example for children)
Total 238 3.8 ± 1.0
.002*
Preaction 102 3.6 ± 1.0 a Preparation 69 3.9 ± 1.1 ab Action 67 4.0 ± 0.9 b
Emotional Arousal (health outcomes-think if family ate more fruit & vegetable they would have fewer health problems)
Total 238 3.8 ± 1.0
.022*
Preaction 102 3.3 ± 1.0 Preparation 69 3.0 ± 0.9 Action 67 3.0 ± 1.2
Reevaluation (self image-feel bad when you realize you were not serving your family enough fruit & vegetable)
Total 238 3.1 ± 1.1
.173
Preaction 102 3.2 ± 0.9 a Preparation 69 3.7 ± 0.9 b Action 66 3.7 ± 0.9 b
Commitment (self motivation-serve more fruit & vegetable because your have decided that you would)
Total 237 3.5 ± 0.9
.002*
Scale: 1 = not at all; 2 = hardly ever; 3 = sometimes; 4 = often; 5 = all the time Values with different superscript letters were significantly different at P < .05. * Mean difference significant at α = .05

69
Table 4.9 Behavioral processes of change: mean scores for frequency of use by stage of change.
Behavioral Processes of Change
Stage of Change n Mean Score
± SD P Value
Preaction 102 3.5 ± 1.0 a Preparation 69 3.8 ± 0.8 b Action 67 4.2 ± 0.7 b
Countering** (sub snacks-choose to serve fruit & vegetable for snacks instead of junk foods)
Total 238 3.8 ± 0.9
.001*
Preaction 102 3.1 ± 1.1 a Preparation 69 3.1 ± 1.2 a Action 67 3.8 ± 1.0 b
Stimulus Control (sub snacks-leave a bowl of fruit out for snacks) Total 238 3.3 ± 1.1
.001*
Preaction 102 2.6 ± 1.1 a Preparation 69 2.7 ± 1.2 ab Action 67 3.2 ± 1.1 b
Helping Relations (social support-talk to other people about serving your family more fruit & vegetable)
Total 238 2.8 ± 1.1
.002*
Preaction 102 2.6 ± 1.2 a Preparation 69 3.1 ± 1.1 b Action 67 3.4 ± 1.2 b
Stimulus Control (planning-give yourself a reminder to serve two vegetables with main meals)
Total 238 3.0 ± 1.2
.001*
Preaction 102 3.1 ± 1.0 a Preparation 69 3.3 ± 0.9 a Action 67 3.7 ± 0.9 b
Countering (sub snacks-serve fruit instead of sweets for dessert) Total 238 3.3 ± 1.0
.001*
Preaction 102 3.2 ± 1.1 a Preparation 69 3.6 ± 1.2 b Action 67 4.0 ± 1.0 b
Rewards (social support-feel pleased when other people said you were being a good parent or caregiver because you served family fruit & vegetable)
Total 238 3.5 ± 1.2
.001*
Scale: 1 = not at all; 2 = hardly ever; 3 = sometimes; 4 = often; 5 = all the time Values with different superscript letters were significantly different at P < .05. * Mean difference significant at α = .05 ** Best defines differences in stages

70
PPCs in the preaction and preparation stages used two experiential processes most frequently; emotional arousal, defined as health outcomes; and reevaluation, defined as
role modeling. PPCs in the action stage used the behavioral process of countering,
defined as substituting fruit and vegetable for snacks, most frequently. The process used
least often was helping relationships, which was used “hardly ever” by PPCs in the
preaction and preparation stages and “sometimes” by PPCs in the action stage.
The differences in use of processes were significant as tested by an omnibus
multivariate analysis of variance (P < .001). The Cronbach’s alpha coefficient for the
processes was r = 0.88. The univariate analyses of variance reflected use of each process
was significantly different among stages with the exception of two; social liberation
defined as noticing changing availability in grocery stores (P = .054), and reevaluation
defined as self image or feeling bad when not serving enough fruit and vegetable (P =
.173). Three experiential processes and three behavioral processes were used
significantly more often by PPC in the preparation stage compared to the preaction stage.
The experiential processes included consciousness raising accomplished by looking for
tips to add fruit and vegetable to meals; reevaluation accomplished by role modeling the
eating of fruit and vegetable to set a good example for children; and commitment to
serving more fruit and vegetable. The behavioral processes were countering defined as
substituting fruit for low-nutrient foods at snacks; stimulus control defined as planning
meals to include vegetables; and rewards defined as social support and praise. PPCs in
the action stage used all but two experiential processes significantly more frequently than
the preaction stage; and they used two behavioral processes, stimulus control and

71
countering, both associated with serving fruit instead of sweets for snacks and desserts,
significantly more often than PPCs in the preparation stage.
A discriminate function analysis was conducted to facilitate interpretation of the
use of processes that best differentiated the stages. Two functions were extracted, with
the first accounting for 75.9 percent of the variance between the stages. The second
function was not significant. The item having the highest correlation (r = .68) was the
behavioral process of countering by substituting fruit or vegetable for less nutritious
snacks. An analysis of variance using the function as the dependent variable revealed
significant differences (P < .001) between PPCs in each stage of change in the use of
behavioral processes; with PPCs in the action stage using behavioral processes most
frequently and use declining as intention to increase fruit and vegetable availability
decreased.
In summary, use of the processes of change increased significantly as stage
progressed and availability of fruit and vegetable increased, with use of behavioral
processes best differentiating the stages. PPC in the preparation and action stages used
both experiential and behavioral processes significantly more often than PPC in preaction
stages; while PPCs in the action stage used behavioral processes significantly more often
than PPCs in the preparation stage. The findings result in a statistical decision to fail to
accept the fifth objective’s null hypothesis in favor of the alternate. There are significant
differences between the stages of change in the use of processes by PPC for increasing
fruit and vegetable availability to preschool age children.

72
CHAPTER V
DISCUSSION, CONCLUSIONS AND IMPLICATIONS
In light of increased dietary intake recommendations and pending changes to
federal food assistance programs aimed at increasing fruit and vegetable consumption,
our interest was in determining the intent of low-income parents and caregivers of
preschool age children for increasing availability of fruit and vegetable, and identifying
differences between those who were serving more fruit and vegetable from those who
were not. We utilized the Transtheoretical Model (TTM) of Behavior Change constructs
to identify factors influencing stage of change including decisional balance, level of self-
efficacy, and processes utilized by PPC in different stages of change; and an eight item
fruit and vegetable frequency survey to determine the types and number of servings of
fruit and vegetable being served each day. Our findings lend evidence that low-income
PPC of preschool age children are indeed in different stages of change for increasing
availability of fruit and vegetable to their preschool age children. These differences are
not a manifestation of demographic characteristics but rather related to differences in
psychosocial factors as measured by TTM constructs.
The TTM constructs of decisional balance and self-efficacy are used as
measurements of a person’s movement toward making a behavior change, and serve as
dependent variables in interventions utilizing TTM (Prochaska, Norcross & DiClemente,

73
1994). The processes of change facilitate movement through the stages by supporting a
positive, cognitive shift in decisional balance and by increasing self-efficacy in
performing the behavior (Velicer et al, 2004). Our study supports that people who have a
positive decisional balance and higher levels of self-efficacy for making fruit and
vegetable available to their children employee a wider variety of experiential and
behavioral processes, are in higher stages of change and are serving more fruit and
vegetable to their children. For example, PPC in the preaction stage were making
available 2.9 servings of fruit and vegetable daily to their preschool age children. They
had a decisional balance weighted by the negative aspects related to the cost and time to
prepare fruit and vegetable. In addition, they had lower self-efficacy, compared to PPC
in the preparation and action stages, for preparing fruit and vegetable at home that their
families would eat. In contrast, PPC in the next higher stage of preparation were serving
an average of one additional serving (4.1 serving versus 2.9 servings) of fruit and
vegetable to their preschool age children each day. While cost, and to a lesser degree
time, were important to their decisions for serving fruit and vegetable, the health benefits
provided by these foods outweighed the negative aspects; thus providing for a shift in
decisional balance. PPC in the preparation stage also had higher self-efficacy than PPC
in the preaction stage, with the exception of when money was limited for purchasing
food. They used more processes of change, with the pivotal difference being their use of
the experiential process of commitment to serve more fruit and vegetable to their
children. With commitment their increased intent to serve more fruit and vegetable
became overt and was demonstrated by their more frequent use of behavioral processes.

74
PPC in the action stage were serving 4.2 servings of fruit and vegetable which
was less than our study’s criteria for performing the desired behavior of making available
five or more servings daily. However, as with PPC in the preparation stage, PPC in the
action stage had a positive decisional balance and were confident in their ability to
prepare tasty and easy fruit and vegetable their family would eat. In addition, they
frequently used of a wide variety of both experiential and behavioral processes. The
positive decisional balance, confidence, commitment and persistent behaviors of PPC in
the action stage to make the recommended amounts of fruit and vegetable available and
accessible to their children each day may have resulted in an overestimation of the
servings reported in the staging algorithm, thus providing an explanation for the
discrepancy between the action stage criteria of making available five or more servings of
fruit and vegetable each day to their children and the lesser amount of 4.2 servings
reported in the FVFQ. Despite this discrepancy, the attributes measured by TTM
constructs are useful in better understanding differences in the availability of fruit and
vegetable in low-income households.
Fruit and Vegetable Availability
Our findings revealed a relationship between increased availability of fruit and
vegetable to low-income, preschool age children and a positive decisional balance, higher
level of self-efficacy, and increased use of a wide repertoire of processes by their PPC.
This is evidenced in that PPC in the preparation and action stages were making
significantly more fruit and vegetable available than PPC in the preaction stage. Earlier
research has found that psychosocial factors and uses of fruit and vegetable influence

75
differently the decision to include or exclude the foods in snacks and meals (Trudeau,
Kristal, Li, & Patterson, 1998). Our findings suggest that fruit is more available to
preschool age children than are vegetables.
PPC in each of the stages were serving about the same amount of 100% fruit juice
in the recommended amount of six ounces (AAP, 2001). This may reflect the large
proportion of the study participants who were enrolled in the WIC program and received
100% juice as part of the supplemental food package. In keeping with American
Academy of Pediatrics recommendations (AAP, 2001), WIC nutrition education
messages place a strong emphasis on limiting juice consumption in preschool age
children to six ounces daily (Oklahoma State Department of Health [OSDH] WIC
Service, 2007).
Whole fruits accounted for the greatest amount of variance between stages in the
availability of total fruit. The significant difference between PPC in preaction and those
in preparation and action stages in the number of whole fruit servings may be related to
cost, which emerged as a factor describing differences in stages both in the decisional
balance and self-efficacy constructs. This is further evidenced by our finding that parents
with higher educational levels served significantly more whole fruit than those with less
education, pointing to the fact that perceived cost may be a barrier in whole fruit
availability. Although all the participants in our study were low-income, it is generally
accepted that people with higher educational levels generally have higher incomes
(Ashenfelter & Rouse, 1999). Nutrition educators have an opportunity to address food
resource management and planning of purchases to help assure that whole fruits are
available at the end of pay periods or food benefit issuance cycles when funds are
76
insufficient to purchase foods. For example, nutrition education messages should not be
limited to use of fresh fruits, but also include purchasing and uses of canned and frozen
varieties. These food items are less perishable and can extend availability and
accessibility between food purchasing occasions (Parker, 2002).
Overall, the average amount of vegetable made available by PPC in all stages fell
short of the Dietary Guideline recommendations (USDHHS, USDA, 2005). Although the
amount of starchy and other vegetables available to children was less than the
recommended amounts, they were the primary source of vegetables. Parker (2002)
identified family preference, versatility, cost and shelf life as major factors influencing
food purchases made by low-income women. Starchy vegetables meet these criteria
(Reed, Frazão & Itskowitz, 2004); and potatoes, particularly, can be prepared in a variety
of ways. One note of concern is that potatoes frequently are served fried (Reed et al.,
2004; Skinner et al., 2004). In response, nutrition education efforts should offer recipes
for potatoes that are acceptable to families with young children and have less added fat
than fried preparation methods.
In summary, greater efforts should be made to increase the variety of vegetables
served and emphasize the benefits of whole fruit over fruit juice.
Theoretical Constructs
An essential element for effectively using TTM based interventions in changing
dietary behaviors is placement of individuals or sub-groups of the population into the
correct stage (Prochaska, 2004). Using the two-stage algorithm, 43 percent of the
participants on our study staged in the precontemplation and contemplation (referred to as
77
preaction) stages; 29 percent staged as preparation; and 27 percent staged in the action
and maintenance (referred to as action) stages. The proportions are consistent with
Prochaska’s (2004) assertion that most people who need to change a behavior are in
preaction stages. However, the ratio of study participants who staged in the
precontemplation stage compared to contemplation stage (10 percent versus 33 percent,
respectively) was of interest. People in the contemplation stage acknowledge they need
to make a change but are not yet ready or able, compared to precontemplaters who are
not cognizant of a need for behavior change. The larger number in the contemplation
stage may be explained in that all study participants were enrolled in nutrition education
programs. Furthermore, the percentage was consistent with those observed in two other
studies in which the study participants were enrolled in nutrition programs. The first was
conducted with low-income, African-American women of whom 40 percent were
enrolled in WIC or had children receiving free or reduced price school meals (Henry et
al., 2006). The second study was also with African-Americans self-enrolled in a program
designed to increase fruit and vegetable consumption (Resnicow, McCarty &
Baranowski, 2003). It would seem logical that persons who self-enroll in food assistance
and nutrition education programs recognize the importance of improving dietary quality
and have demonstrated their intent to make changes by enrolling in the program to seek
support.
Decisional balance describes the relationship of the importance of positive and
negative aspects of a behavior in the decision to make a behavior change. Typically, the
negative aspects outweigh the positive in the early stages of a behavior change and
reverse in later stages (Greene et al., 1999). The crossover usually occurs as subjects

78
move from contemplation to preparation stages. TTM refers to this milestone as ‘tipping
the decisional balance scale,’ (Prochaska, Norcross & DiClemente, 1994) and is essential
to advancing through the preaction stages. This phenomenon held true in our study. The
importance of the health benefits of serving fruit and vegetable was important to all
stages, but only enough to outweigh the negative aspects for PPC in the preparation and
action stages. The negative aspect best describing differences in decisional balance
between stages was time related to preparing fruit and vegetable. Furthermore, all PPC
reported expense to be somewhat important in their decision making. Hence, expense
and time emerged as the negative aspects overpowering the positive aspects of serving
fruit and vegetable for PPC in the preaction stage. The observation is congruent with our
finding that PPC in both the preaction and preparation stages were significantly less self-
efficacy than PPC in the action stage to serve fruit and vegetable when money was low.
Based on these two findings and supported by previous research (Havas, 1998; Parker,
2002), it can be concluded that cost and time are powerful determinants for low-income
PPC in preaction stages when making decisions to increase availability of fruit and
vegetable to their children.
The positive health aspects of fruit and vegetable consumption should be
emphasized to help shift decisional balance toward the positive side. All PPC were
influenced by the protection fruit and vegetable provide against chronic disease, but it
appeared that PPC in preaction stages placed slightly less importance, compared to PPC
in the preparation and action stages, in the benefit fruit and vegetable provide in
protecting families against acute illnesses such as colds and infections. Because almost
one-half of the responding PPC worked outside the home, this aspect may be especially

79
influential if presented in the context that healthier children can result in fewer days of
work missed.
Another observed difference among PPC in different stages of change was the
significantly lower level of self-efficacy reported by the preaction stage for serving fruit
and vegetable in different situations compared to those in the preparation and action
stages. Our finding is in agreement with previous research that found self-efficacy
positively related with fruit and vegetable consumption (Henry et al., 2004; Ma et al.,
2002). Once a positive decisional balance is achieved, self-efficacy is essential for
movement to a higher stage because it provides confidence that use of behavioral
processes will bring about desired outcomes (Prochaska, Norcross & DiClemente, 1994).
In our study, limited money, time and confidence to prepare fruit and vegetable
acceptable to families presented as factors limiting self-efficacy for PPC in preaction
stages. The family’s acceptance of fruit and vegetable is important because it influences
the food items that are purchased, especially when resources are insufficient to meet
needs, thus affecting availability. A major consideration of low-income households in
making food purchasing decisions is limiting food waste (Parker, 2002; Shankar &
Klassen, 2001); therefore they only purchase foods acceptable to their families and limit
highly perishable items, such as fresh fruit and vegetable. When fruit and vegetable are
not available to young children during the developmental periods when food preferences
are being formed, a cyclical pattern of poor eating habits begins (Birch, 1998; Birch &
Fisher, 1998).
A recent study that evaluated the influence of family resources on food
preparation revealed a negative relationship between time spent preparing food and the

80
amount of time working outside the home, regardless of income (Mancino & Newman,
2007). Although employment in our study was not related to fruit and vegetable
availability, employment does limit time for food preparation; and time does appear to
have a relationship with decisional balance and self-efficacy in serving fruit and
vegetable. It is logical then that efforts focusing on building self-efficacy in serving
quick and easily prepared fruit and vegetable would assist PPC in moving from preaction
into sequentially higher stages.
Having fruit and vegetable when eating meals away from home was a factor in
which PPC in all stages had limited self-efficacy, and was the situation in which PPC in
the action stage had the least confidence. The popularity of eating meals away from
home has approximately doubled since the 1970s, and has negatively influenced the
quality of children’s diets (Lin & Guthrie, 1999). Our study did not gather information
about the nature of these meals such as frequency, location, time of day and foods eaten.
Additional research is needed to learn about the meals low-income families with young
children eat away from home and their influence on availability of fruit and vegetable.
We found that PPC in preparation and action stages, compared to preaction
stages, were using both experiential and behavioral processes more frequently in their
efforts to serve fruit and vegetable. The finding is consistent with previous research
positively associating use of a variety of processes with higher stages of change
(Nothwehr et al., 2006). Velicer et al. (2004) explained that use of processes is the
mechanism by which people move toward a positive decisional balance and increase self-
efficacy. It is evident from the data we collected that the greater use of processes by
preparation and action stages supports their higher levels of self efficacy. Therefore, it

81
seems logical that nutrition education efforts aimed at matching processes to stage and
supporting their use should in turn increase self-efficacy, facilitate movement to higher
stages, and ultimately increase availability of fruit and vegetable to preschool age
children. In our study, the processes that were being used more often by PPC in
preparation stages compared to preaction stages included the experiential processes of
consciousness raising by looking for tips for adding fruit and vegetable to meals; parental
reevaluation of the importance of role modeling eating fruit and vegetable; and
commitment to serving more fruit and vegetable. Behavioral processes included stimulus
control by planning main meals to include at least two vegetables; countering behaviors
by serving fruit and vegetable for snacks instead of less nutritious foods; and rewards
gained through social support for serving adequate amounts of fruit and vegetable.
Differences between preparation and action stages were limited to the use of behavioral
processes, specifically countering healthy behaviors for less healthy behaviors and
stimulus control in the environment, both achieved by substituting fruits for less
nutritious snacks and desserts and which involve a degree of planning. The aim then of
nutrition education and intervention efforts should be to utilize processes of change as
independent variables to address factors to shift decisional balance to a positive
perspective and that increase self-efficacy. For example, because PPC in the preaction
stage have are not thinking about making changes in the immediate future, interventions
should emphasize experiential processes that create heightened awareness of economical,
quick and easy tips for adding fruits and vegetable to meals and snacks, as well as the
immediate health benefits these foods can provide. As intent of the PPC increases,

82
intervention strategies should move from an emphasis on experiential to behavioral
processes to help build self-efficacy in making the change.
The discriminate function analysis of the processes of change revealed use of
behavioral processes was the substantive descriptor for differences among PPC in the use
of processes. Countering healthy behaviors for less healthy behaviors accounted for the
greatest amount of variance. In our study this behavior was measured by choosing to
serve fruit and vegetable to children rather than less nutritious foods for snacks. Helping
parents change the dietary quality of children’s snacks to include fruit and vegetable is
important, because in the last two decades the prevalence of snacks consumed throughout
the day has almost doubled from less than once per day to 1.6 snacks per day (Lin,
Frazão & Guthrie, 1999). Thus, snacks have become increasingly important in the
overall nutritional quality of children’s diets. The process of countering can be utilized in
nutrition education with displays and demonstrations of differences in nutrient
contribution and cost between common, low-nutrient snack foods and a variety of fruit
and vegetable snacks; thus increasing the PPC’s ability to assess and evaluate the snack
foods available in their home and identify changes to which they are willing to commit.
The ratio of PPC in action to maintenance stages (3 percent to 25 percent)
indicated that once self-confidence had been established through successful use of
experiential and behavioral processes to overcome cost and preparation constraints, PPC
were able to sustain serving more fruit and vegetable servings to their children.
However, the FVFQ revealed that PPC in action stages have opportunity to further
increase availability of vegetables to meet dietary recommendations. In designing
nutrition education for PPC in action stages, it should be considered that they have strong

83
intent and interest in serving adequate amounts of fruit and vegetable to their children, as
evidenced by their response to the staging algorithm. Furthermore, they place greater
value in the health benefits of fruit and vegetable compared to the negative aspects; have
greater confidence in their ability to serve fruit and vegetable to their children in a variety
of situations compared to PPC who are making lesser quantities available; and use a
wider variety of processes to perform the behavior. As with designing interventions for
preaction stages, nutrition education for PPC in action stages should address issues of
value to them and relevant to their situation. Review of the data for the action stage
indicated they have low confidence for providing fruit and vegetable when eating meals
away from home; and cost, as with all stages, was somewhat important in their decision
making. In addition, they were serving less than recommended amounts vegetables in the
other sub-group. Their strengths were in their confidence in serving fruit and vegetable
when preparing meals at home and in preparing recipes acceptable to their families.
Therefore, opportunity exist for increasing their repertoire for variety of vegetables by
focusing on behavioral strategies such as tasting and cooking sessions focusing on low-
cost and easily prepared recipes, community and/or home gardening programs and
awareness of availability of local produce sources (Nanney, Johnson, Elliot, & Haire-
Joshu, 2007).
In summary, low-income PPC of pre-school age children were in different stages
of change for making available fruit and vegetable, with the majority of the PPC being in
preaction stages. PPC in the preaction stage based their decisions more heavily on the
negative aspects of serving fruit and vegetable, primarily cost and time to prepare, than
did PPC in preparation and action stages, whose decisions were more heavily influenced

84
by the immediate health benefits provided by fruit and vegetable. PPC in the action and
preparation stages had greater confidence in their ability to serve fruit and vegetable in
different situations. Their higher level of self-efficacy was facilitated by more frequent
use of a variety of processes, especially the behavioral process of countering by
substituting fruit and vegetable for less nutritious foods. As such, the constructs of TTM
have practical applications for use in nutrition education efforts designed to increase fruit
and vegetable availability to low-income preschool age children.
Conclusions
Our study supports the usefulness of TTM in identifying differences between PPC
who are making larger amounts of fruit and vegetable available to their young children
and those who are not. PPC recognized the importance of making fruit and vegetable
available to children; however, those in precontemplation and contemplation stages are
impeded by perceived barriers, primarily cost and the time to prepare tasty and easy fruit
and vegetable their families will eat. Helping families build confidence in preparing
economical, quick and easy fruit and vegetable acceptable to their families and building
skills for substituting fruit and vegetable for less nutritious foods in meals and snacks
should provide positive outcomes in assisting families in increasing availability of fruit
and vegetable. Federal food assistance programs should continue funding current and
new initiatives that reduce economic barriers of fruit and vegetable availability and
accessibility as well as funding programs that provide nutrition education to build skills
and support families in their efforts to improve dietary quality.

85
Implications for Nutrition Education
Transtheoretical Theory of Behavior Change posits that interventions should be
matched to the persons or sub-population’s stage of change. Our study found almost half
(43 percent) of the low-income PPC with preschool age children who responded were in
preaction stages, with the majority being in the contemplation stage, for increasing fruit
and vegetable availability. Therefore, efforts should be made to help PPC shift their
decisional balance toward the positive side by using experiential processes that
emphasize the health benefits provided by fruit and vegetable and sharing ideas for
adding economical, tasty and easy to prepare fruit and vegetable to family meals and
snacks. Techniques for individual sessions may utilize motivational interviewing (Miller
& Rollnick, 2002) in which the nutrition educator provides opportunity for the PPC to
identify barriers and strategies that are appropriate for their particular situation and to
which they are committed to trying. The nutrition educator may find it helpful to provide
ideas that have worked with other low-income parents with young children. As
commitment to trying ideas for increasing fruit and vegetable availability is made,
nutrition education should turn to focusing on behavioral processes used by PPC in
preparation stages to increase self-efficacy and facilitate movement to a higher stage of
change. Our study found the most used behavioral process to be countering behaviors by
substituting fruit and vegetables for less healthy snacks. The ideas should be budget
friendly, quick and easy to prepare and appealing to families.
Nutrition education for low-income populations is being increasingly conducted
in group sessions (Kaiser, McMurdo & Joy, 2007). Using a learner-centered approach
(Norris, 2003) based on the TTM can be effective for providing nutrition education
86
(Prochaska, 2004). Because most of the participants will be in preaction stages, sessions
should be matched to their particular attributes (Finckenor & Bredbenner, 2000). PPC in
later stages can provide proven ideas and tips for increasing fruit and vegetable
availability and accessibility. Group lessons can be effective in that they provide a safe
environment for the PPC in early stages from which they can gain ideas and positive
perceptions from their peers for increasing fruit and vegetable availability. In addition,
the group setting provides PPC in preparation and action stages with opportunity to
utilize the behavioral process of rewards gained through social support and recognition
for their success.
Because the average number of servings of fruit served to children were in
keeping with the Dietary Guidelines (USDHHS & USDA, 2005), and average number of
servings of vegetable fell short of the recommendations, nutrition educators should focus
more heavily on messages aimed at increasing vegetable variety and availability,
especially for PPC in action stages. Utilizing cooking demonstrations and interactive
classes using an array of economical, quick and easy recipes should capitalize on the
strong interest and positive attitudes of PPC in the preparation and action stages to further
increase availability of vegetables. Conducting these experiences at a time when family
members can be present to help prepare and taste the recipes in a safe environment
should also be considered.
Implications for Research
It is recommended that the findings of this study describing the stage of change of
low-income PPC with preschool age children be used to develop a stage-based nutrition
87
education model aimed at increasing fruit and vegetable availability. Subsequently
research should be conducted to determine if the provision of a stage-based nutrition
education intervention changes fruit and vegetable availability and accessibility and
ultimately fruit and vegetable consumption by preschool age children.
Our study was limited to the assessment of the current stage of change of low-
income PPC, the majority of which participated in the WIC program, for increasing
availability and accessibility of fruit and vegetable to their preschool age children.
Proposed rules have been posted and are currently under consideration by USDA for the
addition of fruit and vegetable to the supplemental WIC food benefit package (United
Stated Department of Agriculture, Food and Nutrition Service, 2006). A policy change
of this nature has potential to amend the perceived affordability of fruit and vegetable by
low-income PPC, thus altering their stage of change. It is recommended that this study
be repeated after the proposed policy change has become effective and implemented to
measure the affect of the intervention on the stage of change of low-income parents for
increasing availability and accessibility of fruit and vegetable to their preschool age
children.
Previous research suggests that availability of fruit and vegetable is influenced by
frequency of family meals (Gillman et al., 2000). However, our study did not address
this factor. Therefore, future research is needed to determine if stage of change for
increasing fruit and vegetable availability is associated with the frequency and
composition of family meals in low-income families with preschool age children. The
findings would contribute to the existing knowledge and benefit nutrition and health
educators in assisting families in preparing and planning meals that provide amounts and

88
varieties of fruit and vegetable to enable young children to develop healthy food
preferences and meet dietary recommendations for consumption.

89
REFERENCES
American Academy of Pediatrics, Committee on Nutrition. (2003) Policy statement: prevention of pediatric overweight and obesity. Pediatrics. 1112(2):424-430. American Academy of Pediatrics, Committee on Nutrition. (2001) Policy statement: the use and misuse of juice. Pediatrics. 107(5):1210-1213. Anderson PM, Butcher KF. (2006) Childhood obesity: trends and potential causes. The Future of Children. 16(1):9-45. Anderson JV, Bybee DI, Brown RM, McLean FD, et al. (2001) 5 a day fruit and vegetable intervention improves consumption in a low-income population. Journal of the American Dietetic Association. 101(2):195. Anliker J, Damron D, Ballesteros M, Langenberg P. (1999) Using the stages of change model in a 5-a-day guidebook for WIC. Journal of Nutrition Education. 31(3): 175A-176A Anliker J, Winne M, Drake L. (1992) An evaluation of the Connecticut farmers’ market coupon program. Journal of Nutrition Education. 24(4):185-190.
Arredondo EM, Elder JP, Ayala GX, Slymen D, Campbell NR. (2006) Association of a traditional vs shared meal decision-making and preparation style with eating behavior of Hispanic women in San Diego County. Journal of the American Dietetic Association. 106(1):38-45. Ashenfelter OC, Rouse CE. (1999) Schooling, Intelligence, and Income in America: Cracks in the Bell Curve. Working Paper No. W6902. National Bureau of Economic Research. Available at http://papers.ssrn.com/sol3/papers.cfm?abstract. Accessed May 15, 2007. Behavioral Risk Factor Surveillance System Prevalence Data – 2005 Nationwide. Centers for Disease Control. Available at http://apps.nccd.cdc.gov/brfss. Accessed January 15, 2007. Bell EA, Rolls BJ. (2001) Energy density of foods affects energy intake across multiple levels of fat content in lean and obese women. American Journal of Clinical Nutrition. 73:1010-1018.

90
Birch LL. (1998) Development of food acceptance patterns in the first year of life. Proceedings of the Nutrition Society. 57:617-624. Birch LL, Fisher JO. (1998) Development of eating behaviors among children and adolescents. Pediatrics. 101:539-549. Birmingham BJ, Shultz JA, Edlefsen M. (2004) Factors related to frequency of fruit and vegetable served to children and consumed by mother in low-income households. Family and Consumer Sciences Research Journal. 33(1):442-456. Briefel R, Ziegler P, Novak T, Ponza M. (2006) Feeding Infants and toddlers study: characteristics and usual nutrient intake of Hispanic and non-Hispanic infants and toddlers. Journal of the American Dietetic Association. 106(1 suppl 1):S84-95. Bowen DJ, Meschke H, Tomoyasu N. (1994) Preliminary evaluation of the processes of changing to a low-fat diet. Health Education Research. 9:85-94. Centers for Disease Control and Prevention. (2005) Can eating fruit and vegetable help people to mange their weight? United States Department of Health and Human Services. Centers for Disease Control and Prevention (2007a). About CDC. United States Department of Health and Human Services. Available at http://www.cdc.gov/about/. Accessed May 11, 2007. Centers for Disease Control and Prevention. (2007b) Overweight and Obesity: Childhood Overweight. United States Department of Health and Human Services. Available at http://www.cdc.gov/nccdphp/dnpa/obestiy/childhood. Accessed January 3, 2007. Centers for Disease Control and Prevention. (2007c) Overweight and Obesity: Economic Consequences. United States Department of Health and Human Services. Available at http://www.cdc.gov/nccdphp/dnpa/obesity/economic_consequences. Accessed April 8, 2007. Colditz GA, Manson JE, Stampfer MJ, Ronser B, Willett WC, Speizer FE. (1992) Diet and risk of clinical diabetes in women. American Journal of Clinical Nutrition. 55:1018-1023. Cook AJ, Friday JE. (2004) Pyramid Servings Database for USDA Survey Food Codes Version 2.0. Beltsville MD: USDA, ARS, Community Nutrition Research Group. Available at http://www.ba.ars.usda.gov/cnrg/index.html. Accessed June 7, 2006.
Cooperative Sate Research Education and Extension Service (2007). Nutrition. United States Department of Agriculture. Available at http://www.csrees.usda.gov/nea/food/efnep/efnep.html. Accessed May 11, 2007.

91
Cullen KW, Baranowski T, Owens E, March T, Rittenberry L, de Moor C. (2003) Availability, accessibility, and preferences for fruit, 100% fruit juice, and vegetables influence children’s dietary behavior. Health Education Behavior. 30(5):615-26. Dwyer JT, Suitor CW, Hendricks K. (2004) FITS: new insights and lessons learned. Journal of the American Dietetic Association. 104(1S1):S5-S7. Eivens C. (2005) Validation of Methods to Assess Stages of Change for Increasing Fruit and Vegetable Intake by Young Adults. University of Nebraska. Lincoln, Nebraska. Thesis. Epstein LH, Gordy CC, Raynor HA, Beddome M, Kilanowski CK, Paluch R. (2001) Increasing fruit and vegetable intake and decreasing fat and sugar intake in families at risk for child obesity. Obesity Research. 9(3):171-178. Finckenor M, Bredbenner CB. (2000) Nutrition intervention group program based on preaction-stage-oriented change processes of the Transtheoretical model promotes long-term reduction in dietary fat intake. Journal of the American Dietetic Association. 100(3):335-342. Food and Nutrition Service (2007a). WIC Farmer’s Market Nutrition Service. United States Department of Agriculture. Available at http://www.fns.usda.gov/wic/FMNP/FMNPfaqs.htm. Accessed May 11, 2007. Food and Nutrition Service (2007b). Food Stamp Nutrition Education. United States Department of Agriculture. Available at http://www.fns.usda.gov/fsp/nutrition_education/default.htm. Accessed May 11, 2007. Gillman MW, Rifas-Shiman SL, Frazier L, Rockett HRH, Camargo CA, Field AE, Berkey CS, Colditz GA. (2000) Family dinner and diet quality among older children and adolescents. Archives of Family Medicine. 9(3):235-240. Glanz K, Landenau B, Foerster S, Temple S, Mullis R, Schmid T. (1995) Environmental and policy approaches to cardiovascular disease prevention through nutrition: opportunities for state and local action. Health Education Quarterly. 22:512-527. Greene GW, Rossi SR, Rossi JS, Velicer WF, Fava JL, Prochaska JO. (1999) Dietary applications of the Stages of Change Model. Journal of the American Dietetic Association. 99(6):673-677. Guenther PM, Dodd KW, Reedy J, Krebs-Smith SM. (2006) Most Americans eat much less than recommended amounts of fruit and vegetable. Journal of the American Dietetic Association. 106 (9):1371-1379.

92
Havas S, Treiman K, Langenberg P, Ballesteros M, Anliker J, Damron D, Feldman R. (1998) Factors associated with fruit and vegetable consumption among women participating in WIC. Journal of the American Dietetic Association. 98(10):1141-1148. Hearn MD, Baranowski T, Baranowski J, Doyle C, Smith M, Lin LS, Resnicow K. (1998) Environmental influences on dietary behavior among children: availability and accessibility of fruit and vegetable enable consumption. Journal of Health Education. Jan./Feb.;29(1):26-32. Henry H, Reicks M, Smith C, Reimer K, Atwell J, Thomas R. (2003) Identification of factors affecting purchasing and preparation of fruit and vegetable by stage of change for low-income African-American mothers using the think-aloud method. Journal of the American Dietetic Association. 103(12):1643-1646. Henry H, Reimer K, Smith C, Reicks M. (2006) Associations of decisional balance, processes of change, and self-efficacy with stages of change for increased fruit and vegetable intake among low-income African-American mothers. Journal of the American Dietetic Association. 106(6):841-849. Herman DR, Harrison GG, Jenks E. (2006) Choices made by low-income women provided with an economic supplement for fresh fruit and vegetable purchase. Journal of the American Dietetic Association. 106(5):740-744. Horodynski MAO, Hoerr S, Coleman G. (2004) Nutrition education aimed at toddlers: a pilot program for rural, low-income families. Family and Community Health. 27(2):103-114. Hyson D. (2002) The Health Benefits of Fruit and vegetable: A Scientific Overview for Health Professionals. Produce for Better Health Foundation. Wilmington, Delaware.
Institute of Medicine, Food and Nutrition Board. (2002) Dietary Reference Intakes for Energy, Carbohydrate, Fiber, Fatty Acids, Cholesterol, Protein, and Amino Acids. Washington, DC: National Academies Press. Institute of Medicine, Food and Nutrition Board. (2004a) Dietary Reference Intakes for Water, Potassium, Sodium, Chloride, and Sulfate. Washington, DC: National Academies Press. Institute of Medicine, Food and Nutrition Board. (2004b) Proposed Criteria for Selecting the WIC Food Package: A Preliminary Report of the Committee to Review the WIC Food Package. Washington, DC: National Academies Press. Institute of Medicine, Food and Nutrition Board. (2005) WIC Food Packages Time for a Change. The National Academies Press. Washington D.C. 2005.

93
Institute of Medicine. (2007) About. National Academy of Sciences. Available at http://www.iom.edu/CMS/AboutIOM.aspx. Accessed May 11, 2007. James WT, Nelson M, Ralph A, Leather S. (1997) Socioeconomic determinants of health: The contribution of nutrition to inequalities in health. British Medical Journal. 314:1545-1554. Johnson RK, Hankin JH. (2003) Dietary assessment and validation. In: Monsen ER, ed, Research: Successful Approaches. Diana Faulhaber Publisher. 227-242. Joshipura KJ, Hu FB, Manson JE. (2001) The effect of fruit and vegetable intake on risk for coronary heart disease. Annals of Internal Medicine. 134:1106-1114. Kaiser L, McMurdo T, Joy AB. (2007) The food stamp nutrition education program focuses on the learner. Journal of Extension. [on-line] 45(2). Available at http://www.joe.org/joe/2007april/rb5.shtml. Accessed May 1l, 2007. Kratt P, Reynolds K, Shewchuk R. (2000) The role of availability as a moderator of family fruit and vegetable consumption. Health Education and Behavior. 27(4):471-482. Kumanyika SK. (2001) Minisymposium on obesity: overview and some strategic considerations. Annual Review of Public Health. 22:293-308. Lin BH, Frazão E, Guthrie J. (1999) Away-From-Home Foods Increasingly Important to Quality of American Diet. Economic Research Service, United States Department of Agriculture. Washington DC. Ma J, Betts NM, Horacek T, Georgiou C, White A, Nitzke S. (2002) The importance of decisional balance and self-efficacy in relation to stages of change for fruit and vegetable intakes by young adults. American Journal of Health Promotion. 16(3);157-166. Ma J, Betts NM, Horacek T. (2001) Measuring stage of change for assessing readiness to increase fruit and vegetable intake among 18- to 24-year-olds. American Journal of Health Promotion. 16(2):88-97. Mancino L, Newman C. (2007) Who Has Time to Cook? How Family Resources Influence Food Preparation. Economic Research Service. United States Department of Agriculture. Washington DC. Malec MA. (1993) Essential Statistics for Social Research. Westview Press. Boulder, Colorado. Miller WR, Rollnick S. (2002) Motivational Interviewing. The Guilford Press. New York, New York.

94
Mullen MC, Shield J. (2004) Childhood and Adolescent Overweight: The Health Professional’s Guide to Identification, Treatment, and Prevention. Chicago, Illinois. American Dietetic Association.
Nanney MS, Johnson S, Elliot M, Haire-Joshu D. (2007) Frequency of eating home grown produce is associated with higher intake among parents and their preschool age children in rural Missouri. Journal of the American Dietetic Association. 107:577-584. National Center for Health Statistics. (2004) Health, United States, 2004 with Chartbook on Trends in the Health of Americans. Hyattsville, Maryland. Ness AR, Powles JW. (1997) Fruit and vegetable, and cardiovascular disease: A review. International Journal of Epidemiology. 26:1-13.
Nicklas TA, Baranowski T, Baranowski JC, Cullen K, Rittenberry L, Olvera N. (2001) Family and child-care provider influences on preschool children’s fruit, juice and vegetable consumption. Nutrition Reviews. 59(7):224-35. Norris JA.. (2003) From Telling to Teaching: A Dialogue Approach to Adult Learning. Learning by Dialogue. North Myrtle Beach, South Carolina. Nothwehr F, Snetselaar L, Yang J, Wu H. (2006) Stage of change for healthful eating and use of behavioral strategies. Journal of the American Dietetic Association. 106(7):1035-1041. Oklahoma State Board of Health. (2006) A Strong and Healthy Oklahoma 2006 State of the State’s Health Report. Available at http://www.health.ok.gov/board/state/SOSH06. Retrieved April 28, 2006 Oklahoma State Department of Health WIC Service. (2007) Policy and Procedure Manual. Available at http://www.teletrain.com/wic. Accessed February 2, 2007. Oklahoma State Department of Human Services. (2006) Statistics: County Profiles. Available at: http://okdhs.org/library/stats/cp/2006/05/default.htm. Accessed September 27, 2006.
Pariskova J, Hills A. (2001) Childhood Obesity, Prevention and Treatment. CRC Press. Boca Raton, Florida.
Parker, SP. (2002) Understanding the Health Risks of Limited Income Women, Dissertation. Stillwater, OK: Oklahoma State University. Pediatric Nutrition Surveillance System. (2004) Summary of trends in growth indicators by age children aged < 5 years. U.S. Department of Health and Human Services, Centers for Disease Control and Prevention. Available at www.cdc.gov/pednss_tables. Accessed June 7, 2006.
95
Prochaska JO. (2004) Helping Populations Move Through Stages of Change Web cast. Boston University. Available at http://www.bu.edu/cpr/webcast/prochaska. Accessed June 23, 2004. Prochaska JO, Norcross JC, DiClemente CC. (1994) Changing for Good. HarperCollins Publishers. New York, NY. Reed J, Frazão E, Itskowitz R. (2004) How much do Americans pay for fruit and vegetable? Economic Research Service, United States Department of Agriculture. Reicks M, Randall JL, Haynes BJ. (1994) Factors affecting consumption of fruit and vegetable by low-income families. Journal of the American Dietetic Association. 94(11):1309-1311. Resnicow K, McCarty F, Baranowski T. (2003) Are precontemplaters less likely to change their dietary behavior? A prospective analysis. Health Education Research. 18(6):693-705. Serdula MK, Gillespie C, Kettel-Khan L, Farris R, Seymour J, Denny C. (2004) Trends in fruit and vegetable consumption among adults in the United States: behavioral risk factor surveillance system, 1994-2000. American Journal of Public Health. 94(6):1014-1018.
Shankar S, Klassen A. (2001) Influences on fruit and vegetable procurement and consumption among urban African-American public housing residents, and potential strategies for intervention. Family Economics and Nutrition Reviews. 13(2):34-36.
Skinner JD, Ziegler P, Pac S, Devaney B. (2004) Meal and snack patterns of infants and toddlers. Journal of the American Dietetic Association. 104(1):S65-S70. Steinmetz KA, Potter JD. (1996) Vegetables, fruit and cancer prevention: A review. Journal of the American Dietetic Association. 96:1027-1039. Stevens JP. (2002) Applied Multivariate Statistics for the Social Sciences. Lawrence Erlbaum Associates. Mahwah NJ. Tohill BC, Seymour J, Serdula M, Dettel-Khan L, Bolls BJ. (2004) What epidemiologic studies tell us about the relationship between fruit and vegetable consumption and body weight. Nutrition Reviews. 62:365-374. Trudeau E, Kristal AR, Li S, Patterson RE. (1998) Demographic and psychosocial predictors of fruit and vegetable intakes differ: implications for dietary interventions. Journal of the American Dietetic Association. 98(12):1412-1417.

96
United Stated Department of Agriculture, Food and Nutrition Service (2006). 7CFR part 246. Special Supplemental Nutrition Program for Women, Infants and Children (WIC): Revisions in the WIC Food Package; Proposed rule. United States Department of Agriculture. (2003) WIC Farmers’ Market Nutrition Program. Available at: http://www.fns.usda.gov/wic. Accessed May 2003. United States Department of Health and Human Services and United States Department of Agriculture. (2005) Dietary Guidelines for Americans 2005, 6th Edition. Washington D.C. US Government Printing Office. U.S. Department of Health and Human Services, Public Health Service, Office of the Surgeon General. (2001) The Surgeon General’s Call to Action to Prevent and Decrease Overweight and Obesity. United States Government Printing Office, Washington, D.C. Van Duyn MS, Pivonka E. (2000) Overview of the health benefits of fruits and vegetable consumption for the dietetics professional: Selected literature. Journal of the American Dietetics Association. 100(12):1511-1521. Velicer WF, Prochaska JO, Fava JL, Norman GJ, Redding CA. (2004) Detailed Overview of the Transtheoretical Model. Cancer Prevention Center. Available at http://www.uri.edu/research/cprc/TTM. Accessed June 23, 2004. Warde WD. (1990) Sampling Methods. Stillwater, Oklahoma. Statistics Department, Oklahoma State University. Williams DE, Wareham JN, Cox BD, Byrne DC, Hales CN, Day NE. (1999) Frequent salad vegetable consumption is associated with a reduction in the risk of diabetes mellitus. Journal of Clinical Epidemiology. 52:329-335

97
APPENDICES

98
APPENDIX A

99
100
APPENDIX B

101

102
APPENDIX C

103
104
Appendix D

105

106

107

108

109

110

111

112

113

VITA
Deana A. Hildebrand
Candidate for the Degree of
Doctor of Philosophy
Thesis: ASSESSMENT OF THE STAGE OF CHANGE FOR INCREASING FRUIT
AND VEGETABLE AVAILABILITY AND ACCESSIBILITY IN LOW-INCOME
FAMILIES WITH PRESCHOOL AGE CHILDREN
Major Field: Human Environmental Sciences (emphasis in Nutritional Sciences) Biographical:
Education: Bachelor of Science, Vocational Consumer Home Economics Education, University of Central Oklahoma, Edmond, Oklahoma, May 1978. Master of Science, Nutrition and Food Management, University of Central Oklahoma, May 1988. Completed the requirements for the Doctor of Philosophy degree at Oklahoma State University, July, 2007.
Experience: Vocational Consumer Home Economics, secondary school teacher,
1978 to 1980. Oklahoma Department of Education, Child Nutrition Services, Program Coordinator, 1988 to 1998. Edmond Public Schools, Child Nutrition Services Director, 1998 to 2002. Oklahoma State Department of Health, WIC Service, Education and Training Coordinator, 2002 to 2006. Oklahoma State University, Department of Nutritional Sciences, Extension Nutrition Assistant Specialist, 2006 to current.
Professional Memberships: American Dietetic Association, Society for Nutrition Education, School
Nutrition Association

Name: Deana A. Hildebrand Date of Degree: July, 2007 Institution: Oklahoma State University Location: Stillwater, Oklahoma Title of Study: ASSESSMENT OF THE STAGE OF CHANGE FOR INCREASING
FRUIT AND VEGETABLE AVAILABILITY AND ACCESSIBILITY IN LOW-INCOME FAMILIES WITH PRESCHOOL AGE CHILDREN
Pages in Study: 113 Candidate for the Degree of Doctor of Philosophy
Major Field: Human Environmental Sciences (emphasis in Nutritional Sciences) Scope and Method of Study: In light of increased dietary intake recommendations and
pending changes to federal food assistance programs aimed at increasing fruit and vegetable consumption, our interest was in determining the intent of parents and caregivers of preschool age children for making available more fruit and vegetable, and identifying differences between those already serving adequate amounts and those who were not. Data for the cross-sectional, quantitative study came from 238 low-income parents/primary caregivers of preschool age children. We utilized the Transtheoretical Model of Behavior Change to assess the psychosocial factors of decisional balance, self-efficacy and processes influencing availability and accessibility of fruit and vegetable. A two-stage algorithm was used for staging respondents into stages of change, and an eight item fruit and vegetable frequency survey was used to determine the availability of fruit and vegetable accessible to children. Analyses of variance were used to compare differences between stages on each of the constructs and fruit and vegetable availability.
Findings and Conclusions: Our findings lend evidence that low-income PPC of preschool
age children were in different stages of change for increasing availability of fruit and vegetable to their preschool age children. Children of PPC in preparation and action stages had significantly greater availability of whole fruit, dark green vegetables and other vegetables. Availability of 100% juice, orange vegetables and starchy vegetables was similar for all stages. PPC in preaction stages had a negative decisional balance related to cost and time to prepare fruit and vegetable compared to PPC in preparation and action stages. Self-efficacy, especially preparing fruit and vegetable acceptable to families, increased as stage and availability increased. PPC in action stages more frequently employed a variety of strategies to make fruit and vegetable available, particularly the behavioral process of countering by serving fruit and vegetable for snack instead of less nutritious foods. As such, the constructs of TTM have practical applications in nutrition education efforts aimed at increasing fruit and vegetable availability and accessibility in low-income households with preschool age children.
ADVISER’S APPROVAL: Nancy M. Betts, PhD., RD