assessment of transmission length and bond …
TRANSCRIPT

ASSESSMENT OF TRANSMISSION LENGTH AND BOND STRENGTH OF
PRETENSIONED CONCRETE SYSTEMS WITH SEVEN-WIRE STRANDS
A THESIS
Submitted by
PRABHA MOHANDOSS
for the award of the degree
of
DOCTOR OF PHILOSOPHY
DEPARTMENT OF CIVIL ENGINEERING
INDIAN INSTITUTE OF TECHNOLOGY MADRAS
CHENNAI, INDIA
JULY 2019

ii
THESIS CERTIFICATE
This is to certify that the thesis titled “ASSESSMENT OF TRANSMISSION LENGTH AND
BOND STRENGTH OF PRETENSIONED CONCRETE SYSTEMS WITH
SEVEN-WIRE STRANDS", submitted by Ms. PRABHA MOHANDOSS, to the Department
of Civil Engineering, Indian Institute of Technology Madras, Chennai, for the award of the
degree of Doctor of Philosophy is a bona fide record of research work carried out by her under
my supervision. The contents of this thesis, in full or in parts, have not been submitted and will
not be submitted to any other Institute or University for the award of any degree or diploma.
Dr. Radhakrishna G. Pillai
Research Guide
Associate Professor
Department of Civil Engineering
Indian Institute of Technology Madras
Chennai - 600 036, India
Chennai, India
July 1, 2019

iii
DEDICATION
To my family and teachers

iv
ACKNOWLEDGEMENTS
I thank IIT Madras for the great opportunity given to me to pursue doctoral studies in the
BTCM division. I express my feelings of gratitude to Dr. Radhakrishna G. Pillai for his
motivating ideas, constant support, immense patience for long discussions, thoughtful
feedback, meticulous comments, and his invaluable guidance throughout the research program.
With great respect, I express my thanks to Prof. Ravindra Gettu for his constructive criticisms,
suggestions, words of encouragement, and for inculcating a sense of responsibility and values
in me during the various stages of this research program. I am thankful to
Prof. Manu Santhanam and Dr. Piyush Chaunsali for their valuable comments and support
during the various phases of this research program. Additionally, I express my gratitude to
them for their tireless efforts and helpful ideas during the weekly research group meetings.
I would like to express my gratitude to my Doctoral Committee Members
Prof. Amlan Kumar Sengupta, for his constant support and refreshing insights about this
research program and Prof. Srinivasan Chandrasekaran for his words of encouragement during
seminars. I express my sincere thanks to the present Head, Department of Civil Engineering,
Prof. K. Ramamurthy, and the former heads Prof. A. Meher Prasad and Prof. S.R. Gandhi for
facilitating my academic needs during the pursuit of my Ph.D. programme.
I have been greatly benefitted from Prof. Mark G. Alexander and Prof. Surendra P. Shah with
their insightful comments, suggestions, and warm words of encouragement throughout this
research program. Discussions with Prof. Vellore Gopalaratnam and Prof. Carmen Andrade
during their visit to IIT Madras have been illuminating. I am extremely thankful to all faculty
members of BTCM division for their intangible support.
I express my sincere thanks to all the lab staff, especially, Ms. Malarvizhi, Mr. Krishnan,
Mr. Subramanian, Mr. Gaseber, and Mr. Soundarapandian, for their help in the experimental
work. I thank Mr. R. Murali, Mr. Prince, Mr. Balu, and Mr. Nagarajan, Department workshop
facility for their inestimable help in the fabrication of moulds and test set-ups. The support from
the BTCM office and Civil Engineering office is gratefully acknowledged. I thank
Dr. T. Chellappa for his helpful suggestions in document correction.

v
I would like to thank Mr. George from Concrete product for sharing his thoughts on precast
sleepers and providing materials required for the experiments. I thank Dr. Ganesh from L & T
for sharing the design details of a bridge for the case study. I am very delightful to acknowledge
the support from all our beloved intern students, especially Sriram K. K., Sree Maheshwari,
Nandita Gettu, and Sethuraj for their valuable contributions to this research study. Also, I am
thankful to my research assistants Anupama, Sree Anand S., Nirmal Nayak, Rakishma, Rajath,
Herry Thomas, who helped me in many ways.
My sincere appreciation to all my friends and fellow researchers at IIT Madras,
Dr. Jayachandran K., Dr. Bahurudeen, Dr. Komathi M., Sakthivel, Srinivasan, Sooraj, Sripriya,
Swathy, Aswathy, Sundar, Deepak, Vaishnav, Stefie, Sanoop , Rohit, Sachin, Anusha S. B.,
Menaka, Dyana J., Manu, Sujatha, Divya and all other research scholars for the suggestions,
discussions and help rendered during different stages of my research work and for making my
stay at IIT Madras the most pleasant and memorable I am grateful to Ms. Dhanya R. for her
moral support and encouragement in several ways.
I am grateful to Ram, Shriram and Yuvaraj for cheering me in various phases of my research
work. A big thanks to Santhosh for his timly help to get things done at the crucial times of Ph.D.
I thank My cousins Hema and Rajesh for their motivational words during the period of my
research. I thank my bestie Aishwarya Srinidhi for being my constant companion and sacrificed
many trips for early completion of thesis. My appreciation to Mr. Kumaresh for all the
conversation and discussions to keep me going. I express my profound thanks to Vigneswari,
Umesh, Nivethitha, Vinoth, Anandhi, Priya, Vaishu, Jeeva, and Vivek for their favours,
especially the delicious home food.
With deep respect, I express gratitude to my beloved parents Mohandoss and Kalavathi for their
understanding and motivational words of courage to achieve my ‘Ph.D. dream’. Many thanks
are due to my brother Arvind for his constant support. I am grateful to my grandmother for her
blessings. I appreciate all my relatives for their continuous encouragement.
My special thanks to my love Ganesh for his abundance support, care, and patience in achieving
my dream.
Prabha Mohandoss

vi
ABSTRACT
In the PTC systems, the bond between the strand and concrete plays a vital role in transferring
the prestress from the strand to the surrounding concrete. The length of the strand (near the
ends) required to transfer or transmit the prestress from the strand to the surrounding concrete
is defined as ‘transmission length (Lt)’. If the bond is inadequate, the prestress would not be
transferred effectively. This could reduce the shear and flexural performance of the PTC
members, especially in the transmission zone, where transverse cracks in concrete could
develop due to the poor bond. Hence, an accurate estimation of the Lt and the bond strength
(b) between the strand and concrete is necessary to obtain the rational shear design in the
transmission zone.
Many factors (especially the properties of strand and concrete) influence the Lt and b.
However, the existing design formulations for the Lt do not consider these major factors in the
estimation of the Lt. Many standards consider only the diameter of the strands to estimate the
Lt. Consideration of only the ds could lead to the overestimation or underestimation of the Lt.
Both overestimation and underestimation of the Lt are unsafe, especially for shear performance
of the PTC systems. In the PTC systems, the determination of the bond strength is a challenging
task due to the applied prestress and required embedment length of strand to transfer the stress
to the surrounding concrete unlike the conventional reinforced concrete (CRC) systems. The
existing test methods to determine the strength of Strand-Concrete (S-C) bond in the PTC
systems are ASTM A1081 (2012), Moustafa’s method, and ECADA’s test method. However,
these methods suggest a pre-defined slip of 2.5 mm to determine the S-C bond strength (b),
which may lead to erroneous results and significant scatter.
This thesis presents a comparative study of the formulations of transmission length (Lt)
given in various codes such as AASHTO, ACI, AS, BIS, CSA, EN2, IRC, and fib and other
literature. A comprehensive experimental study was carried out in order to determine the Lt of
the PTC members. Totally, 12 prism specimens [(100 100 2000) mm] with a seven-wire
strand at the centre were cast using four different compressive strengths of concrete. An initial
prestress of 0.75fpu (where, fpu = ultimate tensile strength of strand) was applied. The average
compressive strength of concrete at transfer (fci) was 23, 28, 36, and 43 MPa, respectively.
vii
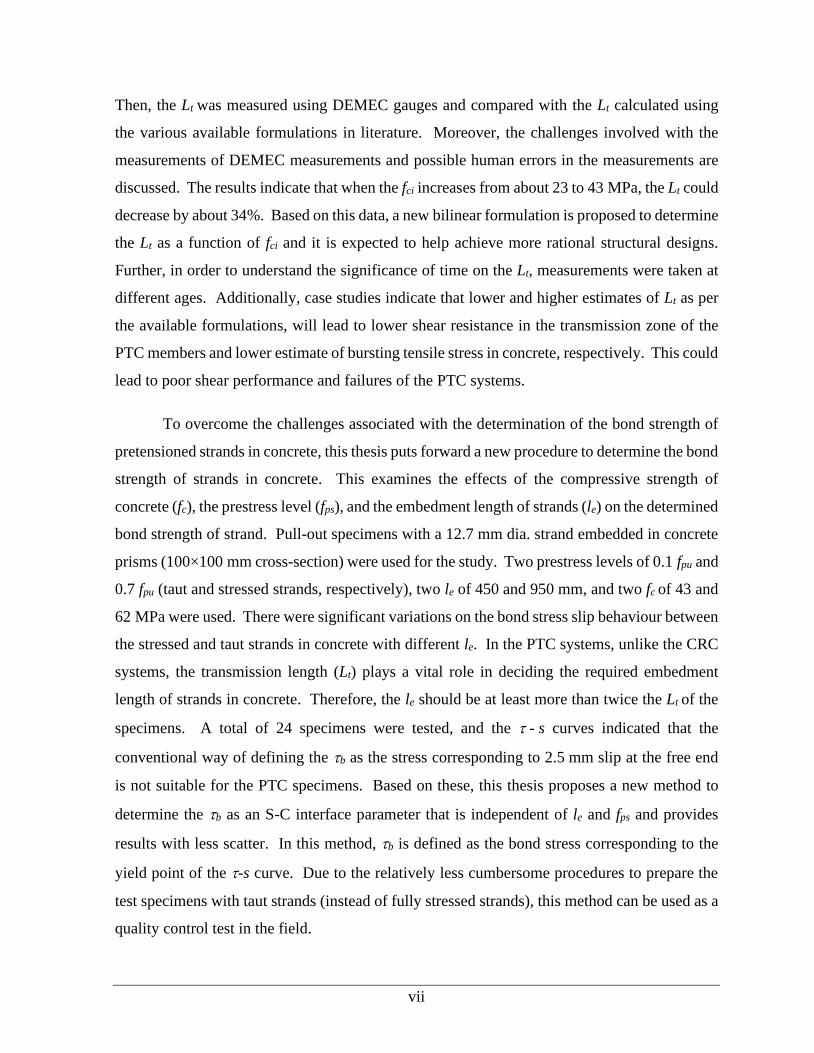
Then, the Lt was measured using DEMEC gauges and compared with the Lt calculated using
the various available formulations in literature. Moreover, the challenges involved with the
measurements of DEMEC measurements and possible human errors in the measurements are
discussed. The results indicate that when the fci increases from about 23 to 43 MPa, the Lt could
decrease by about 34%. Based on this data, a new bilinear formulation is proposed to determine
the Lt as a function of fci and it is expected to help achieve more rational structural designs.
Further, in order to understand the significance of time on the Lt, measurements were taken at
different ages. Additionally, case studies indicate that lower and higher estimates of Lt as per
the available formulations, will lead to lower shear resistance in the transmission zone of the
PTC members and lower estimate of bursting tensile stress in concrete, respectively. This could
lead to poor shear performance and failures of the PTC systems.
To overcome the challenges associated with the determination of the bond strength of
pretensioned strands in concrete, this thesis puts forward a new procedure to determine the bond
strength of strands in concrete. This examines the effects of the compressive strength of
concrete (fc), the prestress level (fps), and the embedment length of strands (le) on the determined
bond strength of strand. Pull-out specimens with a 12.7 mm dia. strand embedded in concrete
prisms (100×100 mm cross-section) were used for the study. Two prestress levels of 0.1 fpu and
0.7 fpu (taut and stressed strands, respectively), two le of 450 and 950 mm, and two fc of 43 and
62 MPa were used. There were significant variations on the bond stress slip behaviour between
the stressed and taut strands in concrete with different le. In the PTC systems, unlike the CRC
systems, the transmission length (Lt) plays a vital role in deciding the required embedment
length of strands in concrete. Therefore, the le should be at least more than twice the Lt of the
specimens. A total of 24 specimens were tested, and the - s curves indicated that the
conventional way of defining the b as the stress corresponding to 2.5 mm slip at the free end
is not suitable for the PTC specimens. Based on these, this thesis proposes a new method to
determine the b as an S-C interface parameter that is independent of le and fps and provides
results with less scatter. In this method, b is defined as the bond stress corresponding to the
yield point of the -s curve. Due to the relatively less cumbersome procedures to prepare the
test specimens with taut strands (instead of fully stressed strands), this method can be used as a
quality control test in the field.
viii
TABLE OF CONTENTS
ACKNOWLEDGEMENTS ................................................................................................ iv
ABSTRACT ......................................................................................................................... vi
TABLE OF CONTENTS ................................................................................................. viii
LIST OF FIGURES ......................................................................................................... xiii
LIST OF TABLES ......................................................................................................... xviii
NOTATIONS AND ABBREVIATIONS ........................................................................ xix
1 INTRODUCTION ........................................................................................................ 1
1.1 PROBLEM STATEMENT ............................................................................................ 1
1.2 DEFINITIONS ........................................................................................................... 4
1.3 RESEARCH QUESTIONS ............................................................................................ 5
1.4 OBJECTIVES AND SCOPE .......................................................................................... 6
1.5 RESEARCH METHODOLOGY ..................................................................................... 7
1.6 ORGANIZATION OF THE THESIS ............................................................................... 7
2 LITERATURE REVIEW ............................................................................................ 9
2.1 INTRODUCTION ....................................................................................................... 9
2.2 BOND MECHANISMS IN STEEL-CONCRETE SYSTEMS ................................................ 9
Conventional reinforced concrete (CRC) systems .................................... 9
2.3 BOND MECHANISMS IN PRETENSIONED CONCRETE (PTC) SYSTEMS ...................... 10
Prestress transfer mechanism from strand to the concrete ....................... 13
2.4 BOND STRENGTH DEFINITIONS AND FORMULATIONS FROM LITERATURE .............. 14
2.5 FACTORS AFFECTING THE BOND STRENGTH AND TRANSMISSION LENGTH OF THE
PTC SYSTEMS .................................................................................................... 16
Compressive strength of concrete (fc) ...................................................... 16
Diameter of strand (ds) ............................................................................. 21
Embedment length (le) ............................................................................. 21
ix
Surface conditions of the strand .............................................................. 22
Applied prestress (fps) and releasing method ........................................... 23
Time-dependent effect ............................................................................. 23
2.6 MEASUREMENT OF TRANSMISSION LENGTH .......................................................... 26
Demountable mechanical (DEMEC) strain gauges ................................. 26
Electrical strain gauge .............................................................................. 27
ECADA method ....................................................................................... 27
Laser-speckle imaging ............................................................................. 28
2.7 EXISTING CODES AND EMPIRICAL EQUATIONS FOR CALCULATING THE
TRANSMISSION LENGTH OF THE PTC SYSTEMS ................................................... 28
ACI 318 (2014) ........................................................................................ 28
AASHTO (2012), AS 3600 (2009), CSA A23 (2014), and
IS 1343 (2012) ......................................................................................... 29
BS 8110 (1997) ........................................................................................ 29
EN 2 (2004)/IRC 112 (2011) and fib MC (2010) .................................... 30
Other empirical models to determine the Lt ............................................. 31
2.8 EXISTING TEST METHODS FOR DETERMINING THE BOND STRENGTH OF THE PTC
SYSTEMS ............................................................................................................. 33
Moustafa test method ............................................................................... 35
ASTM A1081 test method ....................................................................... 35
ECADA Pull-out test method .................................................................. 36
Limitations of the existing test methods to determine the bond in the
PTC systems ............................................................................................ 36
2.9 EFFECT OF BOND AND ITS INFLUENCE ON THE STRUCTURAL BEHAVIOUR OF THE
PTC SYSTEMS .................................................................................................... 37
Effect of transmission length on the shear capacity of PTC systems ...... 38
End region reinforcement ........................................................................ 39
Critical sections for shear ........................................................................ 41
2.10 MODES OF FAILURE IN THE S-C BOND SYSTEM ..................................................... 42
2.11 SUMMARY ............................................................................................................ 43

x
3 RESEARCH NEEDS AND SIGNIFICANCE ......................................................... 44
3.1 RESEARCH NEEDS ................................................................................................. 44
3.2 RESEARCH SIGNIFICANCE ..................................................................................... 45
4 EXPERIMENTAL PROGRAM ............................................................................... 46
4.1 INTRODUCTION ..................................................................................................... 46
4.2 MATERIALS USED IN THE EXPERIMENTAL PROGRAMS AND THEIR PROPERTIES ...... 46
Prestressing strand properties .................................................................. 46
Cement properties .................................................................................... 48
Aggregate properties ................................................................................ 49
Superplasticizer ........................................................................................ 49
Concrete ................................................................................................... 50
4.3 OBJECTIVE 1: DETERMINATION OF THE TRANSMISSION LENGTH (Lt) AND ITS
EFFECT ON SHEAR CAPACITY OF THE PRISTINE PTC SYSTEMS ............................. 51
Experimental design ................................................................................ 51
Specimen geometry ................................................................................. 51
Preparation of Lt specimens ..................................................................... 52
Strain measurements and instrumentation ............................................... 57
4.4 OBJECTIVE 2: DETERMINATION OF BOND STRENGTH BETWEEN THE PRESTRESSED
STRANDS AND CONCRETE ................................................................................... 60
Specimen geometry ................................................................................. 60
Experimental design ................................................................................ 61
Casting of concrete and precautions ........................................................ 62
Pull-out test set-up and procedure ........................................................... 64
Instrumentation ........................................................................................ 66
4.5 SUMMARY ............................................................................................................ 67
5 RESULTS AND DISCUSSIONS – TRANSMISSION LENGTH (Lt) .................. 68
5.1 INTRODUCTION ..................................................................................................... 68
5.2 OBJECTIVE 1: EFFECT OF COMPRESSIVE STRENGTH AT TRANSFER (fci) ON
TRANSMISSION LENGTH (Lt) ................................................................................ 68

xi
5.3 EVALUATION OF THE EXISTING TRANSMISSION LENGTH MODELS ......................... 68
Comparison of available Lt models.......................................................... 69
The significance of transmission length .................................................. 73
5.4 DETERMINATION OF Lt USING DEMEC GAUGE ..................................................... 73
Human error on the DEMEC measurements ........................................... 74
Difference in DEMEC measurement using inserts and discs .................. 75
5.5 EFFECT OF COMPRESSIVE STRENGTH OF CONCRETE ON TRANSMISSION LENGTH ... 77
Development of empirical equation based on experimental results ........ 80
Comparision of the Lt obtained from the proposed model and various
codes ........................................................................................................ 82
5.6 EFFECT OF TIME ON THE MEASUREMENT OF Lt ...................................................... 85
5.7 INFLUENCE OF Lt ON SHEAR CAPACITY OF THE PTC SYSTEMS – A CASE STUDY .... 95
5.8 EFFECT OF OVERESTIMATION ON THE BURSTING STRESS IN THE TRANSMISSION
ZONE – A CASE STUDY ........................................................................................ 99
5.9 SUMMARY .......................................................................................................... 102
6 RESULTS AND DISCUSSION – BOND STRENGTH (b) ................................. 103
6.1 INTRODUCTION ................................................................................................... 103
6.2 LIMITATIONS ON DETERMINING BOND STRENGTH AS A FUNCTION OF ABSOLUTE
SLIP AT FREE/LIVE ENDS ................................................................................... 103
6.3 DETERMINATION OF BOND STRENGTH USING YIELD STRESS METHOD ................. 105
6.4 OBSERVED BOND STRESS-SLIP BEHAVIOUR ......................................................... 108
Bond stress-slip (-s) behaviour at live end PTC systems ..................... 108
Measured bond stress-slip relationship .................................................. 109
Bond stress - slip behaviour of taut and stressed strands embedded in
concrete .................................................................................................. 112
Difference between 2.5 and 0.9 yield ..................................................... 117
Modes of failure ..................................................................................... 123
6.5 FAILURE MECHANISM OF THE S-C BOND ............................................................. 125
6.6 SUMMARY OF OBJECTIVE 2 ................................................................................ 129

xii
7 CONCLUSIONS AND RECOMMENDATIONS ................................................. 130
7.1 SUMMARY OF THE STUDY ................................................................................... 130
7.2 CONCLUSIONS .................................................................................................... 130
Objective 1 – To determine and model the effect of compressive
strength at transfer (fci) on the transmission length (Lt) of pretensioned
concrete systems. ................................................................................... 130
Objective 2 – To develop a simplified procedure and determine the
bond strength of strand in concrete as a function independent of the
embedment length and prestress level. .................................................. 131
7.3 RECOMMENDATIONS FOR FUTURE WORK ............................................. 133
REFERENCES ................................................................................................................. 134
APPENDIX A - TEST PROCEDURE TO DETERMINE THE TRANSMISSION
LENGTH OF PRETENSIONED CONCRETE MEMBERS ............................... 145
APPENDIX B - TEST PROCEDURE TO DETERMINE THE BOND STRENGTH
OF STRANDS IN CONCRETE .............................................................................. 151
APPENDIX C – THE LOAD – SLIP RESPONSE AT LIVE AND FREE ENDS OF
THE SPECIMENS ................................................................................................... 157
APPENDIX D - THE BOND STRESS – SLIP RESPONSE AT LIVE AND FREE
ENDS OF THE SPECIMENS ................................................................................. 162
LIST OF PUBLICATIONS BASED ON THIS THESIS ............................................. 166
DOCTORAL COMMITTEE .......................................................................................... 169
CURRICULUM VITAE .................................................................................................. 170

xiii
LIST OF FIGURES
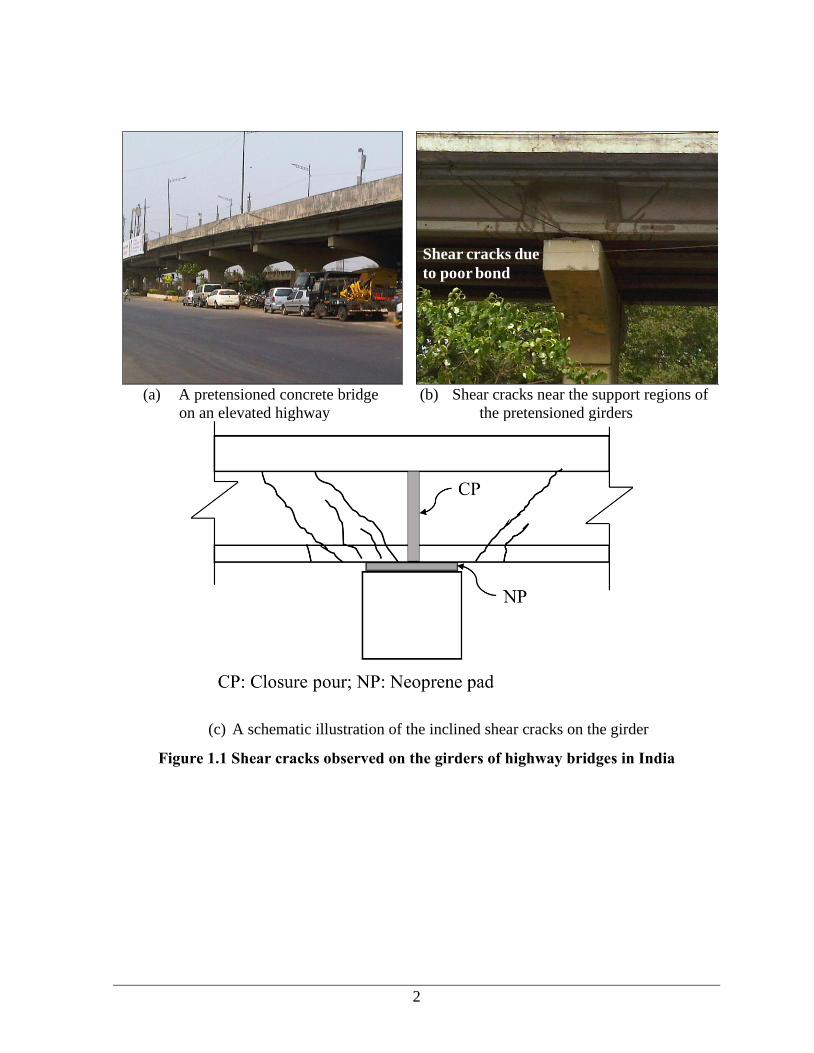
Figure 1.1 Shear cracks observed on the girders of highway bridges in India ................... 2
Figure 1.2 Shear cracks in the hollow-core slab member (Elliot, 2014)............................. 3
Figure 1.3 A chart showing the research methodology....................................................... 7
Figure 2.1 Bond mechanism in conventional reinforced concrete systems
(adapted from ACI 318-11) ............................................................................ 10
Figure 2.2 Bond mechanisms in pretensioned concrete systems ...................................... 11
Figure 2.3 The bond stress-slip behaviour of plain wire and seven-wire strands ............. 12
Figure 2.4 (a) Idealized stress development in the strand; (b) Strain development in the
steel and concrete at the transfer of prestress ................................................. 13
Figure 2.5 Bond stress as a function of the compressive strength of concrete ................. 17
Figure 2.6 Lt of the PTC members as a function of fci from literature data ...................... 18
Figure 2.7 The schematic representation of specimen geometry and set-up used in the
existing pull-out test methods ........................................................................ 34
Figure 2.8 Theoretical distribution of tensile stress in the transmission zone
(adapted from Raju, 2011) ............................................................................. 40
Figure 2.9 The schematic illustration of critical shear regions specified by ACI 318
and IS 1343 (2012) ......................................................................................... 41
Figure 4.1 Uniaxial tensile test setup for prestressing strands .......................................... 47
Figure 4.2 Stress-strain behaviour of prestressing strand ................................................. 48
Figure 4.3 The schematic representation of transmission length specimen geometry ...... 52
Figure 4.4 The schematic representation and photograph of prestressing bed with the
PTC specimen ................................................................................................ 53
Figure 4.5 Zoomed portions of various arrangement to apply and release the prestress .. 54
Figure 4.6 DEMEC insert arrangement for the preparation of the Lt specimens .............. 55

xiv
Figure 4.7 The schematic illustration of the DEMEC inserts used ................................... 56
Figure 4.8 The photograph of transmission length specimen ........................................... 57
Figure 4.9 The photograph of the DEMEC gauge used to take measurements ................ 57
Figure 4.10 Length change being measured using the DEMEC gauge ............................ 59
Figure 4.11 Strain measurement using the DEMEC gauge on the concrete surface ........ 59
Figure 4.12 The schematic diagram of bond test specimen configuration ....................... 60
Figure 4.13 The photograph of the pull-out specimens .................................................... 63
Figure 4.14 The details of the pull-out test set-up ............................................................ 65
Figure 4.15 The photograph of the experimental set-up used for the pull-out test ........... 66
Figure 5.1 Design Lt based on standards for different strengths of concrete at transfer ... 70
Figure 5.2 Calculated Lt using the empirical model equations from literature. ................ 70
Figure 5.3 Variation in DEMEC reading with different persons ...................................... 75
Figure 5.4 Placement of DEMEC inserts and pins on the concrete surface ..................... 76
Figure 5.5 Strain values using DEMEC inserts and pins .................................................. 76
Figure 5.6 Average strain on the concrete surface for fci = 23 MPa ................................. 78
Figure 5.7 Average strain on the concrete surface for fci = 28 MPa ................................. 78
Figure 5.8 Average strain on the concrete surface for fci = 36 MPa ................................. 79
Figure 5.9 Average strain on the concrete surface for fci = 43 MPa ................................. 79
Figure 5.10 Variation of Lt with the compressive strength of concrete at transfer ........... 81
Figure 5.11 The proposed bilinear model for Lt as a function of fci .................................. 81
Figure 5.12 Correlation between the Lt, estimated and Lt, measured .......................................... 82
Figure 5.13 Comparison of Lt models as function of fci .................................................... 83
Figure 5.14 Lt as a function of fci from literature and proposed model ............................. 85
Figure 5.15 Effect of time on Lt of fci 23– Specimen 1 (until 360 days) ........................... 86

xv
Figure 5.16 Effect of time on Lt of fci23– Specimen 2 (until 360 days) ............................ 86
Figure 5.17 Effect of time on Lt of fci23– Specimen 3 (until 360 days) ............................ 87
Figure 5.18 Effect of time on Lt of fci36– Specimen 1 (until 300 days) ............................ 88
Figure 5.19 Effect of time on Lt of fci36– Specimen 2 (until 300 days) ............................ 89
Figure 5.20 Effect of time on Lt of fci36- Specimen 3 (until 300 days) ............................ 89
Figure 5.21 Effect of time on Lt of fci28– Specimen 1 (at transfer and 7 days) ................ 90
Figure 5.22 Effect of time on Lt of fci28– Specimen 2 (at transfer and 7 days) ................ 91
Figure 5.23 Effect of time on Lt of fci28– Specimen 3 (at transfer and 7 days) ................ 91
Figure 5.24 Effect of time on Lt of fci43– Specimen 1 (at transfer and 28 days) .............. 92
Figure 5.25 Effect of time on Lt of fci43– Specimen 2 (at transfer and 28 days) .............. 93
Figure 5.26 Effect of time on Lt of fci43– Specimen 3 (at transfer and 28 days) .............. 93
Figure 5.27 Variation of Lt as a function of time .............................................................. 94
Figure 5.28 The cross section of hollow-core slab used in this case study ....................... 96
Figure 5.29 Shear resistance determined using fib MC (2010) ......................................... 97
Figure 5.30 Shear resistance determined using ACI 318 (2014) ...................................... 97
Figure 5.31 Shear resistance determined using IS 1343 (2012)........................................ 98
Figure 5.32 Distance from the end of the member to reach Vn, max ................................... 99
Figure 5.33 Cross section of a simple I girder (Source: Raju (2008)) ............................ 100
Figure 5.34 Tensile stress distribution in the transmission zone .................................... 100
Figure 5.35 Maximum tensile stress as a function of transmission length ..................... 101
Figure 5.36 Maximum tensile stress in the transmission zone........................................ 101
Figure 6.1 Cross section of 7-wire strand ....................................................................... 104
Figure 6.2 Determination of b using the bond yield stress method – Case 1................. 106
Figure 6.3 Determination of b using the bond yield stress method – Case 2................. 108

xvi
Figure 6.4 Movements at the live end in PTC systems (a) At preload and (b) During
the pull-out test ............................................................................................. 109
Figure 6.5 Representative bond stress-slip behaviour of taut strands with le = 450 mm
in fc = 43 MPa ............................................................................................... 110
Figure 6.6 Representative bond stress-slip behaviour of taut strands with le = 450 mm
in fc = 62 MPa ............................................................................................... 110
Figure 6.7 Representative bond stress-slip behaviour of taut strands with le = 950 mm
in fc = 62 MPa ............................................................................................... 111
Figure 6.8 Representative bond stress-slip behaviour of stressed strands with
le = 950 mm in fc = 62 MPa .......................................................................... 111
Figure 6.9 Bond stress-slip behaviour of fc43-T-S .......................................................... 113
Figure 6.10 Zoomed portions at yield point for fc43-T-S specimens .............................. 113
Figure 6.11 Bond stress-slip behaviour of fc62-T-S ........................................................ 114
Figure 6.12 Zoomed portions at yield point for specimens fc62-T-S .............................. 114
Figure 6.13 Bond stress-slip behaviour of long taut strands with le = 950 mm in
fc = 62 MPa concrete..................................................................................... 116
Figure 6.14 Bond stress-slip behaviour of stressed strand with le = 950 mm in
fc = 62 MPa concrete..................................................................................... 116
Figure 6.15 Determined 2.5 ............................................................................................ 119
Figure 6.16 Determined 0.9yield ..................................................................................... 120
Figure 6.17 Determined b as a function of compressive strength of concrete ............... 121
Figure 6.18 The difference in the b between the taut and stressed strands .................... 122
Figure 6.19 The S-C bond failure at the interface (with close-up views) ....................... 123
Figure 6.20 Damage of concrete keys at the interface .................................................... 124
Figure 6.21 Failure patterns in short and long specimens ............................................... 125
Figure 6.22 Changes at the S-C interface during the pull-out test (until yield) ............... 126

xvii
Figure 6.23 Mechanisms of bond failure at S-C interface .............................................. 128

xviii
LIST OF TABLES
Table 2.1 Bond equations from standards and literature................................................... 15
Table 2.2 Effect of compressive strength of concrete on the measured transmission
length .............................................................................................................. 20
Table 2.3 Changes in Lt with time (from literature) .......................................................... 25
Table 2.4 Lt formulations from standards ......................................................................... 31
Table 2.5 Empirical and analytical formulations to determine Lt from literature ............. 32
Table 2.6 Materials, prestress effect, and pull-out test method considered in the
existing test methods ...................................................................................... 35
Table 2.7 Equations provided in various codes/standards for web shear capacity ........... 39
Table 4.1 Chemical composition of the prestressing strand ............................................. 46
Table 4.2 Chemical composition of Ordinary Portland Cement 53S................................ 48
Table 4.3 Physical properties of Ordinary Portland Cement 53S ..................................... 49
Table 4.4 Physical properties of the aggregates ................................................................ 49
Table 4.5 Details of concrete mix proportions .................................................................. 50
Table 4.6 Properties of concrete........................................................................................ 50
Table 4.7 Experimental design for Objective 1 ................................................................ 51
Table 4.8 Experimental design showing the test variable and its combination ................ 61
Table 5.1 Parameters considered in different standard Lt equations ................................. 71
Table 5.2 Experimental parameters at transfer and measured Lt ...................................... 77
Table 5.3 The ratio of Lt, code/Lt, estimated .............................................................................. 84
Table 6.1 Bond strength of taut strands (le = 450 mm) in fc = 43 and 62 MPa concrete 115
Table 6.2 Experimentally obtained b of taut and stressed strands with le = 950 mm in
fc = 62 MPa concrete .................................................................................... 117

xix
NOTATIONS AND ABBREVIATIONS
NOTATIONS
Proportionality constant and coefficient used in the Lt equation by Barnes et al. (2003)
and Pellegrino et al. (2015)
1 Factor to account for the releasing method
2 Factor to account for the type of strand in EN 2 (2004) and the action effect in
fib MC (2010)
3 Factor to account for pretensioned strand in fib MC (2010)
1
Upper, mean, and lower bound value of
2 and 3 Experimental constants
p1
Factor to account for the type of tendon in fib MC (2010)
p2
Factor to account for the position of the tendon in fib MC (2010)
,,
Coefficient used in the Lt equation Pellegrino et al. (2015)
Factor to account for low-density concrete
Helical angle of the strand ()
Ɛce Effective strain on the concrete surface (mm/mm)
Ɛpi Strain in the strand due to initial prestress before losses (mm/mm)
Ɛpe Effective strain in the strand (mm/mm)
Ɛps(x) Strain in strand at x distance after transfer (mm/mm)
Ɛc(x) Strain on the concrete surface at x distance (mm/mm)
Ɛc, max Maximum strain on the concrete surface (mm/mm)
Ɛc(x) Smoothened strain on the concrete surface at x distance (mm/mm)
p Strain difference in the strand with adjacent concrete (mm/mm)

xx
l Change in length (mm)
lnc Elastic deformation of strand portion outside the concrete (mm)
Bond stress (MPa)
01/ Average bond stress corresponding with the pull-out force @ 0.1 in/2.5 mm slip (MPa)
b Bond strength between the strand and concrete (MPa)
b, taut Bond strength of the taut strands in concrete (MPa)
b, stressed Bond strength of the stressed strands in concrete (MPa)
yield Bond stress at the yield point on -s curve (MPa)
c Resistance factor for concrete
p Resistance factor for prestressing tendons
bw Width of the cross section at the centroid (mm)
d Effective depth of the member (mm)
do Diameter of outer wire of the strand (mm)
ds Diameter of prestressing strand (mm)
fbpt
Bond stress at the time of releasing (MPa)
fc Compressive strength of concrete at pull-out testing (MPa)
fci Compressive strength of concrete at release (MPa)
fck Characteristic compressive strength of concrete (MPa)
fcp Concrete stress due to effective prestress at centroid (MPa)
fctd
Design tensile strength of concrete (MPa)
ft Maximum principal tensile stress (MPa)
fpe Effective stress in prestressing steel after allowance for all prestress losses (MPa)
fpi Initial prestress of strand before losses (MPa)

xxi
fps Applied prestress (MPa)
fpu Ultimate tensile stress in strand (MPa)
fv Transverse tensile stress at the centroid of the end face (MPa)
l Length of strand at LE (mm)
le Length of embedded strand in concrete (mm)
lbb Length of bonded breaker in concrete (mm)
lnc Length of strand portion outside the concrete – not in contact (mm)
lx Distance of section considered from the starting point of the Lt (mm)
k Risk factor
k1 Factor to account for the distance of section considered from Lt
p Circumference of the strand (mm)
s Bond slip (mm)
s01/s2.5 Bond slip at 0.1 in/2.5 mm
s(x) Bond slip at any load ‘x’(mm)
A Cross-sectional area of the concrete (mm2)
Aps sum of cross-sectional areas of seven wires in a strand (mm2)
Asv Area of vertical steel required (mm2)
D Overall depth of the member (mm)
Fbat Transverse tensile force (kN)
Fb Bearing force at the S-C interface (kN)
Fs Shear force at the S-C interface (kN)
I Moment of inertia of gross cross section (mm4)
Kt Factor to represent the type of tendon in BS 8110 (1997)
L Length of the specimen (mm)

xxii
Lb Bond length (mm)
Ld Development length (mm)
Lt Transmission length (mm)
Lt, code Lt value obtained using codal equations (mm)
Lt, estimated Calculated Lt based on the proposed model (mm)
Lt, n Lt measured at nth day (mm), where n = 0, 7, 28, 120, 180, 270, 300, 360 days
N Normal force at the S-C interface (kN)
M Internal moment due to prestress (N mm)
P Axial pull-out force (kN)
P0 Applied pre load before slipping (kN)
Pmax Maximum axial pull-out force (kN)
Ps Applied load at s mm slip (kN)
PT Axial prestressing force at transfer (kN)
Q Moment of the area (mm3)
Vc Shear capacity contributed by the concrete (kN)
Vci Ultimate shear resistance of cracked section in flexure (kN)
Vcw Ultimate shear resistance of uncracked section (kN)
Vn Nominal shear resistance of concrete (kN)
Vp Vertical component of the effective prestress (kN)
Vs Shear capacity contributed by stirrups (kN)
Vn, max Maximum shear resistance (kN)

xxiii
ABBREVIATIONS
AASHTO American Association of State Highway and Transportation
ACI American Concrete Institute
AMA Anchorage Measurement System
AMS Average Maximum Strain
AS Australian Standard
ASTM American Standard Test Method
BS British Standard
CRC Conventional Reinforced Concrete
CSA Canadian Standard Association
DEMEC Demountable Mechanical Gauge
ECADA Ensayo para Caracterizar la Adherenciamediante Destesado y Arrancamiento
FE Free End
HCC Hollow Core Concrete
IRC Indian Road Congress
IS Indian Standards
JE Jacking End
LE Live End
LVDT Linear Variable Differential Transducer
NASP North American Strand Producers
PTC Pretensioned Concrete
RE Releasing End
S-C Strand-Concrete
SCC Self-Compacting Concrete

1
1 INTRODUCTION
1.1 PROBLEM STATEMENT
Pretensioned concrete systems (PTC) with seven-wire strands are widely used as girders in
bridges/buildings and hollow-core slabs in buildings. In the PTC elements, the prestress from
the strand is transferred to the surrounding concrete through the bond between the strand and
concrete, say Strand-Concrete (‘S-C bond’, herein). If the prestress is not adequately
transferred within a particular distance from the free end of strands, the shear critical sections,
near the support, may not have the required prestress to resist the applied shear stresses. The
length of a strand required to develop the effective prestress (fpe) from the strand to concrete is
defined as Lt. An inadequate transmission length (Lt) could result in shear cracks under the
external loading (Elliott, 2014). Figure 1.1 shows a classic case of inclined shear cracks
observed in highway bridge girders, in Mumbai, India - necessitating a standard quality control
test for the b of the PTC systems. Such shear cracks can occur due to (i) low strength concrete,
(ii) poor construction practices, (iii) low bond strength, and (iv) inadequate design provisions
for Lt. Similar kind of failure can be observed in slabs/beams used in buildings under loading
conditions. Figure 1.2 shows an instance of shear failure of precast pretensioned hollow core
slab due to inadequate Lt under loading (Elliot, 2014).
The shear demand is usually high in the transmission zones, say near the support regions
of the PTC systems. The underestimation of Lt can lead to less conservative shear designs.
Therefore, a realistic estimation of the Lt is essential for achieving an adequate shear capacity,
especially for the precast pretensioned hollow-core slabs which do not have shear
reinforcements. Various factors associated with concrete and strand properties can influence
the Lt. However, some design standards do not account for these factors and they could result
in an inadequate Lt. This research work examines the existing formulations for estimating the
Lt, their limitations, and the experimental observations on the influence of the compressive
strength of concrete and time on the Lt. Both underestimation and overestimation of the Lt have
their significance on the structural performance of the PTC members that are addressed in this
study.
2
(a) A pretensioned concrete bridge
on an elevated highway
(b) Shear cracks near the support regions of
the pretensioned girders
(c) A schematic illustration of the inclined shear cracks on the girder
Figure 1.1 Shear cracks observed on the girders of highway bridges in India
Shear cracks due
to poor bond

3
(a) Use of hollow-core slabs in a
commercial building; Courtesy:
https://infogram.com
(b) Occurrence of shear crack due to the
inadequate Lt
(c) A schematic representation of the inclined shear cracks in the HCS member
Figure 1.2 Shear cracks in the hollow-core slab member (Elliot, 2014)
The transmission length of the PTC members depends on the bond between the
pretensioned strand and concrete. If the bond of the PTC members is inadequate, then it could
substantially reduce the structural performance. Eventually, this could cause shear failure at
the ends and flexural cracks in the members. The bond action is not only necessary to provide
an adequate safety by allowing the strand and concrete to work together, but also to control the
structural behaviour by offering an adequate level of ductility (fib Bulletin 10, 2000). The
failure of the S-C bond can lead to structural cracks, which can provide easy access for the
Inclined Shear cracks

4
deleterious elements causing premature and localized corrosion of the embedded strands.
Therefore, ensuring the sufficient S-C bond strength (b) is essential to achieve the desired
safety and service life for the PTC structures. State-of-the-art design procedures and
construction materials/practices are available to ensure the adequate S-C bond. Also, very
limited information is available on the bond stress-slip behaviour of the PTC systems unlike
the conventional reinforced concrete (CRC) systems, which is important to define the bond
strength of the PTC systems. Also, many standards and literature follow the same bond strength
definition or failure condition of rebar for strands using 2.5 mm slip method. However, these
conditions may not be valid for strands. This research work presents the laboratory tests
conducted at IIT Madras. Based on this study, a relatively easy-to-prepare pull-out test
specimen and an evaluation procedure that minimizes the effects of the embedment length (le)
and prestress applied (fps) on the determined b is proposed to use as a quality control measure
at the site.
1.2 DEFINITIONS
This section catalogues the definitions of some keywords used in this thesis work.
i. 7-wire strand: Six outer wires wound helically around a king wire.
ii. Bond length (Lb): Length of embedded pretensioned strand, required to develop the
ultimate prestress from the effective prestress when the member is loaded (see Figure
2.4).
iii. Bond slip (s): The relative axial movement between strand and concrete.
iv. Bond strength (b): The maximum bond stress that a strand-concrete system can
sustain before failure.
v. Bond stress (): Shear stress experienced by the strand-concrete interface
vi. Development length (Ld): Length of the embedded pretensioned strand, required to
develop the design strength of steel at a critical section under service.
vii. Effective prestress (fpe): Stress remaining in the prestressing strand after losses due to
elastic shortening and seating just after transmission of prestress.

5
viii. Embedment length (le): Embedded length of strand in the concrete or cement grout
specimens or length of strand in contact with the surrounding concrete/cement grout.
ix. Free end (FE): The end of pull-out specimen, where the strand is not gripped and kept
free.
x. Initial prestress (fpi): The initial stress applied to tension the strand before casting of
concrete.
xi. Live end (LE): The end of pull-out specimen, where the strand is gripped to apply load
during pull-out test.
xii. Stress adjusting system: A plate welded with three hexagonal nut-bolt used as stress
adjusting system to stress/release the stress in the strand.
xiii. Stressed strands: Strands experiencing an initial prestress of about 0.7fpu.
xiv. Taut Strands: Strands experiencing an initial prestress of about 0.1 fpu (to keep the
strands straight).
xv. Transmission length or Transfer length (Lt): Length of embedded pretensioned strand
required to transfer the effective prestress from strand to concrete.
1.3 RESEARCH QUESTIONS
i. Are the existing formulations for the design transmission length of the PTC systems
conservative? What does the overestimation/underestimation of Lt imply on the
structural performance of the PTC systems? – See Chapter 5 for results
ii. Does the compressive strength of concrete at transfer influence the length needed to
transfer the prestress from the strand to concrete? If so, should it be considered to
determine the transmission length? – See Chapter 5 for results
iii. Does the transmission length of pretensioned concrete systems change as a function of
age or exposure period? – See Chapter 5 for results
iv. Do the existing test methods to determine the bond strength between the strand and
concrete represent the true conditions of PTC systems? – See Chapter 6 for results

6
v. Is the conventional method of determining the bond strength based on an absolute slip
of 2.5 mm at free end valid for the PTC systems? – See Chapter 6 for results
vi. Do prestress level and embedment length of strand influence the performance of
strand-concrete bond? – See Chapter 6 for results
1.4 OBJECTIVES AND SCOPE
Following are the objectives of this research work. The points following each objective indicate
the scope of the work.
1. To determine and model the effect of compressive strength at transfer (fci) on the
transmission length (Lt) of pretensioned concrete systems.
• Initial prestress: 0.75 fpu
• Compressive strength of concrete at transfer (fci): 23, 28, 36, and 46 MPa.
• Cross section of specimen: (100 × 100) mm
• Time effect: 3 to 360 days
2. To develop a simplified procedure and determine the bond strength of strand in concrete
as a function independent of the embedment length and prestress level.
• Applied prestress (fps): 0.1 fpu and 0.7 fpu
• Compressive strength of concrete at testing (fc): 40 and 60 MPa
• Embedment length of strand (le): 450 and 950 mm
• Cross section of specimen: (100 × 100) mm

7
1.5 RESEARCH METHODOLOGY
An experimental research methodology designed to meet the objectives is formulated as shown
in Figure 1.3. The experimental programs that are developed to achieve the research objectives
are discussed in Chapter 4.
Figure 1.3 A chart showing the research methodology
1.6 ORGANIZATION OF THE THESIS
This thesis comprises seven chapters and two appendices. Following is a brief explanation of
the components of the thesis.
Chapter 1 presents the research problem which the thesis attempts to address. This
chapter defines the terminology used in the study, highlights the research questions and
hypothesis, and frames the objective and scope of the work. An overview of the research
methodology formulated to address the objectives are also presented.

8
Chapter 2 considers a critical review on factors affecting the transmission length and
bond strength of the PTC members, the available test methods and their limitations in
determining the transmission length and bond strength. Also, it reviews the available
codal/literature formulations to determine the transmission length and bond strength, and the
significance of bond strength on the structural behaviour of the PTC systems to identify the
research gap to be addressed.
Chapter 3 emphasises the research needs and significance of the thesis.
Chapter 4 consists of the details of materials, geometry of the specimens, experimental
design, and methods used in the experimental program to achieve the objectives of this study.
Chapter 5 evaluates the transmission length using different standard equations from
literature and describes the result and discussion of the experimental investigation on
transmission length. It highlights the significance of the compressive strength of concrete at
transfer and time on the transmission length of the member. It also provides two case studies
to understand the significance of transmission length on the shear capacity of the PTC members.
Chapter 6 elaborates the results and discussions on the bond performance of the PTC
members. It details the challenges associated with the bond measurements and explains the
bond slip behaviour of different embedment length of strand in concrete under different applied
prestress levels. Based on the experimental study, this chapter proposes a new method to
determine the bond strength of the PTC members.
Chapter 7 summarizes the conclusions of each objective drawn from this study and
also recommends the scope for future research.
Appendix A explains the procedure to determine the transmission length of the PTC
members.
Appendix B details the technique to determine the bond strength of strands in concrete.
Appendix C provides the load – slip response at LE and FE of the specimens.
Appendix D provides the bond stress – slip response at LE and FE of the specimens.
9
2 LITERATURE REVIEW
2.1 INTRODUCTION
This chapter provides a critical review on the transmission length and bond performance of the
pretensioned concrete systems. The chapter starts with a discussion on the bond mechanisms
in the steel-concrete systems. Then, various factors affecting the transmission length (Lt) and
bond strength (b) of the PTC systems are reviewed. Next, the challenges in the measurement
of Lt is mentioned. Following this, a review on the existing codes and empirical equations
available in the literature to calculate the Lt and b of the PTC systems is presented. This is
followed by a review of existing test methods and its limitations to determine the Lt and b of
the PTC systems. Then finally, the effect of bond and its influence on the structural
performance of the PTC systems and failure modes of strand-control bond are reviewed.
2.2 BOND MECHANISMS IN STEEL-CONCRETE SYSTEMS
The bond allows the strand and concrete to work together as a composite material under service
loading. When the load is applied, the strand tends to move in the applied load direction. This
relative movement between the strand and concrete is prevented by the bond. If the bond is
inadequate to prevent the movement, bond failure will occur due to excessive slip of the
prestressing strand. Based on the relative movement between strand and concrete, bond
mechanisms are mainly contributed by three factors: adhesion, mechanical interlock, and
friction. However, these bond mechanisms are significantly different in conventionally
reinforced concrete (CRC) and the pretensioned concrete (PTC) systems that are explained in
the following sections.
Conventional reinforced concrete (CRC) systems
In the CRC systems, the bond between the steel and concrete is achieved by the following three
mechanisms; 1) Chemical adhesion between the steel bar and the concrete; (2) Frictional forces
arising from the roughness of the interface, and 3) Mechanical anchorage or bearing of the ribs
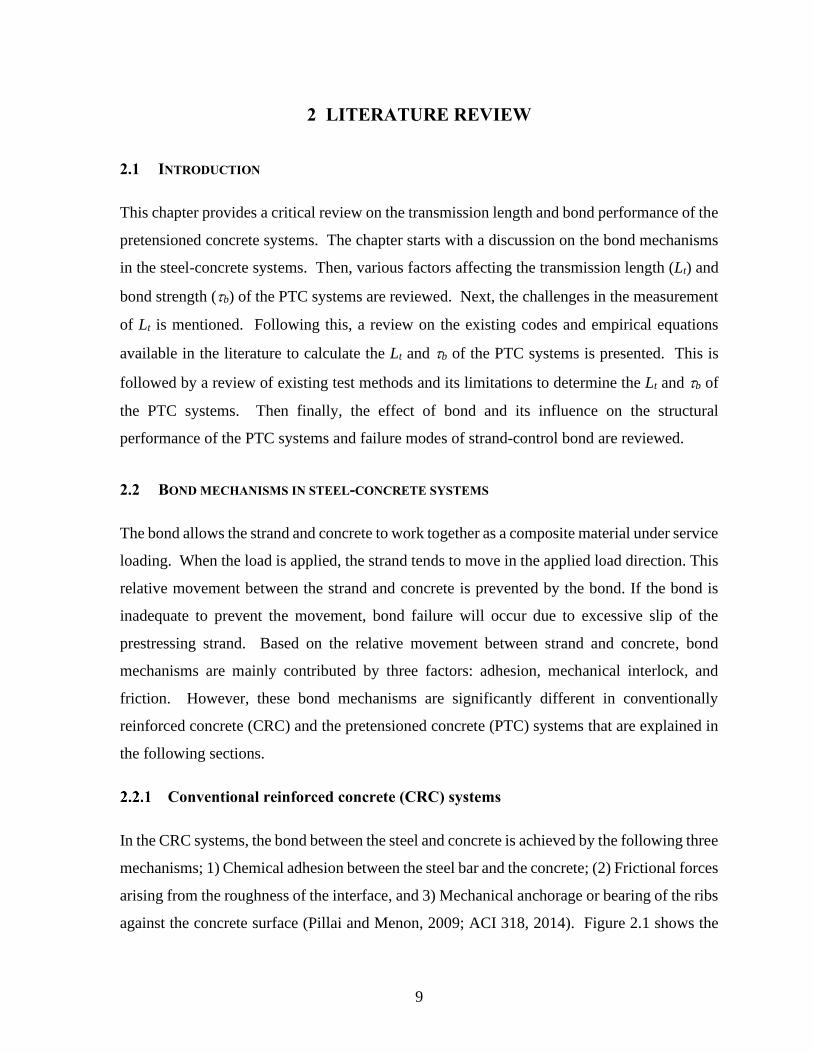
against the concrete surface (Pillai and Menon, 2009; ACI 318, 2014). Figure 2.1 shows the
10
bond mechanism of the CRC systems. The bond strength was initially contributed by adhesion
mechanism due to the presence of chemicals on the steel surface, but the resistance by this
mechanism is destroyed once the strand slips. Then, friction contributes to bond. However,
this becomes inefficient with increasing slip between the rebar and concrete. Further, the bond
resistance is majorly contributed by the bearing stress due to mechanical interlock.
Figure 2.1 Bond mechanism in conventional reinforced concrete systems
(adapted from ACI 318-11)
The S-C bond in the CRC systems is well studied and many bond-slip models have
been derived based on the experimental test results (Mirza and Houde, 1979; Alsiwat and
Saatcioglu, 1992; Song et al., 2015). fib MC10 proposes a general bond stress-slip model to
calculate the bond stress subjected to monotonic loading. Also, AS 3600 (2009) and
ACI 318 (2011-2014) propose a bond model to calculate the bond stress of deformed steel bar
in concrete. The following section explains how different these mechanisms are in the PTC
systems.
2.3 BOND MECHANISMS IN PRETENSIONED CONCRETE (PTC) SYSTEMS
The S-C bond mechanisms in the PTC systems are also contributed by adhesion, mechanical
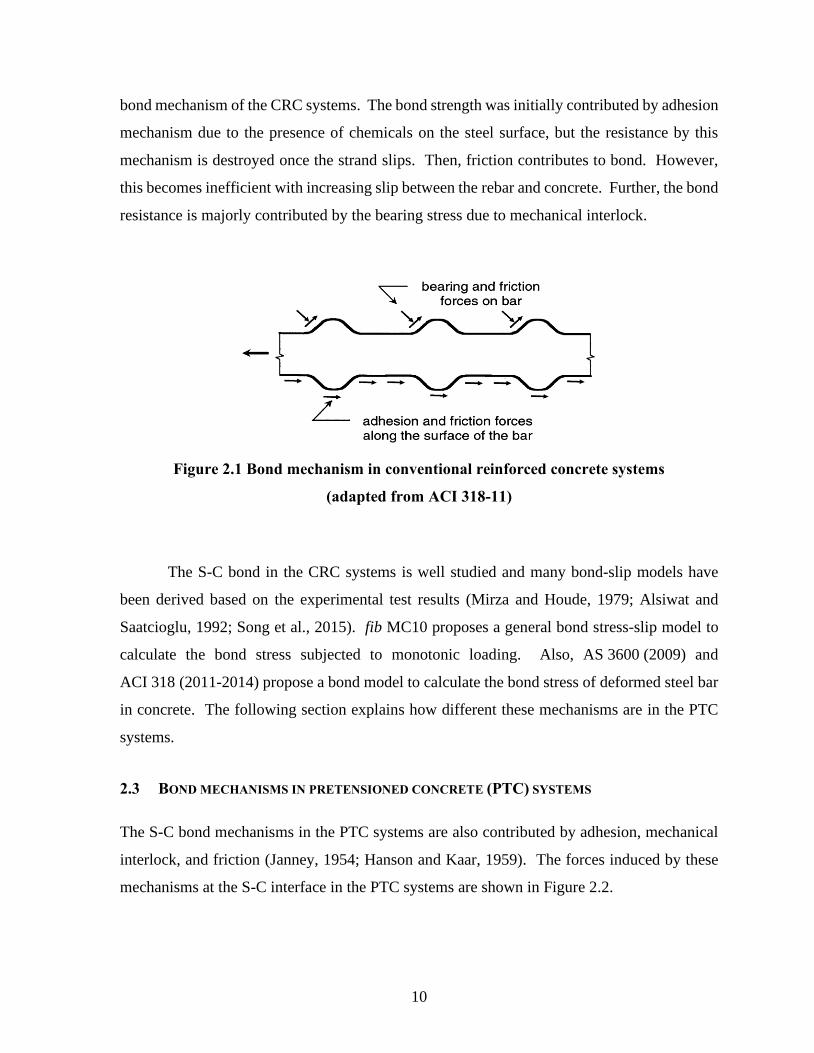
interlock, and friction (Janney, 1954; Hanson and Kaar, 1959). The forces induced by these
mechanisms at the S-C interface in the PTC systems are shown in Figure 2.2.
11
Figure 2.2 Bond mechanisms in pretensioned concrete systems
Adhesion plays a minimal role in transferring the prestress as the slipping of the strand
with respect to the hardened concrete during the stress transfer can destroy the adhesive bond
(Barnes et al., 2003). At the ends of the members, this effect would be lost at transfer. Then,
the friction and mechanical interlock mechanisms play a significant role in the PTC systems.
The friction is developed by the Hoyer effect and confinement of concrete. During prestressing,
the strand is elongated and when the prestress is transferred to the surrounding hardened
concrete, the strand tries to shorten longitudinally and expand laterally due to Poisson’s effect.
However, the surrounding confined concrete provides wedge action and induces compressive
stresses perpendicular to the S-C interface. As a result, the frictional force is increased, which
in turn enhances the bond. This phenomenon is known as the Hoyer effect (Hoyer and
Friedrirch, 1939). Therefore, in the PTC systems, the Poisson’s effect plays a key role in
influencing the bond stress, particularly when the strand is in the elastic stage as it induces the
wedging action at the S-C interface (fib Bulletin 10, 2000).
Normal pressure and bond stress are high at the end of the member and gradually get
decreased over the Lt and become negligible at the end of the transmission zone (Abdelatif et
al., 2015). However, at loading or service conditions, the increase in the prestressing strand
stress could counteract the Hoyer effect by decreasing the strand diameter due to the Poisson’s
effect. This phenomenon could reduce the frictional bond mechanism and consequently,
increases the significance of the mechanical bond mechanism [Hanson and Kaar, 1959 and
Gustavason, 2004]. The mechanical interlock occurs due to the spiral twisting of the outer
12
wires that form the strand. This helical shape of the strand results in the bearing stress between
the strand and concrete which contributes to the bond stress development.
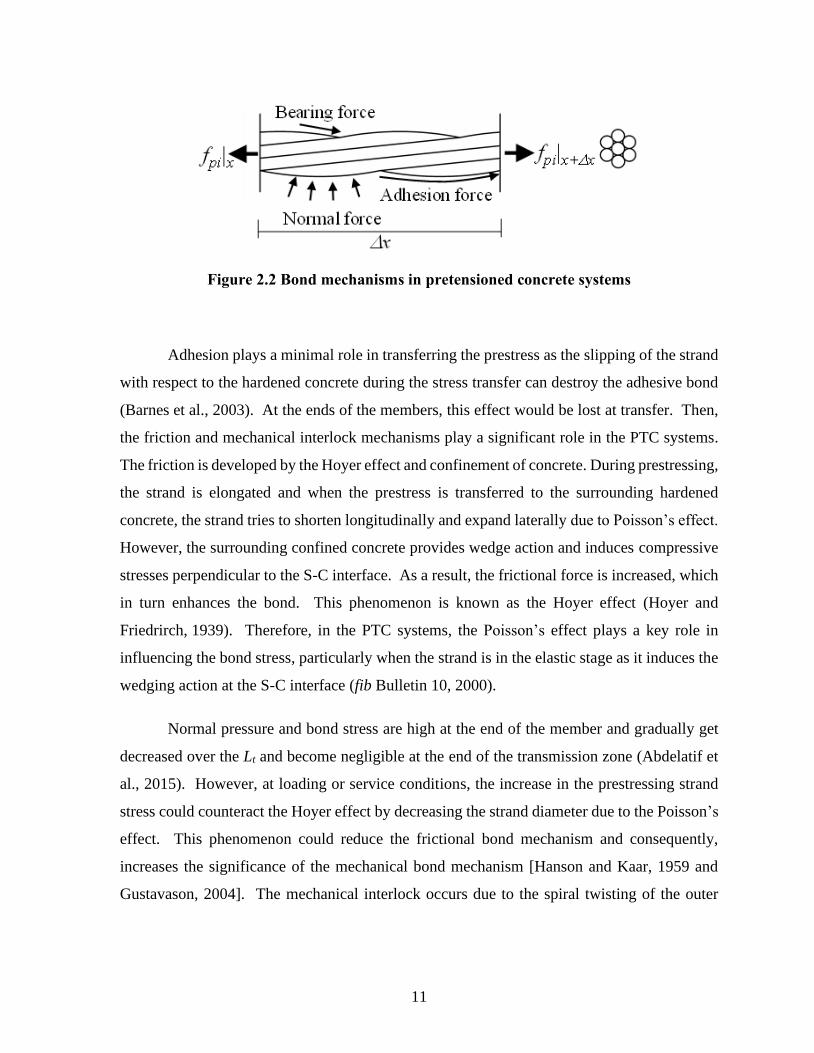
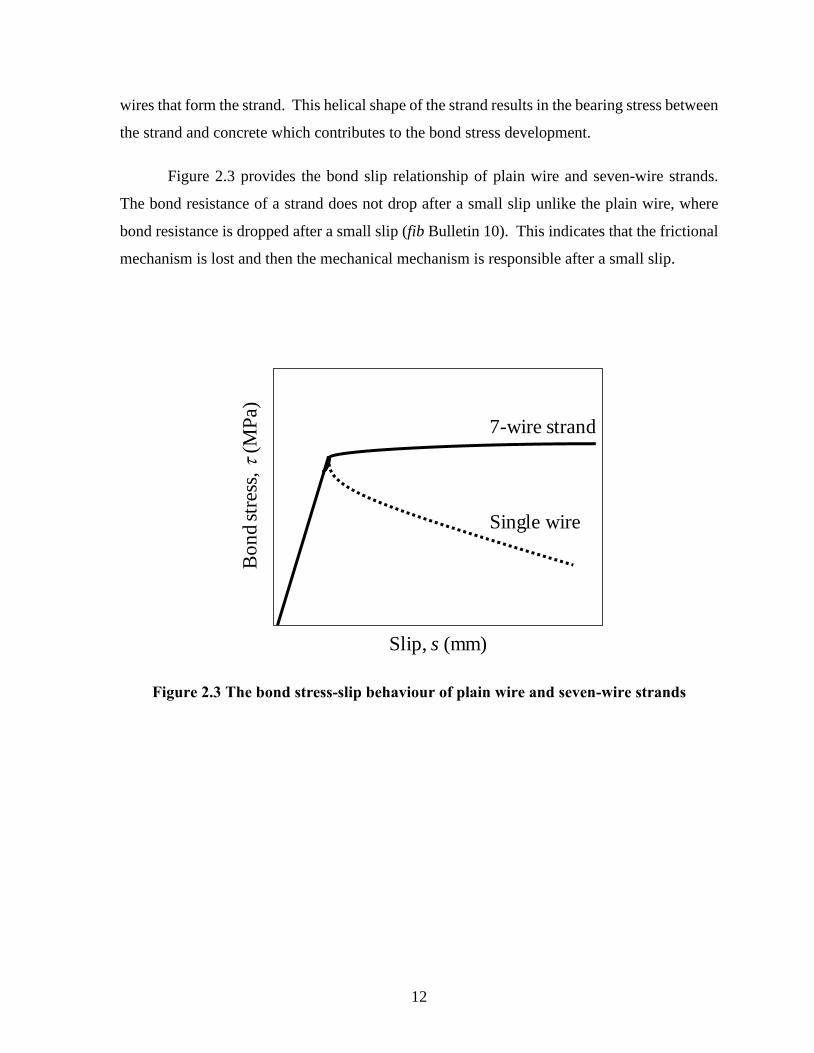
Figure 2.3 provides the bond slip relationship of plain wire and seven-wire strands.
The bond resistance of a strand does not drop after a small slip unlike the plain wire, where
bond resistance is dropped after a small slip (fib Bulletin 10). This indicates that the frictional
mechanism is lost and then the mechanical mechanism is responsible after a small slip.
Figure 2.3 The bond stress-slip behaviour of plain wire and seven-wire strands
7-wire strand
Single wire
Bo
nd
str
ess,
(M
Pa)
Slip, s (mm)

13
Prestress transfer mechanism from strand to the concrete
Figure 2.4(a) shows the idealised bilinear curve exhibiting the development of stress in the
strand along the distance ‘x’ from the end of the member. As shown, by Line 1, stress at the
end of the member (at x = 0) is zero and gradually it increases to fpe at the end of the
transmission zone (at x = Lt) (ACI 318, 2014; AASHTO, 2012).
Figure 2.4 (a) Idealized stress development in the strand; (b) Strain development in the
steel and concrete at the transfer of prestress

14
Further, as depicted by Line 2, under ultimate loading conditions, the stress along the
strand increases linearly from fpe (at x = Lt) to the ultimate stress (fpu) (at x = Ld). The length
required to increase the stress in the strand from fpe to fpu is defined as the bond length (Lb),
which is the difference between Ld and Lt. The bond existing along the Lt and Ld is called
transmission and development bond, respectively. Figure 2.4 (b) shows the strain in the strand
(ps) and strain on the concrete surface (c) at prestress transfer. The pe and ce are effective
strains (after the initial losses) in the strand and on the concrete surface, respectively. The sum
of pe and ce is equal to the p - strain difference in the strand with adjacent concrete.
2.4 BOND STRENGTH DEFINITIONS AND FORMULATIONS FROM LITERATURE
The stress developed at the S-C interface is called bond stress and it is expressed in terms of
the tangential force per unit surface area of the strand (Pillai and Menon, 2009). As per ASTM
A1081, the bond strength (b) can be determined by measuring the pull-out force corresponding
to 2.5 mm slip at the free end (FE) of the strand. Many researchers have used this method to
determine the bond strength (Riding et al., 2016; Dang et al., 2014a). Table 2.1 provides the
formulae for determining the bond stress () of the PTC systems from literature. EN 2 (2004)
and fib MC (2010) codes present the formulations for b that could be used for both CRC and
PTC systems. In addition to the formulations, fib MC (2010) considers the load vs slip
relationship using which, between the concrete and reinforcing steel can be calculated as a
function of slip (s). Several analytical works were carried out to understand the bond
mechanisms of the PTC systems (Baláz, 1992; Oh et al., 2006; Martí-Vargas, 2012a; Dang et
al., 2015). Based on the load vs slip relationship from the fib code, Balaz (1992) proposed an
analytical equation for the S-C bond stress along the Lt. Similarly, Dang et al. (2015) adapted
the -s model for rebars from fib MC (2010) by incorporating a coefficient ‘kb’ to calibrate the
b for strands with and without stress. Martí-Vargas (2012b) proposed a bond stress equation
along the length of the Lt based on the compatibility conditions. However, the effect of applied
prestress (fps) on -s behaviour for the PTC systems is not well addressed in the literature (ACI
318, 2014; CSA A23, 2004; fib MC, 2010; IS 1340, 2012; Martí-Vargas et al., 2006; Shin et
al., 2018). The conventional way of determining b using 2.5 mm slip method found not valid
for the PTC conditions and that are explained later in Chapter 6

15
Table 2.1 Bond equations from standards and literature
Reference Bond equation
fib MC (2010), EN 2
(2004)/IRC 112 (2011)
τb=p1
p2
fctd
p1 – 1.2 and 3.2 for fib MC and EN/IRC, respectively
p2 – 1 for bond conditions
Baláz (1992)
τb=1
2fci
0.5 (s
ds
)3
1 – 1.35, 1, 0.65 for the upper, mean, and lower bound of
2 and 3 – 2.055 and 0.25 experimental constants
Martí-Vargas (2012b)
τb=PT
43⁄ πdsLt
PT – Prestressing force transferred
Lt – Transmission length
ds – Nominal diameter of the strand
Dang et al. (2015)
(x)=kbτ01 (s(x)
s01
)α
kb – Calibration coefficient
01 – Bond stress corresponding to the pull-out force of P01
s01 – Free end slip of 0.1 in. (2.5 mm)
(x) – Bond stress at any location x
s(x) – Strand slip at any location x
- Exponential factor of bond stress-slip model
16
2.5 FACTORS AFFECTING THE BOND STRENGTH AND TRANSMISSION LENGTH OF THE PTC
SYSTEMS
The transmission length of the PTC members depends on the bond strength between the strand
and concrete. If the S-C bond is adequate, the length required to transfer the prestress would
be less – hence, the Lt would be less. Therefore, the factors affecting the bond strength would
also influence the Lt of the members. This section discusses the influence of these factors on
the b and Lt of the PTC members. Several factors like the compressive strength of concrete
(fc), cement content, water to cement ratio, embedment length of strand (le), applied prestress
level (fps), diameter of the strand (ds), texture and surface condition of the strand, confinement
due to the presence of stirrups, method of prestress transfer (gradual or sudden), and other
time-dependent effects (creep and shrinkage) can affect the Lt and bond strength of the PTC
members (Mitchell et al., 1993; Zia and Mostafa, 1997; Rose and Russell, 1997; Oh and Kim,
2000; Oh et al., 2006; Martí-Vargas et al., 2012; Martí-Vargas et al. 2013a; Dang et al., 2014a;
Dang et al., 2014b; Abdelatif et al., 2015; Dang et al., 2015; Ramirez-Garcia et al., 2017; Dang
et al., 2016a). The influence of these factors on b is well established for the CRC systems
(Desnerck and Khayat, 2014; Mousavi et al., 2017; Shen et al., 2016; Sulaiman et al., 2017;
Yalciner et al., 2012; Zhao et al., 2016). However, limited works are available for the PTC
systems. Following is the discussion on these factors.
Compressive strength of concrete (fc)
In practice, the prestress is transferred when the concrete attains about 60% of its target
characteristic compressive strength (fck). The increase in stiffness of the concrete improves the
S-C bond by providing more resistance to the slip (Barnes et al., 2003). Generally, bond
resistance is proportional to (fc) , where is the variable ranges between 0.5 and 0.67 for the
CRC systems (Harajli et al., 1995). A few literature data have been collected and plotted as
shown in Figure 2.5 to understand its significance on the bond stress of the PTC members. It
indicates that with the increase of fc, the b increases. However, a lot of scatter was observed
between the results in various literature (Abrishami and Mitchell, 1993; Brearley and Johnston,
1990; Cousins et al., 1990; Haq, 2005; Martí-Vargas et al., 2012 and 2013b). The scatter could
be due to the difference in the geometry, the applied prestress levels, and test methods used for

17
the determination of b. The test methods used to determine the b and their limitations are
explained in the later section. There is a need to develop a test method that provides an estimate
of b as a parameter that is independent of the geometry and prestress levels of the test
specimen.
Figure 2.5 Bond stress as a function of the compressive strength of concrete
In the PTC systems, due to the Hoyer effect, the induced radial compressive stresses at
the interface depend on the tensile strength of the strand. Thus, as the compressive strength of
concrete increases, the resulting frictional stresses also increase. This results in shorter Lt due
to improved bond (Oh and Kim, 2000 and Martí-Vargas et al., 2012). Table 2.2 provides the
details of materials and geometry used in the literature. It was observed that the length of the
specimems used to determine the Lt typically varied from 2 to 5 m. The table also provides
the experimentally obtained Lt from literature. The Lt was significantly decreased by about
30% when the fci increases from 35 to 70 MPa (Martí-Vargas, 2012b) – similar to the
observations obtained in the current study.
Compressive strength of concrete, fc (MPa)
0 10 20 30 40 50 60 70 80
Bond
str
eng
th,
b (
MP
a)
0
1
2
3
4
5
6
7Bearly and Johnston (1990)
Marti-Vargas et al. (2012)
Marti-Vargas et al. (2013)
18
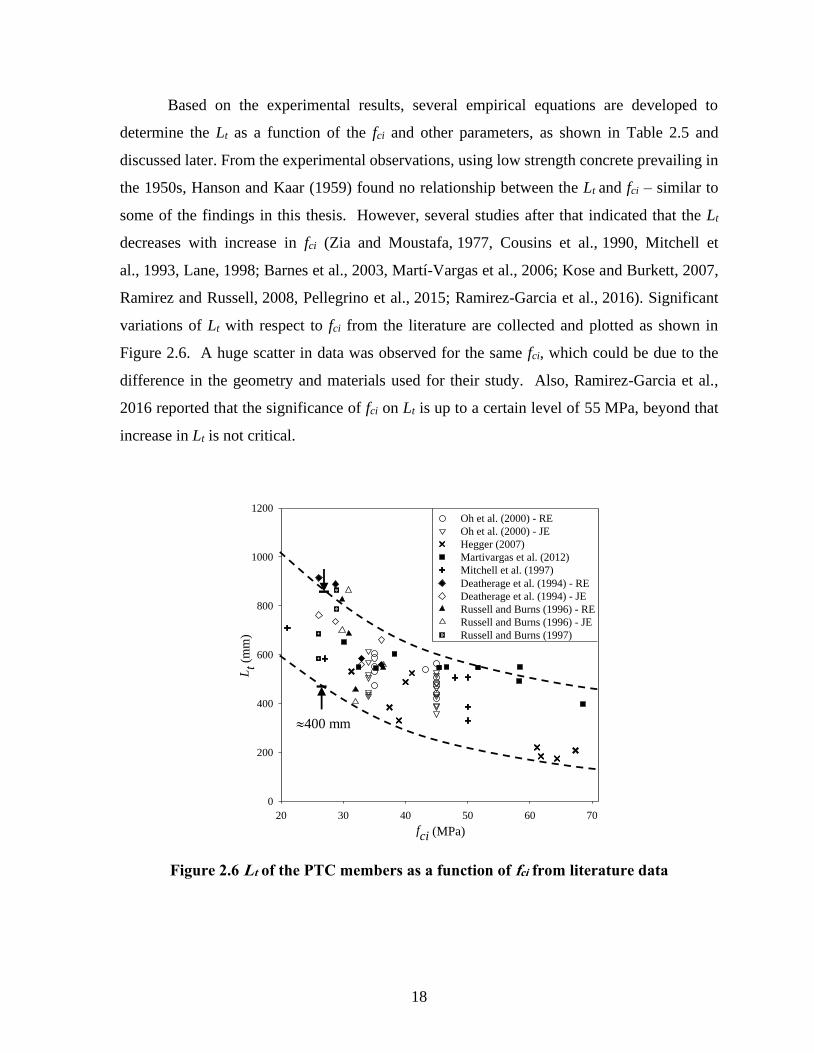
Based on the experimental results, several empirical equations are developed to
determine the Lt as a function of the fci and other parameters, as shown in Table 2.5 and
discussed later. From the experimental observations, using low strength concrete prevailing in
the 1950s, Hanson and Kaar (1959) found no relationship between the Lt and fci – similar to
some of the findings in this thesis. However, several studies after that indicated that the Lt
decreases with increase in fci (Zia and Moustafa, 1977, Cousins et al., 1990, Mitchell et
al., 1993, Lane, 1998; Barnes et al., 2003, Martí-Vargas et al., 2006; Kose and Burkett, 2007,
Ramirez and Russell, 2008, Pellegrino et al., 2015; Ramirez-Garcia et al., 2016). Significant
variations of Lt with respect to fci from the literature are collected and plotted as shown in
Figure 2.6. A huge scatter in data was observed for the same fci, which could be due to the
difference in the geometry and materials used for their study. Also, Ramirez-Garcia et al.,
2016 reported that the significance of fci on Lt is up to a certain level of 55 MPa, beyond that
increase in Lt is not critical.
Figure 2.6 Lt of the PTC members as a function of fci from literature data
fci (MPa)
20 30 40 50 60 70
Lt
(mm
)
0
200
400
600
800
1000
1200Oh et al. (2000) - RE
Oh et al. (2000) - JE
Hegger (2007)
Martivargas et al. (2012)
Mitchell et al. (1997)
Deatherage et al. (1994) - RE
Deatherage et al. (1994) - JE
Russell and Burns (1996) - RE
Russell and Burns (1996) - JE
Russell and Burns (1997)
400 mm

19
In addition to the lateral confinement provided by the concrete matrix, the closed
stirrups also provide confinement and reduce the Lt (Vázquez-Herrero et al. 2013; Floyd et al.,
2015). Russell and Burns (1996), Akhnoukh (2008), Song et al. (2014), and Kim et al. (2016)
reported that the effect of stirrups/confinement reinforcement on the Lt is negligible.
On the other hand, Swamy and Anand (1975) reported that both the addition of stirrups
and maturity of concrete controlled the Lt and the effective transfer of prestress considerably.
They observed about 15% reduction in the Lt due to the addition of stirrups, especially in the
light-weight concrete members which experience the structural failure due to split cracks after
prestress release. These split cracks along the prestressing strand affect the durability of the
systems and could reduce its service life due to other durability related issues (Vázquez-
Herrero et al., 2013). Therefore, it is important to consider the fci in the design estimation of
Lt. It should be noted that considering size effect, correlating the Lt of laboratory specimens
with single-strand and a few stirrups with that of structural elements with multi-strands and
many stirrups is challenging and is not a focus of the current study.

20
Table 2.2 Effect of compressive strength of concrete on the measured transmission
length
Reference fci, avg
(MPa)
Lt, avg (mm) Influence in
Lt (%)
Geometry (b × h × l)
(mm) LE DE
Kaar et al. (1963) 24 1010
-6 150 × 200 × 2400 34 950
Over and Au (1965) 38 890 75 × 75 × 2000
Dorsten et al. (1984) 28 670 89 × 114 × 2440
Cousins et al. (1990) 28 1270 102 × 102 × 1000
Mitchell et al. (1993) 21 70
-45 100 × 200 × L
(L = 650 – 1600) 50 390
Russell and Burns (1996)
30 745 760
-28 100 × 125 × 3000 32 560 545
36 540 545
Oh et al. (2000) 35 549 521
-15 100 × 100 × 3000 45 490 444
Hegger et al. (2007) 39 432 150 × 250 × 2000
Martí-Vargas (2012b)
34 587
-32 100 × 100 × 2000 48 548
58 521
68 398
Floyd et al. (2015)
23 696 665
-28 170 × 300 × 5500 30 697 573
33 537 680
43 510 462
Ramirez-Garcia et al.
(2016)
28 733
-31 165 × 305 × 2750 42 520
64 506

21
Diameter of strand (ds)
The bond strength of the PTC systems gets reduced with an increased diameter of the strand
(ds). b is inversely proportional to ds or the surface area of the strand. During the pull-out
test, the larger the diameter of the strand, the higher the load acting on it and thus results in
significant reduction in diameter of strand due to the Poisson’s effect. This affects the S-C
bond and reduces the confinement due to the compressive strength of concrete and results in
lower bond strength (Shin et al., 2018). Adhesion force is proportional to the amount of
adhered surface at the S-C interface – it is directly proportional to the diameter of the strand.
Also, the frictional force could be affected due to the increase in the normal force due to the
increase in ds. As the grooves between the outer wires of the strand become larger with
increased strand diameter – the bearing force also tends to increase due to mechanical action
(Deatherage et al., 1994).
Consequently, the Lt of the PTC members depends on the available surface area of
strands. As the ds increases the effective force to be transferred also increases, which results
in longer Lt. The AASHTO LRFD (2012), ACI 318 (2014), AS 3600 (2009), CSA 23 (2014),
EN 2 (2004), IRC 112 (2011), fib MC (2010), and IS 1343 (2012) codes consider this in an
empirical way - by using the diameter of the strand (ds) and a multiplier in the equation for Lt.
It is to be noted that, the pitch of the helical outer wires influences the S-C bond mechanism –
longer the pitch, the lesser will be the angle between the outer and centre wires – leading to
lower bearing and mechanical interlock provided. Table 2.4 provides the formulations of the
Lt. It should be noted that the AASHTO LRFD (2012), ACI 318 (2014), AS 3600 (2009), CSA
A23 (2004), EN 2 (2004), IRC 112 (2011), fib MC (2010), and IS 1343 (2012) consider a
linear relationship between Lt and ds. It should also be noted that many codes consider only
the ds as a variable, which indicates its significance on Lt.
Embedment length (le)
The bond stress () depends on the surface area (le p) of the strand in concrete. Furthermore,
the at any instant during the test varies non-linearly along the length of the member
(Abrishami and Mitchell, 1996; fib Bulletin 10, 2000; Dang et al., 2014b). Therefore, to avoid
this non-linearity and obtain reasonably uniform bond stress along the le, a short le has been

22
used in many pull-out tests on CRC systems (Khayat, 1998). However, for the PTC systems,
the le of the strand in concrete should be long enough to accommodate the transmission length,
Lt (Martí-Vargas et al., 2006; Martí-Vargas et al., 2013; Naito et al., 2015; Mohandoss and
Pillai, 2017). As le increases, the resistance to bond failure also increases. Therefore, more
load acts on the longer member and reduces the confinement effect of the surrounding concrete
due to Poisson’s effect (Hegger and Bertram, 2008). Hence, the le plays a critical role in the
PTC systems. Martí-Vargas et al. (2006) studied the effect of le varied from 600 to 1000 mm
by considering Lt. Mohandoss and Pillai (2017) suggested that le should be more than 2Lt for
studying bond strength in PTC systems. It is found that using short/inadequate le for the PTC
systems cannot provide a reliable b. The challenges associated with this is explained later in
Chapter 6.
Surface conditions of the strand
Although, not within the purview of this work, it can be mentioned that the surface conditions
could affect the b of S-C interface (Abrishami and Mitchell, 1993; Brearley and Johnston,
1990; Cousins et al., 1990; Deng et al., 2015; Girgis and Tuan, 2005). The surface condition
of the strand could directly influence the frictional mechanism of the S-C bond. A rough
surface due to the weathering of the strand or indented strands could enhance the friction
between the strand and concrete, which in turn results in increased bond and reduced Lt (Martin
and Scott, 1976; Barnes et al., 2003).
During strand manufacturing, the pre-treatments of strands, wire-drawing processes,
use of lubricants (calcium salts of fatty acids, sodium stearate, etc), and cleaning process can
alter the surface properties (Rose et al.1997; Dang et al., 2014b). Moreover, the thickness of
the residual lubricant film on the strand surface can vary from one strand manufacturer to the
other. All these conditions make the strand surface to be smooth and shiny. If the surface of
the strand is smooth due to the presence of lubricants and the application of coating, then
adhesion and frictional resistance would be less – thus resulting in reduced bond strength and
increased Lt.
23
Applied prestress (fps) and releasing method
The initial prestress level applied in the S-C bond plays a crucial role contributing to the Hoyer
effect. Naito et al. (2015) found that the bond stress computed using the stressed strands
resulted in higher b than that of the unstressed strands. Shin et al. (2018) investigated the
effect of initial prestress on the b by considering the two fps (0.8 and 0.9 fpu) with about 10%
difference and reported a negligible change in b. It is cumbersome and expensive to prepare
test specimens with high prestress levels. Hence, a relatively simplified test procedure with
taut specimens is needed. However, the correlation between the b of specimens with
significantly different stress levels is not reported in the literature and is the focus of this thesis.
The method of prestress releasing (say, sudden release or gradual release) can influence
the Lt. The gradual and sudden methods of transfer of prestress can have different dynamics
of energy at stress transfer (Belhadj et al., 2001; Moon et al., 2010). In a sudden release of the
stressed strand, the end portion of the strand does not get enough time to transmit the
energy - resulting in longer Lt than that is achieved in a gradual release method
(Barnes et al., 2003; Rose and Russell, 1997). The sudden release by flame cutting could result
in Lt of about 6 to 60% greater than that is obtained for similar strands using the gradual
releasing method (Kaar et al., 1963; Cousins et al., 1986; Rose and Russell, 1997; Oh and Kim,
2000). Russell and Burns (1997) also reported that the effect due to the releasing method
becomes less significant as the length of the PTC elements increases. Also, the sudden release
method in practice could increase the scatter in results (Floyd et al., 2015). Therefore, the
gradual release method is recommended for the laboratory studies on the PTC specimens with
less than 3 m. Hence, in this study also, the gradual release method was adapted.
Time-dependent effect
The bond in the PTC systems depends on the confinement provided by the concrete. The
prestress is transferred when the compressive strength of concrete is about 60% of its design
characteristic strength. The continued increase in concrete strength can enhance the S-C bond
and could help in counteracting the possible adverse effects due to the long-term creep,
shrinkage, and relaxation (fib Bulletin 10, 2000 and Barnes et al., 2003). Also, the PTC
specimens would experience prestress losses over time due to shrinkage and creep which could

24
also affect the Lt (Caro et al., 2013a). Kaar et al. (1963) and Bruce et al. (1994) had reported
that for seven-wire, 12.7 mm diameter strands embedded in concrete with fci = 34 MPa, could
increase Lt by approximately 10% during the first 28 days. After 28 days till 365 days no
significant changes were reported, only 3% increment was observed. Also, for seven-wire,
12.7 mm diameter strands embedded in concrete with fci = 27 MPa, the Lt can increase by up
to 20% in 14 months (Dorsten et al., 1984).
Table 2.3 presents the past work done on time variation on the Lt in chronological order.
Several researchers had monitored the effect of time on Lt from the time of transfer to several
days, months, and years (Kaar et al., 1963; Mayfield, 1970; Swamy and Anand, 1975; Dorsten
et al., 1984; Cousins, et al., 1990; Lane, 1998; Roller et al., 1993; Issa et al., 1993; Mitchell et
al., 1993; Bruce et al., 1994; Logan, 1997; Oh and Kim, 2000; Peterman, 2007; Larson et
al.,2007; Ramirez and Russell, 2008; Pozolo and Andrawes, 2011; Floyd et al., 2015). A few
researchers found that the Lt increases with time, whereas other researchers reported that the
Lt decreased with time and in some cases, no significant change was observed on the Lt. Also,
the reason for this difference in behaviour was not well understood.

25
Table 2.3 Changes in Lt with time (from literature)
References Avg. fci
(MPa)
Time
interval
after
transfer
Change in Lt (%) Remarks/Observations
Kaar et al.
(1963)
11, 17, 23,
29, 34 1 year
+ 6% (avg.)
+19% (max.) No significant change
Mayfield
(1970) 52 10 months +5 to 44% Significant increase in Lt
Swamy and
Anand (1975) 31-36
6 to 14
months
+11.5 %
+16%
No trend in the change in Lt;
In some cases, Lt at two ends
were significantly different
Dorsten et al.
(1984) 28 14 months +20 %
Change was observed for
uncoated strands; no change
was observed for coated
strands.
Cousins, et al.
(1990) 30 12 months
+15.4% (coated)
+5.4% (uncoated)
Change in Lt was significant in
the first 90 days after release;
More changes have been
observed for coated strands.
Lane (1998) 32 12 months --- No trend in change in Lt
Roller et al.
(1993) 62 18 months --- No significant change
Issa et al.
(1993) 33 and 40 20 months +20 % Significant increase in Lt
Mitchell et al.
(1993) 21, 27, 50 21 days
+9% (avg.)
+53% (Max)
Decrease of Lt have also been
observed in some specimens
Bruce et al.
(1994) 60 28 days +10% No significant change
Logan (1997) 30 21 days +30 to 67% Significant increase in Lt
Oh and Kim
(2000)
35
45
7 days
90 days
~3%
~6% No significant change
Larson et al.
(2007) 25 - 35. 21 days +10 to 45%
Significant increase of Lt was
observed while using SCC
Ramirez and
Russell (2008) 28 and 42 240 days
+190% (max)
+62% (avg)
Significant difference between
Lt at the two ends of the same
specimen
Pozolo and
Andrawes
(2011)
34 28 days -14%
Significant difference between
Lt at the two ends of the same
specimen Note: The sign (+)/(-) indicate an increase/a decrease in Lt, respectively
26
2.6 MEASUREMENT OF TRANSMISSION LENGTH
The Lt of the PTC specimens is determined based on strain distribution along the length of the
PTC members due to prestress transfer. The strain on the strand or concrete surface along a
line parallel to the strand can be measured to determine the Lt. The strain measurements can
be obtained by using electrical strain gauges or demountable mechanical strain gauges or Laser
speckle method. The Lt of the PTC specimens can also be obtained by stress acting on the
strand using the ECADA method. These methods are discussed in detail in the following
sections. Also, the transmission length of the PTC members can be determined by measuring
the strand end slips using empirical equations. However, this method often results in longer Lt
than the strain method as it is calculated using an empirical equation and bond stress
distribution coefficient (Dang et al., 2016b). Hence, determining the Lt using the strand slip is
not within the purview of this study. This study is focused to determine the strain variation
along the length to estimate the Lt of PTC members.
Demountable mechanical (DEMEC) strain gauges
Researchers have developed a way to indirectly determine the strain on the strand surface by
measuring the strain on the concrete surface using demountable mechanical (DEMEC) strain
gauge. A small stainless or brass discs of size 10 mm dia. with a centre hole of about 1 mm
dia. would be pasted on the concrete surface along the strand line with a gauge length of 50 to
150 mm. The distance between the discs would be measured using the DEMEC gauge before
and after prestress release. Then the strain on the concrete surface would be calculated using
the change in distance between the discs with respect to the gauge length. It should be noted
that the measurement of strain using the DEMEC gauge is highly sensitive to the pressure
applied, the angle of holding, posture etc. – leading to a significant experimental/human error.
If the concrete surface is good enough, then this would give a reliable Lt measurement. Else,
reading would be affected due to improper bonding between the disc and concrete surface. As
multiple DEMEC measurements are made across overlapping the measurement regions, the
strain on the concrete surface is obtained by a smoothening technique using the average
maximum strain method (known as AMS method) (Russell and Burns, 1997). This procedure
is adapted in this study and it is explained in Chapter 4. However, obtaining strain using this
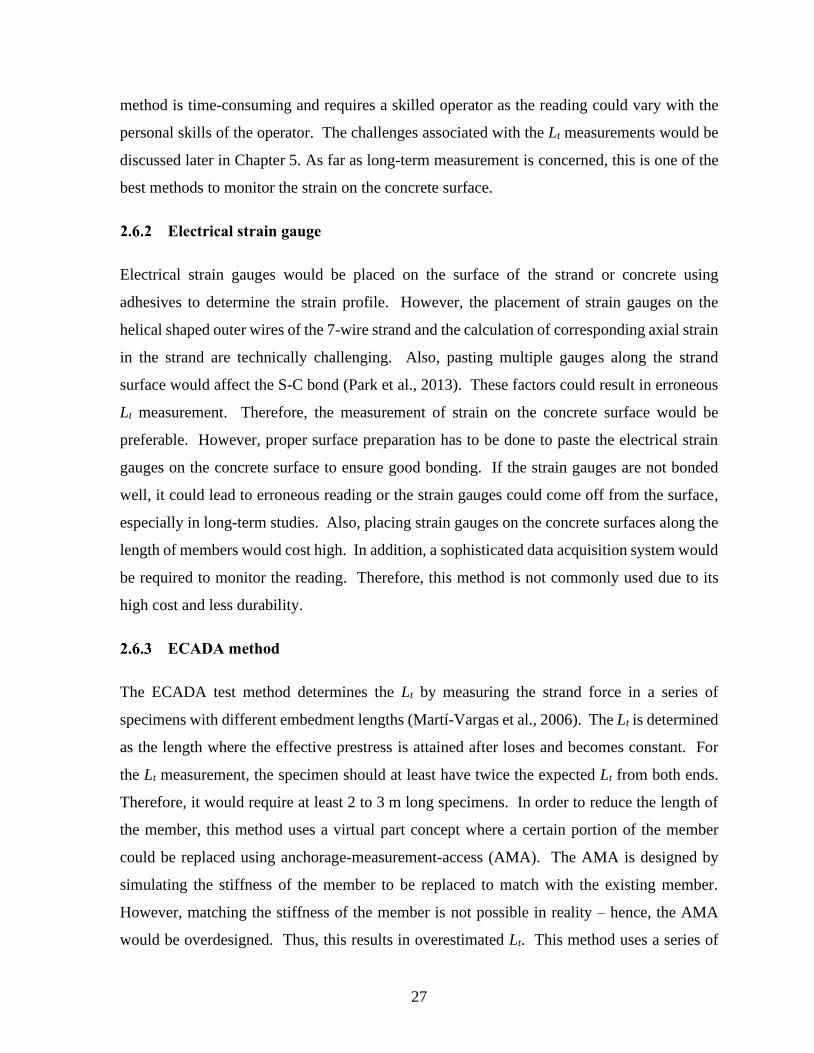
27
method is time-consuming and requires a skilled operator as the reading could vary with the
personal skills of the operator. The challenges associated with the Lt measurements would be
discussed later in Chapter 5. As far as long-term measurement is concerned, this is one of the
best methods to monitor the strain on the concrete surface.
Electrical strain gauge
Electrical strain gauges would be placed on the surface of the strand or concrete using
adhesives to determine the strain profile. However, the placement of strain gauges on the
helical shaped outer wires of the 7-wire strand and the calculation of corresponding axial strain
in the strand are technically challenging. Also, pasting multiple gauges along the strand
surface would affect the S-C bond (Park et al., 2013). These factors could result in erroneous
Lt measurement. Therefore, the measurement of strain on the concrete surface would be
preferable. However, proper surface preparation has to be done to paste the electrical strain
gauges on the concrete surface to ensure good bonding. If the strain gauges are not bonded
well, it could lead to erroneous reading or the strain gauges could come off from the surface,
especially in long-term studies. Also, placing strain gauges on the concrete surfaces along the
length of members would cost high. In addition, a sophisticated data acquisition system would
be required to monitor the reading. Therefore, this method is not commonly used due to its
high cost and less durability.
ECADA method
The ECADA test method determines the Lt by measuring the strand force in a series of
specimens with different embedment lengths (Martí-Vargas et al., 2006). The Lt is determined
as the length where the effective prestress is attained after loses and becomes constant. For
the Lt measurement, the specimen should at least have twice the expected Lt from both ends.
Therefore, it would require at least 2 to 3 m long specimens. In order to reduce the length of
the member, this method uses a virtual part concept where a certain portion of the member
could be replaced using anchorage-measurement-access (AMA). The AMA is designed by
simulating the stiffness of the member to be replaced to match with the existing member.
However, matching the stiffness of the member is not possible in reality – hence, the AMA
would be overdesigned. Thus, this results in overestimated Lt. This method uses a series of

28
specimens with different le to determine the Lt of one particular grade or variable. Also, if the
grade or geometry of the specimen is changed, then the AMA has to be modified accordingly.
Each specimen requires individual AMA system and AMA cannot be reused if the member is
monitored for long-term effect. Therefore, this method consumes more material and cost.
Moreover, with the AMA system (virtual concept) it does not represent the real scenario in the
field. From the above discussions, the measurement of the Lt using the DEMEC is reliable
especially for a long-term measurement of the Lt. Hence, in this study the traditional method
of measuring the Lt using DEMEC gauge would be used.
Laser-speckle imaging
Laser-speckle imaging is an advanced method, developed to measure the strain distribution
along the length of the members rapidly. A thin layer of paint is speckled on the concrete
surface to measure the strain on it at the transfer of prestress. A laser is used on the traversable
rail to take the readings before and after the prestress release (Murphy et al., 2012). This
method determines the Lt by calculating strain using the change in distance captured by the
images. Using this method, the accuracy of less than 10 micro-strain could be measured.
However, this method is not suitable for long-term studies as the speckle pattern or paint could
change or fade which could lead to erroneous readings. Hence, this method could be useful
for the Lt measurement of large number of specimens at the time of prestress transfer.
2.7 EXISTING CODES AND EMPIRICAL EQUATIONS FOR CALCULATING THE TRANSMISSION
LENGTH OF THE PTC SYSTEMS
Different standards provide different design equations for calculating the Lt using various
factors that can influence the Lt and these are listed in Table 2.4.
ACI 318 (2014)
As discussed in Section 2.5, many factors can affect the Lt. However, ACI 318 (2014)
considers only the fpe and ds to compute the Lt. The compressive strength of concrete at release
(fci) is one of the factors which significantly influences the Lt and that was not considered in
the ACI codal equation. The number ‘21’ in the design equation represents the characteristic

29
compressive strength of concrete in MPa (Tabatabai and Dickson, 1993; Zia and Mostafa,
1997). The design equation of Lt in ACI 318 (2014) is based on the experimental work by Kaar
and Hanson in 1959, which was adapted by ACI 318 (1963). However, this equation was not
updated from 1963 to date (ACI 318, 2011; ACI 318, 2014). The materials used in those days
were different and the same equation could not be used for the advanced materials being used
in the current construction practices. Hence, there is a need to revise the Lt equation for the
current construction materials and practices for a realistic estimation of the Lt.
AASHTO (2012), AS 3600 (2009), CSA A23 (2014), and IS 1343 (2012)
AASHTO LFRD (2012), AS 3600 (2009), CSA A23 (2014), and IS 1343 (2012) codes have
considered only the diameter of the strand (ds) to calculate the Lt. However, calculating the Lt
based on only the ds does not represent the actual Lt of the PTC systems that could be affected
by other variables also. AASHTO LFRD (2012) and AS 3600 (2004) suggest 60 times ds to
calculate the Lt which is almost close to the Lt value based on ACI equation if the strands are
stressed to 0.75fpu (Lt = ~ 62-65 times ds depending on the prestress loss at transfer). CSA and
IS codes suggest 50 and 30 times ds, respectively to calculate the Lt which is about 80 and 50 %
of the Lt values based on the AASHTO and AS codes, respectively. These design values of Lt
based on CSA and IS could underestimate the actual value of Lt of the PTC systems as these
consider only the ds. The provision of Lt in IS 1343 was based on the contemporary code of
UK (CP 110, 1972). The British standard has been revised subsequently to meet the current
practices. However, the provision of Lt in Indian code is not updated - indicating the need to
revise the code to meet the modern construction practices.
BS 8110 (1997)
BS 8110 (1997) suggests an equation as a function of ds and fci, also it includes a constant
representing the tendon type for calculating the Lt, and it does not consider the prestress level
in the strand. Typically, in the PTC construction practices, strands are stressed to 0.75fpu. In
practice, controlling the applied initial stress is crucial. If the strands are less stressed then the
design value will be conservative as the Lt required is less to transfer the applied prestress and
vice-versa. On the other hand, overstressing the strand is not common in construction practices
as the strand could yield and break. However, if the strands are overstressed that could result

30
in longer Lt than the required. Therefore, for a realistic estimation of Lt, prestress is one of the
important parameters to consider. Later, the use of this code became obsolete and BS has
adapted the European standards EN 2 (2004).
EN 2 (2004)/IRC 112 (2011) and fib MC (2010)
EN 2 (2004) and fib MC (2010) consider many variables that could affect the Lt and proposed
an equation as a function of the area of strand, the diameter of the strand, stress in strand, bond
stress and other factors (α1, α2, α3, ηp1, and ηp2). Mainly these two codes consider fci indirectly
to compute the bond stress between the strand and concrete. In EN code, the factors α1 and α2
are provided to account for the releasing method and type of strand, respectively. The factor
α1 = 1 and 1.25 for gradual and sudden release; α2 = 0.25 and 0.19 for wires and strands (3 and
7-wire strands).
In fib MC code, the factors α1, α2, α3, ηp1, and ηp2 are provided to account for the
releasing method, action effect, bond situation, type of strand, and position of the strand,
respectively. The factor α1 = 1 for gradual release and 1.25 for sudden release; α2 = 1 for
calculation of Lt when the moment and shear capacity are considered and 0.5 for verification
of transverse stress; α3 = 0.5 and 0.7 for strands and indented or crimped wires, respectively;
ηp1 = 1.4 and 1.2 for indented/crimped wires and 7-wire strands, respectively; ηp2 = 1 for all
the horizontal tendons and 0.7 for all other cases. Since these codes consider the possible
factors affecting the Lt they could provide a conservative design. In addition, these codes
consider lower and upper bound values for an accurate prediction of Lt.

31
Table 2.4 Lt formulations from standards
Other empirical models to determine the Lt
Several researchers had worked on to develop the formulations to determine the transmission
length of the PTC systems. Table 2.5 presents the empirical and analytical formulations to
determine the Lt. Hanson and Kaar (1959) had initiated the experimental work on the
determination of transmission length and proposed an equation as a function of effective
prestress and diameter of the strand considering the numerical value of 20.3 which represent
the characteristic compressive strength of concrete used.
Code Transmission length equation
(SI units)
ACI 318 (2014) Lt = (fpe
20.7) ds
AASHTO (2012) Lt = 60ds
AS 3600 (2009)
BS 8110 (1997) Lt = Ktds
√fci
CSA A23 (2004) Lt = 50ds
fib MC (2010) Lt = 1α2α3
As
πds
fpi
1
2fctd
EN 2 (2004) Lt = 1α2α3𝑑𝑠
fpi
1
2fctd
IRC 112 (2011)
IS 1343 (2012) Lt = 30ds

32
Table 2.5 Empirical and analytical formulations to determine Lt from literature
1959 Hanson and Kaar fpe
20.3ds
1969 Marshall and Krishna Murthy √√f
ci ×103
β
1976 Martin and Scott 80ds
1977 Zia and Mostafa 1.5fpi
fci
ds-117
1990 Cousins et al. 0.5 [Ut
’√f
ci
B] +
[ fpeAps
πdsUt’√f
ci
’
]
1992
1994
1995
Shahawy et al.
Deatherage et al.
Buckner
fpi
20.7ds
1993 Mitchell et al. fpi
20.7ds√
20.7
fci’
1997 Russell and Burns fpe
13.8ds
1998 Lane [4f
pi
fci
’ds] -127
2003 Barnes et al. 𝛼𝑓𝑝𝑖
√𝑓𝑐𝑖𝑑𝑠
2006 Martí-Vargas et al. 2.5Apsfpi
Pfci
2/3
2005 Kose and Burkett 0.045fpi(25.4-ds)
2
√𝑓𝑐𝑖
2008 Ramirez and Russell 315
√𝑓𝑐𝑖ds≥40ds
2013b Caro et al. . . [. (𝑓𝑝𝑒
𝑛 𝐴𝑝𝑠
(𝑘1𝜋𝑑𝑏)𝑈𝑡) + 𝑘2]
2015 Pellegrino et al. eα+βds+γf
pi+δf
ci
2016 Ramierz-Garcia et al. 25.7 (fpi
𝑓𝑐𝑖ds)
0.55
Year Reference Equation for transmission length, Lt

33
In 1969, Marshall and Krishna Murthy proposed an empirical formula to estimate the
Lt by considering cube compressive strength at transfer and a constant to account for the type
of strand. = 0.058 for 12.7 mm dia. 7 wire strands. Some researchers, Shahawy et al. (1992),
Deatherage et al. (1994), Bucker (1995) had suggested Lt equations similar to ACI 318,
considering fpi instead of fpe, and not considering fci. Zia and Moustafa (1977), Cousins et
al. (1990), Mitchell et al. (1993), Lane (1998), Barnes et al. (2003), Martí-Vargas et al. (2006),
Kose and Burkett (2007), Ramirez and Russell (2008), Pellegrino et al. (2015), and
Ramirez-Garcia et al. (2016) had proposed different Lt equations with fci as a variable. As Lt
depends on the bond strength of strand in concrete, Cousins et al. (1990) and Caro et al. (2013b)
considered the bond strength of the member to estimate the Lt. In addition, Caro et al. (2013b)
considers a factor to account for the effect of time. These formulations were evaluated later in
Chapter 5 and compared with the codal formulations.
2.8 EXISTING TEST METHODS FOR DETERMINING THE BOND STRENGTH OF THE PTC
SYSTEMS
Typically, the bond strength between strand and concrete is determined by the pull-out test.
Many test methods were developed to determine the S-C bond. However, each method
suggested the use of different geometry, materials, and stress levels. Figure 2.7 presents the
details of the test specimen and set-up used in those test methods. Table 2.6 gives the details
of the materials and methods used in the three widely reported bond test methods (Moustafa
pull-out test, ASTM A1081, and ECADA test method). The details and limitations of these
test methods are discussed in the following sections.

34
(a) Moustafa Method (Unstressed strands in block: 600 1200 900)
(b) ASTM A1081 (Unstressed strands in cylinder: 125 450)
(c) ECADA Method (Stressed strands in prism: 100 100 L)
Figure 2.7 The schematic representation of specimen geometry and set-up used in the
existing pull-out test methods

35
Table 2.6 Materials, prestress effect, and pull-out test method considered in the existing
test methods
* Refer Figure 2.7 for more details on the geometry of the specimen
Moustafa test method
The Moustafa pull-out (reported in Rose and Russell, 1997) was one of the earliest test methods
used to quantify the b of strands used for lifting loops. In this method, unstressed strands were
pulled out from the large concrete block size of (1200 1200 600) mm using a hydraulic
jack. The use of unstressed strands in the concrete block cannot represent the PTC systems.
Therefore, the bond strength obtained using this method cannot be used to quantify the bond
strength of the PTC systems.
ASTM A1081 test method
Post-Tensioning Institute (PTI) bond tests and North American Strand Producers (NASP) were
also developed bond test methods using unstressed prestressing strands. The reliability of these
methods was tested and the results from different laboratories showed that the NASP bond test
is the most reproducible method (Russell and Paulsgrove, 1999). The contemporary version
of the NASP method was modified and adapted by ASTM A1081 (2012). This method
suggests the use of 450 mm long unstressed strand in 125 mm dia. cylindrical cement mortar.
This test is considered as an indicator of the bondability of strands; but, did not recommend
Test
methods
Type of
specimen
geometry*
Materials Prestressing
and
transfer of
prestress
Pull-out test using
Cement
mortar Concrete Jack
Universal
testing
machine
ASTM
A1081 Cylindrical ✓
✓
Moustafa Large
block ✓ ✓
ECADA Prism ✓
36
any qualifying criteria. Later, based on NASP test method, Dang et al. (2014a) established the
minimum thresholds for qualifying prestressing strands. Dang et al. 2015 reported that when
the mortar is used, the friction bond formed between the strand and mortar becomes
insignificant. Therefore, using the cement grout/mortar instead of concrete and unstressed
strands cannot be helpful to determine the bond strength of the PTC systems as those could not
represent the actual bond mechanisms of the PTC systems.
ECADA Pull-out test method
The ECADA pull-out test method is developed to determine the bond strength of stressed
strands in concrete (Martí-Vargas et al., 2006). Performing a pull-out test for the pretensioned
members is tedious as it requires long member length to account for the transmission length
while transferring the stress. Therefore, the test set-up required to perform has to be designed
such that it can accommodate the longer pull-out specimens.
Researchers have worked on to develop a suitable test method to determine the S-C
bond and Martí-Vargas et al. (2006) had proposed an ECADA method which means in Spanish
Ensayo para Caracterizar la Adherenciamediante Destesado y Arrancamiento (Test to
characterize the bond by release and pull-out). This method considers the virtual part concept
using an anchorage measurement access (AMA) in order to reduce the required long le for the
PTC members. This AMA system designed such that the stiffness of the AMA should match
the stiffness of the concrete portion that has to be replaced. So that the stiffness matched AMA
system could represent the virtual part of the concrete member length (say about ~2 m
depending on the le).
Limitations of the existing test methods to determine the bond in the PTC
systems
The aforementioned Moustafa and ASTM A1081 test methods suggest the use of unstressed
strands and cement mortar/concrete. The unstressed strands in the specimens may not be
perfectly straight and while being pulled-out they tend to straighten; in this straightening
process, they would compress the grout on one side and lose contact with the grout on other
37
side. Such uncontrolled mechanisms could induce more scatter in the test results than those
observed with specimens with stressed and straight strands (Dang et al., 2015).
Martí-Vargas et al. (2006) had proposed the ECADA test method using prestressed
strands (say, 0.7fpu) to represent the real conditions at the S-C interface of the PTC systems.
However, this method adopts a virtual part concept with a system designed to match the
stiffness of the concrete portion that would be replaced to reduce the length of the member.
Note that the stiffness of this system is designed to be higher than that of concrete. As a result,
this method overestimates the b of PTC systems (Martí-Vargas et al. 2013), which may
underestimate the transmission length resulting in reduced shear capacity in the transmission
zone (Mohandoss et al. 2018). Therefore, there is a need for a simplified test specimen and
method to determine the b of S-C systems, which is the focus of this thesis.
2.9 EFFECT OF BOND AND ITS INFLUENCE ON THE STRUCTURAL BEHAVIOUR OF THE PTC
SYSTEMS
The S-C bond could influence the performance of concrete structures in several ways. At the
serviceability limit state, the bond influences the width and spacing of transverse cracks,
tension stiffening, and curvature. Similarly, at the ultimate limit state condition, the bond
is responsible for the strength of end anchorages. In CRC, the bond characteristics of
reinforcement could influence the cracking and deflection of the member at the serviceability
limit state. Also, the strength of anchorage depends on bond at the ultimate limit state. The
rotation capacity of plastic hinges is also influenced by the bond characteristics of the
reinforcement (fib Bulletin 10, 2000). Bond could also influence the ductility – by
withstanding the steel strain along the embedded reinforcement which controls the bending
cracks and formation of secondary cracks. In the PTC systems in addition to the above
functions, bond plays a major role at the stage of prestressing and transfer of prestress before
subjecting to service loads (Dang, 2015). Therefore, the Lt could be significantly influenced
by the S-C bond. Consequently, Lt influences the bending and shear strength of the members
particularly short members supported within the Lt (Swamy and Anand, 1975). Therefore, an
adequate Lt is critical especially in hollow-core slab units without shear reinforcements.

38
Hence, in the following sections, the effect of bond is discussed in terms of the significance of
the Lt on the shear performance and critical shear regions of the PTC members.
Effect of transmission length on the shear capacity of PTC systems
The Lt of prestressed strands plays a crucial role in achieving the desired shear capacity (Vn, max)
within the shear-critical region, especially when the elements do not have shear stirrups. To
ease the placement of concrete and casting, it is common not to use stirrups in the pretensioned
hollow-core slabs (HCS) and rely on the prestressed strands to achieve the desired shear
resistance. The shear force required to cause an inclined crack can be calculated as the shear
force required to cause a principal tensile stress equal to the tensile strength of the concrete at
the centroid of the beam. The nominal shear resistance of the PTC systems is computed as
given in Eq. 2.1 (Nawy, 2003):
Vn = Vc +Vs + Vp Eq. 2.1
where, Vn is the nominal shear force; Vc, Vs, and Vp are the shear capacity contributed by the
concrete, steel stirrups, and prestressed strands (vertical component only), respectively. For
the HCS systems without shear reinforcement and with horizontal strands, the Vs and Vp can
be considered to be zero. For being conservative, Vc is taken as the lower among the Vcw and
Vci (the ultimate shear resistance of sections uncracked and cracked in flexure, respectively).
HCS systems can be considered as simply supported systems and, in such systems, Vcw is found
to be lower than Vci, especially near the supports. Hence, Vc can be considered to be equal to
Vcw. Based on the principles of classical mechanics and Mohr’s circle, Vcw is given as follows
(Eq. 2.2) (Navy, 2003).
𝑉𝑐 = 𝑉𝑐𝑤 =𝐼𝑏𝑤
𝑄√𝑓𝑡
2 + 𝑓𝑐𝑝𝑓𝑡
Eq. 2.2
where,
I – Moment of inertia of gross cross section; bw – Width of the cross section
Q – Moment of area; ft – Maximum principal tensile stress ; fcp – compressive stress due to
effective prestress at centroid
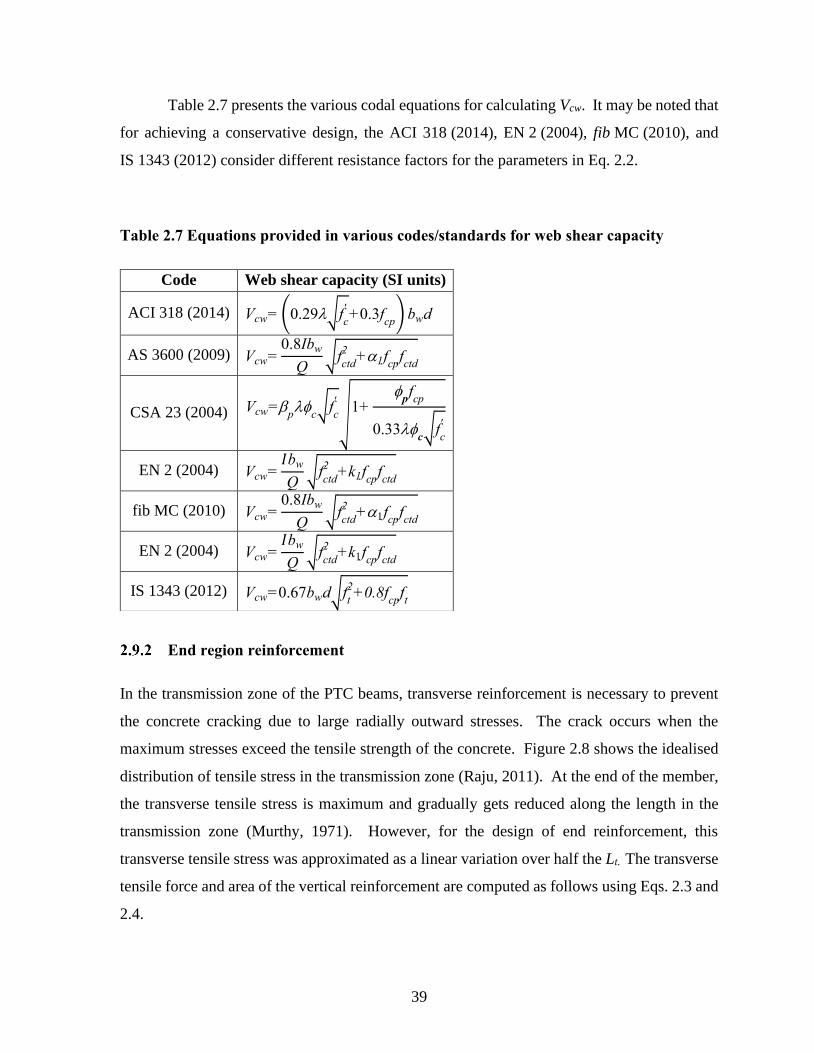
39
Table 2.7 presents the various codal equations for calculating Vcw. It may be noted that
for achieving a conservative design, the ACI 318 (2014), EN 2 (2004), fib MC (2010), and
IS 1343 (2012) consider different resistance factors for the parameters in Eq. 2.2.
Table 2.7 Equations provided in various codes/standards for web shear capacity
End region reinforcement
In the transmission zone of the PTC beams, transverse reinforcement is necessary to prevent
the concrete cracking due to large radially outward stresses. The crack occurs when the
maximum stresses exceed the tensile strength of the concrete. Figure 2.8 shows the idealised
distribution of tensile stress in the transmission zone (Raju, 2011). At the end of the member,
the transverse tensile stress is maximum and gradually gets reduced along the length in the
transmission zone (Murthy, 1971). However, for the design of end reinforcement, this
transverse tensile stress was approximated as a linear variation over half the Lt. The transverse
tensile force and area of the vertical reinforcement are computed as follows using Eqs. 2.3 and
2.4.
Code Web shear capacity (SI units)
ACI 318 (2014) Vcw= (0.29√fc
'+0.3f
cp) bwd
AS 3600 (2009) Vcw=0.8Ibw
Q√f
ctd
2+1f
cpfctd
CSA 23 (2004) Vcw=p
c√f
c
'
√1+
pfcp
0.33c√f
c
'
EN 2 (2004) Vcw=𝐼bw
Q√f
ctd
2+k1f
cpfctd
fib MC (2010) Vcw=0.8Ibw
Q√f
ctd
2+1f
cpfctd
EN 2 (2004) Vcw=𝐼bw
Q√f
ctd
2+k1f
cpfctd
IS 1343 (2012) Vcw=0.67bwd√ft
2+0.8f
cpft
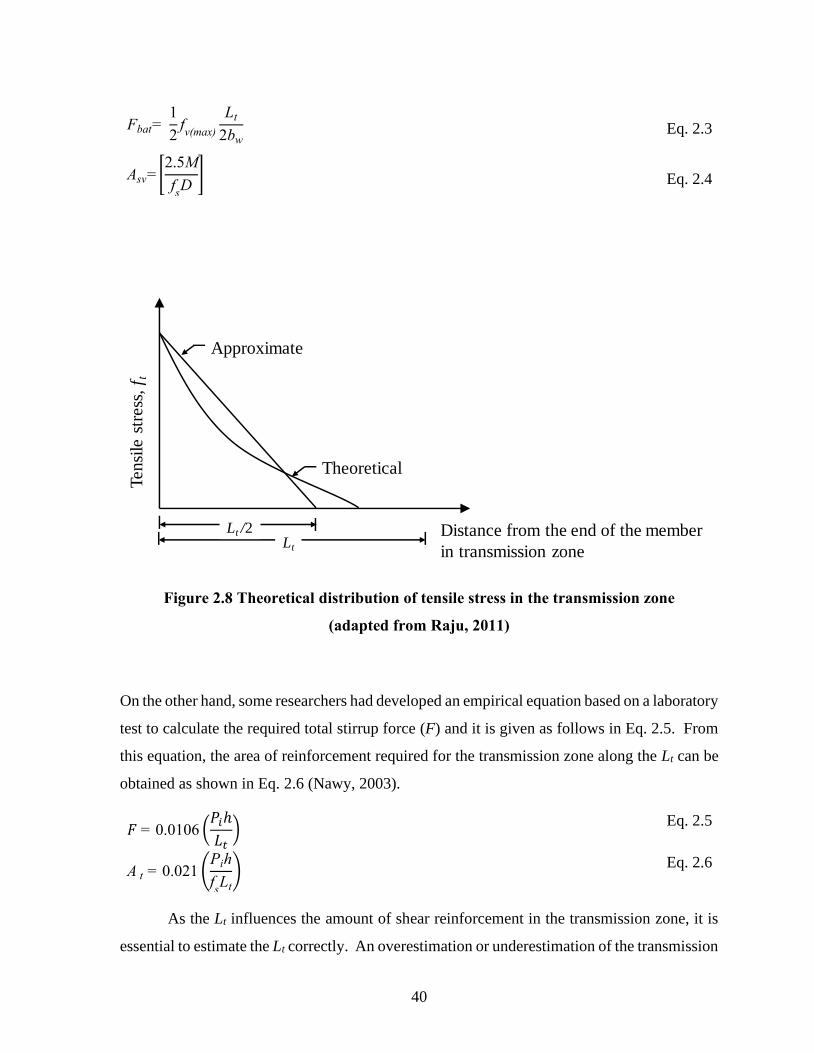
40
Figure 2.8 Theoretical distribution of tensile stress in the transmission zone
(adapted from Raju, 2011)
On the other hand, some researchers had developed an empirical equation based on a laboratory
test to calculate the required total stirrup force (F) and it is given as follows in Eq. 2.5. From
this equation, the area of reinforcement required for the transmission zone along the Lt can be
obtained as shown in Eq. 2.6 (Nawy, 2003).
As the Lt influences the amount of shear reinforcement in the transmission zone, it is
essential to estimate the Lt correctly. An overestimation or underestimation of the transmission
Approximate
Theoretical
Distance from the end of the member
in transmission zone
Ten
sile
str
ess
, f t
Lt
Lt /2
Fbat= 1
2fv(max)
Lt
2bw
Eq. 2.3
Asv= [2.5M
fsD
] Eq. 2.4
𝐹 = 0.0106 (𝑃𝑖ℎ
𝐿𝑡)
Eq. 2.5
A t = 0.021 (Pih
fsLt
) Eq. 2.6

41
length would result in inadequate transverse reinforcement. If the Lt is overestimated then the
amount of steel in the transmission zone would be lesser than the required. The members like
bridge girders, end shear reinforcement could be provided by calculating the amount of force
using the given equations. The members like hollow core slab, where end shear reinforcements
are not provided, the available prestress itself has to take care of the shear along the
transmission length. Hence, it is vital to calculate the realistic Lt of the PTC systems.
Critical sections for shear
The maximum shear force occurs at the face of the support, which is the critical section for
shear and gradually reduces with increasing distance from the support. However, under the
concentrated load the shear force remains high in the region between the support and first
concentrated load. The shear strength of this region is enhanced when the support reactions
introduce the transverse compression at the end of the members. Therefore, inclined cracks do
not develop near the face of the support (Pillai and Menon, 2009). In such a case, the code
allows a section at a distance d from the face of the support to be treated as shear critical region
where maximum shear force was expected, where d is the depth of the member. Figure 2.9
shows a schematic illustration of shear critical regions specified by ACI 318 (2014) and IS
1343 (2012).
Figure 2.9 The schematic illustration of critical shear regions specified by
ACI 318 (2014) and IS 1343 (2012)
D=250
250
150
Lt/2 D
IS 1343 (2012)
ACI 314 (2014)

42
ACI code does not provide a shear critical region for the PTC systems by considering
the Lt. However, it has a general specification suggesting that the shear critical region should
be within the distance of h (depth of the member) from the face of the support. The
specifications for the PTC systems from IS code says that half of the Lt should be achieved at
the face of support so that the Lt would be avoided in the clear span. Therefore, determination
of Lt plays a vital role in shear critical region also. Again, this necessitates the rational
determination of Lt.
2.10 MODES OF FAILURE IN THE S-C BOND SYSTEM
The S-C bond could fail either by the deformation of steel bar/strand or concrete. The failure
could occur due to any one or combination of the following actions (Pillai and Menon, 2009):
• Break-up of adhesion between the steel and concrete.
• Longitudinal splitting of the concrete around the steel.
• Shear of the concrete keys between the ribs/surface of the steel at the S-C interface.
• Rupture of the strand
Break up of adhesion at the S-C interface is not a major failure mode in the PTC
systems as the adhesion mechanism has a minimal role on the S-C bond. The commonly
observed failure modes are: pull-out (shearing of concrete), splitting, and rupture of
strands. These failure modes are discussed as follows.
(i) Pull-out failure
Concrete is sheared at the interface across the tops of the bar ribs. This type of
failure occurs when resistance is offered by thick concrete cover or the confining effect of
secondary reinforcement. It generally occurs when the concrete cover is exceeding 3 times
the diameter of the strand/bar. However, this could also occur due to insufficient
embedment length to develop the stress (Mahmoud et al., 1999). This failure is related to
a local mechanism where only interface collapse would be observed.
43
(ii) Splitting failure
When the concrete cover was not adequate to provide the required confinement,
then the concrete fails by longitudinal splitting. Typically, this failure could occur when
the concrete cover is less than 2 times the diameter of the bar (fib Bulletin 10, 2000). This
type of failure is related to structural collapse.
(iii) Strand rupture
As the embedment length increases the resistance to bond failure also increases.
Hence, the strand experiences the maximum load of its breaking strength and – strand
ruptures. Typically, this type of failure is observed when the embedment length was longer
than the required length to develop the stress (Mahmoud et al., 1999; Martí-Vargas et al.,
2013).
2.11 SUMMARY
The detailed literature review presented in this chapter helps to understand the bond
mechanisms and various factors influencing the Lt and b. The Lt and b formulations from the
literature were discussed. The various methods to determine the Lt and b and the limitations
associated with those methods were also presented. Finally, the significance of bond
performance on the structural behaviour and its mode of failure were discussed. Based on the
literature review, the need for this research work is presented in the forthcoming chapter.
44
3 RESEARCH NEEDS AND SIGNIFICANCE
3.1 RESEARCH NEEDS
The underestimation or overestimation of the Lt can lead to less conservative shear designs as
it influences the available prestress in the transmission zone to resist the external load.
Therefore, a realistic estimation of the Lt is important for achieving adequate shear capacity.
However, the estimation of the Lt has certain challenges in obtaining strain on the steel/concrete
surface. Also, the Lt parameter of the PTC systems depends on several factors. The major
factors that could influence the Lt are the diameter of the strand, the prestress level, and the
compressive strength of concrete at transfer. Therefore, for a rational estimation of the Lt,
these parameters should be considered. However, many standards available for the PTC
systems do not consider the compressive strength at transfer in the design Lt equations. Also,
a lot of studies have been done on the effect of the compressive strength of concrete at transfer
and a huge scatter has been observed in the collected literature data. This is because, different
studies have used different geometry, materials, and methods to determine the Lt. Thus, it
indicates a need to study the effect of the compressive strength on the Lt and for standardising
the procedure to determine the Lt.
As mentioned in Chapter 2, the Lt of the PTC systems depends on the S-C bond. Hence,
the determination of the bond strength (b) of the pretensioned strands in concrete is also a vital
parameter. The existing test methods that determine the bond strength are the Moustafa test,
ASTM A 1081 pull-out test, and the ECADA test. Among these methods, ASTM A 1081 and
the Moustafa tests suggest the use of unstressed strands in cement grout/ concrete block. The
use of unstressed strands in cement grout/concrete block does not represent the S-C bond of
the PTC systems. Later, the ECADA test method was developed for stressed strands.
However, this method has led to more complexity by considering the virtual part concept to
reduce the length of the member. One of the challenges in the PTC systems in determining the
S_C bond is the embedment length of the member by considering the transmission length from
both ends of the member. The conventional method of using a 2.5 mm slip to determine the
bond strength could not be valid for long PTC specimens. Therefore, a suitable test procedure
is required to determine the bond strength. The research significance of this work is as follows.

45
3.2 RESEARCH SIGNIFICANCE
A significant number of pretensioned, precast girders and hollow-core concrete (HCC) slabs
are used in bridge construction and high-rise and industrial buildings, respectively. As
mentioned above, the shear performance of the member depends on the available stress in the
transmission zone. This transmission zone becomes critical, especially in the case of HCC
slabs which do not have shear reinforcement or stirrups. Hence, the Lt is one of the important
design parameters to ensure the PTC members’ shear performance. However, it is found that
significant discrepancy exists among the design Lt equations in the various codes and literature.
Some codes provide empirical formulations to estimate Lt as a function of only the properties
of strands and do not consider that of concrete. This thesis highlights the influence of fci on Lt.
Also, the influence of seemingly simple, but complex test procedures on the determined Lt and
its scatter are explained. Based on the experimental results with various strength grade
concretes, a bilinear model for Lt as a function of the properties of both strand and concrete is
developed. It is anticipated that the proposed equation would be incorporated in the design
codes to achieve more rational estimates of Lt, and hence, more refined structural designs for
the end zone reinforcements of PTC members. As aforementioned, the transmission of
prestress depends on the bond between the pretensioned strand and concrete. Failure of the
S-C bond has been observed in pretensioned concrete (PTC) bridges, indicating the poor bond
between the strand and concrete. The available test methods to determine the bond strength,
b, in PTC systems have limitations in terms of (i) complexity in the preparation of test
specimens, (ii) the method of evaluation, and (iii) dependency on the length of the test
specimen. For frequent quality assurance tests, a simplified test method by eliminating these
limitations is required. Based on a comprehensive experimental work, this thesis proposes a
bond test method with simplified pull-out specimen containing a taut strand and a method to
estimate b based on bond yield stress approach.

46
4 EXPERIMENTAL PROGRAM
4.1 INTRODUCTION
Based on the research objectives and scope two different experimental programs have been
developed. This section enumerates the details of the materials and methodology adapted for
each experimental program. The properties of the materials used are discussed first, which is
followed by the details of experimental design, and test methodology for Objectives 1 and 2.
The test set-up and the instrumentation required for the transmission length and bond strength
test are also specified in this section.
4.2 MATERIALS USED IN THE EXPERIMENTAL PROGRAMS AND THEIR PROPERTIES
This section deals with the characteristics of the materials used in the experimental programs.
Prestressing strand properties
A low relaxation seven-wire strand of 12.7 mm diameter was used. Note that the strands are
kept inside the material storing room to prevent the surface damage or other environmental
efforts. A uniaxial tensile test was performed as shown in Figure 4.1 for 1 m long specimen
to obtain its mechanical properties. Figure 4.2 shows the stress-strain behaviour of the
prestressing strands. Three specimens were tested. The average modulus of elasticity of the
strand (Es) was 198 ± 3 GPa (CoV was 2%). The average ultimate tensile strength with of the
strand (fpu) was 1877 ± 3 MPa (CoV was 0.2% ) conforming to IS 6000 (1983). The symbol ±
indicates the standard deviation. Table 4.1 provides the chemical composition of the strand
obtained using optical emission spectroscopy.
Table 4.1 Chemical composition of the prestressing strand
Elements C Si Mn P Cr Ni Al Co Cu S Fe
Concentration
(%) 0.72 0.21 0.94 0.02 0.27 0.02 0.01 0.02 0.02 0.002 Remaining
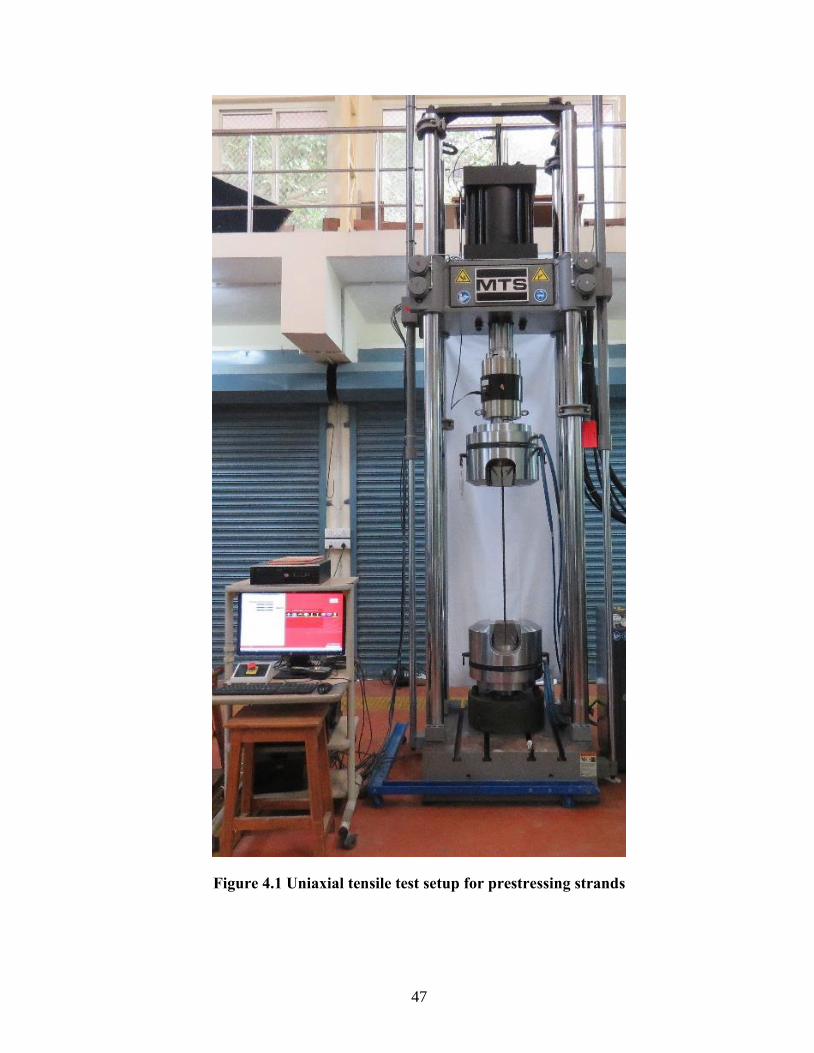
47
Figure 4.1 Uniaxial tensile test setup for prestressing strands

48
Figure 4.2 Stress-strain behaviour of prestressing strand
Cement properties
The Ordinary Portland Cement (OPC) 53S sleeper grade was used. This finely ground cement
helps to achieve early compressive strength gain to transfer the prestress (IS 269, 2015). Table
4.2 provides the chemical composition of the OPC obtained using X-ray fluorescence. The
physical properties of cement were obtained conforming to IS 4031(1988-1999) and ASTM
C204 (2016) and provided in Table 4.3
Table 4.2 Chemical composition of Ordinary Portland Cement 53S
0
250
500
750
1000
1250
1500
1750
2000
0.00 0.01 0.02 0.03 0.04
Str
ess
(M
Pa)
Strain (mm/mm)
Chemical composition Al2O3 CaO Fe2O3 K2O MgO Na2O SiO2 SO3
Concentration (%) 5.74 63.07 4.94 0.60 1.40 0.20 16.29 3.11

49
Table 4.3 Physical properties of Ordinary Portland Cement 53S
Aggregate properties
The crushed granite and natural sand were used as coarse and fine aggregates conforming to
IS 378 (2016). The physical properties of the aggregates used were determined as per
IS 2383 (2007) and they are given in Table 4.4.
Table 4.4 Physical properties of the aggregates
Superplasticizer
Master Glenium 8233, a polycarboxylate (PCE) based superplasticizer was used to attain the
required workability. The appearance was in a reddish-brown colour liquid. The density of
the liquid content was 1080 kg/m3 and it has 33% solid content. The specific gravity and pH
were 1.08 and 6.0, respectively
Characteristics Values obtained Relevant standard
Specific gravity 3.17 IS 4031 (Part 11) - 1998
Fineness (m2/kg) 380 IS 4031 (Part 2) - 1998
ASTM C204 - 2016
Consistency (%) 30 IS 4031 (Part 4) - 1998
Initial setting time (min) 64 IS 4031 (Part 5) - 1988
Final setting time (min) 435 IS 4031 (Part 5) - 1988
Properties Coarse aggregate
(20 mm)
Coarse aggregate
(10 mm) Fine aggregate
Specific gravity
(SSD) 2.77 2.74 2.54
Water absorption 0.30 0.44 0.67
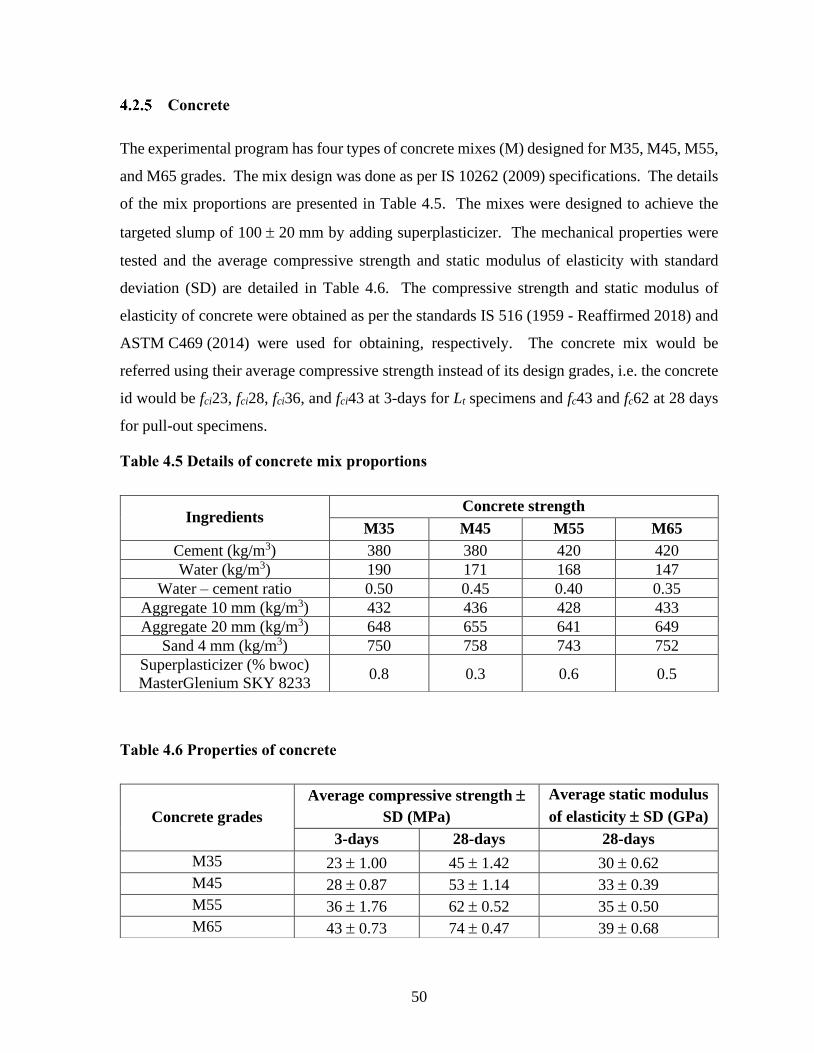
50
Concrete
The experimental program has four types of concrete mixes (M) designed for M35, M45, M55,
and M65 grades. The mix design was done as per IS 10262 (2009) specifications. The details
of the mix proportions are presented in Table 4.5. The mixes were designed to achieve the
targeted slump of 100 20 mm by adding superplasticizer. The mechanical properties were
tested and the average compressive strength and static modulus of elasticity with standard
deviation (SD) are detailed in Table 4.6. The compressive strength and static modulus of
elasticity of concrete were obtained as per the standards IS 516 (1959 - Reaffirmed 2018) and
ASTM C469 (2014) were used for obtaining, respectively. The concrete mix would be
referred using their average compressive strength instead of its design grades, i.e. the concrete
id would be fci23, fci28, fci36, and fci43 at 3-days for Lt specimens and fc43 and fc62 at 28 days
for pull-out specimens.
Table 4.5 Details of concrete mix proportions
Table 4.6 Properties of concrete
Ingredients Concrete strength
M35 M45 M55 M65
Cement (kg/m3) 380 380 420 420
Water (kg/m3) 190 171 168 147
Water – cement ratio 0.50 0.45 0.40 0.35
Aggregate 10 mm (kg/m3) 432 436 428 433
Aggregate 20 mm (kg/m3) 648 655 641 649
Sand 4 mm (kg/m3) 750 758 743 752
Superplasticizer (% bwoc)
MasterGlenium SKY 8233 0.8 0.3 0.6 0.5
Concrete grades
Average compressive strength
SD (MPa)
Average static modulus
of elasticity SD (GPa)
3-days 28-days 28-days
M35 23 1.00 45 1.42 30 0.62
M45 28 0.87 53 1.14 33 0.39
M55 36 1.76 62 0.52 35 0.50
M65 43 0.73 74 0.47 39 0.68

51
4.3 OBJECTIVE 1: DETERMINATION OF THE TRANSMISSION LENGTH (Lt) AND ITS EFFECT
ON SHEAR CAPACITY OF THE PRISTINE PTC SYSTEMS
This section puts forward a detailed description of the geometry of specimens, experimental
variables, preparation of Lt specimens, and the strain measurements used for Objective 1.
Experimental design
The main experimental variable for this objective was the compressive strength of concrete at
transfer (fci). fci of 23, 28, 36, and 43 MPa were used. Then, three Lt specimens of each variable
were cast. Totally, 12 specimens were tested to obtain the Lt of the PTC systems as a function
of fci. Later, to understand the influence of time dependent effects, the transmission length was
monitored upto 360 days. Table 4.7 presents the experiment design used for Objective 1.
Table 4.7 Experimental design for Objective 1
Note: Prestress is transferred at 3rd day.
Specimen geometry
A prismatic specimen with a 12.7 mm diameter strand at the centre, as shown in Figure 4.3
was used. The cross section of the concrete prism was 100 100 mm and length of the
specimen was 2000 mm. The DEMEC inserts were placed on both sides of the concrete
surface along the length of the specimen at 50 mm interval to obtain strain on it. The details of
the DEMEC inserts are set forth in the following sections.
Specimen
ID
fci
(MPa)
No. of
specimen
Duration (days)
3 7 28 120 150 200 250 300 360
fc23 23 3 ✓ ✓ ✓ ✓ ✓ ✓
fc28 28 3 ✓ ✓
fc36 36 3 ✓ ✓ ✓ ✓ ✓
fc43 43 3 ✓ ✓

52
Figure 4.3 The schematic representation of transmission length specimen geometry
Preparation of Lt specimens
The specimen preparation involves three stages (i) prestressing the strand, (ii) concreting and
curing, and (iii) prestress releasing.
4.3.3.1 Stage 1: Prestressing the strand
Figure 4.4 shows the prestressing bed and the PTC specimen. The prestressing bed consisted
of a hollow steel section and two end brackets. A 5.5 m long seven-wire strand was inserted
in the through-holes of the end brackets. Then, an initial prestress of about 0.75 fpk was applied.
As indicated in the zoomed portions 1 and 2 of Figure 4.5 (a) and (b) at the jacking end (JE),
a hydraulic jack (300 kN capacity) was placed to apply the stress. Steel chair, wedges and
barrels, and load cell were also kept to, activate the stress reaction, lock the stress, and monitor
the load applied, respectively. The wedge & barrel placed outside the load cell was initially
kept loose and while stressing the load was activated between the two outer wedges placed at
both ends. After stressing, the wedge & barrel placed outside the load cell would be locked
tightly using the ring holder and then, the outer wedge & barrel and hydraulic jack were
removed. Now the stress would act between the two end brackets of the bed. While removing
the hydraulic jack, some amount of stress would be lost due to the seating of wedge placed
outside the load cell. However, the loss of prestress was negligible by about 5%. The load
cell reading indicating the applied prestress of about 0.7 fpu would be recorded as effective
stress acting on the strand.

53
(c) Photograph of prestressing bed
Figure 4.4 The schematic representation and photograph of prestressing bed with the
PTC specimen

54
(a) Zoomed Portion 1
(b) Zoomed Portion 2
(c) Zoomed Portion 3
Figure 4.5 Zoomed portions of various arrangement to apply and release the prestress

55
4.3.3.2 Stage 2: Concreting and curing
After stressing the strand, a custom-designed PVC mould was placed around the strand (on the
prestressing bed) to place the concrete. Hexagonal brass inserts with bolt/head and nut/base
were designed and fabricated for the strain targets (Mohandoss et al., 2018). These were affixed
to acrylic strips with pre-defined holes (50 mm c/c spacing) for accurate spacing and
alignment. These strips with brass inserts were then placed along the centre line of the two
opposite, vertical surfaces on the inside faces of the PVC mould as shown in Figure 4.6. Figure
4.7 provides more details on these brass inserts. It should be noted that achieving uniform
compaction of concrete along the strand was crucial for the study. To achieve this, concrete
in the PVC mould was placed in a single layer of 100 mm height and compacted uniformly
(25 tampings for every 100 mm length). After 24 hrs, the Lt specimen and the accompanying
cube specimens were demoulded. Then, the acrylic strips were removed from the concrete
surface (by unscrewing the bolt/head of the inserts). Then, the bolt/head of the inserts was
threaded again to the nut/base - to facilitate DEMEC gauge measurements. The specimens
were cured (by covering with wet burlap and plastic sheet) until 3 days or when the concrete
attained about 60% of the target compressive strength, whichever was earlier.
Figure 4.6 DEMEC insert arrangement for the preparation of the Lt specimens

56
Figure 4.7 The schematic illustration of the DEMEC inserts used
4.3.3.3 Stage 3: Prestress releasing
At the releasing end (RE) as shown in Figure 4.5 (c), a hexagonal nut and bolt arrangement
was used as a stress adjusting system (SAS) - to gradually transfer the prestress from the strand
to the hardened concrete. Once the concrete had attained its sufficient strength, say about 60%
of its target compressive strength in about 3 days, the prestress was gradually transferred. The
SAS consists of three hexagonal bolts welded with a steel plate of (150 150 15) mm in size
as shown in the zoomed portion 3. The Lt was obtained by measuring the change in distance
between the inserts before and after prestress transfer. The average fpe was about 1215 MPa.
Figure 4.8 shows the photograph of the Lt specimen after prestress release.

57
Figure 4.8 The photograph of transmission length specimen
Strain measurements and instrumentation
The Lt of the PTC member is determined based on the strain development on the strand or
concrete surface. Measuring strain on the strand surface is difficult as placing multiple strain
gauges on the strand surface could affect the S-C bond. In addition to this, the strain gauge
could be damaged during compaction and prestress transfer. Hence, in this study, strain
measurement on the concrete surface was used to obtain the Lt. Researchers have also proved
that there is no significant change in the strain measurement between the strand and concrete
surfaces (Russell and Burns, 1996).
Figure 4.9 The photograph of the DEMEC gauge used to take measurements
Reference bar
Setting out bar
58
Demountable mechanical (DEMEC) gauge as shown in Figure 4.9 was used to measure
the distance between the inserts before and after prestress transfer. The gauge length of
DEMEC was 150 mm. Inserts were typically placed at 50 mm gauge length. Initially,
surface-mounted DEMEC discs were glued on the concrete surface using Anabond adhesive.
Then, it was experimentally observed that these discs were not suitable for long-term
measurements. Sometimes even while taking measurements, these pins might come off.
Therefore, to avoid this issue, brass inserts were used to obtain quality data, especially for
long-term measurements. These inserts were custom-designed and fabricated as nut bolt
system using hexagonal brass rods and the details are provided in Figure 4.7. Initially, the
inserts were designed without grooves and then later it was found that these inserts were not
gripped properly and could come off from the concrete. In order to fix the inserts properly,
grooves are made on the inserts.
Figure 4.10 shows the details of the DEMEC gauge readings using a 150 mm gauge.
The DEMEC readings were taken with reference of 150 mm gauge length and the strain (c)x
is assigned to the midpoint of the gauge length, which is the distance between every (n-1)th to
(n+1)th point (see Figure 4.11). Consequently, readings were taken for all the points on the
concrete surface. The measured strain data was smoothened by averaging the strain data over
the three consecutive and overlapping 150 mm gage lengths. Therefore, the smoothened strain
at xth point (’c)x was calculated as follows using Eq. 4.1:

59
Figure 4.10 Length change being measured using the DEMEC gauge
Figure 4.11 Strain measurement using the DEMEC gauge on the concrete surface
( )( ) ( ) ( )
3
11 +− ++= xcxcxc
xc
εεεε'
Eq. (4.1)
The average of (𝜀′𝑐)𝑥 observed at the left and right sides of the specimen was
calculated and the average strain profile along the length of the specimen was plotted (with a
plateau at the center portion). Then, the average maximum strain (AMS), as defined by Russell
and Burns (1997), was computed by averaging all the strain measurements on the plateau. The
Lt is defined as the distance from the end of the member to the point with average strain equal

60
to the 95% of AMS. In this way, the Lt at both ends of the specimen was calculated and the
average was defined as the Lt of the specimen.
4.4 OBJECTIVE 2: DETERMINATION OF BOND STRENGTH BETWEEN THE PRESTRESSED
STRANDS AND CONCRETE
Specimen geometry
As per the experimental design, 24 pull-out specimens were cast and tested. Figure 4.12 shows
the geometry details of bond test specimens with strands embedded in a concrete prism of cross
section 100×100 mm. A 50 mm long PVC pipe was placed as a bond breaker as shown to
avoid stress concentration during testing.
Figure 4.12 The schematic diagram of bond test specimen configuration

61
Experimental design
The main experimental parameters for this objective were compressive strength of concrete,
embedment length of the member, and prestress level. Six numbers of specimens were cast
for each group. A total of 24 specimens were cast and tested to determine the bond strength
of the PTC members. Table 4.8 provides the test variables and number of test specimens for
each variable combination studied.
Table 4.8 Experimental design showing the test variable and its combination
Note: Specimen ID; fcxx – compressive strength; T/S – taut (0.1 fpu)/stressed (0.7 fpu); S/L – short le (450)/long
le (950)
Two typical compressive strength of concrete (fc = 43 and 62 MPa) used in the PTC
applications was selected for the experimental work. The le was chosen by considering the
transmission length (Lt) for the applied prestress level. As mentioned in Chapter 2, the le should
be at least more than twice the Lt. Specimens with taut and stressed strands were prepared.
For the taut strand specimens, the minimum stress of about 0.1 fpu was applied to avoid the
wobbling of the strands, and two strengths of concrete (fc = 43 and 62 MPa) were used with
le = 450 mm. For the stressed strand specimens, the maximum stress of about 0.7 fpu was
applied and the length of the specimen (L) was 1000 mm so that le is more than twice the Lt.
For a stress of ~0.7 fpu, the Lt in concrete with fc = 62 MPa is about 440 mm (Mohandoss et al.,
2018).
The pull-out specimens with a maximum of 1000 mm long specimens can only be
tested using the available MTS machine at IIT Madras. As the height of the universal testing
machine (UTM) limits the available space to mount the frame. Therefore, for the stressed
Specimen
ID
Experimental variables
Number of
specimens
Concrete
strength
Embedment
length Prestress level
fc = 43 fc = 62 le = 450 le = 950 fps = 0.1fpu fps = 0.7fpu
fc43-T-S ✓ ✓ ✓ 6
fc62-T-S ✓ ✓ ✓ 6
fc62-T-L ✓ ✓ ✓ 6
fc62-S-L ✓ ✓ ✓ 6
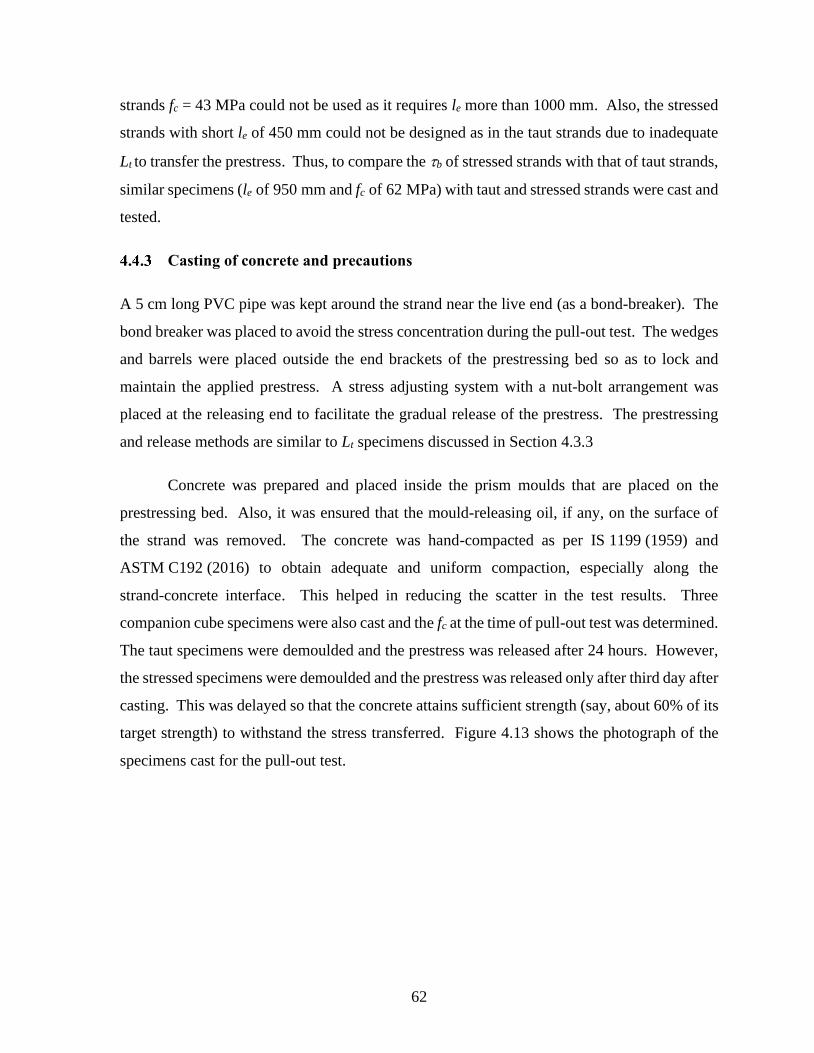
62
strands fc = 43 MPa could not be used as it requires le more than 1000 mm. Also, the stressed
strands with short le of 450 mm could not be designed as in the taut strands due to inadequate
Lt to transfer the prestress. Thus, to compare the b of stressed strands with that of taut strands,
similar specimens (le of 950 mm and fc of 62 MPa) with taut and stressed strands were cast and
tested.
Casting of concrete and precautions
A 5 cm long PVC pipe was kept around the strand near the live end (as a bond-breaker). The
bond breaker was placed to avoid the stress concentration during the pull-out test. The wedges
and barrels were placed outside the end brackets of the prestressing bed so as to lock and
maintain the applied prestress. A stress adjusting system with a nut-bolt arrangement was
placed at the releasing end to facilitate the gradual release of the prestress. The prestressing
and release methods are similar to Lt specimens discussed in Section 4.3.3
Concrete was prepared and placed inside the prism moulds that are placed on the
prestressing bed. Also, it was ensured that the mould-releasing oil, if any, on the surface of
the strand was removed. The concrete was hand-compacted as per IS 1199 (1959) and
ASTM C192 (2016) to obtain adequate and uniform compaction, especially along the
strand-concrete interface. This helped in reducing the scatter in the test results. Three
companion cube specimens were also cast and the fc at the time of pull-out test was determined.
The taut specimens were demoulded and the prestress was released after 24 hours. However,
the stressed specimens were demoulded and the prestress was released only after third day after
casting. This was delayed so that the concrete attains sufficient strength (say, about 60% of its
target strength) to withstand the stress transferred. Figure 4.13 shows the photograph of the
specimens cast for the pull-out test.

63
Figure 4.13 The photograph of the pull-out specimens
The compaction of concrete plays a critical role in the preparation of pull-out specimens
as it could affect the S-C interface. Therefore, it has to be done properly to achieve uniformity
by avoiding voids. Care was taken to attain proper compaction as per IS 1199 (1959) and
ASTM C192 (2016). Since the depth and width of the specimens were 100 mm, concrete was
placed in a single layer for a section length of about 100 mm (to avoid separation at the S-C
interface) and it was hand compacted. Each section was given 25 strokes and distributed
uniformly along the length of the moulds. After compacting the layers, the outsides of the
mould were tapped for about 10 to 15 times to release the trapped large air bubbles. The
surface of the strand should be clean without any rust formation and oil while placing the
concrete. Also, the end faces of the specimens were finished and maintained perpendicular to
the axis of the strand.
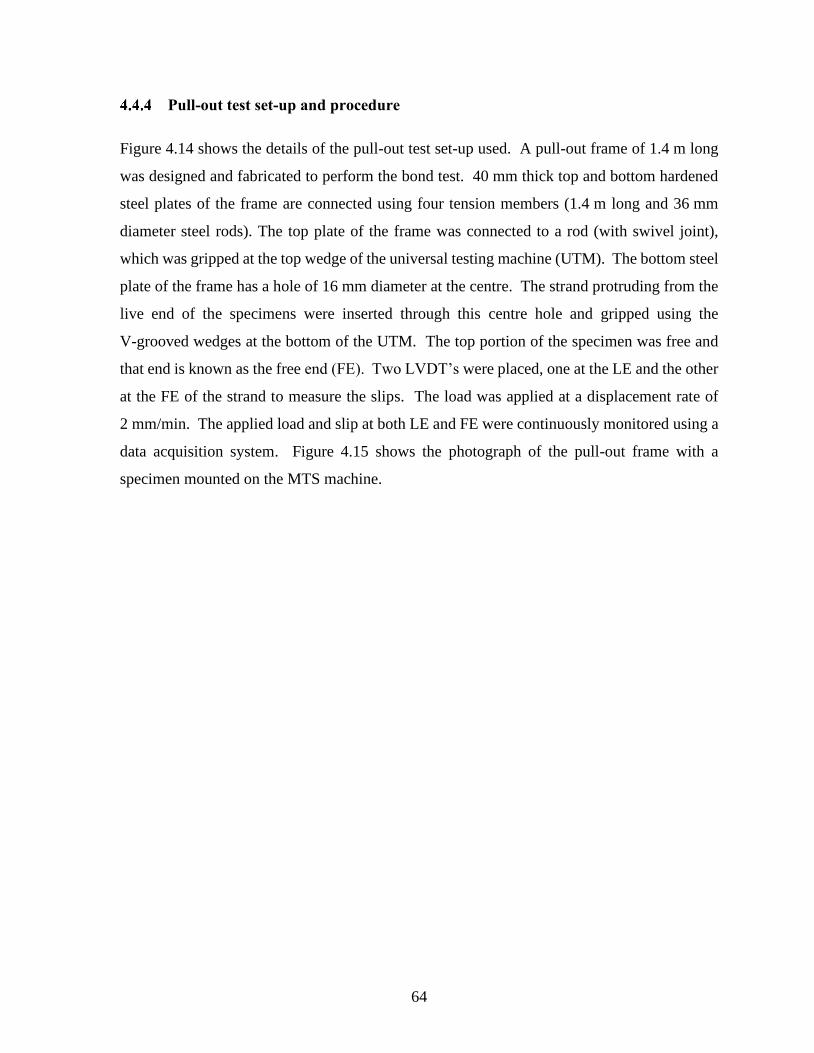
64
Pull-out test set-up and procedure
Figure 4.14 shows the details of the pull-out test set-up used. A pull-out frame of 1.4 m long
was designed and fabricated to perform the bond test. 40 mm thick top and bottom hardened
steel plates of the frame are connected using four tension members (1.4 m long and 36 mm
diameter steel rods). The top plate of the frame was connected to a rod (with swivel joint),
which was gripped at the top wedge of the universal testing machine (UTM). The bottom steel
plate of the frame has a hole of 16 mm diameter at the centre. The strand protruding from the
live end of the specimens were inserted through this centre hole and gripped using the
V-grooved wedges at the bottom of the UTM. The top portion of the specimen was free and
that end is known as the free end (FE). Two LVDT’s were placed, one at the LE and the other
at the FE of the strand to measure the slips. The load was applied at a displacement rate of
2 mm/min. The applied load and slip at both LE and FE were continuously monitored using a
data acquisition system. Figure 4.15 shows the photograph of the pull-out frame with a
specimen mounted on the MTS machine.

65
All dimensions are in mm
Figure 4.14 The details of the pull-out test set-up

66
Figure 4.15 The photograph of the experimental set-up used for the pull-out test
Instrumentation
Two LVDT’s of 50 mm travel length (AEP transducers) were used. One was placed at the live
end and the other was placed at the free end of the strand, as shown in Figure 4.14 - to measure
the slip of the strand with respect to the concrete during testing. An L-shaped smooth plate
surface was placed on the surface of concrete at the free end to place the LVDT in a position
to get a uniform reading. A QuantumX (MX 1615B model) data acquisition system (DAQ)
was used for measuring the test parameters. Two LVDTs, displacement of actuator and load
67
cell of the UTM machine were connected to the DAQ system to record the LVDTs’ reading,
displacement of actuator, load, and elapsed time.
4.5 SUMMARY
In sum, this chapter delineated the experimental method adapted for the study which provides
the details of materials, configuration of specimens, experimental variables, and specimen
preparations for Lt and bond studies. Also, the methods adapted and instrumentations used to
measure the Lt and the bond-slip behaviour of the PTC systems in detail. The results obtained
from the experimental programs would be enumerated in the following chapters.
68
5 RESULTS AND DISCUSSIONS – TRANSMISSION LENGTH (Lt)
5.1 INTRODUCTION
This chapter presents and discusses the results obtained from the experimental investigations
to achieve Objective 1, which addressed the effect of compressive strength of concrete at
transfer and time on transmission length. The challenges associated with the transmission
length measurements were discussed to reduce the error in the DEMEC measurements. Based
on the experimental results, this chapter proposes an Lt model as a function of the fci and
compares that with the available standard Lt models. Also, the consequences of the
underestimation and overestimation of the Lt are disputed by conducting case studies which
emphasise the significance of the Lt on the shear performance of the PTC members in the
transmission zone.
5.2 OBJECTIVE 1: EFFECT OF COMPRESSIVE STRENGTH AT TRANSFER (fci) ON
TRANSMISSION LENGTH (Lt)
Objective 1 has the following three sub-targets: 1) Evaluation of the suitability of various codes
for estimating the transmission length, 2) Determination of effect of compressive strength of
concrete at transfer on Lt, and 3) Effect of Lt on the shear capacity of the pristine PTC systems
and transverse tensile stress distribution along the transmission zone. The first part of the
objective is a comparative study to identify the differences and limitations existing in the
standard design equations. Then, the following section sets forth the experimental
observations on the effect of compressive strength at transfer and time on the Lt and case
studies were discussed to highlight the significance of Lt on the shear capacity of the PTC
members.
5.3 EVALUATION OF THE EXISTING TRANSMISSION LENGTH MODELS
The available equations to calculate the Lt (discussed in the literature chapter) are evaluated to
understand the differences existing between the standard and empirical equations. Many
factors could influence the Lt of the member, however, the effect of compressive strength at
transfer on the transmission length is the focus of the study. The results indicated that some
69
of the codes over/under estimate the required transmission length, especially the codes that do
not consider the fci. This highlights the need for considering the fci in the design transmission
length.
Comparison of available Lt models
Based on the available codal and literature equations, the Lt was calculated (denoted as Lt, code)
and compared to analyse the difference existing among each other. Generally, in the precast
PTC systems, 12.7 mm diameter strands are used and stressed to 0.75 fpu. M55 and M65 are
the commonly used concrete grades in the PTC systems and as per IS 1343 (2012) the
minimum grade of concrete should not be less than M45. Therefore, for the comparative
analysis, concrete grades of M35, M45, M55, and M65 were used and the same grades were
considered for the experiments also. Figure 5.1 presents the Lt, code based on ACI, AASHTO,
AS, CSA, IS, BS, EN, and fib-MC standards for 12.7 mm diameter, 1860 MPa grade, low
relaxation strand embedded in concrete with fci of 23, 28, 36, and 43 MPa. The design
equations provided in the standards are discussed in Chapter 2.
Table 5.1 summarises the different parameters considered to compute the design of the
Lt in different standards. As ACI, AASHTO, AS, CSA, and IS do not consider fci as one of the
variables in their design Lt equation, Lt is not changed when fci is increased from 23 to 43 MPa.
Based on these standards, Lt, code for 12.7 mm dia. strand stressed to 0.75fpu is 718, 762, 635,
and 381 mm for ACI, AASHTO & AS, CSA, and IS, respectively for all grades of concrete.
These codal provisions using empirical formulation based on the diameter of the strands
without considering the properties of the concrete may result in less conservative or less
rational shear design near the supports (Barnes et al., 2003; Mohandoss et al. 2015).

70
Figure 5.1 Design Lt based on standards for different strengths of concrete at transfer
Figure 5.2 Calculated Lt using the empirical model equations from literature
Lt, calculated (mm)
0 500 1000 1500 2000
Hanson and Kaar (1959)Martin and Scott(1976)Zia & Moustafa (1977)
Cousins et al. (1990)Shahawy et a. (1992)Mitchell et al. (1993)
Deatherage et al. (1994)Buckner (1995)
Russell and Burns (1997)Lane (1998)
Mahmoud et al. (1999)Barnes et al. (2003)
Marti-Vargas et al. (2006)Kose and Burkett (2007)
NCHRP (2008)Ramierz-Garcia et al. (2016)
Pellegrino et al. (2017)
fci 43
fci 36
fci 28
fci 23

71
Table 5.1 Parameters considered in different standard Lt equations
✓- Considered in the codes; - Not considered in the codes
On the other hand, the design value of the Lt based on EN 2 and fib MC 10 decreases
significantly as the fci increases thus representing a realistic behaviour. From the plots, it can
be seen that the value of the Lt based on the fib MC (2010), EN 2 (2004), and BS 8110 (1997)
was increased by about 37, 33, and 27%, respectively. The European code overestimates the
Lt value by considering many factors that could influence the Lt. Since the values are over
predicted, the number of underestimated cases are lower in EN codes than the ACI and
AASHTO codes (Martí-Vargas and Hale, 2013).
Figure 5.2 illustrates the calculated values of Lt for different selected concrete strength
using the empirical equations proposed by several authors. The values of Lt by Hanson and
Kaar (1959), Martin and Scott (1976), Deatherage et al. (1994), Buckner (1995), and Russell
Codes Applied
prestress
Strand
diameter
Concrete
strength
at release
Bond
stress /
condition
Type of
tendon
Releasing
method
AASHTO
(2012)
✓
AS 3600
(2009)
CSA
(2004)
IS 1343
(2012)
ACI 318
(1963-
2014) ✓ ✓
BS 8110
(1997) ✓ ✓ ✓
EN 2/ IRC
(2004) ✓ ✓ ✓ ✓ ✓ ✓
fib MC
(2010)

72
and Burns (1997) are 745, 1015, 855, 855, 1090 mm, respectively for all the four fci as these
equations do not consider the fci. The experimental work and results of Hanson and Kaar
(1959) is the fundamental study for the Lt model, and the equation developed based on this
study was adapted by ACI 318 (1963). Even today, the same equation is being used by
ACI 318 (2014). The number at the denominator indicates the compressive strength of
concrete used in those study in the 1960’s. The concrete strength and strand used in today’s
modern construction practices are different from those used in the olden days. Hence, the
codal equations should be revised to meet the current construction practices.
Zia and Moustafa (1977), Cousins et al. (1990), Mitchell et al. (1993), Lane et
al. (1998), Mahmoud et al. (1999), Barnes et al. (2003), Martí-Vargas et al. (2006), Kose and
Burkett (2007), NCHRP (2008), Ramierz-Garcia et al. (2016) and Pellegrino et al. (2017)
proposed an empirical equation to calculate the Lt by considering the fci. However, a huge
scatter was observed on the calculated Lt using these empirical equations. For instance, the
value of Lt, calculated for fci = 43 MPa varied from 315 mm to 1314 mm. Some of these values of
Lt, calculated resulted lesser or higher than that of the Lt, code. This indicates that the design values
could underestimate/overestimate the required Lt.
As explained earlier, a realistic estimation of transmission length is important for a
pretensioned concrete structural design, especially in the precast PTC industry where obtaining
a product within a short duration is essential. So, it is necessary to attain the required fci as
early as possible so that the member can have adequate length to transfer the prestress at
release. As explained in Figure 2.4, the Lt is the part of development length (Ld) and therefore,
the estimation of Lt influences the stress in the prestressing strand under service. Incorrect
estimation of Lt can affect the shear capacity in the end zones of the member at prestress release
(Ramirez-Garcia et al., 2016). The under or overestimation of the Lt could lead to the following
consequences. Accordingly, a design engineer should address the implications of these effect
on the design of PTC members (Martí-Vargas and Hale, 2013).

73
The significance of transmission length
5.3.2.1 Overestimation of transmission length
If the design Lt is longer than the required Lt, the resulted shorter Lt could increase the stress in
the end zone. This could lead to the risk of cracking by concrete splitting and bursting and
could result in spalling of concrete in the end regions. Accordingly, this could affect the bond
at the transmission zone if the members do not have confinement or shear reinforcement (den
Uijl, 1998). Kasan and Harries (2011) reported that if the bond is lost in the transmission zone,
an effective prestress could redevelop by bond at a distance from the damaged location. It is
critical, especially for the design of precast hollow core slabs, where the members do not have
shear reinforcements (Vázquez-Herrero et al., 2013). Hence, proper design checks should be
taken to avoid such issues.
5.3.2.2 Underestimation of transmission length
If the design/estimated Lt is shorter than the required Lt, the resulting longer Lt could reduce
the available member length to resist bending moment and shear. This will eventually affect
the serviceability of the member and result in an unconservative design for shear and flexural.
This situation would be worse in the case of hollow core slabs, where prestress transfer plays
a major role in shear capacity of the member. The detailed discussion on the significance of
transmission length on performance of PTC members is provided in the later sections.
5.4 DETERMINATION OF Lt USING DEMEC GAUGE
As mentioned in Chapter 5, the Lt is determined by obtaining the strain profile on the concrete
surface. The strain on the concrete surface is determined by measuring the change in distance
between the target points placed on the concrete surface using the DEMEC guage. The
measurement of DEMEC gauge readings could seem simple; but it is highly sensitive to the
posture of the person taking the measurements, the way of holding the gauge, the speed of
taking the reading, etc. The measurement of Lt involves multiple and overlapping gauge
lengths, the measurement across which needs to be taken uniformly in a short period (say, a
few minutes), adding the difficulties in obtaining reproducible results. Therefore, the DEMEC
readings can vary when taken by different persons. To understand this human error and its
74
sensitivity to the Lt calculations, a blind test was conducted and discussed in the following sub-
section.
Human error on the DEMEC measurements
In the blind test, three persons (denoted as P1, P2, and P3) measured the length of a standard
reference rod (150 mm long invar rod) using the same DEMEC gauge and at the measurement
rates of 1.5, 3, and 2 readings/min, respectively. P1 was an undergraduate student and P2 and
P3 were graduate students. Figure 5.3 shows the box plot with possible human error in
measurement (or the deviation from 150 mm) in the four cases. Vide footnote of Figure 5.3
for the definition of four cases, C1, C2, C3, and C4 with different persons positioning the gauge
and reading the data. In the C4, to check the sensitivity of DEMEC measurements, P3 took
100 readings blindly (i.e., without looking at the display of the gauge) to avoid any bias on
reading.
The mean () and standard deviation () of C1 and C2 are significantly larger than
those of C3 and C4. From the results, it is observed that P1 did not hold the gauge properly
and hence, could not obtain consistent and/or reproducible results. Also, significant variation
was observed in P2’s reading (who has more experience than P1 in DEMEC measurements
and hence measured faster than P1 and P3). Person P3 with proper control and moderate speed
could control the reading and obtain reproducible results with less error. Hence, in the blind
test for Case C4, P3 could take reading with an acceptable error and obtained reproducible
results. This study showed that human error could be significant and with appropriate
procedures, the variation in the error could be controlled and reproducible results could be
obtained. It is to be noted that the other errors such as instrument error are not considered in
this study.

75
Figure 5.3 Variation in DEMEC reading with different persons
Difference in DEMEC measurement using inserts and discs
Strain measurements on concrete surfaces is heavily dependent on the type of gauges used and
bond conditions, especially for long-term measurements. In this study, initially DEMEC discs
were glued onto the concrete surface using acrylic based adhesive. It was observed that this
glue could not provide sufficient bond between these discs and concrete – probably due to the
moisture curing practices and/or smooth/machined surfaces of the discs. Also, the force
exerted by the technician while placing the gauge onto the DEMEC disc could lead to
debonding. To avoid such issues, custom-made brass inserts were used to obtain the quality
data, especially for long-term measurements. A brass insert was profiled with a 6 mm wide
groove to ensure adequate bond/grip, as shown in Figure 4.7.
For a comparative study, the strain measurements were taken using discs and inserts
placed on the same surface of an Lt specimen. As shown in Figure 5.4, inserts were placed
along the mid-depth on opposite side faces of the specimen (indicated as I and I/) and the discs
were placed adjacent to the inserts (indicated as D and D/); and companion readings were taken.
The two curves with filled and unfilled markers in Figure 5.5 indicate the strain measurements
Err
or
in m
easu
rem
ent
(mm
)
0.00
0.05
0.10
0.15
0.20Error bar indicates one standard deviation
C1 C2 C3 C4
C1- Gauge positioned & data read by P1; (1.5 readings/min)
C2- Gauge positioned & data read by P2; (3 readings/min)
C3- Gauge positioned & data read by P3; (2 readings/min)
C4- Gauge positioned by P3 and data read by P1; (2 readings/min)
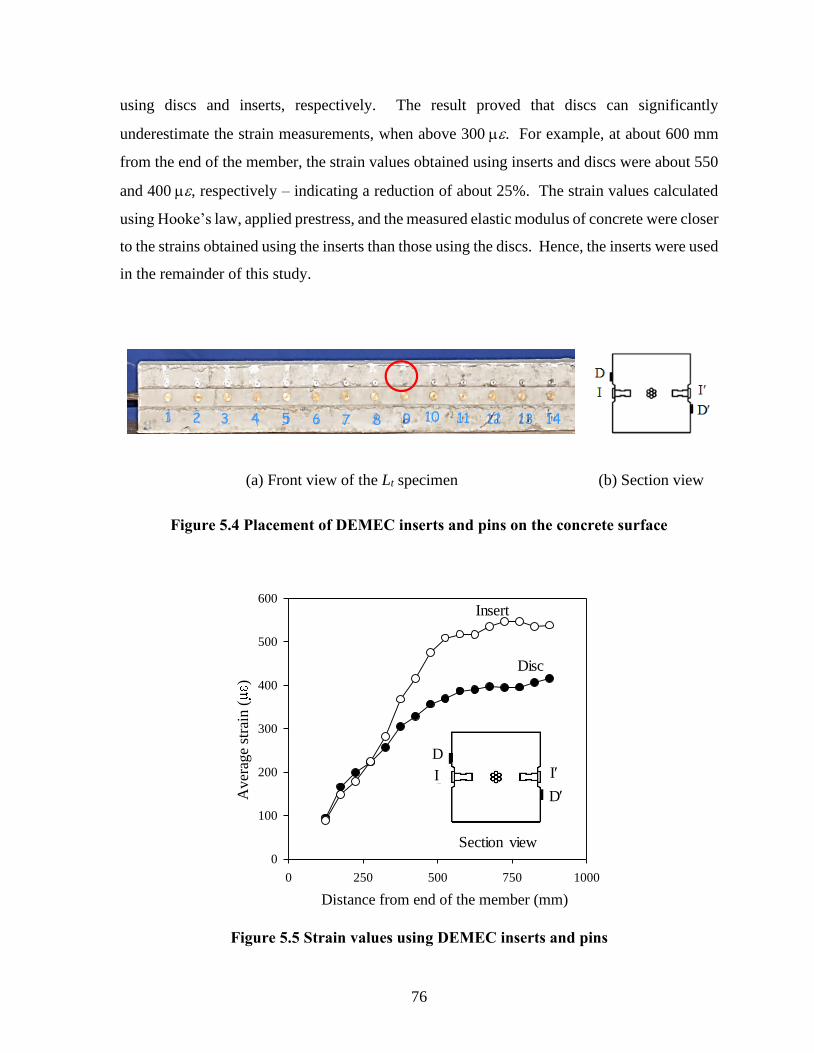
76
using discs and inserts, respectively. The result proved that discs can significantly
underestimate the strain measurements, when above 300 . For example, at about 600 mm
from the end of the member, the strain values obtained using inserts and discs were about 550
and 400 , respectively – indicating a reduction of about 25%. The strain values calculated
using Hooke’s law, applied prestress, and the measured elastic modulus of concrete were closer
to the strains obtained using the inserts than those using the discs. Hence, the inserts were used
in the remainder of this study.
(a) Front view of the Lt specimen (b) Section view
Figure 5.4 Placement of DEMEC inserts and pins on the concrete surface
Figure 5.5 Strain values using DEMEC inserts and pins
1 2 3 4 65 7 8 9 10 11 12 13 14
Distance from end of the member (mm)
0 250 500 750 1000
Aver
age
stra
in (
)
0
100
200
300
400
500
600Insert
Disc
Section viewSection view
D
I I
D

77
5.5 EFFECT OF COMPRESSIVE STRENGTH OF CONCRETE ON TRANSMISSION LENGTH
Table 5.2 provides the fci, fpe at transfer, and measured Lt (denoted as Lt, measured) at both
releasing and jacking ends for all the specimens. Figure 5.6 - Figure 5.9 show the average
smoothed variation of strain, (’c)x along the length of the specimens. At transfer, the strain
on the concrete surface increased along the length of the member from the end and became
constant. The average strain for all the strengths of concrete at transfer was about 530 µε. As
the stress is transferred from the strand to concrete at 3 days, the strain variations between the
different specimens could be in the range of 5 to 20 microstrains, which could not be exactly
captured by DEMEC gauge. Based on the 95% AMS method, a horizontal line has been drawn
to 95% of the maximum average strain. The distance at which the line intersects the strain
profile is considered as the Lt as explained in the AMS method in Chapter 4.
Table 5.2 Experimental parameters at transfer and measured Lt
Specimen
ID
fci
(MPa)
fpe
(MPa)
Lt, measured (mm) Lt, avg
(mm)
Standard
deviation
(mm) JE RE Average
fci23 – S1 23.50 1270 630 565 600
580 32 fci23 – S2 22.80 1189 520 570 545
fci23 – S3 22.10 1230 625 580 600
fci28 – S1 28.00 1179 550 570 560
565 17 fci28 – S2 29.00 1209 540 560 550
fci28 – S3 28.70 1220 565 600 585
fci36 – S1 37.10 1148 480 500 490
465 28 fci36 – S2 36.00 1179 460 470 465
fci36 – S3 36.80 1120 430 445 435
fci43 – S1 43.40 1169 385 370 375
385 9 fci43 – S2 42.56 1189 390 405 395
fci43 – S3 43.72 1108 400 375 390

78
Figure 5.6 Average strain on the concrete surface for fci = 23 MPa
Figure 5.7 Average strain on the concrete surface for fci = 28 MPa
Lt = 582 mm
Distance from the jacking end of the member (mm)
0 250 500 750 1000 1250 1500 1750 2000
Aver
age
stra
in (
)
0
100
200
300
400
500
600
700
fci23 - 1
fci23 - 2
fci23 - 3
Lt = 590
95 % AMS
Lt = 570
fci = 23 MPa
Distance from the jacking end of the member (mm)
0 250 500 750 1000 1250 1500 1750 2000
Aver
age
stra
in (
)
0
100
200
300
400
500
600
700
fci28 - 1
fci28 - 2
fci28 - 3
Lt = 555 Lt = 580
fci = 28 MPa
95 % AMS
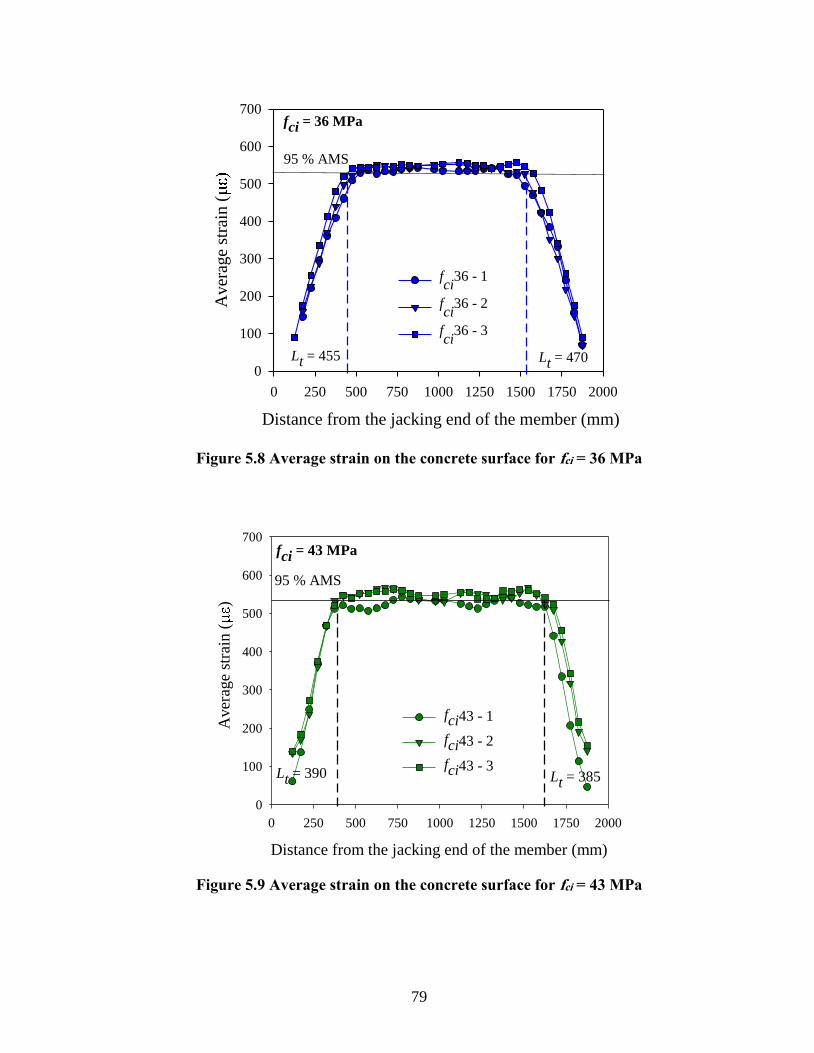
79
Figure 5.8 Average strain on the concrete surface for fci = 36 MPa
Figure 5.9 Average strain on the concrete surface for fci = 43 MPa
Distance from the jacking end of the member (mm)
0 250 500 750 1000 1250 1500 1750 2000
Av
erag
e st
rain
(
0
100
200
300
400
500
600
700
fci
36 - 1
fci
36 - 2
fci
36 - 3
Lt = 455 Lt = 470
95 % AMS
fci = 36 MPa
Distance from the jacking end of the member (mm)
0 250 500 750 1000 1250 1500 1750 2000
Aver
age
stra
in (
)
0
100
200
300
400
500
600
700
fci43 - 1
fci43 - 2
fci43 - 3Lt = 390 Lt = 385
95 % AMS
fci = 43 MPa
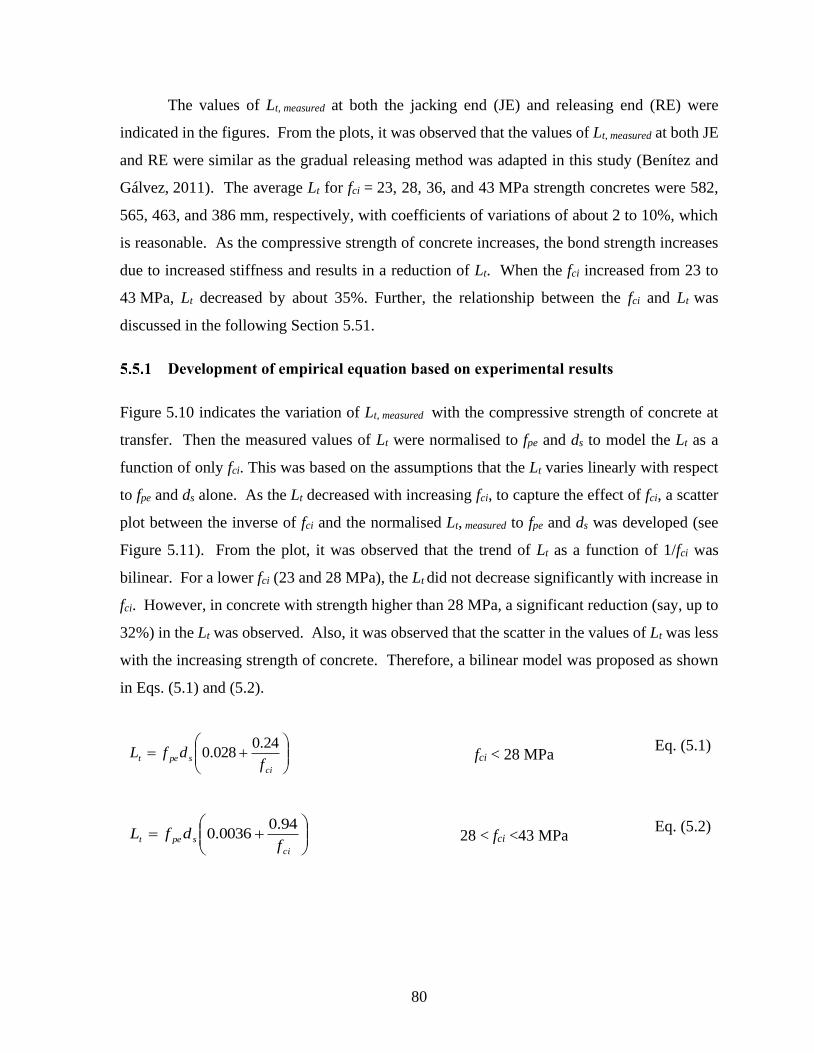
80
The values of Lt, measured at both the jacking end (JE) and releasing end (RE) were
indicated in the figures. From the plots, it was observed that the values of Lt, measured at both JE
and RE were similar as the gradual releasing method was adapted in this study (Benítez and
Gálvez, 2011). The average Lt for fci = 23, 28, 36, and 43 MPa strength concretes were 582,
565, 463, and 386 mm, respectively, with coefficients of variations of about 2 to 10%, which
is reasonable. As the compressive strength of concrete increases, the bond strength increases
due to increased stiffness and results in a reduction of Lt. When the fci increased from 23 to
43 MPa, Lt decreased by about 35%. Further, the relationship between the fci and Lt was
discussed in the following Section 5.51.
Development of empirical equation based on experimental results
Figure 5.10 indicates the variation of Lt, measured with the compressive strength of concrete at
transfer. Then the measured values of Lt were normalised to fpe and ds to model the Lt as a
function of only fci. This was based on the assumptions that the Lt varies linearly with respect
to fpe and ds alone. As the Lt decreased with increasing fci, to capture the effect of fci, a scatter
plot between the inverse of fci and the normalised Lt, measured to fpe and ds was developed (see
Figure 5.11). From the plot, it was observed that the trend of Lt as a function of 1/fci was
bilinear. For a lower fci (23 and 28 MPa), the Lt did not decrease significantly with increase in
fci. However, in concrete with strength higher than 28 MPa, a significant reduction (say, up to
32%) in the Lt was observed. Also, it was observed that the scatter in the values of Lt was less
with the increasing strength of concrete. Therefore, a bilinear model was proposed as shown
in Eqs. (5.1) and (5.2).
+=
ci
spetf
dfL24.0
028.0
fci < 28 MPa
Eq. (5.1)
+=
ci
spetf
dfL94.0
0036.0
28 < fci <43 MPa
Eq. (5.2)
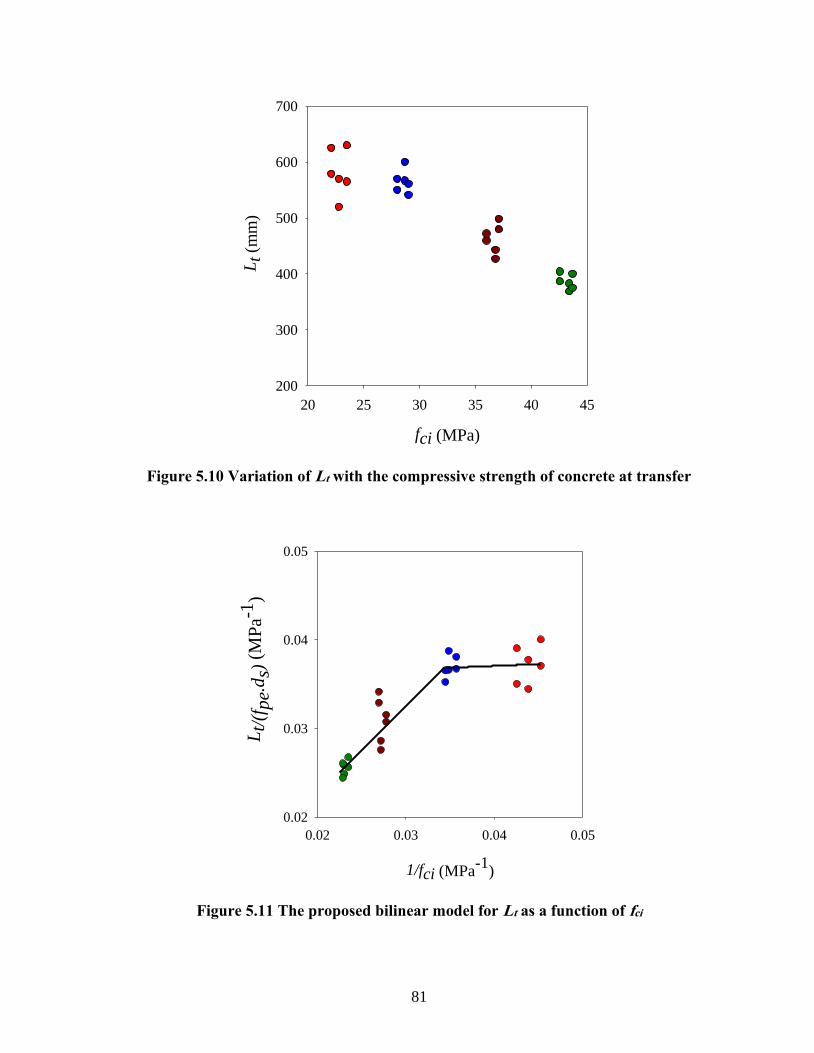
81
Figure 5.10 Variation of Lt with the compressive strength of concrete at transfer
Figure 5.11 The proposed bilinear model for Lt as a function of fci
fci (MPa)
20 25 30 35 40 45
Lt
(mm
)
200
300
400
500
600
700
1/fci (MPa-1
)
0.02 0.03 0.04 0.05
Lt/
(fp
e.d
s) (
MP
a-1)
0.02
0.03
0.04
0.05

82
Figure 5.12 shows the correlation between the Lt estimated using the proposed model
Eqs. (5.1) and (5.2) and Lt, measured. Many data points lie between the two dashed-lines (one
standard deviation away from the average line) indicating the reasonable prediction. Also, the
mean absolute percent error (MAPE) of the model is found to be 3%, - indicating a reasonable
prediction accuracy.
Figure 5.12 Correlation between the Lt, estimated and Lt, measured
Comparision of the Lt obtained from the proposed model and various codes
Figure 5.13 shows the comparison of Lt obtained from the proposed model and various code
(considering fci). The straight lines indicate that the Lt, obtained using AASHTO, AS, ACI,
CSA, and IS codes (i.e., not a function of fci). However, the Lt based on EN 2 (2004),
fib MC (2010), and the proposed model show a downward trend as the concrete strength
increases. It was evident that consideration of the fci in the design Lt equation represents the
rational behaviour of the PTC systems from the experimental results obtained in this study.
Lt, measured (mm)
350 400 450 500 550 600 650
Lt,
est
ima
ted
(m
m)
350
400
450
500
550
600
650

83
Therefore, the fci should be considered in the design Lt equations specified by standard for a
realistic estimation of Lt. In practice, the PTC members will use concrete with fci more than
20 MPa. Considering this, Figure 5.13 indicates that all the codes, except IS 1343 (2012) and
the proposed model overestimate the Lt.
Figure 5.13 Comparison of Lt models as function of fci
Table 5.3 provides the ratio of Lt, code to Lt, estimated (Lt, R herein) for the selected codes.
Except IS 1343 (2012), the Lt, R for other codes was greater than 1 and represented the
conservative Lt designs. The Lt, R based on IS 1343 were 0.65, 0.67, 0.82, and 0.99 for fci of
23, 28, 36, and 43 MPa, respectively. For lower concrete strength, i.e., when the fci = 23 MPa,
the actual Lt of the member was almost double the design Lt based on IS 1343 (2012).
Lt, R increases with increase in fci. Lt, R becomes almost 1 for high strength concrete with
fci = 43 MPa. This indicates that the codal design equation can be used only for the high
strength concrete. However, in practice at the construction site, concrete strength could be
lower and could result in the longer Lt. Therefore, for a standard, it is important to overestimate
fci (MPa)
25 30 35 40 45
Lt
(mm
)
200
400
600
800
1000
1200
ACI AS
CSA
Proposed model
IS
EN 2
fib
AASHTO
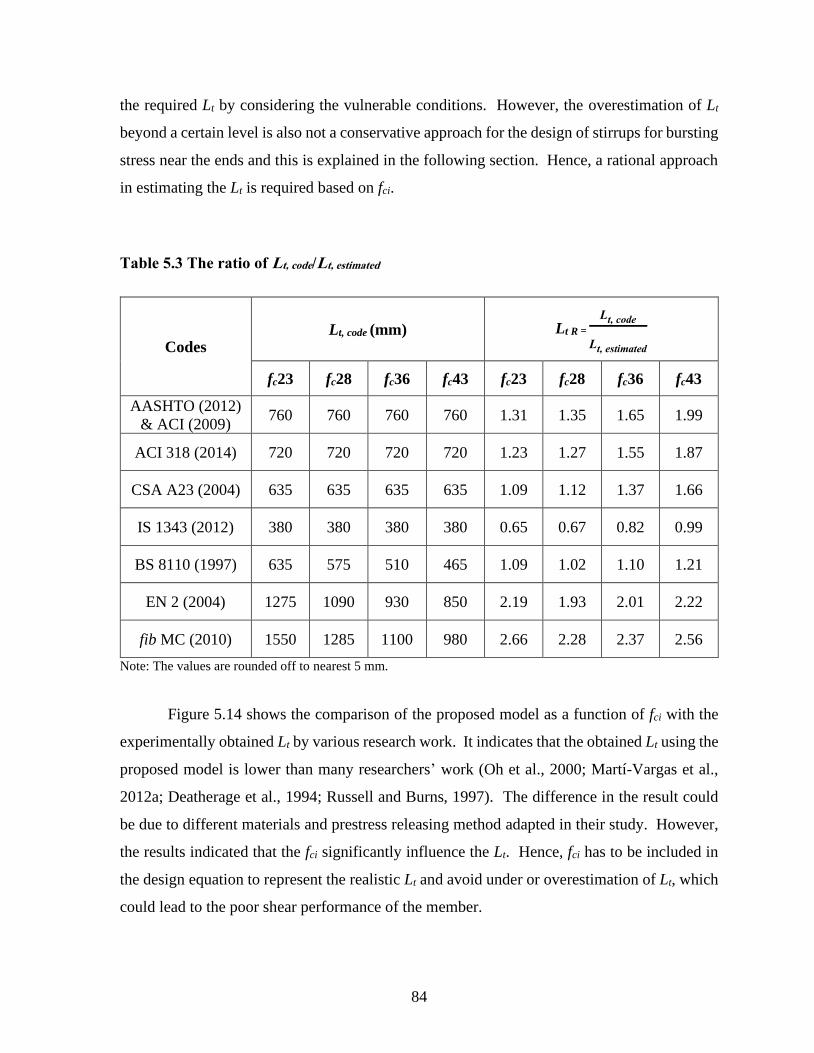
84
the required Lt by considering the vulnerable conditions. However, the overestimation of Lt
beyond a certain level is also not a conservative approach for the design of stirrups for bursting
stress near the ends and this is explained in the following section. Hence, a rational approach
in estimating the Lt is required based on fci.
Table 5.3 The ratio of Lt, code/Lt, estimated
Codes Lt, code (mm) Lt R =
Lt, code
Lt, estimated
fc23 fc28 fc36 fc43 fc23 fc28 fc36 fc43
AASHTO (2012)
& ACI (2009) 760 760 760 760 1.31 1.35 1.65 1.99
ACI 318 (2014) 720 720 720 720 1.23 1.27 1.55 1.87
CSA A23 (2004) 635 635 635 635 1.09 1.12 1.37 1.66
IS 1343 (2012) 380 380 380 380 0.65 0.67 0.82 0.99
BS 8110 (1997) 635 575 510 465 1.09 1.02 1.10 1.21
EN 2 (2004) 1275 1090 930 850 2.19 1.93 2.01 2.22
fib MC (2010) 1550 1285 1100 980 2.66 2.28 2.37 2.56
Note: The values are rounded off to nearest 5 mm.
Figure 5.14 shows the comparison of the proposed model as a function of fci with the
experimentally obtained Lt by various research work. It indicates that the obtained Lt using the
proposed model is lower than many researchers’ work (Oh et al., 2000; Martí-Vargas et al.,
2012a; Deatherage et al., 1994; Russell and Burns, 1997). The difference in the result could
be due to different materials and prestress releasing method adapted in their study. However,
the results indicated that the fci significantly influence the Lt. Hence, fci has to be included in
the design equation to represent the realistic Lt and avoid under or overestimation of Lt, which
could lead to the poor shear performance of the member.
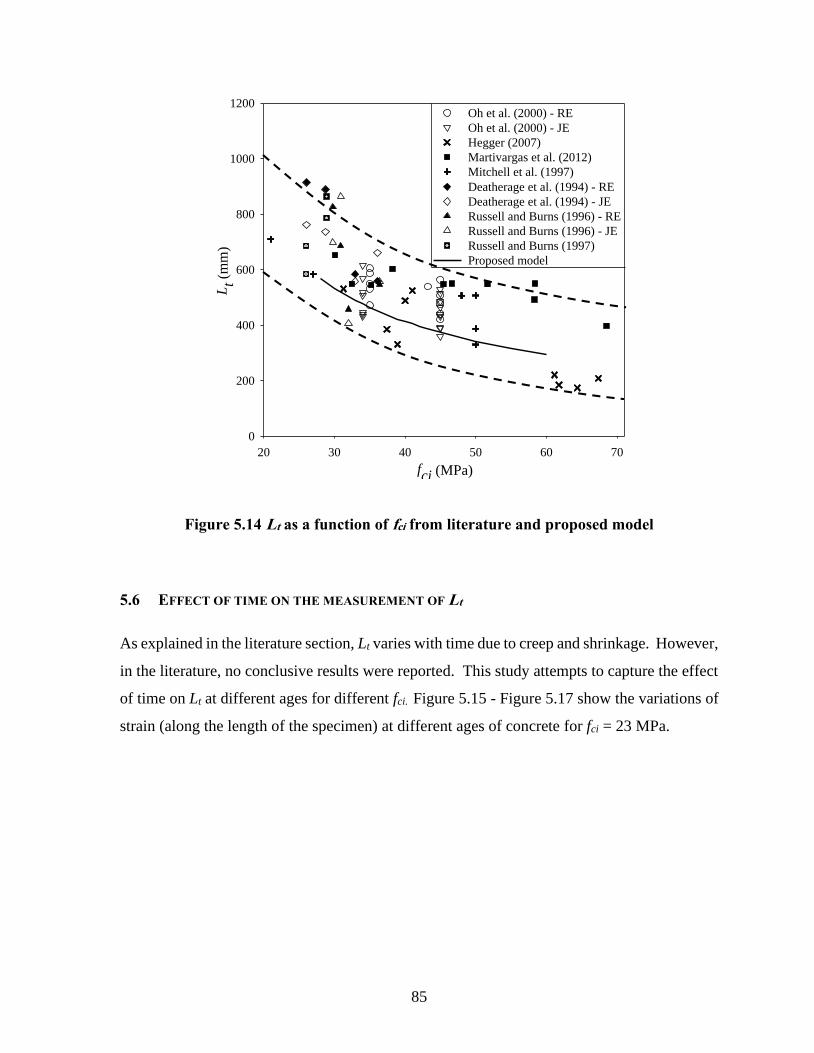
85
Figure 5.14 Lt as a function of fci from literature and proposed model
5.6 EFFECT OF TIME ON THE MEASUREMENT OF Lt
As explained in the literature section, Lt varies with time due to creep and shrinkage. However,
in the literature, no conclusive results were reported. This study attempts to capture the effect
of time on Lt at different ages for different fci. Figure 5.15 - Figure 5.17 show the variations of
strain (along the length of the specimen) at different ages of concrete for fci = 23 MPa.
fci (MPa)
20 30 40 50 60 70
Lt
(mm
)
0
200
400
600
800
1000
1200Oh et al. (2000) - RE
Oh et al. (2000) - JE
Hegger (2007)
Martivargas et al. (2012)
Mitchell et al. (1997)
Deatherage et al. (1994) - RE
Deatherage et al. (1994) - JE
Russell and Burns (1996) - RE
Russell and Burns (1996) - JE
Russell and Burns (1997)
Proposed model
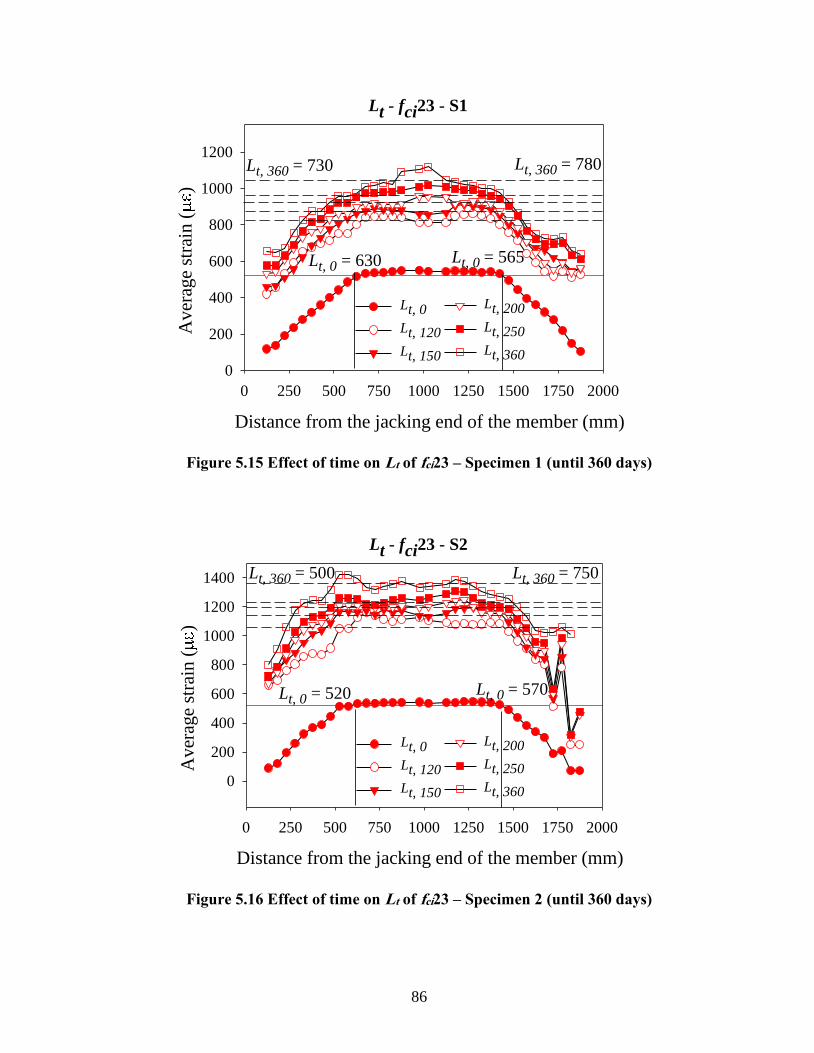
86
Figure 5.15 Effect of time on Lt of fci23 – Specimen 1 (until 360 days)
Figure 5.16 Effect of time on Lt of fci23 – Specimen 2 (until 360 days)
Distance from the jacking end of the member (mm)
0 250 500 750 1000 1250 1500 1750 2000
Aver
age
stra
in (
)
0
200
400
600
800
1000
1200
Lt, 200
Lt, 250
Lt, 360
Lt - fci23 - S1
Lt, 360 = 730
Lt, 0 = 565Lt, 0 = 630
Lt, 0
Lt, 120
Lt, 150
Lt, 360 = 780
Distance from the jacking end of the member (mm)
0 250 500 750 1000 1250 1500 1750 2000
Av
erag
e st
rain
()
0
200
400
600
800
1000
1200
1400
Lt, 200
Lt, 250
Lt, 360
Lt - fci23 - S2
Lt, 360 = 500
Lt, 0 = 570Lt, 0 = 520
Lt, 0
Lt, 120
Lt, 150
Lt, 360 = 750

87
Figure 5.17 Effect of time on Lt of fci23 – Specimen 3 (until 360 days)
The Lt was measured at transfer, 120, 150, 200, 250, and 360 days for the
fci23 specimens. The average Lt, measured of each specimen at 0 and 360 days after the stress
transfer denoted as Lt, 0 and Lt, 360, respectively. The horizontal dashed lines indicate the 95 %
Ɛc, max at 120, 150, 200, 250, and 360 days of exposure.
At the time of stress transfer, the Ɛc, max for all the specimens were about 500 . By
360 days of exposure, this Ɛc, max increased to about 1200 for fci23-S1 and fci23-S3.
Erroneous results were obtained for fci23-S2 at about 1750 mm from the jacking end of the
member. Also, the maximum strain obtained on the surface of fci23-S2 was higher than that
of fci23-S1 and fci23-S3. This difference indicates that the specimen has higher prestress loss
than the other two specimens. Based on the 95% AMS, the average Lt, 360 was 750, 625,
620 mm, respectively for fci-S1, S2, S3. Unlike fci23-S1 and fci23-S3, the Lt, measured at releasing
end was longer than the jacking end due to erroneous results obtained. In addition to this, at
the jacking end, the values of Lt, 360 was shorter than that of Lt, 0 which was not the expected
behaviour. However, similar observations were reported in the literature, which say the
Distance from the jacking end of the member (mm)
0 250 500 750 1000 1250 1500 1750 2000
Aver
age
stra
in (
)
0
200
400
600
800
1000
1200
1400
Lt, 200
Lt, 250
Lt, 360
Lt - fci23 - S3
Lt, 360 = 645
Lt, 0 = 580Lt, 0 = 625
Lt, 0
Lt, 120
Lt, 150
Lt, 360 = 600
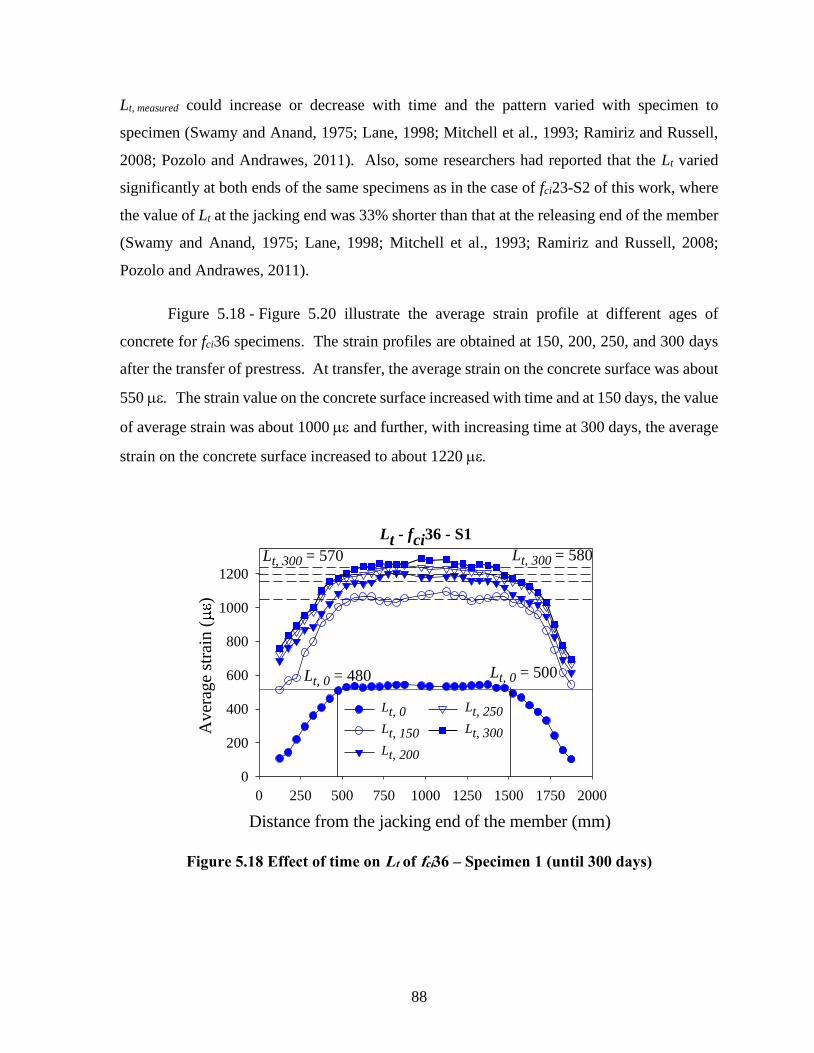
88
Lt, measured could increase or decrease with time and the pattern varied with specimen to
specimen (Swamy and Anand, 1975; Lane, 1998; Mitchell et al., 1993; Ramiriz and Russell,
2008; Pozolo and Andrawes, 2011). Also, some researchers had reported that the Lt varied
significantly at both ends of the same specimens as in the case of fci23-S2 of this work, where
the value of Lt at the jacking end was 33% shorter than that at the releasing end of the member
(Swamy and Anand, 1975; Lane, 1998; Mitchell et al., 1993; Ramiriz and Russell, 2008;
Pozolo and Andrawes, 2011).
Figure 5.18 - Figure 5.20 illustrate the average strain profile at different ages of
concrete for fci36 specimens. The strain profiles are obtained at 150, 200, 250, and 300 days
after the transfer of prestress. At transfer, the average strain on the concrete surface was about
550 The strain value on the concrete surface increased with time and at 150 days, the value
of average strain was about 1000 and further, with increasing time at 300 days, the average
strain on the concrete surface increased to about 1220
Figure 5.18 Effect of time on Lt of fci36 – Specimen 1 (until 300 days)
Distance from the jacking end of the member (mm)
0 250 500 750 1000 1250 1500 1750 2000
Aver
age
stra
in (
)
0
200
400
600
800
1000
1200
Lt, 250
Lt, 300
Lt - fci36 - S1
Lt, 0 = 480 Lt, 0 = 500
Lt, 300 = 580Lt, 300 = 570
Lt, 0
Lt, 150
Lt, 200
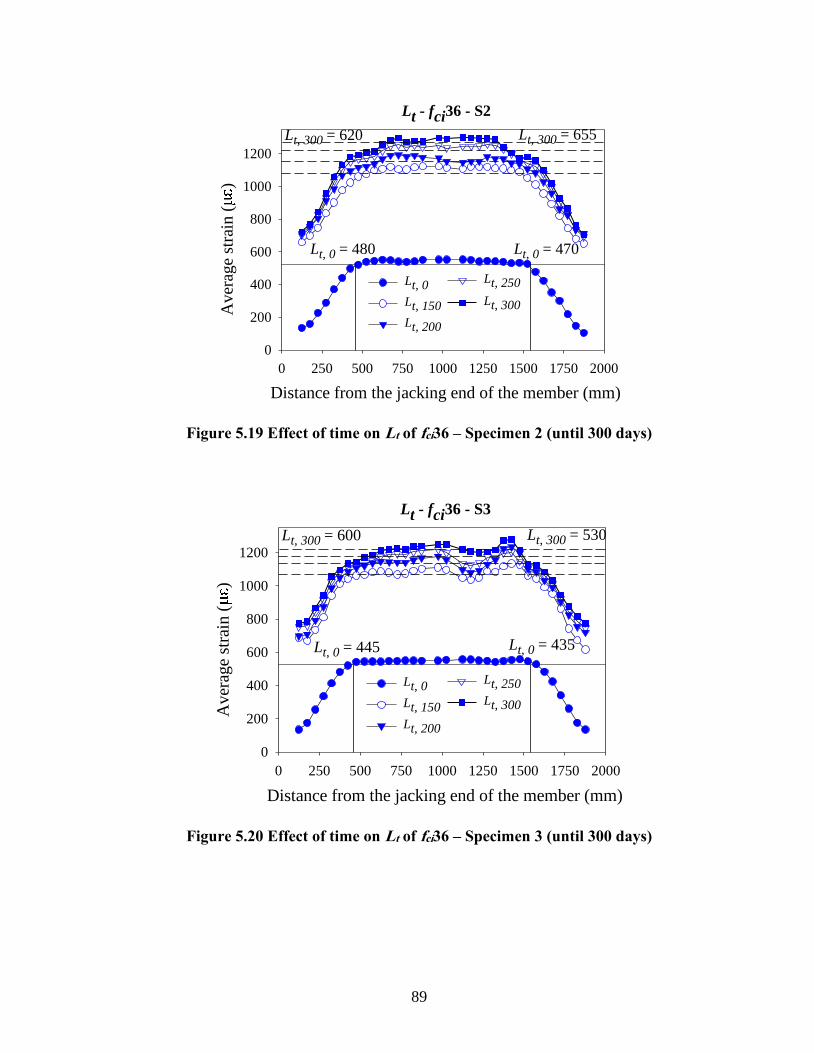
89
Figure 5.19 Effect of time on Lt of fci36 – Specimen 2 (until 300 days)
Figure 5.20 Effect of time on Lt of fci36 – Specimen 3 (until 300 days)
Distance from the jacking end of the member (mm)
0 250 500 750 1000 1250 1500 1750 2000
Aver
age
stra
in (
)
0
200
400
600
800
1000
1200
Lt, 250
Lt, 300
Lt - fci36 - S2
Lt, 0 = 480 Lt, 0 = 470
Lt, 300 = 655Lt, 300 = 620
Lt, 0
Lt, 150
Lt, 200
Distance from the jacking end of the member (mm)
0 250 500 750 1000 1250 1500 1750 2000
Aver
age
stra
in (
)
0
200
400
600
800
1000
1200
Lt, 250
Lt, 300
Lt - fci36 - S3
Lt, 0 = 445 Lt, 0 = 435
Lt, 300 = 530Lt, 300 = 600
Lt, 0
Lt, 150
Lt, 200
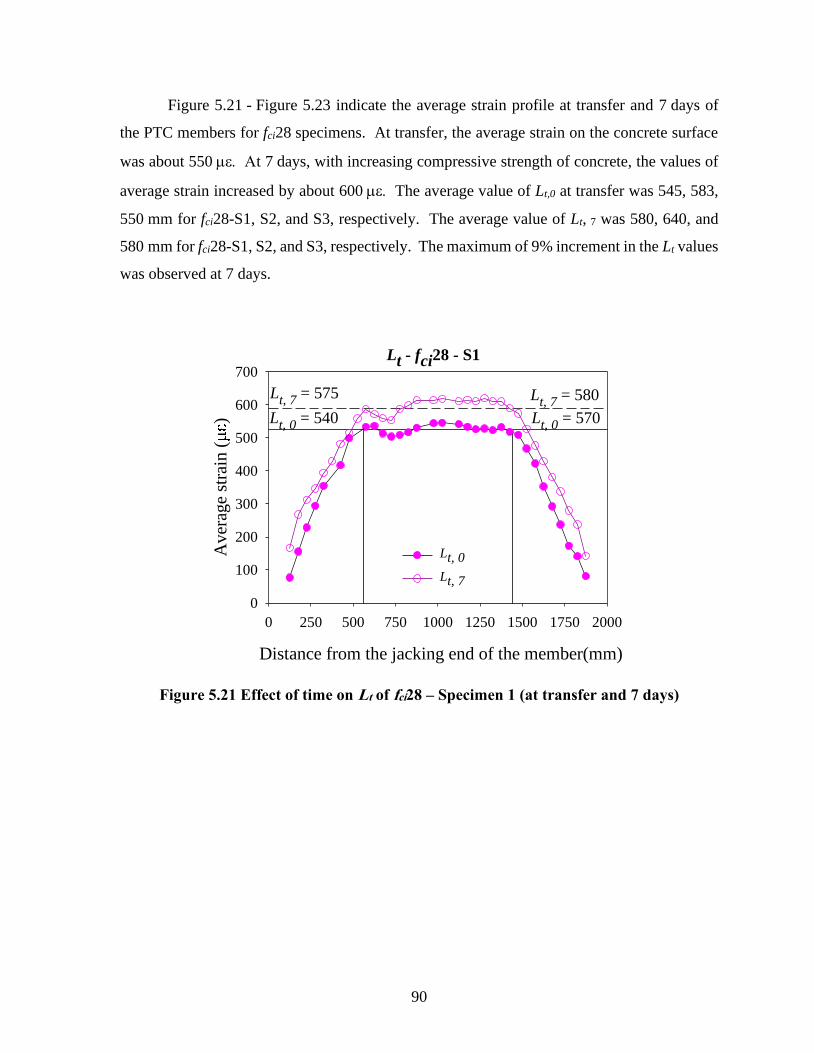
90
Figure 5.21 - Figure 5.23 indicate the average strain profile at transfer and 7 days of
the PTC members for fci28 specimens. At transfer, the average strain on the concrete surface
was about 550 t 7 days, with increasing compressive strength of concrete, the values of
average strain increased by about 600 The average value of Lt,0 at transfer was 545, 583,
550 mm for fci28-S1, S2, and S3, respectively. The average value of Lt, 7 was 580, 640, and
580 mm for fci28-S1, S2, and S3, respectively. The maximum of 9% increment in the Lt values
was observed at 7 days.
Figure 5.21 Effect of time on Lt of fci28 – Specimen 1 (at transfer and 7 days)
Lt - fci28 - S1
Distance from the jacking end of the member(mm)
0 250 500 750 1000 1250 1500 1750 2000
Aver
age
stra
in (
)
0
100
200
300
400
500
600
700
Lt, 0
Lt, 7
Lt, 0 = 570Lt, 0 = 540
Lt, 7 = 580Lt, 7 = 575

91
Figure 5.22 Effect of time on Lt of fci28 – Specimen 2 (at transfer and 7 days)
Figure 5.23 Effect of time on Lt of fci28 – Specimen 3 (at transfer and 7 days)
Lt - fci28 - S2
Distance from the jacking end of the member(mm)
0 250 500 750 1000 1250 1500 1750 2000
Aver
age
stra
in (
)
0
100
200
300
400
500
600
700
Lt, 0
Lt, 7
Lt, 0 = 550Lt, 0 = 540
Lt, 7 = 640Lt, 7 = 520
Lt - fci28 - S3
Distance from the jacking end of the member(mm)
0 250 500 750 1000 1250 1500 1750 2000
Av
erag
e st
rain
()
0
100
200
300
400
500
600
700
Lt, 0
Lt, 7
Lt, 0 = 600Lt, 0 = 565
Lt, 7 = 625Lt, 7 = 650

92
Figure 5.24 - Figure 5.26 shows the average strain profile at transfer and 28 days of the
PTC members for fci43 specimens. At transfer, the average strain on the concrete surface was
about 550 t 28 days, with increasing compressive strength of concrete, the values of
average strain increased by about 750 The average value of Lt, 0 at transfer was 380, 400,
390 mm for fci43-S1, S2, and S3, respectively. The average value of Lt, 28 was 440, 445, and
485 mm for fci28-S1, S2, and S3, respectively. The maximum of about 25 % increment in the
Lt values was observed at 28 days.
Figure 5.24 Effect of time on Lt of fci43– Specimen 1 (at transfer and 28 days)
Distance from the jacking end of the member (mm)
0 250 500 750 1000 1250 1500 1750 2000
Av
erag
e st
rain
()
0
100
200
300
400
500
600
700
800
Lt, 0
Lt, 28
Lt, 0 = 370
Lt, 28= 420 Lt, 28 = 455
Lt, 0 = 385
Lt - fci43 - S1

93
Figure 5.25 Effect of time on Lt of fci43– Specimen 2 (at transfer and 28 days)
Figure 5.26 Effect of time on Lt of fci43– Specimen 3 (at transfer and 28 days)
Distance from the jacking end of the member (mm)
0 250 500 750 1000 1250 1500 1750 2000
Av
erag
e st
rain
()
100
200
300
400
500
600
700
800
Lt, 0
Lt, 28
Lt, 0 = 405
Lt, 28 = 410 Lt, 28 = 480
Lt, 0 = 390
Lt - fci43 - S2
Distance from the jacking end of the member (mm)
0 250 500 750 1000 1250 1500 1750 2000
Av
erag
e st
rain
()
100
200
300
400
500
600
700
800
Lt, 0
Lt, 28
Lt, 0 = 375
Lt, 28 = 460 Lt, 28 = 510
Lt, 0 = 400
Lt - fci43 - S3

94
Figure 5.27 shows the variation of Lt with time. The variation of Lt is significant at 7
and 28 days. However, after 120 days, the increase in Lt is found not significant. From the
plot, it is seen that no uniform pattern was observed. The value of Lt, measured was increasing
with time for specimen (fci36-3); whereas, for other specimens (fci28-1, fci28-2, fci28-3, fci36-1,
and fci36-3) both increase and decrease in trends were observed in the Lt, measured. At 120 days,
the maximum increase of about 6% was observed for fci23-S1 and a negligible decrease of
about 1% was observed for fci23-2 and fci23-3. At 150 days, the values of Lt, measured was
increased to maximum of about 12% for fci36 specimens; whereas, fci23 specimens experienced
about 6% increment and 4% decrement in the Lt values. At 250 days, the value of Lt did not
increase significantly for fci23 specimens whereas, fci36 specimens experienced increment of
15 to 30% compared to the Lt, 0. The fci23 specimens exposed to 360 days resulted in 15 to
25% variation except for fci23-3, which did not show any variation.
Figure 5.27 Variation of Lt as a function of time
Time (days)
0 50 100 150 200 250 300 350 400
Tra
nsm
issi
on l
ength
Lt (m
m)
0
100
200
300
400
500
600
700
800
fci28-1
fci28-2
fci28-3
fci43-1
fci43-2
fci43-3
fci23-1
fci23-2
fci23-3
fci36-1
fci36-2
fci36-3

95
Low relaxation strands meeting ASTM A416 (2017) were used in this study. Hence,
the observed change in the Lt could be mainly due to the creep and shrinkage of concrete. It is
evident that the results are significantly different between specimens and no pattern was
observed. From this study, it is difficult to conclude the effect of time on the Lt. Further testing
on similar specimens is required to comment more on these numbers and the rate of change of
Lt. The initial time from 7 to 28 days plays significant role on Lt as the concrete hardens to
gain its design strength. In general, it can be concluded that the rate of change of Lt after 150
days is not significant.
5.7 INFLUENCE OF Lt ON SHEAR CAPACITY OF THE PTC SYSTEMS – A CASE STUDY
The Lt of prestressed strands plays a crucial role in achieving the desired shear capacity (Vn, max)
within the shear-critical region, especially when the elements do not have shear stirrups. To
ease the placement of concrete (casting), it is common not to use stirrups in the pretensioned
hollow-core slabs (HCS) and rely on the prestressed strands to achieve the desired shear
resistance. The shear design can be conservative if the Lt, measured is adequate. However, if the
Lt, measured is inadequate, then the available prestress at the shear critical region would be less to
resist the shear stresses. To understand the effect of Lt on the shear resistance of HCS members,
a case study was performed on the influence of Lt on the distance from the end of the member
to the point, where Vn, max is achieved. For this case study, a typical HCS design given in PCI
(1999) was considered (PCI, 1999). As shown in Figure 5.28, the depth and width of this HCS
was 254 and 1220 mm, respectively. There were six strands at 38 mm from the bottom of the
slab. For this case study, two commonly used concrete grades were chosen M35 and M55
whose fci were 23 and 36 MPa and named here as Concrete A and Concrete B, respectively.
Three commonly used codes in India for PTC building structure, ACI, fib, and IS were
considered. The shear capacity calculated using the Lt code based on ACI, fib, and IS codes
were compared with that using the Lt, measured from the experiments.
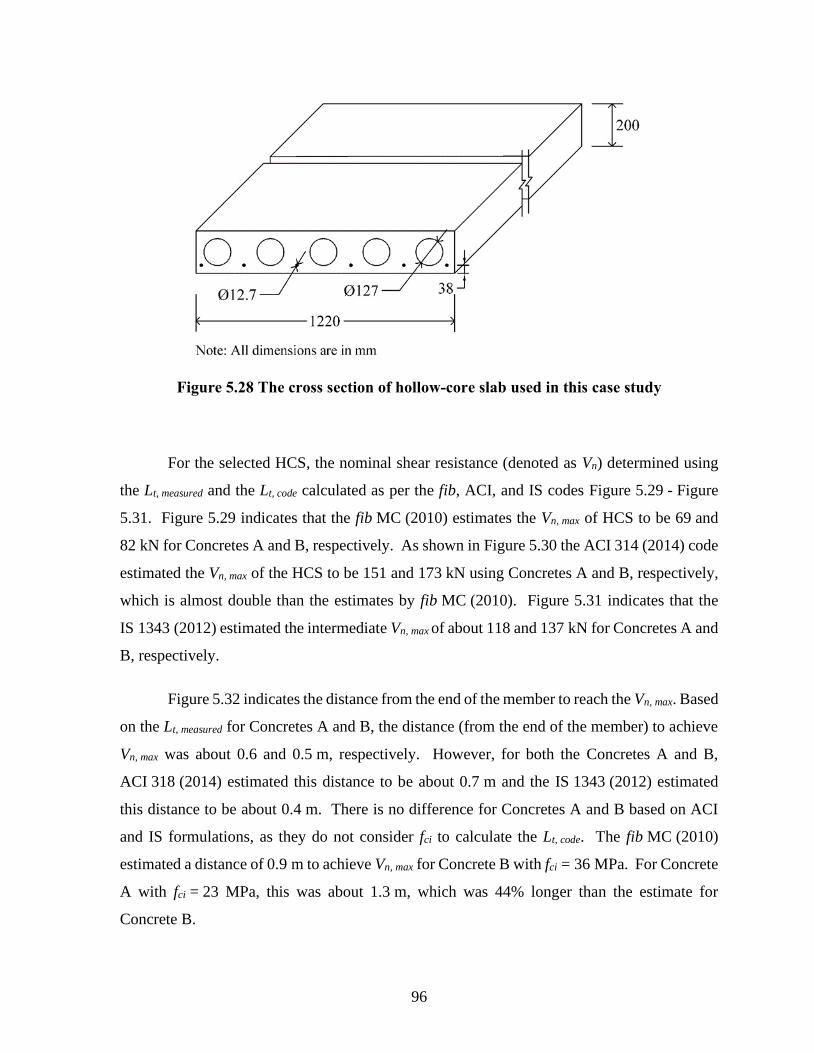
96
Figure 5.28 The cross section of hollow-core slab used in this case study
For the selected HCS, the nominal shear resistance (denoted as Vn) determined using
the Lt, measured and the Lt, code calculated as per the fib, ACI, and IS codes Figure 5.29 - Figure
5.31. Figure 5.29 indicates that the fib MC (2010) estimates the Vn, max of HCS to be 69 and
82 kN for Concretes A and B, respectively. As shown in Figure 5.30 the ACI 314 (2014) code
estimated the Vn, max of the HCS to be 151 and 173 kN using Concretes A and B, respectively,
which is almost double than the estimates by fib MC (2010). Figure 5.31 indicates that the
IS 1343 (2012) estimated the intermediate Vn, max of about 118 and 137 kN for Concretes A and
B, respectively.
Figure 5.32 indicates the distance from the end of the member to reach the Vn, max. Based
on the Lt, measured for Concretes A and B, the distance (from the end of the member) to achieve
Vn, max was about 0.6 and 0.5 m, respectively. However, for both the Concretes A and B,
ACI 318 (2014) estimated this distance to be about 0.7 m and the IS 1343 (2012) estimated
this distance to be about 0.4 m. There is no difference for Concretes A and B based on ACI
and IS formulations, as they do not consider fci to calculate the Lt, code. The fib MC (2010)
estimated a distance of 0.9 m to achieve Vn, max for Concrete B with fci = 36 MPa. For Concrete
A with fci = 23 MPa, this was about 1.3 m, which was 44% longer than the estimate for
Concrete B.

97
Figure 5.29 Shear resistance determined using fib MC (2010)
Figure 5.30 Shear resistance determined using ACI 318 (2014)
fib-MC (2010)
Distance from end of the member (m)
0.0 0.2 0.4 0.6 0.8 1.0 1.2 1.4 1.6
No
min
al s
hea
r re
sist
ance
, V
n (
kN
)
0
50
100
150
200
fc23 - Lt, code
fc23 - Lt, measured
fc36 - Lt, code
fc36 - Lt, measured
ACI 318 (2014)
Distance from end of the member (m)
0.0 0.2 0.4 0.6 0.8 1.0 1.2 1.4 1.6
No
min
al s
hea
r re
sist
ance
, V
n (
kN
)
0
50
100
150
200
fc36 - Lt, code
fc36 - Lt, measured
fc36 - Lt, code
fc36 - Lt, measured
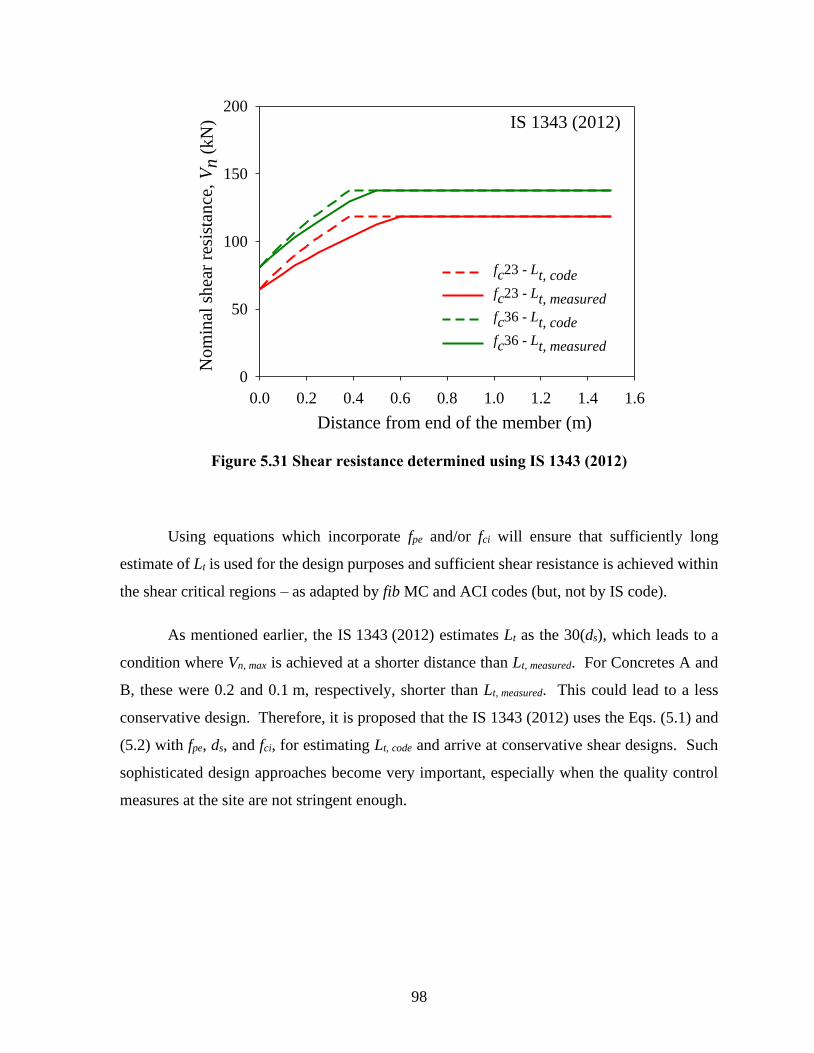
98
Figure 5.31 Shear resistance determined using IS 1343 (2012)
Using equations which incorporate fpe and/or fci will ensure that sufficiently long
estimate of Lt is used for the design purposes and sufficient shear resistance is achieved within
the shear critical regions – as adapted by fib MC and ACI codes (but, not by IS code).
As mentioned earlier, the IS 1343 (2012) estimates Lt as the 30(ds), which leads to a
condition where Vn, max is achieved at a shorter distance than Lt, measured. For Concretes A and
B, these were 0.2 and 0.1 m, respectively, shorter than Lt, measured. This could lead to a less
conservative design. Therefore, it is proposed that the IS 1343 (2012) uses the Eqs. (5.1) and
(5.2) with fpe, ds, and fci, for estimating Lt, code and arrive at conservative shear designs. Such
sophisticated design approaches become very important, especially when the quality control
measures at the site are not stringent enough.
IS 1343 (2012)
Distance from end of the member (m)
0.0 0.2 0.4 0.6 0.8 1.0 1.2 1.4 1.6
No
min
al s
hea
r re
sist
ance
, V
n (
kN
)
0
50
100
150
200
fc23 - Lt, code
fc23 - Lt, measured
fc36 - Lt, code
fc36 - Lt, measured

99
Figure 5.32 Distance from the end of the member to reach Vn, max
5.8 EFFECT OF OVERESTIMATION ON THE BURSTING STRESS IN THE TRANSMISSION ZONE
– A CASE STUDY
In the transmission zone, transverse tensile stresses can develop due to the vertical component
of bearing force and the Hoyer effect of the strand. These stresses are maximum at the end face
of the member. These tensile stresses are dependent on the prestress level, rate of prestress
transfer along the length, etc., which influence the Lt. As a case study, the effect of
overestimation of Lt on the transverse tensile stress at the end of the member was calculated
considering a simple I girder. Figure 5.33 shows the geometry details of the I girder considered
for the case study. If Lt is overestimated, then the maximum tensile stress is underestimated
and vice versa. The estimation of transmission length and maximum tensile stress in the
transmission zone influences the amount and spacing shear reinforcements.
Distance from the end of the member (m)
0.0 0.2 0.4 0.6 0.8 1.0 1.2 1.4
fib-MC (2010)
ACI 318 (2014)
IS 1343 (2012)
Lt, measured
Concrete A (fci = 23 MPa)
Concrete B (fci = 36 MPa)
fib-MC (2010)
ACI 318 (2014)
IS 1343 (2012)
Lt, measured

100
Figure 5.33 Cross section of a simple I girder (Source: Raju (2011))
As explained in the literature, the tensile stress induced due to the transfer of prestress
varies along the transmission length. Figure 5.34 shows the tensile stress distribution due to
the prestress transfer for different transmission length. It indicates that the short Lt results in
high tensile stress distribution.
Figure 5.34 Tensile stress distribution in the transmission zone
Distance from the end of the member (mm)
0 250 500 750 1000 1250 1500
Ten
sile
str
ess
(N/m
m2)
0
2
4
6
8
10
1 - Lt = 250
2 - Lt = 381*
3 - Lt = 500
4 - Lt = 750
5 - Lt = 1000
6 - Lt = 1500
2
3
4
5
6
1
* Lt, measured for fci = 43 MPa
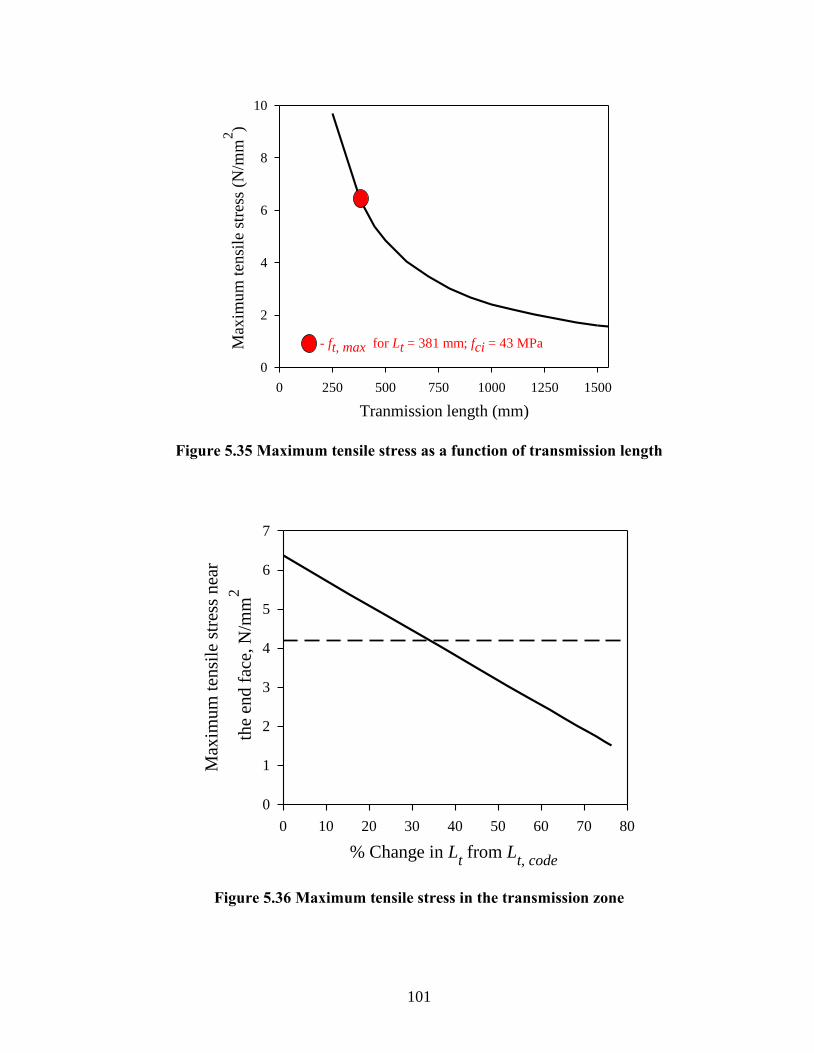
101
Figure 5.35 Maximum tensile stress as a function of transmission length
Figure 5.36 Maximum tensile stress in the transmission zone
Tranmission length (mm)
0 250 500 750 1000 1250 1500
Max
imum
ten
sile
str
ess
(N/m
m2)
0
2
4
6
8
10
- ft, max for Lt = 381 mm; fci = 43 MPa
(b) Variation of estimated
maximum tensile stress with respect to Lt
% Change in Lt from L
t, code
0 10 20 30 40 50 60 70 80
Max
imum
ten
sile
str
ess
nea
r
the
end f
ace,
N/m
m2
0
1
2
3
4
5
6
7

102
Figure 5.35 shows the variation of maximum tensile stress with the transmission length
of the member. To understand this plot better, the maximum tensile stress as a function of the
percent change in Lt (i.e., the difference between the actual Lt and design Lt) for the concrete
properties of fci = 42 MPa and ft = 4.2 MPa is shown in Figure 5.36. Based on the experimental
results, the required Lt was overestimated by about 40, 50, 60, and 70 % by CSA, ACI,
AASHTO, EN, and fib design codes. However, the result indicated that if the Lt is
overestimated by more than 30% of the actual Lt, then the induced tensile stresses could exceed
the tensile strength of concrete and result in bursting cracks in the absence of stirrups. This
scenario could become worse, if the strength of concrete is lower than 42 MPa. This is critical,
especially in narrow web pretensioned beams/girders, where the strands would be closely
placed and congested (Tuan et al., 2004). Therefore, the overestimation of Lt beyond 30% of
the values from tests should be avoided while designing the PTC members. Generally,
overestimation of values taken for granted as safe. However, it is not the case in the PTC
systems. A shorter estimation of Lt is necessary to prevent unexpected high stresses near the
end of the members (Floyd et al., 2015). Hence, care should be taken to ensure adequate Lt in
the design to avoid such issues.
5.9 SUMMARY
This chapter discussed the significance of fci on Lt using various codal and literature equations.
It was observed that for a particular fci, design Lt has varied from 380 to 1500 mm. Also,
empirical equations from the literature were compared and found that significant variations in
Lt. Then, this chapter detailed the experimental investigation on the effect of compressive
strength of concrete at transfer and time on the transmission length. The human error on the
DEMEC measurement is presented to obtain reliable data. Based on the experimental result,
a bilinear model is proposed to determine the Lt. The calculated Lt based on the standard design
equations over/underestimate the required Lt. Also, case studies demonstrating the effect of
underestimation and overestimation of Lt on the shear capacity and tensile stresses induced due
to the transfer of prestress in the transmission zones were presented. The findings of this
chapter would be presented in Chapter 7

103
6 RESULTS AND DISCUSSION – BOND STRENGTH (b)
6.1 INTRODUCTION
This chapter details the results of the experimental investigations performed to meet
Objective 2. This objective aims to develop a test procedure to determine the bond strength of
PTC specimens and investigate the effect of compressive strength of concrete, prestress level,
and embedment length of the strand on the determination of bond strength. Initially, the
challenges associated with the measurement of bond slip are explained. Then, to overcome
the challenges associated with the conventional methods in determining the bond strength, a
method based on the yield point/region on the bond stress-slip curve is proposed. Also, the
significance of the proposed method over the conventional method is presented. Finally, the
failure mechanism at the S-C interface is explained.
6.2 LIMITATIONS ON DETERMINING BOND STRENGTH AS A FUNCTION OF ABSOLUTE SLIP
AT FREE/LIVE ENDS
Bond strength is computed by assuming a uniform distribution over the embedment length
(le) of the strand in concrete, as given in Eq. (6.1)
𝜏 = 𝑃
𝜋𝑝𝑙𝑒
Eq. (6.1)
Perimeter (p) is calculated as the sum of the arc lengths of six outer wires (representing
the area in contact with the concrete). The thick/blue curve in Figure 6.1 indicates this
perimeter. The diameter of the outer wires (do) is 4.2 mm. For the 12.7 mm diameter strand
used in this study, the arc length of outer wire is 8.8 mm; p is 52.8 mm and the embedment
length (le) of the strand in concrete is 450 mm for short specimen and 950 mm for long
specimens.

104
Figure 6.1 Cross section of 7-wire strand
Typically, the measurement of slip at the free end is preferred due to its ease to place
the LVDT. This is because placing the LVDT at the live end is difficult due to the
non-availability of space as the strand is gripped only for loading. Therefore, in this study
specimens were designed in such a way that it could accommodate the placement of LVDT at
the LE. Accordingly, 350 and 150 mm lengths of strand were kept outside the concrete surface
at the LE and FE, respectively to place the LVDTs.
The ASTM A1081 (2012), IS 2770 (1967), and RC 6 (1983) recommend to determine
the b of PTC systems as the corresponding to the pre-defined slip of 2.5 mm at the free end.
This approach has the following limitations. In the pull-out testing, the strand at the live end
can start slipping much earlier than the strand at the free end. This is because the strain has to
develop along the length of the specimen to cause slipping at the free end. The difference in
the instantaneous slips at live and free ends depends on the length of the embedded strand.
This indicates that the bond stress at a particular time instant is maximum near the live end and
reduces towards the free end. The difference in bond stress at live and free ends increases with
increasing le of the member. This indicates that the measurement at the free end is not reliable
for the determination of tb, especially for PTC members, whose le varies depending on the Lt
of the specimens. Hence, the measurement of slip at the live end is more suitable and
representative than at the free end. However, the slip at the live end is also dependent on the

105
length of the specimen. The longer the length, the larger will be the load to cause similar slip
at the live end.
Columns 4 and 5 in Table 6.1 show the 2.5 determined using the 2.5 mm slip at live
and free ends, respectively, for short strand specimens. Table 6.2 shows similar data for long
specimens. For short specimens with taut strands, the estimated 2.5 based on live end slip is
about 20% less than that of free end slip. For long specimens with stressed strands, this
difference is about 50%. These differences are significant and not acceptable for quality
control practices in the field. Based on the aforementioned scenario, defining b as
corresponding to a pre-defined slip at either live or free end seems inappropriate. There is a
need to determine b as a parameter independent of the le and fps.
6.3 DETERMINATION OF BOND STRENGTH USING YIELD STRESS METHOD
To overcome the challenges associated with the 2.5 mm slip method, this thesis determines b
based on bond stress at the yield point where the slope of -s changes significantly. The bond
stress at the yield point is known as bond yield stress (yield) and the load at the yield point is
called yield load (Pyield). -s plot has two regions – an initial steep portion where, increases
with small increase in s and yields into a region where an increase in b is less with a significant
increase in the slip. The friction mechanism between the strand and concrete contributes to the
initial steep portion and after yield where the slope changes indicates the loss of friction. Then,
the mechanical interlock mechanism contributes to the bond and gives further resistance to
slip, which increases the bond stress after yield.
The yield points on the -s curves were categorized into two cases as follows (see Figure 6.2
and Figure 6.3).
• Case 1: A point on the curve indicating a sudden change in slope.
• Case 2: A region on the curve with a gradual and significant change in slope.
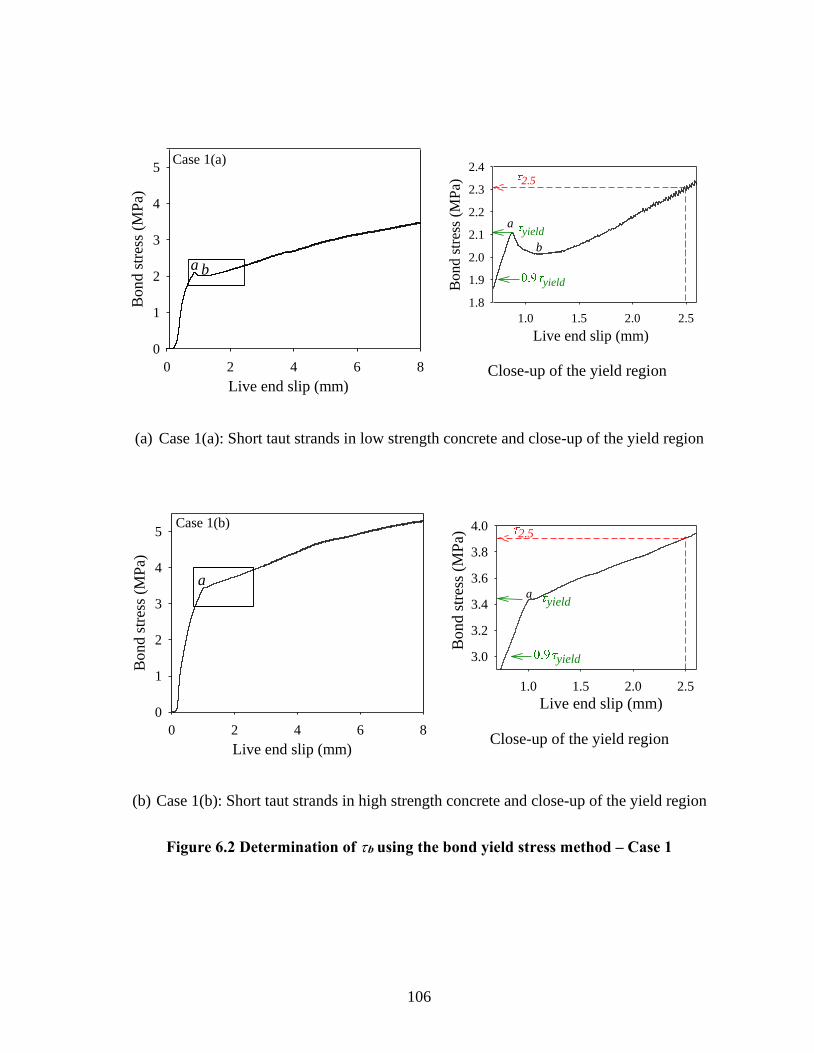
106
Close-up of the yield region
(a) Case 1(a): Short taut strands in low strength concrete and close-up of the yield region
Close-up of the yield region
(b) Case 1(b): Short taut strands in high strength concrete and close-up of the yield region
Figure 6.2 Determination of b using the bond yield stress method – Case 1
Live end slip (mm)
0 2 4 6 8
Bo
nd
str
ess
(MP
a)
0
1
2
3
4
5Case 1(a)
a b
Live end slip (mm)
1.0 1.5 2.0 2.5
Bo
nd
str
ess
(MP
a)
1.8
1.9
2.0
2.1
2.2
2.3
2.4
yield
2.5
yield
a
b
Live end slip (mm)
0 2 4 6 8
Bo
nd
str
ess
(MP
a)
0
1
2
3
4
5Case 1(b)
a
Live end slip (mm)1.0 1.5 2.0 2.5
Bo
nd
str
ess
(MP
a)
3.0
3.2
3.4
3.6
3.8
4.0
yield
2.5
yield
a

107
Case 1 was observed in the specimens with the short taut strands in concrete. Further,
based on the shape of the yield region observed, Case 1 was divided into two categories –
Cases 1(a) and 1(b). The close-up views near the yield point for these cases are shown on the
right side of Figure 6.2 (a) and (b). In Case 1(a), the bond stress increases till the Point ‘a’ and
yield occurs at that point (with a loss in frictional resistance). After yield, the bond stress
reduces (towards Point ‘b’ in the close-up view of the Figure 6.2 (a)). This indicates that once
the friction is lost, the applied load would compress the concrete keys formed due to the helical
shape of the strand at the S-C interface. Then, the mechanical interlock governs the
strand-concrete interaction at the interface. This action results in an increase in the bond stress
after Point ‘b’ (i.e., curve moves upwards). Case 1(a) with significant drop at Point ‘a’ was
observed in the short taut strand specimens embedded in low strength concrete (fc = 43 MPa).
On the other hand, no significant drop at Point ‘a’ was observed in Case 1(b). Figure
6.2 (b) indicates that after yield at point ‘a’, bond stress is not decreased significantly. This
could happen in concretes with high stiffness, where once the friction is lost, the concrete keys
may not experience significant compression. Further, the mechanical interlock contributes to
give resistance to slip and the curve starts moving upward right after Point ‘a’. Typically, an
increase in compressive strength leads to an increase in the stiffness. As a result, Case 1(b)
was observed in the short taut strand specimens are embedded in high strength concrete
(fc = 62 MPa).
Case 2 was typically observed in long specimens with both taut and stressed strands
embedded in high strength concrete (fc = 62 MPa). Here, in Case 2, the length of the member
was twice that in Case 1. As the length of the member increases, more load is needed to pull
the strand. Also, gradual yielding occurs, as shown in Figure 6.3. After yield, the bond stress
does not increase significantly. As the yield is gradual, the yield point was determined as a
point, where the parallel line of each region meet, and stress corresponding to that point can
be considered as yield. To be conservative, this thesis defines b of PTC systems as 90% of
yield (i.e., b = 0.9yield), herein.
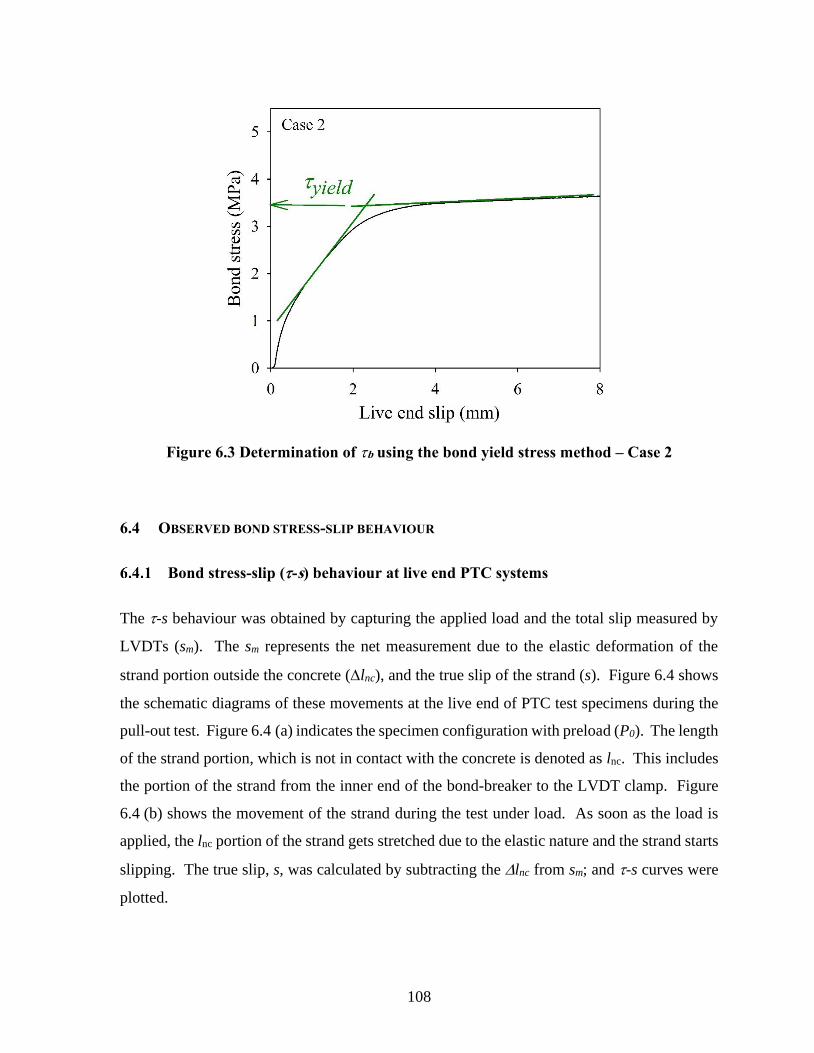
108
Figure 6.3 Determination of b using the bond yield stress method – Case 2
6.4 OBSERVED BOND STRESS-SLIP BEHAVIOUR
Bond stress-slip (-s) behaviour at live end PTC systems
The -s behaviour was obtained by capturing the applied load and the total slip measured by
LVDTs (sm). The sm represents the net measurement due to the elastic deformation of the
strand portion outside the concrete (lnc), and the true slip of the strand (s). Figure 6.4 shows
the schematic diagrams of these movements at the live end of PTC test specimens during the
pull-out test. Figure 6.4 (a) indicates the specimen configuration with preload (P0). The length
of the strand portion, which is not in contact with the concrete is denoted as lnc. This includes
the portion of the strand from the inner end of the bond-breaker to the LVDT clamp. Figure
6.4 (b) shows the movement of the strand during the test under load. As soon as the load is
applied, the lnc portion of the strand gets stretched due to the elastic nature and the strand starts
slipping. The true slip, s, was calculated by subtracting the lnc from sm; and -s curves were
plotted.

109
Figure 6.4 Movements at the live end in PTC systems (a) At preload and (b) During the
pull-out test
Measured bond stress-slip relationship
As explained earlier, the measured slip is not the true slip of the strands as it includes the
deformation of the strand. Therefore, to obtain the true slip of the strand, the effect of the
strand deformation has to be eliminated. Figure 6.5 - Figure 6.8 show the representative bond
stress-slip behaviour of taut and stressed strands using the measured and true slip. The true
slip is obtained by subtracting the deformation due to elongation of the 200 mm long lnc region.
The figures show a significant change/shift in the -s plots due to the strand deformations.
From Figure 6.5 and Figure 6.6 with Case 1 type curves, the yield point was obtained with a
sharp point about 2 and 1 mm slip based on the measured and true slip, respectively. Similarly,
Figure 6.7 and Figure 6.8 with Case 2 type curves, the yield occurred around about 6 and 4 mm
based on the measured and true slip, respectively. It indicates that a significant difference
between the measured and corrected true slip values. Therefore, the determination of bond
strength using 2.5 mm slip could give erroneous results. Hence, the strand deformation from
the measured slip was eliminated to obtain the true -s for all the specimens. Figure
6.9 to Figure 6.14 show the corrected -s plots.

110
Figure 6.5 Representative bond stress-slip behaviour of taut strands with le = 450 mm in
fc = 43 MPa
Figure 6.6 Representative bond stress-slip behaviour of taut strands with le = 450 mm in
fc = 62 MPa
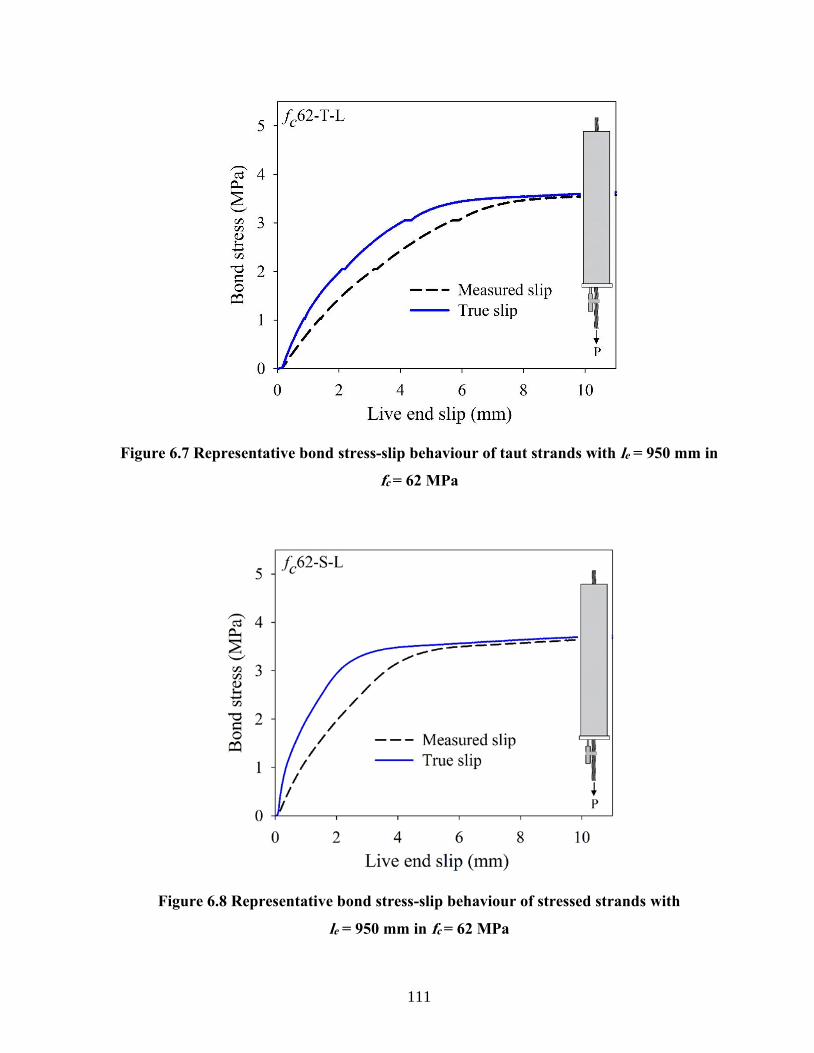
111
Figure 6.7 Representative bond stress-slip behaviour of taut strands with le = 950 mm in
fc = 62 MPa
Figure 6.8 Representative bond stress-slip behaviour of stressed strands with
le = 950 mm in fc = 62 MPa

112
Bond stress - slip behaviour of taut and stressed strands embedded in concrete
Figure 6.9 and Figure 6.11 represent the -s behaviour for taut strands with le = 450 mm in
fc = 43 and 62 MPa, respectively. Specimen identification is provided at the top left of each
figure. Note that ‘fc43-T-S’ indicates specimen with 43 MPa concrete, Taut strand, and a Short
embedment length (say, le = 450 mm); ‘fc62-S-L’ indicates specimen with 62 MPa concrete,
Stressed strand, and a Long embedment length (say, le = 950 mm); and so on. The zoomed
portions near the yield point were shown in Figure 6.10 and Figure 6.12 indicating the change
on –s plot. From the plots, it is observed that the average bond yield stress was about 2 and
3.2 MPa for fc = 43 and 62 MPa, respectively. The yield of short taut strands was obtained
before the strand experiences the 2.5 mm slip. Therefore, the value of yield was lesser than the
2.5. A lot of scatter was observed on the –s plot of the short taut strands in both fc = 43 and
62 MPa. Table 6.1 presents the determined b of taut strands with le = 450 mm.
Figure 6.13 and Figure 6.14 exhibit the -s behaviour of long taut and stressed strands
with le = 950 mm in 62 MPa strength concrete, respectively. was increased about 3.5 MPa
for both taut and stressed strands with le = 950 mm and the slope of −s changes gradually.
The average maximum load experienced by the taut and stressed specimens were about
190 kN. As the breaking strength of 12.7 mm strands is ~190 kN, strands got ruptured once it
reached its breaking strength. It was observed that the -s behaviour of stressed strands was
stiffer and more consistent than that of the taut strands due to the high prestress. As a result,
the average at 2.5 mm slip of stressed strands was higher than that of the taut strands. As le
increases, the resistance to slip also increases. As a consequence, the yield was delayed and
attained after reaching the 2.5 mm slip. Therefore, the yield was higher than the 2.5 for both
taut and stressed strands with le = 950 mm. Table 6.2 presents the determined b of pull-out
specimens with le = 950 mm.
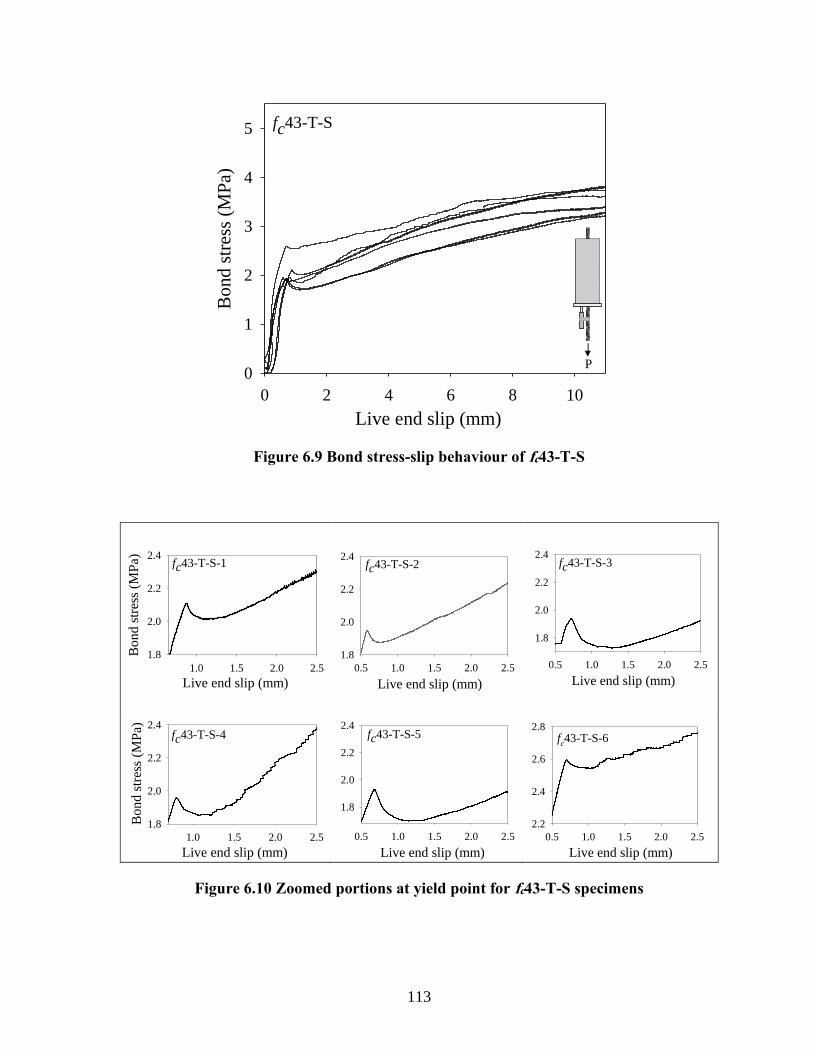
113
Figure 6.9 Bond stress-slip behaviour of fc43-T-S
Figure 6.10 Zoomed portions at yield point for fc43-T-S specimens
Live end slip (mm)
0 2 4 6 8 10
Bond s
tres
s (M
Pa)
0
1
2
3
4
5 fc43-T-S
P
Live end slip (mm)
1.0 1.5 2.0 2.5
Bon
d s
tres
s (M
Pa)
1.8
2.0
2.2
2.4fc43-T-S-1
Live end slip (mm)
0.5 1.0 1.5 2.0 2.5
Bon
d s
tres
s (M
Pa)
1.8
2.0
2.2
2.4fc43-T-S-2
Live end slip (mm)
0.5 1.0 1.5 2.0 2.5
Bo
nd
str
ess
(MP
a)
1.8
2.0
2.2
2.4fc43-T-S-3
Live end slip (mm)
1.0 1.5 2.0 2.5
Bo
nd
str
ess
(MP
a)
1.8
2.0
2.2
2.4fc43-T-S-4
Live end slip (mm)
0.5 1.0 1.5 2.0 2.5
Bon
d s
tres
s (M
Pa)
1.8
2.0
2.2
2.4fc43-T-S-5
Live end slip (mm)
0.5 1.0 1.5 2.0 2.5
Bo
nd
str
ess
(MP
a)
2.2
2.4
2.6
2.8fc43-T-S-6
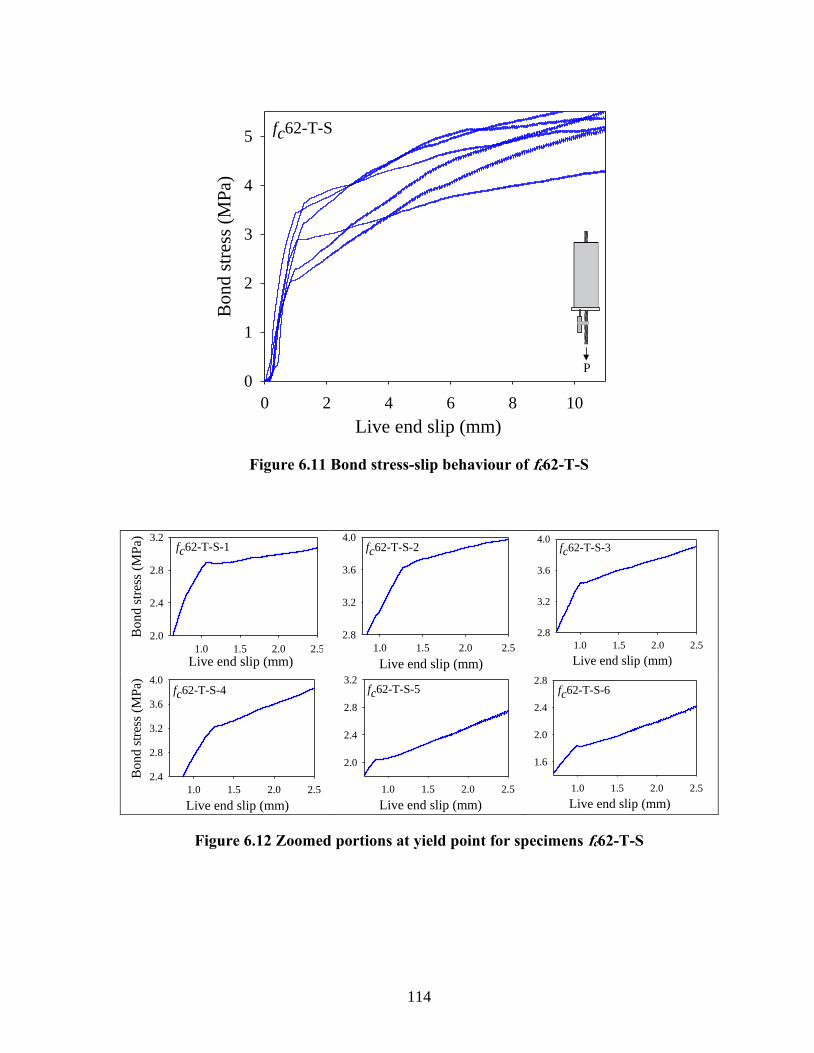
114
Figure 6.11 Bond stress-slip behaviour of fc62-T-S
Figure 6.12 Zoomed portions at yield point for specimens fc62-T-S
Live end slip (mm)
0 2 4 6 8 10
Bo
nd
str
ess
(MP
a)
0
1
2
3
4
5fc62-T-S
P
Live end slip (mm)1.0 1.5 2.0 2.5
Bo
nd
str
ess
(MP
a)
2.0
2.4
2.8
3.2fc62-T-S-1
Live end slip (mm)
1.0 1.5 2.0 2.5
Bon
d s
tres
s (M
Pa)
2.8
3.2
3.6
4.0fc62-T-S-2
Live end slip (mm)
1.0 1.5 2.0 2.5
Bon
d s
tres
s (M
Pa)
2.8
3.2
3.6
4.0fc62-T-S-3
Live end slip (mm)
1.0 1.5 2.0 2.5
Bo
nd
str
ess
(MP
a)
2.4
2.8
3.2
3.6
4.0fc62-T-S-4
Live end slip (mm)
1.0 1.5 2.0 2.5
Bo
nd
str
ess
(MP
a)
2.0
2.4
2.8
3.2fc62-T-S-5
Live end slip (mm)
1.0 1.5 2.0 2.5
Bo
nd
str
ess
(MP
a)
1.6
2.0
2.4
2.8fc62-T-S-6

115
Table 6.1 Bond strength of taut strands (le = 450 mm) in fc = 43 and 62 MPa concrete
Specimen
ID
Compressive
strength of
concrete at
testing (fc) in
MPa
Maximum
bond load
(Pmax) in kN
Bond strength (b) MPa
2.5
After subtracting the
elongation from LE
slip
Live
End
Free
End 2.5 0.9 yield
fc43-T-S-1 44.1 101 2.17 2.58 2.30 1.81
fc43-T-S-2 43.8 93 2.11 2.39 2.24 1.72
fc43-T-S-3 43.7 95 1.83 2.06 1.92 1.72
fc43-T-S-4 42.9 94 2.15 2.57 2.38 1.75
fc43-T-S-5 44.5 95 1.80 2.04 1.91 1.73
fc43-T-S-6 42.3 89 2.13 2.86 2.67 1.85
fc62-T-S-1 63.1 119 2.96 3.31 3.07 2.61
fc62-T-S-2 61.8 132 3.74 4.28 3.97 3.28
fc62-T-S-3 60.2 150 3.63 4.39 3.94 3.05
fc62-T-S-4 60.4 131 3.42 4.48 3.85 2.93
fc62-T-S-5 61.6 145 2.46 3.20 2.75 2.16
fc62-T-S-6 62.2 144 2.67 3.65 3.02 2.06

116
Figure 6.13 Bond stress-slip behaviour of long taut strands with le = 950 mm in
fc = 62 MPa concrete
Figure 6.14 Bond stress-slip behaviour of stressed strand with le = 950 mm in
fc = 62 MPa concrete
Live end slip (mm)0 2 4 6 8 10
Bond s
tres
s (M
Pa)
0
1
2
3
4
5fc62-T-L
P
Live end slip (mm)
0 2 4 6 8 10
Bond s
tres
s (M
Pa)
0
1
2
3
4
5 fc62-S-L
P

117
Table 6.2 Experimentally obtained b of taut and stressed strands with le = 950 mm in
fc = 62 MPa concrete
Difference between 2.5 and 0.9 yield
Statistical hypothesis tests were conducted to check if the difference between the 0.9 yield and
2.5 are statistically significant. The Q-Q Normality tests were conducted on the obtained data
sets for the taut and stressed strands. For those data sets passing the normality test, the
Students’ t-test were conducted to check if the data sets are statistically different. For those
data set, which did not pass the normality test, the Mann-Whitney rank sum test was performed
to check the statistical difference between the data sets.
Specimen ID
Compressive
strength of
concrete at
testing (fc) in
MPa
Maximum
bond load
(Pmax) in kN
Bond strength (b) MPa
2.5
After subtracting the
elongation from LE
slip
LE FE 2.5 0.9 yield
fc62-T-L-1 63.4 194 2.26 3.86 3.02 3.11
fc62-T-L-2 64.7 179 2.29 -- 2.42 3.07
fc62-T-L-3 61.2 191 2.28 -- 3.09 3.08
fc62-T-L-4 63.9 189 2.02 -- 2.65 3.10
fc62-T-L-5 62.5 191 1.72 -- 2.26 3.09
fc62-T-L-6 63.1 190 1.75 -- 2.20 2.97
fc62-S-L-1 65.8 192 2.31 3.50 2.96 2.95
fc62-S-L-2 63.5 194 2.51 3.66 3.12 3.10
fc62-S-L-3 62.6 191 2.31 3.77 3.21 3.06
fc62-S-L-4 62.8 190 2.31 3.64 3.10 3.04
fc62-S-L-5 62.3 189 2.32 3.66 3.18 3.04

118
The 2.5 and 0.9 yield were dot plotted to understand the significance of the results and
shown in Figure 6.15 and Figure 6.16, respectively. It was found that the average value of
for the taut strands in 43 and 62 MPa strength concrete with le = 450 mm was 2.2 (CoV = 13%)
and 3.43 MPa (CoV = 16%), respectively. When the fc increased from 43 to 62 MPa, the value
of increased by about 50%. The average value of for taut and stressed strands in
62 MPa strength concrete with le = 950 mm was 2.61 (CoV = 15%) and 3.18 MPa
(CoV = 3%), respectively. When the stress level increased from 0.1 to 0.7 fpu, the b increased
by about 15%. As the slope of the -s for stressed strands was stiffer than that for the taut
strands in concrete, the average value of 2.5 of the stressed strands was higher than that of the
taut strands with le = 950 mm. It was also observed that the effect of le was predominant on
determining the b using the 2.5 mm slip method. The results indicated that when the le of
strand increased from 450 to 950 mm, the value of decreased significantly by about 25%.
The slip method provides b as a function of le. Therefore, the slip method becomes critical
for PTC systems as the le of the member depends on the Lt of the specimen. The le of the strand
could vary with specimen to specimen using different materials for PTC members. For some
cases, the le could be more or less than 1000 mm. In such cases, the determined b should be
independent of the le of the member and should be represented as a material parameter.
Therefore, the determination of b using 2.5 mm slip method cannot be valid as it varies with
different le of the PTC systems.

119
Figure 6.15 Determined 2.5
Figure 6.16 elucidates the determined 0.9yield of the taut and stressed strands in
concrete with le = 450 and 950 mm. The average 0.9yield of the taut strands in 43 and 62 MPa
strength concrete with le = 950 mm was 1.83 (CoV = 13%) and 2.68 MPa (CoV = 18%),
respectively. As the yield attained before the strands experiencing the 2.5 mm slip, the yield
was lower than the 2.5 for these cases. When the fc increased from 43 to 62 MPa, the 0.9 yield
increased by about 40% due to the improved confinement at the S-C interface. Based on t-test,
the value of P for fc = 43 and 62 MPa was 0.030 and 0.031, respectively (less than 0.005).
Therefore, it confirmed that the 0.9 yield method has a significant difference on the b compared
with the 2.5 mm slip method for the taut short strands embedded in fc = 43 and 62 MPa.
0
1
2
3
4
5
fc43-2.5-TS fc62-2.5-TS 0.1fpu-2.5-TS 0.7fpu-2.5-TS
Bond stress (2018-07-21) 8:39:33 PM 2/11/2019
fc43-2.5-TSfc62-2.5-TS0.1fpu-2.5-TS0.7fpu-2.5-TS
Ran
ge
Dete
rmin
ed
2.5
(MP
a)
fc43-T-S fc62-T-S fc62-T-L fc62-S-L
= 2.24 3.43 2.61 3.18
CoV = 13% 16% 15% 3%

120
Figure 6.16 Determined 0.9yield
In the case of long specimens (le = 950 mm) with the taut and stressed strands in
fc = 62 MPa, the determined 0.9 yield was almost the same, 3 MPa (CoV = 2%). Based on the
yield method the determined b of the taut strands increased by about 13% and almost the same
for the stressed strands compared to the determined b based on slip method. The values of P
for the taut and stressed strands was 0.026 and 0.165, respectively. It indicates that the 0.9 yield
has significant difference on the b of the taut strands and not on that of the stressed strands.
From the results, it is evident that the yield method could eliminate the effect of stress on the
determined b. The b of taut strands (with le = 450 mm) using slip method was 20% lesser
than that using yield method. The effect of le was minimized using the yield method.
Figure 6.17 shows the determined b as a function of the fc. The solid and hollow
markers indicate the 2.5 and 0.9 yield. It signifies a lot of variation on the determined of
the taut strands in concrete. The cluster of solid markers of specimens fc62-T-S, fc62-T-L, and
fc62-S-L, indicate that the value of 0.9 yield is same for the specimens with different le and fps.
0
1
2
3
4
5
fc43-Y fc62-Y 0.1fpu-Y 0.7fpu-Y
Bond stress (2018-07-21)
Ran
ge
Dete
rmin
ed
0.9
yie
ld(M
Pa)
fc43-T-S fc62-T-S fc62-T-L fc62-S-L
= 1.84 2.68 3.07 3.04
CoV = 13% 18% 2% 2%

121
However, the 0.9 yield of taut strands with le = 450 mm has a lot of scatter than that of taut
strands with le = 950 mm.
Figure 6.17 Determined b as a function of compressive strength of concrete
The limitation of the slip method can be overcome by using the 0.9 yield method, which
represents the behaviour of the S-C bond by eliminating the effect of le. This method indicates
that the stress at yield would remain the same irrespective of the le of the strands. The slip at
the yield was longer than that at the for the long specimens of about 3 mm. However, the
slip of yield would attain before the 2.5 mm slip of the strand at the FE, which is typically
considered in many standards. Hence, the slip range would also be well within the range
specified by the codes.
Figure 6.18 displays the difference in the b between the taut and stressed strands (b).
The b was calculated by subtracting the mean b of stressed strands from the b of taut strands
using yield method. The figure indicates that the b for taut strands with le = 950 mm is close
to zero with less scatter compared to that for taut strands with le = 450 mm. From this
Compressive strength of concrete (fc), MPa
40 50 60 70
Det
erm
ined
b, M
Pa
0
1
2
3
4
fc43-T-S, 2.5
fc43-T-S, yield
fc62-T-S, 2.5
fc62-T-S, yield
fc62-T-L, 2.5
fc62-T-L, yield
fc62-S-L, 2.5
fc62-S-L, yield

122
observation, it can be concluded that the 0.9 yield of the stressed and taut strand specimens with
le = 950 mm did not vary significantly. Thus, the b of the stressed strands can be obtained by
using the taut strands with le = 950 mm in concrete.
Figure 6.18 The difference in the b between the taut and stressed strands
Based on the experimental results and above discussions, using the 0.9 yield, the taut
strands with le = 950 mm embedded in concrete strength not less than about 60 MPa could be
used to determine the b in the PTC systems. Also, both the taut and stressed strands with
le = 950 mm ruptures at the maximum load of about 190 kN exhibiting similar behaviour after
the yield. It should be noted that the bond failures of all the specimens were by the pull-out of
the strand. The mode of failure observed in the taut and stressed strands is explained in the
following section. A similar type of pull-out failure was observed for taut and stressed
specimens with le = 950 mm followed by the strand rupture.
le = 950 mm
b
b, ta
ut -
b
, st
ress
ed
-0.4
-0.2
0.0
0.2
0.4
0.6
0.8
1.0
le = 450 mm
S1 S2 S3 S4 S5 S6 S1 S2 S3 S4 S5 S6
Less scatter More scatter

123
Modes of failure
From the experimental investigations, it is observed that all the taut strand specimens
with short le = 450 mm failed by the pull-out of the strand than by splitting of the concrete
which is expected for high strength concrete. This is due to the mechanical interlock
mechanism which provides bearing action against concrete keys due to the helical shape of the
strand. The pull-out specimen was cut open to observe the failure at the S-C interface. Figure
6.19 indicates the S-C bond failure at the interface due to strand slippage.
Figure 6.19 The S-C bond failure at the interface (with close-up views)
The bottom left side of the specimen is zoomed out to display the interface damage
near the live end. The damage of the concrete keys was maximum near the live end. The
Near the live endAway from the live end
Live end
Free end
1 1
2 2
Concrete
Fully
sheared
concrete
key
Partly
sheared
concrete
key
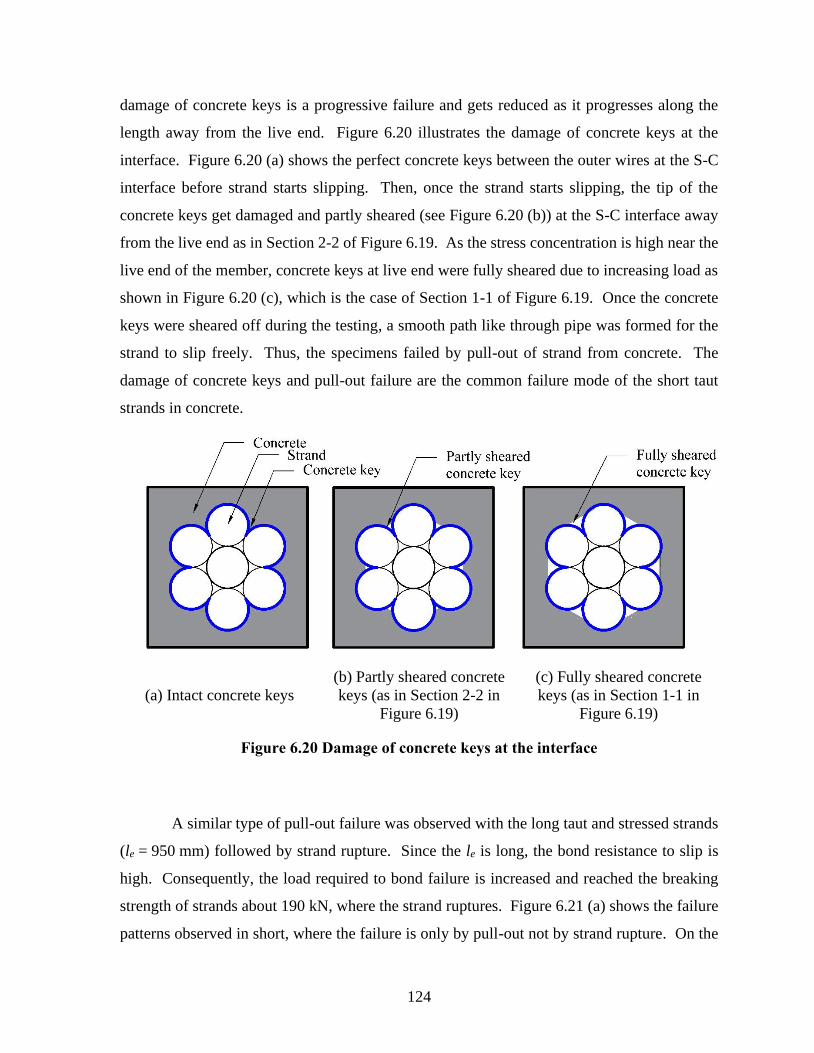
124
damage of concrete keys is a progressive failure and gets reduced as it progresses along the
length away from the live end. Figure 6.20 illustrates the damage of concrete keys at the
interface. Figure 6.20 (a) shows the perfect concrete keys between the outer wires at the S-C
interface before strand starts slipping. Then, once the strand starts slipping, the tip of the
concrete keys get damaged and partly sheared (see Figure 6.20 (b)) at the S-C interface away
from the live end as in Section 2-2 of Figure 6.19. As the stress concentration is high near the
live end of the member, concrete keys at live end were fully sheared due to increasing load as
shown in Figure 6.20 (c), which is the case of Section 1-1 of Figure 6.19. Once the concrete
keys were sheared off during the testing, a smooth path like through pipe was formed for the
strand to slip freely. Thus, the specimens failed by pull-out of strand from concrete. The
damage of concrete keys and pull-out failure are the common failure mode of the short taut
strands in concrete.
(a) Intact concrete keys
(b) Partly sheared concrete
keys (as in Section 2-2 in
Figure 6.19)
(c) Fully sheared concrete
keys (as in Section 1-1 in
Figure 6.19)
Figure 6.20 Damage of concrete keys at the interface
A similar type of pull-out failure was observed with the long taut and stressed strands
(le = 950 mm) followed by strand rupture. Since the le is long, the bond resistance to slip is
high. Consequently, the load required to bond failure is increased and reached the breaking
strength of strands about 190 kN, where the strand ruptures. Figure 6.21 (a) shows the failure
patterns observed in short, where the failure is only by pull-out not by strand rupture. On the

125
other hand, Figure 6.21 (b) shows the strand rupture of long strands. The failure mode of long
taut and stressed strands is the same by strand rupture. The failure mechanism for stressed and
taut strands is explained in the following section.
(a) In short specimens, strands get
pulled-out and strands do not rupture
(b) In long specimens, strands get pulled-out
and eventually gets ruptured
Figure 6.21 Failure patterns in short and long specimens
6.5 FAILURE MECHANISM OF THE S-C BOND
The -s behaviour of the taut and stressed strand is different at the S-C interface due to the
applied initial prestress and Hoyer effect. To illustrate this mechanism, changes at the interface
near the live end of the specimen during the pull-out test is shown in Figure 6.22. During
pull-out test, at Ps < Pyield, strand at the interface elongates and gets debonded with the
surrounded concrete. It is assumed that the strand deforms elastically till Pyield. The Hoyer
effect is insignificant in the taut strand specimens where, the applied initial stress is minimal
(about 0.1 fpu) just to keep the strand straight. The dashed lines in Figure 6.22 (a) indicate the
outer surface of the taut strand in contact with concrete. The shaded region in the figure shows
the debonded region (gap between the strand and concrete).

126
On contrary, in the stressed strand specimens, the Hoyer effect would be significant,
which precompresses the surrounding concrete at the transfer of applied fps (about 0.7fpu). As
a result, while strand elongates under the load, the concrete gets decompressed due to elasticity,
which prevents the debonding of strand from the surrounding concrete (Figure 6.22 (b)). The
white region between the two solid helical lines indicates the decompressed concrete in contact
with the strand.
where, Ps < Pyield
(a) Taut strand in concrete (b) Stressed strand in concrete
Figure 6.22 Changes at the S-C interface during the pull-out test (until yield)
127
In the case of the stressed strands, the expansion of the concrete due to decompression,
gives more stiffness and resistance to the slip of the strand, whereas, in the taut strand
specimen, the concrete would not experience such expansion and leaves a gap between the
strand and concrete when the strand deforms. Hence, there is no restrain for the strand
movement, and the strand starts slipping once the load is applied. The significance of this
mechanism is clearly seen in Figure 6.13 and Figure 6.14, which display the bond stress – slip
behaviour of stressed and taut strands in concrete. The -s behaviour indicates that for a
particular load, the stressed strand specimens would experience less slip than the taut strand
specimens. This implies that the Hoyer and Poisson’s effect at transfer and loading plays a
critical role on the bond stress at the S-C bond of the PTC systems.
Once the strand starts slipping, the shear and bearing forces would be induced on the
concrete keys (typically the cement paste with fine aggregates) between the outer wires of the
strand. Figure 6.23 displays the mechanism of bond failure at S-C interface. A close-up of the
region ABCD is shown and indicates the forces acting on the concrete keys under loading.
When the load is applied, the strand tends to slip. This activates the friction and mechanical
interlock mechanisms and induces the shear force (Fs) and bearing force (Fb) on the interface
between the concrete key and outer wires. IK-W1 and IK-W2 represent the interfaces between the
concrete key and outer wires shown.
The following assumptions are made in developing the bond failure mechanism: (i) the
curved region (dashed line) of outer wire is considered as straight line for simplification and
the triangle formed by the points K1, K2, and K3 forms the concrete key and (ii) there is no
relative movement between the outer wires – indicating no resistance offered by the IK-W2
interface. Also, note that in PTC elements, the strands exhibit complete pull-out failure due to
shearing of the concrete keys. At the S-C interface, when the strand starts slipping, the
surrounding concrete resist the movement of the strand and induces the normal force (N) and
frictional force (N) on the outer surface of the concrete key (K1-K2). Shear force and bearing
forces from the strand on the IK-W act at an angle ‘'’. Therefore, to be in equilibrium, the sum
of the forces acting in the vertical and horizontal direction is zero as given Eqs. 6.2 and 6.3.

128
Fx = 0; N − Fb cos + Fs sin = 0 Eq. (6.2)
Fy = 0; N − Fb sin − Fs cos = 0 Eq. (6.3)
Figure 6.23 Mechanisms of bond failure at S-C interface

129
As the test progresses, with the increase in applied load, the shear force at the interface
increases; when the Fs sin + Fb cos > N, the concrete key region (K1-K2-K3) gets sheared
and forms a path for the strands to slide. Then, the debonding region continues to propagate
along the length of the member. Consequently, this failure facilitates the free movement of
the strands and the concrete keys along the interface K1-K2 surface (complete pull-out failure).
Once the concrete keys get sheared, the mechanical interlock mechanism becomes
insignificant and the strand slips freely (i.e., without much additional load). This can be seen
from Figure 6.13 and Figure 6.14, where the slope of the bond stress changes gradually and
approaches zero with the increasing slip of the strand. Thus, the bond failure of the PTC
members depends on the failure of the concrete keys between the wires, which is a function of
the compressive strength and shear strength of concrete. This indicates (as discussed earlier)
that the prestress plays a role on the slope of the initial region of the -s plot (say, up to yield
point); but not on the yield point or bond strength. After yield, the sheared concrete keys allow
the free movement of strand - indicated by the region with negligible slope on the -s plot.
Therefore, the load required to fail the concrete keys is same irrespective of the slip of the
strand. Hence, the yield and post peak behaviour are the same for both taut and stressed strands
in concrete.
6.6 SUMMARY OF OBJECTIVE 2
In sum, this chapter explained the challenges involved in determining the bond stress using the
conventional method. Also, it has addressed the strand deformation during the pull-out test
and eliminated the strand deformation from the measured slip to obtain the true slip of the PTC
members. Then, to overcome the challenges associated with the conventional method, 90%
bond yield stress method is proposed to determine the bond strength between the strand and
concrete. Using 90% bond yield stress method, effect of compressive strength, prestress level,
and embedment length of the strand on the bond strength of the PTC members were assessed.
Finally, the modes of failure and failure mechanism of bond are detailed. The conclusion from
this chapter are provided in the following Chapter 7.

130
7 CONCLUSIONS AND RECOMMENDATIONS
7.1 SUMMARY OF THE STUDY
The transmission lengths for pretensioned concrete (PTC) members for different compressive
strength of concrete at transfer (fci = 23, 28, 36, and 43 MPa) were estimated using the codal
formulations and compared with the experimentally obtained Lt of twelve specimens. Based
on the experimental data, a bilinear model was proposed to standards for a rational estimation
of Lt. Also, case studies were conducted in order to understand the significance of
underestimation or overestimation of Lt on the structural performance of the PTC members.
The limitations on determining the bond strength were discussed. Pull-out test was performed
using the taut and stressed strands in concrete (fc = 43 and 62 MPa) to determine the bond
strength of the PTC members. A 90% bond yield stress method was proposed to determine
the bond strength as an S-C interface parameter that is independent of le and fps. Based on the
experimental study the following conclusions were drawn:
7.2 CONCLUSIONS
The specific conclusions from each objective are presented in the following subsections.
Objective 1 – To determine and model the effect of compressive strength at
transfer (fci) on the transmission length (Lt) of pretensioned concrete systems.
1. DEMEC readings are highly sensitive and it could vary with persons. Hence, care
should be taken to avoid or minimise the error in the reading. The commonly used
DEMEC discs are not suitable for the Lt measurements – provides lower strain than
expected. Hence, DEMEC inserts are suggested for proper Lt measurements which
is the best suitable for long-term measurements also.
2. The compressive strength of concrete at transfer has significant influence on Lt.
When fci increased from 23 to 43 MPa, the possible range in practice, the values of
Lt decreased by about 34%. Therefore, the fci has to be included in the design
equations for a rational estimation of Lt. From the experimental work, a bilinear
model was proposed to determine the Lt as a function of fci.

131
3. The initial time from 7 to 28 days plays significant role on Lt as the concrete hardens
to gain its design strength. However, after 150 days no trend was observed on the
Lt measurement. More controlled study has to be carried out to obtain the accurate
Lt with time. In general, it can be concluded that the rate of change of Lt after 150
days is not significant.
4. For the range of concrete compressive strength at transfer used in the PTC systems,
the Lt, code based on AASHTO, ACI, AS, CSA, EN, fib MC overestimated the Lt
based on the proposed model. However, the Lt based on IS 1343 (2012)
underestimated the required Lt. Therefore, the design Lt equation in IS 1343 (2012)
has to be revised to meet the actual Lt required to transfer the effective stress from
strand to concrete. Also, it is recommended to revise the Lt as a function of fci in
the design equations of other codes which do not consider fci but overestimates the
Lt.
5. From the case studies, it was observed that the underestimation and overestimation
of Lt are not advisable for the design of shear and transmission zone reinforcement
required for the bursting stresses, respectively. Hence, the proposed model that
considers the compressive strength of concrete at transfer to estimate Lt precisely
is expected to provide a more rational design of the shear and transmission zone
reinforcement.
Objective 2 – To develop a simplified procedure and determine the bond
strength of strand in concrete as a function independent of the embedment
length and prestress level.
1. The corresponding to 2.5 mm at the free end cannot be used to determine the b
as it is not reliable for the long PTC members. Also, the measured slip obtained by
the LVDT at the live end does not represent the true slip of the strand as it measures
the elongation of the strand along with the slip of the strand. This necessitates the
need to eliminate the elongation of strand from the measured slip to get the true -s
behaviour.

132
2. Using the 2.5 mm slip method, the determinedb increased by about 50% when the
fc increased from about 40 to 60 MPa. Also, when the applied prestress increased
from 0.1 fpu to 0.7 fpu, the b increased by about 15% and when the le of strands
increased from 450 to 950 mm, b decreased significantly by 25%. Therefore, the
2.5 mm slip method is not suitable for determining the bond strength of the PTC
systems as b becomes function of le which is critical.
3. Using the bond yield stress method, when the fc increased from 40 to 60 MPa, the
b increased by about 40% due to increased confinement at the S-C interface.
Hence, fc is an important parameter to be considered in the design formulation to
determine the bond strength of PTC members.
4. The determined b of both taut and stressed strands were almost the same, say about
3 MPa using the proposed method based on bond yield stress. Also, the determined
b did not vary with different le as the yield stress represents the behaviour of the
S-C interface independent of the applied prestress and embedment length. The
difference in the b between the taut with 950 mm and stressed strands is
insignificant, close to zero.
5. Based on the proposed method, the complexity in determining the b of the stressed
strands can be reduced. For a proper controlled study, taut strands with le = 950 mm
could be used to determine the b of the stressed strands.
6. The S-C interface of stressed and taut strands was different till yield point due to
transferred stress from strand to concrete. After yield, the concrete keys formed at
the S-C interface gets sheared off under loading and creates a path for strands to
move freely. Thus, the failure of bond depends on the strength of concrete keys
which is the function of the compressive strength of concrete. Therefore,
irrespective of stress, the −s behaviour after yield is the same for both long and
stressed strands in concrete. Then, the failure mechanism of taut and stressed
strands in concrete is mainly by pull-out of strands (short taut strands) and strand
rupture (long taut and stressed strands).

133
7.3 RECOMMENDATIONS FOR FUTURE WORK
1. The effect of time on Lt can be studied with proper controlled condition to capture
the shrinkage and creep effects.
2. Effect of member size and geometry on Lt and b can be studied and those
parameters should be defined as a function of material properties irrespective of
member size and geometry. Further, a full-scale member testing can be done to
determine the transmission length.
3. Bond stress-slip relationship is obtained by measuring the slip at live and free ends
of the member. The strain on the concrete surface along the length of the specimen
under pull-out testing needs to be studied to get deeper understanding of bond
4. mechanisms. The digital image correlation technique could be used for this.
5. Further, this study can be extended to study the bond behaviour of strands
embedded in concrete using supplementary cementitious materials. Also, testing
more specimens with different stress levels would be helpful to obtain the
correlation between the applied prestress and bond strength of PTC members.
6. Many PTC members are subjected to aggressive environment in reality which are
expected to deteriorate by corrosion and degrade the structural performance of the
members. Hence, it is important to study the bond behaviour of strands embedded
in concrete subjected to different corrosion level and service life estimation is
required to ensure its structural performance and safety.
7. Numerical models can be developed to conduct parametric studies on Lt and b.
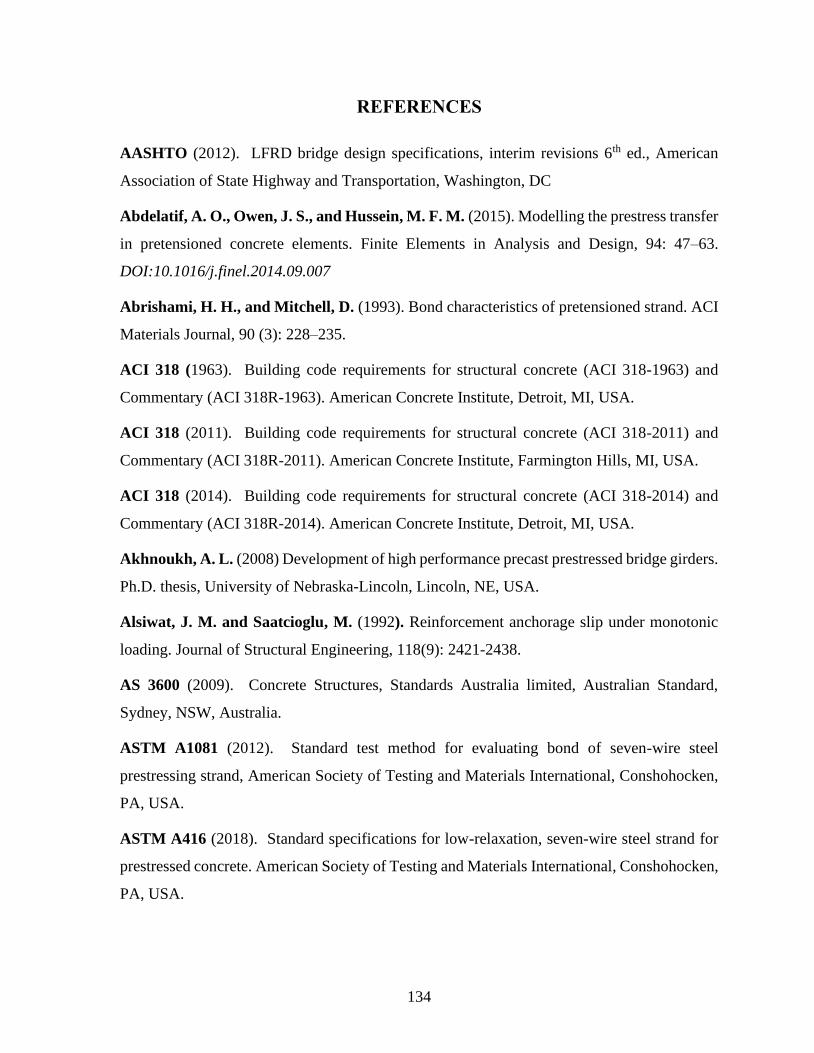
134
REFERENCES
AASHTO (2012). LFRD bridge design specifications, interim revisions 6th ed., American
Association of State Highway and Transportation, Washington, DC
Abdelatif, A. O., Owen, J. S., and Hussein, M. F. M. (2015). Modelling the prestress transfer
in pretensioned concrete elements. Finite Elements in Analysis and Design, 94: 47–63.
DOI:10.1016/j.finel.2014.09.007
Abrishami, H. H., and Mitchell, D. (1993). Bond characteristics of pretensioned strand. ACI
Materials Journal, 90 (3): 228–235.
ACI 318 (1963). Building code requirements for structural concrete (ACI 318-1963) and
Commentary (ACI 318R-1963). American Concrete Institute, Detroit, MI, USA.
ACI 318 (2011). Building code requirements for structural concrete (ACI 318-2011) and
Commentary (ACI 318R-2011). American Concrete Institute, Farmington Hills, MI, USA.
ACI 318 (2014). Building code requirements for structural concrete (ACI 318-2014) and
Commentary (ACI 318R-2014). American Concrete Institute, Detroit, MI, USA.
Akhnoukh, A. L. (2008) Development of high performance precast prestressed bridge girders.
Ph.D. thesis, University of Nebraska-Lincoln, Lincoln, NE, USA.
Alsiwat, J. M. and Saatcioglu, M. (1992). Reinforcement anchorage slip under monotonic
loading. Journal of Structural Engineering, 118(9): 2421-2438.
AS 3600 (2009). Concrete Structures, Standards Australia limited, Australian Standard,
Sydney, NSW, Australia.
ASTM A1081 (2012). Standard test method for evaluating bond of seven-wire steel
prestressing strand, American Society of Testing and Materials International, Conshohocken,
PA, USA.
ASTM A416 (2018). Standard specifications for low-relaxation, seven-wire steel strand for
prestressed concrete. American Society of Testing and Materials International, Conshohocken,
PA, USA.

135
ASTM C192 (2016). Standard practice for making and curing concrete test specimens in the
laboratory. American Society of Testing and Materials International, Conshohocken, PA,
USA.
ASTM C204 (2016). Standard test methods for fineness of hydraulic cement by air
permeability apparatus. American Society of Testing and Materials International,
Conshohocken, PA, USA.
Baláz, G. L. (1992). Transfer control of prestressing strands. PCI Journal, 37: 60-71.
Barnes, R. W., Grove, J. W., and Burns, N. H. (2003). Experimental assessment of factors
affecting transfer length. ACI Structural Journal, 100(6): 740– 748.
Belhadj, A. and Bahai, H. (2001). Friction-slip: an efficient energy dissipating mechanism
for suddenly released prestressing bars, Engineering Structures, 23: 934-944.
Benítez, J. M. and Gálvez, J. C. (2011). Bond modelling of prestressed concrete during the
prestressing force release, Materials and Structures, 44: 263-278.
Brearley, L. M., and Johnston, D. W. (1990). Pull-out bond tests of epoxy-coated
prestressing strand. Journal of Structural Engineering, 116(8): 2236–2252.
Bruce, R. N., Russell, H. G., Roller, J. J., and Martin, B. T. (1994). Feasibility evaluation
of utilizing high-strength concrete in design and construction of highway bridge structures.
Baton Rouge, LA.
BS 8110-1 (1997). Structural use of concrete - Part 1: Code of practice for design and
construction, British Standards, London, UK.
Buckner, C. D. (1995). A review of strand development length for pretensioned. PCI Journal,
40(2): 84–105.
Caro, L. A., Martí-Vargas, J. R., and Serna, P. (2013a). Prestress losses evaluation in
prestressed concrete prismatic specimens. Engineering Structures: 48: 704–715.
https://doi.org/10.1016/j.engstruct.2012.11.038.
Caro, L. A., Martí-Vargas, J. R., and Serna, P. (2013b). Time-dependent evolution of
strand transfer length in pretensioned prestressed concrete members. Mechanics of Time-
Dependent Materials, 17 (4): 501–527. https://doi.org/10.1007/s11043-012-9200-2.

136
Cousins, T. E., Johnston, D. W., and Zia, P. (1986). Bond of epoxy-coated prestressing
strand. Federal Highway Administration, Publication No. FHW A/NC/87-005, Washington,
D.C.
Cousins, T. E., Johnston, D. W., and Zia, P. (1990). Development length of epoxy-coated
prestressing strand. ACI Materials Journal, 87(4): 309–318.
CP 110-1 (1972). Code of practice for the structural use of concrete. Design, materials and
workmanship, UK.
CSA A23.3 (2004). Design of concrete structures, Canadian Standards Association
Mississauga, Canada.
Dang, C. N. (2015). Measurement of transfer and development lengths of 0.7 in. strands on
pretensioned concrete elements. Ph.D. dissertation. University of Arkansas, Fayetteville, AK,
USA.
Dang, C. N., Floyd, R. W., Hale, W. M. and Martí-Vargas, J. R. (2016a). Measured transfer
lengths of 0.7 in. (17.8 mm) strands for pretensioned beams. ACI structural Journal, 113(3):
525-535.
Dang, C. N., Floyd, R. W., Murray, C.D., Hale, W. M., and Martí-Vargas, J.R. (2015).
Bond stress-slip model for 0.6 in. (15.2 mm) diameter strand. ACI Structural Journal, 112 (5):
625-634.
Dang, C. N., Floyd, R. W., Prinz, G. S., and Hale, W. M. (2016b). Determination of bond
stress distribution coefficient by maximum likelihood method. Journal of Structural
Engineering, 142(5): 1-10.
Dang, C. N., Murray, C. D., Floyd, R. W., Hale, W. M., and Martí-Vargas, J. R. (2014b).
Correlation of strand surface quality to transfer length. ACI Structural Journal, 111(5): 1245-
1252.
Dang, C. N., Murray, C. D., Floyd, R. W., Hale, W. M., and Martí-Vargas, J. R. (2014a).
Analysis of bond stress distribution for prestressing strand by strand test for strand bond.
Engineering Structures, 71: 152-159.

137
Deatherage, J. H., Burdette, E. G., and Chew, C. K. (1994). Development length and lateral
spacing requirements of prestressing strand for prestressed concrete bridge girders. PCI
Journal, 39(1): 70–83.
den Uijl, J. A. (1998). Bond Modelling of prestressing strand. ACI special publication 180:
145-169.
Deng, Y., Morcous, G, and Ma Z. J. (2015). Strand bond stress – slip relationship for
prestressed concrete members at prestress release. Materials and Structures, 49 (3): 889-903.
DOI: 10.1617/s11527-015-0546-1.
Dorsten, V., Hunt, F. F., and Preston, H. K. (1984). Epoxy coated seven-wire strand for
prestressed concrete. PCI Journal, 29(4): 100–109.
Elliott, K. S. (2014). Transmission length and shear capacity in prestressed concrete hollow
core slabs. Magazine of Concrete Research, 66(12): 585-602.
EN 2 (2004) Design of concrete structures - Part 1-2: General rules for buildings, European
standard Brussels, Belgium.
Floyd, R. W., Hale, W. M., and Howland, M. B. (2015). Measured transfer length of 0.6 in.
prestressing strands cast in lightweight self-consolidating concrete. PCI Journal, 60(3): 84–98.
Girgis, A. F. M. and Tuan, C. Y. (2005). Bond strength and transfer length of pretensioned
bridge girders cast with self-consolidated concrete. PCI Journal, 56 (6): 72-87.
Gustavson, R. (2004). Experimental studies of the bond response of three-wire strands and
some influencing parameters. Materials and Structures, 37: 96-106.
Hanson, N. W. and Kaar, P. H. (1959). Transmission length of pretensioned prestressed
beams. Journal of the American Concrete Institute, 55(51): 783–802.
Harajli, M. H., Hout, M., and Jalkh (1995). Local bond stress-slip relationship of
reinforcing bars embedded in plain and fiber concrete. ACI Materials Journal, 92(4): 343-354.
Hegger, J. and Bertran, G. (2008) Anchorage behaviour of pretensioned strands in steel fiber
reinforced UHPC, Ultra High Performance Concrete (UHPC). Proceedings of the second
International symposium on ultra high performance concrete. Kassel, Germany: 537-544.

138
Hegger, J., Will, N., and Bülte, S. (2007). Bond strength and shear capacity of prestressed
beams made of SCC. Self-Consolidating concrete for precast prestressed applications, SP-247,
American Concrete Institute, Fajardo, P. R: 123-138.
Hoyer, E. and Friedrirch (1939). Beitrag zur frage der haftspannung in eisinbeton bautellin.
Beton und Eiren, 50: 717–736.
International Federation for Structural Concrete (fib) (2000). Bond of reinforcement in
concrete-State of the art report fib Bulletin No. 10, Lausanne, Switzerland.
International Federation for Structural Concrete (fib) (2010). Model code for concrete
structures, fib Bulletin No. 55, Lausanne, Switzerland.
IRC 112 (2011). Code of practice for concrete road bridges, Indian Road Congress, New
Delhi, India.
IS 10262 (2009). Concrete Mix Proportioning – Guidelines, Bureau of Indian Standards (BIS),
New Delhi, India.
IS 1199 (1959). Methods of sampling and analysis of concrete. Bureau of Indian Standards
(BIS), New Delhi, India.
IS 1199 (1959). Methods of sampling and analysis of concrete, Bureau of Indian Standards
(BIS), New Delhi, India.
IS 1343 (2012). Prestressed concrete - code of practice, Bureau of Indian Standards (BIS),
New Delhi, India.
IS 269 (2015). Ordinary portland cement - specification, Bureau of Indian Standards (BIS),
New Delhi, India.
IS 2770 (1967) - Part 1. Methods of testing bond in reinforced concrete, Part 1 Pull-out test.
Bureau of Indian Standards (BIS), New Delhi, India.
IS 383 (2016). Coarse and fine aggregate for concrete – Specification, Bureau of Indian
Standards (BIS), New Delhi, India.
IS 4031 (1998) – Part 4. Methods of physical tests for hydraulic cement. Part 4 Determination
of consistency of standard cement past, Bureau of Indian Standards (BIS), New Delhi, India.

139
IS 4031 (2008) - Part 1-15. Methods of physical tests for hydraulic cement, Bureau of Indian
Standards (BIS), New Delhi, India.
Issa, M. A., Sen, R., and Amer, A. (1993). Comparative Study of Transfer ength in Fiberglass
and Steel Pretensioned Concrete Members. PCI Journal, 38(6): 52–63.
Janney, J. R. (1954). Nature of bond in pre-tensioned prestressed concrete. Journal of the
American Concrete Institute, 25(9): 717–736.
Kaar, P. H., Lafraugh, R. W., and Mass, M. A. (1963). Influence of concrete strength on
strand transfer length. In Ninth Annual Convention of the Prestressed Concrete Institute: 47–
67.
Kasan, J. and Harries, K. A. (2011). Redevelopment of prestressing force in severed
prestressing strand. ASCE journal of bridge engineering, 16(3): 431-437.
Khayat, K. H. (1998). Use of Viscosity-Modifying admixture to reduce top-bar effect of
anchored bars cast with fluid concrete. ACI Materials Journal 95(2): 158-167
Kim, J. K., Yang, J. M., and Yim, H. J. (2016). Experimental evaluation of transfer length
in pretensioned concrete beams using 2400 MPa prestressed strands. Journal of Structural
Engineering, 142(11: 04016088-1-04016088-10/
Kose, M. M. and Burkett, W. R. (2005). Formulations of new development length equation
for 0.6 in. prestressing strand. PCI Journal, September-October: 96-105.
Krishna Murthy, D. (1971). A method of determining the tensile stresses in the end zones of
pre-tensioned beams. The Indian concrete journal, 45(7): 286-697.
Lane, S. (1998). A new development length equation for pretensioned strands in bridge beams
and piles. Mclean, VA.
Larson, K. H., Peterman, R. J., and Esmaeily, A. (2007). Bond Characteristics of Self-
consolidating Concrete for Prestressed Bridge Girders. PCI Journal, 52(4): 44–57.
Logan, D. R. (1997). Acceptance Criteria for Bond Quality of Strand for Pretensioned
Prestressed Concrete Applications. PCI Journal, 42(2): 52–90.

140
Mahmoud, Z. I., Rizkalla, S. H., and Zaghloul, E. R. (1999). Transfer and development
lengths of carbon fiber reinforced polymers prestressing reinforcement. ACI Structural
Journal, 96 (4): 594-602.
Marshall, W. T. and Krishna Murthy, D. (1969). Transmission length of prestressing
tendons from concrete cube strengths at transfer. The Indian Concrete Journal, 43(7): 244-253
Martin, B. L. D. and Scott, N. L. (1976). Development of prestressing strand in pretensioned
members. In Proceedings of ACI Journal, 73(8): 453–456
Martí-Vargas, J. R., Serna, P., Navarro-Gregori, J., and Bonet, J.L. (2012b). Effects of
concrete composition on transmission length of prestressing strands. Constr. Build. Mater., 27:
350-356
Martí-Vargas, J. R., Serna-Ros, P., Navarro-Gregori, J. and Pallarés, L. (2012a). Bond of
13 mm prestressing steel strands in pretensioned concrete members. Engineering Structures,
41: 403-412
Martí-Vargas, J. R. and Hale, W. M. (2013). Predicting Strand Transfer Length in
Pretensioned Concrete: Eurocode versus North American Practice. Journal of Bridge
Engineering, 18 (December): 1270–1280. doi: 10.1061/(ASCE)BE.1943-5592.0000456.
Martí-Vargas, J. R., Serna-Ros, P., Fernandez-Prada, M. A., and Miguel-Sosa, P. F.
(2006). Test method for determination of the transmission and anchorage lengths in prestressed
reinforcement. Magazine of Concrete Research, 58(1): 21–29.
Mayfield, B., Davies, G., and Kong, F. K. (1970). Some tests on the transmission length and
ultimate strength of pre-tensioned concrete beams incorporating deform strand. Magazine of
Concrete Research, 22(73): 219–226.
Mirza, S. M. and Houde, J. (1979). Study of bond stress-slip relationships in reinforced
concrete. ACI Journal, Symposium paper, 76: 19-46.
Mitchell, D., Cook, W. D., and Khan, A. A. (1993). Influence of high strength concrete on
transfer and development length of pretensioning Strand. PCI Journal, 38(3): 52–66.
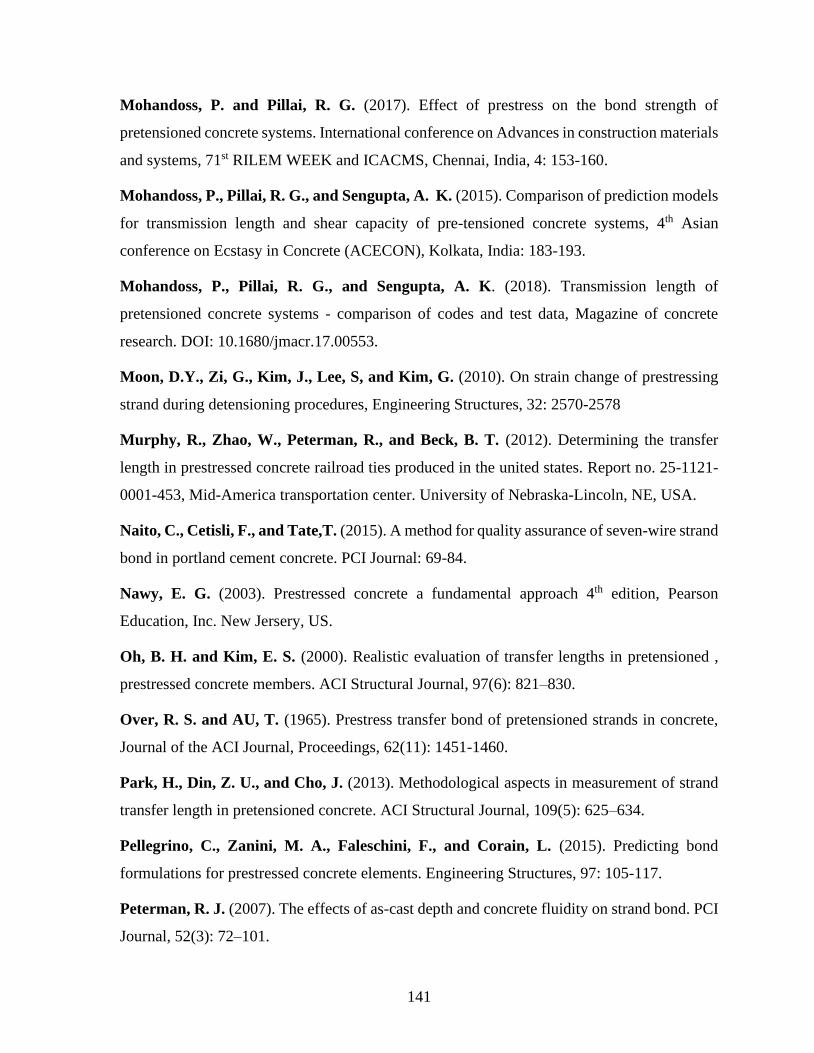
141
Mohandoss, P. and Pillai, R. G. (2017). Effect of prestress on the bond strength of
pretensioned concrete systems. International conference on Advances in construction materials
and systems, 71st RILEM WEEK and ICACMS, Chennai, India, 4: 153-160.
Mohandoss, P., Pillai, R. G., and Sengupta, A. K. (2015). Comparison of prediction models
for transmission length and shear capacity of pre-tensioned concrete systems, 4th Asian
conference on Ecstasy in Concrete (ACECON), Kolkata, India: 183-193.
Mohandoss, P., Pillai, R. G., and Sengupta, A. K. (2018). Transmission length of
pretensioned concrete systems - comparison of codes and test data, Magazine of concrete
research. DOI: 10.1680/jmacr.17.00553.
Moon, D.Y., Zi, G., Kim, J., Lee, S, and Kim, G. (2010). On strain change of prestressing
strand during detensioning procedures, Engineering Structures, 32: 2570-2578
Murphy, R., Zhao, W., Peterman, R., and Beck, B. T. (2012). Determining the transfer
length in prestressed concrete railroad ties produced in the united states. Report no. 25-1121-
0001-453, Mid-America transportation center. University of Nebraska-Lincoln, NE, USA.
Naito, C., Cetisli, F., and Tate,T. (2015). A method for quality assurance of seven-wire strand
bond in portland cement concrete. PCI Journal: 69-84.
Nawy, E. G. (2003). Prestressed concrete a fundamental approach 4th edition, Pearson
Education, Inc. New Jersery, US.
Oh, B. H. and Kim, E. S. (2000). Realistic evaluation of transfer lengths in pretensioned ,
prestressed concrete members. ACI Structural Journal, 97(6): 821–830.
Over, R. S. and AU, T. (1965). Prestress transfer bond of pretensioned strands in concrete,
Journal of the ACI Journal, Proceedings, 62(11): 1451-1460.
Park, H., Din, Z. U., and Cho, J. (2013). Methodological aspects in measurement of strand
transfer length in pretensioned concrete. ACI Structural Journal, 109(5): 625–634.
Pellegrino, C., Zanini, M. A., Faleschini, F., and Corain, L. (2015). Predicting bond
formulations for prestressed concrete elements. Engineering Structures, 97: 105-117.
Peterman, R. J. (2007). The effects of as-cast depth and concrete fluidity on strand bond. PCI
Journal, 52(3): 72–101.

142
Pillai, S. U. and Menon, D. (2009). Reinforced concrete design. McGraw Hill Education
Private Limited, 3rd edition, New Delhi, India.
Pozolo, A. M. and Andrawes, B. (2011). Transfer length in prestressed self-consolidating
concrete box and I-girders. ACI Structural Journal, 108(3): 341–349.
Raju, K. N. (2011). Prestressed concrete, fourth edition, Tata McGraw Hill , New Delhi, India.
Ramirez, J. and Russell, B. (2008). Transfer, development, and splice length for
strand/reinforcement in High-Strength concrete. NCHRP (National Cooperative Highway
Research Program) report 603. Washington, CS: Transportation Research Board
Ramirez-Garcia, A. T., Dang, C. N., Hale, W. M., and Martí-Vargas, J. R. (2017). A
higher-order equation for modelling strand in pretensioned concrete beams. Engineering
structures, 131: 345-361.
Ramirez-Garcia, A. T., Floyd, R. W., Hale, W. M., and Martí-Vargas, J. R. (2016). Effect
of concrete compressive strength on transfer length. Structures, 5: 131-140.
RILEM TC (1983). RILEM recommendations for the testing and use of construction
materials, RC 6 bond test for reinforcement steel. 2. Pull-out test, E & FN SPON, 1994: 218-
220
Roller, J. J., Martin, B. T., Russell, H. G., and Bruce, R. N. (1993). Performance of
Prestressed High Strength Concrete Bridge Girders. PCI Journal, 38(3): 34–45.
Rose, D. R., and Russell, B. W. (1997). Investigation of Standardized Tests to Measure the
Bond Performance. PCI Journal, 44(4), 56–80.
Russell, B. W. and Burns, N. H. (1996). Measured transfer length of 0.5 and 0.6 in. strands
in pretensioned concrete. PCI Journal, 41: 44-65.
Russell, B. W. and Burns, N. H. (1997). Measurement of transfer lengths on pretensioned
concrete elements. Journal of Structural Engineering, 12(3): 541– 549.
Russell, B. W. and Paulsgrove, G. A. (1999). Assessing repeatability and reproductivity of
the moustafa test, the PTI bond test and NASP bond test, Final Report 99-04. Norman, Ok:
University of Oklahoma, Fears Structural Engineering Laboratory.

143
Shahawy, M. A., Issa, M., and Batchelor, B. (1992). Strand transfer lengths in full scale
AASHTO prestressed concrete girders. PCI Journal, 37(3): 84–86.
Shin, H., Lee, S., and Yoo, D. (2018). Bond Behavior of pretensioned strand embedded in
ultra-high-performance fiber-reinforced concrete. International Journal of Concrete Structures
and Materials. DOI 10.1186/s40069-018-0249-4. ISSN 1976-0485/ eISSN 2234-1315
Song, X, Wu, Y., Gu, X., and Chen, C. (2015). Bond behaviour of reinforcing steel bars in
early age concrete. Construction and Building Materials, 94: 209-217.
Song, W., Ma, Z. J., Vadivelu, J., and Burdette, E. G. (2014). Transfer length and splitting
force calculation for pretensioned concrete girders with high-capacity strands. Journal of
Bridge Engineering, 19(7): 1–8. DOI: 10.1061/(ASCE)BE.1943-5592.0000566.
Sulaiman, M. F., Ma, C. K., Apandi, N. M., Chin, S., Awang, A. Z., Mansur, S. A. and
Omar W. (2017). A review on bond and anchorage of confined high-strength concrete.
Structures, DOI: 10.1016/j.istruc.2017.04.004.
Swamy, R. N. and Anand, K. L. (1975). Losses in transmission length and prestress in high
alumina cement concrete. Proc. Instn Civ. Engrs, 59(2): 293–307.
Tabatabai, H. and Dickson, T. (1993). The history of the prestressing strand development
length equation PCI Journal, 38(6): 64-75.
Tuan, Y. C., Yehia, A. S., Jongpitaksseel, N., and Tadros, K. M. (2004). End zone
reinforcement for pretensioned concrete girders. PCI Journal, 49(3): 68-82.
Vázquez-Herrero, C., Martínez-Lage, I., and Martínez-Abella, F. (2013). Transfer length
in pretensioned prestressed concrete structures composed of high performance lightweight and
normal-weight concrete. Engineering Structures, 56: 983–992. doi:
10.1016/j.engstruct.2013.06.020
Yalciner, H., Eren, O., and Sensoy, S. (2012). An experimental study on the bond strength
between reinforcement bars and concrete as a function of concrete cover, strength and
corrosion level. Cement and Concrete Research, 42(5): 643-655.
Zhao, J., Cai, G., and Yang, J. (2016). Bond-slip behavior and embedment length of
reinforcement in high volume fly ash concrete. Materials and Structures, 49(6): 2065-2082.

144
Zia, P. and Mostafa, T. (1997). Development length of prestressing strands. PCI Journal,
22(5): 54–65.

145
APPENDIX A - TEST PROCEDURE TO DETERMINE THE
TRANSMISSION LENGTH OF PRETENSIONED CONCRETE
MEMBERS
INTRODUCTION
There is no standard method available to determine the transmission length of the pretensioned
concrete (PTC) members. This method suggested here is based on the background knowledge
of literature. Some modifications are done to obtain quality transmission length data. The
detailed description of the specimen preparation and procedure to obtain the transmission
length are discussed in the following sections.
SCOPE
o This method targets to determine the bond strength of pretensioned concrete
systems by means of a pull-out test.
REFERENCED DOCUMENTS
• ASTM C192 (2016). Standard practice for making and curing concrete test
specimens in the laboratory. American Society of Testing and Materials
International, Conshohocken, PA, USA.
• ASTM C204 (2016). Standard test methods for fineness of hydraulic cement by air
permeability apparatus. American Society of Testing and Materials International,
Conshohocken, PA, USA.
• ASTM A416 (2018). Standard specifications for Low-relaxation, seven-wire steel
strand for prestressed concrete. American Society of Testing and Materials
International, Conshohocken, PA, USA.
• IS 1343 (2012): Prestressed concrete - code of practice. Bureau of Indian Standards,
New Delhi, India.
• IS 102362 (2009). Concrete Mix Proportioning – Guidelines, Bureau of Indian
Standards (BIS), New Delhi, India.

146
SIGNIFICANCE AND USE
• The transmission length of PTC members is crucial for its shear performance.
Hence, a more rational estimate of the Lt is required for its more refined structural
designs; especially, for the end zone reinforcements of the PTC members.
Design/site engineers or precast manufactures could use this method as a quality
check test to achieve the intended shear performance of the PTC members. If the
PTC member did not meet the design Lt or the difference between the measured
and design Lt is significant, the member can be rejected for failing to meet the
design requirements.
MATERIALS
The following materials are required for the preparation of Lt specimens
1. Strand - The low relaxation seven wire strand of 12.7 mm diameter properties
conforming to IS 6000 (1983).
2. Cement - The Ordinary Portland Cement (OPC) 53S sleeper grade conforming to
IS 4031(1988-1999).
3. Aggregates - The crushed granite and natural sand can be used as coarse and fine
aggregates conforming to IS 383 (2016).
4. Superplasticizer - Master Glenium 8233, a polycarboxylate (PCE) based
superplasticizer.
APPARATUS /TOOLS
1. Concrete mixer – A 120 kg capacity mixer is used to obtain the uniformly mixed
concrete.
2. Prestressing bed – A 6 m long hollow steel frame is used a prestressing bed to
prestress the strands.
3. Hydraulic jack – A 300 bar capacity hydraulic jack is used to apply the initial
prestress.

147
4. Load cell – A 500 kN capacity ring load cell is used to monitor the load applied
while stressing.
5. Load cell indicator – It displays the load measured by the load cell.
6. LVDT / dial gauge – A LVDT of 50 mm travel length or a dial gauge to measure
the displacement of 50 mm is used to measure the slip during transferring of
prestress from strand to concrete.
7. PVC specimen mould – A PVC mould is fabricated and used to cast the
pretensioned concrete specimens.
8. Acrylic strips – Acrylic strips of 2 m long with 50 mm c/c to hole to place the
inserts are used.
9. DEMEC inserts - A custom made brass inserts are fabricated and embedded on the
concrete surface to obtain the change in distance due to prestress transfer.
10. DEMEC gauge – A demec gauge of 150 mm gauge length is used to obtain the
strain on the concrete surface due to prestress transfer.
11. Spanners – Small spanners of 12 mm size are used to fix, demould the moulds and
fix the inserts and large spanners of 36 mm size are used tighten the nuts of SAS to
transfer the stress gradually from strand to concrete.
12. Hammers – It is used to lock the wedge and barrel after stressing the strands.
13. Tamping rods – A circular tamping rods are used to compact the concrete uniformly
to obtain good quality concrete.
14. Nuts and bolts – Nuts and bolts are used to fix the moulds and welded to the steel
plate of SAS.
15. Wedges and barrels – A three sets of wedge and barrels are required to lock the
stress.
16. Steel chair – an arrangement placed to activate the stress.
17. Shim plate – a thin steel plates helps to place the wedges and barrels and loadcell
in its position.

148
18. Stress adjusting systems – a three sets of nut bolts are welded to the steel plate to
facilitate the stress adjustment to transfer the stress gradually from the strand to
concrete.
19. Ring holder – A ring holder made of using thick steel washer and rod, helps to lock
the wedge and barrel at the jacking end.
20. Spatula – It is used to pour the concrete into the mould.
21. Pan – A pan used to save the concrete material.
22. Wet sack and Plastic covers – It is used to moist cure the specimens and prevent
the moisture loss during curing.
23. Adhesive – An acrylic based adhesive is used to fix the acrylic plates on the inside
faces of the specimen mould.
24. Spirit level – It is used to check the level of the SAS.
25. Chop saw machine – It is used to cut the strands after transferring the prestress.
SPECIMEN PREPARATION AND PROCEDURE
1. Insert the strands in the through – holes of the end brackets.
2. Place the shim plates and load cell next to the end bracket at the jacking end.
3. Place wedge and barrel loosely (not to be locked while stressing the strand) outside
the loadcell.
4. Place the ring holder next to wedge and barrel placed at the jacking end.
5. Place the steel chair resting against the end bracket at the jacking end.
6. Place the hydraulic jack next to steel chair.
7. Place the wedge and barrel at the end of hydraulic jack.
8. Place the stress adjusting system at the releasing end after adjusting the levels of
the three nuts using spirit level; leave a about 3 to 4 cm for releasing the stress
purpose.

149
9. Apply an initial stress of about 0.75 fpu using the hydraulic jack with the help of
pressure gauge attached with the it.
10. Lock the wedge and barrel placed outside of the loadcell with the help of ring holder
and rubber hammer.
11. Monitor the load applied using the load cell indicator.
12. Fix the specimen mould on the prestressing bed around the strand.
13. Fix the brass inserts in the acrylic plate and affix them to the inside faces of the
PVC moulds using adhesive.
14. Prepare the concrete using the concrete mixer.
15. Pour the concrete in the PVC prism and cube mould (six companion cube
specimens) in one layer.
16. Compact the concrete using tamping rod (25 numbers of tamping for every 100 mm
length of prism).
17. Demould the prism and cube specimens after 24 hours.
18. Remove the acrylic strips attached on the mould by detaching the head portion of
the inserts.
19. After removing the strips, place the head portions of the inserts by tightening it
using spanner.
20. Moist cure the specimens using wet sack and plastic covers for three days.
21. Test the compressive strength of concrete after three days.
22. Measure the distance (two readings) between the demec inserts embedded on the
concrete surface using DEMEC gauges, before transferring the stress from the
strand to the concrete.
23. Transfer the prestress gradually from the strand to concrete using SAS system by
closing the distance between the nuts and plates of the SAS.

150
24. Measure the distance (two readings) between the brass inserts embedded on the
concrete surface using DEMEC gauges, before transferring the stress from the
strand to the concrete.
25. Cut the strands just outside of the specimens using a chop saw machine.
CALCULATIONS
1. Calculate the strain on the concrete surface (c) due to prestress transfer.
2. Calculate the smoothened strain on the concrete surface (c) over the three
consecutives points (x-1, x, x+1) using the following equation as 150 mm gauge
length overlaps the across the inserts.
( )( ) ( ) ( )
3
11 +− ++= xcxcxc
xc
εεεε'
3. Plot the average strain profile along the length of the specimen using the smoothen
data.
4. Find the 95% of the average maximum strain (AMS) on the profile.
5. Compute the Lt as the distance from the end of the member to reach the 95% of
AMS on the strain profile.

151
APPENDIX B - TEST PROCEDURE TO DETERMINE THE BOND
STRENGTH OF STRANDS IN CONCRETE
PROPOSED STANDARD TEST METHOD FOR DETERMINING THE BOND STRENGTH OF STRANDS
IN CONCRETE
SCOPE
o This method targets to determine the bond strength of pretensioned concrete
systems by means of a pull-out test.
REFERENCED DOCUMENTS
• ASTM A1081 (2012): Standard test method for evaluating bond of seven-wire steel
prestressing strand, American Society of Testing and Materials International, West
Conshohocken, PA, USA.
• ASTM C192 (2016). Standard practice for making and curing concrete test
specimens in the laboratory. American Society of Testing and Materials
international, West Conshohocken, PA, USA.
• ASTM C204 (2016). Standard test methods for fineness of hydraulic cement by air
permeability apparatus. American Society of Testing and Materials international,
Conshohocken, PA, USA.
• ASTM A416 (2018). Standard specifications for Low-relaxation, seven-wire steel
strand for prestressed concrete. American Society of Testing and Materials
International, Conshohocken, PA, USA
• IS 1343 (2012): Prestressed concrete - code of practice. Bureau of Indian Standards,
New Delhi, India.
• IS 102362 (2009). Concrete Mix Proportioning – Guidelines, Bureau of Indian
Standards (BIS), New Delhi, India
• IS 2770 (1967) - Part 1: Methods of testing bond in reinforced concrete, Part 1
Pull-out test. Bureau of Indian Standards, New Delhi, India.

152
• RILEM TC (1983). RILEM recommendations for the testing and use of
construction materials, RC 6 bond test for reinforcement steel. 2. Pull-out test, E &
FN SPON, 1994: 218-220.
SIGNIFICANCE AND USE
o The bond strength of strands embedded in concrete plays a vital role for any
structural systems. However, determination of the bond strength in the PTC
systems are crucial and involves complexity as the strands are stressed. This
method helps to determine the bond strength of strands in concrete by reducing its
complexities involved with the stressed specimens.
APPARATUS/TOOLS
o The test equipment and tools required for bond testing are as follows
1. Concrete mixer: A concrete mixer is used to obtain the uniformly mixed concrete
2. Prestressing bed: A 6 m long hollow steel frame can be used as a prestressing bed
to prestress the strand
3. Hydraulic jack: A 300 bar capacity hydraulic jack is used to apply the initial
prestress
4. Load cell: A 500 kN capacity ring load cell is used to monitor the load applied
while stressing.
5. Load cell indicator: It is used to display the load measured by the load cell.
6. LVDT / dial gauge: A LVDT of 50 mm travel length or a dial gauge could measure
the displacement of 50 mm is used to measure the slip during transferring of
prestress from strand to concrete.
7. PVC specimen mould: A PVC mould is fabricated and used to cast the pretensioned
concrete specimens.
8. Spanners: Small spanners of 12 mm size are used to fix, demould the moulds and
fix the inserts and large spanners of 36 mm size are used to tight the nuts of SAS to
transfer the stress gradually from strand to concrete.

153
9. Hammers: It is used to lock the wedge and barrel after stressing the strands.
10. Tamping rods: A circular tamping rods are used to compact the concrete uniformly
to obtain good quality concrete.
11. Nuts and bolts: Nuts and bolts are used to fix the mould and welded to the streel
plates of SAS.
12. Wedges and barrels: A three sets of wedge and barrel are required to lock the stress.
13. Steel chair: A steel chair type of arrangement can be placed to activate the stress
14. Shim plate: A thin steel plates helps to place the wedges and barrels and loadcell in
its position.
15. Stress adjusting systems: A three sets of nut bolts are welded to the steel plate to
facilitate the stress adjustment to transfer the stress gradually from the strand to
concrete.
16. Circular ring holder: A ring holder made of using thick steel washer and rod, helps
to lock the wedge and barrel at the jacking end.
17. Spatula: It can used to pour the concrete into the mould.
18. Pan: A pan can be used to save the concrete material and transport the concrete
from the mixer to prestressing bed
19. Wet sacks and plastic cover: It can be used to moist cure the specimens and prevent
the moisture loss during curing.
20. Data acquisition system: A data acquisition system can be used to record the
applied load and slip of the strand during testing.
21. Spirit level: A spirit level can be used to check the level of the SAS.
22. Universal testing machine: A universal testing machine can be used to perform a
pull-out test
23. Pullout test frame: A pull-out frame is fabricated as shown in Figure 4.14
24. LVDT holders: Two LVDT holders are used to position the LVDTs

154
25. Ruler and Vernier caliper: These are used to measure the dimensions of the test
specimens
26. Shim plates with a centre hole: Shim plates with a center hole can be used to place
at the end face of the mould to get a uniform surface for pull-out testing.
MATERIALS
o The materials required and preparation of specimens are same as the Lt specimens.
A few extra steps has to be taken for the preparation of pullout specimens that are
explained in the following section.
PROCEDURE FOR CASTING TEST SPECIMEN
1. Fix the specimen mould on the prestressing bed.
2. Insert the strands in the through – holes of the end brackets.
3. Place the bond breaker around the strand at the pulling end of the specimen.
4. Place the shim plates and load cell next to the end bracket at the jacking end.
5. Place the wedge and barrel loosely (not to be locked while stressing the strand)
outside the loadcell.
6. Place the ring holder next to wedge and barrel placed at the jacking end.
7. Place the steel chair resting against the end bracket at the jacking end.
8. Place the hydraulic jack next to steel chair.
9. Place the wedge and barrel at the end of hydraulic jack.
10. Place the stress adjusting system at the releasing end after adjusting the levels of
the three nuts using spirit level; leave a about 3 to 4 cm for releasing the stress
purpose.
11. Apply an initial stress of about 0.1 fpu and 0.75 fpu (for taut and stressed strands,
respectively) using the hydraulic jack with the help of pressure gauge attached with
it.

155
12. Lock the wedge and barrel placed outside of the loadcell using ring holder and
rubber hammer.
13. Monitor the load applied using the load cell indicator.
14. Prepare the concrete using the concrete mixer
15. Place the concrete in the PVC prism and cube mould (six companion cube
specimens) in one layer.
16. Compact the concrete using tamping rod (25 numbers of tamping for every 100 mm
length of prism).
17. Demould the prism and cube specimens after 24 hours.
18. Moist cure the specimens using wet sack and plastic covers for one day and three
days for taut and stresses strand specimens, respectively.
19. Test the compressive strength of concrete and transfer the stress when the concrete
is attained 60% of its target strength. Typically, for taut strand specimens, the stress
would be transferred after one day whereas, for stressed strands specimens, the
stress would be transferred after three days.
20. Cut the strands just outside of the specimens leaving 350 mm and 150 mm length
using a chop saw machine.
21. Moist cure the specimens for 28 days to attained target compressive strength.
22. White wash the surface of the specimens using plaster of paris before testing to find
observe fine cracks developing on the concrete surface during pullout test.
23. Care should be taken to have a proper leveled surface at the ends of the member
(live and free end).
TEST PROCEDURE
1. Arrange and set the DAQ system to monitor the applied load, displacement of the
actuator, and slip of the strand from the concrete.
2. Mount the pullout frame on the UTM and grip the holding rod of the frame at the
upper wedge of the machine.

156
3. Measure the geometry details of the specimen using the ruler and Vernier caliper.
4. Place the pullout specimens on the frame by inserting the strand (350 mm long
portion from the concrete surface) through the center hole of the machine.
5. Grip the strand at the bottom wedge of the machine.
6. Place a thin acrylic plate on the concrete surface at the free end of the member to
place the LVDT.
7. Place the LVDTs, one at the live end (bottom) and other one at the free end (top)
of the specimen using LVDT holders.
8. Apply the load at the displacement rate of 2 mm/min.
9. Obtain the recorded data from the DAQ system.
CALCULATIONS
1. Calculate the bond stress using the following formulation
τ = applied load
surface area of the bonded strand
2. Plot the bond stress vs slip at live end.
3. Determine the bond yield stress of the specimen.
4. Compute the bond strength as 90% of the bond yield stress from the bond stress –
slip behaviour.
5. Bond strength of stressed strands in concrete can be computed using the taut strands
by the bond yield stress method.

157
APPENDIX C – THE LOAD – SLIP RESPONSE AT LIVE AND FREE
ENDS OF THE SPECIMENS
Figure C 1 Load – slip behaviour of taut strands with le = 450 mm in fc = 43 MPa at
live end
Figure C 2 Load – slip behaviour of taut strands with le = 450 mm in fc = 62 MPa at
live end
Live end slip (mm)
0 5 10 15 20 25 30 35 40 45
Load
(kN
)
0
50
100
150
200fc43-T-S
Live end slip (mm)
0 5 10 15 20 25 30 35 40 45
Load
(kN
)
0
50
100
150
200fc62-T-S

158
Figure C 3 Load – slip behaviour of taut strands with le = 950 mm in fc = 62 MPa at
live end
Figure C 4 Load – slip behaviour of stressed strands with le = 950 mm in fc = 62 MPa at
live end
Live end slip (mm)
0 5 10 15 20 25 30 35 40 45
Load
(kN
)
0
50
100
150
200fc62-T-L
Live end slip (mm)
0 5 10 15 20 25 30 35 40 45
Lo
ad (
kN
)
0
50
100
150
200fc62-S-L

159
Figure C 5 Load – slip behaviour of taut strands with le = 450 mm in fc = 43 MPa at
free end
Free end slip (mm)
0 5 10 15 20 25 30 35 40 45
Load
(kN
)
0
50
100
150
200fc43-T-S
Free end slip (mm)
0 5 10 15 20 25 30 35 40 45
Load
(k
N)
0
50
100
150
200fc62-T-S
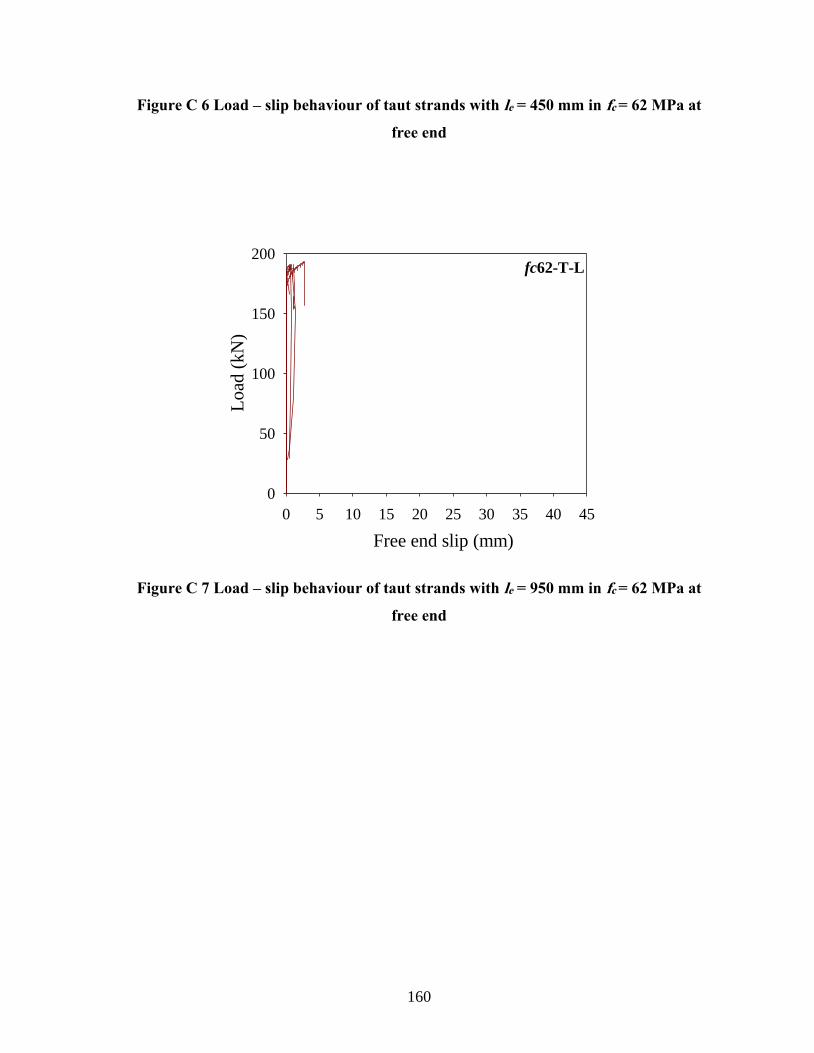
160
Figure C 6 Load – slip behaviour of taut strands with le = 450 mm in fc = 62 MPa at
free end
Figure C 7 Load – slip behaviour of taut strands with le = 950 mm in fc = 62 MPa at
free end
Free end slip (mm)
0 5 10 15 20 25 30 35 40 45
Load
(kN
)
0
50
100
150
200fc62-T-L

161
Figure C 8 Load – slip behaviour of stressed strands with le = 950 mm in fc = 62 MPa at
free end
Free end slip (mm)
0 5 10 15 20 25 30 35 40 45
Lo
ad (
kN
)
0
50
100
150
200fc62-S-L

162
APPENDIX D - THE BOND STRESS – SLIP RESPONSE AT LIVE AND
FREE ENDS OF THE SPECIMENS
Figure D 1 Bond stress – slip behaviour of taut strands with le = 450 mm in fc = 43 MPa
at live end
Figure D 2 Bond stress – slip behaviour of taut strands with le = 450 mm in fc = 62 MPa
at live end
Live end slip (mm)
0 5 10 15 20 25 30 35
Bo
nd
str
ess
(MP
a)
0
1
2
3
4
5
6
7
P
fc62 - T - S
Live end slip (mm)
0 5 10 15 20 25 30 35
Bo
nd
str
ess
(MP
a)
0
1
2
3
4
5
6
7
P
fc43 - T - S
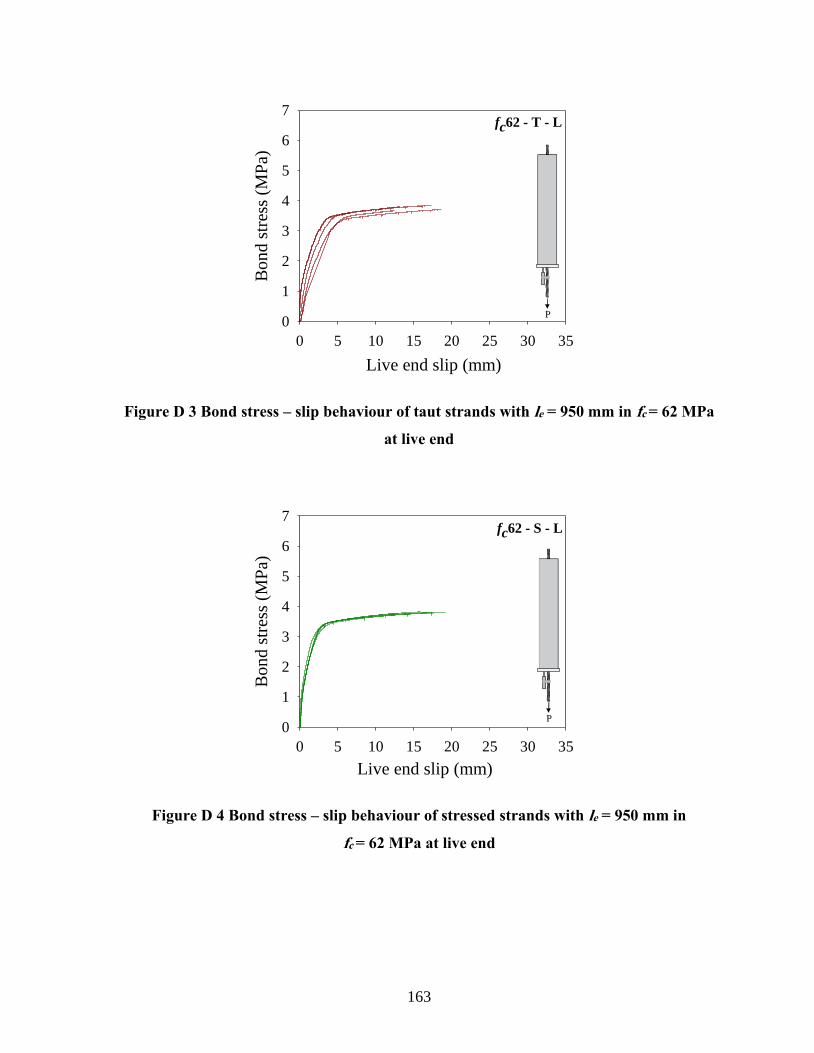
163
Figure D 3 Bond stress – slip behaviour of taut strands with le = 950 mm in fc = 62 MPa
at live end
Figure D 4 Bond stress – slip behaviour of stressed strands with le = 950 mm in
fc = 62 MPa at live end
Live end slip (mm)
0 5 10 15 20 25 30 35
Bo
nd
str
ess
(MP
a)
0
1
2
3
4
5
6
7
P
fc62 - T - L
Live end slip (mm)
0 5 10 15 20 25 30 35
Bo
nd
str
ess
(MP
a)
0
1
2
3
4
5
6
7
P
fc62 - S - L

164
Figure D 5 Bond stress – slip behaviour of taut strands with le = 450 mm in fc = 43 MPa
at free end
Figure D 6 Bond stress – slip behaviour of taut strands with le = 450 mm in fc = 62 MPa
at free end
Free end slip (mm)
0 5 10 15 20 25 30 35 40 45
Bo
nd
str
ess
(MP
a)
0
1
2
3
4
5
6
7fc43 - T - S
P
Free end slip (mm)
0 5 10 15 20 25 30 35 40 45
Bo
nd
str
ess
(MP
a)
0
1
2
3
4
5
6
7fc62 - T - S
P

165
Figure D 7 Bond stress – slip behaviour of taut strands with le = 950 mm in fc = 62 MPa
at free end
Figure D 8 Bond stress – slip behaviour of stressed strands with le = 950 mm in
fc = 62 MPa at free end
Free end slip (mm)
0 5 10 15 20 25 30 35 40 45
Bond s
tres
s (M
Pa)
0
1
2
3
4
5
6
7fc62 - S - L
P

166
LIST OF PUBLICATIONS BASED ON THIS THESIS
REFEREED JOURNALS
1. Mohandoss P., Pillai R. G., and Sengupta A.K. “Transmission length of the pretensioned
concrete system: comparison of codes and test data”, Magazine of Concrete Research,
ICE Publications, April 2018, DOI: 10.1680/jmacr.17.00553 [Journal impact factor:
1.488].
2. Mohandoss P., Pillai R. G., and Sengupta A.K. “Effect of compressive strength of
concrete on transmission length of pretensioned concrete system”
(to be re-submitted to Engineering Structures, Elsevier)
3. Mohondoss P., Pillai R. G., and Gettu R. “Determination of bond strength in
pretensioned concrete systems using 90% yield stress method”.
(Draft ready to be submitted to Materials and Structures, Springer)
INTERNATIONAL CONFERENCE PAPERS
* Indicates presenter
1. Mohandoss P.*, Pillai R.G., and Gettu R., “Effect of Prestress on the Bond strength of
Pretensioned Concrete systems”, International Conference on Advances in Construction
Materials and Systems, 3rd RAIKAR RILEM WEEK and ICACMS, December 15 – 16,
2018.
2. Mohandoss P.* and Pillai R.G., “Effect of Prestress on the Bond strength of Pretensioned
Concrete systems”, International Conference on Advances in Construction Materials and
Systems, 71st RILEM WEEK and ICACMS, September 3 - 8, 2017.
3. Mohandoss P.*, Pillai R.G., and Sengupta A. K., “Comparison of prediction models for
transmission length and shear capacity of pretensioned concrete systems”, 4th Asian
conference on Ecstasy in Concrete (ACECON), Kolkata, India, October 08-10, 2015.

167
NATIONAL CONFERENCE PAPER
* Indicates presenter
1. Mohandoss P.* and Pillai R.G, “Bond performance of pretensioned concrete system”, 10th
Structural engineering convention (SEC), Chennai, India, December 21-23, 2016.
SPECIAL PUBLICATION
1. Mohandoss P, Kompella K. S., and Pillai R. P., “Bond performance of pre-tensioned
concrete system”, Proceedings of SEC 2016, Recent advances in Structural Engineering,
Volume 1, Chapter 22, Springer publication, DOI: 10.1007/978-981-13-0362-3_22.
INTERNATIONAL CONFERENCE PRESENTATIONS
* Indicates presenter
1. Mohandoss P.*, Pillai R. G., Gettu R., and Sengupta A. K. “Assessment of the bond
strength of pretensioned strands in concrete”, Concrete Research in India, Mumbai, India,
December 14, 2018. (Poster presentation)
2. Mohandoss P.*, Pillai R. G., Gettu R., and Sengupta A. K. “Strand-Concrete Bond in
Pretensioned Concrete Systems (PTC)-Mechanisms and Laboratory Testing” the ACI 123
Concrete Research Poster Session at the Spring 2018 ACI Convention and Exposition in
Salt Lake City, UT, USA, 24 – 28th March, 2018. (Poster presentation)
3. Mohandoss P.*, Kompella S. K., Gettu N., and Pillai R. G., “A Study on the bond
performance of pre-tensioned concrete system”, International Conference on Advances in
Construction Materials and Systems, 71st RILEM WEEK and ICACMS, 3rd – 8th
September 2017. (Poster presentation)
4. Mohandoss P.*, Kompella S. K., Maheswari S. K., Nair S. A. O., and Pillai R. G., “Factors
influencing the bond behaviour of pretensioned concrete system” Gordon research
conference (GRC), Hong Kong, China, July 31st – August 8th, 2016. (Poster presentation)
5. Mohandoss P.*, Pillai R. G., Gettu R., and Sengupta A. K. “Effect of compressive strength
of concrete on transmission length of pretensioned concrete” the ACI Open Topic Session
at the Spring 2018 ACI Convention and Exposition in Salt Lake City, UT, USA, 24 – 28th
March, 2018 (Oral Presentation)

168
6. Kompella S. K.*, Mohandoss P., Gettu N., and Pillai R. G., “Enhancing the bond strength
of prestressed concrete sleepers”, Concrete Research in India, Research Scholar
Symposium, Mumbai, India, December 14 -15, 2018. (Poster presentation)
7. Kompella S. K.*, Gettu N., Mohandoss P., and Pillai R. G., “A study on the performance
of bond in pre-tensioned concrete railroad ties (sleepers)”, the concrete convention and
exposition, American concrete institute, Detroit, USA, 26-30th March, 2017. (Oral
presentation)

169
DOCTORAL COMMITTEE
CHAIRPERSON Dr. K. Ramamurthy
Professor and Head
Department of Civil Engineering
GUIDE Dr. Radhakrishna G. Pillai
Associate Professor
Department of Civil Engineering
MEMBERS Dr.Ravindra Gettu
Professor
Department of Civil Engineering
Dr. Amlan Kumar Sengupta
Professor
Department of Civil Engineering
Dr. Srinivasan Chandrasekaran
Professor
Department of Ocean Engineering

170
CURRICULUM VITAE
Name : Prabha Mohandoss
Date of birth : June 24, 1990
Educational qualifications
2011 : Bachelor of Engineering (B.E.)
Institution : Thiagarajar College of Engineering
Madurai, Tamil Nadu, India
Specialization : Civil Engineering
2013 : Master of Engineering (M.E.)
Institution : Anna University: Regional Centre
Madurai, India
Specialization : Structural Engineering
2018 : Doctor of Philosophy (Ph.D.)
Institution : Indian Institute of Technology Madras
Chennai, India
Specialization : Bond performance of steel-concrete systems
Civil Engineering