assessment of undiscovered technically recoverable oil and gas resources of the nation's
TRANSCRIPT

Introduction
This report summarizes the results of the Bureau of Ocean Energy Management (BOEM) 2011 assessment of the undiscovered oil and gas resources for the U.S. Outer Continental Shelf (OCS) (see figure 1). The OCS comprises the portion of the submerged seabed whose mineral estate is subject to Federal jurisdiction. The 2011 assessment represents a comprehensive appraisal that considered relevant data and information available as of January 1, 2009, incorporated advances in petroleum exploration and development technologies, and employed new methods of resource assessment.
This assessment provides estimates of undiscovered, technically and economically recoverable oil and natural gas resources located outside of known oil and gas fields on the OCS. It considers recent geophysical, geological, technological, and economic information and utilizes a probabilistic play-based approach to estimate the undiscovered technically recoverable resources of oil and gas for individual plays. This methodology is suitable for both conceptual plays where there is little or no specific information available, and for developed plays where there are discovered oil and gas fields and considerable information is available. After estimation, individual play results are aggregated to larger areas such as basins, planning areas, and regions. Estimates of the quantities of historical production, reserves, and future reserves appreciation are presented to provide a frame of reference. More detailed information about the geology, assessment methodology, and economics will be made available in separate national and regional assessment reports.
Commodities Assessed
Commodities assessed are crude oil, natural gas liquids (condensate), and natural gas that exist in conventional reservoirs and are producible with conventional recovery techniques. Crude oil and condensate are reported jointly as oil; associated and nonassociated gas are reported as gas. Oil volumes are reported as billions of stock tank barrels of oil (Bbo) and gas as trillion standard cubic feet of gas (Tcfg). Oil-equivalent gas is a volume of gas (associated and/or nonassociated) expressed in terms of its energy equivalence to oil (i.e., 5,620 cubic feet of gas per barrel of oil). The combined volume of oil and oil-equivalent gas resources is referred to as barrel of oil-equivalent (BOE) and is reported in billions of barrels (Bbo).
This assessment does not include potentially large quantities of hydrocarbon resources that could be recovered from known and future fields by enhanced recovery techniques. It also does not consider gas in geopressured brines, or oil and natural gas that may be present in insufficient quantities or quality (low permeability “tight” reservoirs) to be produced by conventional recovery techniques.
Estimates of undiscovered recoverable resources are presented in two categories; undiscovered technically recoverable resources (UTRR), and undiscovered economically recoverable resources (UERR). UTRR estimates are presented at 95th and 5th percentile
Washington/Oregon
NorthernCalifornia
CentralCalifornia
SouthernCalifornia
NorthAtlantic
Mid-Atlantic
SouthAtlantic
Straitsof Florida
Eastern Gulfof Mexico
Central Gulfof Mexico
Western Gulfof Mexico
BowersBasin
AleutianBasin
NavarinBasin
Chukchi Sea
Aleutian Arc
St. GeorgeBasin
ShumaginNorthAleutianBasin
KodiakGulf of Alaska
Cook Inlet
Beaufort Sea
ALASKA
Hope Basin
NortonBasin
St. Matthew-Hall
Assessment of Undiscovered Technically Recoverable Oil and Gas Resources of the Nation’s Outer Continental Shelf, 2011Using a play-based assessment methodology, the Bureau of Ocean Energy Management estimated a mean of 88.6 billion barrels of undiscovered technically recoverable oil and mean of 398.4 trillion cubic feet of undiscovered technically recoverable natural gas in the Federal Outer Continental Shelf of the United States.
Figure 1. Federal OCS Areas of the United States.
BOEM Fact Sheet RED-2011-01aNovember 2011
levels, as well as at the mean level. This range of estimates corresponds to a 95-percent probability (a 19 in 20 chance) and a 5-percent probability (a 1 in 20 chance) of there being more than those amounts present, respectively. The 95- and 5-percent probabilities are considered reasonable minimum and maximum values, and the mean is the average or expected value. UERR results are presented as price-supply curves which show the relationship of price to economically recoverable resource. Price supply curves couple oil prices with gas prices based on the current gas market. Due to fluctuations in the economic value of gas, the 2011 assessment analyzed three different BTU based price pairings between oil and gas. These pairings represent gas prices that assume a 40 percent, 60 percent and 100 percent economic value of gas relative to oil on a BTU basis.
Methodology This assessment incorporates a play-based (see list of terms) approach toward the analysis of hydrocarbon potential. A major strength of this method is that there is a strong relationship between information derived from oil and gas exploration activities and the geologic model developed by the assessment team. An extensive effort was undertaken in developing play models, delineating the geographic limits of each play, and compiling data on geologic and reservoir engineering parameters. These parameters are used in the determination of the total quantities of recoverable resources in each play. Probabilistic methods were employed to account for the inherent uncertainties associated with an assessment of undiscovered resources. Results are reported as a range of values corresponding to different probabilities of occurence.
Due to sparse data from the majority of the plays in the Alaska, Atlantic and part of the Pacific OCS Regions, analog plays were developed with a more subjective approach to cover the range of uncertainties associated with these plays. For mature areas with significant amounts of data, such as the Gulf of Mexico and southern California, plays were analyzed by combining the subjective methodology using historical trends, with a discovery based approach to account for the existing discovered pools. The economic portion of the assessment incorporates a wide range of oil and gas price points and utilizes a relationship between the cost of exploration and development and commodity prices.
Technology
Technological advances in hydrocarbon exploration and development occur on a near continuous basis, yet the nature of advancement is hard to predict and its impact difficult to estimate. Past experience indicates most technological breakthroughs occur during periods when commodity prices are high. For this assessment, recent technological advances in gathering,
processing, and interpreting seismic data contributed to the identification and delineation of geological plays and to the development of geologic parameters used to model the plays. Similarly, recent technological advances in offshore drilling and development operations were incorporated through assumptions associated with the costs of these activities. Although no attempt has been made to develop an empirical relationship between the future technological advancements and the estimated undiscovered resources, BOEM believes that future advances will significantly affect the portion of the undiscovered resources represented by estimates of UTRR, resulting in an increased percentage being classified as economically recoverable resources.
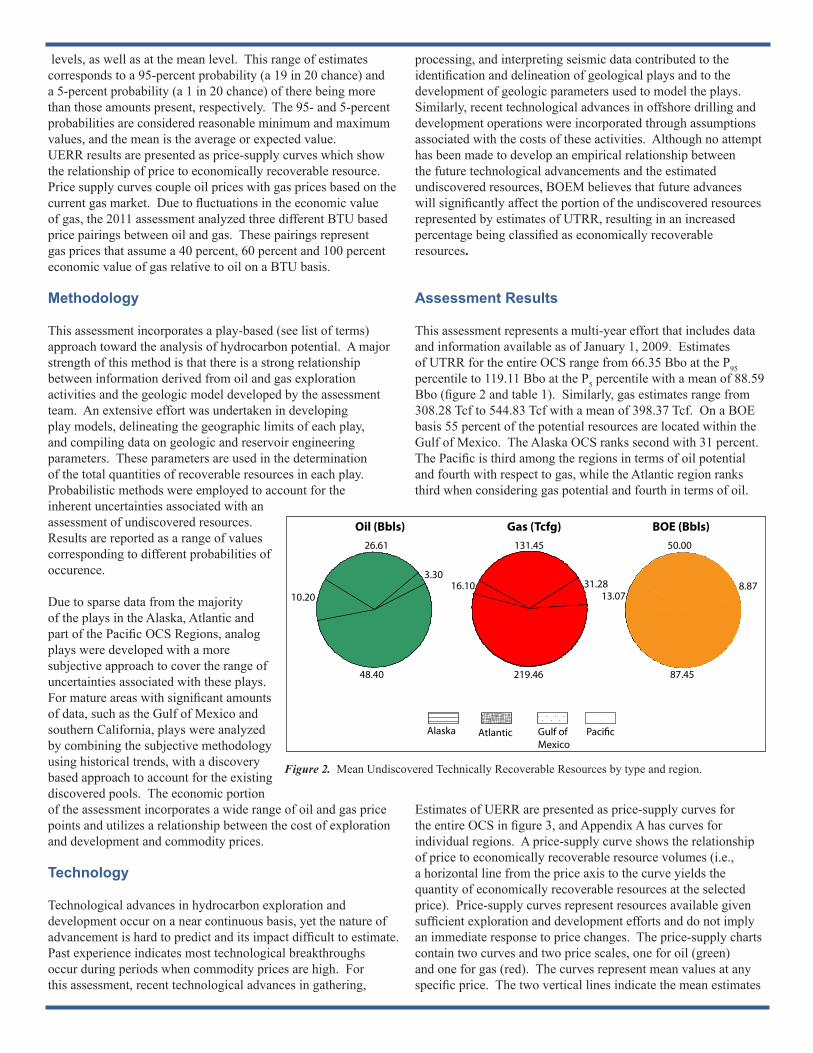
Assessment Results This assessment represents a multi-year effort that includes data and information available as of January 1, 2009. Estimates of UTRR for the entire OCS range from 66.35 Bbo at the P95 percentile to 119.11 Bbo at the P5 percentile with a mean of 88.59 Bbo (figure 2 and table 1). Similarly, gas estimates range from 308.28 Tcf to 544.83 Tcf with a mean of 398.37 Tcf. On a BOE basis 55 percent of the potential resources are located within the Gulf of Mexico. The Alaska OCS ranks second with 31 percent. The Pacific is third among the regions in terms of oil potential and fourth with respect to gas, while the Atlantic region ranks third when considering gas potential and fourth in terms of oil.
Estimates of UERR are presented as price-supply curves for the entire OCS in figure 3, and Appendix A has curves for individual regions. A price-supply curve shows the relationship of price to economically recoverable resource volumes (i.e., a horizontal line from the price axis to the curve yields the quantity of economically recoverable resources at the selected price). Price-supply curves represent resources available given sufficient exploration and development efforts and do not imply an immediate response to price changes. The price-supply charts contain two curves and two price scales, one for oil (green) and one for gas (red). The curves represent mean values at any specific price. The two vertical lines indicate the mean estimates
Paci�cAtlantic Gulf of Mexico
Alaska
26.61
3.30
48.40
10.20
131.45
16.10 31.28
219.46
8.87
87.45
13.07
Oil (Bbls) Gas (Tcfg) BOE (Bbls)50.00
Figure 2. Mean Undiscovered Technically Recoverable Resources by type and region.

of UTRR oil and gas resources for the specific area or region. At high prices, the economically recoverable resource volumes approach the technically recoverable volumes.
The oil and gas price-supply curves are not independent of each other; that is, one specific oil price cannot be used to obtain an oil resource while a separate unrelated gas price is used to obtain a gas resource. The gas price is dependent on the oil price and must be used in conjunction with the oil price on the opposite axis of the chart to calculate resources. This is because oil and gas frequently occur together and individual pool economics are calculated using the coupled pricing. A different gas price associated with the oil price would result in a different resource value than that shown on the curve. Due to fluctuations in the economic value of gas relative to oil three different BTU based price pairings for oil and gas were analysed. Table 2 presents specific price pairs associated with a 40 percent economic value of gas relative to oil.
Estimates of the total endowment, consisting of the sum of historic production, remaining reserves, future reserves appreciation, and UTRR are also presented in table 3. Mean estimates of the total endowment for the entire OCS are about 126 Bbo and 642 Tcfg, or 240 BBOE.
After more than 60 years of OCS exploration and development, 66 percent of the total endowment on a mean BOE basis remains undiscovered and is represented by the UTRR. Of the remaining, more than 20 percent of the total endowment has already been produced, and 14 percent is attributed to remaining reserves and appreciation.
Table 1. Undiscovered Technically Recoverable Resources of OCS Planning Areas.Resource values are in billion barrels of oil (Bbo), and trillion cubic of gas (Tcf). 95% indicates a 95 percent chance of at least the amount listed, 5% indicates a 5 percent chance of at least the amount listed. Only mean values are additive. Some total mean values may not equal the sum of the component values due to independent rounding. Values for Undiscovered Technically Recoverable Resource results are for both leased and unleased lands of the Federal OCS.
Region
Planning Area
Undiscovered Technically Recoverable Oil and GasResources (UTRR)
Oil (Bbo) Gas (Tcfg) BOE (Bbo)
95% Mean 5% 95% Mean 5% 95% Mean 5%Alaska OCS* 8.81 26.61 55.53 47.43 131.45 271.04 17.25 50.00 103.77
Chukchi Sea 2.32 15.38 40.08 10.32 76.77 209.53 4.15 29.04 77.36Beaufort Sea 0.41 8.22 23.24 0.65 27.64 72.18 0.53 13.14 36.08
Hope Basin 0.00 0.15 0.60 0.00 3.77 14.98 0.00 0.82 3.27Navarin Basin 0.00 0.13 0.62 0.00 1.22 5.80 0.00 0.35 1.65
North Aleutian Basin 0.02 0.75 2.50 0.40 8.62 23.28 0.09 2.29 6.65St. George Basin 0.00 0.21 0.79 0.00 2.80 11.15 0.00 0.71 2.77
Norton Basin 0.00 0.06 0.24 0.00 3.06 13.27 0.00 0.60 2.61Cook Inlet 0.06 1.01 2.85 0.03 1.20 3.48 0.06 1.23 3.47
Gulf of Alaska 0.00 0.63 2.04 0.00 4.04 13.87 0.00 1.34 4.51Shumagin 0.00 0.01 0.05 0.00 0.49 2.04 0.00 0.10 0.42
Kodiak 0.00 0.05 0.20 0.00 1.84 7.62 0.00 0.38 1.55*The Aleutian Arc, Aleutian Basin, Bowers Basin, and St. Matthew-Hall Planning Areas in the Alaska OCS Region were not evaluated in this study as their petroleum potential is negligible.
Atlantic OCS 1.30 3.30 5.58 11.11 31.28 53.62 3.28 8.87 15.12North Atlantic 0.06 1.35 3.16 1.25 9.87 21.23 0.28 3.11 6.94
Mid-Atlantic 0.06 1.42 2.85 1.01 19.36 38.94 0.24 4.87 9.78South Atlantic 0.00 0.53 1.15 0.00 2.04 5.95 0.00 0.89 2.21
Gulf of Mexico OCS 38.86 48.40 59.18 193.99 219.46 245.25 73.38 87.45 102.82Western Gulf of Mexico 8.58 12.38 17.15 57.39 69.45 81.94 18.79 24.74 31.73Central Gulf of Mexico 22.54 30.93 40.69 111.77 133.90 156.62 42.43 54.76 68.55Eastern Gulf of Mexico 3.46 5.07 6.95 12.34 16.08 20.68 5.66 7.93 10.63
Straits of Florida 0.01 0.02 0.03 0.01 0.02 0.03 0.01 0.02 0.03Pacific OCS 6.73 10.20 14.30 10.11 16.10 23.75 8.53 13.07 18.52
Washington/Oregon < 0.01 0.40 1.15 0.03 2.28 5.79 0.01 0.81 2.18Northern California 1.08 2.08 3.54 2.13 3.58 5.38 1.46 2.71 4.50
Central California 1.23 2.40 3.87 1.18 2.49 4.15 1.44 2.84 4.61Southern California 2.52 5.32 8.83 3.27 7.76 14.42 3.10 6.70 11.40
Total U.S. OCS 66.35 88.59 119.11 308.28 398.37 544.83 121.20 159.49 216.05

Table 2. Undiscovered Economically Recoverable Resources of OCS Planning Areas.Resource values are in billion barrels of oil (Bbo), and trillion cubic of gas (Tcf). Some total mean values may not equal the sum of the component values due to independent rounding. Prices are in dollars per barrel($/Bbl) for oil, and dollars per thousand cubic feet ($/Mcf) for gas. Table 2 represents a gas price adjustment of 0.4. Values for Undiscovered Economically Recoverable Resource results are for both leased and unleased lands of the Federal OCS.
Region
Planning Area
Undiscovered Economically Recoverable Oil and GasResources (UERR)
$30/Bbl$2.14/Mcf
$60/Bbl$4.27/Mcf
$90/Bbl$6.41/Mcf
$110/Bbl$7.83/Mcf
$120/Bbl$8.54/Mcf
$160/Bbl$11.39/Mcf
Oil Gas Oil Gas Oil Gas Oil Gas Oil Gas Oil Gas Alaska OCS* 1.21 1.20 11.45 19.55 17.77 42.16 20.05 57.05 20.93 64.09 22.97 85.26
Chukchi Sea 0.00 0.00 5.18 10.66 9.87 28.14 11.50 38.54 12.10 43.13 13.42 55.95Beaufort Sea 0.25 0.15 4.40 5.30 5.78 8.88 6.32 11.61 6.53 12.95 7.10 17.40
Hope Basin 0.00 0.00 0.01 0.02 0.03 0.07 0.04 0.11 0.04 0.13 0.05 0.31Navarin Basin 0.00 0.00 0.02 0.03 0.04 0.10 0.05 0.16 0.05 0.20 0.07 0.33
North Aleutian Basin 0.25 0.10 0.45 0.30 0.52 0.88 0.56 1.98 0.58 2.66 0.65 4.74St. George Basin 0.00 0.00 0.05 0.05 0.08 0.10 0.09 0.14 0.09 0.18 0.12 0.60
Norton Basin 0.00 0.00 0.00 0.00 0.00 0.00 0.00 0.00 0.00 0.00 0.01 0.25Cook Inlet 0.58 0.25 0.94 0.80 0.99 0.97 1.00 1.03 1.00 1.05 1.01 1.10
Gulf of Alaska 0.13 0.71 0.40 2.40 0.48 2.87 0.50 3.04 0.51 3.10 0.54 3.28Shumagin 0.00 0.00 0.00 0.00 0.00 0.00 0.00 0.01 0.00 0.02 0.00 0.07
Kodiak 0.00 0.00 0.00 0.00 0.01 0.13 0.02 0.47 0.02 0.67 0.03 1.22*The Aleutian Arc, Aleutian Basin, Bowers Basin, and St. Matthew-Hall Planning Areas in the Alaska OCS Region were not evaluated in this study as their petroleum potential is negligible.Atlantic OCS 1.49 7.53 1.88 12.39 2.06 15.05 2.13 16.12 2.16 16.58 2.26 17.98
North Atlantic 0.89 3.61 1.00 4.70 1.05 5.20 1.07 5.41 1.08 5.50 1.11 5.82Mid-Atlantic 0.56 3.35 0.81 6.86 0.91 8.90 0.95 9.72 0.97 10.07 1.02 11.09
South Atlantic 0.05 0.57 0.06 0.83 0.09 0.95 0.10 0.99 0.11 1.01 0.14 1.07Gulf of Mexico OCS 32.74 129.92 40.29 172.06 42.80 185.94 43.64 190.46 43.97 192.25 44.93 197.53
Western Gulf of Mexico 8.28 43.72 10.29 57.44 10.96 61.46 11.19 62.71 11.28 63.20 11.53 64.59Central Gulf of Mexico 21.17 78.09 25.95 103.99 27.52 112.77 28.04 115.61 28.25 116.74 28.85 120.05Eastern Gulf of Mexico 3.28 8.12 4.05 10.62 4.31 11.71 4.40 12.13 4.43 12.31 4.54 12.88
Straits of Florida 0.01 < 0.01 0.01 0.01 0.01 0.01 0.01 0.01 0.01 0.01 0.01 0.01Pacific OCS 4.32 5.81 6.67 8.80 7.43 9.90 7.69 10.31 7.79 10.49 8.11 11.05
Washington/Oregon 0.11 0.39 0.21 0.74 0.24 0.89 0.25 0.96 0.26 0.99 0.28 1.09Northern California 0.66 0.74 1.18 1.37 1.37 1.66 1.44 1.78 1.47 1.83 1.55 2.00
Central California 1.44 1.52 1.95 2.05 2.10 2.20 2.15 2.24 2.17 2.26 2.22 2.31Southern California 2.12 3.17 3.33 4.65 3.71 5.15 3.84 5.33 3.90 5.40 4.06 5.66
Total U.S. OCS 39.91 144.62 60.39 212.93 70.19 253.15 73.65 274.08 74.94 283.52 78.40 311.89
1.42
3.42
5.42
7.42
9.42
11.42
13.42
0 50 100 150 200 250 300 350 400 450
$20.00
$40.00
$60.00
$80.00
$100.00
$120.00
$140.00
$160.00
$180.00
$200.00
0 10 20 30 40 50 60 70 80 90 100
Gas
Pric
e
UERR Gas (TCF)
Oil
Pric
e
UERR Oil (Bbl)
Gas Market Value Adjustment 0.4
United States OCS
UTRR Oil UERR OilUTRR Gas UERR Gas
.
Figure 3. Price Supply curve of the entire United States OCS

Comparison with Previous Assessments
A comparison of 1996, 2001, 2006 and 2011 UTRR assessment results is shown on figure 4. At the mean level, the estimates of UTRR for the entire OCS represent an increase of 2.71 Bbo (about 3 percent) for oil when compared to the previous (2006) assessment and a decrease of 21.51 Tcfg for gas (about 5 percent). The majority of this change occurred in the Gulf of Mexico, where estimates for oil increased from 44.92 Bbo to 48.40 Bbo (8 percent), while estimates for gas decreased from 232.54 Tcfg to 219.46 Tcfg (6 percent). The increase in oil estimates are attributed to new deepwater discoveries while decreases in gas are attributed to declines in gas production on the shelf.
The Pacific OCS Region mean UTRR estimates of 10.20 Bbo and 16.10 Tcfg represent a slight decrease for both oil and natural gas when compared to the previous assessment. The only new activities occurring in the region since the last assessment were in the existing producing fields in the Southern California Planning Area.
The Atlantic OCS Region mean estimates of UTRR are 3.30 Bbo and 31.28 Tcfg. This represents a 14 percent decrease in oil resources and a 15 percent decrease in gas resources when compared to the previous assessment. These differences are attributed to incorporation of new information gathered from reprocessing of existing seismic, gravity and magnetic subsurface data, as well as from incorporating information from new analogs that have been discovered since the previous assessment.
Mean estimates of UTRR for the Alaska OCS Region remain relatively unchanged in comparison to the previous assessment at 26.61Bbo and 131.45 Tcfg. Since the prior assessment, industry has spent over 2 ¾ billion dollars on 728 new Arctic Alaska OCS leases. However, there has been no significant new geologic data gathered in the region and none of the leases acquired since the previous assessment have been tested.
0
20
40
60
80
100
120
5th percentile
95th percentileMean
MMS 1996
MMS 2001
MMS 2006
BOEM 2011
BOEM 2011
MMS 1996
MMS 2001
MMS 2006
0
100
200
300
400
500
600
0
Billion Barrels of Oil Trillion Cubic Feet of Gas
United States OCS
Figure 4. Comparison of UTRR from BOEMRE 1996, 2001, 2006 assessments.
Table 3. Distribution of total hydrocarbon endowment by type, region and resource category. Some total mean values may not equal the sum of the component values due to independent rounding.
Resource Category
Endowment for the U.S. OCS
Alaska Atlantic Gulf of Mexico Pacific Total
OCS
Cumulative Production
Oil (Bbo) 0.01 0 15.55 1.21 16.77Gas (Tcf) 0 0 169.57 1.62 171.19BOE (Bbo) 0.01 0 45.72 1.50 47.23
ReservesOil (Bbo) 0.03 0 9.25 1.52 10.80Gas (Tcf) 0 0 22.85 1.26 24.11BOE (Bbo) 0.03 0 13.31 1.75 15.09
Reserves Appreciation
Oil (Bbo) - - 9.52 - 9.52Gas (Tcf) - - 48.47 - 48.47BOE (Bbo) - - 18.15 - 18.15
UTRR (Mean)
Oil (Bbo) 26.61 3.30 48.40 10.20 88.59Gas (Tcf) 131.45 31.28 219.46 16.10 398.37BOE (Bbo) 50.00 8.87 87.45 13.07 159.49
Total Endowment
Oil (Bbo) 26.65 3.30 82.72 12.93 125.60Gas (Tcf) 131.45 31.28 460.35 18.98 642.16BOE (Bbo) 50.04 8.87 164.63 16.32 239.86

List of Terms
Analogous Reservoirs: as used in resources assessments, have similar rock and fluid properties, reservoir conditions (depth, temperature and pressure) and drive mechanisms, but are typically at a more advanced stage of development than the reservoir of interest and thus may provide concepts to assist in the interpretation of more limited data and estimation of recovery.
Conventionally Recoverable: Producible by natural pressure, pumping, or secondary recovery methods, such as gas or water injection.
Cumulative production: The sum of all produced volumes of oil and gas prior to a specified point in time.
Field: Area consisting of a single reservoir or multiple reservoirs all grouped on, or related to, the same general geologic structural feature and/or stratigraphic trapping condition. There may be two or more reservoirs in a field that are separated vertically by impervious strata, laterally by local geologic barriers, or by both.
Pool: A discovered or undiscovered accumulation of hydrocarbons, typically within a single stratigraphic interval.
Play: A group of pools that share a common history of hydrocarbon generation, migration, reservoir development, and entrapment.
Probability: A means of expressing an outcome on a numerical scale that ranges from impossibility to absolute certainty; the chance that a specified event will occur.
Prospect: A geologic feature having the potential for trapping and accumulating hydrocarbons; a pool or potential field.
Reserves: The quantities of hydrocarbon resources anticipated to be recovered from known accumulations from a given date forward. All reserve estimates involve some degree of uncertainty.
Reserves appreciation: The observed incremental increase through time in the estimates of reserves (proved and unproved) of an oil and/or natural gas field as a consequence of extension, revision, improved recovery, and the addition of new reservoirs.
Resources: Concentrations in the earth’s crust of naturally occurring liquid or gaseous hydrocarbons that can conceivably be discovered and recovered.
Total Endowment: All technically recoverable hydrocarbon resources of an area. Estimates of total endowment equal the sum of undiscovered technically recoverable resources, cumulative production, proved reserves, unproved reserves and reserves appreciation.
Undiscovered resources: Resources postulated, on the basis of geologic knowledge and theory, to exist outside of known fields or accumulations.
Undiscovered technically recoverable resources (UTRR): Oil and Gas that may be produced as a consequence of natural pressure, artificial lift, pressure maintenance, or other secondary recovery methods, but without any consideration of economic viability. They are primarily located outside of known fields.
Undiscovered economically recoverable resources (UERR): The portion of the undiscovered technically recoverable resources that is economically recoverable under imposed economic and technologic conditions.
Selected References
Minerals Management Service. 1996: An assessment of the undiscovered hydrocarbon potential of the Nation’s Outer Continental Shelf. OCS Report MMS 96-0034, 40 p.
Minerals Management Service. 2006: Assessment of Undiscovered Technically Recoverable Oil and Gas Resources of the Nation’s Outer Continental Shelf. MMS Fact Sheet RED-2006-01b, 6 p.
Minerals Management Service. 2006:Planning Area Resources Addendum to Assessment of Undiscovered Technically Recoverable Oil and Gas Resources of the Nation’s Outer Continental Shelf. MMS Fact Sheet RED-2006-02, 2 p.
Society of Petroleum Engineers and World Petroleum Congress. 1997: Petroleum Reserves Definitions, p. 4-7.
For Further Information
Supporting geological studies, previous assessment results, and methodologies used by BOEM for resource assessment can be found on BOEM’s web site, www.boem.gov.
For further information on this study please contact: Harold Syms, 703-787-1508 [email protected]
For detailed regional information please contact:Alaska OCS: Rance Wall, 907-334-5321 [email protected] OCS: David Cooke, 504-736-2710 [email protected] of Mexico OCS: David Cooke, 504-736-2710 [email protected] OCS: Joan Barminski, 805-389-7209 [email protected]

Appendix A
Atlantic OCS
$20.00
$40.00
$60.00
$80.00
$100.00
$120.00
$140.00
$160.00
$180.00
$200.00
0 0.5 1 1.5 2 2.5 3 3.5
Economic Oil (BSTB)
Oil
Pric
e
0 5 10 15 20 25 30 35Economic Gas (TCF)
Gas
Pri
ce
Geologic Oil Economic OilGeologic Gas Economic GasGas Market Value Adjustment 0.4
1.42
2.85
4.27
5.69
7.12
8.54
9.96
14.23
12.81
11.39
Gulf of Mexico OCS
$20.00
$40.00
$60.00
$80.00
$100.00
$120.00
$140.00
$160.00
$180.00
$200.00
0 10 20 30 40 50 60
Economic Oil (BSTB)
Oil
Pric
e
0 50 100 150 200 250Economic Gas (TCF)
Gas
Pri
ce
Geologic Oil Economic OilGeologic Gas Economic GasGas Market Value Adjustment 0.4
1.42
2.85
4.27
5.69
7.12
8.54
9.96
14.23
12.81
11.39
Pacific OCS
$20.00
$40.00
$60.00
$80.00
$100.00
$120.00
$140.00
$160.00
$180.00
$200.00
0 2 4 6 8 10 12
Economic Oil (BSTB)
Oil
Pric
e
0 2 4 6 8 10 12 14 16 18Economic Gas (TCF)
Gas
Pri
ce
Geologic Oil Economic OilGeologic Gas Economic Gas
.
Gas Market Value Adjustment 0.4
1.42
2.85
4.27
5.69
7.12
8.54
9.96
14.23
12.81
11.39
Price supply curves for the four OCS regions. Each graph shows the economic and geologic resources obtainable at various oil prices. In these graphs, oil prices are coupled with a specific gas price assuming a 40 percent economic value of gas relative to oil. This value of gas is intended to model economic conditions assuming new supplies of nautral gas for North American markets are influenced by emerging unconventional sources of natural gas (shale gas, coal bed methane, tight gas sands) onshore. Price-supply curves represent-ing a 60 percent and 100 percent economic value of gas relative to oil are presented in the detailed assessment report at www.boem.gov.
Alaska OCS
$20.00
$40.00
$60.00
$80.00
$100.00
$120.00
$140.00
$160.00
$180.00
$200.00
0 5 10 15 20 25 30
Economic Oil (BSTB)
Oil
Pric
e
1.42
2.85
4.27
5.69
7.12
8.54
9.96
14.23
12.81
11.39
0 20 40 60 80 100 120 140Economic Gas (TCF)
Gas
Pri
ce
Geologic Oil Economic OilGeologic Gas Economic GasGas Market Value Adjustment 0.4

Appendix B
0
10
20
30
40
50
60
5th percentile
95th percentile
Mean
Billion Barrels of Oil
1996
2006
2001
2011
1996
2006
2001
2011
0
50
100
150
200
250
300Trillion Cubic Feet of Gas
0
Gulf of Mexico OCS
0
5
10
15
20
25
30
5th percentile
95th percentile
Mean
Billion Barrels of Oil
1996
2006
2001
2011
1996
2006
2001
2011
0
5
10
15
20
25
30Trillion Cubic Feet of Gas
0
Paci�c OCS
0
10
20
30
40
50
60
5th percentile
95th percentile
Mean
Billion Barrels of Oil
1996
2006
2001
2011
1996
2006
2001
2011
0
50
100
150
200
250
300Trillion Cubic Feet of Gas
0
Alaska OCS
0
2
4
6
8
10
12
14
5th percentile
95th percentile
Mean
Billion Barrels of Oil
1996
2006
2001
2011
1996
2006
2001
2011
0
10
20
30
40
50
60
70Trillion Cubic Feet of Gas
0
Atlantic OCS
The graphs below show comparisons of UTRR by OCS region for assessments made in 1996, 2001, 2006, and 2011. The bars repre-sent the range between 95th and 5th percentiles for both oil and gas. Mean values are presented as a point on the range bars. These figures help illustrate how the values have changed through time. Changes in estimates reflect subsequent production, discoveries, data acquisitions, and application of new or improved exploration and production technologies.