assessment of water quality of gurara water transfer from gurara dam...
TRANSCRIPT

American Journal of Water Resources, 2014, Vol. 2, No. 4, 74-80 Available online at http://pubs.sciepub.com/ajwr/2/4/1 © Science and Education Publishing DOI:10.12691/ajwr-2-4-1
Assessment of Water Quality of Gurara Water Transfer from Gurara Dam to Lower Usuma Dam for Abuja
Water Supply, FCT, Nigeria
Okunlola I. A.1, Amadi A. N.1,*, Idris-Nda A.1, Agbasi K.1, Kolawole L. L.2
1Department of Geology, Federal University of Technology, Minna, Niger State, Nigeria 2Ladoke Akintola University of Technology, Ogbomoso, Oyo State, Nigeria
*Corresponding author: [email protected]
Received June 12, 2014; Revised July 07, 2014; Accepted August 07, 2014
Abstract Water transfer from area of excess to area of scarcity is now becoming accepted option especially for regional water supply. The Gurara water transfer provides for the transfer of raw water from Gurara dam in Kaduna state to Lower Usuma dam in Federal Capital Territory (FCT), Abuja through a 75Km conduit pipeline to augment water supply to FCT as a result of rapid population growth. The purpose of the research is to provide baseline condition in term of quality of raw water at Gurara dam before the transfer and after mixing at Lower Usuma dam. Water Quality Index (WQI) was used to assess the quality of the waters for overall, drinking, aquatic, recreation, irrigation and livestock uses. Twenty (20) water samples from both dams were collected and some at predetermined depths and subjected to physicochemical analysis using APHA standard methods of analysis for both wet and dry seasons. The overall WQI was poor. The WQI was poor for drinking and aquatic, but fair for recreation and livestock, and good for irrigation. These were due to high concentration of COD, BOD, total hardness, turbidity, Ca2+, K+, Mg2+, Cd+, Pb+ and Fe2+. The results of the analysis when compared with the Nigerian Standard for Drinking Water Quality (NIS 544:2007) and World Health Organization (WHO) permissible limits showed that the Gurara dam and Lower Usuma dam were polluted and that the water was not safe for drinking. Variations in the constituents’ concentration in terms of water depths and seasons were observed. Regular monitoring of the water quality should be carried out as the watershed is presently rural but faces potential urbanization in the coming decades.
Keywords: Water transfer, quality, contamination, surface water
Cite This Article: Okunlola I. A., Amadi A. N., Idris-Nda A., Agbasi K., and Kolawole L. L., “Assessment of Water Quality of Gurara Water Transfer from Gurara Dam to Lower Usuma Dam for Abuja Water Supply, FCT, Nigeria.” American Journal of Water Resources, vol. 2, no. 4 (2014): 74-80. doi: 10.12691/ajwr-2-4-1.
1. Introduction Water quality is important in drinking water supply,
irrigation, fish production, recreation and other purposes to which the water must have been impounded (Mustapha 2006; Amadi et al., 2012).
Water quality is determined by physical and chemical limnology of a reservoir and is controlled by climatic and geological characteristics of the drainage basin. Water quality includes all the physical, chemical and biological factors that influence beneficial use of water for various purposes to which the reservoir was built. Adeniji and Ovie, (1982) reported that temperature, turbidity, total dissolved solids and dissolved oxygen are among other primary factors that determine the quality of a water body. The limnology of the reservoir is characterized by hydrologic impact, autogenic nutrients and biological aspects (Sidnei et al., 1992). Water quality has been known to play an important role in public health,
recreational use and aquacultural capability of reservoir (Boyd, 1979, Amadi et al, 2014).
The population growth rate of Federal Capital Territory (FCT), Abuja is geometric due to relocation of the FCT from Lagos to Abuja. Consequently, people migrated from other parts of Nigeria together with relocation of businesses into the new FCT. The water demand of the region expectedly has increased tremendously, thus, putting the existing water production and supply systems under great pressure. Clearly, this calls for expansion of the systems and a concomitant need to get more water from elsewhere into the territory.
To meet the present and future water demands of the new Capital, the Federal Government of Nigeria, through the Federal Ministry of Water Resources, commissioned a study in 1998 to assess the Gurara Water Transfer Project.
Under a comprehensive framework, the investigation adopted a holistic approach by broadening the effort to identify and assess all feasible sources of water both within and outside the FCT. The effort which ranged from feasibility studies to field investigations identified the gravity based Gurara Water Transfer Project (GWTP) as
75 American Journal of Water Resources
the most suitable for the FCT. Gurara River source was found sufficient to meet, not only the 30-yr demand, but also the ultimate water requirement of the FCT, over the next 50 years (Onah, 2002).
Hence, the purpose of the research is to provide baseline condition in term of quality of raw water at Gurara dam before the transfer and after mixing at Lower Usuma dam.
2. Materials and Methods Study area description: The study area covers the
Upper Gurara Dam area falling within Latitudes 9°13’N and 9°39’ and Longitudes 7°26’E and 7°42’E, an area approximately 150km2. (Figure 1) Also considered is the pipeline route, a corridor some 60m wide and 75km in length, for pipeline conveyance of water from Upper Gurara Reservoir in Kaduna State to the existing Lower Usuma Lake in the FCT.
The prevalent climatic condition in the area is marked by two main regimes: the wet and the dry seasons. The wet (rainy) season is from April to October while the dry season starts in November to March. The average monthly
temperatures are high throughout the year. A mean annual temperature of 22°C is typical of the area. The area lies within the Guinea Savanna belt of Nigeria. The study area is drained by six rivers namely river Iku, river Gurara, river Layi, river Rudu, river Kwohu, river Tapa and by many other streams which are tributaries of the Gurara River that flows north – south dropping gently from the Kukku hill ranges (Figure 1).
Geology and hydrogeology of the area: The area is within the basement complex belonging to Precambrian to Lower Palaezoic times according to Mc curry (1976) (Figure 2). It consist mainly of granite gneiss, schist and migmatite. Groundwater occurrence in basement terrains is controlled by geologic features of depth of weathering (thickness and continuity of the regolith) and the intensity of fracturing.
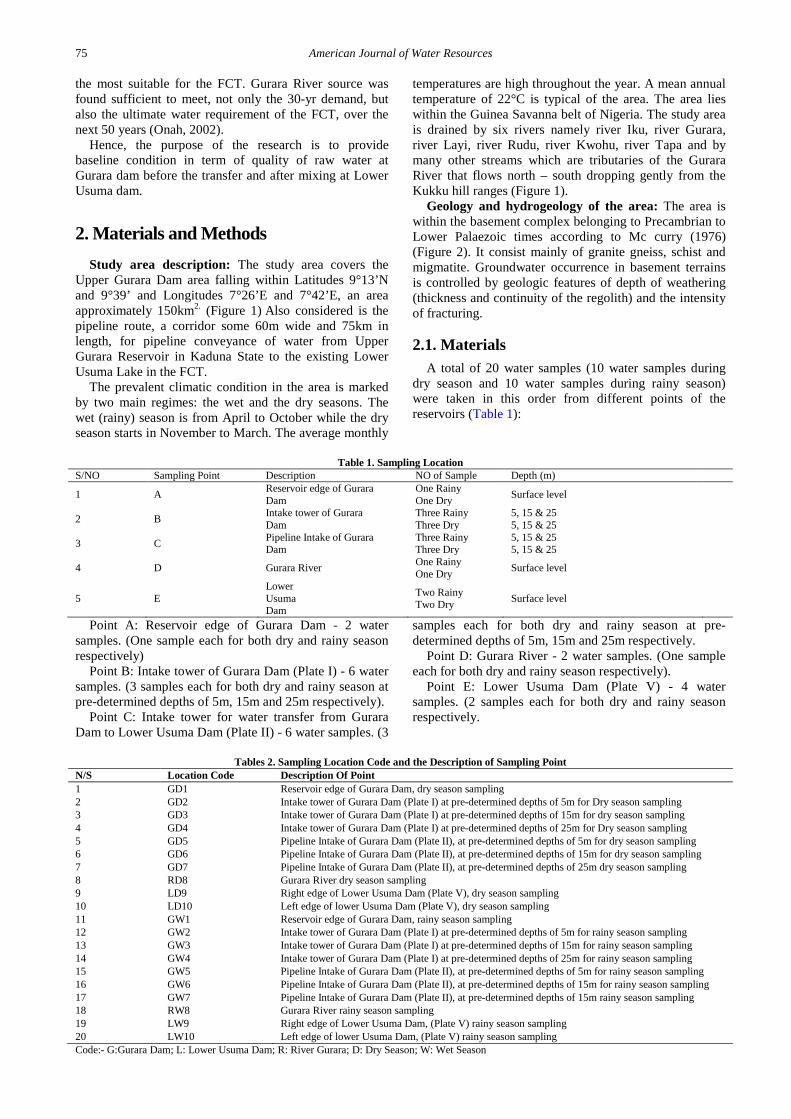
2.1. Materials A total of 20 water samples (10 water samples during
dry season and 10 water samples during rainy season) were taken in this order from different points of the reservoirs (Table 1):
Table 1. Sampling Location S/NO Sampling Point Description NO of Sample Depth (m)
1 A Reservoir edge of Gurara Dam
One Rainy One Dry Surface level
2 B Intake tower of Gurara Dam
Three Rainy Three Dry
5, 15 & 25 5, 15 & 25
3 C Pipeline Intake of Gurara Dam
Three Rainy Three Dry
5, 15 & 25 5, 15 & 25
4 D Gurara River One Rainy One Dry Surface level
5 E Lower Usuma Dam
Two Rainy Two Dry Surface level
Point A: Reservoir edge of Gurara Dam - 2 water samples. (One sample each for both dry and rainy season respectively)
Point B: Intake tower of Gurara Dam (Plate I) - 6 water samples. (3 samples each for both dry and rainy season at pre-determined depths of 5m, 15m and 25m respectively).
Point C: Intake tower for water transfer from Gurara Dam to Lower Usuma Dam (Plate II) - 6 water samples. (3
samples each for both dry and rainy season at pre-determined depths of 5m, 15m and 25m respectively.
Point D: Gurara River - 2 water samples. (One sample each for both dry and rainy season respectively).
Point E: Lower Usuma Dam (Plate V) - 4 water samples. (2 samples each for both dry and rainy season respectively.
Tables 2. Sampling Location Code and the Description of Sampling Point N/S Location Code Description Of Point 1 GD1 Reservoir edge of Gurara Dam, dry season sampling 2 GD2 Intake tower of Gurara Dam (Plate I) at pre-determined depths of 5m for Dry season sampling 3 GD3 Intake tower of Gurara Dam (Plate I) at pre-determined depths of 15m for dry season sampling 4 GD4 Intake tower of Gurara Dam (Plate I) at pre-determined depths of 25m for Dry season sampling 5 GD5 Pipeline Intake of Gurara Dam (Plate II), at pre-determined depths of 5m for dry season sampling 6 GD6 Pipeline Intake of Gurara Dam (Plate II), at pre-determined depths of 15m for dry season sampling 7 GD7 Pipeline Intake of Gurara Dam (Plate II), at pre-determined depths of 25m dry season sampling 8 RD8 Gurara River dry season sampling 9 LD9 Right edge of Lower Usuma Dam (Plate V), dry season sampling 10 LD10 Left edge of lower Usuma Dam (Plate V), dry season sampling 11 GW1 Reservoir edge of Gurara Dam, rainy season sampling 12 GW2 Intake tower of Gurara Dam (Plate I) at pre-determined depths of 5m for rainy season sampling 13 GW3 Intake tower of Gurara Dam (Plate I) at pre-determined depths of 15m for rainy season sampling 14 GW4 Intake tower of Gurara Dam (Plate I) at pre-determined depths of 25m for rainy season sampling 15 GW5 Pipeline Intake of Gurara Dam (Plate II), at pre-determined depths of 5m for rainy season sampling 16 GW6 Pipeline Intake of Gurara Dam (Plate II), at pre-determined depths of 15m for rainy season sampling 17 GW7 Pipeline Intake of Gurara Dam (Plate II), at pre-determined depths of 15m rainy season sampling 18 RW8 Gurara River rainy season sampling 19 LW9 Right edge of Lower Usuma Dam, (Plate V) rainy season sampling 20 LW10 Left edge of lower Usuma Dam, (Plate V) rainy season sampling Code:- G:Gurara Dam; L: Lower Usuma Dam; R: River Gurara; D: Dry Season; W: Wet Season

American Journal of Water Resources 76
With the aid of special water sample grabber, the samplings were done during the peak of wet season (July) and dry season (March) in order to capture the effect of seasonal variations. All the samples were collected in 1.5 litre plastic bottles which were thoroughly rinsed with the waters to be sampled, well labeled then wrapped in black polythene bags, before taken to laboratory in ice packed cooler on the same day the sampling was done for analysis.
Laboratory analysis: Collected water samples were subjected to chemical constituents and bacteriological analysis in the laboratory while the physical parameters were determined in-situ. The constituents analyzed in the laboratory using standard method of analysis of Association of Official Analytical Chemists (AOAC) international 17th edition include; Ca2+, Mg2+, K+, Na+ , Cd+ , Pb+, Fe2+, NO3, HCO3
-, Cl-, SO42-, CO3
-, COD, BOD, Ecoil and total hardness.
Statistical analysis: The statistical analysis was done for bar chart using excel.
Water quality index was calculated for overall, drinking, aquatic, recreation, irrigation, and livestock using CWQI 1.0.
Calculation of WQI: The Water Quality Index (WQI) was calculated using a mathematical description of WQI user – friendly program that runs on Excel and calculates index value based on information input to calculate the water quality index, the scale and bar which helps to estimate an overall quality of the water body as well as the rank of water quality relating to each particular uses based on the values of water quality parameters. It expresses the overall water quality at a certain location and time based on several water quality parameters and uses e.g. drinking, aquatic, recreation, irrigation and livestock etc. (Renee Paterson, 2005).
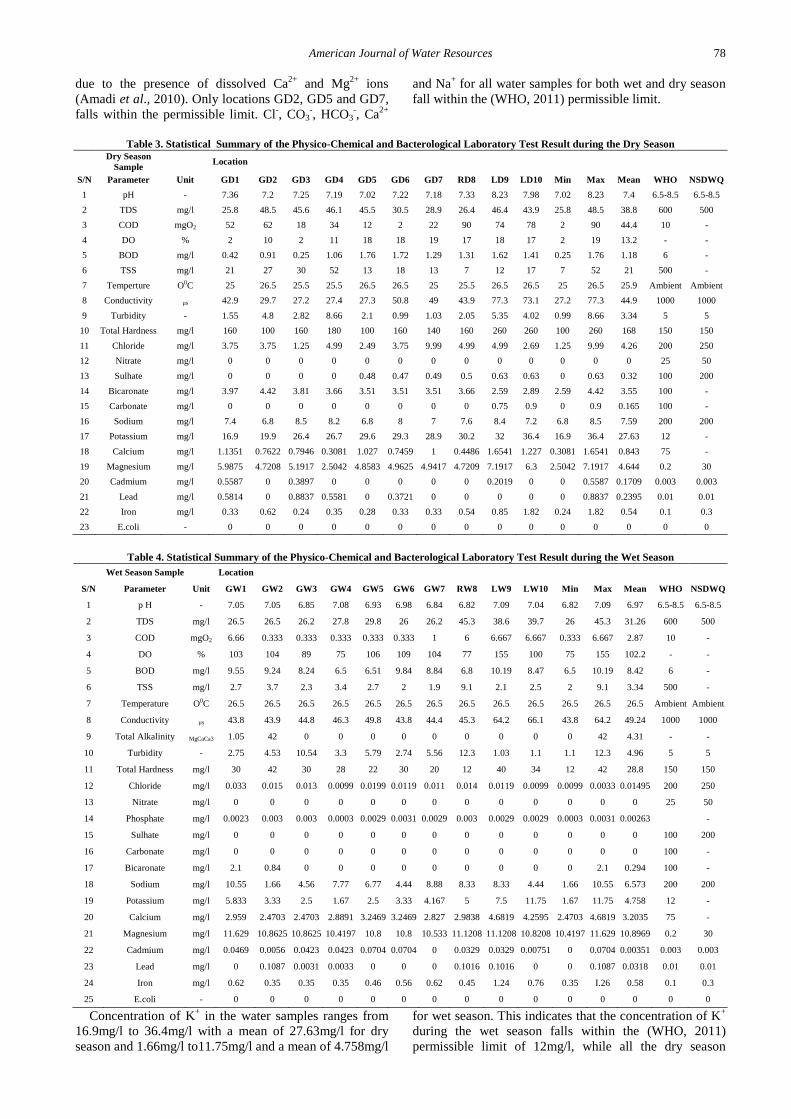
3. Results and Discussion The statistical summary of the analyzed parameters are
contained in Table 3 and Table 4. The pH values for dry season samples range from 7.02 – 8.23 while the wet season recorded 6.82 – 7.09 with mean values of 7.4 and 6.97 respectively. The pH of an aquatic ecosystem is important because it is closely linked to biological productivity. pH values between 6.5 and 8.5 usually indicate good water quality and this range is typical of most major drainage basins of the world (Genevieve M. C, and James P. N. 2006) and the permissible levels of WHO and NDWQS is within this range. The highest pH values of 7.98 and 8.23 (LD10, LD9) were recorded during the dry season and at the surface sampling points, hence it could be concluded that lowest pH values are associated with depth of the dam.
Biochemical Oxygen Demand (BOD) and Chemical Oxygen Demand (COD) are two common measures of water quality that reflect the degree of organic matter pollution of a water body (Genevieve M. C, and James P. N. 2006). The BOD values of between 0.25 and 1.76 in the dry season and mean of 1.18 are low and indicative of high dissolved oxygen concentrations. The wet season values of 6.5 – 10.19 and mean of 8.42 are high and indicative of low dissolved oxygen concentrations. WHO permissible level is 6. COD is a measure of the oxygen equivalent of the organic matter in a water sample that is susceptible to oxidation by a strong chemical oxidant, such as dichromate (Chapman, 1996). The COD mean value of 44.4 was far above the WHO threshold of 6.0 during the dry season but fell below this value for the wet season with men value of 2.87.
Figure 1. Location Map of the Project Area
The Total Dissolved Solids (TDS) values ranges from 26mg/l – 45.3mg/l in the wet season and 25.8mg/l – 48.5mg/l in dry season, while the turbidity value obtained ranges from 1.1 NTU - 12 NTU in the rainy season and 0.99 NTU - 8.66 NTU in dry season. GD4 and LD9
turbidity values are 8.66 and 5.35 respectively for dry season while GW3, GW5, GW7 and RW8 turbidity values are 10.5 NTU, 5 NTU, 9 NTU, 5.56 NTU and 12.3 NTU respectively as against the maximum permissible limit of 5 NTU by the (NSDWQ, 2007) and (WHO, 2011). It also

77 American Journal of Water Resources
indicates that the water is more turbid in the rainy season than dry season. This could be attributed to the presence of organic matter pollution, other effluents, run-off with high suspended particles and heavy rainfall (Chapman,
1996). However, the TDS levels for all samples are below the maximum permissible limit of 600mg/l (NSDWQ, 2007) and (WHO, 2011; Nwankwoala et al., 2011).
Figure 2. Geological Map of Part of Upper Gurara Dam and Lower Usuma (Study Area)
Figure 3. The Water Quality Index values for Overall, Drinking, Aquatic, Recreation, Irrigation and Livestoc
The electrical conductivity value obtained shows that the lower Usuma Dam have value higher than that of the Gurara dam for both wet and dry season (Table 3 & Table 4). This indicates that the Lower Usuma Dam is more contaminated than the Gurara dam, since electrical conductivity is an indicator of how salt-free, ion-free or impurity free a water sample is (Aktar et al., 2010). The electrical conductivity values ranges from 27.2mg/l - 77.3mg/l, with a mean of 44.9 in the dry season, and 43mg/l – 64.2mg/l with a mean of 4.96mg/l in the wet
season and are all within the permissible limit of 1000mg/l (NSDWQ, 2007) and (WHO,2011).
The total hardness value obtained for wet season indicates that all the samples are within the permissible limit of (NSDWQ, 2007) and (WHO, 2011), while the values obtained in the dry season indicates that they are above the permissible limit of 150mg/l (NSDWQ, 2007) and (WHO, 2011). According to Hardness Classification of Water by Sawyer and McCarty quoted in Todd and Mays (2005), the water is classified as hard. This might be
American Journal of Water Resources 78
due to the presence of dissolved Ca2+ and Mg2+ ions (Amadi et al., 2010). Only locations GD2, GD5 and GD7, falls within the permissible limit. Cl-, CO3
-, HCO3-, Ca2+
and Na+ for all water samples for both wet and dry season fall within the (WHO, 2011) permissible limit.
Table 3. Statistical Summary of the Physico-Chemical and Bacterological Laboratory Test Result during the Dry Season
Dry Season
Sample Location S/N Parameter Unit GD1 GD2 GD3 GD4 GD5 GD6 GD7 RD8 LD9 LD10 Min Max Mean WHO NSDWQ
1 pH - 7.36 7.2 7.25 7.19 7.02 7.22 7.18 7.33 8.23 7.98 7.02 8.23 7.4 6.5-8.5 6.5-8.5 2 TDS mg/l 25.8 48.5 45.6 46.1 45.5 30.5 28.9 26.4 46.4 43.9 25.8 48.5 38.8 600 500 3 COD mgO2 52 62 18 34 12 2 22 90 74 78 2 90 44.4 10 - 4 DO % 2 10 2 11 18 18 19 17 18 17 2 19 13.2 - - 5 BOD mg/l 0.42 0.91 0.25 1.06 1.76 1.72 1.29 1.31 1.62 1.41 0.25 1.76 1.18 6 - 6 TSS mg/l 21 27 30 52 13 18 13 7 12 17 7 52 21 500 - 7 Temperture O0C 25 26.5 25.5 25.5 26.5 26.5 25 25.5 26.5 26.5 25 26.5 25.9 Ambient Ambient 8 Conductivity µs 42.9 29.7 27.2 27.4 27.3 50.8 49 43.9 77.3 73.1 27.2 77.3 44.9 1000 1000 9 Turbidity - 1.55 4.8 2.82 8.66 2.1 0.99 1.03 2.05 5.35 4.02 0.99 8.66 3.34 5 5
10 Total Hardness mg/l 160 100 160 180 100 160 140 160 260 260 100 260 168 150 150 11 Chloride mg/l 3.75 3.75 1.25 4.99 2.49 3.75 9.99 4.99 4.99 2.69 1.25 9.99 4.26 200 250 12 Nitrate mg/l 0 0 0 0 0 0 0 0 0 0 0 0 0 25 50 13 Sulhate mg/l 0 0 0 0 0.48 0.47 0.49 0.5 0.63 0.63 0 0.63 0.32 100 200 14 Bicaronate mg/l 3.97 4.42 3.81 3.66 3.51 3.51 3.51 3.66 2.59 2.89 2.59 4.42 3.55 100 - 15 Carbonate mg/l 0 0 0 0 0 0 0 0 0.75 0.9 0 0.9 0.165 100 - 16 Sodium mg/l 7.4 6.8 8.5 8.2 6.8 8 7 7.6 8.4 7.2 6.8 8.5 7.59 200 200 17 Potassium mg/l 16.9 19.9 26.4 26.7 29.6 29.3 28.9 30.2 32 36.4 16.9 36.4 27.63 12 - 18 Calcium mg/l 1.1351 0.7622 0.7946 0.3081 1.027 0.7459 1 0.4486 1.6541 1.227 0.3081 1.6541 0.843 75 - 19 Magnesium mg/l 5.9875 4.7208 5.1917 2.5042 4.8583 4.9625 4.9417 4.7209 7.1917 6.3 2.5042 7.1917 4.644 0.2 30 20 Cadmium mg/l 0.5587 0 0.3897 0 0 0 0 0 0.2019 0 0 0.5587 0.1709 0.003 0.003 21 Lead mg/l 0.5814 0 0.8837 0.5581 0 0.3721 0 0 0 0 0 0.8837 0.2395 0.01 0.01 22 Iron mg/l 0.33 0.62 0.24 0.35 0.28 0.33 0.33 0.54 0.85 1.82 0.24 1.82 0.54 0.1 0.3 23 E.coli - 0 0 0 0 0 0 0 0 0 0 0 0 0 0 0
Table 4. Statistical Summary of the Physico-Chemical and Bacterological Laboratory Test Result during the Wet Season
Wet Season Sample Location S/N Parameter Unit GW1 GW2 GW3 GW4 GW5 GW6 GW7 RW8 LW9 LW10 Min Max Mean WHO NSDWQ
1 p H - 7.05 7.05 6.85 7.08 6.93 6.98 6.84 6.82 7.09 7.04 6.82 7.09 6.97 6.5-8.5 6.5-8.5
2 TDS mg/l 26.5 26.5 26.2 27.8 29.8 26 26.2 45.3 38.6 39.7 26 45.3 31.26 600 500
3 COD mgO2 6.66 0.333 0.333 0.333 0.333 0.333 1 6 6.667 6.667 0.333 6.667 2.87 10 -
4 DO % 103 104 89 75 106 109 104 77 155 100 75 155 102.2 - -
5 BOD mg/l 9.55 9.24 8.24 6.5 6.51 9.84 8.84 6.8 10.19 8.47 6.5 10.19 8.42 6 -
6 TSS mg/l 2.7 3.7 2.3 3.4 2.7 2 1.9 9.1 2.1 2.5 2 9.1 3.34 500 -
7 Temperature O0C 26.5 26.5 26.5 26.5 26.5 26.5 26.5 26.5 26.5 26.5 26.5 26.5 26.5 Ambient Ambient
8 Conductivity µs 43.8 43.9 44.8 46.3 49.8 43.8 44.4 45.3 64.2 66.1 43.8 64.2 49.24 1000 1000
9 Total Alkalinity MgCaCa3 1.05 42 0 0 0 0 0 0 0 0 0 42 4.31 - -
10 Turbidity - 2.75 4.53 10.54 3.3 5.79 2.74 5.56 12.3 1.03 1.1 1.1 12.3 4.96 5 5
11 Total Hardness mg/l 30 42 30 28 22 30 20 12 40 34 12 42 28.8 150 150
12 Chloride mg/l 0.033 0.015 0.013 0.0099 0.0199 0.0119 0.011 0.014 0.0119 0.0099 0.0099 0.0033 0.01495 200 250
13 Nitrate mg/l 0 0 0 0 0 0 0 0 0 0 0 0 0 25 50
14 Phosphate mg/l 0.0023 0.003 0.003 0.0003 0.0029 0.0031 0.0029 0.003 0.0029 0.0029 0.0003 0.0031 0.00263 -
15 Sulhate mg/l 0 0 0 0 0 0 0 0 0 0 0 0 0 100 200
16 Carbonate mg/l 0 0 0 0 0 0 0 0 0 0 0 0 0 100 -
17 Bicaronate mg/l 2.1 0.84 0 0 0 0 0 0 0 0 0 2.1 0.294 100 -
18 Sodium mg/l 10.55 1.66 4.56 7.77 6.77 4.44 8.88 8.33 8.33 4.44 1.66 10.55 6.573 200 200
19 Potassium mg/l 5.833 3.33 2.5 1.67 2.5 3.33 4.167 5 7.5 11.75 1.67 11.75 4.758 12 -
20 Calcium mg/l 2.959 2.4703 2.4703 2.8891 3.2469 3.2469 2.827 2.9838 4.6819 4.2595 2.4703 4.6819 3.2035 75 -
21 Magnesium mg/l 11.629 10.8625 10.8625 10.4197 10.8 10.8 10.533 11.1208 11.1208 10.8208 10.4197 11.629 10.8969 0.2 30
22 Cadmium mg/l 0.0469 0.0056 0.0423 0.0423 0.0704 0.0704 0 0.0329 0.0329 0.00751 0 0.0704 0.00351 0.003 0.003
23 Lead mg/l 0 0.1087 0.0031 0.0033 0 0 0 0.1016 0.1016 0 0 0.1087 0.0318 0.01 0.01
24 Iron mg/l 0.62 0.35 0.35 0.35 0.46 0.56 0.62 0.45 1.24 0.76 0.35 I.26 0.58 0.1 0.3
25 E.coli - 0 0 0 0 0 0 0 0 0 0 0 0 0 0 0
Concentration of K+ in the water samples ranges from 16.9mg/l to 36.4mg/l with a mean of 27.63mg/l for dry season and 1.66mg/l to11.75mg/l and a mean of 4.758mg/l
for wet season. This indicates that the concentration of K+
during the wet season falls within the (WHO, 2011) permissible limit of 12mg/l, while all the dry season

79 American Journal of Water Resources
samples are above the (WHO, 2011) permissible limit. This could be attributed to the run-off with high suspended particles and heavy rainfall (Chapman, 1996; Amadi et al, 2013; Nwankwoala, 2013; Amadi et al., 2012).
All the water samples for both dry and wet season have Mg2+ levels that are above the specified NSDWQ (2007) standard maximum permissible limit of 0.2mg/l. This might accounts for the hardness of the water and could be attributed to bedrock dissolution and chemical weathering of ferromagnesian mineral (Amadi et al., 2010; Alao et al., 2013). The Mg2+ values were generally higher in wet season than in the dry season.
The maximum permissible limit for Cd+ according to both (NSDWQ, 2007) and (WHO, 2011) standards is 0.003mg/l and the result above clearly shows that the wet season water sample which ranges from 0mg/l to 0.07mg/l and a mean value of 0.0035mg/l and dry season water samples ranges from 0mg/l to 0.558mg/l and a mean value of 0.17mg/l indicating that all the wet season samples are above the permissible limit of 0.003mg/l expect for location GW7. The dry season samples locations GD1 and GD2 are above the permissible limit while all other locations are within the permissible limit. This might be as a result of wastewater and diffuse pollution caused by contamination from fertilizers transported by from other water bodies flowing into the reservoir from the catchment areas (WHO, 2011).
The maximum permissible limit for lead according to both (NSDWQ, 2007) and (WHO, 2011) standards is 0.01mg/l and the result indicate that the wet season water samples in location (GR2, RW8 and LW9) and for dry season water samples (GR2, RR8 and LW9) fall above the permissible limit for both (NSDWQ, 2007) and (WHO, 2011) standards. It might be attributed to production of lead-acid batteries, solder, alloys and lubricating agents in petrol found in surface water through surface water flow and runoff from other rivers, streams and lakes in catchment area (Taiwo, 2010; Amadi et al., 2014). All other water samples for both dry and rainy season are within the recommended standards.
Fe2+ concentration in the water samples are generally high for both wet and dry season and are above the permissible limit of 0.30mg/l (WHO, 2011).Water samples in location GD3 and GD5 during the dry season have values of 0.024mg/l and 0.28mg/l which are within the (NSDWQ, 2007) recommended standard of 0.3mg/l while all other locations are above the (NSDWQ, 2007) recommended standard. This might be as a result rainwater dissolving elements from rock formation as it infiltrates the lateritic soil and water bodies (Amadi et al., 2010).
4. Conclusion The study was to assess the water quality of the Gurara
Water Transfer to FCT for the purpose of providing baseline condition in term of quality of raw water at Gurara dam before the transfer and after mixing at Lower Usuma dam and the following conclusions was derived: • The lowest pH values are associated with depth of
reservoir but within the WHO 2011, NSDWQ 2007 standard.
• High BOD above WHO (2011) limit during the wet season than in dry season as such dissolved oxygen concentrations is low during wet season
• High COD above WHO (2011) limit during the dry season but below the threshold in the wet season.
• High DO above WHO (2011) limit during the wet season than in dry season.
• Turbidity is irrespective of seasons above the maximum permissible limits (WHO 2011, NSDWQ 2007).
• K+ values were generally higher in dry season and above the maximum permissible limits (WHO, 2011, NSDWQ, 2007).
• EC values of mixed water in Lower Usuma dam are higher for both seasons but within the permissible levels (WHO, 2011, NSDWQ, 2007).
• Mg2+ values were generally higher in both seasons than the permissible level (NSDWQ, 2007).
• Cd+ values for wet season are above the permissible limits except for a single location (GR7).
• Total hardness above the maximum permissible limits (WHO, 2011, NSDWQ, 2007) during dry season but below limits during the wet season.
• Pb+ values were generally higher in wet season than in the dry season.
• Fe2+ values were generally above the maximum permissible limits (WHO, 2011, NSDWQ, 2007) for both seasons.
The dilution effect was visible as most of the parameters recorded higher values during the dry season with the exception of Ca2+, Mg2+ and Fe2+ in some locations.
The water quality index (WQI) program that provides a mathematical framework for assessing ambient water quality conditions relative to water quality objectives was also used to express the overall water quality poor at 32%, drinking which was poor at 35%, aquatic was good at 80%, recreation was fair at 72%, irrigation was good at 87% and livestock was fair at 67% when compared with (NSDWQ, 2007) and WHO, 2011) as a permissible limits.
References [1] Adeniji, H.A., & Ovie, S.I. (1982). Study and appraisal of the
water quality of the Asa, and Niger Rivers: National Institute for Freshwater Fisheries Research (NIFFR), Annual Report, 15-20.
[2] Aktar, I.S., Ogundele, F.O. & Soladoye, O. (2010). Characterisation by factor analysis of chemical facies water in the coastal plain sand aquifers of Lagos, S.W, Nigeria. International Journal Academic Research. 5, 256-260.
[3] Alao David A., Amadi Akobundu N., Alabi Adeoye D. and Aminu Tukur, (2014). Studies on the Quality of Brine from Selected Sites in Lafia-Obi Local Government Area of Nasarawa State, North-Central Nigeria. American Chemical Science Journal, 4(4), 443-456.
[4] Amadi, A.N., Olasehinde P.I., Okosun, E.A. & Yisa, J. (2010). Assessment of the Water Quality Index of Otamiri and Oramiriukwa Rivers. Physics International, 1(2), 116-123.
[5] Amadi, A. N., Nwankwoala, H. O., Olasehinde, P. I., Okoye, N. O., Okunlola, I. A. and Alkali, Y. B., (2012). Investigation of aquifer quality in Bonny Island, Eastern Niger Delta, Nigeria using geophysical and geochemical techniques. Journal of Emerging Trends in Engineering and Applied Sciences, 3(1), 180-184.
[6] Amadi A. N., Dan-Hassan M. A., Okoye N. O., Ejiofor I. C. and Aminu Tukur, (2013). Studies on Pollution Hazards of Shallow

American Journal of Water Resources 80
Hand-Dug Wells in Erena and Environs, North-Central Nigeria. Environment and Natural Resources Research, 3(2), 69-77.
[7] Amadi, A. N., Okoye, N. O., Alabi, A. D., Aminu Tukur and Angwa, E. M., (2014). Quality assessment of soil and groundwater near Kaduna Refinery and Petrochemical Company, Northwest Nigeria. Journal of Scientific Research & Reports, 3(6), 884-893.
[8] APHA, (2005). American Water Works Association and Water Environment Federation, “Standard Methods for the Examination of Water and Wastewater” (21st Ed). American Public Health Association, Washington DC, USA.
[9] Begum, A., Ramaiah, M., Khan, H. I. & Veena, K. (2009). Heavy metal pollution and chemical profile of Cauvery River Water. E-Journal of Chemistry, 6 (1), 47-52.
[10] Boyd, C.E. (1979). Water quality in warm water fish ponds. Craftmaster Auburn, Alabama, USA, Printers Inc.
[11] Chapman, D.V. (ed. 1996). “Water Quality Assessments: A guide to use Biota, Sediments and Water” Environmental Monitoring. Second Edition. UNESCO, WHO, and UNEP. E & FN Spon, London UK.
[12] Genevieve M. C, James P. N. (2006). Water quality for ecosystem and human health, United Nations Environmental Programme Global Environment Monitoring System/Water Programme. http://www.gemswater.org.
[13] Mustapha, M.K. (2006). Effects of human activities on the biodiversity of a tropical man- made lake. Nigerian Journal of Pure and Applied Sciences, 21: 1960-1968.
[14] NSDWQ, (2007). Nigerian Standard for Drinking Water. Nigerian Industrial Standard, NIS: 554, pp13-14.
[15] Nwankwoala, H.O. (2013). Evaluation of Hydrochemical Characteristics of Groundwater in Port Harcourt, Nigeria. Unpublished Ph.D Dissertation, University of Port Harcourt, Nigeria, 294pp.
[16] Nwankwoala, H.O; Udom, G.J and Ugwu, S.A. (2011). Some heavy metal investigations in groundwater sources in Yenegoa, Bayelsa State, Nigeria. Journal of Applied Technology in Environmental Sanitation Vol. 1 (2): 163-170.
[17] Onah, F.O. (2007). Environmental Impact Assessment (EIA) of Gurara Water Transfer Project Report, 95p.
[18] Otukune, T.V. & Biukwu C.O. (2005). Impact of refinery influent on physico-chemical properties of a water body in Niger Delta. Journals for Applied Ecological and Environmental Research, 3, 61-72.
[19] Sidnei, M.T., Fakio, A.L.T., Maria, C.R., Francises, A.E. & Adaunto, F. (1992). Seasonal variation of some limnological factors of Lagoa do Guarana, a Varzea lake of the Rio Paranana State of Mato Groso do Sul, Brazil. Hydrobiology. 25 (4), 269-276.
[20] Taiwo, A. M. (2011). Composting as a sustainable waste management technique in developing countries. Journal of Environmental Science and Technology, 4, 93-102.
[21] Todd D. K and Mays L. W (2005), Groundwater Hydrology (3rd Edition), John Wiley & Sons Inc. New York USA, 652 pp.
[22] WHO (2011). World Health Organisation, Guidelines for Drinking Water-Quality (4th Edition), Geneva, Switzerland.
Plate I. Over View of the Gurara Dam Intake with Tower at Extreme Left
Plate II. Bottom Outlet Structure of Gurara Dam linking transfer pipe to Lower Usuma Dam
Plate III. The 75 Km Long, 3m Inner Diameter Transfer Pipes
Plate IV. The Outlet Structure where the Water from Gurara Dam enters the Lower Usuma Dam during full discharge
Plate V. Upstream of the Lower Usuma Dam showing the Dam Embankment, Reservoir and Intake Tower Structure