assessment of wind turbine component loads … of wind turbine component loads under yaw-offset...
TRANSCRIPT

Assessment of Wind Turbine Component Loads Under Yaw-OffsetConditionsRick Damiani1, Scott Dana1, Jennifer Annoni1, Paul Fleming1, Jason Roadman1, Jeroen van Dam1, andKatherine Dykes1
1National Renewable Energy Laboratory, Golden, CO, 80401 - USA
Correspondence to: Rick Damiani ([email protected])
Abstract. Renewed interest in yaw control for wind turbine and power plants for wake redirection and load mitigation demands
a clear understanding of the effects of running with skewed inflow. In this paper, we investigate the physics of yawed operations,
building up the complexity from a simplified analytical treatment to more complex aeroelastic simulations. Results in terms
of damage equivalent loads (DELs) and extreme loads under operating, misaligned conditions are compared to data collected
from an instrumented, utility-scale wind turbine. The analysis shows that multiple factors are responsible for the DELs of5
the various components, and that airfoil aerodynamics, elastic characteristics of the rotor, and turbulence intensities are the
primary drivers. Both fatigue and extreme loads are observed to have relatively complex trends with yaw offsets, which can
change depending on the wind-speed regime. Good agreement is found between predicted and measured trends for both fatigue
and ultimate loads.
1 Introduction10
Despite numerous studies on the skewed inflow and wake of wind turbines (e.g., Hand et al., 2001; Schepers, 2004, 2012;
Schreck and Schepers, 2014; Fleming et al., 2015), uncertainties still remain on the loading effects experienced by their
mechanical components under misaligned operation. Whereas new interest is directed at maximizing plant power performance
via wake steering and yaw control (e.g., Gebraad et al., 2016), understanding and managing their effects on operation and
maintenance (O&M) costs is critical for the success of the strategy. For this reason, a clear understanding of the short- and15
long-term consequences of operating in skewed conditions, or with yaw offsets, is necessary to assess whether maintenance
costs could change and to facilitate intelligent ways to improve power performance that mitigate any negative O&M impacts.
It can be argued that a certain degree of yaw error is always present during turbine operation, in part because of wind
turbulence and in part because of mechanical errors in the turbine alignment and during yaw transients. Here we are concerned
with the systematic, skewed-inflow operation. A few studies have shown a reduction in blade load levels for turbines operating20
under certain yaw offsets (e.g., Kragh and Hansen, 2014; Zalkind and Pao, 2016), accompanied by an increase in loads for
other components (e.g., drivetrain and tower). Some focus has also been given to the load variations under cyclic variations of
angle of attack (α) and relative air velocity at the airfoil of interest (Urel), but conflicting information still exists. On the one
hand, industry experts have either advised against yaw offset operation or devised technology and algorithms to minimize yaw
1
Wind Energ. Sci. Discuss., https://doi.org/10.5194/wes-2017-38Manuscript under review for journal Wind Energ. Sci.Discussion started: 12 September 2017c© Author(s) 2017. CC BY 4.0 License.

misalignment while maximizing power production at the individual turbines in a plant (Kragh and Hansen, 2015; Mortimer,
2016; Fleming et al., 2014). On the other hand, control system scholars recommend adopting strategies that can redirect wakes
away from downwind turbines to increase the plant power production as a whole (e.g., Dahlberg and Medici, 2003; Wagenaar
et al., 2012; Jiménez et al., 2010; Gebraad et al., 2016). In the middle, the owners and operators are left with the unsatisfying
conundrum of increasing power production and associated revenues while taking the risk of accelerated machine damage and5
associated repair costs.
Data from wind tunnel experiments (e.g., Schepers et al., 2011; Schreck and Schepers, 2014) show load and performance
trends under yawed conditions, and emphasize the importance of dynamic stall and unsteady aerodynamics (UA) effects; yet
these tests do not capture the impact of realistic atmospheric turbulence on the loads of key wind-power-plant components.
Some data from full-scale turbines are available (e.g., Boorsma, 2012), but are generally associated with involuntary yaw10
errors rather than a systematic measurement campaign with prescribed yaw offsets and comparison to aeroelastic simulations.
In this paper, we examine the problem of skewed wake and inflow for one utility-scale turbine configuration. The analysis
starts from a theoretical standpoint and builds up in complexity, going from a simplified, analytical model for the α and Urel
azimuthal variations under different yaw offsets, to a fully aeroelastic realization of the turbulent operation. At one end of
the complexity spectrum, the analytical model is an aid to the designer, as it predicts load and performance outcomes under15
steady-state conditions and sheds light on the physics by highlighting the effects of shaft tilt, inflow shear, and yaw error. The
aeroelastic model results, at the other end, account for turbulence effects and nonlinearities of the entire system and therefore
provide more clarity about the system-dynamics response under realistic conditions. For practical predictions, the aeroelastic
model should be validated, and extensive data were collected on a 1.5-MW turbine under several different yaw offset conditions
and compared to the model results.20
In Section 2, we provide a description of the methods used in this study, the load channels of interest, and the turbine
under analysis. In Section 3, the analytical model is presented. Section 4 provides results attained with simulations of the
turbine operation under steady winds. Turbulent-inflow simulation results are compared to field-collected data in Section 5. A
summary of the observations is offered in Section 6.
2 Methods and Load Channels of Interest25
Our analysis was focused on the General Electric (GE) 1.5-MW SLE (GEWT) (Mendoza et al., 2015) installed at the National
Wind Technology Center (NWTC), which is owned by the U.S. Department of Energy (DOE) and operated by the National
Renewable Energy Laboratory (NREL). The turbine is instrumented with an extensive set of load and performance sensors per
IEC (2015), which is described in the next section. An original GE aeroelastic model was modified to be used with NREL’s
aero-hydro-servo-elastic tool for wind turbine design (FAST) version 8 (FASTv8) (Jonkman et al., 2015). FAST is a widely30
used industry and academic tool for loads estimation.
One of the underlying goals of this paper was to link the observed results to the physics of the blade aerodynamics and
structural dynamics. Therefore, we started with a simplified model of the aerodynamics under steady, but sheared, wind con-
2
Wind Energ. Sci. Discuss., https://doi.org/10.5194/wes-2017-38Manuscript under review for journal Wind Energ. Sci.Discussion started: 12 September 2017c© Author(s) 2017. CC BY 4.0 License.

ditions and examined the azimuthal variation of the lift. An analytical model based on the variance of the lift out-of-plane
component as a function of yaw offset was produced. The lift standard deviation, i.e., the square root of its variance, hence
the associated blade load standard deviation, was used as an indicator of oscillating, fatigue loads. We then examined how
this model performed under different hub-height wind speeds, and then increased complexity by first using AeroDyn 15,
FASTv8’s aerodynamics module (AD15) in standalone mode, and then a fully aeroelastic model of the turbine within FASTv8.5
We demonstrated the effects of UA and of the structural response on the blade root bending moments by turning on and off
FASTv8’s UA module and the relevant structural degrees of freedom. This initial analysis was done based on two wind speeds,
in turbine power regions 2 and 2.5. Finally, the model was further refined by accounting for turbulent inflow, and was compared
to data from the field for several wind speeds up to rated power wind speed. Twenty turbulent seeds were considered, using
the IEC (2005) normal turbulence model (NTM), and the calculated loads were compared to those extracted from wind-speed10
binned data coming from the field. For the sake of brevity, results for only two wind speeds are shown, which, however, are
representative of conditions at and below rated power.
Seven output channels of interest were selected: blade-root edgewise bending moment (EBM) and flapwise bending moment
(FBM) and their resultant root-bending moment (RBM); low-speed-shaft torque (LSSTq); tower-top bending moment (TTBM)
(resultant of the fore-aft and side-side components); tower-top torque (TTTq); and tower-base bending moment (TBBM) (re-15
sultant of the fore-aft and side-side components). Initially, the focus is on the FBM because conflicting information exists in
the literature and in the industry experience, and because it is also associated with thrust loads responsible for downstream
component loading. The analysis was mainly carried out on fatigue loading, and the results are given in terms of short-term
damage equivalent loads (DELs) via rainflow counting (Downing and Socie, 1982). Note that we also provide some insights on
ultimate loading, but they do not include parked and fault conditions. Simulations and field data are based on 10-min interval20
sets. In the next section, we describe the field instrumentation setup.
2.1 Field Instrumentation
The field-test campaign was carried out at the NWTC near Boulder, Colorado, and occurred over 6 months during which the
test turbine was operated with discrete yaw offsets over a range of wind speeds and atmospheric conditions.
The test turbine and its dedicated meteorological tower are shown in Figure 1. Details of the turbine are provided in Table 1.25
Table 1. Test Turbine Details.
Brand and Model GE 1.5 SLE ESS
Parameter Value
Rated Power (kW) 1500
Hub Height (m) 80
Nominal Rotor Diameter (m) 77
Rated Wind Speed (m/s) 14
3
Wind Energ. Sci. Discuss., https://doi.org/10.5194/wes-2017-38Manuscript under review for journal Wind Energ. Sci.Discussion started: 12 September 2017c© Author(s) 2017. CC BY 4.0 License.
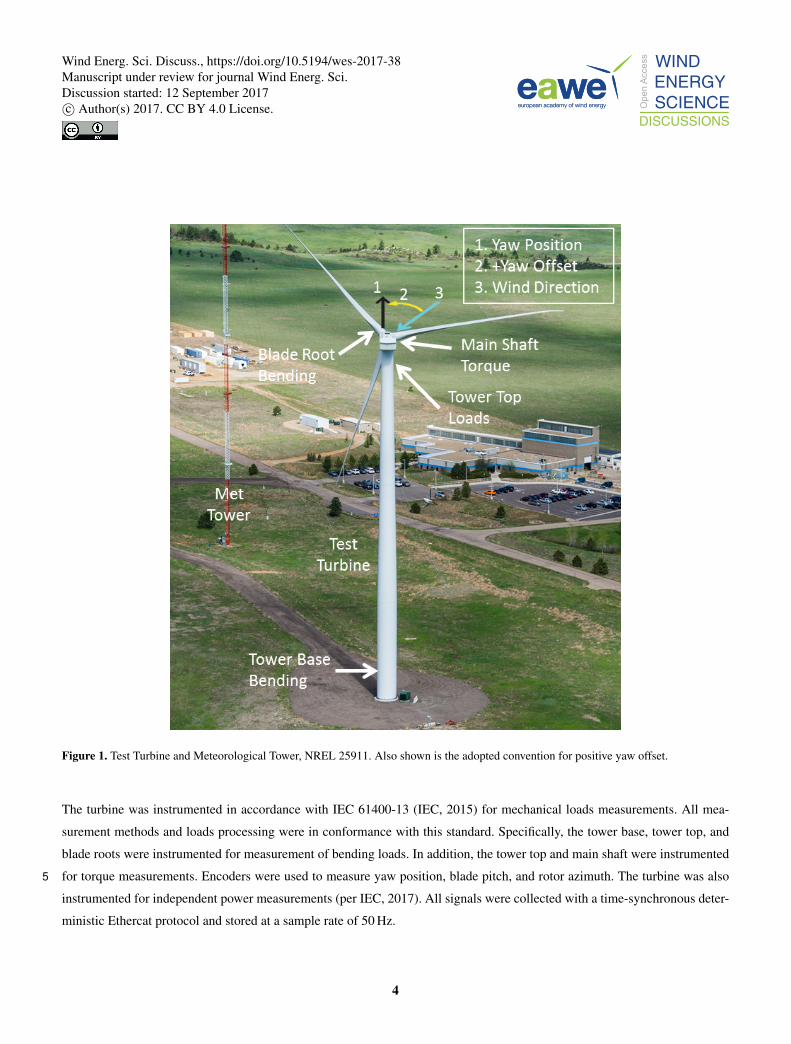
Figure 1. Test Turbine and Meteorological Tower, NREL 25911. Also shown is the adopted convention for positive yaw offset.
The turbine was instrumented in accordance with IEC 61400-13 (IEC, 2015) for mechanical loads measurements. All mea-
surement methods and loads processing were in conformance with this standard. Specifically, the tower base, tower top, and
blade roots were instrumented for measurement of bending loads. In addition, the tower top and main shaft were instrumented
for torque measurements. Encoders were used to measure yaw position, blade pitch, and rotor azimuth. The turbine was also5
instrumented for independent power measurements (per IEC, 2017). All signals were collected with a time-synchronous deter-
ministic Ethercat protocol and stored at a sample rate of 50 Hz.
4
Wind Energ. Sci. Discuss., https://doi.org/10.5194/wes-2017-38Manuscript under review for journal Wind Energ. Sci.Discussion started: 12 September 2017c© Author(s) 2017. CC BY 4.0 License.
The meteorological tower is located 161 m (~2 rotor diameters) in the predominant upwind direction of the turbine and
was instrumented in accordance with IEC 61400-12-1 (IEC, 2017). The meteorological tower measurement signals were time-
synchronously recorded with the turbine loads signals. For the analysis presented in this paper, the 80-m cup anemometer and
the 87-m wind vane signal were used for the reference mean wind speed, direction, and turbulence intensity. Test data was
limited to a sector of directions in which the meteorological tower is largely upwind of the turbine. This measurement sector5
avoids any turbine wake influence on the meteorological tower instrumentation or influence of other turbines at the test site.
More details on the instrumentation set-up can be found in Dana et al. (2017-forthcoming).
The turbine nacelle’s wind vane signal was modified using a frequency modulation device with a dedicated user interface
for programming yaw offset schedules of discrete offset values and durations. In no other way was the turbine or its controller
manipulated. The turbine was set to cycle at 1-hr intervals between the baseline setting, i.e., a 0° yaw offset, and a nonzero10
offset. The offset values included -25◦, -18◦, -12.5◦, 0◦, 12.5◦, 18.0◦, and 25.0◦. However, not all offset value data could be
used for analysis because of wind speeds or directions outside of the acceptance ranges selected for this study and discussed
below.
As visible in Figure 1, the convention employed for the sign of the yaw misalignment implies that with positive yaw offset
the hub center is to the right of the tower centerline when looking downwind.15
3 Analytical Simplification
Fundamentally, the dominant loads during turbine operation originate from the aerodynamic forces and moments on the rotor
blades. The largest contributor to the design loads on the blades and the downstream components is the lift distribution acting
on the blade airfoils. Examining how the out-of-plane (rotor axial) component of the lift varies as a function of azimuth under
different yaw angles can help explain the cyclic out-of-plane loading at the blade root and therefore the associated variation20
of several component loads (e.g., tower, drivetrain). The axial component (l̂) of the two-dimensional (2-D) airfoil lift can be
written as:
l̂ =12ρaUrel
2cl(α)ccosφ (1)
where ρa is the air density, c is the chord, cl(α) is the 2D lift coefficient, α is the angle of attack, φ is the inflow angle, and
where effects on cl due to airfoil-chord Reynolds Number and Mach number are ignored. At a first approximation, within the25
linear region of the airfoil lift polar, one could assume:
cl(α)' c1α (2)
where c1 is an airfoil constant (' 2π for thin airfoils). As we are interested in fatigue loads, the standard deviation of l̂ can
be used as a surrogate for the load oscillation significance. Besides a constant, this translates to the standard deviation of
the product between cl cosφ(' c1αcosφ) and U2rel. To this end, through basic trigonometry, α and Urel can be written as in30
5
Wind Energ. Sci. Discuss., https://doi.org/10.5194/wes-2017-38Manuscript under review for journal Wind Energ. Sci.Discussion started: 12 September 2017c© Author(s) 2017. CC BY 4.0 License.
Eqs. (3)-(4):
α(ψ,r,θ,Uhub,ω,γ) = φ− θ = arctanU(ψ,r,Uhub)cos(γ)cos(δ)
vt(ω,r)−U(ψ,r,Uhub) [cos(γ)sin(δ)sin(ψ) + sin(γ)cos(ψ)]− θ (3)
Urel (ψ,r,Uhub,ω,γ) =√
[U(ψ,r,Uhub)cos(γ)cos(δ)]2 + [vt(ω,r)−U(ψ,r,Uhub) [cos(γ)sin(δ)sin(ψ) + sin(γ)cos(ψ)]]2
(4)
where ψ is the rotor azimuth angle, r is the blade station radial position, θ is the airfoil aero-twist plus pitch setting, δ is the5
shaft tilt, ω is the rotor rotational speed, γ is the rotor yaw offset, vt(ω,r) is the airfoil tangential (in-plane) velocity, and
U(ψ,r,Uhub) is the wind speed at the elevation identified by ψ and r station, and function of the Uhub, where Uhub is the
hub-height mean wind speed. Note that a power-law shear is included in U(ψ,r,Uhub). Under the hypothesis of constant and
uniform induction in region 2 of the turbine power-production curve, we ignore induction and tip effects that would translate
in a constant bias in α and cl for most of the power-producing blade span.10
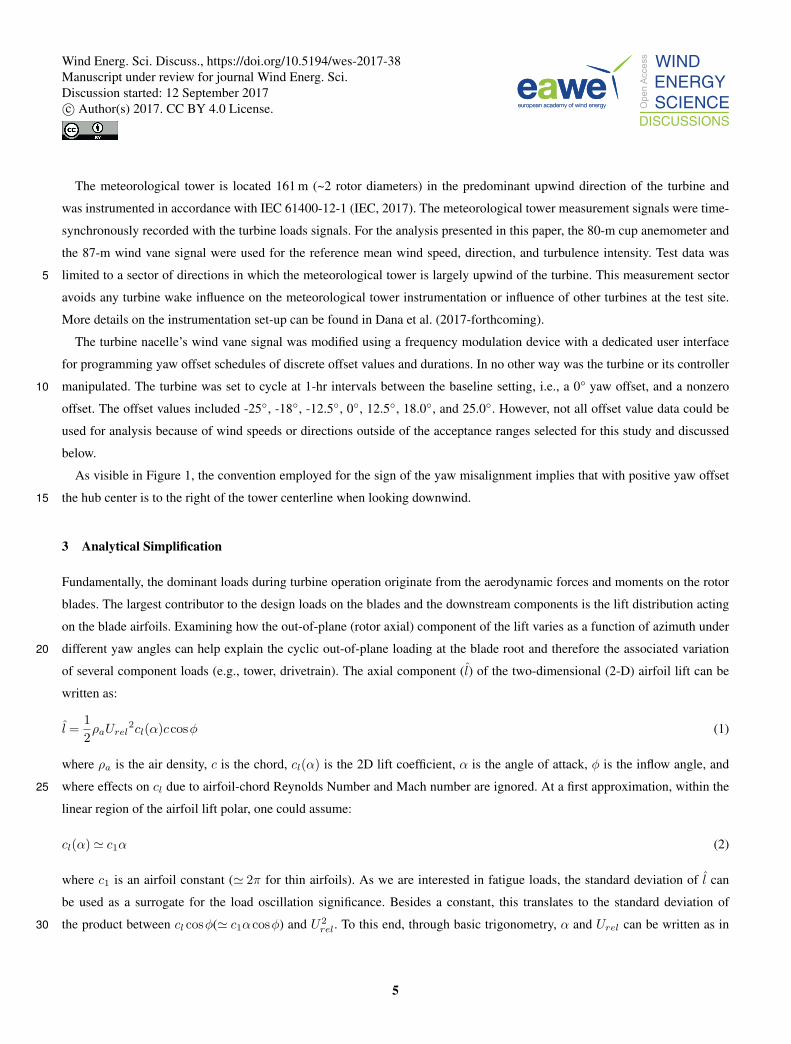
In Figure 2, α and Urel calculated by this analytical model are plotted as a function of ψ for the 75% blade span station
under various yaw offsets and for Uhub=12 m/s with a power-law shear exponent value of 0.21. It can be seen that the impact of
yaw offset reflects primarily on increasing the amplitude of the oscillations for both α and Urel, with little change in the mean
values. Of special note are the azimuthal loci of maxima and minima of the two quantities, which are shifted away from ψ=0°
and 180°, demonstrating an asymmetry in the distribution of lift between the left and right halves of the rotor plane.
Figure 2. α (lines with no markers) and Urel (lines with markers) calculated by the simplified analytical model as a function of ψ for the
75% blade span station under yaw misalignments (γ) as shown in the legend; Uhub=12 m/s. In the legend, the <> and ∆ denote mean and
range (max-min) of the argument.
151The sign convention adopted for the yaw offset is shown in Figure 1.
6
Wind Energ. Sci. Discuss., https://doi.org/10.5194/wes-2017-38Manuscript under review for journal Wind Energ. Sci.Discussion started: 12 September 2017c© Author(s) 2017. CC BY 4.0 License.
As shown by Eqs. (3)-(4) and Figure 2, α and Urel are two quantities well correlated, thus we can use basic statistics (e.g.,
Frishman, 1975) to find the covariance of the product cl cosφU2rel as in Eq. (5):
σ2(cl cosφ ·Urel2
)' σ2
(αcosφ ·Urel2
)= σ2
αcosφ·Urel2 =
σ2(αcosφ)2,Urel
4 +[σ2αcosφ +αcosφ
2]·[σ2Urel
2 +Urel22]−[σ2αcosφ,Urel
2 +αcosφUrel2]2 (5)
In Eq. (5), σ2 denotes the covariance or variance of the argument, and overbars indicate the means of the variables; furthermore,
the constant c1 is omitted with no loss of generality.5
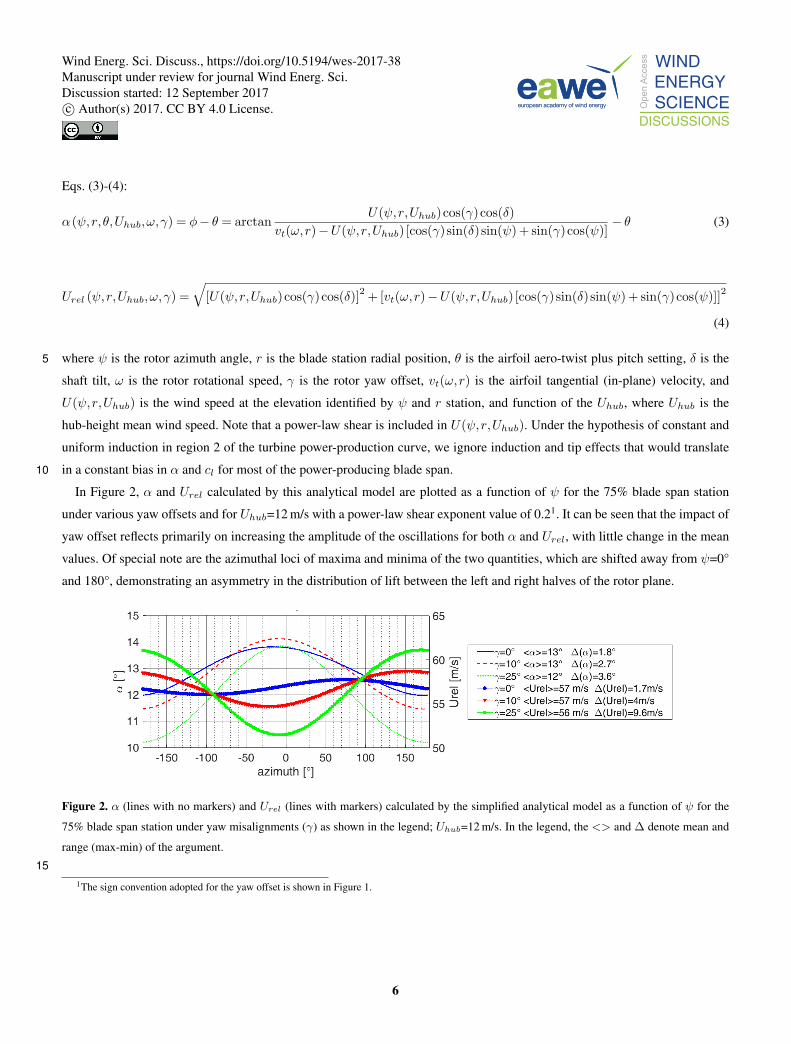
In Figure 3, the model calculated standard deviations for the 75% span airfoil’s cl cosφ, U2rel, and their product are shown
for different values of yaw offsets and hub-height wind speeds of 8 and 14 m/s with a wind shear exponent of 0.2. The standard
deviations were normalized by the means of their respective variables, and are indicated as σ̂cl cosφ, σ̂Urel2 , and σ̂cl cosφ·U2
rel,
respectively. The rotor rotational velocity was set at the average value obtained from aeroelastic simulations and verified
against actual turbine field data for that wind speed. The graphs show that whereas σ̂Urel2 displays a minimum at 0° yaw,
Figure 3. Standard deviations of cl cosφ (crosses), Urel2 (triangles), and their product (circles) for the airfoil at ∼ 75% of the blade span,
for two Uhub wind speeds of 8 m/s (left) and 14 m/s (right), wind shear exponent value of 0.2, and mean rotor rotational speed of ω=16.4
(left) and 18 rpm (right). The standard deviations are normalized by the means of the respective arguments.
10
the σ̂cl cosφ has a minimum near −20°. By examining other wind-speed cases (not shown), which in general rendered similar
trends to Figure 3, it was observed that the minima in σ̂cl cosφ and σ̂cl cosφ·U2rel
get closer to the γ=0° location with increasing
wind speed. Both the σ̂cl cosφ and σ̂Urel2 curves in Figure 3 show an asymmetric behavior. The σ̂Urel
2 standard deviation, for
example, shows higher values for negative yaw offsets than for the corresponding positive misalignments. In contrast, σ̂cl cosφ
exhibits larger variations for positive yaw offsets. The σ̂cl cosφ·U2rel
standard deviation, however, decreases sharply going from15
negative to positive misalignments, with a reduction of some 66% at γ=25° with respect to the baseline case of γ=0°. This
7
Wind Energ. Sci. Discuss., https://doi.org/10.5194/wes-2017-38Manuscript under review for journal Wind Energ. Sci.Discussion started: 12 September 2017c© Author(s) 2017. CC BY 4.0 License.
simplified analysis suggests that, at least in terms of aerodynamic load oscillations, positive yaw misalignments could lead to
a considerable load range reduction. Similar trends were observed at other span locations (not shown).
Although this analysis only considered steady winds, rigid blades, steady aerodynamics, and no induction, it brought forth
results in agreement with recent studies. Zalkind and Pao (2016), for example, suggest the existence of an asymmetric behavior
of blade and tower fatigue loads hinting at the same positive offset as load-favorable misalignment direction.5
4 Blade Aerodynamics and Structural Dynamics under Steady Winds
To better assess the physics responsible for fatigue loading under skewed inflow conditions, and to verify the existence of a
preferred misalignment direction for loads, we build up models of increasing complexity utilizing AD15 and the full FASTv8
aeroelastic tool under steady winds.
Figure 4 shows azimuthal trends for α and Urel as calculated by AD15 for the 75%-span station with aligned, sheared10
flow (0.2 power-law exponent) and no induction effects. It can be observed that α achieves a maximum before reaching
the azimuthal zenith, and a minimum affected by the tower shadow effects just before the 180° azimuth; Urel exhibits an
analogous trend, though shifted by 180°. The asymmetry is caused by the combination of the nonlinear wind profile (power-
law) and the trigonometric contribution of the airfoils’ rotational speed to the relative air speed as a function of their positions
(advancing/retreating effect). Therefore, the sole presence of shear and tilt causes an asymmetry in the variation of cl(α) and15
Urel even under no yaw offset conditions, which can affect the performance of both the individual machine and the entire plant.
For example, it can be speculated that under significant shear, the optimum power performance could occur under misaligned
conditions. Furthermore, the asymmetric distribution of α and Urel translates into an asymmetric azimuthal distribution of the
induction factors, which in turn offsets the wake axis. A power increase under yaw offset conditions is suggested by Kragh and
Hansen (2014), and reports of skewed wake under aligned inflow conditions have been presented in Annoni et al. (2016) and20
Vollmer et al. (2016). These aspects are not further analyzed in this study, however.
By adding yaw offset, the asymmetry about the 0–180° azimuth is still present (see also Figure 2), and whereas the azimuthal
mean α values slightly decrease with larger yaw offsets, the α-ranges (max-min, denoted by ‘∆’) increase with increasing
offsets. Table 2 shows the range for α, cl, and U2rel at different blade spanwise stations (given as spanwise fractions, bf =0.28–
0.92) for two hub-height wind speeds (8 and 12 m/s) and for γ=0◦, -10◦, and 10◦. From the table, it can be observed that,25
relative to the aligned cases, α-ranges reduce by 16–30% with negative misalignments, and increase by 14–70% with positive
ones. This is in agreement with the analytical model predictions. Also, when compared to the aligned cases, the cl-ranges tend
to be larger (smaller) for positive (negative) offsets. The U2rel-ranges, however, increase for both directions of misalignment,
but increase more under negative offsets. As these effects oppose each other when generating aerodynamic loads, it is difficult
to ascertain whether one offset direction could lead to a more favorable load response. Furthermore, as shown in Table 2,30
the reduced frequencies (k =dα
dtc/(2Urel), where c is the chord length and t denotes time) associated with the azimuthal α
variations are largely above 0.02, which is the commonly accepted threshold for unsteady aerodynamic effects to take place
8
Wind Energ. Sci. Discuss., https://doi.org/10.5194/wes-2017-38Manuscript under review for journal Wind Energ. Sci.Discussion started: 12 September 2017c© Author(s) 2017. CC BY 4.0 License.

Figure 4. α and Urel (magnitude divided by three) for the 75% span airfoil as a function of ψ under aligned conditions and a steady
hub-height wind speed of 8 m/s as calculated by AD15. The view is from downwind of the rotor.
(Damiani et al., 2016). Given the expected higher values in angles of attack under positive yaw offsets, dynamic stall effects
should be more prevalent with those misalignments.
Table 3 offers similar results as Table 2, but with induction, skewed wake correction (Ning et al., 2015), and UA effects
included. For most blade spans and wind speeds, AD15 returned increased ranges of α with respect to the no-induction,
geometric calculations. Overall, however, the trends explored under no-induction still apply, with positive yaw offsets showing5
larger variations in cl but smaller in U2rel, confirming that the assumptions in the analytical model of constant and uniform
induction are reasonable. By enabling UA (Damiani et al., 2016), higher peaks in cl’s especially inboard of the blade were
noted. As visible in Figure 5, which portrays azimuthal traces for cl at four blade spanwise stations with no UA (Figure 5a)
and with UA (Figure 5b) effects, the impact of UA is mostly associated with a sharp stall transition for the inboard airfoils (at
rotor radius ≤30%), which is discussed below.10
Figure 6a shows the basic statistics of the blade-root FBM and EBM as calculated by a complete FASTv8 model of the
turbine under investigation for yaw offsets ranging from −25° to 25° and for 8- and 12-m/s hub-height wind speeds. The
companion Figures 6b and 6c offer similar results as obtained by excluding either UA or the rotor/tower flexibility, respectively.
In the plots, the 25th and 75th percentiles of the loads’ distributions are marked with the left and right sides of rectangular
boxes, respectively; the line in the middle of each box is the median, and the whisker lines show the distances to the most15
extreme sample values within the 1.5 interquartile range (i.e., 1.5 times the width of the box). Data beyond 1.5 times the
interquartile ranges are shown as outliers with red crosses. Figure 6a shows little variation of the EBM statistics as a function
9
Wind Energ. Sci. Discuss., https://doi.org/10.5194/wes-2017-38Manuscript under review for journal Wind Energ. Sci.Discussion started: 12 September 2017c© Author(s) 2017. CC BY 4.0 License.

Table 2. Ranges (∆) for α, cl, and U2rel as calculated by AD15 (without induction) for various blade stations (bf ) and hub-height wind
speeds (Uhub) and for yaw offsets (γ) of 0°, −10°, and 10°. A wind shear exponent of 0.2 was assumed. The calculated reduced frequencies
(k) for the various airfoil stations are also given.
Uhub bfγ=0° γ=−10° (a) γ=10° (a)
∆(α) k ∆(cl) ∆(U2rel) ∆∗(α) ∆∗(cl) ∆∗(U2
rel) ∆∗(α) ∆∗(cl) ∆∗(U2rel)
[m/s] [-] [◦] [-] [-] [m2/s2] [-] [-] [-] [-] [-] [-]
8
0.28 4.4 0.11 0.38 63 -0.16 -0.05 1.47 0.57 0.00 1.07
0.51 2.9 0.046 0.11 91 -0.31 -0.19 1.85 0.31 0.45 1.46
0.76 2.2 0.02 0.09 120 -0.18 -0.15 1.92 0.23 0.24 1.58
0.92 2.1 0.011 0.09 132 -0.19 -0.14 2.18 0.14 0.17 1.73
12
0.28 5.7 0.11 0.03 115 -0.14 0.07 1.39 0.70 0.30 0.87
0.51 3.7 0.045 0.06 168 -0.32 -0.63 1.62 0.46 1.68 1.14
0.76 3 0.02 0.07 217 -0.30 -0.10 1.84 0.27 0.01 1.37
0.92 2.7 0.011 0.07 245 -0.22 -0.01 1.94 0.22 0.01 1.44
a ∆∗ denotes the relative difference in range of the argument, with respect to the same quantity at 0° yaw offset.
(a) without UA (b) with UA
Figure 5. (a) cl vs. ψ for various blade stations (bf ) and for γ=10° offset as calculated by AD15 for a hub-height wind speed of 12 m/s. (b)
as in (a) but with UA effects included.
of yaw offset and wind speed; this outcome is to be expected, as the EBM is mainly driven by gravity loads. The FBM median
is seen to decrease with nonzero yaw offsets, as one would expect as the mean thrust load reduces. The FBM distribution
interquartile, hence the variance and standard deviation, however, get larger with nonzero offsets, and more pronouncedly so
for negative yaw offsets. Note that, in contrast to this result, the analytical model of Section 3 predicted an increase in variance
for negative yaw offsets, but a decrease for positive misalignments.5
Data associated with Figure 6 results demonstrate that the standard deviations tend to increase (except at the highest yaw
offset) when UA is excluded from the computations. This indicates that UA acts as a low-pass filter on the span-integral load.
10
Wind Energ. Sci. Discuss., https://doi.org/10.5194/wes-2017-38Manuscript under review for journal Wind Energ. Sci.Discussion started: 12 September 2017c© Author(s) 2017. CC BY 4.0 License.

Table 3. Ranges (∆) for α, cl, and U2rel as calculated by AD15 (with induction) for various blade stations (bf ) and hub-height wind speeds
(Uhub) and for yaw offsets (γ) of 0°, −10°, and 10°. A wind shear exponent of 0.2 was assumed. Results for ∆(cl) are given with (UA) and
without (nUA) unsteady aerodynamics effects included.
Uhub bfγ=0° γ=−10° (a) γ=10° (a)
∆(α) ∆(cl) ∆(U2rel) ∆∗(α) ∆∗(cl) ∆∗(U2
rel) ∆∗(α) ∆∗(cl) ∆∗(U2rel)
[m/s] [-] [◦] nUA [-] UA [-] [m2/s2] [-] nUA [-] UA [-] [-] [-] nUA[-] UA[-] [-]
8
0.28 3.2 0.37 0.31 63 -0.16 -0.16 -0.26 1.47 0.63 0.59 0.65 1.07
0.51 2.6 0.3 0.27 91 -0.31 -0.30 -0.37 1.69 0.38 0.40 0.44 1.38
0.76 2.6 0.26 0.24 120 -0.19 -0.35 -0.21 1.92 0.27 0.23 0.25 1.58
0.92 2.1 0.2 0.19 132 -0.14 -1.00 -0.11 2.18 0.24 0.20 0.26 1.73
12
0.28 8.9 0.38 1.7 115 -0.07 0.00 0.00 1.39 0.46 0.00 0.12 0.87
0.51 4.9 0.17 0.25 168 -0.37 -0.35 0.04 1.62 0.39 0.47 0.40 1.14
0.76 3.5 0.089 0.12 217 -0.34 -0.16 0.00 1.84 0.29 0.46 0.33 1.37
0.92 2.9 0.093 0.1 245 -0.24 -0.09 -0.10 1.94 0.24 0.29 0.30 1.44
a ∆∗ denotes the relative difference in range of the argument, with respect to the same quantity at 0° yaw offset.
Furthermore, under rigid conditions, the FBM values are generally associated with slightly lower standard deviations, whereby
it can be expected they would lead to lesser fatigue loads. These observations are confirmed by an analysis of the load variation
as a function of azimuth (not shown for the sake of brevity), which translate into smoother curves.
In Figure 7, the calculated short-term FBM DELs are presented forUhub=8 and 12 m/s, and for three different configurations:
one including the entire model physics, one without UA effects, and one without blade (and tower) flexibility. The complete5
model results show a minimum of the DEL for the aligned conditions, although the asymmetry in the loading persists, with
negative yaw offsets rendering larger loads than the positive counterparts. The second set of results in Figure 7 is only slightly
different from the first and thus confirms that the dynamic stall effects are not so important for the trends observed in blade
root loads, despite showing a noticeable effect on the cl’s as shown in Figure 5. This result suggests that the integral of the
lift distribution along the blade span washes out the UA contribution to the oscillating loads. Finally, with rigid blades and10
Uhub=8 m/s, the trend for the root FBM DEL is as expected from the simplified variance model of Section 3. Therefore, at this
wind speed, the inertial forces associated with the elastic response—of the rotor in particular—have a dominant effect on the
calculated DELs.
At Uhub=12 m/s, however, the DEL trend with yaw offset reflects what is observed in the first set of Figure 7, suggesting
that the load variation with yaw offset at this wind speed is only slightly affected by the structural response, and therefore15
11
Wind Energ. Sci. Discuss., https://doi.org/10.5194/wes-2017-38Manuscript under review for journal Wind Energ. Sci.Discussion started: 12 September 2017c© Author(s) 2017. CC BY 4.0 License.
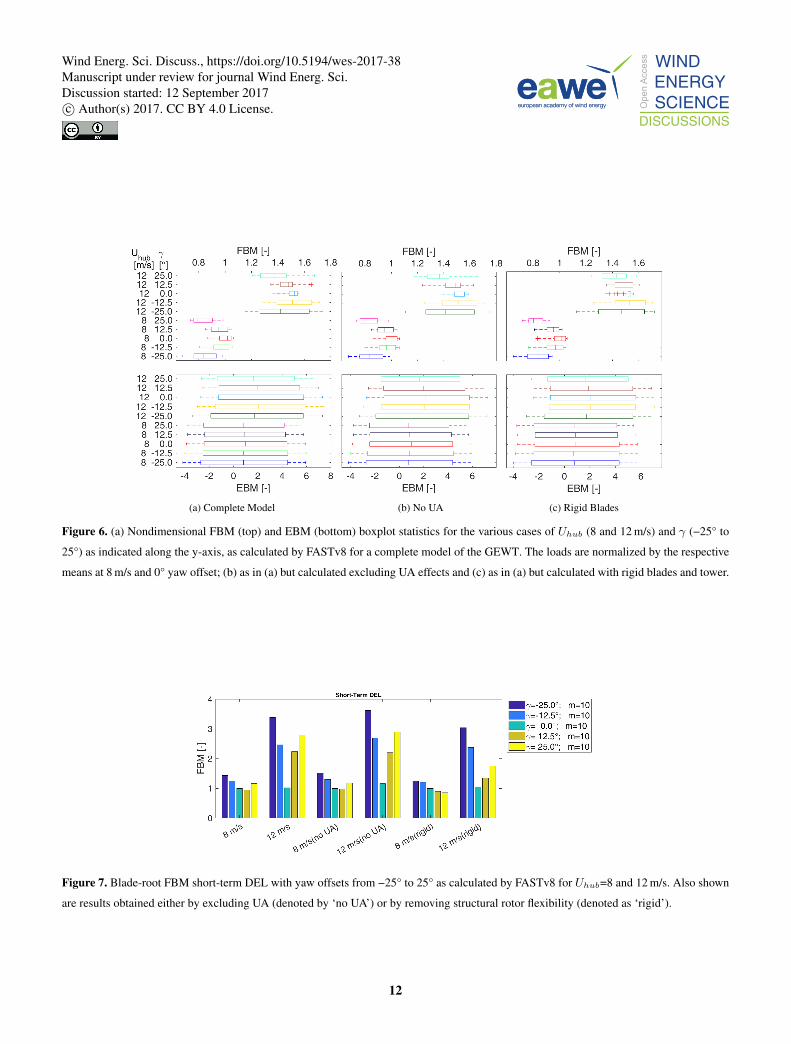
(a) Complete Model (b) No UA (c) Rigid Blades
Figure 6. (a) Nondimensional FBM (top) and EBM (bottom) boxplot statistics for the various cases of Uhub (8 and 12 m/s) and γ (−25° to
25°) as indicated along the y-axis, as calculated by FASTv8 for a complete model of the GEWT. The loads are normalized by the respective
means at 8 m/s and 0° yaw offset; (b) as in (a) but calculated excluding UA effects and (c) as in (a) but calculated with rigid blades and tower.
Figure 7. Blade-root FBM short-term DEL with yaw offsets from −25° to 25° as calculated by FASTv8 for Uhub=8 and 12 m/s. Also shown
are results obtained either by excluding UA (denoted by ‘no UA’) or by removing structural rotor flexibility (denoted as ‘rigid’).
12
Wind Energ. Sci. Discuss., https://doi.org/10.5194/wes-2017-38Manuscript under review for journal Wind Energ. Sci.Discussion started: 12 September 2017c© Author(s) 2017. CC BY 4.0 License.

primarily driven by pure aerodynamic loading2. To understand what is happening at 12 m/s, we further examined the blade
cl-vs.-azimuth relationship. Figure 8 shows how blade structural flexibility affects the cl-vs.-azimuth trends for various blade
span stations at γ=12.5° and for Uhub=8 and 12 m/s. At the higher wind speeds, the inboard airfoils start stalling, even at γ=0°,
and the abrupt drop in cl creates a load forcing that contributes to the higher DELs. This can also be observed in Figure 5.
By comparing Figure 8a to Figure 8b, one can note the 100% increase in the cl-range for the station near the 30% blade span5
when going from Uhub=8 m/s to Uhub=12 m/s. Furthermore, by comparing Figures 8a–8b to Figures 8c–8d, one can see that,
at Uhub=12 m/s, the lift curves are almost unchanged when the blades are made rigid, as opposed to the case with 8-m/s hub-
height wind speed, where the blade flexibility returns a more complex cl response in the region of tower influence near the
180° azimuth for the outboard airfoils, thus again leading to expected higher fatigue loading. This analysis explains why, at the
higher wind speeds, the impact of flexibility is almost negligible on the FBM short-term DEL trend with yaw misalignment,10
but how suppressing elastic response at the lower wind speeds can significantly change the fatigue loading level.
(a) 8 m/s (b) 12 m/s
(c) 8 m/s, rigid blades (d) 12 m/s, rigid blades
Figure 8. FASTv8 results with steady winds; (a) cl vs. ψ for 8 m/s wind speed and 12.5° yaw offset, (b) as in (a) for a hub-height wind speed
of 12 m/s, and (c) and (d) as in (a) and (b) but with rigid blades and tower. Note that the legends provide mean (denoted by <>) and range
(max-min) of cl for the various span stations (bf ).
Figure 9 further demonstrates how the blade inboard stations exhibit a sharp drop in lift near stall. The combination of higher
α’s with higher wind speeds, and the sharper airfoil stall characteristics of the inboard airfoils, cause the large variations in cl’s,
which in turn are responsible for the increase in oscillating loads at the root. This nonlinear aerodynamics explains why the
simple variance model cannot capture load trends at higher wind speeds, and therefore indicates that the airfoil characteristics15
2Note that the turbine controller constantly varies the pitch of the blades at this speed and at all the yaw errors examined thus far, but it was verified that
disabling the controller in the simulations does not significantly affect these observations.
13
Wind Energ. Sci. Discuss., https://doi.org/10.5194/wes-2017-38Manuscript under review for journal Wind Energ. Sci.Discussion started: 12 September 2017c© Author(s) 2017. CC BY 4.0 License.

Figure 9. Lift polar curve of the inboard to midspan airfoils normalized to the respective maximum cl’s.
and the associated UA, together with the elastic response of the blades, contribute to the actual fatigue loading of the blade,
and thereby all the downstream turbine components. Given these results, one can only rely on accurate, nonlinear, aeroelastic
models of the turbine and thorough loads analyses to assess the loading levels in the various components under yaw offsets.
In the subsequent section, we carry out a loads analysis based on FASTv8 simulations with turbulent winds, and compare the
predictions to field-measured loads.5
5 Aeroelastic Simulation and Field Data Validation
To compare model predictions to actual field measurements, we ran aeroelastic simulations for hub-height mean wind speeds
ranging from 4 to 24 m/s in 2-m/s wind-speed bins, and with NTM inflow (see also IEC, 2005) with 20 turbulence seeds per
wind-speed bin. However, besides brevity, we limit the discussion to mean hub-height wind speeds of 10 and 14 m/s for three
reasons. First, we intend to compare to data bins from the field, thus we selected those that provided sufficient field data points10
for statistical significance. Second, above rated wind speed, pitch dynamics adds more complexity to the interpretation of the
results. Lastly, low wind speeds (≤ 6 m/s) gave rise to shutdowns in the simulations, which we wanted to exclude for the sake
of clarity. Furthermore, the selected wind speeds are representative of conditions at or below rated power, which is where wake
steering is thought to be most effective.
The investigated yaw offsets ranged from −25° to 25°, which have been considered for wake redirection in wind farms.15
Because the field data showed large variations in turbulence intensity (TI) within individual wind-speed bins (see Figure 10), a
lower turbulence range was selected for the simulations, with a mean TI=15% throughout the wind-speed range. Accordingly,
the field data were filtered to retain measurements with TI ranging from 1 to 17% to guarantee a statistically significant number
of samples. This was necessary because turbulence intensity proved to have a larger effect than the sole yaw offset on the
magnitude of DELs, as can be seen, for example, in the blade-root FBM DELs shown in Figure 11.20
14
Wind Energ. Sci. Discuss., https://doi.org/10.5194/wes-2017-38Manuscript under review for journal Wind Energ. Sci.Discussion started: 12 September 2017c© Author(s) 2017. CC BY 4.0 License.

Figure 10. Comparison between simulated (circles) and measured (squares) values of TI as function of yaw offset for two wind-speed bins
of interest (left: Uhub=10 m/s; right: Uhub=14 m/s). The field data are shown when including all data (label “All” in the legend) and when
filtering for TI below 17% (label “TI 1–17%” in the legend). The simulated data are shown for Class IA turbulence (IEC, 2005) (label “FAST
TI Class IA” in the legend) and for TI=16% at 15 m/s (label “FAST TI 16%”).
Figure 11. TI effect on the blade FBM DEL. Comparison between simulated (circles) and measured (squares) values of the loads for various
TI levels, as a function of yaw offset and for Uhub=10 m/s (left) and Uhub=14 m/s (right). The loads are normalized by the mean value at 0°
yaw offset from the field data filtered to a TI range of 1 to 17%. Labels in the legend are the same as in Figure 10.
15
Wind Energ. Sci. Discuss., https://doi.org/10.5194/wes-2017-38Manuscript under review for journal Wind Energ. Sci.Discussion started: 12 September 2017c© Author(s) 2017. CC BY 4.0 License.

5.1 Fatigue Loads
Figure 12 offers a summary comparison between predicted and measured short-term DELs for the various channels of interest
and for 10 and 14 m/s. The bars represent mean values from simulation results, and the square symbols are the corresponding
values derived from the field measurements. For each channel, the mean values are given as a function of yaw offset, with all
DELs normalized by the field value at the zero yaw offset. Because field data at γ=−12.5° were scarce, they were not included5
in the plots. In Appendix A, Figures A1–A7 show detailed comparisons between the predicted and the measured DELs for the
various load channels of interest as a function of yaw offset and including error bars representing ±1 standard deviations. The
spread comes from multiple seeds in the FAST results, and from multiple data points (10-min records) in the field datasets.
Figure 12. Comparison between predicted (FAST, bars) and measured (field, square symbols) mean DELs as a function of yaw offsets,
for mean Uhub=10 m/s (top) and 14 m/s (bottom). DELs are normalized by their respective mean measured values at 0° yaw offset and
Uhub=14 m/s.
Overall, good agreement was observed between predicted and measured data both in absolute terms and as far as yaw-offset
trends are concerned. For example, the FBM values predicted at the blade root are very close to the corresponding field-derived10
data. A minimum is seen under aligned conditions as was also shown under steady-state wind conditions in Section 4. The
16
Wind Energ. Sci. Discuss., https://doi.org/10.5194/wes-2017-38Manuscript under review for journal Wind Energ. Sci.Discussion started: 12 September 2017c© Author(s) 2017. CC BY 4.0 License.

previously observed asymmetry in the mean loading as a function of yaw offset is still visible, with negative yaw errors giving
rise to larger loads, though at 14 m/s, this effect is not confirmed by the field-derived data.
Both the calculated and measured blade-root EBM display a mostly monotonic, decreasing trend with increasing yaw offset,
although less pronounced at 14 m/s. This decreasing trend is in line with the decrease in standard deviations observed in
Figure 6a under steady conditions, and is attributable to the aerodynamics partially relieving the gravity loading when going5
from negative to positive yaw offsets.
To assess the effective fatigue load on the blade root, the resultant unsymmetric RBM must be analyzed via load roses,
wherein multiple circular sectors of the root cross section are considered, in addition to the 0° (FBM) and 90° (EBM) compo-
nents. Eight sectors, each 22.5° wide, were analyzed, and the data from the largest contributing sector from each yaw offset
were selected and normalized with respect to the field value under aligned conditions. The calculated results demonstrate that10
the resulting fatigue loading decreases with increasing yaw offset, and that negative misalignments appear more detrimental
than the aligned conditions. The field-derived results generally confirm this trend, but not as clearly.
The LSSTq DELs also showed good agreement between predicted and measured data, especially at 14 m/s. Note, however,
the reversal in the trend with yaw misalignments for different wind speeds. For wind speeds below 14 m/s and near γ=0°, in
fact, FAST results exhibited a maximum in torque DEL, whereas they showed a minimum for a wind speed of 14 m/s. The15
field-derived data confirm this reversal, although an outlier can be noted at γ=−25° and 10 m/s.
A more significant discrepancy was observed for the mean resultant TTBM DEL. The load-rose analysis of field data (con-
ducted in the same fashion as for the blade-root loads above) exhibits an increase in the short-term fatigue damage for nonzero
yaw offsets. FAST predictions, however, render a much smaller effect of the yaw misalignment. The largest discrepancy be-
tween field and FAST results (~40% relative error) can be seen at γ=25° and 14 m/s, but it is also accompanied by very large20
standard deviations in the field data (see Figure A5).
The TTTq DEL from measurements at tower top is, on average, overestimated by the simulations. Large variations in
the loading levels, however, can be seen for positive yaw offsets and higher wind speeds both in the field data and in the
predictions (see Figure A6). Notwithstanding this discrepancy (up to 17% relative error), the increase in torque with increasing
yaw misalignment is confirmed by both simulation- and field-derived data.25
At the tower base, FAST predicts that the resultant TBBM DELs (calculated through load roses) have a maximum between
0° and −12.5° yaw offsets. Measurements from the field, however, lead to a significant increase of the DELs with negative
yaw offset (−25°), and a somewhat lesser increase for positive yaw offsets except at the higher wind speeds. The field-derived
data at −25° still appear to be outliers. The largest relative error in the calculated DEL was 50% under aligned conditions and
14 m/s.30
5.2 Extreme Loads
To complete this gallery of results, we offer a comparison between the FAST-predicted extreme loads and those measured
in the field. Note that these loads are not necessarily the highest loads the various components would encounter throughout
the turbine lifetime, but they give an idea of what to expect in a relative sense when the turbine is operated under misaligned
17
Wind Energ. Sci. Discuss., https://doi.org/10.5194/wes-2017-38Manuscript under review for journal Wind Energ. Sci.Discussion started: 12 September 2017c© Author(s) 2017. CC BY 4.0 License.
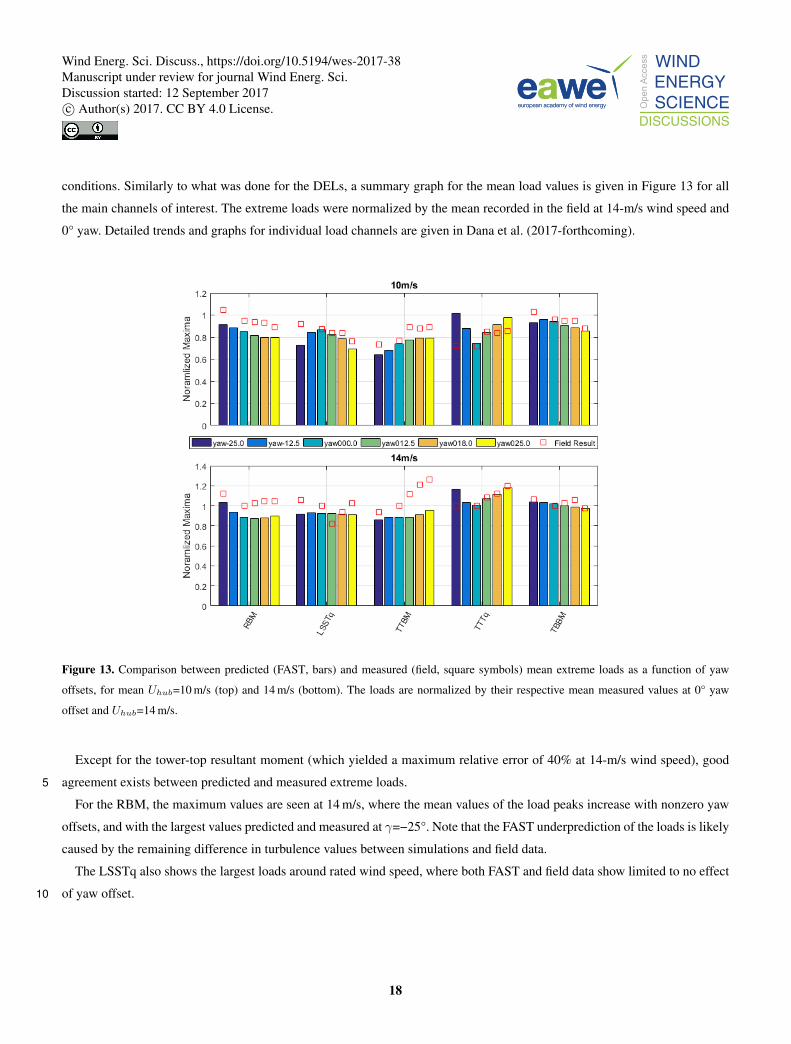
conditions. Similarly to what was done for the DELs, a summary graph for the mean load values is given in Figure 13 for all
the main channels of interest. The extreme loads were normalized by the mean recorded in the field at 14-m/s wind speed and
0° yaw. Detailed trends and graphs for individual load channels are given in Dana et al. (2017-forthcoming).
Figure 13. Comparison between predicted (FAST, bars) and measured (field, square symbols) mean extreme loads as a function of yaw
offsets, for mean Uhub=10 m/s (top) and 14 m/s (bottom). The loads are normalized by their respective mean measured values at 0° yaw
offset and Uhub=14 m/s.
Except for the tower-top resultant moment (which yielded a maximum relative error of 40% at 14-m/s wind speed), good
agreement exists between predicted and measured extreme loads.5
For the RBM, the maximum values are seen at 14 m/s, where the mean values of the load peaks increase with nonzero yaw
offsets, and with the largest values predicted and measured at γ=−25°. Note that the FAST underprediction of the loads is likely
caused by the remaining difference in turbulence values between simulations and field data.
The LSSTq also shows the largest loads around rated wind speed, where both FAST and field data show limited to no effect
of yaw offset.10
18
Wind Energ. Sci. Discuss., https://doi.org/10.5194/wes-2017-38Manuscript under review for journal Wind Energ. Sci.Discussion started: 12 September 2017c© Author(s) 2017. CC BY 4.0 License.

At tower top, a distinctive increase of peak TTBM with increasing yaw offset can be observed in Figure 13, and this trend
persists in both the model and measured data. For the TTTq extremes, FAST predicts a minimum under aligned conditions, but
field data show even smaller values at γ=−25°. Very good agreement exists for positive yaw offsets, however.
Finally, calculated TBBM extremes (highest values at 14-m/s wind speed) are seen to slightly decrease with increasing yaw
offset. Whereas this trend is confirmed by the measurements at 10-m/s wind speed, at 14 m/s, the field data are noisier and5
show less influence of the yaw misalignment.
6 Conclusions
In this paper, we presented an analytical treatment, numerical investigations, and field data analyses to explore the effects of
yaw offset operation on the loads of a commercial-grade wind turbine.
The results of models of increasing complexity were presented for the rotor aerodynamics under different yaw misalignments10
to shed some light on the physics and load predictions. It was shown that, under the presence of vertical wind shear, asymmetric
conditions exist in the azimuthal distributions of the angle of attack and relative air velocity even under aligned inflow, which
complicates the intuitive picture of the turbine response and might have further consequences on wake dynamics and control
strategies. When turning the attention to the cl distributions, rapid changes in values obtained under both steady and unsteady
aerodynamics at the inboard sections of the blades were noted for wind speeds in power region 2.5, which are likely the15
responsible factors for the standard deviations noted in the blade-root FBMs. These effects were mostly attributed to the
crossing of the stall region of the airfoil polars, which was seen as rather abrupt. At lower wind speeds (power region 2),
these effects were partially eliminated by assuming rigid blades, thus demonstrating that, besides aerodynamics, the stiffness
characteristics of the turbine play a significant role in the calculated DELs. A simple analytical model for the standard deviation
of the out-of-plane component of the blade lift was presented and shown to be a valid proxy for DELs only under quasi-steady-20
state and rigid-rotor conditions. In fact, it was shown how stiffness characteristics and aerodynamics specific to the actual wind
turbine model have a dominant role in the determination of the load statistics and therefore the fatigue response.
Furthermore, by considering more realistic turbulent wind fields, via both simulations and field data records, it was shown
that the turbulence intensity distribution for the various mean wind-speed bins can significantly mask the effects caused by
skewed inflow, and care must be taken to the actual site conditions to assess their effects on the loads. Only dedicated aero-25
servo-elastic simulations can capture the actual trends in loading as a function of yaw offset, and only if the proper turbulent
inflow conditions are matched.
Aeroelastic simulations can do a good job predicting the blade-root FBM and EBM bending moment DELs, and it was shown
how these, on average, exhibit different trends with yaw offsets. Whereas the FBM increased with nonzero misalignment,
the EBM decreased with increasing yaw offsets. To assess the actual impact of misaligned operation on blade-root fatigue,30
the combined bending, or resultant moment, was analyzed via load roses. On average, the blade-root bending moment DEL
decreased for positive yaw offsets and increased for negative offsets. Fairly large variations can be attributed to different
turbulence seeds and data records, making generalization more difficult.
19
Wind Energ. Sci. Discuss., https://doi.org/10.5194/wes-2017-38Manuscript under review for journal Wind Energ. Sci.Discussion started: 12 September 2017c© Author(s) 2017. CC BY 4.0 License.
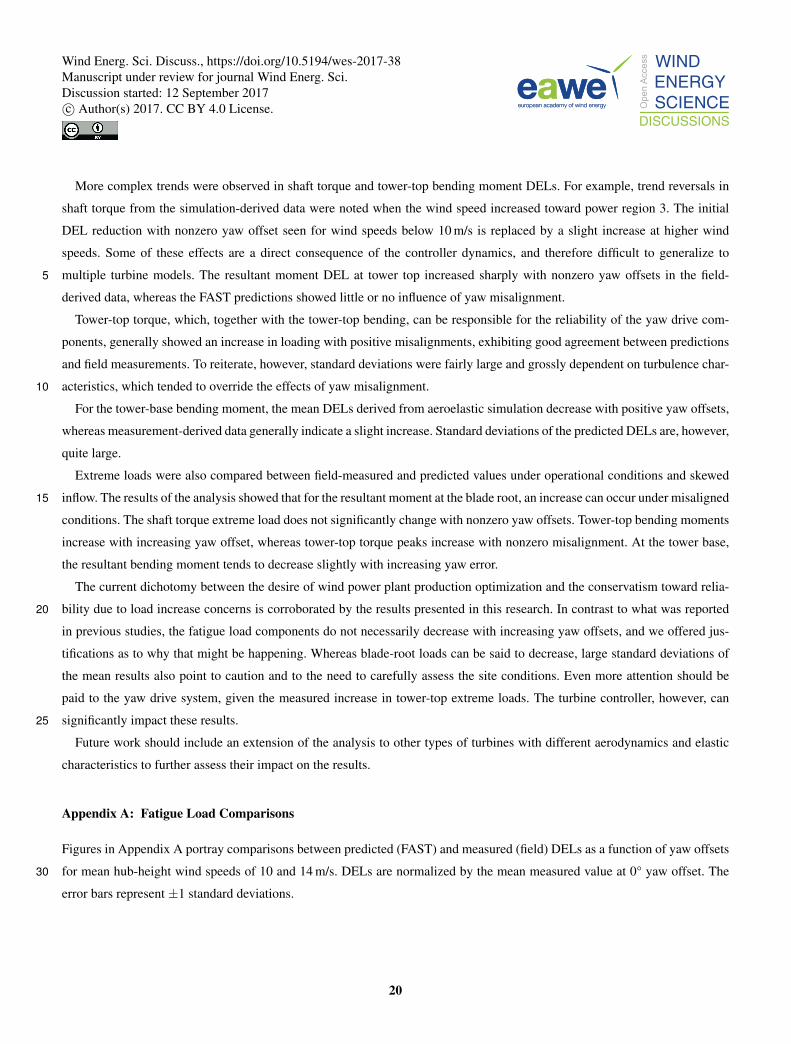
More complex trends were observed in shaft torque and tower-top bending moment DELs. For example, trend reversals in
shaft torque from the simulation-derived data were noted when the wind speed increased toward power region 3. The initial
DEL reduction with nonzero yaw offset seen for wind speeds below 10 m/s is replaced by a slight increase at higher wind
speeds. Some of these effects are a direct consequence of the controller dynamics, and therefore difficult to generalize to
multiple turbine models. The resultant moment DEL at tower top increased sharply with nonzero yaw offsets in the field-5
derived data, whereas the FAST predictions showed little or no influence of yaw misalignment.
Tower-top torque, which, together with the tower-top bending, can be responsible for the reliability of the yaw drive com-
ponents, generally showed an increase in loading with positive misalignments, exhibiting good agreement between predictions
and field measurements. To reiterate, however, standard deviations were fairly large and grossly dependent on turbulence char-
acteristics, which tended to override the effects of yaw misalignment.10
For the tower-base bending moment, the mean DELs derived from aeroelastic simulation decrease with positive yaw offsets,
whereas measurement-derived data generally indicate a slight increase. Standard deviations of the predicted DELs are, however,
quite large.
Extreme loads were also compared between field-measured and predicted values under operational conditions and skewed
inflow. The results of the analysis showed that for the resultant moment at the blade root, an increase can occur under misaligned15
conditions. The shaft torque extreme load does not significantly change with nonzero yaw offsets. Tower-top bending moments
increase with increasing yaw offset, whereas tower-top torque peaks increase with nonzero misalignment. At the tower base,
the resultant bending moment tends to decrease slightly with increasing yaw error.
The current dichotomy between the desire of wind power plant production optimization and the conservatism toward relia-
bility due to load increase concerns is corroborated by the results presented in this research. In contrast to what was reported20
in previous studies, the fatigue load components do not necessarily decrease with increasing yaw offsets, and we offered jus-
tifications as to why that might be happening. Whereas blade-root loads can be said to decrease, large standard deviations of
the mean results also point to caution and to the need to carefully assess the site conditions. Even more attention should be
paid to the yaw drive system, given the measured increase in tower-top extreme loads. The turbine controller, however, can
significantly impact these results.25
Future work should include an extension of the analysis to other types of turbines with different aerodynamics and elastic
characteristics to further assess their impact on the results.
Appendix A: Fatigue Load Comparisons
Figures in Appendix A portray comparisons between predicted (FAST) and measured (field) DELs as a function of yaw offsets
for mean hub-height wind speeds of 10 and 14 m/s. DELs are normalized by the mean measured value at 0° yaw offset. The30
error bars represent ±1 standard deviations.
20
Wind Energ. Sci. Discuss., https://doi.org/10.5194/wes-2017-38Manuscript under review for journal Wind Energ. Sci.Discussion started: 12 September 2017c© Author(s) 2017. CC BY 4.0 License.
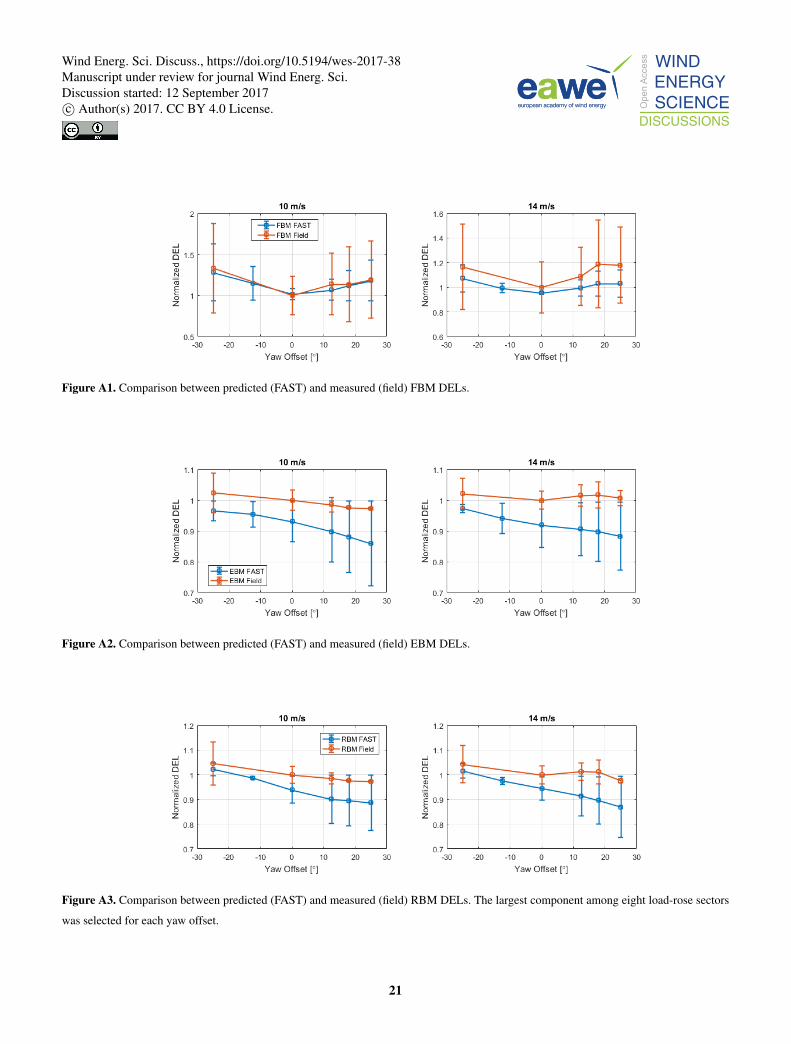
Figure A1. Comparison between predicted (FAST) and measured (field) FBM DELs.
Figure A2. Comparison between predicted (FAST) and measured (field) EBM DELs.
Figure A3. Comparison between predicted (FAST) and measured (field) RBM DELs. The largest component among eight load-rose sectors
was selected for each yaw offset.
21
Wind Energ. Sci. Discuss., https://doi.org/10.5194/wes-2017-38Manuscript under review for journal Wind Energ. Sci.Discussion started: 12 September 2017c© Author(s) 2017. CC BY 4.0 License.

Figure A4. Comparison between predicted (FAST) and measured (field) LSSTq DELs.
Figure A5. Comparison between predicted (FAST) and measured (field) TTBM DELs. The largest component among eight load-rose sectors
was selected for each yaw offset.
Figure A6. Comparison between predicted (FAST) and measured (field) TTTq DELs.
22
Wind Energ. Sci. Discuss., https://doi.org/10.5194/wes-2017-38Manuscript under review for journal Wind Energ. Sci.Discussion started: 12 September 2017c© Author(s) 2017. CC BY 4.0 License.
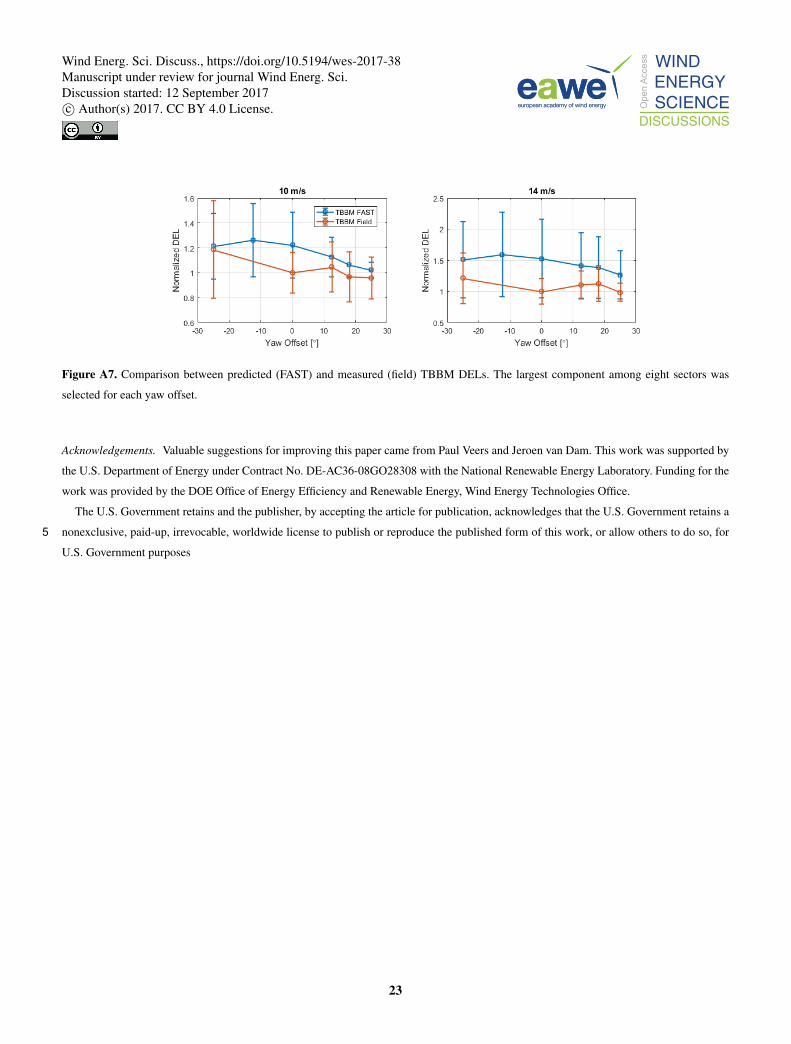
Figure A7. Comparison between predicted (FAST) and measured (field) TBBM DELs. The largest component among eight sectors was
selected for each yaw offset.
Acknowledgements. Valuable suggestions for improving this paper came from Paul Veers and Jeroen van Dam. This work was supported by
the U.S. Department of Energy under Contract No. DE-AC36-08GO28308 with the National Renewable Energy Laboratory. Funding for the
work was provided by the DOE Office of Energy Efficiency and Renewable Energy, Wind Energy Technologies Office.
The U.S. Government retains and the publisher, by accepting the article for publication, acknowledges that the U.S. Government retains a
nonexclusive, paid-up, irrevocable, worldwide license to publish or reproduce the published form of this work, or allow others to do so, for5
U.S. Government purposes
23
Wind Energ. Sci. Discuss., https://doi.org/10.5194/wes-2017-38Manuscript under review for journal Wind Energ. Sci.Discussion started: 12 September 2017c© Author(s) 2017. CC BY 4.0 License.

References
Annoni, J., Gebraad, P., Scholbrock, A., Fleming, P., and Van Wingerden, J.: Analysis of axial-induction-based wind plant control using an
engineering and a high-order wind plant model, Wind Energy, 19, 1135–1150, 2016.
Boorsma, K.: Power and loads for wind turbines in yawed conditions — Analysis of field measurements and aerodynamic predictions, Tech.
Rep. ECN-E–12-047, Energy Research Center of the Netherlands, The Netherlands, 2012.5
Dahlberg, J. and Medici, D.: Potential improvement of wind turbine array efficiency by active wake control, in: Proceedings of European
Wind Energy Conference, pp. 65–84, Madrid, Spain, 2003.
Damiani, R., Hayman, G., and Jonkman, J.: Development and Validation of a New Unsteady Airfoil Aerodynamics Model Within AeroDyn,
in: 34th Wind Energy Symposium–SciTech 2016, AIAA, San Diego, CA, 2016.
Dana, S., Damiani, R., and Dykes, K.: Field Measurement Campaign of the GE 1.5-SLE under Yawed Inflow, Technical Report NREL/TP-10
5000-XXXXX, NREL, Golden, CO, 2017-forthcoming.
Downing, S. D. and Socie, D. F.: Simple rainflow counting algorithms, International Journal of Fatigue, 4, 31–40, 1982.
Fleming, P., Scholbrock, A., Jehu, A., Davoust, S., Osler, E., Wright, A., and Clifton, A.: Field-test results using a nacelle-mounted li-
dar for improving wind turbine power capture by reducing yaw misalignment, Journal of Physics: Conference Series, 524, 012 002,
doi:10.1088/1742-6596/524/1/012002, 2014.15
Fleming, P., Gebraad, P. M. O., Lee, S., van Wingerden, J., Johnson, K., Churchfield, M., Michalakes, J., Spalart, P., and Moriarty, P.:
Simulation comparison of wake mitigation control strategies for a two-turbine case, Wind Energy, 18, 2135–2143, 2015.
Frishman, F.: A Modern Course on Statistical Distributions in Scientific Work: Volume 1 — Models and Structures Proceedings of the NATO
Advanced Study Institute held at the University of Calgary, Calgary, Alberta, Canada July 29 – August 10, 1974, chap. On the Arithmetic
Means and Variances of Products and Ratios of Random Variables, pp. 401–406, Springer Netherlands, Dordrecht, doi:10.1007/978-94-20
010-1842-5_32, 1975.
Gebraad, P. M. O., Teeuwisse, F. W., van Wingerden, J. W., Fleming, P. A., Ruben, S. D., Marden, J. R., and Pao, L. Y.: Wind plant power
optimization through yaw control using a parametric model for wake effects — a CFD simulation study, Wind Energy, 19, 95–114, 2016.
Hand, M. M., Simms, D. A., Fingersh, L. J., Jager, D. W., Cotrell, J. R., Schreck, S., and Larwood, S. M.: Unsteady Aerodynamics Experiment
Phase VI: Wind Tunnel Test Configurations and Available Data Campaigns, Tech. Rep. NREL/TP-500-29955, National Renewable Energy25
Laboratory, Golden, CO, contract No. DE-AC36-99-GO10337, 2001.
IEC: 61400-1. Wind turbines—Part 1: Design requirements, 2005.
IEC: 61400-13:2015 Wind turbines — Part 13: Measurement of mechanical loads, 2015.
IEC: 61400-12-1:2017 Wind energy generation systems — Part 12-1: Power performance measurements of electricity producing wind
turbines, 2017.30
Jiménez, A., Crespo, A., and Migoya, E.: Application of a LES technique to characterize the wake deflection of a wind turbine in yaw, Wind
Energy, 13, 559–572, 2010.
Jonkman, J. M., Hayman, G. J., Jonkman, B. J., and Damiani, R. R.: AeroDyn v15 User’s Guide and Theory Manual, Tech. rep., National
Renewable Energy Laboratory, Golden, CO, 2015.
Kragh, K. A. and Hansen, M. H.: Load Alleviation of wind turbines by yaw misalignment, Wind Energy, 17, 971–982, doi:10.1002/we.1612,35
2014.
24
Wind Energ. Sci. Discuss., https://doi.org/10.5194/wes-2017-38Manuscript under review for journal Wind Energ. Sci.Discussion started: 12 September 2017c© Author(s) 2017. CC BY 4.0 License.

Kragh, K. A. and Hansen, M. H.: Potential of power gain with improved yaw alignment, Wind Energy, 18, 979–989, doi:10.1002/we.1612,
2015.
Mendoza, I., Hur, J., Thao, S., and Curtis, A.: Power Performance Test Report for the U.S. Department of Energy 1.5-Megawatt Wind
Turbine., Tech. Rep. TP-5000-63684, NREL, Golden, CO, 2015.
Mortimer, A.: New ideas for improving wind-farm outputs, Windpower Engineering & Development, pp. 46–50, 2016.5
Ning, S. A., Hayman, G., Damiani, R., and Jonkman, J.: Development and Validation of a New Blade Element Momentum Skewed-Wake
Model within AeroDyn, in: AIAA SciTech 2015 – 33rd Wind Energy Symposium, AIAA, Kissimmee, FL, doi:10.2514/6.2015-0215,
2015.
Schepers, J.: Annexlyse: Validation of Yaw Model, on Basis of Detailed Aerodynamic Measurements on Wind Turine Blades, Tech. Rep.
ECN-C-04-097, Energy Research Center of the Netherlands, The Netherlands, 2004.10
Schepers, J.: Engineering models in wind energy aerodynamics: Development, implementation and analysis using dedicated aerodynamic
measurements, Ph.D. thesis, TU Delft, The Netherlands, doi:10.4233/uuid:92123c07-cc12-4945-973f-103bd744ec87, 2012.
Schepers, J., Boorsma, K., and et al.: Final report of IEA Task 29, Mexnext (Phase 1) — Analysis of Mexico wind tunnel measurements,
Tech. Rep. ECN-E–12-004, Energy Center of the Netherlands, 2011.
Schreck, S. J. and Schepers, J.: Unconventional Rotor Power Response to Yaw Error Variations, Journal of Physics: Conference Series, 555,15
012 001, doi:10.1088/1742-6596/555/1/012001, 2014.
Vollmer, L., Steinfeld, G., Heinemann, D., and Kühn, M.: Estimating the wake deflection downstream of a wind turbine in different atmo-
spheric stabilities: An LES study, Wind Energy Science, in open discussion, doi:10.5194/wes-2016-4, 2016.
Wagenaar, J., Machielse, L., and Schepers, J.: Controlling wind in ECN’s scaled wind farm, in: Proceedings of the EWEA Annual Meeting,
Copenhagen, Denmark, 2012.20
Zalkind, D. S. and Pao, L. Y.: The Fatigue Loading Effects of Yaw Control for Wind Plants, in: 2016 American Control Conference, pp.
537–542, ACC, Boston Marriot Copley Place, Boston, MA, 2016.
25
Wind Energ. Sci. Discuss., https://doi.org/10.5194/wes-2017-38Manuscript under review for journal Wind Energ. Sci.Discussion started: 12 September 2017c© Author(s) 2017. CC BY 4.0 License.