assessment run 56 2019 c-myc · 790-4628 61 ventana/roche 8 19 16 18 44% 60% rmab clone y69...
TRANSCRIPT

Nordic Immunohistochemical Quality Control, C-MYC run 56 2019 Page 1 of 8
Assessment Run 56 2019
C-MYC
Material The slide to be stained for C-MYC comprised: 1. Tonsil, 2. Colon, 3. Burkitt lymphoma (BL), 4-5. Diffuse large B-cell lymphomas (DLBCL) All tissues were fixed in 10% neutral buffered formalin. Criteria for assessing a C-MYC staining as optimal included:
• A strong, distinct nuclear staining reaction of virtually all neoplastic cells of the Burkitt lymphoma. • A weak to moderate nuclear staining reaction in scattered epithelial cells in the basal crypts of the
colon. • A moderate to strong, distinct nuclear staining reaction in approximately 10% of lymphocytes
scattered both in the interfollicular zones and in the reactive germinal centers of the tonsil. • A weak, distinct nuclear staining reaction of mantle zone B-cells (app. 10-20%). • A moderate to strong, distinct nuclear staining reaction in 40-70% of the neoplastic cells of the
DLBCL, tissue core no. 4. • A weak nuclear staining reaction in less than 10% of the neoplastic cells of the DLBCL, tissue core
no. 5. • No nuclear staining reaction in the luminal epithelial cells of the colon. • No or only very faint cytoplasmic staining reaction must be seen.
Participation Number of laboratories registered for C-MYC, run 56 182 Number of laboratories returning slides 173 (95%) Results 173 laboratories participated in this assessment. Of these, 99 (57%) achieved a sufficient mark (optimal or good). Table 1 summarizes the antibodies (Abs) used and assessment marks (see page 2). The most frequent causes of insufficient staining reactions were: - Too low concentration of the primary antibody - Poor signal-to-noise ratio of assays based on the UltraView amplification kit - Use of less sensitive detection systems - Too short efficient Heat Induced Epitope Retrieval (HIER) time Performance history This was the first NordiQC assessment of C-MYC. (see Table 2). Table 2. Proportion of sufficient results for C-MYC in the first NordiQC run performed Run 56 2019 Participants, n= 173 Sufficient results 57% Conclusion The rabbit monoclonal antibody (rmAb) clones EP121 and Y69 could both be used to obtain optimal staining results for C-MYC. Irrespective of the clone applied, efficient HIER, preferably in alkaline buffer, use of sensitive detection system and careful calibration of the primary antibody were the most important prerequisites for an optimal staining result. The widely used Ready-To-Use (RTU) system 790-4628 from Ventana, based on the rmAb clone Y69, had a low overall pass rate. Laboratories using Ventana’s recommended protocol settings had a pass rate of 41%. The low pass rate was partly due to issues with background staining most likely related to the UltraView amplification kit. The pass rate improved to 69% when laboratory modified protocol settings designed to improve sensitivity was used.

Nordic Immunohistochemical Quality Control, C-MYC run 56 2019 Page 2 of 8
Tonsil and colon are recommended as positive and negative tissue controls for C-MYC, respectively. In tonsil, protocols must be calibrated to provide a moderate to strong, distinct nuclear staining reaction in approximately 10% of lymphocytes scattered both in the interfollicular zones and in the reactive germinal centers of the tonsil. A weak, distinct nuclear staining reaction of mantle zone B-cells (app. 10-20%) should also be seen. In colon, a weak to moderate nuclear staining reaction should be displayed in scattered epithelial cells in the basal crypts, whereas the luminal epithelial cells and smooth muscle cells of the tunica muscularis should display no nuclear staining reaction. As a supplement to tonsil and colon, especially in the technical calibration phase, it is recommended to verify the protocol on Burkitt lymphomas and DLBCLs with C-MYC rearrangements. Table 1. Antibodies and assessment marks for C-MYC, run 56
Concentrated antibodies n Vendor Optimal Good Borderline Poor Suff.1 Suff. OPS2
mAb clone 9E10 2 Diagnostic BioSystems 0 0 0 2 - -
rmAb clone EP121
26 15 12 1 1
Cell Marque Epitomics Biocare Medical Abcam Sakura Finetek
17 20 13 5 67% 72%
rmAb clone Y69 39 1
Abcam Eurobio 12 14 5 9 65% 79%
Ready-To-Use antibodies
rmAb clone EP121 PME 415 2 Biocare Medical 1 0 0 1 - -
rmAb clone EP121 PME 415 3 2 Biocare Medical 0 1 0 1 - -
rmAb clone EP121 395R-18 4 5 Cell Marque 3 1 1 0 - -
rmAb clone EP121 RMA-0803 1 Maixin 0 1 0 0 - -
rmAb clone Y69 MAD-000487QD-7/N 2 Master Diagnostica 0 1 1 0 - -
rmAb clone Y69 790-4628 61 Ventana/Roche 8 19 16 18 44% 60%
rmAb clone Y69 790-4628 5 3 Ventana/Roche 0 1 1 1 - -
Total 173 41 58 37 37 -
Proportion 24% 33% 21,5% 21,5% 57% 1) Proportion of sufficient stains (optimal or good). 2) Proportion of sufficient stains with optimal protocol settings only, see below. 3) RTU system developed for the BioCare IntelliPath system, but used on other systems. 4) RTU system developed for a manual Cell Marque protocol, but used on various automated systems. 5) RTU system developed for the Ventana BenchMark system, but used on other systems. Detailed analysis of C-MYC, Run 56 The following protocol parameters were central to obtain optimal staining: Concentrated antibodies rmAb clone EP121: Protocols with optimal results were all based on HIER using Cell Conditioning 1 (CC1, Ventana) (7/20)*, Target Retrieval Solution (TRS) High pH (Dako) (5/15), Bond Epitope Retrieval Solution 2 (BERS2; Leica) (2/6) or Tris-EDTA/EGTA pH 9 (2/3) as retrieval buffer. The mAb was typically diluted in the range of 1:10-1:100 depending on the total sensitivity of the protocol employed. Using these protocol settings, 31 of 43 (72%) laboratories produced a sufficient staining result (good or optimal). * (number of optimal results/number of laboratories using this HIER buffer) rmAb clone Y69: Protocols with optimal results were all based on HIER using CC1 (Ventana) (6/15), TRS pH9 (3-in-1) (Dako) (3/11), or BERS2 (Leica) (2/4) as retrieval buffer. One laboratory used a combined HIER and protease protocol based on HIER in CC1 (Ventana) followed by Protease 3 (Ventana) in 4 min. The mAb was typically diluted in the range of 1:40-1:100 depending on the total sensitivity of the protocol employed. Using these protocol settings, 19 of 25 (79%) laboratories produced a sufficient staining result.

Nordic Immunohistochemical Quality Control, C-MYC run 56 2019 Page 3 of 8
Table 3. Proportion of optimal results for C-MYC for the two most commonly used antibody concentrates on the four main IHC systems* Concentrated antibodies
Dako Autostainer Link /
Classic
Dako Omnis Ventana BenchMark XT / Ultra
Leica Bond III / Max
TRS pH 9.0
TRS pH 6.1
TRS pH 9.0
TRS pH 6.1
CC1 pH 8.5
CC2 pH 6.0
ER2 pH 9.0
ER1 pH 6.0
rmAb clone EP121
0/8** (0%) - 5/15
(33%) - 7/21 (33%) - 2/6
(33%) -
rmAb clone Y69
3/9 (33%) 0/2 0/4 - 7/16***
(44%) - 2/5 (20%) -
* Antibody concentration applied as listed above, HIER buffers and detection kits used as provided by the vendors of the respective systems. ** (number of optimal results/number of laboratories using this buffer) ***(One laboratory used a combined HIER and protease protocol) Ready-To-Use antibodies and corresponding systems rmAb clone EP121, product no. PME 415, Biocare, IntelliPATH: One protocol with an optimal result was based on HIER using Diva Decloaker pH 6.2 (efficient heating time 15 min. at 110°C), 30 min. incubation of the primary Ab and MACH 4 Universal HRP-polymer (M4U534) as detection system. rmAb clone Y69, product no. 790-4628, Ventana, BenchMark XT/Ultra: Protocols with optimal results were based on HIER using CC1 (efficient heating time 64-76 min. at 95-100°C), 16-32 min. incubation of the primary Ab. and UltraView with amplification (760-500 + 760-080) or OptiView (760-700) with or without amplification (760-099) as detection systems. Using these protocol settings, 18 of 30 (60%) laboratories produced a sufficient staining result. Table 4 summarizes the proportion of sufficient and optimal marks for the most commonly used RTU systems. The performance was evaluated both as “true” plug-and-play systems performed strictly according to the vendor recommendations and by laboratory modified systems changing basal protocol settings. Only protocols performed on the intended IHC stainer device are included. Table 4. Proportion of sufficient and optimal results for C-MYC for the most commonly used RTU IHC systems RTU-systems Recommended
protocol settings* Laboratory modified protocol settings**
Sufficient Optimal Sufficient Optimal VMS Ultra/XT/GX rmAb Y69 790-4628
41% (7/17) 6% (1/17) 45% (20/44) 16% (7/44)
* Protocol settings recommended by vendor – Retrieval method and duration, Ab incubation times, detection kit, IHC stainer/equipment. ** Significant modifications: retrieval method, retrieval duration and Ab incubation time altered >25%, detection kit – only protocols performed on the specified vendor IHC stainer were included. Comments In this first NordiQC assessment for C-MYC, focus was on C-MYC expression in lymphomas. Nuclear C-MYC expression can predict the presence of a MYC rearrangement, identifying cases for which MYC FISH analysis is warranted and cases in which FISH can be omitted1. Tissue material circulated included a Burkitt lymphoma harboring a MYC rearrangement resulting in high level C-MYC expression in the neoplastic cells and two DLBCLs without MYC rearrangements. The DLBCL in tissue core no. 5 displayed low level C-MYC expression (less than 10% neoplastic cells weakly positive), whereas the DLBCL in tissue core no. 4 showed moderate level C-MYC-protein expression. In the NordiQC reference laboratories 40-70% of the neoplastic cells displayed a moderate to strong nuclear staining reaction. In the present assessment, the prevalent features of insufficient staining results were characterized either by a generally too weak/false negative staining reaction of the cells expected to be demonstrated, a false positive staining reaction or a poor signal-to-noise ratio caused by excessive background staining. Too weak or false negative staining reaction was seen in 74% of the insufficient results (55 of 74), whereas 8% (6 of 74) displayed poor signal-to-noise ratio or false positive staining reaction. In the remaining 18% (13 of 74) of insufficient results, poor signal-to-noise ratio and/or false positive staining reaction in combination with a too weak staining reaction for C-MYC were seen. Virtually all laboratories were able to demonstrate C-MYC in high-level antigen expressing cells, e.g., the neoplastic cells of the Burkitt lymphoma. In contrast, C-MYC in the DLBCL tissue core no. 4 and the low-level antigen expressing cells in tonsil could only be demonstrated with an optimally calibrated protocol (see Fig 1 – Fig. 4).
Nordic Immunohistochemical Quality Control, C-MYC run 56 2019 Page 4 of 8
56% (97 of 173) of the laboratories used Abs as concentrated format within laboratory developed (LD) assays for C-MYC. Virtually all laboratories used the rmAb clones EP121 or Y69, and both could be used to obtain optimal staining results for C-MYC (see Table 1). Irrespective of the clone used, efficient HIER in an alkaline buffer was necessary for optimal performance (see Fig. 5 and Fig. 6). With rmAb clone EP121 optimal results could be obtained on all three main fully automated IHC platforms – Dako Omnis, Leica Bond and Ventana BenchMark, whereas no laboratories obtained optimal results on the semiautomated Dako Autostainer (see Table 3). Although the proportion of optimal results on the three platforms was an identical 33%, a significant difference was observed comparing the pass rates. Dako Omnis and Leica Bond had a pass rate of 80% (12 of 15) and 83% (5 of 6), respectively. On the Ventana BenchMark the pass rate was only 62%. The major reason for this difference seemed to relate to the choice of detection system. On the Dako Omnis and Leica Bond instruments, only 3-step polymer detection systems were used, whereas both 2-step and 3-step multimer systems was used on the Ventana BenchMark instrument. Excluding the laboratories using 2-step multimer detection systems improved the pass rate on the Ventana BenchMark to a comparable 76%. With rmAb clone Y69, optimal results could be obtained on the Autostainer, Bond and BenchMark, whereas no laboratories obtained optimal results on the Omnis (see Table 3). The lack of laboratories with an optimal score on the Omnis seemed to be related the use of to low concentration of the primary Ab on that platform compared to the other platforms. Two laboratories used the mAb clone 9E10 and both failed to produce the expected staining pattern (see Fig. 7).
44% (76 of 173) of the laboratories used a RTU system for detection of C-MYC and the vast majority (84%) used the rmAb clone Y69 based RTU system from Ventana (790-4628). The overall pass rate for this system was surprisingly low, only 44% (27 of 61) was assessed as sufficient, with 13% (8 of 61) being optimal (see Table 1). 28% (17 of 61) of the laboratories used the system according to Ventana’s recommended protocol settings and 41% were assessed as sufficient with 6% being optimal (see Table 4). 44 laboratories (72%) modified the recommended protocol settings and minor improvements in performance was registered. The pass rate rose from 41% to 45%, with 16% assessed as optimal. A more detailed analysis of the modified protocols identified two different sub-groups of laboratories: 18 laboratories used modifications that reduced the sensitivity of the protocol. These “negative” changes were typically a significant reduction in HIER time (to less than 48 min.) and/or the use of UltraView instead of one of the recommended detection kits, UltraView with amplification or OptiView. The remaining 26 laboratories used modifications that improved the sensitivity of the protocol. These “positive” changes were typically a significant extension in incubation time of the primary Ab (32 min. or longer) and/or the use of OptiView with tyramide amplification. Not surprisingly, comparison of these two sub-groups showed huge differences in pass rate. Laboratories using “positive” protocol modifications had a pass rate of 69% (18 of 26) with 27% assessed as optimal. In contrast, laboratories using “negative” protocol modifications had a pass rate of only 11% (2 of 18) and none were assessed as optimal. These data support the argument that Ventana/Roche should consider either to revise the recommended protocol settings for the RTU system 790-4628 or reformulate the system. Furthermore, the problems with the recommended protocol settings seems to be complicated by a recent issue with the quality of the UltraView amplification kit (760-080). A number of laboratories, predominantly in Denmark and Sweden, including two NordiQC reference laboratories, have reported problems with excessive background staining when the amplification kit (760-080) is used in combination with UltraView-HRP-DAB and UltraView-AP-RED (see MLA assessment, Run 56 report). The problem has been reported for numerous batch numbers of 760-080. Two different protocol settings for the 790-4628 RTU system is recommended by Ventana. One protocol is based on the OptiView-HRP-DAB detection kit and the other on UltraView-HRP-DAB incorporating the amplification kit 760-080. In the current assessment, 17 laboratories based their 790-4628 RTU-protocol on the UltraView detection kit with amplification and in 10 cases excessive background staining and/or poor signal-to-noise was reported (see Fig. 1 – Fig. 4). In contrast, no reports on excessive background staining and/or poor signal-to-noise were made when the OptiView detection kit was used (0 of 31). These data suggest that, at present, optimizing C-MYC protocols using the UltraView detection kit can be very challenging and that the OptiView detection kit may be the preferred option. Ventana is currently working on a new production of the amplification kit (760-080) that hopefully will solve the problem. Two laboratories used the rmAb clone EP121 based RTU system from BioCare (PME 415) tailored for the IntelliPATH instrument (BioCare). One laboratory followed BioCare’s recommended protocol settings and was assessed as optimal, whereas one laboratory used modified protocol settings and was assessed as insufficient. Controls Tonsil and colon are recommended as positive and negative tissue controls for C-MYC, respectivily. In tonsil, protocols must be calibrated to provide a moderate to strong, distinct nuclear staining reaction in approximately 10% of lymphocytes scattered both in the interfollicular zones and in the reactive germinal centers of the tonsil. A weak, distinct nuclear staining reaction of mantle zone B-cells (app. 10-20%)
Nordic Immunohistochemical Quality Control, C-MYC run 56 2019 Page 5 of 8
should also be seen. In colon, a weak to moderate nuclear staining reaction should be displayed in scattered epithelial cells in the basal crypts, whereas the luminal epithelial cells and smooth muscle cells of the tunica muscularis should display no nuclear staining reaction. As a supplement to tonsil and colon, especially in the technical calibration phase, it is recommended to verify the protocol on Burkitt lymphomas and DLBCL’s harboring C-MYC rearrangements.
1. Green TM, Nielsen O, de Stricker K, Xu-Monette ZY, Young KH, Møller MB. High levels of nuclear MYC protein predict the presence of MYC rearrangement in diffuse large B-cell lymphoma. Am J Surg Pathol. 2012 Apr;36(4):612–9.
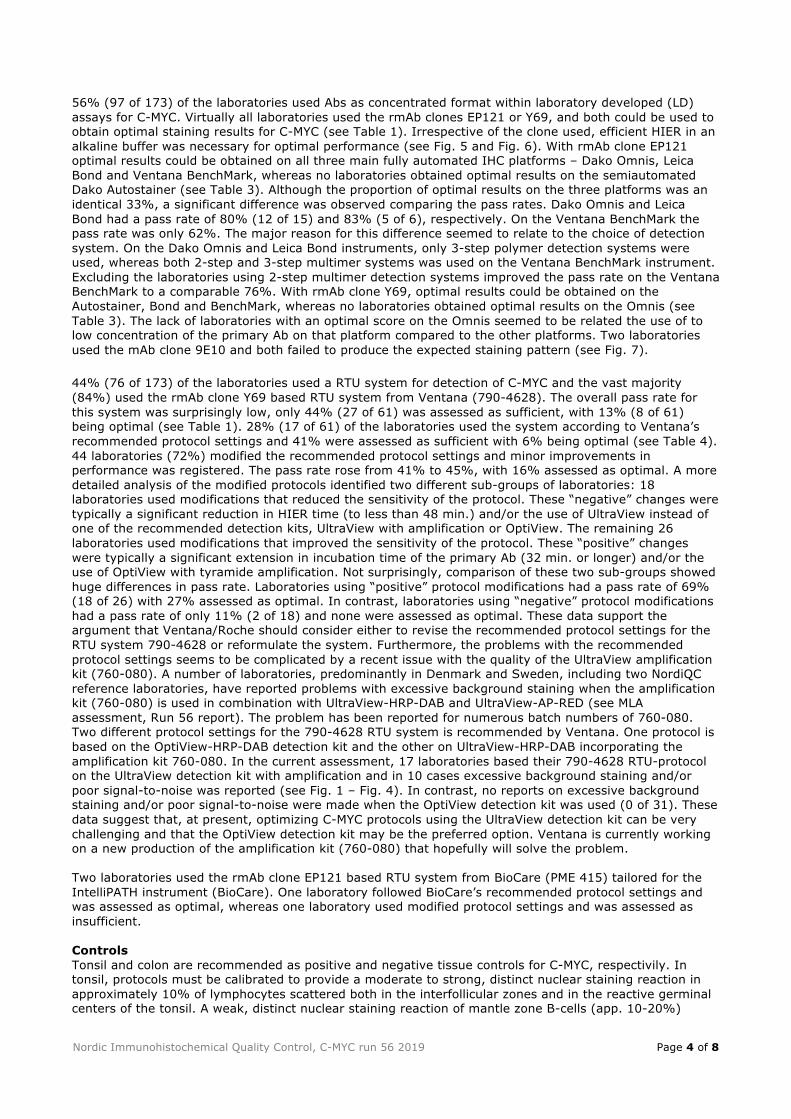
Fig. 1a Optimal C-MYC staining reaction of the tonsil using the rmAb clone EP121, optimally calibrated, HIER in CC1 (Ventana) and a 3-step multimer based detection system (OptiView/Ventana). A moderate to strong, distinct nuclear staining reaction is displayed in approximately 10% of lymphocytes scattered both in the interfollicular zones and in the reactive germinal centers of the tonsil. A weak, distinct nuclear staining reaction is displayed in 10-20% of mantle zone B-cells. No background staining is seen. Same protocol used in Figs. 2a - 4a.
Fig. 1b Insufficient C-MYC staining reaction of the tonsil using the rmAb clone Y69 based RTU system 790-4628 (Ventana) according to the recommended protocol settings (UltraView amplification based) – same field as in Fig. 1a. Excessive background staining – most likely related to the use of the UltraView amplification kit - combined with weak specific nuclear staining reaction results in poor signal-to-noise. Compare with Fig. 1a. Same protocol used in Figs. 2b - 4b.
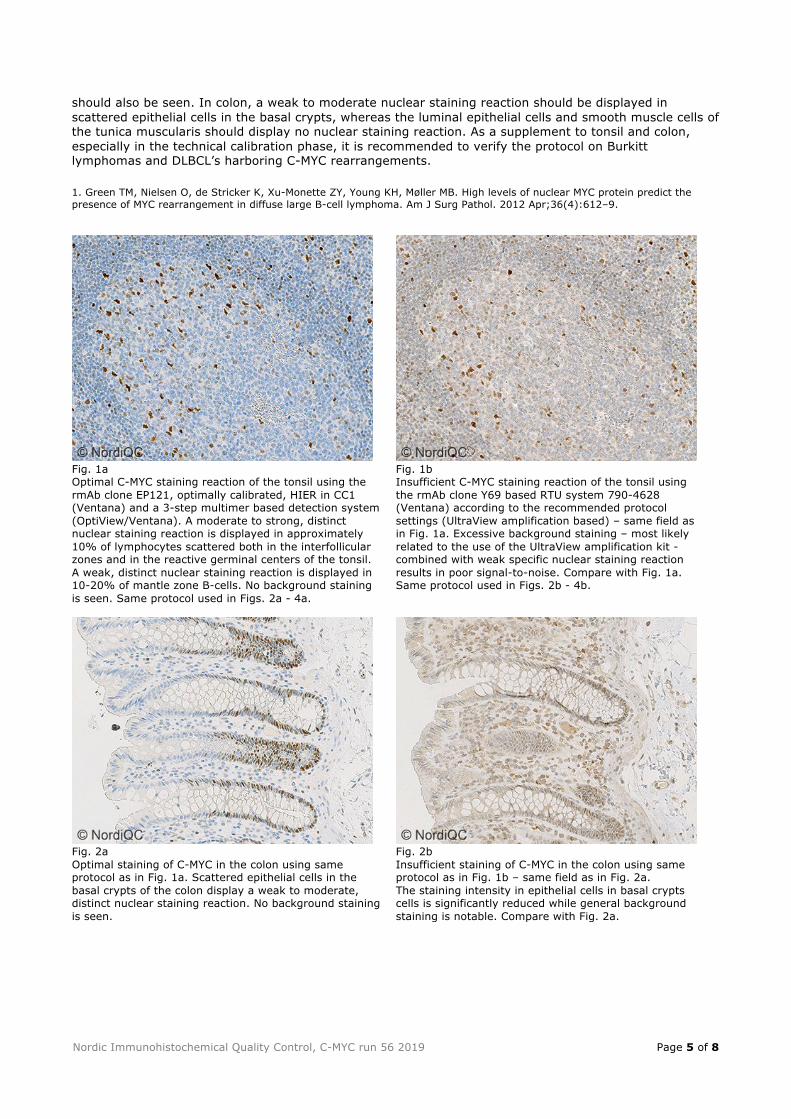
Fig. 2a Optimal staining of C-MYC in the colon using same protocol as in Fig. 1a. Scattered epithelial cells in the basal crypts of the colon display a weak to moderate, distinct nuclear staining reaction. No background staining is seen.
Fig. 2b Insufficient staining of C-MYC in the colon using same protocol as in Fig. 1b – same field as in Fig. 2a. The staining intensity in epithelial cells in basal crypts cells is significantly reduced while general background staining is notable. Compare with Fig. 2a.

Nordic Immunohistochemical Quality Control, C-MYC run 56 2019 Page 6 of 8
Fig. 3a Optimal C-MYC staining of the Burkitt lymphoma using same protocol as in Figs. 1a and 2a. Virtually all neoplastic cells display a strong, distinct nuclear staining reaction. No background staining is seen.
Fig. 3b Insufficient C-MYC staining of the Burkitt lymphoma using same protocol as in Figs. 1b and 2b - same field as in Fig. 3a. Virtually all neoplastic cells display a distinct nuclear staining reaction, but staining intensity is reduced compared to Fig. 3a. In this solid tumour tissue background staining is not evident but compare to Figs. 1b, 2b and 4b.
Fig. 4a Optimal C-MYC staining of the DLBCL, tissue core no. 4, using same protocol as in Figs. 1a – 3a. Approximately 40% of the neoplastic cells display a moderate and distinct nuclear staining reaction. No background staining is seen.
Fig. 4b Insufficient C-MYC staining of the DLBCL, tissue core no. 4, using same protocol as in Figs. 1b – 3b - same field as in Fig. 4a. Weak specific staining reaction combined with background staining makes diagnostic interpretation complicated. Compare with Fig. 4a.

Nordic Immunohistochemical Quality Control, C-MYC run 56 2019 Page 7 of 8
Fig. 5a Optimal C-MYC staining reaction of the tonsil using similar protocol settings as in Fig. 1a. HIER is performed in an alkaline buffer (CC1). A moderate to strong, distinct nuclear staining reaction is displayed in approximately 10% of lymphocytes scattered both in the interfollicular zones and in the reactive germinal centers of the tonsil. A weak, distinct nuclear staining reaction is displayed in 10-20% of mantle zone B-cells. No background staining is seen.
Fig. 5b Insufficient staining of C-MYC in the tonsil using protocol settings comparable to Fig. 5a, except for the use of HIER in citrate buffer pH6 – same field as Fig. 5a. Besides specific nuclear staining reaction in scattered lymphocytes, a dominant cytoplasmic background staining reaction is displayed in many cell types complicating interpretation. Compare with Fig. 5a.
Fig. 6a Optimal C-MYC staining of the DLBCL, tissue core no. 4, using same protocol as in Fig. 5a. Approximately 40% of the neoplastic cells display a moderate and distinct nuclear staining reaction. No background staining is seen.
Fig. 6b Insufficient C-MYC staining of the DLBCL, tissue core no. 4, using same protocol as in Figs. 5b - same field as in Fig. 6a. Weak specific staining reaction combined with cytoplasmic background staining makes diagnostic interpretation complicated. Compare with Fig. 6a.

Nordic Immunohistochemical Quality Control, C-MYC run 56 2019 Page 8 of 8
Fig. 7a Insufficient staining of C-MYC in the tonsil using the mAb clone 9E10 using protocol settings similar to Fig. 1a. No specific nuclear staining reaction is displayed only excessive background staining. Compare with Figs. 1a and 5a. Same protocol used in Fig. 7b.
Fig. 7b Insufficient staining of C-MYC in the colon using same protocol as in Fig. 7a. No specific nuclear staining reaction is displayed only excessive background staining. Compare with Fig. 2a. Same protocol used in Fig. 7a.
ON/LE/RR/MV/SN 08.07.2019