asset allocation guide - financial planner and wealth …regentatlantic.com/file library/investment...
TRANSCRIPT
1
Asset Allocation Guide:Standout Investing in 2015
Understanding the Behaviors of People and Markets toUncover Potential Opportunities and Strategies
to Avoid Pitfalls
RegentAtlantic1200 Mount Kemble Avenue Morristown, NJ 07960
(973) 425-8420
www.regentatlantic.com
®
RegentAtlantic – What We BelieveOur core belief is that value investing is the largest, most persistent investment opportunity. To implement avalue strategy well, we believe that investors should be prepared to look different than the crowd, have a longtime horizon in mind, incorporate quality metrics, and seek out as many different areas around the world wherevalues are attractive to stay diversified.
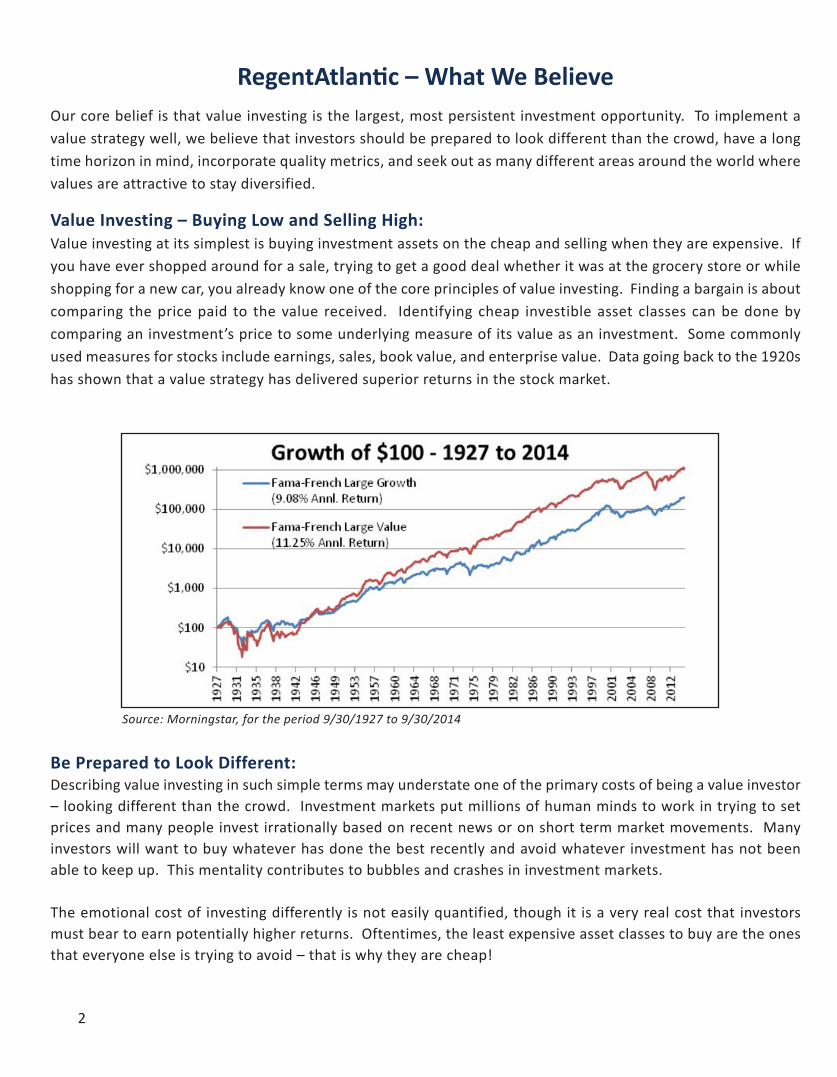
Value Investing – Buying Low and Selling High:Value investing at its simplest is buying investment assets on the cheap and selling when they are expensive. Ifyou have ever shopped around for a sale, trying to get a good deal whether it was at the grocery store or whileshopping for a new car, you already know one of the core principles of value investing. Finding a bargain is aboutcomparing the price paid to the value received. Identifying cheap investible asset classes can be done bycomparing an investment’s price to some underlying measure of its value as an investment. Some commonlyused measures for stocks include earnings, sales, book value, and enterprise value. Data going back to the 1920shas shown that a value strategy has delivered superior returns in the stock market.
Source: Morningstar, for the period 9/30/1927 to 9/30/2014
Be Prepared to Look Different:Describing value investing in such simple terms may understate one of the primary costs of being a value investor– looking different than the crowd. Investment markets put millions of human minds to work in trying to setprices and many people invest irrationally based on recent news or on short term market movements. Manyinvestors will want to buy whatever has done the best recently and avoid whatever investment has not beenable to keep up. This mentality contributes to bubbles and crashes in investment markets.
The emotional cost of investing differently is not easily quantified, though it is a very real cost that investorsmust bear to earn potentially higher returns. Oftentimes, the least expensive asset classes to buy are the onesthat everyone else is trying to avoid – that is why they are cheap!
2

3
Have a Long Time Horizon:Investors who have had the conviction to own portfolios of asset classes that are good values have reaped higherreturns over the long term. There have been times when herd behavior among other investors has led a valuestrategy to have lower performance than the market. To implement a value strategy well, an investor has to beprepared to look different to do well in the long term, even if that means having a lower return for some periodsin the short term.
Focus on Quality:Sometimes investments are cheap for a reason. Within our value oriented strategy, we maintain a focus onquality. When viewing companies some of the key areas we focus on are profitability and debt levels. Companiesthat have historically made wise decisions and earned a competitive return on equity relative to their competitorsare more likely to do so in the future. Maintaining reasonable debt levels within a corporate structure helpsposition a firm for stable long-term growth and provides safety in times of recession or specific disruptions to aparticular industry.
Diversification is Critical:Investors have many tools to identify investments that are good values, but few tools, if any, to fine tune theirtiming. No one has perfect foreknowledge of the markets and the turning point for when out-of-favor assetsclasses will become investor darlings again cannot be known with any certainty.
That means that to implement a value strategy well, investors should be prepared to buy low and sell high in asmany different asset classes around the world as possible. This could help to limit the risk of getting the timingwrong in any one asset class or investment. Taking a broad, global view of value investing increases theopportunity set and diversifies the portfolio across a range of different investments.

4
SIX WAYS WE SEEK TO ADD VALUE
RegentAtlantic Wealth Advisors and team members seek to add value in portfolio management in siximportant ways:
• Behavioral Counseling - we seek to align the client’s portfolioto the client’s time horizon and risk tolerance and to avoidthe behavioral mistakes made by many investors
• Asset Allocation – we combine uncorrelated asset classes inan effort to seek higher returns for a given level of risk (orlower risk for a given level of return)
• Security Selection – we seek the best tools to implementportfolio exposure within each asset class
• Spending Strategy – we seek to enhance after-tax returns byevaluating which accounts should fund retirement spendingfirst, and which should be left invested longer term
• Asset Location – we seek to enhance after-tax returns byskewing securities that generate most of their growth fromappreciation to taxable accounts and securities that generate most of their growth from incometo tax deferred accounts. Moreover, if tax-free growth accounts (ex. Roth IRA) exist, they are filledwith securities containing the highest growth potential
• Rebalancing – we use this disciplined strategy in an effort to buy low and sell high
ASSET ALLOCATION OVERVIEW
Other than market timing mistakes that are all too prevalent among investors today, the allocation of a client’sportfolio to different asset classes is the single greatest determinant of investment performance*. We diversifythe portfolio across a broad spectrum of different asset classes in an effort to reduce overall portfolio volatility.RegentAtlantic’s Investment Committee evaluates the relative risk and return characteristics of 16 separate assetclasses and cash on an ongoing basis. The objective is to select appropriate mixes of asset classes and within eachasset class, to carefully select the investments to comprise that allocation. Through this arduous process,RegentAtlantic has chosen 14 different assets as potentially desirable for portfolio allocation. These include 5“Wait List” Alternative asset categories that we may use when the portfolio managers deem market valuations tobe attractive. We have rejected two asset classes and will not use them.
This guide will describe each of the chosen asset classes and why we view them as potentially attractive portfoliocomponents. We will also explain briefly the rationale behind the Rejected Assets.
CHOSEN, WAIT LIST, AND REJECTED ASSET CLASSES
* Brinson, Gary P., Hood, L. Randolph, and Beebower, Gilbert L., “Determinants of Portfolio Performance”, The Financial Analysts Journal, July/August 1986
Fixed Income Assets Current Allocation
Growth Assets Current Allocation
Wait List Assets Rejected Assets
Cash 0% Global Large Cap Stocks
61% Hedging Strategies Managed Futures
Global Short Term Bonds 40% US Small Cap Stocks 5% High Yield Bonds Gold
Inflation Protected Bonds 15% Int’l Small Cap Stocks 10% Real Estate
Opportunistic Bonds 45% Emerging Markets 15% Commodities
Frontier Markets 3% Emerging Market Debt
Infrastructure 6%
e
h
ss Aemocn IdexiF
Cas
s nt
0% l
te erCurnatiocAllo
GtS
s
p
tess AhtworG
aCegraLlaobksoct
nt W
61% He
erCurnatiocAllo
s e
es Ma
tess Atsi LtiaW R
iategStrgniged
s
s
tess Adetcejee
eurutd Fanage
on
o
s
BmreTTetorhSlaoblG
BdetceotrPonitalfnI
donBcitsinutorppO
t
s 40% S
s 15% n
45% Em
r
S
dn U
dn I
F
ks
ks
ks
s
s
oct
octSpaCllamSS
octSpaCllamSl’t
tekraMgnigrem
tekkraMreiton
5% i
10% e
15% o
3% Em
H
R
C
De
s o
e
s
t
donBdleiYhg G
tatEslae
eitiodmom
ekkeraMgnigremt eb
dol
In
reutcurtsafr
De
6%
t eb
5
FIXED INCOME ASSETS
GLOBAL SHORT-TERM BONDS
• Debt securities issued by corporations andgovernments to raise capital.
• Offer a fixed, semi-annual payment to theinvestor based on the credit quality of theissuing entity.
• Upon maturity, barring any extreme event, theoriginal principal is returned to the investor infull.
• Provide a level of return with lower volatilitythan other asset classes.
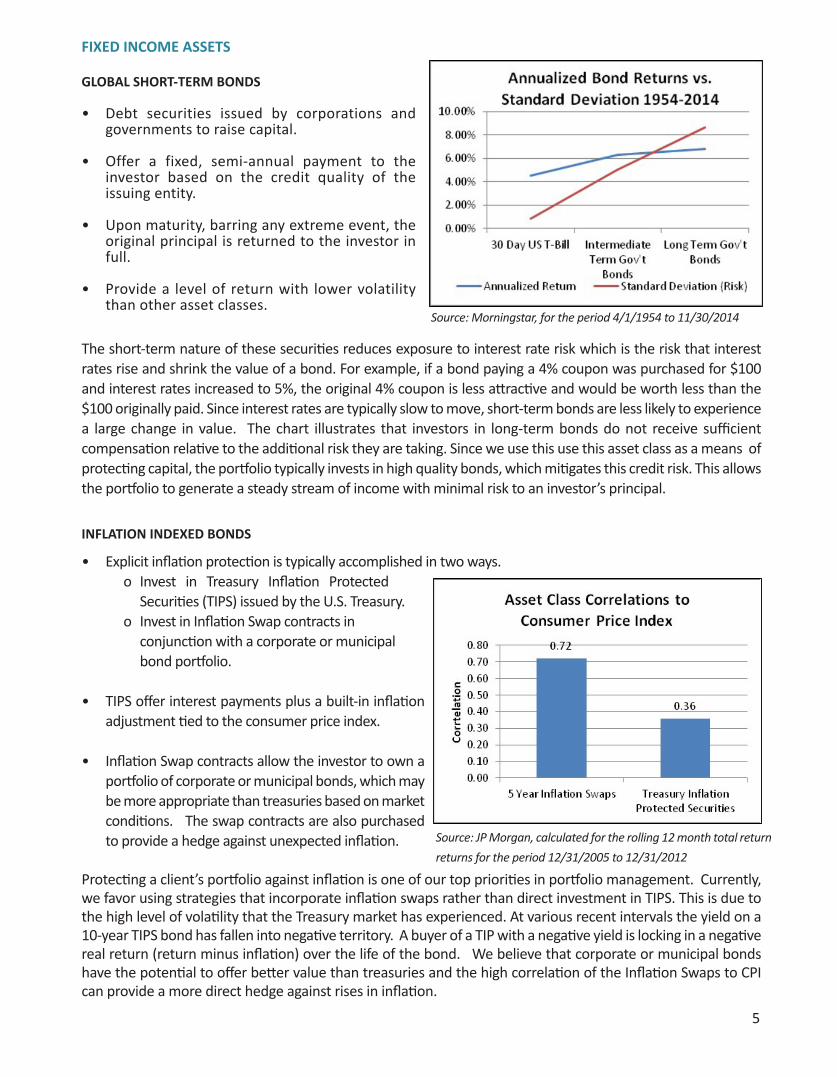
The short-term nature of these securities reduces exposure to interest rate risk which is the risk that interestrates rise and shrink the value of a bond. For example, if a bond paying a 4% coupon was purchased for $100and interest rates increased to 5%, the original 4% coupon is less attractive and would be worth less than the$100 originally paid. Since interest rates are typically slow to move, short-term bonds are less likely to experiencea large change in value. The chart illustrates that investors in long-term bonds do not receive sufficientcompensation relative to the additional risk they are taking. Since we use this use this asset class as a means ofprotecting capital, the portfolio typically invests in high quality bonds, which mitigates this credit risk. This allowsthe portfolio to generate a steady stream of income with minimal risk to an investor’s principal.
INFLATION INDEXED BONDS
• Explicit inflation protection is typically accomplished in two ways. o Invest in Treasury Inflation Protected
Securities (TIPS) issued by the U.S. Treasury.o Invest in Inflation Swap contracts in
conjunction with a corporate or municipal bond portfolio.
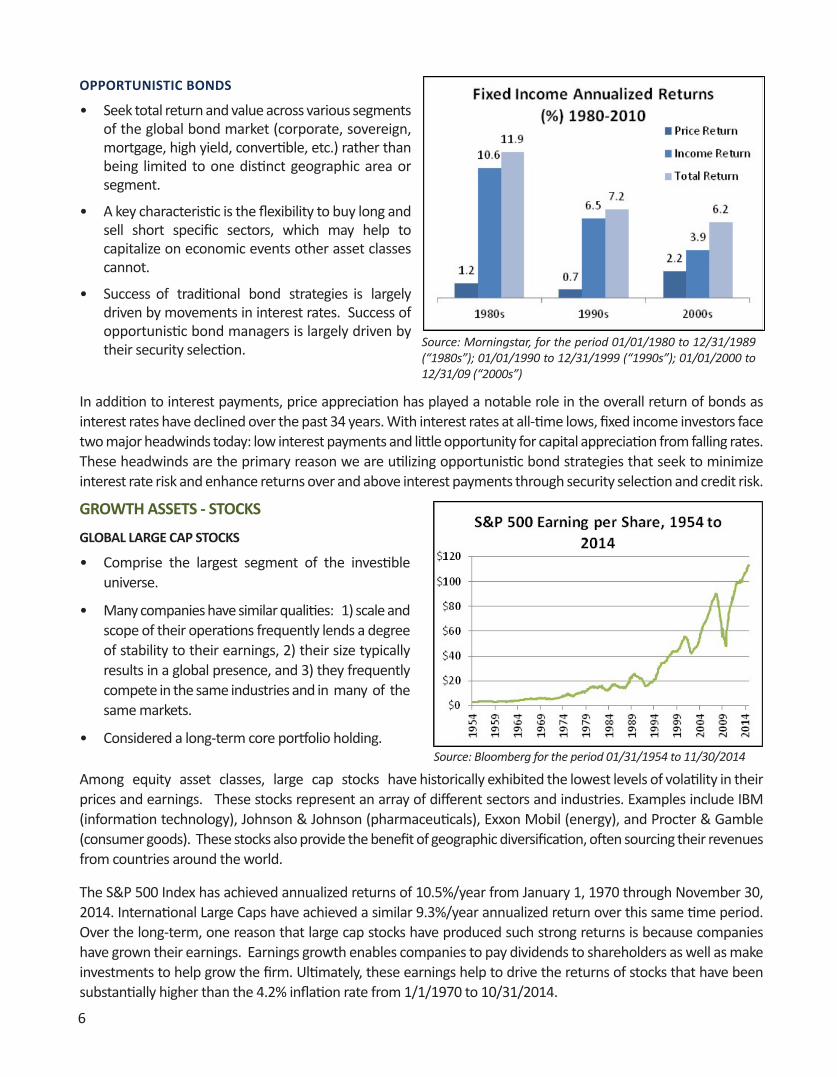
• TIPS offer interest payments plus a built-in inflationadjustment tied to the consumer price index.
• Inflation Swap contracts allow the investor to own aportfolio of corporate or municipal bonds, which maybe more appropriate than treasuries based on marketconditions. The swap contracts are also purchasedto provide a hedge against unexpected inflation.
Protecting a client’s portfolio against inflation is one of our top priorities in portfolio management. Currently,we favor using strategies that incorporate inflation swaps rather than direct investment in TIPS. This is due tothe high level of volatility that the Treasury market has experienced. At various recent intervals the yield on a10-year TIPS bond has fallen into negative territory. A buyer of a TIP with a negative yield is locking in a negativereal return (return minus inflation) over the life of the bond. We believe that corporate or municipal bondshave the potential to offer better value than treasuries and the high correlation of the Inflation Swaps to CPIcan provide a more direct hedge against rises in inflation.
o
Source: Morningstar, for the period 4/1/1954 to 11/30/2014
Source: JP Morgan, calculated for the rolling 12 month total return
returns for the period 12/31/2005 to 12/31/2012
6
OPPORTUNISTIC BONDS
• Seek total return and value across various segmentsof the global bond market (corporate, sovereign,mortgage, high yield, convertible, etc.) rather thanbeing limited to one distinct geographic area orsegment.
• A key characteristic is the flexibility to buy long andsell short specific sectors, which may help tocapitalize on economic events other asset classescannot.
• Success of traditional bond strategies is largelydriven by movements in interest rates. Success ofopportunistic bond managers is largely driven bytheir security selection.
In addition to interest payments, price appreciation has played a notable role in the overall return of bonds asinterest rates have declined over the past 34 years. With interest rates at all-time lows, fixed income investors facetwo major headwinds today: low interest payments and little opportunity for capital appreciation from falling rates.These headwinds are the primary reason we are utilizing opportunistic bond strategies that seek to minimizeinterest rate risk and enhance returns over and above interest payments through security selection and credit risk.
GROWTH ASSETS - STOCKS
GLOBAL LARGE CAP STOCKS
• Comprise the largest segment of the investibleuniverse.
• Many companies have similar qualities: 1) scale andscope of their operations frequently lends a degreeof stability to their earnings, 2) their size typicallyresults in a global presence, and 3) they frequentlycompete in the same industries and in many of thesame markets.
• Considered a long-term core portfolio holding.
Among equity asset classes, large cap stocks have historically exhibited the lowest levels of volatility in theirprices and earnings. These stocks represent an array of different sectors and industries. Examples include IBM(information technology), Johnson & Johnson (pharmaceuticals), Exxon Mobil (energy), and Procter & Gamble(consumer goods). These stocks also provide the benefit of geographic diversification, often sourcing their revenuesfrom countries around the world.
The S&P 500 Index has achieved annualized returns of 10.5%/year from January 1, 1970 through November 30,2014. International Large Caps have achieved a similar 9.3%/year annualized return over this same time period.Over the long-term, one reason that large cap stocks have produced such strong returns is because companieshave grown their earnings. Earnings growth enables companies to pay dividends to shareholders as well as makeinvestments to help grow the firm. Ultimately, these earnings help to drive the returns of stocks that have beensubstantially higher than the 4.2% inflation rate from 1/1/1970 to 10/31/2014.
Source: Morningstar, for the period 01/01/1980 to 12/31/1989(“1980s”); 01/01/1990 to 12/31/1999 (“1990s”); 01/01/2000 to12/31/09 (“2000s”)
Source: Bloomberg for the period 01/31/1954 to 11/30/2014
7
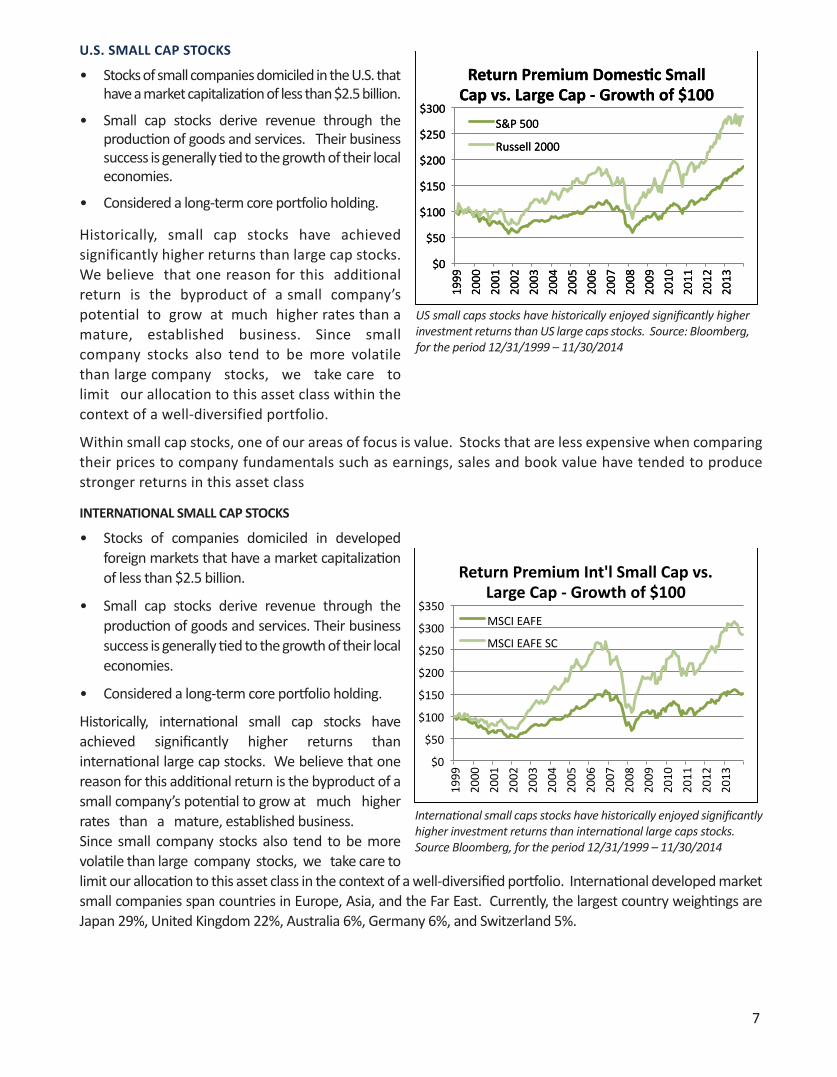
U.S. SMALL CAP STOCKS
• Stocks of small companies domiciled in the U.S. thathave a market capitalization of less than $2.5 billion.
• Small cap stocks derive revenue through theproduction of goods and services. Their businesssuccess is generally tied to the growth of their localeconomies.
• Considered a long-term core portfolio holding.
Historically, small cap stocks have achievedsignificantly higher returns than large cap stocks.We believe that one reason for this additionalreturn is the byproduct of a small company’spotential to grow at much higher rates than amature, established business. Since smallcompany stocks also tend to be more volatilethan large company stocks, we take care tolimit our allocation to this asset class within thecontext of a well-diversified portfolio.
Within small cap stocks, one of our areas of focus is value. Stocks that are less expensive when comparingtheir prices to company fundamentals such as earnings, sales and book value have tended to producestronger returns in this asset class
INTERNATIONAL SMALL CAP STOCKS
• Stocks of companies domiciled in developedforeign markets that have a market capitalizationof less than $2.5 billion.
• Small cap stocks derive revenue through theproduction of goods and services. Their businesssuccess is generally tied to the growth of their localeconomies.
• Considered a long-term core portfolio holding.
Historically, international small cap stocks haveachieved significantly higher returns thaninternational large cap stocks. We believe that onereason for this additional return is the byproduct of asmall company’s potential to grow at much higherrates than a mature, established business.Since small company stocks also tend to be morevolatile than large company stocks, we take care tolimit our allocation to this asset class in the context of a well-diversified portfolio. International developed marketsmall companies span countries in Europe, Asia, and the Far East. Currently, the largest country weightings areJapan 29%, United Kingdom 22%, Australia 6%, Germany 6%, and Switzerland 5%.
US small caps stocks have historically enjoyed significantly higherinvestment returns than US large caps stocks. Source: Bloomberg,for the period 12/31/1999 – 11/30/2014
International small caps stocks have historically enjoyed significantlyhigher investment returns than international large caps stocks. Source Bloomberg, for the period 12/31/1999 – 11/30/2014
8
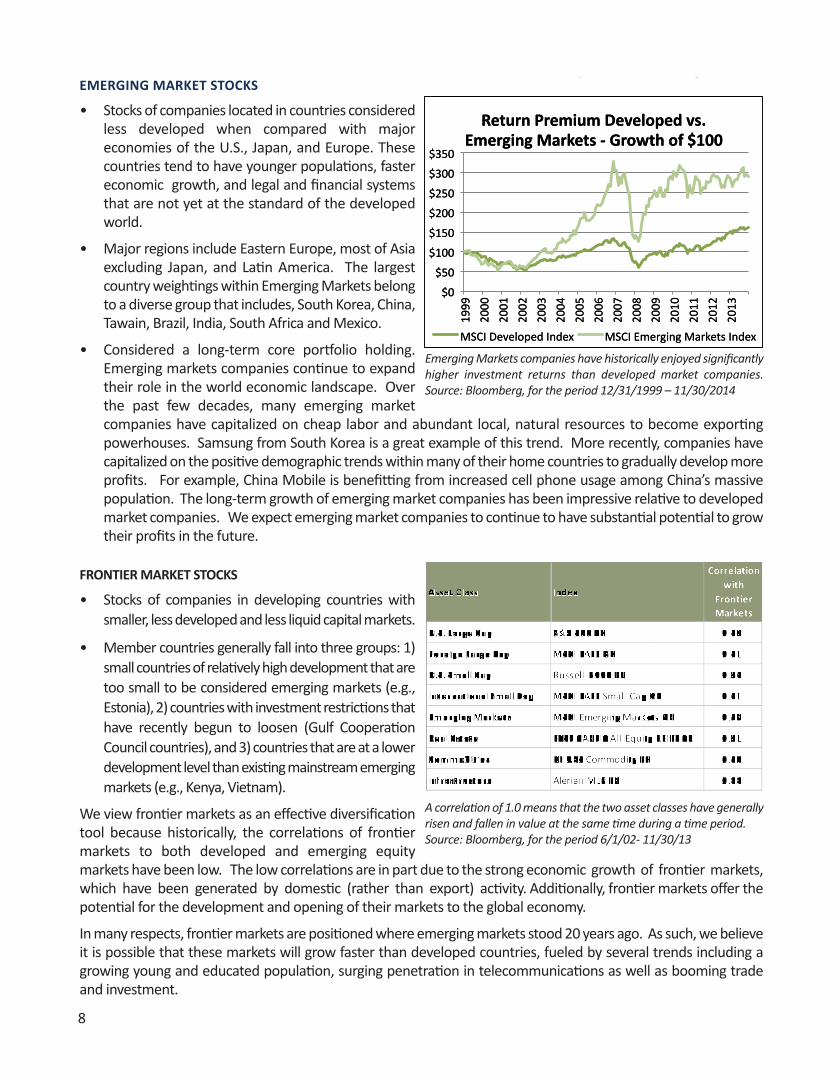
EMERGING MARKET STOCKS
• Stocks of companies located in countries consideredless developed when compared with majoreconomies of the U.S., Japan, and Europe. Thesecountries tend to have younger populations, fastereconomic growth, and legal and financial systemsthat are not yet at the standard of the developedworld.
• Major regions include Eastern Europe, most of Asiaexcluding Japan, and Latin America. The largestcountry weightings within Emerging Markets belongto a diverse group that includes, South Korea, China,Tawain, Brazil, India, South Africa and Mexico.
• Considered a long-term core portfolio holding.Emerging markets companies continue to expandtheir role in the world economic landscape. Overthe past few decades, many emerging marketcompanies have capitalized on cheap labor and abundant local, natural resources to become exportingpowerhouses. Samsung from South Korea is a great example of this trend. More recently, companies havecapitalized on the positive demographic trends within many of their home countries to gradually develop moreprofits. For example, China Mobile is benefitting from increased cell phone usage among China’s massivepopulation. The long-term growth of emerging market companies has been impressive relative to developedmarket companies. We expect emerging market companies to continue to have substantial potential to growtheir profits in the future.
FRONTIER MARKET STOCKS
• Stocks of companies in developing countries withsmaller, less developed and less liquid capital markets.
• Member countries generally fall into three groups: 1)small countries of relatively high development that aretoo small to be considered emerging markets (e.g.,Estonia), 2) countries with investment restrictions thathave recently begun to loosen (Gulf CooperationCouncil countries), and 3) countries that are at a lowerdevelopment level than existing mainstream emergingmarkets (e.g., Kenya, Vietnam).
We view frontier markets as an effective diversificationtool because historically, the correlations of frontiermarkets to both developed and emerging equitymarkets have been low. The low correlations are in part due to the strong economic growth of frontier markets,which have been generated by domestic (rather than export) activity. Additionally, frontier markets offer thepotential for the development and opening of their markets to the global economy.
In many respects, frontier markets are positioned where emerging markets stood 20 years ago. As such, we believeit is possible that these markets will grow faster than developed countries, fueled by several trends including agrowing young and educated population, surging penetration in telecommunications as well as booming tradeand investment.
Emerging Markets companies have historically enjoyed significantlyhigher investment returns than developed market companies.Source: Bloomberg, for the period 12/31/1999 – 11/30/2014
A correlation of 1.0 means that the two asset classes have generallyrisen and fallen in value at the same time during a time period.Source: Bloomberg, for the period 6/1/02- 11/30/13
9
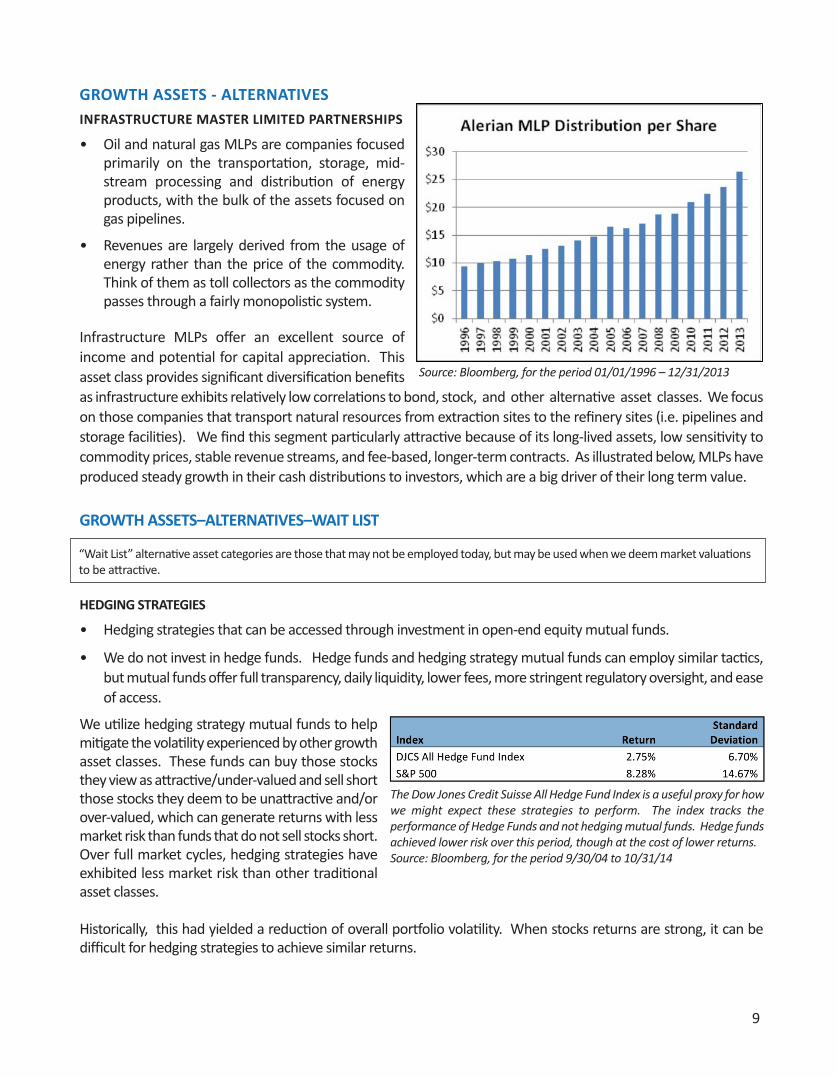
GROWTH ASSETS - ALTERNATIVESINFRASTRUCTURE MASTER LIMITED PARTNERSHIPS
• Oil and natural gas MLPs are companies focusedprimarily on the transportation, storage, mid-stream processing and distribution of energyproducts, with the bulk of the assets focused ongas pipelines.
• Revenues are largely derived from the usage ofenergy rather than the price of the commodity.Think of them as toll collectors as the commoditypasses through a fairly monopolistic system.
Infrastructure MLPs offer an excellent source ofincome and potential for capital appreciation. Thisasset class provides significant diversification benefitsas infrastructure exhibits relatively low correlations to bond, stock, and other alternative asset classes. We focuson those companies that transport natural resources from extraction sites to the refinery sites (i.e. pipelines andstorage facilities). We find this segment particularly attractive because of its long-lived assets, low sensitivity tocommodity prices, stable revenue streams, and fee-based, longer-term contracts. As illustrated below, MLPs haveproduced steady growth in their cash distributions to investors, which are a big driver of their long term value.
GROWTH ASSETS–ALTERNATIVES–WAIT LIST
HEDGING STRATEGIES
• Hedging strategies that can be accessed through investment in open-end equity mutual funds.
• We do not invest in hedge funds. Hedge funds and hedging strategy mutual funds can employ similar tactics,but mutual funds offer full transparency, daily liquidity, lower fees, more stringent regulatory oversight, and easeof access.
We utilize hedging strategy mutual funds to helpmitigate the volatility experienced by other growthasset classes. These funds can buy those stocksthey view as attractive/under-valued and sell shortthose stocks they deem to be unattractive and/orover-valued, which can generate returns with lessmarket risk than funds that do not sell stocks short.Over full market cycles, hedging strategies haveexhibited less market risk than other traditionalasset classes.
Historically, this had yielded a reduction of overall portfolio volatility. When stocks returns are strong, it can bedifficult for hedging strategies to achieve similar returns.
Source: Bloomberg, for the period 01/01/1996 – 12/31/2013
“Wait List” alternative asset categories are those that may not be employed today, but may be used when we deem market valuationsto be attractive.
The Dow Jones Credit Suisse All Hedge Fund Index is a useful proxy for howwe might expect these strategies to perform. The index tracks theperformance of Hedge Funds and not hedging mutual funds. Hedge fundsachieved lower risk over this period, though at the cost of lower returns.Source: Bloomberg, for the period 9/30/04 to 10/31/14

10
HIGH YIELD MUNICIPAL BONDS
• Debt obligations issued by states, localgovernments and other public authorities with anon-investment grade credit rating.
• Standard & Poor’s credit scale ranges from AAA(best) to D (worst). Bonds rated below BBB areconsidered high yield or Junk bonds.
• Generally pay higher yields than investmentgrade bonds due to the higher risk that the issuerwill be unable to make its required payments.
We do not believe that High Yield Bonds (HYB) shouldbe viewed as a core allocation for client portfolios. Overfull market cycles, HYBs are unlikely to produce enoughreturn to justify their higher risk. As shown in the chartto the right, municipal HYBs have historically produced higher returns than investment grade bonds. However, theHYB investors were on a relative roller-coaster ride. The BarCap Muni High Yield Index had a standard deviation(volatility) of 7.5%, while the Barcap Municipal Bond Index had a standard deviation of 4.4%.
Though HYBs are not always attractive as a whole asset class, bond managers that selectively pick from the high yieldbond universe as well as from other parts of the bond market may be nimble enough to add value in many marketenvironments. Our allocation to opportunistic bond managers gives us access to the best thinking of these managers.Municipal HYBs can be an excellent investment when yields rise to elevated levels. This generally occurs after a crisiscontaining one or more high-profile defaults.
REAL ESTATE INVESTMENT TRUSTS• REITs are liquid pools of commercial real estate
that trade on stock exchanges and must pay out90% of its earnings in dividends.
• Two types: 1) mortgage REITs that loan money and2) equity REITs that own properties.
• Equity REITs can provide geographic diversificationby owning properties in different regions of the US.International REITs own properties in foreigncountries.
• REITS can own different types of properties, suchas shopping malls, apartment buildings andoffice buildings.
REITS have experienced low correlation to the S&P 500 Index and the Barclay’s Aggregate Bond Index over thepast 10 years. Therefore, they are useful in diversifying the portfolio.
As shown in the chart, the average dividend yield on the NAREIT index has been approximately 5.4%. Investing inREITs contains significant risk and the best time to invest in REITs is when you are being compensated to take thatrisk with high dividend payments. While REITs are a component of our diversified portfolios during most timeperiods, we generally don’t believe that REITs are a reasonable investment when yields fall below 4%.
Source Bloomberg, for the Period 12/31/99 to 11/30/14
Source: Bloomberg, for the period 12/31/1995 – 11/30/2014
11
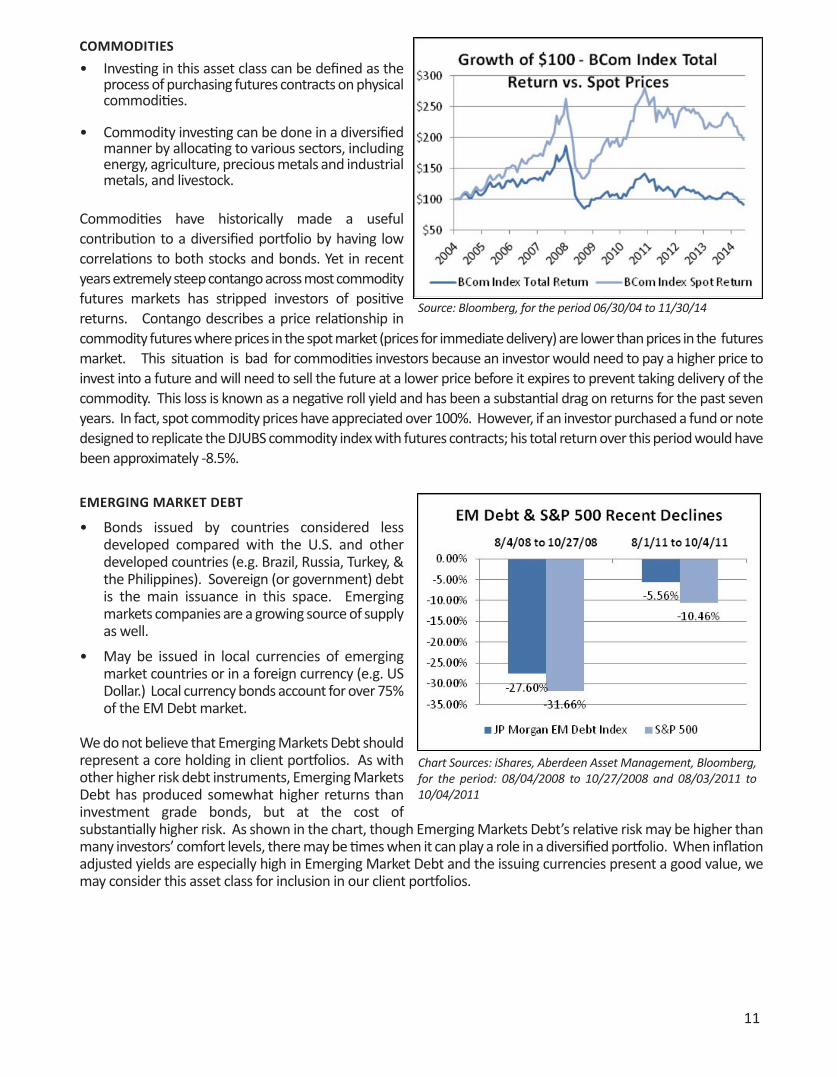
COMMODITIES
• Investing in this asset class can be defined as theprocess of purchasing futures contracts on physicalcommodities.
• Commodity investing can be done in a diversifiedmanner by allocating to various sectors, includingenergy, agriculture, precious metals and industrialmetals, and livestock.
Commodities have historically made a usefulcontribution to a diversified portfolio by having lowcorrelations to both stocks and bonds. Yet in recentyears extremely steep contango across most commodityfutures markets has stripped investors of positivereturns. Contango describes a price relationship incommodity futures where prices in the spot market (prices for immediate delivery) are lower than prices in the futuresmarket. This situation is bad for commodities investors because an investor would need to pay a higher price toinvest into a future and will need to sell the future at a lower price before it expires to prevent taking delivery of thecommodity. This loss is known as a negative roll yield and has been a substantial drag on returns for the past sevenyears. In fact, spot commodity prices have appreciated over 100%. However, if an investor purchased a fund or notedesigned to replicate the DJUBS commodity index with futures contracts; his total return over this period would havebeen approximately -8.5%.
EMERGING MARKET DEBT
• Bonds issued by countries considered lessdeveloped compared with the U.S. and otherdeveloped countries (e.g. Brazil, Russia, Turkey, &the Philippines). Sovereign (or government) debtis the main issuance in this space. Emergingmarkets companies are a growing source of supplyas well.
• May be issued in local currencies of emergingmarket countries or in a foreign currency (e.g. USDollar.) Local currency bonds account for over 75%of the EM Debt market.
We do not believe that Emerging Markets Debt shouldrepresent a core holding in client portfolios. As withother higher risk debt instruments, Emerging MarketsDebt has produced somewhat higher returns thaninvestment grade bonds, but at the cost ofsubstantially higher risk. As shown in the chart, though Emerging Markets Debt’s relative risk may be higher thanmany investors’ comfort levels, there may be times when it can play a role in a diversified portfolio. When inflationadjusted yields are especially high in Emerging Market Debt and the issuing currencies present a good value, wemay consider this asset class for inclusion in our client portfolios.
Source: Bloomberg, for the period 06/30/04 to 11/30/14
Chart Sources: iShares, Aberdeen Asset Management, Bloomberg,for the period: 08/04/2008 to 10/27/2008 and 08/03/2011 to10/04/2011
12
REJECTED ASSETS
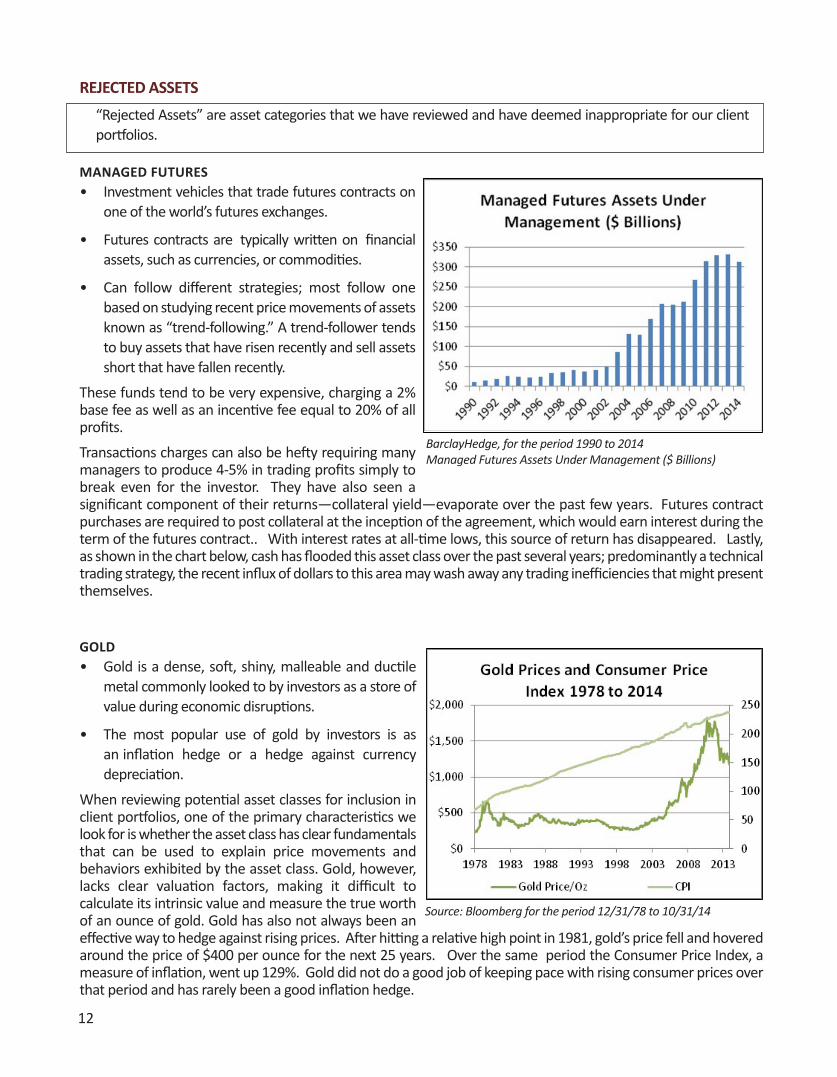
MANAGED FUTURES• Investment vehicles that trade futures contracts on
one of the world’s futures exchanges.
• Futures contracts are typically written on financialassets, such as currencies, or commodities.
• Can follow different strategies; most follow onebased on studying recent price movements of assetsknown as “trend-following.” A trend-follower tendsto buy assets that have risen recently and sell assetsshort that have fallen recently.
These funds tend to be very expensive, charging a 2%base fee as well as an incentive fee equal to 20% of allprofits.
Transactions charges can also be hefty requiring manymanagers to produce 4-5% in trading profits simply tobreak even for the investor. They have also seen asignificant component of their returns―collateral yield―evaporate over the past few years. Futures contractpurchases are required to post collateral at the inception of the agreement, which would earn interest during theterm of the futures contract.. With interest rates at all-time lows, this source of return has disappeared. Lastly,as shown in the chart below, cash has flooded this asset class over the past several years; predominantly a technicaltrading strategy, the recent influx of dollars to this area may wash away any trading inefficiencies that might presentthemselves.
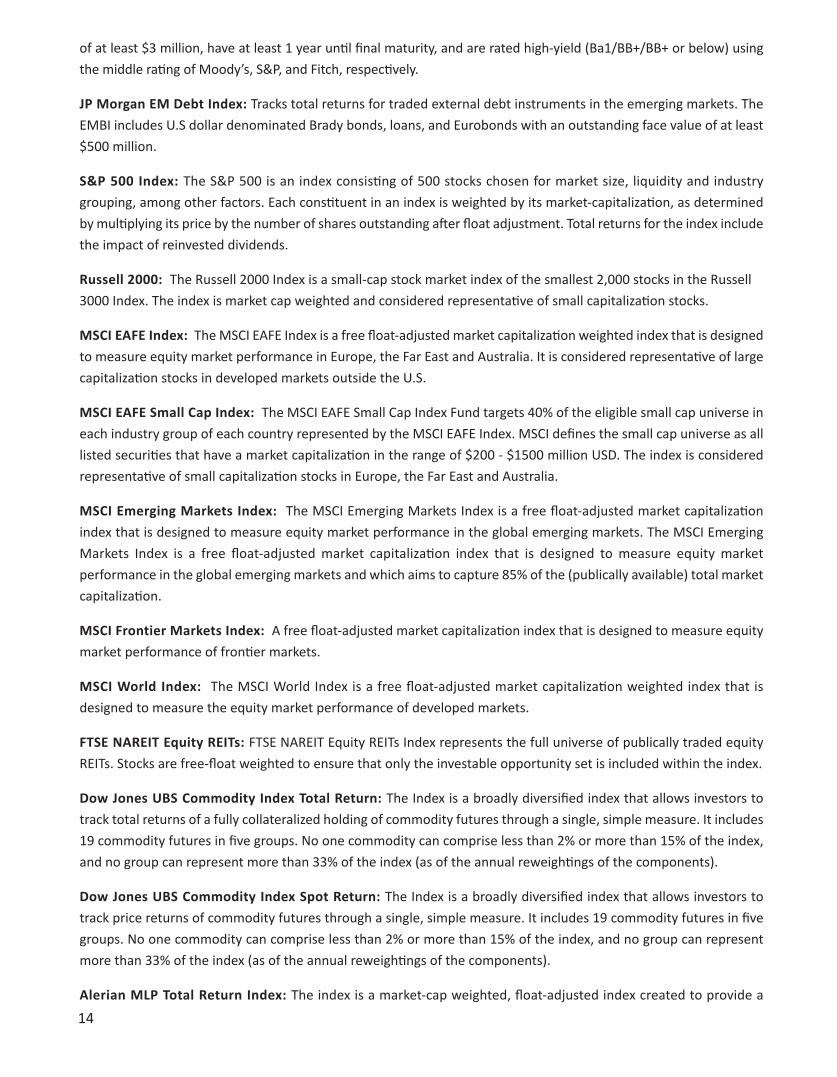
GOLD• Gold is a dense, soft, shiny, malleable and ductile
metal commonly looked to by investors as a store ofvalue during economic disruptions.
• The most popular use of gold by investors is asan inflation hedge or a hedge against currencydepreciation.
When reviewing potential asset classes for inclusion inclient portfolios, one of the primary characteristics welook for is whether the asset class has clear fundamentalsthat can be used to explain price movements andbehaviors exhibited by the asset class. Gold, however,lacks clear valuation factors, making it difficult tocalculate its intrinsic value and measure the true worthof an ounce of gold. Gold has also not always been aneffective way to hedge against rising prices. After hitting a relative high point in 1981, gold’s price fell and hoveredaround the price of $400 per ounce for the next 25 years. Over the same period the Consumer Price Index, ameasure of inflation, went up 129%. Gold did not do a good job of keeping pace with rising consumer prices overthat period and has rarely been a good inflation hedge.
“Rejected Assets” are asset categories that we have reviewed and have deemed inappropriate for our clientportfolios.
BarclayHedge, for the period 1990 to 2014Managed Futures Assets Under Management ($ Billions)
Source: Bloomberg for the period 12/31/78 to 10/31/14

13
Important Disclosure Information
Please remember that different types of investments involve varying degrees of risk, including the loss of moneyinvested. Past performance may not be indicative of future results. Therefore, it should not be assumed that futureperformance of any specific investment or investment strategy, including the investments or investment strategiesrecommended or undertaken by RegentAtlantic Capital, LLC (“RegentAtlantic”) will be profitable. Please remember tocontact RegentAtlantic if there are any changes in your personal or financial situation or investment objectives for thepurpose of reviewing our previous recommendations and services, or if you wish to impose, add, or modify anyreasonable restrictions to our investment management services. A copy of our current written disclosure statementdiscussing our advisory services and fees is available for your review upon request. This guide is not a substitute forpersonalized advice from RegentAtlantic. This information is current only as of the date on which it was sent. Thestatements and opinions expressed are, however, subject to change without notice based on market and otherconditions and may differ from opinions expressed in other businesses and activities of RegentAtlantic. Descriptionsof RegentAtlantic’s process and strategies are based on general practice and we may make exceptions in specific cases.
The allocations shown in this guide are the current allocations recommended by the Investment Committee. Theseallocations are subject to change based on the Investment Committee’s recommendations and is current as ofDecember 31, 2014.
The index returns listed show the total return for various investment indices and include the impact of thereinvestment of dividends. A comparison to indices may not be a meaningful comparison. Comparisons to benchmarkshave limitations because benchmarks have volatility and other material characteristics that may differ from theperformance of a client's portfolio. The investments in a client's portfolio may differ substantially from the securitiesthat comprise each index and are not intended to track the returns of any index. One cannot invest directly in an index,nor is any index representative of any client's portfolio. Actual client accounts will hold different securities than theones included in each index. The index returns are gross of applicable account transaction, custodial, and investmentmanagement fees. The actual investment results would be reduced by such fees and any other expenses incurred asan investor. The definition of the indexes used in this guide are listed below.
Definitions of Indexes Used:
BarCap Aggregate Bond Index: A broad-based benchmark that measures the investment grade, U.S. dollar-
dominated, fixed-rate taxable bond market, including Treasuries, government-related and corporate securities, MBS
(agency fixed-rate and hybrid ARM pass-throughs), ABS, and CMBS. The index was created in 1986, with index history
backfilled to January 1, 1976.
BarCap TIPS Index: The index measures the total return of all publicly issued US treasury inflation protected securities
that have at least 1 year remaining to maturity, are rated investment grade and have $250 million or more of
outstanding face value.
BarCap High Yield Corporate Bond Index: The Barclays Capital High Yield Index measures the total return of publicly
issued U.S. dollar denominated, non-investment grade, fixed-rate, taxable corporate bonds that have a remaining
maturity of at least one year, and are rated high-yield (Ba1/BB+/BB+ or below) using the middle rating of Moody’s,
S&P, and Fitch, respectively.
BarCap Municipal Bond Index – The Barclays Capital U.S. Municipal Bond Index measures the total return of the
long term tax exempt bond market. The index includes bonds with a par value of at least $7 million, have at least 1
year until final maturity, and have a minimum credit rating of Baa3/BBB-/BBB- using the middle rating of Moody’s,
S&P, and Fitch, respectively.
BarCap Municipal High Yield Index – The Barclays Capital U.S. High Yield Municipal Bond Index measures the total
return of the long term, sub investment grade, tax exempt bond market. The index includes bonds with a par value
14
of at least $3 million, have at least 1 year until final maturity, and are rated high-yield (Ba1/BB+/BB+ or below) using
the middle rating of Moody’s, S&P, and Fitch, respectively.
JP Morgan EM Debt Index: Tracks total returns for traded external debt instruments in the emerging markets. The
EMBI includes U.S dollar denominated Brady bonds, loans, and Eurobonds with an outstanding face value of at least
$500 million.
S&P 500 Index: The S&P 500 is an index consisting of 500 stocks chosen for market size, liquidity and industry
grouping, among other factors. Each constituent in an index is weighted by its market-capitalization, as determined
by multiplying its price by the number of shares outstanding after float adjustment. Total returns for the index include
the impact of reinvested dividends.
Russell 2000: The Russell 2000 Index is a small-cap stock market index of the smallest 2,000 stocks in the Russell
3000 Index. The index is market cap weighted and considered representative of small capitalization stocks.
MSCI EAFE Index: The MSCI EAFE Index is a free float-adjusted market capitalization weighted index that is designed
to measure equity market performance in Europe, the Far East and Australia. It is considered representative of large
capitalization stocks in developed markets outside the U.S.
MSCI EAFE Small Cap Index: The MSCI EAFE Small Cap Index Fund targets 40% of the eligible small cap universe in
each industry group of each country represented by the MSCI EAFE Index. MSCI defines the small cap universe as all
listed securities that have a market capitalization in the range of $200 - $1500 million USD. The index is considered
representative of small capitalization stocks in Europe, the Far East and Australia.
MSCI Emerging Markets Index: The MSCI Emerging Markets Index is a free float-adjusted market capitalization
index that is designed to measure equity market performance in the global emerging markets. The MSCI Emerging
Markets Index is a free float-adjusted market capitalization index that is designed to measure equity market
performance in the global emerging markets and which aims to capture 85% of the (publically available) total market
capitalization.
MSCI Frontier Markets Index: A free float-adjusted market capitalization index that is designed to measure equity
market performance of frontier markets.
MSCI World Index: The MSCI World Index is a free float-adjusted market capitalization weighted index that is
designed to measure the equity market performance of developed markets.
FTSE NAREIT Equity REITs: FTSE NAREIT Equity REITs Index represents the full universe of publically traded equity
REITs. Stocks are free-float weighted to ensure that only the investable opportunity set is included within the index.
Dow Jones UBS Commodity Index Total Return: The Index is a broadly diversified index that allows investors to
track total returns of a fully collateralized holding of commodity futures through a single, simple measure. It includes
19 commodity futures in five groups. No one commodity can comprise less than 2% or more than 15% of the index,
and no group can represent more than 33% of the index (as of the annual reweightings of the components).
Dow Jones UBS Commodity Index Spot Return: The Index is a broadly diversified index that allows investors to
track price returns of commodity futures through a single, simple measure. It includes 19 commodity futures in five
groups. No one commodity can comprise less than 2% or more than 15% of the index, and no group can represent
more than 33% of the index (as of the annual reweightings of the components).
Alerian MLP Total Return Index: The index is a market-cap weighted, float-adjusted index created to provide a

15
comprehensive benchmark for investors to track the performance of the energy MLP sector. It is a composite of the 50
most prominent energy master limited partnerships calculated by Standard & Poor's using a float-adjusted market
capitalization methodology. The Index components are selected by Alerian Capital Management, LLC.
Credit Suisse AllHedge Index: The Credit Suisse AllHedge Index is a diversified investable index of hedge funds. It
is comprised of 10 underlying indexes, representing the performance of hedge funds that specialize in the following
categories: Convertible Arbitrage, Dedicated Short Bias, Emerging Markets, Equity Market Neutral, Event Driven
(Distressed), Event Driven (Multi-Strategy), Event Driven (Risk Arbitrage), Fixed Income Arbitrage, Global Macro,
Long/Short Equity, Managed Futures, and Multi-Strategy.
Consumer Price Index: A measure that examines the weighted average of prices of a basket of consumer goods
and services, such as transportation, food and medical care. The CPI is calculated by taking price changes for each
item in the predetermined basket of goods and averaging them; the goods are weighted according to their importance.
Changes in CPI are used to assess price changes associated with the cost of living.
IA SBBI 30 Day T-Bills: A measure of total returns for a one bond portfolio holding the on-the-run 6 month
treasury bill.
IA SBBI 6 Month T-Bills: A measure of total returns for a one bond portfolio holding the on-the-run 6 month
treasury bill.
1 Year T-Notes: A measure of total returns for a one bond portfolio of a single treasury with a maturity near 1 year.
The index is considered representative of short term government bonds.
IA SBBI 5 Year T-Notes: A measure of total returns for a one bond portfolio of a single treasury with a maturity near
5 years. The index is considered representative of intermediate term government bonds.
IA SBBI 20 Year Government Bonds: A measure of total returns for a one bond portfolio of a single treasury with
a maturity near 20 years. The index is considered representative of long-term government bonds.