asset and liability management - national treasury budget/2000/review/chapter … · asset and...
TRANSCRIPT

105
5Asset and liability management
Overview
With the establishment of an Asset and Liability Management branch inthe Department of Finance, Government has brought an integratedapproach to the management of the State’s financial obligations, assetsand risks.
Asset management
The protocol on corporate governance issued during 1996 provides apoint of departure for normalising the financial accounts and tax anddividend policies of major state-owned enterprises. The principles in theprotocol will be incorporated into regulations to be issued in terms of thePublic Finance Management Act of 1999.
During 1999/00, proceeds from the restructuring of state-owned assetsamounted to R6,9 billion, or R2,9 billion more than budgeted. This wasmainly due to restructuring proceeds received from Sasria.
The restructuring of state-owned enterprises has gained momentum. TheDepartment of Public Enterprises is currently finalising an integratedrestructuring programme, in which priority will be given to the largerutilities and enterprises.
Liability management
Since the appointment of a panel of primary dealers on 1 April 1998, thefocus of debt management has turned to the development of the SouthAfrican securities market. The South African bond market has maturedconsiderably, creating opportunities for more active management of thedebt portfolio to reduce risks and debt servicing costs.
The net borrowing requirement during 1999/00 was substantiallyreduced to R14,3 billion, largely because of the receipt of a specialrestructuring dividend from Sasria. At the end of 1999/00, totalgovernment debt will amount to 46,4 per cent of GDP, down from a highof 48,2 per cent in 1996/97.
The net borrowing requirement in the 2000/01 financial year is expectedto be R20,3 billion. Of this amount, R13,6 billion will be financed in thedomestic market and the balance (about US$ 1 billion) in foreign capitalmarkets. The total outstanding debt is projected to decline steadily to45,0 per cent of GDP at 31 March 2001 and 42,0 per cent by the end of2002/03.
The interest costs of servicing state debt will amount to R44,5 billion in1999/00, which is R1,6 billion lower than budgeted mainly because of
Normalisation offinancial accounts of
public enterprises
Proceeds ofR6,9 billion in
1999/00
Shift in focus to activedebt management
Net borrowingrequirement of
R12,0 billion in1999/00
Declining debt-GDPratio
Debt costs lower thanbudgeted

Budget Review 2000
106
lower interest rates and debt reduction through state asset restructuring.State debt costs are estimated at R46,5 billion in 2000/01. Interest ondebt is steadily falling as a percentage of GDP, thereby freeing up taxresources for other priorities.
Contingent liabilities reflected in the Statement of Financially RelatedAssets and Liabilities have declined from R148,5 billion at 31 March1998 to R124,8 billion at 31 March 1999.
During the past year, several international credit rating agenciesacknowledged the positive political and economic developments inSouth Africa by raising their rating outlook for the country.
Asset management
Protocol on corporate governance
In consultation with the Department of Public Enterprises, a corporategovernance protocol was developed in 1996 and approved by Cabinet. Itprovides a framework for financial performance, including tax anddividend policies, and a code of corporate practice and conduct. Theprinciples of the protocol will be incorporated into regulations issued interms of the Public Finance Management Act of 1999.
The principles in the protocol signal Government’s commitment tonormalising the financial affairs of government business enterprises. Toensure transparency, the integrity of the budget and prudence in themanagement of public entities, any subsidisation of government businessenterprises that may be warranted should be done through the budgetallocation process and not through the retention of tax or dividends.
In 1998/99 Government received dividend payments of R475,8 millionand, in 1999/00, R610,2 million, excluding the special restructuringdividend received from Sasria.
During 1999, progress with the normalisation of tax and dividendpayments was as follows:
• Central Energy Fund (CEF): Consolidation of the group accounts andpayment of a first dividend of R180 million.
• Sasria: The Conversion of Sasria Act of 1998 was enacted and aspecial restructuring dividend of R6,2 billion was paid. Sasria will infuture pay normal dividends to Government, based on its profit levels.
• Eskom: The Eskom Amendment Act of 1998 is an important step inthe restructuring of Eskom and forms the basis for negotiations onrevoking its tax-exempt status and on dividend payments.
• Development Bank of Southern Africa (DBSA): The Board ofDirectors accepted the principle of becoming a tax- and dividend-paying entity. Negotiations currently focus on appropriatemechanisms to implement the policy while protecting the capital baseof this development finance institution.
Decline in contingentliabilities
Improved creditratings
Adoption of tax anddividend policies forpublic enterprises
Dividend receipts ofR610 million in1999/00

Asset and liability management
107
Restructuring of state assets
The restructuring of public enterprises will gather pace in 2000 andbeyond. The Department of Public Enterprises is developing anintegrated programme for restructuring, for consideration by the Inter-Ministerial Cabinet Committee in March 2000. The restructuring of thelarger public utilities – Telkom, Eskom, Denel and Transnet – willreceive priority.
During 1999/00 a further R43,9 million was received from the sale of theAirports Company, R6,2 billion from the restructuring of Sasria andR610 million from the sale of a 20 per cent stake in South AfricanAirways, bringing total net asset restructuring proceeds to R6,9 billion.In addition, secondary tax on companies of about R800 million was paidinto revenue as a result of the restructuring of Sasria.
The restructuring programme is coordinated by the Ministry of PublicEnterprises and is undertaken within the context of a NationalFramework Agreement. This agreement affords high priority to reducingstate debt, recapitalising public enterprises and broadening economicparticipation. While the primary focus for restructuring will be theenergy, transport, telecommunication and defence sectors, restructuringof other state-owned enterprises will occur concurrently. Variousapproaches are being adopted in the restructuring process, includingcorporatisation, concessioning, strategic equity partners, business re-engineering and divestiture. The capacity of the Department of PublicEnterprises has been enhanced in order to reinforce the restructuringprogramme.
Table 5.1 summarises the restructuring transactions that have beencompleted to date. A total investment of R8,6 billion has been raised,mainly from international equity partners, of which R3,3 billion has beenpaid to the exchequer to reduce debt. The conversion of Sasria into astate-owned company has allowed a further R6,2 billion in debt to beredeemed.
Table 5.1 Proceeds of the restructuring of state enterprises
R million
Date of transaction Stake sold
(%)
Proceeds fromsale of assets
Proceeds paid toexchequer toreduce debt
Sun Air November 1997 100 42,1 21,1
Telkom May 1997 30 5 630,5 1 165,4
SABC radio stations March 1997 100 510,4 510,4
Airports Company June 1998 25 1035,1 1035,1
South African Airways July 1999 20 1 400,0 610,5
Connex August 1999 100 15,0 –
Sasria February 2000 Special restructuring dividend 6 171,4
Total 8 633,1 9 513,9
The successful bidder for the Aventura holiday resorts did not meet thepayment obligations and Government was forced to terminate the salecontract. Government has since appointed the Protea Group to manageand restructure the company.
Proceeds fromrestructuring of state
assets
Reinforcement of therestructuring
programme
Proceeds of assetrestructuring
Termination of sale ofAventura

Budget Review 2000
108
Government has received 50 per cent of the proceeds of the sale of SunAir. The balance was to be paid in January 2000, but Sun Air has sincebeen liquidated. Government is negotiating with the former shareholders,Rethabile/Consolidated Network Investments, regarding payment of theoutstanding debt of R20 million and commitments under the employeeshare ownership programme.
A 30 per cent stake in Telkom was sold to the SBC/Telekom Malaysiaconsortium in 1997. Government received US$961 million (R5,6 billion)for the initial sale, and invested US$700 million as its share of aUS$1,0 billion recapitalisation programme. The net proceeds(R1,2 billion) were paid to the exchequer.
An amount of R510 million was received from the sale of six radiostations and was paid to the exchequer.
A 20 per cent equity stake in the Airports Company was sold forR819 million to Aeroporti di Roma, which also has an option to acquirea further 10 per cent stake on the public listing of the company. A 10 percent share has been reserved for black economic empowerment, of which4,2 per cent was taken up for an amount of R173 million. Of the 9 percent set aside for sale to management and employees, 1,2 per cent,valued at R43,8 million, was sold in October 1999.
The sale has been finalised of a 20 per cent stake in South AfricanAirways to Swissair for R1,4 billion. Government agreed to the disposalof a further 10 per cent equity stake to economic empowerment groups,the National Empowerment Fund and employees. In keeping with aburden-sharing agreement, Government will take over R1,3 billion of theshortfall in the Transnet Pension Fund attributable to South AfricanAirways.
Proceeds received by the exchequer from the sale of strategic oil stockssince 1995/96 are shown in Table 5.2.
Table 5.2 Proceeds from the sale of strategic oil stocks
R million 1995/96 1996/97 1997/98 1998/99 Total
Proceeds 1 336 1 603 2 947 1 730 7 616
Current public enterprise initiatives
Preparations are in progress for further equity partnerships or outrightsales of government businesses. An amount of R5,0 billion is anticipatedfor the reduction of state debt from the proceeds of the restructuring ofstate assets during 2000/01.
Negotiations are proceeding for the finalisation of prices and conditionsfor the restructuring of SAFCOL and lease of forests managed by theDepartment of Water Affairs and Forestry. Preferred bidders for theforestry packages are reflected in Table 5.3. These transactions aim toachieve greater competition in the forestry and saw-milling industry, andblack economic empowerment groups are expected to become significantplayers. The Mpumalanga and Northern Province packages have been re-offered on a stand-alone basis, and the process is to be completed by
Sun Air negotiationsin progress
Telkom 30% sharesold
Radio stations
Airports Companyempowerment andemployeeparticipation
South AfricanAirways 20% stakesold
Proceeds from thesale of strategic oilstocks
Forestry restructuringto be finalised thisyear

Asset and liability management
109
June 2000. Government is reviewing its position on the Western Capepackage with alternative land-use considerations. In addition to theproceeds of these transactions, Government will receive an annualincome from the lease of the land and significant savings will beachieved in respect of forests currently managed by the Department.
Table 5.3 Government-approved bidders for SAFCOL andgovernment forests
Package Consortia
Southern Cape Thesen consortium
Eastern Cape South Amathole Timber Holdings
Eastern Cape North Singisi Forest Products
KwaZulu-Natal Siyaqhubeka packages
With a view to putting Government’s diamond mining concern on asound footing, a 2-year strategic management contract has been awardedto Nabera, entailing the transfer of operational responsibility for Alexcor.A loan facility to the company to the value of R70 million has beenapproved, as has the withdrawal of Mmakau Mining from the Naberaconsortium.
The Eskom Amendment Act of 1998 constitutes an important step in therestructuring of Eskom. The Act vests ownership of the equity in thestate and establishes the legal basis for revoking Eskom’s tax-exemptstatus and for the payment of dividends. Eskom is currently restructuringinto separate generation, transmission and distribution corporate entities.
The Conversion of Sasria Act of 1998 provides for the conversion of theSA Special Risks Association into a public company owned by the state.At the time of the conversion, Sasria held reserves in excess ofR10,0 billion. In terms of the Act, Government appointed an independentactuary to advise on the portion of the reserves that the converted Sasriawould require to continue its business. Based on the actuarial report, aspecial restructuring dividend of R6,2 billion was declared from theexcess reserves and applied to reduce public debt. R5,0 billion hasalready been received and the remainder is expected before the end of thefiscal year. The transaction also leads to a secondary tax on companiespayment of R800 million.
The Act further provides for the full privatisation of Sasria, by theMinister of Finance, after consultation with the short-term insuranceindustry. This process has commenced and a transaction advisor willshortly be appointed.
Government has approved that 5 per cent of Telkom’s equity, worth anestimated R970 million, should be sold to empowerment groups,employees and the National Empowerment Fund. Black economicempowerment groups were invited to submit applications for a 3 per centstake and the transaction should be concluded by October 2000.Approval has also been granted for the purchase by Telkom employeesof 2 per cent of shares, valued at R310 million. The Inter-MinisterialCabinet Committee has endorsed a 20 per cent initial public offer ofTelkom shares by 2001.
Alexcor under newmanagement
Division of Eskominto 3 entities
Sasria specialdividend of R6,2
billion…
…with privatisation tofollow
Telkom empowermentsale of shares andinitial public offer

Budget Review 2000
110
The corporatisation, restructuring and sale of Transnet’s non-corebusiness units have been approved. The sale of Connex Travel forR15 million has been completed. The disposal of Autonet, Protekon, AirChefs, Apron Service, Production House and Chemical Services isunderway. Transwerk has been corporatised into four entities –Transwerk Rollstock, Transwerk Traction, Transwerk Foundries andTranswerk Perway. Work is in progress on outstanding issues, includingcontractual commitments, the funding of pension obligations andmedical scheme arrangements.
Structural options and restructuring strategies for core businessesPortnet, Petronet and Spoornet are currently being discussed, with dueregard to the role of these entities in the broader transport sector.
Options for restructuring the arms industry are under review. The sale ofDenel’s non-core activities has been approved, as has the purchase of a50 per cent shareholding in Debis IT Services.
Government has approved the merger and consolidation into a singlecorporate entity of the information techonology service providers withinDenel (Ariel Technologies), Eskom and Transnet (Datavia).
The merger and corporatisation of the telecommunications divisions ofTransnet (Transtel) and Eskom have also been approved. A steeringcommittee comprising representatives of these entities and Governmenthas been convened.
The Inter-Ministerial Cabinet Committee has approved the sale of aminority stake in signal distributor Sentech to a strategic equity partnerto access capital, technology and expertise. Terms of reference have beendrawn up for the appointment of a transaction adviser.
Government has approved the appointment of advisers on therestructuring of the South African Broadcasting Corporation. Therestructuring is aimed at corporatisating the SABC, achieving aseparation of public broadcasting and commercial services, andimplementing transparent mechanisms for cross-subsidisation of theseservices.
The South African Post Office signed an agreement in September 1999appointing New Zealand Post International as a strategic managementpartner.
Cash management
The Finance Department’s asset management responsibilities includecontrol of short-term investments and cash management.
Since February 1994, Government has invested surplus cash in tax andloans accounts at the four major clearing banks. This assists the ReserveBank in managing the money market shortage and earns interest for theexchequer. Interest earned on tax and loans accounts since 1994/95 is setout in Table 5.4.
Sale of Transnet’snon-core enterprises
Review of options forTransnet core entites
Arms industryrestructuring
Consolidation of ITinterests
Telecommunicationsmerger
Sale of equity inSentech
Restructuring of theSABC
Management partnerfor the Post Office
Investment of surpluscash

Asset and liability management
111
Table 5.4 Interest earned on tax and loan accounts, 1994/95–1999/00
R million 1994/95 1995/96 1996/97 1997/98 1998/99 1999/00estimate
Total
Interest 309 779 943 452 750 500 3 733
Cash flow requirements in 1999/00 are illustrated in Figure 5.1. Peaksarise from seasonally high expenditure during April, interest payments ofabout R10,0 billion in August and February and repayments of loans ofR7,5 billion, R5,0 billion and R5,0 billion in November, December 1999and March 2000 respectively.
For similar reasons, monthly cash requirements in 2000/01 are expectedto be high in April and August, and February 2001. The repayment ofdomestic loans of R7,5 billion in May and R7,5 billion in November2000 and a foreign loan of about R1,8 billion in June 2000 will alsoresult in high cash flow requirements during the first half of the year.
Figure 5.1 Monthly surplus/deficit before borrowing, 1999/00–2000/01
-12
-10
-8
-6
-4
-2
0
2
4
6
Apr May Jun Jul Aug Sep Oct Nov Dec Jan Feb Mar
R billion 1999/002000/01
Liability management
The South African securities market has become increasingly liquid,partly in response to the introduction of regular bond auctions tocomplement the weekly treasury bill auctions and the market-makingrole of the panel of primary dealers appointed in April 1998. Thedomestic capital market has evolved to a point where the focus of debtmanagement can turn to strategies to reduce risks and debt servicingcosts further.
The soundness of the South African securities market is illustrated by itsperformance relative to other emerging markets during the financialcrisis of 1997 and 1998. Investor confidence has improved, reflected byincreased commitment of funds at the long end of the curve and activeparticipation of foreign investors in the domestic securities market.
Monthly peaks in cash flows
Increasingly liquiddebt market
Improved investorconfidence

Budget Review 2000
112
Over the last two years, the priority has been the development of thedomestic capital market, promoting a more balanced maturity structureand enhancing liquidity in Government’s benchmark funding securities.The management of debt has largely been governed by the principle thatdebt service costs are minimised in a liquid, well-functioning market forgovernment securities.
The matured securities market has created scope for Government to use abroader range of debt management techniques and strategies to reducedebt servicing costs:• Reduction of state debt cost: Switch auctions, for example, will be
used to manage redemptions of domestic government bonds. A switchis a repurchase of government securities before maturity, withpayment in terms of more liquid securities. Alternatively, the treasurycan repurchase securities for a cash settlement under suitable marketconditions. This provides a low risk mechanism for reducingborrowing costs.
• Debt consolidation: Consolidation of bond issues can enhance marketliquidity. The consolidation of several smaller outstandinggovernment bond issues improves market liquidity by focusingtrading activities on fewer instruments.
• Risk management: Recent international experience shows thatcountries that do not manage their liabilities properly becomevulnerable to market shocks. The Department of Finance is exploringoptions for managing the risk exposure of both the domestic andforeign liabilities of government to possible market shocks.
Borrowing requirement and financing
Borrowing requirement
The revised estimates of expenditure and revenue for 1999/00 yield abudget deficit of R19,7 billion, increasing to R23,1 billion in 2000/01,equivalent to 2,6 per cent of projected GDP. Table 5.5 shows theresulting borrowing requirements, with projections to 2002/03.
In the 1999 Budget provision was made for restructuring proceeds ofR4,0 billion. The revised estimate is R6,9 billion, mainly as a result ofthe conversion of Sasria to a state-owned public company. For the2000/01 year, restructuring receipts of R5,0 billion are anticipated.
The borrowing requirement is also affected by extraordinary expenditureitems. A payment of R152 million was made in 1999/00 as finalsettlement of outstanding obligations to the Closed Pension Fund forformer political office-bearers. Government’s burden-sharing agreementregarding Transnet Pension Fund shortfalls attributable to South AfricanAirways amounted to R1,3 billion, and R2,2 billion is provided for thetake-over of South African Rail Commuter Corporation debt during2000/01.
After asset restructuring proceeds and extraordinary payments, the netborrowing requirement for 1999/00 is expected to be R14,3 billion. Aftersimilar adjustments for 2000/01, the net borrowing requirement isR20,3 billion.
From capital marketdevelopment…
…to risk managementand cost reduction
Budget deficit
Sasria proceeds ofR6,9 billion
Extraordinarypayments adding todebt
Net borrowingrequirement
Asset and liability management
113
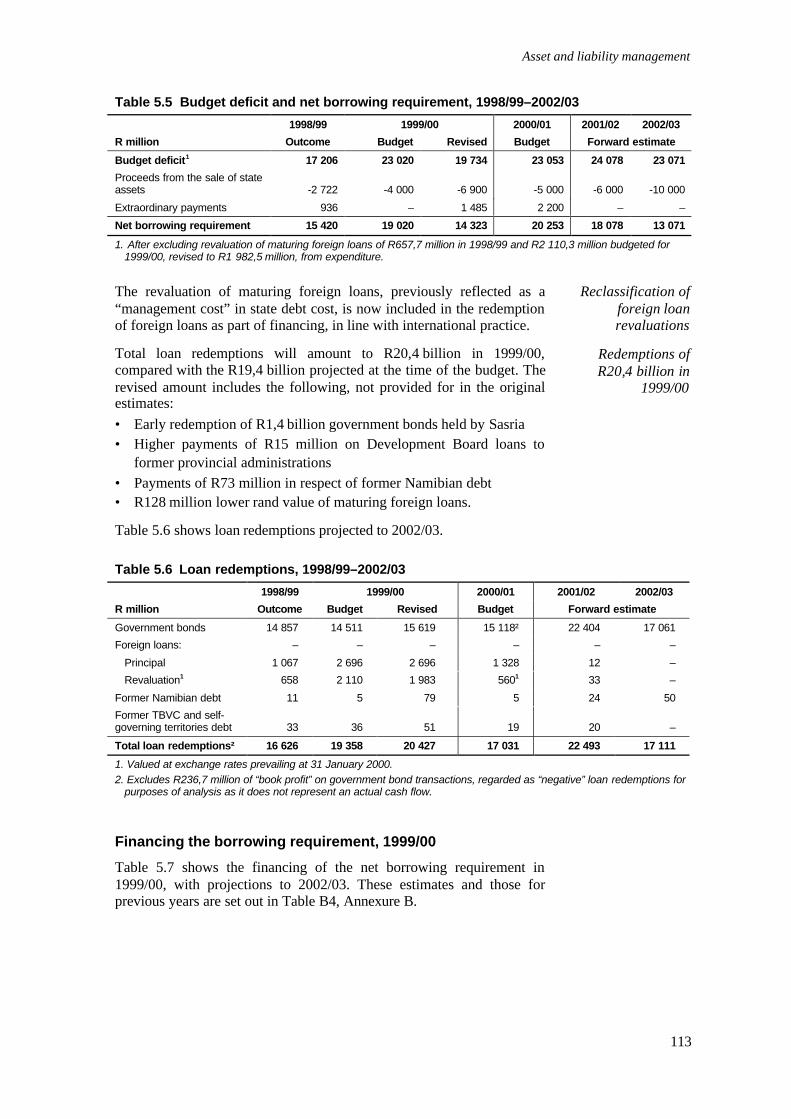
Table 5.5 Budget deficit and net borrowing requirement, 1998/99–2002/03
1998/99 1999/00 2000/01 2001/02 2002/03
R million Outcome Budget Revised Budget Forward estimate
Budget deficit1 17 206 23 020 19 734 23 053 24 078 23 071
Proceeds from the sale of stateassets -2 722 -4 000 -6 900 -5 000 -6 000 -10 000
Extraordinary payments 936 – 1 485 2 200 – –
Net borrowing requirement 15 420 19 020 14 323 20 253 18 078 13 071
1. After excluding revaluation of maturing foreign loans of R657,7 million in 1998/99 and R2 110,3 million budgeted for1999/00, revised to R1 982,5 million, from expenditure.
The revaluation of maturing foreign loans, previously reflected as a“management cost” in state debt cost, is now included in the redemptionof foreign loans as part of financing, in line with international practice.
Total loan redemptions will amount to R20,4 billion in 1999/00,compared with the R19,4 billion projected at the time of the budget. Therevised amount includes the following, not provided for in the originalestimates:• Early redemption of R1,4 billion government bonds held by Sasria• Higher payments of R15 million on Development Board loans to
former provincial administrations• Payments of R73 million in respect of former Namibian debt• R128 million lower rand value of maturing foreign loans.
Table 5.6 shows loan redemptions projected to 2002/03.
Table 5.6 Loan redemptions, 1998/99–2002/03
1998/99 1999/00 2000/01 2001/02 2002/03
R million Outcome Budget Revised Budget Forward estimate
Government bonds 14 857 14 511 15 619 15 118² 22 404 17 061
Foreign loans: – – – – – –
Principal 1 067 2 696 2 696 1 328 12 –
Revaluation1 658 2 110 1 983 5601 33 –
Former Namibian debt 11 5 79 5 24 50
Former TBVC and self-governing territories debt 33 36 51 19 20 –
Total loan redemptions² 16 626 19 358 20 427 17 031 22 493 17 111
1. Valued at exchange rates prevailing at 31 January 2000.2. Excludes R236,7 million of “book profit” on government bond transactions, regarded as “negative” loan redemptions for
purposes of analysis as it does not represent an actual cash flow.
Financing the borrowing requirement, 1999/00
Table 5.7 shows the financing of the net borrowing requirement in1999/00, with projections to 2002/03. These estimates and those forprevious years are set out in Table B4, Annexure B.
Reclassification offoreign loanrevaluations
Redemptions ofR20,4 billion in
1999/00

Budget Review 2000
114
Table 5.7 Financing of net borrowing requirement, 1998/99–2002/03
1998/99 1999/00 2000/01 2001/02 2002/03
Outcome Budget Revised Budget Forward estimate
Domestic short-term loans(net)
1 353 3 000 3 000 3 500 4 000 4 500
Domestic long-term loans(net)
18 215 14 826 4 985 10 141 7 124 1 071
New loans 39 310 33 092 23 904 26 293 33 805 20 446Discount on issue of new loans -6 194 -3 713 -3 171 -1 009 -4 234 -2 265Redemptions (net of bookprofit)
-14 901 -14 553 -15 749 -15 143 -22 447 -17 111
Foreign loans (net) -678 1 194 3 639 4 612 6 955 7 500New loans (net) 1 048 6 000 8 385 6 500 7 000 7 500Discount on issues of newloans
– – -67 – – –
Redemptions (includingrevaluation of loans)1
-1 725 -4 806 -4 679 -1 8881 -46 –
Change in cash and otherbalances2
-3 470 – 2 700 2 000 – –
Opening balance 3 230 2 000 6 699 4 000 2 000 2 000Cash balance 2 610 1 287 4 436 4 000 2 000 2 000Surrenders/Late requests 620 – 1 551 – – –Own Affairs balances – 713 713 – – –
Closing balance 6 700 2 000 4 000 2 000 2 000 2 000
Total financing (net) 15 420 19 020 14 323 20 253 18 078 13 0711. Valued at exchange rates prevailing on 31 March 1999 and forward projections for other financial years.2. A positive change indicates a reduction in cash balances.
The initial exchequer cash balance at the beginning of 1999/00 amountedto R5,1 billion, including surplus balances of R713 million on theaccounts of the former “own affairs” administrations. Departmentalsurrenders (net of late requests) of R1,6 billion brought the balancesavailable for 1999/00 to R6,7 billion, of which some R2,7 billion isexpected to contribute to the 1999/00 financing requirement.
To provide for the government’s forecast cash requirements in the firstquarter of 2000/01, a 1999/00 year-end balance of R4,0 billion will becarried forward to the new year. End-of-year balances of R2,0 billion areprojected over 2000/01 to 2002/03.
Short-term borrowing in 1999/00 is expected to contribute aboutR3,0 billion to financing, at an average interest rate of 11,5 per cent(budgeted 14 per cent). Government will continue to promote liquidity atthe short end of the market by increasing the volume of treasury billissues during 2000/01 by R3,5 billion. The increase in short-termfinancing since 1994/95 is illustrated in Table 5.8.
Cash balances andsurrenders ofR6,7 billion
Short-term loansincrease byR3,0 billion

Asset and liability management
115
Table 5.8 Short-term loans outstanding, 1994/95–2000/01
As at 31 March 1995 1996 1997 1998 1999 2000 2001
R million Estimate
Treasury bills:
Shorter than 91 days 1 880 – – – – – –
91 day 4 700 10 500 9 100 11 200 13 800 16 800 20 300
182 day – 200 5 200 6 085 5 200 5 200 5 200
Bridging bonds 8 453 4 267 – – – – –
Public Investment Commissioners 1 220 – – – – – –
Corporation for Public Deposits 600 600 2 567 1 497 1 117 1 117 1 117
Other1 32 14 12 12 10 10 9
Total 16 885 15 581 16 879 18 776 20 127 23 127 26 626
1. Loan levies and Bophuthatswana bonds.
Net finance raised through domestic bond issues in 1999/00 is projectedto be R5,0 billion, which is R9,8 billion lower than the budgeted amount.Less finance was raised in the domestic market because foreign loanfinancing and asset restructuring proceeds were higher than envisaged.
Up to 31 January 2000, new domestic loans with a total nominal value ofR16,3 billion were issued, at an average coupon rate of 11,3 per cent andan average yield of 14,2 per cent (budgeted 14,0 per cent). Details are setout in Table 5.9.
Table 5.9 Government bonds issued, 1999/00
As at 31 January 2000
R million
Bond issues Finance raised Discount Average yield(%)
Medium-term:
R193 (floating; 2003) 500 495 5 11,39
R175 (9,0%; 2003) 3 484 3 036 449 14,05
R150 (12,0%; 2005/06/07) 4 296 3 962 335 14,07
Long-term:
R153 (13,0%; 2010/11/12) 1 859 1 714 145 14,44
R157 (13,5%; 2015/16/17) 1 947 1 780 168 14,91
R186 (10,5%; 2025/26/27) 4 201 3 085 1 116 14,42
Medium-term bonds comprised 50,8 per cent of issues and long-termbonds 49,2 per cent.
A floating-rate bond (R193) maturing in March 2003 has been issued toreplace the R192 bond redeeming in March 2000. In addition, aninflation-linked bond will be issued during the first quarter of 2000, itsindexing based on headline CPI with a 3-month lag. The issuance ofCPI-linked bonds will become a feature of Government’s overall fundingstrategy.
Primary dealers are permitted to take up a further 10 per cent of theirallotted amounts at any auction, on a non-competitive basis, within24 hours of the close of the auction. About 4,4 per cent of the total bondissues for 1999/00 were taken up in terms of this option.
Domestic bond issuesraise R5,0 billion in
1999/00
Floating rate andCPI-linked bond
issues
Additional take-up ofbonds by primary
dealers

Budget Review 2000
116
Trading activity in the secondary bond market has continued to increasestrongly. During 1999, gross turnover in government bonds amounted toan estimated R8 469 billion, compared to R8 071 billion in 1998 and R3547 billion in 1997. Non-residents were net purchasers of R14 billion ingovernment bonds, whereas they accounted for net sales of R10 billionin 1998 and net purchases of R15 billion in 1997.
At the time of the 1999 Budget, it was envisaged that R6,0 billion wouldbe raised through foreign loans. In April 1999, Government entered theeuro-currency market with a 7-year E500 million eurobond launched at aspread of 328 basis points over German government bonds. This wasfollowed by a 10-year US$500 million global bond in the same month, ata spread of 370 basis points over United States government treasuries.Both bonds showed continuous strong performance last year.
In October 1999, government entered the foreign market again with a 5-year E300 million bond based on solid demand for South African bonds,supported by strong economic performance. This was the first to beexecuted off the euro medium-term note programme established inMarch 1999, and it brought total borrowing to approximatelyUS$1,3 billion, US$300 million more than budgeted.
Table 5.10 Foreign bond issues, 1999/00
Coupon Maturity Size Spread atlaunch
Currentspread 1
(%) (million) (basis points) (basis points)
6,750 19 May 2006 E500 328 175
9,125 19 May 2009 US$500 370 225
7,000 17 October 2004 E300 250 165
1. As at 15 February 2000
Financing the borrowing requirement, 2000/01
The projected net borrowing in domestic government bonds will totalR10,1 billion in 2000/01, while the gross borrowing requirement isprojected to be R26,3 billion. To smooth the maturity profile, fundingwill be spread over the medium and long end of the curve, whichincludes the R150, R177, R153, R157 and R186 government bonds. Inaddition, the R193 (a floating-rate bond) will be included in the 2000/01funding strategy, and a new inflation-linked instrument. To smooth theredemption curve and ensure liquidity throughout the yield curve, switchauctions will be conducted to repurchase bonds before maturity.
The projected foreign borrowing in 2000/01 is equivalent toUS$1,0 billion. Of this amount, about US$300 million will finance theexport credit agreements of the defence procurement programme, and thedefence purchases will continue to be financed within the envisagedforeign financing programme. Government pursues the following broadforeign borrowing objectives:• Establish liquid benchmarks in major currency markets• Maintain a balanced portfolio of foreign currency denominated debt• Broaden and improve the quality of the foreign investor base• Borrow at the most cost-effective rates.
Bond market turnover
Foreign issues ofeuro-bonds and US$global bond
Foreign borrowing ofUS$1,3 billion
Domestic netborrowing in 2000/01of R10,1 billion
Foreign borrowing ofUS$1,0 billion

Asset and liability management
117
The financing of the foreign borrowing requirement will to a large extentdepend on market conditions. Government will continue to use theflexibility of the euro medium-term note programme to access the marketwhen favourable opportunities arise.
Government debt portfolio
Other factors affecting debt
In addition to financing the national budget deficit, government debtincreased because R13,9 billion debt of the former TBVC-states and self-governing territories was converted to national debt during 1994/95, interms of the 1993 Constitution. The consolidation of this debt into thenational government’s debt portfolio has largely been completed.Outstanding balances to be incorporated are summarised in Table 5.11.About R1,4 billion in obligations of the Republic of Namibia were alsotaken over by Government in 1998.
Table 5.11 Former regional authorities’ debt incorporated into RSA debt instruments,1994/95–1999/00
As at 31 MarchR million 1995 1996 1997 1998 1999 2000
Short-term loans 8 594 4 278 9 9 7 7
Capital market loans 732 685 572 106 37 –
RSA government (Foreign Affairs) 483 448 430 411 – –
Industrial Development Corporation 130 117 103 86 74 62
Development Bank of Southern Africa 2 929 3 154 3 160 93 138 63
Other 3 1 – – – –
Total 12 872 8 683 4 273 705 255 132
Loan debt also increased since 1993/94 because government bondsamounting to R10,6 billion were issued to the Reserve Bank tocompensate for realised losses on the Gold and Foreign ExchangeContingency Reserve Account. In addition, a transfer of R7,4 billion wasmade to the government pension funds in 1993/94 to compensate for theimpact of early retirement offers to civil servants. Government’s burden-sharing of South African Airways’ unallocable debt, amounting toR1,3 billion, was settled in 1999/00.
Total government debt
After taking into account the balances of the National Revenue Fund(government’s accounts with the South African Reserve Bank andcommercial banks), total net loan debt declined from 48,2 per cent ofGDP at 31 March 1997 to a projected 46,4 per cent of GDP at the end of1999/00, as illustrated in Figure 5.2.
Consolidation ofRSA debt
Bond issues to theReserve Bank,pension funds
and SAA
Decline in net loandebt as % of GDP

Budget Review 2000
118
Figure 5.2 Government debt, 1980–2003
50
100
150
200
250
300
350
400
450
1980 1982 1984 1986 1988 1990 1992 1994 1996 1998 2000 2002
R billion
0
10
20
30
40
50
60
%
Foreign debtDomestic debt
Total debt as % of GDP
The projected increase in government debt of R14,1 billion in 1999/00 isexplained in Table 5.12.
Table 5.12 Increase in government debt, 1999/00
R million
Financing of the national budget 14 861
Unamortised discount on zero coupon bonds 178
Debt of the former regional structures/Namibia 94
Payments to Closed Pension Fund and SAA burden-sharing 1 485
Foreign loan revaluations and other adjustments 576
Increase in loan debt 17 194
Change in cash balances (decrease +) 1 166
Increase in net loan debt 18 360
Foreign exchange forward cover profits (-) realised by the SARB -4 231
Total projected increase in government debt 14 129
Total net loan debt is projected to be R398,3 billion on 31 March 2001.This is 45,0 per cent of expected GDP, compared with the estimated46,5 per cent of GDP on 31 March 2000. Total government debt mayalso be affected by:• revaluation of foreign loans because of exchange rates movements• forward cover losses or profits on the Gold and Foreign Exchange
Contingency Reserve Account• proceeds from the sale of state assets.
Based on the projected budget deficit, asset restructuring proceeds anddiscounts on bond issues for 2001/02 and 2002/03, total net loan debtwill decline further to 42,0 per cent of GDP by 31 March 2003.
The composition of government debt since 1995/96 is summarised inTable 5.13. Table B8 of Annexure B sets out the figures since 1975.
Increase in totalgovernment debt
Projected increase ingovernment debt

Asset and liability management
119
Table 5.13 Total government debt, 1996–2003
As at 31 March 1996 1997 1998 1999 2000 2001 2002 2003
R billion Forward estimate
Marketable domesticdebt
263,8 290,4 318,8 344,9 358,1 372,9 388,4 395,8
Non-marketabledomestic debt 4,7 6,4 2,8 2,0 2,1 2,0 2,0 2,0
Total domestic debt 268,5 296,8 321,5 346,9 360,2 374,9 390,4 397,8
Total foreign debt1 11,0 11,4 14,6 16,3 20,2 25,4 32,3 39,8
Total gross loan debt 279,5 308,2 336,1 363,2 380,4 400,3 422,8 437,6
Percentage of GDP 49,6% 48,6% 48,1% 48,1% 47,0% 45,2% 44,1% 42,2%
Less: National RevenueFund balance -8,6 -2,8 -4,8 -5,2 -4,0 -2,0 -2,0 -2,0
Total net loan debt 270,9 305,5 331,3 358,1 376,4 398,3 420,8 435,6
Percentage of GDP 48,0% 48,2% 47,4% 47,4% 46,5% 45,0% 43,9% 42,0%
Gold and ForeignExchange ContingencyReserve Account2 – 2,2 0,1 14,4 10,2 10,2 10,2 10,2
Total net governmentdebt 270,9 307,7 331,4 372,5 386,6 408,5 431,0 445,8
1. Valued at exchange rates prevailing at 31 January 2000.2. Mainly foreign exchange losses incurred through provision of forward cover by the Reserve Bank.3. The total net government loan debt is calculated with due account of the balance of the National Revenue Fund
(balances of government’s accounts with the South African Reserve Bank and the Tax and Loans Accounts withcommercial banks).
Total government debt includes the balance on the Gold and ForeignExchange Contingency Reserve Account at the Reserve Bank. Over thepast year profits made on forward contracts have brought the projectedbalance on this account to R10,2 billion on 31 March 2000, R4,2 billionlower than the balance a year ago.
Debt maturity profile
Government aims to keep annual bond redemptions at aboutR12,5 billion in 1997/98 prices, to prevent undue bunching. Table 5.14and Figure 5.3 illustrate the scope for further issues within this limit.
Table 5.14 Further potential issues of government bonds
Bond code R billion
R193 (floating TB; 2003) 0,7
R150 (12,0%; 2005/06/07) 2,4
R189 (floating CPI) 40,3
R177 (9,5%; 2008) 18,6
R153 (13,0%; 2010/11/12) 21,4
R157 (13,5%; 2015/16/17) 109,8
R186 (10,5%; 2026/27/28) 364,0
Forward cover losses
Maturity profile ofdomestic bonds

Budget Review 2000
120
Figure 5.3 Maturity profile of domestic marketable bonds,31 March 2000
20
40
60
80
100
120
140
160
01 03 05 07 09 11 13 15 17 19 21 23 25 27
R billionPotential issuesIssued
Bonds with an outstanding maturity of less than three years comprise16,3 per cent of the total domestic marketable bonds in issue,28,7 per cent lie between three and seven years, 4,1 per cent betweenseven and 10 years, 46,6 per cent between 10 and 19 years and4,3 per cent are dated longer than 19 years ahead. The average maturityis nine years, and the average duration of domestic marketable bonds isfive years.
Composition and ownership of domestic debt
On 31 March 2000 fixed-interest bonds are expected to comprise91,2 per cent of total domestic debt, while treasury bills should accountfor 6,1 per cent, as shown in Table 5.15.
Table 5.15 Composition of domestic debt, 1993/94–1999/00
As at 31 March
R million
1994 1995 1996 1997 1998 1999 2000Estimate
Government bonds:
Fixed interest 164 375 199 674 237 515 258 933 291 439 315 889 328 422
Floating 618 458 305 150 18 5 –
Zero coupon 10 517 10 517 11 362 17 191 10 049 10 049 7 711
Bridging Bonds – 8 453 4 267 – – – –
Treasury bills 6 568 6 580 10 700 14 300 17 285 19 000 22 000
Public Investment Commisioners – 1 220 – – – – –
Corporation for Public Deposits 1 979 600 600 2 567 1 479 1 117 1 117
Namibian loans – – – – 680 669 591
Other 713 3 865 3 795 3 704 601 222 399
Total 184 770 231 367 268 544 296 845 321 551 346 951 360 240
Average maturity /duration of domesticmarketable bonds
Composition ofdomestic debt
Asset and liability management
121
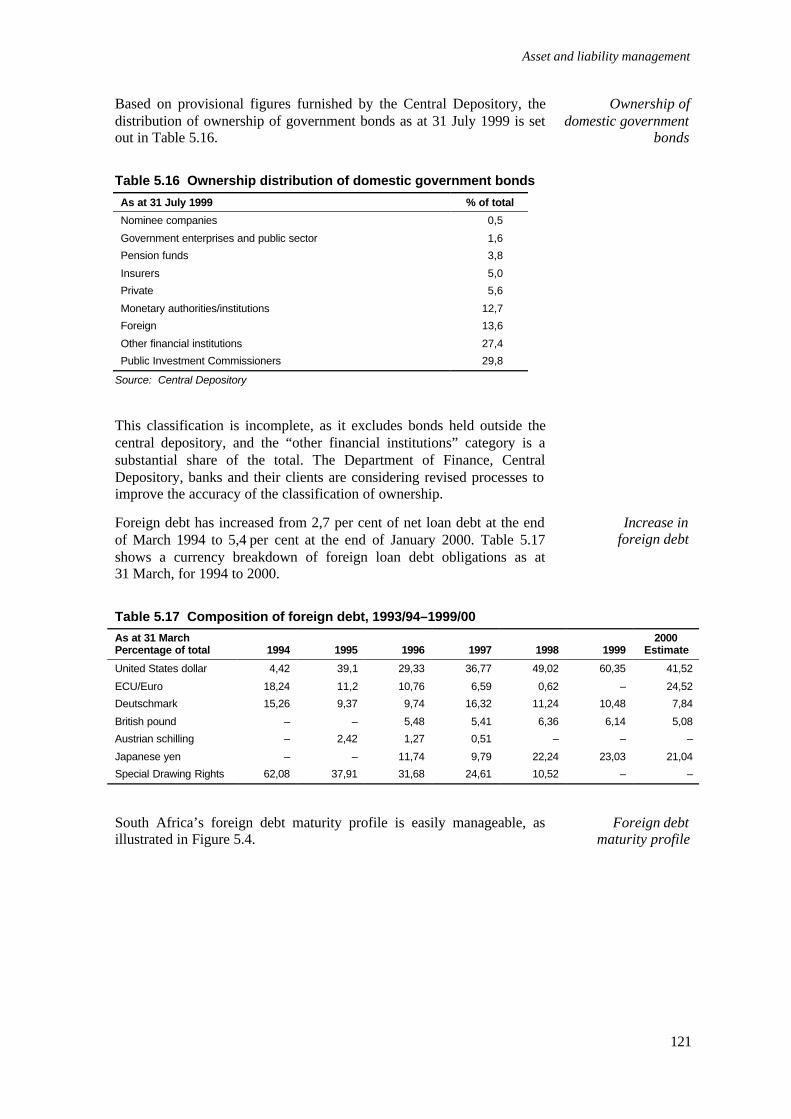
Based on provisional figures furnished by the Central Depository, thedistribution of ownership of government bonds as at 31 July 1999 is setout in Table 5.16.
Table 5.16 Ownership distribution of domestic government bonds
As at 31 July 1999 % of total
Nominee companies 0,5
Government enterprises and public sector 1,6
Pension funds 3,8
Insurers 5,0
Private 5,6
Monetary authorities/institutions 12,7
Foreign 13,6
Other financial institutions 27,4
Public Investment Commissioners 29,8
Source: Central Depository
This classification is incomplete, as it excludes bonds held outside thecentral depository, and the “other financial institutions” category is asubstantial share of the total. The Department of Finance, CentralDepository, banks and their clients are considering revised processes toimprove the accuracy of the classification of ownership.
Foreign debt has increased from 2,7 per cent of net loan debt at the endof March 1994 to 5,4 per cent at the end of January 2000. Table 5.17shows a currency breakdown of foreign loan debt obligations as at31 March, for 1994 to 2000.
Table 5.17 Composition of foreign debt, 1993/94–1999/00
As at 31 MarchPercentage of total 1994 1995 1996 1997 1998 1999
2000Estimate
United States dollar 4,42 39,1 29,33 36,77 49,02 60,35 41,52
ECU/Euro 18,24 11,2 10,76 6,59 0,62 – 24,52
Deutschmark 15,26 9,37 9,74 16,32 11,24 10,48 7,84
British pound – – 5,48 5,41 6,36 6,14 5,08
Austrian schilling – 2,42 1,27 0,51 – – –
Japanese yen – – 11,74 9,79 22,24 23,03 21,04
Special Drawing Rights 62,08 37,91 31,68 24,61 10,52 – –
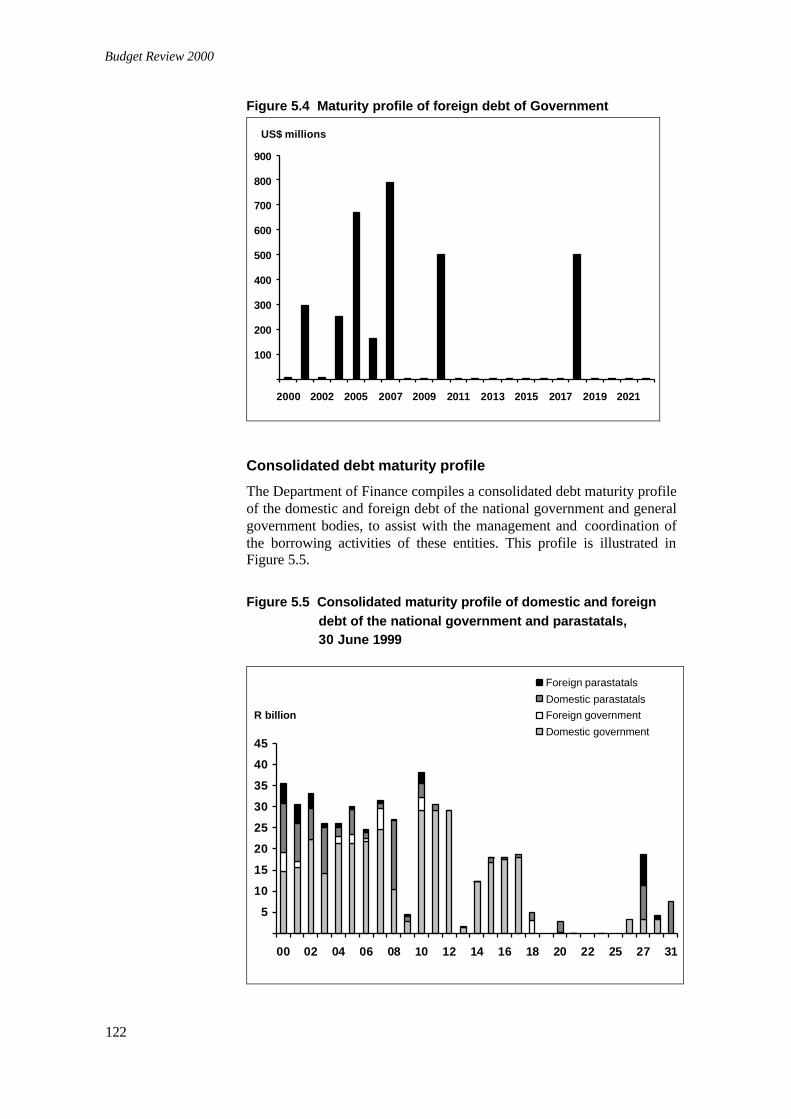
South Africa’s foreign debt maturity profile is easily manageable, asillustrated in Figure 5.4.
Ownership ofdomestic government
bonds
Increase in foreign debt
Foreign debtmaturity profile
Budget Review 2000
122
Figure 5.4 Maturity profile of foreign debt of Government
100
200
300
400
500
600
700
800
900
2000 2002 2005 2007 2009 2011 2013 2015 2017 2019 2021
US$ millions
Consolidated debt maturity profile
The Department of Finance compiles a consolidated debt maturity profileof the domestic and foreign debt of the national government and generalgovernment bodies, to assist with the management and coordination ofthe borrowing activities of these entities. This profile is illustrated inFigure 5.5.
Figure 5.5 Consolidated maturity profile of domestic and foreigndebt of the national government and parastatals,30 June 1999
5
10
15
20
25
30
35
40
45
00 02 04 06 08 10 12 14 16 18 20 22 25 27 31
R billion
Foreign parastatals
Domestic parastatalsForeign government
Domestic government
Asset and liability management
123
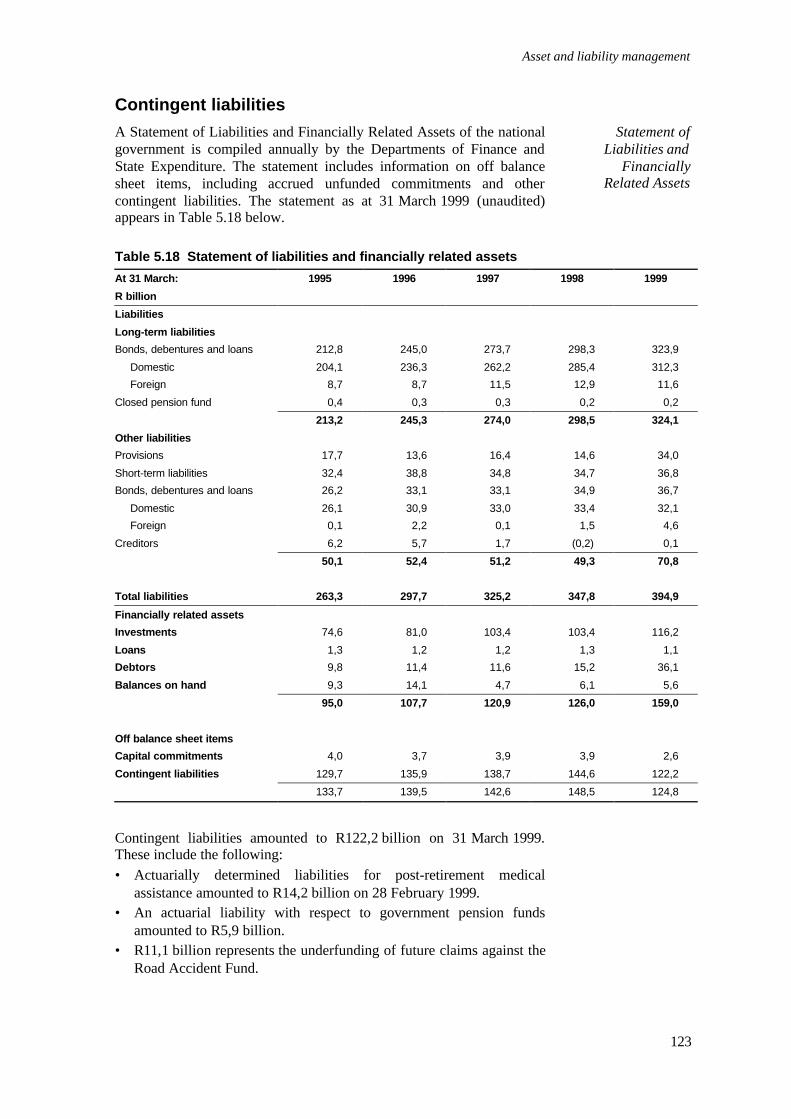
Contingent liabilities
A Statement of Liabilities and Financially Related Assets of the nationalgovernment is compiled annually by the Departments of Finance andState Expenditure. The statement includes information on off balancesheet items, including accrued unfunded commitments and othercontingent liabilities. The statement as at 31 March 1999 (unaudited)appears in Table 5.18 below.
Table 5.18 Statement of liabilities and financially related assets
At 31 March: 1995 1996 1997 1998 1999
R billion
Liabilities
Long-term liabilities
Bonds, debentures and loans 212,8 245,0 273,7 298,3 323,9
Domestic 204,1 236,3 262,2 285,4 312,3
Foreign 8,7 8,7 11,5 12,9 11,6
Closed pension fund 0,4 0,3 0,3 0,2 0,2
213,2 245,3 274,0 298,5 324,1
Other liabilities
Provisions 17,7 13,6 16,4 14,6 34,0
Short-term liabilities 32,4 38,8 34,8 34,7 36,8
Bonds, debentures and loans 26,2 33,1 33,1 34,9 36,7
Domestic 26,1 30,9 33,0 33,4 32,1
Foreign 0,1 2,2 0,1 1,5 4,6
Creditors 6,2 5,7 1,7 (0,2) 0,1
50,1 52,4 51,2 49,3 70,8
Total liabilities 263,3 297,7 325,2 347,8 394,9
Financially related assets
Investments 74,6 81,0 103,4 103,4 116,2
Loans 1,3 1,2 1,2 1,3 1,1
Debtors 9,8 11,4 11,6 15,2 36,1
Balances on hand 9,3 14,1 4,7 6,1 5,6
95,0 107,7 120,9 126,0 159,0
Off balance sheet items
Capital commitments 4,0 3,7 3,9 3,9 2,6
Contingent liabilities 129,7 135,9 138,7 144,6 122,2
133,7 139,5 142,6 148,5 124,8
Contingent liabilities amounted to R122,2 billion on 31 March 1999.These include the following:• Actuarially determined liabilities for post-retirement medical
assistance amounted to R14,2 billion on 28 February 1999.• An actuarial liability with respect to government pension funds
amounted to R5,9 billion.• R11,1 billion represents the underfunding of future claims against the
Road Accident Fund.
Statement ofLiabilities and
FinanciallyRelated Assets

Budget Review 2000
124
• Guarantees to various institutions amounted to R85,8 billion in total,including an amount of R0,9 billion in respect of the guaranteedliabilities of the former TBVC-states and self-governing territories.
Post-retirement medical benefits
A first actuarial valuation of Government’s contingent liability in respectof post-retirement medical assistance for civil servants was concluded inMarch 1999. The amount of R14,2 billion included in the Statement ofLiabilities and Financially Related Assets as at 31 March 1999 representsthe estimated present value of the Government’s future commitment inrespect of medical scheme subsidies to retired government employees(including former members of the National Defence Force, the PoliceServices and Correctional Services). The liability in respect of post-retirement medical assistance of current government employees is notincluded.
In last year’s Statement of Liabilities and Financially Related Assets, anamount of R8,2 billion was included for retired employees who weremembers of the Medihelp medical scheme only, as at 31 March 1997.
Government’s commitment on post-retirement medical assistance isprovided for in the annual budget on the votes of the National DefenceForce, the Police Services and Correctional Services for former servicesmembers, and on the Finance vote for other government employees.
Forward cover losses
Government is also liable for losses incurred as a result of the forwardmarket operations of the Reserve Bank. The outstanding oversoldforward book stood at US$11,5 billion at the end of January 2000.Potential future losses from this open position are not included in thestatement of contingent liabilities, as unanticipated movements in theexchange rate limit the usefulness of such estimates.
Issue of guarantees to public entities
The granting of borrowing powers to general government bodies and theissuing of government guarantees are managed within a set of guidelines.Consistent with these guidelines, during 1999/00 guarantees were largelyrestricted to concessionary loans to public enterprises, project finance forinfrastructure development schemes and, in exceptional cases, facilitiesin support of public enterprise restructuring.
During 1999/00 the average maturity of foreign loans for whichgovernment guarantees were issued was 9,8 years. This lengthening ofthe maturity was made possible largely by improved access to the euro-rand market and various sources of concessionary finance.
Guarantee fees were increased to 2,0 per cent per year on the nominalvalue of a loan; Government received fees to the amount of R2,5 millionduring 1999/00.
Post-retirementmedical assistanceliability ofR14,2 billion
Forward cover losses
Guarantees andborrowing powers
Average maturity ofguarantees issued
Guarantee fees ofR2,5 million received
Asset and liability management
125
Total government guarantees on 31 March 1999 amounted toR85,8 billion. A detailed account of Government’s exposure as at31 March 1999 is set out in Table B9, Annexure B.
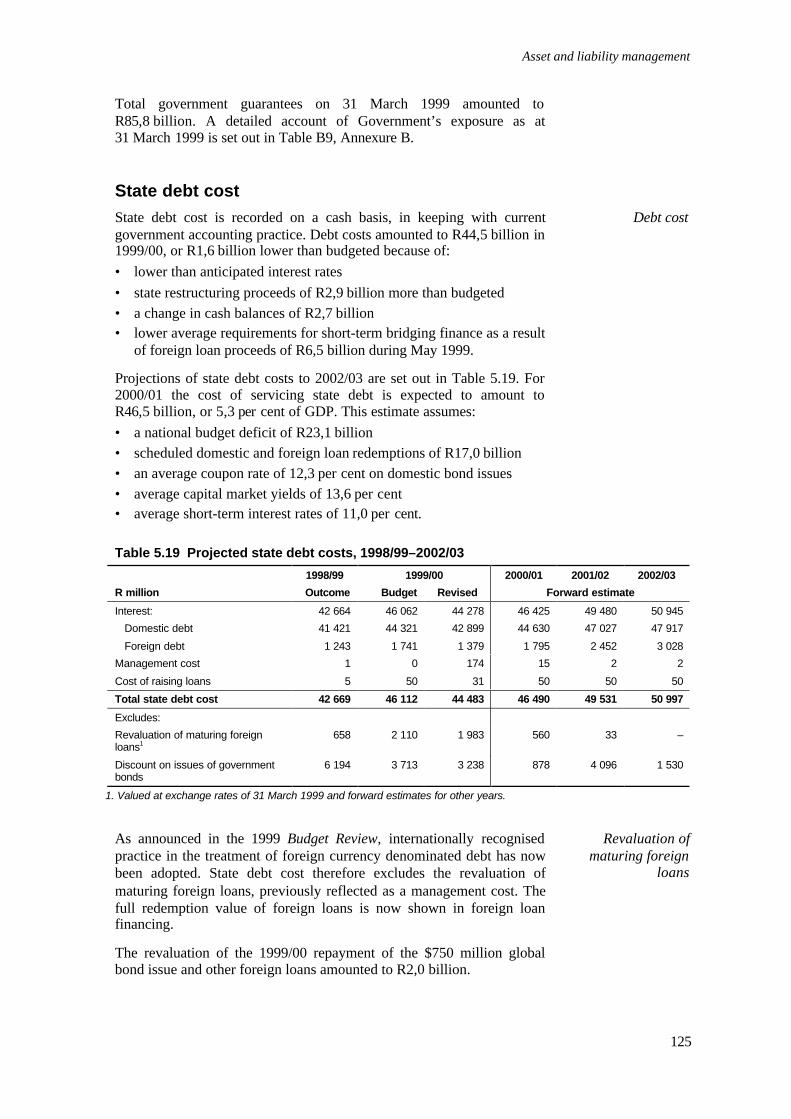
State debt costState debt cost is recorded on a cash basis, in keeping with currentgovernment accounting practice. Debt costs amounted to R44,5 billion in1999/00, or R1,6 billion lower than budgeted because of:• lower than anticipated interest rates• state restructuring proceeds of R2,9 billion more than budgeted• a change in cash balances of R2,7 billion• lower average requirements for short-term bridging finance as a result
of foreign loan proceeds of R6,5 billion during May 1999.
Projections of state debt costs to 2002/03 are set out in Table 5.19. For2000/01 the cost of servicing state debt is expected to amount toR46,5 billion, or 5,3 per cent of GDP. This estimate assumes:• a national budget deficit of R23,1 billion• scheduled domestic and foreign loan redemptions of R17,0 billion• an average coupon rate of 12,3 per cent on domestic bond issues• average capital market yields of 13,6 per cent• average short-term interest rates of 11,0 per cent.
Table 5.19 Projected state debt costs, 1998/99–2002/03
1998/99 1999/00 2000/01 2001/02 2002/03
R million Outcome Budget Revised Forward estimate
Interest: 42 664 46 062 44 278 46 425 49 480 50 945
Domestic debt 41 421 44 321 42 899 44 630 47 027 47 917
Foreign debt 1 243 1 741 1 379 1 795 2 452 3 028
Management cost 1 0 174 15 2 2
Cost of raising loans 5 50 31 50 50 50
Total state debt cost 42 669 46 112 44 483 46 490 49 531 50 997
Excludes:
Revaluation of maturing foreignloans1
658 2 110 1 983 560 33 –
Discount on issues of governmentbonds
6 194 3 713 3 238 878 4 096 1 530
1. Valued at exchange rates of 31 March 1999 and forward estimates for other years.
As announced in the 1999 Budget Review, internationally recognisedpractice in the treatment of foreign currency denominated debt has nowbeen adopted. State debt cost therefore excludes the revaluation ofmaturing foreign loans, previously reflected as a management cost. Thefull redemption value of foreign loans is now shown in foreign loanfinancing.
The revaluation of the 1999/00 repayment of the $750 million globalbond issue and other foreign loans amounted to R2,0 billion.
Debt cost
Revaluation ofmaturing foreign
loans

Budget Review 2000
126
Figure 5.6 Cost to service debt as a percentage of totalrevenue/expenditure, 1990/91–2002/03
13
15
17
19
21
23
25
91 92 93 94 95 96 97 98 99 00 01 02 03
%
As % of totalrevenue
As % of totalexpenditure
The tax burden that debt service costs impose on the economy continuedto shrink, as illustrated in Figure 5.6. The ratio of interest payments totax revenues declines from 23,1 per cent in 1998/99 to 20,9 per cent in2002/03, freeing up resources for other priorities. Interest payments areprojected to fall from 5,7 per cent of GDP to 4,9 per cent over the sameperiod.
Government bonds currently carry interest somewhat below anticipatedmarket rates. The lower domestic financing requirement and lower thananticipated interest rates resulted in a projected discount on bond issuesof R3,2 billion in 1999/00, compared with a budget estimate ofR3,7 billion. The overall discount on the issue of new bonds is expectedto amount to R0,9 billion in 2000/01.
In terms of current government accounting practice, the discount ongovernment bonds is accounted for on a cash basis. Although thediscount is recorded at the time of issue of a bond and forms part ofoutstanding government debt, it is not shown as part of governmentexpenditure. However, since 1996 the discount on government bonds hasbeen disclosed on an accrual basis in the Budget Review, in line with therecommendations of the revised international System of NationalAccounts of 1993. The amortisation of the discount over the term of thebond result in higher recorded state debt cost and governmentexpenditure, a higher deficit and a lower aggregate measure ofgovernment debt. The adjustments for 1989/90 to 1999/00 aresummarised in Table 5.20.
Declining burden ofinterest on debt
Discount on bondsR3,2 billion in1999/00
Accounting fordiscount on bonds

Asset and liability management
127
Table 5.20 Adjustment to state debt cost and total government debt to account fordiscount on an accrual basis, 1989/90–1999/00
Amortised discount(R million)
Adjustments tostate debt cost
(% of GDP)
Nominal total debtat year-end(% of GDP)
Adjusted total debt atyear-end
(% of GDP)
1989/90 666 0,3 36,8 35,0
1990/91 686 0,2 35,3 32,7
1991/92 1 031 0,3 36,8 33,6
1992/93 1 269 0,3 40,4 36,9
1993/94 1 285 0,3 43,5 39,7
1994/95 1 961 0,4 49,1 44,0
1995/96 3 091 0,5 49,5 43,7
1996/97 3 201 0,5 49,0 42,9
1997/98 3 411 0,5 48,1 42,0
1998/99 3 589 0,5 50,0 43,8
1999/00 3 741 0,5 48,2 42,3
Developments on credit ratings
South Africa’s credit rating, like that of other emerging marketsovereigns, was affected during the financial volatility of 1998. Moody’sand Duff and Phelps adjusted their outlook on South Africa’s creditrating from stable to negative. Both Moody’s and Duff and Phelpssubsequently readjusted their outlook from negative to stable andreconfirmed their investment grade rating status for South Africa.
On 7 February 2000 Moody’s again raised South Africa’s rating outlookto positive. This indicates that rating agencies are willing to acknowledgethe positive developments on the economic front. Japan Rating andInvestment Information also reconfirmed their investment grade ratingfor South Africa. Standard and Poor’s credit rating agency completed itsdue diligence meetings in November 1999. Its review for 1999 is stilloutstanding. The current status of South Africa’s credit rating is reflectedin Table 5.21.
Table 5.21 Credit rating
Foreign debt Rand-denominated debt
Duff and Phelps International BBB (Investment grade) A (Investment grade)
Moody’s Investors Service Baa3 (Investment grade) Baa1 (Investment grade)
Japan Rating and Investment BBB (Investment grade)
Standard and Poor’s BB+ (Stable) BBB+ (Investment grade)
Credit ratingsaffected by financial
volatility

Budget Review 2000
128