asset management is paying off - covivio en · yves rocher > strategic location in greater paris...
TRANSCRIPT

Asset Management is paying off
Annual results 2015
18 February 2016

CONTENTS
FONCIÈRE DES RÉGIONS 2
>1. STRATEGIC POSITIONING
>2. REAL ESTATE ACTIVITY
>3. FINANCIAL RESULTS
>4. OUTLOOK
>APPENDICES
3
1. Strategic positioning
Green Corner - Greater Paris

FONCIÈRE DES RÉGIONS
A GROWING AND BETTER QUALITY PORTFOLIO
ANNUAL RESULTS 2015 4
STRATEGY
An integrated operator with highly skilled local teams
€11.0 billion portfolio Group share (€17.7 billion at 100%)
+€1.2 billion Group share in 2015 (+13%)
17%
20%
45%
13%
5%
France Offices> Sound fundamentals; market depth
> Attractive yield; value-creating pipeline
German Residential> Sound economy; buoyant market
> Significant reversion potential; development potential through acquisitions
Non-strategic1
> including France Residential (3%)
Hotel real estate> Leadership position; impressive track record
> Strong relationship with operators; high operating margin
Italy Offices > Leadership position; prime assets> Record cash flow visibility
+3 pts in 2015
+4 pts in 2015
-4 pts in 2015
1 Post disposal of €100 million of Logistics assets in early 2016

FONCIÈRE DES RÉGIONS ANNUAL RESULTS 2015 5
STRATEGY
OUR POSITIONNING: QUALITY AND ASSET MANAGEMENT VALUE CREATION
Strong and secure profitability
Total return of 7.6%1 per year since 2010
1 IPD Index methodology: rental and capital yield (change in value net of capex)
Secured cash-flows
Value creation
track-record
Development pipeline strategy
Asset management
expertise
Partnership strategy
Diversification
Residential – BerlinOffice – Greater Paris
FONCIÈRE DES RÉGIONS ANNUAL RESULTS 2015 6
STRATEGY
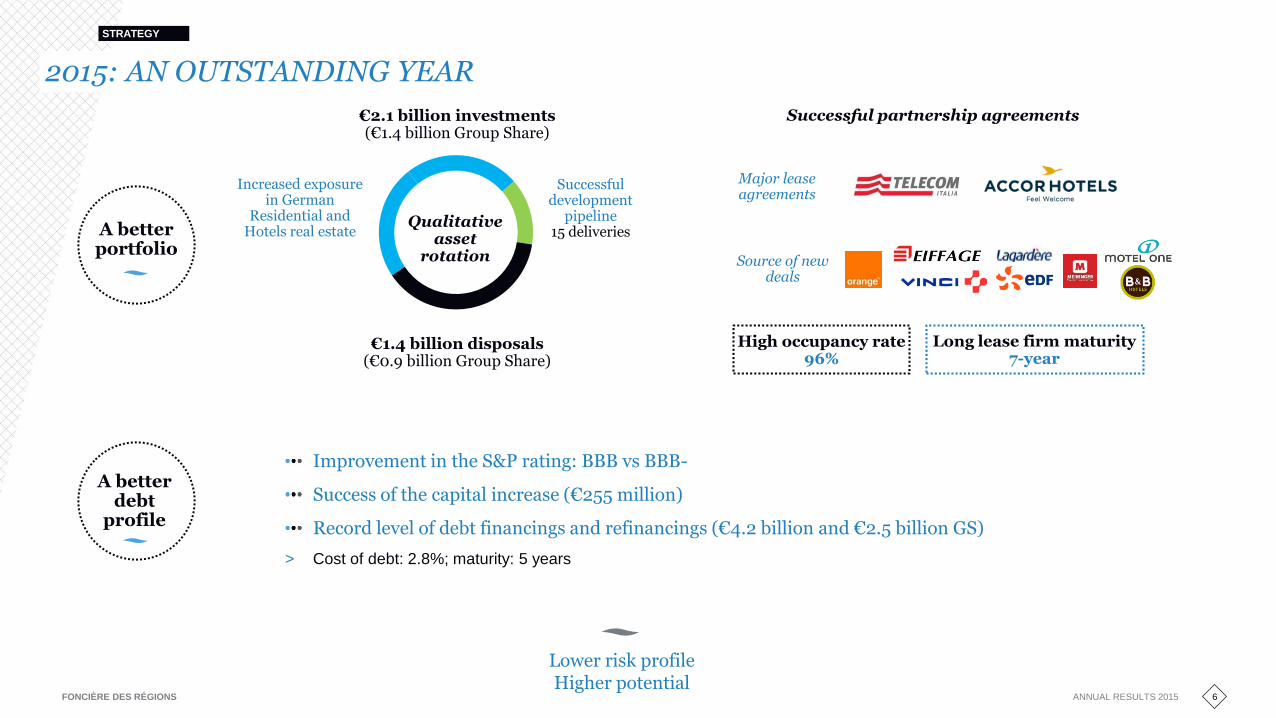
2015: AN OUTSTANDING YEAR
A better portfolio
A better debt
profile
Qualitative asset
rotation
€2.1 billion investments(€1.4 billion Group Share)
€1.4 billion disposals(€0.9 billion Group Share)
Increased exposure in German
Residential and Hotels real estate
Successful development
pipeline15 deliveries
Successful partnership agreements
Lower risk profileHigher potential
High occupancy rate96%
Long lease firm maturity7-year
Improvement in the S&P rating: BBB vs BBB-
Success of the capital increase (€255 million)
Record level of debt financings and refinancings (€4.2 billion and €2.5 billion GS)
> Cost of debt: 2.8%; maturity: 5 years
Major lease agreements
Source of new deals

7
2. Real Estate activity
Eiffage Campus – Greater Paris

8
France Offices
Astrolabe - Marseille

FONCIÈRE DES RÉGIONS ANNUAL RESULTS 2015 9
FRANCE OFFICES
A SOLID SUSTAINABLE POSITIONING
Historically high occupancy rates
94.7% 94.3%96.0% 95.7% 95.8%
96.8% 95.8%
2009
2015
20092015
4.8
5.75.7
5.35.7
5.4
5.4
Long-term leases
(firm maturity in years)
2009
2020
Grade A buildings
(% of green France Offices)
> 2/3
100%
61%
50%41%
24%7%
201520142013
2012
2017
Quality cash-flows
Quality assets
Value creation drivers
1 Acquisitions and development pipeline since 2009
Asset management Development
pipeline
Partnership strategy
Long-term leasesValue creation
reserve€1.2 billion
52% of our portfolio bought or developed
since end-20091
+11 pts
Portfolio
€5.7 billion (100%)
€4.8 billion (GS)
Strategic locations
Paris (35%)
Inner suburbs(41%)
Major Regional Cities(12%)
Non-core(11%)

FONCIÈRE DES RÉGIONS ANNUAL RESULTS 2015 10
FRANCE OFFICES
2015: ASSET MANAGEMENT OVERPERFORMANCE
Strengthen portfolio qualityCreate value through dynamic asset rotation
> Success of the development pipeline (92,990 m² let; €25 million in rents)
> Renewals close to passing rents (96,077 m²; €20 million in rents; -1.7%)
> Rents like-for-like: +0.8%
> Values like-for-like: +7.2%
• Strong performance in Paris (+12%) and Inner suburbs (+8%)
• Success of the development pipeline and asset management: 40% of the like-for-like growth
> 9 projects delivered for 105,000 m² and €444 million cost (€309 million GS)
> Opportunistic acquisitions in a very competitive market (€46 million GS)
Offices in Levallois-Perret; land bank in Montrouge (Greater Paris)
> Disposals: €120 million of non-core assets; 16% average margin
Good letting activity in an
improving market
Asset rotation:
quality and return
Strong operating
performance
Portfolio
€5.7 billion (100%)
€4.8 billion (GS)
Eiffage Campus – Greater Paris

FONCIÈRE DES RÉGIONS 11
ACCELERATION OF THE DEVELOPMENT PIPELINE STRATEGY
FRANCE OFFICES
Astrolabe (Marseille)
14,446 m²
98% let (multi-tenants)
Strategy: development of a new
area in the center of Marseille
ANNUAL RESULTS 2015
Respiro
(Nanterre – Greater Paris)
11,100 m²
100% let (Vinci)
Strategy: turnkey
development with a partner
Green Corner
(Saint-Denis – Greater Paris)
20,817 m²
86% let (HAS; Systra)
Strategy: use of a land bank in a key
business district of Greater Paris
Eiffage Campus
(Vélizy – Greater Paris)
23,242 m²
100% let (Eiffage)
Strategy: turnkey
development with a partner
Quality locations and buildings
Low risk, high return
> 90% occupancy rate vs 71% in early 2015 ; 10 years average firm lease maturity
> 7.1% average yield on cost1; 28% total average value creation
1 Headline gross yield
Portfolio
€5.7 billion (100%)
€4.8 billion (GS)
9 deliveries in 2015

FONCIÈRE DES RÉGIONS
Pont de Levallois - Bécon
Acquisition of OMEGA B: value creation opportunity
> Strategic acquisition of the 3rd building (OMEGA B) of the office block already
owned by Foncière des Régions (OMEGA A & C)
> Quality location in the center of Levallois-Perret (Greater Paris)
> 4,698 m² of offices let at 67% for 2.9 years with Lagardère as main tenant (31%)
> Cost: €25 million (5,300 €/m²)
> Strategy:
• Short term: reduce vacancy rate
• Medium term: merge the 3 buildings to create an asset of 17,700 m²; use
rights to increase the size by c. 3,500 m²
Yield potential of 6.4%
Value creation potential
OMEGA A & C: secure cash-flows
> OMEGA A & C: 11,490 m² of offices in Levallois-Perret (Greater Paris)
> Fully let to Lagardère: renewal of the lease for 6 years firm
> Rents: -2%; value creation: +14%
12
EXAMPLE OF OUR ASSET MANAGEMENT EXPERTISE: OMEGA
ANNUAL RESULTS 2015
FRANCE OFFICES
Potential of 20,000 m² of new offices in a strategic location

FONCIÈRE DES RÉGIONS
Paris-Littré
> 3,560 m² of offices in Paris 6th
> 1st step: refurbishment
> 2nd step: departure of Orange and re-
letting to Kering (9-year firm; no
vacancy period)
> Rents: +33%; value creation >30%
In line with our strategy
> Partnership strategy
> Real estate quality
> Secured cash-flows
> Value creation
13
EXTRACT THE VALUE OF THE ORANGE PORTFOLIO
ANNUAL RESULTS 2015
FRANCE OFFICES
More to come: 60% of the Orange portfolio is located in Paris (€0.8 billion GS)
Paris Littré
Paris 6th district
Steel
Paris 16th district
Paris-Steel
> 3,690 m² of offices in Paris 16th
> 2012-2015: departure of Orange and full
restructuring
> Sept. 2015: 100% let to Groupe OnePoint
(9-year firm)
> Yield on cost: 6%; value creation >30%
In line with our strategy
> Real estate quality
> Secured cash-flows
> Value creation
Rennes
Sèvres-Babylone
Trocadéro
Boissière

FONCIÈRE DES RÉGIONS ANNUAL RESULTS 2015 14
FRANCE OFFICES
AMBITIONS 2016: CONTINUE THE DEVELOPMENT PIPELINE DYNAMIC
Record level of deliveries expected in 2017
€700 million GS
> Projects controlled by Foncière des Régions
> Mix of new constructions and redevelopments
> Launch of the construction work after pre-let (for significant projects) or building permit
Managed pipeline
Committed pipeline
Riverside – Toulouse
Portfolio
€5.7 billion (100%)
€4.8 billion (GS)
9
Deliveries
€309 million
O’rigin
Nancy
New development
€20 millionEDO
Issy-les-Moulineaux
(Greater Paris)
Redevelopment-extension
€83 million
End 2014
(Group share)
TraversièreParis
Redevelopment
€122 million
Euromed Center
(Hermione & Floréal)
Marseille
New developments
€32 million€506
million
€526
million
End 2015
(Group share)
Riverside
Toulouse
New development
€32 million
FONCIÈRE DES RÉGIONS ANNUAL RESULTS 2015 15
FRANCE OFFICES
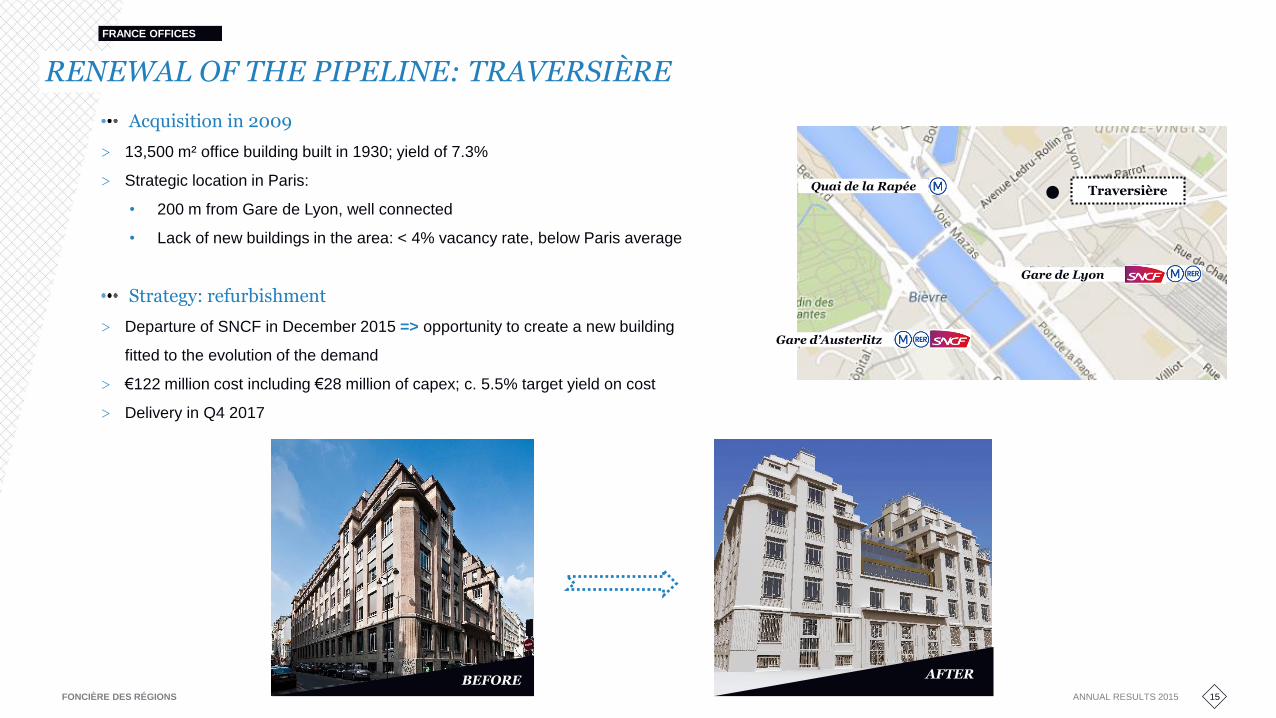
RENEWAL OF THE PIPELINE: TRAVERSIÈRE
Acquisition in 2009
> 13,500 m² office building built in 1930; yield of 7.3%
> Strategic location in Paris:
• 200 m from Gare de Lyon, well connected
• Lack of new buildings in the area: < 4% vacancy rate, below Paris average
Strategy: refurbishment
> Departure of SNCF in December 2015 => opportunity to create a new building
fitted to the evolution of the demand
> €122 million cost including €28 million of capex; c. 5.5% target yield on cost
> Delivery in Q4 2017
Traversière
Gare d’Austerlitz
Gare de Lyon
Quai de la Rapée
BEFORE AFTER

FONCIÈRE DES RÉGIONS
RENEWAL OF THE PIPELINE: EDO
16
Acquisition
> 7,500 m² office building; 7.9% yield
> Short-term lease (3 years) to Groupe
Yves Rocher
> Strategic location in Greater Paris
DeliveryRedevelopment - extension
> Surface: 10,800 m²
(+3,300 m² in additional surfaces)
> Cost (including land value): €83 million
> Target yield on cost: 6%
> Green certification
HQE Excellent
BREEAM Very good
Construction workFebruary 2015 Q4 2017July 2011
ANNUAL RESULTS 2015
FRANCE OFFICES
Departure of the tenant
AFTERBEFORE
Issy-Val de Seine
Maire d’Issy
Paris
Issy-les-Moulineaux
Boulogne-Billancourt
EDO

FONCIÈRE DES RÉGIONS ANNUAL RESULTS 2015 17
FRANCE OFFICES
AMBITIONS 2016: RELY ON OUR POSITIONING TO MAKE THE DIFFERENCE
Long term cash-flowsValue creation
Still buoyant investment market
Improving letting market
Positive economic conditions
Pursue the rotation
dynamic
Pursue the asset
management work
Strong development pipeline: €200 million in capex for 2016
Generate new developments with our partners
Increase quality: €200 million in disposals of non-core assets
Lease expirations: no major issues
> 2016 expirations (1st break): 11% of the rents
Generate new opportunities with our partners
Percier –Paris
Thaïs –Greater Paris
Portfolio
€5.7 billion (100%)
€4.8 billion (GS)

18
Italy Offices
Symbiosis - Milan

FONCIÈRE DES RÉGIONS ANNUAL RESULTS 2015 19
ITALY OFFICES
A LEADING OPERATOR IN ITALY WITH A RENEWED AMBITION
Portfolio
€3.9 billion (100%)
€1.9 billion (GS)
A key operator to take advantage of the current cyclical improvement
A leader in its market
Torre Garibaldi, Milan
Telecom Italia office, Milan
Secured cash-flows• 6.4% yield• 15-year leases
Quality locations• 5.1% yield• 5.3-year leases
Sound fundamentals
Office portfolio (non TI)€2.3 billion (59%)
73% in Milan
Telecom Italia portfolio€1.6 billion (41%)
In value
A €3.9 billion portfolio (€1.9 billion GS) owned through Beni Stabili
> Subsidiary at 48.5% of Foncière des Régions
Secured cash-flows and quality portfolio

FONCIÈRE DES RÉGIONS
> Secured rental base: 92.8% occupancy rate; 9.7-year average firm lease maturity
> Rents like-for-like: -4.1% impacted by the Telecom Italia deal (-2.5%) and vacancy
> Stable values like-for-like: -0.4%
• Telecom Italia portfolio: +0.4%
• Office portfolio (non TI): -0.9%
ANNUAL RESULTS 2015 20
ITALY OFFICES
2015: A TRANSITION PHASE
Secure cash-flow basePotential for improvement
Success of the
Telecom Italia renegotiation
Operating performances
> Extension of the leases: +9 years to 15 years firm; 6.9% reduction in rent
> Quality improvement: disposal of 2 non-core assets for €126 million; €38 million capex program
> Redevelopment potential: 5 buildings in central Milan and Rome with possible vacancy by Telecom Italia
Portfolio
€3.9 billion (100%)
€1.9 billion (GS)
Symbiosis, Milan
Office, Milan
Positive change in appraisals: +€104 millionCore, Milan, long leases …
Negative change in appraisals: -€123 millionDynamic, vacant …

FONCIÈRE DES RÉGIONS 21
2015: LAUNCH OF A NEW INVESTMENT PHASE
Better asset qualityValue creation
Acquisition in prime locations and with value creation potential
> Acquisition of 2 office buildings totalling 22,445 m² in Milan CBD
> €105.6 million (€51 million GS) investments (4,700€/m²)
including capex (€25 million)
> Yield on cost of 6.2% on average
ANNUAL RESULTS 2015
ITALY OFFICES
Via Principe AmedeoAcquisition in 2016 (€42 million)
Immediate redevelopment into offices:
• €11 million capex
• delivery in 2018
Corso ItaliaAcquisition at end-2015 (€38 million)
50% let to ASL (public healthcare agency)
Redevelopment within 2/3 years:
• Mix residential (to be sold) - offices
• €14 million capex
Portfolio
€3.9 billion (100%)
€1.9 billion (GS)
Launch of the first phase of Symbiosis
> New office district on the limit of central Milan
> Next generation of buildings; competitive rent
> Potential for 125,000 m² of offices (€250 million capex - €121 m GS)
> Work launched on a first building; interest from end-users
DuomoBocconi University
Prada Foundation

FONCIÈRE DES RÉGIONS ANNUAL RESULTS 2015 22
ITALY OFFICES
AMBITIONS 2016: A CLEAR ROADMAP FOR A NEW PHASE
Reduce the vacancy rate
Vacant assets: 14% of the Office portfolio (non TI)
> Quality locations: 2/3 in Milan
Galvanize the vacant portfolio management
> €60 million (€29 million GS) capex on vacant assets => €16 million expected extra cash flows (€8 million GS)
Portfolio
€3.9 billion (100%)
€1.9 billion (GS)
San Nicolao, Milan
Torre Garibaldi, Milan
Reduce Telecom Italia
exposure
Objective 2020 of 20% of Italy offices portfolio vs 41%
Extract the redevelopment potential
> 5 buildings; 37,300 m² of offices
Focus on offices in Milan: objective 2020 of 80% of the portfolio
Value creation potential using our asset management expertise
Green offices: objective 2020 of 50% vs 22%
Accelerate quality
improvement
Increase quality; reduce riskImprove profitability

23
German Residential
Residential - Berlin

FONCIÈRE DES RÉGIONS ANNUAL RESULTS 2015 24
GERMAN RESIDENTIAL
2015: INCREASED EXPOSURE AND GROWTH PROSPECT
€871 million (€529 million GS) vs €500 million initial target
> Prime assets in city centers
> Average yield: 5.0%
> 32% reversionary potential
Disposal of €187 million (€114 million GS) in non-core assets in NRW1
> Average margin: 12%; Average yield: 6.6%
Rents like-for-like: +2.4% including +4.4% in Berlin
Value like-for-like: +5.0% including +12.2% in Berlin
Portfolio
€3.6 billion (100%)
€2.2 billion (GS)
Better qualityBetter growth prospect
1 North Rhine-Westphalia
Record level of
acquisitions
Another year of strong
organic growth
Berlin40% (vs 28%)
NRW1
46% (vs 64%)
A growing and better quality portfolio+31% vs end-2014
53% in dynamic cities vs 36% end-2014
Hamburg6% (vs 0%)
Dresden & Leipzig8% (vs 8%)
€3.6 billion €2.2 billion GS(vs end-2014)

FONCIÈRE DES RÉGIONS
2,0%2,0%
2,5%
3,0%
3,5%
4,0%
4,5%
5,0%
Jan Feb Mar Apr May June July Aug Sep Oct Nov Dec
2007
2010
2013
2014
2015
ANNUAL RESULTS 2015 25
GERMAN RESIDENTIAL
2015: DRIVE PERFORMANCE THROUGH ACTIVE PROPERTY MANAGEMENT
Reversionary potential drives the strong rental growth in the dynamic cities (like-for-like growth in €/m²)
Successes of a strong local team Berlin
Hamburg
Berlin:+4.4%
2015Re-lettings:
+27%
Dresden & Leipzig:
+3.2%
2015Re-lettings:
+16%
NRW:+1.6%
2015Re-lettings:
+5.5%
Dynamic property management to reduce the vacancy rate and extract the potential of the acquisitions
Impact of the acquisitions

FONCIÈRE DES RÉGIONS 26
ACQUISITIONS 2015: OUTSTANDING YEAR WITH €871 MILLION INVESTED
GERMAN RESIDENTIAL
Berlin Tempelhof & Neukölln
€60 million (€39 million GS)
Yield: 4.8%; Price/m²: €1,720
Reversionary potential: +29%
Privatisation margin: +28%
ANNUAL RESULTS 2015
Dresden and Leipzig
€37 million (€22 million GS)
Yield: 7.8%; Price/m²: €860
Reversionary potential: +15-20%
Berlin IV takeover bid
€353 million (€207 million GS)
Yield: 4.6%; Price/m²: €1,790
Reversionary potential: +43%
Privatisation margin: +50%
Berlin Prime
€182 million (€105 million GS)
Yield: 5.0%; Price/m²: €2,120
Reversionary potential: +26%
Privatisation margin: +36%
Hamburg
€239 million (€155 million GS)
Yield: 5.6%; Price/m²: €1,860
Reversionary potential: +29%
Privatisation margin: +38%

FONCIÈRE DES RÉGIONS 27
ACQUISITIONS: SUCCESSFUL ASSET MANAGEMENT TRACK RECORD
GERMAN RESIDENTIAL
ANNUAL RESULTS 2015
Berlin
€75 million; yield: 6.5%
Rent/m²/month: 5.8€Berlin
€138 million; yield: 6.7%
Rent/m²/month: 6.1€
Rents: +4%/year
Value: +9%/year Growth
since acquisition
Rents: +3%/year
Value: +6%/year
Rents: +3%/year
Value: +7%/year
Berlin, Dresden
€343 million; yield: 6.5%
Rent/m²/month: 6.0€
Berlin, Dresden & Leipzig
€358 million; yield: 6.0%
Rent/m²/month: 6.2€
Rents: +6%/year
Value: +6%/year
Still room for growthRent reversion potential:
Berlin (+30%); Dresden & Leipzig (+15%); Hamburg (+30%)
Berlin, Dresden & Leipzig, Hamburg
€871 million, yield: 5.0%
Rent/m²/month: 7.4€
Rent reversionpotential
+32%
2011
2012
2013
2014
2015

FONCIÈRE DES RÉGIONS ANNUAL RESULTS 2015 28
GERMAN RESIDENTIAL
AMBITIONS 2016: QUALITY ROTATION AND ORGANIC GROWTH
Continuous reduction of exposure to non-core assets in NRW (15% of the portfolio)
First privatisations in Berlin
Continue to benefit from strong market fundamentals and highly skilled local teams
Prime city center assets
Combine rental growth with medium-term potential for privatisations
Rely on the ability of the local team to source off-market transactions
Enhance the potential of 2015 acquisitions
Objective of +2.75% like-for-like growth in rent
Berlin
Berlin
Pursue acquisitions in dynamic
cities
Quality rotation
Organic growth
Portfolio
€3.6 billion (100%)
€2.2 billion (GS)

29
Hotel real estate in Europe
Sofitel - Lyon

FONCIÈRE DES RÉGIONS ANNUAL RESULTS 2015 30
2015: INCREASED EXPOSURE AND NEW DEVELOPMENT PHASE
Portfolio
€3.5 billion (100%)
€1.4 billion (GS)
Acquisition of 14.7% of the share capital of the subsidiary FDM (to 43.1%)
> Equivalent of €432 million in assets
€346 million (€111 million GS) in investments; 72% in Germany
New hotel operators partnerships
Management contracts
> Already €120 million in investments (€21 million GS)
Increased exposure
New development opportunities
Operating performances
(like-for-like)
Rents -0.6%: resistance despite terrorist attacks
> Including -1.6% on Accor variable rents
Value +3.1%: strong growth in Hotels
> Asset management: +6.2% for AccorHotels post lease extensions
> Success of the development pipeline: +11% value creation
Motel One, Germany
Accor, Boulogne - Paris
HOTELS IN EUROPE
13% of Foncière des Régions portfolio vs 9% at end-2014

FONCIÈRE DES RÉGIONS ANNUAL RESULTS 2015 31
ACCORHOTELS DEAL: ASSET MANAGEMENT EXPERTISE
> AccorHotels portfolio: 6% of the rents GS; 34% of Foncière des Régions lease maturities for 2017 and 2018
> 1st sale and leaseback of AccorHotels in 2005-2006; 91% in France and 9% in Belgium
> Lease structure: rents variable with the hotel’s revenues
Strengthen the partnership with AccorHotels
Increase hotel operator and geographic diversifications
Better growth potential
Better portfolio qualityTargeted locationsBest performing hotels
New development capacities
> 12 years firm
> At passing rents
> At appraisal value
> Average yield: 6.3%
Hotels: €1.5 bn (100%)124
Hotels (€1.1 bn): lease renewals78
Hotels (€0.4 bn): disposals in 201646 i
i
i
> Weaker hotel performance
> Includes all the hotels in small regional cities
Portfolio
€3.5 billion (100%)
€1.4 billion (GS)
HOTELS IN EUROPE

FONCIÈRE DES RÉGIONS
2015: BEING ABLE TO DELIVER ON EACH INVESTMENT MODE
32
STRATEGYSTRATEGYHOTELS IN EUROPE
ANNUAL RESULTS 2015
Natural ally of operators: Long-term cash-flows
Asset management value creation Pipeline of new deals
22 B&B hotels in Germany
€128 million (€51 million GS)
Yield: 6.4%; 18 years firm
2 Motel One hotels
€36 million (€15 million GS)
Berlin-Mitte; Frankfurt-Airport
Yield: 6.1%; 20 years firm
Conversion into a Meininger hotel
€30 million (€13 million GS)
Munich – Olympic Park
12,400 m² of offices converted in 2018
Yield: 6.8%; 20 years firm
Development for Accor
€55 million (€10 million GS)
Paris Airport – Charles-de-Gaulle
Ebitda yield: 8%-10%
Conversion into Louvre Hotels brand
€49 million (€8 million GS)
Germany
Conversion of Motel One existing hotels
Ebitda yield: 8%-10%
6 deliveries in Germany & France
€31 million (€13 million GS)
=> 11% value creation
6 new developments in Germany & France
€43 million (€19 million GS)
Yield >7%; 12 to 20 years firm
Acquisition Developmentpipeline
Management contract
Acquisition of one Park Inn hotel
€16 million (€3 million GS)
Louvain, Belgium
Ebitda yield: 8%
Portfolio
€3.5 billion (100%)
€1.4 billion (GS)
€178 m(€69 m GS)
2015 deliveries€31 m1
(€13 m GS)
€120 m(€21 m GS)
1 Deliveries 2015 cost including land
4 B&B hotels in France
€14 million (€3 million GS)
Yield: 7.1%; 12 years firm

FONCIÈRE DES RÉGIONS
AMBITIONS 2016: ONE NEW PARTNERSHIP = NUMEROUS OPPORTUNITIES
33
STRATEGYSTRATEGYHOTELS IN EUROPE
ANNUAL RESULTS 2015
Objective 2016: €400 million in investments with existing and new partners
Acquisition of 2 Motel One hotelsBerlin & Frankfurt - Germany€36 million (€15 million GS)
Development of the 1st Motel One Hotel in Paris (Porte Dorée)€35 million (€8 million GS)
Delivery in 2018; yield 6.2%; 12-year firm
Conversion of an office into a Meininger hotel Munich - Germany€30 million (€13 million GS)
Developments projects with Meiningerunder discussion in France and Europe
Partnership agreement with MeiningerObjective of €400 million in investments before 2018
Acquisition of 5 NH Hotels in Germany1
€125 million (€54 million GS)
Yield 6.1%; 20-year firm
Acquisition of one NH hotel in Amsterdam€48 million (€21 million GS)
Portfolio
€3.5 billion (100%)
€1.4 billion (GS)
2014
2015
2016
Meininger, Paris
1 To be completed in 2017 and 2018

34
3. Financial results
DS Campus –Greater Paris

FONCIÈRE DES RÉGIONS
2015 INVESTMENTS: RECORD LEVEL UNDER GOOD CONDITIONS
35
46% of investments Group Share in Germany
€m; 2015
Investments including
duties(100%)
Investments(Group Share)
Acquisitions(Group Share)
Capex (Group Share)
Gross potential yield
(Group Share)
Offices - France 330 252 46 206 6.7%1
Offices - Italy 962 472 39 76.2% post
redevelopments
Offices 426 298 85 213 6.7%
German Residential 871 529 529 0 5.0%
Hotels/Service Sector 778 543 522 21 6.2%3
Others 12 7 0 7 n.a.
Total 2,087 1,377 1,136 241 5.8%
FINANCIAL RESULTS
ANNUAL RESULTS 20151 Yield excluding the land bank acquisition in Montrouge; 2 Including the €81 million in acquisitions to be completed in 2016; 3 Excluding Ebitda yield on management contract acquisitions (of 9%)
Development pipeline strategy
New acquisitions in
Milan CBD
German Residential
Acquisitions at 69% in
Berlin
France Offices Italy Offices
Hotels/Service Sector
Investments with historic and new
operators

FONCIÈRE DES RÉGIONS ANNUAL RESULTS 2015 36
2015 DISPOSALS: QUALITY IMPROVEMENT
5% of non-strategic activities vs 9% at end-2014
€m, 2015
Disposalsand
agreements100%
Disposals and agreements
GS
Margin vs.
Values 2014
Gross Yield
Effective disposals
GS
Gross Yield
France Offices 120 120 15.7% 3.6% 93 6.5%
Italy Offices 261 126 0.9% 6.7% 99 6.5%
German Residential 187 114 12.1% 6.6% 112 7.2%
Hotels/Service Sector 417 180 0.2% 6.2% 24 6.5%
Non-strategic 444 309 1.1% 4.8% 240 3.7%
Total asset disposals 1,428 849 4.4% 5.4% 568 5.6%
Group share data
FINANCIAL RESULTS
Non core offices
France Offices
€126 million of Telecom Italia assets
Italy Offices
NRW non-core assets
German Residential
€409 million of AccorHotels
assets
Hotels/Service Sector
€215 million in French
Residential
Non strategic

FONCIÈRE DES RÉGIONS 37
INCREASE IN VALUE AT LIKE-FOR-LIKE SCOPE: +4.4%
FINANCIAL RESULTS
€mValues
2015Total share
Values2015
Group share
Change (%) LFL
12 months
Yield2014
Group share
Yield2015
Group share
France Offices 5,658 4,840 +7.2% 6.6% 6.0%
Italy Offices 3,905 1,893 -0.4% 6.1% 5.7%
Offices 9,563 6,734 +5.0% 6.4% 5.9%
German Residential 3,603 2,175 +5.0% 6.5% 6.0%
Hotels/Service Sector 3,515 1,385 +3.1% 6.1% 5.9%
Other 1,0061 6951 n.a. n.a. n.a.
Total 17,688 10,988 +4.4% 6.3% 5.8%
Group share data
1 Before disposal of €100 million of Logistics assets in early 2016ANNUAL RESULTS 2015
Dev. pipeline & asset management
value creation
France Offices
Negative impact from vacant assets
Italy Offices
+12% in Berlin
German Residential
+4.8% in Hotels
Hotels/Service Sector

FONCIÈRE DES RÉGIONS 38
PORTFOLIO YIELD EVOLUTION: VALUE CREATION AND QUALITY IMPROVEMENT
FINANCIAL RESULTS
Group share data
ANNUAL RESULTS 2015
Yield 2014 Yield 2015
Quality rotation
Like-for-likePortfolio allocation
-10bps -5 bps-20 bps
5.8%6.3%
Increase in German
Residential
Invest in better quality buildings
& locations
Market yield compression
&Asset Management
value creationDispose non-core assets
Exit fromNon-strategic
activities

FONCIÈRE DES RÉGIONS 39
2015: RESHAPE LIABILITIES
FINANCIAL RESULTS
Continue reducing cost of debt
and extending maturityGroup share data
40%
15%
39%
6% Investor mortgages
Bonds
Corporate credits
Bank mortgage loans
Strong diversification in financing
55% unsecured
debt
> Improvement in average debt maturity: 5.0 years vs 4.1 years
> Improvement in cost of debt: -50 bps at 2.8%
> ICR: 3.0 vs. 2.8 end of 2014
> LTV 45.4% vs 46.1% end of 2014
> €4.2 billion (€2.5 billion GS) in financings and refinancings
> Average maturity of financing: 8 years
> Maintenance of a diversified financing policy in a volatile financial market
> BBB, stable outlook vs BBB-, stable outlook
> Improved business profile => better positioned portfolio; stronger cash flows
> Improved financial profile => strengthening of solidity of the balance sheet
Better S&P rating
Record year in financings
and refinancings
Improved debt profile
ANNUAL RESULTS 2015
Debt maturities under control
2016 2017 2018
0.7
0.3
0.8
1.1
2019
0.7
2020
1.2
2025 and later
0.40.4
2021
Average maturity 5.0 years
Group Share - € billion
2022
1.0
2023 2024
0.1

FONCIÈRE DES RÉGIONS 40
EPRA NAV PER SHARE INCREASED BY 6.6%
FINANCIAL RESULTS
EPRA NAV supported by recurring net income and increase in values
> EPRA NAV: €5,318 million (+12% vs 2014) and €79.4 per share (+6.6%)
> EPRA NNNAV: €4,609 million (+11%) and €68.8€ per share (+5.9%)
Successful capital increase in early 2015
> €255 million earmarked for 2015 investments; 3,917,722 new shares (6.2% of capital)
> Followed-up by the primary shareholders of Foncière des Régions
Group share data
1 Post-adjustment after preferential subscription rights distribution linked to the capital increase in early 2015 (adjustment coefficient of 0.986)ANNUAL RESULTS 2015
-€27 million
Comit fund litigation provision
-€69million
Hedge restructuring
and
Beni Stabilibond repurchase
Number of shares used to calculate NAV/share:
66,947,020 for 2015 vs. 62,941,712 for 2014
€5,318 m
€79.4/share
€4,754 m
€74.5/share1
+€333 million
RNI
+€252 million
Capital increase
-€269 million
Dividend
+€27 million
Other
EPRA NAVEnd 2015
EPRA NAVEnd 2014
+€348 million
Property values increase
-€31 million
Real estate transfer cost increase in
2016

FONCIÈRE DES RÉGIONS
Occupancy rate
Residual firm lease
terms
Rental income 1
(€m)
Change Change at like-for-like scope
France Offices 95.8% 5.4 years 238.0 -0.1% 0.8%
Italy Offices 92.8% 9.7 years 102.1 -11.1% -4.1%
Offices 94.9% 6.6 years 340.1 -3.7% -0.9%
German Residential 98.0% n.a. 115.9 +12.2% 2.4%
Hotels/ Service Sector
100% 10.7 years 80.0 +57.0% -0.6%
Other n.a. n.a. 13.3 -24.5% n.a.
Total 96.3% 7.3 years 549.4 +4.6% -0.1%
1 Excluding Logistics (€15.9 million), classified as discontinued operations
41
RENTAL INCOME: +4.6%
FINANCIAL RESULTS
Good performance in a
no inflation environment
Telecom Italia agreement
+4.4% in Berlin; +3.2% in Dresden & Leipzig
Terrorist attacks impact softened by our geographic diversification
Indexation: +0.3%
Occupancy rate: -0.2%
Renewals: -0.2%
Change at like-for-like scope
Group share data
ANNUAL RESULTS 2015
OthersGross annualised rents
End-2014
Gross annualised rents
End-2015
Acquisitions
(including reinforcement in FDM)
Deliveries Like-for-like
annualised
Disposals End of lease
for redevelopments
€56.1 m
€16.7 m
-€2.4 m
- €31 m- €11.2 m
€594 m€570 m
- €4.5 m

FONCIÈRE DES RÉGIONS 42
RECURRING NET INCOME: GOOD PERFORMANCE
FINANCIAL RESULTS
€m, Group Share 2014 2015 %
Rental income 525.0 549.4 +4.6%
o/w net rental income 480.9 505.3 +5.1%
Net operating costs -53.2 -55.5 +4.3%
Income from other activities 21.2 18.9 -10.8%
Current operating income 448.9 468.7 +4.4%
Net cost of financial debt -166.4 -155.3 -6.7%
Recurring net income of MEE companies 14.2 11.2 -21.1%
Income from non consolidated affiliates 0.9 0.2 n.a.
Pre-tax net income 297.6 324.7 +9.1%
Recurrent tax -2.7 -1.9 n.a.
Recurring net income of discontinued operations 19.5 10.0 -49.5%
Recurring Net Income 314.5 332.8 +5.8%
Fair value adjustment on real estate assets 110.6 347.6
Changes in the fair value of financial instruments -183.2 -105.3
Margin on disposals -0.3 0.2
Other -82.8 -48.8
Non-recurrent tax -44.2 -22.1
Profit/loss on discontinued operations 3.9 -22.9
Net income 118.5 481.5
ANNUAL RESULTS 2015
Reinforcement in German Residential and in Hotels
Less property development fees
Lower cost of debt
Change of scope in Dassault SystèmesCampus
Exit from Logistics

FONCIÈRE DES RÉGIONS 43
RECURRING NET INCOME PER SHARE INCREASED +2.2%
Impact of quality improvement
Impact of disposals
Dilution impact from capital increase in 2015
Strengthening position in Hotels
Strengthening in German Residential
Lower average cost of debt
Group Share 20141 2015Change vs.
20141
RNI (in €m) 314.5 332.8 +5.8%
RNI/share (€) 4.96 5.07 +2.2%
Average number of fully diluted shares 62,538,274 65,670,922
Group share data
1 Post-adjustment after preferential subscription rights distribution linked to the capital increase in early 2015 (adjustment coefficient of 0.986)
FINANCIAL RESULTS
ANNUAL RESULTS 2015

FONCIÈRE DES RÉGIONS ANNUAL RESULTS 2015 44
2015 DIVIDEND OF €4.30 PER SHARE
FINANCIAL RESULTS
1 Proposed by the 27 April 2016 Shareholders’ Meeting; 2 Based on a stock-market price of €72.47 as of February 16th 2016
Dividendyield
5.9%2
€4.301
per share
(vs €4.30 for 2014)
Secured level
Payout ratio85%

FONCIÈRE DES RÉGIONS ANNUAL RESULTS 2015 45
A NEW REINFORCEMENT IN HOTEL REAL ESTATE
> Acquisition of 3.3% of FDM shares to ACM paid in new Foncière des Régions shares1
> Share exchange ratio: 1 FdR for 3 FDM - EPRA NAV parity
> Creation of 0,82 million new Foncière des Régions shares (1.2% of the share capital)
Reinforcement in FDM
Long term objective of around 20%
of Foncière des Régions portfolio in Hotel real estate
Launch of a mandatory
public exchange offer on FDM2
Hotel, Berlin
ACM
Foncière des Régions
Free float Generali
BNP Paribas Cardif
GroupeCrédit Agricole
43.1%
9.1%
10.0%10.3%
10.2%
17.2%
FDM shareholding
End 2015
> At the same conditions
> FdR will own at least 46.5% of FDM => +€106 million of assets; +€65 million of equity
1 Term sheet signed in February 17th 2016; should be approved by the 27 April 2016 Shareholders’ Meeting; 2 Upon completion of the offer, Foncière des Régions does not
intend to launch a mandatory squeeze out. An independent expert will be appointed by FDM to give his fairness opinion on the conditions of the offer.

46
4. Outlook
EDO – Greater Paris
FONCIÈRE DES RÉGIONS
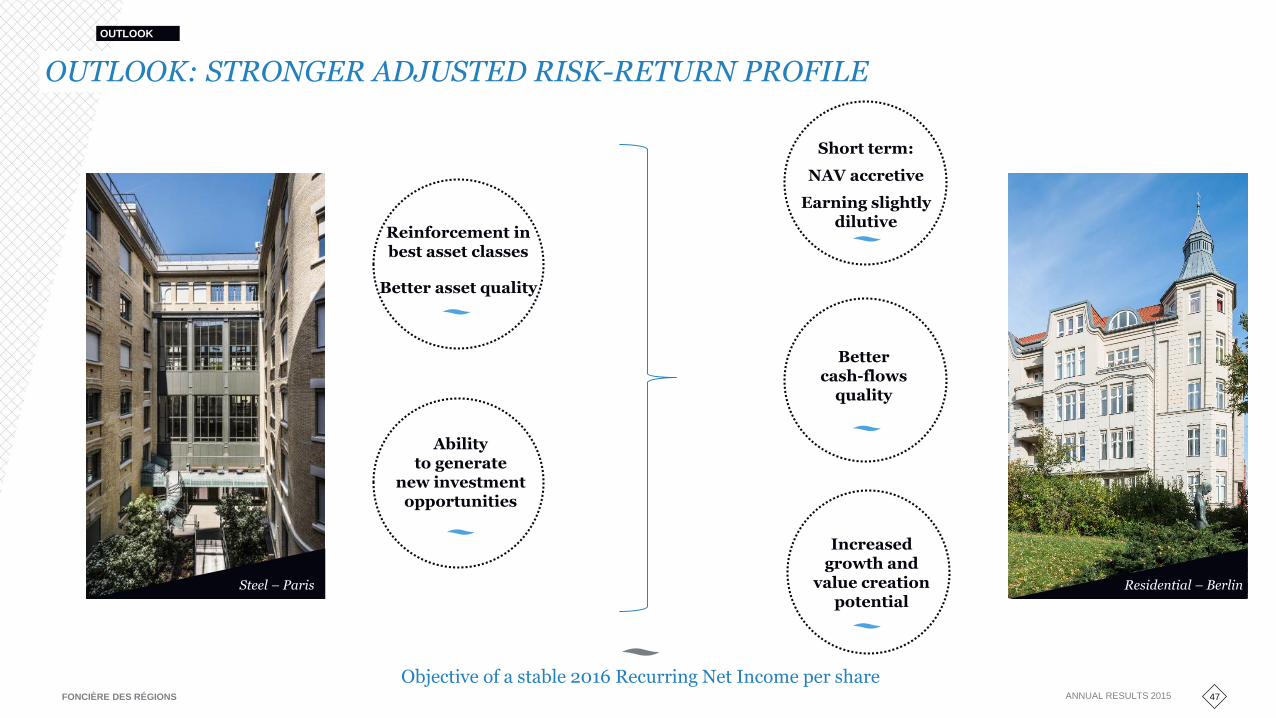
Ability to generate
new investment opportunities
OUTLOOK: STRONGER ADJUSTED RISK-RETURN PROFILE
47
OUTLOOK
ANNUAL RESULTS 2015
Bettercash-flows
quality
Increased growth and
value creation potential
Short term:
NAV accretive
Earning slightly dilutive
Residential – BerlinSteel – Paris
Objective of a stable 2016 Recurring Net Income per share
Better asset quality
Reinforcement in best asset classes
FONCIÈRE DES RÉGIONS 48
FINANCIAL AGENDA
AGENDA
Q1 2016: 4 May 2016
Capital Markets Day in Paris: 14 June 2016
ANNUAL RESULTS 2015

49
Appendices
Eiffage Campus – Greater Paris

FONCIÈRE DES RÉGIONS 50
A STRATEGY STRENGTHENED BY THE SOUNDNESS OF INDICATORS
Group share data
APPENDICES
Growth in value Change in LFL vs. N-1
Rent: at like-for-like scopeChange in LFL vs. N-1
CB 21, La Défense
Firm lease expirations as % of annualised rental income
Commercial portfolio (76% of total rents GS)
Record firm term of leases
2009
5.86.1 6.0
2010 2011 2012
5.5
2013
5.8
2014
7.3
2015
5.8
Historically high occupancy rates
2009
95.4%94.8%
95.8%
2010 2011 2012
95.5%
2013
96.0%
2014
96.3%
2015
97.1%
+3.3%
2010
+0.6%
2011 2012
+2.1%+1.2%
20132009
+2.2%
-0.1%
2014 2015
+0.2%
2009
+5.3%
+1.3%
2010 2011 2012
-0.3%+0.5%
2013
-3.6%
2014
+4.4%
2015
+2.1%
ANNUAL RESULTS 2015

FONCIÈRE DES RÉGIONS 51
COMMITTED PIPELINE: 24 PROJECTS FOR €615 MILLION Group share (+16%)
1100% usable area excl. car park 2Group share incl. land and financial costGroup share data
APPENDICES
ANNUAL RESULTS 2015
Loca t ion A rea ProjectSu rfa ce**
(m ²)Deliv ery
T a rget
offices rent
(€/m²/year)
Pre-let
(%)
T ot a l
Bu dget *
(€m)
Progress Yield
Bose St Ger m a in -en -La y e Gr ea ter Pa r is Con str u ct ion 5 1 00 2 01 6 2 2 5 1 00% 2 0 9 5 % > 7 %
Sch lu m ber g er Pom pig n a n e Mon tpellier Ma jor Reg ion a l Cit ies Con str u ct ion 3 1 5 0 2 01 6 1 5 5 1 00% 8 8 5 % > 7 %
Eu r om ed Cen ter - Ca ly pso (QP FdR : 5 0%) Ma r seille Ma jor Reg ion a l Cit ies Con str u ct ion 9 6 00 2 01 6 2 6 5 3 0% 1 5 8 5 % > 7 %
Clin iqu e INICEA Sa in t-Ma n dé Gr ea ter Pa r is Con str u ct ion 5 5 00 2 01 6 N/A 1 00% 2 5 7 0% 6 %
DS Ca m pu s Ex ten sion 1 (QP FdR : 5 0%) V élizy Gr ea ter Pa r is Con str u ct ion 1 3 1 00 2 01 6 3 05 1 00% 3 9 5 5 % 6 %
2016 su bt ot a l 36 450 90% 107 73%
Eu r om ed Cen ter - Her m ion e (QP FdR 5 0%) Ma r seille Ma jor Reg ion a l Cit ies Con str u ct ion 1 0 4 00 2 01 7 2 6 5 0% 1 4 5 5 % > 7 %
Eu r om ed Cen ter - Flor ea l (QP FdR 5 0%) Ma r seille Ma jor Reg ion a l Cit ies Con str u ct ion 1 3 4 5 0 2 01 7 2 6 5 0% 1 8 4 5 % > 7 %
Silex I Ly on Ma jor Reg ion a l Cit ies Con str u ct ion 1 0 6 00 2 01 7 2 8 0 0% 4 7 4 0% 6 %
Th a ïs Lev a llois Gr ea ter Pa r is Con str u ct ion 5 5 00 2 01 7 4 8 0 0% 4 0 3 0% 6 %
O'r ig in Na n cy Ma jor Reg ion a l Cit ies Con str u ct ion 6 3 00 2 01 7 1 9 5 7 7 % 2 0 3 0% 6 %
Edo Issy -les-Mou lin ea u x Gr ea ter Pa r is Restr u ctu r a t ion -Ex ten sion 1 0 8 00 2 01 7 4 5 0 0% 8 3 1 5 % 6 %
Tr a v er sièr e Pa r is Pa r is Restr u ctu r a t ion -Ex ten sion 1 3 5 00 2 01 7 ND 5 % 1 2 2 5 % 5 %
Riv er side Tou lou se MR Con str u ct ion 1 0 9 00 2 01 8 1 9 0 0% 3 2 0% > 7 %
2017 su bt ot a l 81 450 6% 377 19%
T ot a l Offices Fra nce 117 900 24% 484 31% 7%
Sy m biosis Mila n Ita ly Con str u ct ion 1 2 000 2 01 8 n .a . 0% 2 9 0% > 7 %
Fer r u cci Tu r in Ita ly Restr u ctu r a t ion -Ex ten sion 4 9 2 9 4 2 02 0 n .a . 0% 4 0 6 % n .a .
T ot a l Offices It a ly 61 294 0% 69 3% n.a .
B&B Fr a n ce (1 ) & Ger m a n y (5 ) Fr a n ce & Ger m a n y Fr a n ce & Ger m a n y Con str u ct ion n a 2 01 6 n a 1 00% 1 8 5 9 % >7 %
Eu r om ed Cen ter - Hôtel (QP FdR : 5 0%) Ma r seille Ma r seille Con str u ct ion n a 2 01 6 n a 1 00% 2 3 9 0% >7 %
Motel On e Pa r is - Por te Dor ée Pa r is Gr ea ter Pa r is Con str u ct ion n a 2 01 7 n a 1 00% 8 3 5 % 6 %
Mein in g er Mu n ich Mu n ich Ger m a n y Con v er sion n a 2 01 8 n a 1 00% 1 3 0% 6 %
T ot a l Hot els 100% 62 55% 7%
179 194 29% 615 30% >6%
Offices France
Fr
an
ce
Off
ice
sH
ote
ls
Total Offices+Hotels
Project s
Hotel Real Estate
Offices Italy

FONCIÈRE DES RÉGIONS
ORANGE PORTFOLIO IN PARIS REGION: QUALITY; VALUE CREATION POTENTIAL
52
15 assets including 9 of the 10 primary Orange buildings; €863 million in value; 60% of the Orange portfolio
CarnotMaillot
Montmartre
Philippe Auguste
Bobillot
GobelinsRaspail
Keller
Voltaire
Menilmontant
Villette
AnjouProvence
Laborde
Guttemberg
APPENDICES
ANNUAL RESULTS 2015

FONCIÈRE DES RÉGIONS
ORGANISATION CHART
53
APPENDICES
Foncière des Régions
France Offices Italy Offices(Beni Stabili)
German Residential
(Immeo)
Management contracts
(FDM Management)
Hotels & Service Sector
(Foncière des Murs)
48.5% 61.0% 43.1%
40.8%
Consolidated subsidiaries
Equity affiliates
ANNUAL RESULTS 2015
French Residential
(FDL)
61.3%

FONCIÈRE DES RÉGIONS
Paris30, avenue Kléber75116 ParisTel.: +33 1 58 97 50 00
ContactPaul ArkwrightTel.: +33 1 58 97 51 85Mobile: +33 6 77 33 93 [email protected]