asset management plan – poles and towers - 14.10 amp... · 1,027 of the darwin transmission pole...
TRANSCRIPT

Approved By: Prepared By: Issue Date: 22/02/2018
Next Review: 31/12/2018
Status: Approved
Executive General Manager Power Networks Group Manager Asset Strategy
Document No. D2017/242366
Version No: 1.0
THIS STANDARD IS UNCONTROLLED WHEN PRINTED PAGE 1 OF 51
Asset Management Plan – Poles and Towers
Power and Water Corporation
CONTROLLED DOCUMENT
Executive Summary ........................................................................................................................... 3
Purpose ....................................................................................................................................... 8 1
Scope and Objectives ................................................................................................................. 9 2
Asset Class Overview .......................................................................................................... 9 2.1 Asset Class Function .......................................................................................................... 10 2.2 Asset Objectives ................................................................................................................ 10 2.3
Context ..................................................................................................................................... 12 3
Roles and Responsibilities ................................................................................................. 12 3.1 RACI ................................................................................................................................... 12 3.2
Asset base ................................................................................................................................. 14 4
Overview ........................................................................................................................... 14 4.1 Asset types ........................................................................................................................ 14 4.2 Asset population analysis .................................................................................................. 15 4.3 Asset profiles ..................................................................................................................... 16 4.4
Health and criticality profiles ................................................................................................... 21 5
Asset health and criticality indices.................................................................................... 21 5.1 Transmission ..................................................................................................................... 23 5.2 Distribution ....................................................................................................................... 24 5.3
Key challenges .......................................................................................................................... 26 6
Environmental challenges ................................................................................................. 26 6.1 Operational challenges ..................................................................................................... 27 6.2 Asset challenges ................................................................................................................ 31 6.3 Asset Management challenges ......................................................................................... 32 6.4
Performance indicators ............................................................................................................ 33 7
Operational performance indicators ................................................................................ 33 7.1 Health and Safety indicators ............................................................................................. 36 7.2 Financial indicators ........................................................................................................... 37 7.3
Growth requirements ............................................................................................................... 40 8
Attachment 14.10

Asset Class Management Plan – Poles and Towers
PAGE 2 OF 51
THIS DOCUMENT IS UNCONTROLLED WHEN PRINTED
Renewal and maintenance requirements ................................................................................ 41 9
Transmission Poles and Towers ........................................................................................ 42 9.1 Distribution Poles .............................................................................................................. 43 9.2
Investment program ............................................................................................................. 44 10
Augmentation expenditure (augex) .................................................................................. 44 10.1 Renewal expenditure (repex) ........................................................................................... 44 10.2 Historic, forecast and future expenditure comparison .................................................... 45 10.3 Operational expenditure (opex) ....................................................................................... 46 10.4
Asset class outcomes ............................................................................................................ 47 11
Key performance indicators .............................................................................................. 47 11.1
Performance, monitoring and improvement ....................................................................... 48 12
Appendix A – Lifecycle asset management ..................................................................................... 49
Planning (augmentation) .................................................................................................. 49 12.1 Design ................................................................................................................................ 49 12.2 Operation .......................................................................................................................... 50 12.3 Maintenance (opex) .......................................................................................................... 50 12.4 Renewal (repex) ................................................................................................................ 51 12.5 Disposal ............................................................................................................................. 51 12.6

Asset Class Management Plan – Poles and Towers
PAGE 3 OF 51
THIS DOCUMENT IS UNCONTROLLED WHEN PRINTED
Executive Summary Power and Water Corporation (Power and Water) owns and operates the electricity transmission and distribution networks in the Northern Territory (NT) of Australia. Included in the networks are overhead line assets supported by transmission and distribution pole and tower structures. The poles and towers perform a critical function in maintaining the business objectives of delivering a safe and reliable supply of electricity to Power and Water’s customers.
Assets contribute a sizeable proportion to the total asset base – however age compared to expected life is not a great concern.
Poles and towers make up 17% of the total replacement value of the asset base and contribute to around 6% of the total operating expenditure. At an average age of 31 years the asset fleet has reached midlife and 1.8%, or 836 assets are projected to exceed the standard expected asset life of 60 years within the next regulatory period. The vast majority, 98.1% of the asset class, consist of steel type poles and towers, with a small number of concrete poles located in the Darwin region.
Assets operate across a diverse environment – temperature, humidity, rainfall and soil types present different challenges to managing the assets.
The Power and Water power network is subject to unique environmental and operational challenges ranging from the coastal tropical environments prone to cyclones, high temperatures and humidity, and high annual rainfall to desert environments subject to high ambient temperatures, occasional flooding, droughts and aggressive soil conditions. This unique environment results in a more rapid rate of asset deterioration, and lower worker productivity compared to peer distribution businesses.
There are three key challenges that require management – corrosion, earthing system degradation and specific type defects.
Key asset challenges include asset corrosion in the Darwin region, earthing system degradation in the Darwin region, and type-specific pole failures in the Alice Springs region. The transmission pole and tower assets in the Darwin region are expected to start impacting on system reliability over the next two regulatory periods as the assets continue to age and start to exceed the standard asset life. Condition data collected in recent years has identified a need for investment in the refurbishment of assets aged 40 years and over to address corrosion issues. Up to 39%, or 1,027 of the Darwin transmission pole and tower population falls in this age category. A health and criticality assessment prioritised around 663 of these poles. This is a considerable number of structures in need of investment to extend the asset life.
Earthing system tests performed on 271 transmission poles and towers over a 30 year period identified a deterioration of the tower earth systems. The most recent tests undertaken in 2016 identified up to a third of the earthing systems with deteriorated earthing performance. Investment is required to maintain the safe and reliable operation of the transmission network.
Recent unassisted pole failures in Alice Springs identified accelerated below ground pole corrosion leading to pole failure. High soil salinity was determined to be the main causal factor, combined with a footing design that exposes most of the below ground installation to the aggressive soil conditions. It was also established that standard concrete used in pole footings

Asset Class Management Plan – Poles and Towers
PAGE 4 OF 51
THIS DOCUMENT IS UNCONTROLLED WHEN PRINTED
does not provide protection from the corrosion mechanism. With no unassisted pole failures observed in any other part of the Power and Water network, these failures are considered representative of a type-specific failure mode. Investment in the renewal of the poles involving replacement and rebutting is proposed for the next regulatory period and is expected to continue in following regulatory periods.
Maturing condition data associated with pole and tower assets is a key asset management challenge. With few functional failures observed in the network to date, pole and tower condition issues have generally been managed as corrective maintenance. With asset failures starting to emerge and the assets approaching the expected asset replacement life, an increased focus on the collection of corrosion and condition data and analysis are being put into effect to better support asset management decision making. Targeted methodical inspections prioritising high corrosion areas and corrosion rate measurements for different regions are some of the proposed undertakings aimed at improving data collection and analysis during business as usual activities.
Investment programs are targeted to manage the key challenges – directed refurbishment and replacement.
The following pole and tower asset renewal programs are proposed for the next regulatory period, 2019-20 to 2023-24 to address key asset challenges:
• Transmission pole and tower structure refurbishment (rejuvenation) program. A targeted refurbishment program involving the recoating of transmission tower and pole structures to rectify corrosion defects and extend asset lives in the Darwin region, and includes for targeted methodical inspections.
• Transmission pole and tower earthing system refurbishment program. A targeted refurbishment program to bring high risk earthing systems back to acceptable design standards.
• Alice Springs corroded poles. A renewal program including a mix of replacement and rebutting investments to address advanced distribution pole degradation issues in the Alice Springs region.
The renewal programs have been developed with the objective of maintaining risk over time. To achieve this, an asset health and criticality framework was developed that provides for a consistent method of assessing assets, identifying assets or groups of assets requiring further analysis and making value based investment decisions. The health and criticality framework was central to establishing the targeted pole and tower investment programs focusing on the highest risk assets as a priority.

Asset Class Management Plan – Poles and Towers
PAGE 5 OF 51
THIS DOCUMENT IS UNCONTROLLED WHEN PRINTED
The investment programs are summarised as follows:
Year 2019-20
($ million)
2020-21
($ million)
2021-22
($ million)
2022-23
($ million)
2023-24
($ million)
Total
($ million)
Renewal plans $4.27 $3.59 $3.59 $3.09 $3.06 $17.59
Maintenance plans $0.99 $0.99 $0.99 $0.99 $0.99 $4.96
Total $5.26 $4.58 $4.58 $4.08 $4.05 $22.55
The forecast investment over the regulatory period has been compared to the Australian Energy Regulator’s (AER) repex model output. As shown in Figure 1. Power and Water’s forecast investment in poles and towers exceeds the repex model’s projection over 2019-24 regulatory period; however, the trend in expenditure is downwards and reflects the investment required to address the asset specific issues in order to maintain overall risk. The repex model is not expected to identify the short term increase expenditure to address specific type-issue that emerged in Alice Springs in the current period.
The increase in expenditure during the current regulatory period (2014-19) has been due to an increase in the number of pole replacements due to pole corrosion being detected across the Alice Springs network. Based on the rate of deterioration of poles and structures across the network, the expenditure profile will need to be maintained at an elevated level as compared to historic expenditure to avoid an increase in the rate of in-service functional failures.
Figure 1: Investment in poles and structures over the regulatory period

Asset Class Management Plan – Poles and Towers
PAGE 6 OF 51
THIS DOCUMENT IS UNCONTROLLED WHEN PRINTED
Benefits from the investment program – reliability improvement
The proposed investment in the Alice Springs distribution pole renewal is expected to impact on the contribution to system SAIDI/SAIFI performance, reducing the SAIDI contribution by up to 0.65%, and the SAIFI contribution by up to 0.13% over the next regulatory period.
Historical transmission pole and tower reliability performance events are rare and mostly involve third-party collisions with Power and Water assets which the proposed investments do not mitigate against. The transmission pole and tower renewal investments are therefore not expected to impact on the contribution to system SAIDI/SAIFI performance over the next regulatory period.
The investment programs target the highest risk assets and are expected to affect the risk profile of the pole and tower asset class.
Transmission poles and towers
With mostly life-extension investment over the next five year regulatory period the health and criticality profile is expected to change to that shown in the second table below. The mitigated risk is demonstrated in the number of assets that transfer from the H3 health category. For the transmission assets a reduced risk is reflected in a 2% reduction in the number of poor health assets in the C1 and C2 criticality zones. No life-extension issues were identified in the high criticality, C3 assets.
Transmission poles and towers health-criticality matrix (quantity) by 2023-24, with no investment
H1 H2 H3
C1 259 64 1,517
C2 60 86 686
C3 236 145
Transmission poles and towers health-criticality matrix (quantity) by 2023-24, with investment
H1 H2 H3
C1 307 64 1,469
C2 63 86 683
C3 236 145
Distribution poles
With investment, including for growth over the next 5 year regulatory period, the health and criticality profile for distribution poles is expected to change to that shown in the second table below. The mitigated risk is demonstrated in the number of assets that transfer from the H3 health category. For the distribution pole assets a reduced risk is reflected in a 32% reduction in the number of poor health assets in the C2 and C3 criticality zones.
Distribution poles health-criticality matrix (quantity) by 2023-24, with no investment
H1 H2 H3
C1 5,731 1,408 1,427
C2 5,244 5,433 1,869
C3 15,165 5,830 958

Asset Class Management Plan – Poles and Towers
PAGE 7 OF 51
THIS DOCUMENT IS UNCONTROLLED WHEN PRINTED
Distribution poles health-criticality matrix (quantity) by 2023-24, with investment
H1 H2 H3
C1 6,132 1,408 1,427
C2 6,317 5,433 1,163
C3 16,871 5,830 313
The movement in risk demonstrated by the movement of assets predominantly from the poor health and applicable criticality zones substantiates Power and Water’s investment strategy that targets the highest risk assets.
The risk profile snapshot has been based on the current understanding of the pole and tower asset class age, condition, and operating environment. The risk profile is expected to evolve as ongoing condition and performance monitoring, methodical inspections, and improved data collection practices provide for better quality data and asset insights.

Asset Class Management Plan – Poles and Towers
PAGE 8 OF 51
THIS DOCUMENT IS UNCONTROLLED WHEN PRINTED
Purpose 1The purpose of this asset management plan (AMP) is to define Power and Water’s approach to managing the life-cycle activities for poles and towers. It frames the rationale and direction that underpins the management of these assets into the future:
• Short Term (0-2 years): Detailed maintenance and capital works plans for the upcoming financial year based on current asset condition.
• Medium Term (2-5 years) 2019-24 Regulatory Period: Strategies and plans based on trends in performance and health indicators.
• Long Term (5-10 years) 2024-29 Regulatory Period: Qualitative articulation of the expected long-term outcomes.
The pole and tower assets are managed to comply with the broad external requirements of legislation, codes and standards. This is achieved within an internal framework of policy, strategy and plans that are enabled through interrelated documents, systems and processes that establish the Power Networks asset management practices. The asset management system is summarised in Figure 2.
Figure 2: Asset management system

Asset Class Management Plan – Poles and Towers
PAGE 9 OF 51
THIS DOCUMENT IS UNCONTROLLED WHEN PRINTED
Scope and Objectives 2 Asset Class Overview 2.1
In-scope assets include Power and Water’s transmission (TR) poles and towers, high-voltage (HV) poles, and low-voltage (LV) poles. Table 1 provides an overview of the asset class. The scope does not include other network assets such as pole mounted equipment. Table 1: Overview of in-scope assets
Asset type Quantity Voltage Average Age
Nominal Lifespan
% exceeding lifespan in
forecast period
Key points
Transmission poles and towers
3,053 132-66 kV 32 years 60 years 5.8% (176)
• Located in Darwin, Katherine, Tennant Creek, and Alice Springs.
• Dating from the 1963s. • Refurbishment investment
proposed for the Darwin region in the forecast regulatory period.
HV poles 29,260 11-22 kV 31 years 60 years 1.3% (388)
• Located in Darwin, Katherine, Tennant Creek, and Alice Springs.
• Dating from the 1950s. • Replacement program
proposed for the Alice Springs region in the forecast regulatory period.
LV poles 13,605 415 V 32 years 60 years 2.0% (272)
• Located in Darwin, Katherine, Tennant Creek, and Alice Springs.
• Dating from the 1950s. • Replacement program
proposed for the Alice Springs region in the forecast regulatory period.
Total 45,918 132kV-415V 31 years 60 years 1.8% (836)
• Refurbishment program proposed for transmission poles and towers in the Darwin region in the forecast regulatory period.
• Replacement program proposed for HV & LV poles in the Alice Springs region in the forecast regulatory period.

Asset Class Management Plan – Poles and Towers
PAGE 10 OF 51
THIS DOCUMENT IS UNCONTROLLED WHEN PRINTED
The pole and tower asset class make up a significance proportion of Power and Water’s assets and activities. This is because much of the network is supplied using overhead assets. Currently, the poles and towers asset class comprise:
• 17% of the network by replacement value;
• 6% of operational expenditure (opex); and
• 5% of regulated capital expenditure (capex), including:
o 6% of regulated replacement expenditure (repex); and
o 4% of regulated augmentation expenditure (augex).
Power and Water’s pole and tower assets are distributed throughout its network footprint which covers the NT.
Asset Class Function 2.2
Poles and towers support overhead conductor and equipment in the power transmission and distribution network. Their main purpose is to establish safe electrical and physical clearances between electrical conductors and the ground, and other structures. They are also required to have sufficient strength to withstand forces (e.g. short circuit, wind).
The majority poles and towers are of steel construction, with some concrete transmission poles located in the Darwin region.
The function of poles and towers within Power and Water’s electricity network is illustrated in Figure 3.
Figure 3: Diagram of in-scope assets
Asset Objectives 2.3
The AMP provides a framework which steers the management of the asset class in a manner that supports the achievement of Power and Water’s broader organisational goals. The Asset Management strategies are listed in the Strategic Asset Management Plan (SAMP) and are

Asset Class Management Plan – Poles and Towers
PAGE 11 OF 51
THIS DOCUMENT IS UNCONTROLLED WHEN PRINTED
aligned to the Asset Management Objectives and implemented in through Asset Management Plans (specific to asset class) or Strategic Asset Plans as shown in Figure 4.
Figure 4 Asset Management Line of sight from Corporate and Network strategies through the Asset Management objective to the targets in the asset management plan.
Table 2 provides the asset management objectives from the strategies that are relevant to this asset class along with the measures of success and the targets. This provides a ‘line of sight’ between the discrete asset targets and Power and Water corporate Key Result Areas. Table 2: Asset Objectives
Objectives Measures Targets • Network related operation and maintenance
tasks are quantified in terms of risk and used to inform investment decisions that affect Health and Safety outcomes for the organisation
• Ensure the safety of its employees and the public.
• Known conductor clearance breaches (from ground)
• Vehicle Impacts of unprotected assets • Vegetation clearance breaches
between cutting cycles • Electric Shock due to neutral
connection faults • Unauthorised access • Total asset class specific safety
incidents
• Total asset class specific safety incidents not exceeding 4 per annum
• Ensure that the systems and processes provide sufficient and appropriate data and information to drive optimal asset and operating solutions.
• Asset class contribution to system SAIDI
• Asset class contribution to system SAIFI
• GSL contribution per year Guaranteed Service Levels
• SAIDI to be no more than 10% for this asset class.
• SAIFI to be no more than 2% for this asset class.
• GSL contribution per year TBA
• Ensure that the systems and processes provide sufficient and appropriate financial data
• Understand the financial risks associated with asset management
• Variance to AMP forecast CAPEX • Variance to AMP forecast OPEX
• Variance to AMP forecast CAPEX +/-10%
• Variance to AMP forecast OPEX +/-10%
• Develop systems and data that facilitate informed risk based decisions
• Ensure that works programs optimise the balance between cost, risk and performance
• Ensure the effective delivery of the capital investment program
• Reduce network system damage and supply interruptions, particularly during storms.
• Network risk index quantified (Y/N) • Health and Criticality Parameters
defined (Y/N)
• Acheived
• Identify, review and manage operational and strategic risks
• Prioritise projects, programs and plans to achieve efficient and consistent risk mitigation.
• Achieve an appropriate balance between cost, performance and risk consistent with
• Critical spares analysis completed for asset class
• Operator/Maintainer risk assessment completed for asset class and risk register updated
• Achieved

Asset Class Management Plan – Poles and Towers
PAGE 12 OF 51
THIS DOCUMENT IS UNCONTROLLED WHEN PRINTED
Objectives Measures Targets regulatory and stakeholder expectations.
• Define and communicate the level of risk associated with the investment program
• Ensure that electricity network assets are maintained in a serviceable condition, fit for purpose and contributing positively to Power Networks business objectives.
• All staff are trained and hold appropriate qualifications for the tasks they undertake.
• Peer benchmarking, i.e. a reasonableness test of underlying unit costs (capex, opex)
• Compliance breaches with the relevant legislation / regulation / standards.
• Asset class preventative maintenance completion
• Achieved
Context 3
Roles and Responsibilities 3.1
Power and Water operates using an “Asset Owner / Asset Manager / Service Provider” business model. Although there is extensive collaboration and interfacing between the roles, generally speaking:
• the Asset Owner establishes the overall objectives for the assets;
• the Asset Manager develops the strategies and plans to achieve the objectives; and
• the Service Provider performs activities on the ground to deliver the plans.
RACI 3.2
The Responsibility, Accountability, Consulted, Informed (RACI) matrix for the poles and towers asset class is provided in Table 3. This defines the roles and accountabilities for each task by allocating to specific roles/personnel in Power and Water.

Asset Class Management Plan – Poles and Towers
PAGE 13 OF 51
THIS DOCUMENT IS UNCONTROLLED WHEN PRINTED
Table 3: RACI matrix for Poles and Towers
Process
Exec
GM
Pow
er
Net
wor
ks
Gro
up M
anag
er
Net
wor
k As
sets
Chie
f Eng
inee
r
Net
wor
k Pl
anni
ng
Man
ager
Maj
or P
roje
ct
Deliv
ery
Man
ager
Sout
hern
Del
iver
y M
anag
er
Gro
up M
anag
er
Serv
ice
Deliv
ery
Fiel
d Se
rvic
es
Man
ager
Wor
ks M
anag
emen
t M
anag
er
Stra
tegi
c As
set
Engi
neer
ing
Asse
t Qua
lity
&
Syst
ems
Establish Condition Limits A C C I I C/I I R I
Performance and condition data analysis I A I I I I I I R I
Plan capital works (Options, costs, BNIs, BCs etc) I R A C/I R R R R R I
Execute maintenance plans I I I A A R R C/I I
Deliver identified major projects and programs of work I C A C R R R C/I C/I
Manage asset data (data entry, verify data) A I I C/I R
Monitor delivery of capital plans and maintenance I A I I I R R R R R R
• Accountable (A) means the allocated person has an obligation to ensure that the task is performed appropriately • Responsible (R) means the allocated person must ensure the task is completed • Consulted (C) means the allocated person must be included in the process for input but do not necessarily have specific tasks to do • Informed (I) means this person must be kept up to date with progress as it may impact other parts of their responsibilities or accountabilities.

Asset Class Management Plan – Poles and Towers
PAGE 14 OF 51
THIS DOCUMENT IS UNCONTROLLED WHEN PRINTED
Asset base 4 Overview 4.1
Power and Water owns and maintains a portfolio of 45,918 poles and towers distributed across the four regions of Alice Springs, Darwin, Katherine, and Tennant Creek, with the largest population in the Darwin Region.
The portfolio consists of mainly steel poles and towers, with some concrete poles located in the Darwin region. The poles function across the different network voltage levels including LV (240V, 415V), HV (11kV, 22kV), and transmission voltage (66kV, 132kV).
Different climatic environments and soil conditions across the regions present different challenges, with associated risk and expenditure implications.
Asset types 4.2
An overview of the different pole and tower installation types is provided in Table 4. Table 4: Pole and tower assets by region
Region Network Category
Period of installation
Voltage levels Challenges Expenditure / risk implications
Alice Springs
Transmission 2011-13 • 66kV • No step changes forecast
Distribution 1956 - present
• 415V • 11kV • 22kV
• Advanced footing corrosion.
• Assets approaching end of their expected economic life (60 years).
• Increased asset failure rates resulting from advanced corrosion deterioration.
• Increased risk of physical harm and electrical shock to public and workers.
• Negative impact on system reliability as result of increased asset failures and reactive replacement requirements.
• Increasing replacement expenditure requirements.
Darwin Transmission 1965 - present
• 132kV • 66kV
• Progressive structure corrosion.
• Earthing deterioration.
• Diminishing remaining life of poles and towers as result of progressive corrosion deterioration.
• Defective earthing systems resulting in increased step and touch potentials.
• Defective earthing systems resulting in increased frequency of faults experienced from ineffective fault current dissipation along the line.
• Increased risk of electrical shock to public and workers.
• Negative impact on system

Asset Class Management Plan – Poles and Towers
PAGE 15 OF 51
THIS DOCUMENT IS UNCONTROLLED WHEN PRINTED
Region Network Category
Period of installation
Voltage levels Challenges Expenditure / risk implications
reliability performance. • Increasing refurbishment
expenditure requirements.
Distribution 1960 - present
• 415V • 11kV • 22kV
• Surface corrosion
• Structural corrosion at ground-air interface.
• Ongoing routine testing of pole section loss at ground-air interface using RLS instrument.
• Small batch inspection of footings in mangrove or reclaimed areas to ensure similar footing corrosion risks to Alice Springs do not exist.
Katherine
Transmission 1975 –86 • 132kV • 66kV
• Surface corrosion.
• Earthing deterioration.
• No step changes forecast.
Distribution 1950 - present
• 415V • 11kV • 22kV
• Surface corrosion
• Structural corrosion at ground-air interface.
• No step changes forecast. • Small batch inspection of
footings in swamp areas to ensure similar footing corrosion risks to Alice Springs do not exist.
Tennant Creek Distribution
1960 -present
• 415V • 11kV • 22kV
• Surface corrosion
• Structural corrosion at ground-air interface.
• No step changes forecast. • Small batch inspection of
footings to ensure similar footing corrosion risks to Alice Springs do not exist.
Asset population analysis 4.3
A detailed breakdown of the transmission pole and tower assets is provided in Figure 5.
The Darwin region 132kV and 66kV steel transmission poles and towers are generally problematic as result of the highly corrosive coastal environment, and comprise 24% and 65% of the total asset population respectively.
Figure 5: Transmission poles and towers by asset type

Asset Class Management Plan – Poles and Towers
PAGE 16 OF 51
THIS DOCUMENT IS UNCONTROLLED WHEN PRINTED
A detailed breakdown of the distribution pole assets is provided in Figure 6.
The Alice Springs region steel HV and LV poles are problematic as a result of the aggressive soil conditions resulting in accelerated below ground corrosion. These assets comprise 9.5% and 5.3% of the total asset population respectively.
Figure 6: Distribution poles by asset type
Asset profiles 4.4
4.4.1 Transmission Poles and Towers
Figure 7 provides a breakdown of the transmission pole and tower assets by region over time. The majority transmission pole and tower assets have been installed in the Darwin region since the mid-1960s. Some installations were made in the Katherine region during the 1980s, and installations were made in the early 2010s in the Alice Springs region to connect new generation at Owen Springs, 26km from Alice Springs.
Figure 7: Transmission poles by age and region

Asset Class Management Plan – Poles and Towers
PAGE 17 OF 51
THIS DOCUMENT IS UNCONTROLLED WHEN PRINTED
4.4.2 Distribution Poles
Figure 8 provides a breakdown of the distribution pole assets by region over time. There has been a steady growth in distribution pole installations across the regions since the mid1950s. Development of the distribution network started in the Darwin and Katherine regions in the mid-1950s, followed by developments in the Alice Springs and Tennant Creek regions from the mid-1960s.
Significant installations were made in the Darwin region following cyclone Tracy in the mid1970s and equally material installations were made in the Alice Spring region around the same time. Katherine followed with substantial installations made in the early 1980s and mid-1980s. Over the last 10 years there has been strong growth in the Darwin region mainly as result of a boom in gas resource development. Steady expansions continued in the Katherine, Tennant Creek, and Alice Springs regions over the same period.
Figure 8: Distribution poles by age and region
4.4.3 Standard Asset Life
The asset life is the period of time that an asset can be expected to reliably and efficiently provide the service capability for which it was designed. Understanding the asset life is important to the establishment of a suitable maintenance regime including a planning and recording system together with its impact on capital and operational expenditure forecasts.
The situation and environment in which an individual asset operates can have a significant impact on both the required level of reliability and the rate of asset deterioration. The asset life is typically determined by factors such as:
• the cost of maintenance versus the cost of replacing the asset; • the maintainability of the asset, particularly if replacement components are no longer
available; and • the risk associated with the failure of the asset, particularly if the consequence of failure
increases to an unacceptable level.

Asset Class Management Plan – Poles and Towers
PAGE 18 OF 51
THIS DOCUMENT IS UNCONTROLLED WHEN PRINTED
It is therefore important to note that the asset life represents an average expected life of the asset. Some individual assets will last much longer than the expected asset life and others will fail prematurely.
The asset lives applied by Power and Water as a standard have been based on in-house engineering experience and judgement, supplemented by general industry experience across the National Electricity Market (NEM). The asset life is also referred to in the AMP as the replacement life or the economic life referring to the expected life at which time the asset is typically replaced or renewed.
A standard replacement life of 60 years was applied to the pole and tower assets. It corresponds with the economic replacement asset life applied by Power and Water in asset valuations and compares with asset lives observed across the NEM as demonstrated in Figure 9.
Figure 9: Steel pole and tower replacement life
4.4.4 Age profiles
The age profiles provide an early indication of expected asset condition and potential life extension or renewal investment requirements. Table 5 and Table 6 provide a summary of the asset base remaining life by region against the standard expected asset life. The tables include an illustration of the expected increase in assets that will be exceeding the asset life over the next two regulatory periods. The Darwin transmission assets are a particular concern. These assets make up 89% of the total transmission structure population and are starting to exceed the asset replacement life. Asset condition issues related to age and corrosion are starting to emerge and are expected to have an increasing impact on system reliability over the next two regulatory periods. Table 5: Transmission poles and towers average age and remaining life
Region Weighted Average Age
(years)
Weighted Average
Remaining Life (years)
% of asset population
% exceeding replacement life in 2017
% approaching replacement life by 2024
% approaching replacement life by 2029
Alice Springs 8 52 7% 0.0% 0.0% 0.0% Darwin 33 27 89% 0.0% 1.6% 1.6% Katherine 35 25 4% 0.0% 0.0% 0.0% Tennant Creek - - - - - - All regions 32 28 100% 0.0% 1.4% 1.4%

Asset Class Management Plan – Poles and Towers
PAGE 19 OF 51
THIS DOCUMENT IS UNCONTROLLED WHEN PRINTED
The distribution pole age profile shows an aging asset base with up to 5% of the assets projected to exceed the upper range of the industry standard asset lives within the next two regulatory periods. Similar to the transmission pole and towers, asset condition issues related to age and corrosion are starting to emerge and are expected to have an increasing impact on system reliability over the next two regulatory periods.
The pole assets in Alice Springs are of particular concern. These poles were largely installed in the late-1960s and early-1970s and have an average age of 33 years. Aggressive soil conditions in the Alice Springs region are resulting in increased corrosion rates and a requirement for the early replacement of the assets.
The step increase noticed in the Tennant Creek distribution assets exceeding the asset replacement life is indicative of the aging assets that were mostly installed during the 1960s and 1970s and are now reaching the end of their economic life. Table 6: Distribution poles average age and remaining life
Region Weighted Average Age
(years)
Weighted Average
Remaining Life (years)
% of asset population
% exceeding replacement life in 2017
% approaching replacement life by 2024
% approaching replacement life by 2029
Alice Springs 33 27 14% 0% 3% 14% Darwin 31 29 58% 0% 1% 2% Katherine 34 26 20% 1% 3% 3% Tennant Creek 38 22 8% 0% 13% 26% All regions 33 27 100% 0% 3% 5%
4.4.5 Transmission Poles and Towers – Age profiles by region
Figure 10: Darwin – Transmission pole and tower age profile
Figure 11: Katherine - Transmission pole and tower age profile
Asset Class Management Plan – Poles and Towers
PAGE 20 OF 51
THIS DOCUMENT IS UNCONTROLLED WHEN PRINTED
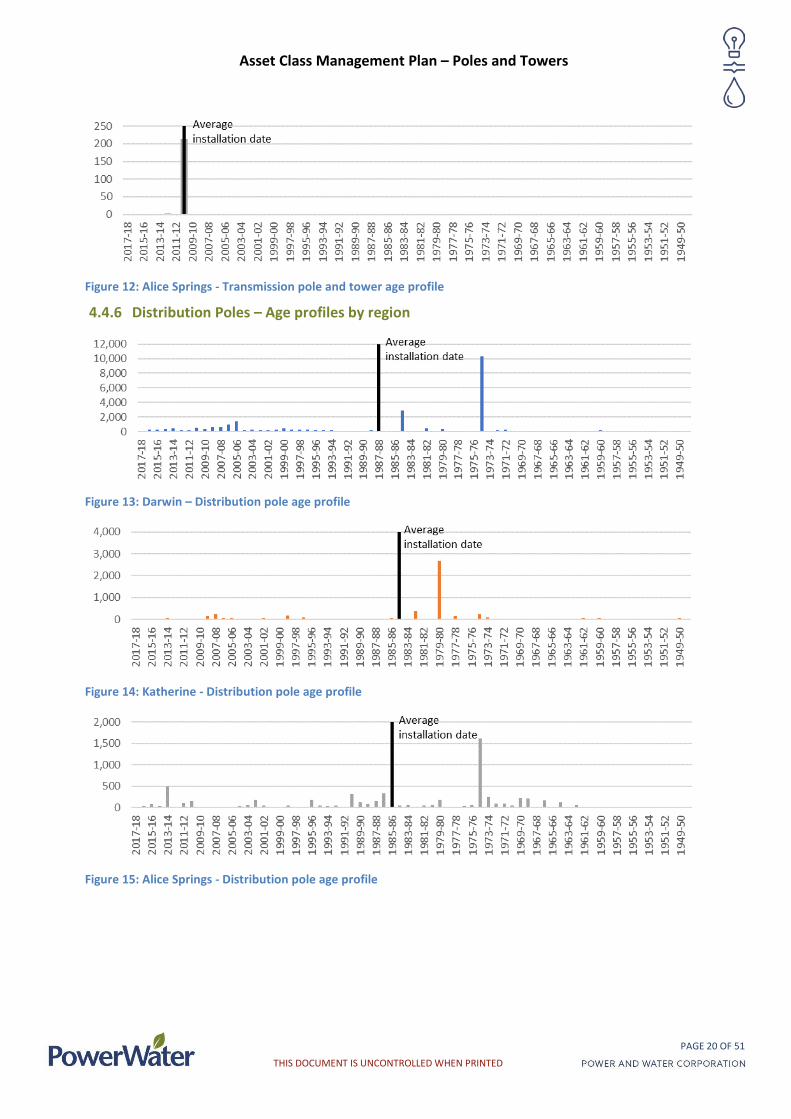
Figure 12: Alice Springs - Transmission pole and tower age profile
4.4.6 Distribution Poles – Age profiles by region
Figure 13: Darwin – Distribution pole age profile
Figure 14: Katherine - Distribution pole age profile
Figure 15: Alice Springs - Distribution pole age profile

Asset Class Management Plan – Poles and Towers
PAGE 21 OF 51
THIS DOCUMENT IS UNCONTROLLED WHEN PRINTED
Figure 16: Tennant Creek - Distribution pole age profile
Health and criticality profiles 5 Asset health and criticality indices 5.1
There is a risk that uncertain events or conditions associated with an asset failure that, if it occurs, will affect Power and Water’s ability to successfully execute its strategies to achieve its organisational objectives of operating a safe and reliable power network at the lowest cost to the customer. The health and criticality framework1 provides the basis for calculating the risk associated with the pole and tower assets. It combines failure data and recent condition data (routine visual inspection, targeted methodical inspection and testing results) to modify the assessment of expected remaining life and the associated likelihood of failure across the fleet of poles and towers.
The health and criticality indices developed for poles and towers establishes the context of the risk associated with these assets and defines the parameters that influence how the risk is managed. Asset health is a key driver in the likelihood of asset failure, and the asset criticality is a key determinant in quantifying the risk associated with the failure.
It should be noted that the health and criticality indices rely heavily on available asset data and will evolve as the quality of data regarding asset age, condition and operating environment improves. It will continue to evolve over time as the asset composition changes with age, investments, and network development. These changes are captured during routine inspections and targeted methodical inspections aimed at recording and updating asset data related to age, condition, and operating environment. These processes and practices are continuously being improved within Power and Water.
The probability of asset failures and the associated risks are therefore continually refined as routine data, and targeted data is collected across the asset base.
Poles and towers have a key safety function within the electrical network, maintaining safe conductor-to-ground/structure clearances. The risk associated with the functional failure of poles and towers is physical and electrical harm to the public and to Power and Water employees who traverse the power network daily.
5.1.1 Asset health
The underlying failure mode for poles and towers is mechanical fatigue resulting from corrosion and leading to deterioration in the asset health, and ultimately the functional failure, or collapse
1 ‘Asset Heath and Criticality Method’ decision making process

Asset Class Management Plan – Poles and Towers
PAGE 22 OF 51
THIS DOCUMENT IS UNCONTROLLED WHEN PRINTED
of the asset. The deterioration in asset health is accelerated by factors such as design defects, third-party impacts, and damage during severe weather events. The main failure modes observed on the pole and tower assets are summarised in Table 7. Table 7: Pole and tower failure modes
Failure mode Description
Below ground corrosion Below ground (footing) structural degradation and mechanical fatigue as result of corrosion. Loss of footing structural integrity can lead to unassisted pole failure as and also makes the pole far more susceptible to failure from minor impacts or during weather events.
Above ground corrosion Above ground structural degradation and mechanical fatigue as result of corrosion. Ground-air interface corrosion
The presence of constant moisture, air and other corrosion accelerators (saline soils, fertilisers, etc) causes very localised and severe corrosion of poles at ground level, compromising the structural integrity of the pole. Concrete collars protect the pole but are also at risk of cracking which undermines the protection provided.
Structural damage Structural degradation and mechanical fatigue as result of vehicles colliding with a pole or tower.
Power and Water assesses and records asset condition during routine inspections as part of other works in the vicinity and through targeted methodical inspections and testing.
• Methodical inspections done by Power and Water on poles and towers in the Darwin region found that the majority of assets in need of refurbishment were older than 40 years.
• Recent studies undertaken by Power and Water found the high salinity soil conditions in the Alice Springs area to be a particularly aggressive corrosive environment.
• The AS/NZS 2312 - Guide to the Protection of Structural Steel Against Atmospheric Corrosion by the Use of Protective Coatings, and a study on corrosion rates developed by Wattyl Industrial Coatings in 2004 (GUIDE TO AS/NZS 2312:2002) provided guidance on the disparate corrosion related issues observed by Power and Water in the power network. The coastal area of Darwin is identified as an area subject to higher corrosion rates, whereas the inland areas of the power network are subject to relatively lower expected corrosion rates.
The outcomes of the inspections and studies mentioned above have been used to inform the pole and tower asset health segregation. Where insufficient data was available asset age or remaining life was used as a proxy for asset health.
Recent fault rates and test results were used to assess the probability of asset failure across the individual asset health categories.
5.1.2 Asset criticality
The pole and tower assets contribute to both the reliability and safety risk of the power network. Risk quantification undertaken in the industry across asset classes has found reliability risk to routinely be the more prominent risk associated with asset failures. Reliability risk is the risk related to the duration and frequency of outages resulting from asset failures and is linked to the number of customers impacted by an outage.

Asset Class Management Plan – Poles and Towers
PAGE 23 OF 51
THIS DOCUMENT IS UNCONTROLLED WHEN PRINTED
The criticality of the pole and tower assets within the network has in the first instance been based on the expected contribution to the system reliability risk resulting from asset failure. Where appropriate and based on inspection and test data, criticality level adjustments have been made to reflect the contribution to public and worker safety risk.
Transmission 5.2
For transmission poles and towers the asset health segregation has been based on corrosion zones and asset age. Assets in higher corrosion zones and with lower remaining life were assigned a poorer health score whereas assets in lower corrosion risk areas and with higher remaining life were allocated a better health score. The criteria applied to allocate a health score are provided in Table 8. The age for segregation was based on the result of recent inspections undertaken by Power and Water in Darwin City, Stuart Park, The Gardens and Woolner distribution areas of the Darwin region that indicated the majority of assets requiring refurbishment investment being over the age of 40 years. Assets with unknown ages were assigned to the highest health category, H1. Table 8: Health indices criteria
Health score Description Criteria
H1 Good Outside of Darwin region H2 Average In Darwin region & Age <40 years, H3 Poor In Darwin region & Age >= 40 years
Where specific poor asset condition issues are identified through targeted inspection and testing, indicating a notable departure from the indices criteria, these poles and towers may be included in the overall indices based on adjusted criteria. No adjustments have been made for transmission poles and towers.
Criticality ratings have been assigned at feeder level based on the impact of contingencies on the security of supply and system loading conditions as described in Table 9. A workshop involving key Power and Water planning and asset management personnel as well as external experts was undertaken to assess the relative criticality of transmission feeders. The main criteria included an assessment of contingencies resulting in radialisation of the network, system overload conditions and system critical supply feeders.. Table 9: Transmission feeder criticality assignment
Criticality score Radialisation criteria Overload Criteria
C1 No radialisation No overload C2 System radialisation Exceed normal rating but not contingency rating
C3 Power station link Exceed emergency rating
The poles and towers asset health and criticality profile is provided in Table 10. It identifies 663 structures in the red and orange zone as being of poor health and higher criticality.
Table 10: Transmission pole and tower health-criticality matrix (quantity)

Asset Class Management Plan – Poles and Towers
PAGE 24 OF 51
THIS DOCUMENT IS UNCONTROLLED WHEN PRINTED
H1 H2 H3
C1 310 1,023 507
C2 138 176 518
C3 236 143 2
The asset health and criticality is a function of time and is expected to change as the assets continue to age. With no investment over the next five year regulatory period and no growth expected in the number of transmission poles and towers over this period, the profile is expected to change to that shown in Table 11. The increase in risk is demonstrated in the increase in the number of assets that entered the H3 health category. For the transmission assets, an increase in risk is reflected in the more than doubling, 129% increase, of the number of low health assets. Table 11: Transmission pole and tower health-criticality matrix (quantity) with no investment
H1 H2 H3
C1 259 64 1,517
C2 60 86 686
C3 236 145
Distribution 5.3
The asset health segregation of the distribution poles has been based on corrosion zones and remaining life. A replacement life of 60 years was applied for distribution poles.
The health segregation adopted a three-point health index scale used to categorise assets in terms of their expected remaining life where conditional factors were not evident to suggest a different segregation. The approach is described in the Asset Health and Criticality Method discussion paper. Assets in higher corrosion zones and with lower remaining life were assigned a poorer health score whereas assets in lower corrosion risk areas, and higher remaining life were allocated a better health score. The criteria applied to allocate a health score are provided in Table 12. Assets with unknown remaining lives were assigned a good health score, H1. Table 12: Health indices criteria
Health score
Description Criteria
H1 Good Outside of the Darwin region In the Darwin region and more than 15 years remaining life
H2 Average In the Darwin region and between 5 and 15 years remaining life
H3 Poor In the Darwin region and less than 5 years remaining life
Asset criticality across the asset class was allocated, in the first instance, based on the customer density as approximated by the feeder categorisation. Based on good historical performance and a high level of system redundancy CBD feeders were allocated to C1. Relatively low historical performance has resulted in short rural feeders being allocated to C3. The underlying criteria applied in allocating pole and tower asset criticality are provided in Table 13. Table 13: Distribution Pole criticality criteria

Asset Class Management Plan – Poles and Towers
PAGE 25 OF 51
THIS DOCUMENT IS UNCONTROLLED WHEN PRINTED
Criticality score Description Criteria
C1 Low Long rural & CBD C2 Medium Urban C3 High Short rural
As previously stated, the Alice Springs poles are subject to increased corrosion rates as result of aggressive soils. Recent pole failures and investigations have identified advanced below ground corrosion issues pushing the need for asset replacements ahead of the expected replacement life. The Alice Springs poles have been included in the health indices based on an assessment of the age of the poles that have failed. The criteria are provided in Table 14. Table 14: Alice Springs poles - Health indices criteria
Health score
Description Criteria
H1 Good Age <= 15 years, i.e. more than 45 years remaining life. H2 Average Age <= 40 years, and > 15 years, i.e. more than 20 years remaining life. H3 Poor Age > 40 years, i.e. less than 20 years remaining life based on the age of assets that failed
unassisted.
The criticality criteria applied to the Alice Springs poles have been based on the expected consequence of failure given the reliability impact and the tip load on the poles. Poles in more densely populated areas carry a higher reliability risk and poles with higher tip loads; e.g. strain and termination poles increase the consequence of asset failure.
The criticality criteria applied to the Alice Springs poles is provided in Table 15. A ration of 30% strain poles to 70% intermediate poles were used as a proxy for more detailed risk modelling which was underway at the time of writing. Further analysis will be undertaken as part of the business case for the proposed investment. Table 15: Alice Springs poles – Criticality indices criteria
Criticality score
Description
Criteria
C1 Low All service poles, intermediate poles in ASP rural short, rural long, CBD areas, and unknown poles.
C2 Medium Distribution intermediate poles in ASP urban and distribution strain poles in rural short areas.
C3 High Distribution strain poles in ASP urban areas.
The distribution pole asset health and criticality profile is provided in Table 16. It identifies 3,181 structures in the red and orange zone as being of poor health and higher criticality. Table 16: Distribution pole health-criticality matrix (quantity)
H1 H2 H3
C1 6,035 1,328 1,203
C2 10,255 523 1,768
C3 20,541 480 933
With no investment over the next five year regulatory period and excluding growth, the profile is expected to change to that shown in Table 17. The increase in risk is demonstrated in the

Asset Class Management Plan – Poles and Towers
PAGE 26 OF 51
THIS DOCUMENT IS UNCONTROLLED WHEN PRINTED
increase in the number of assets that entered the H3 health category. For the distribution assets an increase in risk is reflected in a 9% increase in the number of low health assets. Table 17: Distribution pole health-criticality matrix (quantity) with no investment
H1 H2 H3
C1 5,731 1,408 1,427
C2 5,244 5,433 1,869
C3 15,165 5,830 958
Key challenges 6 Environmental challenges 6.1
The network covers a range of environments and geographies which present different challenges for the pole and tower asset class. Table 18 provides an overview of environmental challenges in relation to managing PWC’s pole and tower assets across its four operating regions.
Approximately 80% of Power and Water’s network is coastal tropical environments prone to cyclones, monsoons, high ambient temperatures and humidity, and high annual rainfall. The remainder of the network is desert environments subject to high ambient temperatures, occasional flooding, droughts, dust storms, and aggressive soil conditions.
The unique environment results in a more rapid rate of asset deterioration, and lower worker productivity compared to peer distribution businesses.
The northern region is also a high termite hazard zone requiring Power and Water to standardise the use of steel poles to mitigate the safety and reliability risks associated with termite damage to wooden poles. This design consideration influences the total cost and the level of service that the pole and tower assets can deliver.
Climate change is also expected to further exacerbate the environmental conditions over time, resulting in increased asset damage and failure from an increase in quantity and/or severity of cyclones, storms, lightning activity, dust storms and droughts.
These factors impact uniquely on the Power and Water network and assets. Table 18: Environmental challenges in relation to pole and tower asset management
Region Environment Challenges Expenditure / risk implications
Alice Springs
Desert
• Dust storms and drought. • Occasional flooding after long
dry periods. • Highly saline soils
• Hot desert environment leading to heat related stresses and reduced productivity.
• Although rare, extreme weather events do occur (e.g. flooding).Aggressive soil types resulting in high corrosion issues (particularly related to steel assets, e.g. earthing systems and poles).
• Climatic change may result in increased asset damage and failure from increase quantity and/or severity of dust storms and drought.
• Pole replacement program.

Asset Class Management Plan – Poles and Towers
PAGE 27 OF 51
THIS DOCUMENT IS UNCONTROLLED WHEN PRINTED
Region Environment Challenges Expenditure / risk implications
Darwin Coastal / Tropical
• Cyclones. • Up to 21,924 lightning strikes
per year (Global Position And Tracking Systems (GPATS) - 2007 to 2017 Data).
• 6-8 Ground strikes per km2 per year (Bureau of Meteorology (BOM)).
• Tropical storms with winds in excess of 100 kilometres per hour.
• Long periods of high supply demands.
• High corrosion rates due to coastal proximity and hot and humid conditions.
• Hot and humid environment leading to heat related stresses and reduced productivity.
• Extreme weather events (e.g. cyclones and flooding).
• Increased asset damage and failure from an increase in quantity and/or severity of storms and lightning.
• Tower refurbishment program. • Tower earthing system refurbishment
program.
Katherine Inland / Tropical • Tropical storms and lightning. • High corrosion rates due to hot
and humid conditions.
• Hot and humid environment leading to heat related stresses and reduced productivity,
• Increased asset damage and failure from an increase in quantity and/or severity of storms and lightning.
• No immediate investment programs planned.
Tennant Creek Desert
• Dust storms and drought. • Occasional flooding after long
dry periods.
• Hot desert environment leading to heat related stresses and reduced productivity.
• Increased asset damage and failure from an increase in quantity and/or severity of dust storms and drought.
• No immediate investment programs planned.
Operational challenges 6.2
1) Asset access
Unpredictable weather conditions and extended and high rainfall periods limit the ability to access assets and effectively schedule and undertake operational and construction activities during the wet season. This directly impacts productivity associated with civil and structural works due to ground water levels filling excavations, impacting excavation wall integrity, and pole and tower installations in extreme conditions that can affect workmanship due to both water ingress and the physical stress on field crews. This is exacerbated by the majority of pole and tower faults occurring during the worst working conditions, as shown in Figure 19.
2) Asset design
The key operational challenge related to pole and tower assets is the unique design of the distribution and transmission poles. The Power Network distribution and transmission poles are largely made up of a welded steel type design; i.e. both the pole and crossarms are made of steel and welded together. The design calls for additional equipment, resourcing, and outage times to allow for the placement and removal of poles during pole replacements. In most cases pole

Asset Class Management Plan – Poles and Towers
PAGE 28 OF 51
THIS DOCUMENT IS UNCONTROLLED WHEN PRINTED
replacements involve the establishment of a complete new structure including the pole top structure.
This challenge significantly adds to the reliability measures for the assets class. An escalation in asset failure is likely to significantly impact the reliability measures of the asset class, and significantly increase the risk associated with public and worker safety.
3) Operational effectiveness
Power and Water operates in hot and humid environments leading to heat related stresses and reduced productivity resulting in increased time to undertake maintenance and inspection tasks. These environments are not comparable to other networks around Australia and have a significant impact on the productivity of the field crews. To assess and quantify the impact of the climatic conditions, Power and Water undertook a study in selected locations across Australia.
Workability is the term used to describe the productivity impact of climate in both Northern and Southern regions. It is the percentage of time for which work of different physical exertion can be effectively undertaken.
Table 19 describes the work rates used in the study along with a description and examples. Table 19: Work rate descriptions Work rate Description Work examples Rest Rest. Lunch and Crib Breaks.
Low Sitting with light manual hand/arm work. Driving. Standing with light arm work, occasional walking.
Driving, work planning, briefings and toolbox meetings, inspections.
Moderate Sustained moderate hand to arm work, moderate arm and truck work. Light pushing and pulling. Normal walking.
Unpacking tools, spare parts, dismantle/ replace small electronic components, general switching from ground.
High Intense arm and truck work, carrying, shovelling, manual sawing, pushing and pulling heavy loads, walking at a fast pace.
Climbing ladders, working in trenches and cabinets, remove replace larger components.
Very High Very intense activity at a fast to maximum pace.
Carrying larger tools and replacement components, lifting, carrying up ladders, digging trenches, hauling cables and moving cable, pillars and poles.
The outcome of the study is shown in Table 20 with the impact on Power and Water highlighted in orange. It demonstrates that the climatic conditions, particularly in Darwin where the majority of Power and Water’s network is located, resulting in an average Workability of 65% compared to other major cities in Australia. This would equate to a 35% escalation in labour hours compared with the Southern states for similar work and therefore an escalation in opex.
This is supported by feedback received via a heat stress survey which identified that approximately 50% of workers report daily or weekly heat-related impacts on their productivity. Table 20: Workability for selected Australian locations based upon moderate metabolic rate
Location Month
J F M A M J J A S O N D Alice Springs 94% 100% 100% 100% 100% 100% 100% 100% 100% 100% 100% 100% Adelaide 100% 100% 100% 100% 100% 100% 100% 100% 100% 100% 100% 100% Brisbane 100% 100% 100% 100% 100% 100% 100% 100% 100% 100% 100% 100%

Asset Class Management Plan – Poles and Towers
PAGE 29 OF 51
THIS DOCUMENT IS UNCONTROLLED WHEN PRINTED
Location Month
J F M A M J J A S O N D Darwin 41% 44% 45% 60% 100% 100% 100% 100% 74% 46% 34% 32% Hobart 100% 100% 100% 100% 100% 100% 100% 100% 100% 100% 100% 100% Melbourne 100% 100% 100% 100% 100% 100% 100% 100% 100% 100% 100% 100% Perth 100% 100% 100% 100% 100% 100% 100% 100% 100% 100% 100% 100% Sydney 100% 100% 100% 100% 100% 100% 100% 100% 100% 100% 100% 100%
4) Demand profile
The demand profile across the network is flat and consistent across each day, as shown in Figure 172. The daily peak is fairly flat and consistent between 8am and 10pm and is driven by the use of air conditioners. This shows that all assets are utilised consistently and therefore it is more difficult to remove assets from service for prolonged periods of time.
During the wet season, November to April, the load profile becomes flatter (more consistent) with less difference between the peak and the trough and the demand is about 10% higher.
Figure 17: Darwin average daily demand profile (Hudson Creek ZSS) May to October
2 Based on Hudson Creek only

Asset Class Management Plan – Poles and Towers
PAGE 30 OF 51
THIS DOCUMENT IS UNCONTROLLED WHEN PRINTED
Figure 18: Darwin average daily demand profile (Hudson Creek ZSS) November to April
The annual maximum shows the demand for the highest half hour interval for the year. This shows that although the average peak was approximately 150 MVA, the maximum was 200 MVA, or 33% higher.
5) Seasonal challenges
Darwin has two distinct seasons, the 'wet' and the 'dry'. The wet season runs from October/November until April/May, and is characterised by high humidity, monsoonal rains and storms. Temperatures typically range from a minimum of 20°C to a maximum of 33°C3 as measured by the Bureau of Meteorology (BOM) over a 77 year period from 1941.
Figure 19 shows the 10 year average monthly maximum temperature measured in Darwin indicating the change in season during the year, in comparison with the corresponding average number of pole and tower failures. The ‘dry’ season is characterised by average maximum temperatures dropping to around 31°C and the ‘wet’ season with average maximum temperatures up around 34°C.
The pole and tower failure profile shows a strong correlation between pole and tower failures and the seasonal climate conditions. An increase in asset failures is observed during the time periods when environmental factors, access to assets, workability and demand profiles presents the highest challenges.
As climate conditions continue to change a corresponding increase in pole and tower failures are expected to be observed during these worst periods of the year, especially impacting the Darwin region at the Top End of the NT.
3 Bureau of Meteorology (BOM), Climate statistics for Australian locations, Darwin

Asset Class Management Plan – Poles and Towers
PAGE 31 OF 51
THIS DOCUMENT IS UNCONTROLLED WHEN PRINTED
Figure 19: Average annual temperature and pole and tower failure profile
Asset challenges 6.3
The health of pole and tower assets and associated earthing systems are uniquely challenged in the Power and Water network. The key underlying issue relates to corrosion. The pole and tower assets are subject to high corrosion environments in the Darwin region and high corrosive soil conditions in the Alice Springs region.
These underlying factors are key considerations in the following asset challenges identified in the transmission and distribution overhead networks.
6.3.1 Transmission Poles and Towers
1) Transmission Tower Corrosion Protection Life Extension Program
Full details on this asset challenge are available in the BNI document: • NMP9 - Transmission Tower Corrosion Protection Life Extension Program
A structyral inspection of 72 poles and towers, or 2.8% of the population in the Darwin region, revealed tower galvanising had reached or was very close to end of life, particularly on structures aged around 40 years and over. The inspection results are summarised as follows:
• 69%, or 50 of the towers and poles inspected were identified as requiring recoating;
• 98% of the towers aged 42 years, were identified as requiring recoating; and
• all the structures identified as requiring recoating are of the lattice tower structure type.
Up to 39% of the Darwin transmission tower and pole population is aged 40 years and older; i.e. around 1,027.

Asset Class Management Plan – Poles and Towers
PAGE 32 OF 51
THIS DOCUMENT IS UNCONTROLLED WHEN PRINTED
A refurbishment program targeting the 50 towers identified during the inspection is proposed for the next regulatory period. The scope involves the recoating of transmission pole and tower structures to rectify corrosion defects and extend the asset life. The systematic inspection and refurbishment of targeted transmission towers and poles is considered an effective asset management approach directed at maintaining the safe and reliable operation of the network in a prudent and cost efficient manner.
2) Transmission Tower Earthing System Refurbishment Program
Full details on this asset challenge are available in the BNI document: • NMP11 - Transmission Tower Earthing System Refurbishment Program
Recent investigations identified deficiencies in Power and Water’s transmission line earthing systems. Earthing tests done over a 30 year period from 1986, with the most recent tests undertaken in 2015-16, demonstrates deterioration in tower base earth systems. The most recent results showed 46% of the test sample exceeded 10Ω earthing resistance and 28% exceeded 30Ω.
Transmission line earthing is a key mechanism for operating a safe and reliable transmission network. Its purpose is to ensure that the lightning performance of the line is acceptable and the dissipation of fault current is effective, avoiding build-up of unsafe step and touch potentials around the base of the towers. A program involving the refurbishment of the transmission pole and tower earthing systems is proposed for the next regulatory period. The program will target the refurbishment of 313, or 12% of earthing systems in the Darwin region over the five year period.
6.3.2 Distribution Poles
1) Alice Springs corroded poles
Full details on this asset challenge are available in the PBC document: • Preliminary Business Case PRA34420 Alice Springs Corroded Poles
Recent (2015 and 2016) investigations into unassisted pole failures in Alice Springs identified a significant issue related to below ground corrosion. The investigation of the failed poles identified that high soil salinity accelerated the corrosion of unprotected steel below ground, leading to pole failure.
A program involving the replacement and rebutting of distribution poles in the Alice Springs region is proposed for the next regulatory period. The program will target the refurbishment or replacement of 945 poles, or 15% of the Alice Springs population over the 5 year period. This will be an ongoing program expected to continue into subsequent regulatory periods.
Asset Management challenges 6.4
Asset management is the application of management, financial, economic, engineering and other practices to infrastructure assets with the objective of providing the required level of service in the most cost-effective manner. It requires the management of the asset condition throughout the asset life cycle, including design, construction, commissioning, operating, maintaining, repairing, modifying, replacing and decommissioning/disposal. A study of condition and performance data captured over time assists in managing the asset to function optimally in a

Asset Class Management Plan – Poles and Towers
PAGE 33 OF 51
THIS DOCUMENT IS UNCONTROLLED WHEN PRINTED
safe and reliable manner throughout its life cycle. The life cycle asset management approach applied by Power Networks is provided in Appendix A.
A key asset management challenge is a lack of comprehensive asset condition assessment data across the network to fully understand and evaluate the health and deterioration of the pole and tower assets.
Improvement in the processes for, and quality of, data collection is a key focus and is being prioritised. Significant steps have already been taken through the introduction of mobile devices to capture data in the field at the time of inspection and testing. The impacts of corrosion deterioration on the functional integrity and strength of poles and towers are also being investigated through post failure assessments and testing.
Particular techniques to assess the below and above ground condition and remaining life of steel assets are a key challenge and are currently being investigated.
In addition, the unique pole design and widely varying environmental factors associated with the Power Network assets does not allow for easy benchmarking and learnings from industry peers.
Performance indicators 7The performance of poles and towers against the specific objectives and measures identified in Section 2.3 are provided here. The performance shown here represents the historical performance of the asset class to date. It is expected that benefits from investments proposed in the next regulatory period will manifest as benefits in these key objectives. The projected investment outcomes in relation to past performance trends are provided in Section 11.
Operational performance indicators 7.1
The performance of the pole and tower asset class over the 10 year period from 2006-07 is provided in Figure 20. Transmission pole and tower contribution to system SAIDI/SAIFI over the last 10 years has been insignificant although this is expected due to the meshed configuration. The performance shown in Figure 20 therefore represents the performance of the distribution pole assets.
The charts show the performance based on sustained outages only; i.e. outages with a duration greater than one minute and excludes major event days (MEDs). In particular the following events were excluded from the analysis calculating the percentage contribution of the asset class into Northern Territory (NT) SAIDI/SAIFI:
a) planned outages; b) generation-related outages; c) outages that were internal to customer premises; or d) outages initiated in the interest of public safety.
The pole and tower contribution to NT SAIDI under a ‘no investment’ scenario is expected to increase to around 13% by the end of the regulatory period, 2023-24, and a corresponding increase in SAIFI contribution of up to around 2.6% is projected. This is a near doubling of the contribution from distribution poles over the next regulatory period. The projected increase is based on the performance trend observed over the last five years and with consideration of the aging asset population and increasing number of assets approaching/exceeding replacement life.

Asset Class Management Plan – Poles and Towers
PAGE 34 OF 51
THIS DOCUMENT IS UNCONTROLLED WHEN PRINTED
The cause of pole related incidents includes asset failures, third party vehicle impacts with Power and Water assets and unidentified outages. On average distribution pole failure events annually contributes around 7% into the NT SAIDI and 1.5% into NT SAIFI.
Figure 20: Distribution Pole and Tower contribution into SAIDI/SAIFI
A significant increase in system reliability contribution from distribution poles has been observed over the last 10 years, increasing from around two outage events per year in the years prior to 2010 to around five events per year in the last five years and contributing an average 455,000 customer minutes lost (CML) to the annual network performance. Figure 21 shows the pole failure and associated CML recorded since 2006-07.
Figure 21: Historical pole failures and reliability consequence in customer minutes lost

Asset Class Management Plan – Poles and Towers
PAGE 35 OF 51
THIS DOCUMENT IS UNCONTROLLED WHEN PRINTED
Included in the performance contribution is the failure of, on average, one pole per year in the Alice Springs region since 2012. An unassisted pole failure in 2015, followed by two more in 2016 triggered investigations that identified a systemic and advanced in-ground corrosion issue brought about by high salinity concentrations. If not treated the system performance contribution from distribution poles in Alice Springs is expected to increase significantly over time.
A comparison with peer utilities demonstrates that Power and Water owns and operates one of the largest and oldest steel pole populations in the NEM. Figure 22 shows Power and Water’s steel pole population in comparison with peer organisations.
Figure 22: Steel pole population comparison
Given the average age, population and the corrosive environment, asset failure rates are expected to be high in comparison with peers, however Figure 23 indicates a relatively low pole failure rate observed in the Power and Water network. This is expected to change given the increasing failure rates over the past 10 years and the number of poles that are reaching the standard asset replacement life. A heightened appreciation for corrosion issues and improved data collection practices is expected to lead to an increase in the number of condition issues identified and need for investment in asset renewal over the next five years.

Asset Class Management Plan – Poles and Towers
PAGE 36 OF 51
THIS DOCUMENT IS UNCONTROLLED WHEN PRINTED
Figure 23: Steel pole failure rate
Health and Safety indicators 7.2
A key corporate objective is the safe operation of the network. The number of safety related events associated with transmission poles and towers and distribution poles, as recorded over the last 10 years, is shown in Table 21 and Table 22 respectively. Safety-related incidents include those outages which were caused by vehicle collision with Power and Water assets, public safety-related outages requested by emergency services and house fires. Table 21: Number of safety-related incidents associated transmission towers/poles
Financial Year Number of Outages Comment
2000-01 1 Incident - Third Party 2002-03 1 Incident - Third Party 2010-11 1 Incident - Third Party
2011-12 1 Outage in the interest of public safety (member of the public climbed up a 66kV tower)
Total 4
Table 22: Number of safety-related incidents associated distribution poles
Financial Year Number of Outages Comment
2006-07 1 Incident - Third Party 2007-08 1 Incident - Third Party 2008-09 4 Incident - Third Party
2009-10 3 Forced outage – Power and Water equipment presents unacceptable risk. Outage in the interest of public safety (member of the public climbed up

Asset Class Management Plan – Poles and Towers
PAGE 37 OF 51
THIS DOCUMENT IS UNCONTROLLED WHEN PRINTED
Financial Year Number of Outages Comment
a pole). 2010-11 8 Incident - Third Party 2011-12 3 Incident - Third Party
2012-13 10 Incident - Third Party Outage in the interest of public safety (member of the public climbed up a pole).
2013-14 3 Incident - Third Party Outage in the interest of public safety Forced outage – Power and Water equipment presents unacceptable risk
2014-15 3 Incident - Third Party 2016-17 4 Incident - Third Party Total 40
Financial indicators 7.3
Power and Water’s long term financial sustainability, as underwritten by affordable service and shareholder returns, is demonstrated in the efficiency and competitiveness of its capital and operating costs.
The capital expenditure forecast for pole and tower assets has been based on historical unit costs, relying on recent and similarly scoped projects. The approach aligns with industry best practice and relies on data that is continuously validated and updated.
7.3.1 Capital unit costs
The capital unit rates are a significant input towards the capital expenditure forecast and have been calculated and justified to be efficient and prudent.
The capital unit rates applied in establishing the regulatory capital forecast have been assessed against similar unit costs observed across the NEM. The comparison provided an indicative measure of the reasonableness of Power and Water’s costs and has been based on publicly available data sourced from the AER’s repex modelling and utility Regulatory Information Notice (RIN) submissions.
There are a number of internal and external operational, asset type and environmental factors that influence the benchmark costs and provide a challenge in respect of the ability to undertake accurate comparisons. Normalisation for these factors has not been undertaken and the benchmark comparisons provided are an indicative measure of reasonableness only.
In undertaking the comparison, Power Networks was considered comparable with six Australian utilities of largely rural type networks. Subject to the availability of appropriate data, these utilities included ActewAGL, Endeavour Energy, Essential Energy, Ergon Energy, TasNetworks, Powercor and United Energy. Where historical unit costs have been utilised as part of the bottom-up estimates or historical analysis, these have been escalated to 2017-18 dollars by Consumer Price Index (CPI) only. The CPI escalation factor was derived from indexes published by the Australian Bureau of Statistics for all consumer groups and applicable to the Darwin area.
Power and Water’s unit cost for the replacement of HV and LV distribution poles are provided in Figure 24 and Figure 25. In comparison with peer averages observed across the NEM, Power and Water’s costs are high. The costs are, however, reflective of the unique welded design of the

Asset Class Management Plan – Poles and Towers
PAGE 38 OF 51
THIS DOCUMENT IS UNCONTROLLED WHEN PRINTED
steel poles that require additional equipment, resourcing and outage times to allow for the placement and removal of poles. This asset design challenge is compounded by the remoteness of the network, harsh weather conditions and a tropical climate that impacts on the productivity levels of work undertaken in the T.
Taking into consideration the extenuating asset design and work conditions, the unit costs are considered reasonable.
Figure 24: HV Distribution pole replacement Unit cost comparison
Figure 25: LV Distribution pole replacement Unit cost comparison
7.3.2 Operating unit costs
The operational expenditure includes the expenditure incurred in operating and managing the pole and tower asset fleet, ensuring that the assets continue to provide their pre-determined service capacity and quality of service and achieve the duration of their useful life. The operating expenditure therefore includes maintenance and direct overhead expenditure associated with the pole and tower assets.
Maintenance expenditure includes those costs incurred when:
• an asset is restored to its operational condition; and • to ensure the asset meets its operational performance and reliability; and • does not extend the useful life of the asset.

Asset Class Management Plan – Poles and Towers
PAGE 39 OF 51
THIS DOCUMENT IS UNCONTROLLED WHEN PRINTED
Direct overhead expenditure is associated with scheduling and planning. These support activities cannot readily be identified as belonging to a particular value adding task/activity and has been allocated on a pro-rata basis.
Similar to the capital cost, a comparison with peer utility expenditures has been applied to provide an indicative measure of the reasonableness of Power and Water’s costs and has been based on publicly available data sourced from the utility Regulatory Information Notice (RIN) submissions.
Insufficient peer utility data was available to allow for a comparison of operations and maintenance costs associated with emergency response works at the asset class level. Emergency response operation and maintenance costs have therefore been excluded from the comparison.
There are internal and external operational, asset type and environmental factors that influence the benchmark costs and provide a challenge in respect of the ability to undertake accurate comparisons. Normalisation for these factors has not been undertaken and the benchmark comparisons provided here are an indicative measure of reasonableness only.
Where historical unit costs have been utilised as part of the analysis, these have been escalated to 2017 dollars by CPI only. The CPI escalation factor was derived from indexes published by the Australian Bureau of Statistics for all consumer groups and applicable to the Darwin area.
A comparison of Power and Water’s average annual routine and non-routine maintenance cost in comparison with peer organisations are provided in Figure 26. The Power and Water cost represents the average annual cost recorded over the last five years.
The high level unnormalised comparison indicates that Power and Water’s costs compare in the upper range of costs recorded across the NEM. Works undertaken in the NT are characterised by higher costs compared to other areas in Australia. This can be partly attributed to the remoteness of the network, attracting additional transport and logistic costs; as well as the harsh weather conditions set apart by extended wet and high rainfall periods that impedes the effective execution of works and a tropical climate that impacts on the productivity that can be achieved during normal work hours. Section 6 provides a discussion on the environmental and operational challenges associated with the Power and Water power network.
Power and Water’s routine and non-routine maintenance costs associated with poles and towers are considered reasonable.
Figure 26: Pole and Tower routine and non-routine maintenance cost comparison

Asset Class Management Plan – Poles and Towers
PAGE 40 OF 51
THIS DOCUMENT IS UNCONTROLLED WHEN PRINTED
Growth requirements 8The demand for power infrastructure is driven mostly by growth in the number of new network connections. To understand this potential growth Power and Water engaged the Australian Energy Market Operator (AEMO) in 2017 to undertake a connection forecast for the network regions of Darwin-Katherine, Tennant Creek, and Alice Springs4. The outcome of the study identified relatively low customer connection growth across the network with the highest expected average growth in Tennant Creek, 1.0%, followed by Darwin, 0.8%, and Alice Springs, 0.1%. The outcome of the connection forecast is summarised in Figure 27.
Figure 27: Customer connection growth by region (AEMO 2017 Forecast)
Overhead power lines generally remain the lowest-cost method of power distribution to most new urban and commercial developments in the Power and Water network, making the projected connection growth a very reasonable proxy for the expected increase in overhead infrastructure asset requirements over the same period.
It is noted that the AEMO connection growth forecast shows a significantly reduced growth rate in comparison with Power and Water’s annual average growth in pole assets over the recent five years from 2012-13 to 2015-16. The exception is Tennant Creek where the connection growth rate is higher than past asset growth rates. The changing environment with reducing demand growth is expected to impact on the requirement for network growth and the AEMO forecast has been adopted to project the expected growth in pole and tower assets by the end of the regulatory period, 2023-24.
The projected increase in pole and tower assets is provided in Table 23. In summary the following approach was taken in calculating the asset growth projections:
• no growth in transmission poles and towers assets is expected or planned; • the pole forecast was based on the customer connection forecasts from AEMO’s 2017
report: Power and Water Corporation Maximum Demand, Energy Consumption, and Connections Forecasts;
4 AEMO, Power and Water Corporation Maximum Demand, Energy Consumption, and Connections Forecast, September
2017

Asset Class Management Plan – Poles and Towers
PAGE 41 OF 51
THIS DOCUMENT IS UNCONTROLLED WHEN PRINTED
• the current asset base (i.e. number of poles) was increased each year according to percentage change in the forecast number of connections; and
• for periods where this percentage change was negative, the asset base remained the same under the assumption that the existing network size will not reduce as result of short-to-medium term negative customer growth.
Table 23: Pole and Tower forecast growth, quantity (FY19 to FY24)
Region
Historical average annual asset growth rate
(2012-13 to 2015-16)
AEMO annual connection growth rate
Transmission Pole & Tower increase
by 2023-24
Distribution Pole increase by 2023-
24
Darwin-Katherine 1.0% 0.8% 0 1,551
Alice Springs 2.2% 0.1% 0 48
Tennant Creek 0.2% 1.0% 0 228 Total pole and tower increase 1.1% 0.7% 0 1,827
The growth in assets will impact on the health and criticality profile of the asset class. The new assets are expected to be of good health and prorated across the asset criticalities.
The revised forecast health and criticality profiles for both transmission and distribution poles and towers by the end of the regulatory period, assuming no investment and including growth, are shown in Table 24 and Table 25. The growth numbers are reflected in the increase in the H1 asset quantities. No growth increase is forecast for the transmission poles and towers. Table 24: Transmission pole and tower health-criticality matrix (quantity) with growth and no investment H1 H2 H3
C1 259 64 1,517
C2 60 86 686
C3 236 0 145
Table 25: Distribution (HV & LV) pole health-criticality matrix (quantity) with growth and no investment H1 H2 H3
C1 6,132 1,408 1,427
C2 5,611 5,433 1,869
C3 16,226 5,830 958
Renewal and maintenance requirements 9Power and Water’s renewal and maintenance investment plans are aimed at addressing key asset challenges identified within the asset class.
Targeted inspections and testing are undertaken to investigate assets of concern and a separate assessment, applying the asset health and criticality decision making approach5 and the more detailed understanding of the condition of the specific assets, is used to assess the risk associated with the assets and to identify those assets that bear the greater risk.
5 ‘Program Replacement Volume Forecast Method’ discussion paper

Asset Class Management Plan – Poles and Towers
PAGE 42 OF 51
THIS DOCUMENT IS UNCONTROLLED WHEN PRINTED
Opportunities to maintain the safe and reliable operation of the network are then considered and typically include assessing the options of run-to-failure, test and replace and targeted pro-active renewal. The outcomes of the assessment manifest in a preferred investment option with a high level scope and cost estimate.
Maintenance activities are crucial in the early identification of asset health and condition issues and the prioritisation of assets for further investigation. Inspection findings, field service feedback and performance measures are the main inputs used to identify those assets that are of particular concern, or may have a type issue. Routine asset inspections are therefore a fundamental aspect of Power and Water’s maintenance regime to ensure prudent and effective investments.
The process and outcomes of the renewal and maintenance requirement assessments are documented in the Business Needs Identification (BNI) documents that are prepared for and approved by the Chief Executive.
The following projects and programs have been evaluated and provide the pole and tower renewal and maintenance requirements proposed for the next regulatory period.
Transmission Poles and Towers 9.1
9.1.1 Transmission Pole and Tower asset renewal plans
1) Transmission Tower Corrosion Protection Life Extension Program
Full details on this asset challenge and assessment are available in the BNI document: • NMP9 - Transmission Tower Corrosion Protection Life Extension Program
Applying the health and criticality criteria laid out in Section 5.2 the assessment of the towers inspected for life extension refurbishment investment is provided in Table 26. It prioritises those assets in the H3 health category.
Table 26: Transmission poles and towers inspected for life extension, health-criticality matrix (quantity) H1 H2 H3
C1 18 48
C2 3 3
C3
A further 350 poles and towers will be identified for a methodical inspection, targeting those assets prioritised in the red and orange zones of Table 10, Section 5.2.
The projected annual refurbishment and methodical inspection volumes over the regulatory period are provided in Table 27. This refurbishment and inspection strategy is expected to be continued in future regulatory periods.
Table 27: Projected annual Transmission pole and tower refurbishment and inspection investment
Program 2019-20
Qty
2020-21
Qty
2021-22
Qty
2022-23
Qty
2023-24
Qty
Total
Qty Refurbishment volumes 10 10 10 10 10 50
Methodical Inspection volumes 70 70 70 70 70 350
2) Transmission Tower Earthing System Refurbishment Program

Asset Class Management Plan – Poles and Towers
PAGE 43 OF 51
THIS DOCUMENT IS UNCONTROLLED WHEN PRINTED
Full details on this asset challenge and assessment are available in the BNI document: • NMP11 - Transmission Tower Earthing System Refurbishment Program
Applying the health and criticality criteria laid out in Section 5.2, the assessment of the sample of towers inspected for earthing system refurbishment investment is provided in Table 28. It prioritises 189 poles and towers in the red and orange zones.
Table 28: Transmission pole and tower earth system health-criticality matrix (quantity) - inspected poles and towers only H1 H2 H3
C1 56 13
C2 41 42
C3 145 2
The projected annual refurbishment and methodical inspection volumes over the regulatory period is provided in Table 29 and will refurbish all the earthing systems that have been tested to date and have failed and includes for the continued testing and refurbishment of earthing systems, targeting those assets prioritised in the red and orange zones of Table 10, Section 5.2. This refurbishment and inspection strategy is expected to be continued in future regulatory periods.
Table 29: Projected annual Transmission pole and tower refurbishment and inspection investment
Program 2019-20
Qty
2020-21
Qty
2021-22
Qty
2022-23
Qty
2023-24
Qty
Total
Qty
Earthing System Refurbishment volumes 76 60 60 60 57 313
9.1.2 Transmission Pole and Tower asset maintenance plans
The maintenance plan for transmission poles and towers is to continue with the established maintenance regime, which is based on three-yearly inspections and repair (or replacement) upon failure.
Distribution Poles 9.2
9.2.1 Distribution Pole asset renewal plans
1) Alice Springs Corroded Poles Replacement Program
Full details on this asset challenge and assessment are available in the PBC document: • Preliminary Business Case PRA34420 Alice Springs Corroded Poles
Applying the health and criticality criteria laid out in Section 5.3, the assessment of the Alice Springs poles is provided in Table 30. It prioritises 2,444 poles in the red and orange zones.
Table 30: Alice Springs distribution pole health-criticality matrix (quantity) H1 H2 H3
C1 682 1,289 1,077
C2 457 499 1,677
C3 110 122 645
It is proposed to inspect 2,146 poles and replace or refurbish 945 poles in the Alice Springs area during the next regulatory period, targeting those assets identified in the red

Asset Class Management Plan – Poles and Towers
PAGE 44 OF 51
THIS DOCUMENT IS UNCONTROLLED WHEN PRINTED
and orange zone. This replacement program is expected to be continued in future regulatory periods.
9.2.2 Distribution Pole asset maintenance plans
The maintenance plan for distribution poles is to continue with the established maintenance regime, which is based on three-yearly inspections and repair (or replacement) upon failure.
Investment program 10The investment program is developed based on the:
• continuation of the established lifecycle asset management approaches;
• specific requirements related to growth in the asset class – outlined in Section 8; and
• specific requirements related to the renewal and maintenance of the asset class – outlined in Section 9.
Augmentation expenditure (augex) 10.1
No augmentation related requirements associated with pole and tower assets have been identified for the next regulatory period.
Renewal expenditure (repex) 10.2
There are three renewal programs proposed for the asset class over the next regulatory period, 2019-20 to 2023-24. The programs are expected to cost $17.59 million over the five year period and include investment in both the transmission and distribution assets.
The renewal expenditure forecast based on the mention programs are provided in Table 31. Table 31: Renewal expenditure forecast
Year 2019-20
($ million)
2020-21
($ million)
2021-22
($ million)
2022-23
($ million)
2023-24
($ million)
Total
($ million) Transmission Pole and Tower Refurbishment $0.40 $0.40 $0.40 $0.40 $0.40 $2.02
Transmission Pole and Tower earthing system refurbishment
$0.87 $0.68 0.683 0.683 0.654 $3.57
Alice Springs Corroded Poles $3.00 $2.50 $2.50 $2.00 $2.00 $12.00
Total Repex $4.27 $3.59 $3.59 $3.09 $3.06 $17.59
The revised five-year forecast health and criticality profiles for the transmission poles and towers and distribution poles, following the proposed investments, are shown in Table 32 and Table 33. The reduction in risk is demonstrated in the number of assets that move from the low health, H3 category, to the high health category, H1, in comparison with the ‘current’ and ‘no investment’ risk scenarios provided in Section 5.2 and Section 5.3.
The earthing system refurbishment investments are not expected to impact on the health or failure mode of the pole and tower assets.

Asset Class Management Plan – Poles and Towers
PAGE 45 OF 51
THIS DOCUMENT IS UNCONTROLLED WHEN PRINTED
Table 32: Transmission poles and towers health-criticality matrix (quantity) with investment H1 H2 H3
C1 307 64 1,469
C2 63 86 683
C3 236 145
Table 33: Distribution pole health-criticality matrix (qty) with investment H1 H2 H3
C1 6,132 1,408 1,427
C2 6,317 5,433 1,163
C3 16,871 5,830 313
Historic, forecast and future expenditure comparison 10.3
Replacement expenditure on poles and towers in recent years has been predominantly associated with the major corrosion problem in Alice Springs, as well as a large program of Relative Loss Section (RLS) testing and the resulting pole replacements and refurbishments.
As outlined in the preceding sections, the forecast expenditure on poles and structures is targeted to address the key asset challenges expected to manifest over the regulatory period. It is noted that the forecast shows a gradual decline in annual expenditure over the forecast period consistent with the targeted approach to addressing the highest risk (i.e. worst health/condition) assets.
Future expenditure in the asset class has been forecast using the AER’s repex model and shows an increasing requirement for investment. As the AER’s repex model is primarily an age-based model it is expected that, through continuing to target poor health assets, future investment in the asset class can be managed at a level below $3.0 million per annum.
The increase in expenditure during the current regulatory period (2014-19) has been due to an increase in the number of pole refurbishments and replacements due to pole corrosion being detected across the Alice Springs network. Based on the rate of deterioration of poles and structures across the network, the expenditure profile will need to be maintained at an elevated level as compared to historic expenditure to avoid an increase in the rate of in-service functional failures.
The trend in expenditure is downwards and reflects the investment required to address the asset specific issues in order to maintain overall risk.

Asset Class Management Plan – Poles and Towers
PAGE 46 OF 51
THIS DOCUMENT IS UNCONTROLLED WHEN PRINTED
Operational expenditure (opex) 10.4
The operating expenditure for poles and towers for the current and next regulatory period is provided in Table 34. Table 34: Operating expenditure forecast
Asset type Expenditure category FY14 (H)
FY15 (H)
FY16 (H)
FY17 (H)
FY18 (F)
FY19 (F)
FY20 (F)
FY21 (F)
FY22 (F)
FY23 (F)
FY24 (F)
Transmission poles and towers
Routine $0.25 $0.38 $0.10 $0.09 $0.17 $0.16 $0.14 $0.14 $0.14 $0.14 $0.14 Non-routine $0.13 $0.27 $0.49 $0.18 $0.26 $0.24 $0.21 $0.21 $0.21 $0.21 $0.21 Fault and emergency $0.00 $0.02 $0.01 $0.00 $0.01 $0.01 $0.01 $0.01 $0.01 $0.01 $0.01
Total $0.38 $0.68 $0.59 $0.27 $0.44 $0.40 $0.36 $0.36 $0.36 $0.36 $0.36
Distribution poles Routine $0.00 $0.00 $0.01 $0.04 $0.01 $0.01 $0.01 $0.01 $0.01 $0.01 $0.01 Non-routine $0.60 $0.51 $0.22 $0.56 $0.46 $0.42 $0.37 $0.37 $0.37 $0.37 $0.37 Fault and emergency $0.14 $0.33 $0.33 $0.36 $0.27 $0.26 $0.25 $0.25 $0.25 $0.25 $0.25
Total $0.74 $0.84 $0.55 $0.96 $0.74 $0.69 $0.63 $0.63 $0.63 $0.63 $0.63
All poles and towers
Routine $0.25 $0.38 $0.11 $0.13 $0.18 $0.16 $0.15 $0.15 $0.15 $0.15 $0.15 Non-routine $0.73 $0.78 $0.71 $0.74 $0.73 $0.65 $0.58 $0.58 $0.58 $0.58 $0.58 Fault and emergency $0.14 $0.35 $0.33 $0.36 $0.27 $0.26 $0.26 $0.26 $0.26 $0.26 $0.26
Total $1.11 $1.51 $1.15 $1.23 $1.18 $1.08 $0.99 $0.99 $0.99 $0.99 $0.99

Asset Class Management Plan – Poles and Towers
PAGE 47 OF 51
THIS DOCUMENT IS UNCONTROLLED WHEN PRINTED
Asset class outcomes 11 Key performance indicators 11.1
11.1.1 Reliability indicators
Excluding the issues emerging in Alice Springs, historical pole and tower events recorded on the transmission network over the past 15 years all involved forcible third-party vehicle impact with PWC’s assets. The asset condition issues addressed by the transmission pole and tower investment programs does not mitigate against third-party vehicle impacts, and the projected transmission pole and tower contribution to reliability performance is therefore not expected to be impacted by the proposed investments.
The Alice Springs pole replacement program is expected to deliver system reliability performance benefits. The Alice Springs pole population makes up around 15% of the total system distribution pole population. At a renewal rate of around 270 poles over the proposed regulatory period, the total renewal rate is around 0.63% and is expected to have around a 0.65% NT SAIDI and 0.13% NT SAIFI improvement impact. The projected potential reliability improvements are illustrated in Figure 29 and Figure 30.
Improvements were calculated as the percentage contribution to total system performance at an asset level based on historical performance and taking into account existing asset quantities, expected growth rates and renewal volumes. The SAIDI/SAIFI improvements followed the quantity of assets expected to be replaced or refurbished.
With no reliability performance impact expected from the transmission pole and tower investments, the distribution pole performance impact reflects the expected performance contribution improvements from the overall pole and tower asset class.
Figure 28: Distribution poles contribution into NT system SAIDI, following investment

Asset Class Management Plan – Poles and Towers
PAGE 48 OF 51
THIS DOCUMENT IS UNCONTROLLED WHEN PRINTED
Figure 29: Distribution poles contribution into NT system SAIFI, following investment
11.1.2 Responsibility indicators
Excluding the issues emerging in Alice Springs, historical transmission and distribution pole and tower safety related incidents recorded on the transmission and distribution networks over the past 10 to 15 years have all involved vehicle collision with Power and Water assets, public safety-related outages requested by emergency services, and outages to allow safe work. The proposed transmission and distribution pole and tower renewal programs are not expected to have any impact on the number of these types of incidents over the next regulatory period.
Performance, monitoring and improvement 12Ongoing condition and performance monitoring is a key part of Power and Water’s performance evaluation and improvement strategy. Study of the condition and performance data captured over time assists in developing valuable insights on pole and tower defect modes and trends. These insights provide for informed decision making on whether to repair or replace pole and tower assets. It will also assist in the continuous development of the asset management strategy for poles and towers.
This Asset Management Plan will be reviewed at least every two years, or when there is a significant driver from the network or other events that prompts revision.
Improving data resources, undertaking data analysis and deriving insights will be undertaken as ‘business as usual’ activities with increased focused. Any improvements in analysis and understanding of the pole and tower fleet will be included in this AMP when it is updated.
The RACI model provided in Section 3.2 identifies the important roles and responsibilities required in the management of the pole and tower assets. These responsibilities include ongoing performance monitoring and strategy revisions.

Asset Class Management Plan – Poles and Towers
PAGE 49 OF 51
THIS DOCUMENT IS UNCONTROLLED WHEN PRINTED
Appendix A – Lifecycle asset management Power and Water makes great efforts to be a customer centric organisation that provides a safe, reliable and efficient electricity supply in the NT. This is demonstrated in the approach Power Networks takes in managing its assets. The life cycle asset management approach applied by Power Networks is aimed at making prudent asset management decisions such that its assets do not cause harm to any person, have minimal environmental impact and meet agreed service performance outcomes; consistent with current and future needs.
The approach includes:
• maximising the utilisation of its assets throughout their life cycle; • optimising life cycle asset management costs; • reducing asset risks as low as reasonably practical; and • continually improving its knowledge in respect of its assets
The following asset management activities details Power and Water’s life cycle management of its pole and tower assets.
Planning (augmentation) 12.1
The asset planning stage determines the need for an asset to exist. It also establishes the functional requirements of the assets and ultimately the number of assets, design, function, criticality, configuration, level of redundancy, capability, and capacity.
Key criteria to ensure optimal line route selection and establishing prudent, cost efficient, intrinsically safe and sustainable corridors for the life cycle management of the pole and tower assets include consideration of:
• optimised utilisation of existing poles and towers; • schedule and cost impacts from existing adjacent infrastructure; • transport and logistics; • project cost implications; • safety and reliability risks; • environmental and approvals risk; • stakeholder and community requirements; • design and execution requirements; and • operational and maintenance requirements.
An example of the planning approach is the proposed replacement of the 22kV Lake Bennett feeder, where the replacement of the feeder involves the use of a combination of new and existing assets to optimise the cost efficient replacement of the feeder. It involves the installation of mid-span poles, the refurbishment of existing poles and pole tops, and the potential construction of sections of new line in parallel to the existing line, where appropriate, to reduce impact on customer outages.
Design 12.2
The design phase is where decisions around the physical characteristics and functioning of the asset are made. This life cycle stage defines the quality and reliability of the asset and the whole

Asset Class Management Plan – Poles and Towers
PAGE 50 OF 51
THIS DOCUMENT IS UNCONTROLLED WHEN PRINTED
of life cycle costs that can be realised. It influences the total cost and the level of service that the assets can deliver to customers and shareholders.
Power and Water’s approach to the whole of life cycle prudent and efficient design of assets includes the standardisation of pole and tower designs. Standardisation is defined as the process of developing and agreeing on uniform technical design criteria, specifications and processes and is a key aspect of Power and Water’s asset management process.
Along with continuity, leverage and scalability, standardisation enables the consistent application of best industry practice and continuous performance improvement. It establishes technical commonality that allows for an off-the-shelf, best practice and fit-for-purpose approach to engineering solutions. It also allows for interchangeability that provides operations and asset management benefits.
PWC’s pole and tower design standardisation offers the following specific benefits to the business. It:
• Helps with the ranking and prioritisation of investment projects • Gives confidence in the safe and reliable functioning of the assets • Provides assurance that the assets will do the job they were intended for • Boost production and productivity • Encourages higher quality of engineering leveraging specialist knowledge and optimum
solutions • Allows for the uniform execution of projects • Enables standardisation of construction equipment and processes
Examples of continuous improvement in this design approach are demonstrated in the new two piece spliced pole and associated improved construction methodology introduced by Power and Water in 2016. The design leverages standard transmission lattice pole design and construction methodology, where the pole is delivered in two sections and assembled on site. The benefits from this design include transport and site construction improvements, cost efficiencies from mid-pole extensions to allow for additional ground clearances, cost efficiencies from half pole replacements to address both pole top and in-ground degradation issues.
Operation 12.3
Asset operations include activities associated with the monitoring, operation and control of the asset to adapt to changing requirements of the network. This includes:
• planned switching of the network for scheduled works (e.g. maintenance); • emergency switching of the network in response to incidents (e.g. fault events); • real time switching to operate the asset within its design parameters (e.g. loading); and • monitoring of the condition of the asset (e.g. alarms).
Asset operations do not typically apply to poles and towers. The main function of poles and towers is to provide safety clearances between conductors and other conductive elements. These assets do not need to be operated to adapt to changing network requirements.
Maintenance (opex) 12.4
Asset maintenance involves the care of assets to ensure they will function to their required capability in a safe and reliable manner, from their commissioning to their disposal. The

Asset Class Management Plan – Poles and Towers
PAGE 51 OF 51
THIS DOCUMENT IS UNCONTROLLED WHEN PRINTED
maintenance requirements evolve as the condition and performance requirements of the assets change through its life. It monitors and provides feedback on asset condition, it incorporates upkeep and repair activities to maintain the condition of an asset and includes the monitoring and management of the deterioration of an asset over time. Three main types of maintenance activities are defined; preventative, corrective and unplanned maintenance.
• Preventative maintenance involves the controlled care and repair activities carried out to reduce the probability of failure or degradation of asset performance. It includes routine inspection and monitoring, upkeep and repair, testing and component replacements. Preventative maintenance expenditure increases over time as assets age.
• Corrective maintenance involves activities to repair asset defects identified as result of condition assessments or failures. Corrective maintenance expenditure increases over time as assets age and deteriorate.
• Unplanned maintenance involves activities to immediately restore supply or make a site safe in response to unplanned failures. Unplanned maintenance expenditure increases over time as assets age and deteriorate.
Power and Water employs a three yearly ground based visual inspection and an annual visual/aerial inspection cycle to assess the health of pole and tower assets. Included in this inspection is an assessment of the above ground and accessible components of the assets and the structure earthing systems. The inspection involves a judgement of condition and risk of failure based on a visual assessment and in conjunction with system performance tracking, provides a pointer to potential asset integrity issues. High risk assets are prioritised for further investigation and testing.
Renewal (repex) 12.5
Asset renewal is the establishment of a new asset in response to an existing asset’s condition. The need for the renewal of existing assets is identified in the asset maintenance stage and verified in the asset planning stage. Asset renewal aims to optimise the utilisation of an asset whilst managing the safety and reliability risk associated with the failure of the asset.
Power and Water has asset replacement programs in place to renew assets of poor condition as close as possible, yet prior, to the asset failing.
Disposal 12.6
The decision to reuse or dispose of an asset is made with consideration of the potential to:
• reuse the asset; • utilise the asset as an emergency spare; or • salvage asset components as strategic spare parts.
The remaining asset is disposed of in an environmentally responsible manner.