asset management plan - parks and recreation
TRANSCRIPT

LISMORE CITY COUNCIL – PARKS & RECREATION ASSET MANAGEMENT PLAN
Parks & Recreation
Core Asset Management Plan
Version 1.04
March 2017
lismo city council

LISMORE CITY COUNCIL – PARKS & RECREATION ASSET MANAGEMENT PLAN
Document Control
Document ID: lcc_parks and recreation amp_v4 20170213
Rev No Date Revision Details Author Reviewer Approver
1.00 2016 Draft for Review AM (JRA)
1.01 November 2016 Updated ODM Modelling from 2016 Parks & Recreation
revaluation results
CL AM
1.02 December 2016 Updated ODM modelling outputs & document changes
as per comments
CL AM
1.03 February 2017 Updated ODM modelling outputs & document changes
as updated expenditure & alteration to LTFP scenario
to actual (including new) & renewal (all capital
expenditure to renewal)
CL AM
1.04 March 2017 Amendments done as necessary AM AM LCC
© Copyright 2014 – All rights reserved.
The Institute of Public Works Engineering Australasia.
www.ipwea.org/namsplus
0 IPWEA Slffl/TI!! OF PIJ8UC: WDRKI
ENCi ii.ERINO AUSJRALA51A

LISMORE CITY COUNCIL – PARKS & RECREATION ASSET MANAGEMENT PLAN
TABLE OF CONTENTS
1. EXECUTIVE SUMMARY ................................................................................................................... 2 Context .......................................................................................................................................... 2 Funding Scenarios .......................................................................................................................... 2 What does it Cost? ......................................................................................................................... 2 What we will do ............................................................................................................................. 4 Managing the Risks ........................................................................................................................ 4 Confidence Levels .......................................................................................................................... 4 The Next Steps ............................................................................................................................... 4
2. INTRODUCTION .............................................................................................................................. 6 2.1 Background ............................................................................................................................ 6 2.2 Goals and Objectives of Asset Management ......................................................................... 7 2.3 Plan Framework ..................................................................................................................... 8 2.4 Core and Advanced Asset Management ............................................................................... 8 2.5 Community Consultation ....................................................................................................... 9
3. LEVELS OF SERVICE ........................................................................................................................ 9 3.1 Customer Research and Expectations ................................................................................... 9 3.2 Strategic and Corporate Goals ............................................................................................ 10 3.3 Legislative Requirements .................................................................................................... 12 3.4 Community Levels of Service ............................................................................................... 14 3.5 Technical Levels of Service .................................................................................................. 15
4. FUTURE DEMAND ........................................................................................................................ 16 4.1 Demand Drivers ................................................................................................................... 16 4.2 Demand Forecast ................................................................................................................ 16 4.3 Demand Impact on Assets ................................................................................................... 16 4.4 Demand Management Plan ................................................................................................. 17 4.5 Asset Programs to meet Demand ........................................................................................ 18
5. LIFECYCLE MANAGEMENT PLAN .................................................................................................. 20 5.1 Background Data ................................................................................................................. 20 5.2 Infrastructure Risk Management Plan ................................................................................. 24 5.3 Routine Operations and Maintenance Plan ........................................................................ 24 5.4 Renewal/Replacement Plan ................................................................................................ 27 5.5 Creation/Acquisition/Upgrade Plan .................................................................................... 30 5.6 Disposal Plan ....................................................................................................................... 32
6. FINANCIAL SUMMARY ................................................................................................................. 32 6.1 Financial Statements and Projections ................................................................................. 32 6.2 Funding Strategy.................................................................................................................. 46 6.3 Valuation Forecasts ............................................................................................................. 46 6.4 Key Assumptions made in Financial Forecasts .................................................................... 51 6.5 Forecast Reliability and Confidence .................................................................................... 52
7. PLAN IMPROVEMENT AND MONITORING ................................................................................... 53 7.1 Status of Asset Management Practices ............................................................................... 53 7.2 Improvement Plan ............................................................................................................... 54 7.3 Monitoring and Review Procedures .................................................................................... 55 7.4 Performance Measures ....................................................................................................... 55
8. REFERENCES ................................................................................................................................. 56 9. APPENDICES ................................................................................................................................. 57
Appendix A Abbreviations ...................................................................................................... 58 Appendix B Glossary ............................................................................................................... 59

‐ 2 ‐
LISMORE CITY COUNCIL – PARKS & RECREATION ASSET MANAGEMENT PLAN
1. EXECUTIVE SUMMARY
Context
Council provides parks & recreation assets, referred to for the remainder of this plan as ‘parks & recreation’, to enable a range of recreational opportunities for the wider community as well as provide a safe environment for the enjoyment of such facilities. The types of assets involved in delivering this service are:
Bins
Fences
Footpaths
Furniture
Electrical Equipment
Playgrounds
Services
Signs
Sportsfields
Structures Parks & recreation assets account for approximately 1.3% of Council’s infrastructure assets by value (based on the 2016 revalued technical asset register).
Funding Scenarios
Current capital expenditure for parks & recreation is based on the actual estimates for the Long Term Financial Plan (LTFP) years FY 2016/17 to FY 2026/27. Current modelling is based on 3 funding scenarios: Funding Scenario 1 – Current actual LTFP budget figures, this is inclusive of 72% of current capital expenditure ($2,599,742) being allocated to various sporting groups for new infrastructure. Funding Scenario 2 – Current LTFP figures allocating the current 72% of capital expenditure ($2,599,742) being to renewal of existing infrastructure rather than being allocated to various sporting groups for new infrastructure
Funding Scenario 3 – Unconstrained Renew all parks & recreation assets at condition 4 ensuring no condition 5 assets in 10 years.
What does it Cost?
Funding Scenario 1 – Current actual LTFP budget figures, this is inclusive of 72% of current capital expenditure ($2,599,742) being allocated to various sporting groups for new infrastructure
2017 Parks LTFP - Actual
$12,000,000.00
$10,000,000.00 - --$8,000,000.00
-$6,000,000.00 -- ,......... -- - ~ ~ -
$4,000,000.00
$2,000,000.00
$0.00
2017 2018 2019 2020 2021 2022 2023 2024 2025 2026
OperatingNeed - MaintenanceNeed RenewalFunded - RenewalDeferred ~ BudgetConstraint_LTFP

‐ 3 ‐
LISMORE CITY COUNCIL – PARKS & RECREATION ASSET MANAGEMENT PLAN
The projected outlays necessary to provide the services covered by this Asset Management Plan (AM Plan) includes operations, maintenance, renewal and upgrade of existing assets over the 10 year planning period is $70,625,572 or $7,062,557 on average per year from the ODM output based on the works program.
Estimated available funding for this period is $50,928,722 or $5,092,872 on average per year which is 72% (including new assets) of the cost to provide the service. This is a funding shortfall of $1,969,685 on average per year. Projected expenditure required to provide services in the AM Plan compared with planned expenditure currently included in the Long Term Financial Plan are shown in the graph above.
Funding Scenario 2 – Current LTFP figures allocating the current 72% of capital expenditure ($2,599,742) being to renewal of existing infrastructure rather than being allocated to various sporting groups for new infrastructure.
The projected outlays necessary to provide the services covered by this Asset Management Plan (AM Plan) includes operations, maintenance, renewal and upgrade of existing assets over the 10 year planning period is $64,853,524 or $6,485,352 on average per year.
Estimated available funding for this period is $50,928,722 or $5,092,872 on average per year which is 79% (with all capital expenditure budget applied to renewal, no new assets) of the cost to provide the service. This is a funding shortfall of $1,392,480 on average per year. Projected expenditure required to provide services in the AM Plan compared with planned expenditure currently included in the Long Term Financial Plan are shown in the graph above.
Funding Scenario 3 – Unconstrained Renew all parks & recreation assets at condition 4 ensuring no condition 5 assets in 10 years.
$12,000,000.00
$10,000,000.00
$8,000,000.00
$6,000,000.00
$4,000,000.00
$2,000,000.00
$0.00
$9 ,000,000.00
$8,000,000.00
$7,000,000.00
$6,000,000.00
$5,000,000.00
$4,000,000.00
$3,000,000.00
$2,000,000.00
$1,000,000.00
$0.00
2017 Parks LTFP - Renewal
2017 2018 2019 2020 2021 2022 2023 2024 2025 2026
Operating Need MaintenanceNeed c::::::J Renew alFunded - RenewalDeferred ~ BudgetConstraint_L TFP
2017 Parks Unconstrained - Renew Condition 4
-
2017 2018 2019 2020 2021 2022 2023 2024 2025 2026
OperatingNeed - MaintenanceNeed c::::::J Renewa !Funded ~ Budgetconstraint_L TFP

‐ 4 ‐
LISMORE CITY COUNCIL – PARKS & RECREATION ASSET MANAGEMENT PLAN
The projected outlays necessary to provide the services covered by this Asset Management Plan (AM Plan) includes operations, maintenance, renewal and upgrade of existing assets over the 10 year planning period is $56,532,921 or $5,653,292 on average per year.
Estimated available funding for this period based on the LTFP is $50,928,722 or $5,092,872 on average per year which is 90% of the cost to provide the service ensuring no condition 5 assets for parks in 10 years based on the renewal of assets at condition 4. This is an additional $560,490 on average per year above the existing LTFP budget figures. Projected expenditure required to provide services in the AM Plan compared with planned expenditure currently included in the Long Term Financial Plan are shown in the graph above.
What we will do
We plan to provide parks & recreation services for the following: Operation, maintenance, renewal and upgrade of Council’s parks to meet service levels set by Council in annual
budgets.
Promote wider community participation and engagement in local community activities such as sport, recreation, leisure, arts.
Managing the Risks
There are risks associated with providing the service and not being able to complete all identified activities and projects. We have identified major risks as:
Age & Condition: In general, Lismore's assets are ageing and there are limited maintenance funds to maintain to an acceptable level without the funds to renew the assets.
Attracting People to Lismore: The purpose of any park is to attract users which is difficult for any inland city whilst also coping with diminishing maintenance resources.
Increased Community Expectations: In this day of the internet, communication and personal travel for business and holidays, our community is always educated in what other Council's provide and what can be achieved.
Our community have expectations that need to be managed accordingly. We will endeavour to manage these risks within available funding by:
Community Understanding: Managing the community's expectations. Future community surveys and Council's direct community consultation strategies should aim to find out what our community needs from us as a Council, whilst also informing the community of what Council resources are available to provide for those needs.
Healthy Asset Management: Council has continued it’s strengthening of its asset management with a detailed collection of open space assets within our parks, bushland and sporting fields. From this, Council will now develop an asset management strategy that will aim to provide for the effective maintenance and renewal of its assets. Focusing on providing more 'bang‐for‐your‐buck' will help be effective with our resources. Consolidation of pocket parks where access and use is generally very limited will assist help with a more effective provision of resources.
Attracting People to Lismore: The implementation of Council's Sport & Recreation will assist in the attraction of users to our open space areas, strategically targeting successful sport and recreation types whilst also identifying new trends.
Confidence Levels
This AM Plan is based on medium level of confidence information.
The Next Steps
The actions resulting from this asset management plan are:
Move towards service driven asset management using a “bottom up” approach for gathering asset information that supports council’s goals of optimising activities and meeting agreed service levels and define maintenance standards and levels of service that can be delivered at various funding levels.
Prioritise renewal works based on risk.
Continue to improve asset information and knowledge.
Improve reporting of parks & recreation assets.

‐ 5 ‐
LISMORE CITY COUNCIL – PARKS & RECREATION ASSET MANAGEMENT PLAN
Questions you may have
What is this plan about?
This asset management plan covers the infrastructure assets that serve the Lismore City Council community’s parks & recreation needs. These include parks, playgrounds and sporting field assets that enable Council to provide community and recreation facilities for residents and visitors to Council in the most cost effective manner.
What is an Asset Management Plan?
Asset management planning is a comprehensive process to ensure delivery of services from infrastructure is provided in a financially sustainable manner.
An asset management plan details information about infrastructure assets including actions required to provide an agreed level of service in the most cost effective manner. The plan defines the services to be provided, how the services are provided and what funds are required to provide the services.
Why is there a funding shortfall?
Most of the Council’s parks & recreation network was constructed by developers and from government grants, often provided and accepted without consideration of ongoing operations, maintenance and replacement needs.
Many of these assets are approaching the later years of their life and require replacement. Services from the assets are decreasing and maintenance costs are increasing.
Our present funding levels are insufficient to continue to provide existing services at current levels in the medium term.
What options do we have?
Resolving the funding shortfall involves several steps: 1. Improving asset knowledge so that data accurately records the asset inventory, how assets are performing and
when assets are not able to provide the required service levels, 2. Improving our efficiency in operating, maintaining, renewing and replacing existing assets to optimise life cycle
costs, 3. Identifying and managing risks associated with providing services from infrastructure, 4. Making trade‐offs between service levels and costs to ensure that the community receives the best return from
infrastructure, 5. Identifying assets surplus to needs for disposal to make saving in future operations and maintenance costs, 6. Consulting with the community to ensure that parks & recreation services and costs meet community needs and
are affordable, 7. Developing partnership with other bodies, where available to provide services, 8. Seeking additional funding from governments and other bodies to better reflect a ‘whole of government’ funding
approach to infrastructure services.
What happens if we don’t manage the shortfall?
For parks and recreation assets, the service level reduction may include an increase in maintenance and operating costs due to ageing assets and an inability to renew existing assets in line with the optimal renewal program.
What can we do?
We can develop options, costs and priorities for future parks & recreation services, consult with the community to plan future services to match the community service needs with ability to pay for services and maximise community benefits against costs.

‐ 6 ‐
LISMORE CITY COUNCIL – PARKS & RECREATION ASSET MANAGEMENT PLAN
2. INTRODUCTION
2.1 Background
Within the Lismore City Council jurisdiction area there are over 110 parks and 70 formal garden areas, along with numerous other reserves sites that are maintained. In total, Council’s Parks team maintains over 650 sites containing a variety of infrastructure including playground equipment, fences, bridges, walking paths and sporting facilities. The purpose of this asset management plan is to demonstrate responsive management of these assets (and services provided from assets), compliance with regulatory requirements, and to communicate funding needed to provide the required levels of service over a 20 year planning period.
The asset management plan follows the format for asset management plans recommended in Section 4.2.6 of the International Infrastructure Management Manual1.
The asset management plan is to be read with the organisation’s Asset Management Policy, Asset Management Strategy and the following associated planning documents:
NSW DLG Integrated Planning Guidelines and Manual 2010
Lismore City Council Community Strategic Plan
Lismore City Council Delivery Plan
Lismore City Council Operational Plan
2012 Lismore City Council Community Survey This infrastructure assets covered by this asset management plan are shown in Table 2.1. These assets are used to provide a broad range of recreational & sporting services to the community.
Table 2.1: Assets covered by this Plan
Asset Category Current Replacement Cost Written Down Value
Land Improvements $8,845,597 $5,260,691
OOSRA $1,205,930 $663,848
Other Structures $10,070,446 $5,751,978
Grand Total $20,121,973 $11,676,517
Key stakeholders in the preparation and implementation of this asset management plan are: Shown in Table 2.1.1.
Table 2.1.1: Key Stakeholders in the AM Plan
Key Stakeholder Role in Asset Management Plan
Elected Members Endorsement of the asset management policy, strategy and plans. Set high level direction through the development of asset management principles in the Community Strategic Plan.
Senior Management Endorse the development of asset management plans and provide the resources required to complete this task. Set high level priorities for asset management development in Council and raise the awareness of this function among Council staff and contractors. Support the implementation of actions resulting from this plan and prepared to make changes to a better way of managing assets and delivering services. Support for an asset management driven budget and LTFP.
Corporate Services Consolidating the asset register and ensuring the asset valuations are accurate. Development of supporting policies such as capitalisation and depreciation. Preparation of asset sustainability and financial reports incorporating asset depreciation in compliance with current Australian accounting standards. AM and GIS support and admin.
Field Services Staff Provide local knowledge level detail on all road assets. They verify the size, location and condition of assets. They can describe the maintenance standards deployed and Council’s ability to meet technical and customer levels of service.
1 IPWEA, 2011, Sec 4.2.6, Example of an Asset Management Plan Structure, pp 4|24 – 27.
‐ 7 ‐
LISMORE CITY COUNCIL – PARKS & RECREATION ASSET MANAGEMENT PLAN
Key Stakeholder Role in Asset Management Plan
Asset Management Consultants Provide support for the development of asset management plans and the implementation of effective asset management principles within Council. Also independently endorse asset revaluation methodology.
External Parties Community residents & businesses;
Tourist and Visitors (as occasional users);
Neighbouring Council’s;
Road Users;
Emergency services;
Developers & Utility companies;
Local Businesses and;
Federal and State Government authorities & agencies such as RTA, local law enforcement and land use/development planning.
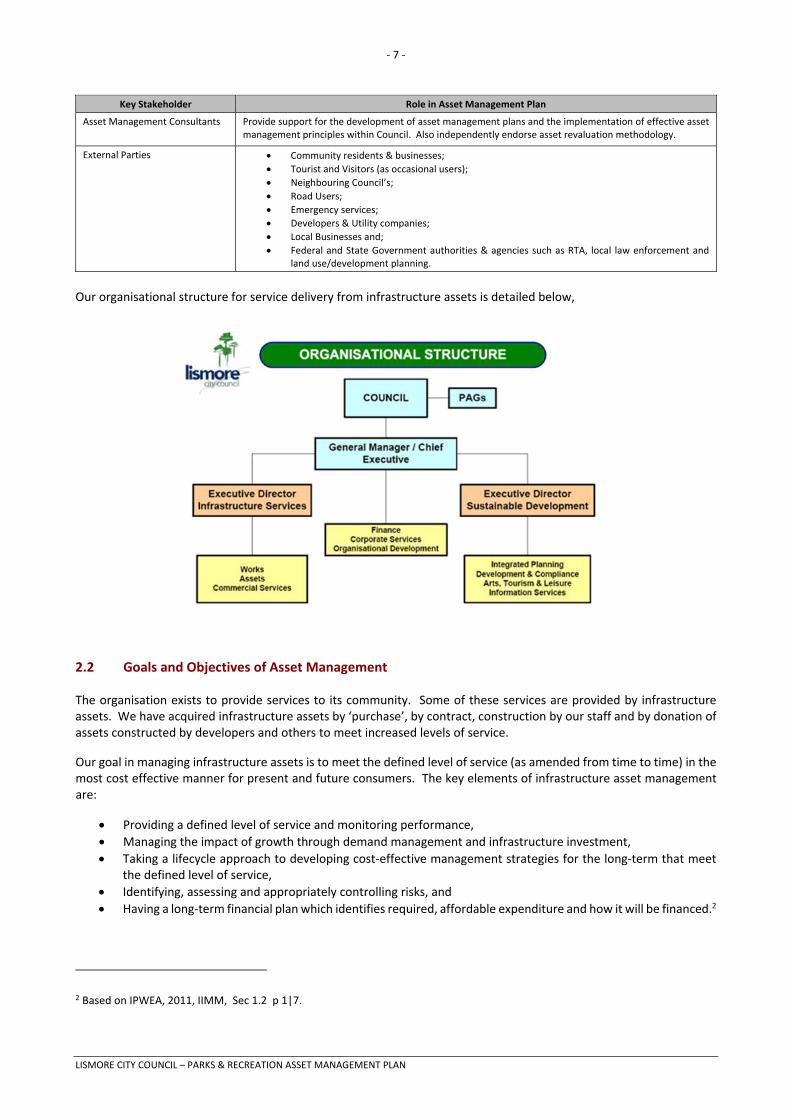
Our organisational structure for service delivery from infrastructure assets is detailed below,
2.2 Goals and Objectives of Asset Management
The organisation exists to provide services to its community. Some of these services are provided by infrastructure assets. We have acquired infrastructure assets by ‘purchase’, by contract, construction by our staff and by donation of assets constructed by developers and others to meet increased levels of service.
Our goal in managing infrastructure assets is to meet the defined level of service (as amended from time to time) in the most cost effective manner for present and future consumers. The key elements of infrastructure asset management are:
Providing a defined level of service and monitoring performance,
Managing the impact of growth through demand management and infrastructure investment,
Taking a lifecycle approach to developing cost‐effective management strategies for the long‐term that meet the defined level of service,
Identifying, assessing and appropriately controlling risks, and
Having a long‐term financial plan which identifies required, affordable expenditure and how it will be financed.2
2 Based on IPWEA, 2011, IIMM, Sec 1.2 p 1|7.
ii ORGANISATIONAL STRUCTURE
ISl'llOre
Executive Director Infrastructure Services
Works Assets
c ommtrelal serviees
COUNCIL
General Manager / Chief Executive
Fin nee Corporate services
Organ!SIIIIOMI 06vel~nl
PAGs
Executive Director Sustalnable Development
lnteg~1ed Planning Oevelopmenl & Compliance
Arts, TO\lrtsm & Lebure lnformatJon ~ices

‐ 8 ‐
LISMORE CITY COUNCIL – PARKS & RECREATION ASSET MANAGEMENT PLAN
2.3 Plan Framework
Key elements of the plan are
Levels of service – specifies the services and levels of service to be provided by the organisation,
Future demand – how this will impact on future service delivery and how this is to be met,
Life cycle management – how Council will manage its existing and future assets to provide defined levels of service,
Financial summary – what funds are required to provide the defined services,
Asset management practices,
Monitoring – how the plan will be monitored to ensure it is meeting organisation’s objectives, Asset management improvement plan.
A road map for preparing an asset management plan is shown below.
Road Map for preparing an Asset Management Plan Source: IPWEA, 2006, IIMM, Fig 1.5.1, p 1.11.
2.4 Core and Advanced Asset Management
AM PLAN REVIEW AND
AUDIT
IMPLEMENT IMPROVEMENT
STRATEGY
ANNUAL PLAN / BUSINESS PLAN
fz w 2 w > 0 D:'. o_
~
~ ~ "' >-' z w 2 w ('.) <( z <( 2 z 0
~ 2 D:'. 0 LL z
CORPORATE PLANNING Confirm strategic objectives and establish AM policies, strategies & goals. Define responsibilities & ownership. Decide core or advanced AM Pan. Gain organisation commitment.
REVIEW/COLLATE ASSET INFORMATION Existing information sources Identify & describe assets. Data collection Condition assessments Performance monitoring Valuation Data
ESTABLISH LEVELS OF SERVICE Establish strategic linkages Define & adopt statements Establish measures & targets Consultation
LIFECYCLE MANAGEMENT STRATEGIES Develop lifecycle strategies Describe service delivery strategy Risk management strategies Demand forecasting and management
DEFINE SCOPE & STRUCTURE OF PLAI
Optimised decision making (renewals, new works, disposals) Optimise maintenance strategies
FINANCIAL FORECASTS Lifecycle analysis Financial forecast summary Valuation Depreciation Funding
IMPROVEMENT PLAN Assess current/desired practices Develop improvement plan
IS THE PLAN AFFORDABLE?
ITERATION Reconsider service statements Options for funding Consult with Council Consult with Community

‐ 9 ‐
LISMORE CITY COUNCIL – PARKS & RECREATION ASSET MANAGEMENT PLAN
This asset management plan is prepared as a ‘core’ asset management plan over a 20 year planning period in accordance with the International Infrastructure Management Manual3. It is prepared to meet minimum legislative and organisational requirements for sustainable service delivery and long term financial planning and reporting. Core asset management is a ‘top down’ approach where analysis is applied at the ‘system’ or ‘network’ level.
Future revisions of this asset management plan will move towards ‘advanced’ asset management using a ‘bottom up’ approach for gathering asset information for individual assets to support the optimisation of activities and programs to meet agreed service levels in a financially sustainable manner.
2.5 Community Consultation
This ‘core’ asset management plan is prepared to facilitate community consultation initially through feedback on public display of draft asset management plans prior to adoption by the Council/Board. Future revisions of the asset management plan will incorporate community consultation on service levels and costs of providing the service. This will assist the Council/Board and the community in matching the level of service needed by the community, service risks and consequences with the community’s ability and willingness to pay for the service.
3. LEVELS OF SERVICE
3.1 Customer Research and Expectations
Council conducts Community Surveys, the most recent of which was undertaken in 2016. The extract of results from the survey is shown as Table 3.1
Table 3.1: Community Satisfaction Survey Levels
The organisation uses this information in developing its Strategic Plan and in allocation of resources in the budget.
3 IPWEA, 2011, IIMM.
,r
Quadrant Analysis Importance v Satisfaction mprove llllaintain
Higher irrportance, lowersotis'bction Higl-,;, r i ~ rta.c e , hi gler soti::i1acti on
4 ·8 ~ ining ~ aled road :i. ♦ <'orr'Nlif€1 wit. the corrrr,.mit,
♦ Proio!-dion oft.e nat.m:il en'Aronmc-nt and "ffldlife
4.6
4.4
4.2
4.0
3.8
3.6
3.4
3.2
Y..bslt cole,: ion .L m:ino ge mc-nt
Co,..r.eil l'C"'lf' On,:h'"ne ¾ to ♦ ♦
D"lcouragi-ig new wn,:ill b u::ine¼ ar.:I i~:i.+ne-nt ♦
♦
c orrrrunitll' needs
Oi-ne- ♦ ♦ <:ouncilleader-lhip ♦hfo'";;~~:~~;~si~it,< of pr ~ nton and ad vocac ·,
• &n:-rger,: y m:magem:-nt
P,fford <:ib le houWlg ♦
• 1\l'tlrl'bining um-ea led road s
iniiafive-i. ♦ Ovci,;illheatt. of
<,iafun<hlp ,,.,t, E~o~aglo .. touri= indigenous rc- sid ents ♦ ♦
Land u~ plcinnr'lg ♦ an~u:~~:1;:~es
C'evc- lopm:-ntappication s ♦
H:efra,;: b ar,;1 w:i li:ingpafrn ♦
[liwbiit,- acc -:- ,r,. L inclicion
Pro \i~ionard m:iintc-r,cr,:e ofpar ~
pla·,wound s and
Storrm. lClltr 4lt,1: ::: a r,;:1 e \ o:- nt-
Lbrarie:i. and l"l'brrnction ♦
.~j rport (li'IITIOre ,ili rport .& ger.e-ral a >.4:i ion area )
♦
Pro >.ii-::ionand m:i i-.1'!-nar,: e ♦ ♦ of -!pori~ ield s (:oonellab ah
iliTtirl Pool ♦ Sports. and
3.0 +----~----~----~---~----~,._---~--'-~-•_1_.lc_) , ------''--~-'•_S"_"_ .. _<_•_ot~• 2.3 2.5 2.7 2.9 3.1 3.3 3,5 3.7 3.9 4.1
Niche Lower i1Tportonce, I owe r satis 'bcti on
Sali<laction Community Lower i rrportarc e, hi g-.e r s atis 'bcti on
,r ~

‐ 10 ‐
LISMORE CITY COUNCIL – PARKS & RECREATION ASSET MANAGEMENT PLAN
3.2 Strategic and Corporate Goals
This asset management plan is prepared under the direction of the organisation’s vision, mission, goals and objectives.
Our vision is:
“Lismore: A great place to live and work.”
Our mission is:
“To work with the community to maintain Lismore as the regional centre in a healthy rural setting.”
Relevant organisational goals and objectives and how these are addressed in this asset management plan are:
Table 3.2: Organisational Goals and how these are addressed in this Plan
Principles and Goals Outcomes How The Asset Management Plans contribute to achieving these outcomes
Guiding Principle: Social Inclusion and Participation
That all Lismore residents enjoy equal opportunities within a strong, inclusive community.
The provision and maintenance of public infrastructure is an important component contributing to the social needs of the community
Guiding Principle Sustainable Economic Growth and Development
That Lismore’s economy is vibrant and development is environmentally and socially sustainable.
Economic sustainability and growth is linked to the services provided by infrastructure. The Asset Management Plans will provide guidance as to the assets required, and the long term sustainability of these services.
Guiding Principle Protect, Conserve and Enhance the Environment and Biodiversity
That Lismore’s natural ecology is protected and maintained in a healthy and robust state for future generations
Provision of the appropriate infrastructure to support the natural environment will continue to be a long term consideration in Asset Management Planning
Guiding Principle Best‐Practice Corporate Governance
That best practice management principles pervade our business; that we are innovative, ethical, and our use of resources provides maximum benefits to the community.
Council has limited resources. Asset Management Planning provides a way in which the community can be engaged in setting the priorities and allocation of these resources. Planning long term sustainable infrastructure is important to enable the appropriate resources to be identified, provided and enable Council to meet its statutory requirements
Community Strategic Priority Enhance Lismore as a Regional Centre
That Lismore retains and builds on its regional service centre role, including the provision of key medical, legal and tertiary education functions.
Planning and long term management of these assets is one of the principle aims of the Asset Management Plans and is essential to the sustainability of these services.
Community Strategic Priority Foster Youth Development
That young people are included in our community and can safely pursue their interests and aspirations.
The provision and maintenance of public infrastructure is an important component contributing to the cultural and social needs of the community
Community Strategic Priority Support an Ageing Population
That older people have access to appropriate services and facilities to enhance their health and wellbeing.
The provision and maintenance of public infrastructure is an important component contributing to the cultural and social needs of the community
Community Strategic Priority Provide Sustainable Land‐use Planning
That land‐use planning is founded on principles of sustainability.
The Asset Management Plans will provide guidance as to the assets required, and the long term sustainability of these services.
Community Strategic Priority Improve Catchment Management
That catchment management is integrated and holistic, in order to achieve a sustainable and balanced use of natural resources.
Planning and long term management of these assets is one of the principle aims of the Asset Management Plans and is essential to the sustainability of these services.
Community Strategic Priority Revitalise the CBD
That the CBD becomes a vibrant meeting place and a cultural and entertainment hub for the Northern Rivers region.
Planning and long term management of these assets is one of the principle aims of the Asset Management Plans and is essential to the sustainability of these services.
Community Strategic Priority Integrated Waste Cycle Management
That Lismore minimises waste to landfill by reducing, reusing and recycling.
Planning and long term management of these assets is one of the principle aims of the Asset Management Plans and is essential to the sustainability of these services.

‐ 11 ‐
LISMORE CITY COUNCIL – PARKS & RECREATION ASSET MANAGEMENT PLAN
Principles and Goals Outcomes How The Asset Management Plans contribute to achieving these outcomes
Community Strategic Priority Improve Roads, Cycle ways and Footpaths
That Lismore has an extensive transport network and is an accessible, safe and efficient city for motorists, cyclists and pedestrians.
Infrastructure is provided to support services. Getting the correct infrastructure appropriate to the needs of the community is a primary goal of Asset Management Planning. A primary objective of the asset management plan is to develop a lifecycle approach to the provision of infrastructure. This aims to minimise the life cycle cost of assets while maximising the service that is delivered
Community Strategic Priority Mitigate Climate Change at a Local Level
That Lismore is a leader in reducing carbon emissions and minimising the impacts of climate change.
The provision of infrastructure that minimises the impacts of climate change, as well as anticipating the impacts that climate change may have on infrastructure will become an increasing consideration for Asset Management Planning.
Community Strategic Priority Develop and Support Art, Cultural, Sporting and Tourism Activities Integrated Water Cycle Management
That our regional art, cultural and sporting facilities remain a major component of Lismore life and an increasingly popular attraction for domestic tourists. That Lismore maintains long‐term water security for its growing population through the efficient use of this precious resource.
The provision and maintenance of public infrastructure is an important component contributing to the cultural and social needs of the community
Community Strategic Priority Provide Greater Housing Choices
That Lismore offers a diverse range of housing options to accommodate a variety of households.
The provision and maintenance of public infrastructure is an important component contributing to providing for the needs of the community
Community Strategic Priority Improve Passive and Active Recreational Facilities
That Lismore retains and builds on its regional recreation centre to attract major events and tournaments.
Recreation infrastructure is provided to contribute to lifestyle, health and wellbeing. Provision and sustainably management of the infrastructure appropriate to the needs of the community is a primary goal of Asset Management Planning.
Corporate Foundation Efficient Use of Council Resources
That we maximise the value of our resources, continually review our operations to ensure best value, eliminate waste and duplication, and gain the full service potential from our assets.
Council has limited resources. Asset Management Planning provides a way in which the allocation of resources can be made with sound knowledge of sustainable service levels.
Corporate Foundation Engage With the Community
That the community is informed and consulted about the issues that are relevant to their lives and we are fully accountable to the community for our operations.
Council has limited resources. Asset Management Planning provides a way in which the community can be engaged in setting the priorities and allocation of these resources.
Corporate Foundation Promote a Constructive Corporate Culture
That customers and staff experience a supportive organisation, with a strong sense of integrity, which responds to their needs and provides innovative and creative services.
The Asset Management Plan in conjunction with Long Term Financial Plans are the tools by which Council assesses the long term financial sustainability of council’s infrastructure assets Planning long term sustainable infrastructure is important to enable the appropriate resources to be identified, planned and provided
Corporate Foundation Whole of Council Corporate Planning
That we have clear goals and act as one in their co‐ordinated implementation, in order to maximise the return on resource investment and staff expertise.
Planning and long term management of these assets is one of the principle aims of the Asset Management Plans and this requires a whole of Council approach to identify an achieve goals.
Corporate Foundation Providing Excellent Customer Service
That our primary focus is to understand and respond to the needs of the community we serve.
Infrastructure is provided to support services. Getting the correct infrastructure appropriate to the needs of the community is a primary goal of Asset Management Planning, and underlies the objectives of customer service.
The organisation will exercise its duty of care to ensure public safety is accordance with the infrastructure risk management plan prepared in conjunction with this AM Plan. Management of infrastructure risks is covered in Section 5.2

‐ 12 ‐
LISMORE CITY COUNCIL – PARKS & RECREATION ASSET MANAGEMENT PLAN
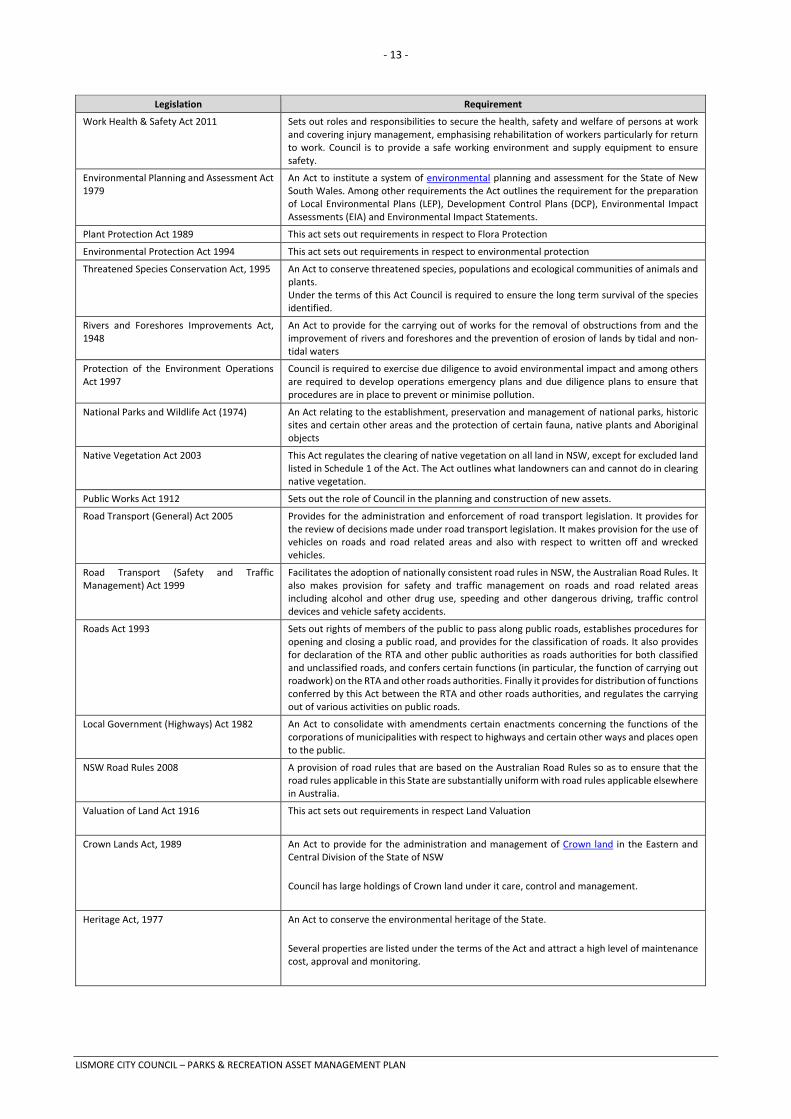
3.3 Legislative Requirements
The organisation has to meet many legislative requirements including Australian and State legislation and State regulations. These include:
Table 3.3: Legislative Requirements
Legislation Requirement
Local Government Act 1993
Sets out role, purpose, responsibilities and powers of local governments.
The purposes of this Act are as follows:
(a) to provide the legal framework for an effective, efficient, environmentally responsible and open system of local government in New South Wales,
(b) to regulate the relationships between the people and bodies comprising the system of local government in New South Wales,
(c) to encourage and assist the effective participation of local communities in the affairs of local government,
(d) to give councils:
• the ability to provide goods, services and facilities, and to carry out activities, appropriate to the current and future needs of local communities and of the wider public
• the responsibility for administering some regulatory systems under this Act
• a role in the management, improvement and development of the resources of their areas,
(e) to require councils, councillors and council employees to have regard to the principles of ecologically sustainable development in carrying out their responsibilities.
The land management provisions of the Act require that Council prepare plans of management for all community land. The plan of management identifies the management objectives for the land category, performance indicators and performance measures to meet the objectives identified.
Local Government Amendment (Planning and Reporting) Act 2009
Local Government Amendment (Planning and Reporting) Act 2009 includes the preparation of a long term financial plan supported by asset management plans for sustainable service delivery.
Disability Discriminations Act, 1992 The Federal Disability Discrimination Act 1992 (D.D.A.) provides protection for everyone in Australia against discrimination based on disability. It encourages everyone to be involved in implementing the Act and to share in the overall benefits to the community and the economy that flow from participation by the widest range of people.
(a) to eliminate, as far as possible, discrimination against persons on the ground of disability in the areas of:
(i) work, accommodation, education, access to premises, clubs and sport; and
(ii) the provision of goods, facilities, services and land; and
(iii) existing laws; and
(iv) the administration of Commonwealth laws and programs; and
(b) to ensure, as far as practicable, that persons with disabilities have the same rights to equality before the law as the rest of the community; and
to promote recognition and acceptance within the community of the principle that persons with disabilities have the same fundamental rights as the rest of the community.
‐ 13 ‐
LISMORE CITY COUNCIL – PARKS & RECREATION ASSET MANAGEMENT PLAN
Legislation Requirement
Work Health & Safety Act 2011 Sets out roles and responsibilities to secure the health, safety and welfare of persons at work and covering injury management, emphasising rehabilitation of workers particularly for return to work. Council is to provide a safe working environment and supply equipment to ensure safety.
Environmental Planning and Assessment Act 1979
An Act to institute a system of environmental planning and assessment for the State of New South Wales. Among other requirements the Act outlines the requirement for the preparation of Local Environmental Plans (LEP), Development Control Plans (DCP), Environmental Impact Assessments (EIA) and Environmental Impact Statements.
Plant Protection Act 1989 This act sets out requirements in respect to Flora Protection
Environmental Protection Act 1994 This act sets out requirements in respect to environmental protection
Threatened Species Conservation Act, 1995 An Act to conserve threatened species, populations and ecological communities of animals and plants. Under the terms of this Act Council is required to ensure the long term survival of the species identified.
Rivers and Foreshores Improvements Act, 1948
An Act to provide for the carrying out of works for the removal of obstructions from and the improvement of rivers and foreshores and the prevention of erosion of lands by tidal and non‐tidal waters
Protection of the Environment Operations Act 1997
Council is required to exercise due diligence to avoid environmental impact and among others are required to develop operations emergency plans and due diligence plans to ensure that procedures are in place to prevent or minimise pollution.
National Parks and Wildlife Act (1974) An Act relating to the establishment, preservation and management of national parks, historic sites and certain other areas and the protection of certain fauna, native plants and Aboriginal objects
Native Vegetation Act 2003 This Act regulates the clearing of native vegetation on all land in NSW, except for excluded land listed in Schedule 1 of the Act. The Act outlines what landowners can and cannot do in clearing native vegetation.
Public Works Act 1912 Sets out the role of Council in the planning and construction of new assets.
Road Transport (General) Act 2005 Provides for the administration and enforcement of road transport legislation. It provides for the review of decisions made under road transport legislation. It makes provision for the use of vehicles on roads and road related areas and also with respect to written off and wrecked vehicles.
Road Transport (Safety and Traffic Management) Act 1999
Facilitates the adoption of nationally consistent road rules in NSW, the Australian Road Rules. It also makes provision for safety and traffic management on roads and road related areas including alcohol and other drug use, speeding and other dangerous driving, traffic control devices and vehicle safety accidents.
Roads Act 1993 Sets out rights of members of the public to pass along public roads, establishes procedures for opening and closing a public road, and provides for the classification of roads. It also provides for declaration of the RTA and other public authorities as roads authorities for both classified and unclassified roads, and confers certain functions (in particular, the function of carrying out roadwork) on the RTA and other roads authorities. Finally it provides for distribution of functions conferred by this Act between the RTA and other roads authorities, and regulates the carrying out of various activities on public roads.
Local Government (Highways) Act 1982 An Act to consolidate with amendments certain enactments concerning the functions of the corporations of municipalities with respect to highways and certain other ways and places open to the public.
NSW Road Rules 2008 A provision of road rules that are based on the Australian Road Rules so as to ensure that the road rules applicable in this State are substantially uniform with road rules applicable elsewhere in Australia.
Valuation of Land Act 1916 This act sets out requirements in respect Land Valuation
Crown Lands Act, 1989 An Act to provide for the administration and management of Crown land in the Eastern and Central Division of the State of NSW
Council has large holdings of Crown land under it care, control and management.
Heritage Act, 1977 An Act to conserve the environmental heritage of the State.
Several properties are listed under the terms of the Act and attract a high level of maintenance cost, approval and monitoring.

‐ 14 ‐
LISMORE CITY COUNCIL – PARKS & RECREATION ASSET MANAGEMENT PLAN
Legislation Requirement
Building Code of Australia The goal of the BCA is to enable the achievement of nationally consistent, minimum necessary standards of relevant, health, safety (including structural safety and safety from fire), amenity and sustainability objectives efficiently.
Building Fire and Safety Regulation 1991 This Act sets out the regulations for things such as means of escape, Limitation of people in buildings, Fire and evacuation plans and testing of special fire services and installations.
Electrical Safety Act 2002 This act sets out the installation, reporting and safe use with electricity
Building Regulation 2003 This act sets out requirements in respect to Building Requirements
Plumbing and Drainage Act 2002 This act sets out requirements in respect to Plumbing Requirements
Rural Fires Act, 1997 An Act to establish the NSW Rural Fire Service and define its functions; to make provision for the prevention, mitigation and suppression of rural fires.
Under the terms of this Act Council is required to mitigate any fire that emanate from bushland.
Dangerous Goods Safety Management Act 2001
This act sets out the safe use, storage and disposal of dangerous goods
Fire and Rescue Service Act 1990 This act sets out requirements in respect to Emergency Services for Fire and Rescue
Public Records Act 2002 This act sets out requirements in respect maintaining Public Records
Surveillance Devices Act This act sets out requirements in respect use of Surveillance Devices
Civil Liability Act, 2002 An Act to make provision in relation to the recovery of damages for death or personal injurycaused by the fault of a person
Companion Animals Act, 1998 An Act to provide for the identification and registration of companion animals and for the duties and responsibilities of their owners.
Under the terms of the Act Council is required to provide and maintain at least one off leash area. It currently has eleven areas identified as off leash.
Rural Fires Act, 1997 An Act to establish the NSW Rural Fire Service and define its functions; to make provision for the prevention, mitigation and suppression of rural fires.
Under the terms of this Act Council is required to mitigate any fire that emanate from bushland.
The organisation will exercise its duty of care to ensure public safety in accordance with the infrastructure risk management plan linked to this AM Plan. Management of risks is discussed in Section 5.2.
3.4 Community Levels of Service
Service levels are defined service levels in two terms, customer levels of service and technical levels of service.
Community Levels of Service measure how the community receives the service and whether the organisation is providing community value.
Community levels of service measures used in the asset management plan are:
Quality How good is the service? Function Does it meet users’ needs? Capacity/Utilisation Is the service over or under used?

‐ 15 ‐
LISMORE CITY COUNCIL – PARKS & RECREATION ASSET MANAGEMENT PLAN
The organisation’s current and expected community service levels are detailed in Tables 3.4 and 3.5. Table 3.4 shows the agreed expected community levels of service based on resource levels in the current long‐term financial plan and community consultation/engagement.
Table 3.4: Community Level of Service
Service Attribute
Performance Indicator Level of Service Current Level of Service (LTFP)
Target Level of Service
Expected position in 10 years based on current LTFP
Actions to Meet Performance Target
COMMUNITY LEVELS OF SERVICE
Quality Asset Condition Asset Condition 4% of assets in Condition 1
34% of assets in Condition 2
50% of assets in Condition 3
11% of assets in Condition 4
1% of assets in Condition 5
Replace assets before they reach Condition 5
10% of assets in Condition 1
8% of assets in Condition 2
19% of assets in Condition 3
34% of assets in Condition 4
29% of assets in Condition 5
Undertake regular condition inspection and modelling of the assets and prepare the optimal works program. It is estimated that an additional funding of $560,490 per year for the next 10 years is required to replace all assets before they reach Condition 5
Organisational measure Confidence levels: Medium
Function The provision of a safe and functional assets that meet the safety limits & community needs
The provision of a safe and functional assets that meet the safety limits & community needs
Assets are satisfactorily maintained and meet the community’s expectations in regards to safety and functionality.
100% compliance from Safety Audits, Asset Maintenance
Assets are deteriorating under the current funding levels and there won’t be sufficient funds to keep them safe or functional.
Safety AuditsConduct programmed risk assessment and safety audits as per specified Inspection frequency. Disposal of some assets may be necessary.
Organisational measure Confidence levels: Low
Capacity/ Utilisation
Assets well used & meet capacity needs of the community
Assets well used & meet capacity needs of the community
Council promote and encourage the use of its parks and reserves and endeavours to increase capacity
Assets are well utilised and are up to current standards
Utilisation of parks may decrease if the capacity isn’t there to service the community
Usage Recordsand Community Feedback
Organisational measure Confidence levels: Low
3.5 Technical Levels of Service
Technical Levels of Service ‐ Supporting the community service levels are operational or technical measures of performance. These technical measures relate to the allocation of resources to service activities that the organisation undertakes to best achieve the desired community outcomes and demonstrate effective organisational performance.
Technical service measures are linked to annual budgets covering:
Operations – the regular activities to provide services such as opening hours, cleansing, mowing grass, energy, inspections, etc.
Maintenance – the activities necessary to retain an asset as near as practicable to an appropriate service condition (e.g. road patching, unsealed road grading, playground equipment repairs),
Renewal – the activities that return the service capability of an asset up to that which it had originally (e.g. frequency and cost of road resurfacing and pavement reconstruction, pipeline replacement and playground equipment replacement),
‐ 16 ‐
LISMORE CITY COUNCIL – PARKS & RECREATION ASSET MANAGEMENT PLAN
Upgrade – the activities to provide a higher level of service (e.g. widening a road, sealing an unsealed road, replacing a pipeline with a larger size) or a new service that did not exist previously (e.g. a new park).
Service and asset managers plan, implement and control technical service levels to influence the customer service levels.4
At present, indications of desired levels of service are obtained from various sources including the December 2016 Customer Satisfaction survey, residents’ feedback to Councillors and staff, service requests and correspondence. Council has yet to quantify desired levels of service. This will be done in future revisions of this asset management plan.
4. FUTURE DEMAND
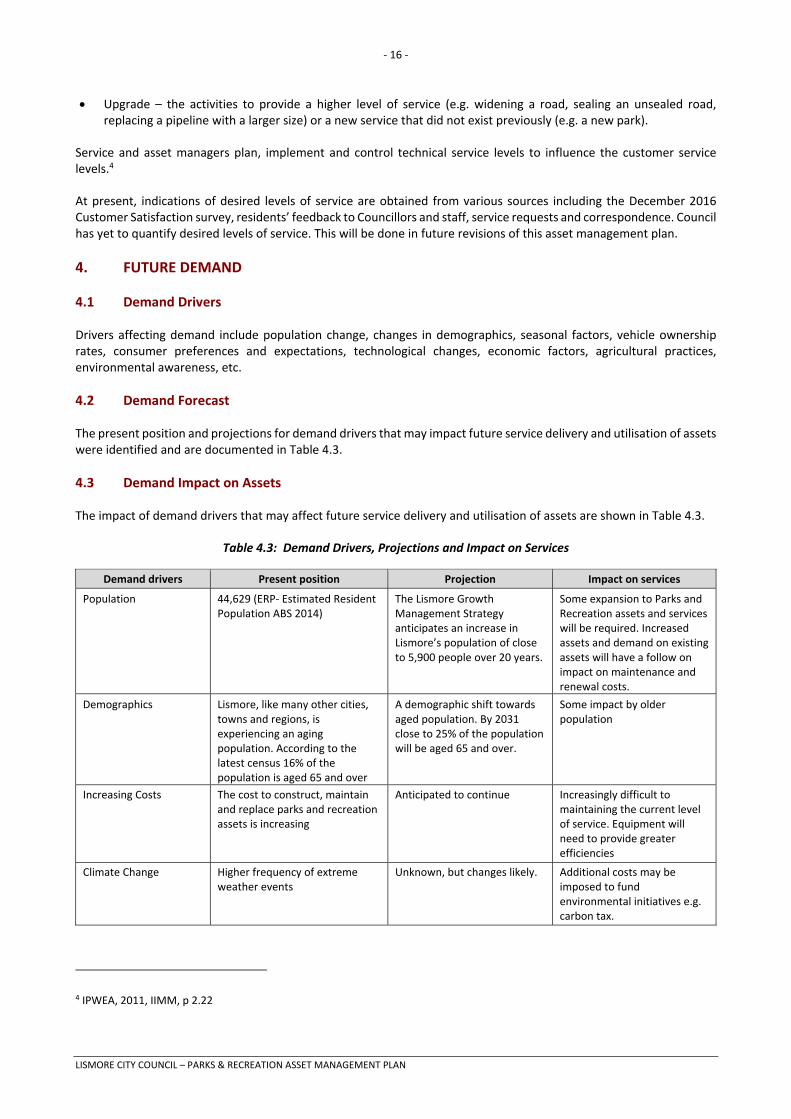
4.1 Demand Drivers
Drivers affecting demand include population change, changes in demographics, seasonal factors, vehicle ownership rates, consumer preferences and expectations, technological changes, economic factors, agricultural practices, environmental awareness, etc.
4.2 Demand Forecast
The present position and projections for demand drivers that may impact future service delivery and utilisation of assets were identified and are documented in Table 4.3.
4.3 Demand Impact on Assets
The impact of demand drivers that may affect future service delivery and utilisation of assets are shown in Table 4.3.
Table 4.3: Demand Drivers, Projections and Impact on Services
Demand drivers Present position Projection Impact on services
Population 44,629 (ERP‐ Estimated Resident Population ABS 2014)
The Lismore Growth Management Strategy anticipates an increase in Lismore’s population of close to 5,900 people over 20 years.
Some expansion to Parks and Recreation assets and services will be required. Increased assets and demand on existing assets will have a follow on impact on maintenance and renewal costs.
Demographics Lismore, like many other cities, towns and regions, is experiencing an aging population. According to the latest census 16% of the population is aged 65 and over
A demographic shift towards aged population. By 2031 close to 25% of the population will be aged 65 and over.
Some impact by older population
Increasing Costs The cost to construct, maintain and replace parks and recreation assets is increasing
Anticipated to continue Increasingly difficult to maintaining the current level of service. Equipment will need to provide greater efficiencies
Climate Change Higher frequency of extreme weather events
Unknown, but changes likely. Additional costs may be imposed to fund environmental initiatives e.g. carbon tax.
4 IPWEA, 2011, IIMM, p 2.22

‐ 17 ‐
LISMORE CITY COUNCIL – PARKS & RECREATION ASSET MANAGEMENT PLAN
Demand drivers Present position Projection Impact on services
Environmental awareness
Awareness raising , water use minimisation , expectation for improvements Trend toward sustainable energy
Greater demand to reduce pollution and runoff into waterways Trend continues towards sustainable energy practices with greater emphasis on recycled water
Efficient water/irrigation systems and , stormwater reuse solutions, REF/EIS Requirements , Fisheries requirements
Economic Factors
Significant increases in cost of energy Constraints/Increases in grants and funding sources
Councils Operational and Maintenance Costs will increase with little change to cost recovery in most areas
Increased costs of works.
4.4 Demand Management Plan
Demand for new services will be managed through a combination of managing existing assets, upgrading of existing assets and providing new assets to meet demand and demand management. Demand management practices include non‐asset solutions, insuring against risks and managing failures.
Non‐asset solutions focus on providing the required service without the need for the organisation to own the assets and management actions including reducing demand for the service, reducing the level of service (allowing some assets to deteriorate beyond current service levels) or educating customers to accept appropriate asset failures5. Examples of non‐asset solutions include providing services from existing infrastructure such as aquatic centres and libraries that may be in another community area or public toilets provided in commercial premises.
Opportunities identified to date for demand management are shown in Table 4.4. Further opportunities will be developed in future revisions of this asset management plan.
Table 4.4: Demand Management Plan Summary
Demand Driver Demand Management Plan
Increased usage of sports fields and resultant impact of higher traffic has required a focus on improving irrigation and turf management practices.
Prepare turf management /maintenance manual that determines the service required to meet the demand for active and passive reserves; specifies all annual forecasted maintenance works and outlines service standards within parks and sporting fields
Renewal programming Investigate treatments to lower lifecycle costs, including increasing useful asset life by undertaking strategic maintenance works
Maintenance of Parks & Recreation network Vary levels of service to match Parks & Recreation hierarchy and available resources. Resist extension of ad hoc asset creation. Maintain and review Parks & Recreation hierarchy, optimise maintenance against hierarchy. Review usage with view to dispose, updates based on adopted recreation and any facility development plan. Engage with community and service clubs to augment maintenance capability
Investigate fees and charges and cost recovery rates Pricing including hire rates, entry fees etc better matched to LOS
Park Maintenance
Annual maintenance plans / programs identify and forecast all maintenance works required within parks
Planning Support, provide and maintain community facilities as focal points for community involvement, learning, leisure and sporting activities. Develop a detailed plan of current and future parks, playgrounds and recreation areas. Use this as the basis for development of a long term forward plan.
Service Delivery To ensure that the services required (via surveys) are driving the demand for our Parks and Recreation assets.
5 IPWEA, 2011, IIMM, Table 3.4.1, p 3|58.

‐ 18 ‐
LISMORE CITY COUNCIL – PARKS & RECREATION ASSET MANAGEMENT PLAN
4.5 Asset Programs to meet Demand
The new assets required to meet growth will be acquired free of cost from land developments and constructed/acquired by the organisation. New assets constructed/acquired by the organisation are discussed in Section 5.5. The cumulative value of new contributed and constructed asset values are summarised in Figure 1.
Figure 1.1: Upgrade and New Assets to meet Demand (Scenario 1 – Current Actual LTFP Including Capital Expenditure Allocated to New Assets)
$3,000
$2,500
-0 $2,000 0
0
* ...... Ill QI $1 ,500 :::J iii > -QI
$1 ,000 Ill Ill ~
$500
$0
Lism,ore CC - Upgrade & New Assets to meet Demand (Parks_Recreation_Actual_2017 _S1_ Vl)
□ Contributed ■ Constructed
- - - - - - - -
- - ,__ ,__ - - ,__ - - -
- - - - - - - - - - - -
- - - ,__ - - ,__ ,__ - - ,__ - - -
- - - ,__ - - ,__ - - ,__ ,__ - - f-- - - --L
- -
- -
- -
- -
- -
~ ID rn O ~ N M ~ ~ W ~ ID m O ~ N M ~ ~ W ~ ~ ~ N N N N N N N N N N ~ ~ ~ ~ ~ ~ ~ 0 0 0 0 0 0 0 0 0 0 0 0 0 0 0 0 0 0 0 0 N N N N N N N N N N N N N N N N N N N N
Year
‐ 19 ‐
LISMORE CITY COUNCIL – PARKS & RECREATION ASSET MANAGEMENT PLAN
Figure 1.2: Upgrade and New Assets to meet Demand (Scenario 2 – Alternate LTFP Scenario, All Capital Expenditure to Renewal of Existing Assets)
Acquiring these new assets will commit the organisation to fund ongoing operations, maintenance and renewal costs for the period that the service provided from the assets is required. These future costs are identified and considered in developing forecasts of future operations, maintenance and renewal costs in Section 5.
-
L·sm,ore CC - Upgrade & New Assets to meet Demand (Parks_Recreation_Renewal_2017 _51_ Vl)
□ Contributed ■ Constructed
$1-.-----------------------------------,
$1---1---------------------------
0 ~ $1
Ill
~ $1--+----------------------------------------< ~ -; $0--------------------------------------c
$0---1---------------------------
$0 t-- (D 0) 0 ,.--- N C') "'1" It) (0 t-- CD 0) 0 ,.--- N ("") "'1" It) (0 ..---- ..---- ..---- N N N N N N N N N N (") (") (") (") (") (") (") 0 0 0 0 0 0 0 0 0 0 0 0 0 0 0 0 0 0 0 0 N N N N N N N N N N N N N N N N N N N N
Year

‐ 20 ‐
LISMORE CITY COUNCIL – PARKS & RECREATION ASSET MANAGEMENT PLAN
5. LIFECYCLE MANAGEMENT PLAN
The lifecycle management plan details how the organisation plans to manage and operate the assets at the agreed levels of service (defined in Section 3) while optimising life cycle costs.
5.1 Background Data
5.1.1 Physical parameters
The assets covered by this asset management plan are shown in Table 2.1.
The age profile of the assets include in this AM Plan is shown in Figure 2.
Figure 2: Asset Age Profile
5.1.2 Asset capacity and performance
The organisation’s services are generally provided to meet design standards where these are available.
Locations where deficiencies in service performance are known are detailed in Table 5.1.2.
Table 5.1.2: Known Service Performance Deficiencies
Location Service Deficiency
No major service deficiencies have been individually identified in this Asset Management Plan.
Development of this detail should be included in future revisions of this Asset Management Plan.
$4,000
$3,500
$3,000
- $2,500 0 0 0 -v. $2,000 u a: u ......
$1,500
$1,000
$500
$0
Lismore CC - Age Profile (Parks_ Recreation_Actual_ 2017 _S1_ Vl)
- ~
- - - - - -
nn n nn_ n n n - n n n n n ~
Vear Acquired
-
-
-
-
- -
n ., r,

‐ 21 ‐
LISMORE CITY COUNCIL – PARKS & RECREATION ASSET MANAGEMENT PLAN
5.1.3 Asset condition
The condition profile of our assets is shown in Figure 3.
Fig 3: Asset Condition Profile
Condition is measured using a 1 – 5 grading system6 as detailed in Table 5.1.3.
Table 5.1.3: Simple Condition Grading Model
Condition Grading Description of Condition
1 Very Good: only planned maintenance required
2 Good: minor maintenance required plus planned maintenance
3 Fair: significant maintenance required
4 Poor: significant renewal/rehabilitation required
5 Very Poor: physically unsound and/or beyond rehabilitation
As part of the preparation of the asset management plan Council has used ODM modelling to determine the likely impact on asset condition under the 3 explored scenarios. Scenario 1 models the current actual LTFP in which 72% over 10 years of allocated capital expenditure is for new assets for various sporting groups. Scenario 2 explores the cost & effect of allocating the entirety of the available capital expenditure budget to the renewal of existing assets. Scenario 3 explores the cost & effect of renewing all parks & recreation assets on reaching condition 4 ensuring there are no assets in condition 5 in 10 years excluding all budget restrictions.
6 IPWEA, 2011, IIMM, Sec 2.5.4, p 2|79.
$12,000
$10,000
- $8,000 0 0 9 -lilt-
$6,000 -QI :::J ii >
$4,000
$2,000
$0
Lism:,ore CC - Condition Profile {Parks_Recreation_Actua _ 2017 _S1_ Vl)
■ Rating Value D Not Rated
0 2 3 4
Rating
5

‐ 22 ‐
LISMORE CITY COUNCIL – PARKS & RECREATION ASSET MANAGEMENT PLAN
Funding Scenario 1 – Current Actual LTFP Including Capital Expenditure Allocated to New Assets Fig 3.2: 20 Year Asset Condition Profiles (Scenario 1 – Current Actual LTFP Including Capital Expenditure Allocated to
New Assets)
Current modelling is based on the existing valued technical register which does not contain all “green assets” and section 94a funded assets. The condition graphs above demonstrates that modelling scenario 1 maintaining the current level of upgrade/new would be unsustainable over a 20 year period and lead to a significant deterioration in asset condition. This is due to the cyclical operations, maintenance and renewal requirements of the existing assets in addition to the requirements of the total value of land improvements assets increasing and the subsequent operations and maintenance requirements of any additional assets. Any year modelled will show a snapshot in the renewal cycle of the asset class as assets progressively deteriorate with time to a point where renewal is required. Adequate operations & maintenance schedules will increase the life of the asset and improve the overall condition of the asset group. If funding is insufficient over the long term we will expect to see a progressive increase in the total value of assets in very poor condition as renewals are deferred. A sample result of the current funding scenarios modelled over 20 years is provided in figure 3.3 & 3.4. Given the demonstrated sample scenario the upgrade/new level for land improvements will be reviewed in line with the Delivery Program review making funding scenario 2 the more likely 20 year condition profile for land improvements assets. Funding Scenario 2 – Alternate LTFP Scenario, All Capital Expenditure to Renewal of Existing Assets
Fig 3.3: Condition Profile ‐ Scenario 2 (Alternate LTFP Scenario, All Capital Expenditure to Renewal of Existing Assets)
Current Condition
Current
current Condition
Very Poor, Current
1% "' / Very4~•
Fair, 50%
10 Yr Condition - LTFP (Actual lnduding New Assets)
Year 10 - LTFP (Actual)
..
10 Yr Condition - LTFP (Actual lnduding New Assets)
Year 10 - LTFP (Renewal)
..
20 Yr Condition - LTFP (Actual Including New Assets)
Year 20 - LTFP (Actual)
OR
20 Yr Condition - LTFP (Actual Including New Assets)
Year 20 - LTFP (Renewal)
OR

‐ 23 ‐
LISMORE CITY COUNCIL – PARKS & RECREATION ASSET MANAGEMENT PLAN
Funding Scenario 3 – Unconstrained Financial Model Renewing All Assets at Condition 4 (No Condition 5 in 10yrs) Fig 3.4: Condition Profile ‐ Funding Scenario 3 – Unconstrained Financial Model Renewing all Assets at Condition 4
(No Condition 5 in 10yrs)
5.1.4 Asset valuations
The value of assets recorded in the asset register as at 30 June 2016 covered by this asset management plan is shown below. Assets were last revalued at 30 June 2016. Assets are valued at fair value methodology with straight line depreciation.
Current Replacement Cost $20,121,972.95
Depreciable Amount $20,121,972.95
Depreciated Replacement Cost7 $11,676,516.85
Annual Depreciation Expense $800,223.14
Useful lives were reviewed in June 2016 by JRA Datashare Benchmark lives & best practice estimates by Council.
Various ratios of asset consumption and expenditure have been prepared to help guide and gauge asset management performance and trends over time.
Rate of Annual Asset Consumption 3.98% (Depreciation/Depreciable Amount)
Rate of Annual Asset Renewal 0.5% (Scenario 1), 1.7% (Scenario 2) (Capital renewal exp/Depreciable amount)
Rate of Annual Asset Upgrade/New 1.2% (Scenario 1), 0% (Scenario 2) (Capital upgrade/new/Depreciable amount)
In 2017 the organisation plans to renew assets at 11.8% of the rate they are being consumed and will be increasing its asset stock by 1.2% in the year under scenario 1.
In 2017 the organisation plans to renew assets at 41% of the rate they are being consumed and will be increasing its asset stock by 0% in the year under scenario 2.
7 Also reported as Written Down Current Replacement Cost (WDCRC).
Current Condition
Very Poor, Current 1" ~ / Very4~•
Fair, SO%
10 Yr Condition - Unconstrained {No condition 5 in 10 years)
20 Yr Condition - Unconstrained (No condition 5 in 10 years)
Year 10 - Unconstrained Renew
Condition 4
Year 20 - Unconstrained Renew
Condition 4
0
Current Replacement
Cost Accumulate Depreciation
Depreciated--=,.,,--➔ Replacement
Cost
Annual Depreciation
Expense
End of reporting period 1
End of reporting period 2
Useful Life
Depreciable Amount
Residual Value

‐ 24 ‐
LISMORE CITY COUNCIL – PARKS & RECREATION ASSET MANAGEMENT PLAN
5.2 Infrastructure Risk Management Plan
An assessment of risks associated with service delivery from infrastructure assets has identified critical risks that will result in loss or reduction in service from infrastructure assets or a ‘financial shock’ to the organisation. The risk assessment process identifies credible risks, the likelihood of the risk event occurring, the consequences should the event occur, develops a risk rating, evaluates the risk and develops a risk treatment plan for non‐acceptable risks.
Critical risks, being those assessed as ‘Very High’ ‐ requiring immediate corrective action and ‘High’ – requiring prioritised corrective action identified in the Infrastructure Risk Management Plan, together with the estimated residual risk after the selected treatment plan is operational are summarised in Table 5.2. These risks are reported to management and Council/Board.
Table 5.2: Critical Risks and Treatment Plans
Service or Asset at Risk
What can Happen Risk Rating (VH, H)
Risk Treatment Plan Residual Risk *
Treatment Costs
Parks & Recreation Age & Condition: In general, Lismore's assets are ageing and there are limited maintenance funds to maintain to an acceptable level. . Increased Community Expectations: In this day of the internet, communication and personal travel for business and holidays, our community is always educated in what other Council's provide and what can be achieved. Our community have expectations that need to be managed accordingly.
M/H Community Understanding: Managing the community's expectations. Future community surveys and Council's direct community consultation strategies should aim to find out what our community needs from us as a Council, whilst also informing the community of what Council resources are available to provide for those needs. Healthy Asset Management: Council has continued the strengthening of its asset management with a detailed collection of open space assets within our parks, bushland and sporting fields. From this, Council will now develop an asset management strategy that will aim to provide for the effective maintenance and renewal of its assets.
L/M In House Resources
Note * The residual risk is the risk remaining after the selected risk treatment plan is operational.
5.3 Routine Operations and Maintenance Plan
Operations include regular activities to provide services such as public health, safety and amenity, eg cleansing, street sweeping, grass mowing, gardening and street lighting.
Routine maintenance is the regular on‐going work that is necessary to keep assets operating, including instances where portions of the asset fail and need immediate repair to make the asset operational again.
5.3.1 Operations and Maintenance Plan
Operations activities affect service levels including quality and function through grass mowing frequency, intensity and spacing of street lights and cleaning frequency and opening hours of building and other facilities.
Maintenance includes all actions necessary for retaining an asset as near as practicable to an appropriate service condition including regular ongoing day‐to‐day work necessary to keep assets operating, eg road patching but excluding rehabilitation or renewal. Maintenance may be classified into reactive, planned and specific maintenance work activities.
Reactive maintenance is unplanned repair work carried out in response to service requests and management/supervisory directions.

‐ 25 ‐
LISMORE CITY COUNCIL – PARKS & RECREATION ASSET MANAGEMENT PLAN
Planned maintenance is repair work that is identified and managed through a maintenance management system (MMS). MMS activities include inspection, assessing the condition against failure/breakdown experience, prioritising, scheduling, actioning the work and reporting what was done to develop a maintenance history and improve maintenance and service delivery performance.
Specific maintenance is replacement of higher value components/sub‐components of assets that is undertaken on a regular cycle including repainting, replacing air conditioning units, etc. This work falls below the capital/maintenance threshold but may require a specific budget allocation.
Actual maintenance expenditure is shown in Table 5.3.1.
Table 5.3.1: Maintenance Expenditure
Year Maintenance Expenditure
Planned and Specific Unplanned
2017/18 $3,228,593 $150,000
Planned maintenance work is currently 4% of total maintenance expenditure.
Under Funding Scenarios 1 & 2 Council’s mmaintenance expenditure levels are not currently considered to be adequate to meet projected service levels, which may be less than or equal to current service levels. Where maintenance expenditure levels are such that will result in a lesser level of service, the service consequences and service risks have been identified and service consequences highlighted in this AM Plan and service risks considered in the Infrastructure Risk Management Plan.
Assessment and prioritisation of reactive maintenance is undertaken by Council staff using experience and judgement.
5.3.2 Operations and Maintenance Strategies
The organisation will operate and maintain assets to provide the defined level of service to approved budgets in the most cost‐efficient manner. The operation and maintenance activities include:
Scheduling operations activities to deliver the defined level of service in the most efficient manner,
Undertaking maintenance activities through a planned maintenance system to reduce maintenance costs and improve maintenance outcomes. Undertake cost‐benefit analysis to determine the most cost‐effective split between planned and unplanned maintenance activities (50 – 70% planned desirable as measured by cost),
Maintain a current infrastructure risk register for assets and present service risks associated with providing services from infrastructure assets and reporting Very High and High risks and residual risks after treatment to management and Council,
Review current and required skills base and implement workforce training and development to meet required operations and maintenance needs,
Review asset utilisation to identify underutilised assets and appropriate remedies, and over utilised assets and customer demand management options,
Maintain a current hierarchy of critical assets and required operations and maintenance activities,
Review management of operations and maintenance activities to ensure Council is obtaining best value for resources used.
Asset hierarchy
An asset hierarchy provides a framework for structuring data in an information system to assist in collection of data, reporting information and making decisions. The hierarchy includes the asset class and component used for asset planning and financial reporting and service level hierarchy used for service planning and delivery.
The organisation’s service hierarchy is shown is Table 5.3.2.
I I

‐ 26 ‐
LISMORE CITY COUNCIL – PARKS & RECREATION ASSET MANAGEMENT PLAN
Table 5.3.2: Asset Service Hierarchy
Service Hierarchy Service Level Objective
Parks & Recreation
Land Improvements
Carparks (Pavement/Seal/Kerb)
Electrical
Irrigation
Park Landscaping
Paths
Playgrounds
Playing Surfaces
Roads (Pavement/Seal)
Sportsfields
Water
A healthy environment ‐ Protecting our environment and sustainable use of resources.
Facilitates sport, community and healthy lifestyle
Provides for and promotes recreation and healthy lifestyles
Create an aesthetic and passive environment for the enjoyment of residents and visitors
Land Improvements Non‐Depreciable
Carparks (Formation)
Roads (Formation)
Park Landscaping
Other Open Space & Recreation Assets (OOSRA)
Furniture
Rubbish Bins
Other Structures
Fences
Monuments
Park Bridges
Site Structures
Critical Assets
Critical assets are those assets which have a high consequence of failure but not necessarily a high likelihood of failure. By identifying critical assets and critical failure modes, organisations can target and refine investigative activities, maintenance plans and capital expenditure plans at the appropriate time.
Operations and maintenances activities may be targeted to mitigate critical assets failure and maintain service levels. These activities may include increased inspection frequency, higher maintenance intervention levels, etc. Critical assets failure modes and required operations and maintenance activities are detailed in Table 5.3.2.1.
Table 5.3.2.1: Critical Assets and Service Level Objectives
Critical Assets Critical Failure Mode Operations & Maintenance Activities
None currently identified for 2016 AMP
Standards and specifications
Maintenance work is carried out in accordance with the following Standards and Specifications.
Local Government Act
Australian Safety Standards for Playgrounds
Council’s Health and Safety policy under Work Health and Safety (WHS)
Relevant Council policies & procedures

‐ 27 ‐
LISMORE CITY COUNCIL – PARKS & RECREATION ASSET MANAGEMENT PLAN
5.3.3 Summary of future operations and maintenance expenditures
Future operations and maintenance expenditure is forecast to trend in line with the value of the asset stock as shown in Figure 4. Note that all costs are shown in current dollar values (i.e. real values).
Figure 4: Projected Operations and Maintenance Expenditure (Scenario 1 & 2)
Deferred maintenance, i.e. works that are identified for maintenance and unable to be funded are to be included in the risk assessment and analysis in the infrastructure risk management plan.
Maintenance is funded from the operating budget where available. This is further discussed in Section 6.2.
5.4 Renewal/Replacement Plan
Renewal and replacement expenditure is major work which does not increase the asset’s design capacity but restores, rehabilitates, replaces or renews an existing asset to its original or lesser required service potential. Work over and above restoring an asset to original service potential is upgrade/expansion or new works expenditure.
5.4.1 Renewal plan
Assets requiring renewal/replacement are identified from one of three methods provided in the ‘Expenditure Template’.
Method 1 uses Asset Register data to project the renewal costs using acquisition year and useful life to determine the renewal year, or
Method 2 uses capital renewal expenditure projections from external condition modelling systems (such as Council’s Optimised Decision Making System), or
Method 3 uses a combination of average network renewals plus defect repairs in the Renewal Plan and Defect Repair Plan worksheets on the ‘Expenditure template’.
... m Ill ► ... Ill ~ ..-.., 0 o , 0 ~ -
Lismore CC - Projected Operations & Maintenance Expenditure (Parks_Recreation_Actual_ 2017 _51_ Vl)
$6,000
$5,000
$4,000
$3,000
$2,000
$1 ,000
$0
- Maintenance - Operations - Budget
2017 2018 2019 2020 2021 2022 2023 2024 2025 2026 2027 2028 2029 2030 2031 2032 2033 2034 2035 2036
Year

‐ 28 ‐
LISMORE CITY COUNCIL – PARKS & RECREATION ASSET MANAGEMENT PLAN
Method 2 was used for this asset management plan.
The useful lives of assets used to develop projected asset renewal expenditures are shown in Table 5.4.1. Asset useful lives were last reviewed on 30 June 2016 as part of the parks & recreation asset revaluation.8
Table 5.4.1: Useful Lives of Assets
Asset (Sub)Category Useful life (Years)
Carpark Formation Non‐Depreciable
Carpark K&G 50‐100
Carpark Pavement 75
Carpark Seal 15‐25
Electrical Items 30‐50
Fence Items 25‐50
Furniture Items 20‐30
Irrigation Items 30
Monument Items 20‐80
Park Bridges 80
Park Landscaping 20‐Non‐Depreciable
Paths 15‐120
Playground Items 20‐120
Playing Surfaces 5‐50
Road Formation Non‐Depreciable
Road Pavement 75
Road Seal 15‐25
Rubbish Bins 20
Site Structures 20‐100
Sportsfield Items 10‐30
Water Features 30
Water Items 20‐100
5.4.2 Renewal and Replacement Strategies
The organisation will plan capital renewal and replacement projects to meet level of service objectives and minimise infrastructure service risks by:
Planning and scheduling renewal projects to deliver the defined level of service in the most efficient manner,
Undertaking project scoping for all capital renewal and replacement projects to identify: o the service delivery ‘deficiency’, present risk and optimum time for renewal/replacement, o the project objectives to rectify the deficiency, o the range of options, estimated capital and life cycle costs for each options that could address the service
deficiency, o and evaluate the options against evaluation criteria adopted by the organisation, and o select the best option to be included in capital renewal programs,
Using ‘low cost’ renewal methods (cost of renewal is less than replacement) wherever possible,
Maintain a current infrastructure risk register for assets and service risks associated with providing services from infrastructure assets and reporting Very High and High risks and residual risks after treatment to management and Council,
Review current and required skills base and implement workforce training and development to meet required construction and renewal needs,
8 Lismore_LandImpOther_Revaluation Report_V2.00 1600908 FINAL

‐ 29 ‐
LISMORE CITY COUNCIL – PARKS & RECREATION ASSET MANAGEMENT PLAN
Maintain a current hierarchy of critical assets and capital renewal treatments and timings required ,
Review management of capital renewal and replacement activities to ensure Council is obtaining best value for resources used.
Renewal ranking criteria
Asset renewal and replacement is typically undertaken to either:
Ensure the reliability of the existing infrastructure to deliver the service it was constructed to facilitate (eg replacing a bridge that has a 5 t load limit), or
To ensure the infrastructure is of sufficient quality to meet the service requirements (eg roughness of a road).9
It is possible to get some indication of capital renewal and replacement priorities by identifying assets or asset groups that:
Have a high consequence of failure,
Have a high utilisation and subsequent impact on users would be greatest,
The total value represents the greatest net value to the organisation,
Have the highest average age relative to their expected lives,
Are identified in the AM Plan as key cost factors,
Have high operational or maintenance costs, and
Where replacement with modern equivalent assets would yield material savings.10
Renewal and replacement standards
Renewal work is carried out in accordance with the following Standards and Specifications.
Relevant Australian Standards
Playground Standards
Disability Discrimination Act
Compliance with current regulations
Building Code of Australia
Recognised Best Practice Industry Standards
AS 2560 Guide to Sports Lighting and codes relevant to each sport
Council’s Processes for Purchasing, Tenders and Code of Conduct
9 IPWEA, 2011, IIMM, Sec 3.4.4, p 3|60. 10 Based on IPWEA, 2011, IIMM, Sec 3.4.5, p 3|66.

‐ 30 ‐
LISMORE CITY COUNCIL – PARKS & RECREATION ASSET MANAGEMENT PLAN
5.4.3 Summary of future renewal and replacement expenditure
Projected future renewal and replacement expenditures are forecast to increase over time as the asset stock increases from growth. The expenditure is summarised in Fig 5. Note that all amounts are shown in real values.
Fig 5: Projected Capital Renewal and Replacement Expenditure (Scenario 1 & 2)
Deferred renewal and replacement, i.e. those assets identified for renewal and/or replacement and not scheduled in capital works programs are to be included in the risk analysis process in the risk management plan.
Renewals and replacement expenditure in the organisation’s capital works program will be accommodated in the long term financial plan. This is further discussed in Section 6.2.
5.5 Creation/Acquisition/Upgrade Plan
New works are those works that create a new asset that did not previously exist, or works which upgrade or improve an existing asset beyond its existing capacity. They may result from growth, social or environmental needs. Assets may also be acquired at no cost to the organisation from land development. These assets from growth are considered in Section 4.4.
5.5.1 Selection criteria
New assets and upgrade/expansion of existing assets are identified from various sources such as councillor/director or community requests, proposals identified by strategic plans or partnerships with other organisations. Candidate proposals are inspected to verify need and to develop a preliminary renewal estimate. Verified proposals are ranked by priority and available funds and scheduled in future works programmes. Council needs to develop a more thorough priority ranking criteria like the example shown below.
0 0 C •
Lismore CC - Projected Capital Renewal Expenditure (Parks_Recreation_Actua _ 2017 _S1_ Vl)
Gen's 2+ Gen 1
4,000
$3,500
3,000
$2,500 "'" -2,000
$1,500 --$1,000 -
$500
$0 - n n n - n Cl n ,-. co 0) 0 N (Y) "=I' I.O <D ,-. co 0) C) N (Y) ._,.
N N N N N N N N N N (Y) (Y) (") (Y) (Y) 0 C) C) 0 C) C) 0 0 C) 0 0 C) 0 C) 0 C) 0 C)
N N N N N N N N N N N N ' N N N N N N
Vea,r
,... ,... - -
FI I.O ~ (Y) (Y)
0 0 N N

‐ 31 ‐
LISMORE CITY COUNCIL – PARKS & RECREATION ASSET MANAGEMENT PLAN
Table 5.5.1: Example ‐ New Assets Priority Ranking Criteria
Criteria Weighting
Safety 35%
Community Expectation 15%
Impact on Existing Services/Infrastructure ‐Lifecycle Costs
25%
Community Benefits 25%
Total 100%
5.5.2 Capital Investment Strategies
The organisation will plan capital upgrade and new projects to meet level of service objectives by:
Planning and scheduling capital upgrade and new projects to deliver the defined level of service in the most efficient manner,
Undertake project scoping for all capital upgrade/new projects to identify: o the service delivery ‘deficiency’, present risk and required timeline for delivery of the upgrade/new asset, o the project objectives to rectify the deficiency including value management for major projects, o the range of options, estimated capital and life cycle costs for each options that could address the service
deficiency, o management of risks associated with alternative options, o and evaluate the options against evaluation criteria adopted by Council, and o select the best option to be included in capital upgrade/new programs,
Review current and required skills base and implement training and development to meet required construction and project management needs,
Review management of capital project management activities to ensure Council is obtaining best value for resources used.
Standards and specifications for new assets and for upgrade/expansion of existing assets are the same as those for renewal shown in Section 5.4.2.
5.5.3 Summary of future upgrade/new assets expenditure
Under Funding Scenario 1 all capital expenditure has been allocated to the upgrade of existing assets and mainly to the creation of new assets. This is the current situation as the capital funds available are allocated to different sporting groups to enhance their facilities. new assets (expansion or upgrade) will add operating and maintenance costs because it increases the asset base. Expansion may also increase revenue, whereas upgrade is not likely to add new revenue.
Under Funding Scenario 2 all capital expenditure has been allocated to the renewal of Council’s existing asset base. Capital renewal will generally have no impact on future revenue, as existing assets are being replaced, but may reduce future operating and maintenance expenditure if well designed and completed at the optimum time. As depicted in previous graphs this funding scenario has a significant impact on the condition of Council’s existing asset base over 20 years.
The decision to invest in assets imposes a responsibility on Council to provide the requisite funds for operating, maintenance, renewal and disposal of that infrastructure asset over its life cycle. Asset decisions cannot be made in isolation and capital and recurrent outlays should be considered within council’s overall budget and the impact these assets will have on the future costs and revenues of the Council.

‐ 32 ‐
LISMORE CITY COUNCIL – PARKS & RECREATION ASSET MANAGEMENT PLAN
5.6 Disposal Plan
Disposal includes any activity associated with disposal of a decommissioned asset including sale, demolition or relocation. Assets identified for possible decommissioning and disposal are shown in Table 5.6, together with estimated annual savings from not having to fund operations and maintenance of the assets. These assets will be further reinvestigated to determine the required levels of service and see what options are available for alternate service delivery, if any. Any revenue gained from asset disposals is accommodated in Council’s long term financial plan.
Under the current LTFP funding Council cannot fund its asset renewals and it is inevitable that Council will not be able to replace some of its Parks & Recreation assets when they reach the end of their life, hence they will need to be disposed of. The below table needs to be developed in future revisions of this AMP.
Table 5.6: Assets Identified for Disposal
Asset Reason for Disposal Timing Disposal Expenditure Operations & Maintenance Annual
Savings
To be developed
6. FINANCIAL SUMMARY
This section contains the financial requirements resulting from all the information presented in the previous sections of this asset management plan. The financial projections will be improved as further information becomes available on desired levels of service and current and projected future asset performance.
6.1 Financial Statements and Projections
The financial projections are shown in Fig 7 for projected operating (operations and maintenance) and capital expenditure (renewal and upgrade/expansion/new assets). Note that all costs are shown in current values. Figure 7 is based on the ODM modelling. This explores the likely effect of current funding scenarios.
Figure 7 shows the projected works program for the planning period against the budget from the Long Term Financial Plan. The black line shows the total budget for operations, maintenance, renewal and upgrade/new as a total. The bars show the ongoing required expenditures to maintain service levels for the existing assets held in the technical asset register. The bars that are above the budget line shows funding requirements above the available budget level. The works program will prioritise the renewal requirements based on pre‐set criteria agreed with Council and detailed in the implementation health. The model will fund operations, maintenance and renewal up to the level of the pre‐set budget. Once renewal requirements exceed the available budget the asset will be deferred in the register until the next budget year and identified within the register. Where assets are deferred the criticality is automatically increased, condition is deteriorated by one year in the model and risk, operational and maintenance requirements are adjusted. The following budget year the prioritisation of renewal requirements is completed again with assets calculated as having the highest criticality funded first. An asset can be deferred for multiple years with the criticality, operational and maintenance requirements will continue to be adjusted.
The service level lines (condition, function and capacity) lines show the projected effect on the total network condition, function and capacity scores for each year of the planning period against the projected and budgeted expenditures. The calculated service levels are shown in 0‐100 scale that correlates with the IIMM 1‐5 condition scale, this allows service level scores to be adjusted annually at a greater level of detail.
Table 6.1: SAM Model Service Level Descriptions
Modelling Score IIMM Score Estimated % Life Remaining80-100 1 = As New 80%-100% 60-80 2 60%-80% 40-60 3 40%-60% 20-40 4 20%-40% 0-20 5 = Very Poor/Unserviceable 0%-20%

‐ 33 ‐
LISMORE CITY COUNCIL – PARKS & RECREATION ASSET MANAGEMENT PLAN
Fig 7.1: Projected Capital Expenditure (Scenario 1 – Current Actual LTFP Including Capital Expenditure Allocated to New Assets)
FM I _SI _ Vl 2 - 2017 _ParksRecreation_LTFP _Actual
+ Budget ,'\; Defened ■ New Upgrade ■ Renewal Maintenance Operating -+- Condition S16M
I 0 114M
20
~l2M
lO
SlOM §
~
n 40 ?1
~ ro .,-"' 58M e
::r 50 ro
cc Q. ~
t 0 s:
$6M
t ro
60 ~ ro
. '' - 70
S4M
80
52M 90
SOM I 00
2017 20 18 2019 2020 2021 2022 2023 2024 2025 2026 2027 2028 2029 2030 2031 2032 2033 2034 2035 2036 2037 2038 2039 2040 2041

‐ 34 ‐
LISMORE CITY COUNCIL – PARKS & RECREATION ASSET MANAGEMENT PLAN
Fig 7.2: Projected Capital Expenditure (Scenario 2 ‐ Alternate LTFP Scenario, All Capital Expenditure to Renewal of Existing Assets)
FM3_51_Vl 1 - Parks & Recreation -AMP Funding Scenario 2 (Renewal On ly - No O&M)
$12M
$8M
E .. °' o $6M &::
" .,,_
~ $4M
$2M
$OM
+ Budget " ' Deferred ■ New Upgrade ■ Renewal Maintenance Operating
20 17 2018 2019 2020 202 1 2022 2023 2024 2025 2026 2027 2028 2029 2030 2031 2032 2033 2034 2035 2036 2037 2038 2039 2040 2041
0
20
30
n 40 ?J
i .,;· ::,-
50 ;. Q.
~ 60 ~
"' 70
80
90
100

‐ 35 ‐
LISMORE CITY COUNCIL – PARKS & RECREATION ASSET MANAGEMENT PLAN
Fig 7.3: Projected Operating and Capital Expenditure (Scenario 3 – Unconstrained model based on expenditures required to renew all assets at condition 4 – No condition 5 in 10 yrs)
FM2 _S l _ V3 - 2017 _ParksRecreation_Unconmained_Condition 4
S9M
58M
S7M
56M
E SSM ~ ~
e C>.
f 54M a
:s:
!3M
S2M
SIM
SOM
2017 2018 2019 2020 2021
+ Budget \ ' Deferred ■ New Upgrade ■ Renewal Maintenance Operating + Condition
2022 2023 2024 2025 2026 2027 2028 2029 2030 2031 2032 2033 2034 2035 2036 20!7 2038 2039 2040 2041
0
10
20
30
n 40 ~
:E ro <!l
~ 50 ro o_
t ro
60 ~ ro
70
80
90
I 00

‐ 36 ‐
LISMORE CITY COUNCIL – PARKS & RECREATION ASSET MANAGEMENT PLAN
6.1.1 Sustainability of service delivery
There are four key indicators for service delivery sustainability that have been considered in the analysis of the services provided by this asset category, these being the asset renewal funding ratio, long term life cycle costs/expenditures and medium term projected/budgeted expenditures over 5 and 10 years of the planning period.
Asset Renewal Funding Ratio (From ODM Works Program modelling output)
Scenario 1 ‐ (Current actual LTFP budget figures, this is inclusive of 72% of current
capital expenditure ($2,599,742) being allocated to various sporting groups for new infrastructure)
Scenario 2 ‐ Current LTFP figures allocating the current 72% of
capital expenditure ($2,599,742) being to renewal of existing
infrastructure rather than being allocated to various sporting groups for new infrastructure
Scenario 3 ‐ Unconstrained model based on
expenditures required to renew all assets at
condition 4 – No condition 5 in 10 yrs
($000’s) ($000’s) ($000’s)
Asset Renewal Funding Ratio
Asset Renewal Funding Ratio 5% 20% 100%
Life Cycle Cost (long term)'($000)
Life Cycle Cost (depreciation + ops. and maintenance. expenditures – 10 year average)
$54,550,724 $54,550,724 $54,550,724
Life Cycle Exp. (Capital renewal. + operations + maintenance expenditure 10 year average)
$48,328,980 $50,928,722 $56,532,921
Life Cycle Gap [life cycle expenditure ‐ life cycle cost [‐ve = gap]
‐$6,221,744 ‐$3,622,002 $1,982,197
Life Cycle Sustainability Indicator [life cycle expenditure / LCC]
89% 93% 104%
Medium Term (10 yrs) Sustainability
10 year Operations, Maintenance & Renewal Projected Expenditure
$68,025,830 $64,853,524 $56,532,921
10 year Operations, Maintenance & Renewal Planned (Budget) Expenditures
$48,328,980 $50,928,722 $56,532,921
10 year Funding Shortfall (10 year projected. expenditures. ‐ Planned (Budget) Expenditures)
‐$19,696,850 ‐$13,924,802 $0
10 year Sustainability Indicator (10 year planned exp. / projected. Expenditure)
71% 79% 100%
Short Term (5 years) Sustainability
5 year Operations, Maintenance & Renewal Projected Expenditure
$25,054,248 $24,136,426 $25,817,101
5 year Operations, Maintenance & Renewal Planned (Budget) Expenditure
$23,072,275 $24,298,818 $25,817,101
5 year Funding Shortfall (5 year projected expenditures. ‐ planned (budget) expenditures)
‐$1,981,973 $162,392 $0
5 year Sustainability Indicator (5 year planned expenditures. / projected expenditures)
92% 101% 100%

‐ 37 ‐
LISMORE CITY COUNCIL – PARKS & RECREATION ASSET MANAGEMENT PLAN
The Asset Renewal Funding Ratio is the most important indicator and reveals that over the next 10 years, Council is forecasting that it will have 5% of the funds required for the optimal renewal and replacement of its assets under the current actual LTFP figures due to 72% of current capital expenditure being allocated to various sporting groups for the construction of new assets. Under the alternate scenario 2 all expenditure is allocated to renewal of existing assets with no allocation for new but this ration is still only 20%.
Scenario 1 ‐ (Current actual LTFP budget figures, this is inclusive of 72% of current capital expenditure ($2,599,742) being allocated to various sporting groups for new infrastructure)
Long term ‐ Life Cycle Cost (Current Long Term Financial Plan)
Life cycle costs (or whole of life costs) are the average costs that are required to sustain the service levels over the asset life cycle. Life cycle costs include operations and maintenance expenditure and asset consumption (depreciation expense). The life cycle cost for the services covered in this asset management plan is $5,455,072 per year (average operations and maintenance expenditure plus depreciation expense projected over 10 years).
Life cycle costs can be compared to life cycle expenditure to give an initial indicator of affordability of projected service levels when considered with age profiles. Life cycle expenditure includes operations, maintenance and capital renewal expenditure. Life cycle expenditure will vary depending on the timing of asset renewals. The life cycle expenditure over the 10 year planning period is $4,832,898 per year (average operations and maintenance plus capital renewal budgeted expenditure in LTFP over 10 years).
A shortfall between life cycle cost and life cycle expenditure is the life cycle gap. The life cycle gap for services covered by this asset management plan is ‐$622,174 per year (‐ve = gap, +ve = surplus).
Life cycle expenditure is 89% of life cycle costs.
The life cycle costs and life cycle expenditure comparison highlights any difference between present outlays and the average cost of providing the service over the long term. If the life cycle expenditure is less than that life cycle cost, it is most likely that outlays will need to be increased or cuts in services made in the future.
Knowing the extent and timing of any required increase in outlays and the service consequences if funding is not available will assist organisations in providing services to their communities in a financially sustainable manner. This is the purpose of the asset management plans and long term financial plan.
Medium term – 10 year financial planning period (Current Long Term Financial Plan)
This asset management plan identifies the projected operations, maintenance and capital renewal expenditures required to provide an agreed level of service to the community over a 10 year period. This provides input into 10 year financial and funding plans aimed at providing the required services in a sustainable manner.
These projected expenditures may be compared to budgeted expenditures in the 10 year period to identify any funding shortfall. In a core asset management plan, a gap is generally due to increasing asset renewals for ageing assets.
The projected operations, maintenance and capital renewal expenditure required over the 10 year planning period is $6,802,583 on average per year.
Estimated (budget) operations, maintenance and capital renewal funding is $4,832,898 on average per year giving a 10 year funding shortfall of ‐$1,969,685 per year. This indicates that Council expects to have 71% of the projected expenditures needed to provide the services documented in the asset management plan based on the existing current LTFP which allocates 72% of current capital expenditure to new assets.
Medium Term – 5 year financial planning period (Current Long Term Financial Plan)
The projected operations, maintenance and capital renewal expenditure required over the first 5 years of the planning period is $2,505,425 on average per year.

‐ 38 ‐
LISMORE CITY COUNCIL – PARKS & RECREATION ASSET MANAGEMENT PLAN
Estimated (budget) operations, maintenance and capital renewal funding is $2,307,228 on average per year giving a 5 year funding shortfall of ‐$198,197.26. This indicates that Council expects to have 92% of projected expenditures required to provide the services shown in this asset management plan.
Scenario 2 ‐ Current LTFP figures allocating the current 72% of capital expenditure ($2,599,742) being to renewal of existing infrastructure rather than being allocated to various sporting groups for new infrastructure
Long term ‐ Life Cycle Cost (Current Long Term Financial Plan)
Life cycle costs (or whole of life costs) are the average costs that are required to sustain the service levels over the asset life cycle. Life cycle costs include operations and maintenance expenditure and asset consumption (depreciation expense). The life cycle cost for the services covered in this asset management plan is $5,455,072 per year (average operations and maintenance expenditure plus depreciation expense projected over 10 years).
Life cycle costs can be compared to life cycle expenditure to give an initial indicator of affordability of projected service levels when considered with age profiles. Life cycle expenditure includes operations, maintenance and capital renewal expenditure. Life cycle expenditure will vary depending on the timing of asset renewals. The life cycle expenditure over the 10 year planning period is $5,092,872 (average operations and maintenance plus capital renewal budgeted expenditure in LTFP over 10 years).
A shortfall between life cycle cost and life cycle expenditure is the life cycle gap. The life cycle gap for services covered by this asset management plan is ‐$362,200 per year (‐ve = gap, +ve = surplus).
Life cycle expenditure is 93% of life cycle costs.
The life cycle costs and life cycle expenditure comparison highlights any difference between present outlays and the average cost of providing the service over the long term. If the life cycle expenditure is less than that life cycle cost, it is most likely that outlays will need to be increased or cuts in services made in the future.
Knowing the extent and timing of any required increase in outlays and the service consequences if funding is not available will assist organisations in providing services to their communities in a financially sustainable manner. This is the purpose of the asset management plans and long term financial plan.
Medium term – 10 year financial planning period (Current Long Term Financial Plan)
This asset management plan identifies the projected operations, maintenance and capital renewal expenditures required to provide an agreed level of service to the community over a 10 year period. This provides input into 10 year financial and funding plans aimed at providing the required services in a sustainable manner.
These projected expenditures may be compared to budgeted expenditures in the 10 year period to identify any funding shortfall. In a core asset management plan, a gap is generally due to increasing asset renewals for ageing assets.
The projected operations, maintenance and capital renewal expenditure required over the 10 year planning period is $6,485,352 on average per year.
Estimated (budget) operations, maintenance and capital renewal funding is $5,092,872 on average per year giving a 10 year funding shortfall of ‐$1,392,480 per year. This indicates that Council expects to have 79% of the projected expenditures needed to provide the services documented in the asset management plan.
Medium Term – 5 year financial planning period (Current Long Term Financial Plan)
The projected operations, maintenance and capital renewal expenditure required over the first 5 years of the planning period is $2,413,643 on average per year.
Estimated (budget) operations, maintenance and capital renewal funding is $2,429,882 on average per year producing a financial calculated surplus of $16,239. This indicates that Council expects to have 101% of projected expenditures required to provide the services shown in this asset management plan.

‐ 39 ‐
LISMORE CITY COUNCIL – PARKS & RECREATION ASSET MANAGEMENT PLAN
Asset management financial indicators
Figure 7A shows the asset management financial indicators over the 10 year planning period and for the long term life cycle.
Figure 7A: Asset Management Financial Indicators
Providing services from infrastructure in a sustainable manner requires the matching and managing of service levels, risks, projected expenditures and financing to achieve a financial indicator of approximately 1.0 for the first years of the asset management plan and ideally over the 10 year life of the Long Term Financial Plan.
Figure 8.1 shows the projected asset renewal and replacement expenditure over the 20 years of the AM Plan for scenario 1. The projected asset renewal and replacement expenditure is compared to renewal and replacement expenditure in the capital works program, which is accommodated in the long term financial plan
12.0%
100%
80%
60%
40%
20%
0%
AM finandal Indicators
SYr 10Yr Lifecyde
■ S1 - LTFP Actual ■ S2 - LTFP Actua II ■ S3 - Unconstrained Renew at Condit1ion 4

‐ 40 ‐
LISMORE CITY COUNCIL – PARKS & RECREATION ASSET MANAGEMENT PLAN
Figure 8.1: Projected and LTFP Budgeted Renewal Expenditure (Scenario 1 – Current Actual LTFP Including Capital Expenditure Allocated to New Assets)
Table 6.1.1.A shows the shortfall between projected renewal and replacement expenditures and expenditure accommodated in long term financial plan for scenario 1.
Table 6.1.1.A: Projected and LTFP Budgeted Renewals and Financing Shortfall (Scenario 1 – Current Actual LTFP Including Capital Expenditure Allocated to New Assets)
Mode lYear
Budget Constraint_LTFP
Renewal Funded
Renewal Deferred
Operating Need
Maintenance Need
Renewal Need
Upgrade Need New Need
Opex Budget
Capex Budget
2017 $4,462,039 $0 $222,064 $1,062,415 $3,592,434 $222,064 $0 $233,885 $0 ‐$192,810
2018 $4,556,726 $0 $264,686 $1,062,415 $3,592,434 $264,686 $0 $239,462 $0 ‐$98,123
2019 $4,649,358 $0 $264,686 $1,062,415 $3,592,434 $264,686 $0 $245,172 $0 ‐$5,491
2020 $4,651,313 $0 $430,204 $1,062,415 $3,592,434 $430,204 $0 $251,018 $0 ‐$3,536
2021 $4,752,838 $97,910 $500,452 $1,062,415 $3,592,434 $598,362 $0 $257,004 $0 $97,989
2022 $4,856,689 $201,801 $1,694,738 $1,062,415 $3,592,434 $1,896,539 $0 $263,133 $0 $201,840
2023 $4,962,920 $307,903 $1,386,835 $1,062,415 $3,592,434 $1,694,738 $0 $269,408 $0 $308,071
2024 $5,071,589 $416,554 $4,590,235 $1,062,415 $3,592,434 $5,006,788 $0 $275,834 $0 $416,740
2025 $5,182,753 $527,760 $5,219,441 $1,062,415 $3,592,434 $5,747,201 $0 $282,412 $0 $527,904
2026 $5,182,753 $527,800 $4,824,271 $1,062,415 $3,592,434 $5,352,071 $0 $282,412 $0 $527,904
10 Yr Total $48,328,980 $2,079,727 $19,397,611 $10,624,148 $35,924,344 $21,477,338 $0 $2,599,742 $0 $1,780,488
2027 $5,182,753 $527,860 $5,354,331 $1,062,415 $3,592,434 $5,882,191 $0 $282,412 $0 $527,904
2028 $5,182,753 $527,902 $6,690,540 $1,062,415 $3,592,434 $7,218,442 $0 $282,412 $0 $527,904
L smore CC - Projected & L TFP Budgeted Renewa : Expenditure (Parks_Recreation_Actual_2017 _Sl_Vl)
Projected Renewals - Planned Renewals - Expenditure Year 1
S4,000
S:3,500
S3,000
S2,500
,..... C ~
C 52,000 0 • ...,
S1 ,500
S1 ,000
S500 -
n - - n n so - - - -
20117 2018 2019 2020 2021 2022 2023 202 2025 2026 2027 2028 2029 2030 2031 2032 2033 2034 2035 2036
Vear

‐ 41 ‐
LISMORE CITY COUNCIL – PARKS & RECREATION ASSET MANAGEMENT PLAN
Mode lYear
Budget Constraint_LTFP
Renewal Funded
Renewal Deferred
Operating Need
Maintenance Need
Renewal Need
Upgrade Need New Need
Opex Budget
Capex Budget
2029 $5,182,753 $527,895 $6,857,607 $1,062,415 $3,592,434 $7,385,502 $0 $282,412 $0 $527,904
2030 $5,182,753 $527,864 $6,533,611 $1,062,415 $3,592,434 $7,061,475 $0 $282,412 $0 $527,904
2031 $5,182,753 $527,884 $6,005,727 $1,062,415 $3,592,434 $6,533,611 $0 $282,412 $0 $527,904
2032 $5,182,753 $527,852 $5,970,782 $1,062,415 $3,592,434 $6,498,634 $0 $282,412 $0 $527,904
2033 $5,182,753 $527,878 $5,686,837 $1,062,415 $3,592,434 $6,214,715 $0 $282,412 $0 $527,904
2034 $5,182,753 $527,854 $8,065,822 $1,062,415 $3,592,434 $8,593,676 $0 $282,412 $0 $527,904
2035 $5,182,753 $527,898 $7,537,923 $1,062,415 $3,592,434 $8,065,822 $0 $282,412 $0 $527,904
2036 $5,182,753 $527,849 $7,010,704 $1,062,415 $3,592,434 $7,538,553 $0 $282,412 $0 $527,904
20 Yr Total $100,156,511 $7,358,464 $85,111,495 $21,248,296 $71,848,688 $92,469,959 $0 $5,423,865 $0 $7,059,527
Note: A negative shortfall indicates a financing gap, a positive shortfall indicates a surplus for that year.
Figure 8.2 shows the projected asset renewal and replacement expenditure over the 20 years of the AM Plan for scenario 2. The projected asset renewal and replacement expenditure is compared to renewal and replacement expenditure in the capital works program, which is accommodated in the long term financial plan
Figure 8.2: Projected and LTFP Budgeted Renewal Expenditure (Scenario 2 ‐ Alternate LTFP Scenario, All Capital Expenditure to Renewal of Existing Assets)
Table 6.1.1.B shows the shortfall between projected renewal and replacement expenditures and expenditure accommodated in long term financial plan for scenario 1.
Lismore CC - Projected & L TFP Budgeted Renewal Expenditure (Parks_Recreation_Renewal_2017 _Sl_ Vl}
Projected Renewals - Planned Renewals - Expenditure Year 1
S ,000
53,500
53,000
52,500
..... C C
52,000 0 iii. ,_.
51 ,SOO
S1 ,000
S500
so
Year

‐ 42 ‐
LISMORE CITY COUNCIL – PARKS & RECREATION ASSET MANAGEMENT PLAN
Table 6.1.1.B: Projected and LTFP Budgeted Renewals and Financing Shortfall (Scenario 2 ‐ Alternate LTFP Scenario, All Capital Expenditure to Renewal of Existing Assets)
Model Year
Budget Constraint_LTFP
Renewal Funded
Renewal Deferred
Operating Need
Maintenance Need
Renewal Need
Upgrade Need
New Need
Opex Budget
Capex Budget
2017 $4,695,925 $40,800 $181,264 $1,062,415 $3,592,434 $222,064 $0 $0 $0 $41,075
2018 $4,796,189 $141,332 $82,554 $1,062,415 $3,592,434 $223,886 $0 $0 $0 $141,339
2019 $4,894,530 $82,554 $0 $1,062,415 $3,592,434 $82,554 $0 $0 $0 $239,681
2020 $4,902,331 $165,518 $0 $1,062,415 $3,592,434 $165,518 $0 $0 $0 $247,482
2021 $5,009,843 $168,158 $0 $1,062,415 $3,592,434 $168,158 $0 $0 $0 $354,994
2022 $5,119,822 $226,087 $1,170,000 $1,062,415 $3,592,434 $1,396,087 $0 $0 $0 $464,973
2023 $5,232,329 $22,326 $1,170,000 $1,062,415 $3,592,434 $1,192,326 $0 $0 $0 $577,479
2024 $5,347,422 $692,279 $4,140,297 $1,062,415 $3,592,434 $4,832,576 $0 $0 $0 $692,573
2025 $5,465,165 $810,292 $4,576,401 $1,062,415 $3,592,434 $5,386,693 $0 $0 $0 $810,316
2026 $5,465,165 $810,144 $3,825,027 $1,062,415 $3,592,434 $4,635,171 $0 $0 $0 $810,316
10 Yr Total $50,928,722 $3,159,489 $15,145,543 $10,624,148 $35,924,344 $18,305,032 $0 $0 $0 $4,380,230
2027 $5,465,165 $810,299 $4,055,505 $1,062,415 $3,592,434 $4,865,804 $0 $0 $0 $810,316
2028 $5,465,165 $810,268 $5,068,299 $1,062,415 $3,592,434 $5,878,567 $0 $0 $0 $810,316
2029 $5,465,165 $810,313 $4,953,555 $1,062,415 $3,592,434 $5,763,868 $0 $0 $0 $810,316
2030 $5,465,165 $810,277 $4,389,161 $1,062,415 $3,592,434 $5,199,438 $0 $0 $0 $810,316
2031 $5,465,165 $810,292 $3,673,447 $1,062,415 $3,592,434 $4,483,739 $0 $0 $0 $810,316
2032 $5,465,165 $810,297 $3,282,198 $1,062,415 $3,592,434 $4,092,494 $0 $0 $0 $810,316
2033 $5,465,165 $810,250 $2,699,368 $1,062,415 $3,592,434 $3,509,618 $0 $0 $0 $810,316
2034 $5,465,165 $810,310 $4,756,539 $1,062,415 $3,592,434 $5,566,849 $0 $0 $0 $810,316
2035 $5,465,165 $810,303 $4,022,930 $1,062,415 $3,592,434 $4,833,234 $0 $0 $0 $810,316
2036 $5,465,165 $810,270 $3,254,675 $1,062,415 $3,592,434 $4,064,945 $0 $0 $0 $810,316
20 Yr Total $105,580,376 $11,262,369 $55,301,219 $21,248,296 $71,848,688 $66,563,588 $0 $0 $0 $12,483,392
Note: A negative shortfall indicates a financing gap, a positive shortfall indicates a surplus for that year.
Figure 8.3 shows the projected asset renewal and replacement expenditure over the 20 years of the AM Plan for scenario 3. The projected asset renewal and replacement expenditure is compared to renewal and replacement expenditure in the capital works program, which is accommodated in the long term financial plan
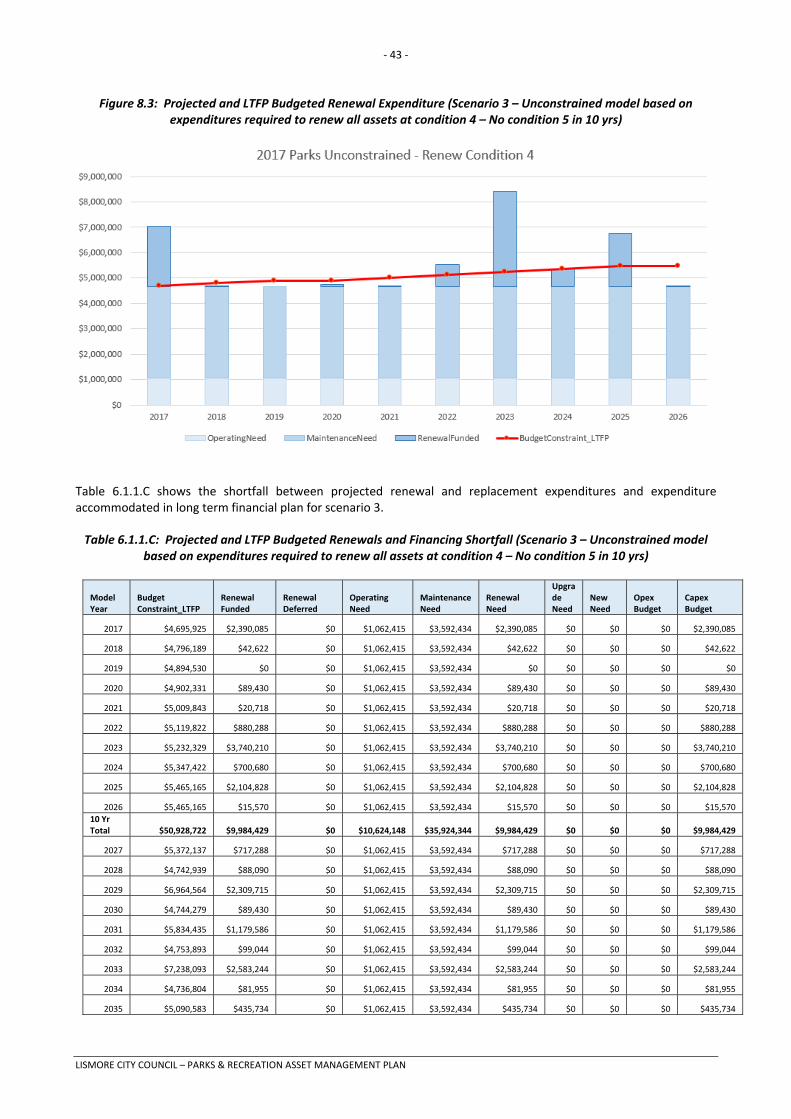
‐ 43 ‐
LISMORE CITY COUNCIL – PARKS & RECREATION ASSET MANAGEMENT PLAN
Figure 8.3: Projected and LTFP Budgeted Renewal Expenditure (Scenario 3 – Unconstrained model based on expenditures required to renew all assets at condition 4 – No condition 5 in 10 yrs)
Table 6.1.1.C shows the shortfall between projected renewal and replacement expenditures and expenditure accommodated in long term financial plan for scenario 3.
Table 6.1.1.C: Projected and LTFP Budgeted Renewals and Financing Shortfall (Scenario 3 – Unconstrained model based on expenditures required to renew all assets at condition 4 – No condition 5 in 10 yrs)
Model Year
Budget Constraint_LTFP
Renewal Funded
Renewal Deferred
Operating Need
Maintenance Need
Renewal Need
Upgrade Need
New Need
Opex Budget
Capex Budget
2017 $4,695,925 $2,390,085 $0 $1,062,415 $3,592,434 $2,390,085 $0 $0 $0 $2,390,085
2018 $4,796,189 $42,622 $0 $1,062,415 $3,592,434 $42,622 $0 $0 $0 $42,622
2019 $4,894,530 $0 $0 $1,062,415 $3,592,434 $0 $0 $0 $0 $0
2020 $4,902,331 $89,430 $0 $1,062,415 $3,592,434 $89,430 $0 $0 $0 $89,430
2021 $5,009,843 $20,718 $0 $1,062,415 $3,592,434 $20,718 $0 $0 $0 $20,718
2022 $5,119,822 $880,288 $0 $1,062,415 $3,592,434 $880,288 $0 $0 $0 $880,288
2023 $5,232,329 $3,740,210 $0 $1,062,415 $3,592,434 $3,740,210 $0 $0 $0 $3,740,210
2024 $5,347,422 $700,680 $0 $1,062,415 $3,592,434 $700,680 $0 $0 $0 $700,680
2025 $5,465,165 $2,104,828 $0 $1,062,415 $3,592,434 $2,104,828 $0 $0 $0 $2,104,828
2026 $5,465,165 $15,570 $0 $1,062,415 $3,592,434 $15,570 $0 $0 $0 $15,570
10 Yr Total $50,928,722 $9,984,429 $0 $10,624,148 $35,924,344 $9,984,429 $0 $0 $0 $9,984,429
2027 $5,372,137 $717,288 $0 $1,062,415 $3,592,434 $717,288 $0 $0 $0 $717,288
2028 $4,742,939 $88,090 $0 $1,062,415 $3,592,434 $88,090 $0 $0 $0 $88,090
2029 $6,964,564 $2,309,715 $0 $1,062,415 $3,592,434 $2,309,715 $0 $0 $0 $2,309,715
2030 $4,744,279 $89,430 $0 $1,062,415 $3,592,434 $89,430 $0 $0 $0 $89,430
2031 $5,834,435 $1,179,586 $0 $1,062,415 $3,592,434 $1,179,586 $0 $0 $0 $1,179,586
2032 $4,753,893 $99,044 $0 $1,062,415 $3,592,434 $99,044 $0 $0 $0 $99,044
2033 $7,238,093 $2,583,244 $0 $1,062,415 $3,592,434 $2,583,244 $0 $0 $0 $2,583,244
2034 $4,736,804 $81,955 $0 $1,062,415 $3,592,434 $81,955 $0 $0 $0 $81,955
2035 $5,090,583 $435,734 $0 $1,062,415 $3,592,434 $435,734 $0 $0 $0 $435,734
2017 Parks Unconstrained - Renew Condition 4
$9,000, 000
$8,000, 000
$7,000, 000 - -
$6,000, 000
$5,000, 000 - -$4,000, 000
$3,000, 000
$2,000, 000
Sl,000, 000
so 2017 2018 2019 2020 2021 2022 2023 2024 2025 2026
OperatingNeed - MaintenanceNeed = RenewalFunded --BudgetC<Jnstraint_LTFP

‐ 44 ‐
LISMORE CITY COUNCIL – PARKS & RECREATION ASSET MANAGEMENT PLAN
Model Year
Budget Constraint_LTFP
Renewal Funded
Renewal Deferred
Operating Need
Maintenance Need
Renewal Need
Upgrade Need
New Need
Opex Budget
Capex Budget
2036 $5,524,323 $869,474 $0 $1,062,415 $3,592,434 $869,474 $0 $0 $0 $869,474
20 Yr Total $105,930,773 $18,437,988 $0 $21,248,296 $71,848,688 $18,437,988 $0 $0 $0 $18,437,988
Note: A negative shortfall indicates a financing gap, a positive shortfall indicates a surplus for that year.
Providing services in a sustainable manner will require matching of projected asset renewal and replacement expenditure to meet agreed service levels with the corresponding capital works program accommodated in the long term financial plan.
A gap between projected asset renewal/replacement expenditure and amounts accommodated in the LTFP indicates that further work is required on reviewing service levels in the AM Plan (including possibly revising the LTFP) before revising the asset management plan to manage required service levels and funding to eliminate any funding gap.
We will manage the ‘gap’ by developing this asset management plan to provide guidance on future service levels and resources required to provide these services, and review future services, service levels and costs with the community.
6.1.2 Projected expenditures for long term financial plan
Table 6.1.2 shows the projected expenditures for the 10 year long term financial plan.
I I I I I I I I I I I I

‐ 45 ‐
LISMORE CITY COUNCIL – PARKS & RECREATION ASSET MANAGEMENT PLAN
Table 6.1.2.A: Projected Expenditures for Long Term Financial Plan ($000) (Scenario 1 – Current Actual LTFP Including Capital Expenditure Allocated to New Assets)
Parks & Recreation AMP Expenditure ‐Funding Scenario 1
Parks & Recreation 2016/17 2017/18 2018/19 2019/20 2020/21 2021/22 2022/23 2023/24 2024/25 2025/26
Capital NEW $222,500 $233,885 $239,462 $245,173 $251,019 $257,004 $263,134 $269,408 $275,834 $282,413
Capital Renewal $48,300 $94,108 $95,434 $96,782 $98,156 $99,554 $100,977 $102,424 $103,900 $105,401
Maintenance $3,329,300 $3,378,594 $3,453,045 $3,523,819 $3,503,460 $3,582,204 $3,662,798 $3,745,285 $3,829,713 $3,916,127
Operating $969,700 $989,338 $1,008,248 $1,028,756 $1,049,698 $1,071,081 $1,092,916 $1,115,210 $1,137,976 $1,161,224
TOTAL $4,569,800 $4,695,925 $4,796,189 $4,894,530 $4,902,333 $5,009,843 $5,119,825 $5,232,327 $5,347,423 $5,465,165
Table 6.1.2.B: Projected Expenditures for Long Term Financial Plan ($000) (Scenario 2 ‐ Alternate LTFP Scenario, All Capital Expenditure to Renewal of Existing Assets)
Parks & Recreation AMP Expenditure ‐ Funding Scenario 2
Parks & Recreation 2016/17 2017/18 2018/19 2019/20 2020/21 2021/22 2022/23 2023/24 2024/25 2025/26
Capital Renewal $270,800 $327,995 $334,896 $341,955 $349,174 $356,558 $364,108 $371,834 $379,734 $387,814
Maintenance $3,329,300 $3,378,594 $3,453,045 $3,523,819 $3,503,460 $3,582,204 $3,662,798 $3,745,285 $3,829,713 $3,916,127
Operating $969,700 $989,338 $1,008,248 $1,028,756 $1,049,698 $1,071,081 $1,092,916 $1,115,210 $1,137,976 $1,161,224
TOTAL $4,569,800 $4,695,927 $4,796,189 $4,894,530 $4,902,332 $5,009,843 $5,119,822 $5,232,329 $5,347,423 $5,465,165

‐ 46 ‐
LISMORE CITY COUNCIL – PARKS & RECREATION ASSET MANAGEMENT PLAN
6.2 Funding Strategy
After reviewing service levels, as appropriate to ensure ongoing financial sustainability projected expenditures identified in Section 6.1.2 will be accommodated in the Council’s 10 year long term financial plan.
6.3 Valuation Forecasts
Asset values are forecast to increase as additional assets are added to the asset stock from construction and acquisition by Council and from assets constructed by land developers and others and donated to Council. Figure 9 shows the projected replacement cost asset values over the planning period in real values.
Figure 9.1: Projected Asset Values (Scenario 1 – Current Actual LTFP Including Capital Expenditure Allocated to New Assets)
$25,000
$22,500
$20,000
$17 500
- $15,000 g 0 VI- $12,500 ..... u a:: u $10,000
$7,500
$5,000
$2,500
$0
Lismore CC - Projected Asset Values (Parks_Recreation_Actual_2017_S1_V1)
--- -- - -- - - - - -
- - - - - -
- - - - - -
- - - - - -
- - - - - -
- - - - - -
- - - - - -
~ - - ~ '-- -
t-- O'J 0) 0 N (Y) ..- N N N N
0000000 NNNNNNN
-
-
-
-
-
-
-
-
-- -
- -
- -- -
- -- -- -- .............
s:;t lO <D N N N 0 0 0 N N N
-
-
-
-
-
-
-
-
- - -
- - -
- >-- ->-- >-- -
- >-- -
- ,- -
- >-- -
,.__ - -
t-- 00 0) 0 N N N (Y) 0 0 0 0 N N N N
Vear
-
-
-
-
-
-
-
-
- -
- -
- -- -
- -- -- -
- -N (Y)
(") (<) (Y) 0 0 0 N N N
- - -- - -- >-- >--
- >-- >--
- - >--
1 - - -- - >--
- .......... ,.____

‐ 47 ‐
LISMORE CITY COUNCIL – PARKS & RECREATION ASSET MANAGEMENT PLAN
Figure 9.2: Projected Asset Values (Scenario 2 ‐ Alternate LTFP Scenario, All Capital Expenditure to Renewal of Existing Assets)
Depreciation expense values are forecast in line with asset values as shown in Figure 10.
--Cl Cl Cl 'iA-..... u a: Q
Lismore CC - Projected Depreciated Replacement Cost (Parks_Recreation_Renewa _2017 _S1_ Vl)
■ New Assets Existing Assets
$12,000
- -$10,000 -- - - - - -$8,000 - - - - - - - - - -
$6,000 - - - - - - - - - - - - - - -$4,000 - - ~ - - - - - - - - - - - - - - -$2,000 - - - - - - - - - - - - - - - - - - -
$0
Year
...

‐ 48 ‐
LISMORE CITY COUNCIL – PARKS & RECREATION ASSET MANAGEMENT PLAN
Figure 10.1: Projected Depreciation Expense (Scenario 1 – Current Actual LTFP Including Capital Expenditure Allocated to New Assets)
0 C C 1111-..... C 0 ; Cl ;::; Cl .. "" 41 C
::I C C ,c(
L1smore CC - Projected Depreciation Expense (Parks_ Recreation_Actual_ 2017 _S1_ Vl)
$1,000
$900
$800
$700
$600
$500
$400
$300
$200
$100
$0
...
f-
...
...
f-
...
f-
,.._
-,.._
,.._
-lo-
f--
,-.... 00
0 0 N N
-------
.... .... lo-
,.._
-,.._
,.._
-lo-
f--
0) 0 N
0 0 N N
lo-
,.._
-,.._
,.._
-lo-
f--
,-
N 0 N
--------
--lo-
,.._
-,.._
,.._
-lo-
f--
N (") N N C) 0 N N
.... lo-
,.._
-,.._
,.._
-lo-
f--
.... - lo-
- ,.._
- -- ,.._
- ,.._
- -- lo-
- f--
(0 N 0 N
-
-
-
-
-
-
--
-
-
-
-
--
--
,-... (X)
N N 0 0 N N
Vear
-
-
-
-
-
-
--
0) N 0 N
-
-
-
-
-
-
--
C) (Y) C) N
lo-
,.._
-,.._
,.._
-lo-
f--
---
---
-
-
N (") 0 N
-
-
-
-
-
-
--
(") (") 0 N
-
-
--
-
-
--
lo-
,.._
-,.._
,.._
-lo-
f--
-.:;f" I.O (") (Y) 0 0 N N
--------
...
...
f-
...
...
f-
...
f-
(0 (T) 0 N

‐ 49 ‐
LISMORE CITY COUNCIL – PARKS & RECREATION ASSET MANAGEMENT PLAN
Figure 10.2: Projected Depreciation Expense (Scenario 2 ‐ Alternate LTFP Scenario, All Capital Expenditure to Renewal of Existing Assets)
The depreciated replacement cost will vary over the forecast period depending on the rates of addition of new assets, disposal of old assets and consumption and renewal of existing assets. Forecast of the assets’ depreciated replacement cost is shown in Figure 11. The depreciated replacement cost of contributed and new assets is shown in the darker colour and in the lighter colour for existing assets.
$900
$800
$700 ..... 0 C
$600 0 111' ...... C 0 $500 :i:: !II ,j Cl ..
$400 c. 1111 0 jij ~ $300 C C ,0:
$200
$100
$0
Lismore CC - Projected Depreciation Expense (Parks_Recreat1on_Renewal_ 2017 _Sl_Vl)
,-
...
...
,-
...
...
,-
- ~ - - ~
- - - - -- - - - -- ~ - - ~
- - - - -- - - - -- ~ - - ~
t-000)0 N N N N
0 0 0 0 0 0 N N N N N N
-
-
-
-
-
-
-
- -- -- -- -- -- -- -
(') "<;f" in N N N 0 0 0 N N N
-------
~
--~
--~
~ rN N 0 0 N N
Vear
-
-
-
-
-
-
-
00 N 0 N
-
-
-
-
-
-
-
- -- -- -- -- -- -- -
CJ) 0 N (Y) M 0 0 0 N N ' N
~
--~
--~
N (') 0 N
-
-
-
-
-
-
-
-
-
-
-
-
-
-
(") "<;f" (I") (') 0 0 N N
-
-
-
-
-
-
-
l.O (') 0 N
- ,-
- ...
- ...
- ,-
- ...
- ...
- ,-

‐ 50 ‐
LISMORE CITY COUNCIL – PARKS & RECREATION ASSET MANAGEMENT PLAN
Figure 11.1: Projected Depreciated Replacement Cost (Scenario 1 – Current Actual LTFP Including Capital Expenditure Allocated to New Assets)
--Cl Cl Cl ~ ..... y 1:11: C
Lismore CC - Projected Depreciated Replacement Cost (Parks_Recreation_Actual_ 2017 _S1_ Vl)
■ New Assets Existing Assets
$12,000
$10,000
$8,000
$6,000
$4,000
$2,000
$0 I'-- 00 0) 0 N (Y) '<:t .., (0 I'-- (X) 0) 0 N M s;J" in (0 ..... N N N N N N N N N N (Y) (Y) (Y) M (Y) (Y) (Y) 0 0 0 0 0 0 0 0 0 0 0 0 0 0 0 0 0 0 0 0 N N N N N N N N N N N N N N N N N N N N
Year

‐ 51 ‐
LISMORE CITY COUNCIL – PARKS & RECREATION ASSET MANAGEMENT PLAN
Figure 11.2: Projected Depreciated Replacement Cost (Scenario 2 ‐ Alternate LTFP Scenario, All Capital Expenditure to Renewal of Existing Assets)
6.4 Key Assumptions made in Financial Forecasts
This section details the key assumptions made in presenting the information contained in this asset management plan and in preparing forecasts of required operating and capital expenditure and asset values, depreciation expense and carrying amount estimates. It is presented to enable readers to gain an understanding of the levels of confidence in the data behind the financial forecasts.
Key assumptions made in this asset management plan and risks that these may change are shown in Table 6.4.
Required maintenance is assumed to take place in accordance with relevant codes and standards
Parks & Recreation Assets will be replaced at the end of their useful life in accordance with the funding levels reported in the current long term financial plan
The Parks & Recreation register is complete and correct as per the Land Improvements & Other Structures asset revaluation as at 30 June 2016
No allowance in modelling has been made for disposals over the planning period.
-Q Q Q
~ l,J a= Cl
Lismore CC - Projected Depreciaited Replacement Cost (Parks_Recreation_Renewal_ 2017 _S1_ Vl)
$12,000
$10,000
8,000
$6,000
$4,000
$2,000
$0
■ New Assets Existing Assets
- - -t-- - - ....
- .... -,- - - - ,- - - -- - ....
t-- - - - t-- - ---- t-- - - - .... - - --t-- - - - t-- - - t-- - - - - - - t-- - - -t-- - - - - - - - - - - - - ----
,_ - ,_ - -
~ 00 m O N M V ~ ~ ~ 00 m O ~ N M V ~ W N N N N N N N N N N M M M M M M M
0 0 0 0 0 0 0 0 0 0 0 0 0 0 0 0 0 0 0 0 N N N N N N N N N N N N N N N N N N N N
Vea,r

‐ 52 ‐
LISMORE CITY COUNCIL – PARKS & RECREATION ASSET MANAGEMENT PLAN
6.5 Forecast Reliability and Confidence
The expenditure and valuations projections in this AM Plan are based on best available data. Currency and accuracy of data is critical to effective asset and financial management. Data confidence is classified on a 5 level scale11 in accordance with Table 6.5.
Table 6.5: Data Confidence Grading System
Confidence Grade Description
A Highly reliable Data based on sound records, procedures, investigations and analysis, documented properly and recognised as the best method of assessment. Dataset is complete and estimated to be accurate ± 2%
B Reliable Data based on sound records, procedures, investigations and analysis, documented properly but has minor shortcomings, for example some of the data is old, some documentation is missing and/or reliance is placed on unconfirmed reports or some extrapolation. Dataset is complete and estimated to be accurate ± 10%
C Uncertain Data based on sound records, procedures, investigations and analysis which is incomplete or unsupported, or extrapolated from a limited sample for which grade A or B data are available. Dataset is substantially complete but up to 50% is extrapolated data and accuracy estimated ± 25%
D Very Uncertain Data is based on unconfirmed verbal reports and/or cursory inspections and analysis. Dataset may not be fully complete and most data is estimated or extrapolated. Accuracy ± 40%
E Unknown None or very little data held.
The estimated confidence level for and reliability of data used in this AM Plan is shown in Table 6.5.1.
Table 6.5.1: Data Confidence Assessment for Data used in AM Plan
Data Confidence Assessment Comment
Demand drivers C Uncertain General comments on parks & recreation demand drivers
Operations expenditures A Highly reliable Lismore City Council ‐ Parks & Recreation AMP Expenditure
Maintenance expenditures A Highly reliable Lismore City Council ‐ Parks & Recreation AMP Expenditure
Projected Renewal exps. ‐ Asset values
A Highly reliable Lismore City Council – Parks & Recreation Asset Revaluation 30 June 2016
‐ Asset residual values A Highly reliable Lismore City Council – Parks & Recreation Asset Revaluation 30 June 2016
‐ Asset useful lives A Highly reliable Lismore City Council – Parks & Recreation Asset Revaluation 30 June 2016
‐ Condition modelling A Highly reliable Lismore City Council – Parks & Recreation Asset Revaluation 30 June 2016 – ODM Modelling based on revaluation condition & current LTFP expenditures
‐ Network renewals A Highly reliable Lismore City Council – Parks & Recreation Asset Revaluation 30 June 2016 – ODM Modelling based on revaluation condition & current LTFP expenditures
‐ Defect repairs E Unknown No data currently modelled for parks & recreation
Upgrade/New expenditures B Reliable Lismore City Council ‐ Parks & Recreation AMP Expenditure
Disposal expenditures E Unknown No data currently modelled for parks & recreation
Over all data sources the data confidence is assessed as Medium to High confidence level for data used in the preparation of this AM Plan.
11 IPWEA, 2011, IIMM, Table 2.4.6, p 2|59.

‐ 53 ‐
LISMORE CITY COUNCIL – PARKS & RECREATION ASSET MANAGEMENT PLAN
7. PLAN IMPROVEMENT AND MONITORING
7.1 Status of Asset Management Practices
7.1.1 Accounting and financial systems
Accounting system is Civica Authority.
Accountabilities for financial systems is the Finance Section.
Accounting standards and regulations:
Local Government Act (NSW) 1993
Local Government Amendment (Planning and Reporting) Act 2009
Local Government (Finance Plans and Reporting) Regulation 2010
AASB116
Capital/Maintenance Threshold
Items of infrastructure, property, plant and equipment are not capitalised unless their cost of acquisition exceeds the following;12
Land o Council land 100% Capitalised o Open space 100% Capitalised o Land under roads (purchases after 30/6/08) 100% Capitalised
Plant & Equipment o Office Furniture > $1,000 o Office Equipment > $1,000 o Other Plant &Equipment > $1,000 o Buildings & Land Improvements o Park Furniture & Equipment > $2,000
Building o Construction/extensions 100% Capitalised o Renovations > $10,000
Other Structures > $2,000
Water & Sewer Assets o Reticulation extensions > $5,000 o Other > $5,000
Stormwater Assets o Drains & Culverts > $5,000 o Other > $5,000
Transport Assets o Road construction & reconstruction > $10,000 o Reseal/Re‐sheet & major repairs: > $10,000 o Bridge construction & reconstruction > $10,000
12 Lismore City Council, General Purpose Financial Statements for the year ended 30 June 2011

‐ 54 ‐
LISMORE CITY COUNCIL – PARKS & RECREATION ASSET MANAGEMENT PLAN
Required changes to accounting financial systems arising from this AM Plan:
Develop reporting on expenditures, with separation of costs for operations as opposed to maintenance and improved reporting on capital expenditures as renewal or upgrade/new,
Continued input and development of a single corporate asset register, in which financial calculations including calculation of annual depreciation can be undertaken by council.
Linking of the customer service system/work orders to the corporate asset register to link requests to asset records,
Improved project cost accounting to record costs against the asset component and develop valuation unit rates.
7.1.2 Asset management system
Asset System is Civica Authority AM which is managed by the Asset Management Section and the IT Section.
Accountabilities for asset management system and data maintenance is the Asset Management Section.
Required changes to asset management system arising from this AM Plan are:
Review of accuracy and currency of asset condition data,
Continued development of a single technical asset register as the corporate asset register, in which financial calculations including calculation of annual depreciation can be undertaken by council at an individual asset component level.
Development of a works costing and maintenance management system to improve works planning and cost recording, in particular to identify expenditure type (operations, maintenance, capital renewal and capital new/upgrade)
Continue to develop project cost accounting to record costs against the asset component.
7.2 Improvement Plan
The asset management improvement plan generated from this asset management plan is shown in Table 7.2.
Table 7.2: Improvement Plan
Task No Task Responsibility Resources Required
1 Continue to improve record and reporting on expenditures, with separate costs for operations, maintenance and capture capital expenditures as renewal or upgrade/new
Corporate (Infrastructure Services & Finance)
Staff Time
2 Continue to maintain the corporate asset register, in which financial calculations including calculation of annual depreciation are undertaken by council.
Corporate (Infrastructure Services & Finance)
Staff Time
3 Linking of the customer service system to the corporate asset register to link requests to asset records
Corporate (Infrastructure Services & Corporate Services)
Staff Time
4 Continue to Improve project cost accounting to record costs against the asset component and develop valuation unit rates
Corporate (Infrastructure Services & Finance)
Staff Time
5 Review the accuracy and currency of asset condition data for high risk assets
Infrastructure Services
Staff Time

‐ 55 ‐
LISMORE CITY COUNCIL – PARKS & RECREATION ASSET MANAGEMENT PLAN
Task No Task Responsibility Resources Required
6 Continue to review methodology for determining remaining life, with detail assessment for assets requiring renewal in the medium term (next 10‐20 years) An advanced outcome should be that the remaining lives from the asset register will generate a renewal scenario aligning with the Works Program and Long Term Financial Plan. (Scenario 1 described in this asset management plan will match Scenario 3)
Infrastructure Services
Staff Time
8 Develop procedures for maintaining the Asset and Financial Registers
Corporate (Infrastructure Services & Finance)
Staff Time
9 Strategies need to be developed to mitigate the risk of Council not being able to fund its renewal program
Corporate Staff Time
10 Review the process for allocation of funding in the Sports Facilities Funds Grants
Corporate Staff Time
7.3 Monitoring and Review Procedures
This asset management plan will be reviewed during annual budget planning processes and amended to recognise any material changes in service levels and/or resources available to provide those services as a result of budget decisions.
The AM Plan will be updated periodically to ensure it represents the current service level, asset values, projected operations, maintenance, capital renewal and replacement, capital upgrade/new and asset disposal expenditures and projected expenditure values incorporated into the organisation’s long term financial plan.
7.4 Performance Measures
The effectiveness of the asset management plan can be measured in the following ways:
The degree to which the required projected expenditures identified in this asset management plan are incorporated into Council’s long term financial plan,
The degree to which 1‐5 year detailed works programs, budgets, business plans and organisational structures take into account the ‘global’ works program trends provided by the asset management plan,
The degree to which the existing and projected service levels and service consequences (what we cannot do), risks and residual risks are incorporated into the Council’s Strategic Plan and associated plans,
The Asset Renewal Funding Ratio achieving the target of 1.0.

‐ 56 ‐
LISMORE CITY COUNCIL – PARKS & RECREATION ASSET MANAGEMENT PLAN
8. REFERENCES
IPWEA, 2006, ‘International Infrastructure Management Manual’, Institute of Public Works Engineering Australasia, Sydney, www.ipwea.org/IIMM
IPWEA, 2008, ‘NAMS.PLUS Asset Management’, Institute of Public Works Engineering Australasia, Sydney,
www.ipwea.org/namsplus.
IPWEA, 2009, ‘Australian Infrastructure Financial Management Guidelines’, Institute of Public Works Engineering
Australasia, Sydney, www.ipwea.org/AIFMG.
IPWEA, 2011, ‘International Infrastructure Management Manual’, Institute of Public Works Engineering Australasia, Sydney, www.ipwea.org/IIMM

‐ 57 ‐
LISMORE CITY COUNCIL – PARKS & RECREATION ASSET MANAGEMENT PLAN
9. APPENDICES
Appendix A Abbreviations
Appendix B Glossary

‐ 58 ‐
LISMORE CITY COUNCIL – PARKS & RECREATION ASSET MANAGEMENT PLAN
Appendix A Abbreviations
AAAC Average annual asset consumption
AM Asset management
AM Plan Asset management plan
ARI Average recurrence interval
ASC Annual service cost
BOD Biochemical (biological) oxygen demand
CRC Current replacement cost
CWMS Community wastewater management systems
DA Depreciable amount
DRC Depreciated replacement cost
EF Earthworks/formation
IRMP Infrastructure risk management plan
LCC Life Cycle cost
LCE Life cycle expenditure
LTFP Long term financial plan
MMS Maintenance management system
PCI Pavement condition index
RV Residual value
SoA State of the Assets
SS Suspended solids
vph Vehicles per hour
WDCRC Written down current replacement cost
‐ 59 ‐
LISMORE CITY COUNCIL – PARKS & RECREATION ASSET MANAGEMENT PLAN
Appendix B Glossary
Annual service cost (ASC) 1) Reporting actual cost The annual (accrual) cost of providing a service including operations, maintenance, depreciation,
finance/opportunity and disposal costs less revenue. 2) For investment analysis and budgeting An estimate of the cost that would be tendered, per annum, if tenders were called for the supply of a service to a
performance specification for a fixed term. The Annual Service Cost includes operations, maintenance, depreciation, finance/ opportunity and disposal costs, less revenue.
Asset A resource controlled by an entity as a result of past events and from which future economic benefits are expected to flow to the entity. Infrastructure assets are a sub‐class of property, plant and equipment which are non‐current assets with a life greater than 12 months and enable services to be provided.
Asset category Sub‐group of assets within a class hierarchy for financial reporting and management purposes.
Asset class A group of assets having a similar nature or function in the operations of an entity, and which, for purposes of disclosure, is shown as a single item without supplementary disclosure.
Asset condition assessment The process of continuous or periodic inspection, assessment, measurement and interpretation of the resultant data to indicate the condition of a specific asset so as to determine the need for some preventative or remedial action.
Asset hierarchy A framework for segmenting an asset base into appropriate classifications. The asset hierarchy can be based on asset function or asset type or a combination of the two.
Asset management (AM) The combination of management, financial, economic, engineering and other practices applied to physical assets with the objective of providing the required level of service in the most cost effective manner.
Asset renewal funding ratio The ratio of the net present value of asset renewal funding accommodated over a 10 year period in a long term financial plan relative to the net present value of projected capital renewal expenditures identified in an asset management plan for the same period [AIFMG Financial Sustainability Indicator No 8].
Average annual asset consumption (AAAC)* The amount of an organisation’s asset base consumed during a reporting period (generally a year). This may be calculated by dividing the depreciable amount by the useful life (or total future economic benefits/service potential) and totalled for each and every asset OR by dividing the carrying amount (depreciated replacement cost) by the remaining useful life (or remaining future economic benefits/service potential) and totalled for each and every asset in an asset category or class.
Borrowings A borrowing or loan is a contractual obligation of the borrowing entity to deliver cash or another financial asset to the lending entity over a specified period of time or at a specified point in time, to cover both the initial capital provided and the cost of the interest incurred for providing this capital. A borrowing or loan provides the means for the borrowing entity to finance outlays (typically physical assets) when it has insufficient funds of its own to do so, and for the lending entity to make a financial return, normally in the form of interest revenue, on the funding provided.

‐ 60 ‐
LISMORE CITY COUNCIL – PARKS & RECREATION ASSET MANAGEMENT PLAN
Capital expenditure Relatively large (material) expenditure, which has benefits, expected to last for more than 12 months. Capital expenditure includes renewal, expansion and upgrade. Where capital projects involve a combination of renewal, expansion and/or upgrade expenditures, the total project cost needs to be allocated accordingly.
Capital expenditure ‐ expansion Expenditure that extends the capacity of an existing asset to provide benefits, at the same standard as is currently enjoyed by existing beneficiaries, to a new group of users. It is discretionary expenditure, which increases future operations and maintenance costs, because it increases the organisation’s asset base, but may be associated with additional revenue from the new user group, eg. extending a drainage or road network, the provision of an oval or park in a new suburb for new residents.
Capital expenditure ‐ new Expenditure which creates a new asset providing a new service/output that did not exist beforehand. As it increases service potential it may impact revenue and will increase future operations and maintenance expenditure.
Capital expenditure ‐ renewal Expenditure on an existing asset or on replacing an existing asset, which returns the service capability of the asset up to that which it had originally. It is periodically required expenditure, relatively large (material) in value compared with the value of the components or sub‐components of the asset being renewed. As it reinstates existing service potential, it generally has no impact on revenue, but may reduce future operations and maintenance expenditure if completed at the optimum time, eg. resurfacing or resheeting a material part of a road network, replacing a material section of a drainage network with pipes of the same capacity, resurfacing an oval.
Capital expenditure ‐ upgrade Expenditure, which enhances an existing asset to provide a higher level of service or expenditure that will increase the life of the asset beyond that which it had originally. Upgrade expenditure is discretionary and often does not result in additional revenue unless direct user charges apply. It will increase operations and maintenance expenditure in the future because of the increase in the organisation’s asset base, eg. widening the sealed area of an existing road, replacing drainage pipes with pipes of a greater capacity, enlarging a grandstand at a sporting facility.
Capital funding Funding to pay for capital expenditure.
Capital grants Monies received generally tied to the specific projects for which they are granted, which are often upgrade and/or expansion or new investment proposals.
Capital investment expenditure See capital expenditure definition
Capitalisation threshold The value of expenditure on non‐current assets above which the expenditure is recognised as capital expenditure and below which the expenditure is charged as an expense in the year of acquisition.
Carrying amount The amount at which an asset is recognised after deducting any accumulated depreciation / amortisation and accumulated impairment losses thereon.
Class of assets See asset class definition
Component Specific parts of an asset having independent physical or functional identity and having specific attributes such as different life expectancy, maintenance regimes, risk or criticality.

‐ 61 ‐
LISMORE CITY COUNCIL – PARKS & RECREATION ASSET MANAGEMENT PLAN
Core asset management Asset management which relies primarily on the use of an asset register, maintenance management systems, job resource management, inventory control, condition assessment, simple risk assessment and defined levels of service, in order to establish alternative treatment options and long‐term cashflow predictions. Priorities are usually established on the basis of financial return gained by carrying out the work (rather than detailed risk analysis and optimised decision‐ making).
Cost of an asset The amount of cash or cash equivalents paid or the fair value of the consideration given to acquire an asset at the time of its acquisition or construction, including any costs necessary to place the asset into service. This includes one‐off design and project management costs.
Critical assets Assets for which the financial, business or service level consequences of failure are sufficiently severe to justify proactive inspection and rehabilitation. Critical assets have a lower threshold for action than noncritical assets.
Current replacement cost (CRC) The cost the entity would incur to acquire the asset on the reporting date. The cost is measured by reference to the lowest cost at which the gross future economic benefits could be obtained in the normal course of business or the minimum it would cost, to replace the existing asset with a technologically modern equivalent new asset (not a second hand one) with the same economic benefits (gross service potential) allowing for any differences in the quantity and quality of output and in operating costs.
Deferred maintenance The shortfall in rehabilitation work undertaken relative to that required to maintain the service potential of an asset.
Depreciable amount The cost of an asset, or other amount substituted for its cost, less its residual value.
Depreciated replacement cost (DRC) The current replacement cost (CRC) of an asset less, where applicable, accumulated depreciation calculated on the basis of such cost to reflect the already consumed or expired future economic benefits of the asset.
Depreciation / amortisation The systematic allocation of the depreciable amount (service potential) of an asset over its useful life.
Economic life See useful life definition.
Expenditure The spending of money on goods and services. Expenditure includes recurrent and capital outlays.
Expenses Decreases in economic benefits during the accounting period in the form of outflows or depletions of assets or increases in liabilities that result in decreases in equity, other than those relating to distributions to equity participants.
Fair value The amount for which an asset could be exchanged, or a liability settled, between knowledgeable, willing parties, in an arms length transaction.
Financing gap A financing gap exists whenever an entity has insufficient capacity to finance asset renewal and other expenditure necessary to be able to appropriately maintain the range and level of services its existing asset stock was originally designed and intended to deliver. The service capability of the existing asset stock should be determined assuming no additional operating revenue, productivity improvements, or net financial liabilities above levels currently planned or projected. A current financing gap means service levels have already or are currently falling. A projected financing gap if not addressed will result in a future diminution of existing service levels.

‐ 62 ‐
LISMORE CITY COUNCIL – PARKS & RECREATION ASSET MANAGEMENT PLAN
Heritage asset An asset with historic, artistic, scientific, technological, geographical or environmental qualities that is held and maintained principally for its contribution to knowledge and culture and this purpose is central to the objectives of the entity holding it.
Impairment Loss The amount by which the carrying amount of an asset exceeds its recoverable amount.
Infrastructure assets Physical assets that contribute to meeting the needs of organisations or the need for access to major economic and social facilities and services, eg. roads, drainage, footpaths and cycleways. These are typically large, interconnected networks or portfolios of composite assets. The components of these assets may be separately maintained, renewed or replaced individually so that the required level and standard of service from the network of assets is continuously sustained. Generally the components and hence the assets have long lives. They are fixed in place and are often have no separate market value.
Investment property Property held to earn rentals or for capital appreciation or both, rather than for: (a) use in the production or supply of goods or services or for administrative purposes; or (b) sale in the ordinary course of business.
Key performance indicator A qualitative or quantitative measure of a service or activity used to compare actual performance against a standard or other target. Performance indicators commonly relate to statutory limits, safety, responsiveness, cost, comfort, asset performance, reliability, efficiency, environmental protection and customer satisfaction.
Level of service The defined service quality for a particular service/activity against which service performance may be measured. Service levels usually relate to quality, quantity, reliability, responsiveness, environmental impact, acceptability and cost.
Life Cycle Cost * 1. Total LCC The total cost of an asset throughout its life including planning, design, construction, acquisition,
operation, maintenance, rehabilitation and disposal costs. 2. Average LCC The life cycle cost (LCC) is average cost to provide the service over the longest asset life cycle. It
comprises average operations, maintenance expenditure plus asset consumption expense, represented by depreciation expense projected over 10 years. The Life Cycle Cost does not indicate the funds required to provide the service in a particular year.
Life Cycle Expenditure The Life Cycle Expenditure (LCE) is the average operations, maintenance and capital renewal expenditure accommodated in the long term financial plan over 10 years. Life Cycle Expenditure may be compared to average Life Cycle Cost to give an initial indicator of affordability of projected service levels when considered with asset age profiles.
Loans / borrowings See borrowings.
Maintenance All actions necessary for retaining an asset as near as practicable to an appropriate service condition, including regular ongoing day‐to‐day work necessary to keep assets operating, eg road patching but excluding rehabilitation or renewal. It is operating expenditure required to ensure that the asset reaches its expected useful life. • Planned maintenance
Repair work that is identified and managed through a maintenance management system (MMS). MMS activities include inspection, assessing the condition against failure/breakdown criteria/experience, prioritising scheduling, actioning the work and reporting what was done to develop a maintenance history and improve maintenance and service delivery performance.
• Reactive maintenance Unplanned repair work that is carried out in response to service requests and management/ supervisory directions.

‐ 63 ‐
LISMORE CITY COUNCIL – PARKS & RECREATION ASSET MANAGEMENT PLAN
• Specific maintenance Maintenance work to repair components or replace sub‐components that needs to be identified as a specific maintenance item in the maintenance budget.
• Unplanned maintenance Corrective work required in the short‐term to restore an asset to working condition so it can continue to deliver the required service or to maintain its level of security and integrity.
Maintenance expenditure * Recurrent expenditure, which is periodically or regularly required as part of the anticipated schedule of works required to ensure that the asset achieves its useful life and provides the required level of service. It is expenditure, which was anticipated in determining the asset’s useful life.
Materiality The notion of materiality guides the margin of error acceptable, the degree of precision required and the extent of the disclosure required when preparing general purpose financial reports. Information is material if its omission, misstatement or non‐disclosure has the potential, individually or collectively, to influence the economic decisions of users taken on the basis of the financial report or affect the discharge of accountability by the management or governing body of the entity.
Modern equivalent asset Assets that replicate what is in existence with the most cost‐effective asset performing the same level of service. It is the most cost efficient, currently available asset which will provide the same stream of services as the existing asset is capable of producing. It allows for technology changes and, improvements and efficiencies in production and installation techniques
Net present value (NPV) The value to the organisation of the cash flows associated with an asset, liability, activity or event calculated using a discount rate to reflect the time value of money. It is the net amount of discounted total cash inflows after deducting the value of the discounted total cash outflows arising from eg the continued use and subsequent disposal of the asset after deducting the value of the discounted total cash outflows.
Non‐revenue generating investments Investments for the provision of goods and services to sustain or improve services to the community that are not expected to generate any savings or revenue to the Council, eg. parks and playgrounds, footpaths, roads and bridges, libraries, etc.
Operations Regular activities to provide services such as public health, safety and amenity, eg street sweeping, grass mowing and street lighting.
Operating expenditure Recurrent expenditure, which is continuously required to provide a service. In common use the term typically includes, eg power, fuel, staff, plant equipment, on‐costs and overheads but excludes maintenance and depreciation. Maintenance and depreciation is on the other hand included in operating expenses.
Operating expense The gross outflow of economic benefits, being cash and non cash items, during the period arising in the course of ordinary activities of an entity when those outflows result in decreases in equity, other than decreases relating to distributions to equity participants.
Operating expenses Recurrent expenses continuously required to provide a service, including power, fuel, staff, plant equipment, maintenance, depreciation, on‐costs and overheads.
Operations, maintenance and renewal financing ratio Ratio of estimated budget to projected expenditure for operations, maintenance and renewal of assets over a defined time (eg 5, 10 and 15 years).

‐ 64 ‐
LISMORE CITY COUNCIL – PARKS & RECREATION ASSET MANAGEMENT PLAN
Operations, maintenance and renewal gap Difference between budgeted expenditures in a long term financial plan (or estimated future budgets in absence of a long term financial plan) and projected expenditures for operations, maintenance and renewal of assets to achieve/maintain specified service levels, totalled over a defined time (e.g. 5, 10 and 15 years).
Pavement management system (PMS) A systematic process for measuring and predicting the condition of road pavements and wearing surfaces over time and recommending corrective actions.
PMS Score A measure of condition of a road segment determined from a Pavement Management System.
Rate of annual asset consumption * The ratio of annual asset consumption relative to the depreciable amount of the assets. It measures the amount of the consumable parts of assets that are consumed in a period (depreciation) expressed as a percentage of the depreciable amount.
Rate of annual asset renewal * The ratio of asset renewal and replacement expenditure relative to depreciable amount for a period. It measures whether assets are being replaced at the rate they are wearing out with capital renewal expenditure expressed as a percentage of depreciable amount (capital renewal expenditure/DA).
Rate of annual asset upgrade/new * A measure of the rate at which assets are being upgraded and expanded per annum with capital upgrade/new expenditure expressed as a percentage of depreciable amount (capital upgrade/expansion expenditure/DA).
Recoverable amount The higher of an asset's fair value, less costs to sell and its value in use.
Recurrent expenditure Relatively small (immaterial) expenditure or that which has benefits expected to last less than 12 months. Recurrent expenditure includes operations and maintenance expenditure.
Recurrent funding Funding to pay for recurrent expenditure.
Rehabilitation See capital renewal expenditure definition above.
Remaining useful life The time remaining until an asset ceases to provide the required service level or economic usefulness. Age plus remaining useful life is useful life.
Renewal See capital renewal expenditure definition above.
Residual value The estimated amount that an entity would currently obtain from disposal of the asset, after deducting the estimated costs of disposal, if the asset were already of the age and in the condition expected at the end of its useful life.
Revenue generating investments Investments for the provision of goods and services to sustain or improve services to the community that are expected to generate some savings or revenue to offset operating costs, eg public halls and theatres, childcare centres, sporting and recreation facilities, tourist information centres, etc.

‐ 65 ‐
LISMORE CITY COUNCIL – PARKS & RECREATION ASSET MANAGEMENT PLAN
Risk management The application of a formal process to the range of possible values relating to key factors associated with a risk in order to determine the resultant ranges of outcomes and their probability of occurrence.
Section or segment A self‐contained part or piece of an infrastructure asset.
Service potential The total future service capacity of an asset. It is normally determined by reference to the operating capacity and economic life of an asset. A measure of service potential is used in the not‐for‐profit sector/public sector to value assets, particularly those not producing a cash flow.
Service potential remaining A measure of the future economic benefits remaining in assets. It may be expressed in dollar values (Fair Value) or as a percentage of total anticipated future economic benefits. It is also a measure of the percentage of the asset’s potential to provide services that is still available for use in providing services (Depreciated Replacement Cost/Depreciable Amount).
Specific Maintenance Replacement of higher value components/sub‐components of assets that is undertaken on a regular cycle including repainting, replacement of air conditioning equipment, etc. This work generally falls below the capital/ maintenance threshold and needs to be identified in a specific maintenance budget allocation.
Strategic Longer‐Term Plan A plan covering the term of office of councillors (4 years minimum) reflecting the needs of the community for the foreseeable future. It brings together the detailed requirements in the Council’s longer‐term plans such as the asset management plan and the long‐term financial plan. The plan is prepared in consultation with the community and details where the Council is at that point in time, where it wants to go, how it is going to get there, mechanisms for monitoring the achievement of the outcomes and how the plan will be resourced.
Sub‐component Smaller individual parts that make up a component part.
Useful life Either: (a) the period over which an asset is expected to be available for use by an entity, or (b) the number of production or similar units expected to be obtained from the asset by the entity. It is estimated or expected time between placing the asset into service and removing it from service, or the estimated period of time over which the future economic benefits embodied in a depreciable asset, are expected to be consumed by the Council.
Value in Use The present value of future cash flows expected to be derived from an asset or cash generating unit. It is deemed to be depreciated replacement cost (DRC) for those assets whose future economic benefits are not primarily dependent on the asset's ability to generate net cash inflows, where the entity would, if deprived of the asset, replace its remaining future economic benefits.
Source: IPWEA, 2009, Glossary
Additional and modified glossary items shown *