assets under management rs. 50,742.07 crore (as on may 31
TRANSCRIPT

Assets Under Management Rs. 50,742.07 Crore (As on May 31, 2007)

22

3
O v e r v i e w
Nilesh ShahChief Investment Officer
Fixed Income Market SnapshotImpact on Interest Rates
FACTORS Short Term Medium Term(1-3 Months) (3-6 Months)
Inflation NEUTRAL NEUTRAL
WPI-based inflation eased around the RBI's FY08 target rate of 5% mark to 5.06% ason May 19, 2007, due to a high base effect and fall in primary food articles' prices.These coupled with the impact of govt's fiscal and monetary measures (viz. duty cutsand interest rate hikes) seem to be weighing down inflation. The govt. reiterated itscommitment to bringing down inflation to 5%. It has not ruled out any further fiscaland monetary measures while it continues to monitor economic data.
Money Supply NEGATIVE NEGATIVE
M3 grew 20% YoY as on June 1, 2007, still higher than RBI's forecast of 17-17.5%. Thegovt admitted to the challenge posed by excessive foreign exchange inflows through ECB/FDI/FII route in managing money supply, while RBI confessed to limited open market interventionsin the view of rupee appreciation. Liquidity remained adequate due to limited MSS auctionsand forex interventions, resumption of government spending and inflows by way of couponpayments and bond redemptions. This caused the overnight borrowing rates to dip as lowas 0.50%. Advance tax outflows will flush out some liquidity in June, however, foreigncurrency inflows into some large IPOs could trigger RBI intervention injecting fresh liquidity intothe system.. In such a situation, further MSS issuances or a CRR hike is not ruled out.
Credit Demand NEGATIVE NEGATIVE
Non-food credit growth continued unabated at 27% YoY as on June 1, 2007, withthe credit-deposit ratio still high at 72%. Having said that, the incremental CD ratiodropped to 40% YoY, as opposed to 100% YoY during the same time last year. Thiscould be a signal of some moderation in credit growth. RBI would like to see thecredit growth moderate to 24-25% in FY08.
Government Borrowings NEUTRAL NEUTRAL
In comparison with the borrowing calendar for Q1FY08, scheduled governmentborrowings will decrease going forward. Though RBI has been issuing MSS lately,adding to the SLR supply, we expect to see a cut in SLR in the later part of the year tomake up for the demand-supply mismatch.
Foreign Exchange Market POSITIVE NEUTRAL
India's forex reserves were at a robust $205 bn as on May 25, 2007. Rupee continued tostrengthen to touch a high of Rs.40.20/$ mark during the month, on the back of largecapital inflows, despite USD's bounce-back vis-à-vis other major currencies. RBI's comfort hasbeen tested recently and unlike the previous month, RBI intervened in the currency marketsbuying dollars to support the level of 40.50.
RBI Policy NEGATIVE NEGATIVE
The central bank has maintained in its review of the monetary policy that liquiditymanagement would be a priority, to contain inflation. Market participants are henceanticipating RBI action by way of another hike in the CRR or increase the use of MSSfor sucking out excess cash and force a slowdown in credit growth. Issuing fresh MSSis an additional burden on the Government Fiscal kitty, whereas a CRR hike adds to theburden of the banking system. We expect the Central Bank's liquidity managementpolicy to strike a balance between the two measures.
Market Sentiment NEGATIVE NEUTRAL
10-year benchmark G-Sec yields softened due to a surge in liquidity and a decliningtrend in inflation, leading to a sentiment reversal. Reduction in MSS auctions alsoboosted market sentiment. However, cautiousness persisted due to apprehensionover CRR hike.
OUTLOOK
We expect RBI to watch economic data in order to assess how recent rate hikeshave influenced the credit growth, inflation and money supply growth over asustained period. The market seems to be divided on the likelihood of furtherCRR hike due to comfortable liquidity. Future rate hikes cannot be completelyruled out, considering an aggressive stance taken by RBI as regards inflation,although the timing may not be exactly predictable.
We expect interest rates to be range bound with upward bias in 1HFY08. Webelieve that fixed maturity products provide the best opportunity today interms of risk-reward ratio. We recommend investors to consider Fixed MaturityPlans (FMPs)/Interval Funds in their debt portfolio.
FACTORSFundamentalsGrowth in India's Index of Industrial Production (IIP) beat expectations by showing a rise of12.9% YoY in March (8.9%YoY for Mar'06), the aggregate growth for FY07 amounting to11.3% (8.2% in FY06), boosted by double-digit growth in 10 out of 17 industry groups in FY07.The core industries grew 10% YoY in March (7.1% in Mar'06), with FY07 growth at 8.6%(6.2% in FY06) due to an increase in steel and refining output, while cement productionremained subdued. These macro numbers put together underline the strong fundamentals.Due to revision in the numbers for the earlier quarters, full year GDP for FY 07 grew by 9.4%p.a. , exceeding the projections of 9.2% made earlier surpassing all previous annual growthrates, except for 1988-89 when it expanded by 10.5%. Manufacturing (12.3%) and services(11.2%) drove the surge, while farm growth actually slackened, as compared to FY06.Economic growth, however, slowed down to 9.1% in the fourth quarter of FY '07 against 10%in the same quarter of the previous fiscal showing signs of moderation as a result of tighteningaction taken by the Central Bank. India's export growth was encouraging in Apr'07 (23% YoY)despite the appreciation in rupee. Higher imports (41%YoY), reflecting greater investment andindustrial activity, caused the trade deficit to widen to $7bn.Technicals
Equity Market Snapshot
Market SentimentsThe benchmark index Sensex rallied to gain 4.85% for the month on account of strongglobal markets and sustained FII inflows as concerns regarding sustainability of growthmomentum and RBI's further tightening measures were alleviated due to robust economicdata and declining trend in inflation. A reversal of sentiment was apparent after decentearnings performance in Q4FY07 and optimistic outlook on various M&A announcements.However, volatility persisted due to cautiousness at higher index levels. IT stocks continuedto underperform due to the rupee appreciation, while banking sector spurted due to betterthan expected SBI results, passing of SBI (Subsidiary Bank Laws) Amendment Bill 2006 andRBI guidelines on trading of credit default swaps. Metals underperformed due to a fall incopper prices on LME. The market sentiment was cautious with the announcement of twinlarge IPOs of DLF and ICICI Bank, expected to raise in approx. Rs.30000 crore. Both FIIs andMFs remain optimistic on expectation of strong corporate performance and underlyingstrength in the Indian economy. FIIs followed up their $1.4bn purchase of Indian equity inApril '07 with another $1.1bn buying in May '07.
Global EventsUS treasuries fell in response to economic reports and Fed's reiteration of risks to inflationsuggesting that it could be on hold for longer than was initially anticipated. Even thoughQ1CY08 GDP was revised downwards to 0.6% as against 1.3% earlier, other data signaledthat US economy could be rebounding without fueling inflation. This was in line with FOMCopinion that growth could pick up in the coming quarter. In a bid to prevent economicoverheating, PBoC hiked lending rate by 18bps and deposit rate by 27 bps to 6.57% and3.06% resp. Reserve requirement was hiked by another 50bps to 11.5% and Yuan tradingband was widened from 0.3% to 0.5%. Market experts and Chinese govt have beenwarning of a looming correction in the Chinese markets, due to steep valuations (ShanghaiComposite trades at 42x). Chinese market decline was triggered by the announcement oftripling of stamp duty on securities trades, aimed at deterring investors in view of stockmarkets' overheating. Crude continued to remain rangebound due to worries over enoughgasoline supplies for the summer. BoE raised interest rate to 5.5%, amid strong economicgrowth. ECB kept the refinancing rate at 3.75 percent, as it pledged "strong vigilance'',flagging a rate move in June.
OUTLOOKThe bull run in the past four years has captured the undervaluation of equities, whichhas resulted in exponential gains during this period. There have been apprehensionsabout valuations running ahead of fundamentals, but that does not mean that theupcycle has fizzled out. With markets fairly valued currently, investors need tomoderate their expectations. Long term, we believe the uptrend may continue giventhe prospects of corporates delivering above average earnings. Hence, the premiumvaluations are not completely out of place. With the results season over, the marketmay be rangebound in the near term as it seeks to consolidate its gains, assess theimpact of interest rate hikes on future profit growth. Fresh supply of Rs. 30000 croresin the equity markets through the IPOs of DLF and ICICI Bank could dampen themarket as it will take time to absorb this huge supply. The unfolding of the monsoonscenario could also impact the market momentum. Having said that, analysts reckonthat with the inflation coming off to around 5% levels, the pressure on RBI seems tohave eased considerably. The market has so far shrugged off the fears of the rippleeffect of Chinese market slump in the region. However, considering the extent of
Investments by Institutions Apr-07 May-07in cash market (Rs. Crs.)FIIs (Net Purchases / Sales) 5533 4572MFs (Net Purchases / Sales) 1034 1891Avg Daily Open Interest(Rs. Cr.)
Index Futures 14112 13919
Stock Futures 22309 26445
Index Options 12345 12862
Stock Options 1788 2937
Total 50554 56163
Valuation Ratios Mar-07 Apr-07P/E ratio- Sensex 19.48 21.05P/E ratio- Nifty 20.71 20.41Price/Book Value Ratio-Sensex 5.33 4.88Price/Book Value Ratio-Nifty 5.09 5.59Dividend Yield-Sensex 1.15 1.13Dividend Yield-Nifty 1.17 1.10
Avg Daily Volumes (Rs. Cr.)
CASH SegmentBSE 3796 4536NSE 8428 9885Total 12224 14421Derivative SegmentNSE 30814 34049Avg Advance Decline RatioBSE 1.56 1.08NSE 1.48 1
Indices Movement % change % changeFeb 06-Mar06 Mar 07-Apr 07
Sensex 6.12 4.85Nifty 6.96 5.09BSE Healthcare 1.48 3.75BSE Auto 2.67 0.26BSE Consumer Durables 3.25 13.81BSE FMCG 3.57 5.89Bankex 5.21 10.52BSE Teck Index 5.55 -0.51BSE PSU 8.14 5.25BSE Capital Goods 8.87 12.89BSE Oil & Gas 11.15 9.26BSE Metals 15.88 5.80BSE Mid Cap 7.65 7.35BSE Small Cap 8.08 5.99
India remains a compelling investment proposition....
The Market

4
MARKET CHEAP ATTRACTIVE FAIR
FAIR
VALUE
PLUS
STRETCHED BUBBLE
Exit Neutral Neutral -
5%-10%
EQUITY
ALLOCATION
Under Invested
70%-80% 55%-65% 50% 35%-45% 15%-25%
Over Invested Neutral +
Suggested Equity Allocation (Assuming 50% equity allocation as neutral)
ICICI Prudential Fusion Fund-Series IIDiversified Fund (Close - Ended)
Snapshot:Fund Manager : Anand ShahIndicative Investment Horizon: 3 yrs and moreInception date: 31-03-2007Fund Size: Rs. 1,125.69 crores***NAV (As on 30-May-2007):
Growth option : Rs. 10.78Dividend option : Rs. 10.78
**Expense Ratio (2 Months avg. Apr 07-May 07):Retail option : 2.03%Institutional option-I : 1.21%
**This is a close approximation of the number.
*** NAV is declared on a weekly basis.
Style Box
Style Value Blend Growth Size
Large
Mid
Small
Figures as on 31-May-2007
WHY SHOULD ONE INVEST?Exploit the long-term investment potential
in small & mid-cap segment
PortfolioCompany/Issuer Mkt Value (Rs. Lakh) % to NAVAuto Ancillaries 3,718.43 3.31%Kesoram Industries Ltd 2,553.14 2.27%Exide Industries Ltd 1,165.29 1.04%Banks 9,032.71 8.03%
• Punjab National Bank Ltd 3,778.81 3.36%HDFC Bank Ltd 2,869.00 2.55%Federal Bank Ltd 1,465.75 1.30%ICICI Bank Ltd 919.15 0.82%Cement 3,217.00 2.86%
• Birla Corporation Ltd 3,217.00 2.86%Construction 3,162.55 2.81%Jai Prakash Associates Ltd 1,711.46 1.52%Nagarjuna Construction Company Ltd 1,451.09 1.29%Consumer Non-Durable 436.92 0.39%Pidilite Industries Ltd 436.92 0.39%Ferrous Metals 7,943.92 7.06%
• Steel Authority of India Ltd 3,507.50 3.12%Usha Martin Ltd 2,846.44 2.53%Ratnamani Metals & Tubes Ltd 1,589.98 1.41%Fertilizers 1,485.00 1.32%Coromandel Fertilisers Ltd 1,485.00 1.32%Finance 2,337.00 2.08%Industrial Development Finance Corporation Ltd 2,337.00 2.08%Industrial Products 5,549.20 4.93%AIA Engineering Ltd 3,062.90 2.72%Kirloskar Oil Engines Ltd 1,373.25 1.22%Esab India Ltd 1,113.05 0.99%Media & Entertainment 11,935.83 10.61%
• Deccan Chronicle Holdings Ltd 3,980.50 3.54%• Zee Entertainment Enterprises Ltd 3,612.48 3.21%
HT Media Ltd 1,767.93 1.57%Television Eighteen India Ltd. 1,337.71 1.19%Entertainment Network India Ltd 1,237.21 1.10%Non-Ferrous Metals 3,265.80 2.90%
• Sterlite Industries (India) Ltd 3,265.80 2.90%Oil 2,867.00 2.55%Cairn India Ltd 2,867.00 2.55%Petroleum Products 3,517.60 3.12%
• Reliance Industries Ltd 3,517.60 3.12%Pharmaceuticals 2,345.66 2.08%Dishman Pharmaceuticals & Chemicals Ltd 2,345.66 2.08%Retailing 2,370.50 2.11%Pantaloon Retail (India) Ltd 2,370.50 2.11%Software 11,949.62 10.62%
• Sasken Communications Technologies Ltd 3,687.98 3.28%• Tata Consultancy Services Ltd 3,081.29 2.74%
Mphasis BFL Software Ltd 2,636.65 2.34%Infosys Technologies Ltd 1,923.50 1.71%3i Infotech Ltd 620.20 0.55%Telecom Services 3,397.00 3.02%
• Bharti Airtel Ltd 3,397.00 3.02%Textiles - Cotton 1,412.62 1.25%Vardhaman Textiles Ltd 1,412.62 1.25%Textiles - Products 1,401.50 1.25%Aditya Birla Nuvo Ltd 1,401.50 1.25%CPs, CDs and Term Deposits 13,268.13 11.79%ICICI Bank Ltd 7,811.00 6.94%Tata Power Company Ltd 3,687.92 3.28%Kotak Mahindra Bank Ltd 982.85 0.87%UTI Bank Ltd 786.36 0.70%Cash, Call, CBLO & Reverse Repo 12,138.27 10.78%Other Current Assets 5,816.61 5.13%
Total Net Assets 112,568.87 100.00%• Top Ten Holdings
Valuation levels of the Sensex based on FY08 earnings estimate of Rs.830
Quantitative Indicators:
Average P/E : 19Average P/BV : 4.04Average Dividend Yield: 0.7Annual Portfolio Turnover Ratio: 0.80 timesPortfolio turnover has been computed as the ratio of the higher value of average purchase and averagesales, to the average net assets in the past one year (since inception for schemes that have notcompleted a year). The figures are not netted for derivative transactions.
740084009400
104001140012400134001440015400
2-Ja
n-06
21-J
an-0
69-
Feb-
0628
-Feb
-06
19-M
ar-0
67-
Apr-
0626
-Apr
-06
15-M
ay-0
63-
Jun-
0622
-Jun
-06
11-J
ul-0
630
-Jul
-06
18-A
ug-0
66-
Sep-
0625
-Sep
-06
14-O
ct-0
62-
Nov
-06
21-N
ov-0
610
-Dec
-06
29-D
ec-0
617
-Jan
-07
5-Fe
b-07
24-F
eb-0
715
-Mar
-07
3-Ap
r-07
22-A
pr-0
711
-May
-07
30-M
ay-0
7
CHEAP 9X -10X
ATTRACTIVE 11X -12X
FAIR 13X -16X
FAIR VALUE PLUS 17X -18X
STRETCHED 19X -20X
integration of global markets, volatility on account of unforeseen global eventscannot be ruled out. Therefore our recommendation to investors is as follows;• In a fair value market, maintain a neutral allocation towards equities.• Do not try to time the market, as the high short-term volatility cannot be ruled out.• Asset allocation and Systematic Investment Plans are the best way to safeguard against
volatility. They ensure optimal returns and not the maximum return in volatile markets.
• Investors should look at a mix of large and mid cap funds for 3-5 years horizon onsystematic investment basis.
Asset Allocation GuideThis asset allocation guide helps you to determine the suggested equity exposure atdifferent valuations levels based on the Sensex.
Performance Record *- Growth Option
*Returns < 1Year : Absolute, > = 1Year : CAGR. Benchmark is S&P CNX NftyIndex. For computation of returns the allotment NAV has been taken asRs. 10.00. Past performance may or may not be sustained in future.
*Pertains to the equity investments only.
Sector Allocation*
7.80%
11.20%
0.00%2.00%4.00%6.00%8.00%
10.00%12.00%14.00%16.00%18.00%
Since Inception
Fusion Fund - Series II S&P CNX Nifty
10.62%10.61%
8.03%7.06%
4.93%3.31%
3.12%3.02%2.90%2.86%2.81%
2.55%2.11%2.08%2.08%
1.32%1.25%1.25%
0.39%
0.00% 4.00% 8.00% 12.00%
SoftwareMedia & Entertainment
BanksFerrous Metals
Industrial ProductsAuto Ancillaries
Petroleum ProductsTelecom Services
Non-Ferrous MetalsCement
ConstructionOil
RetailingPharmaceuticals
FinanceFertilizers
Textiles - ProductsTextiles - Cotton
Consumer Non-Durable

5
SIP Returns: As on 31-May-2007
Period SIP Start Date Total Amount Total No. Market Value SIPInvested of Units Returns
1 Year SIP 30-Jun-06 12,000.00 202.74 14,185.47 42.43%3 Year SIP 30-Jun-04 36,000.00 1,028.66 71,974.11 53.49%Since Inception 31-Oct-02 56,000.00 2,457.97 171,981.21 52.38%
Fund Manager's Comment
The fund maintained an equity exposure at 84% during the month, indicating a cautious stance. Thefund has taken fresh exposure to Hotels. The fund booked profits in Banks (SBI), Industrial Capital Goods(BHEL), while exposure to Pharmaceuticals (Dr. Reddy, Cipla, Sun Pharma) was enhanced.
Past performance may or may not be sustained in future. Assume Rs. 1000 invested every month. Thehigh level of returns come from the sharp appreciation in market, in the year 2002, 2004 & 2006.
Quantitative Indicators:Average P/E : 18Average P/BV : 3.98Average Dividend Yield : 1.29Annual Portfolio Turnover Ratio : 2.52 times
PortfolioCompany/Issuer Mkt Value (Rs. Lakh) % to NAVSnapshot:
Fund Manager : Sankaran NarenIndicative Investment Horizon: 3 yrs & moreInception date: 31-10-2002Fund Size: Rs. 2,341.46 croresNAV (As on 31-May-2007):
Growth option : Rs. 69.9688Dividend option : Rs. 21.8855
**Expense Ratio (6 Months avg. Dec 06-May 07):Retail option : 1.90%Institutional option-I : 1.00%
**This is a close approximation of the number.
WHY SHOULD ONE INVEST?Medium term investment of funds for capital appreciation
by managing cash and equity portfolio
Auto 5,374.06 2.30%Mahindra & Mahindra Ltd 3,787.25 1.62%Maruti Udyog Ltd 1,586.81 0.68%Auto Ancillaries 1,382.54 0.59%Sundaram Clayton Ltd 1,382.54 0.59%Banks 24,473.73 10.45%
• ICICI Bank Ltd 7,915.26 3.38%• HDFC Bank Ltd 5,738.00 2.45%
Federal Bank Ltd 5,599.83 2.39%State Bank of India Ltd 3,458.58 1.48%Punjab National Bank Ltd 1,762.06 0.75%Cement 4,930.05 2.11%Orient Paper & Industries Ltd 2,410.70 1.03%Grasim Industries Ltd 2,054.85 0.88%Hyderabad Industries Ltd 464.50 0.20%Construction 736.90 0.31%Patel Engineering Ltd 736.90 0.31%Consumer Non-Durable 9,899.03 4.22%
• ITC Limited 7,761.11 3.31%E.I.D. Parry (India) Ltd 2,137.92 0.91%Ferrous Metals 16,162.57 6.90%
• Tata Steel Ltd 10,114.40 4.32%Steel Authority of India Ltd 4,662.92 1.99%Mukand Ltd 1,385.25 0.59%Fertilizers 1,856.25 0.79%Coromandel Fertilisers Ltd 1,856.25 0.79%Hotels 2,347.04 1.00%Indian Hotels Company Ltd 2,347.04 1.00%Industrial Capital Goods 3,349.32 1.43%Texmaco Ltd 3,349.32 1.43%Industrial Products 12,330.55 5.27%Jain Irrigation Systems Ltd 3,862.40 1.65%Greaves Cotton Limited 3,321.25 1.42%AIA Engineering Ltd 3,062.90 1.31%Sterlite Optical Technologies Ltd 2,084.00 0.89%Media & Entertainment 14,344.75 6.13%
• Deccan Chronicle Holdings Ltd 11,208.25 4.79%Zee Entertainment Enterprises Ltd 3,136.50 1.34%Non-Ferrous Metals 2,225.66 0.95%Sterlite Industries (India) Ltd 2,225.66 0.95%Oil 14,441.17 6.17%
• Oil & Natural Gas Company Ltd 14,441.17 6.17%Petroleum Products 17,590.64 7.51%
• Reliance Industries Ltd 17,590.64 7.51%Pharmaceuticals 12,327.98 5.26%Cadila Healthcare Ltd 3,724.60 1.59%Alembic Ltd 2,880.00 1.23%Novartis India Ltd 2,165.10 0.92%Dr. Reddy’s Laboratories Ltd 1,663.18 0.71%Cipla Ltd 1,559.12 0.67%Sun Pharmaceuticals Limited 335.98 0.14%Power 7,652.45 3.27%
• National Thermal Power Corporation Ltd 7,652.45 3.27%Software 37,103.72 15.84%
• Tata Consultancy Services Ltd 16,420.27 7.01%• Infosys Technologies Ltd 15,388.00 6.57%
Subex Azure Ltd 2,723.85 1.16%Mastek Ltd 1,289.64 0.55%HCL Technologies Ltd 1,281.96 0.55%Telecom Services 3,104.01 1.33%Bharti Airtel Ltd 3,104.01 1.33%Transportation 5,138.21 2.19%Containers Corporation of India Ltd 5,138.21 2.19%CPs, CDs and Term Deposits 30,192.59 12.90%ICICI Bank Ltd 17,761.00 7.59%Kotak Mahindra Bank Ltd 5,852.88 2.50%UTI Bank Ltd 4,816.45 2.06%Allahabad Bank Ltd 850.00 0.36%GE Capital Services India Ltd 812.26 0.35%UTI Bank Ltd 100.00 0.04%Cash, Call, CBLO & Reverse Repo 12,473.37 5.33%Other Current Assets (5,290.16) -2.25%Total Net Assets 234,146.43 100.00%
• Top Ten Holdings
Performance Record *- Cumulative Option
Rs. 10000 invested at inception: Dynamic Plan Vs S&P CNX Nifty
CAGR – Dynamic Plan: 52.87%; Benchmark: 38.94%Past performance may or may not be sustained in future.
Sector Allocation*
Style Box
*Returns < 1Year : Absolute, > = 1Year : CAGR. Benchmark is S&P CNX Nifty.For computation of returns the allotment NAV has been taken asRs. 10.00. Past performance may or may not be sustained in future.
Figures as on 31-May-2007
*Pertains to the equity investments only.
Portfolio turnover has been computed as the ratio of the higher value of average purchase and averagesales, to the average net assets in the past one year (since inception for schemes that have notcompleted a year). The figures are not netted for derivative transactions.^ Risk-free rate based on the last 3 month T-Bill cut-off.
Std Dev : 6.54%Sharpe Ratio^ : 0.56Portfolio Beta : 1.00R squared : 0.73
ICICI Prudential Dynamic PlanDiversified Fund
12.32%
38.75%
61.06%52.87%
8.63%
39.88% 42.53% 38.94%
0.00%10.00%20.00%30.00%40.00%50.00%60.00%70.00%
Last6 Months
Last1 years
Last3 years
SinceInception
Dynamic Plan S&P CNX Nifty
Rs 69968.80
Rs 45152.41
9,665
19,665
29,665
39,665
49,665
59,665
69,665
79,665
Oct-0
2Ja
n-03
Apr-0
3Ju
l-03
Oct-0
3Ja
n-04
Apr-0
4Ju
l-04
Oct-0
4Ja
n-05
Apr-0
5Ju
l-05
Oct-0
5Ja
n-06
Apr-0
6Ju
l-06
Oct-0
6Ja
n-07
Apr-0
7
Dynamic Plan S&P CNX Nifty
15.84%
10.45%
7.51%6.90%
6.17%
6.13%
5.27%
5.26%
4.22%
3.27%2.30%
2.19%
2.11%
1.43%
1.33%
1.00%0.95%
0.79%
0.59%
0.31%
0.00% 5.00% 10.00% 15.00% 20.00%
Software
Banks
Petroleum ProductsFerrous Metals
Oil
Media & Entertainment
Industrial Products
Pharmaceuticals
Consumer Non-Durable
PowerAuto
Transportation
Cement
Industrial Capital
Telecom Services
Hotels
Non-Ferrous MetalsFertilizers
Auto Ancillaries
Construction
6
SIP Returns: As on 31-May-2007
Period SIP Start Date Total Amount Total No. Market Value SIPInvested of Units Returns
1 Year SIP 30-Jun-06 12,000.00 159.36 14,214.91 43.04%3 Year SIP 30-Jun-04 36,000.00 755.56 67,395.95 47.86%5 Year SIP 28-Jun-02 60,000.00 2,196.82 195,956.34 50.94%Since Inception 1-Oct-94 153,000.00 11,992.11 1,069,696.21 27.94%
Fund Manager's Comment
The fund maintained an equity exposure of 94% during the month including~2.75% exposure to Nifty Futures. The fund has reduced exposure to FerrousMetals (Usha Martin) by booking profits. Exposure to Banks (HDFC Bank), Oil(Cairn India) and Petroleum Product has increased.
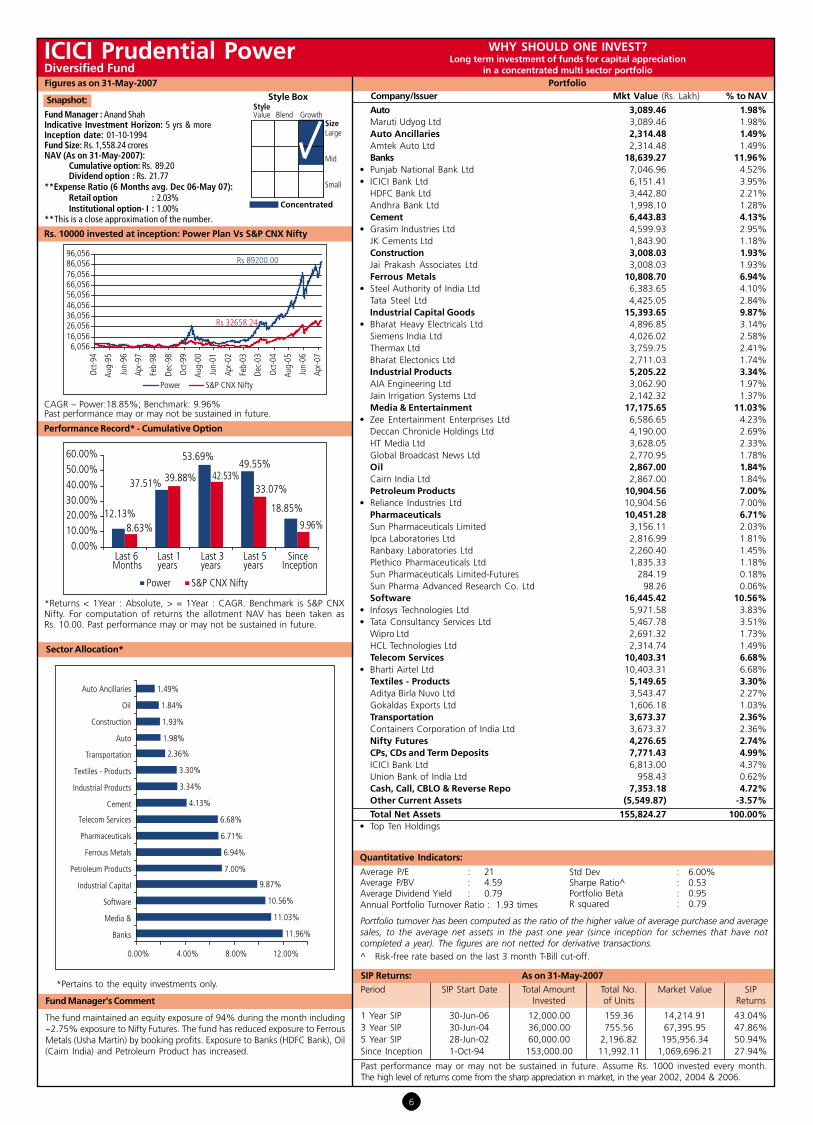
ICICI Prudential PowerDiversified Fund
Snapshot:
Fund Manager : Anand ShahIndicative Investment Horizon: 5 yrs & moreInception date: 01-10-1994Fund Size: Rs. 1,558.24 croresNAV (As on 31-May-2007):
Cumulative option: Rs. 89.20Dividend option : Rs. 21.77
**Expense Ratio (6 Months avg. Dec 06-May 07):Retail option : 2.03%Institutional option- I : 1.00%
**This is a close approximation of the number.
WHY SHOULD ONE INVEST?Long term investment of funds for capital appreciation
in a concentrated multi sector portfolio
Performance Record* - Cumulative Option
Rs. 10000 invested at inception: Power Plan Vs S&P CNX Nifty
CAGR – Power:18.85%; Benchmark: 9.96%Past performance may or may not be sustained in future.
Sector Allocation*
*Returns < 1Year : Absolute, > = 1Year : CAGR. Benchmark is S&P CNXNifty. For computation of returns the allotment NAV has been taken asRs. 10.00. Past performance may or may not be sustained in future.
Quantitative Indicators:
Average P/E : 21Average P/BV : 4.59Average Dividend Yield : 0.79Annual Portfolio Turnover Ratio : 1.93 times
PortfolioCompany/Issuer Mkt Value (Rs. Lakh) % to NAVStyle Box
Figures as on 31-May-2007
*Pertains to the equity investments only.
Portfolio turnover has been computed as the ratio of the higher value of average purchase and averagesales, to the average net assets in the past one year (since inception for schemes that have notcompleted a year). The figures are not netted for derivative transactions.^ Risk-free rate based on the last 3 month T-Bill cut-off.
Auto 3,089.46 1.98%Maruti Udyog Ltd 3,089.46 1.98%Auto Ancillaries 2,314.48 1.49%Amtek Auto Ltd 2,314.48 1.49%Banks 18,639.27 11.96%
• Punjab National Bank Ltd 7,046.96 4.52%• ICICI Bank Ltd 6,151.41 3.95%
HDFC Bank Ltd 3,442.80 2.21%Andhra Bank Ltd 1,998.10 1.28%Cement 6,443.83 4.13%
• Grasim Industries Ltd 4,599.93 2.95%JK Cements Ltd 1,843.90 1.18%Construction 3,008.03 1.93%Jai Prakash Associates Ltd 3,008.03 1.93%Ferrous Metals 10,808.70 6.94%
• Steel Authority of India Ltd 6,383.65 4.10%Tata Steel Ltd 4,425.05 2.84%Industrial Capital Goods 15,393.65 9.87%
• Bharat Heavy Electricals Ltd 4,896.85 3.14%Siemens India Ltd 4,026.02 2.58%Thermax Ltd 3,759.75 2.41%Bharat Electonics Ltd 2,711.03 1.74%Industrial Products 5,205.22 3.34%AIA Engineering Ltd 3,062.90 1.97%Jain Irrigation Systems Ltd 2,142.32 1.37%Media & Entertainment 17,175.65 11.03%
• Zee Entertainment Enterprises Ltd 6,586.65 4.23%Deccan Chronicle Holdings Ltd 4,190.00 2.69%HT Media Ltd 3,628.05 2.33%Global Broadcast News Ltd 2,770.95 1.78%Oil 2,867.00 1.84%Cairn India Ltd 2,867.00 1.84%Petroleum Products 10,904.56 7.00%
• Reliance Industries Ltd 10,904.56 7.00%Pharmaceuticals 10,451.28 6.71%Sun Pharmaceuticals Limited 3,156.11 2.03%Ipca Laboratories Ltd 2,816.99 1.81%Ranbaxy Laboratories Ltd 2,260.40 1.45%Plethico Pharmaceuticals Ltd 1,835.33 1.18%Sun Pharmaceuticals Limited-Futures 284.19 0.18%Sun Pharma Advanced Research Co. Ltd 98.26 0.06%Software 16,445.42 10.56%
• Infosys Technologies Ltd 5,971.58 3.83%• Tata Consultancy Services Ltd 5,467.78 3.51%
Wipro Ltd 2,691.32 1.73%HCL Technologies Ltd 2,314.74 1.49%Telecom Services 10,403.31 6.68%
• Bharti Airtel Ltd 10,403.31 6.68%Textiles - Products 5,149.65 3.30%Aditya Birla Nuvo Ltd 3,543.47 2.27%Gokaldas Exports Ltd 1,606.18 1.03%Transportation 3,673.37 2.36%Containers Corporation of India Ltd 3,673.37 2.36%Nifty Futures 4,276.65 2.74%CPs, CDs and Term Deposits 7,771.43 4.99%ICICI Bank Ltd 6,813.00 4.37%Union Bank of India Ltd 958.43 0.62%Cash, Call, CBLO & Reverse Repo 7,353.18 4.72%Other Current Assets (5,549.87) -3.57%
Total Net Assets 155,824.27 100.00%• Top Ten Holdings
Std Dev : 6.00%Sharpe Ratio^ : 0.53Portfolio Beta : 0.95R squared : 0.79
Past performance may or may not be sustained in future. Assume Rs. 1000 invested every month.The high level of returns come from the sharp appreciation in market, in the year 2002, 2004 & 2006.
12.13%
37.51%
53.69%49.55%
18.85%
8.63%
39.88% 42.53%33.07%
9.96%
0.00%10.00%20.00%30.00%40.00%50.00%60.00%
Last 6Months
Last 1years
Last 3years
Last 5years
SinceInception
Power S&P CNX Nifty
Rs 89200.00
Rs 32658.24
6,05616,05626,05636,05646,05656,05666,05676,05686,05696,056
Oct
-94
Aug-
95
Jun-
96
Apr-9
7
Feb-
98
Dec-
98
Oct
-99
Aug-
00
Jun-
01
Apr-0
2
Feb-
03
Dec-
03
Oct
-04
Aug-
05
Jun-
06
Apr-0
7
Power S&P CNX Nifty
11.96%
11.03%
10.56%
9.87%
7.00%
6.94%
6.71%
6.68%
4.13%
3.34%
3.30%
2.36%
1.98%
1.93%
1.84%
1.49%
0.00% 4.00% 8.00% 12.00%
Banks
Media &
Software
Industrial Capital
Petroleum Products
Ferrous Metals
Pharmaceuticals
Telecom Services
Cement
Industrial Products
Textiles - Products
Transportation
Auto
Construction
Oil
Auto Ancillaries

7
Fund Manager’s Comment
The fund maintained an average equity exposure of 90% during the month, including ~1.35% exposureto Nifty Futures, indicating a cautious stance. The fund booked some profits in Cement (Century) andPaper (TN Newsprint). Weightage of Ferrous Metals has increased due to increase in exposure in KalyaniSteels and fresh position in Welspun.
Sector Allocation*
*Pertains to the equity investments only.
Performance Record *- Growth Option
*Returns < 1Year : Absolute, > 1Year : CAGR. Benchmark is Nifty Junior. Forcomputation of returns the allotment NAV has been taken asRs. 10.00. Past performance may or may not be sustained in future.
SIP Returns: As on 31-May-2007
Period SIP Start Date Total Amount Total No. Market Value SIPInvested of Units Returns
1 Year SIP 30-Jun-06 12,000.00 468.79 14,396.54 46.80%Since Inception 28-Oct-04 33,000.00 1,886.94 57,947.93 47.42%
Quantitative Indicators:
Average P/E : 18Average P/BV : 3.44Average Dividend Yield : 0.74Annual Portfolio Turnover Ratio : 0.76 times
Portfolio turnover has been computed as the ratio of the higher value ofaverage purchase and average sales, to the average net assets in the pastone year (since inception for schemes that have not completed a year). Thefigures are not netted for derivative transactions.
^ Risk-free rate based on the last 3 month T-Bill cut-off.
Portfolio
WHY SHOULD ONE INVEST?Long term investment of funds for
capital appreciation on a mid-cap portfolio
Company/Issuer Mkt Value (Rs. Lakh) % to NAVStyle BoxFigures as on 31-May-2007
ICICI Prudential Emerging S.T.A.R. FundDiversified Fund
Auto Ancillaries 8,977.41 8.05%Phillips Carbon Black Ltd 2,610.86 2.34%Amtek Auto Ltd 2,519.62 2.26%Apollo Tyres Ltd 1,936.71 1.74%Bosch Chassis Systems India Ltd 1,910.22 1.71%Banks 5,966.48 5.35%Bank of Baroda Ltd 2,610.64 2.34%Union Bank of India Ltd 2,001.62 1.80%Andhra Bank Ltd 1,354.22 1.21%Cement 5,653.92 5.07%Birla Corporation Ltd 2,565.88 2.30%India Cements Ltd 1,392.69 1.25%Ramco Industries Ltd 989.60 0.89%Orient Paper & Industries Ltd 705.75 0.63%Chemicals 1,880.55 1.69%Beck India Ltd 965.91 0.87%Vivimed Labs Ltd 914.64 0.82%Construction 3,909.32 3.51%
• Patel Engineering Ltd 2,866.19 2.57%Nagarjuna Construction Company Ltd 1,043.13 0.94%Consumer Durables 3,708.23 3.32%Lloyd Electric & Engineering Ltd 2,044.33 1.83%Mirza International Ltd 1,663.90 1.49%Ferrous Metals 4,610.90 4.14%Mukand Ltd 1,884.12 1.69%Kalyani Steels Ltd 1,445.15 1.30%Welspun Gujarat Stahl Roh Ltd 1,072.20 0.96%Kamdhenu Ispat Ltd 209.43 0.19%Finance 3,595.15 3.23%
• India Infoline Ltd 3,595.15 3.23%Industrial Capital Goods 7,737.84 6.95%
• Aban Lloyd Chiles Offshore Ltd 2,751.57 2.47%RPG Transmission Ltd 2,338.49 2.10%TRF Ltd 1,938.07 1.74%Stone India Ltd 709.71 0.64%Industrial Products 15,822.37 14.19%
• Sintex Industries Ltd 3,333.51 2.99%• AIA Engineering Ltd 2,944.30 2.64%• Sterlite Optical Technologies Ltd 2,734.21 2.45%
Finolex Cables Ltd 2,595.60 2.33%Cummins India Ltd 2,107.53 1.89%Graphite India Ltd 2,107.22 1.89%Media & Entertainment 10,256.01 9.20%
• Deccan Chronicle Holdings Ltd 7,643.59 6.86%Jagran Prakashan Pvt Ltd 1,428.62 1.28%Prime Focus Ltd 1,183.80 1.06%Pharmaceuticals 2,199.21 1.97%Dishman Pharmaceuticals & Chemicals Ltd 2,199.21 1.97%Power 1,606.76 1.44%Webel SL Energy Ltd 1,606.76 1.44%Software 18,227.34 16.35%
• Nucleus Software Exports Ltd 4,069.26 3.65%• Subex Azure Ltd 3,476.09 3.12%• 3i Infotech Ltd 2,753.42 2.47%
Geodesic Information Systems Ltd 2,309.26 2.07%Megasoft Ltd 1,976.80 1.77%Mphasis BFL Software Ltd 1,903.73 1.71%Tech Mahindra Ltd 1,738.78 1.56%Textiles - Products 3,956.58 3.55%Provogue (India) Ltd 1,886.01 1.69%Gokaldas Exports Ltd 1,244.37 1.12%Kewal Kiran Clothing Ltd 826.20 0.74%Transportation 1,163.49 1.04%All Cargo Global Logistics Ltd 1,163.49 1.04%Nifty Futures 1,488.27 1.34%CPs, CDs and Term Deposits 5,017.08 4.50%ICICI Bank Ltd 2,126.00 1.91%Tata Power Company Ltd 1,229.31 1.10%ABN Amro Bank Ltd 476.82 0.43%Kotak Mahindra Bank Ltd 429.65 0.39%UTI Securities Ltd 405.30 0.36%UTI Bank Ltd 350.00 0.31%Cash, Call, CBLO & Reverse Repo 8,432.08 7.56%Other Current Assets (2,744.21) -2.45%Total Net Assets 111,464.78 100.00%
• Top Ten Holdings
Snapshot:Fund Manager : Deven SangoiIndicative Investment Horizon: 3 years & moreInception date: 28-10-2004Fund Size: Rs. 1,114.65 croresNAV (As on 31-May-2007):
Growth option : Rs. 30.71Dividend option : Rs. 22.38
**Expense Ratio (6 Months avg. Dec 06-May 07):Retail option : 2.06%Institutional option-I : 1.00%
**This is a close approximation of the number.
Rs. 10000 invested at inception: Emerging S.T.A.R Fund Vs S&P CNX Nifty
CAGR – Emerging S.T.A.R. Fund : 54.24%; Benchmark : 37.95%Past performance may or may not be sustained in future.
Past performance may or may not be sustained in future. Assume Rs. 1000 invested every month.The high level of returns come from the sharp appreciation in market, in the year 2004 & 2006.
Std Dev : 7.64%Sharpe Ratio^ : 0.42Portfolio Beta : 0.94R squared : 0.74
12.99%
31.80%
54.24%
15.15%
37.67% 37.95%
0.00%
10.00%
20.00%
30.00%
40.00%
50.00%
60.00%
Last 6 Months Last 1 years Since Inception
Emerging S.T.A.R. Fund NIFTY Junior Index
Rs 30710.00
Rs 23003.079,933
14,933
19,933
24,933
29,933
34,933
Oct
-04
Dec-
04
Feb-
05
Apr-0
5
Jun-
05
Aug-
05
Oct
-05
Dec-
05
Feb-
06
Apr-0
6
Jun-
06
Aug-
06
Oct
-06
Dec-
06
Feb-
07
Apr-0
7
Emerging S.T.A.R. Fund NIFTY Junior Index
16.35%14.19%
9.20%8.05%
6.95%5.35%
5.07%
4.14%3.55%
3.51%3.32%
3.23%1.97%
1.69%1.44%
1.04%
0.00% 5.00% 10.00% 15.00% 20.00%
Software
Industrial ProductsMedia & Entertainment
Auto Ancillaries
Industrial Capital GoodsBanks
CementFerrous Metals
Textiles - ProductsConstruction
Consumer DurablesFinance
Pharmaceuticals
ChemicalsPower
Transportation

8
Fund Manager's Comment
The fund maintained an equity exposure of 94% during the month. Exposure toBanks, Petroleum Products and Fertilizers was reduced by booking profits inspecific stocks, while increased exposure to Oil. Within Software sector, the fundreplaced holding in Mastek with increased holding in HCL Technologies.
SIP Returns: As on 31-May-2007
Period SIP Start Date Total Amount Total No. Market Value SIPInvested of Units Returns
1 Year SIP 30-Jun-06 12,000.00 470.55 13,250.69 23.64%Since Inception 16-Aug-04 35,000.00 1,988.89 56,007.14 36.15%
Rs. 10000 invested at inception: Discovery Fund Vs S & P CNX Nifty
CAGR – Discovery Plan : 44.95%; Benchmark : 42.52%Past performance may or may not be sustained in future.
Quantitative Indicators:
Average P/E : 13Average P/BV : 2.10Average Dividend Yield : 2.29Annual Portfolio Turnover Ratio : 2.06 times
Portfolio
ICICI Prudential Discovery FundDiversified Fund
Snapshot:Fund Manager : Sankaran NarenIndicative Investment Horizon: 5 yrs and moreInception date: 16-08-2004Fund Size: Rs. 869.15 croresNAV (As on 31-May-2007):
Growth option: Rs. 28.16Dividend option: Rs. 19.47
**Expense Ratio (6 Months avg. Dec 06-May 07):Retail option : 2.06%Institutional option-I : 1.00%
**This is a close approximation of the number.
WHY SHOULD ONE INVEST?Long term investment of funds for capital appreciation
following value investment philosophy
Performance Record *- Growth Option
Sector Allocation*
Company/Issuer Mkt Value (Rs. Lakh) % to NAVStyle Box
*Returns < 1Year : Absolute, > 1Year : CAGR. Benchmark is S&P CNX Nifty.For computation of returns the allotment NAV has been taken as Rs. 10.00.Past performance may or may not be sustained in future.
Figures as on 31-May-2007
*Pertains to the equity investments only.
Auto Ancillaries 5,499.19 6.33%• Kesoram Industries Ltd 3,231.60 3.72%
Apollo Tyres Ltd 1,392.10 1.60%India Nippon Elect Ltd 875.49 1.01%Banks 6,823.42 7.85%
• State Bank of India Ltd 3,695.46 4.25%Andhra Bank Ltd 3,127.96 3.60%Cement 4,445.10 5.11%
• Birla Corporation Ltd 4,445.10 5.11%Chemicals 1,916.95 2.21%India Glycols Ltd 1,916.95 2.21%Consumer Non-Durable 8,503.20 9.78%
• Tata Tea Ltd 4,141.35 4.76%Ruchi Soya Industries Ltd 2,591.76 2.98%Nirma Ltd 1,204.09 1.39%Rajshree Sugars & Chemicals Ltd 566.00 0.65%Ferrous Metals 2,690.57 3.09%Jindal Steel & Power Company Ltd 2,184.85 2.51%Tata Steel Ltd 505.72 0.58%Fertilizers 1,995.09 2.29%Gujarat State Fertilisers & Chemicals Ltd 1,199.86 1.38%Zuari Industries Ltd 795.23 0.91%Hardware 1,266.13 1.46%HCL Infosystems Ltd 1,266.13 1.46%Industrial Products 6,297.83 7.25%
• Finolex Cables Ltd 3,430.00 3.95%Kirloskar Oil Engines Ltd 2,337.27 2.69%MM Forgings Ltd 530.56 0.61%Non-Ferrous Metals 974.93 1.12%Nava Bharat Ventures Ltd 974.93 1.12%Oil 6,465.33 7.44%
• Oil & Natural Gas Company Ltd 6,465.33 7.44%Paper 4,764.33 5.49%Tamil Nadu Newsprint & Papers Ltd 2,360.00 2.72%JK Paper Ltd 1,851.50 2.13%Seshashayee Paper & Boards Ltd 552.83 0.64%Pesticides 2,171.10 2.50%Rallis India Ltd 2,171.10 2.50%Petroleum Products 1,533.75 1.76%IBP Company Ltd 1,533.75 1.76%Pharmaceuticals 15,340.26 17.64%
• Aventis Pharma Ltd 5,284.60 6.08%• Cadila Healthcare Ltd 4,086.36 4.70%• Ipca Laboratories Ltd 3,781.20 4.35%
Novartis India Ltd 1,264.10 1.45%FDC Ltd 924.00 1.06%Software 4,131.00 4.75%
• HCL Technologies Ltd 4,131.00 4.75%Textiles - Cotton 3,206.40 3.69%Vardhaman Textiles Ltd 3,206.40 3.69%Textiles - Products 2,276.40 2.62%Raymond Ltd 2,276.40 2.62%Transportation 1,141.83 1.31%Containers Corporation of India Ltd 1,141.83 1.31%CPs, CDs and Term Deposits 2352.95 2.70%ICICI Bank Ltd 2,350.00 2.70%Kotak Mahindra Bank Ltd 2.95 0.00%Cash, Call, CBLO & Reverse Repo 3,532.39 4.06%Other Current Assets (410.00) -0.45%Total Net Assets 86,915.20 100.00%
• Top Ten Holdings
Std Dev : 6.59%Sharpe Ratio^ : 0.41Portfolio Beta : 0.92R squared : 0.63
Portfolio turnover has been computed as the ratio of the higher value of average purchase and averagesales, to the average net assets in the past one year (since inception for schemes that have notcompleted a year). The figures are not netted for derivative transactions.^ Risk-free rate based on the last 3 month T-Bill cut-off.
Past performance may or may not be sustained in future. Assume Rs. 1000 invested every month.The high level of returns come from the sharp appreciation in market, in the year 2004.
5.11%
16.46%
44.95%
8.63%
39.88% 42.52%
0.00%
10.00%
20.00%
30.00%
40.00%
50.00%
Last 6 Months Last 1 years Since Inception
Discovery Fund S&P CNX Nifty
Rs 28160.00
Rs 26863.02
9,819
14,819
19,819
24,819
29,819
34,819
Aug-
04
Oct
-04
Dec-
04
Feb-
05Ap
r-05
Jun-
05
Aug-
05
Oct
-05
Dec-
05
Feb-
06Ap
r-06
Jun-
06
Aug-
06
Oct
-06
Dec-
06
Feb-
07
Apr-
07
Discovery Fund S&P CNX Nifty
17.64%
9.78%
7.85%
7.44%
7.25%
6.33%
5.49%
5.11%
4.75%
3.69%
3.09%
2.62%
2.50%
2.29%
2.21%
1.76%
1.46%
1.31%
1.12%
0.00% 5.00% 10.00% 15.00% 20.00%
Pharmaceuticals
Consumer Non-
Banks
Oil
Industrial Products
Auto Ancillaries
Paper
Cement
Software
Textiles - Cotton
Ferrous Metals
Textiles - Products
Pesticides
Fertilizers
Chemicals
Petroleum Products
Hardware
Transportation
Non-Ferrous Metals

9
Performance Record *- Growth Option
*Returns < 1Year : Absolute, > = 1Year : CAGR. Benchmark is ^Nifty JuniorIndex. For computation of returns the allotment NAV has been taken asRs. 10.00. Past performance may or may not be sustained in future.
ICICI Prudential Fusion FundDiversified Fund (Close - Ended)
Snapshot:
Fund Manager : Deven SangoiIndicative Investment Horizon: 5 yrs and moreInception date: 25-03-2006Fund Size: Rs. 734.35 croresNAV (As on 31-May-2007):
Growth option : Rs. 13.39Dividend option : Rs. 13.39
**Expense Ratio (6 Months avg. Dec 06-May 07):Retail option : 2.12%Institutional option-I : 0.99%
**This is a close approximation of the number.
Style Box
Style Value Blend Growth Size
Large
Mid
Small
Figures as on 31-May-2007
*Pertains to the equity investments only.
WHY SHOULD ONE INVEST?Exploit the long-term investment potential of equity
PortfolioCompany/Issuer Mkt Value (Rs. Lakh) % to NAV
Auto Ancillaries 3,576.59 4.87%• Amtek India Ltd 2,369.82 3.23%
Enkei Castalloy Ltd 750.00 1.02%Sundaram Clayton Ltd 456.77 0.62%Banks 1,236.27 1.68%Punjab National Bank Ltd 696.61 0.95%Federal Bank Ltd 539.66 0.73%Cement 370.46 0.50%Ramco Industries Ltd 370.46 0.50%Construction 6,239.92 8.50%
• Orbit Corporation Ltd 3,175.87 4.32%IVRCL Infrastructure & Projects Ltd 1,226.23 1.67%Unity Infraprojects Ltd 930.21 1.27%Mahindra Gesco Developers Ltd 907.61 1.24%Consumer Durables 930.98 1.27%K.G. Khosla Compressors Ltd 930.98 1.27%Consumer Non-Durable 1,532.09 2.08%ITC Limited 1,273.52 1.73%Synergy Multibase Ltd 258.57 0.35%Ferrous Metals 2,558.41 3.48%
• Kalyani Steels Ltd 2,558.41 3.48%Industrial Capital Goods 7,008.51 9.54%
• Aban Lloyd Chiles Offshore Ltd 1,935.16 2.64%Bharti Shipyard Ltd 1,698.21 2.31%Action Construction Ltd 1,302.74 1.77%Jyoti Ltd 933.25 1.27%Gei Hamon Industries Ltd 630.50 0.86%Gujarat Apollo Equipments Ltd 508.65 0.69%Industrial Products 8,037.50 10.95%
• Jain Irrigation Systems Ltd 3,931.46 5.35%AIA Engineering Ltd 1,806.97 2.46%Esab India Ltd 1,180.88 1.61%Finolex Cables Ltd 1,062.24 1.45%Nitin Fire Protection Industries Ltd 55.95 0.08%Media & Entertainment 7,182.98 9.78%
• Deccan Chronicle Holdings Ltd 5,307.41 7.23%Jagran Prakashan Pvt Ltd 1,875.57 2.55%Pesticides 2,443.38 3.33%United Phosphorus Ltd 1,538.75 2.10%Rallis India Ltd 904.63 1.23%Petroleum Products 4,391.76 5.98%
• Reliance Industries Ltd 4,391.76 5.98%Pharmaceuticals 7,011.19 9.55%
• Elder Pharmaceuticals Ltd 2,623.46 3.57%Dishman Pharmaceuticals & Chemicals Ltd 1,648.28 2.24%Torrent Pharmaceuticals Ltd 1,384.49 1.89%Cadila Healthcare Ltd 1,354.96 1.85%Software 9,704.79 13.22%
• Subex Azure Ltd 3,247.59 4.42%• Zenith Infotech Ltd 2,369.32 3.23%
Firstsource Solutions Ltd 1,192.07 1.62%Mphasis BFL Software Ltd 1,135.93 1.55%Megasoft Ltd 1,120.70 1.53%Geometric Software Solutions Ltd 639.18 0.87%Textiles - Products 4,083.58 5.55%Aditya Birla Nuvo Ltd 1,396.40 1.90%Kewal Kiran Clothing Ltd 1,191.56 1.62%Siyaram Silk Mills Ltd 788.28 1.07%Gokaldas Exports Ltd 707.34 0.96%Nifty Futures 2,039.96 2.78%CPs, CDs and Term Deposits 510.00 0.69%ICICI Bank Ltd 510.00 0.69%Cash, Call, CBLO & Reverse Repo 4,529.49 6.17%Other Current Assets 47.18 0.08%Total Net Assets 73,435.04 100.00%
• Top Ten Holdings
Sector Allocation*
Quantitative Indicators:
Average P/E : 23Average P/BV : 4.12Average Dividend Yield: 0.64Annual Portfolio Turnover Ratio: 0.57 times
Portfolio turnover has been computed as the ratio of the higher value of average purchase and averagesales, to the average net assets in the past one year (since inception for schemes that have notcompleted a year). The figures are not netted for derivative transactions.^ Risk-free rate based on the last 3 month T-Bill cut-off.
Std Dev : 7.41%Sharpe Ratio^ : 0.22Portfolio Beta : 0.94R squared : 0.77
Rs. 10000 invested at inception: Fusion Plan Vs S&P CNX Nifty
CAGR – Fusion Fund: 27.97%; Benchmark : 22.21%Past performance may or may not be sustained in future.
10.66%
29.62% 27.97%
15.15%
37.67%
22.21%
0.00%5.00%
10.00%15.00%20.00%25.00%30.00%35.00%40.00%
Last 6 Months Last 1 years Since Inception
Fusion Fund NIFTY Junior Index
Rs 13390.00
Rs 13282.26
7,430
8,430
9,430
10,430
11,430
12,430
13,430
14,430
Mar
-06
Apr-0
6
May
-06
Jun-
06
Jul-0
6
Aug-
06
Sep-
06
Oct
-06
Nov
-06
Dec-
06
Jan-
07
Feb-
07
Mar
-07
Apr-0
7
May
-07
Fusion Fund NIFTY Junior Index
13.22%10.95%
9.78%9.55%9.54%
8.50%5.98%
5.55%4.87%
3.48%3.33%
2.08%1.68%
1.27%0.50%
0.00% 4.00% 8.00% 12.00% 16.00%
SoftwareIndustrial Products
Media & EntertainmentPharmaceuticals
Industrial Capital GoodsConstruction
Petroleum ProductsTextiles - Products
Auto AncillariesFerrous Metals
PesticidesConsumer Non-Durable
BanksConsumer Durables
Cement

10
Performance Record *- Growth Option
*Returns < 1Year : Absolute, > = 1Year : CAGR. Benchmark is S&P CNX Nifty.For computation of returns the allotment NAV has been taken asRs. 10.00. Past performance may or may not be sustained in future.
Sector Allocation*
*Pertains to the equity investments only.
ICICI Prudential Tax PlanDiversified Fund
Snapshot:Fund Manager : Sankaran NarenIndicative Investment Horizon: 3 yrs & moreInception date: 19-08-1999Fund Size: Rs. 700.14 croresNAV (As on 31-May-2007):
Growth option : Rs. 92.43Dividend option : Rs. 22.19
**Expense Ratio (6 Months avg. Dec 06-May 07): 2.21%
**This is a close approximation of the number.
WHY SHOULD ONE INVEST?Medium term investment of funds with tax benefits for capital appreciation
Auto Ancillaries 7,151.06 10.21%• Kesoram Industries Ltd 2,827.65 4.04%
Sundaram Clayton Ltd 1,921.70 2.74%Rane Madras Ltd 856.02 1.22%Sundaram Brake Linings Ltd 646.95 0.92%Rane Holdings Ltd 522.70 0.75%Rane Brake Linings Ltd 376.04 0.54%Banks 6,182.89 8.83%
• ICICI Bank Ltd 2,756.53 3.94%Andhra Bank Ltd 1,396.30 1.99%Punjab National Bank Ltd 1,248.11 1.78%ING Vysya Bank Ltd 781.95 1.12%Cement 1,655.20 2.36%Orient Paper & Industries Ltd 1,655.20 2.36%Chemicals 4,173.20 5.96%Clariant Chemicals (India) Ltd 1,811.70 2.59%India Glycols Ltd 736.47 1.05%Gwalior Chemical Industries Ltd 632.44 0.90%Atul Ltd 565.47 0.81%Andhra Sugars Ltd 427.12 0.61%Construction 726.14 1.04%Sadbhav Engineering Ltd 726.14 1.04%Consumer Non-Durable 9,092.15 12.98%
• ICI India Ltd 3,678.34 5.25%• Tata Tea Ltd 2,300.75 3.29%
Gillette India Ltd 1,491.03 2.13%Hindustan Sanitaryware & Industries Ltd 664.61 0.95%Venky's (India) Ltd 492.99 0.70%Harrisons Malyalam Ltd 464.43 0.66%Ferrous Metals 251.75 0.36%Tata Steel Ltd 251.75 0.36%Fertilizers 1,525.05 2.18%Zuari Industries Ltd 1,525.05 2.18%Hotels 897.41 1.28%Oriental Hotels Ltd 897.41 1.28%Industrial Capital Goods 872.87 1.25%Numeric Power Systems Ltd 872.87 1.25%Industrial Products 3,663.39 5.24%H.E.G. Ltd 1,661.30 2.37%Paper Products Ltd 1,076.25 1.54%Poleplex Corporation Ltd 600.09 0.86%MM Forgings Ltd 325.75 0.47%Media & Entertainment 714.75 1.02%Zee News Ltd 714.75 1.02%Non-Ferrous Metals 489.34 0.70%National Aluminium Company Limited-Futures 489.34 0.70%Oil 4,173.58 5.96%
• Oil & Natural Gas Company Ltd 3,461.03 4.94%Hindustan Oil Exploration Ltd 712.55 1.02%Petroleum Products 2,321.60 3.32%
• IBP Company Ltd 2,321.60 3.32%Pharmaceuticals 9,066.41 12.94%
• Cadila Healthcare Ltd 2,927.75 4.18%• Aventis Pharma Ltd 2,426.95 3.47%
FDC Ltd 1,326.07 1.89%Alembic Ltd 1,246.72 1.78%Glenmark Pharmaceuticals Ltd 1,095.44 1.56%Ahlcon Parenterals (India) Ltd 43.48 0.06%Retailing 1,999.20 2.86%Trent Ltd 1,999.20 2.86%Software 9,577.81 13.67%
• Infosys Technologies Ltd 4,327.88 6.18%• Tata Consultancy Services Ltd 2,416.70 3.45%
Megasoft Ltd 1,129.49 1.61%3i Infotech Ltd 930.30 1.33%Firstsource Solutions Ltd 584.45 0.83%MIC Electronics Ltd 188.99 0.27%Textiles - Cotton 462.54 0.66%Precot Mills Ltd 462.54 0.66%Textiles - Products 980.25 1.40%Raymond Ltd 980.25 1.40%Textiles - Synthetic 281.14 0.40%Sangam India Ltd 281.14 0.40%CPs, CDs and Term Deposits 779.00 1.11%UTI Bank Ltd 430.00 0.61%ICICI Bank Ltd 349.00 0.50%Cash, Call, CBLO & Reverse Repo 5,333.59 7.62%Other Current Assets (2,356.51) -3.35%Total Net Assets 70,013.81 100.00%
• Top Ten Holdings
SIP Returns: As on 31-May-2007
Period SIP Start Date Total Amount Total No. Market Value SIPInvested of Units Returns
1 Year SIP 30-Jun-06 12,000.00 139.43 12,887.51 16.59%3 Year SIP 30-Jun-04 36,000.00 626.87 57,941.59 35.38%5 Year SIP 28-Jun-02 60,000.00 2,111.24 195,141.91 50.74%Since Inception 19-Aug-99 95,000.00 4,925.72 455,284.30 39.21%
Quantitative Indicators:
Average P/E : 18Average P/BV : 2.44Average Dividend Yield : 1.75Annual Portfolio Turnover Ratio : 1.79 times
PortfolioCompany/Issuer Mkt Value (Rs. Lakh) % to NAVStyle Box
Figures as on 31-May-2007
Portfolio turnover has been computed as the ratio of the higher value of average purchase and averagesales, to the average net assets in the past one year (since inception for schemes that have not completeda year). The figures are not netted for derivative transactions.
^ Risk-free rate based on the last 3 month T-Bill cut-off.
CAGR – Tax Plan: 33.06%; Benchmark : 16.08%Past performance may or may not be sustained in future.
Rs. 10000 invested at inception: Tax Plan Vs S&P CNX Nifty
Past performance may or may not be sustained in future. Assume Rs. 1000 invested every month. Thehigh level of returns come from the sharp appreciation in market, in the year 2002 & 2004 .
Std Dev : 7.38%Sharpe Ratio^ : 0.46Portfolio Beta : 0.95R squared : 0.52
1.45% 9.70%
55.97%49.65%
33.06%
8.63%
39.88% 42.53%33.07%
16.08%
0.00%10.00%20.00%30.00%40.00%50.00%60.00%
Last 6Months
Last 1years
Last 3years
Last 5years
SinceInception
Tax Plan S&P CNX Nifty
Rs 92430.00
Rs 31939.03
6,301
26,301
46,301
66,301
86,301
106,301
126,301
Aug-
99Ja
n-00
Jun-
00N
ov-0
0Ap
r-01
Sep-
01Fe
b-02
Jul-0
2De
c-02
May
-03
Oct
-03
Mar
-04
Aug-
04Ja
n-05
Jun-
05N
ov-0
5Ap
r-06
Sep-
06Fe
b-07
Tax Plan S&P CNX Nifty
13.67%
12.98%12.94%
10.21%8.83%
5.96%5.96%
5.24%
3.32%2.86%
2.36%2.18%
1.40%1.28%1.25%
1.04%1.02%
0.70%0.66%
0.40%0.36%
0.00% 4.00% 8.00% 12.00% 16.00%
SoftwareConsumer Non-Durable
Pharmaceuticals
Auto AncillariesBanks
OilChemicals
Industrial ProductsPetroleum Products
Retailing
CementFertilizers
Textiles - ProductsHotels
Industrial Capital GoodsConstruction
Media & Entertainment
Non-Ferrous MetalsTextiles - Cotton
Textiles - SyntheticFerrous Metals

11
Fund Manager's Comment
The fund maintained an average equity exposure of 95% during the month, including ~9% exposure toNifty Futures, indicating a cautious stance. The fund increased exposure to Banks (HDFC Bank),Consumer Non-Durable (HLL) and Non-Ferrous Metals (Sterlite Industries) while it booked profits in Autoand Construction. The portfolio is skewed towards large cap as the fund seeks to maximize the risk-return payoff.
SIP Returns: As on 31-May-2007
Period SIP Start Date Total Amount Total No. Market Value SIPInvested of Units Returns
1 Year SIP 30-Jun-06 12,000.00 137.98 13,770.40 33.98%
3 Year SIP 30-Jun-04 36,000.00 640.19 63,890.96 43.37%
5 Year SIP 28-Jun-02 60,000.00 1,674.32 167,097.14 43.65%
Since Inception 9-Jul-98 108,000.00 4,539.88 453,080.02 30.88%
Quantitative Indicators:
Average P/E : 22Average P/BV : 4.77Average Dividend Yield : 1.14Annual Portfolio Turnover Ratio : 2.09 times
Portfolio turnover has been computed as the ratio of the higher value of average purchase and averagesales, to the average net assets in the past one year (since inception for schemes that have notcompleted a year). The figures are not netted for derivative transactions.^ Risk-free rate based on the last 3 month T-Bill cut-off.
Past performance may or may not be sustained in future. Assume Rs. 1000 invested every month. Thehigh level of returns come from the sharp appreciation in market, in the year 2002, 2004 & 2006.
Std Dev : 5.87%Sharpe Ratio^ : 0.50Portfolio Beta : 0.98R squared : 0.88
PortfolioCompany/Issuer Mkt Value (Rs. Lakh) % to NAV
ICICI Prudential Growth PlanDiversified Fund
Snapshot:Fund Manager : Deven SangoiIndicative Investment Horizon: 5 years & moreInception date: 09-07-1998Fund Size: Rs. 470.64 croresNAV (As on 31-May-2007):
Growth option : Rs. 99.80Dividend option : Rs. 24.44
**Expense Ratio (6 Months avg. Dec 06-May 07):Retail option : 2.29%Institutional option-I : 1.00%
**This is a close approximation of the number.
WHY SHOULD ONE INVEST?Long term investment of funds for capital appreciation
Performance Record *- Growth Option
Rs. 10000 invested at inception: Growth Plan Vs S & P CNX Nifty
CAGR – Growth Plan : 29.50%; Benchmark : 18.33%Past performance may or may not be sustained in future.
Sector Allocation*
*Returns < 1Year : Absolute, > 1Year : CAGR. Benchmark is S&P CNX Nifty.For computation of returns the allotment NAV has been taken as Rs. 10.00.Past performance may or may not be sustained in future.
Style BoxFigures as on 31-May-2007
*Pertains to the equity investments only.
Auto 612.83 1.30%Maruti Udyog Ltd 612.83 1.30%Banks 5,725.85 12.16%
• ICICI Bank Ltd 1,865.21 3.96%State Bank of India Ltd 1,437.31 3.05%Punjab National Bank Ltd 1,369.76 2.91%HDFC Bank Ltd 1,053.57 2.24%Cement 2,084.42 4.43%Grasim Industries Ltd 1,279.78 2.72%Gujarat Ambuja Cement Ltd 804.64 1.71%Consumer Non-Durable 2,720.73 5.78%
• ITC Limited 1,466.99 3.12%Hindustan Lever Ltd 1,253.74 2.66%Ferrous Metals 2,163.34 4.60%Steel Authority of India Ltd 1,321.91 2.81%Tata Steel Ltd 841.43 1.79%Industrial Capital Goods 4,901.78 10.42%
• Larsen & Toubro Limited 1,852.18 3.94%• Bharat Heavy Electricals Ltd 1,554.85 3.30%• Bharat Electonics Ltd 1,494.75 3.18%
Media & Entertainment 1,834.85 3.90%• Zee Entertainment Enterprises Ltd 1,834.85 3.90%
Non-Ferrous Metals 680.38 1.45%Sterlite Industries (India) Ltd 680.38 1.45%Oil 2,381.86 5.06%
• Oil & Natural Gas Company Ltd 2,381.86 5.06%Pesticides 1,186.56 2.52%United Phosphorus Ltd 1,186.56 2.52%Petroleum Products 3,904.15 8.30%
• Reliance Industries Ltd 3,904.15 8.30%Pharmaceuticals 1,798.57 3.82%Sun Pharmaceuticals Limited 1,019.89 2.17%Ranbaxy Laboratories Ltd 461.07 0.98%Sun Pharmaceuticals Limited-Futures 274.30 0.58%Sun Pharma Advanced Research Co. Ltd 43.31 0.09%Software 5,287.72 11.23%
• Tata Consultancy Services Ltd 1,477.82 3.14%Infosys Technologies Ltd 1,335.83 2.84%Wipro Ltd 1,115.38 2.37%HCL Technologies Ltd 942.83 2.00%Satyam Computer Services Ltd 415.86 0.88%Telecom Services 3,792.74 8.05%
• Bharti Airtel Ltd 2,482.36 5.27%Reliance Communications Ventures Ltd 1,310.38 2.78%Transportation 1,382.54 2.94%Containers Corporation of India Ltd 1,382.54 2.94%Nifty Futures 4,199.67 8.92%CPs, CDs and Term Deposits 708.63 1.51%ICICI Bank Ltd 621.00 1.32%State Bank of Patiala Ltd 87.63 0.19%Cash, Call, CBLO & Reverse Repo 5,975.59 12.70%Other Current Assets (4,277.95) -9.09%Total Net Assets 47,064.26 100.00%
• Top Ten Holdings
7.67%
33.74%
49.45%
40.38%
29.50%
8.63%
39.88% 42.53%
33.07%
18.33%
0.00%
10.00%20.00%
30.00%40.00%
50.00%60.00%
Last 6Months
Last 1years
Last 3years
Last 5years
SinceInception
Growth Plan S&P CNX Nifty
Rs 99800.00
Rs 44699.03
8,36518,36528,36538,36548,36558,36568,36578,36588,36598,365
108,365
Jul-9
8
Jan-
99Ju
l-99
Jan-
00
Jul-0
0Ja
n-01
Jul-0
1
Jan-
02Ju
l-02
Jan-
03
Jul-0
3Ja
n-04
Jul-0
4
Jan-
05Ju
l-05
Jan-
06
Jul-0
6Ja
n-07
Growth Plan S&P CNX Nifty
12.16%
11.23%
10.42%
8.30%
8.05%
5.78%
5.06%
4.60%
4.43%
3.90%
3.82%
2.94%
2.52%
1.45%
1.30%
0.00% 4.00% 8.00% 12.00%
Banks
Software
Industrial Capital Goods
Petroleum Products
Telecom Services
Consumer Non-Durable
Oil
Ferrous Metals
Cement
Media & Entertainment
Pharmaceuticals
Transportation
Pesticides
Non-Ferrous Metals
Auto

12
SIP Returns: As on 31-May-2007
Period SIP Start Date Total Amount Total No. Market Value SIPInvested of Units Returns
1 Year SIP 30-Jun-06 12,000.00 715.49 14,710.47 53.39%Since Inception 31-Aug-05 22,000.00 1,545.38 31,773.01 48.48%
Past performance may or may not be sustained in future. Assume Rs. 1000 invested every month.The high level of returns come from the sharp appreciation in market, in the years 2005 & 2006.
Fund Manager's Comment
The fund has further decreased its equity exposure at 78% during the month, indicating a cautiousstance. The fund booked profit in Industrial Capital Goods (BHEL) and Construction (Jai PrakashAssociates Ltd), while consolidating investments in Power (NTPC) and Cement.
Sector Allocation*
Performance Record *- Growth Option
*Returns < 1Year : Absolute, > = 1Year : CAGR. Benchmark is S&P CNX Nifty.For computation of returns the allotment NAV has been taken as Rs. 10.00.Past performance may or may not be sustained in future.
Quantitative Indicators:
Average P/E : 15Average P/BV : 2.72Average Dividend Yield : 1.34Annual Portfolio Turnover Ratio : 2.30 times
Portfolio turnover has been computed as the ratio of the higher value ofaverage purchase and average sales, to the average net assets in the pastone year (since inception for schemes that have not completed a year). Thefigures are not netted for derivative transactions.
ICICI Prudential Infrastructure FundThematic Fund
Snapshot:Fund Manager : Sankaran NarenIndicative Investment Horizon: 5 yrs and moreInception date: 31-08-2005Fund Size: Rs. 1,821.57 croresNAV (As on 31-May-2007):
Growth option : Rs. 20.56Dividend option : Rs. 15.97
**Expense Ratio (6 Months avg. Dec 06-May 07):Retail option : 1.92%Institutional option-I : 1.00%
**This is a close approximation of the number.
Style BoxFigures as on 31-May-2007
*Pertains to the equity investments only.
WHY SHOULD ONE INVEST?Long term investment of funds for capital appreciation derivedfrom the growth and development of the infrastructure sector
Std Dev : 7.58%Sharpe Ratio^ : 0.42Portfolio Beta : 1.13R squared : 0.83
^ Risk-free rate based on the last 3 month T-Bill cut-off.
PortfolioCompany/Issuer Mkt Value (Rs. Lakh) % to NAV
Auto Ancillaries 7,387.84 4.06%• Kesoram Industries Ltd 7,387.84 4.06%
Banks 20,062.19 11.01%• ICICI Bank Ltd 6,860.70 3.77%
Andhra Bank Ltd 5,232.00 2.87%HDFC Bank Ltd 3,442.80 1.89%Punjab National Bank Ltd 2,496.21 1.37%State Bank of India Ltd 2,030.48 1.11%Cement 3,879.83 2.13%Grasim Industries Ltd 2,600.31 1.43%Birla Corporation Ltd 771.22 0.42%JK Cements Ltd 508.30 0.28%Construction 13,991.22 7.68%
• Patel Engineering Ltd 7,736.64 4.25%Gammon India Ltd 2,419.23 1.33%Nagarjuna Construction Company Ltd 2,170.24 1.19%BL Kashyap and Sons Ltd 1,665.11 0.91%Dredging 3,455.69 1.90%Dredging Corporation of India Ltd 3,455.69 1.90%Ferrous Metals 22,400.79 12.30%
• Jindal Steel & Power Company Ltd 8,752.24 4.80%• Usha Martin Ltd 5,732.75 3.15%• Steel Authority of India Ltd 5,601.69 3.08%
Adhunik Metaliks Ltd 1,862.00 1.02%Welspun Gujarat Stahl Roh Ltd 452.11 0.25%Hotels 3,707.03 2.04%EIH Ltd 3,707.03 2.04%Industrial Capital Goods 11,331.65 6.21%Siemens India Ltd 4,209.52 2.31%Larsen & Toubro Limited 4,014.78 2.20%ABG Heavy Industries Ltd 1,586.54 0.87%Kalpataru Power Transmission Ltd 1,312.43 0.72%Larsen & Toubro Limited-Futures 208.38 0.11%Industrial Products 9,263.99 5.09%Cummins India Ltd 5,188.40 2.85%Electrosteel Castings Ltd 4,075.59 2.24%Non-Ferrous Metals 2,721.50 1.49%Sterlite Industries (India) Ltd 2,721.50 1.49%Oil 9,346.86 5.13%
• Oil & Natural Gas Company Ltd 7,739.95 4.25%Hindustan Oil Exploration Ltd 1,606.91 0.88%Petroleum Products 14,069.52 7.72%
• Reliance Industries Ltd 14,069.52 7.72%Power 13,650.85 7.49%
• Tata Power Company Ltd 7,614.75 4.18%National Thermal Power Corporation Ltd 3,170.00 1.74%Gujarat Industries Power Company Ltd 2,866.10 1.57%Telecom Services 2,547.75 1.40%Bharti Airtel Ltd 2,547.75 1.40%Transportation 5,284.78 2.90%
• Containers Corporation of India Ltd 5,284.78 2.90%CPs, CDs and Term Deposits 23,747.47 13.04%ICICI Bank Ltd 13,381.00 7.35%Allahabad Bank Ltd 9,825.00 5.39%UTI Bank Ltd 541.47 0.30%Cash, Call, CBLO & Reverse Repo 18,393.46 10.10%Other Current Assets (3,085.44) -1.69%Total Net Assets 182,156.98 100.00%
• Top Ten Holdings
Rs. 10000 invested at inception: Infrastructure Fund Vs S&P CNX Nifty
CAGR – Infrastructure : 51.04%; Benchmark : 40.04%Past performance may or may not be sustained in future.
12.97%
47.28%51.04%
8.63%
39.88% 40.04%
0.00%
10.00%
20.00%
30.00%
40.00%
50.00%
60.00%
Last 6 Months Last 1 years Since Inception
Infrastructure Fund S&P CNX Nifty
Rs 20560.00
Rs 18014.38
9,420
11,420
13,420
15,420
17,420
19,420
21,420
Aug-
05Se
p-05
Oct
-05
Nov
-05
Dec-
05Ja
n-06
Feb-
06M
ar-0
6Ap
r-06
May
-06
Jun-
06Ju
l-06
Aug-
06Se
p-06
Oct
-06
Nov
-06
Dec-
06Ja
n-07
Feb-
07M
ar-0
7Ap
r-07
May
-07
Infrastructure Fund S&P CNX Nifty
12.30%
11.01%
7.72%
7.68%
7.49%
6.21%
5.13%
5.09%
4.06%
2.90%
2.13%
2.04%
1.90%
1.49%
1.40%
0.00% 4.00% 8.00% 12.00% 16.00%
Ferrous Metals
Banks
Petroleum Products
Construction
Power
Industrial Capital Goods
Oil
Industrial Products
Auto Ancillaries
Transportation
Cement
Hotels
Dredging
Non-Ferrous Metals
Telecom Services

13
SIP Returns: As on 31-May-2007
Period SIP Start Date Total Amount Total No. Market Value SIPInvested of Units Returns
1 Year SIP 30-Jun-06 12,000.00 899.61 15,338.35 66.84%Since Inception 30-Nov-05 19,000.00 1,535.23 26,175.67 49.85%
Fund Manager's Comment
The fund maintained an average equity exposure of 90% during the month, including ~4.30% exposure to NiftyFutures, indicating a cautious stance. The fund has built fresh position in HDFC Bank (Banks), Avaya GlobalConnect (Telecom Services) and Vimta Labs (Healthcare Services). The fund booked profits in Software bycompletely exiting Wipro.
Average P/E : 23Average P/BV : 4.11Average Dividend Yield : 0.87Annual Portfolio Turnover Ratio : 1.22 timesPortfolio turnover has been computed as the ratio of the higher value of average purchase and averagesales, to the average net assets in the past one year (since inception for schemes that have not completeda year). The figures are not netted for derivative transactions.^ Risk-free rate based on the last 3 month T-Bill cut-off.
Quantitative Indicators:
PortfolioCompany/Issuer Mkt Value (Rs. Lakh) % to NAVSnapshot:
Fund Manager : Deven SangoiIndicative Investment Horizon: 5 yrs. & moreInception date: 30-11-2005Fund Size: Rs. 543.52 croresNAV (As on 31-May-2007):
Growth option : Rs. 17.05Dividend option : Rs. 15.46
**Expense Ratio (6 Months avg. Dec 06-May 07): 2.24%**This is a close approximation of the number.
WHY SHOULD ONE INVEST?Long term investment of funds for capital appreciation derived
from the growth potential of the service industries sector
Auto Ancillaries 2,475.61 4.55%Automobile Corporation of Goa Ltd 1,379.83 2.54%Sundaram Clayton Ltd 816.72 1.50%Shivam Autotech Ltd 279.06 0.51%Banks 7,511.85 13.82%
• ICICI Bank Ltd 2,068.09 3.80%Andhra Bank Ltd 1,296.35 2.39%Punjab National Bank Ltd 1,259.23 2.32%HDFC Bank Ltd 1,158.47 2.13%Union Bank of India Ltd 1,134.72 2.09%Bank of Baroda Ltd 594.99 1.09%Construction 3,565.55 6.55%Jai Prakash Associates Ltd 1,448.19 2.66%Nagarjuna Construction Company Ltd 985.18 1.81%BL Kashyap and Sons Ltd 613.59 1.13%Patel Engineering Ltd 518.59 0.95%Finance 1,914.91 3.52%
• India Infoline Ltd 1,914.91 3.52%Healthcare Services 573.25 1.05%Vimta Labs Ltd 573.25 1.05%Industrial Capital Goods 2,877.88 5.30%
• Bharti Shipyard Ltd 1,531.40 2.82%Bharat Electonics Ltd 1,346.48 2.48%Industrial Products 1,885.89 3.47%
• Jain Irrigation Systems Ltd 1,885.89 3.47%Media & Entertainment 5,568.85 10.24%
• Jagran Prakashan Pvt Ltd 1,725.30 3.17%• Zee Entertainment Enterprises Ltd 1,649.15 3.03%• Deccan Chronicle Holdings Ltd 1,571.25 2.89%
Television Eighteen India Ltd. 623.15 1.15%Pesticides 905.97 1.67%United Phosphorus Ltd 905.97 1.67%Pharmaceuticals 4,080.31 7.51%
• Dishman Pharmaceuticals & Chemicals Ltd 1,525.30 2.81%Sun Pharmaceuticals Limited 657.73 1.21%Dr. Reddy’s Laboratories Ltd 647.15 1.19%Plethico Pharmaceuticals Ltd 486.52 0.90%Elder Pharmaceuticals Ltd 409.71 0.75%Indoco Remedies Ltd 326.00 0.60%Sun Pharma Advanced Research Co. Ltd 27.90 0.05%Power 814.16 1.50%PTC India Ltd 814.16 1.50%Software 8,761.09 16.12%
• Nucleus Software Exports Ltd 2,537.10 4.67%Infotech Enterprises Ltd 1,205.10 2.22%Tata Consultancy Services Ltd 998.39 1.84%Tech Mahindra Ltd 922.73 1.70%3i Infotech Ltd 914.80 1.68%Infosys Technologies Ltd 843.32 1.55%Mphasis BFL Software Ltd 708.86 1.30%Financial Technologies Ltd 630.79 1.16%Telecom Services 2,716.42 5.00%
• Bharti Airtel Ltd 1,825.89 3.36%Reliance Communications Ventures Ltd 587.81 1.08%Avaya Global Connect Ltd 302.72 0.56%Textiles - Products 1,704.64 3.14%Aditya Birla Nuvo Ltd 1,282.98 2.36%Gokaldas Exports Ltd 421.66 0.78%Transportation 1,166.56 2.15%Containers Corporation of India Ltd 1,166.56 2.15%Nifty Futures 2,335.05 4.30%CPs, CDs and Term Deposits 402.00 0.74%ICICI Bank Ltd 402.00 0.74%Cash, Call, CBLO & Reverse Repo 7,073.48 13.01%Other Current Assets (1,981.10) -3.64%Total Net Assets 54,352.37 100.00%
• Top Ten Holdings
Performance Record *- Growth Option
Sector Allocation*
*Returns >= 1 Year are CAGR, < 1 Year are Absolute. Benchmark is S&P CNXNifty. For computation of returns the allotment NAV has been taken asRs. 10.00. Past performance may or may not be sustained in future.
*Pertains to the equity investments only.
Figures as on 31-May-2007
ICICI Prudential Services Industries FundThematic Fund
Style Box
Std Dev : 6.24%Sharpe Ratio^ : 0.41Portfolio Beta : 0.80R squared : 0.50
Rs. 10000 invested at inception: Services Industries Fund Vs S&P CNX Nifty
CAGR – Service Industries : 42.77%; Benchmark : 37.96%Past performance may or may not be sustained in future.
Past performance may or may not be sustained in future. Assume Rs. 1000 invested every month.The high level of returns come from the sharp appreciation in market, in the year 2006.
19.15%
51.02%42.77%
8.63%
39.88% 37.96%
0.00%
10.00%
20.00%
30.00%
40.00%
50.00%
60.00%
Last 6 Months Last 1 years Since Inception
Services Industries Fund S&P CNX Nifty
Rs 17050.00
Rs 16196.81
8,8109,810
10,81011,81012,81013,81014,81015,81016,81017,810
Nov
-05
Dec-
05
Jan-
06
Feb-
06
Mar
-06
Apr-0
6
May
-06
Jun-
06
Jul-0
6
Aug-
06
Sep-
06
Oct
-06
Nov
-06
Dec-
06
Jan-
07
Feb-
07
Mar
-07
Apr-0
7
May
-07
Services Industries Fund S&P CNX Nifty
16.12%
13.82%
10.24%
7.51%
6.55%
5.30%
5.00%
4.55%
3.52%
3.47%
3.14%
2.15%
1.67%
1.50%
1.05%
0.00% 5.00% 10.00% 15.00% 20.00%
Software
Banks
Media & Entertainment
Pharmaceuticals
Construction
Industrial Capital Goods
Telecom Services
Auto Ancillaries
Finance
Industrial Products
Textiles - Products
Transportation
Pesticides
Power
Healthcare Services

14
PortfolioCompany/Issuer Mkt Value (Rs. Lakh) % to NAV
ICICI Prudential FMCG FundThematic Fund
Snapshot:
Fund Manager : Prashant KothariIndicative Investment Horizon: 5 yrs & moreInception date: 31-03-1999Fund Size: Rs. 80.39 croresNAV (As on 31-May-2007):
Growth option : Rs. 41.98Dividend option : Rs. 33.41
**Expense Ratio (6 Months avg. Dec 06-May 07): 2.50%
**This is a close approximation of the number.
WHY SHOULD ONE INVEST?Long term investment of funds for capital appreciation in FMCG sector
Performance Record* - Growth Option
Rs. 10000 invested at inception: FMCG Vs CNX FMCG Index
CAGR – FMCG : 19.19%; Benchmark : 6.00%Past performance may or may not be sustained in future.
Sector Allocation*
*Returns < 1Year : Absolute, > = 1Year : CAGR. Benchmark is CNX FMCGIndex. For computation of returns the allotment NAV has been taken asRs. 10.00. Past performance may or may not be sustained in future.
SIP Returns: As on 31-May-2007
Period SIP Start Date Total Amount Total No. Market Value SIPInvested of Units Returns
1 Year SIP 30-Jun-06 12,000.00 312.55 13,120.85 21.10%
3 Year SIP 30-Jun-04 36,000.00 1,510.28 63,401.55 42.74%
5 Year SIP 28-Jun-02 60,000.00 4,121.45 173,018.47 45.23%
Since Inception 31-Mar-99 99,000.00 8,141.35 341,773.87 29.50%
Quantitative Indicators:
Average P/E : 38Average P/BV : 4.71Average Dividend Yield : 1.38Annual Portfolio Turnover Ratio : 0.87 times
Consumer Non-Durable 6,147.03 76.47%• ICI India Ltd 1,417.94 17.64%• Marico Industries Ltd 1,031.39 12.83%• Gillette India Ltd 787.82 9.80%• Asian Paints Ltd 673.15 8.37%• Pidilite Industries Ltd 659.62 8.20%• Proctor & Gamble Hygiene and Healthcare Limited 462.73 5.76%• Hindustan Lever Ltd 307.13 3.82%• ITC Limited 298.73 3.72%
ITC Limited-Futures 254.84 3.17%Radico Khaitan Ltd 253.68 3.16%Retailing 1,540.11 19.15%
• Trent Ltd 889.47 11.06%• Pantaloon Retail (India) Ltd 650.64 8.09%
Textiles - Products 278.34 3.46%Page Industries Ltd 278.34 3.46%CPs, CDs and Term Deposits 90.00 1.12%ICICI Bank Ltd 90.00 1.12%Cash, Call, CBLO & Reverse Repo 378.10 4.70%Other Current Assets (394.13) -4.90%Total Net Assets 8,039.45 100.00%
• Top Ten Holdings
Style Box
Figures as on 31-May-2007
*Pertains to the equity investments only.
Portfolio turnover has been computed as the ratio of the higher value of average purchase and averagesales, to the average net assets in the past one year (since inception for schemes that have not completeda year). The figures are not netted for derivative transactions.
^ Risk-free rate based on the last 3 month T-Bill cut-off.
Past performance may or may not be sustained in future. Assume Rs. 1000 invested every month. Thehigh level of returns come from the sharp appreciation in market, in the year 2002, 2004 & 2006.
Std Dev : 6.54%Sharpe Ratio^ : 0.52Portfolio Beta : 0.70R squared : 0.53
2.07%14.08%
56.65%
38.27%
19.19%
-5.17%
1.33%
33.06%
18.51%6.00%
-10.00%0.00%
10.00%20.00%30.00%40.00%50.00%60.00%
Last 6Months
Last 1years
Last 3years
Last 5years
SinceInception
FMCG Fund CNX FMCG Index
Rs 41980.00
Rs 16096.29
5,85310,85315,85320,85325,85330,85335,85340,85345,853
Mar
-99
Sep-
99
Mar
-00
Sep-
00
Mar
-01
Sep-
01
Mar
-02
Sep-
02
Mar
-03
Sep-
03
Mar
-04
Sep-
04
Mar
-05
Sep-
05
Mar
-06
Sep-
06
Mar
-07
FMCG Fund CNX FMCG Index
76.47%
19.15%
3.46%
0.00% 20.00% 40.00% 60.00% 80.00% 100.00%
Consumer Non-
Durable
Retailing
Textiles - Products

15
Quantitative Indicators:
PortfolioCompany/Issuer Mkt Value (Rs. Lakh) % to NAV
ICICI Prudential Technology FundSector Fund
Snapshot:Fund Manager : Nimesh ChandanIndicative Investment Horizon: 5 yrs & moreInception date: 03-03-2000Fund Size: Rs. 180.45 croresNAV (As on 31-May-2007):
Growth option: Rs. 16.43**Expense Ratio (6 Months avg. Dec 06-May 07): 2.40%
**This is a close approximation of the number.
WHY SHOULD ONE INVEST?Long term investment of funds for capital appreciation in technology sector
Consultancy 25.82 0.14%Quality Assurance Institute (I) Ltd 25.82 0.14%Hardware 560.85 3.11%Cambridge Solutions Ltd 560.85 3.11%Industrial Capital Goods 378.67 2.10%Solectron Centum Electronics Ltd 378.67 2.10%Media & Entertainment 2,190.81 12.14%
• Deccan Chronicle Holdings Ltd 2,190.81 12.14%Pharmaceuticals 1,755.38 9.72%Elder Pharmaceuticals Ltd 585.30 3.24%Indoco Remedies Ltd 479.74 2.66%Plethico Pharmaceuticals Ltd 399.30 2.21%Glenmark Pharmaceuticals Ltd 291.04 1.61%Software 12,148.93 67.34%
• Nucleus Software Exports Ltd 1,626.11 9.01%• Subex Azure Ltd 1,207.34 6.69%• Tata Consultancy Services Ltd 1,134.23 6.29%• 3i Infotech Ltd 956.04 5.30%• Tech Mahindra Ltd 746.41 4.14%• HCL Technologies Ltd 709.16 3.93%• Infotech Enterprises Ltd 691.22 3.83%• Tulip IT Services Ltd 627.34 3.48%
Sasken Communications Technologies Ltd 568.92 3.15%Tanla Solutions Ltd 560.45 3.11%Geometric Software Solutions Ltd 468.97 2.60%Hexaware Technologies Ltd 466.57 2.59%Infosys Technologies Ltd 465.64 2.58%Mphasis BFL Software Ltd 455.00 2.52%Geodesic Information Systems Ltd 404.71 2.24%Megasoft Ltd 364.89 2.02%Zenith Infotech Ltd 353.40 1.96%Wipro Ltd 342.53 1.90%Telecom Services 616.00 3.41%
• Avaya Global Connect Ltd 616.00 3.41%CPs, CDs and Term Deposits 300.00 1.66%UTI Bank Ltd 300.00 1.66%Cash, Call, CBLO & Reverse Repo 459.40 2.55%Other Current Assets (390.42) -2.17%
Total Net Assets 18,045.44 100.00%
• Top Ten Holdings
Performance Record *- Growth Option
Rs. 10000 invested at inception: Technology Fund Vs BSE Tech Index
CAGR – Technology Fund: 7.09%; Benchmark : -2.63%Past performance may or may not be sustained in future.
Sector Allocation*
*Returns < 1Year : Absolute, > = 1Year : CAGR. Benchmark is BSE Tech Index.For computation of returns the allotment NAV has been taken as Rs. 10.00.Past performance may or may not be sustained in future.
SIP Returns: As on 31-May-2007
Period SIP Start Date Total Amount Total No. Market Value SIPInvested of Units Returns
1 Year SIP 30-Jun-06 12,000.00 919.64 15,109.69 61.90%
3 Year SIP 30-Jun-04 36,000.00 4,134.24 67,925.56 48.52%
5 Year SIP 28-Jun-02 60,000.00 11,110.91 182,552.25 47.68%
Since Inception 3-Mar-00 88,000.00 18,381.58 302,009.36 33.62%
Average P/E : 30Average P/BV : 5.70Average Dividend Yield : 0.65Annual Portfolio Turnover Ratio : 0.92 times
Style Box
*Pertains to the equity investments only.
Portfolio turnover has been computed as the ratio of the higher value of average purchase and averagesales, to the average net assets in the past one year (since inception for schemes that have not completeda year). The figures are not netted for derivative transactions.
^ Risk-free rate based on the last 3 month T-Bill cut-off.
Figures as on 31-May-2007
Past performance may or may not be sustained in future. Assume Rs. 1000 invested every month. Thehigh level of returns come from the sharp appreciation in market, in the year 2002, 2004 and 2006.
Std Dev : 6.85%Sharpe Ratio^ : 0.45Portfolio Beta : 0.91R squared : 0.56
19.58%
51.57% 50.60%
39.12%
7.09%4.11%
51.08%47.02%
33.79%
-2.63%-10.00%0.00%
10.00%20.00%30.00%40.00%50.00%60.00%
Last 6Months
Last 1years
Last 3years
Last 5years
SinceInception
Technology Fund BSE Tech Index
Rs 16430.00
Rs 8243.16
1,1773,1775,1777,1779,177
11,17713,17715,17717,17719,177
Mar
-00
Aug-
00
Jan-
01Ju
n-01
Nov-
01Ap
r-02
Sep-
02Fe
b-03
Jul-0
3De
c-03
May
-04
Oct-0
4M
ar-0
5Au
g-05
Jan-
06Ju
n-06
Nov-
06Ap
r-07
Technology Fund BSE Tech Index
67.34%
12.14%
9.72%
3.41%
3.11%
2.10%
0.14%
0.00% 20.00% 40.00% 60.00% 80.00%
Software
Media & Entertainment
Pharmaceuticals
Telecom Services
Hardware
Industrial Capital Goods
Consultancy

16
SIP Returns: As on 31-May-2007
Period SIP Start Date Total Amount Total No. Market Value SIPInvested of Units Returns
1 Year SIP 30-Jun-06 12,000.00 363.82 13,921.94 37.04%3 Year SIP 30-Jun-04 36,000.00 1,633.48 62,506.75 41.56%5 Year SIP 28-Jun-02 60,000.00 3,946.27 151,007.97 39.11%Since Inception 26-Feb-02 65,000.00 4,478.38 171,369.69 37.47%
PortfolioCompany/Issuer Mkt Value (Rs. Lakh) % to NAV
ICICI Prudential Index FundIndex Fund
Snapshot:Fund Manager : Yogesh BhattIndicative Investment Horizon: 5 yrs & moreInception date: 26-02-2002Fund Size: Rs. 16.41 croresNAV (As on 31-May-2007): Rs. 38.2660**Expense Ratio (6 Months avg. Dec 06-May 07): 1.25%
**This is a close approximation of the number.
WHY SHOULD ONE INVEST?Long term investment of funds for capital appreciation
by replicating S&P CNX Nifty index
Auto 76.81 4.68%Tata Motors Ltd 20.62 1.26%Maruti Udyog Ltd 16.71 1.02%Bajaj Auto Ltd 15.95 0.97%Mahindra & Mahindra Ltd 13.17 0.80%Hero Honda Ltd 10.36 0.63%Banks 146.86 8.95%
• ICICI Bank Ltd 58.53 3.57%• State Bank of India Ltd 50.46 3.07%
HDFC Bank Ltd 25.92 1.58%Punjab National Bank Ltd 11.95 0.73%Cement 39.61 2.41%Grasim Industries Ltd 16.15 0.98%Gujarat Ambuja Cement Ltd 12.18 0.74%Associated Cement Companies Ltd 11.28 0.69%Chemicals 7.59 0.46%Indian Petrochemicals Corporation Ltd 7.59 0.46%Consumer Non-Durable 81.52 4.97%Dabur India Ltd 6.10 0.37%ITC Limited 43.64 2.66%Hindustan Lever Ltd 31.78 1.94%Ferrous Metals 66.84 4.07%Steel Authority of India Ltd 41.03 2.50%Tata Steel Ltd 25.81 1.57%Finance 33.70 2.05%HDFC Ltd 33.70 2.05%Gas 18.28 1.11%Gas Authority of India Ltd 18.28 1.11%Industrial Capital Goods 148.46 9.05%
• Bharat Heavy Electricals Ltd 48.52 2.96%Larsen & Toubro Limited 40.16 2.45%Suzlon Energy Ltd 30.76 1.87%Siemens India Ltd 15.30 0.93%ABB Ltd 13.72 0.84%Media & Entertainment 9.63 0.59%Zee Entertainment Enterprises Ltd 9.63 0.59%Non-Ferrous Metals 45.07 2.74%Sterlite Industries (India) Ltd 21.52 1.31%Hindalco Industries Ltd 12.22 0.74%National Aluminium Company Limited 11.33 0.69%Oil 139.67 8.51%
• Oil & Natural Gas Company Ltd 139.67 8.51%Petroleum Products 221.80 13.51%Bharat Petroleum Corporation Ltd 9.24 0.56%Hindustan Petroleum Corporation Ltd 7.08 0.43%
• Reliance Industries Ltd 205.48 12.52%Pharmaceuticals 53.95 3.29%Glaxo Smithkline Pharma Ltd 7.70 0.47%Dr. Reddy’s Laboratories Ltd 7.69 0.47%Sun Pharma Advanced Research Co. Ltd 0.95 0.06%Sun Pharmaceuticals Limited 15.41 0.94%Cipla Ltd 11.97 0.73%Ranbaxy Laboratories Ltd 10.23 0.62%Power 16.89 1.03%Reliance Energy Ltd 8.70 0.53%Tata Power Company Ltd 8.19 0.50%Software 255.26 15.56%
• Tata Consultancy Services Ltd 83.69 5.10%• Infosys Technologies Ltd 77.75 4.74%• Wipro Ltd 55.62 3.39%
Satyam Computer Services Ltd 22.02 1.34%HCL Technologies Ltd 16.18 0.99%Telecom Services 203.38 12.40%Videsh Sanchar Nigam Ltd 9.39 0.57%Mahanagar Telephone Nigam Ltd 6.82 0.42%
• Bharti Airtel Ltd 114.00 6.95%• Reliance Communications Ventures Ltd 73.17 4.46%
Nifty Futures 74.84 4.56%Cash, Call, CBLO & Reverse Repo 243.90 14.86%Other Current Assets (242.97) -14.80%Total Net Assets 1,641.09 100.00%
• Top Ten Holdings
Performance Record *- Cumulative Option
Rs. 10000 invested at inception: Index Fund Vs S&P CNX Nifty
CAGR – Index Fund : 29.06%; Benchmark : 27.65%Past performance may or may not be sustained in future.
Sector Allocation*
*Returns >= 1 Year are CAGR, < 1 Year are Absolute. Benchmark is S&P CNXNifty. For computation of returns the allotment NAV has been taken asRs. 10.00. Past performance may or may not be sustained in future.
Quantitative Indicators:
Average P/E : 23Average P/BV : 4.42Average Dividend Yield : 1.25Annual Portfolio Turnover Ratio : 3.64 times
*Pertains to the equity investments only.
Portfolio turnover has been computed as the ratio of the higher value of average purchase and averagesales, to the average net assets in the past one year (since inception for schemes that have not completeda year). The figures are not netted for derivative transactions.
^ Risk-free rate based on the last 3 month T-Bill cut-off.
Figures as on 31-May-2007
Past performance may or may not be sustained in future. Assume Rs. 1000 invested every month. Thehigh level of returns come from the sharp appreciation in market, in the year 2002, 2004 & 2006.
Std Dev : 5.67%Sharpe Ratio^ : 0.48Portfolio Beta : 1.01R squared : 1.00
9.06%
41.76%45.45%
34.43%29.06%
8.63%
39.88% 42.53%33.07%
27.65%
0.00%5.00%
10.00%15.00%20.00%25.00%30.00%35.00%40.00%45.00%50.00%
Last 6Months
Last 1years
Last 3years
Last 5years
SinceInception
Index Fund S&P CNX Nifty
Rs 38266.00
Rs 36117.37
7,708
12,70817,708
22,708
27,708
32,70837,708
42,708
Feb-
02M
ay-0
2Au
g-02
Nov
-02
Feb-
03M
ay-0
3Au
g-03
Nov
-03
Feb-
04M
ay-0
4Au
g-04
Nov
-04
Feb-
05M
ay-0
5Au
g-05
Nov
-05
Feb-
06M
ay-0
6Au
g-06
Nov
-06
Feb-
07M
ay-0
7
Index Fund S&P CNX Nifty
15.56%
13.51%
12.40%
9.05%
8.95%
8.51%
4.97%
4.68%
4.07%
3.29%
2.74%
2.41%
2.05%
1.11%
1.03%
0.59%
0.46%
0.00% 5.00% 10.00% 15.00% 20.00%
Software
Petroleum Products
Telecom Services
Industrial Capital
Banks
Oil
Consumer Non-Durable
Auto
Ferrous Metals
Pharmaceuticals
Non-Ferrous Metals
Cement
Finance
Gas
Power
Media & Entertainment
Chemicals

17
Quantitative Indicators:
Average P/E : 22Average P/BV : 4.65Average Dividend Yield : 1.15Annual Portfolio Turnover Ratio : 0.54 times
Portfolio
SPIcE FundIndex Fund
Snapshot:Fund Manager : Yogesh BhattInvestment Horizon: 5 years & moreInception date: 10-01-2003Fund Size: Rs. 0.80 croresNAV (As on 31-May-2007): Rs. 149.0809**Expense Ratio (6 Months avg. Dec 06-May 07): 0.80%
**This is a close approximation of the number.
WHY SHOULD ONE INVEST?Long term investment of funds for capital appreciation by replicating the BSE Sensitive Index
Auto 4.19 5.22%
Tata Motors Ltd 1.47 1.83%
Bajaj Auto Ltd 1.31 1.63%
Maruti Udyog Ltd 0.79 0.99%
Hero Honda Ltd 0.62 0.77%
Banks 12.11 15.12%
• ICICI Bank Ltd 6.97 8.70%
• State Bank of India Ltd 2.69 3.36%
HDFC Bank Ltd 2.45 3.06%
Cement 3.24 4.04%
Grasim Industries Ltd 1.43 1.78%
Gujarat Ambuja Cement Ltd 1.01 1.26%
Associated Cement Companies Ltd 0.80 1.00%
Consumer Non-Durable 5.52 6.89%
• ITC Limited 3.63 4.53%
Hindustan Lever Ltd 1.89 2.36%
Ferrous Metals 2.16 2.70%
Tata Steel Ltd 2.16 2.70%
Finance 3.59 4.48%
• HDFC Ltd 3.59 4.48%
Industrial Capital Goods 6.29 7.85%
• Larsen & Toubro Limited 4.28 5.34%
Bharat Heavy Electricals Ltd 2.01 2.51%
Non-Ferrous Metals 1.04 1.30%
Hindalco Industries Ltd 1.04 1.30%
Oil 3.29 4.11%
• Oil & Natural Gas Company Ltd 3.29 4.11%
Petroleum Products 10.33 12.89%
• Reliance Industries Ltd 10.33 12.89%
Pharmaceuticals 2.47 3.08%
Cipla Ltd 0.93 1.16%
Ranbaxy Laboratories Ltd 0.85 1.06%
Dr. Reddy’s Laboratories Ltd 0.69 0.86%
Power 2.37 2.96%
National Thermal Power Corporation Ltd 1.65 2.06%
Reliance Energy Ltd 0.72 0.90%
Software 13.67 17.06%
• Infosys Technologies Ltd 7.85 9.80%
Satyam Computer Services Ltd 2.49 3.11%
Tata Consultancy Services Ltd 1.99 2.48%
Wipro Ltd 1.34 1.67%
Telecom Services 7.79 9.73%
• Bharti Airtel Ltd 4.74 5.92%
• Reliance Communications Ventures Ltd 3.05 3.81%
Cash, Call, CBLO & Reverse Repo 6.40 7.99%
Other Current Assets (4.33) -5.42%
Total Net Assets 80.13 100.00%• Top Ten Holdings
Performance Record* - Growth Option
Rs. 10000 invested at inception: SPICE Vs BSE Sensitive Index
CAGR – SPIcE Fund : 40.43%; Benchmark : 39.64%Past performance may or may not be sustained in future.
Sector Allocation*
*Returns < 1Year : Absolute, > = 1Year : CAGR. Benchmark is BSE SENSEXIndex.For computation of returns the allotment NAV has been taken asRs. 10.00. Past performance may or may not be sustained in future.
Company/Issuer Mkt Value (Rs. Lakh) % to NAV
*Pertains to the equity investments only.
Portfolio turnover has been computed as the ratio of the higher value of average purchase and averagesales, to the average net assets in the past one year (since inception for schemes that have not completeda year). The figures are not netted for derivative transactions.
^ Risk-free rate based on the last 3 month T-Bill cut-off.
Figures as on 31-May-2007
Std Dev : 5.45%Sharpe Ratio^ : 0.50Portfolio Beta : 0.99R squared : 1.00
6.21%
40.37%
45.61%40.43%
6.19%
39.87%45.11%
39.64%
0.00%5.00%
10.00%15.00%20.00%25.00%30.00%35.00%40.00%45.00%50.00%
Last6 Months
Last1 years
Last3 years
SinceInception
SPIcE Fund BSE SENSEX
Rs 44382.52
Rs 43300.10
8,65513,65518,65523,65528,65533,65538,65543,65548,655
Jan-
03Ap
r-03
Jul-0
3O
ct-0
3Ja
n-04
Apr-0
4Ju
l-04
Oct
-04
Jan-
05Ap
r-05
Jul-0
5O
ct-0
5Ja
n-06
Apr-0
6Ju
l-06
Oct
-06
Jan-
07Ap
r-07
SPIcE Fund BSE SENSEX
17.06%
15.12%
12.89%
9.73%
7.85%
6.89%
5.22%
4.48%
4.11%
4.04%
3.08%
2.96%
2.70%
1.30%
0.00% 5.00% 10.00% 15.00% 20.00%
Software
Banks
Petroleum Products
Telecom Services
Industrial Capital Goods
Consumer Non-Durable
Auto
Finance
Oil
Cement
Pharmaceuticals
Power
Ferrous Metals
Non-Ferrous Metals

18
Quantitative Indicators – Debt Component Quantitative Indicators – Equity Component
Average Maturity : 2.13 yearsModified Duration : 1.43 yearsYield To Maturity : 8.78%
Average P/E : 29Average P/BV : 4.69Average Dividend Yield : 0.96
SIP Returns: As on 31-May-2007
Period SIP Start Date Total Amount Total No. Market Value SIPInvested of Units Returns
1 Year SIP 30-Jun-06 12,000.00 645.83 12,438.75 8.09%3 Year SIP 29-Jun-04 36,000.00 2,154.09 41,487.99 9.96%5 Year SIP 28-Jun-02 60,000.00 3,963.19 76,331.44 9.87%Since Inception 10-Nov-00 80,000.00 5,781.72 111,356.51 10.00%
Past performance may or may not be sustained in future. Assume Rs. 1000 invested every month.
ICICI Prudential Monthly Income Plan
Snapshot:Fund Managers: Equity : Prashant Kothari
Debt : Chaitanya PandeIndicative Investment Horizon: 1 yr & aboveInception date: 10-11-2000Fund Size: Rs. 581.85 croresNAV (As on 31-May-2007): Cumulative option : Rs. 19.2601**Expense Ratio (6 Months avg. Dec 06-May 07): 1.94%**This is a close approximation of the number.
WHY SHOULD ONE INVEST?Medium term investment in a portfolio of debtand equity (upto 15%) for capital appreciation.
Rs. 10000 invested at inception*: MIP Vs Crisil MIP Blended Index
Performance Record* - Cumulative Option
Rating Profile (as % of debt holding)
*Benchmark start date : 31-03-2002. CAGR – MIP: 9.98%; Benchmark :8.99%. Benchmark is Crisil MIP Blended Index. Past performance may or maynot be sustained in future.
*Returns >= 1 Year are CAGR, < 1 Year are Absolute. Benchmark is Crisil MIPBlended Index. Start date: 31/3/02. For computation of returns the allotmentNAV has been taken as Rs. 10.00. Past performance may or may not besustained in future.
Equity Holdings 8,768.44 15.08%Bharti Airtel Ltd Telecom Services 1,146.49 1.97%Tata Consultancy Services Ltd Software 633.66 1.09%ICICI Bank Ltd Banks 623.18 1.07%Infosys Technologies Ltd Software 600.15 1.03%ICI India Ltd Consumer Non-Durable 515.19 0.89%3i Infotech Ltd Software 465.15 0.80%Deccan Chronicle Holdings Ltd Media & Entertainment 410.62 0.71%ITC Limited Consumer Non-Durable 395.04 0.68%Firstsource Solutions Ltd Software 391.57 0.67%Exide Industries Ltd Auto Ancillaries 369.20 0.63%Pantaloon Retail (India) Ltd Retailing 323.25 0.56%Trent Ltd Retailing 300.63 0.52%Andhra Bank Ltd Banks 287.76 0.49%Patel Engineering Ltd Construction 281.65 0.48%Cadila Healthcare Ltd Pharmaceuticals 267.68 0.46%Aventis Pharma Ltd Pharmaceuticals 231.95 0.40%Proctor & Gamble Hygiene andHealthcare Limited Consumer Non-Durable 192.94 0.33%Wipro Ltd Software 190.30 0.33%Mahindra & Mahindra Ltd Auto 189.36 0.33%Siemens India Ltd Industrial Capital Goods 166.15 0.29%Punjab National Bank Ltd Banks 133.96 0.23%AIA Engineering Ltd Industrial Products 53.83 0.09%Nifty Futures 598.73 1.03%Debt Holdings 47,373.76 81.41%PSU/PFI Bonds 12,165.70 20.91%
• Power Finance Corporation Ltd AAA 4,790.06 8.23%• Nabard AAA 4,041.19 6.95%
Infrastructure Development Finance Corp. AAA 2,385.26 4.10%Export Import Bank of India Ltd AAA 949.19 1.63%Private Corporate Securities 30,520.32 52.45%
• Sundaram Finance Ltd AAA 5,000.00 8.59%• PTC Credit Asset Trust Series HSBC F1+SO 3,531.31 6.07%• PTC IBL Trust IndusInd Bank AAA(SO) 2,753.82 4.73%
TGS Investment & Trade Pvt. Ltd. A1+ 2,500.00 4.30%GE Countrywide Finacial Services Ltd AAA 2,500.00 4.30%PTC Birla Home Finance GECSI AA(SO) 2,500.00 4.30%Mahindra & Mahindra Financial Services Ltd AA+ 2,000.00 3.44%PTC RPS Tata Teleservices AAA(SO) 1,658.82 2.85%PTC Hero Motors Ltd A1+(SO) 1,200.00 2.06%Tata Sons Ltd AAA 1,194.77 2.05%PTC IPGE Loan Trust GECapital Services India Ltd F1+SO 1,105.04 1.90%DSP Merill Lynch Capital Ltd P1+ 1,000.00 1.72%HDFC Bank Ltd AAA 999.90 1.72%UTI Bank Ltd AAA 886.76 1.52%PTC Shriram Transport F1+ 605.93 1.04%PTC Citi Fleet Trust Citibank AAA(SO) 546.65 0.94%HDFC Ltd AAA 298.21 0.51%PTC TAS Trust Tata Sons A1+(SO) 112.98 0.19%PTC RTL Trust Centurion Bank AAA(SO) 107.99 0.19%India Infrastructure Developers Ltd A1+(SO) 18.14 0.03%Government Securities 987.70 1.70%8.33% GOI 2036 Sovereign 987.70 1.70%CPs, CDs and Term Deposits 3,348.74 5.75%UTI Bank Ltd P1+ 2,490.00 4.28%ICICI Bank Ltd P1+ 811.00 1.39%Kotak Mahindra Bank Ltd P1+ 47.74 0.08%Cash, Call, CBLO & Reverse Repo 351.30 0.60%Other Current Assets 2,042.72 3.51%
Total Net Assets 58,184.92 100.00%• Top Five Holdings
PortfolioCompany/Issuer Sector/Rating Mkt Value (Rs. Lakh) % to NAV
Maturity Profile (as % of debt holding)
(An open ended fund. Monthly income is not assured and is subject to the availability of distributable surplus.)
% Unlisted Bonds : 22.07%
Figures as on 31-May-2007
Style Box:
Debt Equity
47.70%
18.50%
14.49%
10.82%
4.13%
2.36%
2.00%
0.00% 15.00% 30.00% 45.00% 60.00%
<182 days
3-5 years
1-3 years
182 days - 1 year
Other Current Assets
5-10 years
> 10 years
2.13%
8.57%10.33% 10.09% 10.51%
2.11%
8.88%8.19%
9.46%
0.00%
2.00%
4.00%6.00%
8.00%
10.00%
12.00%
Last 6Months
Last 1years
Last 3years
Last 5years
SinceInception
Monthly Income Plan Crisil MIP Blended index
Rs 16346.78
Rs 15595.96
9,823
10,823
11,823
12,823
13,823
14,823
15,823
16,823
Apr-0
2Ju
l-02
Oct
-02
Jan-
03Ap
r-03
Jul-0
3O
ct-0
3Ja
n-04
Apr-0
4Ju
l-04
Oct
-04
Jan-
05Ap
r-05
Jul-0
5O
ct-0
5Ja
n-06
Apr-0
6Ju
l-06
Oct
-06
Jan-
07Ap
r-07
Monthly Income Plan Crisil MIP Blended index
Sovereign Securities2.00%
AA and Equivalent
9.11%
Call,Current Assets and
Reverse Repos4.84%
AAA and Equivalent84.05%

19
Performance Record* - Cumulative option
SIP Returns As on 31-May-2007
Period SIP Start Date Total Amount Total No. Market Value SIPInvested of Units Returns
1 Year SIP 30-Jun-06 12,000.00 857.18 12,583.23 10.80%3 Year SIP 29-Jun-04 36,000.00 2,979.95 43,745.07 13.80%Since Inception 30-Mar-04 40,000.00 3,384.04 49,677.03 13.74%
Sector Allocation (as % of the equity portfolio)*
Quantitative Indicators – Equity Component
Average P/E : 26Average P/BV : 4.30Average Dividend Yield : 0.98
Quantitative Indicators – Debt Component
Average Maturity : 0.94 yearsModified Duration : 0.80 yearsYield To Maturity : 7.78%% Unlisted Bonds : 12.67%
Rating Profile (as % of debt holdings)
ICICI Prudential Income Multiplier Fund
Snapshot:Fund Managers : Equity : Prashant Kothari
Debt : Chaitanya PandeIndicative Investment Horizon: 1 yr & aboveInception date: 30-03-2004Fund Size: Rs. 464.00 croresNAV (As on 31-May-2007):Cumulative option: Rs. 14.6798 Dividend option: Rs. 11.9275**Expense Ratio (6 Months avg. Dec 06-May 07): 2.01%**This is a close approximation of the number.
WHY SHOULD ONE INVEST?Medium term investment in a portfolio of debt and
equity (upto 30%) for capital appreciation.
Rs. 10000 invested at inception: IMP Vs Crisil MIP Blended Index
CAGR – Income Multiplier Fund : 12.87%; Benchmark : 6.91%Benchmark is Crisil MIP Blended Index.Past performance may or may not be sustained in future.
*Returns >= 1 Year are CAGR, < 1 Year are Absolute. Benchmark is Crisil MIPBlended Index. For computation of returns the allotment NAV has been takenas Rs. 10.00. Past performance may or may not be sustained in future.
Equity Holdings 11,489.15 24.77%Bharti Airtel Ltd Telecom Services 1,622.92 3.50%Tata Consultancy Services Ltd Software 959.91 2.07%ICI India Ltd Consumer Non-Durable 753.51 1.62%ICICI Bank Ltd Banks 599.29 1.29%Exide Industries Ltd Auto Ancillaries 585.34 1.26%Marico Industries Ltd Consumer Non-Durable 582.46 1.26%Pidilite Industries Ltd Consumer Non-Durable 576.30 1.24%Trent Ltd Retailing 528.85 1.14%Cadila Healthcare Ltd Pharmaceuticals 453.93 0.98%Infosys Technologies Ltd Software 407.84 0.88%Blue Star Ltd Consumer Durables 405.08 0.87%Finolex Cables Ltd Industrial Products 385.88 0.83%Siemens India Ltd Industrial Capital Goods 383.43 0.83%Pantaloon Retail (India) Ltd Retailing 370.75 0.80%Subros Ltd Auto Ancillaries 327.20 0.71%Megasoft Ltd Software 325.39 0.70%Vimta Labs Ltd Healthcare Services 308.47 0.66%Proctor & Gamble Hygiene andHealthcare Limited Consumer Non-Durable 293.27 0.63%Karur Vysya Bank Ltd Banks 278.17 0.60%Punjab National Bank Ltd Banks 267.93 0.58%Glaxo Smithkline Pharma Ltd Pharmaceuticals 264.83 0.57%Wipro Ltd Software 244.67 0.53%Mahindra & Mahindra Ltd Auto 227.30 0.49%FDC Ltd Pharmaceuticals 198.00 0.43%Alembic Ltd Pharmaceuticals 138.43 0.30%Debt Holdings 34,490.14 74.37%PSU/PFI Bonds 4,874.90 10.51%
• Nabard AAA 2,494.56 5.38%Infrastructure Development FinanceCorporation AAA 1,431.15 3.08%Export Import Bank of India Ltd AAA 949.19 2.05%Private Corporate Securities 22,118.54 47.70%
• PTC Credit Asset Trust Series HSBC F1+SO 4,035.78 8.70%• PTC Birla Home Finance GECSI AA(SO) 2,500.00 5.39%• Sundaram Finance Ltd AA+ 2,500.00 5.39%• CitiFinancial Consumer Finance India Ltd AAA 2,426.43 5.23%
PTC IBL Trust IndusInd Bank AAA(SO) 2,019.47 4.35%Tata Sons Ltd AAA 1,593.03 3.43%Rabo India Finance Ltd AAA 1,019.81 2.20%PTC Hero Motors Ltd A1+(SO) 1,000.00 2.16%Mahindra & Mahindra FinancialServices Ltd AA+ 1,000.00 2.16%DSP Merill Lynch Capital Ltd P1+ 1,000.00 2.16%TGS Investment & Trade Pvt. Ltd. A1+ 1,000.00 2.16%Kotak Mahindra Primus Ltd AA 809.94 1.75%Grasim Industries Ltd AAA 588.30 1.27%PTC RPS Tata Teleservices AAA(SO) 580.59 1.25%PTC TAS Trust Tata Sons A1+(SO) 45.19 0.10%Government Securities 25.81 0.06%8.15% GOI 2022 Sovereign 25.81 0.06%CPs, CDs and Term Deposits 2,927.00 6.31%UTI Bank Ltd P1+ 2,500.00 5.39%ICICI Bank Ltd P1+ 427.00 0.92%Cash, Call, CBLO & Reverse Repo 4,543.89 9.79%Other Current Assets 420.75 0.86%Total Net Assets 46,400.04 100.00%
• Top Five Holdings
PortfolioCompany/Issuer Sector/Rating Mkt Value (Rs. Lakh) % to NAV
Maturity Profile (as % of debt holdings)
Figures as on 31-May-2007
Style Box:
Past performance may or may not be sustained in future. Assume Rs. 1000 invested every month.
EquityDebt
*Pertains to the equity positions only.
58.59%
20.39%
10.05%
9.68%
0.07%
1.21%
0.00% 20.00% 40.00% 60.00% 80.00%
<182 days
1-3 years
182 days - 1 year
3-5 years
Other Current Assets
> 10 years
3.12%
11.43%
15.20%12.87%
2.11%
8.88% 8.19%6.91%
0.00%2.00%4.00%6.00%8.00%
10.00%12.00%14.00%16.00%
Last6 Months
Last1 years
Last3 years
SinceInception
Income Multiplier Crisil MIP Blended index
Rs 14702.88
Rs 12245.08
9,444
10,444
11,444
12,444
13,444
14,444
15,444
Apr-0
4Ju
n-04
Aug-
04O
ct-0
4De
c-04
Feb-
05Ap
r-05
Jun-
05Au
g-05
Oct
-05
Dec-
05Fe
b-06
Apr-0
6Ju
n-06
Aug-
06O
ct-0
6De
c-06
Feb-
07Ap
r-07
Income Multiplier Crisil MIP Blended index
19.20%
16.86%
14.13%
9.97%
9.18%
7.94%
7.83%
3.53%
3.36%
3.34%
2.68%
1.98%
0.00% 5.00% 10.00% 15.00% 20.00% 25.00%
Consumer Non-Durable
Software
Telecom Services
Banks
Pharmaceuticals
Auto Ancillaries
Retailing
Consumer Durables
Industrial Products
Industrial Capital Goods
Healthcare Services
Auto
AAA and Equivalent66.20%
Call,Current Assets and
Reverse Repos14.22%
AA and Equivalent19.51%
Sovereign Securities0.07%

20
Fund Manager's Comment
The ✓ extending beyond the red portion represents the marginal change in the style of the portfolio.Equity allocation to large cap stocks has been increased to protect capital at current valuations.
Sector Allocation* (as % of equity portfolio)
SIP Returns As on 31-May-2007
Period SIP Start Date Total Amount Total No. Market Value SIPInvested of Units Returns
1 Year SIP 30-Jun-06 12,000.00 317.45 13,497.97 28.52%3 Year SIP 30-Jun-04 36,000.00 1,259.53 53,555.22 29.13%5 Year SIP 28-Jun-02 60,000.00 3,058.90 130,064.43 32.51%Since Inception 31-Aug-01 70,000.00 4,019.21 170,896.81 31.53%
Figures as on 31st Aug, 2004Figures as on 31st Aug, 2004
ICICI Prudential Child Care Plan (Gift)WHY SHOULD ONE INVEST?
For your child between 1-13 years and seeking to saveover a long term horizon
Snapshot:Fund Managers: Equity : Munzal Shah
Debt : Pankaj KajiIndicative Investment Horizon: 6-17 yrsInception date: 31-08-2001Fund Size: Rs. 114.54 croresNAV (As on 31-May-2007) : Rs. 42.52**Expense Ratio (6 Months avg. Dec 06-May 07): 2.00%**This is a close approximation of the number.
Equity Holdings 7,838.75 68.46%• Containers Corporation of India Ltd Transportation 377.83 3.30%• Provogue (India) Ltd Textiles - Products 343.49 3.00%• Asian Paints Ltd Consumer Non-Durable 331.82 2.90%
Thermax Ltd Industrial Capital Goods 325.85 2.84%Megasoft Ltd Software 325.27 2.84%Federal Bank Ltd Banks 318.18 2.78%Aditya Birla Nuvo Ltd Textiles - Products 316.40 2.76%Indoco Remedies Ltd Pharmaceuticals 310.22 2.71%Bharti Airtel Ltd Telecom Services 297.24 2.60%Gillette India Ltd Consumer Non-Durable 295.41 2.58%Karur Vysya Bank Ltd Banks 286.92 2.51%Exide Industries Ltd Auto Ancillaries 276.90 2.42%ICICI Bank Ltd Banks 275.75 2.41%Tata Consultancy Services Ltd Software 254.06 2.22%ICI India Ltd Consumer Non-Durable 253.67 2.21%Marico Industries Ltd Consumer Non-Durable 252.28 2.20%3i Infotech Ltd Software 232.58 2.03%Vimta Labs Ltd Healthcare Services 229.30 2.00%Sintex Industries Ltd Industrial Products 226.25 1.98%Proctor & Gamble Hygiene andHealthcare Limited Consumer Non-Durable 216.09 1.89%Finolex Cables Ltd Industrial Products 210.14 1.83%ITC Limited Consumer Non-Durable 209.29 1.83%Orient Paper & Industries Ltd Cement 202.66 1.77%Geometric Software Solutions Ltd Software 200.52 1.75%Infosys Technologies Ltd Software 177.31 1.55%Sundaram Clayton Ltd Auto Ancillaries 174.75 1.53%Wipro Ltd Software 163.11 1.42%AIA Engineering Ltd Industrial Products 153.15 1.34%HOV Services Ltd Software 152.85 1.33%Pantaloon Retail (India) Ltd Retailing 150.85 1.32%Mahindra & Mahindra Ltd Auto 124.31 1.09%Forbes Gokak Ltd Textiles - Cotton 96.80 0.85%Kalyani Steels Ltd Ferrous Metals 42.42 0.37%Orbit Corporation Ltd Construction 27.88 0.24%Carborandum Universal Ltd Auto Ancillaries 3.64 0.03%Gujarat Apollo Equipments Ltd Industrial Capital Goods 3.56 0.03%Debt Holdings 3,405.90 29.74%Private Corporate Securities 2,269.50 19.82%
• TGS Investment & Trade Pvt. Ltd. A1+ 1,000.00 8.73%• DSP Merill Lynch Capital Ltd AAA(SO) 464.61 4.06%
Tata Sons Ltd AAA 238.95 2.09%GE Money Financial Services Ltd AAA 197.95 1.73%Reliance Industries Ltd AAA 196.72 1.72%PTC IBL Trust IndusInd Bank AAA(SO) 91.79 0.80%CitiFinancial Consumer Finance India Ltd AAA 39.30 0.34%Kotak Mahindra Primus Ltd AA 20.00 0.17%Titan Industries Ltd A 11.14 0.10%PTC TAS Trust Tata Sons A1+(SO) 9.04 0.08%CPs, CDs and Term Deposits 305.00 2.66%Allahabad Bank Ltd P1+ 300.00 2.62%ICICI Bank Ltd P1+ 5.00 0.04%Cash, Call, CBLO & Reverse Repo 831.40 7.26%Other Current Assets 208.93 1.80%Total Net Assets 11,453.58 100.00%
• Top Five Holdings
Rs. 10000 invested at inception*: CCP - Gift Vs Crisil Balanced Fund Index
*Benchmark start date - 31.03.2002. CAGR – CCP - Gift : 29.27%;Benchmark : 20.11%. Past performance may or may not be sustained infuture.
PortfolioCompany/Issuer Sector/Rating Mkt Value (Rs. Lakh) % to NAV
Figures as on 31-May-2007
Style Box
Maturity Profile (as % of debt holding)
Rating Profile (as % of debt holding)
Performance Record *- Cumulative Option
*Returns >= 1 Year are CAGR, < 1 Year are Absolute. Benchmark is CrisilBalanced Fund Index and start date - 31.03.2002. For computation of returnsthe allotment NAV has been taken as Rs. 10.00. Past performance may ormay not be sustained in future.
Past performance may or may not be sustained in future. Assume Rs. 1000 invested every month. Thehigh level of returns come from the sharp appreciation in market, in the year 2002, 2004 & 2006.
Debt Equity
*Pertains to the equity positions only.
19.89%19.21%
11.24%8.42%
7.52%5.81%
4.82%4.21%3.96%3.79%
2.93%2.59%
1.92%1.59%
1.23%0.54%0.36%
0.00% 5.00% 10.00% 15.00% 20.00% 25.00%
Consumer Non-DurableSoftware
BanksTextiles - ProductsIndustrial Products
Auto AncillariesTransportation
Industrial CapitalPharmaceuticals
Telecom ServicesHealthcare Services
CementRetailing
AutoTextiles - CottonFerrous Metals
Construction
70.82%
12.32%
10.77%
5.78%
0.31%
0.00% 20.00% 40.00% 60.00% 80.00%
<182 days
1-3 years
182 days - 1 year
Other Current Assets
3-5 years
7.24%
21.62%
32.76% 31.64%28.62%
5.99%
25.29% 25.33%21.83%
0.00%5.00%
10.00%15.00%20.00%25.00%30.00%35.00%
Last 6Months
Last 1years
Last 3years
Last 5years
SinceInception
Child Care Gift Crisil Balanced Fund Index
Rs 37661.65
Rs 25767.00
8,986
13,986
18,986
23,986
28,986
33,986
38,986
43,986
Apr-0
2Ju
l-02
Oct
-02
Jan-
03Ap
r-03
Jul-0
3O
ct-0
3Ja
n-04
Apr-0
4Ju
l-04
Oct
-04
Jan-
05Ap
r-05
Jul-0
5O
ct-0
5Ja
n-06
Apr-0
6Ju
l-06
Oct
-06
Jan-
07Ap
r-07
Child Care Gift Crisil Balanced Fund Index
AA and Equivalent
0.55%
AAA and Equivalent70.36%
A and Equivalent
0.31%
Call,Current Assets and
Reverse Repos28.78%
Quantitative Indicators – Debt Component Quantitative Indicators – Equity Component
Average Maturity : 0.47 yearModified Duration : 0.42 yearYield To Maturity : 7.44%
Average P/E : 23Average P/BV : 3.81Average Dividend Yield : 1.04
% Unlisted Bonds : 14.61%

21
Fund Manager's Comment
The ✓ extending beyond the red portion represents the marginal change in the style of the portfolio.Equity allocation to large cap stocks has been increased to protect capital at current valuations.
Past performance may or may not be sustained in future. Assume Rs. 1000 invested every month.
SIP Returns As on 31-May-2007
Period SIP Start Date Total Amount Total No. Market Value SIPInvested of Units Returns
1 Year SIP 30-Jun-06 12,000.00 628.23 12,888.20 16.61%3 Year SIP 29-Jun-04 36,000.00 2,154.42 44,198.14 14.56%5 Year SIP 28-Jun-02 60,000.00 4,108.70 84,290.39 13.99%Since Inception 31-Aug-01 70,000.00 5,066.49 103,939.55 13.80%
Quantitative Indicators – Equity Component
Average P/E : 27Average P/BV : 4.22Average Dividend Yield : 0.63
Quantitative Indicators – Debt Component
Average Maturity : 0.67 yearModified Duration : 0.60 yearYield To Maturity : 8.34%% Unlisted Bonds : 23.32%
Rating Profile (as % of debt holding)
Maturity Profile (as % of debt holding)
ICICI Prudential Child Care Plan (Study)
Snapshot:Fund Managers: Equity : Munzal Shah
Debt : Pankaj KajiIndicative Investment Horizon: 3-5 yrsInception date: 31-08-2001Fund Size: Rs. 29.95 croresNAV (As on 31-May-2007) : Rs. 20.5151**Expense Ratio (6 Months avg. Dec 06-May 07): 1.50%**This is a close approximation of the number.
WHY SHOULD ONE INVEST?For your child between 13-17 years and on the
threshold of higher studies
Performance Record *- Growth Option
*Returns >= 1 Year are CAGR, < 1 Year are Absolute. Benchmark is Crisil MIPBlended Index and start date - 31.03.2002. For computation of returns theallotment NAV has been taken as Rs. 10.00. Past performance may or may notbe sustained in future.
Equity Holdings 664.91 22.17%
Bharti Airtel Ltd Telecom Services 118.90 3.97%
HOV Services Ltd Software 50.16 1.67%
Gillette India Ltd Consumer Non-Durable 48.28 1.61%
Containers Corporation of India Ltd Transportation 45.67 1.52%
AIA Engineering Ltd Industrial Products 38.87 1.30%
Firstsource Solutions Ltd Software 34.54 1.15%
ING Vysya Bank Ltd Banks 33.88 1.13%
Provogue (India) Ltd Textiles - Products 32.10 1.07%
Tanla Solutions Ltd Software 31.91 1.07%
Marico Industries Ltd Consumer Non-Durable 31.60 1.05%
Karur Vysya Bank Ltd Banks 30.79 1.03%
Asian Paints Ltd Consumer Non-Durable 27.06 0.90%
Automobile Corporation of Goa Ltd Auto Ancillaries 25.79 0.86%
Federal Bank Ltd Banks 25.61 0.85%
Blue Star Ltd Consumer Durables 25.51 0.85%
Exide Industries Ltd Auto Ancillaries 23.08 0.77%
Trent Ltd Retailing 22.55 0.75%
3i Infotech Ltd Software 18.61 0.62%
Debt Holdings 2,289.94 76.45%
PSU/PFI Bonds 99.78 3.33%
Nabard AAA 99.78 3.33%
Private Corporate Securities 1,338.42 44.69%
• Rabo India Finance Ltd AAA 267.44 8.93%
• Tata Sons Ltd AAA 238.95 7.98%
• DSP Merill Lynch Capital Ltd P1+ 197.86 6.61%
• GE Money Financial Services Ltd AAA 196.43 6.56%
• Reliance Industries Ltd AAA 186.88 6.24%
Kotak Mahindra Primus Ltd AA 129.99 4.34%
PTC TVS Finance AAA(SO) 83.98 2.80%
Trent Ltd AA- 36.89 1.23%
CPs, CDs and Term Deposits 616.54 20.58%
UTI Bank Ltd P1+ 294.88 9.84%
Kotak Mahindra Bank Ltd P1+ 191.66 6.40%
State Bank of Hyderabad Ltd P1+ 130.00 4.34%
Cash, Call, CBLO & Reverse Repo 235.20 7.85%
Other Current Assets 40.64 1.38%
Total Net Assets 2,995.49 100.00%
• Top Five Holdings
PortfolioCompany/Issuer Sector/Rating Mkt Value (Rs. Lakh) % to NAV
Figures as on 31-May-2007
Style Box:
Rs. 10000 invested at inception*: CCP - Study Vs Crisil MIP Blended Index
*Benchmark start date - 31.03.2002.CAGR – CCP - Study : 13.01%; Benchmark : 8.99%.Past performance may or may not be sustained in future.
Debt Equity
66.52%
30.16%
1.74%
1.58%
0.00% 20.00% 40.00% 60.00% 80.00%
<182 days
1-3 years
Other Current Assets
3-5 years
6.69%
11.70%13.86% 13.68% 13.31%
2.11%
8.88% 8.19%9.46%
0.00%2.00%4.00%6.00%8.00%
10.00%12.00%14.00%16.00%
Last 6Months
Last 1years
Last 3years
Last 5years
SinceInception
Child Care Study Crisil MIP Blended index
Rs 18803.94
Rs 15595.96
9,72110,72111,72112,72113,72114,72115,72116,72117,72118,72119,721
Apr-0
2Ju
l-02
Oct
-02
Jan-
03Ap
r-03
Jul-0
3O
ct-0
3Ja
n-04
Apr-0
4Ju
l-04
Oct
-04
Jan-
05Ap
r-05
Jul-0
5O
ct-0
5Ja
n-06
Apr-0
6Ju
l-06
Oct
-06
Jan-
07Ap
r-07
Child Care Study Crisil MIP Blended index
AA and Equivalent
7.16%
Call,Current Assets and
Reverse Repos11.84%
AAA and Equivalent81.00%

22
Performance Record *- Retail Growth Option
Quantitative Indicators – Debt Component
Average Maturity : 0.68 yearModified Duration : 0.62 yearYield To Maturity : 10.14%
% Unlisted Bonds : 0.00%
Rating Profile (as % of total debt components)
Maturity Profile (as % of debt holding)
ICICI Prudential Equity & Derivatives FundIncome Optimiser Plan
WHY SHOULD ONE INVEST?Generate low volatility returns by investing in mix of cash equities, equity
derivatives and debt market instruments - relatively more conservative - 65%to 80% in Equity and Equity Derivatives (unhedged exposure limited to 5%)
Snapshot:
Fund Managers: Equity : Yogesh BhattDebt : Chaitanya Pande
Inception date: 30-12-2006Fund Size: Rs. 1,182.86 croresNAV (As on 31-May-2007):
Retail Growth option : Rs. 10.56Inst. Growth option : Rs. 10.57Retail Dividend option : Rs. 10.56
**Expense Ratio (6 Months avg. Dec 06-May 07):Retail Option : 1.50%Inst. Option : 1.20%
**This is a close approximation of the number.
Figures as on 31-May-2007
Style Box
Debt Equity
*Returns >= 1 Year are CAGR, < 1 Year are Absolute. Benchmark is CrisilLiquid Fund Index. For computation of returns the allotment NAV has beentaken as Rs. 10.00. Past performance may or may not be sustained in future.
Equity Holdings 6,429.07 5.44%Alfa-Laval (India) Ltd Industrial Capital Goods 5,625.19 4.76%BASF Ltd Chemicals 530.70 0.45%Hinduja TMT Technologies Ltd Software 273.18 0.23%Equity & Derivative Holdings 71,743.36 60.64% (71,826.72)State Bank of India Ltd Banks 7,597.36 6.42%State Bank of India Ltd- Futures -7,597.64Reliance Communications Ventures Ltd Telecom Services 7,433.65 6.28%Reliance Communications Ventures Ltd- Futures -7,516.75Reliance Capital Finance Ltd Finance 6,172.48 5.22%Reliance Capital Finance Ltd- Futures -6,241.10Punjab National Bank Ltd Banks 5,854.70 4.95%Punjab National Bank Ltd- Futures -5,848.69Tata Consultancy Services Ltd Software 3,555.57 3.01%Tata Consultancy Services Ltd- Futures -3,577.05Gujarat Ambuja Cement Ltd Cement 3,145.02 2.66%Gujarat Ambuja Cement Ltd- Futures -3,165.82Tata Motors Ltd Auto 2,350.68 1.99%Tata Motors Ltd- Futures -2,308.69Reliance Industries Ltd Petroleum Products 2,001.59 1.69%Reliance Industries Ltd- Futures -2,023.55Punj Llyod Ltd Construction 1,998.53 1.69%Punj Llyod Ltd- Futures -2,007.73India Cements Ltd Cement 1,915.84 1.62%India Cements Ltd- Futures -1,938.37Hindalco Industries Ltd Non-Ferrous Metals 1,837.85 1.55%Hindalco Industries Ltd- Futures -2,328.74Industrial Development Bank of India Banks 1,771.97 1.50%Industrial Development Bank of India- Futures -1,790.64Divis Laboratories Ltd Pharmaceuticals 1,708.78 1.44%Divis Laboratories Ltd- Futures -1,713.43Bharti Airtel Ltd Telecom Services 1,698.50 1.44%Bharti Airtel Ltd- Futures -1,677.40Tata Steel Ltd Ferrous Metals 1,647.07 1.39%Tata Steel Ltd- Futures -1,625.70Bank of Baroda Ltd Banks 1,513.04 1.28%Bank of Baroda Ltd- Futures -1,505.08Mahanagar Telephone Nigam Ltd Telecom Services 1,407.14 1.19%Mahanagar Telephone Nigam Ltd- Futures -1,425.08Tata Tea Ltd Consumer Non-Durable 1,402.08 1.19%Tata Tea Ltd- Futures -1,418.76GMR Infrastructure Ltd Construction 1,353.06 1.14%GMR Infrastructure Ltd- Futures -1,370.20Sesa Goa Ltd Ferrous Metals 1,352.58 1.14%Sesa Goa Ltd- Futures -603.57Century Textiles & Industries Ltd Cement 1,322.82 1.12%Century Textiles & Industries Ltd- Futures -1,338.12Satyam Computer Services Ltd Software 1,172.87 0.99%Satyam Computer Services Ltd- Futures -1,173.00Jai Prakash Associates Ltd Construction 1,149.27 0.97%Jai Prakash Associates Ltd- Futures -1,152.68Union Bank of India Ltd Banks 1,091.86 0.92%Union Bank of India Ltd- Futures -1,095.05Titan Industries Ltd Consumer Non-Durable 864.39 0.73%Titan Industries Ltd- Futures -874.34Kotak Mahindra Bank Ltd Banks 824.68 0.70%Kotak Mahindra Bank Ltd- Futures -831.31Mahindra & Mahindra Ltd Auto 805.87 0.68%Mahindra & Mahindra Ltd- Futures -815.02Praj Industries Ltd Industrial Capital Goods 696.77 0.59%Praj Industries Ltd- Futures -705.99Mphasis BFL Software Ltd Software 676.53 0.57%Mphasis BFL Software Ltd- Futures -683.82Nagarjuna Construction Company Ltd Construction 565.99 0.48%Nagarjuna Construction Company Ltd- Futures -573.53CESC Ltd Power 539.36 0.46%CESC Ltd- Futures -544.40Hindustan Construction Co. Ltd Construction 508.83 0.43%Hindustan Construction Co. Ltd- Futures -516.50UTI Bank Ltd Banks 465.71 0.39%UTI Bank Ltd- Futures -467.09Gateway Distriparks Ltd Transportation 391.72 0.33%Gateway Distriparks Ltd- Futures -395.71Infosys Technologies Ltd Software 380.85 0.32%Infosys Technologies Ltd- Futures -382.72Dr. Reddy’s Laboratories Ltd Pharmaceuticals 323.58 0.27%Dr. Reddy’s Laboratories Ltd- Futures -327.03Matrix Laboratories Ltd Pharmaceuticals 305.50 0.26%Matrix Laboratories Ltd- Futures -308.10Bombay Dyeing & Manufacturing Co. Ltd Textiles - Products 274.12 0.23%Bombay Dyeing & Manufacturing Co. Ltd- Futures -277.40Aban Lloyd Chiles Offshore Ltd Industrial Capital Goods 261.00 0.22%Aban Lloyd Chiles Offshore Ltd- Futures -264.40Unitech Ltd Construction 227.86 0.19%Unitech Ltd- Futures -229.60Bata India Ltd Consumer Non-Durable 193.35 0.16%Bata India Ltd- Futures -195.73Colgate Palmolive (India) Ltd Consumer Non-Durable 182.93 0.15%Colgate Palmolive (India) Ltd- Futures -184.39Corporation Bank Ltd Banks 147.05 0.12%Corporation Bank Ltd- Futures -146.16Lanco Infratech Ltd Industrial Capital Goods 136.32 0.12%Lanco Infratech Ltd- Futures -138.42Bank of India Banks 120.07 0.10%Bank of India- Futures -120.67Polaris Software Lab Ltd Software 102.14 0.09%Polaris Software Lab Ltd- Futures -103.46I-Flex Solutions Ltd Software 78.99 0.07%I-Flex Solutions Ltd- Futures -80.00SRF Ltd Textiles - Synthetic 65.81 0.06%SRF Ltd- Futures -66.74Lupin Ltd Pharmaceuticals 57.26 0.05%Lupin Ltd- Futures -57.84Great Eastern Shipping Co. Ltd Transportation 50.67 0.04%Great Eastern Shipping Co. Ltd- Futures -51.37Bharat Forge Ltd Industrial Products 32.83 0.03%Bharat Forge Ltd- Futures -33.17Parsvanath Developers Ltd Construction 8.87 0.01%Parsvanath Developers Ltd- Futures -8.97Debt Holdings 43,320.31 36.63%Private Corporate Securities 6,000.00 5.08%Kotak Mahindra Primus Ltd AA+ 5,000.00 4.23%LIC Housing Finance Ltd AAA 1,000.00 0.85%CPs, CDs and Term Deposits 20,824.75 17.60%ICICI Bank Ltd P1+ 20,480.00 17.31%UTI Bank Ltd P1+ 170.00 0.14%Allahabad Bank Ltd P1+ 150.00 0.13%Yes Bank P1+ 24.75 0.02%Cash, Call, CBLO & Reverse Repo 16,495.56 13.95%Other Current Assets (3,206.61) -2.71%Total Net Assets 118,286.13 100.00%
PortfolioCompany/Issuer Sector/Rating Mkt Value % to NAV Mkt Value (Rs.
(Rs. Lakh) Lakh) - Futures
Income Optimiser Crisil Liquid Fund Index
5.60%
3.79%
0.00%1.00%2.00%3.00%4.00%5.00%6.00%
Since Inception
98.78%
-0.15%
1.36%
-40.00% 0.00% 40.00% 80.00% 120.00%
182 days - 1year
<182 days
Other Current
Assets
AAA and Equivalent54.41%
Call,Current Assets and
Reverse Repos33.12%
AA and Equivalent12.47%

23
Performance Record *- Retail Growth Option
Quantitative Indicators – Debt Component
Average Maturity : 0.06 yearModified Duration : 0.06 yearYield To Maturity : 5.43%
% Unlisted Bonds : 0.00%
Maturity Profile (as % of debt holding)
Rating Profile (as % of total debt components)
ICICI Prudential Equity & Derivatives FundWealth Optimiser Plan
Snapshot:
Fund Managers: Equity : Nimesh ChandanDebt : Chaitanya Pande
Inception date: 30-12-2006Fund Size: Rs. 1,162.87 croresNAV (As on 31-May-2007):
Growth option : Rs. 10.83Dividend option : Rs. 10.83
**Expense Ratio (6 Months avg. Dec 06-May 07): 2.15%**This is a close approximation of the number.
WHY SHOULD ONE INVEST?Generate low volatility returns by investing in mix of cash equities, equity
derivatives and debt market instruments - relatively less conservative - 65% to100% in Equity and Equity Derivatives (unhedged exposure limited to 80%)
Figures as on 31-May-2007
Style Box:Debt Equity
*Returns >= 1 Year are CAGR, < 1 Year are Absolute. Benchmark is CrisilBalanced Fund. For computation of returns the allotment NAV has been takenas Rs. 10.00. Past performance may or may not be sustained in future.
Equity Holdings 51,703.15 44.43%Reliance Industries Ltd Petroleum Products 4,924.64 4.23%Oil & Natural Gas Company Ltd Oil 3,573.04 3.07%Tata Consultancy Services Ltd Software 3,075.29 2.64%ICICI Bank Ltd Banks 2,342.45 2.01%Bharti Airtel Ltd Telecom Services 2,292.98 1.97%Larsen & Toubro Limited Industrial Capital Goods 2,009.90 1.73%Infosys Technologies Ltd Software 1,519.57 1.31%Grasim Industries Ltd Cement 1,509.56 1.30%State Bank of India Ltd Banks 1,475.48 1.27%United Phosphorus Ltd Pesticides 1,439.40 1.24%National Thermal Power Corporation Ltd Power 1,401.14 1.20%Tata Steel Ltd Ferrous Metals 1,340.52 1.15%3i Infotech Ltd Software 1,317.93 1.13%HDFC Ltd Finance 1,317.82 1.13%Siemens India Ltd Industrial Capital Goods 1,311.29 1.13%HCL Technologies Ltd Software 1,232.28 1.06%Cummins India Ltd Industrial Products 1,220.80 1.05%Zee Entertainment Enterprises Ltd Media & Entertainment 1,191.87 1.02%Aditya Birla Nuvo Ltd Textiles - Products 1,187.07 1.02%Cambridge Solutions Ltd Hardware 1,062.07 0.91%Dr. Reddy’s Laboratories Ltd Pharmaceuticals 1,035.44 0.89%Bharat Heavy Electricals Ltd Industrial Capital Goods 979.37 0.84%Maruti Udyog Ltd Auto 972.35 0.84%Pantaloon Retail (India) Ltd Retailing 957.68 0.82%Bharat Electonics Ltd Industrial Capital Goods 939.84 0.81%ITC Limited Consumer Non-Durable 936.94 0.81%Hindustan Lever Ltd Consumer Non-Durable 915.30 0.79%HT Media Ltd Media & Entertainment 880.84 0.76%Glenmark Pharmaceuticals Ltd Pharmaceuticals 876.30 0.75%Crompton Greaves Ltd Industrial Capital Goods 860.65 0.74%Lupin Ltd Pharmaceuticals 853.56 0.73%Steel Authority of India Ltd Ferrous Metals 701.50 0.60%Punjab National Bank Ltd Banks 632.30 0.54%Andhra Bank Ltd Banks 621.56 0.53%Mphasis BFL Software Ltd Software 582.16 0.50%Reliance Communications Ventures Ltd Telecom Services 505.45 0.43%Glaxo Smothkline Pharma Ltd Pharmaceuticals 449.95 0.39%Wipro Ltd Software 429.52 0.37%Satyam Computer Services Ltd Software 348.76 0.30%Cipla Ltd Pharmaceuticals 326.18 0.28%BASF Ltd Chemicals 103.49 0.09%Sun Pharma Advanced Research Co. Ltd Pharmaceuticals 48.91 0.04%Equity & Derivative Holdings 29,105.89 25.04% (23,813.34)Reliance Industries Ltd Petroleum Products 3,954.66 3.40%Reliance Industries Ltd- Futures -3,980.41State Bank of India Ltd Banks 5,864.69 5.04%State Bank of India Ltd- Futures -5,864.91Infosys Technologies Ltd Software 4,808.75 4.14%Infosys Technologies Ltd- Futures -4,832.38Reliance Communications Ventures Ltd Telecom Services 1,514.33 1.30%Reliance Communications Ventures Ltd- Futures -1,531.26Punjab National Bank Ltd Banks 900.23 0.77%Punjab National Bank Ltd- Futures -899.30Dr. Reddy’s Laboratories Ltd Pharmaceuticals 453.01 0.39%Dr. Reddy’s Laboratories Ltd- Futures -457.84Divis Laboratories Ltd Pharmaceuticals 1,320.14 1.14%Divis Laboratories Ltd- Futures -1,323.74Sun Pharmaceuticals Limited Pharmaceuticals 1,153.00 0.99%Sun Pharmaceuticals Limited- Futures 328.67Satyam Computer Services Ltd Software 724.59 0.62%Satyam Computer Services Ltd- Futures -724.66Mahanagar Telephone Nigam Ltd Telecom Services 1,069.43 0.92%Mahanagar Telephone Nigam Ltd- Futures -1,083.06India Cements Ltd Cement 890.61 0.77%India Cements Ltd- Futures -901.08Mphasis BFL Software Ltd Software 183.84 0.16%Mphasis BFL Software Ltd- Futures -185.82Hindalco Industries Ltd Non-Ferrous Metals 683.98 0.59%Hindalco Industries Ltd- Futures -689.58Cairn India Ltd Oil 673.75 0.58%Cairn India Ltd- Futures -682.68Industrial Development Bank of India Banks 473.74 0.41%Industrial Development Bank of India- Futures -478.73Reliance Energy Ltd Power 269.34 0.23%Reliance Energy Ltd- Futures -270.45Indian Hotels Company Ltd Hotels 233.29 0.20%Indian Hotels Company Ltd- Futures -236.11Nifty Futures 3,934.52 3.38%Debt Holdings 42,925.96 36.92%CPs, CDs and Term Deposits 24,372.30 20.96%ICICI Bank Ltd P1+ 11,569.00 9.95%UTI Bank Ltd P1+ 5,897.70 5.07%Tata Power Company Ltd P1+ 4,917.23 4.23%Rabo India Finance Ltd P1+ 1,988.37 1.71%Cash, Call, CBLO & Reverse Repo 18,553.66 15.96%Other Current Assets (7,448.31) -6.39%
Total Net Assets 116,286.70 100.00%
PortfolioCompany/Issuer Sector/Rating Mkt Value % to NAV Mkt Value (Rs.
(Rs. Lakh) Lakh) - Futures
120.99%
-20.99%
-50.00% 0.00% 50.00% 100.00% 150.00%
<182 days
Other Current
Assets
Call,Current Assets and
Reverse Repos31.30%
AAA and Equivalent68.70%
Wealth Optimiser Crisil Balanced Fund Index
8.30%
5.81%
0.00%1.00%2.00%3.00%4.00%5.00%6.00%7.00%8.00%9.00%
Since Inception

24
Snapshot:Fund Managers :Equity : Yogesh Bhatt
Debt : Chaitanya PandeIndicative Investment Horizon: 6 months-1 yearInception date: 31-05-2005Fund Size: Rs. 490.56 croresNAV (As on 31-May-2007):
Growth option : Rs. 11.6660Dividend option : Rs. 10.6018
**Expense Ratio (6 Months avg. Dec 06-May 07): 1.50%**This is a close approximation of the number.
ICICI Prudential Blended Plan A Portfolio
Company/Issuer Sector/Rating Mkt Value %NAV Mkt Value(Rs. Lakh) (Rs. Lakh)-Futures
Figures as on 31-May-2007
Equity Holdings 32,242.05 65.72% (32,447.14)• Punjab National Bank Ltd Banks 3,408.01 6.95%
Punjab National Bank Ltd- Futures -3,404.51• Bank of Baroda Ltd Banks 2,991.35 6.10%
Bank of Baroda Ltd- Futures -2,975.61• Mahanagar Telephone Nigam Ltd Telecom Services 2,214.72 4.51%
Mahanagar Telephone Nigam Ltd- Futures -2,242.95• Century Textiles & Industries Ltd Cement 1,989.38 4.06%
Century Textiles & Industries Ltd- Futures -2,012.38• Tata Consultancy Services Ltd Software 1,933.36 3.94%
Tata Consultancy Services Ltd- Futures -1,945.04Reliance Communications Ventures Ltd Telecom Services 1,510.79 3.08%Reliance Communications Ventures Ltd- Futures -1,527.68Jai Prakash Hydro Power Ltd Power 472.39 0.96%Jai Prakash Hydro Power Ltd- Futures -467.93Essar Oil Ltd Oil 430.00 0.88%Essar Oil Ltd- Futures -436.24India Cements Ltd Cement 396.11 0.81%India Cements Ltd- Futures -400.77Polaris Software Lab Ltd Software 390.79 0.80%Polaris Software Lab Ltd- Futures -395.84Orchid Chemicals Ltd Pharmaceuticals 318.73 0.65%Orchid Chemicals Ltd- Futures -323.34Petronet LNG Ltd Gas 256.56 0.52%Petronet LNG Ltd- Futures -260.53UTI Bank Ltd Banks 250.97 0.51%UTI Bank Ltd- Futures -251.71Ultratech Cement Company Ltd Cement 224.51 0.46%Ultratech Cement Company Ltd- Futures -225.07Ashok Leyland Ltd Auto 223.81 0.46%Ashok Leyland Ltd- Futures -226.82IndusInd Bank Ltd Banks 213.71 0.44%IndusInd Bank Ltd- Futures -217.24Mahindra & Mahindra Ltd Auto 196.15 0.40%Mahindra & Mahindra Ltd- Futures -198.38SRF Ltd Textiles - Synthetic 192.74 0.39%SRF Ltd- Futures -195.45Matrix Laboratories Ltd Pharmaceuticals 182.13 0.37%Matrix Laboratories Ltd- Futures -183.68Patni Computer Systems Ltd Software 155.71 0.32%Patni Computer Systems Ltd- Futures -156.79Cummins India Ltd Industrial Products 150.77 0.31%Cummins India Ltd- Futures -152.32Mangalore Refineries & Petrochemicals Ltd Petroleum Products 139.34 0.28%Mangalore Refineries & Petrochemicals Ltd- Futures -141.20Chambal Fertilisers & Chemicals Ltd Fertilizers 126.68 0.26%Chambal Fertilisers & Chemicals Ltd- Futures -128.36Karnataka Bank Ltd Banks 80.77 0.16%Karnataka Bank Ltd- Futures -80.58State Bank of India Ltd Banks 1,248.74 2.55%State Bank of India Ltd- Futures -1,248.79Jindal Steel & Power Company Ltd Ferrous Metals 1,154.14 2.35%Jindal Steel & Power Company Ltd- Futures -1,157.05Unitech Ltd Construction 1,149.65 2.34%Unitech Ltd- Futures -1,158.44New Delhi Television Ltd Media & Entertainment 1,056.55 2.15%New Delhi Television Ltd- Futures -1,060.94Infosys Technologies Ltd Software 961.75 1.96%Infosys Technologies Ltd- Futures -966.48Reliance Capital Finance Ltd Finance 954.45 1.95%Reliance Capital Finance Ltd- Futures -965.06Parsvanath Developers Ltd Construction 922.96 1.88%Parsvanath Developers Ltd- Futures -932.71Industrial Development Bank of India Banks 920.15 1.88%Industrial Development Bank of India- Futures -929.85Union Bank of India Ltd Banks 855.37 1.74%Union Bank of India Ltd- Futures -857.87Industrial Finance Corporation of India Ltd Finance 842.99 1.72%Industrial Finance Corporation of India Ltd- Futures -853.76Gujarat Narmada Valley Fertilisers Co. Ltd Fertilizers 765.95 1.56%Gujarat Narmada Valley Fertilisers Co. Ltd- Futures -777.78LIC Housing Finance Ltd Finance 618.36 1.26%LIC Housing Finance Ltd- Futures -627.36Dr. Reddy’s Laboratories Ltd Pharmaceuticals 546.19 1.11%Dr. Reddy’s Laboratories Ltd- Futures -552.02Reliance Industries Ltd Petroleum Products 507.11 1.03%Reliance Industries Ltd- Futures -512.68Vijaya Bank Banks 475.11 0.97%Vijaya Bank- Futures -474.06Mphasis BFL Software Ltd Software 473.08 0.96%Mphasis BFL Software Ltd- Futures -478.18Shipping Corporation of India Ltd Transportation 66.70 0.14%Shipping Corporation of India Ltd- Futures -67.58Arvind Mills Ltd Textiles - Products 60.52 0.12%Arvind Mills Ltd- Futures -61.32Aban Lloyd Chiles Offshore Ltd Industrial Capital Goods 57.42 0.12%Aban Lloyd Chiles Offshore Ltd- Futures -58.17Punj Llyod Ltd Construction 52.16 0.11%Punj Llyod Ltd- Futures -52.40Cairn India Ltd Oil 46.59 0.09%Cairn India Ltd- Futures -47.21Reliance Energy Ltd Power 41.44 0.08%Reliance Energy Ltd- Futures -41.61Neyveli Lignite Corporation Ltd Power 15.19 0.03%Neyveli Lignite Corporation Ltd- Futures -15.40Debt Holdings 15,121.23 30.83%PSU/PFI Bonds 2,902.20 5.91%Infrastructure Development Finance Corporation AAA 954.10 1.94%Export Import Bank of India Ltd AAA 949.19 1.93%Union Bank of India Ltd AA 500.00 1.02%Nabard AAA 498.91 1.02%Private Corporate Securities 1,642.74 3.36%PTC TAS Trust Tata Sons A1+(SO) 311.81 0.64%DSP Merill Lynch Capital Ltd P1+ 200.00 0.41%Kotak Mahindra Primus Ltd AA 79.99 0.16%PTC Credit Asset Trust Series HSBC F1+SO 1,008.95 2.06%PTC TVS Finance AAA(SO) 41.99 0.09%CPs, CDs and Term Deposits 7,150.00 14.58%ICICI Bank Ltd P1+ 7,150.00 14.58%Cash, Call, CBLO & Reverse Repo 3,426.29 6.98%Other Current Assets 1,692.71 3.45%Total Net Assets 49,055.99 100.00%
• Top Five Holdings
Performance Record* - Growth Option
* Returns >= 1 Year are CAGR, < 1 Year are Absolute. Benchmark is CrisilShort Term Bond Fund Index. For Computation of returns the allotment NAVhas been taken as Rs 10.00. Past performance may or may not be sustainedin future.
Rating Profile (as % of total debt components)
Maturity Profile: (as % of total debt components)
Asset Allocation: (as % of Net Assets)
Quantitative Indicators:
Average Maturity : 0.75 yearModified Duration : 0.61 yearYield To Maturity : 6.85%% Unlisted Bonds : 3.37%
WHY SHOULD ONE INVEST?Opportunity to enhance returns from a blend of equity & equity arbitrage (atleast 51%)
and low volatility returns from a minimum debt exposure of 25% for a short time horizon
Unhedged Equity
Holdings0.00%
Debt Holdings34.28%
Hedged Equity
Holdings65.72%
75.64%
14.29%
10.06%
0.01%
0.00% 40.00% 80.00%
<182 days
3-5 years
Other Current Assets
1-3 years
4.99%
7.90% 8.01%
2.92%
6.10%5.28%
0.00%1.00%2.00%3.00%4.00%5.00%6.00%7.00%8.00%9.00%
Last 6 Months Last 1 years Since Inception
Blended Plan A Crisil Short Term Bond Fund Index
AAA and Equivalent66.12%
Call,Current Assets and
Reverse Repos30.43%
AA and Equivalent
3.45%

25
Performance Record* - Growth Option
* Returns >= 1 Year are CAGR, < 1 Year are Absolute. Benchmark is CrisilShort Term Bond Fund Index. For Computation of returns the allotment NAVhas been taken as Rs 10.00. Past performance may or may not be sustainedin future.
Quantitative Indicators:
Rating Profile (as % of total debt components)
Maturity Profile: (as % of total debt components)
Snapshot:Fund Managers: Debt : Chaitanya Pande
Equity : Yogesh BhattIndicative Investment Horizon: 6 months-1 yearInception date: 31-05-2005Fund Size: Rs. 43.21 croresNAV (As on 31-May-2007):
Growth option : Rs. 11.3941Dividend option : Rs. 10.7120
**Expense Ratio (6 Months avg. Dec 06-May 07):Blended Plan B : 1.49%Blended Plan B - Inst.: 0.99%
**This is a close approximation of the number.
ICICI Prudential Blended Plan BPortfolio
Company/Issuer Sector/Rating Mkt Value %NAV Mkt Value(Rs. Lakh) (Rs. Lakh)-Futures
Debt Holdings 4,225.32 97.78% 0.00
PSU/PFI Bonds 999.87 23.14%
• Union Bank of India Ltd AA 500.00 11.57%
• Nabard AAA 498.91 11.55%
Power Finance Corporation Ltd AAA 0.96 0.02%
Private Corporate Securities 2,892.85 66.95%
• PTC IBL Trust IndusInd Bank AAA(SO) 917.94 21.24%
• Tata Sons Ltd AAA 796.51 18.43%
• PTC Citi Fleet Trust Citibank AAA(SO) 770.34 17.83%
DSP Merill Lynch Capital Ltd P1+ 340.00 7.87%
PTC TVS Finance AAA(SO) 68.06 1.58%
CPs, CDs and Term Deposits 319.00 7.38%
ICICI Bank Ltd P1+ 319.00 7.38%
Cash, Call, CBLO & Reverse Repo 13.60 0.31%
Other Current Assets 95.61 2.22%
Total Net Assets 4,320.93 100.00%
• Top Five Holdings
Average Maturity : 1.31 yearModified Duration : 1.21 yearYield To Maturity : 9.66%% Unlisted Bonds : 19.44%
Figures as on 31-May-2007
WHY SHOULD ONE INVEST?Generate low volaility returns from debt (atleast 51%) along with
an opportunity to enhance returns from equity arbitrage (maximum 49%)
46.52%
21.24%
2.21%
11.57%
18.46%
0.00% 20.00% 40.00% 60.00%
<182 days
182 days - 1 year
1-3 years
3-5 years
Other Current Assets
3.76%
6.74% 6.74%
2.92%
6.10%5.28%
0.00%1.00%2.00%3.00%4.00%5.00%6.00%7.00%8.00%
Last 6 Months Last 1 years Since Inception
Blended Plan B Crisil Short Term Bond Fund Index
AA and Equivalent11.57%
Call,Current Assets and
Reverse Repos2.53%
AAA and Equivalent85.90%

26
SIP Return: As on 31-May-2007
Period SIP Start Date Total Amount Total No. Market Value SIPInvested of Units Returns
1 Year SIP 30-Jun-06 12,000.00 367.28 13,365.32 25.90%3 Year SIP 30-Jun-04 36,000.00 1,503.33 54,706.18 30.80%5 Year SIP 28-Jun-02 60,000.00 3,630.97 132,131.00 33.20%Since Inception 3-Nov-99 92,000.00 6,993.89 254,507.66 26.35%
Past performance may or may not be sustained in future. Assume Rs. 1000 invested every month. Thehigh level of returns come from the sharp appreciation in market, in the year 2002, 2004 & 2006.
Quantitative Indicators – Debt Component Quantitative Indicators – Equity Component
Average Maturity : 2.95 yearsModified Duration : 1.47 yearsYield To Maturity : 7.34%
Average P/E : 21Average P/BV : 3.89Average Dividend Yield : 1.00
% Unlisted Bonds : 3.29%
Maturity Profile (as % of debt holding)
Sector Allocation* (as % of equity portfolio)
Snapshot:Fund Managers: Equity : Deven Sangoi
Debt : Pankaj KajiIndicative Investment Horizon: 3 yrs & moreInception date: 03-11-1999Fund Size: Rs. 441.55 croresNAV (As on 31-May-2007):
Growth option : Rs. 36.39Dividend option : Rs. 17.85
**Expense Ratio (6 Months avg. Dec 06-May 07): 2.18%**This is a close approximation of the number.
WHY SHOULD ONE INVEST?Medium term investment of funds in a portfolio of
equity (minimum) 65% and debt for capital appreciation.
Rs. 10000 invested at inception*: Balanced Fund Vs Crisil Balanced Fund Index
Performance Record *- Growth Option
*Benchmark start date - 31.03.2002. CAGR – Balanced Fund : 30.10%;Benchmark : 20.11%. Past performance may or may not be sustained infuture.
*Returns < 1 Year : Absolute, > = 1Year : CAGR. Benchmark - Crisil BalancedFund Index and start date - 31.03.2002. For computation of returns theallotment NAV has been taken as Rs. 10.00. Past performance may or may notbe sustained in future.
Equity Holdings 32,841.82 74.39%• Reliance Industries Ltd Petroleum Products 3,473.42 7.87%• AIA Engineering Ltd Industrial Products 2,078.04 4.71%• Bharat Electonics Ltd Industrial Capital Goods 1,611.60 3.65%
Jain Irrigation Systems Ltd Industrial Products 1,465.65 3.32%ICICI Bank Ltd Banks 1,439.46 3.26%Oil & Natural Gas Company Ltd Oil 1,380.60 3.13%Bharti Airtel Ltd Telecom Services 1,361.77 3.08%Punjab National Bank Ltd Banks 1,127.47 2.55%HOV Services Ltd Software 1,121.81 2.54%Tata Consultancy Services Ltd Software 1,036.41 2.35%Grasim Industries Ltd Cement 1,019.85 2.31%Andhra Bank Ltd Banks 972.88 2.20%Steel Authority of India Ltd Ferrous Metals 948.29 2.15%CMC Ltd. Hardware 946.21 2.14%HCL Technologies Ltd Software 926.03 2.10%Bharat Heavy Electricals Ltd Industrial Capital Goods 922.45 2.09%IVRCL Infrastructure & Projects Ltd Construction 875.88 1.98%Bank of Baroda Ltd Banks 851.49 1.93%United Phosphorus Ltd Pesticides 837.61 1.90%Reliance Communications Ventures Ltd Telecom Services 835.76 1.89%Sun Pharmaceuticals Limited Pharmaceuticals 803.50 1.82%Sterlite Optical Technologies Ltd Industrial Products 760.66 1.72%Wipro Ltd Software 683.30 1.55%Sterlite Industries (India) Ltd Non-Ferrous Metals 681.51 1.54%Bharat Forge Utilities Ltd Industrial Capital Goods 658.44 1.49%Sundaram Clayton Ltd Auto Ancillaries 612.83 1.39%Tata Steel Ltd Ferrous Metals 586.25 1.33%Marico Industries Ltd Consumer Non-Durable 547.10 1.24%Dr. Reddy’s Laboratories Ltd Pharmaceuticals 449.53 1.02%Gokaldas Exports Ltd Textiles - Products 291.48 0.66%Sun Pharmaceuticals Limited-Futures Pharmaceuticals 217.46 0.49%Sun Pharma Advanced Research Co. Ltd Pharmaceuticals 34.08 0.08%Nifty Futures 1,283.00 2.91%Debt Holdings 13,781.00 31.21%PSU/PFI Bonds 4,674.08 10.58%
• Nabard AAA 3,242.93 7.34%Infrastructure Development FinanceCorporation AAA 1,431.15 3.24%Private Corporate Securities 3,781.33 8.56%
• Mahindra & Mahindra FinancialServices Ltd AA+ 2,000.00 4.53%Tata Sons Ltd AAA 955.82 2.16%PTC RPS Tata Teleservices AAA(SO) 746.47 1.69%Kotak Mahindra Primus Ltd AA 50.00 0.11%DSP Merill Lynch Capital Ltd P1+ 20.00 0.05%PTC TAS Trust Tata Sons A1+(SO) 9.04 0.02%Government Securities 987.70 2.24%8.33% GOI 2036 Sovereign 987.70 2.24%CPs, CDs and Term Deposits 1,608.00 3.65%Allahabad Bank Ltd P1+ 850.00 1.93%ICICI Bank Ltd P1+ 758.00 1.72%Cash, Call, CBLO & Reverse Repo 2,729.89 6.18%Other Current Assets (2,467.93) -5.60%Total Net Assets 44,154.89 100.00%
• Top Five Holdings
PortfolioCompany/Issuer Sector/Rating Mkt Value (Rs. Lakh) % to NAV
Figures as on 31-May-2007
*Pertains to the equity investments only.
Style Box:Debt Equity
ICICI Prudential Balanced Fund
67.71%
17.68%
12.65%
-21.82%
8.73%
15.06%
-40.00% -20.00% 0.00% 20.00% 40.00% 60.00% 80.00%
<182 days
182 days - 1 year
1-3 years
3-5 years
> 10 years
Other Current Assets
7.60%
23.65%
35.68%32.24%
18.58%
5.99%
25.29% 25.33% 21.83%
0.00%5.00%
10.00%15.00%20.00%25.00%30.00%35.00%40.00%
Last 6Months
Last 1years
Last 3years
Last 5years
SinceInception
Balanced Fund Crisil Balanced Fund Index
Rs 38919.79
Rs 25767.00
8,986
13,986
18,986
23,986
28,986
33,986
38,986
43,986
Apr-
02Ju
l-02
Oct
-02
Jan-
03Ap
r-03
Jul-0
3O
ct-0
3Ja
n-04
Apr-
04Ju
l-04
Oct
-04
Jan-
05Ap
r-05
Jul-0
5O
ct-0
5Ja
n-06
Apr-
06Ju
l-06
Oct
-06
Jan-
07Ap
r-07
Balanced Fund Crisil Balanced Fund Index
13.91%13.63%
11.93%11.01%
10.12%6.97%
4.86%4.77%
4.37%3.23%
3.00%2.78%2.65%
2.16%1.94%1.73%
0.92%
0.00% 4.00% 8.00% 12.00% 16.00%
BanksIndustrial Products
SoftwarePetroleum Products
Industrial Capital GoodsTelecom Services
Ferrous MetalsPharmaceuticals
OilCement
HardwareConstruction
PesticidesNon-Ferrous Metals
Auto AncillariesConsumer Non-Durable
Textiles - Products

27
INVESTMENT HORIZON 1 Month to 36 Months
ICICI Prudential Fixed Maturity Plan WHY SHOULD ONE INVEST?Those who have a fixed investment horizon
ranging from 1 month to 36 monthsFigures as on 31-May-2007
Fund Manager : Chaitanya Pande
PORTFOLIO
Company/Issuer Sector/ Mkt.Value % toRating (Rs.Lacs) NAV
ICICI Prudential FMP Series 34- 18 Months Plan
PSU/PFI Bonds 3,505.53 14.46%
Indian Railway Finance Corporation AAA 3,350.58 13.82%
Power Finance Corporation Ltd AAA 154.95 0.64%
Private Corporate Securities 19,706.69 81.29%
GE Money Financial Services Ltd AAA 4,714.30 19.45%
Mahindra & Mahindra Financial Services Ltd AA+ 4,567.56 18.84%
DSP Merill Lynch Capital Ltd AAA(SO) 4,526.92 18.67%
Citicorp Maruti Finance Ltd AAA 4,423.26 18.25%
CitiFinancial Consumer Finance India Ltd AAA 1,474.65 6.08%
Cash, Call, CBLO & Reverse Repo 26.50 0.11%
Other Current Assets 1,002.25 4.14%
Total Net Assets 24,240.97 100.00%
ICICI Prudential FMPSeries 34 - 17 Month Plan
Private Corporate Securities 6,376.91 94.85%
DSP Merill Lynch Capital Ltd AAA 1,185.18 17.63%
CitiFinancial Consumer Finance India Ltd AAA 1,149.54 17.10%
Sundaram Finance Ltd AAA 976.34 14.52%
GE Money Financial Services Ltd AA+ 893.48 13.29%
Ultratech Cement Company Ltd AA+ 873.44 12.99%
Rabo India Finance Ltd AAA 703.28 10.46%
GE Capital Services India Ltd AA+ 595.65 8.86%
CPs, CDs and Term Deposits 17.00 0.25%
ICICI Bank Ltd P1+ 17.00 0.25%
Cash, Call, CBLO & Reverse Repo 68.10 1.01%
Other Current Assets 261.87 3.89%
Total Net Assets 6,723.88 100.00%
ICICI Prudential FMP Series 35 - 13 Month Plan B
PSU/PFI Bonds 4,040.16 5.39%
Infrastructure Development Finance Corporation AAA 4,040.16 5.39%
Private Corporate Securities 33,264.17 44.36%
HDFC Ltd AAA 16,407.85 21.88%
Mahindra & Mahindra Financial Services Ltd AA+ 7,021.74 9.36%
CitiFinancial Consumer Finance India Ltd AAA 5,018.22 6.69%
GE Money Financial Services Ltd AAA 2,809.61 3.75%
DSP Merill Lynch Capital Ltd AAA 2,006.75 2.68%
CPs, CDs and Term Deposits 36,586.62 48.79%
Export Import Bank of India Ltd AAA 15,911.62 21.22%
UTI Bank Ltd P1+ 15,000.00 20.00%
ICICI Bank Ltd P1+ 5,675.00 7.57%
Cash, Call, CBLO & Reverse Repo 183.60 0.24%
Other Current Assets 918.05 1.22%
Total Net Assets 74,992.60 100.00%
ICICI Prudential FMPSeries 35 - 13 Month Plan A
Private Corporate Securities 17,417.69 67.92%
Rabo India Finance Ltd AAA 5,015.04 19.56%
Kotak Mahindra Primus Ltd AA 4,505.45 17.57%
Citicorp Maruti Finance Ltd AAA 3,582.64 13.97%
PTC UBL Trust DSP Merrill Lynch Capital Ltd F1+ 3,495.51 13.63%
L&T Finance Ltd AA+ 494.90 1.93%
Mahindra & Mahindra Financial Services Ltd AA+ 324.15 1.26%
CPs, CDs and Term Deposits 7,500.00 29.25%
ICICI Bank Ltd P1+ 5,000.00 19.50%
UTI Bank Ltd P1+ 2,500.00 9.75%
Cash, Call, CBLO & Reverse Repo 14.00 0.05%
Other Current Assets 705.92 2.78%
Total Net Assets 25,637.61 100.00%
ICICI Prudential FMP Series 37 - 3 Month Plus Plan A
CPs, CDs and Term Deposits 34,929.56 98.56%
Union Bank of India Ltd P1+ 11,911.78 33.61%
UTI Bank Ltd P1+ 7,000.00 19.75%
ICICI Bank Ltd P1+ 7,000.00 19.75%
State Bank of Patiala Ltd P1+ 6,500.00 18.34%
Export Import Bank of India Ltd P1+ 2,164.78 6.11%
State Bank of Hyderabad Ltd P1+ 353.00 1.00%
Other Current Assets 515.37 1.44%
Total Net Assets 35,444.93 100.00%
ICICI Prudential FMP Series 37 - 1 Year Plan A
CPs, CDs and Term Deposits 27,380.91 99.39%
HSBC Ltd F1+ 27,380.91 99.39%
Cash, Call, CBLO & Reverse Repo 159.20 0.58%
Other Current Assets 7.76 0.03%
Total Net Assets 27,547.87 100.00%
ICICI Prudential FMP Series 34 - 1 Year Plan B
PSU/PFI Bonds 5,244.59 3.97%
PTC Power Finance Corporation Ltd AAA 4,124.82 3.12%
State Bank of India Ltd AAA 1,119.77 0.85%
Private Corporate Securities 60,342.40 45.62%
HDFC Ltd AAA 14,528.71 10.98%
HDFC Bank Ltd AAA 11,875.00 8.98%
Cholamandalam Investment & Finance Co. Ltd AA 10,016.59 7.57%
Kotak Mahindra Bank Ltd AAA(SO) 9,051.19 6.84%
CitiFinancial Consumer Finance India Ltd AAA 5,022.00 3.80%
L&T Finance Ltd A1+(SO) 5,011.42 3.79%
PTC IL & FS Investmart Ltd AAA(SO) 4,576.69 3.46%
Mahindra & Mahindra Financial Services Ltd AA+ 260.80 0.20%
CPs, CDs and Term Deposits 65,197.77 49.30%
ICICI Bank Ltd P1+ 26,875.00 20.32%
Syndicate Bank Ltd P1+ 25,000.00 18.90%
Export Import Bank of India Ltd AAA 7,035.63 5.32%
HSBC Ltd F1+ 2,374.68 1.80%
Birla Home Finance Ltd A1+ 2,286.53 1.73%
Kotak Mahindra Bank Ltd P1+ 960.10 0.73%
Cholamandalam Investment & Finance Co. Ltd P1+ 665.83 0.50%
Cash, Call, CBLO & Reverse Repo 16.50 0.01%
Other Current Assets 1,487.58 1.10%
Total Net Assets 132,288.84 100.00%
ICICI Prudential FMPSeries 37 - 14 Month Plan
PSU/PFI Bonds 3,156.23 14.61%
Infrastructure Development Finance Corp. AAA 3,156.23 14.61%
Private Corporate Securities 13,207.02 61.12%
HDFC Ltd AAA 4,237.58 19.61%
DSP Merill Lynch Capital Ltd AAA 4,013.50 18.57%
Mahindra & Mahindra Financial Services Ltd AA+ 2,748.39 12.72%
GE Money Financial Services Ltd AAA 2,207.55 10.22%
CPs, CDs and Term Deposits 4,936.00 22.85%
ICICI Bank Ltd P1+ 4,736.00 21.92%
Canara Bank Ltd P1+ 200.00 0.93%
Cash, Call, CBLO & Reverse Repo 7.10 0.03%
Other Current Assets 302.51 1.39%
Total Net Assets 21,608.86 100.00%
ICICI Prudential FMP Series 37 - 3 Months Plus Plan B
Private Corporate Securities 16,000.00 29.24%
Rabo India Finance Ltd P1+ 8,000.00 14.62%
GE Money Financial Services Ltd P1+ 8,000.00 14.62%
CPs, CDs and Term Deposits 38,558.43 70.46%
HDFC Bank Ltd P1+ 13,090.35 23.92%
IDBI Bank Ltd P1+ 11,431.17 20.89%
State Bank of Patiala Ltd P1+ 6,075.90 11.10%
Allahabad Bank Ltd P1+ 5,307.31 9.70%
Kotak Mahindra Bank Ltd P1+ 2,653.70 4.85%
Cash, Call, CBLO & Reverse Repo 3.10 0.01%
Other Current Assets 157.32 0.29%
Total Net Assets 54,718.85 100.00%

28
ICICI Prudential Fixed Maturity Plan WHY SHOULD ONE INVEST?Those who have a fixed investment horizon
ranging from 1 month to 36 monthsFigures as on 31-May-2007
Fund Manager : Chaitanya Pande
ICICI Prudential FMPSeries 34 - 6 Month Plan
PSU/PFI Bonds 0.96 0.01%
Power Finance Corporation Ltd AAA 0.96 0.01%
CPs, CDs and Term Deposits 17,478.85 98.44%
Jammu & Kashmir Bank Ltd AAA 3,571.61 20.12%
UTI Bank Ltd P1+ 3,500.00 19.71%
ICICI Bank Ltd P1+ 3,500.00 19.71%
State Bank of Bikaner & Jaipur Ltd P1+ 3,498.00 19.70%
IDBI Bank Ltd P1+ 3,174.24 17.88%
State Bank of Hyderabad Ltd P1+ 235.00 1.32%
Cash, Call, CBLO & Reverse Repo 2.40 0.01%
Other Current Assets 273.41 1.54%
Total Net Assets 17,755.62 100.00%
ICICI Prudential FMP 30 - 13 Mths Plan
PSU/PFI Bonds 3,342.72 14.62%
Nabard AAA 3,342.72 14.62%
Private Corporate Securities 4,094.16 17.90%
Kotak Mahindra Primus Ltd P1+ 2,486.82 10.87%
PTC IPGE Loan Trust GE Capital Services India Ltd F1+SO 1,607.34 7.03%
CPs, CDs and Term Deposits 14,944.50 65.35%
GE Capital Services India Ltd P1+ 5,131.07 22.44%
Union Bank of India Ltd P1+ 4,908.28 21.46%
Yes Bank P1+ 4,905.15 21.45%
Other Current Assets 487.67 2.13%
Total Net Assets 22,869.05 100.00%
ICICI Prudential FMPSeries 34 - 15 Month Plan
PSU/PFI Bonds 3,831.25 9.11%
Infrastructure Development Finance Corporation AAA 3,831.25 9.11%
Private Corporate Securities 28,750.61 68.35%
Kotak Mahindra Primus Ltd AA 5,999.00 14.27%
CitiFinancial Consumer Finance India Ltd AAA 5,194.19 12.35%
GE Capital Services India Ltd AAA 5,014.39 11.92%
Citicorp Finance (India) Ltd AAA 4,992.10 11.87%
GE Money Financial Services Ltd AAA 2,999.25 7.13%
Rabo India Finance Ltd AAA 1,994.38 4.74%
Sundaram Finance Ltd AAA 1,464.51 3.48%
Ultratech Cement Company Ltd AA+ 582.29 1.38%
Citicorp Maruti Finance Ltd AAA 294.46 0.70%
DSP Merill Lynch Capital Ltd AAA(SO) 216.04 0.51%
CPs, CDs and Term Deposits 8,320.00 19.79%
ICICI Bank Ltd P1+ 8,320.00 19.79%
Cash, Call, CBLO & Reverse Repo 148.70 0.35%
Other Current Assets 1,000.51 2.40%
Total Net Assets 42,051.07 100.00%
ICICI Prudential FMPSeries 34 - 16 Month Plan
PSU/PFI Bonds 2,977.02 10.18%
Infrastructure Development Finance Corporation AAA 2,977.02 10.18%
Private Corporate Securities 19,604.39 67.03%
CitiFinancial Consumer Finance India Ltd AAA 5,031.98 17.21%
DSP Merill Lynch Capital Ltd AAA(SO) 3,671.28 12.55%
Rabo India Finance Ltd AAA 2,991.57 10.23%
L&T Finance Ltd AA+ 2,969.43 10.15%
Citicorp Finance (India) Ltd AAA 2,458.24 8.41%
GE Capital Services India Ltd AA+ 1,389.86 4.75%
GE Money Financial Services Ltd AA+ 1,092.03 3.73%
CPs, CDs and Term Deposits 5,665.00 19.37%
ICICI Bank Ltd P1+ 5,665.00 19.37%
Cash, Call, CBLO & Reverse Repo 17.80 0.06%
Other Current Assets 982.44 3.36%
Total Net Assets 29,246.65 100.00%
ICICI Prudential FMP Series 35 - 1 Year Plan
Private Corporate Securities 4,178.76 17.82%
CitiFinancial Consumer Finance India Ltd AAA(SO) 2,508.66 10.70%
HDFC Ltd AAA 1,601.20 6.83%
Citicorp Maruti Finance Ltd AAA 49.08 0.21%
Citicorp Finance (India) Ltd AAA 19.82 0.08%
CPs, CDs and Term Deposits 19,160.93 81.70%
Kotak Mahindra Bank Ltd P1+ 5,105.93 21.77%
American Express Bank Ltd P1+ 5,018.53 21.40%
HSBC Ltd F1+ 4,932.02 21.03%
Cholamandalam Investment & Finance Co. Ltd P1+ 4,104.45 17.50%
Cash, Call, CBLO & Reverse Repo 39.80 0.17%
Other Current Assets 70.36 0.31%
Total Net Assets 23,449.85 100.00%
ICICI Prudential FMPSeries 37 - 3 Month Plan A
Private Corporate Securities 8,000.00 35.52%
SBI Factors & Commercial Services Pvt Ltd A1+ 3,000.00 13.32%
Rabo India Finance Ltd P1+ 3,000.00 13.32%
CitiFinancial Consumer Finance India Ltd P1+ 2,000.00 8.88%
CPs, CDs and Term Deposits 13,975.65 62.08%
UTI Bank Ltd P1+ 4,300.00 19.10%
ICICI Bank Ltd P1+ 4,300.00 19.10%
Corporation Bank Ltd P1+ 4,300.00 19.10%
American Express Bank Ltd P1+ 1,075.65 4.78%
Other Current Assets 539.35 2.40%
Total Net Assets 22,515.00 100.00%
ICICI Prudential FMPSeries 37 - 3 Month Plan B
Private Corporate Securities 10,590.00 26.49%
Cessna Garden Developers Pvt Ltd P1+SO 4,990.00 10.50%
JM Financial & InvestmentConsultancy Services Pvt. Ltd P1+ 4,100.00 8.62%
Indiabulls Financial Services Ltd P1+ 2,000.00 4.21%
TGS Investment & Trade Pvt. Ltd. A1+ 1,500.00 3.16%
CPs, CDs and Term Deposits 34,022.26 71.57%
State Bank of Bikaner & Jaipur Ltd P1+ 9,265.00 19.49%
ICICI Bank Ltd P1+ 9,250.00 19.46%
State Bank of Patiala Ltd P1+ 9,234.00 19.42%
Indiabulls Financial Services Ltd AAA 2,968.80 6.25%
Alembic Ltd P1+ 1,984.46 4.17%
ING Vysya Bank Ltd P1+ 1,320.00 2.78%
Cash, Call, CBLO & Reverse Repo 43.70 0.09%
Other Current Assets 881.16 1.86%
Total Net Assets 47,537.12 100.00%
ICICI Prudential FMPSeries 38 - 1 Yearly Plan A
Private Corporate Securities 4,499.83 19.55%
Sundaram Finance Ltd A1+ 2,500.01 10.86%
Kotak Mahindra Bank Ltd AA 1,999.82 8.69%
CPs, CDs and Term Deposits 13,639.48 59.26%
Industrial Development Bank of India A1+ 9,080.54 39.45%
Allahabad Bank Ltd A1+ 2,285.92 9.93%
IDBI Bank Ltd P1+ 2,273.02 9.88%
Cash, Call, CBLO & Reverse Repo 1,438.90 6.25%
Other Current Assets 3,439.35 14.94%
Total Net Assets 23,017.56 100.00%
ICICI Prudential FMP Series 38 - 3 Months Plan A
Private Corporate Securities 2,500.00 7.96%
Birla Global Finance Ltd A1+ 2,500.00 7.96%
CPs, CDs and Term Deposits 28,890.16 91.95%
Standard Chartered Bank Ltd P1+ 12,695.61 40.41%
ABN Amro Bank Ltd A1+ 7,389.61 23.52%
HDFC Ltd P1+ 4,920.71 15.66%
ING Vysya Bank Ltd P1+ 2,461.10 7.83%
Industrial Development Bank of India P1+ 1,423.13 4.53%
Cash, Call, CBLO & Reverse Repo 7.50 0.02%
Other Current Assets 21.51 0.07%
Total Net Assets 31,419.17 100.00%

29
ICICI Prudential Fixed Maturity Plan WHY SHOULD ONE INVEST?Those who have a fixed investment horizon
ranging from 1 month to 36 monthsFigures as on 31-May-2007
Fund Manager : Chaitanya Pande
ICICI Prudential FMPSeries 38 - 3 Month Plan B
Private Corporate Securities 1,970.01 2.77%
Kotak Mahindra Bank Ltd P1+ 1,970.01 2.77%
CPs, CDs and Term Deposits 68,949.51 96.90%
Indian Bank Ltd A1+ 9,720.51 13.66%
GE Capital Services India Ltd P1+ 9,714.55 13.65%
Union Bank of India Ltd P1+ 9,713.29 13.65%
HDFC Bank Ltd P1+ 9,696.55 13.63%
Standard Chartered Bank Ltd P1+ 9,685.54 13.61%
State Bank of Patiala Ltd P1+ 6,034.45 8.48%
Industrial Development Bank of India P1+ 5,055.62 7.11%
Indiabulls Financial Services Ltd P1+ 4,898.13 6.88%
Allahabad Bank Ltd P1+ 4,430.87 6.23%
Cash, Call, CBLO & Reverse Repo 159.20 0.22%
Other Current Assets 72.66 0.11%
Total Net Assets 71,151.38 100.00%
ICICI Prudential FMPSeries 38 - 3 Month Plan C
PSU/PFI Bonds 1,500.00 12.18%
CanBank Factors Ltd P1+ 1,500.00 12.18%
Private Corporate Securities 1,500.00 12.18%
Birla Global Finance Ltd A1+ 1,500.00 12.18%
CPs, CDs and Term Deposits 4,626.62 37.59%
State Bank of India Ltd P1+ 4,401.82 35.76%
Infrastructure Development Finance Corporation P1+ 224.80 1.83%
Cash, Call, CBLO & Reverse Repo 4,761.69 38.68%
Other Current Assets (77.44) -0.63%
Total Net Assets 12,310.87 100.00%
ICICI Prudential FMP 34 - 1 Year Plan A
PSU/PFI Bonds 0.96 0.01%
Power Finance Corporation Ltd AAA 0.96 0.01%
Private Corporate Securities 6,525.18 40.34%
GE Money Financial Services Ltd AAA 2,276.42 14.07%
DSP Merill Lynch Capital Ltd P1+ 2,275.36 14.07%
Hindalco Industries Ltd AAA 1,973.40 12.20%
CPs, CDs and Term Deposits 8,800.00 54.41%
UTI Bank Ltd P1+ 3,200.00 19.78%
Allahabad Bank Ltd P1+ 3,100.00 19.17%
ICICI Bank Ltd P1+ 2,500.00 15.46%
Cash, Call, CBLO & Reverse Repo 209.20 1.29%
Other Current Assets 639.50 3.95%
Total Net Assets 16,174.84 100.00%
ICICI Prudential Hyrbid FMP - 13 Months
PSU/PFI Bonds 9,928.43 11.92%Infrastructure Development Finance Corporation AAA 9,928.43 11.92%Private Corporate Securities 23,802.41 28.57%HDFC Ltd AAA 13,891.41 16.67%PTC GE Capital Services India Ltd AAA(SO) 4,955.50 5.95%PTC GE Capital Services India Ltd AAA 4,955.50 5.95%CPs, CDs and Term Deposits 44,614.48 53.56%Industrial Development Bank of India P1+ 15,000.00 18.01%ICICI Bank Ltd P1+ 14,970.00 17.97%Allahabad Bank Ltd P1+ 14,500.00 17.41%Kotak Mahindra Bank Ltd P1+ 144.48 0.17%Cash, Call, CBLO & Reverse Repo 43.90 0.05%Other Current Assets 4,919.10 5.90%Total Net Assets 83,308.32 100.00%
PERFORMANCEPerformance Records for FMP- Retail Growth Plan
Scheme Name Date Period NAV *NAV as On Returns30-May-07
ICICI Prudential FMP 30 -13 Months 17-Jul-06 Since inception 10.0000 10.6524 6.52%
ICICI Prudential Hybrid FMP 30-Aug-06 Since inception 10.0000 10.5414 5.41%13 Months Plan
ICICI Prudential FMP Series 11-Nov-06 Since inception 10.0000 10.3888 3.89%34 - 1 Year Plan A
ICICI Prudential FMP Series 25-Nov-06 Since inception 10.0000 10.2365 2.36%34 - 18 Months Plan
ICICI Prudential FMP Series 23-Dec-06 Since inception 10.0000 10.2522 2.52% 34 - 17 Months Plan
ICICI Prudential FMP Series 22-Jan-07 Since inception 10.0000 10.2546 2.55%34 - 16 Months Plan
ICICI Prudential FMP Series 27-Feb-07 Since inception 10.0000 10.2633 2.63%34 - 15 Months Plan
ICICI Prudential FMP Series 9-Mar-07 Since inception 10.0000 10.2524 2.52%35 - 13 Months Plan A
ICICI Prudential FMP Series 9-Mar-07 Since inception 10.0000 10.2378 2.38%34 - 6 Months Plan
ICICI Prudential FMP Series 16-Mar-07 Since inception 10.0000 10.2248 2.25%35 - 13 Months Plan B
ICICI Prudential FMP Series 16-Mar-07 Since inception 10.0000 10.2231 2.23%37 - 3 Months Plan A
ICICI Prudential FMPSeries 23-Mar-07 Since inception 10.0000 10.2158 2.16%37 - 14 Months Plan
ICICI Prudential FMP Series 23-Mar-07 Since inception 10.0000 10.2137 2.14%37 - 3 Months Plus Plan - A
ICICI Prudential FMP Series 29-Mar-07 Since inception 10.0000 10.1946 1.95%34- 1 Year Plan B
ICICI Prudential FMP Series 29-Mar-07 Since inception 10.0000 10.1968 1.97%37 - 3 Months Plan B
ICICI Prudential FMP Series 30-Mar-07 Since inception 10.0000 10.1750 1.75%37 - 1 Year Plan A
ICICI Prudential FMP Series 19-Apr-07 Since inception 10.0000 10.1223 1.22%35 - 1 Year Plan
ICICI Prudential FMP Series 20-Apr-07 Since inception 10.0000 10.1124 1.12%38 - 3 Months Plan A
ICICI Prudential FMP Series 11-May-07 Since inception 10.0000 10.0490 0.49%38 - 3 Months Plan B
ICICI Prudential FMP Series 18-May-07 Since inception 10.0000 10.0347 0.35%38 - 1 Year Plan A
* NAV is declared on a weekly basis.
The units under ICICI Prudential FMP Series 38 - 3 Months Plan C were alloted on30-May-07and the NAV for the same would be declared on 06-Jun-07.
Returns >= 1 Year are CAGR, < 1 Year are Absolute. Note: For computation of returns theallotment NAV has been taken as Rs 10.00. Past performance may or may not be sustainedin the future.
Fund Size Rs. 8,580.67 Crores

30
ICICI Prudential Interval Fund WHY SHOULD ONE INVEST?Risk averse investors seeking returns on a held
to maturity basis.Figures as on 31-May-2007
Fund Manager : Chaitanya Pande
INVESTMENT HORIZON 1 Month to 15 Months
PORTFOLIO
Company/Issuer Sector/ Mkt.Value % toRating (Rs.Lacs) NAV
ICICI Prudential Interval Fund-Mntly Int Plan I
CPs, CDs and Term Deposits 8,355.67 99.66%
GE Money Financial Services Ltd P1+ 2,430.22 28.99%
ABN Amro Bank Ltd P1+ 2,424.02 28.91%
Industrial Development Bank of India P1+ 2,236.14 26.67%
State Bank of Patiala Ltd P1+ 1,265.29 15.09%
Cash, Call, CBLO & Reverse Repo 24.70 0.29%
Other Current Assets 3.04 0.05%
Total Net Assets 8,383.41 100.00%
ICICI Prudential Interval Fund-Mntly Int Plan II
CPs, CDs and Term Deposits 1,458.53 100.30%
Industrial Development Bank of India P1+ 486.94 33.49%
UCO Bank P1+ 486.30 33.44%
Essel Propack Ltd A1+ 485.29 33.37%
Other Current Assets (4.46) -0.30%
Total Net Assets 1,454.07 100.00%
ICICI Prudential Interval Fund-Qtrly Int Plan I
Private Corporate Securities 4,800.00 14.67%
GE Money Financial Services Ltd AAA 4,800.00 14.67%
CPs, CDs and Term Deposits 27,874.37 85.21%
Allahabad Bank Ltd P1+ 7,998.74 24.45%
State Bank of Mysore Ltd P1+ 5,329.37 16.29%
Edelweiss Securities Pvt Ltd P1+ 4,892.37 14.96%
State Bank of India Ltd P1+ 4,854.16 14.84%
UCO Bank P1+ 2,431.48 7.43%
HSBC Ltd F1+ 2,368.25 7.24%
Cash, Call, CBLO & Reverse Repo 18.70 0.06%
Other Current Assets 17.21 0.06%
Total Net Assets 32,710.28 100.00%
PERFORMANCEPerformance Records for FMP- Retail Growth Plan
Scheme Name Date Period NAV NAV as On Returns31-May-07
ICICI Pru Interval Fund - 12-May-07 Since inception 10.0000 10.0463 0.46%Monthly Interval Plan I
ICICI Pru Interval Fund - 15-May-07 Since inception 10.0000 10.0447 0.45%Quarterly Interval Plan I
ICICI Pru Interval Fund - 26-May-07 Since inception 10.0000 10.0129 0.13%Monthly Interval Plan II
Returns >= 1 Year are CAGR, < 1 Year are Absolute. Note: For computation of returns theallotment NAV has been taken as Rs 10.00. Past performance may or may not be sustainedin the future.
Fund Size Rs. 425.48 Crores

31
Quantitative Indicators:
Average Maturity : 0.38 yearModified Duration : 0.35 yearYield To Maturity : 9.64%% Unlisted Bonds : 4.65%
Maturity profile:Performance Record *- Cumulative Option
Rs. 10000 invested at inception: Flexible Vs Crisil Composite Bond Fund Index
Rating Profile
PSU/PFI Bonds 747.99 0.32%Industrial Development Bank of India AA+ 447.66 0.19%Power Finance Corporation Ltd AAA 300.33 0.13%Private Corporate Securities 37,677.22 16.05%
• PTC Shriram Transport F1+ 8,733.61 3.72%• PTC Credit Asset Trust Series HSBC F1+SO 5,044.73 2.15%• Kotak Mahindra Primus Ltd P1+ 4,000.00 1.71%• PTC DAS Trust Standard Chartered Bank A1+(SO) 3,048.97 1.30%• GE Capital Services India Ltd AAA 4,200.00 1.79%
PTC GE Capital Services India Ltd A1+(SO) 2,601.94 1.11%PTC Citi Fleet Trust Citibank AAA(SO) 2,488.80 1.06%TGS Investment & Trade Pvt. Ltd. A1+ 2,000.00 0.85%PTC ICL Trust Birla Home Finance P1+SO 1,999.13 0.85%Hindalco Industries Ltd AAA 1,981.11 0.84%Oscar Investments Ltd Unrated 700.00 0.30%Reliance Industries Ltd AAA 501.64 0.21%PTC DLF GE Capital Services India Ltd AAA(SO) 207.30 0.09%Kotak Mahindra Primus Ltd AA 169.99 0.07%CPs, CDs and Term Deposits 181,493.58 77.43%ABN Amro Bank Ltd A1+ 20,237.35 8.63%HDFC Bank Ltd P1+ 16,551.16 7.06%ING Vysya Bank Ltd P1+ 15,666.16 6.68%American Express Bank Ltd P1+ 15,115.56 6.45%ICICI Bank Ltd P1+ 15,000.00 6.40%Essel Propack Ltd A1+ 14,558.61 6.21%State Bank of Indore Ltd P1+ 14,539.45 6.20%Industrial Development Bank of India P1+ 10,137.78 4.32%State Bank of Saurashtra Ltd A1+ 9,446.62 4.03%Allahabad Bank Ltd AAA / P1+ 9,460.79 4.04%Jammu & Kashmir Bank Ltd AAA 6,147.06 2.62%Standard Chartered Investment & Loan (India) Ltd P1+ 6,074.74 2.59%IDBI Bank Ltd P1+ 4,868.47 2.08%GE Capital Transportation Financial Services Ltd P1+ 4,615.59 1.97%Corporation Bank Ltd P1+ 4,000.00 1.71%Cholamandalam Investment & Finance Co. Ltd P1+ 2,526.51 1.08%State Bank of Mysore Ltd P1+ 2,370.71 1.01%Kotak Mahindra Bank Ltd P1+ 2,225.17 0.95%UCO Bank P1+ 1,940.81 0.83%UTI Bank Ltd P1+ 1,900.00 0.81%State Bank of Bikaner & Jaipur Ltd P1+ 1,496.00 0.64%Infrastructure Development Finance Corporation P1+ 998.40 0.43%State Bank of Hyderabad Ltd P1+ 998.19 0.43%State Bank of Patiala Ltd P1+ 497.11 0.21%Union Bank of India Ltd P1+ 101.54 0.04%Yes Bank P1+ 19.80 0.01%Cash, Call, CBLO & Reverse Repo 13,138.36 5.60%Other Current Assets 1,441.42 0.60%
Total Net Assets 234,498.57 100.00%
• Top Five Holdings
Snapshot:
Fund Manager : Rahul GoswamiIndicative Investment Horizon: 1 year & aboveInception date: 27-09-2002Fund Size: Rs. 2,344.99 croresNAV (As on 31-May-2007):Cumulative option : Rs. 13.9595**Expense Ratio (6 Months avg. Dec 06-May 07): 0.55%
**This is a close approximation of the number.
WHY SHOULD ONE INVEST?Medium term investment for returns generated
from managing interest rate volatility
*Returns >= 1 Year are CAGR, < 1 Year are Absolute. Benchmark is CrisilComposite Bond Fund Index. For computation of returns the allotment NAVhas been taken as Rs. 10.00. Past performance may or may not be sustainedin future.
ICICI Prudential Flexible Income Plan
CAGR – Flexible Income Plan : 7.39%; Benchmark : 4.77%Past performance may or may not be sustained in future.
PortfolioCompany/Issuer Rating Mkt Value (Rs. Lakh) % to NAVStyle Box
Figures as on 31-May-2007
24.56%
4.73%
0.61%
70.09%
-20.00% 10.00% 40.00% 70.00% 100.00%
<182 days
182 days - 1 year
1-3 years
Other CurrentAssets
4.38%
8.04%
5.27%
7.39%
0.80%
3.68%2.83%
4.77%
0.00%1.00%2.00%3.00%4.00%5.00%6.00%7.00%8.00%9.00%
Last6 Months
Last1 years
Last3 years
SinceInception
Flexible Income Plan Crisil Composite Bond Fund Index
Rs 13959.50
Rs 12434.57
9,95010,45010,95011,45011,95012,45012,95013,45013,95014,450
Sep-
02De
c-02
Mar
-03
Jun-
03Se
p-03
Dec-
03M
ar-0
4Ju
n-04
Sep-
04De
c-04
Mar
-05
Jun-
05Se
p-05
Dec-
05M
ar-0
6Ju
n-06
Sep-
06De
c-06
Mar
-07
Flexible Income Plan Crisil Composite Bond Fund Index
AAA andEquivalent93.22%
Call,Current Assets and
Reverse Repos6.22%
AA and Equivalent
0.26%
Unrated0.30%

32
Quantitative Indicators: Treasury Plan
Average Maturity : 0.63 YearModified Duration : 0.58 YearYield To Maturity : 9.64%% Unlisted Bonds : 0.00%
Quantitative Indicators: Investment PlanAverage Maturity : 14.07 YearsModified Duration : 5.19 YearsYield To Maturity : 9.15%% Unlisted Bonds : 0.00%
Maturity Profile:Maturity Profile:
Performance Record* - Growth Option (Treasury Plan)
Rs. 10000 invested at inception*: Gilt -Treasury Vs I Sec Si Bex
WHY SHOULD ONE INVEST?Treasury Plan: Short term deployment of funds in a portfolio of G-Secs with low volatility
Investment Plan: Medium term investment in a portfolio of G-Secs for steady returns with market volatility
*Returns >= 1 Year are CAGR, < 1 Year are Absolute. Benchmark is I Sec Si Bex. Benchmarkstart date : 31-03-2002. For computation of returns the allotment NAV has been taken asRs. 10.00. Past performance may or may not be sustained in future.
ICICI Prudential Gilt Fund
*Benchmark start date : 31-03-2002. CAGR – Gilt - Treasury : 5.93%; Benchmark : 6.13%Past performance may or may not be sustained in future.
Style Box Snapshot: Investment PlanFund Manager : Rahul GoswamiIndicative Investment Horizon: 1 year & aboveInception date: 19-08-1999Fund Size: Rs. 97.94 croresNAV (As on 31-May-2007): Growth option : Rs. 22.6859
Dividend option: Rs. 10.7314
**Expense Ratio (6 Months avg. Dec 06-May 07): 1.15%
**This is a close approximation of the number.
Snapshot: Treasury Plan
Fund Manager : Rahul GoswamiIndicative Investment Horizon: 3-6 monthsInception date: 19-08-1999Fund Size: Rs. 56.72 croresNAV (As on 31-May-2007): Growth option : Rs. 18.2209
Dividend option: Rs. 10.6186
**Expense Ratio (6 Months avg. Dec 06-May 07): 1.10%
**This is a close approximation of the number.
Rs. 10000 invested at inception: Gilt - Investment Vs I-Sec I Bex
CAGR – Gilt - Investment: 11.09%; Benchmark : 11.20%. Past performance may or maynot be sustained in future.
Performance Record* - Growth Option (Investment Plan)
*Returns >= 1 Year are CAGR, < 1 Year are Absolute. Benchmark is I Bex. For computationof returns the allotment NAV has been taken as Rs. 10.00. Past performance may or maynot be sustained in future.
Style BoxFigures as on 31-May-2007
Portfolio - Treasury Plan
Company/Issuer Rating Mkt Value % to NAV(Rs. Lakh)
CPs, CDs and Term Deposits 5,362.60 94.55%• Kotak Mahindra Bank Ltd P1+ 1,615.79 28.49%• State Bank of Mysore Ltd P1+ 968.98 17.08%• State Bank of Travancore Ltd P1+ 604.89 10.66%• Industrial Development Bank of India P1+ 507.58 8.95%• Canara Bank Ltd P1+ 463.36 8.17%
Allahabad Bank Ltd A1+ 462.58 8.16%IDBI Bank Ltd P1+ 370.19 6.53%Union Bank of India Ltd P1+ 369.23 6.51%Cash, Call, CBLO & Reverse Repo 355.10 6.26%Other Current Assets (45.75) -0.81%Total Net Assets 5,671.95 100.00%
• Top Five Holdings
Portfolio - Investment Plan
Company/Issuer Rating Mkt Value % to NAV(Rs. Lakh)
Government Securities 4,444.65 45.38%• 8.33% GOI 2036 Sovereign 4,444.65 45.38%
CPs, CDs and Term Deposits 4,709.03 48.09%• State Bank of Mysore Ltd P1+ 1,937.95 19.79%• Kotak Mahindra Bank Ltd P1+ 1,661.95 16.97%• IDBI Bank Ltd P1+ 555.29 5.67%• Union Bank of India Ltd P1+ 553.84 5.66%
Cash, Call, CBLO & Reverse Repo 224.00 2.29%Other Current Assets 416.06 4.24%Total Net Assets 9,793.74 100.00%
• Top Five Holdings
77.46%
-0.81%
23.34%
-40.00% 0.00% 40.00% 80.00% 120.00%
182 days - 1 year
<182 days
Other Current Assets
45.38%
28.29%
22.07%
4.25%
0.00% 10.00% 20.00% 30.00% 40.00% 50.00%
> 10 years
182 days - 1 year
<182 days
Other Current Assets
Rs 13464.15
Rs 13597.52
9,78010,28010,78011,28011,78012,28012,78013,28013,78014,280
Apr-0
2Ju
l-02
Oct-0
2Ja
n-03
Apr-0
3Ju
l-03
Oct-0
3Ja
n-04
Apr-0
4Ju
l-04
Oct-0
4Ja
n-05
Apr-0
5Ju
l-05
Oct-0
5Ja
n-06
Apr-0
6Ju
l-06
Oct-0
6Ja
n-07
Apr-0
7
Gilt Treasury I Sec Si Bex
Rs 22685.90
Rs 22852.80
9,93111,931
13,93115,931
17,93119,931
21,93123,931
Aug-
99Ja
n-00
Jun-
00N
ov-0
0Ap
r-01
Sep-
01Fe
b-02
Jul-0
2De
c-02
May
-03
Oct
-03
Mar
-04
Aug-
04Ja
n-05
Jun-
05N
ov-0
5Ap
r-06
Sep-
06Fe
b-07
Gilt Investment I Sec I-Bex
2.09%
5.50% 4.90%
6.25%8.01%
3.18%
6.84%5.17%
6.36%
0.00%1.00%2.00%3.00%4.00%5.00%6.00%7.00%8.00%9.00%
Last 6Months
Last1 years
Last3 years
Last5 years
SinceInception
Gilt Treasury I Sec Si Bex
0.71%
7.56%
3.82%
7.78%
11.09%
-0.33%
6.10%
3.23%
8.01%
11.20%
-2.00%0.00%2.00%4.00%6.00%8.00%
10.00%12.00%
Last 6Months
Last 1years
Last 3years
Last 5years
SinceInception
Gilt Investment I Sec I-Bex

33
Maturity profile:
Performance Record - Growth option
Quantitative Indicators: Investment PF Plan
Average Maturity : 16.08 yearsModified Duration : 6.14 yearsYield To Maturity : 9.01%%Unlisted : 0.00%
Rs. 10000 invested at inception: Gilt -Investement PF Vs I Sec Li BexRs. 10000 invested at inception: Gilt -Treasury PF Vs I Sec Si Bex
Maturity Profile:
Quantitative Indicators: Treasury PF Plan
Average Maturity : 0.68 YearModified Duration : 0.62 YearYield To Maturity : 10.14%% Unlisted : 0.00%
Performance Record - Growth option
Snapshot: Treasury Plan PF optionFund Manager : Rahul GoswamiIndicative Investment Horizon: 3-6 monthsInception date: 11-Feb-04Fund Size: Rs. 29.87 croresNAV (As on 31-May-2007): Growth option: Rs. 11.6051**Expense Ratio (6 Months avg. Dec 06-May 07): 1.50%
**This is a close approximation of the number.
WHY SHOULD ONE INVEST?Treasury: Short term deployment of funds in portfolio of G-Secs with low volatility
Investment: Medium term investment for steady returns with market volatility
Returns >= 1 Year are CAGR, < Year are Absolute. Benchmark is I-Sec Si Bex Index.For computation of returns the allotment NAV has been taken as Rs. 10.00. Past performancemay or may not be sustained in future.
ICICI Prudential Gilt Fund PF Option
Portfolio - Treasury PF
Company/Issuer Rating Mkt Value % to NAV(Rs. Lakh)
CPs, CDs and Term Deposits 2,950.73 98.78%• Industrial Development Bank of India P1+ 1,010.43 33.83%• Canara Bank Ltd P1+ 463.36 15.51%• Allahabad Bank Ltd A1+ 462.58 15.49%• IDBI Bank Ltd P1+ 370.19 12.39%• State Bank of Travancore Ltd P1+ 325.71 10.90%
Union Bank of India Ltd P1+ 318.46 10.66%Cash, Call, CBLO & Reverse Repo 40.70 1.36%Other Current Assets (4.38) -0.14%Total Net Assets 2,987.05 100.00%
• Top Five Holdings
Style Box
Absolute – Gilt Treasury PF option : 4.61%; Benchmark : 5.21%. Past performance may ormay not be sustained in future.
Portfolio - Investment PF
Company/Issuer Rating Mkt Value % to NAV(Rs. Lakh)
Government Securities 4,675.03 60.92%• 8.33% GOI 2036 Sovereign 3,950.80 51.49%• 6.20% GOI 2015 Sovereign 532.84 6.94%• 6.65% GOI 2009 Sovereign 191.39 2.49%
CPs, CDs and Term Deposits 2,776.07 36.18%• Allahabad Bank Ltd P1+ 1,039.07 13.54%• Kotak Mahindra Bank Ltd P1+ 729.41 9.51%
IDBI Bank Ltd P1+ 555.29 7.24%Union Bank of India Ltd P1+ 452.30 5.89%Cash, Call, CBLO & Reverse Repo 101.10 1.32%Other Current Assets 120.88 1.58%Total Net Assets 7,673.08 100.00%
• Top Five Holdings
Snapshot: Investment Plan PF optionFund Manager : Rahul GoswamiIndicative Investment Horizon: 1 year & aboveInception date: 19-Nov-03Fund Size: Rs. 76.73 croresNAV (As on 31-May-2007): Growth option: Rs. 11.8165**Expense Ratio (6 Months avg. Dec 06-May 07): 1.10%
**This is a close approximation of the number.
Style Box
Absolute – Gilt Investment PF option : 4.84%; Benchmark : 3.23%. Past performancemay or may not be sustained in future.
Returns >= 1 Year are CAGR, < Year are Absolute. Benchmark is I-Sec Li Bex Index.For computation of returns the allotment NAV has been taken as Rs. 10.00. Past performancemay or may not be sustained in future.
Figures as on 31-May-2007
98.78%
1.36%
-0.15%
-40.00% 0.00% 40.00% 80.00% 120.00%
182 days - 1 year
<182 days
Other Current Assets
51.49%
36.18%
6.94%
1.58%
1.32%
2.49%
0.00% 40.00% 80.00%
> 10 years
182 days - 1 year
5-10 years
1-3 years
Other Current Assets
<182 days
2.33%
5.58%4.34% 4.61%
3.18%
6.84%
5.17% 5.21%
0.00%1.00%2.00%3.00%4.00%5.00%6.00%7.00%8.00%
Last6 Months
Last1 years
Last3 years
SinceInception
Gilt Treasury-PF I Sec Si Bex
Rs 11816.50
Rs 11187.13
9,235
9,735
10,235
10,735
11,235
11,735
12,235
Nov-
03Ja
n-04
Mar
-04
May
-04
Jul-0
4Se
p-04
Nov-
04Ja
n-05
Mar
-05
May
-05
Jul-0
5Se
p-05
Nov-
05Ja
n-06
Mar
-06
May
-06
Jul-0
6Se
p-06
Nov-
06Ja
n-07
Mar
-07
May
-07
Gilt Fund-PF I Sec Li-Bex
Rs 11605.10
Rs 11826.89
9,95010,15010,35010,55010,75010,95011,15011,35011,55011,75011,950
Feb-
04Ap
r-04
Jun-
04Au
g-04
Oct
-04
Dec-
04Fe
b-05
Apr-0
5Ju
n-05
Aug-
05O
ct-0
5De
c-05
Feb-
06Ap
r-06
Jun-
06Au
g-06
Oct
-06
Dec-
06Fe
b-07
Apr-0
7
Gilt Treasury-PF I Sec Si Bex
-1.31%
7.11%
4.50% 4.84%
-1.33%
6.64%
3.13% 3.23%
-2.00%-1.00%0.00%1.00%2.00%3.00%4.00%5.00%6.00%7.00%8.00%
Last 6Months
Last1 years
Last3 years
SinceInception
Gilt Fund-PF I Sec Li-Bex

34
Maturity profile:
Quantitative Indicators:
Average Maturity : 0.03 yearModified Duration : 0.02 yearYield To Maturity : 10.42%% Unlisted Bonds : 5.90%
Rating Profile
Portfolio
Snapshot:
Fund Manager : Rahul GoswamiIndicative Investment Horizon: 1 year & moreInception date: 28-03-2002Fund Size: Rs. 932.85 croresNAV (As on 31-May-2007):
Growth option : Rs. 15.8843Dividend option : Rs. 10.5616
**Expense Ratio (6 Months avg. Dec 06-May 07): 0.41%**This is a close approximation of the number.
WHY SHOULD ONE INVEST?Medium term investment for steady returns with market volatility
Company/Issuer Rating Mkt Value (Rs. Lakh) % to NAV
ICICI Prudential Long Term Plan
PSU/PFI Bonds 3,625.49 3.88%• Export Import Bank of India Ltd AAA 2,986.88 3.20%• Nabard AAA 638.61 0.68%
Private Corporate Securities 6,249.47 6.70%• Kotak Mahindra Primus Ltd AA 3,738.29 4.01%• CitiFinancial Retail Services India Ltd AAA 2,491.53 2.67%• Mahindra & Mahindra Financial
Services Ltd AA+ 19.65 0.02%CPs, CDs and Term Deposits 42,761.58 45.84%UTI Bank Ltd P1+ 35,000.00 37.52%State Bank of Bikaner & Jaipur Ltd P1+ 7,500.00 8.04%State Bank of Hyderabad Ltd P1+ 212.00 0.23%Union Bank of India Ltd P1+ 49.58 0.05%Cash, Call, CBLO & Reverse Repo 2,956.69 3.17%Other Current Assets 37,691.91 40.41%Total Net Assets 93,285.14 100.00%
• Top Five Holdings
Rs. 10000 invested at inception: Long Term Plan Vs Crisil Composite Bond Fund Index
*Benchmark start date : 31-03-2002CAGR – Long Term Plan : 9.20%; Benchmark : 5.19%Past performance may or may not be sustained in future.
Figures as on 31-May-2007
Performance Record *- Growth Option
*Returns < 1Year : Absolute, > = 1Year : CAGR. Benchmark is Crisil Composite Bond FundIndex. For computation of returns the allotment NAV has been taken as Rs. 10.00.Past performance may or may not be sustained in future.
Style Box
Notes to Numbers and Data in the Fact Sheet
1. Yield to maturity, modified duration and average maturity are the weightedaverage of these numbers, computed for each security in the portfolio, andweighted by the market value of each security to the total market value of theportfolio.
2. Average maturity for PTCs and papers with partial redemptions, are weightedaverages of tenor and quantity of cash flows until maturity.
3. Price/Earning Ratio, Price/Book Value Ratio, and Dividend Yield are based on thehistorical earning numbers, and accounting numbers, and have been sourcedfrom Bloombergâ. They have been computed only for the invested portion ofthe portfolio.
4. Average days to reset for the Floating rate plan, is the weighted average of thenext interest reset date of the floating rate bonds, weighted by their marketvalues.
5. Bank deposits are internally credit rated and posses an internal rating equivalentto AAA. They have been disclosed separately in the credit profile section only inthe interest of clarity, so that investors do not presume they are independentlycredit rated.
6. Other current assets are not included for the purposes of computing portfolioaggregate numbers such as YTM, Modified Duration and average (except in thecase of Liquid Plan).
7. Where the individual holding in a security/issuer is less than 1% of the NAV,such holdings have been aggregated, wherever appropriate, in the interestof clarity.
8. Dividends declared in a scheme have been separately disclosed.
9. All portfolios are common portfolios held under a given scheme, and all returnnumbers unless otherwise stated, represent the Growth Option.
10. For computing the % of listed securities, instruments which cannot be listedunder the existing rules and regulations such as CPs, CDs, CBLOs, Bank FDs, TBills, and PTCs are excluded from the unlisted category.
11. The standard deviation is used to measure the volatility of returns.
12. Sharpe Ratio is the measure of the risk-adjusted performance. It is calculated bysubtracting the risk-free rate from the average rate of return for a portfolio anddividing the result by the standard deviation of the portfolio returns.
13. Beta is the measure of the portfolio’s volatility to its respective benchmark.
14. R-squared is a measurement of how closely a portfolio’s performance correlateswith the performance of benchmark index. A higher R-squared value indicates amore useful beta.
15 The Std. Dev., Sharpe Ratio, Portfolio Beta & R-squared are based on monthlyreturns calculated using last 3 years data.
59.52%
40.40%
0.08%
0.00% 20.00% 40.00% 60.00% 80.00%
<182 days
Other Current Assets
1-3 years
3.85%
7.66%8.50%
9.37% 9.35%
0.80%
3.68%2.83%
5.40%
0.00%1.00%2.00%3.00%4.00%5.00%6.00%7.00%8.00%9.00%
10.00%
Last 6Months
Last 1years
Last 3years
Last 5years
SinceInception
Long Term Plan Crisil Composite Bond Fund Index
Rs 15742.62
Rs 12982.40
9,85710,85711,85712,85713,85714,85715,85716,857
Apr-
02Ju
l-02
Oct
-02
Jan-
03Ap
r-03
Jul-0
3O
ct-0
3Ja
n-04
Apr-
04Ju
l-04
Oct
-04
Jan-
05Ap
r-05
Jul-0
5O
ct-0
5Ja
n-06
Apr-
06Ju
l-06
Oct
-06
Jan-
07Ap
r-07
Long Term Plan Crisil Composite Bond Fund Index
AA and Equivalent
4.03%
Call,Current Assets and
Reverse Repos43.57%
AAA and Equivalent52.40%

35
Maturity Profile Quantitative Indicators
Average Maturity : 8.48Years
Modified Duration : 4.26Years
Yield to Maturity : 9.12%
% Unlisted Bonds : 6.50%
Performance Record* - Growth Option
Rs. 10000 invested at inception*: Income Plan Vs Crisil Composite Bond Fund Index
Rating Profile
PSU/PFI Bonds 7,457.43 33.30%• Power Finance Corporation Ltd AAA 3,142.28 14.03%• Infrastructure Development Finance Corporation AAA 1,908.20 8.52%
Export Import Bank of India Ltd AAA 1,898.39 8.48%Indian Oil Corporation Ltd AAA 465.29 2.08%State Bank of India Ltd AAA 43.27 0.19%Private Corporate Securities 3,988.67 17.81%
• Tata Sons Ltd AAA 1,991.28 8.89%• UTI Bank Ltd AAA 1,970.57 8.80%
HDFC Bank Ltd AAA 18.02 0.08%HDFC Ltd AAA 8.80 0.04%Government Securities 5,395.50 24.09%
• 8.33% GOI 2036 Sovereign 3,950.80 17.64%7.49% GOI 2017 Sovereign 1,438.05 6.42%8.13% GOI 2021 Sovereign 6.65 0.03%CPs, CDs and Term Deposits 5,300.11 23.67%State Bank of Bikaner & Jaipur Ltd P1+ 2,407.37 10.75%State Bank of Patiala Ltd P1+ 2,406.86 10.75%IDBI Bank Ltd P1+ 485.88 2.17%Cash, Call, CBLO & Reverse Repo 5.30 0.02%Other Current Assets 246.63 1.11%
Total Net Assets 22,393.64 100.00%• Top Five Holdings
Snapshot:Fund Manager : Pankaj KajiIndicative Investment Horizon: 1 year & aboveInception date: 09-07-1998Fund Size: Rs. 223.94 croresNAV (As on 31-May-2007):
Retail Growth option : Rs. 21.5492Institutional Growth option : Rs. 22.1418
**Expense Ratio (6 Months avg. Dec 06-May 07):Income Plan: 2.08%Income Inst. Plan: 1.50%
**This is a close approximation of the number.
WHY SHOULD ONE INVEST?Medium term investment for steady returns with market volatility
*Returns < 1 : Absolute, > = 1Year : CAGR. Benchmark - Crisil CompositeBond Fund Index. Start date - 31.03.2002. For computation of returns theallotment NAV has been taken as Rs. 10.00. Past performance may or maynot be sustained in future.
ICICI Prudential Income Plan
*Benchmark start date : 31-03-2002.CAGR – Income Plan: 5.60%; Benchmark : 5.29%Past performance may or may not be sustained in future.
PortfolioCompany/Issuer Rating Mkt Value (Rs. Lakh) % to NAV
Figures as on 31-May-2007
Style Box
33.11%
21.52%
17.67%
15.41%
1.10%
2.17%
9.01%
-10.00% 10.00% 30.00% 50.00%
3-5 years
<182 days
> 10 years
5-10 years
1-3 years
182 days - 1 year
Other Current Assets
-0.45%
4.81%
3.14%
5.86%
9.01%
0.80%
3.68%2.83%
5.40%
-2.00%
0.00%
2.00%
4.00%
6.00%
8.00%
10.00%
Last 6Months
Last 1years
Last 3years
Last 5years
SinceInception
Income Plan Crisil Composite Bond Fund Index
Rs 13252.89
Rs 13049.27
9,79010,29010,79011,29011,79012,29012,79013,29013,790
Apr-0
2Ju
l-02
Oct
-02
Jan-
03Ap
r-03
Jul-0
3O
ct-0
3Ja
n-04
Apr-0
4Ju
l-04
Oct
-04
Jan-
05Ap
r-05
Jul-0
5O
ct-0
5Ja
n-06
Apr-0
6Ju
l-06
Oct
-06
Jan-
07Ap
r-07
Income Plan Crisil Composite Bond Fund Index
AAA andEquivalent74.78%
Sovereign Securities24.09%
Call,Current Assets and
Reverse Repos1.13%

36
Rating Profile
Maturity Profile:
Quantitative Indicators:
Average Maturity : 65.37 DaysModified Duration : 60.21 DaysYield To Maturity : 6.57%% Floating Rate Assets : 21.83%Average days to reset : 57.99 DaysAverage maturity of fixed rate component : 57.60 DaysWeighted average maturity : 57.68 Days% Unlisted Bonds : 5.76%
Performance Record *- Growth Option – Institutional Plus Plan
Rs. 10000 invested at inception*: Liquid Plan Inst. Plus Vs Crisil LiquidFund Index
PSU/PFI Bonds 16,438.77 0.85%Industrial Development Bank of India AA+ 13,453.17 0.69%Power Finance Corporation Ltd AAA 2,485.60 0.13%CanBank Factors Ltd P1+ 500.00 0.03%Private Corporate Securities 235,971.31 12.32%
• PTC UBL Trust DSP Merrill Lynch Capital Ltd A1+(SO) 19,998.48 1.02%• CitiFinancial Consumer Finance India Ltd AAA 15,343.44 0.78%• Tata Motors Ltd P1+ 15,000.00 0.76%• Global Trade Finance Ltd AAA 15,000.00 0.76%
TGS Investment & Trade Pvt. Ltd. A1+ 14,000.00 0.71%Cholamandalam Investment & Finance Co. Ltd P1+ 13,000.00 0.66%DSP Merill Lynch Capital Ltd P1+ 12,940.00 0.66%TML Financial Services Ltd AAA 10,725.63 0.55%GE Capital Services India Ltd AAA 10,303.45 0.53%Oscar Investments Ltd Unrated 9,300.00 0.47%Rabo India Finance Ltd AAA 8,000.00 0.41%PTC IPGE Loan Trust GE Capital Services India LtdF1+SO 7,333.44 0.37%Nirma Ltd P1+ 7,000.00 0.36%Ranbaxy Holding Company Ltd Unrated 6,700.00 0.34%PTC DAS Trust Standard Chartered Bank A1+(SO) 5,069.42 0.26%PTC Shriram Transport F1+ 5,017.03 0.26%Chambal Fertilisers & Chemicals Ltd P1+ 5,000.00 0.25%Mahindra & Mahindra Financial Services Ltd P1+ 5,000.00 0.25%Reliance Capital Finance Ltd A1+ 5,000.00 0.25%Raymond Ltd P1+ 4,700.00 0.24%Birla Global Finance Ltd A1+ 4,500.00 0.23%First India Credit Corporation Ltd A1+ 3,800.00 0.19%Reliance Industries Ltd AAA 3,540.98 0.18%HDFC Ltd AAA 3,256.22 0.17%PTC GE Capital Services India Ltd A1+(SO) 2,902.16 0.15%Kotak Mahindra Bank Ltd P1+ 2,504.20 0.13%Hero Honda Finlease Ltd P1+ 2,500.00 0.13%JM Financial & Investment ConsultancyServices Pvt. Ltd P1+ 2,500.00 0.13%Gujarat Glass Ltd Unrated 2,500.00 0.13%SBI Factors & Commercial Services Pvt Ltd A1+ 2,000.00 0.10%GE Money Financial Services Ltd P1+ 2,000.00 0.10%Blue Star Ltd P1+ 2,000.00 0.10%PTC ICL Trust Birla Home Finance P1+SO 1,999.13 0.10%Hindalco Industries Ltd AAA 1,973.40 0.10%Grasim Industries Ltd AAA 1,873.74 0.10%PTC Credit Asset Trust Series HSBC F1+SO 1,513.42 0.08%PTC UBL Trust IndusInd Bank AAA(SO) 1,198.60 0.06%PTC Kotak Mahindra Bank Ltd. AAA(SO) 1,113.55 0.06%LIC Housing Finance Ltd AAA 995.86 0.05%PTC BHPC Tata Motors AAA(SO) 832.63 0.04%PTC Hero Motors Ltd A1+(SO) 550.00 0.03%PTC IL & FS Investmart Ltd AAA(SO) 509.64 0.03%PTC TVS Finance AAA(SO) 321.41 0.02%PTC IBL Trust IndusInd Bank AAA(SO) 215.93 0.01%PTC Citi Fleet Trust Citibank AAA(SO) 199.97 0.01%Treasury Bills 29,646.78 1.51%
• 364 Day T Bill (MD 28/03/2008) Sovereign 17,392.04 0.89%364 Day T Bill (MD 14/07/2007) Sovereign 7,346.98 0.37%182 Day T Bill (MD 07/09/2007) Sovereign 4,907.76 0.25%CPs, CDs and Term Deposits 961,393.93 49.01%ICICI Bank Ltd P1+ 164,259.00 8.37%Punjab National Bank Ltd P1+ / A1+ 109,935.05 5.61%ING Vysya Bank Ltd P1+ 65,684.89 3.35%ABN Amro Bank Ltd AAA 59,950.41 3.06%HDFC Bank Ltd P1+ 45,351.51 2.31%UTI Bank Ltd P1+ 40,200.00 2.05%Citibank P1+ 40,000.00 2.04%Allahabad Bank Ltd A1+ / P1+ 32,021.40 1.63%Kotak Mahindra Bank Ltd AAA 30,997.80 1.58%UCO Bank P1+ 28,774.74 1.47%State Bank of Patiala Ltd P1+ 28,330.25 1.45%State Bank of Saurashtra Ltd A1+ 28,339.86 1.44%Union Bank of India Ltd P1+ 28,170.89 1.44%Yes Bank F1+ 28,338.73 1.44%Corporation Bank Ltd P1+ 26,700.00 1.36%GE Money Financial Services Ltd AAA 17,333.00 0.88%IDBI Bank Ltd P1+ 15,592.15 0.79%Indian Bank Ltd AAA 14,671.93 0.75%Jammu & Kashmir Bank Ltd A1+ 14,574.51 0.74%Essel Propack Ltd A1+ 14,073.33 0.72%State Bank of Bikaner & Jaipur Ltd P1+ 13,729.10 0.70%Infrastructure Development Finance Corporation AAA 12,530.46 0.64%Standard Chartered Bank - Bills Rediscounted Unrated 11,470.30 0.58%State Bank of Hyderabad Ltd P1+ 10,518.99 0.54%Industrial Development Bank of India P1+ 9,737.66 0.50%HDFC Ltd AAA 9,245.62 0.47%UTI Securities Ltd P1+ 9,131.27 0.47%Standard Chartered Investment & Loan (India) LtdP1+ 8,787.54 0.45%Bank of America - Bills Rediscounted Unrated 7,461.75 0.38%Deutsche Bank - Bills Rediscounted Unrated 4,985.00 0.25%HSBC Ltd F1+ 4,904.02 0.25%State Bank of Indore Ltd P1+ 4,712.23 0.24%Canara Bank Ltd P1+ 4,188.55 0.21%Standard Chartered Bank Ltd P1+ 3,972.64 0.20%Bajaj Auto Ltd P1+ 2,378.45 0.12%Citicorp Finance (India) Ltd P1+ 2,369.19 0.12%GE Capital Transportation Financial Services Ltd P1+ 2,299.66 0.12%Redington India Ltd P1+ 1,955.83 0.10%State Bank of Travancore Ltd P1+ 1,477.54 0.08%State Bank of Mysore Ltd P1+ 1,453.46 0.07%Export Import Bank of India Ltd P1+ 296.13 0.02%State Bank of India Ltd P1+ 489.09 0.02%Cash, Call, CBLO & Reverse Repo 335,411.25 17.09%Other Current Assets 377,428.44 19.22%Total Net Assets 1,962,050.90 100.00%
• Top Five Holdings
Snapshot:Fund Manager : Chaitanya PandeIndicative Investment Horizon: Upto 1monthInception date:
Growth Option: 24-06-1998Institutional Option: 03-04-2003Institutional Plus Option: 28-09-2003Super Institutional Option: 17-11-2005
Fund Size: Rs. 19,620.51 croresNAV (As on 31-May-2007):
Growth option : Rs. 18.6359Institutional Growth option : Rs. 18.8488Institutional Plus Growth option : Rs. 18.9113Super Institutional Growth option : Rs. 11.1572Institutional option-I-Growth option: Rs. 10.9231
**Expense Ratio (6 Months avg. Dec 06-May 07):Growth option : 1.00% Inst. option : 0.71%Inst. Plus option : 0.66% Super Inst. option : 0.47%Inst. - I option : 0.47%
** This is a close approximation of the number.
WHY SHOULD ONE INVEST?Temporary parking of funds with high liquidity
Style Box
ICICI Prudential Liquid Plan
*Benchmark start date : 31-03-2002CAGR – Liquid Plan : 5.99%; Benchmark : 5.29%Past performance may or may not be sustained in future.
PortfolioCompany/Issuer Rating Mkt Value (Rs. Lakh) % to NAV
*Returns >= 1 Year are CAGR, < 1 Year are Simple Annualised. Benchmark is CrisilLiquid Fund Index. For computation of returns the allotment NAV has been takenas Rs. 10.00. Past performance may or may not be sustained in future.
Figures as on 31-May-2007
82.11%
17.89%
0.00% 20.00% 40.00% 60.00% 80.00% 100.00%
<182 days
>182 days
8.57% 8.77% 8.55% 7.81%5.99%
11.60%10.47%
8.49%7.18%
5.29%
0.00%2.00%4.00%6.00%8.00%
10.00%12.00%14.00%
Last 15days
Last 30days
Last 6Months
Last 1years
SinceInception
Institutional Plus Plan Crisil Liquid Fund Index
Rs 12380.31
Rs 12085.19
9,950
10,450
10,950
11,450
11,950
12,450
12,950
Sep-
03N
ov-0
3Ja
n-04
Mar
-04
May
-04
Jul-0
4Se
p-04
Nov
-04
Jan-
05M
ar-0
5M
ay-0
5Ju
l-05
Sep-
05N
ov-0
5Ja
n-06
Mar
-06
May
-06
Jul-0
6Se
p-06
Nov
-06
Jan-
07M
ar-0
7M
ay-0
7
Institutional Plus Plan Crisil Liquid Fund Index
Unrated2.16%
AAA and Equivalent59.31%
Call,Current Assets and
Reverse Repos36.33%
AA and Equivalent
0.69%
Sovereign Securities1.51%

37
Average Maturity : 93.81 DaysModified Duration : 87.50 DaysYield To Maturity : 8.33%% Floating Rate Assets : 14.06%Average days to reset : 52.76 DaysAverage maturity of fixed rate component : 49.60 DaysWeighted average maturity : 50.04 Days% Unlisted Bonds : 6.63%
Quantitative Indicators:Maturity Profile
Performance Record *- Cumulative Option – Plan B
Rs. 10000 invested at inception: Floating Rate Plan B Vs Crisil Liquid Fund Index
Rating Profile
Snapshot:Fund Manager : Chaitanya PandeIndicative Investment Horizon: 1 - 3 monthsInception date: 28-03-2003Fund Size: Rs. 1,130.55 croresNAV (As on 31-May-2007):
Plan A - Cumulative: Rs. 11.8148Plan B - Cumulative: Rs. 12.6861Plan C - Cumulative: Rs. 11.9319Plan D - Cumulative: Rs. 11.1696
**Expense Ratio (6 Months avg. Dec 06-May 07):Plan A - 1.08%, Plan B - 0.83%, Plan C - 0.72%, Plan D - 0.60%
**This is a close approximation of the number.
WHY SHOULD ONE INVEST?Short term deployment of funds
*Returns >= 1 Year are CAGR, < 1 Year are Simple Annualised. Benchmark is CrisilLiquid Fund Index. For computation of returns the allotment NAV has been takenas Rs.10.00. Past performance may or may not be sustained in future.
ICICI Prudential Floating Rate Plan
CAGR – Floating Rate Plan - Plan B : 5.86%; Benchmark : 5.22%Past performance may or may not be sustained in future.
PSU/PFI Bonds 3,000.00 2.65%
• Industrial Development Bank of India AA+ 3,000.00 2.65%
Private Corporate Securities 25,364.18 22.44%
• Global Trade Finance Ltd P1+ 10,000.00 8.85%
• Oscar Investments Ltd Unrated 5,000.00 4.42%
• GE Capital Services India Ltd P1+ 3,500.00 3.10%
• Citicorp Finance (India) Ltd AAA 2,500.00 2.21%
Hindalco Industries Ltd AAA 1,983.22 1.75%
PTC Citi Fleet Trust Citibank AAA(SO) 1,430.96 1.27%
TGS Investment & Trade Pvt. Ltd. A1+ 500.00 0.44%
PTC Hero Motors Ltd A1+(SO) 450.00 0.40%
CPs, CDs and Term Deposits 62,932.63 55.66%
Punjab National Bank Ltd P1+ 15,000.00 13.27%
UTI Bank Ltd P1+ 10,010.00 8.85%
UCO Bank P1+ 9,451.44 8.36%
ING Vysya Bank Ltd P1+ 9,000.00 7.96%
State Bank of Hyderabad Ltd P1+ 8,850.00 7.83%
ABN Amro Bank Ltd A1+ 4,739.39 4.19%
Kotak Mahindra Bank Ltd P1+ 4,154.88 3.68%
Allahabad Bank Ltd P1+ 1,416.92 1.25%
Canara Bank Ltd P1+ 310.00 0.27%
Cash, Call, CBLO & Reverse Repo 9.30 0.01%
Other Current Assets 21,748.75 19.24%
Total Net Assets 113,054.86 100.00%
• Top Five Holdings
PortfolioCompany/Issuer Rating Mkt Value (Rs. Lakh) % to NAVStyle Box
Figures as on 31-May-2007
72.83%
27.17%
0.00% 20.00% 40.00% 60.00% 80.00%
<182 days
>182 days
8.55% 8.76% 8.61% 7.75%5.86%
11.60%10.47%
8.49%7.18%
5.22%
0.00%2.00%4.00%6.00%8.00%
10.00%12.00%14.00%
Last 15days
Last 30days
Last 6Months
Last 1years
SinceInception
Floating Rate Plan Crisil Liquid Fund Index
Rs 12686.10
Rs 12369.15
9,950
10,450
10,950
11,450
11,950
12,450
12,950
Mar
-03
May
-03
Jul-0
3Se
p-03
Nov-
03Ja
n-04
Mar
-04
May
-04
Jul-0
4Se
p-04
Nov-
04Ja
n-05
Mar
-05
May
-05
Jul-0
5Se
p-05
Nov-
05Ja
n-06
Mar
-06
May
-06
Jul-0
6Se
p-06
Nov-
06Ja
n-07
Mar
-07
May
-07
Floating Rate Plan Crisil Liquid Fund Index
Unrated4.42%
AA and Equivalent
2.65%
Call,Current Assets and
Reverse Repos19.24%
AAA and Equivalent73.69%

38
Rating Profile
Maturity Profile:
Quantitative Indicators:
Average Maturity : 11.75 DaysModified Duration : 10.84 DaysYield To Maturity : 5.66%% Floating Rate Assets : 25.17%Average days to reset : 11.47 DaysAverage maturity of fixed rate component : 11.43 DaysWeighted average maturity : 11.44 Days% Unlisted Bonds : 6.33%
Performance* Record - Cash Option - Growth
Private Corporate Securities 5,993.22 7.60%
• GE Capital Services India Ltd P1+ 2,500.00 3.17%
• Mahindra & Mahindra Financial Services Ltd AA+ 2,492.48 3.16%
• PTC GE Capital Services India Ltd A1+(SO) 1,000.74 1.27%
CPs, CDs and Term Deposits 34,610.00 43.88%
State Bank of Hyderabad Ltd P1+ 10,200.00 12.93%
Punjab National Bank Ltd P1+ 5,000.00 6.34%
ING Vysya Bank Ltd P1+ 5,000.00 6.34%
ICICI Bank Ltd P1+ 5,000.00 6.34%
Corporation Bank Ltd P1+ 5,000.00 6.34%
UCO Bank P1+ 1,940.81 2.46%
Industrial Development Bank of India P1+ 948.76 1.20%
Allahabad Bank Ltd P1+ 944.61 1.20%
ABN Amro Bank Ltd A1+ 460.13 0.58%
IDBI Bank Ltd P1+ 115.69 0.15%
Cash, Call, CBLO & Reverse Repo 16,357.05 20.74%
Other Current Assets 21,920.45 27.78%
Total Net Assets 78,880.72 100.00%• Top Five Holdings
Snapshot:Fund Manager : Chaitanya PandeIndicative Investment Horizon: One day to one weekInception date:
Growth Option: 06-03-2002Growth Cash Option: 09-03-2006
Fund Size: Rs. 788.81 croresNAV (As on 31-May-2007):
Growth option : Rs. 12.9327Cash Option Growth: Rs. 10.9606
**Expense Ratio (6 Months avg. Dec 06-May 07):Growth option: 1.00%Cash Option Growth: 0.53%
** This is a close approximation of the number.
WHY SHOULD ONE INVEST?Temporary parking of funds with high liquidity
Style Box
ICICI Prudential Sweep PlanPortfolio
Company/Issuer Rating Mkt Value (Rs. Lakh) % to NAV
*Returns >= 1 Year are CAGR, < 1 Year are Simple Annualised. Benchmark is CrisilLiquid Fund Index. For computation of returns the allotment NAV has been takenas Rs. 10.00. Past performance may or may not be sustained in future.
Figures as on 31-May-2007
96.87%
3.13%
0.00% 40.00% 80.00% 120.00%
<182 days
182 days - 1 year
8.80%9.29% 8.82% 7.97% 7.76%
11.60%10.47%
8.49%7.18% 7.21%
0.00%2.00%4.00%6.00%8.00%
10.00%12.00%14.00%
Last 15days
Last 30days
Last 6Months
Last 1years
SinceInception
Sweep Crisil Liquid Fund Index
AAA and Equivalent48.32%
Call,Current Assets and
Reverse Repos48.53%
AA and Equivalent
3.16%

39
Maturity Profile Quantitative Indicators:
Average Maturity : 0.52 Year
Modified Duration : 0.47 Year
Yield To Maturity : 11.22%
% Floating Rate Assets : 38.05%
Average days to reset : 0.16 Year
Average maturity of fixed rate component : 0.15 Year
Weighted average maturity : 0.16 Year
% Unlisted : 13.22%
Rs. 10000 invested at inception*: STP Vs Crisil Short Term Bond Fund Index
Rating Profile
PSU/PFI Bonds 116.46 0.48%
Nabard AAA 109.76 0.45%
Power Finance Corporation Ltd AAA 6.70 0.03%
Private Corporate Securities 9,724.18 40.15%
• PTC DAS Trust Standard Chartered Bank A1+(SO) 3,359.48 13.87%
• Ranbaxy Holding Company Ltd Unrated 2,500.00 10.32%
• PTC ICL Trust Birla Home Finance P1+SO 999.56 4.13%
• Cholamandalam Investment & Finance Co. Ltd AA 699.99 2.89%
• PTC Citi Fleet Trust Citibank AAA(SO) 504.38 2.08%
Grasim Industries Ltd AAA 489.66 2.02%
PTC Shriram Transport F1+ 403.96 1.67%
PTC UBL Trust IndusInd Bank AAA(SO) 387.64 1.60%
HDFC Ltd AAA 195.92 0.81%
PTC IBL Trust IndusInd Bank AAA(SO) 183.59 0.76%
CPs, CDs and Term Deposits 7,890.00 32.59%
UTI Bank Ltd P1+ 3,000.00 12.39%
Canara Bank Ltd P1+ 2,690.00 11.11%
ICICI Bank Ltd P1+ 2,200.00 9.09%
Cash, Call, CBLO & Reverse Repo 618.90 2.56%
Other Current Assets 5,864.36 24.22%
Total Net Assets 24,213.90 100.00%
• Top Five Holdings
WHY SHOULD ONE INVEST?Short term deployment of funds with low volatilityICICI Prudential Short Term Plan
*Benchmark start date : 31-03-2002CAGR – Short Term Plan: 6.60%; Benchmark : 5.42%Past performance may or may not be sustained in future.
PortfolioCompany/Issuer Rating Mkt Value (Rs. Lakh) % to NAVStyle Box
Performance Record* - Cumulative Option
*Returns >= 1 Year are CAGR, < 1 Year are Absolute. Benchmark is Crisil ShortTerm Bond Fund Index. Start date: 31-03-2002. For computation of returns theallotment NAV has been taken as Rs. 10.00. Past performance may or maynot be sustained in future.
Figures as on 31-May-2007
Snapshot:Fund Manager : Chaitanya PandeIndicative Investment Horizon: 3 - 6 monthsInception Cumulative Option: 25-10-2001date Institutional Option : 03-04-2003Fund Size: Rs. 242.14 croresNAV (As on 31-May-2007):
Cumulative Option : Rs. 14.4696Institutional Option : Rs. 14.6214
**Expense Ratio (6 Months avg. Dec 06-May 07):Short Term Plan : 1.10%Inst. Plan : 0.80%
** This is a close approximation of the number.
}
43.41%
24.22%
18.46%
13.91%
0.00% 20.00% 40.00% 60.00%
<182 days
Other Current Assets
1-3 years
182 days - 1 year
3.90%
7.55%6.37% 6.56% 6.82%
2.92%
6.10%
4.67%5.36%
0.00%1.00%2.00%3.00%4.00%5.00%6.00%7.00%8.00%
Last 6Months
Last 1years
Last 3years
Last 5years
SinceInception
Short Term Plan Crisil Short Term Bond Fund Index
Rs 13915.08
Rs 13134.96
9,95010,45010,95011,45011,95012,45012,95013,45013,95014,450
Apr-0
2Ju
l-02
Oct-0
2Ja
n-03
Apr-0
3Ju
l-03
Oct-0
3Ja
n-04
Apr-0
4Ju
l-04
Oct-0
4Ja
n-05
Apr-0
5Ju
l-05
Oct-0
5Ja
n-06
Apr-0
6Ju
l-06
Oct-0
6Ja
n-07
Apr-0
7
Short Term Plan Crisil Short Term Bond Fund Index
Unrated10.32%
AA and Equivalent
2.89%
Call,Current Assets and
Reverse Repos26.78%
AAA and Equivalent60.01%

40
Rs. 10000 invested at inception: Long Term Floating Rate Plan-B Vs Crisil Liquid Fund Index
CAGR – Long Term Floating Rate Plan: 6.38%; Benchmark : 5.78%Past performance may or may not be sustained in future.
Rating Profile
Maturity Profile
Performance Record *- Cumulative Option
Snapshot:Fund Manager : Chaitanya PandeIndicative Investment Horizon: 6-12 monthsInception date: 15-Sep-04Fund Size: Rs. 82.94 croresNAV (As on 31-May-2007):
Plan A - Cumulative: Rs. 11.6892Plan B - Cumulative: Rs. 11.8222
**Expense Ratio (6 Months avg. Dec 06-May 07):Plan A - 1.25%Plan B - 0.85%
**This is a close approximation of the number.
*Returns >= 1 Year are CAGR, < 1 Year are Absolute. Benchmark is CrisilLiquid Fund Index. For computation of returns the allotment NAV has beentaken as Rs. 10.00. Past performance may or may not be sustained in future.
ICICI Prudential Long Term Floating Rate Plan
Average Maturity : 0.51 YearModified Duration : 0.47 YearYield To Maturity : 10.17%% Floating Rate Assets : 28.34%Average days to reset : 0.30 YearAverage maturity of fixed rate component : 0.30 YearWeighted average maturity : 0.30 Year% Unlisted Bonds : 9.65%
Quantitative Indicators:
PSU/PFI Bonds 548.10 6.61%
• Industrial Development Bank of India AA+ 547.14 6.60%
• Power Finance Corporation Ltd AAA 0.96 0.01%
Private Corporate Securities 2,197.53 32.47%
• PTC Shriram Transport F1+ 1,009.89 12.18%
• Ranbaxy Holding Company Ltd Unrated 800.00 9.65%
• ICICI Bank Ltd AAA 495.15 5.97%
PTC UBL Trust IndusInd Bank AAA(SO) 387.64 4.67%
CPs, CDs and Term Deposits 4,493.99 54.18%
ICICI Bank Ltd P1+ 2,000.00 24.11%
Allahabad Bank Ltd P1+ 1,019.61 12.29%
Canara Bank Ltd P1+ 1,000.00 12.06%
Industrial Development Bank of India P1+ 474.38 5.72%
Cash, Call, CBLO & Reverse Repo 487.60 5.88%
Other Current Assets 72.03 0.86%
Total Net Assets 8,294.40 100.00%
• Top Five Holdings
PortfolioCompany/Issuer Rating Mkt Value (Rs. Lakh) % to NAVStyle Box
WHY SHOULD ONE INVEST?Generate market rate of returns with low volatility
Figures as on 31-May-2007
47.63%
32.72%
18.78%
0.87%
0.00% 20.00% 40.00% 60.00%
<182 days
182 days - 1 year
1-3 years
Other CurrentAssets
4.01%
7.55%6.38%
4.23%
7.18%
5.78%
0.00%1.00%2.00%3.00%4.00%5.00%6.00%7.00%8.00%
Last 6 Months Last 1 years Since Inception
Long Term Floating Rate Plan Crisil Liquid Fund Index
Rs 11822.20
Rs 11641.97
9,95010,15010,35010,55010,75010,95011,15011,35011,55011,75011,950
Sep-
04
Nov
-04
Jan-
05
Mar
-05
May
-05
Jul-0
5
Sep-
05
Nov
-05
Jan-
06
Mar
-06
May
-06
Jul-0
6
Sep-
06
Nov
-06
Jan-
07
Mar
-07
May
-07
Long Term Floating Rate Plan Crisil Liquid Fund Index
Unrated9.65%
AA and Equivalent
6.60%
Call,Current Assets and
Reverse Repos6.75%
AAA and Equivalent77.00%

41
ICICI Prudential Income Plan - Quarterly Dividend Option
Record Date Face Value (Rs) NAV (Rs) Dividend (Rs.)/Unit
30-Dec-05 10.00 10.9769 0.040031-Mar-06 10.00 10.8980 0.100030-Jun-06 10.00 10.8817 0.100029-Sep-06 10.00 11.1210 0.150029-Dec-06 10.00 11.1905 0.150030-Mar-07 10.00 10.9618 0.0500
ICICI Prudential Short Term Plan - Monthly Dividend Option (Dec. 2006 onwards)
Record Date Face Value (Rs) NAV (Rs) Dividend (Rs.)/Unit28-Dec-06 10.00 10.8187 0.060031-Jan-07 10.00 10.8344 0.060028-Feb-07 10.00 10.8037 0.060030-Mar-07 10.00 10.8263 0.080027-Apr-07 10.00 10.8298 0.080031-May-07 10.00 10.8500 0.0900Dividend is gross dividend. To arrive at the net dividend payable for corporate and non-corporate investors dividend distribution tax @ 22.44% and 14.025% needs to beadjusted respectively.Past performance may or may not be sustained in future. Afterpayment of dividend the NAV will fall to the extent of payout and distribution taxes ifapplicable.
ICICI Prudential Short Term Plan - Fortnightly Dividend Option (Dec. 2006 onwards)
Record Date Face Value (Rs) NAV (Rs) Dividend (Rs.)/Unit15-Dec-06 10.0000 10.8025 0.030029-Dec-06 10.0000 10.7968 0.030016-Jan-07 10.0000 10.8061 0.030031-Jan-07 10.0000 10.8115 0.030015-Feb-07 10.0000 10.8005 0.030028-Feb-07 10.0000 10.7808 0.030015-Mar-07 10.0000 10.7954 0.030030-Mar-07 10.0000 10.8034 0.037516-Apr-07 10.0000 10.8154 0.037527-Apr-07 10.0000 10.8120 0.037515-May-07 10.0000 10.8306 0.050031-May-07 10.0000 10.8247 0.0400
ICICI Prudential Liquid Plan - Weekly Dividend Option (Dec. 2006 onwards)Record Date Face Value (Rs) NAV (Rs) Dividend (Rs.)/Unit04-Dec-06 10.00 11.8455 0.014911-Dec-06 10.00 11.8456 0.015018-Dec-06 10.00 11.8460 0.015426-Dec-06 10.00 11.8490 0.018402-Jan-07 10.00 11.8482 0.017608-Jan-07 10.00 11.8445 0.013915-Jan-07 10.00 11.8468 0.016222-Jan-07 10.00 11.8469 0.016329-Jan-07 10.00 11.8469 0.016305-Feb-07 10.00 11.8472 0.016612-Feb-07 10.00 11.8470 0.016419-Feb-07 10.00 11.8474 0.016826-Feb-07 10.00 11.8474 0.016805-Mar-07 10.00 11.8473 0.016712-Mar-07 10.00 11.8478 0.017220-Mar-07 10.00 11.8525 0.021926-Mar-07 10.00 11.8495 0.01893-Apr-07 10.00 11.8599 0.02939-Apr-07 10.00 11.8499 0.019316-Apr-07 10.00 11.8507 0.020123-Apr-07 10.00 11.8521 0.02151-May-07 10.00 11.8517 0.02427-May-07 10.00 11.8480 0.017414-May-07 10.00 11.8489 0.018321-May-07 10.00 11.8497 0.019128-May-07 10.00 11.8497 0.0191Dividend is gross dividend. To arrive at the net dividend payable for corporate andnon-corporate investors dividend distribution tax @ 22.44% and 14.025% needs to beadjusted respectively. Past performance may or may not be sustained in future. Afterpayment of dividend the NAV will fall to the extent of payout and distribution taxes if applicable.
WHY SHOULD ONE INVEST?Customised investment solutions to match risk return profile.ICICI Prudential Advisor Series
Figures as on 31-May-2007
Fund Manager : Pankaj Kaji
Performance Records *
Scheme Name Date Period NAV NAV Returns(Rs) as of Fund Benchmark
31-May-07 Index
Very Cautious 30-Nov-06 Last 6 Months 11.6496 12.1334 4.15% 3.84%Very Cautious 31-May-06 Last 1 years 11.2798 12.1334 7.57% 6.85%Very Cautious 31-May-04 Last 3 years 10.2101 12.1334 5.92% 5.30%Very Cautious 18-Dec-03 Since Inception 10.0000 12.1334 5.76% 5.13%Cautious 30-Nov-06 Last 6 Months 13.3088 14.1995 6.69% 3.93%Cautious 31-May-06 Last 1 years 12.4326 14.1995 14.21% 15.01%Cautious 31-May-04 Last 3 years 10.1267 14.1995 11.93% 12.55%Cautious 18-Dec-03 Since Inception 10.0000 14.1995 10.69% 10.10%Moderate 30-Nov-06 Last 6 Months 17.0214 18.5398 8.92% 6.43%Moderate 31-May-06 Last 1 years 15.1221 18.5398 22.60% 26.59%Moderate 31-May-04 Last 3 years 9.5866 18.5398 24.59% 24.49%Moderate 18-Dec-03 Since Inception 10.0000 18.5398 19.58% 18.41%Aggressive 30-Nov-06 Last 6 Months 20.6214 22.7311 10.23% 7.74%Aggressive 31-May-06 Last 1 years 17.6270 22.7311 28.96% 34.56%Aggressive 31-May-04 Last 3 years 9.0195 22.7311 36.09% 34.56%Aggressive 18-Dec-03 Since Inception 10.0000 22.7311 26.85% 24.82%Very Aggressive 30-Nov-06 Last 6 Months 24.6827 27.3432 10.78% 8.48%Very Aggressive 31-May-06 Last 1 years 20.5654 27.3432 32.96% 38.49%Very Aggressive 31-May-04 Last 3 years 8.7850 27.3432 46.01% 40.32%Very Aggressive 18-Dec-03 Since Inception 10.0000 27.3432 33.83% 28.33%Very Cautious:- Crisil Liquid fund Index - 70%, Crisil Short Term Bond Fund-30%Cautious:- Nifty-15%, Crisil Composite Bond Fund Index - 70%, Crisil Liquid
Fund Index-15%Moderate:- Nifty-40%, Crisil Composite Bond Fund Index - 40%, Crisil Liquid
Fund Index-20%Aggressive:- Nifty-70%, Crisil Composite Bond Fund Index - 25%, Crisil Liquid
Fund Index-5%Very Aggressive:- Nifty-90%, Crisil Liquid Fund Index- 10%*Returns < 1Year : Absolute, > = 1Year : CAGR. Past Performance may or may not besustained in the future.Note: For computation of returns the allotment NAV has been taken as Rs.10.00
Portfolio - Very Cautious Plan
Company/Issuer Mkt. Value (Rs. Lakh) % to NAVICICI Prudential Flexible Income Plan 326.13 58.98%ICICI Prudential Liquid Plan 217.41 39.32%Other Current Assets 9.42 1.70%Total Net Assets 552.96 100.00%
Portfolio - Very Aggressive Plan
Company/Issuer Mkt. Value(Rs. Lakh) % to NAVICICI Prudential Power Plan 374.45 40.35%ICICI Prudential Growth Plan 280.72 30.25%ICICI Prudential Emerging S.T.A.R 93.59 10.08%ICICI Prudential Dynamic Plan 93.22 10.04%ICICI Prudential Services Industries Fund - Growth 46.87 5.05%ICICI Prudential Flexible Income Plan 46.30 4.99%Other Current Assets (7.11) -0.76%Total Net Assets 928.04 100.00%
Portfolio - Aggressive Plan
Company/Issuer Mkt. Value (Rs. Lakh) % to NAVICICI Prudential Flexible Income Plan 217.28 24.95%ICICI Prudential Power Plan 175.74 20.18%ICICI Prudential Growth Plan 175.68 20.17%ICICI Prudential Dynamic Plan 131.25 15.07%ICICI Prudential Services Industries Fund - Growth 87.99 10.10%ICICI Prudential Emerging S.T.A.R 87.85 10.09%Other Current Assets (4.90) -0.56%Total Net Assets 870.89 100.00%
Portfolio - Moderate Plan
Company/Issuer Mkt. Value (Rs. Lakh) % to NAVICICI Prudential Flexible Income Plan 418.83 39.67%ICICI Prudential Power Plan 158.81 15.04%ICICI Prudential Growth Plan 158.74 15.03%ICICI Prudential Services Industries Fund - Growth 106.01 10.04%ICICI Prudential Emerging S.T.A.R 105.85 10.03%ICICI Prudential Dynamic Plan 52.71 4.99%ICICI Prudential Liquid Plan 52.35 4.96%Other Current Assets 2.52 0.24%Total Net Assets 1,055.82 100.00%
Portfolio - Cautious Plan
Company/Issuer Mkt. Value (Rs. Lakh) % to NAVICICI Prudential Flexible Income Plan 295.27 59.10%ICICI Prudential Liquid Plan 61.51 12.31%ICICI Prudential Services Industries Fund - Growth 37.37 7.48%ICICI Prudential Growth Plan 37.31 7.47%ICICI Prudential Dynamic Plan 37.16 7.44%ICICI Prudential Emerging S.T.A.R 24.88 4.98%Other Current Assets 6.08 1.22%Total Net Assets 499.58 100.00%
Fund Size Rs. 39.07 Crores
Dividend History
ICICI Prudential Income Plan - Half yearly Dividend Option
Record Date Face Value (Rs) NAV (Rs) Dividend (Rs.)/Unit
29-Sep-05 10.00 10.5154 0.220031-Mar-06 10.00 10.3702 0.120029-Sep-06 10.00 10.6548 0.250030-Mar-07 10.00 10.5371 0.2500Dividend is gross dividend. To arrive at the net dividend payable for corporate and non-corporate investors dividend distribution tax @ 22.44% and 14.025% needs to beadjusted respectively. Past performance may or may not be sustained in future. Afterpayment of dividend the NAV will fall to the extent of payout and distribution taxes ifapplicable.

42
ICICI Prudential Monthly Income Plan** - Quarterly Dividend Option (Feb.2006 onwards)
Record Date Face Value (Rs.) NAV (Rs) Dividend (Rs.)/Unit
28-Feb-07 10.0000 11.8645 0.250031-May-07 10.0000 11.8857 0.2500
ICICI Prudential Long Term Floating Rate Plan - Dividend A Monthly Option
Record Date Face Value (Rs.) NAV (Rs) Dividend (Rs.)/Unit30-Nov-06 10.00 10.1460 0.050029-Dec-06 10.00 10.1483 0.050031-Jan-07 10.00 10.1624 0.052028-Feb-07 10.00 10.1580 0.052030-Mar-07 10.00 10.1697 0.063027-Apr-07 10.00 10.1702 0.063031-May-07 10.00 10.1945 0.0700
ICICI Prudential Long Term Floating Rate Plan - Dividend B Monthly Option
Record Date Face Value (Rs.) NAV (Rs) Dividend (Rs.)/Unit30-Nov-06 10.00 10.1655 0.052029-Dec-06 10.00 10.1691 0.052031-Jan-07 10.00 10.1850 0.054028-Feb-07 10.00 10.1818 0.054030-Mar-07 10.00 10.1949 0.066527-Apr-07 10.00 10.1953 0.066531-May-07 10.00 10.2201 0.0735
ICICI Prudential Gilt Fund - Treasury Plan - Quarterly Dividend Option (May 2007 onwards)
Record Date Face Value (Rs.) NAV (Rs) Dividend (Rs.)/Unit31-May-07 10.0000 10.6186 0.1500
ICICI Prudential Gilt Fund - Treasury Plan - Half Yearly Dividend Option (May 2006 onwards)
Record Date Face Value (Rs.) NAV (Rs) Dividend (Rs.)/Unit31-May-07 10.0000 10.3050 0.2000Dividend is gross dividend. To arrive at the net dividend payable for corporate and non-corporateinvestors dividend distribution tax @ 22.44% and 14.025% needs to be adjusted respectively.Past performance may or may not be sustained in future. After payment of dividend theNAV will fall to the extent of payout.
ICICI Prudential Sweep Plan - Cash - Monthly Option
Record Date Face Value (Rs) NAV (Rs) Dividend (Rs.)/Unit30-May-07 10.00 10.0877 0.0877Dividend is gross dividend. To arrive at the net dividend payable for corporate and non-corporate investors dividend distribution tax @ 22.44% and 14.025% needs to be adjustedrespectively. Past performance may or may not be sustained in future. After payment ofdividend the NAV will fall to the extent of payout and distribution taxes if applicable.
ICICI Prudential Gilt Fund - Investment Plan - Half Yearly Dividend Option (Nov 2006 onwards)
Record Date Face Value (Rs.) NAV (Rs) Dividend (Rs.)/Unit30-Nov-06 10.0000 11.0558 0.400031-May-07 10.0000 10.7314 0.1000
ICICI Prudential Monthly Income Plan** - Monthly Dividend Option (Jan. 2007 onwards)
Record Date Face Value (Rs.) NAV (Rs) Dividend (Rs.)/Unit
31-Jan-07 10.0000 11.6988 0.070028-Feb-07 10.0000 11.4882 0.060030-Mar-07 10.0000 11.4461 0.060027-Apr-07 10.0000 11.5230 0.080031-May-07 10.0000 11.5527 0.0700
ICICI Prudential Blended Plan A - Dividend Option
Record Date Face Value (Rs.) NAV (Rs) Dividend (Rs.)/Unit26-Oct-05 10.00 10.2945 0.25001-June-06 10.00 10.5643 0.250020-Apr-07 10.00 11.0246 0.5000
Dividend is gross dividend. To arrive at the net dividend payable for corporate and non-corporate investors dividend distribution tax @ 22.44% and 14.025% needs to be adjustedrespectively. Past performance may or may not be sustained in future. After payment ofdividend the NAV will fall to the extent of payout and distribution taxes if applicable.
ICICI Prudential Long Term Floating Rate Plan - Dividend C Monthly Option
Record Date Face Value (Rs.) NAV (Rs) Dividend (Rs.)/Unit28-Apr-06 10.00 10.0743 0.0440
ICICI Prudential Sweep Plan - Cash Option - Weekly Dividend
Record Date Face Value (Rs) NAV (Rs) Dividend (Rs.)/Unit1-May-07 10.00 10.0186 0.02137-May-07 10.00 10.0165 0.016514-May-07 10.00 10.0182 0.018221-May-07 10.00 10.0175 0.017528-May-07 10.00 10.0173 0.0173
Dividend History
ICICI Prudential FMP Series 28 - 16 Mths Plan-Institutional Dividend
Record Date Face Value (Rs.) NAV (Rs) Dividend (Rs.)/Unit14-May-07 10.00 10.1385 0.1385
ICICI Prudential FMP Series 34 - 18 Mths Plan-Retail Dividend
Record Date Face Value (Rs.) NAV (Rs) Dividend (Rs.)/Unit29-Mar-07 10.00 10.0439 0.0439
ICICI Prudential FMP Series 34 - 17 Mths Plan-Retail Dividend
Record Date Face Value (Rs.) NAV (Rs) Dividend (Rs.)/Unit29-Mar-07 10.00 10.0540 0.0540
ICICI Prudential FMP Series 34 - 17 Mths Plan-Institutional Dividend
Record Date Face Value (Rs.) NAV (Rs) Dividend (Rs.)/Unit29-Mar-07 10.00 10.0646 0.0646
ICICI Prudential FMP Series 28 - 16 Mths Plan-DividendRecord Date Face Value (Rs.) NAV (Rs) Dividend (Rs.)/Unit14-May-07 10.00 10.1384 0.1384
ICICI Prudential FMP - Yearly Series 12 Retail Div 1
Record Date Face Value (Rs.) NAV (Rs) Dividend (Rs.)/Unit7-May-07 10.00 10.0737 0.0737
ICICI Prudential FMP Series 34 - 1 Year Plan A-Institutional Dividend
Record Date Face Value (Rs.) NAV (Rs) Dividend (Rs.)/Unit29-Mar-07 10.00 10.1969 0.1969
ICICI Prudential FMP Series 34 - 1 Year Plan A-Retail DividendRecord Date Face Value (Rs.) NAV (Rs) Dividend (Rs.)/Unit29-Mar-07 10.00 10.1853 0.1853
ICICI Prudential FMP Series 35-3A-Dividend PlanRecord Date Face Value (Rs.) NAV (Rs) Dividend (Rs.)/Unit24-Apr-07 10.00 10.0643 0.0643
ICICI Prudential FMP Series 35-3B-Dividend PlanRecord Date Face Value (Rs.) NAV (Rs) Dividend (Rs.)/Unit14-May-07 10.00 10.1201 0.1201
ICICI Prudential FMP Series 35-3C-Dividend PlanRecord Date Face Value (Rs.) NAV (Rs) Dividend (Rs.)/Unit29-May-07 10.00 10.1765 0.1765
ICICI Prudential FMP Series 34-3A-Dividend PlanRecord Date Face Value (Rs.) NAV (Rs) Dividend (Rs.)/Unit19-Apr-07 10.00 10.0487 0.0487
ICICI Prudential FMP Series 34 - 16 Mths Plan-Retail DividendRecord Date Face Value (Rs.) NAV (Rs) Dividend (Rs.)/Unit29-Mar-07 10.00 10.0625 0.0625
ICICI Prudential FMP Series 34 - 15 Mths Plan-Retail DividendRecord Date Face Value (Rs.) NAV (Rs) Dividend (Rs.)/Unit29-Mar-07 10.00 10.0680 0.0680
ICICI Prudential FMP Series 30 - 13 Mths Plan-Retail DividendRecord Date Face Value (Rs.) NAV (Rs) Dividend (Rs.)/Unit29-Mar-07 10.00 10.5168 0.5168
ICICI Prudential FMP - Yearly Series 12 Institutional Div 1
Record Date Face Value (Rs.) NAV (Rs) Dividend (Rs.)/Unit7-May-07 10.00 10.0758 0.0758
ICICI Prudential Hybrid FMP 13 Mths Plan - Retail Annual Dividend
Record Date Face Value (Rs.) NAV (Rs) Dividend (Rs.)/Unit29-Mar-07 10.00 10.3869 0.3869
ICICI Prudential Hybrid FMP 13 Mths Plan - Institutional Quarterly Dividend
Record Date Face Value (Rs.) NAV (Rs) Dividend (Rs.)/Unit29-Mar-07 10.00 10.2920 0.2920
ICICI Prudential Hybrid FMP 13 Mths Plan - Retail Quarterly Dividend
Record Date Face Value (Rs.) NAV (Rs) Dividend (Rs.)/Unit29-Mar-07 10.00 10.2651 0.2651
ICICI Prudential FMP Series 35 - 1 Mth Plan - Retail Dividend Option
Record Date Face Value (Rs.) NAV (Rs) Dividend (Rs.)/Unit29-Mar-07 10.00 10.0782 0.0782
ICICI Prudential FMP Series 37 - 1 Mth Plan - Retail Dividend Option
Record Date Face Value (Rs.) NAV (Rs) Dividend (Rs.)/Unit29-Apr-07 10.00 10.0995 0.0995Dividend is gross dividend. To arrive at the net dividend payable for corporate and non-corporate investors dividend distribution tax @ 22.44% and 14.025% needs to be adjustedrespectively. Past performance may or may not be sustained in future. After payment ofdividend the NAV will fall to the extent of payout and distribution taxes if applicable.
ICICI Prudential Blended Plan B - Dividend Option
Record Date Face Value (Rs.) NAV (Rs) Dividend (Rs.)/Unit
26-Oct-05 10.00 10.2600 0.230001-Jun-06 10.00 10.4485 0.4000Dividend is gross dividend. To arrive at the net dividend payable for corporate and non-corporate investors dividend distribution tax @ 22.44% and 14.025% needs to be adjustedrespectively. Past performance may or may not be sustained in future. After payment ofdividend the NAV will fall to the extent of payout and distribution taxes if applicable.

43
Dividend History
ICICI Prudential Monthly Income Plan** - Half Yearly Dividend Option (Aug. 2006 onwards)
Record Date Face Value (Rs.) NAV (Rs) Dividend (Rs.)/Unit31-Aug-06 10.0000 11.8638 0.450028-Feb-07 10.0000 11.8944 0.5000
Dividend is gross dividend. To arrive at the net dividend payable for corporate and non-corporateinvestors dividend distribution tax @ 22.44% and 14.025% needs to be adjusted respectively.Past performance may or may not be sustained in future. After payment of dividend the NAV willfall to the extent of payout and distribution taxes if applicable. **An open-ended fund. Monthlyincome is not assured and is subject to the availability of distributable surplus.
ICICI Prudential Flexible Income Plan - Weekly Dividend OptionRecord Date Face Value (Rs.) NAV (Rs) Dividend (Rs.)/Unit2-May-07 10.00 10.5591 0.01977-May-07 10.00 10.5601 0.020714-May-07 10.00 10.5567 0.017321-May-07 10.00 10.5580 0.018628-May-07 10.00 10.5580 0.0186Dividend is gross dividend. To arrive at the net dividend payable for corporate and non-corporate investors dividend distribution tax @ 22.44% and 14.025% needs to be adjustedrespectively. Past performance may or may not be sustained in future. After payment ofdividend the NAV will fall to the extent of payout and distribution taxes if applicable.
ICICI Prudential Floating Rate Plan - Plan C - Fortnightly Dividend Option (Dec.2006 onwards)
Record Date Face Value (Rs.) NAV (Rs) Dividend (Rs.)/Unit14-Dec-06 10.00 10.0302 0.028428-Dec-06 10.00 10.0311 0.029216-Jan-07 10.00 10.0435 0.041529-Jan-07 10.00 10.0286 0.026514-Feb-07 10.00 10.0348 0.032627-Feb-07 10.00 10.0278 0.025515-Mar-07 10.00 10.0358 0.033529-Mar-07 10.00 10.0438 0.041516-Apr-07 10.00 10.0581 0.055826-Apr-07 10.00 10.0295 0.027215-May-07 10.00 10.0500 0.047730-May-07 10.00 10.0380 0.0357
ICICI Prudential Long Term Plan - Dividend OptionRecord Date Face Value (Rs.) NAV (Rs) Dividend (Rs.)/Unit30-Mar-07 10.0000 10.5343 0.071527-Apr-07 10.0000 10.5391 0.071531-May-07 10.0000 10.5616 0.0900Dividend is gross dividend. To arrive at the net dividend payable for corporate and non-corporate investors dividend distribution tax @ 22.44% and 14.025% needs to be adjustedrespectively. Past performance may or may not be sustained in future. After payment ofdividend the NAV will fall to the extent of payout and distribution taxes if applicable.
ICICI Prudential Balanced Fund - Dividend OptionRecord Date Face Value (Rs.) NAV (Rs) Dividend (Rs.)/Unit30-Oct-03 10.00 12.93 2.0024-Mar-05 10.00 15.36 3.5026-Dec-05 10.00 15.76 1.2029-Sep-06 10.00 17.66 1.2016-Mar-07 10.00 16.93 1.00Past performance may or may not be sustained in future. After payment of dividend theNAV will fall to the extent of dividend payout and statutory levy, if any
ICICI Prudential Floating Rate Plan - Plan D - Fortnightly Dividend Option (April. 2007 onwards)
Record Date Face Value (Rs.) NAV (Rs) Dividend (Rs.)/Unit16-Apr-07 10.00 10.0584 0.056326-Apr-07 10.00 10.0296 0.027515-May-07 10.00 10.0506 0.048530-May-07 10.00 10.0385 0.0364Dividend is gross dividend. To arrive at the net dividend payable for corporate and non-corporateinvestors dividend distribution tax @ 22.44% and 14.025% needs to be adjusted respectively. Pastperformance may or may not be sustained in future. After payment of dividend the NAV willfall to the extent of payout and distribution taxes if applicable.
ICICI Prudential Income Multiplier Fund - Dividend Option (Dec. 2006 onwards)Record Date Face Value (Rs.) NAV (Rs) Dividend (Rs.)/Unit15-Dec-06 10.00 12.5406 0.5016-Mar-07 10.00 12.0028 0.4531-May-07 10.00 11.9275 0.08Dividend is gross dividend. To arrive at the net dividend payable for corporate and non-corporate investors dividend distribution tax @ 22.44% and 14.025% needs to be adjustedrespectively. Past performance may or may not be sustained in future. After payment ofdividend the NAV will fall to the extent of payout and distribution taxes if applicable.
ICICI Prudential Infrastructure fund - DividendRecord Date Face Value (Rs.) NAV (Rs) Dividend (Rs.)/Unit20-Mar-06 10.00 14.37 1.0015-Sep-06 10.00 14.68 1.0016-Mar-07 10.00 14.46 1.50Past performance may or may not be sustained in future. After payment of dividend theNAV will fall to the extent of dividend payout and statutory levy, if any
ICICI Prudential Floating Rate Plan - Plan B - Fortnightly Dividend Option (Dec. 2006 onwards)
Record Date Face Value (Rs.) NAV (Rs) Dividend (Rs.)/Unit
14-Dec-06 10.00 10.0666 0.028028-Dec-06 10.00 10.0675 0.028816-Jan-07 10.00 10.0798 0.041029-Jan-07 10.00 10.0651 0.026214-Feb-07 10.00 10.0713 0.032327-Feb-07 10.00 10.0644 0.025315-Mar-07 10.00 10.0721 0.033029-Mar-07 10.00 10.0804 0.041316-Apr-07 10.00 10.0948 0.055726-Apr-07 10.00 10.0663 0.027215-May-07 10.00 10.0864 0.047330-May-07 10.00 10.0745 0.0354
ICICI Prudential Floating Rate Plan - Plan A - Fortnightly Dividend Option (Dec. 2006 onwards)
Record Date Face Value (Rs.) NAV (Rs) Dividend (Rs.)/Unit
14-Dec-06 10.00 10.0290 0.026928-Dec-06 10.00 10.0300 0.027816-Jan-07 10.00 10.0419 0.039629-Jan-07 10.00 10.0277 0.025314-Feb-07 10.00 10.0335 0.031027-Feb-07 10.00 10.0269 0.024315-Mar-07 10.00 10.0345 0.031929-Mar-07 10.00 10.0427 0.040116-Apr-07 10.00 10.0566 0.054026-Apr-07 10.00 10.0288 0.026215-May-07 10.00 10.0485 0.045930-May-07 10.00 10.0369 0.0343
ICICI Prudential Emerging S.T.A.R. Fund - Dividend Option
Record Date Face Value (Rs.) NAV (Rs) Dividend (Rs.)/Unit19-Jul-05 10.00 15.21 1.0018-May-06 10.00 23.93 3.0012-Jan-07 10.00 24.23 2.50Past performance may or may not be sustained in future. After payment of dividend theNAV will fall to the extent of dividend payout and statutory levy, if any
ICICI Prudential Dynamic Fund - Dividend Option
Record Date Face Value (Rs.) NAV (Rs) Dividend (Rs.)/Unit21-Sep-05 10.00 16.5757 2.0027-Apr-06 10.00 21.6998 2.0009-Feb-07 10.00 23.3124 2.00Past performance may or may not be sustained in future. After payment of dividend theNAV will fall to the extent of dividend payout and statutory levy, if any
ICICI Prudential FMCG Fund - Dividend Option
Record Date Face Value (Rs.) NAV (Rs) Dividend (Rs.)/Unit
16-Mar-00 Rs. 10.00 11.45 1.0023-Mar-06 Rs. 10.00 34.47 3.0012-Jan-07 Rs. 10.00 35.25 1.80Past performance may or may not be sustained in future. After payment of dividend theNAV will fall to the extent of dividend payout and statutory levy, if any
ICICI Prudential Tax Plan - Dividend Option
Record Date Face Value (Rs.) NAV (Rs) Dividend (Rs.)/Unit16-Mar-00 10.00 22.06 6.0024-Jul-03 10.00 12.38 1.2025-Mar-04 10.00 16.09 4.5028-Dec-04 10.00 20.61 2.5023-Aug-05 10.00 26.98 2.5020-Mar-06 10.00 31.51 5.0010-Nov-06 10.00 29.77 2.5009-Feb-07 10.00 27.15 5.00Past performance may or may not be sustained in future. After payment of dividend theNAV will fall to the extent of dividend payout and statutory levy, if any
ICICI Prudential Power - Dividend OptionRecord Date Face Value (Rs.) NAV (Rs) Dividend (Rs.)/Unit24-Jul-03 10.00 14.07 2.0023-Oct-03 10.00 18.62 3.0024-Dec-03 10.00 16.22 3.0025-Mar-04 10.00 12.68 1.5024-Mar-05 10.00 14.72 2.5026-Dec-05 10.00 17.77 2.008-Aug-06 10.00 19.33 2.0016-Mar-07 10.00 20.16 2.00Past performance may or may not be sustained in future. After payment of dividend theNAV will fall to the extent of dividend payout and statutory levy, if any
ICICI Prudential Growth Plan - Dividend Option
Record Date Face Value (Rs.) NAV (Rs) Dividend (Rs.)/Unit01-Mar-01 10.00 12.54 1.2015-Mar-02 10.00 10.83 0.8024-Jul-03 10.00 11.09 0.8006-Nov-03 10.00 14.76 2.5025-Mar-04 10.00 13.15 2.0017-Mar-05 10.00 14.68 1.0023-Mar-06 10.00 23.03 2.0015-Dec-06 10.00 25.03 2.50Past performance may or may not be sustained in future. After payment of dividend theNAV will fall to the extent of dividend payout and statutory levy, if any
ICICI Prudential Discovery Fund - Dividend Option
Record Date Face Value (Rs.) NAV (Rs) Dividend (Rs.)/Unit05-Apr-05 10.00 13.71 1.0011-Oct-05 10.00 17.99 1.5023-Mar-06 10.00 20.30 2.0024-Nov-06 10.00 20.68 2.00Past performance may or may not be sustained in future. After payment of dividend theNAV will fall to the extent of dividend payout and statutory levy, if any
ICICI Prudential Services Industries Fund - DividendRecord Date Face Value (Rs.) NAV (Rs) Dividend (Rs.)/Unit11-May-07 10.00 15.99 1.50Past performance may or may not be sustained in future. After payment of dividend theNAV will fall to the extent of dividend payout and statutory levy, if any

44
Key Features
Type
Investment Pattern(Under normalcircumstances)
Options
Default Option
Application Amount ###
Min. Addl. Investment ###
Entry Load*
Exit Load*$$$
Redemption ChequesIssued ##
Min. Redemption Amt.
Cut off time:Purchase/Switch inRedemption/Switch out $
Systematic InvestmentPlan (SIP)
Systematic WithdrawalPlan (SWP)
Systematic Transfer Plan(STP) $$
Recurring Expenses**Investment Mangmt. Exp.Other recurring expensesTotal
Funds at a glanceLiquid Plan
Open-ended Liquid Income Fund
Money Market upto 80% & DebtInstruments upto 20%
1. Growth Option2. Dividend Option
a) Dividend PayoutQuarterly & Half Yearly
b) Div. Reinvestmenti) Daily, Weekly & Monthlyii) Quarterly & Half Yearly
Dividend Reinvestment withweekly frequency.
a) Growth option : Rs.15,000b) Institutional option: Rs. 1 crc) Institutional Plus option: Rs. 3 crsd) Super Institutional Growth
option: Rs. 5 crs(plus in multiples of Re.1)
a) Growth option : Rs.5,000b) Institutional option: Rs. 1 lacc) Institutional Plus option: Rs. 1 lacd) Super Institutional Growth
option: Rs. 1 lac(plus in multiples of Re.1)
Nil
Nil
Generally within 1 Business Dayfor specified RBI locations andadditional 3 Business Days forNon-RBI locations. Same DayRedemption Facility (refer toKey Information Memorandum)
Rs. 5,000
12.00 noon3.00 p.m.
N.A.
N.A.
Available
0.70%0.30%1.00%
Income Plan
Open-ended Debt Fund
Debt Securities upto 75% & MoneyMarket & Cash upto 25%
1. Growth2. Growth-AEP (Appreciation &
Regular)3. Dividend^ (Quarterly & Half
Yearly)
Dividend Reinvestment withHalf Yearly frequency.
Rs. 5,000 (plus in multiples of Re. 1)Rs.25,000 for AEP
Rs. 500 & in multiples thereof
Nil
For investment of less than or uptoRs.10 lacs : 0.5% if investment heldfor less than or equal to a period of6 months For investment of aboveRs.10 lacs: Nil
Generally within 1 Business Day forspecified RBI locations andadditional 3 Business Days for Non-RBI locations
Rs. 500
3.00 p.m.3.00 p.m.
Monthly: Minimum Rs. 1,000 + 5post-dated cheques for a minimumof Rs. 1,000 each.
*****
Minimum of Rs. 500 and in multiplesof Re. 1/-
Available
1.25%0.75%
2.00%
Short Term Plan
Open-ended Income Fund
Debt Securities upto 100% & MoneyMarket & Cash upto 50%
1. Cumulative2. Dividend Reinvestment
(Fortnightly & Monthly)
Dividend Reinvestment withFortnightly frequency.
Rs.5,000 (plus in multiples of Re. 1)Rs.25,000 for Institutional option(plus in multiples of Re.1)
Rs. 500 & in multiples thereof
Nil
Nil
Generally within 1 Business Day forspecified RBI locations andadditional 3 Business Days for Non-RBI locations
Rs. 500
3.00 p.m.3.00 p.m.
Not Available
Not Available
Available
1.25%1.00%
2.25%
Floating Rate Plan
Open-ended Income Fund
65-100% = Floating Rate DebtInstruments. 0-35% = Fixed ratedebt instruments.
1. Cumulative2. Div. Reinvestment
(Fortnightly & Dailyfrequencies)
Option: Plan ASub option: Cumulative
a) Plan-A: Rs 10,000/-b) Plan-B: Rs.10 lacsc) Plan-C: Rs.3 croresd) Plan-D: Rs.5 crores(plus in multiples of Re.1)
Plans A & B: Rs.1000 plus in multiplesof Re.1Plan C: The minimum additionalinvestment amount can be anyamount provided the minimumbalance in the investors account atthe time of additional subscriptionincluding the amount proposed to beinvested, is not below Rs. 5Crore****.Plan D: Rs.1 lac.¥
Plan-A, B, C & D: Nil
Plan-A, B, C & D: For allinvestments made on or after April24, 2007, an exit load of 0.25% ofthe applicable NAV if theredumption/switch-out is madewithin 10 days from the date ofinvestment.
Generally Within 1 business dayfor Specified RBI locations andadditional 3 Business Days forNon-RBI locations.
Rs. 500/- and multiples thereof
3.00 p.m.3.00 p.m.
Not Available
Not Available
Available
Plan A Plan B Plan C
1.00% 0.75% 0.65%
Long Term FloatingRate Plan
Open-ended Income Fund
65-100% = Floating Rate DebtInstruments. 0-35% = Fixed ratedebt instruments
1. Cumulative2. Div. Reinvestment
(Quarterly)
Option: Plan ASub option: CumulativeDividend: Automatic
Reinvestment
a) Plan-A: Rs 25,000/-b) Plan-B: Rs.1 crorec) Plan-C: Rs.5 crores(plus in multiples of Re.1)
Plans A & B: Rs.1000 (plus inmultiples of Re1)Plan C: The minimum additionalinvestment amount can be anyamount provided the minimumbalance in the investors account atthe time of additional subscriptionincluding the amount proposed to beinvested, is not below Rs. 5Crore****.
Plan-A, B & C : Nil
Plan-A: 0.50% for investments ofless than or equal to Rs. 1 Croreand redemption is made on orbefore the completion of sixmonths from the date of allotmentof units.Plan B & Plan C: Nil
Generally Within 1 business day forSpecified RBI locations andadditional 3 Business Days for Non-RBI locations.
Rs. 5,000/- and in multiples thereof;provided that minimum balanceunder a particular folio should notfall below the minumumapplication amount. This will notbe applicable for closing theaccount.
3.00 p.m.3.00 p.m.
Not Available
Not Available
Available
Plan A Plan B Plan C0.75% 0.60% 0.50%0.50% 0.30% 0.25%
1.25% 0.90% 0.75%
* The Trustees reserves the right to change/modify the load structure at a later date for the Schemes. ** Investors are requested to read the section on “Fees and Annual Recurringexpenses” in the Offer Documents of the respective schemes. The recurring expenses indicated above may change subject to ceilings under the Regulations. *** Entry load of 2.25% ofthe applicable NAV will be charged on the SIP/STP investment under this Scheme. Exit Load on the SIP/STP Invesment under this Scheme is Nil. *****For SIP/STP investment under this

45
Key Features
Type
Investment Pattern(Under normalcircumstances)
Options
Default Option
Application Amount ###
Min. Addl. Investment ###
Entry Load*
Exit Load*$$$
Redemption ChequesIssued ##
Min. Redemption Amt.
Cut off time:Purchase/Switch inRedemption/Switch out $
Systematic InvestmentPlan (SIP)
Systematic WithdrawalPlan (SWP)
Systematic Transfer Plan(STP) $$
Recurring Expenses**Investment Mangmt. Exp.Other recurring expensesTotal
Funds at a glance
Scheme: Entry Load – Nil, Exit Load – Nil. Exceptions: For all SIP and STP investments registered under ICICI Prudential Power and ICICI Prudential Discovery Fund from June 21, 2006 toJuly 31, 2006: (i) If redemptions are made from June 21, 2006 to July 5, 2006 no exit load shall be charged; (ii) If redemptions are made after July 5, 2006 but on or before the end of sixmonths from the date of investment of each installment of SIP/STP investment, an exit load of 0.5% shall be charged. ^ Under the Dividend Option, the Unit-holder may choose betweenDividend Payout and Reinvestment Option. If not chosen, Default Option would be Dividend Payout. $ For all web-based transactions under the schemes of ICICI Prudential Mutual Fund,entered through the website of the fund viz. www.icicipruamc.com there would be a cooling off period of 30 minutes before the respective cut-off times of the relevant schemes. ###In case of all purchase transactions including additional purchase requests under all schemes except ICICI Prudential Liquid Plan, the AMC reserves the right to reject/reverse the transaction,if an amount of Rs. 1 Lakh and above is received by way of MICR cheques at the centers where high value clearing is available. In case of ICICI Prudential Index Fund, all the transactionfor Fresh/Additional purchases for a consideration of Rs.One lakh and above will be accepted only through High Value Cheques/Demand Drafts received before the cut-off time of 10.00a.m. for clearing of High Value Instruments or through Transfer Cheques received before 1.00 p.m. Æ For dividend of Rs.500 or less the Dividend will be Automatic Compulsory Reinvestment(irrespective of the option selected by the Unitholder) & for Dividend of more than Rs.500 will either be paid out or reinvested as opted by the Unitholders, If not selected the default optionwould be dividend reinvestment. Investors on or after July 24, 2006 will only have Dividend re-investment option. ## As per the Regulations, the Fund shall dispatch redemption proceedswithin 10 Business days of receiving the redemption request. Investors are advised to refer to the sections titled “Suspension of sale and redemption of units” and “Right to limitRedemption”. The default option for payment of redemption/dividend proceeds would be Direct Credit into their bank account (in case the investor has provided his bank mandate as oneof the banks participating in direct credit arrangement and if he fails to specify the mode of payment). **** Minimum additional application amount shall be applicable for investments byan investor by itself or for investments along with any of its group companies. Later on even if the net asset value under the folio falls below Rs. 5 crores, the investment can continue underthe Option C. ¥ The minimum additional application amount shall be applicable for investments by an investor by itself or for investments along with any of its group companies. Later oneven if the net asset value under the folio below Rs. 5 cores, the investment can continue under the ICICI Prudential Floating Rate Plan-Plan D. $$$ Where as a result of a redemption/ switch arising out of excess holding by an investor beyond 25% of the net assets of the scheme in the manner envisaged under specified SEBI circulars, such redemption / switch willnot be subject to exit load. $$ The minimum amount that can be transferred from one scheme to another is Rs. 1000/- for a minimum of 6 installments. The unitholder can avail theSTP facility for a maximum period of 10 years.
Flexible Income Plan
Open-ended Income Fund
10 to 100% - Money market andDebentures with residual maturityof less than 1 year. 0 to 90% -Debt instruments with maturitymore than 1 year
1. Cumulative2. Dividend ReinvestmentÆ
(Daily & Weekly Frequencies)
Dividend Reinvestment withdaily frequency.
Rs.5,000 (plus in multiples of Re. 1)
Rs. 500 & in multiples thereof
Nil
Investments made: (a) before July24, 06 - Nil (b) on or after July 24,2006 - 0.50% of the applicable NAV,if the redemption is made within onemonth from the date of investment.Investment made on or after March28, 2007 - 0.25% of the applicableNAV, if the redemption/switch-outis made within 10 days from the dateof investment.
Generally within 1 Business Day forspecified RBI locations andadditional 3 Business Days for Non-RBI locations
Rs. 500
3.00 p.m.3.00 p.m.
Monthly: Minimum Rs. 1,000 + 5post-dated cheques for a minimumof Rs. 1,000 each
*****
Minimum of Rs. 500 and multiplesof Re. 1/-
Available
1.00%0.50%
1.50%
Gilt - Treasury
Open-ended short-term Gilt Fund
Gilt Securities (incl. Treasury Bills).Average Maturity normally not toexceed 3 years.
1. Growth2. Growth-AEP3. Dividend (Quarterly & Half
Yearly)
Dividend Reinvestment withQuarterly frequency.
Rs.25,000 (plus in multiples of Re. 1)
Rs. 5,000 & in multiples thereof
Nil
Nil
Generally within 1 Business Day forspecified RBI locations andadditional 3 Business Days for Non-RBI locations
Rs. 5,000
3.00 p.m.3.00 p.m.
Not Available
Not Available
Available
0.75%0.35%
1.10%
Gilt - Investment
Open-ended medium-term Gilt Fund
Gilt Securities (incl. Treasury Bills).Average Maturity normally not toexceed 8 years.
1. Growth2. Growth-AEP3. DividendÆ (Half Yearly)
Dividend Reinvestment withHalf Yearly frequency.
Rs.25,000 (plus in multiples of Re. 1)
Rs. 5,000 & in multiples thereof
Nil
Nil
Generally within 1 Business Day forspecified RBI locations andadditional 3 Business Days for Non-RBI locations
Rs. 5,000
3.00 p.m.3.00 p.m.
Not Available
Not Available
Available
0.75%0.40%
1.15%
Gilt - TreasuryPF Option
Open-ended Gilt Fund
Gilt Securities (incl. Treasury Bills).Average Maturity normally not toexceed 3 years.
1. Growth2. Growth-AEP (Monthly,
Quarterly, Half Yearly & Yearly)
Cumulative option
Rs.25,000 (plus in multiples of Re. 1)
Rs. 5,000 & in multiples thereof
Nil
0.80% of applicable NAV in case theamount sought to be redeemed is notbeing invested under the Plan for aminimum period of 365 days. ExitLoad is NIL if the amount is investedfor more than 365 days.
Generally within 1 Business Day forspecified RBI locations andadditional 3 Business Days for Non-RBI locations
Rs. 5,000
3.00 p.m.3.00 p.m.
Not Available
Not Available
Not Available
2.25%
Gilt - InvestmentPF Option
Open-ended Gilt Fund
Gilt Securities (incl. Treasury Bills).Average Maturity normally not toexceed 8 years.
1. Growth2. Growth-AEP (Monthly,
Quarterly, Half Yearly & Yearly)
Cumulative option
Rs.25,000 (plus in multiples of Re. 1)
Rs. 5,000 & in multiples thereof
Nil
0.60% of applicable NAV in case theamount sought to be redeemed is notbeing invested under the Plan for aminimum period of 365 days.
Generally within 1 Business Day forspecified RBI locations andadditional 3 Business Days for Non-RBI locations
Rs. 5,000
3.00 p.m.3.00 p.m.
Not Available
Not Available
Not Available
1.10%

46
Key Features
Type
Investment Pattern(Under normal circumstances)
Options
Default OptionApplication Amount ###
Min. Addl. Investment ###
Entry Load*
Exit Load*$$$
Redemption Cheques Issued ##
Min. Redemption Amt.
Cut off time:Purchase/Switch inRedemption/Switch out $
Systematic Investment Plan(SIP)
Systematic Withdrawal Plan (SWP)Systematic Transfer Plan (STP)Recurring Expenses**Investment Mangmt. Exp.Other recurring expensesTotal
Long Term Plan
Open-ended Income Fund
Debt Instruments - 0% to 100% & MoneyMarket instruments - 0% to 10%
Cumulative & Dividend
Dividend ReinvestmentRs. 5,000 (plus in multiples of Re.1)
Rs. 500/- & in multilples thereof
Nil
Nil
Generally within 1 Business Day forspecified RBI locations and additional 3Business Days for Non-RBI locations.Rs. 500/- provided that minimum balanceunder a particular folio should not fall be-low Rs. 5,000
3.00 p.m.3.00 p.m.Monthly: Minimum Rs. 1,000 + 5 post-datedcheques for a minimum of Rs. 1,000 each.
*****Minimum of Rs. 500 and in multiples of Re. 1/-Not Available
2.00%
Income Multiplier Fund –Regular Plan
An open-ended debt fund which investsupto 30% in equity.
Equity & Equity Related Securities0-30%, Debt instruments 65-100%, Cash &money market instruments 0-5%.
1. Cumulative2. Dividend (Monthly)
Dividend ReinvestmentRs.5,000 (plus in multiples of Re.1)
Rs.500 & in multiples thereof
Nil
(i) 1% - For investments of less than Rs. 5crores and if the investments are held forless than a period of 12 months; (ii) No ExitLoad for investments of Rs. 5 crores andabove.
Generally within 1 Business Day forspecified RBI locations and additional 3Business Days for Non-RBI locationsRs.500
3.00 p.m.3.00 p.m.Monthly: Minimum Rs. 1,000 + 5 post-datedcheques for a minimum of Rs. 1,000 each.
*****Minimum of Rs.500 and multiples of Re. 1/-Available $$
1.00%1.25%
2.25%
Monthly Income Plan
An open-ended fund. Monthly income isnot assured and is subject to the availabilityof distributable surplus.Debt securities, money market instru-ments, securitised debt & Cash upto 85%,Equity & Equity related securities upto 15%
1. Cumulative2. AEP (Appreciation & Regular)3. Dividend (Monthly, Quarterly & Half
Yearly)Dividend Reinvestment (Monthly)a) Cumulative : Rs.5,000b) Dividend & AEP : Rs. 25,000(plus multiples of Re 1)Rs.500 & in multiples thereof under eachoptionNil
For investment of less than or upto Rs.10lakhs: 0.5% if investment held for less thanor equal to a period of 6 months Forinvestment of above Rs.10 lakhs: Nil
Generally within 1 Business Day forspecified RBI locations and additional 3Business Days for Non-RBI locationsRs.500
3.00 p.m.3.00 p.m.Dividend & AEP Option – Monthly andCumulative (without AEP) Option –Monthly: Min. Rs. 1,000 + 5 post-dtd.cheques for a minimum of Rs. 1,000 each.
*****Minimum of Rs.500 and multiples of Re. 1/-Available $$
1.25%1.00%
2.25%
Child Care Plan - Study
Open-ended fund (Study Plan)
Equity and Equity related securities 0-15%,Debt Securities, Money MarketInstruments, Securitised Debt and Cash85-100%Cumulative Option
Cumulative OptionRs. 5,000/-, additional in multiples of Re.1
Rs. 1,000/- & in multiples thereof
1.50%
1.00% if investment is redeemed within 3years.Nil if investment is redeemed after 3years but before the Beneficiary Childattains the age of 18.
Normally Within 3 business days
Rs. 1,000
3.00 p.m.3.00 p.m.Monthy : Minimum Rs 1000 + 5 post datedcheques for a min of Rs. 1,000/- each.Entry Load: 1.50% of applicable NAVExit Load: 1.00% of applicale NAV ifinvestment is redeemed within 3 years fromthe date of allotment, Nil thereafter.Minimum of Rs.500 and multiples of Re. 1/-Available (from Study Plan to Gift Plan)
1.25%1.00%
2.25%
Funds at a glance
Key FeaturesType
Investment Pattern(Under normal circumstances)
OptionsDefault Option
Application Amount ###Min. Addl. Investment ###Max. Amount Investment per applicationEntry Load*
Exit Load*$$$
Redemption Cheques Issued ##
Min. Redemption Amt.Cut off time:
Purchase/Switch inRedemption/Switch out $
Systematic Investment Plan (SIP)
Systematic Withdrawal Plan (SWP)Systematic Transfer Plan (STP) $$
Recurring Expenses**Investment Mangmt. Exp.Other recurring expensesTotal
Child Care Plan - GiftOpen-ended fund (Gift Plan)
Equity & Equity related securities65% to 80%, Debt Securities, MoneyMarket Instruments, Securitised Debt &Cash - 20%-35%.
Cumulative OptionCumulative Option
Rs. 5,000/-, additional in multiples of Re.1Rs.1,000/-Not Available1.50%
1.00% if investment is redeemed within 3years.Nil if investment is redeemed after 3years but before the Beneficiary Childattains the age of 18.
Normally Within 3 business days
Rs.1,000
3.00 p.m.3.00 p.m.Monthy : Minimum Rs 1000 + 5 post datedcheques for a min of Rs. 1,000/- each.Entry Load: 1.50% of applicable NAVExit Load: 1.00% of applicale NAV ifinvestment is redeemed within 3 years fromthe date of allotment, Nil thereafter.Minimum of Rs.500 and multiples of Re. 1/-
Not available
1.25%1.25%
2.50%
Balanced FundOpen-ended Balanced Fund
Equity and Equity related instruments –65% to 80% & Debt, Money Market andCash – 20% to 35%.
Growth & DividendDividend Reinvestment
Rs. 5,000 (plus in multiples of Re. 1)Rs. 500 & in multiples thereofNot Available(i) For investment of less than Rs.5Crores: 2.25% of applicable NAV;(ii) For investment of Rs.5 Crores &above: NILNil
Generally within 3 Business Days forspecified RBI locations and an additionalof 3 Business Days for Non RBI locationsRs. 500
3.00 p.m.3.00 p.m.Monthly: Minimum Rs. 1,000 + 5 post-datedcheques for a minimum of Rs. 1000 each
***
Minimum of Rs.500 and multiples of Re. 1/-
Available
1.25%1.25%
2.50%
Blended Plan - A @@Open ended fund investing in a blend ofequity, derivatives, debt and money marketinstruments.Equity and Equity Related securities – 65%-80%; Derivative including Index Futures,Stock Futures, Index Options and StockOptions etc. – 0%-80%; Money Market,Debt instruments, securitised debt –20%-35%.Growth & DividendOption - GrowthSub-option - ReinvestmentRs. 5,000 (plus in multiples of Re. 1)Rs. 1,000 & in multiples of Re.1/-Rs. 10 Crores per applicationNil
0.50%, if the investment is redeemedwithin a period of 30 days from the date ofallotment. Nil, if the investment is redeemedafter 30 days from the date of allotment.
Generally within 3 Business Days forspecified RBI locations and an additionalof 3 Business Days for Non RBI locationsRs. 500 and in multiples of Re.1/-
3.00 p.m.3.00 p.m.Not available
Not available
Not available
1.25%1.25%
2.50%
Blended Plan - B @@Open ended fund investing in a blend ofequity, derivatives, debt and money marketinstruments.Equity and Equity Related securities – 0%-49%; Derivative including Index Futures,Stock Futures, Index Options and StockOptions etc. – 0%-49%; Money Market,Debt instruments, securitised debt– 51%-100%.Growth & DividendOption - GrowthSub-option - ReinvestmentRs. 5,000 (plus in multiples of Re. 1)Rs. 1,000 & in multiples of Re.1/-Not AvailableNil
0.50%, if the investment is redeemed withina period of 30 days from the date ofallotment. Nil, if the investment is redeemedafter 30 days from the date of allotment.
Generally within 1 Business Day forspecified RBI locations and an additional of3 Business Days for Non RBI locationsRs. 500 and in multiples of Re.1/-
3.00 p.m.3.00 p.m.Not available
Not available
Not available
1.00%1.25%
2.25%
@@ Default option for ICICI Prudential Blended Plan is Plan B.Exit Load for fresh and additional purchases (including SIPs and STPs) made in the schemes given hereinbelow during September 15, 2006 to October 16, 2006, the following willbe applicable: • ICICI Prudential Power, ICICI Prudential Dynamic Plan, ICICI Prudential Discovery Plan, ICICI Prudential Balanced Fund – (i) 0.50% of the applicable NAV if the investmentis made for an amount of less than Rs. 5 crores and is invested for a period of six months or less than six months from the date of allotment. (ii) Nil for investment of Rs. 5 crores andabove. • ICICI Prudential Income Multiplier Plan – (i) 1.25% of the applicable NAV if the investment is made for an amount of less than Rs. 5 crores and is invested for a period of lessthan twelve months from the date of allotment. (ii) Nil for investment of Rs. 5 crores and above. • ICICI Prudential Monthly Income Plan – (i) 0.75% of the applicable NAV if the investment
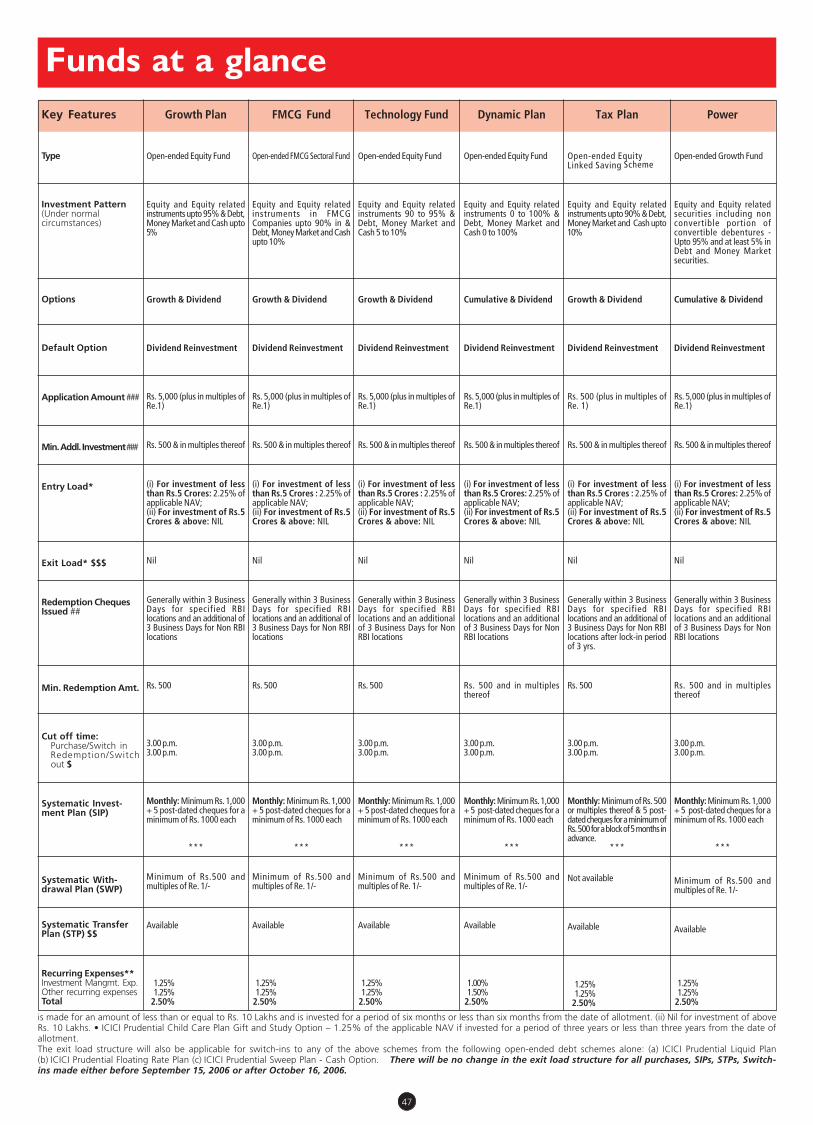
47
Funds at a glance
Key Features
Type
Investment Pattern(Under normalcircumstances)
Options
Default Option
Application Amount ###
Min. Addl. Investment ###
Entry Load*
Exit Load* $$$
Redemption ChequesIssued ##
Min. Redemption Amt.
Cut off time:Purchase/Switch inRedemption/Switchout $
Systematic Invest-ment Plan (SIP)
Systematic With-drawal Plan (SWP)
Systematic TransferPlan (STP) $$
Recurring Expenses**Investment Mangmt. Exp.Other recurring expensesTotal
FMCG Fund
Open-ended FMCG Sectoral Fund
Equity and Equity relatedinstruments in FMCGCompanies upto 90% in &Debt, Money Market and Cashupto 10%
Growth & Dividend
Dividend Reinvestment
Rs. 5,000 (plus in multiples ofRe.1)
Rs. 500 & in multiples thereof
(i) For investment of lessthan Rs.5 Crores : 2.25% ofapplicable NAV;(ii) For investment of Rs.5Crores & above: NIL
Nil
Generally within 3 BusinessDays for specified RBIlocations and an additional of3 Business Days for Non RBIlocations
Rs. 500
3.00 p.m.3.00 p.m.
Monthly: Minimum Rs. 1,000+ 5 post-dated cheques for aminimum of Rs. 1000 each
***
Minimum of Rs.500 andmultiples of Re. 1/-
Available
1.25%1.25%
2.50%
Technology Fund
Open-ended Equity Fund
Equity and Equity relatedinstruments 90 to 95% &Debt, Money Market andCash 5 to 10%
Growth & Dividend
Dividend Reinvestment
Rs. 5,000 (plus in multiples ofRe.1)
Rs. 500 & in multiples thereof
(i) For investment of lessthan Rs.5 Crores : 2.25% ofapplicable NAV;(ii) For investment of Rs.5Crores & above: NIL
Nil
Generally within 3 BusinessDays for specified RBIlocations and an additionalof 3 Business Days for NonRBI locations
Rs. 500
3.00 p.m.3.00 p.m.
Monthly: Minimum Rs. 1,000+ 5 post-dated cheques for aminimum of Rs. 1000 each
***
Minimum of Rs.500 andmultiples of Re. 1/-
Available
1.25%1.25%
2.50%
Dynamic Plan
Open-ended Equity Fund
Equity and Equity relatedinstruments 0 to 100% &Debt, Money Market andCash 0 to 100%
Cumulative & Dividend
Dividend Reinvestment
Rs. 5,000 (plus in multiples ofRe.1)
Rs. 500 & in multiples thereof
(i) For investment of lessthan Rs.5 Crores: 2.25% ofapplicable NAV;(ii) For investment of Rs.5Crores & above: NIL
Nil
Generally within 3 BusinessDays for specified RBIlocations and an additionalof 3 Business Days for NonRBI locations
Rs. 500 and in multiplesthereof
3.00 p.m.3.00 p.m.
Monthly: Minimum Rs. 1,000+ 5 post-dated cheques for aminimum of Rs. 1000 each
***
Minimum of Rs.500 andmultiples of Re. 1/-
Available
1.00%1.50%
2.50%
Power
Open-ended Growth Fund
Equity and Equity relatedsecurities including nonconvertible portion ofconvertible debentures -Upto 95% and at least 5% inDebt and Money Marketsecurities.
Cumulative & Dividend
Dividend Reinvestment
Rs. 5,000 (plus in multiples ofRe.1)
Rs. 500 & in multiples thereof
(i) For investment of lessthan Rs.5 Crores: 2.25% ofapplicable NAV;(ii) For investment of Rs.5Crores & above: NIL
Nil
Generally within 3 BusinessDays for specified RBIlocations and an additionalof 3 Business Days for NonRBI locations
Rs. 500 and in multiplesthereof
3.00 p.m.3.00 p.m.
Monthly: Minimum Rs. 1,000+ 5 post-dated cheques for aminimum of Rs. 1000 each
***
Minimum of Rs.500 andmultiples of Re. 1/-
Available
1.25%1.25%
2.50%
Growth Plan
Open-ended Equity Fund
Equity and Equity relatedinstruments upto 95% & Debt,Money Market and Cash upto5%
Growth & Dividend
Dividend Reinvestment
Rs. 5,000 (plus in multiples ofRe.1)
Rs. 500 & in multiples thereof
(i) For investment of lessthan Rs.5 Crores: 2.25% ofapplicable NAV;(ii) For investment of Rs.5Crores & above: NIL
Nil
Generally within 3 BusinessDays for specified RBIlocations and an additional of3 Business Days for Non RBIlocations
Rs. 500
3.00 p.m.3.00 p.m.
Monthly: Minimum Rs. 1,000+ 5 post-dated cheques for aminimum of Rs. 1000 each
***
Minimum of Rs.500 andmultiples of Re. 1/-
Available
1.25%1.25%
2.50%
Tax Plan
Open-ended EquityLinked Saving Scheme
Equity and Equity relatedinstruments upto 90% & Debt,Money Market and Cash upto10%
Growth & Dividend
Dividend Reinvestment
Rs. 500 (plus in multiples ofRe. 1)
Rs. 500 & in multiples thereof
(i) For investment of lessthan Rs.5 Crores : 2.25% ofapplicable NAV;(ii) For investment of Rs.5Crores & above: NIL
Nil
Generally within 3 BusinessDays for specified RBIlocations and an additional of3 Business Days for Non RBIlocations after lock-in periodof 3 yrs.
Rs. 500
3.00 p.m.3.00 p.m.
Monthly: Minimum of Rs. 500or multiples thereof & 5 post-dated cheques for a minimum ofRs. 500 for a block of 5 months inadvance.
***
Not available
Available
1.25%1.25%
2.50%
is made for an amount of less than or equal to Rs. 10 Lakhs and is invested for a period of six months or less than six months from the date of allotment. (ii) Nil for investment of aboveRs. 10 Lakhs. • ICICI Prudential Child Care Plan Gift and Study Option – 1.25% of the applicable NAV if invested for a period of three years or less than three years from the date ofallotment.The exit load structure will also be applicable for switch-ins to any of the above schemes from the following open-ended debt schemes alone: (a) ICICI Prudential Liquid Plan(b) ICICI Prudential Floating Rate Plan (c) ICICI Prudential Sweep Plan - Cash Option. There will be no change in the exit load structure for all purchases, SIPs, STPs, Switch-ins made either before September 15, 2006 or after October 16, 2006.

48
Key Features
Type
Investment Pattern(Under normalcircumstances)
Options
Default Option
Application Amount ###
Min. Addl. Investment ###
Entry Load*
Exit Load* $$$
Redemption ChequesIssued ##
Min. Redemption Amt.
Cut off time:Purchase/Switch inRedemption/Switch out $
Systematic InvestmentPlan (SIP)
Systematic WithdrawalPlan (SWP)
Systematic TransferPlan (STP) $$
Recurring Expenses**Investment Mangmt. Exp.Other recurring expensesTotal
SPIcE
An open-ended,exchange listed, indexlinked growth scheme
Securities comprisingthe SENSEX upto 100%& Upto 10% in Moneymarket instruments,convertible bonds &other securitiesincluding cash
–
–
One Unit (One unit =SENSEX/100)
One Unit (One unit =SENSEX/100)
Nil
NIL (In case there areno quotes on the BSE/DSE for five tradingdays consecutively, aninvestor can selldirectly to the fund atan exit load of 2.5% ofNAV)
Within 3 buisness days
One Unit (One unit =SENSEX/100)
3.00 p.m. during StockExchange WorkingHours
Not Available
Not Available
Not Available
1.00%
Index Fund
Open-ended Index LinkedGrowth Scheme
Equity stocks drawn from thecomponents of the S&P CNXNifty and the exchangetraded derivatives on the S&PCNX Nifty – upto 100%.Money Market instruments– upto 10%
Nifty
–
Rs.5,000 (plus multiples of Rs1000)
Rs.1000/-
1.00% of applicable NAV
Nil
Within 3 Business Days
Rs.1000
3.00 p.m.3.00 p.m.
Monthly/Quarterly: Mini-mum Rs.1,000/- + 5 post-datedcheques of Rs. 1,000/- each.Entry Load: Nil; Exit Load:0.5% of the applicable NAV,if the investment is redeemedwithin 1 year from the dateof allotment, Nil thereafter.
Minimum of Rs.1000 andmultiples of Re. 1/-
Available
0.70%0.55%
1.25%
Discovery Fund
Open-ended Equity Fund
Equity and Equity relatedsecurities - 80% to 100%and Cash & Money Mar-ket instruments - 0% to20%
Growth & Dividend
DividendReinvestment
Rs. 5,000 (plus inmultiples of Re.1)
Rs. 500 & in multiplesthereof
(1) For investment ofless than Rs. 5 Crores:Entry load at 2.25% ofapplicable Net Asset Value(NAV);(2) For investment ofRs.5 Crores and above:Entry load is Nil.
Nil
Within 3 Business Daysfor specified RBI loca-tions and an additional of3 Business Days for Non-RBI locations.
Rs.500
3.00 p.m.3.00 p.m.
Monthly: MinimumRs.1,000 + 5 post-datedcheques of Rs. 1,000each
***
Minimum of Rs.500 andmultiples of Re. 1/-
Available
1.25%1.25%
2.50%
Emerging S.T.A.R. (StocksTargeted At Returns)
Fund
Open-ended Equity Fund
Equity and Equity Linked Instruments -90% to 100% and Debt Securities, Cash& Money Market instruments - 0% to10%
Growth & Dividend
Dividend Reinvestment
Rs. 5,000 (plus in multiples of Re.1)
Rs. 500 & in multiples thereof
(1) For investment of less than Rs. 5Crores: Entry load at 2.25% of applicableNet Asset Value (NAV);(2) For investment of Rs.5 Crores andabove: Entry load is Nil.
The exit load structure for fresh andadditional purchases for amounts lessthan Rs. 5 crores (including switch-insfrom open ended debt schemes) madeby unitholders during the period May 1,2006 to May 31, 2006 will be – (i) 0.5%of the applicable NAV, if the amountsought to be redeemed or switched outis invested for a period of six months orless than six months from the date ofallotment; (ii) Nil, if the amount soughtto be redeemed or switched out isinvested for a period of more than sixmonths from the date of allotment. Thisload structure will be applicable onlyfor the purchases (including switch-insfrom open ended debt schemes) madeduring the period May 1, 2006 to May31, 2006. For all other purchases madeeither before May 1, 2006 or after May31, 2006 no exit load will be charged onthe redemptions or switch-outs made.
Within 3 Business Days from the dateof acceptance of Redemption requestat any of the Customer ServiceCentres.
Rs.500
3.00 p.m.3.00 p.m.
Monthly: Minimum Rs. 1,000 + 5 post-dated cheques of Rs. 1,000 each
***
Minimum of Rs.500 and multiples ofRe. 1/-
Available
2.50%
Infrastructure Fund
Open-ended Equity Fund
Equity and Equity relatedinstruments in Infrastructuresector 70% to 100% & debt,money market instrument -0% to 30%
Growth & Dividend
Dividend Reinvestment
Rs. 5,000 (plus in multiples ofRe.1)
Rs. 500 & in multiples thereof
(i) For all purchases of lessthan Rs. 5 Crore perTransaction: 2.25% ofapplicable NAV;(ii) For purchases of Rs.5Crore & above perTransaction : NIL
1) For investment madebefore 28-Nov-05:A) 1% of applicable NAV
if i) Amount originallyinvested per transactionis less than Rs.5 croresand Redemption madebefore completion of 6months from the date ofallotment of units.
B) Nil – if i) Originalinvestment is 5 crores ormore per transaction.Or ii) RedemptionRequest made on/after 6months from date ofallotment irrespective oforiginal investment.
2) Nil for investments madeon or after 28-Nov-05.
Generally within 3 Business Daysfor specified RBI locations andan additional of 3 Business Daysfor Non-RBI locations
Rs. 500
3.00 p.m.3.00 p.m.
Monthly: Minimum Rs. 1,000 +5 post-dated cheques for aminimum of Rs. 1000 each
***
Minimum of Rs.500 and multiplesof Re. 1/-
Available
1.25%1.25%2.50%
Services IndustriesFund
Open-ended Equity Fund
Equity and equity relatedinstruments in services sector70% to 100% & debt, moneymarket instruments - 0% to 30%
Growth & Dividend payout& Dividend Reinvestment
Dividend Reinvestment
Rs. 5000 per application and inmultiples of Re.1 thereafter
Rs. 500 per application and inmultiples of Re.1 thereafter
(i) For all purchases of lessthan Rs. 5 crore pertransaction:2.25% ofapplicable NAV;(ii) For all purchases of morethan Rs. 5 crore & above pertransaction:NIL
For investment made duringNew Fund Offer (NFO) Period:(i) 1% of applicable NAV ifamount originally invested pertransaction is less than Rs. 5crores and redemption madebefore completion of 6 monthsfrom the date of allotment.(ii) Nil if (a) Original investmentis 5 crores or more pertransaction and the redemptionrequest is made within 6 monthsor beyond; or (b) RedemptionRequest is made on/after 6months from the date ofallotment irrespective of anyamount invested.For investment made afterNFO Period: Nil
Generally within 3 business daysfor specified RBI locations andan additional 3 Business days forNon-RBI locations
Rs 500 and in multiples thereof
3.00 p.m.3.00 p.m.
Monthly:Minimum Rs. 1000 + 5Installment for a minimum of Rs.1000 each and in multiples of Re.1 thereafter
***
Available
Available
1.25%1.25%
2.50%
Funds at a glance

49
Funds at a glance
Key Features
Type
Investment Pattern(Under normal circumstances)
Options
Default Option
Sub-Options
Default Sub-Options
Min. Application Amount ###
Min. Addl. Investment ###
Entry Load*
Exit Load* $$$
Redemption Cheques Issued ##
Min. Redemption Amt.
Cut off time:Purchase/Switch inRedemption/Switch out $
Systematic InvestmentPlan (SIP)
Systematic Withdrawal Plan (SWP)
Systematic Transfer Plan (STP) $$
Recurring Expenses**Investment Mangmt. Exp.Other recurring expensesTotal
Equity & Derivatives FundIncome Optimiser Plan
Open-ended Equity Fund
65% to 80% in Equity and Equity Derivatives (equity unhedgedexposure limited to 5%), 20% to 35% in Debt instruments.
Retail Option and Institutional Option
Retail Option
Growth and Dividend with dividend payout and dividendreinvestment facilities.
Dividend Reinvestment
Retail Option: Rs.5,000 (plus in multiples of Re.1)Institutional Option: Rs.5 crores (plus in multiples of Re.1)
Rs.1,000/- (plus in multiples of Re.1/-)
Nil
i) 0.5% of the applicable NAV, if the investment is redeemedwithin a period of 6 months from the date of allotment.
ii) Nil – if the investment is redeemed after 6 months fromthe date of allotment.
Within 10 Business Days from the date of acceptance of atransaction request.
Rs. 500/-
3.00 p.m.3.00 p.m.
Retail Option (Monthly): Minimum Rs. 1,000 + 5 post-datedcheques for a minimum of Rs. 1000 each.Entry load for SIP & STP investments: NilExit load for SIP & STP investments:i) 0.5% of the applicable NAV, if the investment is redeemed
within a period of 6 months from the date of allotment.ii) Nil – if the investment is redeemed after 6 months from
the date of allotment.
Retail Option: Rs.500 and in multiples of Re. 1/- providedminimum balance should not fall below Rs.5000/-.
Available
1.25%1.25%2.50%
Equity & Derivatives FundWealth Optimiser Plan
Open-ended Equity Fund
65% to 100% in Equity and Equity Derivatives (equityunhedged exposure limited to 80%), 0% to 35% in Debtinstruments.
Regular Option
–
Growth and Dividend with dividend payout and dividendreinvestment facilities.
Dividend Reinvestment
Regular Option: Rs.5,000 (plus in multiples of Re.1)
Rs.1,000/- (plus in multiples of Re.1/-)
i) 2.25% of the applicable NAV, if the investment amountis less than Rs.5 crores
ii) Nil – for investment of Rs.5 crores and above.
i) 0.50% of the applicable NAV if redemption/switchouts ismade within 6 months from the date of investment.
ii) Nil for investment of Rs.5 crores and above and redeemedany time.
Within 10 Business Days from the date of acceptance of atransaction request.
Rs 500/-
3.00 p.m.3.00 p.m.
Regular Option (Monthly): Minimum Rs. 1000 + 5 post datedcheques for a minimum of Rs. 1000 each.Entry load for SIP & STP investments:i) 2.25% of the applicable NAV, if the investment amount is
less than Rs.5 crores.ii) Nil – if the iinvestment amount is Rs.5 crores or moreExit load for SIP & STP investments : Nil
Regular Option: Rs.500 and in multiples of Re. 1/- providedminimum balance should not fall below Rs.5000/-.
Available
1.25%1.25%2.50%
Statutory Details: ICICI Prudential Mutual Fund (erstwhile Prudential ICICI Mutual Fund) (the Fund) was set up as a Trust sponsored by Prudential plc (through its wholly owned subsidiary namely Prudential Corporation HoldingsLtd) and ICICI Bank Ltd. ICICI Prudential Trust Limited (erstwhile Prudential ICICI Trust Limited ) (Trust company) is the Trustee to the Fund and ICICI Prudential Asset Management Company Ltd. (erstwhile Prudential ICICI AssetManagement Company Limited) (AMC) is the Investment Manager to the Fund. ICICI Bank Ltd (ICICI Bank) and Prudential Plc (acting through its wholly owned subsidiary namely Prudential Corporation Holdings Ltd) are thepromoters of the AMC and the Trust Company. ICICI Bank currently holds 51% stake in both the companies and the balance 49% stake in both the companies is held by Prudential plc (acting through its wholly owned subsidiarynamely Prudential Holdings Corporation Ltd). Prudential Plc (acting through its wholly owned subsidiary namely Prudential Corporation Holdings Ltd) transferred 6% of its shareholding in both the companies to ICICI Bank w.e.f26th August 2005.Subsequently in accordance with the approval granted by the Board of Directors and the shareholders of the AMC and the Trust Company the name of the AMC has been changed to ICICI Prudential AssetManagement Company Limited and the name of the Trust Company has been changed to ICICI Prudential Trust Limited. SEBI has vide its letter no IMD/PM/84968/07 dated January 23, 2007 conveyed its no objection to the saidchange of names of the AMC & the Trust company. The said change of names has also been approved by the Registrar of Companies, NCT of Delhi & Haryana, Ministry of Company Affairs, Govt of India. The Board of Directorsof the Trust company have at their meeting held on 20th February 2007 accorded approval for the change of name of the Mutual Fund to ICICI Prudential Mutual Fund as well as of the various schemes /plans/options there under.SEBI has vide its Letter Nos IMD/PM/90168/07 & IMD/PM/90170/07 dated 2nd April 2007 accorded approval for the same. Risk Factors: Mutual Funds and securities investments are subject to market risks and there is no assuranceor guarantee that the objectives of the Schemes will be achieved. As with any securities investment, the NAV of the Units issued under the Schemes can go up or down, depending on the factors and forces affecting the capitalmarkets. Past performance of the Sponsors, AMC/Fund does not indicate the future performance of the Schemes of the Fund. The Sponsors are not responsible or liable for any loss resulting from the operation of the Schemes beyondthe contribution of an amount of Rs.22.2 lacs, collectively made by them towards setting up the Fund and such other accretions and additions to the corpus set up by the Sponsors. • ICICI Prudential Growth Plan^ (An open-ended equity fund. Objective is to generate long term capital appreciation), Entry Load: **, Exit Load: Nil; ICICI Prudential Income Plan (An open-ended Debt Fund. Objective is to generate income through investments indebt securities), Entry Load: Nil, Exit Load: For investment of less than or upto Rs. 10 Lakhs : 0.50% of applicable Net Asset Value (NAV) if the investment held for less than or equal to a period of 6 months; For investment of aboveRs. 10 Lakhs: Nil; ICICI Prudential Liquid Plan (An open-ended Liquid Income Fund. Objective is to generate reasonable returns while providing high levels of liquidity), Entry Load: Nil, Exit Load: Nil; ICICI Prudential FMCGFund^ (An open-ended FMCG Sectoral Fund. Objective is to generate long term capital appreciation through investments primarily in FMCG sector), Entry Load: **, Exit Load: Nil; ICICI Prudential Tax Plan^ (An open-endedEquity Linked Saving Scheme. Objective is to generate long term capital appreciation), Entry Load: **, Exit Load: Nil; ICICI Prudential Gilt Fund - Treasury Plan (An open-ended short-term Gilt Fund. Objective is to generateregular returns through investments made in gilts), Entry Load: Nil, Exit Load: Nil; ICICI Prudential Gilt Fund - Investment Plan (An open-ended medium-term Gilt Fund. Objective is to generate regular returns throughinvestments made in gilts), Entry Load: Nil, Exit Load: Nil; ICICI Prudential Balanced Fund^ (An open-ended Balanced Fund. Objective is to generate long term capital appreciation and current income), Entry Load: **, ExitLoad: Nil; ICICI Prudential Technology Fund^ (An open-ended Equity Fund. Objective is to generate long term capital appreciation), Entry Load: **, Exit Load: Nil; ICICI Prudential Monthly Income Plan (An open endedfund. Monthly income is not assured and is subject to the availability of distributable surplus) (Objective is to generate regular income through investments in fixed income securities), Entry Load: Nil, Exit Load: Forinvestment of less than or upto Rs. 10 Lakhs : 0.50% of applicable Net Asset Value (NAV) if the investment held for less than or equal to a period of 6 months; For investment of above Rs. 10 Lakhs : Nil; ICICI Prudential FixedMaturity Plan – Series 30 - 13 Months Plan (A close-ended Debt Fund. Objective is to generate regular returns by investing in a portfolio of fixed income securities/debt instruments normally maturing in line with the timeprofile of the Scheme), Entry Load: Nil, Exit Load: Nil - for redemptions made on Maturity, 2% of the applicable NAV for redemptions made during repurchase facility period; ICICI Prudential Hybrid Fixed Maturity Plan -13 months Plan (A close-ended Income Fund. The primary objective of the Scheme is to seek to generate regular returns by investing in a portfolio of fixed income securities/ debt instruments normally maturing in line with thetime profile of the Plan. The secondary objective of the Scheme is to generate long-term capital appreciation by investing a portion of the Scheme's assets in equity and equity related instruments), Entry Load: Nil, Exit Load: Nil- for redemptions made on Maturity, 2% of the applicable NAV for redemptions made during repurchase facility period; ICICI Prudential Fixed Maturity Plan – Series 34 - One Year Plan A, One Year Plan B, FifteenMonths Plan, Sixteen Months Plan, Seventeen Months Plan & Eighteen Months Plan (A close-ended Debt Fund. Objective of the Plan under the Scheme is seeking to generate regular returns by investing in a portfolio
Statutory Details & Risk Factors
Contd...

of fixed income securities/ debt instruments normally maturing in line with the time profile of the Plan.), Entry Load: Nil, Exit Load: Nil - for redemptions made on Maturity, 2% of the applicable NAV for redemptions made duringrepurchase facility period; ICICI Prudential Fixed Maturity Plan - Series 35 – Thirteen Months Plan A & Thirteen Months Plan B, One Year Plan (A close-ended Debt Fund. Objective of the Plan under the Schemeis seeking to generate regular returns by investing in a portfolio of fixed income securities/debt instruments normally maturing in line with the time profile of the Plan. Entry Load: Nil, Exit Load: Nil - for redemptions madeon Maturity, 2% of the applicable NAV for redemptions made during repurchase facility period); ICICI Prudential Fixed Maturity Plan - Series 37 – Fourteen Months Plan, One Year Plan - A (A close-ended Debt Fund.Objective of the Plan under the Scheme is seeking to generate regular returns by investing in a portfolio of fixed income securities/ debt instruments normally maturing in line with the time profile of the Plan. Entry Load:Nil, Exit Load: Nil - for redemptions made on Maturity, 2% of the applicable NAV for redemptions made during repurchase facility period); ICICI Prudential Fixed Maturity Plan - Series 37 – Three Months Plan A & ThreeMonths Plan B (A close-ended Debt Fund. Objective of the Plan under the Scheme is seeking to generate regular returns by investing in a portfolio of fixed income securities/ debt instruments normally maturing in linewith the time profile of the Plan. Entry Load: Nil, Exit Load: Nil - for redemptions made on Maturity, 1% of the applicable NAV for redemptions made during repurchase facility period); ICICI Prudential Fixed Maturity Plan- Series 37 – Three Months Plus Plan A (A close-ended Debt Fund. Objective of the Plan under the Scheme is seeking to generate regular returns by investing in a portfolio of fixed income securities/ debt instrumentsnormally maturing in line with the time profile of the Plan. Entry Load: Nil, Exit Load: Nil - for redemptions made on Maturity, 1% of the applicable NAV for redemptions made during repurchase facility period); ICICI PrudentialFixed Maturity Plan - Series 34 – Six Months Plan (A close-ended Debt Fund. Objective of the Plan under the Scheme is seeking to generate regular returns by investing in a portfolio of fixed income securities/ debtinstruments normally maturing in line with the time profile of the Plan. Entry Load: Nil, Exit Load: Nil - for redemptions made on Maturity, 1% of the applicable NAV for redemptions made during repurchase facility period);ICICI Prudential Fixed Maturity Plan - Series 38 –Three Months Plan A, Three Months Plan B & Three Months Plan C – (A close-ended Debt Fund. Objective of the Plan under the Scheme is seeking to generateregular returns by investing in a portfolio of fixed income securities/ debt instruments normally maturing in line with the time profile of the Plan), Entry Load: Nil, Exit Load: Nil - for redemptions made on Maturity, 1% of the applicableNAV for redemptions made during repurchase facility period; ICICI Prudential Fixed Maturity Plan - Series 38 –One Year Plan A – (A close-ended Debt Fund. Objective of the Plan under the Scheme is seeking to generateregular returns by investing in a portfolio of fixed income securities/ debt instruments normally maturing in line with the time profile of the Plan), Entry Load: Nil, Exit Load: Nil - for redemptions made on Maturity, 2% of the applicableNAV for redemptions made during repurchase facility period; ICICI Prudential Child Care Plan (Study Plan: An open-ended fund. Objective is to generate income by creating a portfolio that is invested in debt, money marketinstruments and equity and equity related securities. Gift Plan: An open-ended Fund. Objective is to generate capital appreciation by creating a portfolio that is invested in equity and equity related securities and debt and moneymarket instruments), Entry Load for both the plans are 1.50%. The Exit Load for both the Plans are 1%, if investment is redeemed within 3 years. (2) Nil, if investment is redeemed after 3 years but before the Unitholder attainsthe age of 18; ICICI Prudential Power^ (An open-ended Growth Fund. Objective is to generate long term capital appreciation through investments in core sectors & associated feeder industries), Entry Load: **, Exit Load:Nil; ICICI Prudential Short Term Plan (An open-ended Income Fund. Objective is to generate Income through investments in debt securities) Entry Load: Nil, Exit Load: Nil; ICICI Prudential Long Term Plan (An open-endedIncome Fund. Objective is to generate income through investment in range of debt and money market instruments while maintaining optimum balance of yield, safety and liquidity), Entry Load: Nil, Exit Load: Nil; ICICI PrudentialSweep Plan (An open-ended Liquid Fund. Objective is to provide reasonable returns, commensurate with low risk while providing a high level of liquidity, through investments made primarily in money market and debt securities),Entry Load: Nil, Exit Load: Nil; ICICI Prudential Index Fund (An open-ended index linked Growth Scheme. Objective is track the returns of S&P CNX Nifty Index through investment in stocks drawn from constituents of Nifty),Entry Load: 1% of the Applicable NAV, Exit Load: NI; ICICI Prudential Flexible Income Plan (An open-ended Income Fund. Objective is to generate income through investments in a range of debt instruments and money marketinstruments of various maturities with a view to maximising income while maintaining the optimum balance of yield, safety and liquidity) Entry Load: Nil, Exit Load: Investments made: (a) before July 24, 06 - Nil (b) on or afterJuly 24, 2006 - 0.50% of the applicable NAV, if the redemption is made within one month from the date of investment. Investment made on or after March 28, 2007 - 0.25% of the applicable NAV, if the redemption/switch-out is made within 10 days from the date of investment; ICICI Prudential Dynamic Plan^ (An open-ended Equity Fund. Objective is to generate capital appreciation by actively investing in equity and equity related securitiesand for defensive consideration in debt / money market instruments), Entry Load: **, Exit Load: Nil; SENSEX Prudential ICICI Exchange Traded Fund (“SPIcE”) (An open-ended exchange listed, index linked growth scheme.Objective is to provide the investment returns that closely corresponds to the total return of securities as represented by the SENSEX). Entry Load: Nil, Exit Load: 2.5% of applicable NAV in case of no quotes on the BSE for fivetrading days consecutively and an investor redeeming directly from the Fund; ICICI Prudential Floating Rate Plan – Option A, B, C & D (An open-ended income fund. Objective is to generate income consistent with the prudentrisk from a portfolio comprising substantially of floating rate debt instruments, fixed rate debt instruments swapped for floating rate return, and also fixed rate instruments and money market instruments) Entry Load : Nil, ExitLoad: For all investments made on or after April 24, 2007, an exit load of 0.25% of the applicable NAV if the redumption/switch-out is made within 10 days from the date of investment. ICICI Prudential Advisor Series(An open-ended asset allocation fund, which is of the nature of Fund of Funds, comprising there under five investment Plans, with a primary objective to generate returns through investment in underlying schemes of ICICI PrudentialMutual Fund) Entry Load: For ICICI Prudential Very Cautious Plan and ICICI Prudential Cautious Plan is Nil and for ICICI Prudential Moderate Plan, ICICI Prudential Aggressive Plan and ICICI Prudential Very Aggressive Plan, theEntry Load is 1%, 1.50% and 1.75% respectively, Exit Load: Nil, Further, for investments by the Fund of Funds scheme, in underlying schemes of ICICI Prudential Mutual Fund, there would not be any entry load / exit load. ICICIPrudential Gilt Fund Investment Plan - PF Option (An open-ended Medium Term Gilt Fund. Objective is to generate income through investments in Gilts of various maturities) Entry Load: Nil, Exit load : 0.60% of a NAVin case the amount sought to be redeemed is not being invested under the Plan for a minimum period of 365 days, ICICI Prudential Gilt Fund Treasury - PF Option (An open-ended Gilt Fund. Objective is to generate incomethrough investments in Gilts of various maturities) Entry Load: Nil, Exit load: 0.80% of a NAV in case the amount sought to be redeemed is not being invested under the Plan for a minimum period of 365 day; ICICI PrudentialIncome Multiplier Fund (An open-ended debt fund which invests upto 30% in equity. Objective is to generate long-term capital appreciation from a portfolio that is invested predominantly in debt and money market securitiesand the balance in equity and equity related securities) Entry Load: Nil, Exit Load: (i) 1% - For investments of less than Rs. 5 crores and if the investments are held for less than a period of 12 months; (ii) No Exit Load for investmentsof Rs. 5 crores and above; ICICI Prudential Discovery Fund^ (An open-ended Equity Fund. Objective is to generate returns through a combination of dividend income and capital appreciation by investing primarily in a well-diversified portfolio of value stocks) Entry Load: **, Exit Load: Nil; ICICI Prudential Long Term Floating Rate Plan – Option A, B & C (An open-ended Income Fund. Objective is to generate income through investmentsin a range of debt and money market instruments of various maturities with a view to maximizing income while maintaining the optimum balance of yield, safety and liquidity) Entry Load : Nil, Exit Load : Nil for Options B andC and for Option A - 0.50% for investments of less than or equal to Rs. 1 Crore and redemption is made on or before the completion of six months from the date of allotment of units; ICICI Prudential Emerging S.T.A.R. (StocksTargeted At Returns) Fund^ (An open-ended Equity Fund. Primary objective is to generate capital appreciation by actively investing in diversified mid cap stocks. The scheme will invest primarily in companies that have a marketcapitalisation between 100 crores and 2000 crores.) Entry Load: **, Exit Load: The exit load structure for fresh and additional purchases for amounts less than Rs. 5 crores (including switch-ins from open ended debt schemes)made by unitholders during the period May 1, 2006 to May 31, 2006 will be – (i) 0.5% of the applicable NAV, if the amount sought to be redeemed or switched out is invested for a period of six months or less than six months fromthe date of allotment; (ii) Nil, if the amount sought to be redeemed or switched out is invested for a period of more than six months from the date of allotment. This load structure will be applicable only for the purchases (includingswitch-ins from open ended debt schemes) made during the period May 1, 2006 to May 31, 2006. For all other purchases made either before May 1, 2006 or after May 31, 2006 no exit load will be charged on the redemptions orswitch-outs made; ICICI Prudential Blended Plan (An open ended fund investing in a blend of equity, derivatives, debt and money market instruments under two Plans viz. Plan A and Plan B. Objective of Plan A under the schemeis to provide capital appreciation and income distribution to unitholders by investing in equity & equity related securities including derivatives and the balance portion in debt securities. Objective of Plan B under the scheme isto provide capital appreciation and income distribution to unitholders by investing predominantly in debt securities and the balance portion in equity & equity related securities including derivatives. Entry Load: Nil. Exit Load: Underboth the Plans viz., Plan A and Plan B, in case the amount sought to be redeemed is not invested by the investor for a period of 30 days from the date of allotment, an exit load @ 0.50% of applicable NAV will be imposed.); ICICIPrudential Infrastructure Fund^ (An open-ended equity scheme. Objective is to generate capital appreciation and income distribution to unitholders by investing predominantly in equity/equity related securities of thecompanies belonging to the infrastructure industries and balance in debt securities and money market instruments including call money), Entry Load: For all purchases of less than Rs.5 crore per transaction - 2.25% of applicableNAV, For Purchases of Rs.5 crores and above per transaction - Nil, Exit Load: For Investments made before November 28, 2005 - (i) If the amount originally invested per transaction is less than Rs. 5 crores and the redemptionrequest is made before completion of 6 months from the date of allotment of units - 1.00%, (ii) If the amount originally invested per transaction is Rs. 5 crores or more and whether the redemption is sought within 6 months orbeyond; or Any amount invested, for which the redemption request is made on or after the completion of 6 months from the date of allotment of units - No exit load; For investments made from November 28, 2005 onwards: Noexit load will be charged for investments made under the Scheme on or after November 28, 2005 irrespective of the amount invested; ICICI Prudential Services Industries Fund (PISIF)^ (An open-ended equity Scheme.Objective: to generate capital appreciation and income distribution to unitholders by investing predominantly in equity/equity related securities of the companies belonging to the service industry and balance in debt securitiesand money market instruments including call money), Entry Load: For all purchases of less than Rs.5 crore per transaction - 2.25% of applicable NAV, For Purchases of Rs. 5 crores and above per transaction - Nil; Exit Load: ForInvestments made during the New Fund Offering period: (i) 1% - If the amount originally invested per transaction is less than Rs. 5 crores and the redemption request is made before completion of 6 months from the date of allotmentof units. (ii) Nil - If the amount originally invested per transaction is Rs. 5 crores or more and whether the redemption is sought within 6 months or beyond; or Any amount invested, for which the redemption request is made onor after the completion of 6 months from the date of allotment of units. For investments made after New Fund Offer: Nil; ICICI Prudential Fusion Fund (A close-ended diversified equity scheme, with a maturity period of 5years, that seeks to generate long-term capital appreciation by investing predominantly in equity and equity related instruments of companies across large, mid and small market capitalization. Entry Load: Nil, Exit Load: For theredemptions made before the maturity date of the Scheme i.e. redemptions made during the repurchase facility period, the following exit load structure will be applicable: (i) 5% of the applicable NAV, if the amount sought tobe redeemed is invested for a period of one year or less than one year from the date of allotment; (ii) 4% of the applicable NAV, if the amount sought to be redeemed is invested for a period more than one year but less than orequal to two years from the date of allotment; (iii) 3% of the applicable NAV, if the amount sought to be redeemed is invested for a period of more than two years but less than or equal to three years from the date of allotment;(iv) 2% of the applicable NAV, if the amount sought to be redeemed is invested for a period of more than three years but less than or equal to four years from the date of allotment; (v) 1% of the applicable NAV, if the amountsought to be redeemed is invested for a period of more than four years from the date of allotment but redeemed before the date of maturity of the Scheme; ICICI Prudential Equity & Derivatives Fund – Income OptimiserPlan [An open-ended equity fund. Objective is to seek to generate low volatility returns by using arbitrage and other derivative strategies in equity markets and investments in short-term debt portfolio. Entry Load (inluding SIP/STP investments): Nil, Exit Load (inluding SIP/STP investments w.e.f. 5/01/07): (i) 0.5% of the applicable NAV, if the investment is redeemed within a period of 6 months from the date of allotment. (ii) Nil – if the investment is redeemedafter 6 months from the date of allotment]; ICICI Prudential Equity & Derivatives Fund – Wealth Optimiser Plan [An open-ended equity fund. Objective is to seek to provide capital appreciation and income distribution tothe investors by using equity derivatives strategies, arbitrage opportunities and pure equity investments. Entry Load (inluding SIP/STP investments): (i) 2.25% of the applicable NAV, if the investment amount is less than Rs.5 crores.(ii) Nil – for investment of Rs.5 crores and above. Exit Load: 0.5% of the applicable NAV, if the redemption/switch-out is made within 6 months from the date of investment, Nil for the investment of Rs.5 crores and above and redeemedat any time (Exit Load for SIP/STP investment is Nil)]; ICICI Prudential Fusion Fund Series – II [A close-ended diversified equity Scheme, with a maturity period of 3 years, that seeks to generate long-term capitalappreciation by investing predominantly in equity and equity related instruments of companies across large, mid and small market capitalization. Asset Allocation Pattern: Equity & equity related securities – 70% to 100%,Debt & Money Market Instruments* (including cash and cash equivalent) – 0 to 30%]. Entry Load: Nil, Exit Load: No exit load will be charged. However, being a close-ended Scheme, for redemptions made before theMaturity Date of the Scheme, i.e. redemptions made during the repurchase facility period, the AMC will redeem the units after recovering the balance proportionate unamortized new fund offer expenses in accordancewith SEBI Circular dated April 4, 2006. These are the names of the Schemes and do not in any manner indicate either the quality of the Schemes or their future prospects and returns. ** Entry Load for all the Equity Funds:(i) For investment of less than Rs.5 crores is 2.25% of applicable NAV; (ii) For investment of Rs.5 crores and above is Nil. No entry load will be payable in respect of switch transaction from one equity scheme of ICICI Prudentialto another equity scheme of ICICI Prudential. Further, for investments by a Fund of Funds Scheme(s) in various schemes of ICICI Prudential Mutual Fund, there would not be any entry load / exit load charged by the underlying schemes.^ For SIP & STP Investments: Entry load of 2.25% of the applicable NAV will be charged on the amount invested under the scheme(s). Exit Load: Nil. Exceptions: For all SIP and STP investments registered under
ICICI Prudential Power and ICICI Prudential Discovery Fund from June 21, 2006 to July 31, 2006: (i) If redemptions are made from June 21, 2006 to July 5, 2006 no exit load shall be charged; (ii) If redemptions aremade after July 5, 2006 but on or before the end of six months from the date of investment of each installment of SIP/STP investment, an exit load of 0.5% shall be charged. Load Structure on SIP & STP investments underthe following schemes are as follows: • ICICI Prudential Child Care Plan (Gift Plan & Study Plan) – Entry Load: 1.50% of applicable NAV. Exit Load: 1.00% of Applicable NAV if the investment is redeemed within3 years from the date of allotment, Nil thereafter • ICICI Prudential Moderate Plan – Entry Load: 1% of applicable NAV; Exit Load: Nil • ICICI Prudential Aggressive Plan – Entry Load: 1% of applicable NAV; ExitLoad: 0.5% of the applicable NAV, if the units are redeemed before completion of 2 years from the date of allotment • ICICI Prudential Very Aggressive Plan – Entry Load: 1% of applicable NAV; Exit Load: 0.75% ofthe applicable NAV, if the units are redeemed before completion of 2 years from the date of allotment • ICICI Prudential Index Fund – Entry Load: Nil; Exit Load: 0.5% of the applicable NAV, if the investment is redeemedwithin 1 year from the date of allotment, Nil thereafter • No entry or exit load will be charged on the SIP investments under ICICI Prudential Flexible Income Plan, ICICI Prudential Long Term Plan, ICICI Prudential Income Plan,ICICI Prudential Monthly Income Plan, ICICI Prudential Income Multiplier Fund, ICICI Prudential Very Cautious Plan and ICICI Prudential Cautious Plan. Exit Load for fresh and additional purchases (including SIPs and STPs) madein the schemes given hereinbelow during September 15, 2006 to October 16, 2006, the following will be applicable: • ICICI Prudential Power, ICICI Prudential Dynamic Plan, ICICI Prudential Discovery Plan, ICICI PrudentialBalanced Fund – (i) 0.50% of the applicable NAV if the investment is made for an amount of less than Rs. 5 crores and is invested for a period of six months or less than six months from the date of allotment. (ii) Nil for investmentof Rs. 5 crores and above. • ICICI Prudential Income Multiplier Plan – (i) 1.25% of the applicable NAV if the investment is made for an amount of less than Rs. 5 crores and is invested for a period of less than twelve months fromthe date of allotment. (ii) Nil for investment of Rs. 5 crores and above. • ICICI Prudential Monthly Income Plan – (i) 0.75% of the applicable NAV if the investment is made for an amount of less than or equal to Rs. 10 Lakhs andis invested for a period of six months or less than six months from the date of allotment. (ii) Nil for investment of above Rs. 10 Lakhs. • ICICI Prudential Child Care Plan Gift and Study Option – 1.25% of the applicable NAV if investedfor a period of three years or less than three years from the date of allotment. The exit load structure will also be applicable for switch-ins to any of the above schemes from the following open-ended debt schemes alone: (a) ICICIPrudential Liquid Plan (b) ICICI Prudential Floating Rate Plan (c) ICICI Prudential Sweep Plan - Cash Option. There will be no change in the exit load structure for all purchases, SIPs, STPs, Switch-ins made eitherbefore September 15, 2006 or after October 16, 2006.
ICICI Prudential Mutual Fund Corporate Office(Erstwhile Prudential ICICI Mutual Fund)
Peninsula Tower, 8th Floor, Peninsula Corporate Park, Ganpatrao Kadam Marg, Off. Senapati Bapat Marg,Lower Parel, Mumbai – 400 013. Telephone No.: 022-24997000 Fax No.: 022-2499 7029
Website: www.icicipruamc.com E-mail: [email protected]

