assignment classification table (by...
TRANSCRIPT
Copyright © 2011 John Wiley & Sons, Inc. Kieso, IFRS, 1/e, Solutions Manual (For Instructor Use Only) 9-1
CHAPTER 9Inventories: Additional Valuation Issues
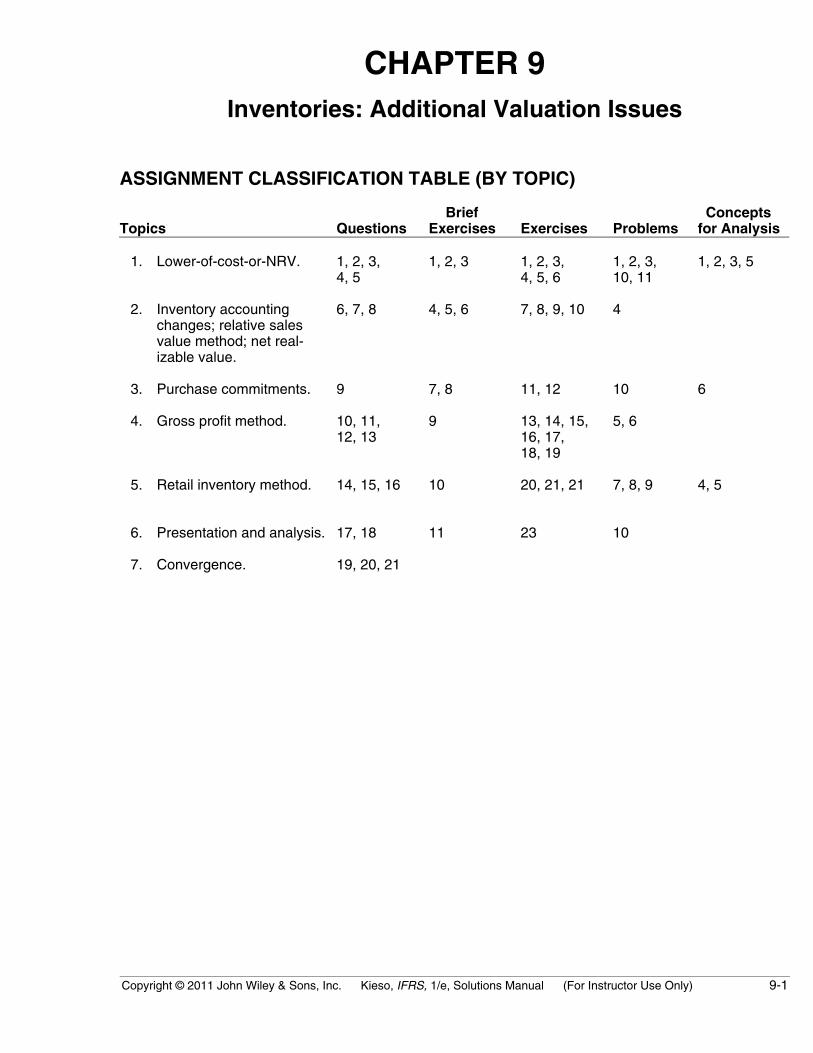
ASSIGNMENT CLASSIFICATION TABLE (BY TOPIC)
Topics QuestionsBrief
Exercises Exercises Problems Conceptsfor Analysis
1. Lower-of-cost-or-NRV. 1, 2, 3,4, 5
1, 2, 3 1, 2, 3,4, 5, 6
1, 2, 3,10, 11
1, 2, 3, 5
2. Inventory accountingchanges; relative salesvalue method; net real-izable value.
6, 7, 8 4, 5, 6 7, 8, 9, 10 4
3. Purchase commitments. 9 7, 8 11, 12 10 6
4. Gross profit method. 10, 11,12, 13
9 13, 14, 15,16, 17,18, 19
5, 6
5. Retail inventory method. 14, 15, 16 10 20, 21, 21 7, 8, 9 4, 5
6. Presentation and analysis. 17, 18 11 23 10
7. Convergence. 19, 20, 21
9-2 Copyright © 2011 John Wiley & Sons, Inc. Kieso, IFRS, 1/e, Solutions Manual (For Instructor Use Only)
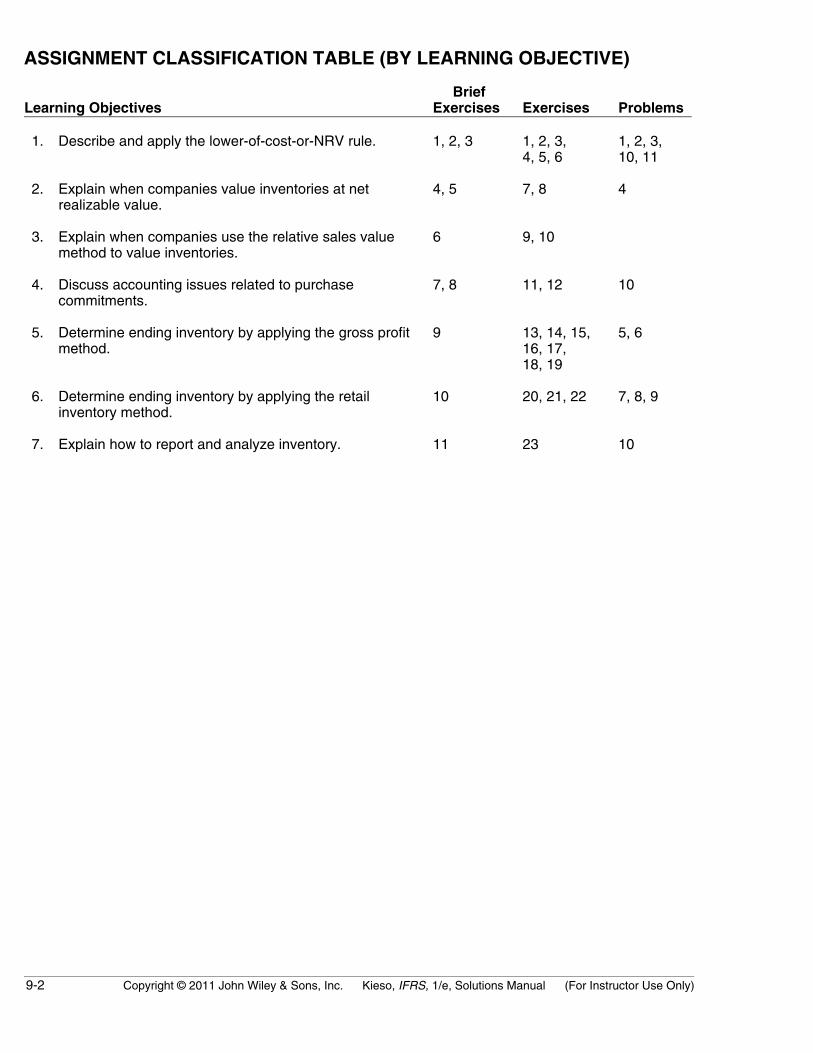
ASSIGNMENT CLASSIFICATION TABLE (BY LEARNING OBJECTIVE)
Learning Objectives BriefExercises Exercises Problems
1. Describe and apply the lower-of-cost-or-NRV rule. 1, 2, 3 1, 2, 3,4, 5, 6
1, 2, 3,10, 11
2. Explain when companies value inventories at netrealizable value.
4, 5 7, 8 4
3. Explain when companies use the relative sales valuemethod to value inventories.
6 9, 10
4. Discuss accounting issues related to purchasecommitments.
7, 8 11, 12 10
5. Determine ending inventory by applying the gross profitmethod.
9 13, 14, 15,16, 17,18, 19
5, 6
6. Determine ending inventory by applying the retailinventory method.
10 20, 21, 22 7, 8, 9
7. Explain how to report and analyze inventory. 11 23 10

Copyright © 2011 John Wiley & Sons, Inc. Kieso, IFRS, 1/e, Solutions Manual (For Instructor Use Only) 9-3
ASSIGNMENT CHARACTERISTICS TABLE
Item DescriptionLevel ofDifficulty
Time(minutes)
E9-1 LCNRV. Simple 15–20 E9-2 LCNRV. Simple 10–15 E9-3 LCNRV. Simple 15–20 E9-4 LCNRV—journal entries. Simple 10–15 E9-5 LCNRV—valuation account. Moderate 20–25 E9-6 LCNRV—error effect. Simple 10–15 E9-7 Valuation at net realizable value. Simple 10-15 E9-8 Valuation at net realizable value. Simple 10-15 E9-9 Relative sales value method. Simple 15–20 E9-10 Relative sales value method. Simple 12–17 E9-11 Purchase commitments. Simple 05–10 E9-12 Purchase commitments. Simple 15–20 E9-13 Gross profit method. Simple 8–13 E9-14 Gross profit method. Simple 10–15 E9-15 Gross profit method. Simple 15–20 E9-16 Gross profit method. Moderate 15–20 E9-17 Gross profit method. Simple 10–15 E9-18 Gross profit method. Simple 15–20 E9-19 Gross profit method. Moderate 20–25 E9-20 Retail inventory method. Moderate 20–25 E9-21 Retail inventory method. Simple 12–17 E9-22 Retail inventory method. Simple 20–25 E9-23 Analysis of inventories. Simple 10–15
P9-1 LCNRV. Simple 10–15 P9-2 LCNRV. Moderate 25–30 P9-3 LCNRV—Cost-of-goods-sold and Loss. Moderate 30–35 P9-4 Valuation at net realizable value. Simple 15-20 P9-5 Gross profit method. Moderate 20–30 P9-6 Gross profit method. Complex 40–45 P9-7 Retail inventory method. Moderate 20–30 P9-8 Retail inventory method. Moderate 20–30
9-4 Copyright © 2011 John Wiley & Sons, Inc. Kieso, IFRS, 1/e, Solutions Manual (For Instructor Use Only)
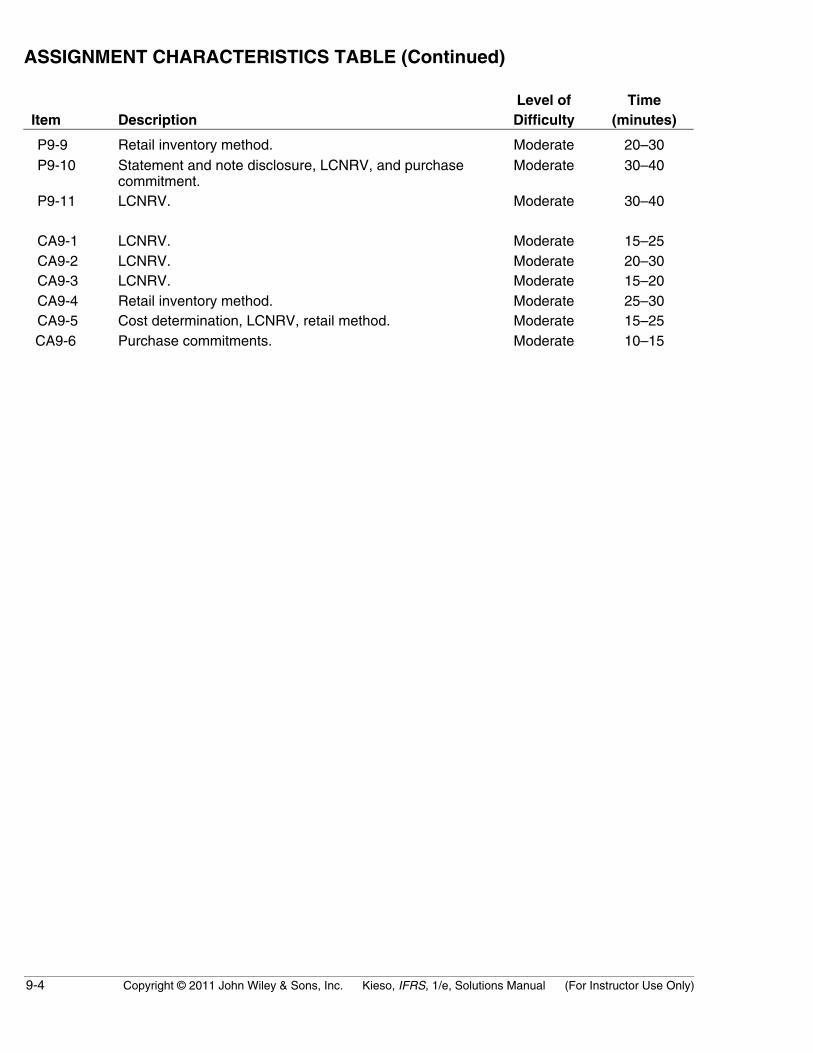
ASSIGNMENT CHARACTERISTICS TABLE (Continued)
Item DescriptionLevel ofDifficulty
Time(minutes)
P9-9 Retail inventory method. Moderate 20–30 P9-10 Statement and note disclosure, LCNRV, and purchase
commitment.Moderate 30–40
P9-11 LCNRV. Moderate 30–40
CA9-1 LCNRV. Moderate 15–25 CA9-2 LCNRV. Moderate 20–30 CA9-3 LCNRV. Moderate 15–20 CA9-4 Retail inventory method. Moderate 25–30 CA9-5 Cost determination, LCNRV, retail method. Moderate 15–25 CA9-6 Purchase commitments. Moderate 10–15

Copyright © 2011 John Wiley & Sons, Inc. Kieso, IFRS, 1/e, Solutions Manual (For Instructor Use Only) 9-5
ANSWERS TO QUESTIONS
1. Where there is evidence that the utility of goods to be disposed of in the ordinary course ofbusiness will be less than cost, the difference should be recognized as a loss in the current period,and the inventory should be stated at net realizable value in the financial statements.
2. The usual basis for carrying forward the inventory to the next period is cost. Departure from cost isrequired; however, when the utility of the goods included in the inventory is less than their cost.This loss in utility should be recognized as a loss of the current period, the period in which itoccurred. Furthermore, the subsequent period should be charged for goods at an amount thatmeasures their expected contribution to that period. In other words, the subsequent period shouldbe charged for inventory at prices no higher than those which would have been paid if theinventory had been obtained at the beginning of that period. (Historically, the lower-of-cost-or-netrealizable value rule arose from the accounting convention of providing for all losses andanticipating no profits.)
In accordance with the foregoing reasoning, the rule of “cost or net realizable value, whichever islower” may be applied to each item in the inventory, to the total of the components of each majorcategory, or to the total of the inventory, whichever most clearly reflects operations. The rule isusually applied to each item, but if individual inventory items enter into the same category orcategories of finished product, alternative procedures are suitable.
The arguments against the use of the lower-of-cost-or-net realizable value method of valuinginventories include the following:(a) The method requires the reporting of estimated losses (all or a portion of the excess of actual
cost over net realizable value) as definite income charges even though the losses have notbeen sustained to date and may never be sustained. Under a consistent criterion ofrealization a drop in net realizable value below original cost is no more a sustained loss thana rise above cost is a realized gain.
(b) A price shrinkage is brought into the income statement before the loss has been sustainedthrough sale. Furthermore, if the charge for the inventory write-downs is not made to a specialloss account, the cost figure for goods actually sold is inflated by the amount of the estimatedshrinkage in price of the unsold goods. The title “Cost of Goods Sold” therefore becomes amisnomer.
(c) The method is inconsistent in application in a given year because it recognizes the proprietyof implied price reductions but gives no recognition in the accounts or financial statements tothe effect of the price increases.
(d) The method is also inconsistent in application in one year as opposed to another because theinventory of a company may be valued at cost in one year and at net realizable value in thenext year.
(e) The lower-of-cost-or-net realizable value method values the inventory in the statement offinancial position conservatively. Its effect on the income statement, however, may be theopposite. Although the income statement for the year in which the unsustained loss is taken isstated conservatively, the net income on the income statement of the subsequent period maybe distorted if the expected reductions in sales prices do not materialize.
3. The lower-of-cost-or-net realizable value rule may be applied directly to each item or to the total ofthe inventory (or in some cases, to the total of the components of each major category). Themethod should be the one that most clearly reflects income. The most common practice is to pricethe inventory on an item-by-item basis. Companies favor the individual item approach because taxrequirements in some countries require that an individual item basis be used unless it involvespractical difficulties. In addition, the individual item approach gives the most conservative valuationfor balance sheet purposes.

9-6 Copyright © 2011 John Wiley & Sons, Inc. Kieso, IFRS, 1/e, Solutions Manual (For Instructor Use Only)
Questions Chapter 9 (Continued)
4. (1) $12.80.(2) $16.10.(3) $13.00.(4) $9.20.(5) $15.90.
5. One approach is to record the inventory at cost and then reduce it to net realizable value, therebyreflecting a loss in the current period (often referred to as the loss method). The loss would thenbe shown as a separate item in the income statement and the cost of goods sold for the yearwould not be distorted by its inclusion. An objection to this method of valuation is that aninconsistency is created between the income statement and balance sheet. Companies may recordthe adjustment either directly to the Inventory account or use the Allowance to Reduce Inventory toMarket which is a contra account against inventory on the statement of financial position.
Another approach is merely to substitute market for cost when pricing the new inventory (oftenreferred to as the cost of goods sold method). Such a procedure increases cost of goods sold bythe amount of the loss and fails to reflect this loss separately. For this reason, many theoreticalobjections can be raised against this procedure.
6. An exception to the normal recognition rule occurs where the inventory consists of (1) agriculturalassets, and (2) commodities held by borker-traders. Some minerals and minerals products may bevalued at NRV.
7. (a) Biological assets are measured on initial recognition and at the end of each reporting period atfair value less costs to sell (NRV). Companies record a gain or loss due to changes in theNRV of biological assets in income when it arises.
(b) Agricultural produce (which are harvested from biological assets) are measured at fair valueless costs to sell (NRV) at the point of harvest. Once harvested, the NRV of the agriculturalproduce becomes its cost and this asset is accounted for similar to other inventories held forsale in the normal course of business.
8. Relative sales value is an appropriate basis for pricing inventory when a group of varying units ispurchased at a single lump-sum price (basket purchase). The purchase price must be allocated insome manner or on some basis among the various units. When the units vary in size, character,and attractiveness, the basis for allocation must reflect both quantitative and qualitative aspects. Asuitable basis then is the relative sales value of the units that comprise the inventory.
9. The drop in the market price of the commitment should be charged to operations in the current yearif it is material in amount. The following entry would be made [(£6.20 – £5.90) X 150,000] = £45,000:
Unrealized Holding Gain or Loss—Income (Purchase Commitments)............ 45,000Purchase Commitment Liability.................................................................. 45,000
The entry is made because a loss in utility has occurred during the period in which the marketdecline took place. The account credited in the above entry should be included among the currentliabilities on the statement of financial position with an appropriate note indicating the nature andextent of the commitment. This liability indicates the minimum obligation on the commitmentcontract at the present time—the amount that would have to be forfeited in case of breach ofcontract.
10. The major uses of the gross profit method are: (1) it provides an approximation of the endinginventory which the auditor might use for testing validity of physical inventory count; (2) it meansthat a physical count need not be taken every month or quarter; and (3) it helps in determiningdamages caused by casualty when inventory cannot be counted.

Copyright © 2011 John Wiley & Sons, Inc. Kieso, IFRS, 1/e, Solutions Manual (For Instructor Use Only) 9-7
Questions Chapter 9 (Continued)
11. Gross profit as a percentage of sales indicates that the margin is based on selling price rather thancost; for this reason the gross profit as a percentage of selling price will always be lower than ifbased on cost. Conversions are as follows:
25% on cost = 20% on selling price33 1/3% on cost = 25% on selling price33 1/3% on selling price = 50% on cost60% on selling price = 150% on cost
12. A markup of 25% on cost equals a 20% markup on selling price; therefore, gross profit equals$1,000,000 ($5 million X 20%) and net income equals $250,000 [$1,000,000 – (15% X $5 million)].
The following formula was used to compute the 20% markup on selling price:
Percentage markup on cost .25Gross profit on selling price =100% + Percentage markup on cost
=1 + .25
= 20%
13. Inventory, January 1, 2011.................................................................................. $ 400,000Purchases to February 10, 2011........................................................................ $1,140,000Freight-in to February 10, 2011 .......................................................................... 60,000 1,200,000
Merchandise available................................................................................. 1,600,000Sales to February 10, 2011 ................................................................................. 1,950,000
Less gross profit at 40%.............................................................................. 780,000Sales at cost .................................................................................................. 1,170,000
Inventory (approximately) at February 10, 2011 ............................... $ 430,000
14. The validity of the retail inventory method is dependent upon (1) the composition of the inventoryremaining approximately the same at the end of the period as it was during the period, and(2) there being approximately the same rate of markup at the end of the year as was usedthroughout the period.
The retail method, though ordinarily applied on a departmental basis, may be appropriate for thebusiness as a unit if the above conditions are met.
15. The conventional retail method is a procedure based on averages whereby inventory figures atretail are reduced to an inventory valuation figure by multiplying the retail figures by a percentagewhich is the complement of the markup percent.
To determine the markup percent, original markups and additional net markups are related to theoriginal cost. The complement of the markup percent is then applied to the inventory at retail afterthe latter has been reduced by net markdowns, thus in effect achieving a lower-of-cost-or-NRVvaluation.
An example of reduction to market follows:
Assume purchase of 100 items at $1 each, marked to sell at $1.50 each, at which price 80 weresold. The remaining 20 are marked down to $1.15 each.
9-8 Copyright © 2011 John Wiley & Sons, Inc. Kieso, IFRS, 1/e, Solutions Manual (For Instructor Use Only)
Questions Chapter 9 (Continued)
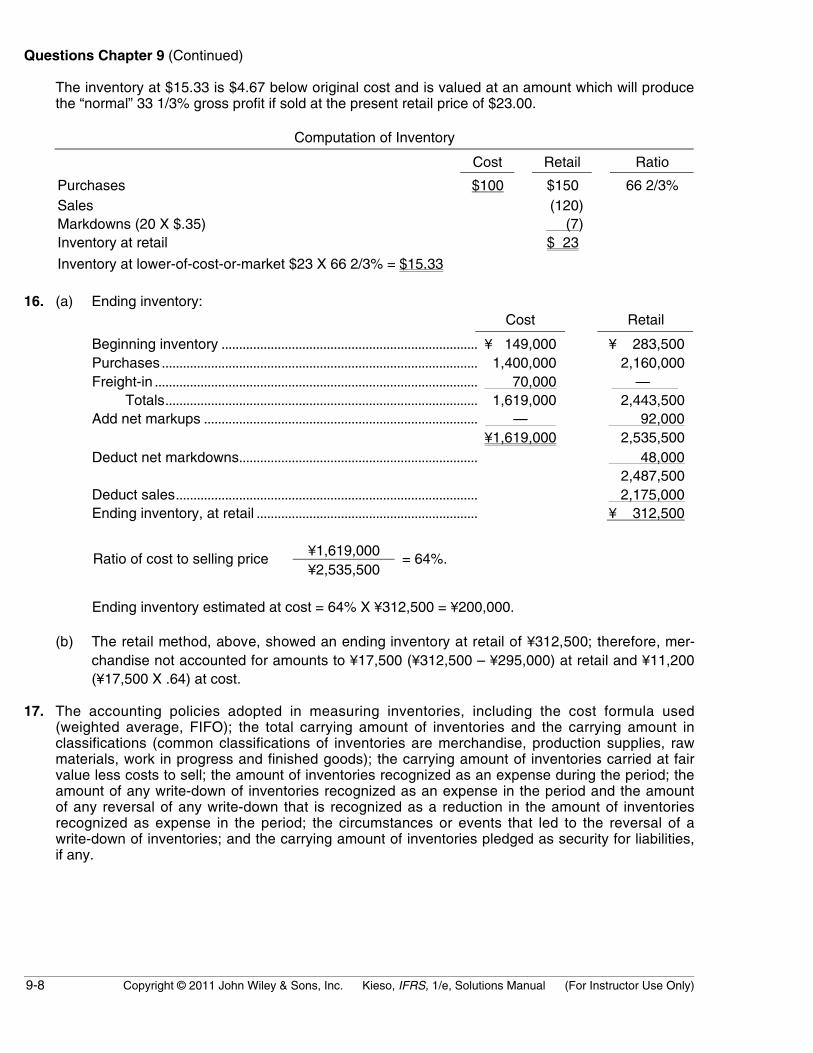
The inventory at $15.33 is $4.67 below original cost and is valued at an amount which will producethe “normal” 33 1/3% gross profit if sold at the present retail price of $23.00.
Computation of Inventory
Cost Retail Ratio
Purchases $100 $150 66 2/3%Sales (120)Markdowns (20 X $.35) (7)Inventory at retail $ 23
Inventory at lower-of-cost-or-market $23 X 66 2/3% = $15.33
16. (a) Ending inventory:Cost Retail
Beginning inventory ......................................................................... ¥ 149,000 ¥ 283,500Purchases .......................................................................................... 1,400,000 2,160,000Freight-in ............................................................................................ 70,000 —
Totals......................................................................................... 1,619,000 2,443,500Add net markups .............................................................................. — 92,000
¥1,619,000 2,535,500Deduct net markdowns.................................................................... 48,000
2,487,500Deduct sales...................................................................................... 2,175,000Ending inventory, at retail ............................................................... ¥ 312,500
¥1,619,000Ratio of cost to selling price¥2,535,500
= 64%.
Ending inventory estimated at cost = 64% X ¥312,500 = ¥200,000.
(b) The retail method, above, showed an ending inventory at retail of ¥312,500; therefore, mer-chandise not accounted for amounts to ¥17,500 (¥312,500 – ¥295,000) at retail and ¥11,200(¥17,500 X .64) at cost.
17. The accounting policies adopted in measuring inventories, including the cost formula used(weighted average, FIFO); the total carrying amount of inventories and the carrying amount inclassifications (common classifications of inventories are merchandise, production supplies, rawmaterials, work in progress and finished goods); the carrying amount of inventories carried at fairvalue less costs to sell; the amount of inventories recognized as an expense during the period; theamount of any write-down of inventories recognized as an expense in the period and the amountof any reversal of any write-down that is recognized as a reduction in the amount of inventoriesrecognized as expense in the period; the circumstances or events that led to the reversal of awrite-down of inventories; and the carrying amount of inventories pledged as security for liabilities,if any.

Copyright © 2011 John Wiley & Sons, Inc. Kieso, IFRS, 1/e, Solutions Manual (For Instructor Use Only) 9-9
Questions Chapter 9 (Continued)
18. Inventory turnover measures how quickly inventory is sold. Generally, the higher the inventoryturnover, the better the enterprise is performing. The more times the inventory turns over, thesmaller the net margin can be to earn an appropriate total profit and return on assets. Forexample, a company can price its goods lower if it has a high inventory turnover. A company witha low profit margin, such as 2%, can earn as much as a company with a high net profit margin,such as 40%, if its inventory turnover is often enough. To illustrate, a grocery store with a 2% profitmargin can earn as much as a jewelry store with a 40% profit margin and an inventory turnover of1 if its turnover is more than 20 times.
19. Key Similarities are (1) the guidelines on who owns the goods—goods in transit, consignedgoods, special sales agreements, and the costs to include in inventory are essentially accountedfor the same under IFRS and U.S. GAAP; (2) use of specific identification cost flow assumption,where appropriate; (3) unlike property plant and equipment, IFRS does not permit the option ofvaluing inventories at fair value. As indicated above, IFRS requires inventory to be written down,but inventory cannot be written up above its original cost; (4) certain agricultural products andminerals and mineral products can be reported at net realizable value using IFRS.
Key differences are related to (1) the LIFO cost flow assumption—U.S. GAAP permits the use ofLIFO for inventory valuation. IFRS prohibits its use. FIFO and average-cost are the only twoacceptable cost flow assumptions permitted under IFRS; (2) lower-of-cost-or-market test forinventory valuation—IFRS defines market as net realizable value. U.S. GAAP on the other handdefines market as replacement cost subject to the constraints of net realizable value (the ceiling) andnet realizable value less a normal markup (the floor). That is, IFRS does not use a ceiling or a floorto determine market; (3) inventory write-downs—under U.S. GAAP, if inventory is written downunder the lower-of-cost-or-market valuation, the new basis is now considered its cost. As a result,the inventory may not be written back up to its original cost in a subsequent period. Under IFRS, thewrite-down may be reversed in a subsequent period up to the amount of the previous write-down.Both the write-down and any subsequent reversal should be reported on the income statement;(4) The requirements for accounting and reporting for inventories are more principles-based underIFRS. That is, U.S. GAAP provides more detailed guidelines in inventory accounting.
20. As shown in the analysis below, under IFRS, LaTour’s inventory turnover ratio is computed asfollows:
Cost of Goods SoldAverageInventory
=57815
€€ 44
3.75 or approximately 97 days(365÷ 3.75)= ..
Difficulties in comparison to a company using U.S. GAAP could arise if the U.S. company uses theLIFO cost flow assumption, which is prohibited under IFRS. Generally in times of rising prices,LIFO results in lower inventory balance reported on the balance sheet (assume more recentlypurchased items are sold first). Thus, the U.S. GAAP company will report higher inventory turnoverratios. The LIFO reserve can be used to adjust the reported LIFO numbers to FIFO and to permitan “apples to apples” comparison.

9-10 Copyright © 2011 John Wiley & Sons, Inc. Kieso, IFRS, 1/e, Solutions Manual (For Instructor Use Only)
Questions Chapter 9 (Continued)
21. Reed must not be aware the important convergence issue arising from the use of the LIFO costflow assumption; IFRS specifically prohibits its use. Conversely, the LIFO cost flow assumption iswidely used in the United States because of its favorable tax advantages. In addition, many arguethat LIFO from a financial reporting point of view provides a better matching of current costsagainst revenue and therefore a more realistic income is computed.
The problem is compounded in the United States because LIFO cannot be used for tax purposesunless it is used for financial reporting purposes. As a result, unless the tax law is changed, it isunlikely that U.S. GAAP will eliminate the use of the LIFO cost flow assumption because of itssubstantial tax advantages for many companies.
Also, U.S. GAAP has more detailed rules related to accounting and reporting of inventories thanIFRS. We expect that these more detailed rules will be used internationally because they providepractical guidance for some inventory accounting and reporting issues.
Copyright © 2011 John Wiley & Sons, Inc. Kieso, IFRS, 1/e, Solutions Manual (For Instructor Use Only) 9-11
SOLUTIONS TO BRIEF EXERCISES
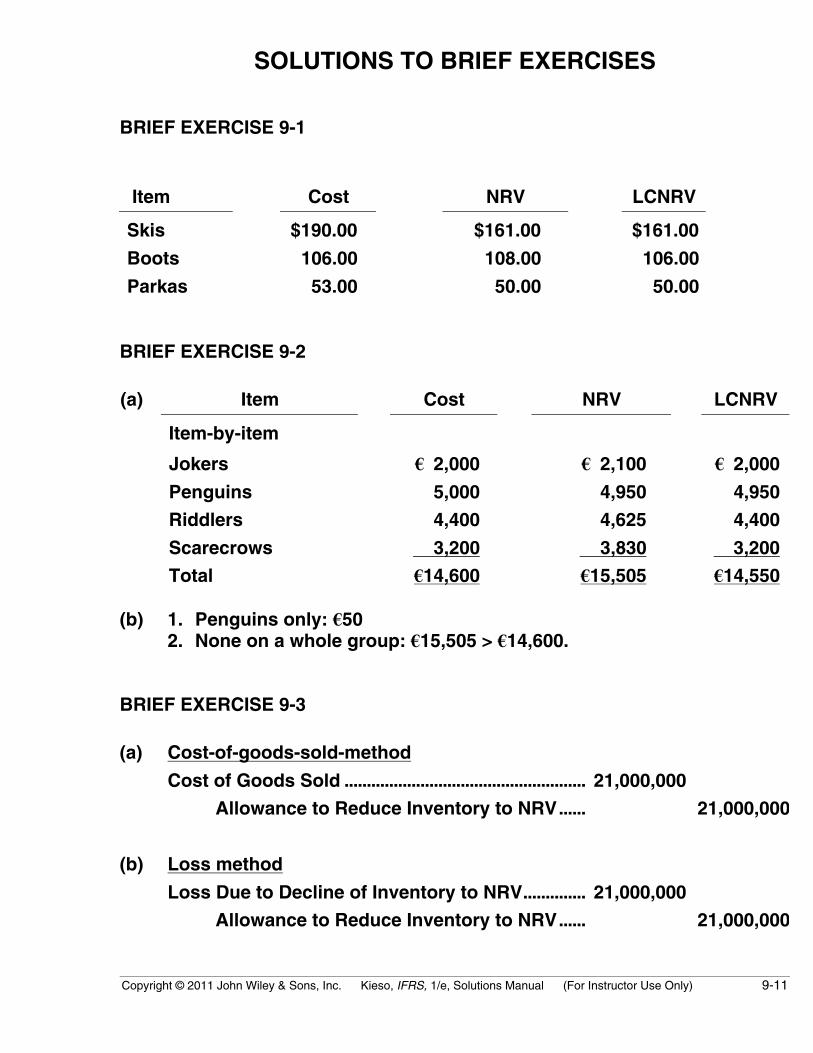
BRIEF EXERCISE 9-1
Item Cost NRV LCNRV
Skis $190.00 $161.00 $161.00
Boots 106.00 108.00 106.00
Parkas 53.00 50.00 50.00
BRIEF EXERCISE 9-2
(a) Item Cost NRV LCNRV
Item-by-item
Jokers € 2,000 € 2,100 € 2,000
Penguins 5,000 4,950 4,950
Riddlers 4,400 4,625 4,400
Scarecrows 3,200 3,830 3,200
Total €14,600 €15,505 €14,550
(b) 1. Penguins only: €502. None on a whole group: €15,505 > €14,600.
BRIEF EXERCISE 9-3
(a) Cost-of-goods-sold-method
Cost of Goods Sold ...................................................... 21,000,000
Allowance to Reduce Inventory to NRV...... 21,000,000
(b) Loss method
Loss Due to Decline of Inventory to NRV.............. 21,000,000
Allowance to Reduce Inventory to NRV...... 21,000,000

9-12 Copyright © 2011 John Wiley & Sons, Inc. Kieso, IFRS, 1/e, Solutions Manual (For Instructor Use Only)
BRIEF EXERCISE 9-4
Biological Assets – Shearing Sheep............................. 4,125*
Unrealized Holding Gain or Loss – Income ..... 4,125
*€4,700 – €575 = €4,125.
BRIEF EXERCISE 9-5
Wool Inventory ..................................................................... 9,000
Unrealized Holding Gain or Loss – Income ..... 9,000
Cash......................................................................................... 10,500
Cost of Goods Sold............................................................. 9,000
Wool Inventory........................................................... 9,000
Sales.............................................................................. 10,500
BRIEF EXERCISE 9-6
GroupNumberof CDs
SalesPrice
per CD
TotalSalesPrice
RelativeSalesPrice
TotalCost
CostAllocated
to CDsCost
per CD
1 100 ¥ 5 ¥ 500 5/100* X ¥8,000 = ¥ 400 ¥ 4**2 800 ¥10 8,000 80/100 X ¥8,000 = 6,400 ¥ 83 100 ¥15 1,500 15/100 X ¥8,000 = 1,200 ¥12
¥10,000 ¥8,000
*¥500/¥10,000 = 5/100 **¥400/100 = ¥4
BRIEF EXERCISE 9-7
Unrealized Holding Loss—Income .................................. 50,000Purchase Commitment Liability............................. 50,000
Copyright © 2011 John Wiley & Sons, Inc. Kieso, IFRS, 1/e, Solutions Manual (For Instructor Use Only) 9-13
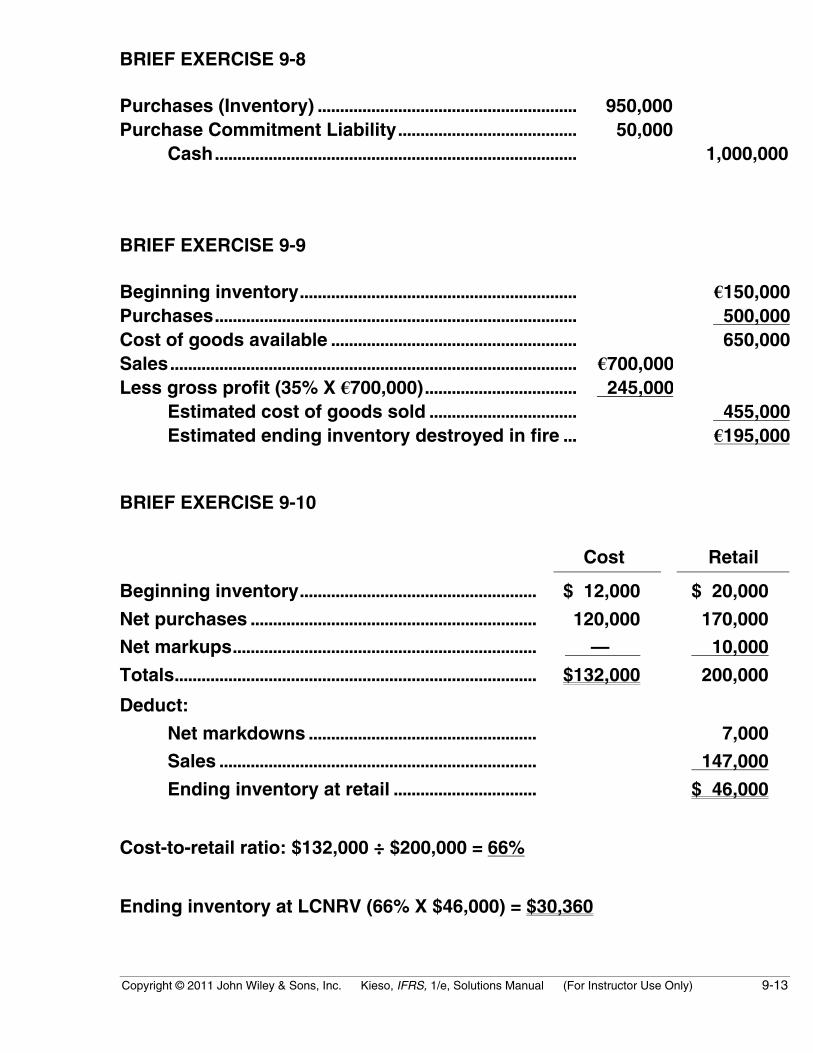
BRIEF EXERCISE 9-8
Purchases (Inventory) .......................................................... 950,000Purchase Commitment Liability........................................ 50,000
Cash................................................................................. 1,000,000
BRIEF EXERCISE 9-9
Beginning inventory.............................................................. €150,000Purchases................................................................................. 500,000Cost of goods available ....................................................... 650,000Sales........................................................................................... €700,000Less gross profit (35% X €700,000).................................. 245,000
Estimated cost of goods sold ................................. 455,000Estimated ending inventory destroyed in fire ... €195,000
BRIEF EXERCISE 9-10
Cost Retail
Beginning inventory..................................................... $ 12,000 $ 20,000
Net purchases ................................................................ 120,000 170,000
Net markups.................................................................... — 10,000
Totals................................................................................. $132,000 200,000
Deduct:
Net markdowns ................................................... 7,000
Sales ....................................................................... 147,000
Ending inventory at retail ................................ $ 46,000
Cost-to-retail ratio: $132,000 ÷ $200,000 = 66%
Ending inventory at LCNRV (66% X $46,000) = $30,360

9-14 Copyright © 2011 John Wiley & Sons, Inc. Kieso, IFRS, 1/e, Solutions Manual (For Instructor Use Only)
BRIEF EXERCISE 9-11
Inventory turnover:
€68,709.4
€6,891 + €6,867= 10.0 times
2
Average days to sell inventory:
365 ÷ 10.0 = 36.5 days

Copyright © 2011 John Wiley & Sons, Inc. Kieso, IFRS, 1/e, Solutions Manual (For Instructor Use Only) 9-15
SOLUTIONS TO EXERCISES
EXERCISE 9-1 (15–20 minutes)
Per Unit Lower-of-
Part No. Quantity Cost NRVTotalCost
TotalNRV
Cost-or-NRV
110 600 $ 95 $100.00 $ 57,000 $ 60,000 $ 57,000111 1,000 60 52.00 60,000 52,000 52,000112 500 80 76.00 40,000 38,000 38,000113 200 170 180.00 34,000 36,000 34,000120 400 205 208.00 82,000 83,200 82,000121 1,600 16 1.00 25,600 1,600 1,600122 300 240 235.00 72,000 70,500 70,500
Totals $370,600 $341,300 $335,100
(a) $335,100.
(b) $341,300.
EXERCISE 9-2 (10–15 minutes)
Item
NetRealizable
Value Cost LCNRVD €80* €75 €75E 62 80 62F 60 80 60G 35 80 35H 70 50 50I 40 36 36
*Estimated selling price – Estimated selling costs and cost tocomplete = €120 – €30 – €10 = €80.

9-16 Copyright © 2011 John Wiley & Sons, Inc. Kieso, IFRS, 1/e, Solutions Manual (For Instructor Use Only)
EXERCISE 9-3 (15–20 minutes)
ItemNo.
Costper Unit
Net RealizableValue LCNRV Quantity
FinalInventory
Value
1320 $3.20 $2.90* $2.90 1,200 $ 3,4801333 2.70 2.40 2.40 900 2,1601426 4.50 3.60 3.60 800 2,8801437 3.60 1.85 1.85 1,000 1,8501510 2.25 1.85 1.85 700 1,2951522 3.00 3.10 3.00 500 1,5001573 1.80 1.30 1.30 3,000 3,9001626 4.70 4.50 4.50 1,000 4,500
$21,565
*$4.50 – $1.60 = $2.90.
EXERCISE 9-4 (10–15 minutes)
(a) 12/31/10 Cost of Goods Sold .................................... 24,000Allowance to Reduce
Inventory to NRV .......................... 24,000
12/31/11 Allowance to Reduce Inventory to NRV..................................... 4,000
Cost of Goods Sold.......................... 4,000
(b) 12/31/10 Loss Due to Decline of Inventory to NRV...................................... 24,000
Allowance to Reduce Inventory to NRV .......................... 24,000
12/31/11 Allowance to Reduce Inventory to NRV..................................... 4,000*
Recovery of Inventory Loss.......... 4,000
Copyright © 2011 John Wiley & Sons, Inc. Kieso, IFRS, 1/e, Solutions Manual (For Instructor Use Only) 9-17
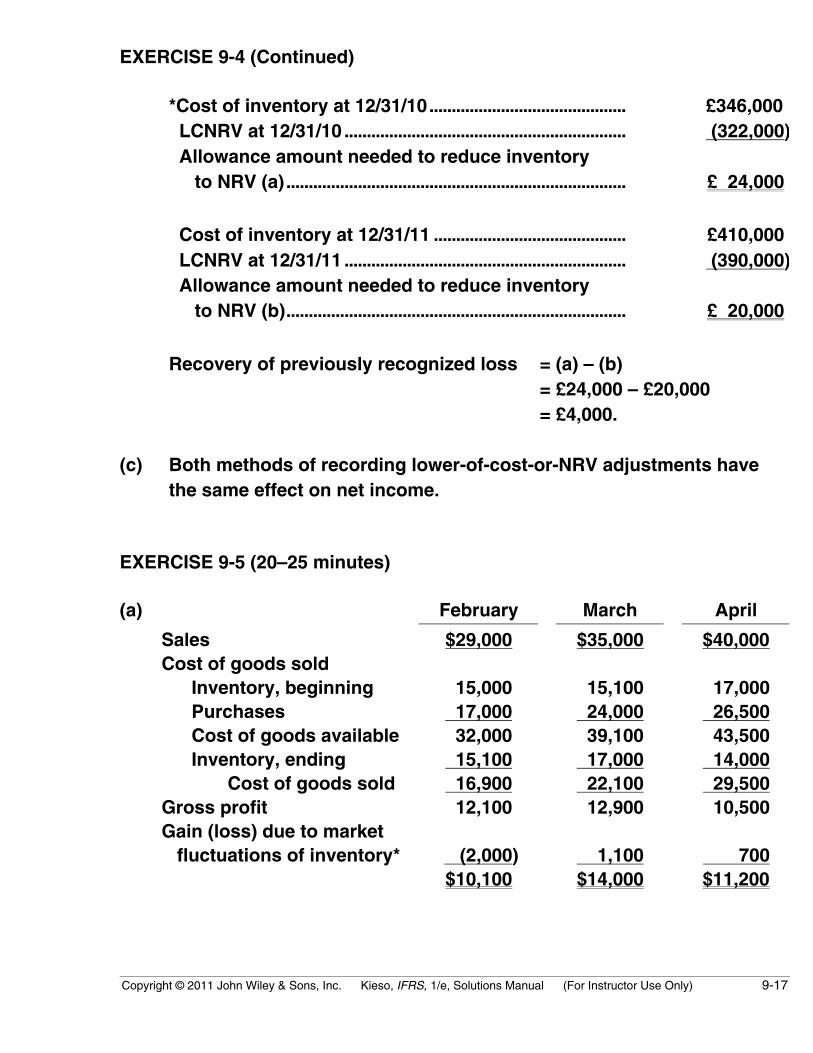
EXERCISE 9-4 (Continued)
*Cost of inventory at 12/31/10............................................ £346,000 LCNRV at 12/31/10 ............................................................... (322,000) Allowance amount needed to reduce inventory to NRV (a)............................................................................ £ 24,000
Cost of inventory at 12/31/11 ........................................... £410,000 LCNRV at 12/31/11 ............................................................... (390,000) Allowance amount needed to reduce inventory to NRV (b)............................................................................ £ 20,000
Recovery of previously recognized loss = (a) – (b)= £24,000 – £20,000= £4,000.
(c) Both methods of recording lower-of-cost-or-NRV adjustments havethe same effect on net income.
EXERCISE 9-5 (20–25 minutes)
(a) February March April
Sales $29,000 $35,000 $40,000Cost of goods sold
Inventory, beginning 15,000 15,100 17,000Purchases 17,000 24,000 26,500Cost of goods available 32,000 39,100 43,500Inventory, ending 15,100 17,000 14,000
Cost of goods sold 16,900 22,100 29,500Gross profit 12,100 12,900 10,500Gain (loss) due to market fluctuations of inventory* (2,000) 1,100 700
$10,100 $14,000 $11,200
9-18 Copyright © 2011 John Wiley & Sons, Inc. Kieso, IFRS, 1/e, Solutions Manual (For Instructor Use Only)
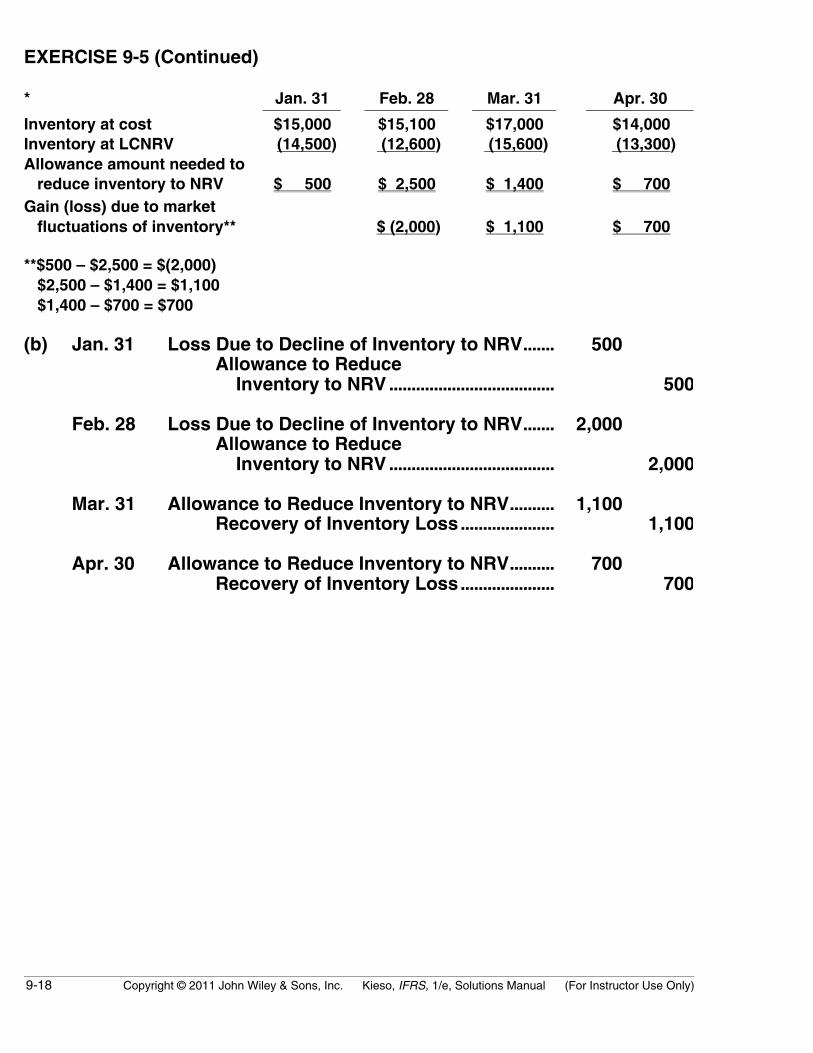
EXERCISE 9-5 (Continued)
* Jan. 31 Feb. 28 Mar. 31 Apr. 30
Inventory at cost $15,000 $15,100 $17,000 $14,000Inventory at LCNRV (14,500) (12,600) (15,600) (13,300)Allowance amount needed to reduce inventory to NRV $ 500 $ 2,500 $ 1,400 $ 700Gain (loss) due to market fluctuations of inventory** $ (2,000) $ 1,100 $ 700
**$500 – $2,500 = $(2,000) $2,500 – $1,400 = $1,100 $1,400 – $700 = $700
(b) Jan. 31 Loss Due to Decline of Inventory to NRV....... 500Allowance to Reduce Inventory to NRV ..................................... 500
Feb. 28 Loss Due to Decline of Inventory to NRV....... 2,000Allowance to Reduce Inventory to NRV ..................................... 2,000
Mar. 31 Allowance to Reduce Inventory to NRV.......... 1,100Recovery of Inventory Loss..................... 1,100
Apr. 30 Allowance to Reduce Inventory to NRV.......... 700Recovery of Inventory Loss..................... 700
Copyright © 2011 John Wiley & Sons, Inc. Kieso, IFRS, 1/e, Solutions Manual (For Instructor Use Only) 9-19
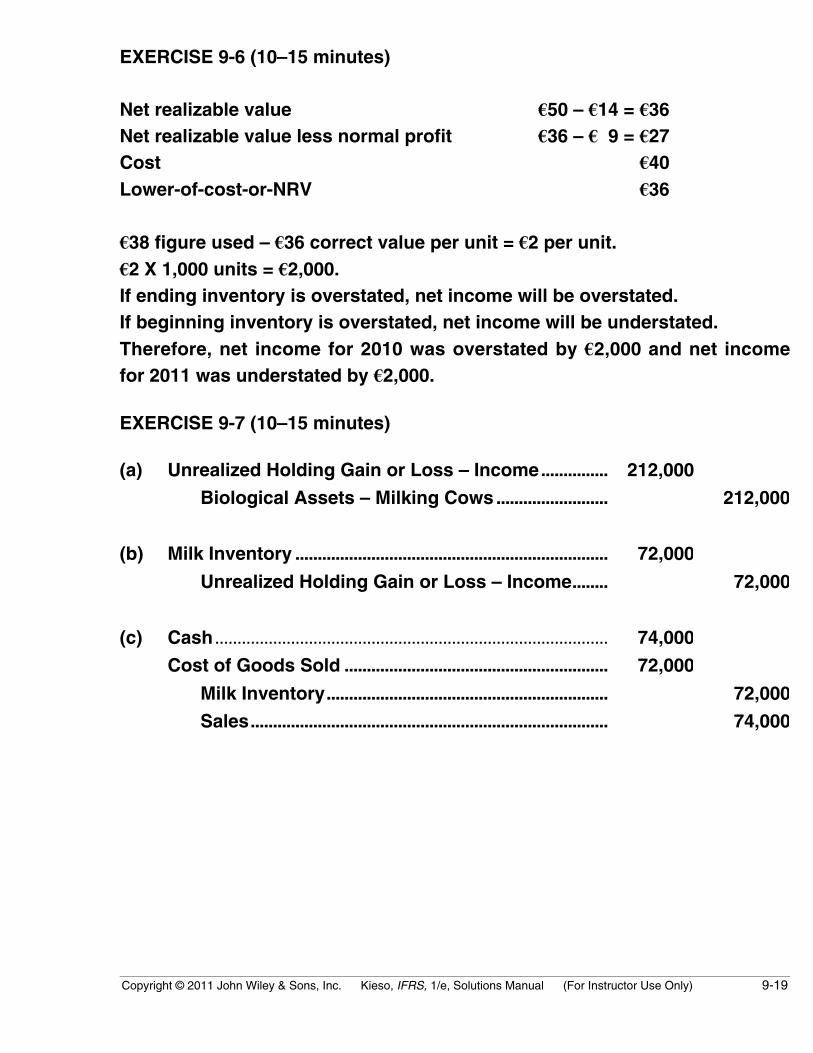
EXERCISE 9-6 (10–15 minutes)
Net realizable value €50 – €14 = €36Net realizable value less normal profit €36 – € 9 = €27Cost €40Lower-of-cost-or-NRV €36
€38 figure used – €36 correct value per unit = €2 per unit.€2 X 1,000 units = €2,000.If ending inventory is overstated, net income will be overstated.If beginning inventory is overstated, net income will be understated.Therefore, net income for 2010 was overstated by €2,000 and net incomefor 2011 was understated by €2,000.
EXERCISE 9-7 (10–15 minutes)
(a) Unrealized Holding Gain or Loss – Income............... 212,000
Biological Assets – Milking Cows......................... 212,000
(b) Milk Inventory ...................................................................... 72,000
Unrealized Holding Gain or Loss – Income........ 72,000
(c) Cash ........................................................................................ 74,000
Cost of Goods Sold ........................................................... 72,000
Milk Inventory............................................................... 72,000
Sales................................................................................ 74,000

9-20 Copyright © 2011 John Wiley & Sons, Inc. Kieso, IFRS, 1/e, Solutions Manual (For Instructor Use Only)
EXERCISE 9-8 (10–15 minutes)
(a) Biological Assets – Shearing Alpaca ........................... 6,725
Unrealized Holding Gain or Loss – Income ....... 6,725
(b) Wool Inventory..................................................................... 13,000
Unrealized Holding Gain or Loss – Income ....... 13,000
(c) Cash......................................................................................... 14,500
Cost of Goods Sold............................................................ 13,000
Wool Inventory............................................................. 13,000
Sales................................................................................ 14,500
(d) (1) The birth of a baby Alpaca may result in a gain on the initialrecognition of the biological asset.
(2) Losses may result as the fair value of the older Alpaca will likelydecrease because the shearing is more limited than with the otherAlpacas.

Copyright © 2011 John Wiley & Sons, Inc. Kieso, IFRS, 1/e, Solutions Manual (For Instructor Use Only) 9-21
EXERCISE 9-9 (15–20 minutes)
Co
st P
er L
ot
(Co
st A
lloca
ted
/N
o. o
f L
ots
)
$2,0
40
2,7
20
1,3
60
Co
stA
lloca
ted
to L
ots
$18,
360
40,
800
25,
840
$85,
000
To
tal
Co
st
$85,
000
85,
000
85,
000
X X X
Rel
ativ
e S
ales
Pri
ce
$27,
000/
$125
,000
$60,
000/
$125
,000
$38,
000/
$125
,000
$78,
000
53,
040
24,
960
18,
200
$ 6
,760
Gro
ssP
rofi
t
$ 3
,840
10,
240
10,
880
$24
,960
To
tal
Sal
esP
rice
$ 2
7,00
0
6
0,00
0
3
8,00
0
$125
,000
Sal
es
$12,
000
32,
000
34,
000
$78
,000
Sal
esP
rice
Per
Lo
t
$3,0
00
4,0
00
2,0
00
Co
st
Co
st o
f P
er
L
ots
Lo
t
So
ld
$2,0
40
$
8,1
60
2,7
20
2
1,76
0
1,3
60
2
3,12
0
$
53,0
40
No
. of
Lo
ts
9 15 19 4 8 17 29
Nu
mb
ero
f L
ots
So
ld*
Gro
up
1
Gro
up
2
Gro
up
3
Sal
es (
see
sch
edu
le)
Co
st o
f g
oo
ds
sold
(se
e sc
hed
ule
)
Gro
ss p
rofi
t
Op
erat
ing
exp
ense
s
Net
inco
me
Gro
up
1
Gro
up
2
Gro
up
3
To
tal
* 9
– 5
= 4
15
– 7
= 8
19
– 2
= 17
9-22 Copyright © 2011 John Wiley & Sons, Inc. Kieso, IFRS, 1/e, Solutions Manual (For Instructor Use Only)
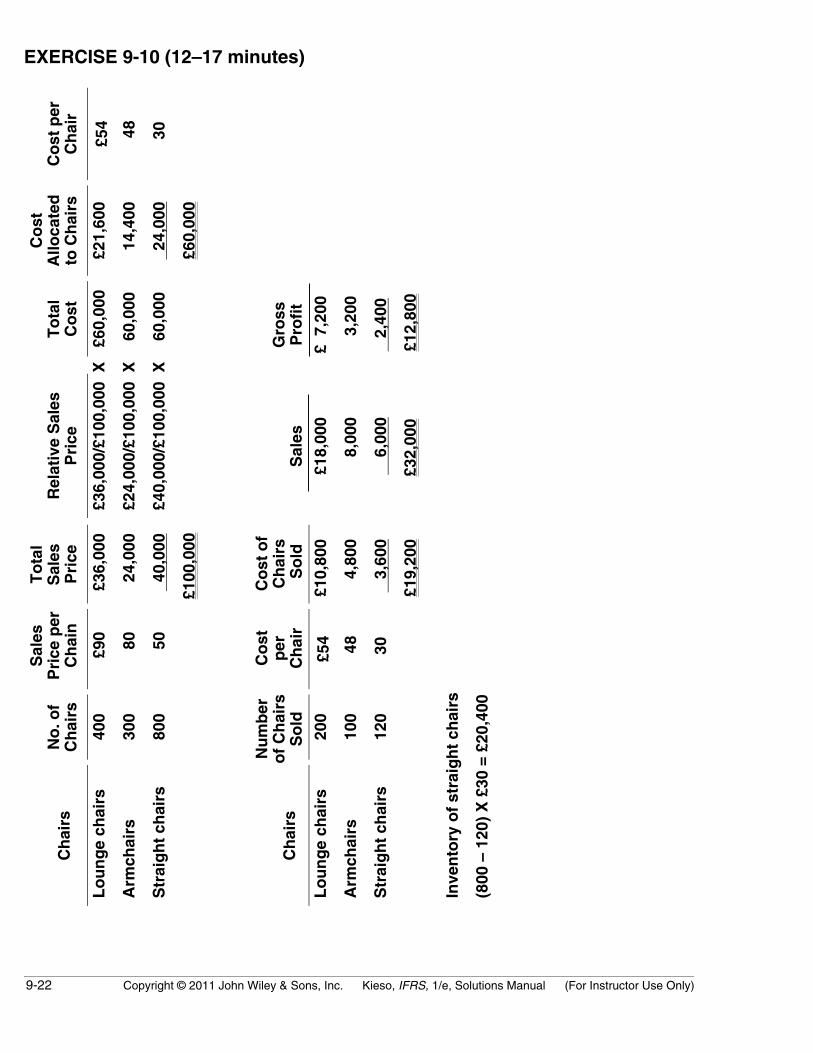
EXERCISE 9-10 (12–17 minutes)C
ost
per
Ch
air
£54
48
30
Co
stA
lloca
ted
to C
hai
rs
£21,
600
14,
400
24,
000
£60,
000
To
tal
Co
st
£60,
000
60,
000
60,
000
Gro
ssP
rofi
t
£ 7
,200
3
,200
2,
400
£12
,800
X X X
Rel
ativ
e S
ales
Pri
ce
£36,
000/
£100
,000
£24,
000/
£100
,000
£40,
000/
£100
,000
Sal
es
£18,
000
8
,000
6
,000
£32
,000
To
tal
Sal
esP
rice
£36,
000
24,
000
40,
000
£100
,000
Co
st o
fC
hai
rs S
old
£10,
800
4,8
00
3,
600
£19,
200
Sal
esP
rice
per
Ch
ain
£90
80
50
Co
stp
erC
hai
r
£54
48
30
No
. of
Ch
airs
400
300
800
200
100
120
Nu
mb
ero
f C
hai
rsS
old
Ch
airs
Lo
un
ge
chai
rs
Arm
chai
rs
Str
aig
ht
chai
rs
Ch
airs
Lo
un
ge
chai
rs
Arm
chai
rs
Str
aig
ht
chai
rs
Inve
nto
ry o
f st
raig
ht
chai
rs
(800
– 1
20)
X £
30 =
£20
,400

Copyright © 2011 John Wiley & Sons, Inc. Kieso, IFRS, 1/e, Solutions Manual (For Instructor Use Only) 9-23
EXERCISE 9-11 (5–10 minutes)
Unrealized Holding Gain or Loss—Income ............ 25,000Purchase Commitment Liability ...................... 25,000
EXERCISE 9-12 (15–20 minutes)
(a) If the commitment is material in amount, there should be a footnote inthe balance sheet stating the nature and extent of the commitment.The footnote may also disclose the market price of the materials. Theexcess of market price over contracted price is a gain contingencythat should not be recognized in the accounts until it is realized.
(b) The drop in the market price of the commitment should be charged tooperations in the current year if it is material in amount. The followingentry would be made:
Unrealized Holding Gain or Loss—Income ............... 12,000Purchase Commitment Liability .......................... 12,000
The entry is made because a loss in utility has occurred during theperiod in which the market decline took place. The account credited inthe above entry should be included among the current liabilities on thestatement of financial position, with an appropriate footnote indicatingthe nature and extent of the commitment. This liability indicates theminimum obligation on the commitment contract at the presenttime—the amount that would have to be forfeited in case of breach ofcontract.
(c) Assuming the $12,000 market decline entry was made on December31, 2011, as indicated in (b), the entry when the materials are receivedin January 2012 would be:
Raw Materials ....................................................................... 108,000Purchase Commitment Liability..................................... 12,000
Accounts Payable .................................................... 120,000
9-24 Copyright © 2011 John Wiley & Sons, Inc. Kieso, IFRS, 1/e, Solutions Manual (For Instructor Use Only)
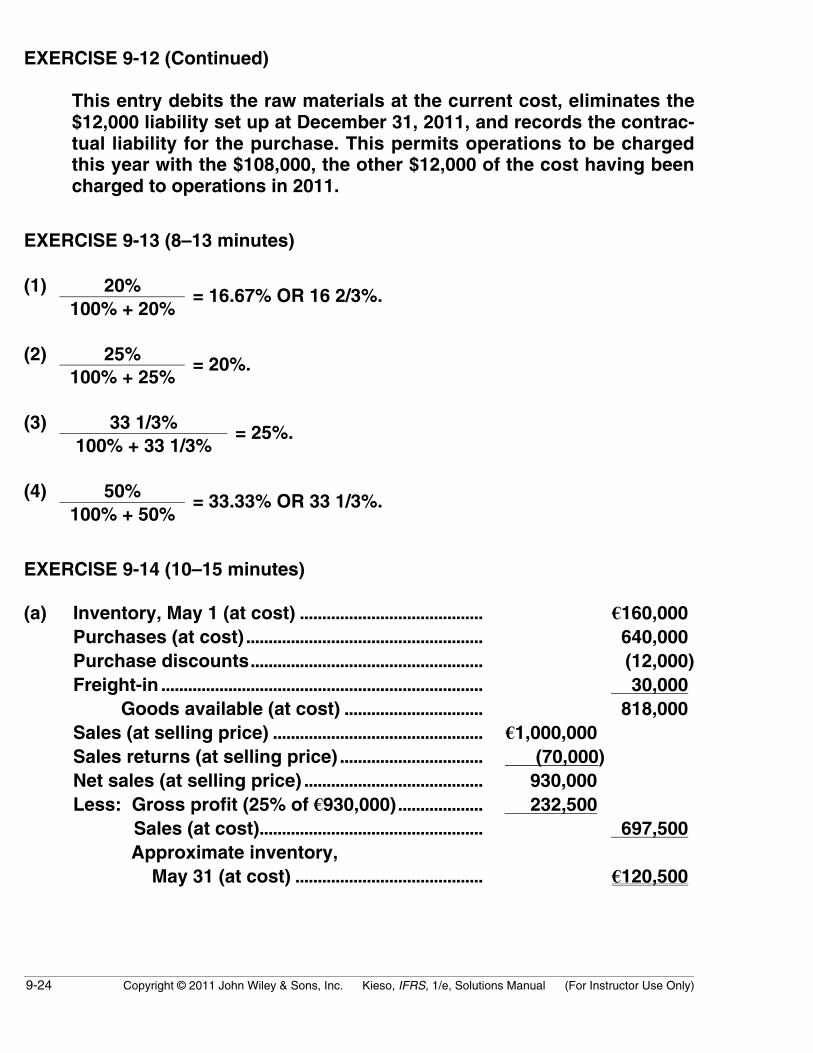
EXERCISE 9-12 (Continued)
This entry debits the raw materials at the current cost, eliminates the$12,000 liability set up at December 31, 2011, and records the contrac-tual liability for the purchase. This permits operations to be chargedthis year with the $108,000, the other $12,000 of the cost having beencharged to operations in 2011.
EXERCISE 9-13 (8–13 minutes)
(1) 20%100% + 20%
= 16.67% OR 16 2/3%.
(2) 25%100% + 25%
= 20%.
(3) 33 1/3%100% + 33 1/3%
= 25%.
(4) 50%100% + 50%
= 33.33% OR 33 1/3%.
EXERCISE 9-14 (10–15 minutes)
(a) Inventory, May 1 (at cost) ......................................... €160,000Purchases (at cost) ..................................................... 640,000Purchase discounts.................................................... (12,000)Freight-in ........................................................................ 30,000
Goods available (at cost) ............................... 818,000Sales (at selling price) ............................................... €1,000,000Sales returns (at selling price) ................................ (70,000)Net sales (at selling price) ........................................ 930,000Less: Gross profit (25% of €930,000)................... 232,500
Sales (at cost).................................................. 697,500 Approximate inventory, May 31 (at cost) .......................................... €120,500

Copyright © 2011 John Wiley & Sons, Inc. Kieso, IFRS, 1/e, Solutions Manual (For Instructor Use Only) 9-25
EXERCISE 9-14 (Continued)
(b) Gross profit as a percent of sales must be computed:
25%100% + 25%
= 20% of sales.
Inventory, May 1 (at cost) ........................................ €160,000Purchases (at cost).................................................... 640,000Purchase discounts .................................................. (12,000)Freight-in....................................................................... 30,000
Goods available (at cost) .............................. 818,000Sales (at selling price) .............................................. €1,000,000Sales returns (at selling price)............................... (70,000)Net sales (at selling price)....................................... 930,000Less: Gross profit (20% of €930,000) ................. 186,000
Sales (at cost)................................................. 744,000 Approximate inventory, May 31 (at cost) .......................................... € 74,000
EXERCISE 9-15 (15–20 minutes)
(a) Merchandise on hand, January 1.......................... $ 38,000Purchases..................................................................... 92,000Less: Purchase returns and allowances........... (2,400)Freight-in....................................................................... 3,400
Total merchandise available (at cost)....... 131,000Cost of goods sold*................................................... (90,000)Ending inventory........................................................ 41,000Less: Undamaged goods ....................................... 10,900Estimated fire loss..................................................... $ 30,100
33 1/3%*Gross profit =100% + 33 1/3%
= 25% of sales.
Cost of goods sold = 75% of sales of $120,000 = $90,000.
9-26 Copyright © 2011 John Wiley & Sons, Inc. Kieso, IFRS, 1/e, Solutions Manual (For Instructor Use Only)
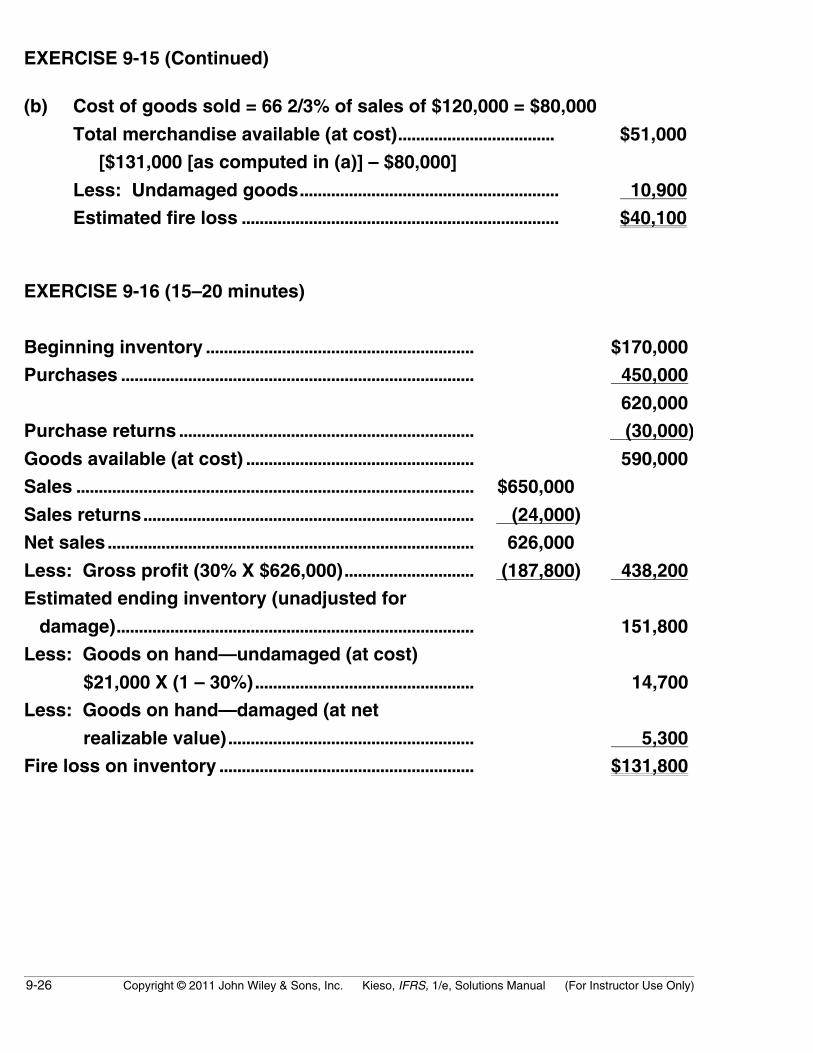
EXERCISE 9-15 (Continued)
(b) Cost of goods sold = 66 2/3% of sales of $120,000 = $80,000
Total merchandise available (at cost)...................................
[$131,000 [as computed in (a)] – $80,000]
$51,000
Less: Undamaged goods.......................................................... 10,900
Estimated fire loss ....................................................................... $40,100
EXERCISE 9-16 (15–20 minutes)
Beginning inventory ............................................................ $170,000
Purchases ............................................................................... 450,000
620,000
Purchase returns .................................................................. (30,000)
Goods available (at cost) ................................................... 590,000
Sales ......................................................................................... $650,000
Sales returns.......................................................................... (24,000)
Net sales.................................................................................. 626,000
Less: Gross profit (30% X $626,000)............................. (187,800) 438,200
Estimated ending inventory (unadjusted for
damage)................................................................................ 151,800
Less: Goods on hand—undamaged (at cost)
$21,000 X (1 – 30%)................................................. 14,700
Less: Goods on hand—damaged (at net
realizable value)....................................................... 5,300
Fire loss on inventory ......................................................... $131,800

Copyright © 2011 John Wiley & Sons, Inc. Kieso, IFRS, 1/e, Solutions Manual (For Instructor Use Only) 9-27
EXERCISE 9-17 (10–15 minutes)
Beginning inventory (at cost) .......................................... ¥ 38,000Purchases (at cost).............................................................. 90,000
Goods available (at cost) ........................................ 128,000Sales (at selling price) ........................................................ ¥116,000Less sales returns ............................................................... 4,000Net sales.................................................................................. 112,000Less: Gross profit* (20% of ¥112,000).......................... 22,400
Net sales (at cost)................................................... 89,600Estimated inventory (at cost)........................................... 38,400Less: Goods on hand (¥30,500 – ¥6,000) ..................... 24,500
Claim against insurance company................................. ¥ 13,900
25%*Computation of gross profit:
100% + 25%= 20% of selling price
EXERCISE 9-18 (15–20 minutes)
Lumber Millwork Hardware
Inventory 1/1/11 (cost) $ 250,000 $ 90,000 $ 45,000Purchases to 8/18/11 (cost) 1,500,000 375,000 160,000
Cost of goods available 1,750,000 465,000 205,000Deduct cost of goods sold* 1,640,000 410,000 175,000Inventory 8/18/11 $ 110,000 $ 55,000 $ 30,000
*(See computations on next page)
9-28 Copyright © 2011 John Wiley & Sons, Inc. Kieso, IFRS, 1/e, Solutions Manual (For Instructor Use Only)
EXERCISE 9-18 (Continued)
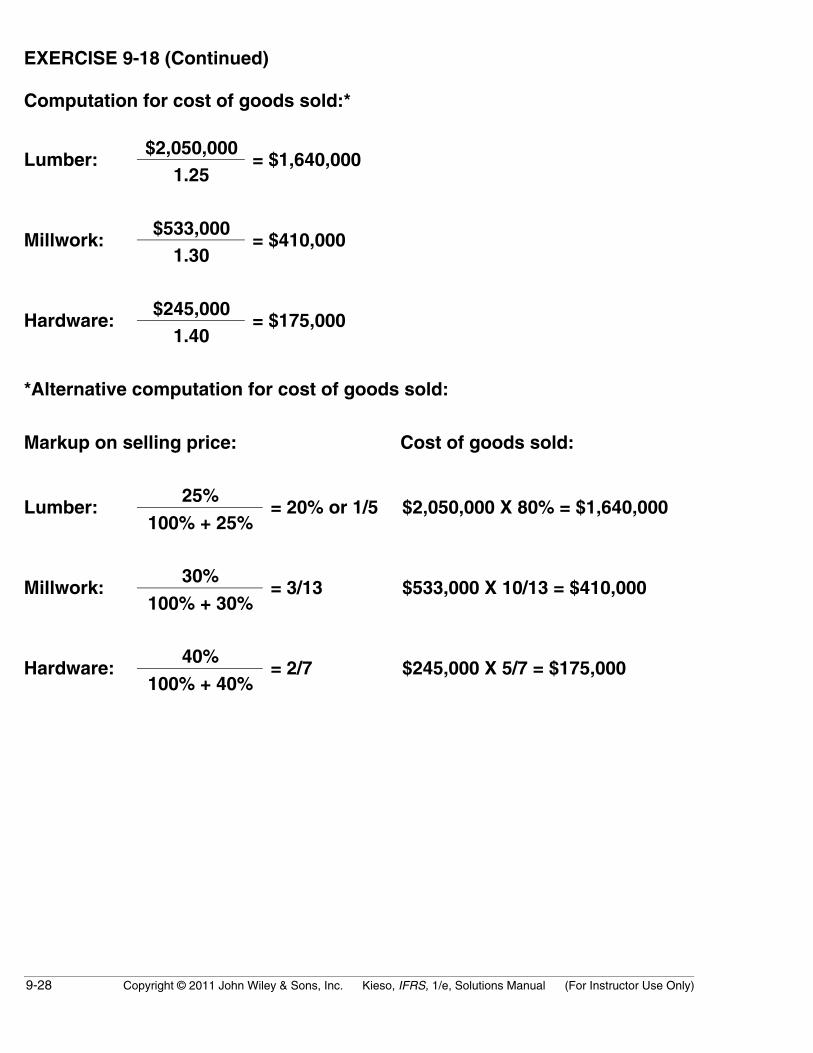
Computation for cost of goods sold:*
$2,050,000Lumber:
1.25= $1,640,000
$533,000Millwork:
1.30= $410,000
$245,000Hardware:
1.40= $175,000
*Alternative computation for cost of goods sold:
Markup on selling price: Cost of goods sold:
25%Lumber:
100% + 25%= 20% or 1/5 $2,050,000 X 80% = $1,640,000
30%Millwork:
100% + 30%= 3/13 $533,000 X 10/13 = $410,000
40%Hardware:
100% + 40%= 2/7 $245,000 X 5/7 = $175,000
Copyright © 2011 John Wiley & Sons, Inc. Kieso, IFRS, 1/e, Solutions Manual (For Instructor Use Only) 9-29
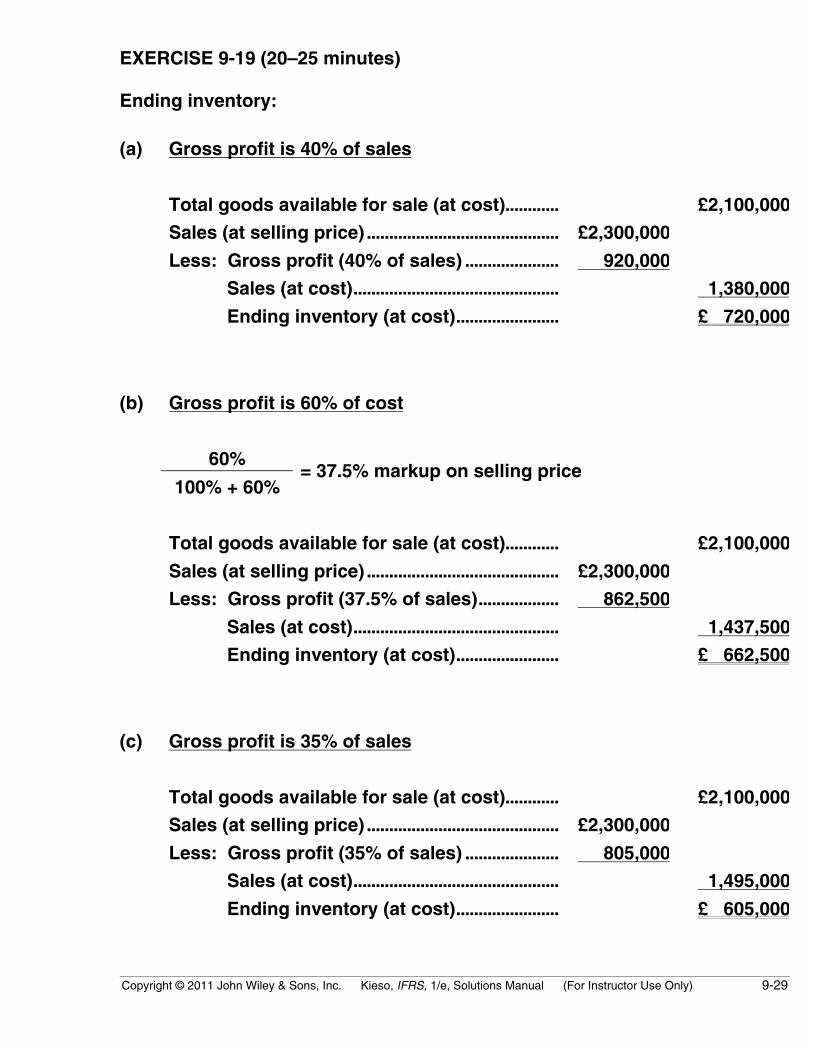
EXERCISE 9-19 (20–25 minutes)
Ending inventory:
(a) Gross profit is 40% of sales
Total goods available for sale (at cost)............ £2,100,000
Sales (at selling price) ........................................... £2,300,000
Less: Gross profit (40% of sales) ..................... 920,000
Sales (at cost).............................................. 1,380,000
Ending inventory (at cost)....................... £ 720,000
(b) Gross profit is 60% of cost
60%
100% + 60%= 37.5% markup on selling price
Total goods available for sale (at cost)............ £2,100,000
Sales (at selling price) ........................................... £2,300,000
Less: Gross profit (37.5% of sales).................. 862,500
Sales (at cost).............................................. 1,437,500
Ending inventory (at cost)....................... £ 662,500
(c) Gross profit is 35% of sales
Total goods available for sale (at cost)............ £2,100,000
Sales (at selling price) ........................................... £2,300,000
Less: Gross profit (35% of sales) ..................... 805,000
Sales (at cost).............................................. 1,495,000
Ending inventory (at cost)....................... £ 605,000
9-30 Copyright © 2011 John Wiley & Sons, Inc. Kieso, IFRS, 1/e, Solutions Manual (For Instructor Use Only)
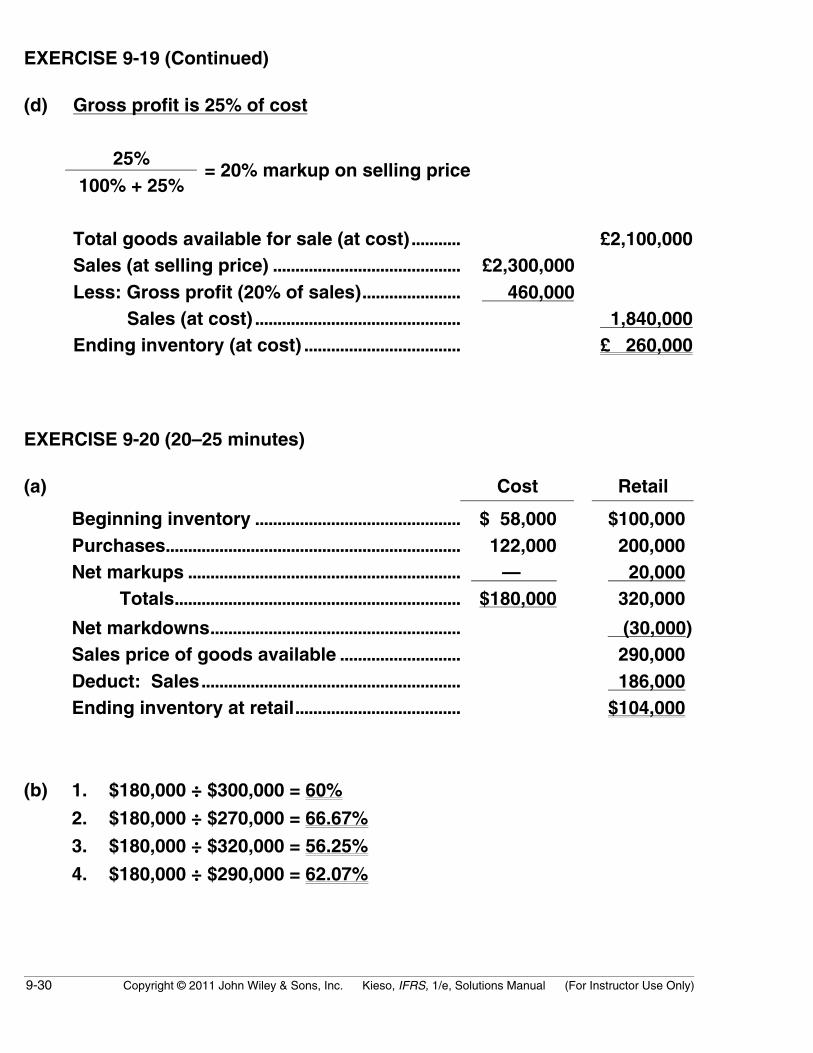
EXERCISE 9-19 (Continued)
(d) Gross profit is 25% of cost
25%100% + 25%
= 20% markup on selling price
Total goods available for sale (at cost)........... £2,100,000Sales (at selling price) .......................................... £2,300,000Less: Gross profit (20% of sales)...................... 460,000
Sales (at cost) .............................................. 1,840,000Ending inventory (at cost) ................................... £ 260,000
EXERCISE 9-20 (20–25 minutes)
(a) Cost Retail
Beginning inventory .............................................. $ 58,000 $100,000Purchases.................................................................. 122,000 200,000Net markups ............................................................. — 20,000
Totals................................................................ $180,000 320,000
Net markdowns........................................................ (30,000)Sales price of goods available ........................... 290,000Deduct: Sales.......................................................... 186,000Ending inventory at retail..................................... $104,000
(b) 1. $180,000 ÷ $300,000 = 60%
2. $180,000 ÷ $270,000 = 66.67%
3. $180,000 ÷ $320,000 = 56.25%
4. $180,000 ÷ $290,000 = 62.07%

Copyright © 2011 John Wiley & Sons, Inc. Kieso, IFRS, 1/e, Solutions Manual (For Instructor Use Only) 9-31
EXERCISE 9-20 (Continued)
(c) 1. Method 3.2. Method 3.3. Method 3.
(d) 56.25% X $104,000 = $58,500
(e) $180,000 – $58,500 = $121,500
(f) $186,000 – $121,500 = $64,500
EXERCISE 9-21 (12–17 minutes)
Cost RetailBeginning inventory.............................. € 200,000 € 280,000Purchases................................................. 1,425,000 2,140,000
Totals............................................... 1,625,000 2,420,000Add: Net markups
Markups......................................... €95,000 Markup cancellations................ _________ (15,000) 80,000
Totals.......................................................... €1,625,000 2,500,000
Deduct: Net markdownsMarkdowns .................................... 35,000Markdown cancellations ........... (5,000) 30,000
Sales price of goods available........... 2,470,000Deduct: Sales ......................................... 2,250,000Ending inventory at retail .................... € 220,000
€1,625,000Cost-to-retail ratio =€2,500,000
= 65%
Ending inventory at cost = 65% X €220,000 = €143,000

9-32 Copyright © 2011 John Wiley & Sons, Inc. Kieso, IFRS, 1/e, Solutions Manual (For Instructor Use Only)
EXERCISE 9-22 (20–25 minutes)
Cost RetailBeginning inventory ................................... $30,000 $ 46,500Purchases ...................................................... 55,000 88,000Purchase returns ......................................... (2,000) (3,000)Freight on purchases ................................. 2,400 _______
Totals .................................................... 85,400 131,500Add: Net markups
Markups .............................................. $10,000 Markup cancellations ..................... (1,500)
Net markups .................................................. _______ 8,500Totals .................................................... $85,400 140,000
Deduct: Net markdownsMarkdowns.......................................... 9,300Markdown cancellations................. (2,800)
Net markdowns ............................................ 6,500Sales price of goods available ................ 133,500Deduct: Net sales ($95,000 – $2,000)..... 93,000Ending inventory, at retail ........................ $ 40,500
$85,400Cost-to-retail ratio =$140,000
= 61%
Ending inventory at cost = 61% X $40,500 = $24,705
EXERCISE 9-23 (10–15 minutes)
(a) Inventory turnover:2008 2007
€7,122 €5,936€1,119 + €2,086
= 4.44 times€1,017 + €1,119
= 5.56 times
2 2
(b) Average days to sell inventory:2008 2007
365 ÷ 4.44 = 82.2 days 365 ÷ 5.56 = 65.6 days
Copyright © 2011 John Wiley & Sons, Inc. Kieso, IFRS, 1/e, Solutions Manual (For Instructor Use Only) 9-33
TIME AND PURPOSE OF PROBLEMS
Problem 9-1 (Time 10–15 minutes)Purpose—to provide the student with an understanding of the lower-of-cost-or-net realizable valueapproach to inventory valuation, similar to Problem 9-2. The major difference between these problemsis that Problem 9-1 provides some ambiguity to the situation by changing the catalog prices near theend of the year.
Problem 9-2 (Time 25–30 minutes)Purpose—to provide the student with an understanding of the lower-of-cost-or-net realizable valueapproach to inventory valuation. The student is required to examine a number of individual items andapply the lower-of-cost-or-net realizable value rule and to also explain the use and value of the lower-of-cost-or-net realizable value rule.
Problem 9-3 (Time 30–35 minutes)Purpose—to provide a problem that requires entries for reducing inventory to lower-of-cost-or-netrealizable value under the perpetual inventory system using both the cost of goods sold and the lossmethod.
Problem 9-4 (Time 15-20 minutes)Purpose—to provide a problem that requires entries for recording the unrealized gains and losses onbiological assets and harvested assets.
Problem 9-5 (Time 20–30 minutes)Purpose—to provide another problem where a fire loss must be computed using the gross profit method.Certain goods remained undamaged and therefore an adjustment is necessary. In addition, the inventorywas subject to an obsolescence factor which must be considered.
Problem 9-6 (Time 40–45 minutes)Purpose—to provide the student with a complex problem involving a fire loss where the gross profitmethod must be employed. The problem is complicated because a number of adjustments must be madeto the purchases account related to merchandise returned, unrecorded purchases, and shipments intransit. In addition, some cash to accrual computations are necessary.
Problem 9-7 (Time 20–30 minutes)Purpose—to provide the student with a problem on the retail inventory method. The problem is relativelystraightforward although transfers-in from other departments as well as the proper treatment for normalspoilage complicate the problem. A good problem that summarizes the essentials of the retail inventorymethod.
Problem 9-8 (Time 20–30 minutes)Purpose—to provide the student with a problem on the retail inventory method. This problem is similarto Problem 9-7, except that a few different items must be evaluated in finding ending inventory at retailand cost. Unusual items in this problem are employee discounts granted and loss from breakage.A good problem that summarizes the essentials of the retail inventory method.
Problem 9-9 (Time 20–30 minutes)Purpose—to provide the student with a problem on the retail inventory method. This problem is similarto Problems 9-7 and 9-8, except that the student is asked to list the factors that may have caused thedifference between the computed inventory and the physical count.
9-34 Copyright © 2011 John Wiley & Sons, Inc. Kieso, IFRS, 1/e, Solutions Manual (For Instructor Use Only)
Time and Purpose of Problems (Continued)
Problem 9-10 (Time 30–40 minutes)Purpose—to provide the student with a problem requiring financial statement and note disclosure ofinventories, the income statement disclosure of an inventory market decline, and the treatment ofpurchase commitments.
Problem 9-11 (Time 30–40 minutes)Purpose—to provide the student with an opportunity to write a memo explaining what is net realizablevalue and how it is computed. As part of this memo, the student is required to compute inventory on thelower-of-cost-or-net realizable value basis using the individual item approach.
Copyright © 2011 John Wiley & Sons, Inc. Kieso, IFRS, 1/e, Solutions Manual (For Instructor Use Only) 9-35
SOLUTIONS TO PROBLEMS
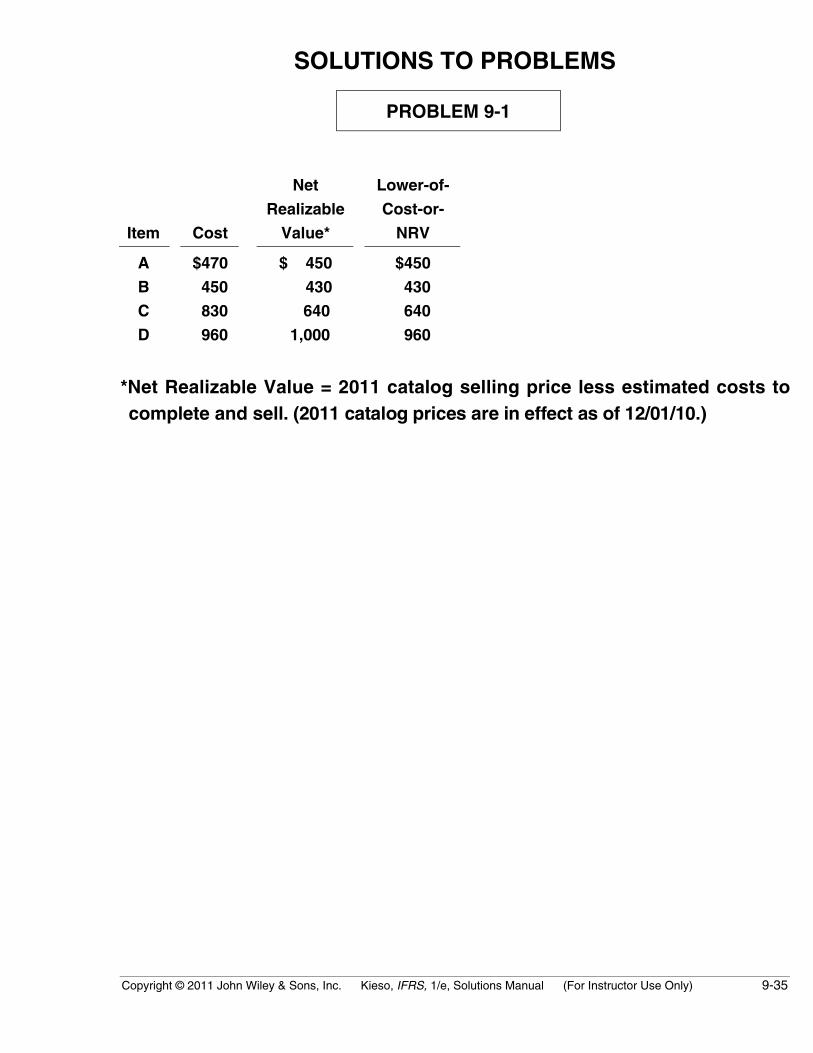
PROBLEM 9-1
Item Cost
Net
Realizable
Value*
Lower-of-
Cost-or-
NRV
A $470 $ 450 $450
B 450 430 430
C 830 640 640
D 960 1,000 960
*Net Realizable Value = 2011 catalog selling price less estimated costs tocomplete and sell. (2011 catalog prices are in effect as of 12/01/10.)

9-36 Copyright © 2011 John Wiley & Sons, Inc. Kieso, IFRS, 1/e, Solutions Manual (For Instructor Use Only)
PROBLEM 9-2
(a) 1. The balance in the Allowance to Reduce Inventory to NRV at May31, 2010, should be $15,200, as calculated in Exhibit 1 below.
Cost NRV LCNRV
Aluminum siding $ 70,000 $ 56,000 $ 56,000
Cedar shake siding 86,000 84,800 84,800
Louvered glass doors 112,000 168,300 112,000
Thermal windows 140,000 140,000 140,000
Totals $408,000 $449,100 $392,800
Inventory cost $408,000
LCNRV valuation 392,800
Allowance at May 31, 2010 $ 15,200
2. For the fiscal year ended May 31, 2010, the gain that would berecorded due to the change in the Allowance to Reduce Inventoryto Net Realizable Value would be $12,300, as calculated below.
Balance prior to adjustment...................................... $27,500Required balance.......................................................... (15,200)Gain to be recorded ..................................................... $(12,300)
Copyright © 2011 John Wiley & Sons, Inc. Kieso, IFRS, 1/e, Solutions Manual (For Instructor Use Only) 9-37
PROBLEM 9-2 (Continued)
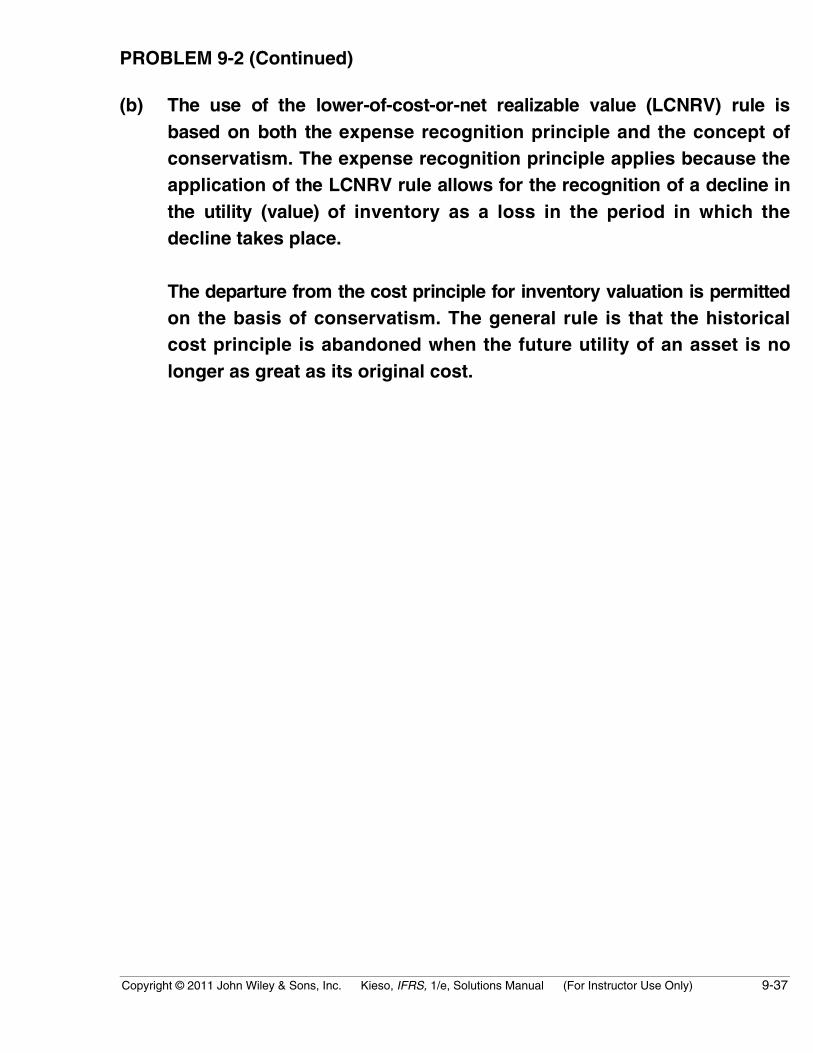
(b) The use of the lower-of-cost-or-net realizable value (LCNRV) rule isbased on both the expense recognition principle and the concept ofconservatism. The expense recognition principle applies because theapplication of the LCNRV rule allows for the recognition of a decline inthe utility (value) of inventory as a loss in the period in which thedecline takes place.
The departure from the cost principle for inventory valuation is permittedon the basis of conservatism. The general rule is that the historicalcost principle is abandoned when the future utility of an asset is nolonger as great as its original cost.
9-38 Copyright © 2011 John Wiley & Sons, Inc. Kieso, IFRS, 1/e, Solutions Manual (For Instructor Use Only)
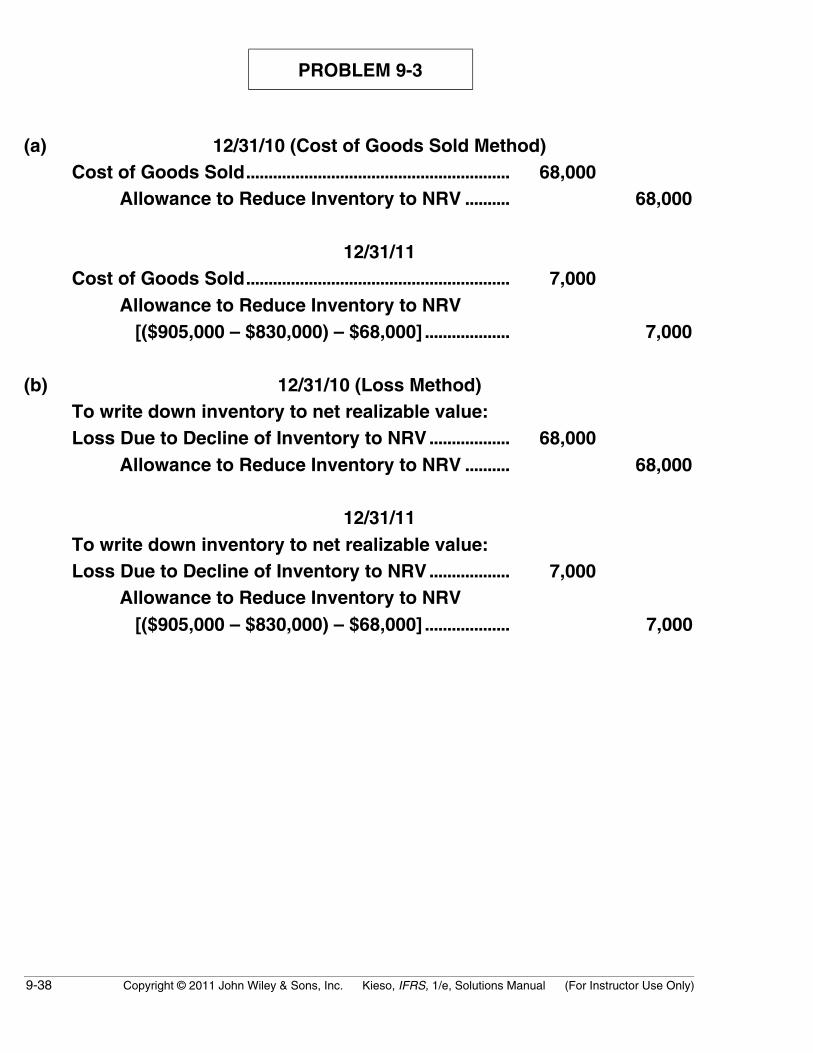
PROBLEM 9-3
(a) 12/31/10 (Cost of Goods Sold Method)Cost of Goods Sold........................................................... 68,000
Allowance to Reduce Inventory to NRV .......... 68,000
12/31/11Cost of Goods Sold........................................................... 7,000
Allowance to Reduce Inventory to NRV [($905,000 – $830,000) – $68,000] ................... 7,000
(b) 12/31/10 (Loss Method)To write down inventory to net realizable value:Loss Due to Decline of Inventory to NRV.................. 68,000
Allowance to Reduce Inventory to NRV .......... 68,000
12/31/11To write down inventory to net realizable value:Loss Due to Decline of Inventory to NRV.................. 7,000
Allowance to Reduce Inventory to NRV [($905,000 – $830,000) – $68,000] ................... 7,000
Copyright © 2011 John Wiley & Sons, Inc. Kieso, IFRS, 1/e, Solutions Manual (For Instructor Use Only) 9-39
PROBLEM 9-4
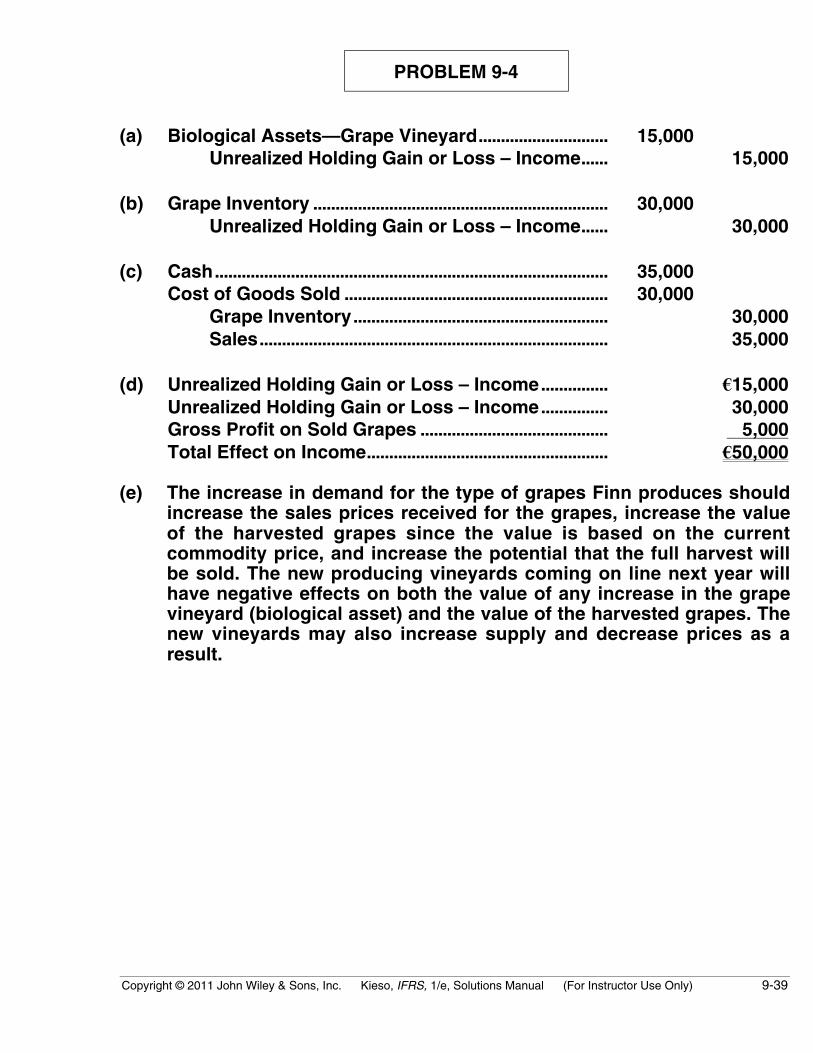
(a) Biological Assets—Grape Vineyard............................. 15,000Unrealized Holding Gain or Loss – Income...... 15,000
(b) Grape Inventory .................................................................. 30,000Unrealized Holding Gain or Loss – Income...... 30,000
(c) Cash........................................................................................ 35,000Cost of Goods Sold ........................................................... 30,000
Grape Inventory......................................................... 30,000Sales.............................................................................. 35,000
(d) Unrealized Holding Gain or Loss – Income............... €15,000Unrealized Holding Gain or Loss – Income............... 30,000Gross Profit on Sold Grapes .......................................... 5,000Total Effect on Income...................................................... €50,000
(e) The increase in demand for the type of grapes Finn produces shouldincrease the sales prices received for the grapes, increase the valueof the harvested grapes since the value is based on the currentcommodity price, and increase the potential that the full harvest willbe sold. The new producing vineyards coming on line next year willhave negative effects on both the value of any increase in the grapevineyard (biological asset) and the value of the harvested grapes. Thenew vineyards may also increase supply and decrease prices as aresult.
9-40 Copyright © 2011 John Wiley & Sons, Inc. Kieso, IFRS, 1/e, Solutions Manual (For Instructor Use Only)
PROBLEM 9-5
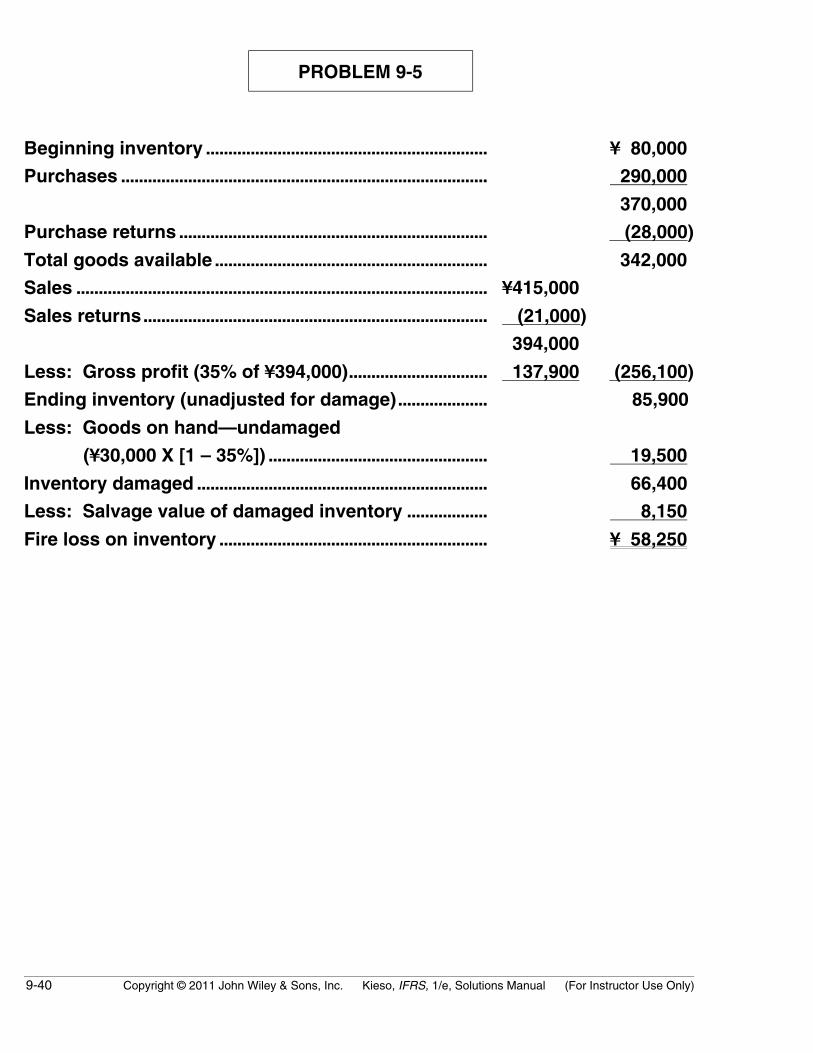
Beginning inventory ............................................................... ¥ 80,000
Purchases .................................................................................. 290,000
370,000
Purchase returns ..................................................................... (28,000)
Total goods available ............................................................. 342,000
Sales ............................................................................................ ¥415,000
Sales returns............................................................................. (21,000)
394,000
Less: Gross profit (35% of ¥394,000)............................... 137,900 (256,100)
Ending inventory (unadjusted for damage).................... 85,900
Less: Goods on hand—undamaged
(¥30,000 X [1 – 35%]) ................................................. 19,500
Inventory damaged ................................................................. 66,400
Less: Salvage value of damaged inventory .................. 8,150
Fire loss on inventory ............................................................ ¥ 58,250
Copyright © 2011 John Wiley & Sons, Inc. Kieso, IFRS, 1/e, Solutions Manual (For Instructor Use Only) 9-41
PROBLEM 9-6
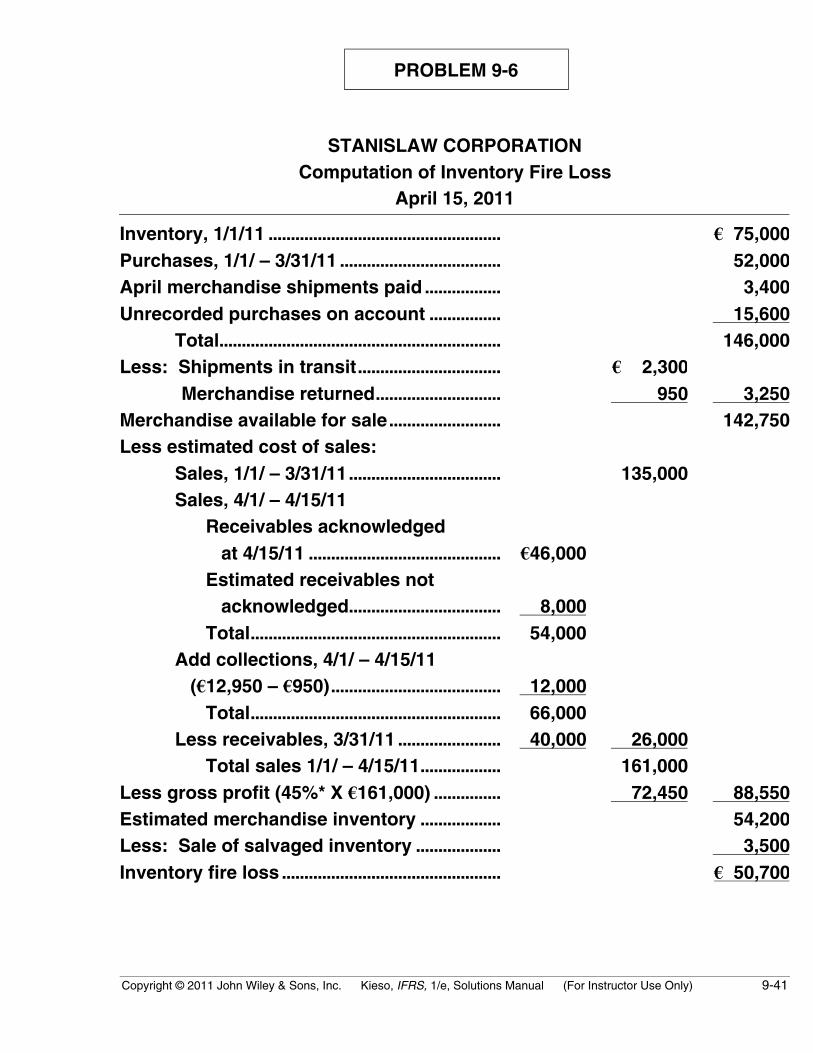
STANISLAW CORPORATIONComputation of Inventory Fire Loss
April 15, 2011
Inventory, 1/1/11 .................................................... € 75,000Purchases, 1/1/ – 3/31/11 .................................... 52,000April merchandise shipments paid ................. 3,400Unrecorded purchases on account ................ 15,600
Total............................................................... 146,000Less: Shipments in transit................................ € 2,300 Merchandise returned............................ 950 3,250Merchandise available for sale......................... 142,750Less estimated cost of sales:
Sales, 1/1/ – 3/31/11.................................. 135,000Sales, 4/1/ – 4/15/11 Receivables acknowledged at 4/15/11 ........................................... €46,000 Estimated receivables not acknowledged.................................. 8,000 Total........................................................ 54,000Add collections, 4/1/ – 4/15/11 (€12,950 – €950)...................................... 12,000 Total........................................................ 66,000Less receivables, 3/31/11 ....................... 40,000 26,000 Total sales 1/1/ – 4/15/11.................. 161,000
Less gross profit (45%* X €161,000) ............... 72,450 88,550Estimated merchandise inventory .................. 54,200Less: Sale of salvaged inventory ................... 3,500Inventory fire loss ................................................. € 50,700

9-42 Copyright © 2011 John Wiley & Sons, Inc. Kieso, IFRS, 1/e, Solutions Manual (For Instructor Use Only)
PROBLEM 9-6 (Continued)
*Computation of Gross Profit Ratio
Net sales, 2009 ......................................................... €390,000
Net sales, 2010 ......................................................... 530,000
Total net sales .............................................. 920,000
Beginning inventory ............................................... € 66,000
Net purchases, 2009 ............................................... 235,000
Net purchases, 2010 ............................................... 280,000
Total................................................................. 581,000
Less: Ending inventory ........................................ 75,000 506,000
Gross profit .................................................. €414,000
Gross profit ratio (€414,000 ÷ €920,000)........... 45%

Copyright © 2011 John Wiley & Sons, Inc. Kieso, IFRS, 1/e, Solutions Manual (For Instructor Use Only) 9-43
PROBLEM 9-7
(a) Cost Retail
Beginning Inventory.................... HK$ 17,000 HK$ 25,000
Purchases ....................................... 82,500 137,000
Freight-in......................................... 7,000
Purchase returns.......................... (2,300) (3,000)
Transfers in from suburban
branch........................................... 9,200 13,000
Totals ..................................... HK$113,400 172,000
Net markups................................... 8,000
180,000
Net markdowns ............................. (4,000)
Sales ................................................. HK$(95,000)
Sales returns.................................. 2,400 (92,600)
Inventory losses due to
breakage ...................................... (400)
Ending inventory at retail .......... HK$ 83,000
HK$113,400Cost-to-retail ratio =
HK$180,000= 63%
(b) Ending inventory at LCNRV
(63% of HK$83,000) ................................. HK$ 52,290

9-44 Copyright © 2011 John Wiley & Sons, Inc. Kieso, IFRS, 1/e, Solutions Manual (For Instructor Use Only)
PROBLEM 9-8
Cost Retail
Beginning Inventory ................................. $ 250,000 $ 390,000
Purchases .................................................... 914,500 1,460,000
Purchase returns ....................................... (60,000) (80,000)
Purchase discounts.................................. (18,000) —
Freight-in ...................................................... 42,000 —
Markups ........................................................ $ 120,000 —
Markup cancellations ............................... (40,000) 80,000
Totals .................................................. $1,128,500 1,850,000
Markdowns .................................................. (45,000) —
Markdown cancellations ......................... 20,000 (25,000)
Sales .............................................................. (1,410,000) —
Sales returns............................................... 97,500 (1,312,500)
Inventory losses due to breakage........ (4,500)
Employee discounts................................. (8,000)
Ending inventory at retail ....................... $ 500,000
$1,128,500Cost-to-retail ratio =
$1,850,000= 61%
Ending inventory at cost
(61% of $500,000) ................................... $ 305,000
Copyright © 2011 John Wiley & Sons, Inc. Kieso, IFRS, 1/e, Solutions Manual (For Instructor Use Only) 9-45
PROBLEM 9-9
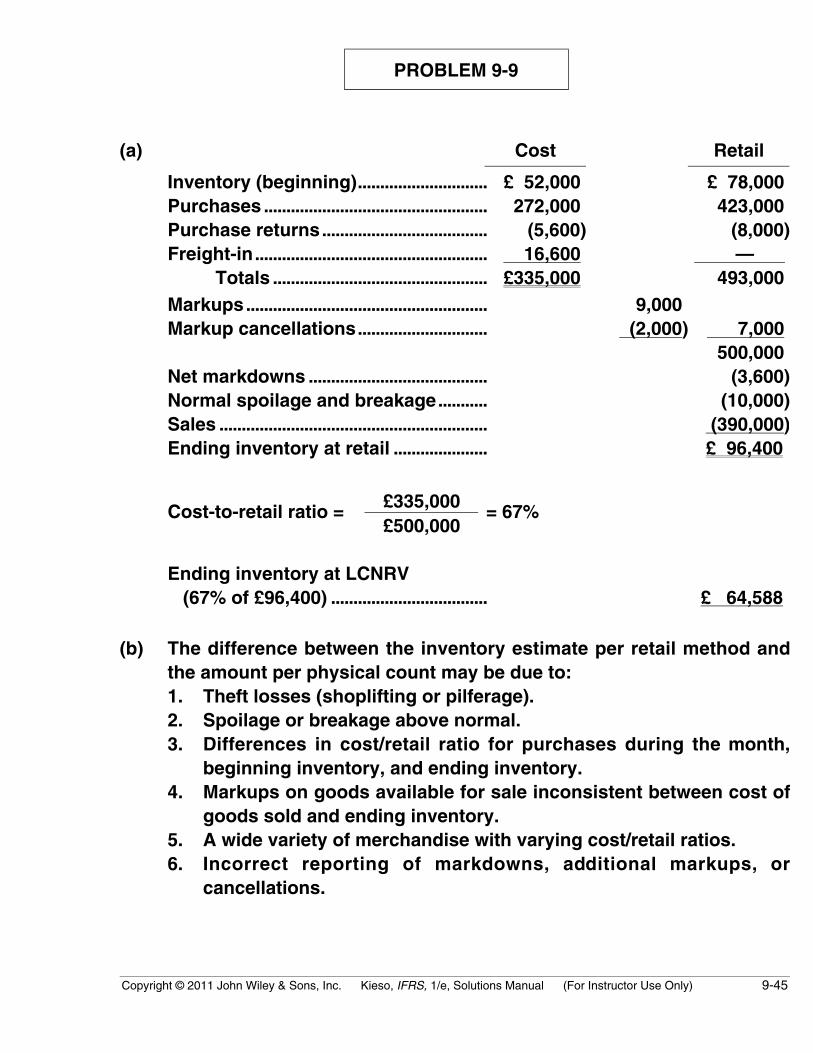
(a) Cost Retail
Inventory (beginning)............................. £ 52,000 £ 78,000Purchases .................................................. 272,000 423,000Purchase returns..................................... (5,600) (8,000)Freight-in.................................................... 16,600 —
Totals ................................................ £335,000 493,000Markups...................................................... 9,000Markup cancellations............................. (2,000) 7,000
500,000Net markdowns ........................................ (3,600)Normal spoilage and breakage........... (10,000)Sales ............................................................ (390,000)Ending inventory at retail ..................... £ 96,400
£335,000Cost-to-retail ratio =£500,000
= 67%
Ending inventory at LCNRV (67% of £96,400) ................................... £ 64,588
(b) The difference between the inventory estimate per retail method andthe amount per physical count may be due to:1. Theft losses (shoplifting or pilferage).2. Spoilage or breakage above normal.3. Differences in cost/retail ratio for purchases during the month,
beginning inventory, and ending inventory.4. Markups on goods available for sale inconsistent between cost of
goods sold and ending inventory.5. A wide variety of merchandise with varying cost/retail ratios.6. Incorrect reporting of markdowns, additional markups, or
cancellations.

9-46 Copyright © 2011 John Wiley & Sons, Inc. Kieso, IFRS, 1/e, Solutions Manual (For Instructor Use Only)
PROBLEM 9-10
(a) The inventory section of Maddox’s statement of financial position asof November 30, 2010, including required footnotes, is presentedbelow. Also presented below are the inventory section supportingcalculations.
Current assetsInventory Section (Note 1.)
Finished goods (Note 2.) ............................... $643,000Work-in-process ............................................... 108,700Raw materials.................................................... 237,400Factory supplies............................................... 64,800Total inventories............................................... $1,053,900
Note 1. Lower-of-cost (first-in, first-out) or-net realizable value isapplied on a major category basis for finished goods, and ona total inventory basis for work-in-process, raw materials,and factory supplies.
Note 2. Seventy-five percent of bar end shifters finished goodsinventory in the amount of $136,500 ($182,000 X .75) ispledged as collateral for a bank loan, and one-half of thehead tube shifters finished goods is held by catalog outletson consignment.

Copyright © 2011 John Wiley & Sons, Inc. Kieso, IFRS, 1/e, Solutions Manual (For Instructor Use Only) 9-47
PROBLEM 9-10 (Continued)
Supporting Calculations
FinishedGoods
Work-in-Process
RawMaterials
FactorySupplies
Down tube shifters at NRV .............. $266,000Bar end shifters at cost .................... 182,000Head tube shifters at cost................ 195,000Work-in-process at NRV................... $108,700Derailleurs at NRV .............................. $110,0001
Remaining items at NRV .................. 127,400Supplies at cost................................... $64,8002
Totals.......................................... $643,000 $108,700 $237,400 $64,800
1$264,000 X 1/2 = $132,000; $132,000 ÷ 1.2 = $110,000.2$69,000 – $4,200 = $64,800.
(b) The decline in the net realizable value of inventory below cost may bereported using one or two alternate methods, the cost of goods soldmethod or the loss method. The decline in the net realizable value ofinventory may be reflected in Maddox’s income statement as aseparate loss item for the fiscal year ended November 30, 2010. Theloss amount may also be written off directly, increasing the cost ofgoods sold on Maddox’s income statement. The loss must be reportedin continuing operations. The loss must be included in the incomestatement since it is material to Maddox’s financial statements.
(c) Purchase contracts for which a firm price has been established shouldbe disclosed on the financial statements of the buyer. If the contractprice is greater than the current market price and a loss is expectedwhen the purchase takes place, an unrealized holding loss amountingto the difference between the contracted price and the current marketprice should be recognized on the income statement in the periodduring which the price decline takes place. Also, an estimated liabilityon purchase commitments should be recognized on the statement offinancial position. The recognition of the loss is unnecessary if a firmsales commitment exists which precludes the loss.

9-48 Copyright © 2011 John Wiley & Sons, Inc. Kieso, IFRS, 1/e, Solutions Manual (For Instructor Use Only)
PROBLEM 9-11
(a) Schedule A
ItemOn HandQuantity Cost NRV
Lower-of-Cost-or-NRV
A 1,100 ¥7.50 ¥9.00 ¥7.50B 800 8.20 8.10 8.10C 1,000 5.60 5.45 5.45D 1,000 3.80 4.50 3.80E 1,400 6.40 6.00 6.00
Schedule B
Item Cost Lower-of-Cost-or-NRV DifferenceA 1,100 X ¥7.50 = ¥8,250 1,100 X ¥7.50 = ¥8,250 NoneB 800 X ¥8.20 = ¥6,560 800 X ¥8.10 = ¥6,480 ¥ 80C 1,000 X ¥5.60 = ¥5,600 1,000 X ¥5.45 = ¥5,450 ¥150D 1,000 X ¥3.80 = ¥3,800 1,000 X ¥3.80 = ¥3,800 NoneE 1,400 X ¥6.40 = ¥8,960 1,400 X ¥6.00 = ¥8,400 ¥560
¥790
(b) Cost of Goods Sold............................................................. 790 Allowance to Reduce Inventory to NRV.............. 790
or
Loss Due to Decline of Inventory to NRV................... 790 Allowance to Reduce Inventory to NRV............ 790
Copyright © 2011 John Wiley & Sons, Inc. Kieso, IFRS, 1/e, Solutions Manual (For Instructor Use Only) 9-49
PROBLEM 9-11 (Continued)
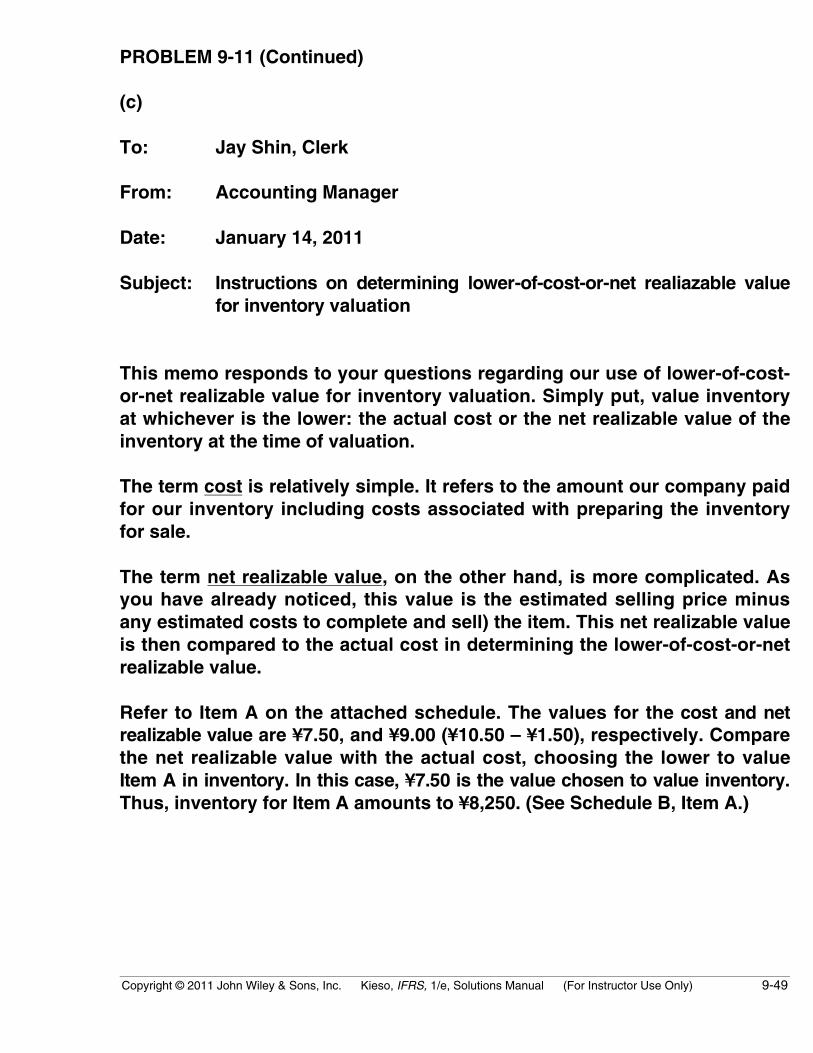
(c)
To: Jay Shin, Clerk
From: Accounting Manager
Date: January 14, 2011
Subject: Instructions on determining lower-of-cost-or-net realiazable valuefor inventory valuation
This memo responds to your questions regarding our use of lower-of-cost-or-net realizable value for inventory valuation. Simply put, value inventoryat whichever is the lower: the actual cost or the net realizable value of theinventory at the time of valuation.
The term cost is relatively simple. It refers to the amount our company paidfor our inventory including costs associated with preparing the inventoryfor sale.
The term net realizable value, on the other hand, is more complicated. Asyou have already noticed, this value is the estimated selling price minusany estimated costs to complete and sell) the item. This net realizable valueis then compared to the actual cost in determining the lower-of-cost-or-netrealizable value.
Refer to Item A on the attached schedule. The values for the cost and netrealizable value are ¥7.50, and ¥9.00 (¥10.50 – ¥1.50), respectively. Comparethe net realizable value with the actual cost, choosing the lower to valueItem A in inventory. In this case, ¥7.50 is the value chosen to value inventory.Thus, inventory for Item A amounts to ¥8,250. (See Schedule B, Item A.)
9-50 Copyright © 2011 John Wiley & Sons, Inc. Kieso, IFRS, 1/e, Solutions Manual (For Instructor Use Only)
PROBLEM 9-11 (Continued)
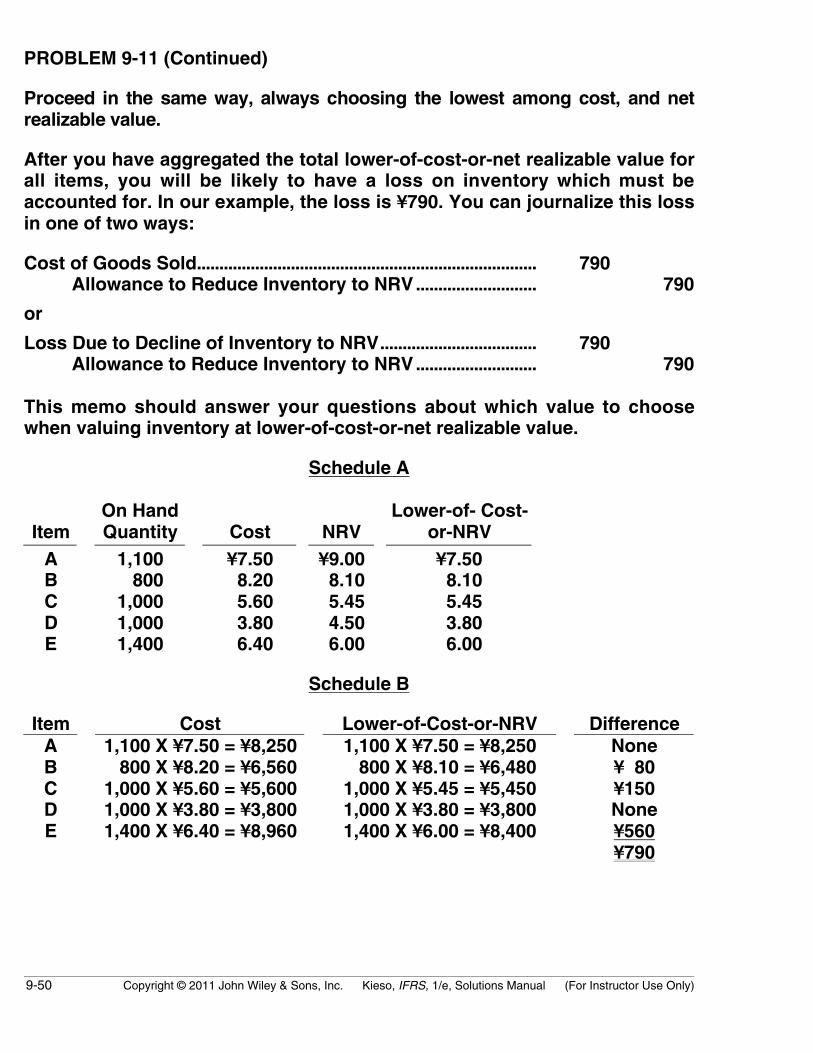
Proceed in the same way, always choosing the lowest among cost, and netrealizable value.
After you have aggregated the total lower-of-cost-or-net realizable value forall items, you will be likely to have a loss on inventory which must beaccounted for. In our example, the loss is ¥790. You can journalize this lossin one of two ways:
Cost of Goods Sold............................................................................ 790Allowance to Reduce Inventory to NRV........................... 790
or
Loss Due to Decline of Inventory to NRV................................... 790Allowance to Reduce Inventory to NRV........................... 790
This memo should answer your questions about which value to choosewhen valuing inventory at lower-of-cost-or-net realizable value.
Schedule A
ItemOn HandQuantity Cost NRV
Lower-of- Cost-or-NRV
A 1,100 ¥7.50 ¥9.00 ¥7.50B 800 8.20 8.10 8.10C 1,000 5.60 5.45 5.45D 1,000 3.80 4.50 3.80E 1,400 6.40 6.00 6.00
Schedule B
Item Cost Lower-of-Cost-or-NRV DifferenceA 1,100 X ¥7.50 = ¥8,250 1,100 X ¥7.50 = ¥8,250 NoneB 800 X ¥8.20 = ¥6,560 800 X ¥8.10 = ¥6,480 ¥ 80C 1,000 X ¥5.60 = ¥5,600 1,000 X ¥5.45 = ¥5,450 ¥150D 1,000 X ¥3.80 = ¥3,800 1,000 X ¥3.80 = ¥3,800 NoneE 1,400 X ¥6.40 = ¥8,960 1,400 X ¥6.00 = ¥8,400 ¥560
¥790
Copyright © 2011 John Wiley & Sons, Inc. Kieso, IFRS, 1/e, Solutions Manual (For Instructor Use Only) 9-51
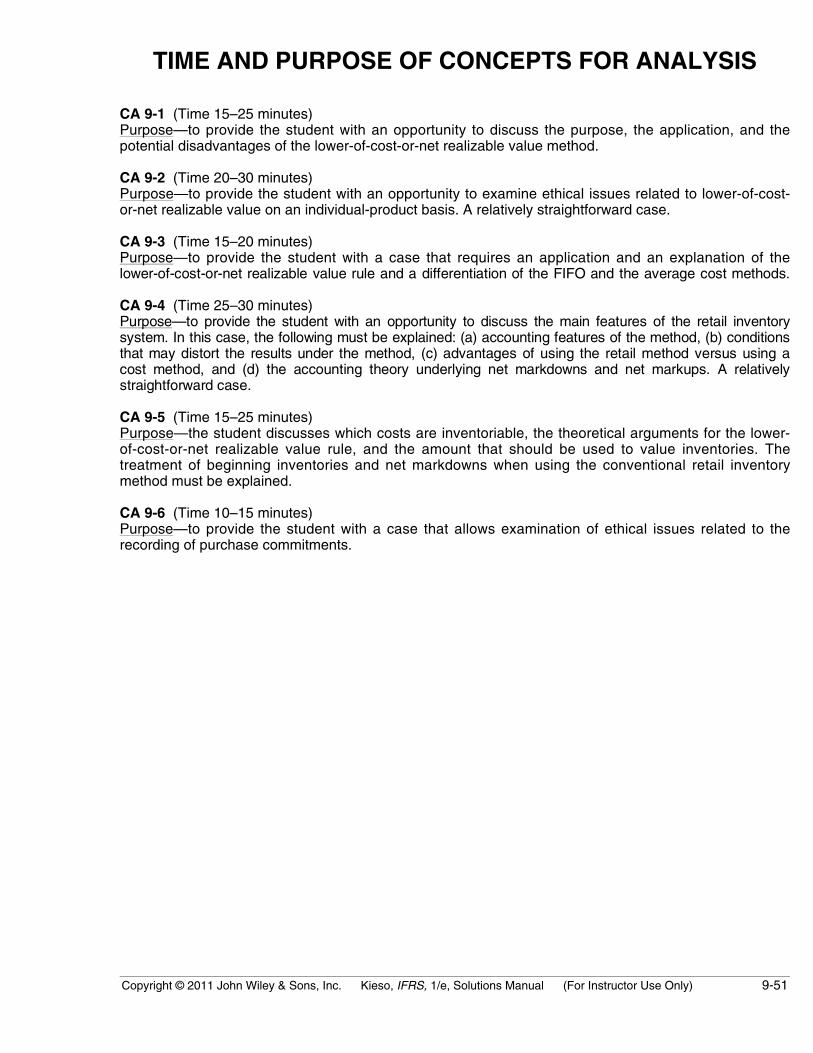
TIME AND PURPOSE OF CONCEPTS FOR ANALYSIS
CA 9-1 (Time 15–25 minutes)Purpose—to provide the student with an opportunity to discuss the purpose, the application, and thepotential disadvantages of the lower-of-cost-or-net realizable value method.
CA 9-2 (Time 20–30 minutes)Purpose—to provide the student with an opportunity to examine ethical issues related to lower-of-cost-or-net realizable value on an individual-product basis. A relatively straightforward case.
CA 9-3 (Time 15–20 minutes)Purpose—to provide the student with a case that requires an application and an explanation of thelower-of-cost-or-net realizable value rule and a differentiation of the FIFO and the average cost methods.
CA 9-4 (Time 25–30 minutes)Purpose—to provide the student with an opportunity to discuss the main features of the retail inventorysystem. In this case, the following must be explained: (a) accounting features of the method, (b) conditionsthat may distort the results under the method, (c) advantages of using the retail method versus using acost method, and (d) the accounting theory underlying net markdowns and net markups. A relativelystraightforward case.
CA 9-5 (Time 15–25 minutes)Purpose—the student discusses which costs are inventoriable, the theoretical arguments for the lower-of-cost-or-net realizable value rule, and the amount that should be used to value inventories. Thetreatment of beginning inventories and net markdowns when using the conventional retail inventorymethod must be explained.
CA 9-6 (Time 10–15 minutes)Purpose—to provide the student with a case that allows examination of ethical issues related to therecording of purchase commitments.
9-52 Copyright © 2011 John Wiley & Sons, Inc. Kieso, IFRS, 1/e, Solutions Manual (For Instructor Use Only)
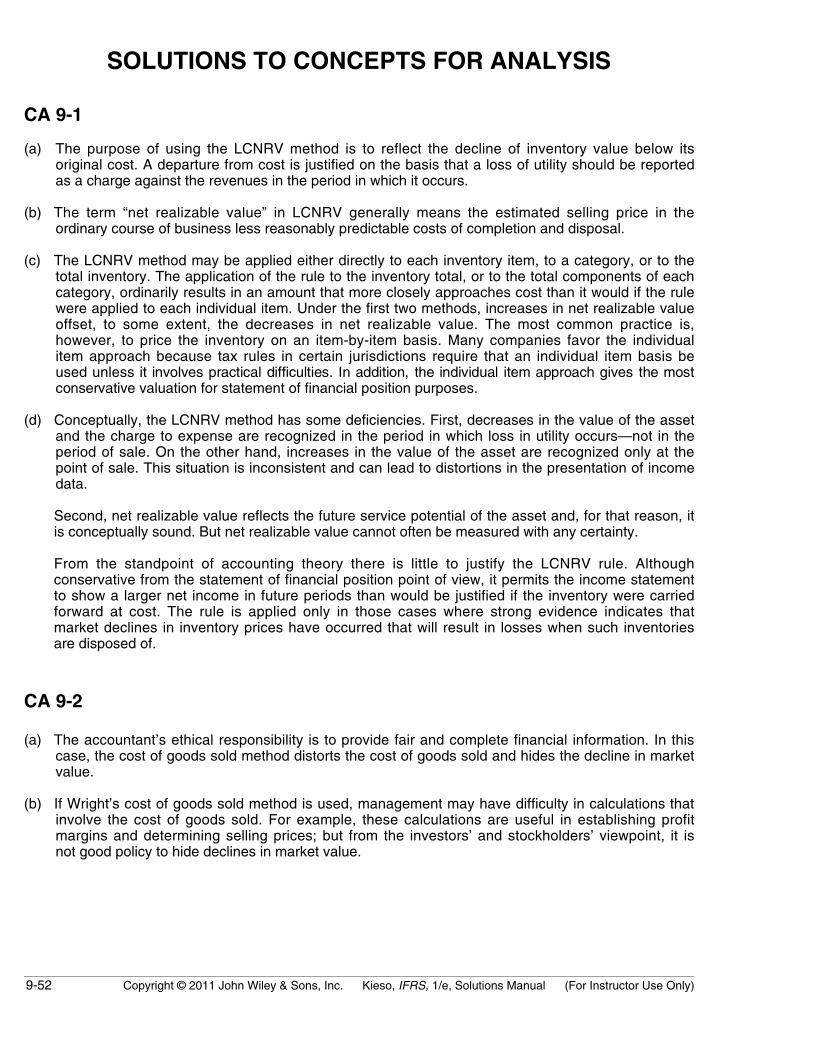
SOLUTIONS TO CONCEPTS FOR ANALYSIS
CA 9-1
(a) The purpose of using the LCNRV method is to reflect the decline of inventory value below itsoriginal cost. A departure from cost is justified on the basis that a loss of utility should be reportedas a charge against the revenues in the period in which it occurs.
(b) The term “net realizable value” in LCNRV generally means the estimated selling price in theordinary course of business less reasonably predictable costs of completion and disposal.
(c) The LCNRV method may be applied either directly to each inventory item, to a category, or to thetotal inventory. The application of the rule to the inventory total, or to the total components of eachcategory, ordinarily results in an amount that more closely approaches cost than it would if the rulewere applied to each individual item. Under the first two methods, increases in net realizable valueoffset, to some extent, the decreases in net realizable value. The most common practice is,however, to price the inventory on an item-by-item basis. Many companies favor the individualitem approach because tax rules in certain jurisdictions require that an individual item basis beused unless it involves practical difficulties. In addition, the individual item approach gives the mostconservative valuation for statement of financial position purposes.
(d) Conceptually, the LCNRV method has some deficiencies. First, decreases in the value of the assetand the charge to expense are recognized in the period in which loss in utility occurs—not in theperiod of sale. On the other hand, increases in the value of the asset are recognized only at thepoint of sale. This situation is inconsistent and can lead to distortions in the presentation of incomedata.
Second, net realizable value reflects the future service potential of the asset and, for that reason, itis conceptually sound. But net realizable value cannot often be measured with any certainty.
From the standpoint of accounting theory there is little to justify the LCNRV rule. Althoughconservative from the statement of financial position point of view, it permits the income statementto show a larger net income in future periods than would be justified if the inventory were carriedforward at cost. The rule is applied only in those cases where strong evidence indicates thatmarket declines in inventory prices have occurred that will result in losses when such inventoriesare disposed of.
CA 9-2
(a) The accountant’s ethical responsibility is to provide fair and complete financial information. In thiscase, the cost of goods sold method distorts the cost of goods sold and hides the decline in marketvalue.
(b) If Wright’s cost of goods sold method is used, management may have difficulty in calculations thatinvolve the cost of goods sold. For example, these calculations are useful in establishing profitmargins and determining selling prices; but from the investors’ and stockholders’ viewpoint, it isnot good policy to hide declines in market value.

Copyright © 2011 John Wiley & Sons, Inc. Kieso, IFRS, 1/e, Solutions Manual (For Instructor Use Only) 9-53
CA 9-2 (Continued)
(c) Conan should use the loss method to disclose the decline in market value and avoid distorting costof goods sold. However, she faces an ethical dilemma if Wright will not accept the method Conanwants to use. She should consider various alternatives including the extremes of simply acceptingher boss’s decision to quitting if Wright will not change his mind. Conan should assess theconsequences of each possible alternative and weigh them carefully before she decides what to do.
CA 9-3
(a) (1) Ogala’s inventory should be reported at net realizable value consistent with the LCNRV rulesince net realizable value is below original cost.
(2) The LCNRV rule is used to report the inventory in the statement of financial position at itsfuture utility value. It also recognizes a decline in the utility of inventory in the incomestatement in the period in which the decline occurs.
(b) Generally, ending inventory would have been higher and cost of goods sold would have beenlower had Ogala used the average cost inventory method in a period of declining prices. Inventoryquantities increased and average cost associates the all purchase prices with inventory. However,in this instance, there would have been no effect on ending inventory or cost of goods sold hadOgala used the average inventory method because Ogala’s inventory would have been reported atnet realizable value according to the LCNRV rule. Net realizable value of the inventory is less thaneither its average cost or FIFO cost.
CA 9-4
(a) The retail inventory method can be employed to estimate retail, wholesale, and manufacturingfinished goods inventories.
The valuation of inventory under this method is arrived at by reducing the ending inventory at retailto an estimate of LCNRV. The retail value of ending inventory can be computed by (1) taking aphysical inventory, or by (2) subtracting net sales and net markdowns from the total retail value ofmerchandise available for sale (i.e., the sum of beginning inventory at retail, net purchases atretail, and net markups). The reduction of ending inventory at retail to an estimate of the lower-of-cost-or-market is accomplished by applying to it an estimated cost ratio arrived at by dividing theretail value of merchandise available for sale as computed in (2) above into the cost ofmerchandise available for sale (i.e., the sum of beginning inventory, net purchases, and otherinventoriable costs).
(b) Since the retail method is based on an estimated cost ratio involving total merchandise availableduring the period, its validity depends on the underlying assumption that the merchandise inending inventory is a representative mixture of all merchandise handled. If this condition does notexist, the cost ratio may not be appropriate for the merchandise in ending inventory and can resultin significant error.
Where there are a number of inventory subdivisions for which differing rates of markup aremaintained, there is no assurance that the ending inventory mix will be representative of the totalmerchandise handled during the period. In such cases accurate results can be obtained by sub-classifications by rate of markup.
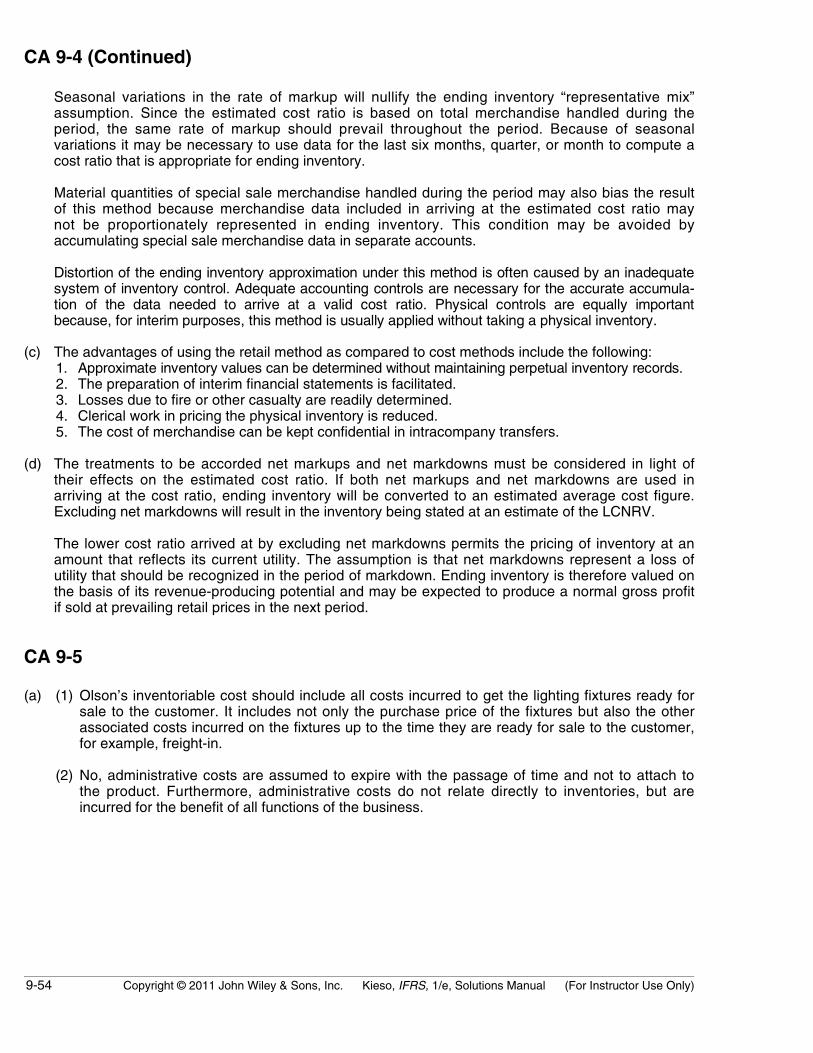
9-54 Copyright © 2011 John Wiley & Sons, Inc. Kieso, IFRS, 1/e, Solutions Manual (For Instructor Use Only)
CA 9-4 (Continued)
Seasonal variations in the rate of markup will nullify the ending inventory “representative mix”assumption. Since the estimated cost ratio is based on total merchandise handled during theperiod, the same rate of markup should prevail throughout the period. Because of seasonalvariations it may be necessary to use data for the last six months, quarter, or month to compute acost ratio that is appropriate for ending inventory.
Material quantities of special sale merchandise handled during the period may also bias the resultof this method because merchandise data included in arriving at the estimated cost ratio maynot be proportionately represented in ending inventory. This condition may be avoided byaccumulating special sale merchandise data in separate accounts.
Distortion of the ending inventory approximation under this method is often caused by an inadequatesystem of inventory control. Adequate accounting controls are necessary for the accurate accumula-tion of the data needed to arrive at a valid cost ratio. Physical controls are equally importantbecause, for interim purposes, this method is usually applied without taking a physical inventory.
(c) The advantages of using the retail method as compared to cost methods include the following:1. Approximate inventory values can be determined without maintaining perpetual inventory records.2. The preparation of interim financial statements is facilitated.3. Losses due to fire or other casualty are readily determined.4. Clerical work in pricing the physical inventory is reduced.5. The cost of merchandise can be kept confidential in intracompany transfers.
(d) The treatments to be accorded net markups and net markdowns must be considered in light oftheir effects on the estimated cost ratio. If both net markups and net markdowns are used inarriving at the cost ratio, ending inventory will be converted to an estimated average cost figure.Excluding net markdowns will result in the inventory being stated at an estimate of the LCNRV.
The lower cost ratio arrived at by excluding net markdowns permits the pricing of inventory at anamount that reflects its current utility. The assumption is that net markdowns represent a loss ofutility that should be recognized in the period of markdown. Ending inventory is therefore valued onthe basis of its revenue-producing potential and may be expected to produce a normal gross profitif sold at prevailing retail prices in the next period.
CA 9-5
(a) (1) Olson’s inventoriable cost should include all costs incurred to get the lighting fixtures ready forsale to the customer. It includes not only the purchase price of the fixtures but also the otherassociated costs incurred on the fixtures up to the time they are ready for sale to the customer,for example, freight-in.
(2) No, administrative costs are assumed to expire with the passage of time and not to attach tothe product. Furthermore, administrative costs do not relate directly to inventories, but areincurred for the benefit of all functions of the business.
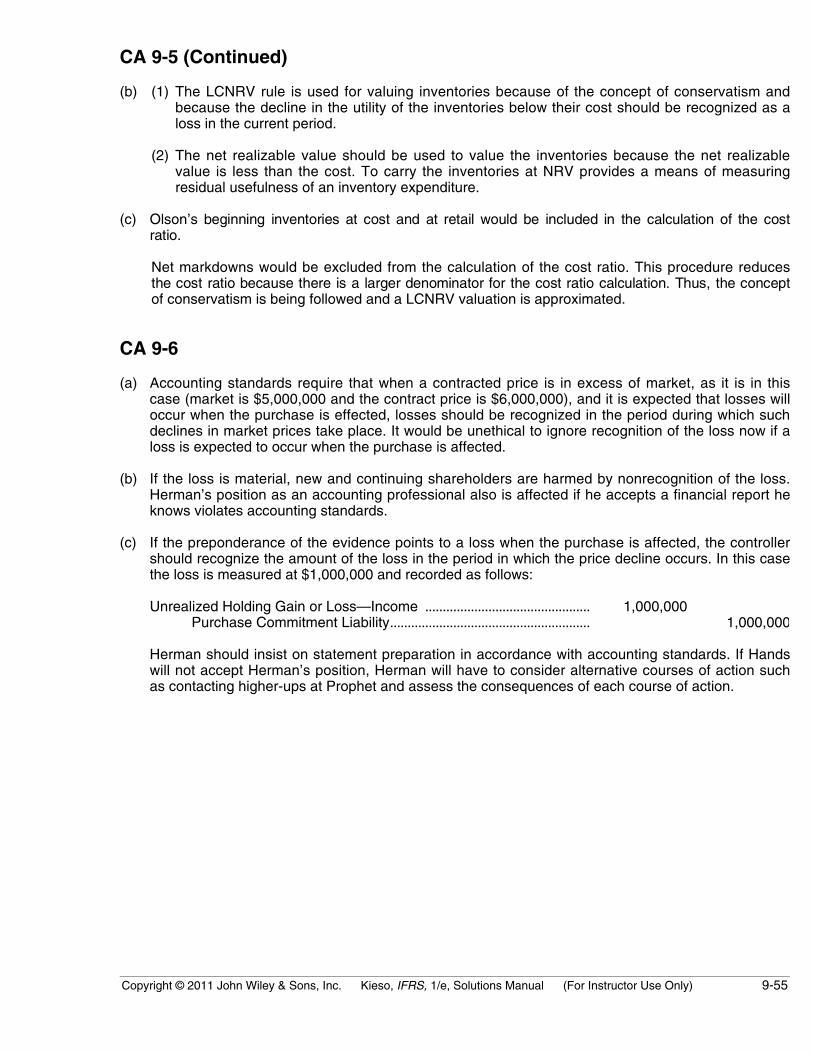
Copyright © 2011 John Wiley & Sons, Inc. Kieso, IFRS, 1/e, Solutions Manual (For Instructor Use Only) 9-55
CA 9-5 (Continued)
(b) (1) The LCNRV rule is used for valuing inventories because of the concept of conservatism andbecause the decline in the utility of the inventories below their cost should be recognized as aloss in the current period.
(2) The net realizable value should be used to value the inventories because the net realizablevalue is less than the cost. To carry the inventories at NRV provides a means of measuringresidual usefulness of an inventory expenditure.
(c) Olson’s beginning inventories at cost and at retail would be included in the calculation of the costratio.
Net markdowns would be excluded from the calculation of the cost ratio. This procedure reducesthe cost ratio because there is a larger denominator for the cost ratio calculation. Thus, the conceptof conservatism is being followed and a LCNRV valuation is approximated.
CA 9-6
(a) Accounting standards require that when a contracted price is in excess of market, as it is in thiscase (market is $5,000,000 and the contract price is $6,000,000), and it is expected that losses willoccur when the purchase is effected, losses should be recognized in the period during which suchdeclines in market prices take place. It would be unethical to ignore recognition of the loss now if aloss is expected to occur when the purchase is affected.
(b) If the loss is material, new and continuing shareholders are harmed by nonrecognition of the loss.Herman’s position as an accounting professional also is affected if he accepts a financial report heknows violates accounting standards.
(c) If the preponderance of the evidence points to a loss when the purchase is affected, the controllershould recognize the amount of the loss in the period in which the price decline occurs. In this casethe loss is measured at $1,000,000 and recorded as follows:
Unrealized Holding Gain or Loss—Income ............................................... 1,000,000Purchase Commitment Liability......................................................... 1,000,000
Herman should insist on statement preparation in accordance with accounting standards. If Handswill not accept Herman’s position, Herman will have to consider alternative courses of action suchas contacting higher-ups at Prophet and assess the consequences of each course of action.

9-56 Copyright © 2011 John Wiley & Sons, Inc. Kieso, IFRS, 1/e, Solutions Manual (For Instructor Use Only)
FINANCIAL REPORTING PROBLEM
(a) Inventories are valued at the lower-of-cost-or-net realisable value usingthe retail method, which is computed on the basis of selling price lessthe appropriate trading margin. All inventories are finished goods.
(b) Inventories are reported on the statement of financial position simplyas “Inventories.” The footnotes indicate that all inventories arefinished goods.
(c) The only information given is “The cost of sales above represents costof inventories recognised as an expense in the year.”
Cost of Sales £5,535.2(d) Inventory turnover =Average Inventory
=£488.9 + £416.3
2 = 12.23 or approximately 30 days to turn its inventory. Turnover
remains high.
Its gross profit percentages for 2008 and 2007 are as follows:
2008 2007Net sales................................... £9,022.0 £8,588.1Cost of sales ........................... 5,535.2 5,246.9Gross profit ............................. £3,486.8 £3,341.2
Gross profit percentage ...... 38.6% 38.9%
M&S had a small improvement in its gross profit and and slightdecline in gross profit percentage. Sales in 2008 showed a 5.1%increase, due to increased UK locations and strong internationalperformance. It appears that M&S has been able to maintain grossprofit percentage on these increased sales.
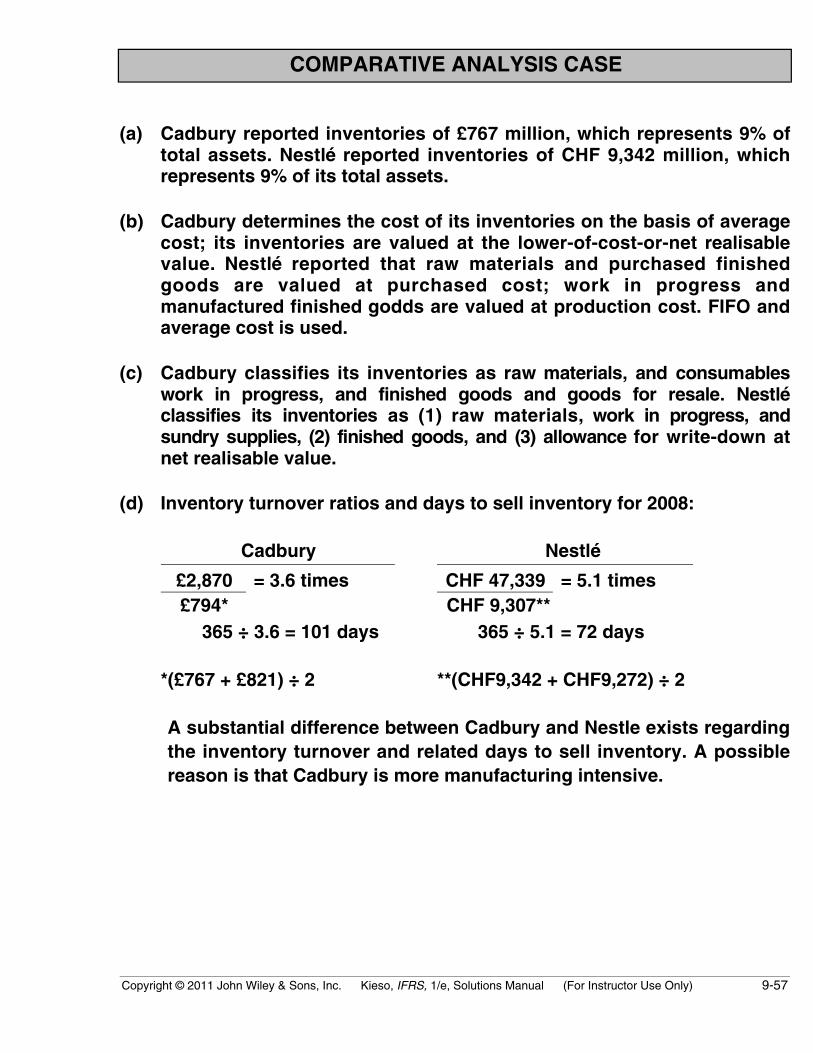
Copyright © 2011 John Wiley & Sons, Inc. Kieso, IFRS, 1/e, Solutions Manual (For Instructor Use Only) 9-57
COMPARATIVE ANALYSIS CASE
(a) Cadbury reported inventories of £767 million, which represents 9% oftotal assets. Nestlé reported inventories of CHF 9,342 million, whichrepresents 9% of its total assets.
(b) Cadbury determines the cost of its inventories on the basis of averagecost; its inventories are valued at the lower-of-cost-or-net realisablevalue. Nestlé reported that raw materials and purchased finishedgoods are valued at purchased cost; work in progress andmanufactured finished godds are valued at production cost. FIFO andaverage cost is used.
(c) Cadbury classifies its inventories as raw materials, and consumableswork in progress, and finished goods and goods for resale. Nestléclassifies its inventories as (1) raw materials, work in progress, andsundry supplies, (2) finished goods, and (3) allowance for write-down atnet realisable value.
(d) Inventory turnover ratios and days to sell inventory for 2008:
Cadbury Nestlé
£2,870 = 3.6 times CHF 47,339 = 5.1 times£794* CHF 9,307**
365 ÷ 3.6 = 101 days 365 ÷ 5.1 = 72 days
*(£767 + £821) ÷ 2 **(CHF9,342 + CHF9,272) ÷ 2
A substantial difference between Cadbury and Nestle exists regardingthe inventory turnover and related days to sell inventory. A possiblereason is that Cadbury is more manufacturing intensive.

9-58 Copyright © 2011 John Wiley & Sons, Inc. Kieso, IFRS, 1/e, Solutions Manual (For Instructor Use Only)
FINANCIAL STATEMENT ANALYSIS CASE
(a) There are probably no finished goods because gold is a highly liquidcommodity, and so it can be sold as soon as processing is complete.Ore in stockpiles is a noncurrent asset probably because processingtakes more than one year.
(b) Sales are recorded as follows:
Accounts Receivable or Cash................................ XXXSales Revenue .................................................... XXX
AND
Cost of Goods Sold .................................................. XXXGold in Process Inventory ............................. XXX
(c) Statement of Financial Position Income Statement
Inventory Overstated Cost of goods sold UnderstatedRetained earnings Overstated Net income OverstatedAccounts payable No effectWorking capital OverstatedCurrent ratio Overstated
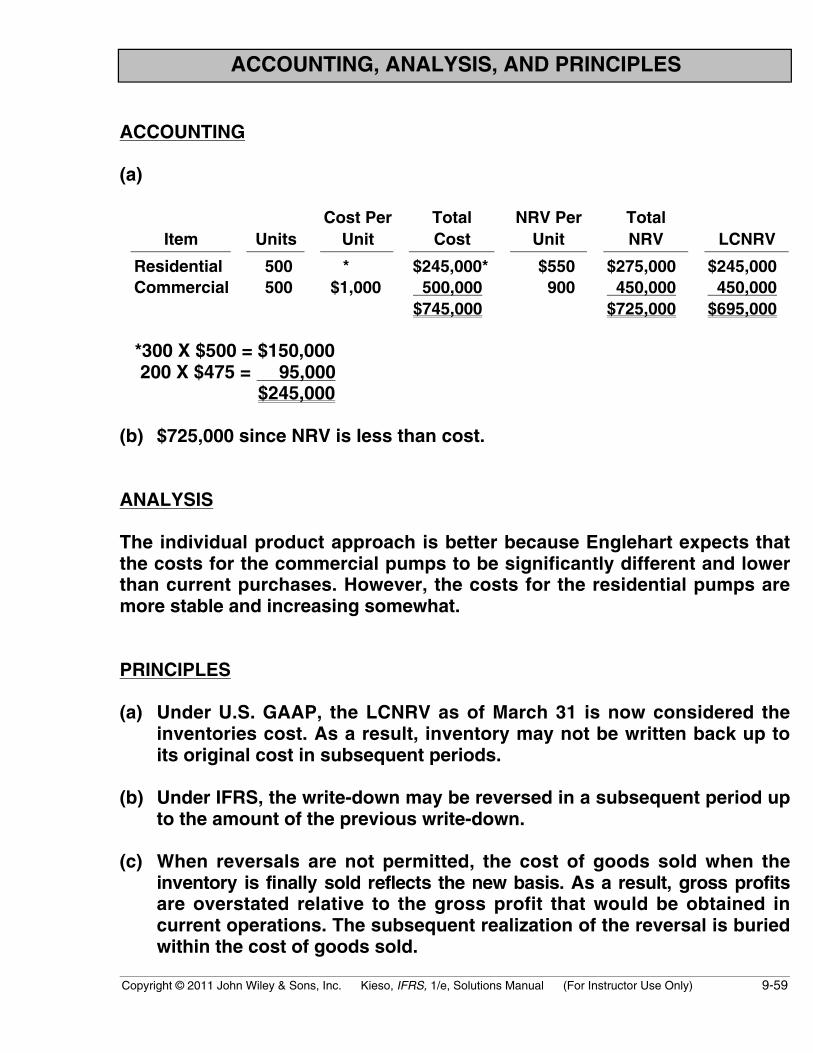
Copyright © 2011 John Wiley & Sons, Inc. Kieso, IFRS, 1/e, Solutions Manual (For Instructor Use Only) 9-59
ACCOUNTING, ANALYSIS, AND PRINCIPLES
ACCOUNTING
(a)
Item UnitsCost Per
UnitTotalCost
NRV PerUnit
TotalNRV LCNRV
Residential 500 * $245,000* $550 $275,000 $245,000Commercial 500 $1,000 500,000 900 450,000 450,000
$745,000 $725,000 $695,000
*300 X $500 = $150,000 200 X $475 = 95,000
$245,000
(b) $725,000 since NRV is less than cost.
ANALYSIS
The individual product approach is better because Englehart expects thatthe costs for the commercial pumps to be significantly different and lowerthan current purchases. However, the costs for the residential pumps aremore stable and increasing somewhat.
PRINCIPLES
(a) Under U.S. GAAP, the LCNRV as of March 31 is now considered theinventories cost. As a result, inventory may not be written back up toits original cost in subsequent periods.
(b) Under IFRS, the write-down may be reversed in a subsequent period upto the amount of the previous write-down.
(c) When reversals are not permitted, the cost of goods sold when theinventory is finally sold reflects the new basis. As a result, gross profitsare overstated relative to the gross profit that would be obtained incurrent operations. The subsequent realization of the reversal is buriedwithin the cost of goods sold.
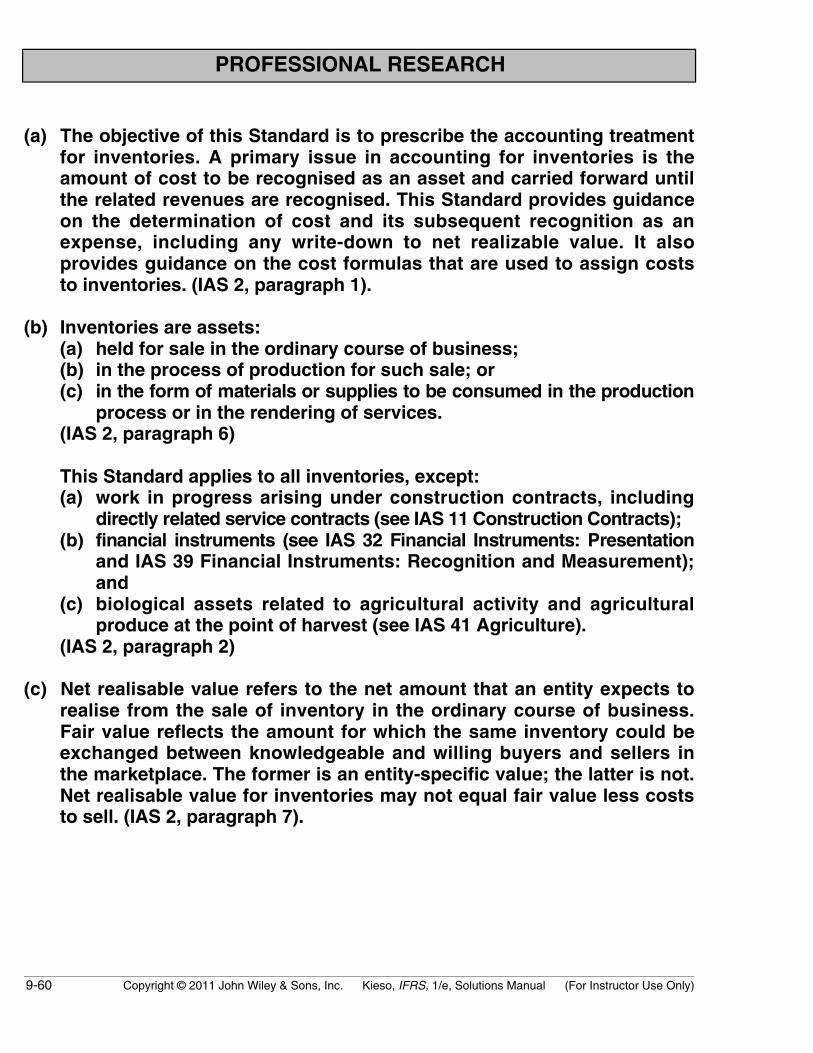
9-60 Copyright © 2011 John Wiley & Sons, Inc. Kieso, IFRS, 1/e, Solutions Manual (For Instructor Use Only)
PROFESSIONAL RESEARCH
(a) The objective of this Standard is to prescribe the accounting treatmentfor inventories. A primary issue in accounting for inventories is theamount of cost to be recognised as an asset and carried forward untilthe related revenues are recognised. This Standard provides guidanceon the determination of cost and its subsequent recognition as anexpense, including any write-down to net realizable value. It alsoprovides guidance on the cost formulas that are used to assign coststo inventories. (IAS 2, paragraph 1).
(b) Inventories are assets:(a) held for sale in the ordinary course of business;(b) in the process of production for such sale; or(c) in the form of materials or supplies to be consumed in the production
process or in the rendering of services.(IAS 2, paragraph 6)
This Standard applies to all inventories, except:(a) work in progress arising under construction contracts, including
directly related service contracts (see IAS 11 Construction Contracts);(b) financial instruments (see IAS 32 Financial Instruments: Presentation
and IAS 39 Financial Instruments: Recognition and Measurement);and
(c) biological assets related to agricultural activity and agriculturalproduce at the point of harvest (see IAS 41 Agriculture).
(IAS 2, paragraph 2)
(c) Net realisable value refers to the net amount that an entity expects torealise from the sale of inventory in the ordinary course of business.Fair value reflects the amount for which the same inventory could beexchanged between knowledgeable and willing buyers and sellers inthe marketplace. The former is an entity-specific value; the latter is not.Net realisable value for inventories may not equal fair value less coststo sell. (IAS 2, paragraph 7).

Copyright © 2011 John Wiley & Sons, Inc. Kieso, IFRS, 1/e, Solutions Manual (For Instructor Use Only) 9-61
PROFESSIONAL RESEARCH (Continued)
(d) This Standard does not apply to the measurement of inventories heldby:(a) producers of agricultural and forest products, agricultural produce
after harvest, and minerals and mineral products, to the extent thatthey are measured at net realisable value in accordance with well-established practices in those industries. When such inventoriesare measured at net realisable value, changes in that value arerecognised in profit or loss in the period of the change.
(b) commodity broker-traders who measure their inventories at fairvalue less costs to sell. When such inventories are measured at fairvalue less costs to sell, changes in fair value less costs to sell arerecognised in profit or loss in the period of the change.
(IAS 2, paragraph 3).
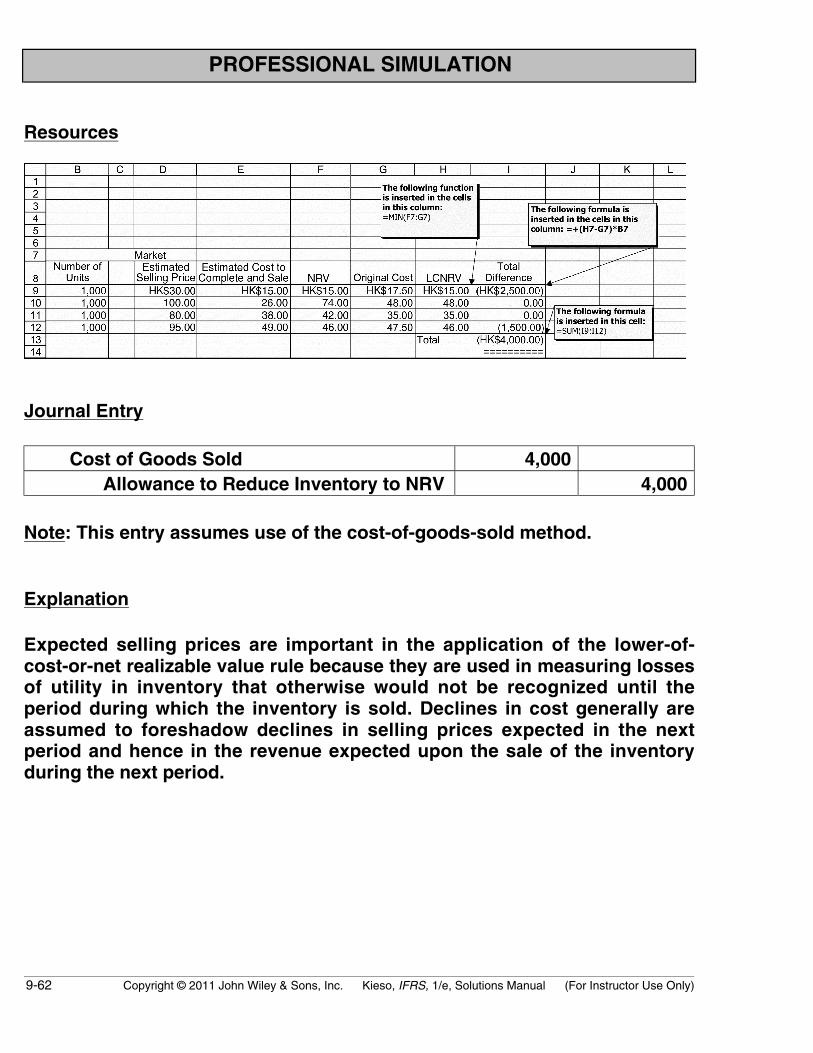
9-62 Copyright © 2011 John Wiley & Sons, Inc. Kieso, IFRS, 1/e, Solutions Manual (For Instructor Use Only)
PROFESSIONAL SIMULATION
Resources
Journal Entry
Cost of Goods Sold 4,000Allowance to Reduce Inventory to NRV 4,000
Note: This entry assumes use of the cost-of-goods-sold method.
Explanation
Expected selling prices are important in the application of the lower-of-cost-or-net realizable value rule because they are used in measuring lossesof utility in inventory that otherwise would not be recognized until theperiod during which the inventory is sold. Declines in cost generally areassumed to foreshadow declines in selling prices expected in the nextperiod and hence in the revenue expected upon the sale of the inventoryduring the next period.