assiniboine river water quality study … · assiniboine river water quality study nitrogen and...
TRANSCRIPT
ASSINIBOINE RIVER WATER QUALITY STUDY
NITROGEN AND PHOSPHORUS DYNAMICSMAY 2001 TO MAY 2002
By Nicole ArmstrongWater Quality Management Section,Water BranchManitoba Conservation
November 2002
Manitoba Conservation Report No. 2002-10

Manitoba Conservation Report No. 2002-10
November 2002
ASSINIBOINE RIVER WATER QUALITY STUDY
NITROGEN AND PHOSPHORUS DYNAMICSMAY 2001 TO MAY 2002
Nicole Armstrong
Water Quality Management SectionWater Branch
Manitoba Conservation
Printed on Recycled Paper
i
TABLE OF CONTENTS
Table of Contents…………………………………………………………………………..……….i
List of Tables……………………………………………………………………..………………...ii
List of Figures…………………………………………………………………………….….…….iii
Acknowledgements……………………………………………………………..…………………..1
Introduction…………………………………………………………………………….………….2
Methods…………………………………………………………………………….……………....3
Results……………………………………………………………………………..……………….6
Discussion……………………………………………………………………………….……..…12
Water Quality Modelling Implications……………………………………………………….……14
References…………………………………………………………………….…………………..15
Appendix One……………………………………………………………………………….……34
Appendix Two……………………………………………………………………………………35

ii
LIST OF TABLES
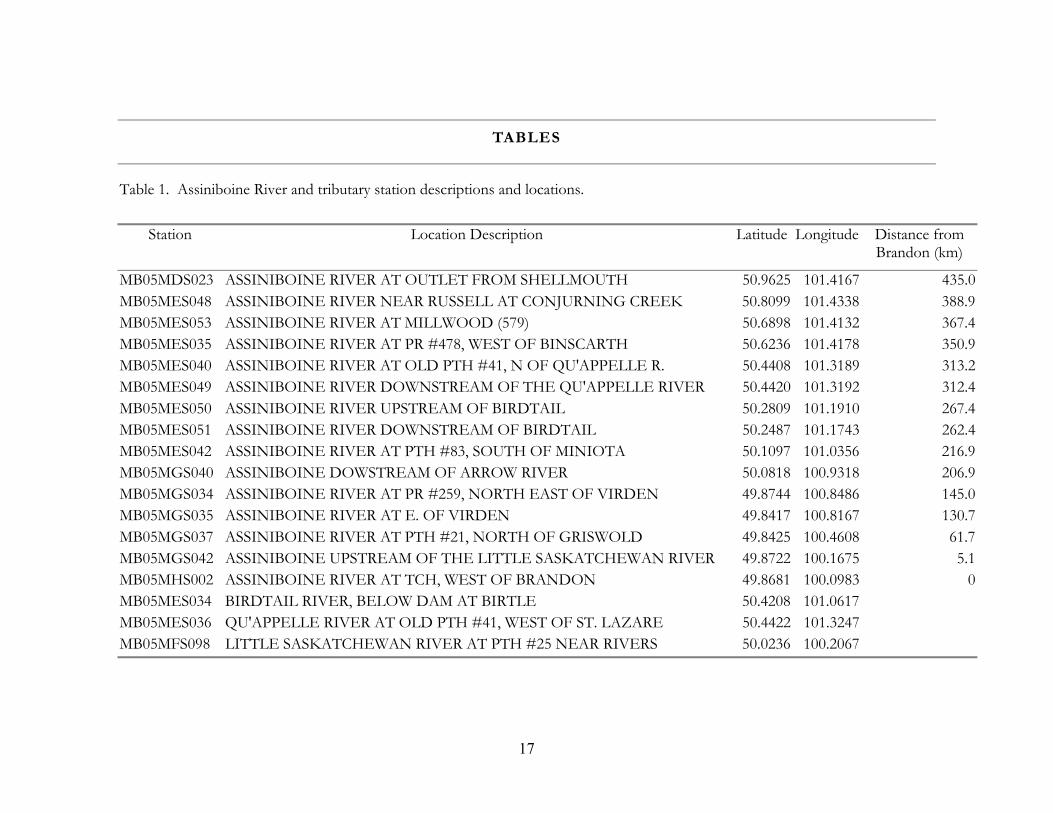
Table 1. Assiniboine River and tributary station descriptions and locations……………...………..17
Table 2. Percentage of the study area occupied by each type of land use (For Land Use Categorydescriptions please see Appendix 2)…………………………………………..…..….….18
Table 3. Average chemical concentrations for 15 Assiniboine River and three tributary stations forMay 2001 to May 2002……………………………………………………..……..….….19
iii
LIST OF FIGURES
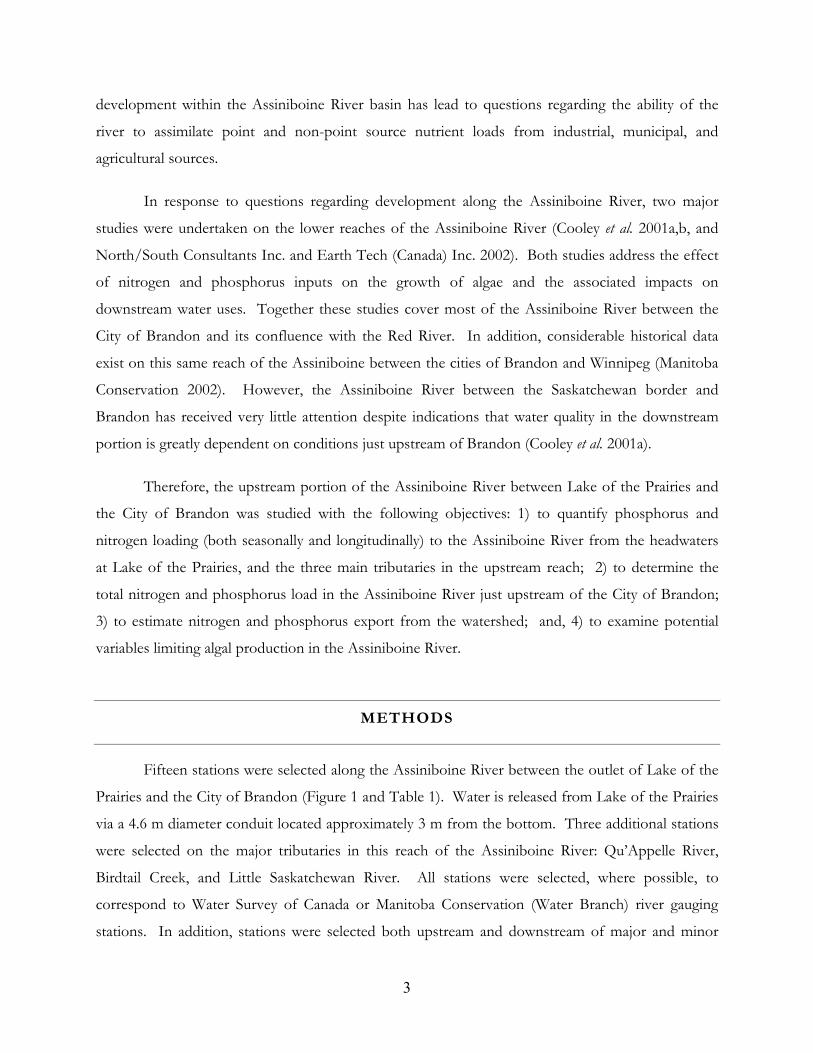
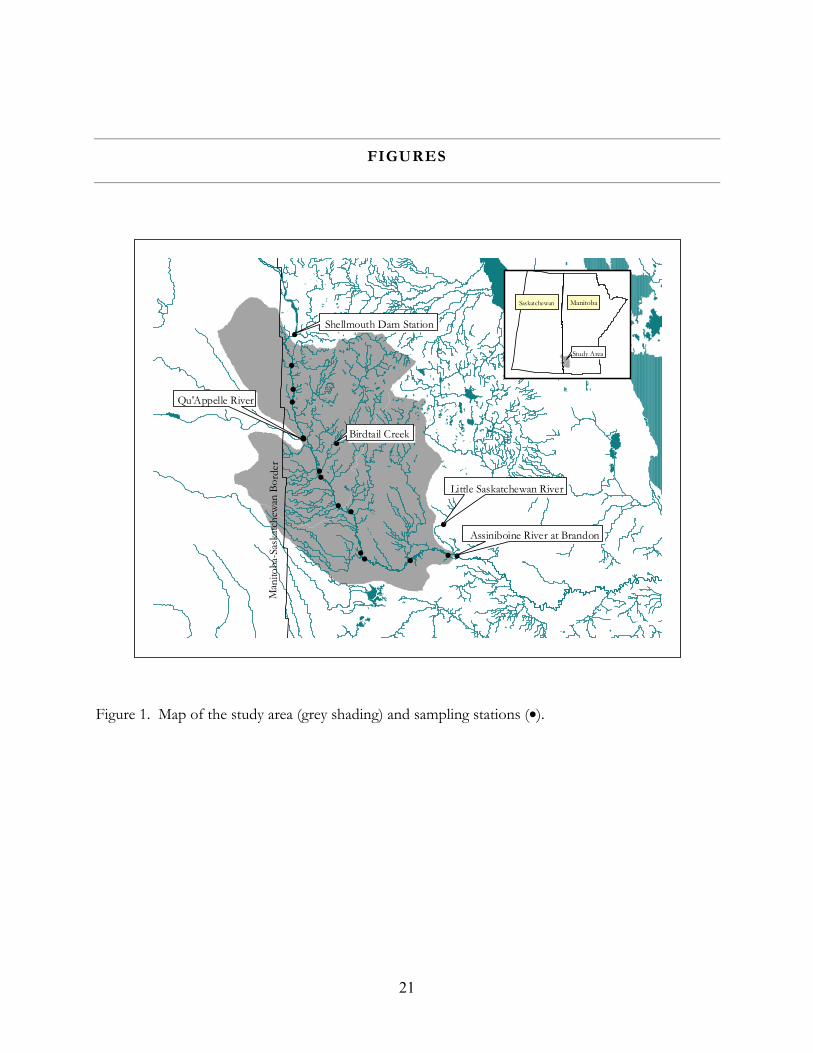
Figure 1. Map of the study area (grey shading) and sampling stations (•)…………………………21
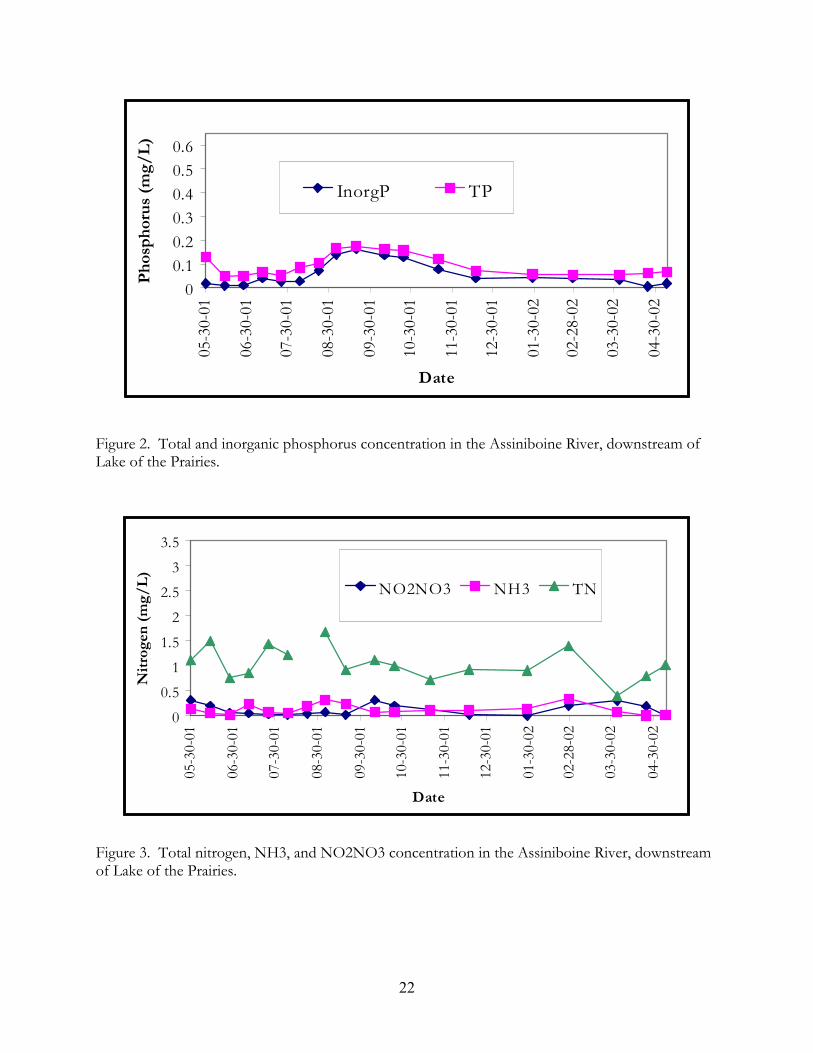
Figure 2. Total and inorganic phosphorus concentration in the Assiniboine River, downstream ofLake of the Prairies………………………………………………………………….….22
Figure 3. Total nitrogen, NH3, and NO2NO3 concentration in the Assiniboine River, downstreamof Lake of the Prairies………………………………………………………………….22
Figure 4. Total and inorganic phosphorus concentration in the Assiniboine River at Brandon…....23
Figure 5. Longitudinal trends in TP and inorgP concentration on June 13 and 14, 2001 in theAssiniboine River……………………….……………………………………...……….23
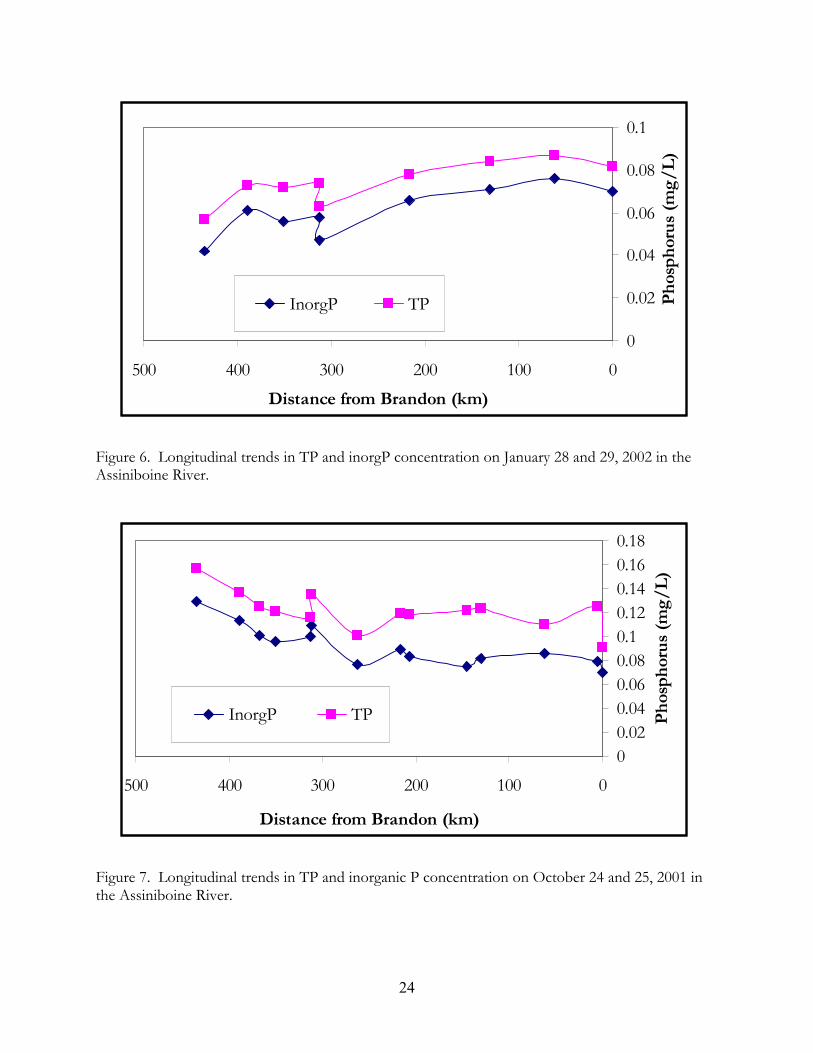
Figure 6. Longitudinal trends in TP and inorgP concentration on January 28 and 29, 2002 in theAssiniboine River………………………………………………………………...……..24
Figure 7. Longitudinal trends in TP and inorgP concentration on October 24 and 25, 2001 in theAssiniboine River………………………...……………………………………………..24
Figure 8. Total nitrogen, NH3, and NO2NO3 concentration in the Assiniboine River atMiniota…………………………………………….………………………………...…25
Figure 9. Total nitrogen, NH3, and NO2NO3 concentration in the Assiniboine River atBrandon……………………………………………..………….………………………25
Figure 10. Flows in the Assiniboine River at Brandon (cms)…………….……………………..…26
Figure 11. Longitudinal trends in TN and inorgN concentration on June 13 and 14, 2001 in theAssiniboine River…………………………………………………………...………….26
Figure 12. Longitudinal trends in TN and inorgN concentration on January 28 and 29, 2002 in theAssiniboine River…………………………………………………………………...….27
Figure 13. Observed seasonal fluctuations in N to P ratios in the Assiniboine River, downstream ofLake of the Prairies…………………………………………………….………………27
Figure 14. Observed seasonal fluctuations in N to P ratios in the Assiniboine River atRussell………………………………………………………………………….……....28
Figure 15. Observed seasonal fluctuations in N to P ratios in the Assiniboine River atBrandon………………………………………………………………………….……28
iv
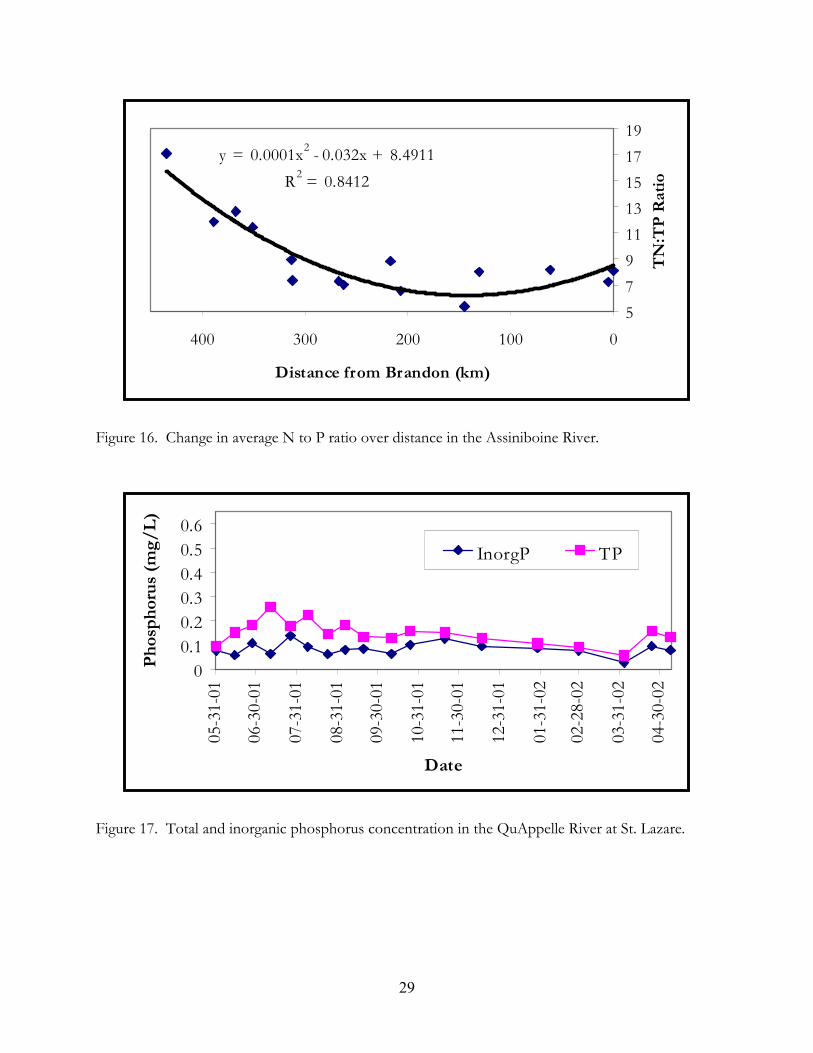
Figure 16. Change in average N to P ratio over distance downstream in the AssiniboineRiver………………………………………………………………………….………..29
Figure 17. Total and inorganic phosphorus concentration in the Qu’Appelle River at St.Lazare………………………………………………………………………………….29
Figure 18. Total and inorganic phosphorus concentration in Birdtail Creek at Birtle…………..….30
Figure 19. Total and inorganic phosphorus concentration in the Little Saskatchewan River atRivers……………………………………………………………………………….…30
Figure 20. Total nitrogen, NH3, and NO2NO3 concentration in the Qu’Appelle River at St.Lazare..……………………………………………………………………………...…31
Figure 21. Total nitrogen, NH3, and NO2NO3 concentration in Birdtail Creek at Birtle………...31
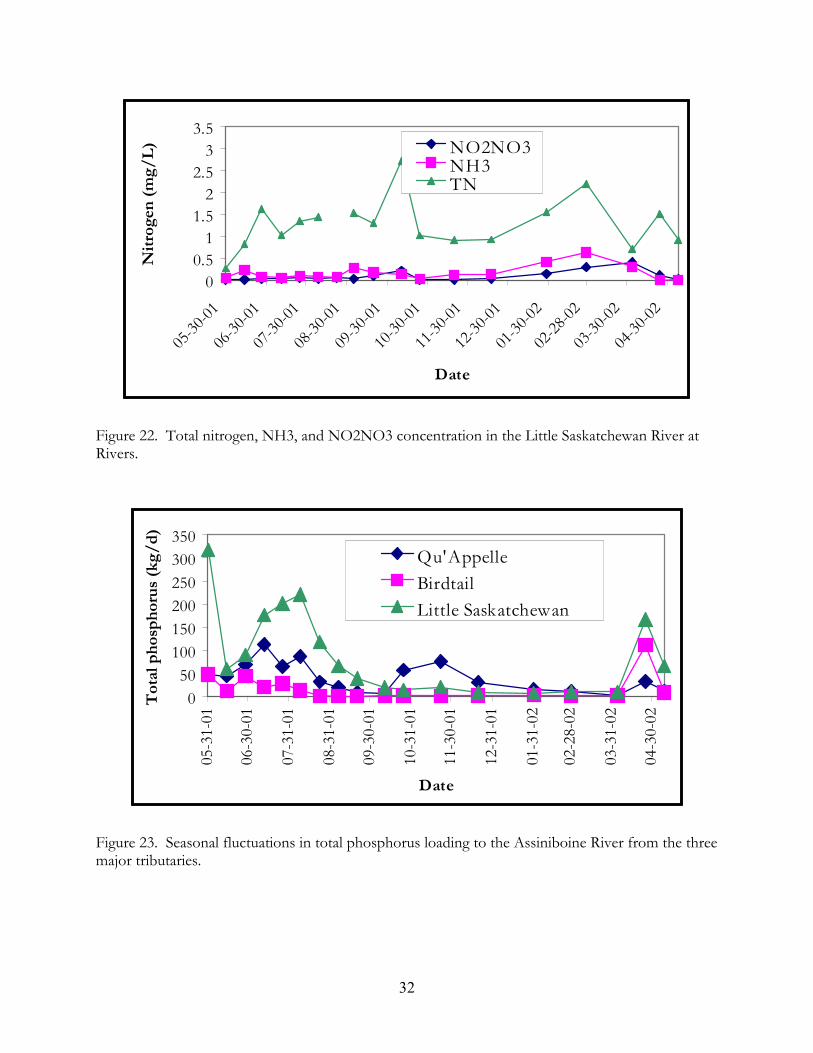
Figure 22. Total nitrogen, NH3, and NO2NO3 concentration in the Little Saskatchewan River atRivers…………………………………………………………………….……………32
Figure 23. Seasonal fluctuations in total phosphorus loading to the Assiniboine River from the threemajor tributaries……………………………………………...………………………..32
Figure 24. Seasonal fluctuations in total nitrogen loading to the Assiniboine River from the threemajor tributaries…………………………………………………………….…………33
Figure 25. Observed seasonal fluctuations in non-measured inputs of total phosphorus and totalnitrogen to the Assiniboine River…………………………………….………………...33

1
ACKNOWLEDGEMENTS
The author gratefully acknowledges field support from E. Shipley, A. Frezghi, D. Fehr, I.
Currie, G. Jones, C. Hughes, A Bourne, B. Webb, and P. Blahut. Helpful discussions regarding data
collection and analysis were held with the members of the Assiniboine River Water Quality Co-
ordination Team.

2
INTRODUCTION
The Assiniboine River flows from its headwaters in eastern Saskatchewan into and across
the western portion of Manitoba to its eventual confluence with the Red River within the City of
Winnipeg. The Assiniboine River watershed is relatively large, encompassing an area of about
41,500 km2 (not including the Qu’Appelle and Souris River basins which are generally considered
separately). Roughly 60 % (24,900 km2) of the watershed is within the province of Manitoba and
drains an area dominated by agriculture and populated with about 100,000 people, excluding those
in the City of Winnipeg. The Assiniboine River itself is used for recreational activities such as
boating, canoeing, water skiing, fishing, and swimming. The river provides essential habitat for
about 40 species of fish and its shoreline supports numerous plant and animal species. Water drawn
from the river is used for irrigation and for facilities such as food processing industries, and is the
drinking water source for the cities of Brandon and Portage la Prairie. The Assiniboine River is also
the recipient of treated effluent from a number of municipal and industrial wastewater treatment
facilities. With many values and uses, the Assiniboine River is a valuable resource.
Nutrient enrichment or eutrophication is one of the most serious water quality issues in
western Canada. High concentrations of plant nutrients, in particular nitrogen and phosphorus, can
result in an increase in the occurrence and extent of algal blooms, corresponding with an overall
decrease in aquatic biodiversity. Algal blooms in a drinking water source can clog treatment plant
filters, and impart an unpleasant taste, odour, and appearance to finished water. Treatment of such
water for drinking purposes can be very expensive and may prove to be cost prohibitive for some
water utilities. Blooms of blue-green algae species, many of which produce potent nerve and liver
toxins, may become more common under eutrophic conditions, and consumption of waters during
and following such blooms presents a health risk for humans, household pets, and livestock
(Carmichael 1991). There is also evidence that the toxins produced by blue-green algae can
bioaccumulate and thus be transferred through the aquatic food web (Kotak 1995). Algal blooms
and extensive macrophyte growth are also considered aesthetically unappealing and can detract from
the recreational use of surface water. The die-off and subsequent decay of algal blooms and
macrophyte vegetation consumes dissolved oxygen, leading to extensive fish kills. Increased
3
development within the Assiniboine River basin has lead to questions regarding the ability of the
river to assimilate point and non-point source nutrient loads from industrial, municipal, and
agricultural sources.
In response to questions regarding development along the Assiniboine River, two major
studies were undertaken on the lower reaches of the Assiniboine River (Cooley et al. 2001a,b, and
North/South Consultants Inc. and Earth Tech (Canada) Inc. 2002). Both studies address the effect
of nitrogen and phosphorus inputs on the growth of algae and the associated impacts on
downstream water uses. Together these studies cover most of the Assiniboine River between the
City of Brandon and its confluence with the Red River. In addition, considerable historical data
exist on this same reach of the Assiniboine between the cities of Brandon and Winnipeg (Manitoba
Conservation 2002). However, the Assiniboine River between the Saskatchewan border and
Brandon has received very little attention despite indications that water quality in the downstream
portion is greatly dependent on conditions just upstream of Brandon (Cooley et al. 2001a).
Therefore, the upstream portion of the Assiniboine River between Lake of the Prairies and
the City of Brandon was studied with the following objectives: 1) to quantify phosphorus and
nitrogen loading (both seasonally and longitudinally) to the Assiniboine River from the headwaters
at Lake of the Prairies, and the three main tributaries in the upstream reach; 2) to determine the
total nitrogen and phosphorus load in the Assiniboine River just upstream of the City of Brandon;
3) to estimate nitrogen and phosphorus export from the watershed; and, 4) to examine potential
variables limiting algal production in the Assiniboine River.
METHODS
Fifteen stations were selected along the Assiniboine River between the outlet of Lake of the
Prairies and the City of Brandon (Figure 1 and Table 1). Water is released from Lake of the Prairies
via a 4.6 m diameter conduit located approximately 3 m from the bottom. Three additional stations
were selected on the major tributaries in this reach of the Assiniboine River: Qu’Appelle River,
Birdtail Creek, and Little Saskatchewan River. All stations were selected, where possible, to
correspond to Water Survey of Canada or Manitoba Conservation (Water Branch) river gauging
stations. In addition, stations were selected both upstream and downstream of major and minor

4
(Gopher Creek, Arrow River) tributary inputs. River distances between stations were calculated with
data from Prairie Farm Rehabilitation Administration (1980 revised 1990).
During the ice-free season (May to November), water samples were collected every two
weeks at each of the 15 stations along the Assiniboine River from the most upstream site at Lake of
the Prairies to the City of Brandon, and from the three tributary stations. With the exception of
dissolved oxygen (DO), water samples were collected where possible by a weighed bucket dropped
mid-stream from a roadway bridge. Where stations did not correspond with a roadway bridge,
samples were collected with a sampling pole from the shoreline. At all times, DO samples were
collected with a sampler designed to minimise the production of oxygen bubbles during collection.
During the period of ice cover (December to April), the number of sampling stations on the
Assiniboine River was reduced from 15 to nine due to poor winter access at some stations. All three
major tributaries were also sampled. Water samples were collected from an 20 cm hole drilled with a
needle bar or ice auger. Ice thickness varied from between 30 to 100 cm depending on time of year
and location.
After collection, water samples were dispersed into various sized bottles and kept on ice in
the dark until delivery at CANTEST Ltd. Profession Analytical Services approximately 24 hours
later. Chemical analyses were conducted for pH, turbidity, organic (OP) and inorganic phosphorus
(as total reactive phosphorus, InorgP), total (TP), dissolved (DP) and particulate phosphorus (PP),
ammonia-N (NH3), nitrate-nitrite-N (NO3NO2), total kjeldahl nitrogen (TKN), DO, biological
oxygen demand (BOD), and phytoplankton biomass (as chlorophyll a, chla). Total organic nitrogen
(ON) was calculated as the difference between TKN and ammonia-N. Total inorganic nitrogen
(InorgN) is the sum of NO3NO2 and NH3. Total nitrogen (TN) was estimated as the sum of TKN
and NO3NO2. Nutrient limitation was assessed with TN to TP ratios where ratios less than 10
suggest potential nitrogen limitation, ratios greater than 20 suggest phosphorus limitation, and ratios
between 10 and 20 suggest periods of either nitrogen or phosphorus limitation (Redfield et al. 1963,
Borchardt 1996). Temperature was measured at each site with a mercury thermometer and was
recorded along with the time of collection.
Total nitrogen and phosphorus loads were calculated for stations at the beginning
(Assiniboine River at the outlet of Lake of the Prairies) and end (Assiniboine River just upstream of
5
Brandon at the Trans Canada Highway) of the study area, and on the three main tributaries to the
Assiniboine River in this reach (Qu’Appelle River at Welby, Birdtail Creek at Birtle, and Little
Saskatchewan River at Rivers). Daily or weekly flow averages (m3·s-1) obtained from Water Survey
of Canada or Manitoba Conservation (Water Branch) were converted to m3·d-1 and multiplied by the
average TN or TP concentration (mg·L-1) during that time period. The load of TN or TP (kg·d-1) in
the Assiniboine River at the beginning of the study area was added to the tributary loads to provide
an estimate of total measured TN or TP load (kg·d-1). Loads of TN and TP determined for each
time period of available water quality data were multiplied by the total time period and summed to
produce estimates of annual TN and TP load (kg·y-1) within the study area. Remaining calculations
were done for both daily (for examination of seasonal trends in loading) and annual data (for
determination of annual loading rates and export coefficients). Total measured TN or TP load was
subtracted from the TN or TP load measured in the Assiniboine River at the end of the study area
(City of Brandon) for an estimate of non-measured TN or TP load. Non-measured TN or TP load
includes inputs from minor tributaries not included in the loading calculations due to a lack of flow
data (Gopher Creek, Arrow River), stream bank/bed erosion, inputs from point sources such as
wastewater treatment lagoons and industrial facilities, and non-point source inputs from land runoff.
Calculations were repeated as above to determine loads of the various N and P fractions (OP,
inorgP, ON, inorganic N).
An estimate of the nutrient load from wastewater treatment facilities to the Assiniboine
River watershed was calculated. Eleven wastewater facilities were located within the study area that
discharge to the Assiniboine River or to surface waters that flow into the Assiniboine River.
Wastewater facilities that discharge to land were not included. Population served by the facility was
estimated as the entire community population obtained from Statistics Canada (2001) or from the
province of Manitoba’s community profiles (Manitoba Intergovernmental Affairs 2002).
Communities too small to be included in Statistics Canada estimates and not available on the
Manitoba Community profiles were estimated at 200 people. Estimates of TN and TP load from
each facility were calculated with population served by the facility, Chambers et al.'s (2001) estimates
of N and P load/capita/d and literature estimates of treatment efficiencies as in Bourne et al. (2002)
(Appendix 1).
Nutrient export from the study area (Water Survey of Canada watersheds 05ME and 05MG)
was estimated for TP, TN, inorgP, OP, inorgN, and ON. The total annual load of each nutrient
6
(kg·y-1) at the beginning of the study area (Shellmouth) was subtracted from the load at Brandon.
The input load from the Qu’Appelle and Little Saskatchewan Rivers were also subtracted because
these watersheds were not included in the study area. The nutrient load acquired between Lake of
the Prairies and the City of Brandon was then divided by the area of the watershed as determined
with ArcView (Version 3.2) and Water Survey of Canada watershed shape files.
Land use within the study area was examined with GIS shape files prepared by the Manitoba
Remote Sensing Centre and the Manitoba Land Initiative. Land use data were available for
approximately 82 % of the study area as defined by Water Survey of Canada watersheds 05ME and
05MG. Approximately 80 % of the study area with land use data was related to agricultural activities
with 51 % dedicated to cropland, 26 % to grasslands/pasture land, and 3 % to perennial forage
(alflafa and clover) and fall seeded crops such as winter wheat or fall rye. Remaining land use data
within the watershed, and the classification descriptions are found in Table 2 and Appendix 2,
respectively.
Weather data were obtained from the Environment Canada (2001) station at Shoal Lake
(50°27’N, 100°36’W) - the closest station with a full suite of climate data required for further water
quality modelling work (dry bulb temperature, tipping bucket rain gauge precipitation, wind, and
relative humidity).
RESULTS
Phosphorus in the Assiniboine River
Trends in phosphorus concentration in the Assiniboine River at Lake of the Prairies likely
reflect water characteristics at the bottom of the lake since flow comes directly from a conduit only 3
m from the sediment surface. Total phosphorus concentrations ranged between 0.049 and 0.175
mg·L-1 (Table 3) during 2001 to 2002 with the highest concentrations observed during September
and October (Figure 2). Higher concentrations of inorgP and DP were also observed during this
time period as compared to the rest of the study. Particulate phosphorus, colour, turbidity, and TSS
were not elevated during the fall as compared to late spring-early summer suggesting that sediment
resuspension was not responsible for the elevated TP concentrations. Concentrations of NH3 were
also relatively high during this period, particularly in late August and September (Figure 3), and were

7
accompanied by relatively low NO3NO2 concentrations. Anoxic conditions may have existed
during late summer-early fall near the lake sediment surface resulting in high rates of denitrification,
low rates of nitrification and release of DP, inorgP from the reservoir sediments. Dissolved oxygen
concentrations at the bottom of the lake cannot be assessed as turbulent flow through the dam
greatly increases the oxygen concentration of samples taken at the outlet. However, a previous
study by Fortin and Gurney (1997) found little evidence of oxygen or temperature stratification
during the fall period. Weather conditions during Fortin and Gurney’s 1991 to 1993 study may not
have been conducive to the development of anoxic conditions as compared to conditions during
this study. Nevertheless, the most upstream station on the Assiniboine River displays typical
hypolimnetic rather than lotic seasonal trends in phosphorus.
Hypolimnetic trends observed in the Assiniboine River just downstream of Lake of the
Prairies were not evident just 46 km downstream at Russell. Elevated concentrations of dissolved
nutrients (NH3, DP, SRP) observed just downstream of Lake of the Prairies were rapidly depleted
over the 46 km reach of the Assiniboine River between Lake of the Prairies and Russell. In late
August, NH3, SRP and DP decreased 79, 69, and 62 % respectively, between Lake of the Prairies
and Russell. Light penetration was greater just downstream of Lake of the Prairies as compared to
Russell (average turbidity for late August-late October was three times higher at Russell) and large
cobble lined the streambed. An epilithic algal community was present just downstream of Lake of
the Prairies – a phenomenon that did not exist at any other of the sampling stations on the
Assiniboine River. Epilithic algae were likely thriving on high nutrient concentrations released from
Lake of the Prairies and thereby provided considerable uptake of dissolved nutrients. Low turbidity
and shallow depth allowed light to penetrate to the bottom providing adequate light for
photosynthesis. While the remaining stations on the Assiniboine River may have adequate nutrients
for development of a benthic algal community, median turbidity was on average seven times greater
as compared to just downstream of Lake of the Prairies suggesting that light may limit algal growth.
All stations downstream exhibit different seasonal trends in phosphorus as compared to the
Assiniboine River at Lake of the Prairies. Total phosphorus concentrations were highest during
spring and early summer 2001, and declined through late summer, fall and winter (Figure 4).
Generally, inorgP concentrations mirrored fluctuations in TP concentration. Total phosphorus
concentrations then peaked again in spring 2002. Throughout most of the study, TP and inorgP
concentrations increased downstream (Figure 5). Total phosphorus concentrations in the

8
Assiniboine River at Brandon were on average about 70 % higher than those observed at the outlet
of Lake of the Prairies (average TP 0.159 mg·L-1). However, longitudinal trends were less obvious
during the ice-covered season (Figure 6) and the trend of increasing downstream phosphorus
concentration was actually reversed during the period of high phosphorus release from Lake of the
Prairies (September-November). Total phosphorus concentrations were on average 46 % higher
just downstream of Lake of the Prairies as compared to at Brandon during September to November
(Figure 7). Also, near the end of June, a dramatic spike in TP concentration was observed near the
downstream end of the Assiniboine River, just upstream of Virden, and continued through to
Brandon where TP concentrations were 1000 times higher than at Lake of the Prairies. The spike
appeared to coincide with the end of a three-day rainfall event and yet was not observed in a sample
collected just two hours earlier about 73 km upstream (at Miniota). While in general, there was a
gradual increase in phosphorus concentration in the Assiniboine River between Lake of the Prairies
and the City of Brandon, reservoir anoxia, precipitation, and the presence or absence of ice cover
influenced both spatial and temporal patterns.
Nitrogen in the Assiniboine River
In contrast with phosphorus, temporal and spatial trends in nitrogen concentration in the
Assiniboine River were less clear. At the upstream end of the Assiniboine River at Lake of the
Prairies, TN concentrations appeared to peak in late spring, late summer and late winter with spring
and summer peaks associated with increased ON, and winter peaks with increased inorgN (Figure
2). Inorganic N (NH3 and NO2NO3) concentrations fluctuated throughout the season with NH3
concentrations peaking in September and late February, perhaps corresponding to periods of anoxia
and high decomposition at the bottom of Lake of Prairies. High concentrations of NO2NO3
observed several weeks after the peaks in NH3, and corresponding to decreased NH3 concentration,
suggest that rates of nitrification were high. In contrast with longitudinal trends in phosphorus,
seasonal patterns in nitrogen persist past the station at Russell, about 46 km downstream.
Seasonal fluctuations in TN concentration on the Assiniboine River downstream of Russell
were dramatically different between stations with peaks and declines occurring at different times of
the year (e.g. Figures 8 and 9). However, most of the variability appeared to be associated with
fluctuations in ON as clear patterns in inorgN were evident. In general, both NH3 and NO2NO3
concentrations remained relatively low until late December after which concentrations of both begin
9
to rise, with NH3 peaking in late January and NO3NO2 peaking in late April. Nitrate-nitrite
concentrations then plummeted in May, in combination with a dramatic decline in flows (Figure 10).
As with phosphorus, a small peak in both NH3 and NO2NO3 concentrations occurred in late June
at the most downstream stations after an intense three-day rainfall. Another small peak in
NO2NO3 concentration also occurred in late July in the upstream reaches of the Assiniboine River.
While some variations were observed, the lower reaches of the Assiniboine River tended to have
dramatically fluctuating ON concentrations, and relatively low and stable inorgN concentration
during the ice-free season with higher concentrations observed under ice-cover.
Longitudinal trends in nitrogen concentration contrasted to those observed for phosphorus
concentration in the Assiniboine River. Concentrations of TN and inorgN in the Assiniboine River
during the ice-free period remained constant or decreased slightly between Lake of the Prairies and
the City of Brandon (Figure 11). Any point or non-point sources of nitrogen appeared to be rapidly
depleted possibly due to biological uptake and losses through denitrification. In general, uptake of
nitrogen during the ice-free season within the Assiniboine River exceeded inputs. Total nitrogen
concentrations were also relatively constant longitudinally during the period of ice cover. However,
inorgN concentrations increased on average over 100 % in the Assiniboine River between Lake of
the Prairies and Brandon during the ice-covered period (Figure 12). Perhaps reduced demand for
inorgN from the biological community during winter allowed nitrogen inputs to build up within the
river. In addition, losses to the atmosphere (i.e. through denitrification) would be expected to be
zero during the ice-covered period.
Nitrogen to Phosphorus ratios in the Assiniboine River
Total nitrogen to phosphorus ratios in the Assiniboine River varied both spatially and
temporally. At the most upstream site on the Assiniboine River at Lake of the Prairies, periods of
potential nitrogen (<10) and phosphorus (>20) limitation occurred (Figure 13). Total nitrogen to
phosphorus ratios of less than 10 occurred during September to November when TP concentrations
were relatively high and during April 2001 and 2002 when TN concentrations were relatively low.
Periods when ratios were above 20 occurred in both summer and winter and coincided with
relatively high TN concentrations. Just 46 km downstream on the Assiniboine River at Russell, low
TN:TP ratios (<10) occurred through most of the spring, summer and fall (Figure 14). A
dominance of low TN:TP ratios continued downstream with the number of periods with low

10
TN:TP ratios increasing, and the occurrence of ratios above 20 decreasing. In the Assiniboine River
at Brandon, TN:TP ratios were below 20 at all times during the study (Figure 15). A polynomial
relationship existed between average TN:TP ratio at each station and distance from Brandon such
that minimum TN:TP ratios were observed just upstream of Gopher Creek at about 145 km
upstream from Brandon (Figure 16, r2=0.84, P<0.0001). Overall, median TN:TP ratios were higher
during ice-cover as compared to ice-free conditions (P<0.0001). While temporal trends in TN:TP
ratio appeared to vary between stations, a strong decreasing trend in TN:TP ratio was observed on
the Assiniboine River between Lake of the Prairies and the City of Brandon.
Assiniboine River Tributaries: Qu’Appelle River, Birdtail Creek, Little Saskatchewan River
Seasonal trends in phosphorus concentrations in the three major tributaries to the
Assiniboine River within the study area were quite similar (Figures 17, 18 and 19). Total phosphorus
concentrations were highest during spring runoff and summer but declined in fall and winter. In
Birdtail Creek and the Little Saskatchewan River, seasonal trends in inorgP concentrations mirrored
those of TP. However, in the Qu’Appelle River, inorgP concentrations remained relatively
consistent suggesting that peaks in TP were associated with OP and possibly algal biomass. In fact,
algal biomass (as estimated by chla) in the Qu’Appelle River was correlated to OP (r2 = 0.496, P =
0.001) but not inorgP (r2 = 0, P = 0.9710) during the study period.
As in the Assiniboine River, seasonal TN concentrations fluctuated dramatically while
inorgN concentration showed similar patterns in all three major tributaries (Figures 20, 21 and 22).
NH3 and NO2NO3 concentrations were relatively low throughout the spring, summer, and fall of
2001 but rose during the winter of 2002. Ammonia concentrations dropped dramatically in late
April, while NO2NO3 concentrations dropped two weeks later in early May. Inorganic nitrogen
concentrations in Birdtail Creek and the Little Saskatchewan River also peaked slightly during the
fall. As with the Assiniboine River, large fluctuations in TN concentration in the three major
tributaries appeared to be associated with fluctuations in organic rather than inorganic N.
Nutrient Loading to the Assiniboine River
Total phosphorus load contributed by the three major tributaries to the Assiniboine River
also fluctuated seasonally (Figure 23). From the beginning of the study in late May until the end of
October, the Little Saskatchewan River contributed the largest TP load to the Assiniboine River
11
(kg·d-1), followed by the Qu’Appelle River and Birdtail Creek, respectively. However, throughout
the winter until early April, the Qu’Appelle River contributed the largest TP load, followed by the
Little Saskatchewan River and Birdtail Creek. By April, the Little Saskatchewan River again
contributed the largest proportion of TP load in the Assiniboine River. Over the entire season, the
Little Saskatchewan River contributed the largest proportion of the TP load at about 23 % while the
Qu’Appelle River and Birdtail Creek contributed 13 and 4 %, respectively (Table 2).
As with TP, tributary contribution to TN load to the Assiniboine River varied seasonally.
Total nitrogen load in the Little Saskatchewan River was the largest of the three tributaries from late
May until early October (Figure 24). Between late October and mid-December, the Qu’Appelle
contributed the largest portion of the TN load. After a period in January, when the Birdtail Creek
contributed the largest portion of the TN load, the Little Saskatchewan River was again the largest
contributor to TN load in the Assiniboine River. Annually, the Little Saskatchewan River
contributed 26 % of the TN load while the Qu’Appelle River and Birdtail Creek contributed 13 and
6 %, respectively.
During the study period, 50.2 % of the TP load acquired by the Assiniboine River between
Lake of the Prairies and the City of Brandon was measured as loading from Lake of the Prairies and
the three tributaries (Table 2). Of this, only 41.3 % of the inorgP load was measured while 79.5 %
of the OP was measured. Similarly, 58.6 % of the TN load acquired by the Assiniboine River within
the study was measured with 50.0 % of the inorgN load and 61.0 % of the ON measured. During
the study period, the amount of non-measured TP that entered the Assiniboine River varied from
less than zero (uptake of TP within the stream exceeded measured inputs) to 1487 kg·d-1 (Figure 25).
Non-measured inputs of TN also varied from less than zero to 8404 kg·d-1. Non-measured TN and
TP were strongly correlated with flow at Brandon (Log TN = -4.1062 + 2.379 Log Flow, P=0.002,
r2=0.63, Log TP = -4.0497 + 2.111 Log Flow, P<0.0001, r2=0.85). With the exception of an outlier
at the end of June (during the three day extreme precipitation event), non-measured TN and TP
were also strongly positively, correlated (p< 0.003, r2 = 0.64 and 0.91, respectively) with incremental
inflows (Flow at Brandon minus release from Lake of the Prairies minus three main tributary flows).
During some times of the year, non-measured inputs of nutrients accounted for a significant portion
of instream load. During other periods, instream uptake of nutrients exceeded inputs resulting in
lower nutrient loads downstream.

12
Estimated point source loading of TN and TP to the Assiniboine River from wastewater
treatment facilities formed only a small percentage of the non-measured load (5.2 and 3.8 %,
respectively). The remaining non-measured load could be accounted for by inputs from minor
tributaries not included in the loading calculations due to a lack of flow data (Gopher Creek,
Arrow River), stream bank/bed erosion, and non-point source inputs from land runoff. Overall,
TN and TP load from wastewater treatment facilities contributed only 2.1 and 1.9 %, respectively to
the overall nutrient load in the Assiniboine River at Brandon.
Rates of TP and TN export from the Assiniboine River were at the lower range of those
reported in the literature. Total phosphorus export was 4.47 kg·km-2·y-1 while total nitrogen export
was 26.6 kg·km-2·y-1. Rates of TP export in 198 watersheds dominated by cropland (>50 %
cropland) in North America (reviewed by Chambers and Dale 1997) varied from between 0.6 to 286
kg·km-2·y-1 while TN export in 177 watersheds ranged from between 8.2 and 2920 kg·km-2·y-1.
Interestingly, 88 % of TP export was inorganic while only 26 % of the TN export was
inorganic. Chambers and Dale (1997) indicate that export coefficients for SRP are usually 40 to 50
% of that for TP. Measurements of inorgP in this study were expected to be higher than those
reported in the literature for SRP as estimates include both soluble and particulate SRP. In the
Assiniboine River, inorgP consisted of about 58 % SRP. Export rate of inorgP in the Assiniboine
River watershed was 3.93 kg·km-2·y-1, lower than the average export rate for SRP in 172 cropland
watersheds (11.8 kg·km-2·y-1). The rate of inorgN export was 7.04 kg·km-2·y-1 as compared to an
average of 573 kg·km-2·y-1 found for 166 cropland watershed in North America (Chambers and Dale
1997).
DISCUSSION
Phosphorus and nitrogen concentrations at the study headwaters just downstream of Lake
of the Prairies displayed dramatically different trends than were observed elsewhere on the
Assiniboine River. Phosphorus concentrations peaked in late summer and fall, and were about
double those during the rest of the study period. Ammonia concentrations were also elevated
during this period. However, these trends in phosphorus and nitrogen persisted for less than 46 and
68 km, respectively. Visual observations indicated that a large periphyton community, not observed
elsewhere in the study reach, flourished due to comparatively high light penetration and adequate
13
nutrient concentrations. Nutrient uptake by periphyton likely depleted excess phosphorus and
nitrogen resulting in completely different downstream seasonal trends.
Seasonal trends in phosphorus and nitrogen concentration at the remaining stations on the
Assiniboine River were relatively similar. Phosphorus concentrations were highest in spring and
declined through the summer, fall, and winter. InorgN concentrations were highest during the ice-
covered season, and remained comparatively low and constant during the ice-free period. In some
instances, large rainfall events resulted in short peaks in nutrient concentration. Total nitrogen to
phosphorus ratios were highest under ice-cover and declined during the ice-free season. Spring,
summer, and fall TN:TP ratios were below 20 suggesting that algal biomass was likely N- rather than
P-limited (Redfield et al. 1963, Borchart 1996) in the Assiniboine River during most of the growing
season.
Longitudinal trends in phosphorus and nitrogen concentration along the Assiniboine River
were seasonal. Except during the fall, TP and inorgP concentrations increased with distance
downstream of Lake of the Prairies. The trend was reversed in the fall during the period of high
phosphorus release from Lake of the Prairies. In contrast, TN concentrations remained constant or
decreased with distance downstream throughout the entire study. InorgN concentrations also
remained constant or decreased with distance downstream during the ice-free season but increased
during the ice-covered season. In general, TN:TP ratios decreased with distance downstream
suggesting that N- rather than P-limitation occurred more frequently in the downstream portions of
the Assiniboine River.
Phosphorus and nitrogen loads in the Assiniboine River increased on average 26 and 13 fold,
respectively, between the outlet of Lake of the Prairies and the City of Brandon. Measurement of
phosphorus and nitrogen loads at the headwaters at Lake of the Prairies, and in the three main
tributaries accounted for 50 and 59 % of the phosphorus and nitrogen loads at Brandon,
respectively. Estimated point source loads from wastewater treatment facilities accounted for an
additional 2.1 and 1.9 % of the nitrogen and phosphorus loads, respectively. It is estimated that the
remaining nitrogen and phosphorus load was contributed by non-point sources such as erosion and
runoff. The strong correlation between non-measured phosphorus and nitrogen, and incremental
inflows through most of the ice-free season suggests that non-gauged inflows (direct runoff from
precipitation, small tributaries) accounted for a large proportion of the non-measured nutrients.

14
Rates of nutrient export from the Assiniboine River watershed during 2001 to 2002 were
low as compared to those found throughout the literature for other watersheds in North America
with over 50 % cropland (Chambers and Dale 1996). Below average precipitation in the watershed
during more than 75 % of the study period (Environment Canada 2002) and correspondingly low
river flows may have reduced nutrient export from the watershed. Flows in the Assiniboine River at
Russell were below the median (1970 to 1999) for all but one two-week period during the study and
in fact, at many times, flows were below the lower decile (10 %). A relatively low runoff year in the
Assiniboine River watershed may have resulted in low rates of nutrient export as compared to those
reported in the literature.
WATER QUALITY MODELLING IMPLICATIONS
The final product for the Assiniboine River project will be a water quality model, developed
to predict the influence of anthropogenic (wastewater discharge, altered flow regimes from Lake of
the Prairies, land use practices, etc.) and natural (annual variability in precipitation and temperature)
changes on water quality in the Assiniboine River. Modelling efforts will be guided by some of the
conclusions of this report.
As expected from previous efforts towards water quality modelling on the Assiniboine River
(Cooley et al.. 2001a,b), separate models will be required for ice-free and ice-covered seasons. In
addition to fundamental differences in temperature, aeration, and flow, different spatial and
temporal patterns in phosphorus and nitrogen concentrations were evident during the ice-free and
ice-covered seasons on the Assiniboine River. Estimates of non-measured nitrogen and phosphorus
were also higher during the ice-free as compared to ice-covered season suggesting that the addition
of incremental non-point source nutrients will only be a component of ice-free water quality models.
In general, algal biomass in the Assiniboine River between Lake of the Prairies and Brandon
appears to be nitrogen or light limited. Total nitrogen to phosphorus ratios of less than 10
predominate for much of the year, and in particular, in the downstream portion of the watershed.
However, turbidity was relatively high throughout most of the study area, suggesting that light
limitation may also be a factor. Water quality modelling will aid in determination of the influence of
light on algal biomass within the Assiniboine River and provide further clarification on the issue of
algal limitation.
15
REFERENCES
Borchardt, M.A. 1996. Nutrients. In: Stevenson, R. J., Bothwell, M.L., and Lowe, R. L. editors.Algal Ecology. Academic Press, Toronto. pp 183-227.
Bourne, A., Armstrong, N., and Jones, G. 2002. A preliminary estimate of total nitrogen and totalphosphorus loading to streams in Manitoba, Canada. Water Quality Management Section.Manitoba Conservation Report No. 2002 - 04.
Carmichael, W.W. 1991. Toxic freshwater blue-green algae (cyanobacteria): an overlooked healthtreat. Health and Environment Digest 5:1-4.
Chambers, P.A. and Dale, A.R. 1997. Contribution of Industrial, Municipal, Agricultural andGroundwater Sources to Nutrient Export, Athabasca and Wapiti-Smoky Rivers, 1989-1993.
Chambers, P.A., Guy, M., Roberts, E.S., Charlton, M.N., Kent, R., Gagnon, C., Grove, G., andFoster, N. 2001. Nutrients and their impact on the Canadian environment. Agriculture andAgrifood Canada, Environment Canada, Fisheries and Oceans Canada, Health Canada andNatural Resources Canada. Hull, Quebec, Canada. 241pp.
Cooley, M., Schneider-Vieira, F., and Towes, J. June 2001a. Assiniboine River Monitoring StudyWater Quality Component: Winter Water Quality Assessment and Model. North/SouthConsultants Inc. Winnipeg, Manitoba. 63pp. plus Appendices.
Cooley, M., Schneider-Vieira, F., and Towes, J. October 2001b. Assiniboine River MonitoringStudy Water Quality Component: Water Quality Assessment and Model for the Open WaterSeason. North/South Consultants Inc. Winnipeg, Manitoba. 156pp. plus Appendices.
Environment Canada. 2001. Weather data from Shoal Lake Climate Station. Meteorological Serviceof Canada.
Environment Canada. 2002. Seasonal Forecasts: Verification of Past Forecasts.www.weatheroffice.ec.gc.ca/saisons/index_e.html
Fortin, R. V. and Gurney, S.E. 1997. Phosphorus loading to Shellmouth Reservoir. ManitobaEnvironment Report No. 97-05. Winnipeg, Manitoba, 79pp.
Kotak, B.G. 1995. Concentration and toxicity of microcystin-LR in compartments and organismsof aquatic food webs. Ph.D. thesis. Department of Biological Sciences, University ofAlberta, Edmonton, Alberta, Canada. 327pp.
Manitoba Conservation. 2002. Unpublished data. Water Quality Management Section, 123 MainStreet, Suite 160 Winnipeg MB R3C 1A5.
16
Manitoba Intergovernmental Affairs. 2002. Manitoba Community Profiles.www.communityprofiles.mb.ca
North/South Consultants Inc. and Earth Tech (Canada) Inc. 2002. Assiniboine River MonitoringStudy: Portage la Prairie to Headingley. Proposed Workplan 2001-2004 (Draft).
Prairie Farm Rehabilitation Administration. 1980 revised 1990. Report on Determination of RiverDistances for the Saskatchewan-Nelson River Basin: Hydrology Report #95. HydrologyDivision, PFRA.
Redfield, A.C., Ketchum, B.H. and Richards, F.A. 1963. The influence of organisms on thecomposition of seawater. In: Hill, M.N. The Sea. Wiley-Interscience, New York. pp.26-77.
Statistics Canada. 2001. 2001 Community Profiles.www12.statcan.ca/english/profil01/PlaceSearchForm1.cfm
17
TABLES
Table 1. Assiniboine River and tributary station descriptions and locations.
Station Location Description Latitude Longitude Distance fromBrandon (km)
MB05MDS023 ASSINIBOINE RIVER AT OUTLET FROM SHELLMOUTH 50.9625 101.4167 435.0MB05MES048 ASSINIBOINE RIVER NEAR RUSSELL AT CONJURNING CREEK 50.8099 101.4338 388.9MB05MES053 ASSINIBOINE RIVER AT MILLWOOD (579) 50.6898 101.4132 367.4MB05MES035 ASSINIBOINE RIVER AT PR #478, WEST OF BINSCARTH 50.6236 101.4178 350.9MB05MES040 ASSINIBOINE RIVER AT OLD PTH #41, N OF QU'APPELLE R. 50.4408 101.3189 313.2MB05MES049 ASSINIBOINE RIVER DOWNSTREAM OF THE QU'APPELLE RIVER 50.4420 101.3192 312.4MB05MES050 ASSINIBOINE RIVER UPSTREAM OF BIRDTAIL 50.2809 101.1910 267.4MB05MES051 ASSINIBOINE RIVER DOWNSTREAM OF BIRDTAIL 50.2487 101.1743 262.4MB05MES042 ASSINIBOINE RIVER AT PTH #83, SOUTH OF MINIOTA 50.1097 101.0356 216.9MB05MGS040 ASSINIBOINE DOWSTREAM OF ARROW RIVER 50.0818 100.9318 206.9MB05MGS034 ASSINIBOINE RIVER AT PR #259, NORTH EAST OF VIRDEN 49.8744 100.8486 145.0MB05MGS035 ASSINIBOINE RIVER AT E. OF VIRDEN 49.8417 100.8167 130.7MB05MGS037 ASSINIBOINE RIVER AT PTH #21, NORTH OF GRISWOLD 49.8425 100.4608 61.7MB05MGS042 ASSINIBOINE UPSTREAM OF THE LITTLE SASKATCHEWAN RIVER 49.8722 100.1675 5.1MB05MHS002 ASSINIBOINE RIVER AT TCH, WEST OF BRANDON 49.8681 100.0983 0MB05MES034 BIRDTAIL RIVER, BELOW DAM AT BIRTLE 50.4208 101.0617MB05MES036 QU'APPELLE RIVER AT OLD PTH #41, WEST OF ST. LAZARE 50.4422 101.3247MB05MFS098 LITTLE SASKATCHEWAN RIVER AT PTH #25 NEAR RIVERS 50.0236 100.2067

18
Table 2. Percentage of the study area occupied by each type of land use (For Land Use Categorydescriptions please see Appendix 2).
Land Use Category % CoverAgriculture 51.11Grassland 25.86Forage Crops 2.83Deciduous Forest 10.60Open Deciduous Forest 1.43Mixedwood Forest 0.40Conifer Forest 0.14Water 1.60Marsh/Fens 3.32Bogs 0.08Bare rock/sand/gravel 0.01Cultural 0.14Roads/Trails 2.46

19
Table 3. Average chemical concentrations for 15 Assiniboine River and three tributary stations for May 2001 to May 2002.
Station N pH Specificconductivity
(uS/cm)
Truecolor(colorunits)
Turbidity(NTU)
TDS(mg/L)
TSS(mg/L)
DO(mg/L)
BOD(mg/L)
TC(mg/L)
TOC(mg/L)
NH3(mg/L)
TKN(mg/L)
NO2NO3(mg/L)
TP(mg/L)
TDP(mg/L)
OrthoP(mg/L)
Chla(µg/L)
MDS023 Average 18 8.23 707 14 2.77 491 5 8.48 3.1 69 14 0.125 1.283 0.126 0.094 0.071 0.058 19.3
Std. Deviation 0.13 59 6 2.99 66 3 2.47 3.7 4 1 0.101 1.561 0.111 0.046 0.043 0.050 33.0
MES048 Average 18 8.26 753 15 16.35 530 30 8.17 2.3 71 14 0.111 1.211 0.140 0.130 0.062 0.082 15.6
Std. Deviation 0.13 78 6 12.05 70 23 2.97 1.6 4 2 0.099 0.844 0.170 0.050 0.028 0.040 13.8
MES053 Average 14 8.33 743 19 13.74 522 25 8.69 2.1 70 15 0.076 1.371 0.145 0.117 0.059 0.070 19.1
Std. Deviation 0.11 83 7 9.69 58 12 2.53 1.5 3 1 0.056 1.543 0.285 0.031 0.023 0.024 17.4
MES035 Average 18 8.26 771 17 14.35 543 31 7.85 1.7 71 14 0.076 1.239 0.172 0.120 0.052 0.083 8.6
Std. Deviation 0.13 86 7 9.47 64 22 2.27 0.9 4 2 0.043 1.580 0.333 0.040 0.020 0.032 7.2
MES040 Average 18 8.19 808 17 18.37 565 34 7.27 2.2 75 13 0.064 0.856 0.194 0.119 0.049 0.077 8.5
Std. Deviation 0.17 113 9 13.84 95 27 1.93 1.7 7 2 0.045 0.430 0.387 0.045 0.016 0.037 7.3
MES049 Average 18 8.25 969 17 17.02 681 36 7.78 3.5 78 13 0.060 0.817 0.129 0.141 0.056 0.081 17.3
Std. Deviation 0.16 155 12 9.91 75 23 2.08 5.2 6 1 0.044 0.396 0.160 0.047 0.017 0.034 15.2
MES050 Average 10 8.27 887 18 14.25 635 35 5.74 2.1 74 13 0.043 0.840 0.103 0.131 0.049 0.068 19.6
Std. Deviation 0.12 135 16 8.91 79 22 5.47 1.2 8 2 0.026 0.435 0.205 0.032 0.015 0.027 9.4
MES051 Average 13 8.32 815 21 15.38 562 40 8.26 3.1 79 14 0.037 0.792 0.072 0.133 0.048 0.082 10.7
Std. Deviation 0.12 72 12 8.20 80 32 1.56 4.8 8 2 0.021 0.403 0.137 0.060 0.016 0.057 5.5
MES042 Average 18 8.22 914 16 16.01 659 38 7.25 2.1 79 12 0.059 0.906 0.146 0.132 0.055 0.092 14.7
Std. Deviation 0.19 126 9 11.00 73 30 2.15 1.3 7 2 0.047 0.717 0.213 0.059 0.020 0.049 8.1
MGS040 Average 13 8.28 893 18 22.27 630 59 7.05 2.2 78 13 0.043 0.946 0.099 0.171 0.065 0.114 16.2
Std. Deviation 0.13 97 10 18.11 63 50 2.25 1.4 8 1 0.025 0.459 0.204 0.079 0.025 0.069 7.8
MGS034 Average 14 8.29 897 23 37.50 625 118 7.71 2.6 78 13 0.050 1.000 0.109 0.246 0.071 0.177 17.5
Std. Deviation 0.19 142 13 55.52 87 219 1.95 2.4 10 1 0.039 0.619 0.218 0.282 0.040 0.256 6.5

20
Table 3. Average chemical concentrations for 15 Assiniboine River and three tributary stations for May 2001 to May 2002(continued).
Station N pH Specificconductivity
(uS/cm)
Truecolor(colorunits)
Turbidity(NTU)
TDS(mg/L)
TSS(mg/L)
DO(mg/L)
BOD(mg/L)
TC(mg/L)
TOC(mg/L)
NH3(mg/L)
TKN(mg/L)
NO2NO3 (mg/L)
TP(mg/L)
TDP(mg/L)
OrthoP(mg/L)
Chla(µg/L)
MGS035 Average 18 8.21 931 18 25.01 659 66 7.13 2.3 80 12 0.080 0.978 0.168 0.188 0.065 0.133 15.0
Std. Deviation 0.22 120 12 28.11 85 91 1.79 2.1 8 2 0.062 0.520 0.261 0.140 0.027 0.127 8.0
MGS037 Average 18 8.22 956 20 21.86 675 51 6.98 2.0 81 13 0.078 0.956 0.199 0.165 0.076 0.120 15.4
Std. Deviation 0.23 117 13 18.35 84 49 2.57 1.6 10 2 0.053 0.331 0.275 0.087 0.038 0.077 8.6
MGS042 Average 14 8.34 931 21 21.59 665 46 8.68 2.4 80 13 0.044 1.007 0.155 0.164 0.077 0.121 15.5
Std. Deviation 0.12 129 12 10.18 91 27 4.08 1.8 12 2 0.033 0.365 0.295 0.057 0.042 0.065 8.5
MHS002 Average 18 8.29 894 20 20.62 628 46 7.31 2.5 81 14 0.065 0.922 0.205 0.159 0.073 0.121 12.3
Std. Deviation 0.24 117 12 33.25 85 81 2.17 1.8 9 2 0.057 0.463 0.291 0.115 0.038 0.114 7.6
MES036 Average 18 8.22 1137 12 16.61 764 38 8.06 2.7 83 15 0.077 0.967 0.124 0.148 0.058 0.084 21.3
Std. Deviation 0.20 154 8 7.70 204 20 1.82 1.7 8 13 0.083 0.549 0.146 0.048 0.019 0.026 16.4
MES034 Average 18 8.18 764 24 10.25 545 18 7.77 1.7 92 14 0.123 1.222 0.175 0.103 0.062 0.073 4.5
Std. Deviation 0.17 191 12 7.41 123 18 1.95 0.8 11 3 0.121 1.219 0.247 0.050 0.030 0.037 4.3
MFS098 Average 18 8.25 685 29 2.20 497 5 7.67 2.1 81 18 0.163 1.383 0.095 0.147 0.114 0.101 15.3
Std. Deviation 0.22 155 11 0.83 106 4 1.99 1.5 11 3 0.161 0.908 0.115 0.060 0.055 0.060 12.8
21
FIGURES
#
#
#
##
#
#
#
##
#
#
## #
#
# #
Ma n
itoba
-Sas
katc
hew
an B
o rde
r
Shellmouth Dam Station
Assiniboine River at Brandon
Qu'Appelle River
Birdtail Creek
Little Saskatchewan River
Manitoba
Study Area
Saskatchewan
Figure 1. Map of the study area (grey shading) and sampling stations (•).
22
00.10.20.30.40.50.6
05-3
0-01
06-3
0-01
07-3
0-01
08-3
0-01
09-3
0-01
10-3
0-01
11-3
0-01
12-3
0-01
01-3
0-02
02-2
8-02
03-3
0-02
04-3
0-02
Date
Phos
phor
us (m
g/L)
InorgP TP
Figure 2. Total and inorganic phosphorus concentration in the Assiniboine River, downstream ofLake of the Prairies.
0
0.5
1
1.5
2
2.5
3
3.5
05-3
0-01
06-3
0-01
07-3
0-01
08-3
0-01
09-3
0-01
10-3
0-01
11-3
0-01
12-3
0-01
01-3
0-02
02-2
8-02
03-3
0-02
04-3
0-02
Date
Nitr
ogen
(mg/
L) NO2NO3 NH3 TN
Figure 3. Total nitrogen, NH3, and NO2NO3 concentration in the Assiniboine River, downstreamof Lake of the Prairies.

23
00.10.20.30.40.50.6
05-3
1-01
06-3
0-01
07-3
1-01
08-3
1-01
09-3
0-01
10-3
1-01
11-3
0-01
12-3
1-01
01-3
1-02
02-2
8-02
03-3
1-02
04-3
0-02
Date
Phos
phor
us (m
g/L)
InorgP TP
Figure 4. Total and inorganic phosphorus concentration in the Assiniboine River at Brandon.
Figure 5. Longitudinal trends in TP and inorgP concentration on June 13 and 14, 2001 in theAssiniboine River.
00.020.040.060.080.10.120.140.160.180.2
0100200300400500Distance from Brandon (km)
Phos
phor
us (m
g/L)
InorgP TP
24
Figure 6. Longitudinal trends in TP and inorgP concentration on January 28 and 29, 2002 in theAssiniboine River.
Figure 7. Longitudinal trends in TP and inorganic P concentration on October 24 and 25, 2001 inthe Assiniboine River.
0
0.02
0.04
0.06
0.08
0.1
0100200300400500Distance from Brandon (km)
Phos
phor
us (m
g/L)
InorgP TP
00.020.040.060.080.10.120.140.160.18
0100200300400500
Distance from Brandon (km)
Phos
phor
us (m
g/L)
InorgP TP

25
00.5
11.5
22.5
33.5
05-31
-01
06-30
-01
07-31
-01
08-31
-01
09-30
-01
10-31
-01
11-30
-01
12-31
-01
01-31
-02
02-28
-02
03-31
-02
04-30
-02
Date
Nitr
ogen
(mg/
L)NO2NO3NH3TN
Figure 8. Total nitrogen, NH3, and NO2NO3 concentration in the Assiniboine River at Miniota.
00.5
11.5
22.5
33.5
05-31
-01
06-30
-01
07-31
-01
08-31
-01
09-30
-01
10-31
-01
11-30
-01
12-31
-01
01-31
-02
02-28
-02
03-31
-02
04-30
-02
Date
Nitr
ogen
(mg/
L) NO2NO3NH3TN
Figure 9. Total nitrogen, NH3, and NO2NO3 concentration in the Assiniboine River at Brandon.

26
01020304050607080
05-31
-01
06-30
-01
07-31
-01
08-31
-01
09-30
-01
10-31
-01
11-30
-01
12-31
-01
01-31
-02
02-28
-02
03-31
-02
04-30
-02
Date
Flow
(cm
s)
Figure 10. Flows in the Assiniboine River at Brandon (cms).
Figure 11. Longitudinal trends in TN and inorgN concentration on June 13 and 14, 2001 in theAssiniboine River.
0
0.5
1
1.5
2
2.5
0100200300400500
Distance from Brandon (km)
Nitr
ogen
(mg/
L)
InorgN TN

27
Figure 12. Longitudinal trends in TN and inorgN concentration on January 28 and 29, 2002 in theAssiniboine River.
05
101520253035
05-3
0-01
06-3
0-01
07-3
0-01
08-3
0-01
09-3
0-01
10-3
0-01
11-3
0-01
12-3
0-01
01-3
0-02
02-2
8-02
03-3
0-02
04-3
0-02
Date
Nitr
ogen
to P
hosp
horu
s R
atio
Figure 13. Observed seasonal fluctuations in N to P ratios in the Assiniboine River, downstream ofLake of the Prairies.
00.2
0.40.60.8
11.21.4
1.61.8
0100200300400500
Distance from Brandon (km)
Nitr
ogen
(mg/
L)
InorgN TN

28
05
101520253035
05-3
0-01
06-3
0-01
07-3
0-01
08-3
0-01
09-3
0-01
10-3
0-01
11-3
0-01
12-3
0-01
01-3
0-02
02-2
8-02
03-3
0-02
04-3
0-02
Date
Nitr
ogen
to P
hosp
horu
s Rat
io
Figure 14. Observed seasonal fluctuations in N to P ratios in the Assiniboine River at Russell.
05
101520253035
2001
-05-
31
2001
-06-
30
2001
-07-
31
2001
-08-
31
2001
-09-
30
2001
-10-
31
2001
-11-
30
2001
-12-
31
2002
-01-
31
2002
-02-
28
2002
-03-
31
2002
-04-
30
Date
Nitr
ogen
to P
hosp
horu
s Rat
io
Figure 15. Observed seasonal fluctuations in N to P ratios in the Assiniboine River at Brandon.
29
y = 0.0001x2 - 0.032x + 8.4911R2 = 0.8412
5791113151719
0100200300400
Distance from Brandon (km)
TN
:TP
Rat
io
Figure 16. Change in average N to P ratio over distance in the Assiniboine River.
00.10.20.30.40.50.6
05-3
1-01
06-3
0-01
07-3
1-01
08-3
1-01
09-3
0-01
10-3
1-01
11-3
0-01
12-3
1-01
01-3
1-02
02-2
8-02
03-3
1-02
04-3
0-02
Date
Phos
phor
us (m
g/L)
InorgP TP
Figure 17. Total and inorganic phosphorus concentration in the QuAppelle River at St. Lazare.

30
00.10.20.30.40.50.6
05-3
0-01
06-3
0-01
07-3
0-01
08-3
0-01
09-3
0-01
10-3
0-01
11-3
0-01
12-3
0-01
01-3
0-02
02-2
8-02
03-3
0-02
04-3
0-02
Date
Phos
phor
us (m
g/L)
InorgP TP
Figure 18. Total and inorganic phosphorus concentration in Birdtail Creek at Birtle.
00.10.20.30.40.50.6
05-3
0-01
06-3
0-01
07-3
0-01
08-3
0-01
09-3
0-01
10-3
0-01
11-3
0-01
12-3
0-01
01-3
0-02
02-2
8-02
03-3
0-02
04-3
0-02
Date
Phos
phor
us (m
g/L)
InorgP TP
Figure 19. Total and inorganic phosphorus concentration in the Little Saskatchewan River at Rivers.

31
00.5
11.5
22.5
33.5
05-31
-01
06-30
-01
07-31
-01
08-31
-01
09-30
-01
10-31
-01
11-30
-01
12-31
-01
01-31
-02
02-28
-02
03-31
-02
04-30
-02
Date
Nitr
ogen
(mg/
L) NO2NO3NH3TN
Figure 20. Total nitrogen, NH3, and NO2NO3 concentration in the Qu'Appelle River at St. Lazare.
00.5
11.5
22.5
33.5
05-30
-01
06-30
-01
07-30
-01
08-30
-01
09-30
-01
10-30
-01
11-30
-01
12-30
-01
01-30
-02
02-28
-02
03-30
-02
04-30
-02
Date
Nitr
ogen
(mg/
L) NO2NO3NH3TN
Figure 21. Total nitrogen, NH3, and NO2NO3 concentration in Birdtail Creek at Birtle.
32
00.5
11.5
22.5
33.5
05-30
-01
06-30
-01
07-30
-01
08-30
-01
09-30
-01
10-30
-01
11-30
-01
12-30
-01
01-30
-02
02-28
-02
03-30
-02
04-30
-02
Date
Nitr
ogen
(mg/
L) NO2NO3NH3TN
Figure 22. Total nitrogen, NH3, and NO2NO3 concentration in the Little Saskatchewan River atRivers.
050
100150200250300350
05-3
1-01
06-3
0-01
07-3
1-01
08-3
1-01
09-3
0-01
10-3
1-01
11-3
0-01
12-3
1-01
01-3
1-02
02-2
8-02
03-3
1-02
04-3
0-02
Date
Tot
al p
hosp
horu
s (kg
/d)
Qu'AppelleBirdtailLittle Saskatchewan
Figure 23. Seasonal fluctuations in total phosphorus loading to the Assiniboine River from the threemajor tributaries.

33
0
500
1000
1500
2000
05-3
1-01
06-3
0-01
07-3
1-01
08-3
1-01
09-3
0-01
10-3
1-01
11-3
0-01
12-3
1-01
01-3
1-02
02-2
8-02
03-3
1-02
04-3
0-02
Date
Tot
al n
itrog
en (k
g/d) Qu'Appelle
BirdtailLittle Saskatchewan
Figure 24. Seasonal fluctuations in total nitrogen loading to the Assiniboine River from the threemajor tributaries.
-2000
0
2000
4000
6000
8000
10000
05-3
1-01
06-3
0-01
07-3
1-01
08-3
1-01
09-3
0-01
10-3
1-01
11-3
0-01
12-3
1-01
01-3
1-02
02-2
8-02
03-3
1-02
04-3
0-02
Time
Tot
al p
hosp
hour
s (kg
/d)
-20002004006008001000120014001600
Tot
al n
itrog
en (k
g/d)Total Phosphorus
Total Nitrogen
Figure 25. Observed seasonal fluctuations in non-measured inputs of total phosphorus and totalnitrogen to the Assiniboine River.

34
APPENDIX ONE
Table 1. Estimated nutrient loading calculations for wastewater facilities.
WastewaterFacility
EstimatedPopulationServed byFacility
Phosphorusload/capita/d1
Influent Pload (g/d)
Total Premovalefficiency
EffluentP load(kg/yr)
Nitrogenload/capita/d1
InfluentN load(g/d)
EffluentN load(kg/yr)
Final Discharge
KENTON 200 3.38 676 65.5 85 10 2000 657 AssiniboineRiver
MCAULEY 200 3.38 676 65.5 85 10 2000 657 Scissors CreekELKHORN 470 3.38 1589 65.5 200 10 4700 1544 Bosshill CreekMINIOTA 215 3.38 727 65.5 92 10 2150 706 Assiniboine
RiverBINSCARTH 445 3.38 1504 65.5 189 10 4450 1462 Assiniboine
RiverANGUSVILLE 200 3.38 676 65.5 85 10 2000 657 SloughBIRTLE 715 3.38 2417 65.5 304 10 7150 2349 Birdtail CreekRUSSELL 1587 3.38 5364 65.5 675 10 15870 5213 Silver CreekFOXWARREN 200 3.38 676 65.5 85 10 2000 657 Snake CreekOAK LAKE 359 3.38 1213 65.5 153 10 3590 1179 Oak RiverOAK RIVER 150 3.38 507 65.5 64 10 1500 493 Oak River
1 From Chambers et al.. 2001

35
APPENDIX TWO
Land Use and Land Cover Mapping of Manitoba Codes
1. Agricultural Cropland; All lands dedicated to the production of annual cereal, oil seedand other speciality crops. This class can be further sub-divided into three crop 0 % - 33%, 34 % - 66 %, and 67 % - 100 %.
2. Deciduous Forest;75 % - 100 % of the forest canopy is deciduous. Dominant speciesinclude trembling aspen (Populus tremuloides), balsam poplar (Populus balsamifera), andwhite birch (Betula papyrifera). May include small patches of grassland, marsh or fensless than two hectares in size.
3. Water Bodies; All open water - lakes, rivers, streams, ponds and lagoons.
4. Grassland/Rangeland; Mixed native and/or tame prairie grasses and herbs. May alsoinclude scattered stands of willow (Salix L.), choke cherry (Prunus virginiana), pin cherry(Prunus pensylvanica) and saskatoon (Amelanchier alnifolia). Many of these areas areused for cutting of hay and grazing. Both upland and lowland meadows fall into thisclass. There is normally less than 10 % shrub or tree cover.
5. Mixedwood Forest; 25 % - 75 % of the canopy is coniferous. May include patches oftreed bog, marsh or fens less than two hectares in size.
6. Marsh and Fens; Wet areas with standing or slowly moving water. Vegetation consists ofgrasses and/or sedge. Marshes will include common hydrophytic vegetation such ascattail and rushes. Fens will be formed on minerotrophic sites. Areas are frequentlyinterspersed with channels or pools of open water.
7. Treed and Open Bogs; Peat covered or peat filled depressions with a high water table.The bogs are covered with a carpet of Spagnum spp. and ericaceous shrubs and may betreeless or treed with black spruce (Picea mariana) and/or tamarack (Larix laricina).
8. Coniferous Forest; 75 % - 100 % of the canopy are coniferous. Pine (Pinus spp.) andspruce (Picea spp.) are dominant species. May include patches of treed bog, marsh orfens less than two hectares in size.
9. Open Deciduous; Lands characterized by rough topography, shallow soil, or poordrainage. Supports a growth of shrubs such as willow (Salix spp.), alder (Alnus spp.)saskatoon (Amalanchier spp.) and/or stunted deciduous (Populus spp.) tree cover. Anarea could have up to 50 % scattered tree or shrub cover.

36
10. Forage Crops; Consists of perennial forage such as alflafa, and clover or blends of thesewith tame species of grass. Fall seeded crops such as winter wheat or fall rye areincluded here.
11. Cultural Features; Built-up areas such as cities and towns, peat farms, golf courses,cemeteries, shopping centres, large recreation sites, auto wreck yards, airports, cottageareas, race tracks.
12. Bare Rock, Gravel and Sand; Exposed areas of bedrock, sand dunes, and beaches, gravelquarry/pit operations, mine tailings, borrow pits, and rock quarries.
13. Roads and Trails; All highways, secondary roads, trails, cut survey lines, right-of-ways,railway lines and transmission lines.