assisted night vision for motorists in highway
TRANSCRIPT
Assisted Night Vision for Motorists in Highway Construction Zones: Phase II*
*(Prepared in Cooperation with the US Department of Transportation, Federal Highway
Administration, MBTC and AHTD Under Grant Number MBTC 2064)
FINAL REPORT
PI: Hirak C. Patangia, Ph.D., P.E. University of Arkansas @ Little Rock
2801 S. University, ETAS 227 Little Rock, AR 72204
501.569.8202(v) 501.569.8206(f)
ACKNOWLEDGEMENT
The author wishes to acknowledge the financial support of Mack-Blackwell Rural Transportation Center and Arkansas Highway & Transportation Department for the project under grant MBTC-2064. The technical support of HK Idea-Tech. toward the project is greatly appreciated. Thanks are also due to Dr. John Faucett for carrying out the test-drive survey, and my students especially Dennis Gregory and Jerry Clark for their commendable technical support throughout the project.
Disclaimer Statement
The contents of this report reflect the views of the author who is responsible for the facts and the accuracy of the data presented herein. The document is disseminated under the sponsorship of Department of Transportation, University Transportation Centers Program, and Arkansas Highway and Transportation Department, in the interest of information exchange. The U.S. Government assumes no liability for the contents or use thereof. This report does not constitute a standard, specification, or regulation.
1

Project Abstract Generally, construction zones require motorists to switch from using the familiar pavement markings for defining driving lanes to the unfamiliar and unforgiving concrete dividers (Jersey Barriers). Quite often, these “detour” lanes are narrower requiring motorists to exert additional caution to avoid collision with the dividers. During nighttime driving, it is frequently difficult to determine lane narrowing or shifts. If an active delineation light could be attached to the top of the jersey barriers, drivers could know, with fair warning, where and how the road changes.
The research developed two types of barrier lighting devices using LED and EL (Electroluminescent) technology that employ solar power as the energy source. The lamps have been designed to withstand the harsh environment of the highway, have small footprints and lightweight, portable, and require no wires or outside power source. The light is bright enough to see at a distance without distracting the driver, and the unit is highly power efficient and designed to be practically maintenance free. The lamps can run for almost a week with 2-3 days of full charge. This is especially attractive for winter and cloud cover days. A drive test survey was carried out in October 2006 to evaluate motorists’ perception of the lighting system with the help of Dr. John Faucett, Professor of Psychology at the university. Approximately 100 students and their friends and relatives took part in the drive test. The survey indicated that 74% of respondents believed the LED lighting would be more effective for marking highway barriers and changes in the roadway than the passive reflectors, and 71% of respondents felt that the EL lighting would be more effective than reflectors. The respondents favored the LED lighting system for its brightness although the EL system is known to be more effective in foggy and misty environment. Such a weather condition was not present during drive test. The barrier lights are commercially viable and ready for technology transfer. It is believed that the deployment of the lamps on jersey barriers will vastly improve driver safety. Being portable, the lamps are also suitable for other highway applications including road construction site and sharp bend on highway exits.
2

Table of Contents I) Introduction…….………………………………….……………………………4 II) Portable Solar Powered LED Lamps…..………………….………...….....…. 5
1) LED Selection…………………………………………….……………...……5 2) Solar Panel Selection…………………………………….……………….…..5 3) Battery Selection………………………………………….……………......…6 4) LED Lamp Driver…………………………………………………..…….......6 5) LED Lamp Prototype………………………….…………………….…....….9
III) Portable Solar Powered EL Lamps……….……………………………….… 10 1) EL Fiber Selection………………………………………...……….......….….10 2) Battery and Solar Panel Selection………………………………..….....…...11 3) EL Lamp Driver……………………………………………………...….…...12
1) EL Driver Block Diagram………………...………………….…..….…..13 2) EL Driver Test Results………………………………………….…...…..18 3) Electrical Characteristics and Efficiency……….………………..….....20
4) EL lamp Prototype………………………………………………….….…….22 IV) Deployment of Lamps in Construction Zone……………………...…….…. 24 V) Survey and Data Analysis………………………….……………………..…...27
1) Introduction……………..……………………………………………...….…27 2) Method……………………………………….…………….…………………28
1) Sample……………………………………………………………….……28 2) Procedure…………………………………….…………………………...28
3) Survey Results…………………………..……………………………………29 1) Light Visibility Survey…………………………...........…………..…….29 2) Light Comparison Survey…………………………….………………...30
4) Survey Conclusions………………………………………………...….…….31 VI) Project Conclusions……………………………………....................................32 VII) Summary Statement of Research Implementation…………………...…….35 VIII) Research Publications Related to Project……………………………………35 IX) Other Research Dissemination………………………...……………………..36 A) Appendix…………………………………………..…………………………...37
1) Light Visibility Survey………………………………………………………37 2) Light Comparison Survey..............................................................................38 3) Data Logger Results (Aug 14-27) for LED Battery Charging………..…..41
3

I. Introduction: Generally, construction zones require motorists to switch from using the familiar pavement markings for defining driving lanes to the unfamiliar and unforgiving concrete dividers (Jersey Barriers). Quite often, these “detour” lanes are narrower requiring motorists to exert additional caution to avoid collision with the dividers. During nighttime driving, it is frequently difficult to determine lane narrowing or shifts. If an active delineation light could be attached to the top of the jersey barriers, drivers could know, with fair warning, where and how the road changes. Such a cautionary lighting scheme will vastly improve driver safety especially in dark and rainy nights.
The preliminary investigation of the idea in Phase I of the project (MBTC 2050) gave us the following observations that were needed to be addressed in Phase II implementation scheme:
• EL lights are sensitive to outdoor UV effects in continuous use under hot summer condition.
• The wire harnessing from lamp to lamp through conduits laid on the top of the Jersey barrier is not practical especially if a large segment of the highway is to be covered.
• The system reliability for powering the lamps from one central driver with large solar panels is marginal at best.
With a view to mitigating those deficiencies, several factors were taken into consideration in Phase II of the project:
• The highway in general is a very demanding and harsh environment requiring robust construction.
• The device should be portable and stand-alone with no necessity for long power lines from device to device.
• The device should be lightweight enough so as not to become a dangerous projectile that could enter an oncoming car’s windshield in the event of a collision.
• The light should be bright enough to see at a distance, but not so bright that the driver is distracted by the light.
• Visibility shouldn’t be impaired under dusty and foggy situation. • The lighting system should be electrically robust and require little or no maintenance. • The lighting circuitry should be as efficient as possible to allow the use of compact
solar panels. The project took two approaches for formulating designs offering reliable and low cost solutions. One approach uses LEDs (Light Emitting Diodes) assembled in a matrix form much like the type of lighting now being implemented for traffic lights and on tractor-trailers. The second approach uses EL (Electroluminescent) technology that has the potential for superior performance in foggy condition when compared with LEDs. Since EL technology operates at a high voltage with a frequency of several hundred hertz, a more sophisticated electronic driver is required for these lamps. Both approaches can be configured for sequential lighting should it be desired, however, this methodology would require direct wiring between the light sources or wireless RF communication. The specific research goals accomplished through the project are:
4

• Design of cost effective Portable Solar-Powered LED Lamps • Design of cost effective Portable Solar-Powered EL Lamps • Deployment and evaluation of lamps’ functionality in construction zone • Evaluation of effectiveness of Night Vision Systems through drive tests II. Portable Solar Powered LED Lamps At the heart of the LED portion of this project is the method by which the LED is illuminated. PWM (Pulse Width Modulation) is the method of choice where current pulses though the LED at a predetermined rate. As long as the peak current and its duration do not exceed the LED specifications, a current regulating resistor is not necessary and power wastage on the resistor can be avoided. Controlling the interval of time the current pulse is applied changes the amount of energy used, and thereby cause a change in the brightness of the light. The brightness varies in direct relation to the pulse width. II. 1 LED Selection: A goal of the project was to make the lamp bright enough to see at a distance yet not too bright at close proximity for it to be a distracter to the motorist. After experimenting with several types, configurations and number of LED’s, the target current of about 20mA was derived. This current was also derived from the experience that was being gained on the EL part of this project. With these considerations, 40 LEDs per lamp were selected with 20 LEDs on each side of the lamp to provide bidirectional visibility. Both orange and white LEDs were tested for the application. This resulted in an average current of 15mA – 20mA with brightness in the range of 100 LUX - 200 LUX. Measuring the intensity of a distributed light is somewhat subjective. The distance, angle and position of the light meter affect the reading of light intensity especially when the lighting is not uniform. Since there are 20 LEDs per side, there are 20 spots where the light is more intense. Sampling of the light intensity at various points gave readings between 100 LUX to 200 LUX with an average of 150. The final product employed white LEDs with an orange reflector surrounding the LEDs. II. 2 Solar Panel Selection: Since the device envisioned would be setting out on the highway, potentially at a great distance from existing power lines, solar energy is a logical choice for powering the lamps. Such a power source will allow a great advantage in portability. The original trial of this project (Phase I) had a single point of power for several lights strung up in parallel along the length of the jersey barrier. The trial proved that the stand-alone unit would have considerable advantages over the single supply. Stringing up the lights for the trial was a time consuming effort and if the lights were to be a temporary placement, such as in a construction area, spending such amounts of time along with cost would be non-productive. The stand-alone unit would be much easier to set up and take down, and would be more conducive to being setup in a construction zone. This realization restricts the size of the solar panel so that it would match the size of an individual lighting unit.
5

Consequently the amount of power available for charging would have to be taken into account along with its physical size. Several experiments were conducted with various sizes of solar panels. The size of the solar panel is directly proportional to the amount of power it can produce. Since the unit would need to be small enough to fit on the top of the barrier wall, only solar panels four to six inches in diameter were tested. The final decision was to use a four and one half inch diameter solar panel which will be mounted at an angle to harness maximum solar power per day. The solar panel chosen produced a short circuit current of about 100 mA in summer time sun at an inclination of about fifteen degrees to horizontal, facing the sun. This current seemed to be a reasonable amount considering the current target of 20 mA to be used by the lamp. Ten hours of light usage would amount to 200 mA-hr of electricity and theoretically, two hours of summer sun at a charging rate of 100 mA should replace the depleted energy. And conversely, sixteen hours of winter night would drain 320 mA-hr and most winter days would have sufficient sunlight to recharge any power used at night. The solar panel produced an open source voltage of 6V in general conditions. This voltage level was the driving force in the battery chosen. II. 3 Battery Selection: Like the solar panel, several types and sizes of battery were considered. The two main candidates were lithium-ion and lead acid battery. These two types exhibit the best characteristics for the application considering the environment and the power source to recharge the battery. Another parameter to be considered for the project was the weight of the battery. The complete unit needed to be as light weight as possible because an accident could knock the unit off the barrier and crash it into the windshield of an oncoming vehicle. Lithium-ion was selected for the application because of weight, power density and voltage level considerations. The lithium cells come in natural voltage increments of 3.6V (actual max voltage is 4.2V) whereas the typical voltage level available in the lead acid is 6V (actual max voltage is 7.2V). The 6V (open circuit) solar panel would match the charging requirement of the 3.6V lithium-ion battery. The power density to weight ratio is much higher for Li-ion and thus it seemed like a natural fit. The battery capacity was chosen at 2200 mA-hr to provide reserve power for inclement weather situation. Charging requirement for Li-ion is stringent and needs careful design. Under ideal conditions, the Li-ion needs a constant current source to “properly” charge. There is not an easy and natural way to take solar power directly and have it supply a constant current to the battery. II. 4 LED Lamp Driver: The PIC 12F683 is at the heart of the electronics package. It is an eight pin programmable microcontroller. At less than two dollars a unit, it made perfect sense to use this chip. Also the chip is capable of performing analog to digital conversions on several different pins, and has a programmable PWM (pulse width modulation) pin and can operate down to a voltage of two volts, well below the lowest desired voltage on the Li-ion battery of 3.2 volts. Figure1 below gives the schematic of the driver circuit.
6

Fig. 1 LED Driver Circuit
The basic operation can be summarized as follows. The 12F683 continuously monitors and controls the LED circuit. If the sun is up there will be a voltage at pin 3, this will cause the PWM at pin 5 to cease. If there is no voltage present at pin 3, the PIC will sense this as the sun being down and will proceed to turn on the LED lights by sending a PWM signal wave to the BS-170 MOSFET which in turn will make the LEDs to illuminate. An increase in the pulse width provides brighter light at the cost of higher current drain from the battery. The PIC also senses the battery voltage on pin 7. If the battery voltage is too low, it will not turn on the lights and also the reading on this pin is used to disable the solar panel when the battery is fully charged. Should the PIC controller fail, the MOSFET will remain open preventing the lights from turning on. The voltage divider circuit was chosen to give 3 volts to the gate of the MOSFET to provide a safe voltage level on sensing the solar panel voltage. The circuitry in itself is relatively simple but it is a result of much experimentation and adherence to the idea of keeping it simple but effective. The complexity of the driver is hidden in the programming code used to control the circuit. Since it is the code that controls when and how the lights come on and then takes action, it is probably the most important part of this project. And since it is programming code, it is very flexible and many settings can be modified to change the behavioral characteristic of the light. For instance, the sun light level at which the light should come on is just a number in the program. Also, the brightness of the lamp can be changed easily with the programming code. It is even possible to track the amount of sunlight hours and adjust the brightness of the light accordingly, although this feature was not included in the design. That effort would require a great deal of data points to be taken in a real world setting. The flowchart below (Figure2) shows the decision structure that is used in the design of the LED driver. The following considerations were taken into account while developing the microcontroller programming code: • Employ A/D feature to monitor the battery voltage continuously and vary the PWM
duty cycle as a function of the battery voltage to maximize device run time. Light brightness is increased if weather condition provides strong sun light.
7

• Take into account battery voltage reading to prevent over-charging and over- discharging of the battery. The lights are turned off when voltage level drops to 3.6V and the solar panel current is shunted to ground if the battery voltage reaches 4.2V.
• Monitoring of solar panel voltage determines when to turn-on or turn-off the lights. • Hysteresis is provided through coding to prevent lights from oscillating on and off
when the solar panel voltage is at the threshold (short duration cloudiness). • Watchdog timer is implemented so that the unit can re-initialize itself if the
microcontroller has lost control of the program. The experimental research on the previous models that were deployed without a watchdog timer revealed a problem when lightening would strike near-by. Since implementing the watchdog timer, no such problems have been observed. If indeed the controller has lost control of the program, the watchdog timer will not be reset. Once the watchdog timer has expired, the unit will restart and re-initialize itself correcting the problem.
Fig. 2 PIC Programming Flow Chart
8

II. 5 LED Lamp Prototype: The final LED Lighting Unit is a result of many hours of experimentation and research. It is a product very close in design for commercialization. To evaluate the long term reliability and effectiveness of the unit, it will be advisable to produce and test them in greater numbers. As regards the project, the goals that were set forth have been fully met in the final product. A barrier lighting device weighing approximately one pound has been developed that can withstand the harsh environment of the highway, has a small footprint and lightweight, portable, and requires no wires or outside power source. The light is bright enough to see at a distance without distracting the driver, the unit is highly power efficient, and practically maintenance free. The complete unit was installed inside a molded housing. The following are images of the final LED units.
Fig. 3 LED Proto-Type Units
9

III. Portable Solar Powered EL Lamps The second approach that was undertaken to develop the barrier lamps is to use Electroluminescent (EL) display. The most advantageous feature of this technology is their power efficiency. These devices behave like capacitive elements and theoretically they have no real power consumption. Light-weight, uniform light emission, availability in various colors, and wide-viewing area are other advantages of this technology. The EL lighting is available in two forms: sheets and fiber. The research of Phase I showed that the EL plates are susceptible to UV exposure when placed in the harsh environment of outdoor sun. For phase II, EL sheets were replaced by EL fiber which is UV-resistant. It comes with a dual encapsulated sheath and has been used in outdoor application with no degradation of its emission. However, the fiber will need to be coiled in a way to generate a spiral circle while retaining its superior advantage in visibility in foggy and dusty environment. This EL fiber technology has found use in highway signage in the west coast because of their enhanced visibility in foggy driving condition.
III. 1 EL Fiber Selection: The fibers consist of a phosphor coated copper wire surrounded by a hair thin transmitter wire, and they are encapsulated by an inner vinyl jacket and an outer jacket. The amount of phosphor coating determines the brightness of the fiber. For the project application, three different types of fibers were tested. The first two were not acceptable based on their color and brightness. Highway guidelines required orange color. A fiber manufacturer specially made a high brightness EL for this application, which meant no increase in power consumption while increasing its brightness by 2.5 times the ordinary fiber. It has an overall diameter of 5mm with orange color when not lighted and light orange when it is lighted up. The following pictures give a view of different types of fiber that were researched for the project.
Fig. 4 EL Fibers
10

The fiber employed in the final product is of 85 cm long and formed into a concentric circle as tightly as possible. It is placed in an injection molded polished acrylic holder with grooves so that the light can be seen from both sides. The bidirectional visibility with one piece of EL fiber is a definite advantage of the unit. One approach was to mill the acrylic, but the milled ditch will be milky in color, thus reducing the brightness. The electrical characteristic of the fiber unit was checked and it can be modeled approximately as a 4nF capacitor in parallel with a 1M Ω -750 KΩ resistor at a frequency of 1 KHz. The final design included a highly reflective material (passive) surrounding the fiber coil to enhance its visibility to headlights. The reflective materials were supplied by the highway department. The pictures below show the finished design of the EL fiber layout:
Fig. 5 EL Fiber Housing with Passive Reflector around Spiral Lamp III. 2 Battery and Solar Panel Selection: Like EL plates, the fiber operates at a high voltage with a typical ac value of 100V rms at a frequency of few KHz. Selection of battery voltage is critical since this voltage will need to be raised to about 140V for the application. A lower battery voltage will require a large conversion ratio (6:140) affecting the complexity of the electronics circuitry. On the other hand, a higher battery voltage means a large size solar panel. Our design criterion requires that the lamp size must fit the top of the jersey barrier. As in the case of LED lamp, both Li-ion and lead-acid batteries were considered. Because of cost consideration and the fact that charging requirements of lead-acid are much more forgiving, 6V sealed lead-acid batteries were selected for the application. Similar to LED, the average target current of the EL lamp was set at 20mA, and the battery amp-hr rating was chosen to be 1.4A-hr. The choice of this rating will allow enough reserve power in the battery for inclement weather with a matching solar panel. The solar panel selected for the application is of size 14.5 cm x 11.5 cm with an open circuit voltage of 7.65V and a short-circuit current of 225mA. The panels were tested over a period of time for its power output and the following plots show their characteristics under sunny and roving cloudy conditions.
11

Fig. 6 Solar Charging Characteristics under Sunny (Left) and Cloudy (Right) Conditions
Analysis of Figure 6 shows that under cloudy condition, an average energy of 1800mW-hr was transferred to the battery by the solar panel per day, and the unit’s daily energy usage is approximately 1000mW-hr. This allows the battery to reserve power for several days of poor sunlight weather. In fact, it was observed that two days of good sunlight can run the unit for the whole week with average lighting of 10-12 hours per night.
III. 3 EL Lamp Driver: T
here are two basic design requirements for the EL driver:
1) Sinusoidal source voltage with an average rms value of 100-120V 2) Frequency of voltage source in the range of 440 Hz to 1-2 KHz Since it’s much simpler to generate square waves, these waveforms are also used to drive EL display. In such a case, the high harmonic content of the waveform shortens the life of the EL. For the project where a robust unit is desired, the following design specifications
ere established: w 1) Generation of a low distortion sine wave with a rms value of 100V (peak voltage 144V) at frequencies of 500 Hz and 1 KHz. 2) A highly efficient inverter design to drive capacitive load 3) A compact design for portability 4) A modern design matching the new EL technology An exhaustive literature search for an existing design meeting those aforementioned requirements produced no results. There are vast amount of available literature in the area of inverter design, but they are intended for power frequency use (60 Hz) driving mostly resistive loads and three-phase applications. Available single-phase inverters employ square waves and are not intended for driving capacitive loads. This led us to design our own inverter, and much of the research time and effort were devoted for its development. The research team has made some significant contributions in the area of single-phase inverter design with tunable (variable) frequency, and the results have been disseminated through seven publications in IEEE International Conferences and Symposiums. The support of MBTC and AHTD were acknowledged in all the papers. The references of the published articles are included in a later section. One new concept that has been proposed through the research for generation of high voltage is the concept of Amplitude Division
12

Multiplexing (ADM). Multiplexing techniques for time and frequency commonly known as TDM (Time Division Multiplexing) and FDM (Frequency Division Multiplexing) are well-known in the literature and normally included in undergraduate textbooks. The ADM concept developed by PI is new and is illustrated through the diagram below:
ADM
s3(t)
s1(t)
s2(t)
s1 s2s3
ty(t)
Fig. 7 Amplitude-Division Multiplexing
Fig. 7 shows a 3-input multiplexing scheme where s1(t), s2(t), s3(t) (which we are labeling as base signals) are stacked in amplitude to form the output signal y(t). It can be seen that the base signals s2 and s1 are level shifted by an amount equal to the amplitudes of s3 and s2 respectively, before they are stacked on s3 at the desired phase angles to generate the output signal y(t). In a low voltage low power application, y(t) is simply the analog summing of the three signals. However, for high voltage application, it is more insightful to consider this operation as an amplitude-division multiplexing function from the view point of practical realization. For high voltage signal generation, each of the base signals is amplified through switching or other means before they are assembled at the output. Although not specifically identified, the implementation methods employed in transformer-less multilevel inverters can be classified as amplitude-division multiplexing. The advantage of this approach is that the electronics for signal processing can be used more effectively while processing small amplitude segments. For example, if signal operation involves switching, large time constant of the circuit caused by switch ‘on’ resistance and capacitive load, and the rise and fall time of the switches affect the circuit operation quite adversely if the swing in switching level is high. On the other hand, the circuit behavior can be improved many fold if the switching is carried out using a smaller segment of the amplitude and also, switching losses can be reduced. The ADM approach can also be utilized effectively in the processing of high voltage signals. Here, the large signal can be sliced into smaller segments for their processing with low voltage electronics, and then multiplexed using ADM approach to assemble the processed signal. III. 3.1 EL Driver Block Diagram: The overall system has two main components: a DC-DC Converter and an ADM Multiplexer. A microcontroller (PIC 16F628) is used to provide the timing signals of the complete system. The sequencing of the time signals is critical for generating a distortion-free sinusoid. Figure 8 gives a block diagram representation of the complete system:
13
SOLARPANEL
POWERCONTROL
DC/DCCONVERTER
AMPLITUDEDIVISIONMULTIPLEXER
H-BRIDGE
6V1.4Ahr
12
2
1
LOAD
12 2 1
12
2
1
PIC16F628
Voc = 7.65VIsc = 225mA
6V (SWITCHED)
144V
24V12V
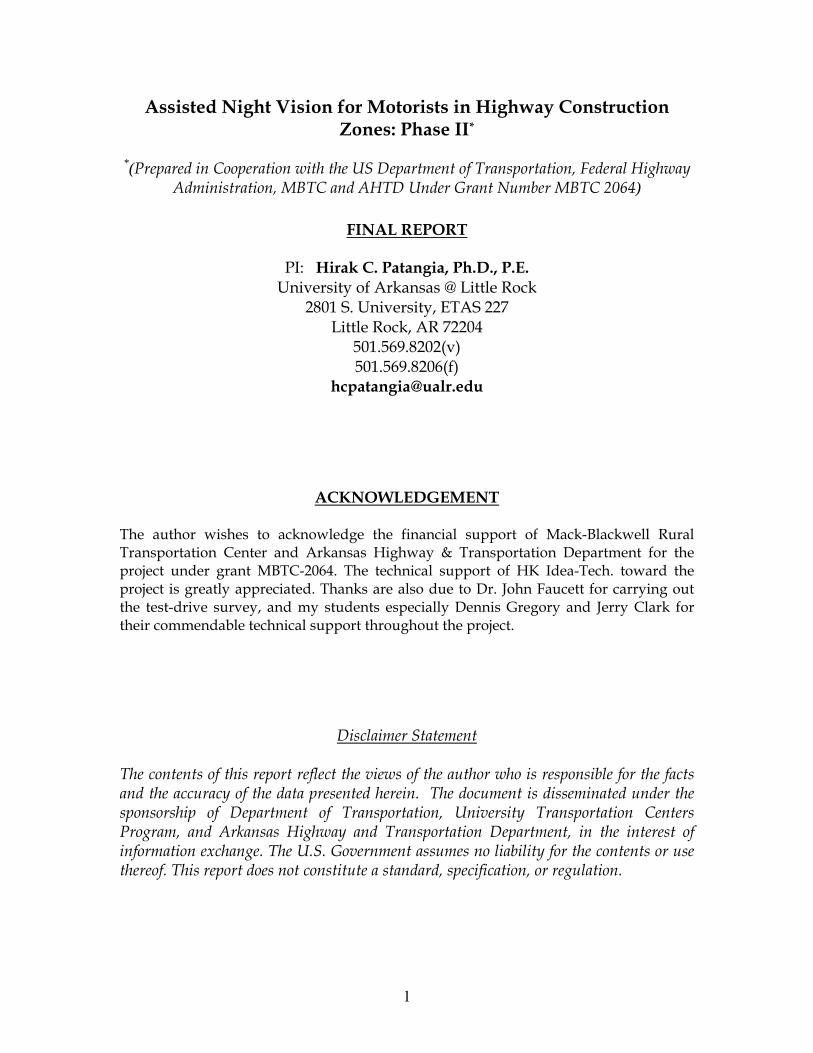
Fig. 8 Block Diagram of EL Driver
The functions of each block are explained below: Power Control: An opto-isolator senses the voltage from the solar panel and if it is above a threshold level, an in-line MOSFET disables the 6V power source to the rest of the circuit. When there is prolonged darkness (solar voltage is below the threshold), the power control energizes the driver circuit from the battery and the lamps are ‘on’. The diode insures that power flow is unidirectional. DC-DC Converter: Since the available source is a 6V battery, it needs to be elevated to a level of 144V for the sinusoid to have a rms value of 100V. Different methods were examined for implementing this unit including switching-mode transformer and switching-mode boost regulator. However, these approaches do not provide the shifting voltage levels that are necessary for the ADM multiplexer. A switched-capacitor dc-dc converter approach was chosen for the application since it is compact (transformer-less) and more importantly, provides the various discrete voltage levels required for ADM. A single cell of the converter circuit with push-pull switching is shown in Figure 9.
+-Vs
D1 D2
C1
Co
Q1
Q2
Vi
Fig. 9 A Single Cell of DC-DC Converter
14

Neglecting diode drops, if the push-pull stage is off, the voltage across C0 is VS. When Q1 conducts and Q2 is off, voltage across C1 rises to VS. In the next cycle when Q1 is off and Q2 is on, D1 is reverse-biased, and VS across C1 level shifts the voltage of C0 to 2VS at steady-state (C1 is much larger than C0). Thus this circuit doubles the voltage VS. Similarly, multiple stages can be employed to increase output voltage level to kVS where k is an integer. For lifting 6V to 144V, 24 stages are necessary. The advantage of this technique is that all the voltage steps are available. Although 24 stages appear to be a large number, the converter was implemented with four Hex Schmitt Inverters (MM74C14) that allow the push-pull functions of Q1and Q2 of Fig. 9. The circuit employed 0.1µF capacitors for charge transfer. For providing voltage stability, a 22 µF capacitor was used across each of the voltage taps in 12V increments. Effectively, twelve stages of the converter were employed for the implementation. A 12-stage dc-dc converter will give the same results. However, the use of a 12V battery will require a bigger panel, and thus affect the compact size requirements of the design. The complete ircuit was implemented through surface-mount components for a compact design. c
Amplitude-Division Multiplexer: This block employs a ‘lift and stack’ amplitude-division multiplexing approach to generate a stepped sinusoid. The general multiplexing concept is illustrated in Figure 10.
S1
Sn
SN
K1
Kn
KN
x(t) y(t)
S1
Sn
SN
.
.
.
.
.
.
.
.
.
.
.
.
.
.
.
.
.
.
Fig. 10 N- Step Multiplexing Scheme
Each path in Fig.10 contains an input and an output switch and a processing block Kn in between. The switches operate periodically and the control signals of the switches are determined by the waveform to be generated (in our case a sinusoid). Fig. 11a and 11b show two ways of generating the high voltage signal. In Fig. 11a, a low voltage reference waveform is divided into equal time intervals with non-uniform voltage heights, and in Fig. 11b the signal is divided into equal voltage steps with non-uniform time intervals. These two approaches have been termed by the PI as vertical siding and horizontal siding approach respectively.
Fig. 11b Horizontal Siding (VMAX = N∆V)
t
( )v t
T∆
V∆
( )v t
t
Fig. 11a Vertical Siding (T = N∆T)
15

The Kn block in Fig. 10 represents the level shifting operation that is performed on the input samples to raise them to various heights before placing across the load through the output switches. This block may also include gain or filtering elements depending on the application. The term ‘siding’ has been used to signify its similarity to installing house sidings. In Figure 10, the switches S1through SN can be considered as trimming the sidings at ground level (base) to desired widths, K1 through KN can be considered as lifting the sides to staggered heights sequentially, and output switches perform functions similar to attaching the sidings at the right location. The vertical siding approach is attractive for switched-capacitor type of implementation where Kn is realized through capacitor ratios. For the project, we selected the horizontal siding approach since it matches well with our dc-dc converter design. In this approach, the timing waveforms for the switches (Fig. 10) are shown in Fig. 12. The waveforms can be generated by comparing a reference (low voltage) sinusoid against a set of dc voltages from a precision voltage divider circuit and the number of steps depends on the desired voltage level in the output voltage. Higher the number of steps, better will be the quality of the output signal. In the project implementation, a PIC microcontroller was programmed to generate the timing waveforms.
S1
Sn
SN
.
.
.
.
1
n
T n
ReferenceSignal
Fig. 12 Switching Waveforms (Horizontal Siding)
Here the input voltage x(t) in Fig. 10 equals the desired output step size Vs (= ∆V). In our implementation Vs = 12V. For the nth path, the closing of the left switch Sn trims the dc voltage to a side-width determined by the output signal requirements. This voltage is then level shifted by Kn before it is multiplexed at the output through the right switch to raise the voltage level from (n-1)VS to nVs. The overall output is a stepped sinusoid as shown in Fig. 13 and this case can be considered as ADM of voltage sources Vs with a non-uniform ‘on’ interval.
V(t)
tT
Vs
2Vs
3Vs
NVs
t t1 2t
N
1
2
T - tT - t
nVs
Base Signal
Q1
Q2
LOAD
(n-1)Vs
nVs
R1
R2
Tn
Tn
Fig. 13 Equal Voltage-Step ADM with Non-Uniform Timing Fig. 14 Level Shifter
16

The output voltage v(t) can be expressed as:
∑∑=
∝
=
=N
nm
Ktv10
)( n [ ⟩−−⟨ ntmTtu ⟩−−−⟨− )( nntmTtu τ ] ……(1) )(tx
where tn and τn are the transition instant and horizontal side width respectively, for the nth path. At steady state, v(t) is a periodic waveform (a periodically time-varying ystem) and its harmonic contents can be determined using Fourier series expansion. s
The translation of the base signals to various heights to meet the stacking requirements of the desired waveform can be realized by several schemes. A level shifter circuit is shown in Figure 14. The base signal in Fig. 14 is the waveform obtained after the first switch closure and has amplitude of Vs. When this signal is low, Q1 is off and so also Q2. As the base signal goes high, the gate-source voltage of Q2 is sufficiently negative to turn it on. The output voltage across load rises to nVs from the previous level of (n-1)Vs. The output diode in Fig. 14 does the function of the output switch in Fig. 10 so that there is no cross talk between paths. The voltage translation circuit employed in our design is somewhat different from Fig. 14, but the concept is the same. A pair of N-MOS (ZVN4424) and P-MOS (ZVP4424) switches was employed for each voltage step. The P-MOS is turned ‘on’ for building the rising edge of the sine wave and the N-MOS removes the charge from the load to create the falling edge of the sine wave. This is necessary since the EL acts as a capacitive device. This has the added advantage that energy is fed back from the capacitor to the dc source and thus, improves the overall efficiency. For a resistive load, charge removal is unnecessary and eliminates the need for the N-MOS switches. H-Bridge: In general, the multilevel inverter requires both positive and negative level shifting dc voltages for a symmetrical swing in the output. This requirement can be halved in the proposed implementation plan with a voltage inversion circuit eliminating the need for negative dc sources. This is a differential BTL (Bridge-Tied Load) configuration as shown in Fig. 15. This is possible since the load can be configured as a floating load. The control signal A and NOTA correspond to each half cycle of the sinusoid for polarity reversal.
nVs
A
A
A
A
CL
Fig. 15 Simplified Output Circuitry for nth Path for Capacitive Load
When A is high, CL (EL Lamp) charges/discharges from the source through the pair of P-MOS and N-MOS connected to nVs. When A is high, CL is charged/discharged as before, but its polarity is reversed. Thus the voltage across CL has both positive and negative swing.
17

Microcontroller (PIC 16F628): The microcontroller provides all the timing signals for the ADM multiplexer and the H-Bridge. The transition times (Low-High/High-Low) were calculated using the describing equation of a sine wave at 500 Hz and 1 KHz. These data were loaded to the PIC to generate the timing signals for the ADM block. The specific functions of the PIC are: • One input pin allows the user to select frequencies between 500 Hz and 1 KHz. This will vary the timing signal’s frequency to alter brightness of the lamp. • Twelve output pins are used to control the timing of the ADM circuit which generates twelve steps in each quarter of the sine wave. • Two output pins are used to control the H-Bridge’s phase reversal to provide both positive and negative swing of the sinusoid. • The microcontroller is disabled when the battery is being charged by the solar panel during the day. • When the microcontroller receives power, the program restarts, checks the frequency selection input, and starts generating the required timing signals.
GND
+10V
+10Vin
0.1uF
1uF
0.1uF
10K1N4148
10K10uF //0.1uF
1N4003
100uF//0.1uF
3
2
1LM340
18
17
16
15
14
13
12
11
109
8
7
6
5
4
3
2
1
PIC
16F
628-04I/P
RB4/PGM
RB5
RB6/T1OSO/T1CKI/PGC
RB7/T1OSI/PGD
VDD
RA6/OSC2/CLKOUT
RA7/OSC1/CLKIN
RA0/AN0
RA1/AN1
RB3/CCP1
RB2/TX/CK
RB1/RX/DT
RB0/INT
VSS
RA5/MCLR/VPP
RA4/TOCKI/CMP2
RA3/AN3/CMP1
RA2/AN2/VREF
ZTX658
ZTX658
10K
10K
VN0104N3
10K
4.7K 10K
51K
10K
4.7K
10K
10K
+5V+5V
+5V
VN0104N3
51K
10K
12V
24V
36V
48V
60V
72V
72V
84V
96V
108V
120V
132V
144V
LOAD
Fig. 16 ADM Circuitry and H-Bridge with Microcontroller Interface
III. 3.2 EL Driver Test Results: The EL driver’s output is a 48-step approximation of the sine wave and this is shown in the images below at no load. The slight difference in voltage levels at 1KHz and 500Hz is
18

due to the dc-dc converter which was designed for open-loop operation to reduce its complexity. It is seen that the peak voltage and frequency requirements are met in the design.
Fig. 17A Output Waveforms Showing Amplitude and Frequency at 1KHz
Fig. 17B Output Waveforms Showing Amplitude and Frequency at ~ 500Hz
One of our design goals was to produce a low distortion on the driver output. To check this, the signal was captured on a digital oscilloscope (Agilent 54621A) and transported to MatLab to check its harmonic contents. Fig. 18 below shows the FFT of the signal:
Fig. 18a Captured Waveform Fig. 18b FFT Amplitude (Volt)
19
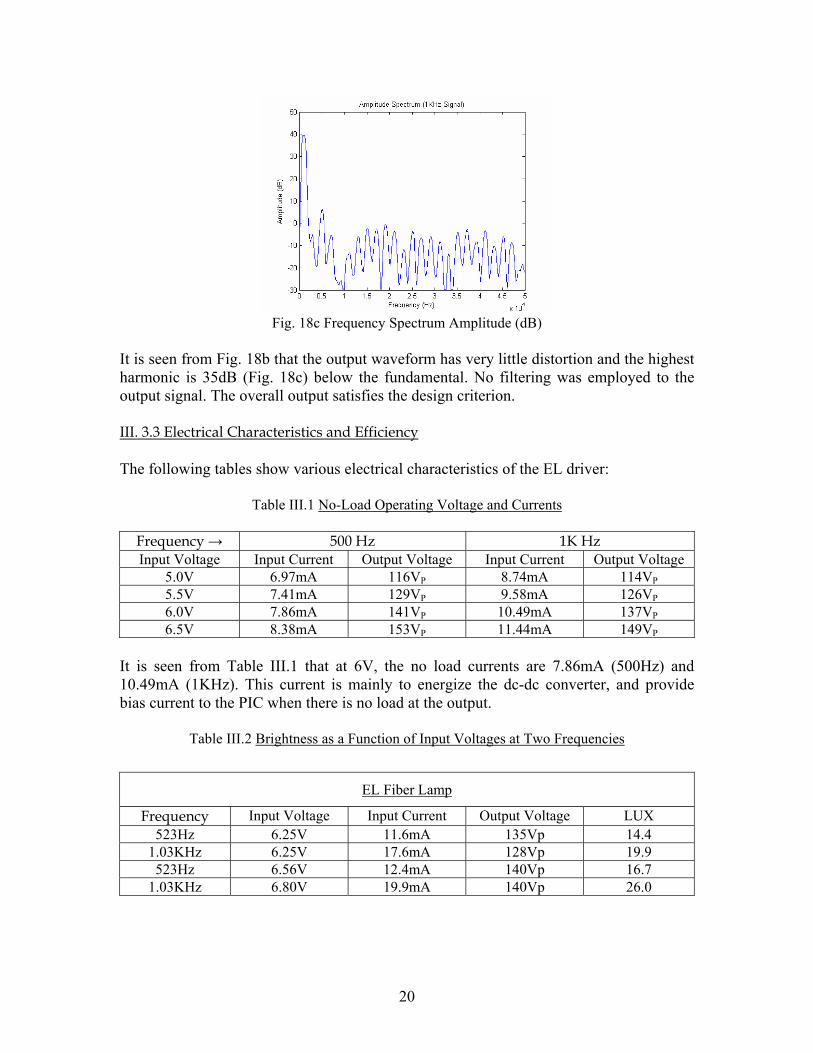
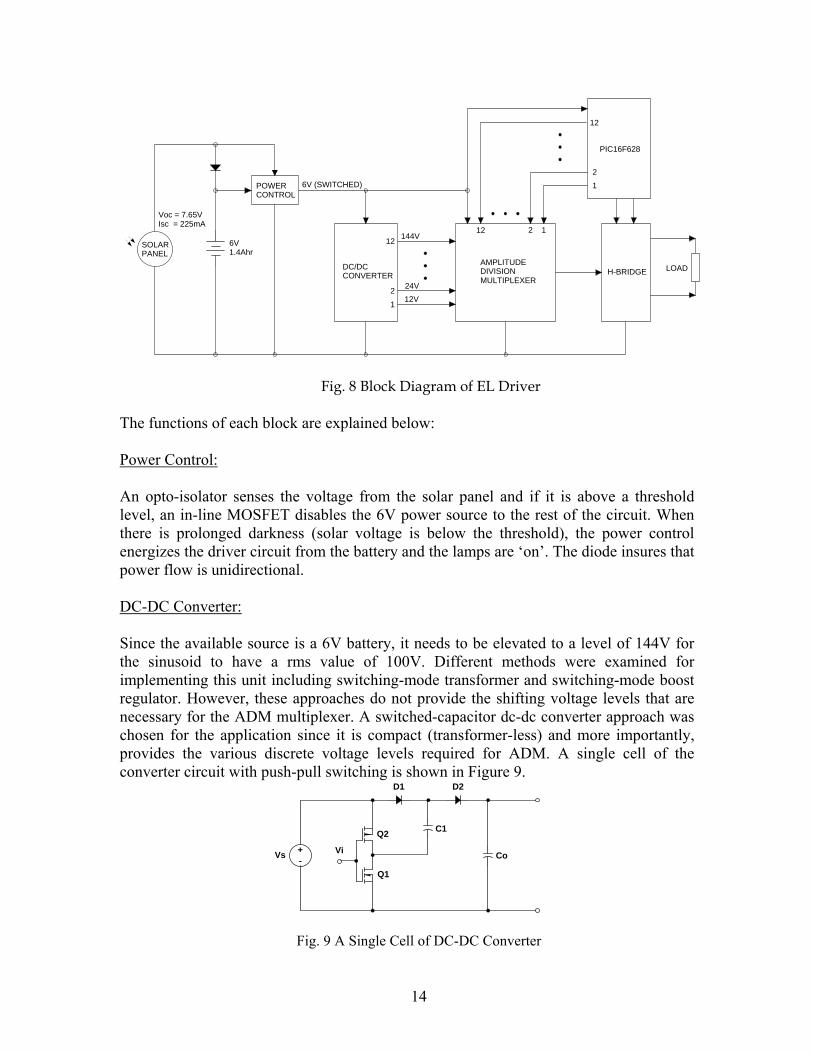
Fig. 18c Frequency Spectrum Amplitude (dB)
It is seen from Fig. 18b that the output waveform has very little distortion and the highest harmonic is 35dB (Fig. 18c) below the fundamental. No filtering was employed to the output signal. The overall output satisfies the design criterion. III. 3.3 Electrical Characteristics and Efficiency The following tables show various electrical characteristics of the EL driver:
Table III.1 No-Load Operating Voltage and Currents
Frequency → 500 Hz 1K Hz Input Voltage Input Current Output Voltage Input Current Output Voltage
5.0V 6.97mA 116VP 8.74mA 114VP
5.5V 7.41mA 129VP 9.58mA 126VP
6.0V 7.86mA 141VP 10.49mA 137VP
6.5V 8.38mA 153VP 11.44mA 149VP
It is seen from Table III.1 that at 6V, the no load currents are 7.86mA (500Hz) and 10.49mA (1KHz). This current is mainly to energize the dc-dc converter, and provide bias current to the PIC when there is no load at the output.
Table III.2 Brightness as a Function of Input Voltages at Two Frequencies
EL Fiber Lamp
Frequency Input Voltage Input Current Output Voltage LUX 523Hz 6.25V 11.6mA 135Vp 14.4
1.03KHz 6.25V 17.6mA 128Vp 19.9 523Hz 6.56V 12.4mA 140Vp 16.7
1.03KHz 6.80V 19.9mA 140Vp 26.0
20

The following graphs show the relationship of lamp brightness as a function of input voltage and current at 1KHz.
Fig. 19 Lamp Brightness as a Function of Input Voltage and Current at 1KHz
It is seen from Table III.2 that for a 6V (nominal) battery, when it is fully charged, the brightness of lamp is about 30 LUX and as the voltage drops the brightness falls as expected. For 30 LUX output, the current draw is close to 25mA (Fig. 19). Since capacitive load has no real power loss, the efficiency of the inverter was checked with resistive load. The following Figure 19 shows its efficiency for the 48-stage design as well as a comparison with a 24-stage design. With increase in load current, the efficiency rises to 95%. This verifies the other design criterion we had set regarding the inverter being highly efficient. It is seen that the 24 step design has better efficiency at lower load current since the dc-dc converter’s no load current is smaller with less number of stages. However, less number of steps will degrade the signal quality.
0 50 100 150 200 25050
60
70
80
90
100
48 Step24 Step
Efficiency - 48 Step vs. 24 Step
Load Current (mA RMS)
Effic
ienc
y (%
)
Fig. 20 Inverter Efficiency Curve
The following graph shows the lamp’s power usage as a function of time. A fully charged battery was used continuously to determine how long will the unit operate with one charge. The device ran for more than 90 hours before PIC shutdown. For a ten hour
21

operation, the device uses approximately 5mW of power and it is refurbished during daytime charging.
Fig. 21 Inverter Power Consumption vs Time III. 4 EL Lamp Prototype: A commercially available UV resistant waterproof box was used for housing the lamp. The solar panel was fitted on the top cover of the box and a blister was placed over the panel. The EL driver was tested under varying environmental temperatures to insure its functionality under harsh highway conditions of both summer and winter. The unit was tested outdoor for a period of about six months and necessary design changes were made to insure a robust product before installing on the highway. The blister caused humidity affecting the solar panel, and it was removed subsequently. Special attention was paid to UV effect on the new design and no degradation in its operation was noticed. The following pictures show the lamp, the driver board, and its visibility under various conditions:
Fig. 22a EL Lamp Components
22

Fig. 22b EL Lamp with Light Shining on Reflector Fig. 22c Driver Board (top)
Fig. 22d Driver Board (bottom) Fig. 22e Lighted Lamps
Fig. 22f Dimensions of EL Lamps
23

Fig. 23a EL and LED Lamp Comparison (lighted) Fig. 23b EL and LED Lamps (unlit) IV. Deployment of Lamps in Construction Zone The highway department allocated a new construction zone on highway 270-70 junction in Hot Spring to deploy the lamps for outdoor testing. The test site is not on the main highway and away on a dead-end zone. The following two pictures show the site location, and the lamps are to be mounted on the inside barriers.
Fig 24 Test Site (HWY 270-70 Junction in Hot Spring)
Approximately twenty lamps of each design were installed on the barriers in June 2006. The LED lamps were placed on the barriers on the incoming traffic side and the EL lamps were on the traffic exit side. The following pictures show the installation of the lamps on the barriers:
24

Fig. 25a EL Lamp Installation
25

Fig. 25b LED Lamp Installation
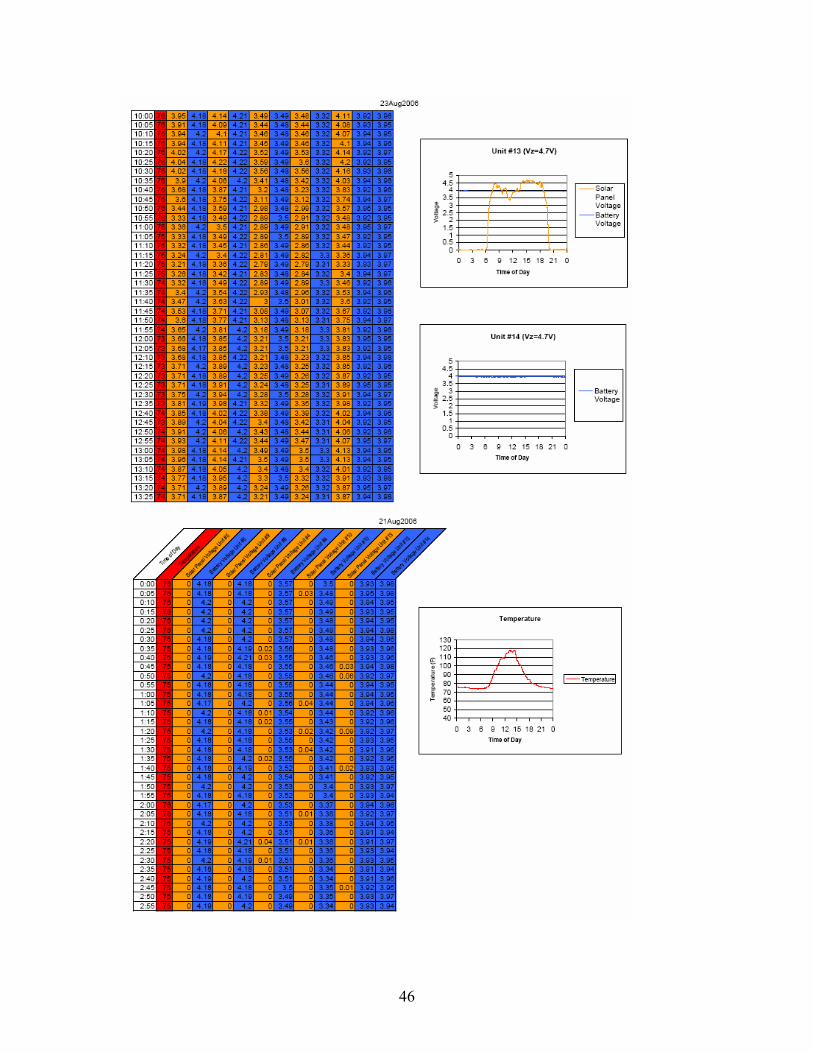
The lamps were installed at the test site at the end of June and monitored weekly to examine their functionality. The following observations were made over a period of time: • About half of the LED lamps were ‘off’ within a week after installation although
sunlight was plenty. Laboratory testing showed that the charging circuitry for the Li-ion batteries needed tighter control. A data logger was designed and built to monitor the charging of the Li-ion batteries over a period of time. The necessary modifications were made and the lamps had no problem since then.
• A few EL lamps failed due to water seeping through the fiber housing when there was a big storm. This problem was resolved by caulking the seals with water repellant silicone glue.
• Vandalism destroyed few of the LED and EL lamps (Fig. 26). It was reported to the authority. The lamps were fixed and replaced.
• Dr. John Faucett from Psychology Department took several trips to the test site for the purpose of developing the ‘perception’ survey study.
• Dr. Faucett found that the test site is not suitable for the survey because the highway slopes upwards at that point and there are too many reflective signs to warn of the curve, narrowing highway, etc. which is clearly visible in Fig. 23. One cannot see the test lights until he/she is right up on them. Dr. Faucett and his students tried getting as far away as possible on the uncompleted highway where the lights are, but both the lights and the (existing) reflectors are visible as far back as they could go. Any survey at that location will give misleading results.
• The PI and his research team had the same observation. As one is exiting from the highway, he/she has to lean to the left to see the lights as they were so far off the highway travel path. This was reported to highway department with a request for an improved test site. No such location could be identified, and it was decided then that the testing will done on a county road with official approval. The lamps will be set up on temporary stands for the nights when test drives are made, and drivers for the test will be recruited from the community and university students.
26

Fig. 26 Vandalism of LED Lamps
V. Survey and Data Analysis Dr. John Faucett, Professor of Psychology at the University of Arkansas, Little Rock, developed the survey instrument and completed the data analysis. The PI and his team provided engineering support in setting up the temporary arrangement for drive test. The lamps were fully charged before each night’s test drive. V. 1 Introduction The purpose of the drive study was to evaluate motorists’ perceptions of the relative utility of three types of highway lighting - passive light reflectors, such as those currently in use on Arkansas highways, and two types of active solar powered lighting: LED and EL. Motorist perceptions of lighting utility were gauged via two surveys, one comparing the visibility of the various lights completed by motorists as they travel an isolated stretch of rural highway (Scott, Arkansas) and the other measuring motorist perceptions of the relative utility of the lights completed immediately thereafter. This study addresses the following questions:
1. Which of the three types of lights will become visible to motorists first? 2. How effective would each type of light be for marking concrete highway barriers? 3. How effective would each type of light be for marking changes in curves in the
roadway path? 4. How distracting to motorists would each type of solar light be if placed at the top
of a highway barrier? 5. Which of the three types of lights would be more effective for marking highway
barriers and the roadway path?
27

V. 2 Method V. 2.1 Sample One hundred eleven Arkansas drivers, most of whom were students of the University of Arkansas at Little Rock, were recruited to participate in the study. Subjects were recruited from four psychology classes and an engineering class. Subjects were required to hold a valid Arkansas driver’s license. Subjects received $40.00 compensation for participating in the project. The responses of 24 subjects on the visibility survey and responses of 11 subjects on the opinion survey had to be discarded due to a failure of subjects to follow survey instructions or unintelligible responding. The resulting sample was 87 respondents for the visibility survey and 100 for the opinion survey. The sample consisted of 65 females and 35 males. The age of respondents ranged from 18 to 53, with an average age of 23 years. V. 2.2 Procedure Subjects participated in a driving simulation and two surveys focusing on the relative utility of three types of highway lights: reflectors, LEDs and ELs. Subjects traveled in pairs (driver and passenger) by automobile down a 2-mile stretch of rural highway at 50-miles-per hour. Three pairs of lights on moveable stands, approximately five feet in height, were stationed along the stretch of highway, one of each pair on either side of the road. The pairs of lights were stationed at ½-mile intervals. The set-up of the light pairs was as follows (assume the motorist is driving upwards, so that the reflector is on the left and the EL lamp on the right for the first pairing):
Table V.1
Pairing of Lights Under Test (West-East)
Reflector EL Lamps EL Lamps LED Lamps Reflector LED Lamps
Automobile trip odometers were set to 0 prior to each trial. The pairs of motorists initially drove west to east down the test stretch of highway. The initial task of the driver in each pair of motorists was to indicate which of each pair of lights he/she saw first by saying “left” if he/she saw the light on the left first and “right” if he/she saw the light on the right first. He/She would then indicate with “left” or “right” when the second light in each pair became visible. The passenger’s task was to record which light the driver saw first for each light pairing and to record odometer readings indicating at what distance each light was seen. Attachment A shows an example of the Light Visibility Survey.
28

Once the motorists traversed the test stretch of highway, the driver completed the Light Comparison Survey (Attachment B). The survey consisted of nine questions gauging a driver’s perceptions as to the effectiveness of each type of light. The effectiveness of each type of light for marking concrete highway barriers and changes or curves in the roadway path was measured with 7-point scales anchored at one end with the words Very Ineffective and at the other end with the words Very Effective. How distracting each light would be if it were placed at the top of a highway barrier was measured with 7-point scales anchored at one end with the words Not at all Distracting and at the other end with the words Very Distracting. In addition, subjects were asked to indicate which of each pair of lights they thought would be more effective for marking highway barriers and the roadway path. After the driver completed the Light Comparison Survey, the driver and passenger switched positions and they drove back down the test stretch of highway again, this time traveling in the opposite direction, east to west. The motorist pairs repeated the procedures for the Light Visibility and Light Comparison surveys. The set-up of lights for the return trip was as follows:
Table V.2
Pairing of Lights Under Test (East-West)
EL Lamp Reflector LED Lamp EL Lamp LED Lamp Reflector
V. 3 Survey Results V. 3.1 Light Visibility Survey 49 usable surveys were obtained for motorists traveling west to east, and 38 usable surveys were obtained for motorists traveling east to west. Tables below summarize motorist responses on the visibility survey.
Table V.3
Comparison of Light Visibility: EL Lamp vs. Reflector
Direction # seeing EL first % # seeing Reflector 1st % Can’t say %W-E 30 62 18 38 x 0 E-W 20 53 16 42 2 5 Total 50 58 34 40 2 2
29

Table V.4
Comparison of Light Visibility: LED vs. EL Lamps
Direction # seeing LED first % # seeing EL 1st % Can’t say % W-E 40 82 9 18 x 0 E-W 23 61 14 37 1 2 Total 63 72 23 28 1 1
Table V.5
Comparison of Light Visibility: LED vs. Reflector
Direction # seeing LED first % # seeing Reflector 1st % Can’t say % W-E 42 88 5 10 1 2 E-W 38 100 0 0 0 0 Total 80 93 5 6 1 1
As indicated above, an overwhelming majority of motorists (93%) perceived the LED light to be more readily visible than the reflector, and a large percentage of motorists (72) perceived the LED to be more readily visible than the EL. A majority of motorists (58%) perceived the EL to be more visible than the reflector. The average discrepancy in distance at which the LED was perceived vs. the reflector was 0.112 miles for the motorists traveling from west to east and 0.078 miles from east to west. The average discrepancy in distance at which the LED was perceived vs. the EL was 0.166 miles for the motorists traveling from west to east and 0.101 miles from east to west. The average discrepancy in distance at which the EL was perceived vs. the reflector was 0.164 miles for the motorists traveling from west to east and 0.025 miles from east to west. V. 3.2 Light Comparison Survey 100 usable surveys were obtained for the Light Comparison Survey. Only 49 responses were obtained for the comparison of the EL and the reflector, because the research associate assigned to bring the surveys to the testing sight was absent for one of the administrations, so that an old version of the survey that did not contain the EL vs. reflector comparison had to be used. Ratings were made on 7-point scales with higher numbers indicating greater effectiveness or distractibility. Table below shows the means and standard deviations of motorist perceptions of light effectiveness for marking concrete highway barriers and changes in the roadway path, as well as how distracting a light would be.
30

Table V.6
Effectiveness & Distractibility Ratings for LED and EL Lamps
Units→ LED EL Question N** Mean SD* N** Mean SD*
Effectiveness in marking barriers
100 5.18 1.57 100 4.16 1.61
Effectiveness in marking roadway path
100 5.22 1.54 100 4.07 1.59
How distracting 99 3.31 1.71 100 3.00 1.60 ** Number of Samples (N); * Standard Deviation (SD) Mean ratings of effectiveness and distractibility for LED and EL lighting were compared with t tests. Respondents indicated that LED lighting would be significantly more effective than EL lighting for both marking concrete highway barriers, t (99) = 4.44, p < .0001 and for marking changes or curves in the roadway path, t (99) = 5.05, p < .0001. Mean ratings of distractibility for the LED and EL lighting did not differ significantly. Motorists were also asked for their opinions as to which type of lighting would be more effective for marking highway barriers and the roadway path. Table below shows frequencies and percentages for the LED vs. Reflector, EL vs. Reflector, and LED vs. EL.
Table V.7
Comparison of Relative Effectiveness of LED, EL, & Reflector for Marking Highway Barriers and Roadway Path
Comparison Frequency Percent LED 74 74
Reflector 26 26
EL 35* 71 Reflector 14* 29
LED 69 70 EL 30 30
* Only 49 people completed this part of the survey due to administrative error (see page 28) V. 4 Survey Conclusions The results of the study indicated that the active solar lighting (LED and EL) was more visible to motorists than was the reflective lighting currently in use on Arkansas roadways. Furthermore, motorists perceived the active solar lighting to be more effective
31

for both marking concrete highway barriers and marking changes or curves in the roadway path than reflective lighting. The clear “winner” in lighting choices from both the Light Visibility and Light Comparison surveys would appear to be the LED lighting. The Light Visibility Survey indicated that the LED lights were far more likely to be perceived first by motorists than were the reflectors or the EL lights. The Light Comparison Survey indicated that 74% of respondents believed the LED lighting would be more effective for marking highway barriers and changes in the roadway than the reflectors, and 70% believed the LED lighting would be more effective than the EL lighting. Average LED ratings of effectiveness were significantly higher than EL ratings for both marking concrete highway barriers and marking changes in the roadway path. Although LED lighting would appear to be the best option for lighting Arkansas roadways, the EL lighting appeared to be more effective than the passive reflective lighting. The Light Visibility Survey indicated that the EL lights were more likely to be seen first by motorists compared to the reflectors. The Light Comparison Survey indicated that 71% of respondents felt that the EL lighting would be more effective than reflectors for marking highway barriers and the roadway path. It needs to be pointed out that the weather condition during the test was normal and there was no rain or foggy situation. Literature review indicates that the EL fiber is more effective in foggy condition. This couldn’t be verified through the test. Perhaps use of each technology lamp alternately for highway markings will be a good recommendation. VI. Project Conclusions The research developed two types of barrier lighting devices using LED and EL (Electroluminescent) technology that employ solar energy as the power source. The following are initial prototypes of the solar powered units that were reported in Phase I. Fig. 27a Initial LED Lamp Prototype Fig. 27b Initial EL Lamp Prototype During the course of phase II research, the design was changed dramatically, electronics much improved for higher efficiency, and units have a professional look. We can say convincingly that the research has led us to develop a new breed of barrier lights that can withstand the harsh environment of the highway, have small footprints and lightweight,
32

portable, and require no wires or outside power source. The light is bright enough to see at a distance without distracting the driver and thus enhances driving safety especially in inclement weather condition. Each unit has high power conversion efficiency, and is practically maintenance free. The design has fully met the goals set for the project. The following pictures show the lamps side by side for comparison with the initial prototypes.
Fig. 28 Final Design of EL and LED Lamps The LED lighting employs PWM technique which is controlled by a PIC microcontroller. It continuously monitors the battery voltage and adjusts the brightness accordingly. The system has a high efficiency to run the lamps for a whole week with approximately 3 days of full charge. Li-ion was selected for the application for its power density and weight consideration. The EL lighting system employs an ADM approach for the driver. ADM is a new concept that resulted through this research. The concept has been disseminated internationally through conferences and symposiums. The driving circuitry for the EL is more complex and employs a dc-dc switched capacitor converter to raise 6V dc to 144V dc level. For this type of dc-dc conversion, the ADM approach is a natural fit to generate a high ac voltage. The electrical efficiency of the unit is close to 95%. The ADM approach also allows feedback of energy to the battery in two quarter cycles of the sinusoid, thus enhancing the inverter efficiency. This has been possible since the EL acts as a capacitive device. The following table summarizes some of the units’ useful specifications:
33

Table VI.1
Lamp Characteristics
Parameter LED Lamps EL Fiber Lamps Weight 1lb. 2oz 2lbs. 4oz Battery 3.6V Li-ion, 2200mA-hr 6V Sealed Lead Acid, 1400mA-hr
Solar Panel 11.5 cm Diameter Open Circuit Voltage= 6.5V,
Short Circuit Current= 115mA
14.5cm x 11.5 cm Open Circuit Voltage= 7.6V,
Short Circuit Current= 225mA Brightness Av LUX: 150 w/White LED
40 w/Orange LED Av LUX: 20 @ 6V
70 @ 12V Capacity Approx. 3 days of full charge runs a
week Approx. 2 days of full charge runs a
week Long term deployment of the units on the highway didn’t have any noticeable UV effect. There were minor problems of water seepage in a stormy weather and failure of the microcontroller due to lightening. These problems were solved through sealing and watchdog timer, and the units ran effectively for more than six months on the highway. The curiosity of the new units led to some vandalism and the units were repaired for reuse. Dr. John Faucett, a Professor of Psychology at UALR, carried out the motorists’ perception test on a county highway in Scott, Arkansas. The highway 270-70 site where the units were deployed in a cul-de-sac away from the main travel path was not suitable for the survey. Drivers were recruited from the university and community, and paid a small compensation for their time. The drivers were required to fill out two survey instruments: Light Visibility Survey and Light Comparison Survey. The Light Visibility Survey indicated that the LED and EL lights were far more likely to be perceived first by motorists than were the reflectors. The Light Comparison Survey indicated that 74% of respondents believed the LED lighting would be more effective for marking highway barriers and changes in the roadway than the reflectors, and 71% of respondents felt that the EL lighting would be more effective than reflectors for marking highway barriers and the roadway path. 70% believed the LED lighting would be more effective than the EL lighting in visibility. This is due to the fact that both the units didn’t have the same brightness in the final product. One of the design guidelines was not to make the lamps too bright to be a distracter while driving. The initial design of LED lamp employed orange LEDs that produced an average brightness of 30-40 LUX with an input current of 10-15mA. The LED lighting is discrete and was dispersed through an orange lens. The light intensity measurement is not uniform. The EL lamp was designed for an intensity of 20-25 LUX (uniform intensity) with an input current of 15-20mA. However, the intensity of both units was found to be less than optimum for strong visibility, and the LED lamps were converted to white LEDs resulting in more brightness. The input voltage of the EL lamp was doubled to increase its brightness to 70-75 LUX. The same effect is achieved for EL lamp if the operating frequency is doubled without raising the input voltage level. However, in both the cases, the input current from the battery increased by about two-fold. It was found that the system design has enough additional capacity to handle this higher input current. During the test drive, the weather condition was normal and there
34

was no precipitation and foggy situation. The effectiveness of the lights in terms of their visibility couldn’t be determined under such inclement weather, although the EL fiber is known to be more effective under foggy and misty condition. In conclusion, the research has produced two types of commercially viable barrier lights that have been found to be far superior to passive reflectors in their visibility. It is believed that the deployment of a combination of lamps (LED & EL) on jersey barriers will vastly improve driver safety. Being portable, the lamps are also suitable for other applications including road construction and sharp bend on highway exits.
VII. Summary Statement of Research Implementation The deliverables of Phase II research are ready for technology transfer. Barring battery cost, the production costs of the prototypes in quantities of 25 are: approximately $40/LED lamp and $100/EL lamp. The enclosure for the EL lamp was bought from commercial vendors and it raised the unit costing. However, the enclosure box and the EL lamp can be molded into one unit similar to the LED lamp, and this will reduce the unit cost of EL lamp. In volume of 10,000, it is estimated that the lamps will cost no more than $20 - $50 per unit. The LED life is more than 10,000 hrs (50% brightness) and that of EL is 7,000 hours (50% brightness) of continuous use. The solar panel is good for 10 years and the battery life is expected to be 3-4 years depending on the charging condition. With advances in technology, the units should be upgraded on a timely basis to reflect the existing state of technology in light display, solar panel, and battery technology. VIII. Research Publications Related to Project
• H. Patangia and E. Dervishi*, “A Switched-Capacitor inverter for driving a highly capacitive load,” in Proc. IEEE Int. Conf. Indus. Technology, December 2004, Tunisia.
• H. Patangia, T. Wijaya*, and D. Gregory*, “A Multi-Level inverter for driving a high voltage display,” in Proc. IEEE Int. Symp. Circuits & Systems, May 2005, Kobe, Japan.
• H. Patangia, “Amplitude Division Multiplexing Scheme in Analog Signal
Processing”, in Proc. IEEE Int. Midwest Symp. Circuits & Systems, August 2005, Cincinnati, Ohio
• H. Patangia and D. Gregory*, “An N-Path Implementation of a Switched-
Capacitor Inverter Using Charge Transfer”, in Proceedings IEEE Int. Conf. Indus. Technology, December 2005, Hong Kong
• H. Patangia and D. Gregory*, “A Harmonic Reduction Scheme in SPWM”, in
Proceedings IEEE Asia Pacific Conf. Cir. & Systems, December 2006, Singapore
35

• H. Patangia and D. Gregory*, “Implementation of a Multilevel SPWM Inverter For Capacitive Loads”, in Proceedings IEEE Int. Conf. Indus. Technology, December 15-17 2006, Mumbai, India
• H. Patangia and D. Gregory*, “A Novel Multilevel Strategy in SPWM Design” in
Proceedings IEEE International Symposium on Industrial Electronics, June, 2007, Vigo, Spain.
IX. Other Research Dissemination • Presented research finding of project MBTC-2064 “Assisted Night Vision for
Motorists” at the TRC annual meeting held at UALR, May, 2006. • H. Patangia, “Assisted Night Vision for Motorists in Construction Zones: Phase I”
poster at Technology for Legislators, Arkansas State Capitol Building, March, 2005 • UALR published an article on the Phase II research in “Undergraduate
Research Bulletin”, Fall 2005 with the pictures below.
Fig. 29 Types of Lights Evaluated for Project Application
36

APPENDIX
A.1 LIGHT VISIBILITY SURVEY Subject Number: ______________________ The driver will indicate which of each pair of lights he/she sees first by saying the side of the road that light is on (Left or Right). The passenger will record the odometer reading and circle which light was seen first. The driver will indicate the side of the road the second light of each pair is on when he/she first notices it (Left or Right). The passenger will record the odometer reading. The process will be repeated 3 times, once for each pair of lights. Direction Traveled (Please Circle): East West First Pair First Seen: Right Left Odometer reading for first light seen: ________________ Odometer reading for second light seen: ________________ Second Pair First Seen: Right Left Odometer reading for first light seen: ________________ Odometer reading for second light seen: ________________ Third Pair First Seen: Right Left Odometer reading for first light seen: ________________ Odometer reading for second light seen: ________________
37

A.2 LIGHT COMPARISON SURVEY
Arkansas Highway Department and the University of Arkansas at Little Rock
Subject Number: _______________________ Date: ______________________ Time: _______________________ General Weather Conditions: ______________________________________ General Instructions for Survey Administrators 3 pairs of lights on moveable stands will be set up on either side of a seldom traveled roadway, each pair approximately ½ mile from the other pairs. Motorist subjects will travel in pairs down the stretch of highway. The driver will make judgments concerning the visibility of the lights and the passenger will record those judgments. Once they have traveled the designated stretch of highway, the subjects will switch places (i.e., the driver will become the passenger and vice versa) and they will repeat the experimental procedure traveling in the opposite direction. The set-up of the lights will be as shown below: EL Reflector LED EL LED Reflector Survey Instructions: Motorist’s Age: ____________________ Sex (Circle One): M F
1. On a scale of 1 to 7, with 1 meaning very ineffective and 7 meaning very effective, how effective do you believe the Round Gold Light (LED) would be for marking concrete highway barriers?
Very Ineffective Very Effective
1 2 3 4 5 6 7
38

2. On a scale of 1 to 7, with 1 meaning very ineffective and 7 meaning very effective, how effective do you believe the Round Gold Light would be for marking changes or curves in the roadway path?
Very Ineffective Very Effective
1 2 3 4 5 6 7
3. On a scale of 1 to 7, with 1 meaning not at all distracting, and 7 meaning very
distracting, how distracting do you believe the Round Gold Light would be if it were placed at the top of a highway barrier?
Not at all Distracting Very Distracting
1 2 3 4 5 6 7
4. Which do you think would be more effective for marking highway barriers and the roadway path, the Round Gold Light or the reflector?
(1) Light (2) Reflector
5. On a scale of 1 to 7, with 1 meaning very ineffective and 7 meaning very
effective, how effective do you believe the Square Yellow Light would be for marking concrete highway barriers?
Very Ineffective Very Effective
1 2 3 4 5 6 7
6. On a scale of 1 to 7, with 1 meaning very ineffective and 7 meaning very effective, how effective do you believe the Square Yellow Light would be for marking changes or curves in the roadway path?
Very Ineffective Very Effective
1 2 3 4 5 6 7
7. On a scale of 1 to 7, with 1 meaning not at all distracting and 7 meaning very distracting, How distracting do you believe the Square Yellow Light would be if it were placed at the top of a highway barrier?
39

Not at all Distracting Very Distracting
1 2 3 4 5 6 7
8. Which do you think would be more effective for marking highway barriers and
the roadway path, the Square Yellow Light or the reflector?
(1) Light (2) Reflector
9. Which of the two lights do you believe would be more effective for marking
highway barriers and the roadway path?
Round Gold Light A Square Yellow Light B Why?
40

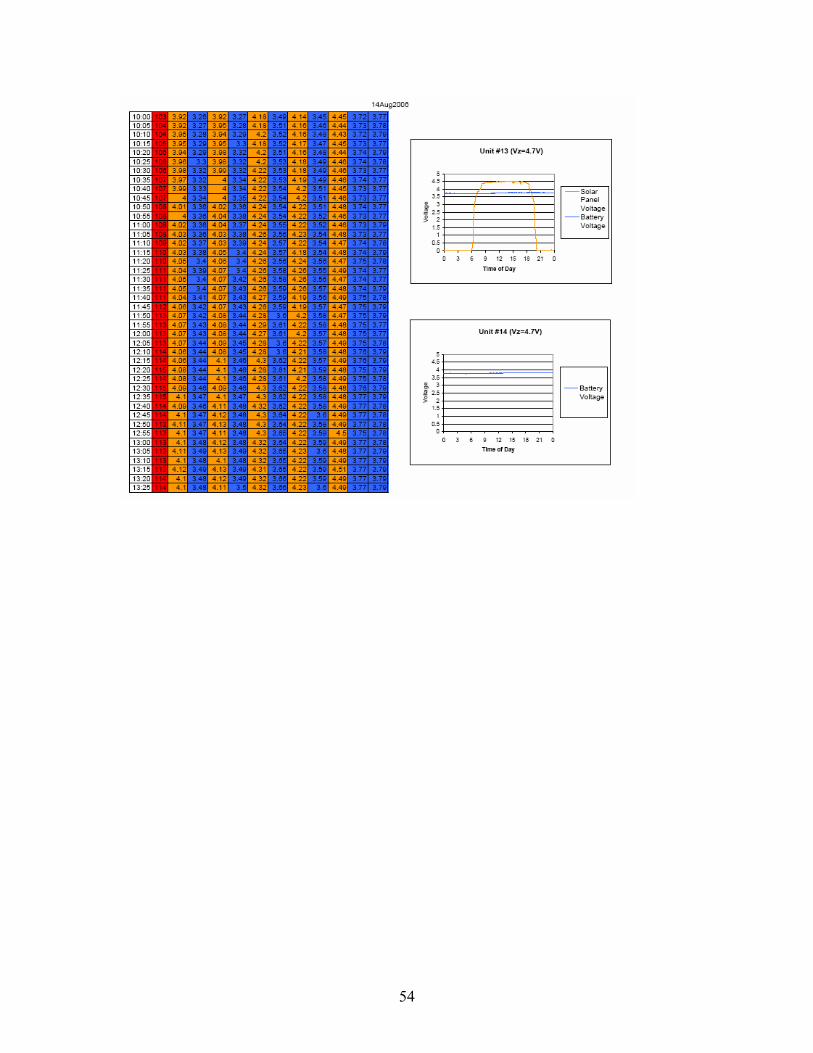
A.3 Data Logger Results ( Aug 14 -27) for LED Battery Charging
41

42

43

44

45
46

47

48

49

50

51

52

53
54