assisting congress to better understand environmental justice midterm briefing magdalena dewane...
TRANSCRIPT

Assisting Congress to Better Understand Environmental JusticeMidterm BriefingMagdalena DewaneMarch 6, 2013Advisor: Gail Suchman
2
The Beginning of WE ACT
Prepared for Photo Credits: HCE Contractorsand WE ACT

Prepared for
3
WE ACT Today
• National leader in environmental justice
• New office in Washington, D.C.
• Programs:• Clean Air• Affordable, Equitable Transit• Waste Reduction• Toxic Free Products

Prepared for
4
What is Environmental Justice?
“…the fair treatment and meaningful involvement of all people regardless of race,
color, national origin, or income with respect to the development, implementation, and
enforcement of environmental laws, regulations, and policies…”
-U.S. Environmental Protection Agency
(1985) Population SizeAverage
Household IncomePersons Below
Poverty Line
72nd StreetNeighborhood
84% white $123,000 8.5%
West Harlem 60% black $26,000 34%
Data: University of Michigan

Prepared for
5
Promoting Environmental Justice
Objective: Support WE ACT in advocating for environmental justice in Congress.
Outputs:• Five community case studies by district• Localized fact sheets for district
Representatives• Research report and case study model• Congressional briefing

Prepared for
6
Target States

Prepared for
7
Methodology Elements
• Conduct data analysis• Low-income and minority populations• Environmental hazards
• Research political profile• Relevant committee membership• Voting record
• Align with WE ACT policy priorities

Prepared for
8
Colorado Demographics
Population 5,029,196
White 70%
Hispanic 21%
Black/African American 4%
Asian/Pacific Islander 3%
Median household income $56,993 (14th US)
Poverty 12.5%
Food stamp participants 10%
Unemployment 7.6%
2010 Census Statistics
Data: Census.gov
9
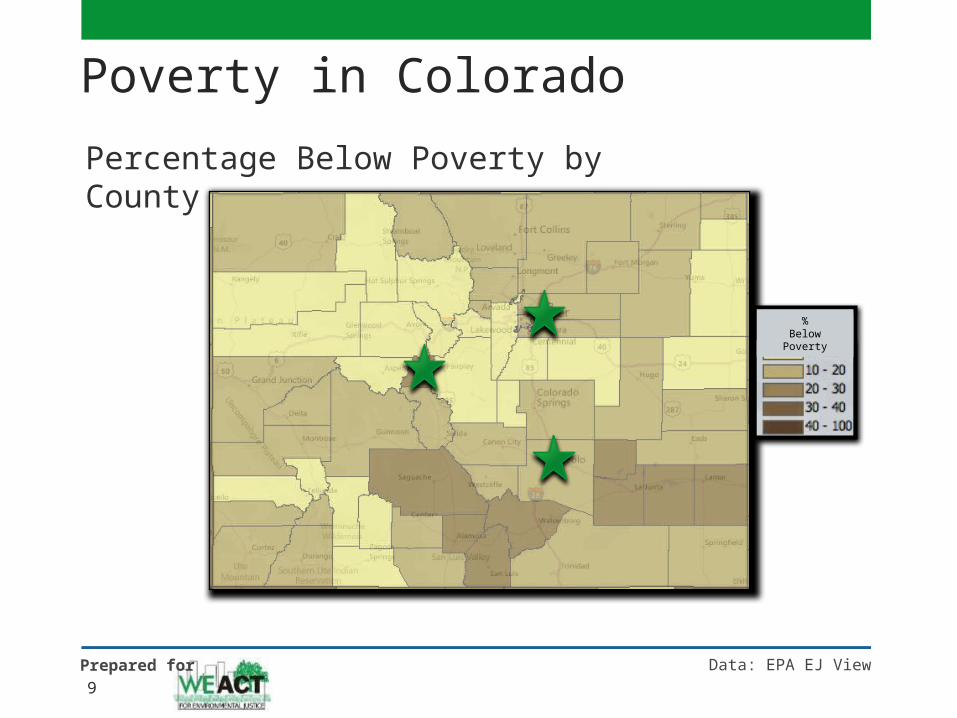
Poverty in Colorado
Prepared for
Percentage Below Poverty by County
%Below Poverty
Data: EPA EJ View

Prepared for
10
Poverty in Denver
Percentage Below Poverty by Census Tract
%Below Poverty
Data: EPA EJ View

Prepared for
11
Minorities in Denver
Minority Percentage by Census Tract
Data: EPA EJ View

Prepared for
12
Minorities in Downtown Denver
Minority Percentage by Census Tract
Data: EPA EJ View

Prepared for
13
Denver County Burden Ratios
0 20000 40000 60000
Indicator of Chemical Releases
0 0.20.40.60.8 1 1.21.41.61.8
Facilities Per Square Mile
Ratio2:1
Ratio1.21:1
Data: Good Guide
Toxic ChemicalReleases
Superfund Sites
Above PovertyBelow Poverty

Prepared for
14
Political Analysis
Photo Credit: lcv.org
• Committee on Energy and Commerce
• Subcommittee on Environment and the Economy

Prepared for
15
Additional Research
“When you first picture Denver, you probably don't picture pollution … but the state suffers
from a wide span of toxic, hazardous and radioactive pollution.”
Credit: TheWitness.org

Prepared for
16
Case Studies

Prepared for
17
Overcoming Challenges
Challenge:• Identifying target communities
• 312 counties 3 cities/regions
Solution:• Cross reference environmental justice mapping
tool with census data• Consider committee assignments and voting
record of Representatives

18
Looking Ahead
Prepared for
Tasks:
• Conduct interviews
• Complete case studies
• Develop fact sheets
• Compile research report and model

Thank you!
Questions?