association analyses of known genetic variants with …
TRANSCRIPT
ASSOCIATION ANALYSES OF KNOWN GENETIC VARIANTS WITH GENE
EXPRESSION IN BRAIN
by
Viktoriya Strumba
A dissertation submitted in partial fulfillment of the requirements for the degree of
Doctor of Philosophy (Bioinformatics)
in The University of Michigan 2009
Doctoral Committee:
Professor Margit Burmeister, Chair Professor Huda Akil Professor Brian D. Athey Assistant Professor Zhaohui S. Qin Research Statistician Thomas Blackwell

ii
To
Sam and Valentina
Dmitriy and Elizabeth

iii
ACKNOWLEDGEMENTS
I would like to thank my advisor Professor Margit Burmeister, who tirelessly guided me
though seemingly impassable corridors of graduate work. Throughout my thesis writing
period she provided sound advice, encouragement and inspiration. Leading by example,
her enthusiasm and dedication have been instrumental in my path to becoming a better
scientist.
I also would like to thank my co-advisor Tom Blackwell. His careful prodding always
kept me on my toes and looking for answers, which taught me the depth of careful
statistical analysis. His diligence and dedication have been irreplaceable in most difficult
of projects.
I also would like to thank my other committee members: Huda Akil, Brian Athey and
Steve Qin as well as David States. You did not make it easy for me, but I thank you for
believing and not giving up. Huda’s eloquence in every subject matter she explained have
been particularly inspiring, while both Huda’s and Brian’s valuable advice made the
completion of this dissertation possible.
I would also like to thank all the members of the Burmeister lab, both past and present:
Sandra Villafuerte, Kristine Ito, Cindy Schoen, Karen Majczenko, Ellen Schmidt, Randi
Burns, Gang Su, Nan Xiang and Ana Progovac. You all taught me something new, gave

iv
me a little bit of yourself. Separate thank you to Elżbieta Śliwerska for patiently teaching
me lab techniques and for being a good friend.
A special thank you goes to my parents Dr.Reznik and Dr.Vyunitskaya. You have been
my inspiration throughout my life. I wish you lots of health and hope I can continue to
learn from you for many years to come. A very special thank you goes to my husband
who pushed and pulled, held on and pressed forward, stood by my side and stood out of
my way. I could not do it without you! I also would like to thank my immediate and
extended family: Eugenia, Alesha, Dina, Larisa, Raisa Il’inichna, Mikhail Markovich,
Grigoriy Davidovich, Lyubov Ivanovna, Anna, Zhenya, Vera, Yasha and Phillip. Of
course it would not be possible without Ilya Wagner, who has been the best uncle my
precious daughter Elizabeth could ask for!

v
TABLE OF CONTENTS
DEDICATION ............................................................................................................................. ii
ACKNOLEDGEMENTS.......................................................................................................... iii
LIST OF TABLES ..................................................................................................................... vii
LIST OF FIGURES .................................................................................................................. viii
CHAPTER
I INTRODUCTION..................................................................................................1
DNA microarrays technology is a platform for quantifying molecular phenotypes ...................................................................................................2 Expression studies of Mendelian disorders .................................................5 Association studies of complex disorders ...................................................8 References ..................................................................................................13
II GLUTAMATE SIGNALLING IMPLICATED IN CAYMAN ATAXIA BY MICROARRAY ANALYSIS OF ITS MOUSE MODEL ...............................17
Introduction ................................................................................................17 Materials and Methods ..............................................................................20 Results .......................................................................................................23 Discussion ..................................................................................................28 Figures........................................................................................................34 Tables .........................................................................................................36 References ..................................................................................................46

vi
III EXPRESSION PROFILING IMPLICATES DYSREGULATION
OF CALCIUM SIGNALING IN WADDLES (WDS), A MOUSE MODEL OF ATAXIA AND DYSTONIA ............................................................. 51
Introduction ................................................................................................51 Materials and Methods ..............................................................................53 Results .......................................................................................................54 Discussion ..................................................................................................56 Tables .........................................................................................................62 References ..................................................................................................70
IV ANALYSIS OF GENE EXPRESSION ASSOCIATION WITH BIPOLAR DISORDER ASSOCIATED SNPS ....................................................................73
Introduction ................................................................................................73 Materials and Methods ..............................................................................80 Results .......................................................................................................82 Discussion ..................................................................................................87 Figures........................................................................................................89 Tables .........................................................................................................95 References ..................................................................................................96
V DISCUSSION ......................................................................................................99
Figures......................................................................................................118 References ................................................................................................119

vii
LIST OF TABLES
CHAPTER II
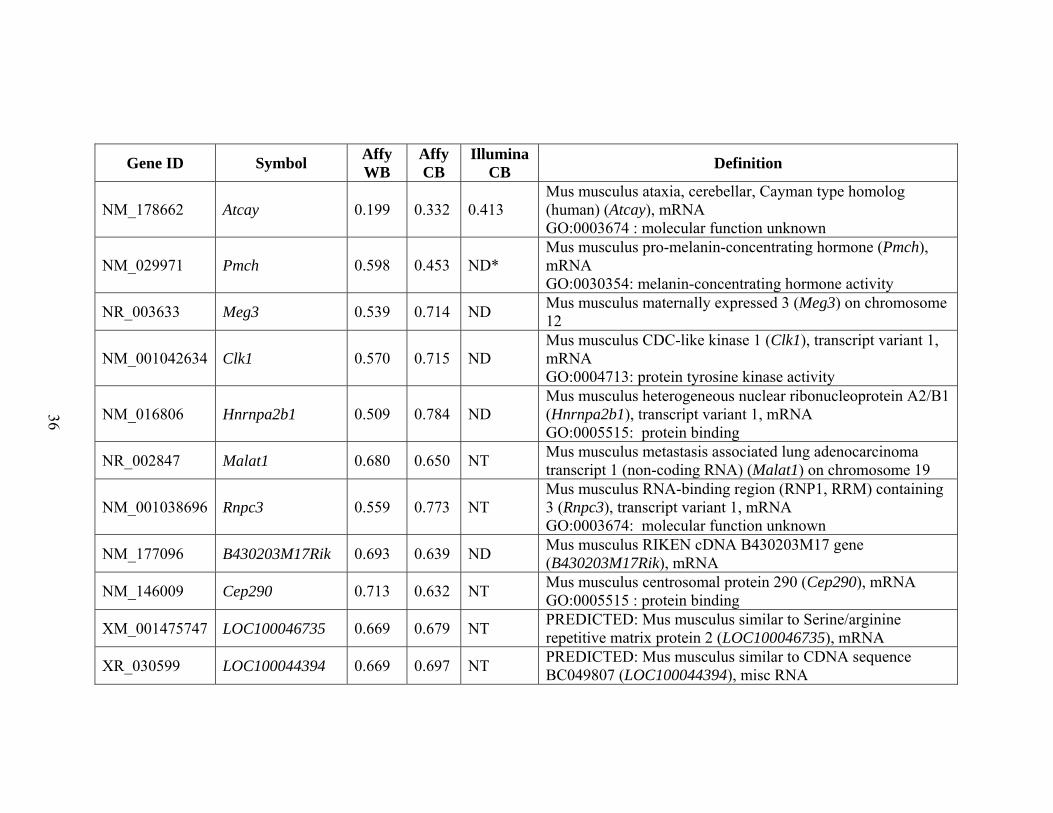
2.1 Genes consistently differentially expressed in whole brain and cerebellum experiments ....................................................................................................36
2.2 qRT-PCR primer pairs ....................................................................................44
2.3 Results of qRT-PCR .......................................................................................45
CHAPTER III
3.1 Subset of genes differentially expressed in cerebellum of waddles mice compared to controls ......................................................................................62
CHAPTER IV
4.1 Summary of the data used for the regression analysis of gene expression against SNPs ...................................................................................................95

viii
LIST OF FIGURES
CHAPTER II
2.1 Differentially expressed genes in Atcay mutants compared to control cerebellum ......................................................................................................34
2.2 Mouse models of ataxia ..................................................................................35
CHAPTER IV
4.1 Significant association between SNPs and transcripts in cis seen in all 6 brain regions tested ..................................................................................................89
4.2 Top cis associations are due to SNPs in LD with each other in regions on chromosomes 3 and5 ......................................................................................90
4.3 Expression levels of MCTP1 gene are associated with variants of rs212448 SNP consistently across brain regions ............................................................91
4.4 Bipolar GWAS association p-values peak does not overlap with SNP-expression p-values peak ................................................................................92
4.5 Association between MCTP1 and rs211448 is replicated in all disorders samples in this study .......................................................................................93
4.6 Plot of –log10 p-values for BP GWA study meta-analysis for region on chromosome 3 ................................................................................................94
CHAPTER V
5.1 Basic circuitry of the cerebellar cortex .........................................................118

1
CHAPTER I
INTRODUCTION
It has long been accepted that genetic variations underlie phenotypic differences
between individuals of the same species. There are many different types of DNA
variations, including single nucleotide polymorphisms (SNPs), as well as inversions,
insertions and deletions (the latter can range from one or a few bases to parts of
chromosomes). One way to classify the small scale variations, i.e. those that affect only
one or few base pairs of a sequence, is to distinguish between those that lie within gene
product coding sequence and those that lie outside. Variations in both categories could be
silent and have no discernable effect on phenotype. Alternatively, they can lead to
phenotypic changes due to qualitative or quantitative changes at the level of the mRNA
transcript, the resulting protein, or both. The recent availability of high throughput
technologies to measure transcription on a genome-wide scale gave scientists an
unprecedented ability to study the effects of variations/mutations at the molecular level.
In this thesis, we utilized data generated using genome-wide high throughput microarray
technology in two different scenarios to elucidate the function of genetic variants or
mutations, thereby placing a previously functionally uncharacterized protein or genetic
variant into a functional context, and to generate new hypotheses for future inquiries. We
used microarray technology to address two fundamentally different biological questions.
In Chapters II and III, I describe our investigations of mouse models of two Mendelian

2
neurological disorders using microarray technology to elucidate “downstream” effects of
the two mutations. In Chapter IV we investigated microarray expression data from human
postmortem brain to help us clarify functional repercussions of variations associated with
complex psychiatric disorder. While in both cases we tried to answer very different
biological questions, there are also many commonalities, especially in the challenges met
in data acquisition and processing. In each case, despite the challenges, we were able to
use whole-genome expression microarrays to generate new hypotheses.
In this Chapter, some of the previous work in the field of microarray expression
analysis leading up to our investigations is reviewed. Chapters II, III and IV will detail
the experiments and results of three studies that we carried out. Finally, in Chapter V,
some of the common challenges identified and addressed in our experiments are
discussed.
DNA microarrays technology is a platform for quantifying molecular phenotypes.
Transcription is the first step in a chain of events, often called the central dogma
of biology, the cellular process that reads the DNA blueprint into the final functional
protein products. Which gene is transcribed or expressed is a tightly regulated process
and depends on several factors. In a multicellular organism, one of these factors is the
cell type. While all cells in a given organism contain the same DNA and use the same
subset of genes, often referred to as housekeeping genes, to sustain basic functions, they
also express sets of cell type specific transcripts. In addition, cells can also regulate which
genes are used at a particular point in time in response to external signals. In the 1990s, a
new technology, called DNA microarrays, was developed to allow measurement of the
transcription levels of thousands of genes at the same time (1-3). Microarray technology
3
utilizes the specificity of hybridization of nucleic acids to probe and quantify the amount
of mRNA in a mixture. Short nucleotide sequences, called probes, are attached to a solid
surface, called a chip, to which labeled complementary RNA (cRNA) obtained from
samples of interest is hybridized. Specialized scanners are then used to read fluorescence
emitted by the labeled cRNA which in then converted into relative mRNA quantities.
While the exact design differs widely between different manufacturers, all of them offer
various platforms for measuring anywhere from a few hundred transcripts that may be of
a particular interest to all known transcripts in the genome.
The extraordinary power of DNA microarray technology has led to an explosion
of studies investigating whole genome expression changes. Most applications compare
two groups of samples, such as disease vs. control, different diseases states, or cells with
vs. without treatment with metabolites, heat or a drug. The power of this approach can be
perhaps best exemplified by advancements made in cancer research, where many new
molecular pathways affected in various cancer types, as well as between benign and
metastatic cancers, have been identified (4).
After extensive technical data analysis (normalization as well as accounting for a
variety of co-variables and batch effects), microarray experiments typically result in lists
of transcripts that are differentially expressed between the sample groups that were
compared. Most microarray analyses are then followed by network or pathways analysis
that attempts to group the results into biological functional units. The premise here is that
since genes function and act together, when multiple genes are affected in a disease
compared to a control set of samples, some of those changes are likely to be in several
genes that are part of an already characterized, defined biological pathway. Various tools

4
exist for carrying out this type of analysis, including, but not limited to, DAVID/EASE
(5, 6), Ingenuity Pathways Analysis (www.ingenuity.com), and Gene Set Enrichment
Analysis (GSEA) (7). All of these tools use information from publically available
sources, such as Gene Ontology (8) or KEGG (9), as well as add their own curated
definitions of groups, biological pathways or functional categories. For example,
Ingenuity Pathway Analysis offers sets of cell regulatory networks based on expert-
curated information obtained from multiple sources, such as publications of individual
interactions or yeast two hybrid interaction experiments. While the analytical details of
how enrichment is estimated differ between these tools, the underlining general scheme is
the same. First, every member of the list of significantly differentially expressed genes,
provided by the user, is matched to every category, group, pathway, or network each may
belong to. Statistical analysis is then applied to estimate the probability of observing
several of the differentially expressed genes belonging to the same category or network
by chance, given the reference set of all genes tested in a particular experiment.
These resources are continually evolving and their immense value should not be
underestimated. However, the best of these tools tend to be those that are curated by
experts based on published results. Such pathways therefore tend to be biased towards
well studied fields, such as cancer research. This means, for example, that if a particular
dataset contains differentially expressed genes that play a role in cell proliferation, this
function is readily identified by most pathway tools. On the other hand, when
differentially expressed transcripts are involved in a complex neuronal signal
transduction pathway that is not well characterized or documented in the literature, as I
will describe in Chapter II of this thesis, evaluating results only with available

5
bioinformatics tools will not give the complete picture. Better expert annotation of
pathways is clearly an area of bioinformatics in which there is room for future
improvement for the field.
Expression studies of Mendelian disorders.
Mendelian disorders are highly penetrant disorders caused by mutations at a
single specific locus. For this class of disorders, microarray expression studies have been
used for two basic applications. The first is the use of mRNA expression profiling in the
tissue of interest to help identify the disease locus. This use of microarray platform is
complicated by the fact that expression has to be done in the tissue where the effect is
observed, which is not always available from human subjects carrying the disease.
However, animal models have been successfully used in such a case. For example,
Kennan et al. (10) identified the mutation in a form of human autosomal dominant
retinitis pigmentosa by sequencing only those genes that were differentially expressed in
a mouse model of retinal degeneration.
Second, in disorders with known monogenic defects, microarray expression
studies have been successfully used to identify downstream pathways, i.e. the secondary
effects of a mutation on expression of other genes. For example, microarray expression
analysis of a mouse model of Friedreich’s ataxia allowed the identification of
downstream effects of frataxin on dysregulation of mitochondrial proteins (11). These
experiments pointed to specific changes in genes involved in nucleic acid and protein
metabolism, signal transduction and oxidative stress, with the latter category having been
previously implicated in the pathogenesis of the disorder (12). These experiments were
performed using samples from mouse neuronal tissue and some of the findings were in

6
addition confirmed by qRT-PCR in cell lines from human subjects with the disease (11).
Additional microarray experiments in other tissue types helped further define antioxidant
defense and mitochondrial function as the molecular pathways affected by the mutation,
and even helped identify a novel therapeutic target for the disorder (13).
In Chapters II and III of this thesis, I will describe our work on two specific cases
of such functional evaluation, in mouse models of two human ataxias. In these two cases
we used microarray expression data from a mouse model to place its homologous human
disorder of unknown functional origin into known functional pathways. In the first set of
experiments, the mutant was a severe (null) murine allele of the Atcay/ATCAY gene that
is also implicated in human Cayman ataxia Previous studies had shown that Caytaxin, the
protein product of Atcay, is a binding partner for phosphate-activated enzyme
glutaminase [(14) and K. Ito, M. Hortsch, unpublished data], which catalyzes glutamine
(Gln) to glutamate (Glu) conversion. It was previously postulated that Caytaxin may play
a role in glutaminase transport (14), which would mean that the absence of functional
Caytaxin protein, such as observed in the mouse mutant Atcayswd/swd (15), would result in
misdirection of glutaminase and thus in reduction of glutamate at the axon termini and
synaptic cleft on one hand, but could also lead to excess amounts of Glu in extracellular
spaces and cytotoxicity leading to neurodegeneration. Our microarray results indicate no
apparent neurodegeneration in neuronal cells downstream of Atcay. Instead, our results
show largely postsynaptic changes, which lead us to a new hypothesis: the amount of Glu
in the synapse may in fact be reduced, and Purkinje cells react in a compensatory fashion.
This new hypothesis is based on the observed downregulation of several transcripts
downstream of Glu signaling. In short, DNA microarray analysis of brain and cerebellum

7
tissue of Atcayswd/swd mice compared to control allowed us to put forth alternative
hypothesis about the role of Caytaxin, which can now be tested in additional experiments.
The experiments described in Chapter II identified carbonic anhydrase related
protein VIII, Car8, as one of the genes affected by Caytaxin deficiency. Since Car8 in
turn was also known to be associated with an ataxic phenotype, this directly led to our
investigation, detailed in Chapter III, of the molecular signature in Car8 deficient
waddles mice. That set of expression studies revealed several important biological
pathways disrupted in that mutant, including Ca2+ signaling and GABA receptor
regulation. Our results are consistent in terms of pathways reported as affected in another
microarray study of this mouse mutant (16). However, in addition, we also clarified
which molecular disturbances could be associated with previously observed
morphological aberrations in these mutants. Specifically, it was previously shown using
electron microscopy on brain slices of wild type and Car8wdl/wdl mice that highly
specialized cerebellar neurons, called Purkinje cells, show abnormal dendritic
arborization (17). This type of abnormal arborization was also previously observed in
primary hippocampal cultures overexpressing a subunit of ionotropic Glu receptor, Gria2
in GABA releasing neurons (18). We hypothesize that the upregulation of this gene in
Car8wdl/wdl mice cerebellum that we observed in our set of microarray experiment is one
factor that leads to the reported morphological abnormality.
While use of animal models proved to be invaluable in studying Mendelian
disorders, leading causes of disability in humans are not caused by rare fully penetrant
disorders, but by complex disorders. According to the World Health Organization,
depression is among the most common disabling conditions in the world (19). While

8
depression is very common and caused by a variety of environmental and genetic factors,
possibly interacting with each other (20, 21), the evidence for a genetic etiology for the
most severe form, bipolar disorder, has clearly been established (22). Recently, whole
genome genetic approaches aimed at identifying susceptibility loci of complex disorders
have been applied to study bipolar disorder, which I review next.
Association studies of complex disorders.
Genome wide association (GWA) studies have been successfully used to identify
susceptibility loci for complex disorders. As of April 2009, a catalog of published GWA
studies (https://www.genome.gov /26525384) contained 305 publications. Six of these
studies, published in the last 2 years, sought to identify susceptibility loci for bipolar
disorder (23-28). Bipolar disorder is a debilitating, life-long brain disorder with yet
unknown etiology. The six bipolar GWA studies used genetic material from Caucasian
individuals with bipolar disorder and their matched controls to compare allele frequencies
of different SNP variants between the two groups. In other words, these studies looked
for association between SNP variants and bipolar disorder, and identified several such
alleles at various thresholds of significance. These were used as a starting point for my
investigation outlined in Chapter IV.
GWA studies, by definition, identify SNP variants, not genes associated with the
disease. One of the immediate questions after identifying a SNP is then to identify genes
or gene product changes in affected individuals that may lead to the phenotype. These
genes can then become targets for further investigations. When a strongly associated SNP
affects the coding region of a gene, it is straightforward to analyze this prediction.
However, in the vast majority of GWA findings, that is not the case. The decision

9
becomes even more difficult when there are multiple genes near an associated SNP.
Close proximity of a SNP to a gene, and the fact that the SNP marks the locus important
to the phenotype, led to the hypothesis that SNPs of interest could affect transcription.
Several genome wide studies looked at exactly this scenario globally by studying both
SNPs and gene expression in lymphoblastoid cell lines (29, 30). Referred to as expression
quantitative trait loci (eQTL) GWA , these studies identified a number of cis-acting loci
in the human genome, which means that there was a significant association noted
between a SNP and the expression levels of a nearby gene.
Although important for identifying potential regulatory sites, eQTL studies are
not aimed at addressing any particular disease phenotype or disease-associated loci. The
hypothesis that disease-associated SNPs may affect gene expression in cis was recently
tested by Moffat et al. (31). The authors first carried out a genome wide association
analysis on ~1000 patients with childhood onset of asthma and ~1200 controls. They
identified multiple SNPs in 17q21 as being associated with the disease trait. Interestingly,
the top findings in that region involve several linkage disequilibrium blocks, which
means that there may have identified several independent susceptibility loci within that
chromosomal interval. The authors then followed up on this result by testing each of their
most strongly disease-associated SNPs in turn for association with expression in cis, and
found that one of them, rs7216389, is strongly associated with changes in expression of
the orosomucoid - like protein 3 (ORMDL3) gene. Thus, the top GWAS finding was
shown to be a cis-regulator of the ORMLD3 gene, which strengthens the probability that
this gene is the best candidate for any follow up investigations. Others also followed up
GWAS findings with additional analyses in order to identify the most likely susceptibility

10
genes among all identified loci. Torkamani et al (32) used pathways and network based
analysis to identify the most likely affected pathways in the seven different disorders that
were investigated by the Wellcome Trust Case Control Consortium (WTCCC) in GWA
studies. The analysis proposed by the authors involved first translating SNPs into genes,
and then using methods developed for gene expression analysis to identify affected
pathways. In a similar fashion, another study (33) offered an improvement on a popular
gene expression data enrichment analysis (GSEA ) (7, 34), and applied single-SNP-to-
gene mapping based on the proximity of a SNP to a transcript. While this set up may be a
reasonable approach in some cases, SNPs can act at a distance and may affect not just the
closest gene. For instance, in the Moffat et al. study (31), cited above, the cis-regulatory
relationship was between a gene (ORMDL3) and a SNP (rs7216389) in a first intron of
another gene in the neighborhood (GSDML).
In another example, Chen et al. (35), proposed to use expression data to identify
the most likely causative gene in the region of top GWAS SNPs by considering all
expression data publically available in the Gene Expression Omnibus (GEO) database
(36, 37). The basic premise of their study is that genes that tend to be differentially
expressed are more likely to be affected in common disorders. As suggested by the
authors, however, their method, called FitSNP, is best applied to cases when GWAS
identified SNPs lie in a gene-rich region. Such a decision is aided by a scoring system
applied to all processed transcripts with a suggestion to choose the gene with the highest
score. The authors demonstrated the effectiveness of their approach by considering
previously confirmed GWAS results.
In Chapter IV, we propose another method for evaluating GWAS findings for

11
functional significance. We considered all SNPs that were significantly associated with
bipolar disorder above a certain threshold in any of 6 bipolar disorder GWA studies. We
then searched for association of these SNPs with expression of genes in the chromosomal
regions identified by the GWA studies. While we did not find statistically significant
associations for any of the top GWAS SNPs with the expression of nearby genes in our
brain samples, we identified several other SNPs in nearby genes showing such
relationship. In addition, for one GWAS region on chromosome 3 we successfully used
expression data to filter out genes, and identified genes whose expression was
differentially affected by SNPs in the brain within that chromosomal region.
In summary, in this thesis we tested the effect of genetic variants on expression in
the most complex organ, the brain. In the first two chapters, we investigated an extreme
case of the effect of two mouse knock out mutations on other genes and successfully
identified clearly differentially expressed genes, and were able to suggest potential
pathways. In the last research chapter, we explored whether microarray expression
analysis in combination with GWA studies can also elucidate the much more complex
etiology of bipolar disorder. In that case, while we identified clear-cut effects of several
variants on gene expression, we were unable to make the link to the etiology of the
disorder. Our difficulties in this more complex scenario can have many potential causes
which we discuss, but they are not unexpected given that no gene has so far been
convincingly both genetically and functionally implicated in bipolar disorder.
The fields of genetics and bioinformatics are rapidly developing and are often
driven by improvements in technology. Thus, in the last chapter, I discuss how new
technology, in particular next generation sequencing, will affect the future of the type of

12
studies I described. While many technical challenges we faced in our investigations
described here will be overcome, others will remain.

13
References:
1 Schena, M., Shalon, D., Davis, R.W. and Brown, P.O. (1995) Quantitative monitoring of gene expression patterns with a complementary DNA microarray. Science, 270, 467-470.
2 Lockhart, D.J., Dong, H., Byrne, M.C., Follettie, M.T., Gallo, M.V., Chee, M.S., Mittmann, M., Wang, C., Kobayashi, M., Horton, H. et al. (1996) Expression monitoring by hybridization to high-density oligonucleotide arrays. Nat Biotechnol, 14, 1675-1680.
3 DeRisi, J., Penland, L., Brown, P.O., Bittner, M.L., Meltzer, P.S., Ray, M., Chen, Y., Su, Y.A. and Trent, J.M. (1996) Use of a cDNA microarray to analyse gene expression patterns in human cancer. Nat Genet, 14, 457-460.
4 Segal, E., Friedman, N., Kaminski, N., Regev, A. and Koller, D. (2005) From signatures to models: understanding cancer using microarrays. Nat Genet, 37 Suppl, S38-45.
5 Dennis, G., Jr., Sherman, B.T., Hosack, D.A., Yang, J., Gao, W., Lane, H.C. and Lempicki, R.A. (2003) DAVID: Database for Annotation, Visualization, and Integrated Discovery. Genome Biol, 4, P3.
6 Hosack, D.A., Dennis, G., Jr., Sherman, B.T., Lane, H.C. and Lempicki, R.A. (2003) Identifying biological themes within lists of genes with EASE. Genome Biol, 4, R70.
7 Subramanian, A., Tamayo, P., Mootha, V.K., Mukherjee, S., Ebert, B.L., Gillette, M.A., Paulovich, A., Pomeroy, S.L., Golub, T.R., Lander, E.S. et al. (2005) Gene set enrichment analysis: a knowledge-based approach for interpreting genome-wide expression profiles. Proc Natl Acad Sci U S A, 102, 15545-15550.
8 Ashburner, M., Ball, C.A., Blake, J.A., Botstein, D., Butler, H., Cherry, J.M., Davis, A.P., Dolinski, K., Dwight, S.S., Eppig, J.T. et al. (2000) Gene ontology: tool for the unification of biology. The Gene Ontology Consortium. Nat Genet, 25, 25-29.
9 Kanehisa, M., Araki, M., Goto, S., Hattori, M., Hirakawa, M., Itoh, M., Katayama, T., Kawashima, S., Okuda, S., Tokimatsu, T. et al. (2008) KEGG for linking genomes to life and the environment. Nucleic Acids Res, 36, D480-484.
10 Kennan, A., Aherne, A., Palfi, A., Humphries, M., McKee, A., Stitt, A., Simpson, D.A., Demtroder, K., Orntoft, T., Ayuso, C. et al. (2002) Identification of an IMPDH1 mutation in autosomal dominant retinitis pigmentosa (RP10) revealed following comparative microarray analysis of transcripts derived from retinas of wild-type and

14
Rho(-/-) mice. Hum Mol Genet, 11, 547-557.
11 Coppola, G., Choi, S.H., Santos, M.M., Miranda, C.J., Tentler, D., Wexler, E.M., Pandolfo, M. and Geschwind, D.H. (2006) Gene expression profiling in frataxin deficient mice: microarray evidence for significant expression changes without detectable neurodegeneration. Neurobiol Dis, 22, 302-311.
12 Puccio, H. and Koenig, M. (2002) Friedreich ataxia: a paradigm for mitochondrial diseases. Curr Opin Genet Dev, 12, 272-277.
13 Coppola, G., Marmolino, D., Lu, D., Wang, Q., Cnop, M., Rai, M., Acquaviva, F., Cocozza, S., Pandolfo, M. and Geschwind, D.H. (2009) Functional genomic analysis of frataxin deficiency reveals tissue-specific alterations and identifies the PPARgamma pathway as a therapeutic target in Friedreich's ataxia. Hum Mol Genet, 18, 2452-2461.
14 Buschdorf, J.P., Li Chew, L., Zhang, B., Cao, Q., Liang, F.Y., Liou, Y.C., Zhou, Y.T. and Low, B.C. (2006) Brain-specific BNIP-2-homology protein Caytaxin relocalises glutaminase to neurite terminals and reduces glutamate levels. J Cell Sci, 119, 3337-3350.
15 Bomar, J.M., Benke, P.J., Slattery, E.L., Puttagunta, R., Taylor, L.P., Seong, E., Nystuen, A., Chen, W., Albin, R.L., Patel, P.D. et al. (2003) Mutations in a novel gene encoding a CRAL-TRIO domain cause human Cayman ataxia and ataxia/dystonia in the jittery mouse. Nat Genet, 35, 264-269.
16 Yan, J., Jiao, Y., Jiao, F., Stuart, J., Donahue, L.R., Beamer, W.G., Li, X., Roe, B.A., LeDoux, M.S. and Gu, W. (2007) Effects of carbonic anhydrase VIII deficiency on cerebellar gene expression profiles in the wdl mouse. Neurosci Lett, 413, 196-201.
17 Hirasawa, M., Xu, X., Trask, R.B., Maddatu, T.P., Johnson, B.A., Naggert, J.K., Nishina, P.M. and Ikeda, A. (2007) Carbonic anhydrase related protein 8 mutation results in aberrant synaptic morphology and excitatory synaptic function in the cerebellum. Mol Cell Neurosci, 35, 161-170.
18 Passafaro, M., Nakagawa, T., Sala, C. and Sheng, M. (2003) Induction of dendritic spines by an extracellular domain of AMPA receptor subunit GluR2. Nature, 424, 677-681.
19 Mathers, C., Fat, D.M., Boerma, J.T. and World Health Organization. (2008) The global burden of disease : 2004 update. World Health Organization, Geneva, Switzerland.
20 Caspi, A., Sugden, K., Moffitt, T.E., Taylor, A., Craig, I.W., Harrington, H.,

15
McClay, J., Mill, J., Martin, J., Braithwaite, A. et al. (2003) Influence of life stress on depression: moderation by a polymorphism in the 5-HTT gene. Science, 301, 386-389.
21 Risch, N., Herrell, R., Lehner, T., Liang, K.Y., Eaves, L., Hoh, J., Griem, A., Kovacs, M., Ott, J. and Merikangas, K.R. (2009) Interaction between the serotonin transporter gene (5-HTTLPR), stressful life events, and risk of depression: a meta-analysis. JAMA, 301, 2462-2471.
22 Burmeister, M., McInnis, M.G. and Zollner, S. (2008) Psychiatric genetics: progress amid controversy. Nat Rev Genet, 9, 527-540.
23 Baum, A.E., Akula, N., Cabanero, M., Cardona, I., Corona, W., Klemens, B., Schulze, T.G., Cichon, S., Rietschel, M., Nothen, M.M. et al. (2008) A genome-wide association study implicates diacylglycerol kinase eta (DGKH) and several other genes in the etiology of bipolar disorder. Mol Psychiatry, 13, 197-207.
24 Baum, A.E., Hamshere, M., Green, E., Cichon, S., Rietschel, M., Noethen, M.M., Craddock, N. and McMahon, F.J. (2008) Meta-analysis of two genome-wide association studies of bipolar disorder reveals important points of agreement. Mol Psychiatry, 13, 466-467.
25 Ferreira, M.A., O'Donovan, M.C., Meng, Y.A., Jones, I.R., Ruderfer, D.M., Jones, L., Fan, J., Kirov, G., Perlis, R.H., Green, E.K. et al. (2008) Collaborative genome-wide association analysis supports a role for ANK3 and CACNA1C in bipolar disorder. Nat Genet, 40, 1056-1058.
26 Sklar, P., Smoller, J.W., Fan, J., Ferreira, M.A., Perlis, R.H., Chambert, K., Nimgaonkar, V.L., McQueen, M.B., Faraone, S.V., Kirby, A. et al. (2008) Whole-genome association study of bipolar disorder. Mol Psychiatry, 13, 558-569.
27 WTCC (2007) Genome-wide association study of 14,000 cases of seven common diseases and 3,000 shared controls. Nature, 447, 661-678.
28 Scott, L.J., Muglia, P., Kong, X.Q., Guan, W., Flickinger, M., Upmanyu, R., Tozzi, F., Li, J.Z., Burmeister, M., Absher, D. et al. (2009) Genome-wide association and meta-analysis of bipolar disorder in individuals of European ancestry. Proc Natl Acad Sci U S A, 106, 7501-7506.
29 Monks, S.A., Leonardson, A., Zhu, H., Cundiff, P., Pietrusiak, P., Edwards, S., Phillips, J.W., Sachs, A. and Schadt, E.E. (2004) Genetic inheritance of gene expression in human cell lines. Am J Hum Genet, 75, 1094-1105.
30 Morley, M., Molony, C.M., Weber, T.M., Devlin, J.L., Ewens, K.G., Spielman,

16
R.S. and Cheung, V.G. (2004) Genetic analysis of genome-wide variation in human gene expression. Nature, 430, 743-747.
31 Moffatt, M.F., Kabesch, M., Liang, L., Dixon, A.L., Strachan, D., Heath, S., Depner, M., von Berg, A., Bufe, A., Rietschel, E. et al. (2007) Genetic variants regulating ORMDL3 expression contribute to the risk of childhood asthma. Nature, 448, 470-473.
32 Torkamani, A., Topol, E.J. and Schork, N.J. (2008) Pathway analysis of seven common diseases assessed by genome-wide association. Genomics, 92, 265-272.
33 Holden, M., Deng, S., Wojnowski, L. and Kulle, B. (2008) GSEA-SNP: applying gene set enrichment analysis to SNP data from genome-wide association studies. Bioinformatics, 24, 2784-2785.
34 Mootha, V.K., Lindgren, C.M., Eriksson, K.F., Subramanian, A., Sihag, S., Lehar, J., Puigserver, P., Carlsson, E., Ridderstrale, M., Laurila, E. et al. (2003) PGC-1alpha-responsive genes involved in oxidative phosphorylation are coordinately downregulated in human diabetes. Nat Genet, 34, 267-273.
35 Chen, R., Morgan, A.A., Dudley, J., Deshpande, T., Li, L., Kodama, K., Chiang, A.P. and Butte, A.J. (2008) FitSNPs: highly differentially expressed genes are more likely to have variants associated with disease. Genome Biol, 9, R170.
36 Edgar, R., Domrachev, M. and Lash, A.E. (2002) Gene Expression Omnibus: NCBI gene expression and hybridization array data repository. Nucleic Acids Res, 30, 207-210.
37 Barrett, T., Troup, D.B., Wilhite, S.E., Ledoux, P., Rudnev, D., Evangelista, C., Kim, I.F., Soboleva, A., Tomashevsky, M. and Edgar, R. (2007) NCBI GEO: mining tens of millions of expression profiles--database and tools update. Nucleic Acids Res, 35, D760-765.

17
CHAPTER II
GLUTAMATE SIGNALLING IMPLICATED IN CAYMAN ATAXIA BY
MICROARRAY ANALYSIS OF ITS MOUSE MODEL
Introduction.
Cerebellar ataxias are a heterogeneous group of neurological disorders
characterized by incoordination and imbalance, psychomotor retardation, dysarthia and
ocular disturbances. Cerebellar ataxias can be acquired or inherited, with etiological
heterogeneity in both categories (1). Acquired ataxias can be due to cerebellar infarction
or other trauma, hemorrhage, acute intoxication, chronic toxic agents, immune disorders,
infections or neoplasm. These can sometimes be treated with medication or surgical
intervention. Hereditary ataxias, on the other hand, are often progressive and, with few
exceptions, cannot be effectively treated. Hereditary ataxia can be distinguished
genetically by mode of inheritance (dominant, recessive, X-linked or mitochondrial), and
functionally by etiology, both by the specific genes and/or pathways involved. There are
> 50 known ataxia genes, and even more mapped but not yet cloned forms of ataxia (1).
In addition to the genetic heterogeneity obvious from the mode of inheritance and
linkage heterogeneity, the identification of > 50 ataxia genes in the past 20 years also
revealed that several, quite different, biological pathways can be involved in ataxia. The
major, but not the only pathway involved in dominant ataxias (SCAs), often also called
olivopontecerebellar atrophies, is neurodegenerative, involving expansion of triplet CAG

18
(glutamate) repeats (1). In addition, there are also dominant episodic ataxias, which are
caused largely by mutations in potassium channels or their regulators or effectors.
Recessive ataxias are much more variable in terms of functional etiology (1).
Some common causes include mitochondrial malfunction, as in the FRATAXIN gene that
is implicated in Friedreich’s ataxia (2) or the mitochondrial polymerase gamma POLG,
implicated in the mitochondrial recessive ataxic syndrome (MIRAS) (3-5), DNA repair
defects, such as ataxia telangiectasia mutated (ATM) gene in the disorder after which it
has been named (6), and several different metabolic or intracellular transport defects,
such as ataxia with selective vitamin E deficiency (7). However, this is not an exclusive
list, and many known ataxia genes represent an apparently unique function. The work
presented in this chapter illustrates how the availability of an animal model and
identification of downstream effects of a mutation can help place an ataxia of unknown
functional origin into a known biological pathway involved in other ataxias, and thus
provide a classification tool as well as functional context.
Cayman ataxia is a nonprogressive autosomal recessive ataxia found in one
population isolate of Grand Cayman Island (8). Patients with this disorder have hypotonia
from birth, variable psychomotor retardation, wide-based ataxic gait, nystagmus and
dysarthia, but the disorder does not progress, and affected subjects have normal life
expectancy. Several years ago, other members of the Burmeister laboratory found that all
affected individuals are homozygous for two different point mutations in the ATCAY gene
on chromosome 19 (9). Which of these two variants is the causative mutation is still
unclear. Three different mutations in the homologous mouse gene, Atcay, lead to three
different mutant mouse alleles characterized by various degrees of ataxia (10). Hesitant
19
mice, Atcayhes/hes, which carry an IAP element insertion in intron 1, display mild ataxia
and dystonia, with normal fertility and life span (9). Jittery mice, Atcayji/ji, which carry a
B1 element insertion in exon 4, and sidewinder mice Atcayswd/swd, with a 2 bp deletion in
exon 5, have severe ataxia and dystonia and die of starvation and dehydration at 3-4
weeks of age (9). A different IAP insertion in the rat Atcay gene was found to be the
cause of dystonia in rats (11). This dystonia has been shown to be cerebellar in origin,
since removal of the cerebellum (cerebellectomy) cures these rats of the dystonia (12).
Although no fine grained analysis of specific cells has been done, histopathology shows
no apparent apoptosis, neurodegeneration or necrosis. In addition, all cerebellar and
cerebral layers are well formed, suggesting no gross neurodevelopmental deficits. This
suggests a specific functional rather than a structural or degenerative deficit in affected
mice and, by analogy, human subjects.
The mouse Atcay gene is expressed exclusively in neuronal tissue, which includes
all brain regions, spinal ganglion cells, as well as the enteric nervous system (9). Atcay
expression is strong and uniform throughout the brain at embryonic stage E19. In adult
mice (13) and rats (11) Atcay shows increased expression in cerebellum compared to the
rest of the brain. Within the cerebellum, there is little if any expression in Purkinje cells,
but strong expression in parallel as well as climbing fibers (13).
Caytaxin, also known as BNIP-H, the protein product of Atcay, binds Kidney
Type Glutaminase (KGA), as was shown by co-immune precipitation (14) and also
confirmed by affinity chromatography followed by mass spectroscopy by our
collaborators (K.Ito, M. Hortsch, unpublished data). KGA is a member of a group of
enzymes, called Glutaminases, which catalyze conversion of Glutamine (Gln) to

20
Glutamate (Glu). Except for this association, and a more recent finding that Caytaxin
binds peptidyl-prolyl isomerase Pin1 in differentiated neurons in an NGF-dependent
manner (15), little was known about the function of Caytaxin at the outset of this work.
One way to elucidate the function of a novel protein of unknown function is to
investigate the effect of its deficiency on other, better characterized proteins or genes. For
example, a series of microarray expression studies in a mouse model of Friedrich’s ataxia
successfully identified novel biological treatment targets (16). In order to elucidate the
Caytaxin pathway, we therefore evaluated the downstream effects of the Atcay mutation
on the expression of other genes using microarray analysis of mutants in comparison to
litter-matched control samples. Because there are no apparent structural or degenerative
deficits, we hypothesized that such microarray analysis will help elucidate the biological
pathways in which Caytaxin is involved, rather than secondary or tertiary effects due to
degeneration.
Materials and Methods.
Animals.
Heterozygous, Atcayswd/+, animals were mated to each other to obtain
homozygous Atcayswd/swd mutants and their age-, gender- and litter-matched controls.
Both heterozygous and homozygous wild type animals were used as controls because
they were phenotypically indistinguishable. All animals were genotyped (see below)
using genomic DNA obtained from tail tips biopsied at 14-16 days of age. Whole brain or
cerebella were extracted at weaning, i.e. P21, and flesh frozen in liquid nitrogen. The
University of Michigan Committee on Use and Care of Animals approved all mouse

21
experiments.
Genotyping and RNA isolation.
A pair of primers (forward primer 5’-CCAGTGTTGTCAGTCCATC-3’, reverse
primer 5’-ATCATAGGGGAGCAAGAGCATC- 3’) were used to amplify a 234 or 232
bp fragment containing AGdel using 39 cycles of PCR with 95 °C for 30 sec, 61 °C for 30
sec , 72 °C for 1 min 30 sec. PCR products were then digested at 37°C for 5 h with the
Msl1 restriction enzyme (New England Biolabs, City, State,), which resulted in three
fragments for wild type alleles (162bp, 56bp and 16bp) or two fragments for the mutant
allele (218 bp and 16 bp). Heterozygotes showed 3 different fragments. Fragments were
separated by 2% agarose gel electrophoresis in TAE or (your other buffer), and
visualized by Ethidium Bromide staining under fluorescence.
Total RNA was extracted from brain and cerebellum samples using the TRIzol®
Reagent (Invitrogen,) according to manufacturer’s instructions. RNA quantity was
measured using a NanoDrop ND-1000 spectrophotometer.
Gene expression hybridizations and data analysis.
RNA isolated from 6 whole brain and 10 cerebellum samples was processed and
hybridized to Affymetrix GeneChip® 430 2.0 arrays according to the manufacturer’s
suggestions (Affymetrix, Santa Clara, CA). To avoid batch effects, samples isolated from
mutant and their litter-matched controls were hybridized at the same time. In addition,
RNA from 10 cerebellum samples were also hybridized to Illumina mouse WG-6 chips
according to manufacturer’s instructions (Illumina, San Diego, CA). All 3 sets of

22
experiments were preprocessed and analyzed separately using the Bioconductor package
(2) in R (17).
Northern blot analysis has previously shown that the amount of Atcay mRNA in
the sidewinder mutant allele (Atcayswd/swd) is severely reduced (9). Therefore, the Atcay
gene itself could serve as our internal control when evaluating different methodologies to
analyze expression results. In Affymetrix chips, each probe set is composed of 22 probes,
11 matched and 11 mismatched probes. CDF files are used to identify which probe
represents which gene, i.e. defines membership of each probe in a probeset representing
specific gene. Often, a gene is represented by more than one probe set of 22 probes. We
first analyzed Affymetrix data using Affymetrix CDF files. We found three different
Affymetrix probesets for Atcay. These showed quite different fold-changes between
mutant and wild-type. Because of this inconsistency, and because Affymetrix CDF files
were defined before the mouse genome was well annotated, we decided to switch to
using RefSeq custom CDF files (18), which redefine each probeset membership based on
sequence mapping to Reference Sequence database. RefSeq CDF file 11 contains only
one probeset for Atcay, NM_178662_at, which, in agreement with expectations, was the
most differentially expressed probeset in the whole dataset with a fold-change of 0.199
(i.e. a > 5 fold reduction in level). The RefSeq 11 version of custom CDF can be
downloaded either at the Bioconductor (www.bioconductor.org) website or from the
developers’ website( http://brainarray.mbni.med. umich.edu/Brainarray/Database/
CustomCDF/ genomic_ curated_CDF.asp). Data were preprocessed using Robust
Multichip Average (RMA) from the Affy Bioconductor package (5,2). Illumina data were
preprocessed using quantile normalization implemented in the limma (19) R package.

23
After preprocessing, all datasets were analyzed as follows: paired t-test and q-values were
computed using Significance Analysis of Microarrays (SAM) software package (4); t-test
and nominal p-values associated with these tests were also computed using R (20). Probe,
in case of Illumina, and probeset, in case of Affymetrix, detection calls were evaluated as
follows: for Illumina, probes showing median detection p-values >20% across
experiments were considered absent; for Affymetrix experiments probesets that had 60%
Absent calls (as defined by Affymetrix MAS5 algorithm) were considered absent.
Quantitative Real-Time PCR.
Primer3 (21) was used to design primer pairs to amplify 10 genes. Primer
sequences are shown in Table_2.2. Eef2 and Eif3f were chosen as internal control genes,
as recommended by Kouadjo et al (22). We confirmed that these were not differentially
expressed in our microarray experiments and showed expression levels similar to those of
our genes of interest. All primers were designed to span exons to avoid amplification of
genomic DNA. 5 µg of total RNA was used to amplify a first stand of cDNA using
SuperScipttm II (Invitrogen, city, state) with oligo(dT)12-18 primers. The amounts of the
resulting cDNA were quantified using a NanoDrop ND-1000 spectrophotometer. 250 pg
of first-strand cDNA of each sample was used in triplicates in a SYBR-green assay (Bio-
Rad, City, State). Fluorescence was measured in a Bio-Rad iCycler (Bio-Rad, City, State)
using the FAM-490 detection protocol.
Results.
Genes differentially expressed in Caytaxin-deficient mice compared to controls

24
To elucidate the downstream effects of Caytaxin deficiency on the expression of
other genes and the pathways involved, we performed three sets of microarray
experiments using whole brain and cerebella from Atcayswd/swd mice and their litter-,
gender- and age- matched controls. We used RNA from 3 whole brain and 5 cerebellum
sample pairs for hybridization experiments using Affymetrix Whole Genome 430 2.0
chips and RNA from another 5 cerebellum pairs for hybridization experiments using
Illumina mouse WG-6 chips.
In the Affymetrix whole brain set of experiments, only 4 different genes (Atcay,
Amy1, Plscr1, Cyp3a11), passed a False Discovery Rate (FDR) threshold of 5% (an
FDR cutoff of 5% means that 5% of all genes identified as differentially expressed are
expected to be false positive). In order to be able to mine data successfully for pathways,
we looked at the data by considering a much higher cutoff (FDR ~20%) as well as
evaluated gene lists at nominal p-value cutoffs of 10%, 20% and 30% for each dataset.
In addition, results were further filtered based on present/absent calls for each gene as
well fold changes. Genes showing less than 25% change in signal between mutant and
control groups were discarded, i.e. in addition to the p value cut-offs, only genes with
fold change of >1.25 (up-regulated in mutants) or < 0.8 (downregulated in mutant) were
considered for further functional analysis.
Significant discrepancies between genes identified on different platforms
Combining all 3 experiments produced a list of over 900 genes that passed a fold
change threshold of >1.25 or < 0.8 in at least one of the three experiments. Interestingly,
comparing results from 2 sets of experiment on different platforms of cerebella, we found

25
that there was little if any agreement. Of 582 genes that passed the fold change threshold
in the Affymetrix cerebellum experiment, and 95 that passed this threshold in the
Illumina cerebellum experiment, only 5 were in common, namely Atcay, Col18a1 , Fos,
Gng13, Stk17b. This is perhaps not surprising because of the poor overall overlap
between the two platforms. Altogether, Affymetrix platform has 21865 probesets
annotated using RefSeq (23) identifiers, plus 64 Affymetrix quality controls. Illumina
platform on the other hand contains 46643 probes, with 35950 (77%) annotated with
RefSeq identifiers. Other probes were from sources such as Riken database (24) or
Mouse Exonic Evidence Based Oligonucleotide set (MEEBO). To estimate the overlap
between Illumina and Affymetrix datasets, we considered only those Illumina probes that
had associated RefSeq identifiers. Together Affymetrix and Illumina datasets had 16668
RefSeq identifiers in common, which makes up 76% of the Affymetrix dataset and 46%
of the Illumina RefSeq dataset. Of these ~16,000 genes 8,404 passed the detection in at
least one Affymetrix and the Illumina experiments. However, the majority of genes that
passed our fold change threshold in both of the Affymetrix experiments were either not
detected or not tested by Illumina platform (Table 2.1). In other words, many of the
potentially most interesting findings did not belong to the subset of genes estimated as
detected and differentially expressed by both platforms.
A case in point is a gene called carbonic anhydrase like protein VIII (Car8),
which was identified on the Affymetrix panel as differentially expressed with an FDR
level of 10% (fold change 0.81 and 0.78 and nominal p-value = 0.03 and 0.12 in whole
brain and cerebellum experiments, respectively). We confirmed and found statistical
differences in expression between the cerebellum of mutant and control mice by qRT-

26
PCR (p-value = 0.037). While both whole brain and cerebellum experiments using
Affymetrix GeneChip showed downregulation of Car8 in Atcayswd/swd mice, the probe for
this gene was labeled as undetected in all Illumina cerebellum microarrays (mutant and
wild type), although the absolute level showed a similar difference as the Affymetrix
arrays, suggesting that the calling of “undetected” may have been faulty. Given this
ambiguity, for pathway analysis we considered all results that passed our fold change
threshold in at least two experiments. These criteria resulted in a list of 80 genes that are
shown in Table 2.1.
Genes differentially expressed in Caytaxin-deficient mice are enriched in glutamate
signaling in Purkinje cells.
To determine whether some of the 80 differentially expressed genes have shared
functionalities or belong to the same biological pathway, we performed enrichment
analysis using two different software applications, DAVID/EASE (25) and Ingenuity
Pathways Analysis (Ingenuity® Systems, www.ingenuity.com). EASE showed nucleic
acid binding as the top enriched Gene Ontology (GO) (26) molecular function category,
while Ingenuity pointed to antigen binding as the most enriched. Given the neuronal
expression and what was known about Caytaxin functions, these annotations were
surprising, and not particularly informative. We also realized that many genes that we
found differentially expressed in our mouse model do not have extensive functional
annotation. Table 2.1 illustrates that many genes have only vague GO category
annotation, such as protein or RNA binding. The list of 80 differentially expressed genes
was created using FDR and fold change cutoffs. While guarding against false positives,

27
this strategy may result in many false negatives. To ensure that we are not missing out on
potentially important findings, we expanded the list of findings to consider for annotation
by including all genes with nominal p-value cutoffs of 20% and even 30% (FDR >20%)
while keeping the same fold change requirements. However, testing these expanded lists
did not provide any additional insight into biological pathways.
A manual review of the list of 80 differentially expressed genes and searching
their function in the literature pointed to the fact that several (including Gng13, Fabp7,
Slc1a6, Trpc3, Gsbs and Car8) were previously identified as markers for a cerebellum-
specific cell type called Purkinje cells. Rong et al. (27) identified a list of 33 candidate
Purkinje cell markers by comparing genes that are downregulated in cerebella of pcd3j,
mice in which the majority of Purkinje cells have degenerated. We used GSEA (28, 29)
to determine whether the observed overlap between our list and that identified by Rong et
al. was statistically significant. While formally only borderline significant, we found that
there is only 6% chance (i.e. FDR q-value = 0.06) that the observed overlap could happen
by chance.
Another recent publication, by Xiao et al., described results from microarray
experiments done on cerebella of dystonic (dt) rat, which also carry a mutation in the
Atcay gene, compared to control rats (30). Since the mutation is in the same gene and
both mutant rats and mice show cerebellar dysfunction, we hypothesized and in fact
expected that many of the genes affected downstream of Atcay mutations would be the
same, despite differences in phenotype and genetic background. Xiao et al. used
Affymetrix Rat 230A GeneChip® technology. To ensure that any discrepancies in results
were not due to differences in preprocessing and statistical analysis, I obtained their raw

28
data and re-analyzed them using custom RefSeq CDF files followed by paired t-test in the
same fashion in which we analyzed our own mouse datasets.
We found first that overall, our re-analysis of the dt rat data confirms the major
findings described by Xiao et al., showing no major discrepances due to analytical
differences. We identified 113 differentially expressed genes in the rat experiments with
FDR of <20%. However, with one exception, Stk17b, these genes did not overlap with
genes that we found differentially expressed in our mouse experiments at the same
significance threshold. A major conclusion of Xiao et al was that Caytaxin may be
involved in phosphatidylinositol signaling pathways. This claim was corroborated by
qRT-PCR confirmation for one of the genes implicated by microarrays. While we did not
find those genes differentially expressed in our mouse microarrays analysis, we tested
two genes , Inpp1 and Inpp5a, by qRT-PCR and confirmed they were not differentially
expressed in swd mice. Altogether, except for Stk17b and Slc1a6 genes, which were
modestly differentially expressed in both the mouse and the rat experiments, we
surprisingly did not find any overlap between these two experiments.
Discussion.
No large scale expression changes in Atcayswd/swd mice.
Despite the severity of the phenotype, we found very few genes differentially
expressed in Atcayswd/swd compared to controls. These results are exemplified in a plot of
paired t-test results from a set of cerebellum Illumina experiments (Figure 2.1), showing
also that the majority of the differentially expressed genes were down-regulated in

29
mutants compared to control. These results confirm our initial hypothesis that since there
are no neurodegenerative or structural changes in the mutants, expression of only a small
number of genes is affected by the mutation. This is in contrast to the waddles
(Car8wdl/wdl) mice (details in the next chapter of this thesis), in which many more genes
were found differentially expressed, and most changes were upregulation of genes. This
is astonishing in view of the fact that Car8wdl/wd have a much milder phenotype than
Atcayswd/swd mutants, and these mice also have no large structural or degenerative
changes. It seems that the number of downstream expression changes found in such
experiments is not predictable from the severity of the phenotype.
Gene expression changes cannot be explained by Purkinje cell death.
Many of the genes identified as differentially expressed in our study are enriched
or exclusively expressed in Purkinje cells, a cell type often degenerated in human ataxia
and in mouse ataxia models (1). Thus, we wondered whether the observed changes were
simply due to degeneration of this cell type, which would secondarily lead to lowered
apparent expression of genes expressed predominantly in that cell type. However, we do
not observe overt Purkinje cell degeneration in our mutants. Gross morphology of the
adult mouse brain was shown to be normal (9). Moreover, and more importantly, we
looked at microarray expression level changes of several established Purkinje cell
specific markers, such as Calbindin , Itpr1 and Aldolase C, and found that these were not
differentially expressed in our set of experiments. These genes were previously shown to
be downregulated in pcd3J mice, which are a model of Purkinje cell degeneration (27).
Thus, although many of the differentially expressed genes are expressed in Purkinje cells,

30
their downregulation is not simply due to absence or degeneration of this cell type, since
the most established marker genes for this cell types were found unchanged in expression
levels.
Reduced expression of genes involved in Glu signaling and other mouse mutants.
Buschdorf et al (14) and our collaborators (K.Ito, M. Hortsch, unpublished
results) found that Caytaxin, the protein product of the Atcay locus, binds kidney-type
glutaminase (KGA). Glutaminase is an enzyme that hydrolyses deamidation of glutamine
(Gln) to glutamate (Glu) and ammonia (31). KGA, one of three known glutaminases, is
expressed in kidney, brain, small intestine, lymphocytes and fetal liver (32) and is
localized to mitochondria (33). These previous findings together with our microarray
analysis lead us to hypothesize that Caytaxin disrupts normal Glu production in neurons
and consequently Glu signaling. If Caytaxin is involved in transport of glutaminase to the
synaptic termini, we would predict a depletion of Glu in the synaptic cleft. This could in
turn result in compensatory downregulation of genes, whose products participate in Glu
signal propagation from parallel fibers onto Purkinje cells. This proposed mechanism
would explain many of our findings: For example, one downregulated gene is Slc1a6,
which encodes EAAT4, one of the glutamate transporters, highly enriched in Purkinje
cells (34), responsible for clearing of Glu from the synaptic cleft to prevent
neurotransmitter spillover to neighboring synapse (35). Another differentially expressed
gene is Car8, carbonic anhydrase like protein VIII, known to be highly expressed in the
cerebellum and to play a role in IP3-regulated Ca2+ signaling in Purkinje cells (36, 37).
Car8 has been shown to inhibit the binding of IP3 to the Itpr1 receptor, thus preventing

31
Ca2+ release from endoplasmic reticulum (37). Other downregulated genes include
Gng13, encoding the G-protein subunit 13, implicated in modulating IP3 responses in
taste receptor (38), and Cep290, the product of which has been shown to modulate Gng13
trafficking in olfactory neurons (39). While the cerebellar function of Cep290 or Gng13
has not yet been investigated, Gng13 was named as one of 33 potential Purkinje cell
markers due to its significant downregulation in mice with Purkinje cell degeneration
(27).
Mutations in several of these and other genes downstream of Glu signaling from
parallel fibers to Purkinje cells are also associated with ataxic phenotypes, such as Car8
(40), Itpr1(41-43), Gnaq (44) and Grm1(45, 46), Plcb4 (47) as is illustrated in Figure-
_2.2. In summary, as illustrated in this figure, our results place Caytaxin in the Glu
signaling pathway from parallel fibers to Purkinje cells, disruption of which was already
known to lead to ataxia in both humans and mice. However, in contrast to most known
ataxias in this pathway, which are in genes encoding Purkinje cell –expressed genes,
Caytaxin is postulated to act largely presynaptically. Conditional knockouts in parallel
fibers but not Purkinje cells could further prove our hypothesis of a largely presynaptic
deficit.
Differentially expressed genes largely do not overlap between ataxic mice and
dystonic rat mutants of the Atcay gene.
Xiao et al (30), investigated the downstream effects of another Caytaxin mutation,
in the dystonic rat, also by microarray analysis. They found several inositol phosphate
phosphatases downregulated in the dystonic rat, and concluded that phosphatidylinositol

32
signaling pathways are disrupted. We did not find the same genes differentially expressed
in ataxic mice in either microarray analysis or by qRT-PCR (Table 2.3). However, other
genes affected in sidewinder experiments, including Gng13 and Car8, point to
phosphatidylinositol signaling as being affected. Given the experience with Car8, which
was clearly differentially expressed but was not detectable on the Illumina platform, it is
possible that some of the discrepancies between our results and those of Xiao et al. in the
rat is due to the design of the chips for the two species, even when we compare the same
tissue (cerebellum) and chips from the same company (Affymetrix). Since both sets of
experiments used only a handful of samples, it is also possible that due to low power to
detect all differentially expressed genes, some truly differentially expressed genes may
simply have been missed in our experiments (i.e. false negatives). However, at least in a
few cases, we performed quantitative real time PCR, which confirmed that some of the
observed differences are indeed biological – some of the differentially expressed rat
genes are clearly not differentially expressed in mice, although the mutations in mice is
more severe (null), and the mice are much more severely affected than the rats. These
may shed light on the fact that similar mutations can lead to two quite different
phenotypes, ataxia and a dystonia. This is an interesting area of future research to follow
up on. Future research may for example compare the milder mouse allele, hesitant,
which, depending on background, shows either more ataxia or more dystonia (10). Future
microarray experiments may elucidate these phenotypic differences.
In summary, we find very few genes differentially expressed in Atcayswd/swd
mutants compared to controls. Despite the fact that the Atcay gene product is expressed in

33
glutamatergic neurons innervating Purkinje cells, the majority of the changes are
observed in Purkinje cells themselves. However, we do not observe any PC degeneration,
which was previously proposed to result from absence of Caytaxin(14). We also find that
the downstream consequences of Caytaxin deficiency affect the same PC Glu signaling
pathway that is already known to be involved in several other mutants with ataxia. We
thus could establish a link between Cayman Ataxia, an ataxia of functionally unknown
cause, to several other, more well known forms of ataxia.

FcewwQaxarbAfr
Figure 2.1. erebellum.
was hybridizwere analyzeQ-Q plot of axis the expere the bounoundary ind
Atcayswd/swd mrom chance e
DifferentialRNA from ed to Illumid by the SAa two-class pected values ndaries that dicate signi
mutants compexpectation
lly expressemutant and ina whole gM (significapaired t-testof the test sdefines FD
ificant downpared to conare downreg
34
ed genes inlitter- and g
genome micrant analysis i. The Y-axisstatistic. TheDR cutoff, nregulated (ntrols. The mgulated.
n Atcay mugender-matcroarray chipif microarrays shows obse two lines pwhich is 2(green) or majority of g
utant compched control ps. After preys) package
served statistparallel to th1.29%. Valupregulatedgenes deviat
pared to comouse cere
eprocessing,in R. Shown
tic scores, thhe main diaglues outsided (red) geneting signific
ntrol ebella data n is a he X-gonal
e that es in cantly

35
Figure 2.2. Mouse models of ataxia. Several mouse models of ataxia affect Glu signaling onto Purkinje Cells as well as downstream signal propagation. GLS – glutaminase; Gln – glutamine; Glu – glutamate; GRIA2 – glutamate receptor, ionotropic, AMPA2; EAAT4- solute carrier family 1 (high affinity aspartate/glutamate transporter) member6; GRM1 – glutamate receptor, metabotropic,1; GNAQ – guanine nucleotide-binding protein, q polypeptide; Gγ13 – guanine nucleotide-binding protein , gamma13; PLC – phospholipase C, beta – 4; CAR8 – carbonic anhydrase related protein VIII; IP3R1 – inositol 1,4,5-tryphosphate receptor, type 1. Protein names are in square boxes; gray boxes indicate downregulation in Atcayswd/swd
Callouts indicate that either mouse and/or human mutations in that gene is associated with ataxia: 1 – Atcayji/ji, Atcayswd/swd, Atcayhes/hes; Cayman ataxia. 2 – Grm1tm1Stl/tm1Stl; Paraneoplastic cerebellar ataxia(48) 3 – Car8wdl/wdl; Ataxia with mild mental retardation with predisposition to quadrupedal gait(49) 4 – Itpr1m1Asp/m1Asp, Itpr1tm1Tno/tm1Tno, Itpr1opt/opt; SCA15 (42) 5 – Plcb4tm1Hssh/tm1Hssh
5 – Gnaqtm1Sofft/tm1Sofft
1
5
6
2
34
36
Gene ID Symbol Affy WB
Affy CB
Illumina CB Definition
NM_178662 Atcay 0.199 0.332 0.413 Mus musculus ataxia, cerebellar, Cayman type homolog (human) (Atcay), mRNA GO:0003674 : molecular function unknown
NM_029971 Pmch 0.598 0.453 ND* Mus musculus pro-melanin-concentrating hormone (Pmch), mRNA GO:0030354: melanin-concentrating hormone activity
NR_003633 Meg3 0.539 0.714 ND Mus musculus maternally expressed 3 (Meg3) on chromosome 12
NM_001042634 Clk1 0.570 0.715 ND Mus musculus CDC-like kinase 1 (Clk1), transcript variant 1, mRNA GO:0004713: protein tyrosine kinase activity
NM_016806 Hnrnpa2b1 0.509 0.784 ND Mus musculus heterogeneous nuclear ribonucleoprotein A2/B1 (Hnrnpa2b1), transcript variant 1, mRNA GO:0005515: protein binding
NR_002847 Malat1 0.680 0.650 NT Mus musculus metastasis associated lung adenocarcinoma transcript 1 (non-coding RNA) (Malat1) on chromosome 19
NM_001038696 Rnpc3 0.559 0.773 NT Mus musculus RNA-binding region (RNP1, RRM) containing 3 (Rnpc3), transcript variant 1, mRNA GO:0003674: molecular function unknown
NM_177096 B430203M17Rik 0.693 0.639 ND Mus musculus RIKEN cDNA B430203M17 gene (B430203M17Rik), mRNA
NM_146009 Cep290 0.713 0.632 NT Mus musculus centrosomal protein 290 (Cep290), mRNA GO:0005515 : protein binding
XM_001475747 LOC100046735 0.669 0.679 NT PREDICTED: Mus musculus similar to Serine/arginine repetitive matrix protein 2 (LOC100046735), mRNA
XR_030599 LOC100044394 0.669 0.697 NT PREDICTED: Mus musculus similar to CDNA sequence BC049807 (LOC100044394), misc RNA

37
Gene ID Symbol Affy WB
Affy CB
Illumina CB Definition
NM_153552 Thoc1 0.636 0.778 ND Mus musculus THO complex 1 (Thoc1), mRNA GO:0003674 : molecular function unknown
NM_022422 Gng13 0.725 0.679 0.733 Mus musculus guanine nucleotide binding protein (G protein), gamma 13 (Gng13), mRNA GO:0003924 : GTPase activity
NM_026368 5830433M19Rik 0.690 0.741 ND Mus musculus RIKEN cDNA 5830433M19 gene (5830433M19Rik), mRNA
XM_354987 BC043476 0.732 0.709 NT PREDICTED: Mus musculus cDNA sequence BC043476, transcript variant 1 (BC043476), mRNA
NM_133810 Stk17b 0.800 0.670 0.721
Mus musculus serine/threonine kinase 17b (apoptosis-inducing) (Stk17b), mRNA GO:0005524 : ATP binding GO:0004674 : protein serine/threonine kinase activity
NM_012008 Ddx3y 0.796 0.668 ND Mus musculus DEAD (Asp-Glu-Ala-Asp) box polypeptide 3, Y-linked (Ddx3y), mRNA GO:0003723: RNA binding
NM_001113383 Gls 0.742 0.722 ND Mus musculus glutaminase (Gls), nuclear gene encoding mitochondrial protein, transcript variant 2, mRNA GO:0004359 : glutaminase activity
NM_001002008 BC049807 0.759 0.713 NT Mus musculus cDNA sequence BC049807 (BC049807), mRNA
NM_009555 Zfp40 0.723 0.757 ND Mus musculus zinc finger protein 40 (Zfp40), mRNA GO:0005515 : protein binding
NM_146224 Suhw4 0.789 0.693 ND Mus musculus suppressor of hairy wing homolog 4 (Drosophila) (Suhw4), mRNA

38
Gene ID Symbol Affy WB
Affy CB
Illumina CB Definition
XM_358888 1810007M14Rik 0.688 0.795 ND PREDICTED: Mus musculus RIKEN cDNA 1810007M14 gene, transcript variant 1 (1810007M14Rik), mRNA
NM_009929 Col18a1 0.830 0.764 0.634 Mus musculus collagen, type XVIII, alpha 1 GO:0003674 : molecular_function unknown
NM_017381 Zranb2 0.710 0.778 NT Mus musculus zinc finger, RAN-binding domain containing 2 (Zranb2), mRNA GO:0005515 : protein binding
NM_028915 Lrrcc1 0.766 0.730 ND Mus musculus leucine rich repeat and coiled-coil domain containing 1 (Lrrcc1), mRNA
NM_198102 Tra2a 0.697 0.804 ND Mus musculus transformer 2 alpha homolog (Drosophila) (Tra2a), mRNA GO:0003723 : RNA binding
NR_002896 Snhg1 0.723 0.783 NT Mus musculus small nucleolar RNA host gene (non-protein coding) 1 (Snhg1) on chromosome 19
NM_175472 Zcchc11 0.743 0.765 ND Mus musculus zinc finger, CCHC domain containing 11 (Zcchc11), mRNA GO:0005515 : protein binding
NM_001008501 Zfp760 0.738 0.777 NT Mus musculus zinc finger protein 760 (Zfp760), mRNA
NM_001033422 Thoc2 0.807 0.712 NT Mus musculus THO complex 2 (Thoc2), mRNA GO:0005515 : protein binding
NM_021272 Fabp7 0.752 0.781 ND Mus musculus fatty acid binding protein 7, brain (Fabp7), mRNA GO:0005504 : fatty acid binding
NM_001013379 D10627 0.773 0.765 ND Mus musculus cDNA sequence D10627 (D10627), mRNA
NM_001114879 D14Abb1e 0.771 0.768 ND Mus musculus DNA segment, Chr 14, Abbott 1 expressed (D14Abb1e), transcript variant 1, mRNA

39
Gene ID Symbol Affy WB
Affy CB
Illumina CB Definition
NM_172637 Hectd2 0.734 0.807 ND Mus musculus HECT domain containing 2 (Hectd2), mRNA GO:0016881: acid-amino acid ligase activity
NM_001081371 Dmxl1 0.734 0.808 NT Mus musculus Dmx-like 1 (Dmxl1), mRNA
NM_018759 Zfp326 0.780 0.771 ND Mus musculus zinc finger protein 326 (Zfp326), mRNA GO:0003677: DNA binding
NM_027421 Ints2 0.749 0.803 ND Mus musculus integrator complex subunit 2 (Ints2), mRNA GO:0005515 : protein binding
NM_177806 Prpf39 0.612 0.676 1.045 Mus musculus PRP39 pre-mRNA processing factor 39 homolog (yeast) (Prpf39), mRNA
NM_007700 Chuk 0.576 0.751 1.010
Mus musculus conserved helix-loop-helix ubiquitous kinase (Chuk), mRNA GO:0004702 : receptor signaling protein serine/threonine kinase activity
NM_027349 Rbm25 0.797 0.762 ND Mus musculus RNA binding motif protein 25 (Rbm25), mRNA GO:0003729 : mRNA binding
NM_007592 Car8 0.805 0.754 ND Mus musculus carbonic anhydrase 8 (Car8), mRNA GO:0005515 : protein binding
NM_013902 Fkbp3 0.797 0.766 ND Mus musculus FK506 binding protein 3 (Fkbp3), mRNA
NM_029570 Atp11b 0.759 0.807 ND Mus musculus ATPase, class VI, type 11B (Atp11b), mRNA
NM_025736 Ttc35 0.792 0.775 ND Mus musculus tetratricopeptide repeat domain 35 (Ttc35), mRNA
NM_026313 3300001P08Rik 0.633 0.778 0.945 Mus musculus RIKEN cDNA 3300001P08 gene (3300001P08Rik), mRNA
NM_001110017 Dzip3 0.804 0.767 NT Mus musculus DAZ interacting protein 3, zinc finger (Dzip3),

40
Gene ID Symbol Affy WB
Affy CB
Illumina CB Definition
transcript variant 1, mRNA
XM_001480596 2310002J21Rik 0.790 0.718 0.858 PREDICTED: Mus musculus RIKEN cDNA 2310002J21 gene (2310002J21Rik), mRNA
NM_057172 Fubp1 0.641 0.798 0.938 Mus musculus far upstream element (FUSE) binding protein 1 (Fubp1), mRNA GO:0003700 : transcription factor activity
XM_001473032 LOC676792 0.800 0.792 NT PREDICTED: Mus musculus similar to Carbonic anhydrase 8 (LOC676792), mRNA
NM_026647 Zdhhc21 0.798 0.564 1.038 Mus musculus zinc finger, DHHC domain containing 21 (Zdhhc21), mRNA
NM_009071 Rock1 0.798 0.720 0.887 Mus musculus Rho-associated coiled-coil containing protein kinase 1 (Rock1), mRNA GO:0005515 : protein binding
NM_009200 Slc1a6 0.760 0.784 0.863 Mus musculus solute carrier family 1 (high affinity aspartate/glutamate transporter), member 6 (Slc1a6), mRNA GO:0005313 : L-glutamate transmembrane transporter activity
NM_175229 Srrm2 0.688 0.692 1.066 Mus musculus serine/arginine repetitive matrix 2 (Srrm2), mRNA GO:0005515 : protein binding
NM_026043 Rnpc3 0.630 0.796 1.026 Mus musculus RNA-binding region (RNP1, RRM) containing 3 (Rnpc3), transcript variant 2, mRNA GO:0003674 : molecular_function unknown
NM_001098723 Yy2 0.807 0.833 NT Mus musculus Yy2 transcription factor (Yy2), mRNA GO:0003674 : molecular function unknown
NM_001033375 A230046K03Rik 0.780 0.746 0.939 Mus musculus RIKEN cDNA A230046K03 gene (A230046K03Rik), mRNA

41
Gene ID Symbol Affy WB
Affy CB
Illumina CB Definition
NM_001039195 Gria2 0.705 0.750 1.027 Mus musculus glutamate receptor, ionotropic, AMPA2 (alpha 2) (Gria2), transcript variant 1, mRNA GO:0005515 : protein binding
NM_172591 Fcho2 0.753 0.800 0.950 Mus musculus FCH domain only 2 (Fcho2), mRNA GO:0003674 : molecular_function unknown
NM_001040400 Tet2 0.798 0.871 NT Mus musculus tet oncogene family member 2 (Tet2), mRNA GO:0003674 : molecular function unknown
NM_027619 Ttc14 0.657 0.791 1.064 Mus musculus tetratricopeptide repeat domain 14 (Ttc14), transcript variant 1, mRNA
NM_025978 Ttc14 0.645 0.805 1.064 Mus musculus tetratricopeptide repeat domain 14 (Ttc14), transcript variant 2, mRNA
NM_001079824 Hnrph3 0.809 0.867 NT Mus musculus heterogeneous nuclear ribonucleoprotein H3 (Hnrph3), mRNA GO:0005515: protein binding
NM_001081252 Ugcgl2 0.805 0.876 NT
Mus musculus UDP-glucose ceramide glucosyltransferase-like 2 (Ugcgl2), mRNA GO:0003980: UDP-glucose:glycoprotein glucosyltransferase activity
NM_011692 Vbp1 0.773 0.794 0.961 Mus musculus von Hippel-Lindau binding protein 1 (Vbp1), mRNA GO:0003674 : molecular function unknown
NM_001081308 Taok3 0.771 0.929 NT Mus musculus TAO kinase 3 (Taok3), mRNA GO:0005524 : ATP binding
NM_016710 Nsbp1 0.692 0.753 1.106 Mus musculus nucleosome binding protein 1 (Nsbp1), mRNA GO:0003682 : chromatin binding

42
Gene ID Symbol Affy WB
Affy CB
Illumina CB Definition
NM_138590 Zcchc7 0.714 0.770 1.068 Mus musculus zinc finger, CCHC domain containing 7 (Zcchc7), transcript variant 1, mRNA
NM_134063 BC016423 0.796 0.729 1.046 Mus musculus cDNA sequence BC016423 (BC016423), mRNA
NM_198005 4833418A01Rik 0.698 0.778 1.098 Mus musculus RIKEN cDNA 4833418A01 gene (4833418A01Rik), mRNA
XM_001479818 LOC100047988 0.798 0.920 NT PREDICTED: Mus musculus hypothetical protein LOC100047988 (LOC100047988), mRNA
NM_026143 Mlstd2 0.799 0.702 1.077 Mus musculus male sterility domain containing 2 (Mlstd2), transcript variant 1, mRNA GO:0050062 : long-chain-fatty-acyl-CoA reductase activity
NM_001081166 Phf21b 0.767 0.958 NT Mus musculus PHD finger protein 21B (Phf21b), mRNA GO:0003674 : molecular function unknown
NM_021510 Hnrph1 0.706 0.800 1.104 Mus musculus heterogeneous nuclear ribonucleoprotein H1 (Hnrph1), mRNA GO:0005515 : protein binding
NM_001039478 4933421E11Rik 0.772 0.769 1.098 Mus musculus RIKEN cDNA 4933421E11 gene (4933421E11Rik), transcript variant 3, mRNA
NM_178691 Yod1 0.739 0.789 1.120 Mus musculus YOD1 OTU deubiquitinating enzyme 1 homologue (S. cerevisiae) (Yod1), mRNA GO:0016289 : CoA hydrolase activity
NM_001078167 Sfrs1 0.771 0.802 1.083
Mus musculus splicing factor, arginine/serine-rich 1 (ASF/SF2) (Sfrs1), transcript variant 2, mRNA GO:0050733 : RS domain binding GO:0005515 : protein binding

43
Gene ID Symbol Affy WB
Affy CB
Illumina CB Definition
NM_013827 Mtf2 0.807 0.805 1.066 Mus musculus metal response element binding transcription factor 2 (Mtf2), mRNA
NM_019402 Pabpn1 0.755 0.809 1.118 Mus musculus poly(A) binding protein, nuclear 1 (Pabpn1), mRNA GO:0008143 : poly(A) RNA binding
XM_001474535 LOC100045566 0.808 1.085 NT PREDICTED: Mus musculus hypothetical protein LOC100045566 (LOC100045566), mRNA
NM_133362 Erdr1 0.926 1.385 1.624 Mus musculus erythroid differentiation regulator 1 (Erdr1), mRNA. GO:0003674 : molecular function unknown
Table 2.1. Genes consistently differentially expressed in whole brain and cerebellum experiments. *ND- not detected; NT-not tested.

44
Gene Symbol
Entrez gene id Forward primer sequence ( 5’- 3’) Reverse primer sequence ( 5’- 3’)
Car8 12319 AAAACCAGCGTGGTTCTGAG GTCACAGCCTTCAAGCCAAC
Gng13 64337 ATGTGCCCCAGATGAAGAAG TCATAGGATGGTGCACTTGG
Eef2 13629 CATCTACGGTGTCCTGAAC GATCTGCCAGTGGTCAAAC
Slc1a6 20513 GGTTACCATGGTGATTGTGC AGAGTCAGCTCAGCCTCCTG
Cacna1g 12291 AGCTTCCCAAAGATGCACAC GCCCACTCACCTCTGACAAC
Inpp1 16329 ATCCCTCACGAGAGTCTTGG ACGCAAAAGGCTGATTGATG
Inpp5a 212111 AGAGAGCGAGGAGAAGGTTG GTCTAGCAGGTGAGGCTTGG
Eif3f 66085 TTGAGACCATGCTCAACAGC AAGAAACCCTTTGCCTCCAC
Stk17b 98267 GCCACAGACTTCATCCAGAG CCATTACAGGAGGACTTGGAG
Car4 12351 AAGCACTGCCCAGTATCTCC TTGTGGATCTTGATGGGTTG Table 2.2. qRT-PCR primer pairs.

45
Gene Symbol
Accession number Gene Description t-score p-value
Car8 NM_007592 Carbonic anhydrase like protein 5.42 0.037
Gng13 NM_022422 Guanine nucleotide binding protein (G protein), gamma 13 3.9 0.03
Stk17b NM_133810 Serine/threonine kinase 17b 13 0.0009
Cacna1g NM_001112813 Calcium channel, voltage-dependent, T type, alpha 1G subunit 3.5 0.07
Inpp1 NM_008384 Inositol polyphosphate-1-phosphatase 1.15 0.37
Inpp5a NM_183144 Inositol polyphosphate-5-phosphatase A 1.99 0.18
Car4 NM_007607 Carbonic anhydrase 4 0.62 0.57
Slc1a6 NM_009200 Solute carrier family 1 (high affinity aspartate/glutamate transporter), member 6 (Slc1a6) 1.8 0.15
Table 2.3. Results of qRT-PCR.

46
References.
1 Manto, M. and Marmolino, D. (2009) Cerebellar ataxias. Curr Opin Neurol.
2 Campuzano, V., Montermini, L., Molto, M.D., Pianese, L., Cossee, M., Cavalcanti, F., Monros, E., Rodius, F., Duclos, F., Monticelli, A. et al. (1996) Friedreich's ataxia: autosomal recessive disease caused by an intronic GAA triplet repeat expansion. Science, 271, 1423-1427.
3 Van Goethem, G., Luoma, P., Rantamaki, M., Al Memar, A., Kaakkola, S., Hackman, P., Krahe, R., Lofgren, A., Martin, J.J., De Jonghe, P. et al. (2004) POLG mutations in neurodegenerative disorders with ataxia but no muscle involvement. Neurology, 63, 1251-1257.
4 Winterthun, S., Ferrari, G., He, L., Taylor, R.W., Zeviani, M., Turnbull, D.M., Engelsen, B.A., Moen, G. and Bindoff, L.A. (2005) Autosomal recessive mitochondrial ataxic syndrome due to mitochondrial polymerase gamma mutations. Neurology, 64, 1204-1208.
5 Tzoulis, C., Engelsen, B.A., Telstad, W., Aasly, J., Zeviani, M., Winterthun, S., Ferrari, G., Aarseth, J.H. and Bindoff, L.A. (2006) The spectrum of clinical disease caused by the A467T and W748S POLG mutations: a study of 26 cases. Brain, 129, 1685-1692.
6 Sedgewick, R., and Boder, E. (1991) P. Vinken, G.B., and H. Klawans (ed.), In Handbook of Clinical Neurology. Elsevier Scientific Publishers, New York, pp. 347-423.
7 Harding, A.E., Matthews, S., Jones, S., Ellis, C.J., Booth, I.W. and Muller, D.P. (1985) Spinocerebellar degeneration associated with a selective defect of vitamin E absorption. N Engl J Med, 313, 32-35.
8 Nystuen, A., Benke, P.J., Merren, J., Stone, E.M. and Sheffield, V.C. (1996) A cerebellar ataxia locus identified by DNA pooling to search for linkage disequilibrium in an isolated population from the Cayman Islands. Hum Mol Genet, 5, 525-531.
9 Bomar, J.M., Benke, P.J., Slattery, E.L., Puttagunta, R., Taylor, L.P., Seong, E., Nystuen, A., Chen, W., Albin, R.L., Patel, P.D. et al. (2003) Mutations in a novel gene encoding a CRAL-TRIO domain cause human Cayman ataxia and ataxia/dystonia in the jittery mouse. Nat Genet, 35, 264-269.
10 Kapfhamer, D., Sweet, H.O., Sufalko, D., Warren, S., Johnson, K.R. and
47
Burmeister, M. (1996) The neurological mouse mutations jittery and hesitant are allelic and map to the region of mouse chromosome 10 homologous to 19p13.3. Genomics, 35, 533-538.
11 Xiao, J. and Ledoux, M.S. (2005) Caytaxin deficiency causes generalized dystonia in rats. Brain Res Mol Brain Res, 141, 181-192.
12 Ledoux, M.S., Lorden, J.F. and Ervin, J.M. (1993) Cerebellectomy Eliminates the Motor Syndrome of the Genetically Dystonic Rat. Experimental Neurology, 120, 302-310.
13 Hayakawa, Y., Itoh, M., Yamada, A., Mitsuda, T. and Nakagawa, T. (2007) Expression and localization of Cayman ataxia-related protein, Caytaxin, is regulated in a developmental- and spatial-dependent manner. Brain Res, 1129, 100-109.
14 Buschdorf, J.P., Li Chew, L., Zhang, B., Cao, Q., Liang, F.Y., Liou, Y.C., Zhou, Y.T. and Low, B.C. (2006) Brain-specific BNIP-2-homology protein Caytaxin relocalises glutaminase to neurite terminals and reduces glutamate levels. J Cell Sci, 119, 3337-3350.
15 Buschdorf, J.P., Chew, L.L., Soh, U.J., Liou, Y.C. and Low, B.C. (2008) Nerve growth factor stimulates interaction of Cayman ataxia protein BNIP-H/Caytaxin with peptidyl-prolyl isomerase Pin1 in differentiating neurons. PLoS ONE, 3, e2686.
16 Coppola, G., Marmolino, D., Lu, D., Wang, Q., Cnop, M., Rai, M., Acquaviva, F., Cocozza, S., Pandolfo, M. and Geschwind, D.H. (2009) Functional genomic analysis of frataxin deficiency reveals tissue-specific alterations and identifies the PPARgamma pathway as a therapeutic target in Friedreich's ataxia. Hum Mol Genet, 18, 2452-2461.
17 Team, R.D.C. (2009) Computing, R.F.f.S. (ed.), Vienna, Austria.
18 Dai, M., Wang, P., Boyd, A.D., Kostov, G., Athey, B., Jones, E.G., Bunney, W.E., Myers, R.M., Speed, T.P., Akil, H. et al. (2005) Evolving gene/transcript definitions significantly alter the interpretation of GeneChip data. Nucleic Acids Res, 33, e175.
19 Smyth, G.K. (2005) R. Gentleman, V.C., S. Dudoit, R. Irizarry, W. Huber (ed.), In Bioinformatics and Computational Biology Solutions using R and Bioconductor. Springer, New York.
20 Bates, D., Chambers, J., Dalgaard, P., Falcon, S., Gentelman, R., Hornik, K., Iacus, S., Ihaka, R., Leisch, F., Lumley, T., Maechler M., Murdoch, M., Murrell, P., Plummer, M., Ripley, B., Sarkar, D., Temple - Lang, D., Tierney, L., Urbanek , S. (2009)

48
Computing, R.F.f.S. (ed.), Vienna, Austria.
21 Rozen, S. and Skaletsky, H. (2000) Primer3 on the WWW for general users and for biologist programmers. Methods Mol Biol, 132, 365-386.
22 Kouadjo, K.E., Nishida, Y., Cadrin-Girard, J.F., Yoshioka, M. and St-Amand, J. (2007) Housekeeping and tissue-specific genes in mouse tissues. BMC Genomics, 8, 127.
23 Pruitt, K.D., Tatusova, T. and Maglott, D.R. (2007) NCBI reference sequences (RefSeq): a curated non-redundant sequence database of genomes, transcripts and proteins. Nucleic Acids Res, 35, D61-65.
24 Kawai, J., Shinagawa, A., Shibata, K., Yoshino, M., Itoh, M., Ishii, Y., Arakawa, T., Hara, A., Fukunishi, Y., Konno, H. et al. (2001) Functional annotation of a full-length mouse cDNA collection. Nature, 409, 685-690.
25 Dennis, G., Jr., Sherman, B.T., Hosack, D.A., Yang, J., Gao, W., Lane, H.C. and Lempicki, R.A. (2003) DAVID: Database for Annotation, Visualization, and Integrated Discovery. Genome Biol, 4, P3.
26 Ashburner, M., Ball, C.A., Blake, J.A., Botstein, D., Butler, H., Cherry, J.M., Davis, A.P., Dolinski, K., Dwight, S.S., Eppig, J.T. et al. (2000) Gene ontology: tool for the unification of biology. The Gene Ontology Consortium. Nat Genet, 25, 25-29.
27 Rong, Y., Wang, T. and Morgan, J.I. (2004) Identification of candidate Purkinje cell-specific markers by gene expression profiling in wild-type and pcd(3J) mice. Brain Res Mol Brain Res, 132, 128-145.
28 Mootha, V.K., Lindgren, C.M., Eriksson, K.F., Subramanian, A., Sihag, S., Lehar, J., Puigserver, P., Carlsson, E., Ridderstrale, M., Laurila, E. et al. (2003) PGC-1alpha-responsive genes involved in oxidative phosphorylation are coordinately downregulated in human diabetes. Nat Genet, 34, 267-273.
29 Subramanian, A., Tamayo, P., Mootha, V.K., Mukherjee, S., Ebert, B.L., Gillette, M.A., Paulovich, A., Pomeroy, S.L., Golub, T.R., Lander, E.S. et al. (2005) Gene set enrichment analysis: a knowledge-based approach for interpreting genome-wide expression profiles. Proc Natl Acad Sci U S A, 102, 15545-15550.
30 Xiao, J., Gong, S. and Ledoux, M.S. (2007) Caytaxin deficiency disrupts signaling pathways in cerebellar cortex. Neuroscience, 144, 439-461.
31 Krebs, H.A. (1935) Metabolism of amino-acids: The synthesis of glutamine from

49
glutamic acid and ammonia, and the enzymic hydrolysis of glutamine in animal tissues. Biochem J, 29, 1951-1969.
32 Curthoys, N.P. and Watford, M. (1995) Regulation of glutaminase activity and glutamine metabolism. Annu Rev Nutr, 15, 133-159.
33 Laake, J.H., Takumi, Y., Eidet, J., Torgner, I.A., Roberg, B., Kvamme, E. and Ottersen, O.P. (1999) Postembedding immunogold labelling reveals subcellular localization and pathway-specific enrichment of phosphate activated glutaminase in rat cerebellum. Neuroscience, 88, 1137-1151.
34 Yamada, K., Watanabe, M., Shibata, T., Tanaka, K., Wada, K. and Inoue, Y. (1996) EAAT4 is a post-synaptic glutamate transporter at Purkinje cell synapses. Neuroreport, 7, 2013-2017.
35 Tanaka, J., Ichikawa, R., Watanabe, M., Tanaka, K. and Inoue, Y. (1997) Extra-junctional localization of glutamate transporter EAAT4 at excitatory Purkinje cell synapses. Neuroreport, 8, 2461-2464.
36 Lakkis, M.M., O'Shea, K.S. and Tashian, R.E. (1997) Differential expression of the carbonic anhydrase genes for CA VII (Car7) and CA-RP VIII (Car8) in mouse brain. J Histochem Cytochem, 45, 657-662.
37 Hirota, J., Ando, H., Hamada, K. and Mikoshiba, K. (2003) Carbonic anhydrase-related protein is a novel binding protein for inositol 1,4,5-trisphosphate receptor type 1. Biochem J, 372, 435-441.
38 Huang, L., Shanker, Y.G., Dubauskaite, J., Zheng, J.Z., Yan, W., Rosenzweig, S., Spielman, A.I., Max, M. and Margolskee, R.F. (1999) Ggamma13 colocalizes with gustducin in taste receptor cells and mediates IP3 responses to bitter denatonium. Nat Neurosci, 2, 1055-1062.
39 McEwen, D.P., Koenekoop, R.K., Khanna, H., Jenkins, P.M., Lopez, I., Swaroop, A. and Martens, J.R. (2007) Hypomorphic CEP290/NPHP6 mutations result in anosmia caused by the selective loss of G proteins in cilia of olfactory sensory neurons. Proc Natl Acad Sci U S A, 104, 15917-15922.
40 Jiao, Y., Yan, J., Zhao, Y., Donahue, L.R., Beamer, W.G., Li, X., Roe, B.A., Ledoux, M.S. and Gu, W. (2005) Carbonic anhydrase-related protein VIII deficiency is associated with a distinctive lifelong gait disorder in waddles mice. Genetics, 171, 1239-1246.
41 Matsumoto, M., Nakagawa, T., Inoue, T., Nagata, E., Tanaka, K., Takano, H.,

50
Minowa, O., Kuno, J., Sakakibara, S., Yamada, M. et al. (1996) Ataxia and epileptic seizures in mice lacking type 1 inositol 1,4,5-trisphosphate receptor. Nature, 379, 168-171.
42 van de Leemput, J., Chandran, J., Knight, M.A., Holtzclaw, L.A., Scholz, S., Cookson, M.R., Houlden, H., Gwinn-Hardy, K., Fung, H.C., Lin, X. et al. (2007) Deletion at ITPR1 underlies ataxia in mice and spinocerebellar ataxia 15 in humans. PLoS Genet, 3, e108.
43 Street, V.A., Bosma, M.M., Demas, V.P., Regan, M.R., Lin, D.D., Robinson, L.C., Agnew, W.S. and Tempel, B.L. (1997) The type 1 inositol 1,4,5-trisphosphate receptor gene is altered in the opisthotonos mouse. J Neurosci, 17, 635-645.
44 Offermanns, S., Hashimoto, K., Watanabe, M., Sun, W., Kurihara, H., Thompson, R.F., Inoue, Y., Kano, M. and Simon, M.I. (1997) Impaired motor coordination and persistent multiple climbing fiber innervation of cerebellar Purkinje cells in mice lacking Galphaq. Proc Natl Acad Sci U S A, 94, 14089-14094.
45 Conquet, F., Bashir, Z.I., Davies, C.H., Daniel, H., Ferraguti, F., Bordi, F., Franz-Bacon, K., Reggiani, A., Matarese, V., Conde, F. et al. (1994) Motor deficit and impairment of synaptic plasticity in mice lacking mGluR1. Nature, 372, 237-243.
46 Aiba, A., Kano, M., Chen, C., Stanton, M.E., Fox, G.D., Herrup, K., Zwingman, T.A. and Tonegawa, S. (1994) Deficient cerebellar long-term depression and impaired motor learning in mGluR1 mutant mice. Cell, 79, 377-388.
47 Kano, M., Hashimoto, K., Watanabe, M., Kurihara, H., Offermanns, S., Jiang, H., Wu, Y., Jun, K., Shin, H.S., Inoue, Y. et al. (1998) Phospholipase cbeta4 is specifically involved in climbing fiber synapse elimination in the developing cerebellum. Proc Natl Acad Sci U S A, 95, 15724-15729.
48 Sillevis Smitt, P., Kinoshita, A., De Leeuw, B., Moll, W., Coesmans, M., Jaarsma, D., Henzen-Logmans, S., Vecht, C., De Zeeuw, C., Sekiyama, N. et al. (2000) Paraneoplastic cerebellar ataxia due to autoantibodies against a glutamate receptor. N Engl J Med, 342, 21-27.
49 Turkmen, S., Guo, G., Garshasbi, M., Hoffmann, K., Alshalah, A.J., Mischung, C., Kuss, A., Humphrey, N., Mundlos, S. and Robinson, P.N. (2009) CA8 mutations cause a novel syndrome characterized by ataxia and mild mental retardation with predisposition to quadrupedal gait. PLoS Genet, 5, e1000487.

51
CHAPTER III
EXPRESSION PROFILING IMPLICATES DYSREGULATION OF CALCIUM
SIGNALING IN WADDLES (WDS), A MOUSE MODEL OF ATAXIA AND DYSTONIA
Introduction
In the previous chapter, I reported that an inactivating mutation in the Atcay gene
leads to dysregulation of glutamate (Glu) signaling in the cerebellum and to severe ataxia
in mice. One of the genes we found significantly (qRT-PCR fold change = 0.56; p-value
=0.04) downregulated in cerebella of Atcayswd/swd mice was Car8, the gene encoding the
carbonic anhydrase related protein CAR8. A 19 bp deletion in this gene leads to a
different form of ataxia with dystonia, in a mouse mutant called waddles (wdl) (1). Our
previous finding that one ataxia gene, Car8, is downregulated in a mouse that is a null
allele for the other, Atcay, suggests that the pathways leading to the ataxic phenotype in
these two mutant mice may be related. Here we investigate this hypothesis further.
Waddles phenotype arose spontaneously at The Jackson Laboratory
(www.jax.org). Although Car8wdl/wdl mutant mice have cerebellar ataxia and dystonia, the
phenotype is much milder than that of Atcayswd/swd mutants, and Car8wdl/wdl mice have
normal life span and fertility. The Car8 gene and its protein product were originally
identified in 1990 (2) and given this name because of high amino acid sequence
similarity with other carbonic anhydrases (CAs). CAs are a group of metalloenzymes,

52
with zinc bound to their active site, that functions to catalyze the reversible hydration of
CO2 (3): CO2 + H2O
HCO3- + H+. However, due to changes in critical
amino acids in their active sites (3, 4), CAR8 as well as the related CAR10, do not have
any enzymatic carbonic anhydrase activity. Rather, CAR8 is a binding partner for
inositol 1,4,5-triphosphate (IP3) receptor (ITPR) type 1 in mouse brain (5). IP3 is a
second messenger molecule produced in response to extracellular stimuli, which then
binds to the ITP receptor and stimulates Ca2+ release from the endoplasmic reticulum
(ER) (6, 7).
Both Car8 and Itpr1 are expressed predominantly in Purkinje cells (8, 9), a
specialized type of neuron found exclusively in the cerebellum. Purkinje cells are
innervated by glutamatergic parallel and climbing fibers and provide the sole output from
the cerebellar cortex. Dysregulation of signaling within Purkinje cells is associated with
several different forms of ataxia in both humans and mice (10). For example, three
different mouse mutants of Itpr1, two knockouts (11, 12) and the spontaneous null allele
opisthotonos (13), display severe ataxic phenotypes and die before or soon after weaning.
A deletion in ITPR1 was also found to underlie Spinocerebellar Ataxia 15 in humans
(12). Thus, although Atcayswd/swd (14) and Car8wdl/wdl exhibit quite different severity of
symptoms, the fact that both mutants have cerebellar ataxia and dystonia and that Car8 is
dysregulated in Atcayswd/swd led us to hypothesize that both genes may be involved in the
same or related biological pathways.
To test this hypothesis we carried out microarray expression experiments on
mutant wdl cerebella. Here we report significant mRNA changes consequent to the Car8
mutation in the mouse mutant waddles in Ca2+ signaling as a major affected pathway as

53
well as some evidence for dysregulation of GABA receptor signaling.
Materials and Methods
Animals
Car8wdl/+ mice were obtained from The Jackson Laboratory, Bar Harbor, Maine
(http://www.jax.org) and bred to obtain Car8wdl/wdl and their age-, gender- and litter-
matched controls. Two wild type and one Car8wdl/+ mice, which are phenotypically
indistinguishable, were used as controls in 3 paired microarray expression experiments.
All animals were genotyped using genomic DNA obtained from tail tips at 14-16 days of
age. Cerebella were removed at weaning, P21, and flash frozen in liquid nitrogen. The
University of Michigan Committee on Use and Care of Animals approved all mouse
experiments.
Genotyping and RNA isolation.
To genotype the wdl mutation, a pair of primers (forward primer 5’- AATTGTC
TCCCAAAATCCCATC -3’, reverse primer 5’- CAGCATGCTTTCTTAACCACTG -
3’) were designed using Primer3 software (15) and used to amplify a fragment around
the 19bp deletion in exon 8 of the Car8 gene using 39 cycles of PCR with 94 °C for 1
min, 56.5 °C for 1 min , 72 °C 30 sec. The wild type allele yields product of 259 bp and
mutant 238 bp. Each sample was genotyped by size determination by gel electrophoresis
of the PCR product size.
For gene expression analysis, total RNA was extracted from samples using TRIzol®
Reagent (Invitrogen, cat. no. 15596-018) according to the manufacturer’s instructions.

54
RNA quantity was measured using NanoDrop ND-1000 spectrophotometer.
Microarray hybridization and analysis
RNA isolated form 6 cerebellum samples were processed and hybridized to
Illumina mouse WG-6 chips according to the manufacturer’s instructions (Illumina, San
Diego, CA). Raw probe intensities were extracted using Illumina BeadStudio software
(Illumina, San Diego, CA) and further analyzed using R (16) and Bioconductor (17).
Data were preprocessed using the quantile normalization algorithm (18) in the limma (19)
R package. After preprocessing, the data were analyzed using the Significance Analysis
of Microarrays (SAM) software package (20). Since our design used matched controls,
we analyzed the data using a paired t-test, as implemented in SAM.
We carried out functional and network enrichment analysis using the
DAVID/EASE (21) software as well as Ingenuity Pathways Analysis (Ingenuity®
Systems, www.ingenuity.com).
Results
In order to determine whether in the Car8-mutant ataxic mice similar pathways
are affected as those in the Atcay mutants, we hybridized cRNA from cerebella of three
Car8wdl/wdl mice and their litter-, gender- and age- matched controls to whole genome
expression chips (mouse WG-6 BeadArrays, Illumina, San Diego, CA). After paired t-
test analysis, 348 probes passed an FDR q-value cutoff of 10%. This means that out of
348 probes identified as differentially expressed, 90% are expected to be true positive
findings and 10% false positives. On the Illumina platform genes are represented with 50-

55
mer probes, using probes for genes that have different splice variants. The 348 probes
represent 338 unique genes. 328 (~95%) of the differentially expressed probes showed
upregulation in mutants compared to control samples. This is in contrast to Atcayswd/swd ,
where there were fewer genes identified as significantly changed, and the majority of
differentially expressed genes were found to be downregulated in mutants compared to
controls (see Chapter II) .
Microarray gene profiling experiments often results in hundreds of differentially
expressed genes, as was the case here. Not all of these changes may be relevant to a
particular system under investigation, and it is often difficult to navigate these long lists
of genes and put them into functional context. Pathway and enrichment analyses can be
used to identify whether a particular set of genes with shared functional category
assignment or within the same biological pathway are differentially expressed, and
whether the list of results is enriched for genes from such pathways. In order to analyze
pathways affected in both mutants, we used two different software packages. Expression
Analysis Systematic Explorer (EASE) (21) provides a measure of enrichment of genes as
defined by Gene Ontology(GO) (22) categories, while Ingenuity Pathways Analysis
(www.ingenuity.com) relies on a curated set of functional categories, pathways and
interaction network, including some that are publically available (such as KEGG(23)).
After analysis, 188 (54%) of the 348 probes were clones or predicted sequences with
little or no gene product description and no functional annotation available. Functional
analysis of the remaining 45% of the differentially expressed genes with EASE showed
several GO Biological process categories enriched in our data with nominal significance:
metal ion transport (p-value = 0.016, synaptic transmission (p-value = 0.015), and

56
transmission of nerve impulses (p-value = 0.016). These three categories were enriched
mainly due to expression changes in just three genes: Gria2, Kcnma1 and Kcnq2.
Analysis with the Ingenuity Pathways Analysis (Ingenuity® Systems,
www.ingenuity.com) identified several pathways as enriched at p-value < 0.1 , including
Ca2+ signaling (enrichment p-value = 0.06; genes: Gria2, Nfat5, Trpc1, Trpc2), GABA
receptor signaling (p-value = 0.06; genes: Nsf, Slc6a11) and synaptic transmission (p-
value = 0.0036; genes: Dlgap1, Gria2, Kcnn2, Kcnq2, Kif1b, Npxn3, Nsf, Sv2b).
Discussion.
Because of phenotypic similarities between waddles and sidewinder mouse
mutants and the fact that Car8 is significantly downregulated in Atcayswd/swd mice, we
hypothesized significant overlap in differentially expressed genes between the Car8wdl/wdl
and the Atcayswd/swd mutants. To our surprise, our results did not show such a global
overlap. First, and most strikingly, while the majority of differentially regulated genes in
Atcay mutants are downregulated, the majority of differentially expressed genes in
waddles mice were upregulated. This by itself suggests that the mode of response to the
two mutations is quite different. Second, although the phenotype of waddles mice is
much milder than that of sidewinder mice, the number of differentially expressed genes,
under the same statistical threshold, is much larger (1,665 are differentially expressed at
FDR 20%, which is what we applied in Atcayswd/swd experiments). Third, the genes most
prominently differentially expressed are in different annotated pathways, although they
may be related.

57
Downstream expression changes in Gria2 are in the opposite directions in the two
mutants.
Caytaxin binds to kidney-type phosphate-activated glutaminase (KGA) (24).
KGA is the key enzyme essential for conversion of glutamine to glutamate within
glutamatergic cells such as parallel and climbing fibers. In the previous chapter we have
shown that the disruption of Glu signaling in presynaptic cells has downstream effects on
molecules that are differentially expressed in postsynaptic Purkinje cells (PCs) of Atcay
mutant mice. More specifically, genes whose products were downregulated in sidewinder
mice are involved in Glu signal responses in postsynaptic cells, such as Gria2, an
ionotropic glutamate receptor, Slc1a6, high affinity aspartate/glutamate transporter highly
enriched in PCs (25) , as well as Gng13, which encodes the G-protein gamma subunit 13
known to be expressed in brain, but also suggested to be PC specific in the cerebellum
(9). These as well as other changes in Atcay mutants mostly affected genes known or
suspected to be PC specific. PCs are well established to be involved in ataxia (10, 26).
PCs are a specialized type of neurons found only in cerebella cortex and provide sole
output from that region thus playing a crucial role in signal transduction out of that part
of the brain.
Glutamate signaling was not among categories enriched in genes differentially
expressed in waddles mutants compared to controls. However, one of the genes
upregulated (fold change=1.49, q-value=8%) in Car8wdl/wdl is the ionotropic glutamate
receptor, AMPA type2, known as Gria2 or Glur2 (Table 3.1). Its gene product is one of
the subunits of glutamate-activated cation channels (27, 28). Increased expression of this
gene is known to be associated with increased length, width and density of dendritic

58
spines (29). Interestingly, the increased expression of Gria2 that we see in Car8wdl/wdl
would thus be consistent with the previously observed increase in the number of Purkinje
cell spines, which form connections with parallel fibers (PF) in these mutants (30).
Therefore, our findings are not only consistent with previously observed morphological
phenomenon in waddles cerebellum (30), but also show evidence of further possible
connection between the two mutants at the molecular level.
With the exception of Gria2, there is no evidence that glutamate receptors,
transporters are affected in waddles mice. Instead, the majority of the significant changes
are further downstream in signal transduction within PCs, such as Ca2+ signaling.
Ca2+ and GABA signaling dysregulation in waddles is implicated by two
independent gene expression experiments.
Yan et al. (31) recently reported results from similar microarray experiments on
waddles mutants. The authors of that study used total RNA from cerebella of 3 pairs of 2-
week old Car8wdl/wdl and age- and gender-matched littermates to hybridize to Affymetrix
Mouse Genome 430 2.0 GeneChips®. Comparing the number of differentially expressed
genes in that (total = 192) to our (total = 348) study is difficult because of the difference
in platforms as well as in the ways the statistics were calculated and thresholds applied.
However, comparing the lists of 192 significant genes from Yan et al. we find that 39
(20%) have no Illumina counterpart, i.e. were not measured in our experiment. Another
29% were not detected by the Illumina platform (median detection p-value ≤ 0.2). For the
remaining 108 (56%) genes, we compared the fold changes between the two sets of
experiments overall, and found no correlation. These results mean that genes found
59
significantly dysregulated by Yan et al were not confirmed in our experiment. The
reciprocal comparison, of our list of significant genes to those of Yan et al findings was
not possible due to lack of access to full dataset from that study.
This lack of replication may be due technical differences between the two
platforms used for the two sets of experiments, biological differences, low power to
detect differentially expressed genes, or a combination of these. For example, Yan et al.
find a 20-fold difference in Car8 expression while Illumina chips cannot detect that
signal at all. Although unlikely, it is possible that differences in the maintenance of the
mice at the two different sites, organ harvest procedures etc. affected the detection levels
of some genes. A third possible explanation is that due to small sample sizes, each set of
experiments had low power to detect all differentially expressed genes, and thus only a
small subset was identified. Therefore, relatively large sampling variation of the
expression differences in each experiment may lead to non-overlapping sets of
differentially expressed genes. While such subsets would not be expected to overlap
much, they would be expected to be in similar pathways, as we found to be indeed the
case. Despite the fact that there is no overlap in the exact lists of gene names detected as
differentially expressed in the two experiments, we see definite overlaps in the pathways
that are affected. For example, both sets of experiments find Ca2+ signaling as well as
signaling involving GABA receptor as enriched in both lists.
Ca2+ signaling plays an important role in the regulation of nervous system
processes, including neurotransmitter release, neuronal signal transduction and synaptic
plasticity as well as gene transcription (32). We find several genes involved in this
pathway upregulated in Car8wdl/wdl mutants compared to controls. First of all, although

60
functionally inactivated rather than upregulated, is Car8 itself, which competes with IP3
binding to its receptor thus affecting Ca2+ release from the ER. One other gene is the
aforementioned Gria2, a cation channel regulatory protein that, via mRNA editing,
regulates whether or not the channel will be permeable to Ca2+ and other cations (27, 28).
Two additional genes that are upregulated in waddles are Trpc1 and Trpc2, which are
members of the subfamily C of transient receptor potential cation channels implicated in
store-activated Ca2+ entry (33, 34). Trpc1 has been shown to co-localize with Grm1,
metabotropic glutamate receptor 1, in PCs (35) thus placing this Ca2+ channel in the same
cellular context, which in turn has already been shown to be involved in other ataxias
(10).
Another gene that we find upregulated in Car8wdl/wdl cerebellum is N-
ethylmaleimide sensitive fusion protein (Nsf), which has been shown to play a role in
Gria2 trafficking (36). Interestingly, the Nsf gene product is also important for gamma-
aminobutyric acid β receptor (GABBR) (37) functioning. GABBRs are known as
inhibitory receptors, since their activation triggers a reduction in Ca2+ conductance and
reduced neurotransmitter release. Nsf is also known to play a role in membrane
trafficking of GABAA receptors (38). One other significantly (FDR q-value = 0)
differentially expressed gene, kinesin binding trafficking protein 1 (Trak1), is another
trafficking protein known to interact with GABAA receptor (39). Mice carrying a
homozygous mutation in this gene, Trak1hyrt/hyrt, have hypertonia, which is often observed
in neurological disorders such as stiff-person syndrome, Parkinson’s disease and
dystonia. Trak1 dysregulation in Car8wdl/wdl mice thus shows a connection to yet another
mutant with gait disorder.

61
Both Ca2+and GABA receptor signaling findings are not unexpected given the
known biological function of CAR8. Because CAR8 inhibits IP3 binding to ITPR1 (5), its
deficiency is expected to lead to increased Ca2+ release from intracellular stores. While
there is no apparent overlap in the changes observed in Atcay mutant and those in
waddles, the fact remains that the two mutations lie in the same pathway of signal
propagation from Purkinje cells onward. More specifically, in Atcayswd/swd the glutamate
signaling onto Purkinje cells is dysregulated, while in waddles the changes are further
down in signal propagation, Ca2+ signaling. Our results suggests that ataxia and dystonia
in waddles mice is functionally related to ataxia in several other mouse mutants and
human ataxias with defects in the Purkinje cell signaling (10).
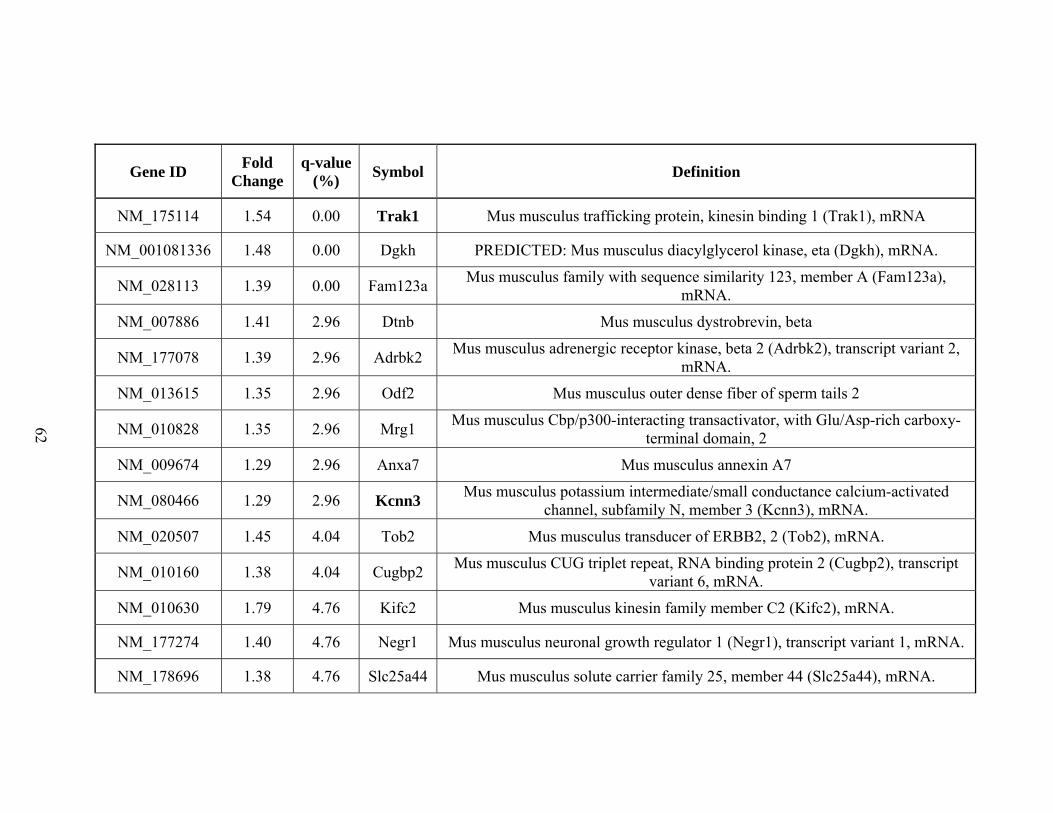
62
Gene ID Fold Change
q-value(%) Symbol Definition
NM_175114 1.54 0.00 Trak1 Mus musculus trafficking protein, kinesin binding 1 (Trak1), mRNA
NM_001081336 1.48 0.00 Dgkh PREDICTED: Mus musculus diacylglycerol kinase, eta (Dgkh), mRNA.
NM_028113 1.39 0.00 Fam123a Mus musculus family with sequence similarity 123, member A (Fam123a), mRNA.
NM_007886 1.41 2.96 Dtnb Mus musculus dystrobrevin, beta
NM_177078 1.39 2.96 Adrbk2 Mus musculus adrenergic receptor kinase, beta 2 (Adrbk2), transcript variant 2, mRNA.
NM_013615 1.35 2.96 Odf2 Mus musculus outer dense fiber of sperm tails 2
NM_010828 1.35 2.96 Mrg1 Mus musculus Cbp/p300-interacting transactivator, with Glu/Asp-rich carboxy-terminal domain, 2
NM_009674 1.29 2.96 Anxa7 Mus musculus annexin A7
NM_080466 1.29 2.96 Kcnn3 Mus musculus potassium intermediate/small conductance calcium-activated channel, subfamily N, member 3 (Kcnn3), mRNA.
NM_020507 1.45 4.04 Tob2 Mus musculus transducer of ERBB2, 2 (Tob2), mRNA.
NM_010160 1.38 4.04 Cugbp2 Mus musculus CUG triplet repeat, RNA binding protein 2 (Cugbp2), transcript variant 6, mRNA.
NM_010630 1.79 4.76 Kifc2 Mus musculus kinesin family member C2 (Kifc2), mRNA.
NM_177274 1.40 4.76 Negr1 Mus musculus neuronal growth regulator 1 (Negr1), transcript variant 1, mRNA.
NM_178696 1.38 4.76 Slc25a44 Mus musculus solute carrier family 25, member 44 (Slc25a44), mRNA.

63
Gene ID Fold Change
q-value(%) Symbol Definition
NM_019816 1.32 4.76 Trb Mus musculus tribbles homolog 1 (Drosophila) (Trib1), mRNA.
NM_026331 1.31 4.76 Slc25a37 Mus musculus solute carrier family 25, member 37 (Slc25a37), nuclear gene encoding mitochondrial protein, mRNA.
NM_011821 1.31 4.76 Gpc6 Mus musculus glypican 6
NM_018744 1.28 4.76 Sema6a Mus musculus sema domain, transmembrane domain (TM), and cytoplasmic domain, (semaphorin) 6A (Sema6a), mRNA.
NM_021426 0.74 4.76 Nkain4 Mus musculus Na+/K+ transporting ATPase interacting 4 (Nkain4), mRNA.
NM_139134 0.74 4.76 Chodl Mus musculus chondrolectin (Chodl), mRNA.
NM_025836 0.71 4.76 M6prbp1 Mus musculus mannose-6-phosphate receptor binding protein 1 (M6prbp1), mRNA.
NM_026612 0.69 4.76 Ndufb2 Mus musculus NADH dehydrogenase (ubiquinone) 1 beta subcomplex, 2 (Ndufb2), mRNA.
NM_175692 1.63 5.01 Snhg11 Mus musculus small nucleolar RNA host gene 11 (non-protein coding) (Snhg11), mRNA.
NM_172868 1.27 5.01 Akap2 Mus musculus A kinase (PRKA) anchor protein 2 (Akap2), transcript variant 1, mRNA.
NM_178654 1.25 5.01 Pak2 Mus musculus p21 (CDKN1A)-activated kinase 2 (Pak2), mRNA.
AF313046 1.38 5.43 Tssc8 Mus musculus tumor-suppressing subchromosomal transferable fragment 8
NM_010611 1.33 5.43 Kcnq2 Mus musculus potassium voltage-gated channel, subfamily Q, member 2 (Kcnq2), transcript variant 12, mRNA.
NM_028399 1.29 5.43 Ccnt2 Mus musculus cyclin T2 (Ccnt2), mRNA.

64
Gene ID Fold Change
q-value(%) Symbol Definition
XM_283052 1.29 5.43 Prg2 Mus musculus proteoglycan 2, bone marrow (Prg2), mRNA.
NM_011898 1.27 5.43 Spry4 Mus musculus sprouty homolog 4 (Drosophila) (Spry4), mRNA.
NM_010091 1.26 5.43 Dvl1 Mus musculus dishevelled, dsh homolog 1 (Drosophila) (Dvl1), mRNA.
NM_008678 1.25 5.43 Ncoa2 Mus musculus nuclear receptor coactivator 2 (Ncoa2), transcript variant 1, mRNA.
NM_008687 1.25 5.43 Nfib Mus musculus nuclear factor I/B (Nfib), mRNA.
NM_026094 1.25 5.43 Atp8b3 Mus musculus ATPase, class I, type 8B, member 3 (Atp8b3), mRNA.
NM_172339 1.36 5.55 Snapc4 Mus musculus small nuclear RNA activating complex, polypeptide 4 (Snapc4), mRNA.
NM_013507 1.33 5.55 Eif4g2 Mus musculus eukaryotic translation initiation factor 4, gamma 2 (Eif4g2), transcript variant 1, mRNA.
NM_207682 1.30 5.55 Kif1b Mus musculus kinesin family member 1B (Kif1b), transcript variant 2, mRNA.
NM_213616 1.43 5.79 Atp2b2 Mus musculus ATPase, Ca++ transporting, plasma membrane 2 (Atp2b2), transcript variant 1, mRNA.
NM_153458 1.34 5.79 Olfm3 Mus musculus olfactomedin 3 (Olfm3), transcript variant B, mRNA.
NM_011361 1.58 6.09 Sgk1 Mus musculus serum/glucocorticoid regulated kinase 1 (Sgk1), mRNA.
NM_198703 1.34 6.09 Wnk1 Mus musculus WNK lysine deficient protein kinase 1 (Wnk1), mRNA.
NM_008808 1.33 6.09 Pdgfa Mus musculus platelet derived growth factor, alpha (Pdgfa), mRNA.
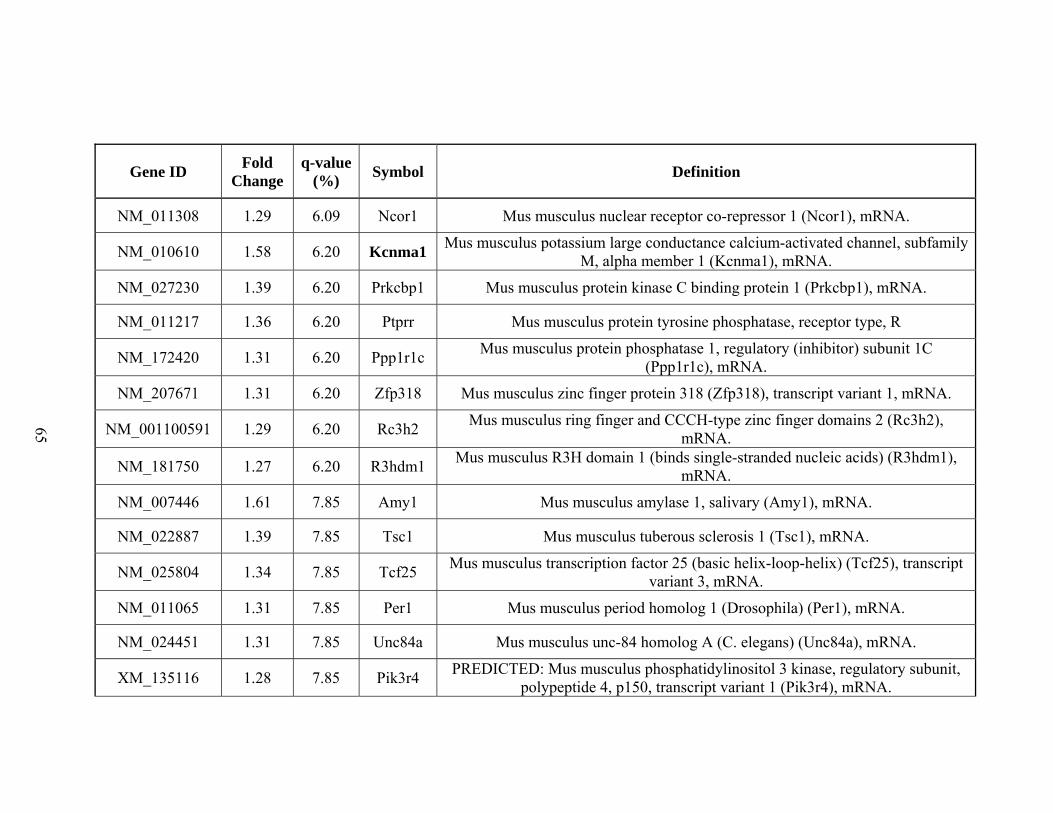
65
Gene ID Fold Change
q-value(%) Symbol Definition
NM_011308 1.29 6.09 Ncor1 Mus musculus nuclear receptor co-repressor 1 (Ncor1), mRNA.
NM_010610 1.58 6.20 Kcnma1 Mus musculus potassium large conductance calcium-activated channel, subfamily M, alpha member 1 (Kcnma1), mRNA.
NM_027230 1.39 6.20 Prkcbp1 Mus musculus protein kinase C binding protein 1 (Prkcbp1), mRNA.
NM_011217 1.36 6.20 Ptprr Mus musculus protein tyrosine phosphatase, receptor type, R
NM_172420 1.31 6.20 Ppp1r1c Mus musculus protein phosphatase 1, regulatory (inhibitor) subunit 1C (Ppp1r1c), mRNA.
NM_207671 1.31 6.20 Zfp318 Mus musculus zinc finger protein 318 (Zfp318), transcript variant 1, mRNA.
NM_001100591 1.29 6.20 Rc3h2 Mus musculus ring finger and CCCH-type zinc finger domains 2 (Rc3h2), mRNA.
NM_181750 1.27 6.20 R3hdm1 Mus musculus R3H domain 1 (binds single-stranded nucleic acids) (R3hdm1), mRNA.
NM_007446 1.61 7.85 Amy1 Mus musculus amylase 1, salivary (Amy1), mRNA.
NM_022887 1.39 7.85 Tsc1 Mus musculus tuberous sclerosis 1 (Tsc1), mRNA.
NM_025804 1.34 7.85 Tcf25 Mus musculus transcription factor 25 (basic helix-loop-helix) (Tcf25), transcript variant 3, mRNA.
NM_011065 1.31 7.85 Per1 Mus musculus period homolog 1 (Drosophila) (Per1), mRNA.
NM_024451 1.31 7.85 Unc84a Mus musculus unc-84 homolog A (C. elegans) (Unc84a), mRNA.
XM_135116 1.28 7.85 Pik3r4 PREDICTED: Mus musculus phosphatidylinositol 3 kinase, regulatory subunit, polypeptide 4, p150, transcript variant 1 (Pik3r4), mRNA.

66
Gene ID Fold Change
q-value(%) Symbol Definition
NM_001042711 1.69 7.90 Amy2b Mus musculus amylase 2b, pancreatic (Amy2b), mRNA.
NM_001001984 1.50 7.90 Fbxl11 Mus musculus F-box and leucine-rich repeat protein 11 (Fbxl11), mRNA.
NM_013540 1.49 7.90 Gria2 Mus musculus glutamate receptor, ionotropic, AMPA2 (alpha 2) (Gria2), transcript variant 3, mRNA.
NM_010350 1.47 7.90 Grin2c Mus musculus glutamate receptor, ionotropic, NMDA2C (epsilon 3) (Grin2c), mRNA.
NM_009773 1.44 7.90 Bub1b Mus musculus budding uninhibited by benzimidazoles 1 homolog, beta (S. cerevisiae) (Bub1b), mRNA.
NM_172890 1.40 7.90 Slc6a11 Mus musculus solute carrier family 6 (neurotransmitter transporter, GABA), member 11 (Slc6a11), mRNA.
NM_011947 1.38 7.90 Map3k3 Mus musculus mitogen-activated protein kinase kinase kinase 3 (Map3k3), mRNA.
NM_001081225 1.36 7.90 Fam178a Mus musculus family with sequence similarity 178, member A (Fam178a), mRNA.
NM_172903 1.34 7.90 Man2a2 Mus musculus mannosidase 2, alpha 2 (Man2a2), mRNA.
NM_172546 1.33 7.90 Magi1 Mus musculus membrane associated guanylate kinase, WW and PDZ domain containing 1 (Magi1), transcript variant 1, mRNA.
NM_029721 1.30 7.90 Snx27 Mus musculus sorting nexin family member 27 (Snx27), transcript variant 2, mRNA.
NM_153579 1.30 7.90 Sv2b Mus musculus synaptic vesicle glycoprotein 2 b (Sv2b), mRNA.
NM_011504 1.29 7.90 Stxbp3 AT rich interactive domain 1A
NM_001080819 1.29 7.90 Arid1a AT rich interactive domain 1A

67
Gene ID Fold Change
q-value(%) Symbol Definition
NM_153158 1.25 7.90 E130308A19Rik
Mus musculus RIKEN cDNA E130308A19 gene (E130308A19Rik), transcript variant 2, mRNA.
NM_011644 1.24 7.90 Trrp2 Mus musculus transient receptor potential cation channel, subfamily C, member 2 (Trpc2), mRNA.
NM_018854 0.79 7.90 Ift20 Mus musculus intraflagellar transport 20 homolog (Chlamydomonas) (Ift20), mRNA.
NM_025570 0.78 7.90 Mrpl20 Mus musculus mitochondrial ribosomal protein L20 (Mrpl20), nuclear gene encoding mitochondrial protein, mRNA.
NM_013898 0.78 7.90 Timm8a1 Mus musculus translocase of inner mitochondrial membrane 8 homolog a1 (yeast) (Timm8a1), mRNA.
XP_990642 1.26 8.14 Rasa1 Mus musculus RAS p21 protein activator 1 (Rasa1), mRNA.
NM_028444 0.79 8.14 Prkcdbp Mus musculus protein kinase C, delta binding protein (Prkcdbp), mRNA.
NM_009426 0.75 8.14 Trh Mus musculus thyrotropin releasing hormone (Trh), mRNA.
NM_009653 1.54 9.08 Alas2 Mus musculus aminolevulinic acid synthase 2, erythroid (Alas2), mRNA.
NM_175836 1.37 9.08 Spnb2 Mus musculus spectrin beta 2 (Spnb2), transcript variant 2, mRNA.
NM_016920 1.34 9.08 Atp6v0a1 Mus musculus ATPase, H+ transporting, lysosomal V0 subunit A1 (Atp6v0a1), mRNA.
NM_015772 1.31 9.08 Sall2 Mus musculus sal-like 2 (Drosophila) (Sall2), mRNA.
NM_175642 1.27 9.08 Bai3 Mus musculus brain-specific angiogenesis inhibitor 3 (Bai3), mRNA.
NM_027740 1.26 9.08 Wdr51b Mus musculus WD repeat domain 51B (Wdr51b), mRNA.

68
Gene ID Fold Change
q-value(%) Symbol Definition
NM_133957 1.25 9.08 Nfat5 Mus musculus nuclear factor of activated T-cells5 (Nfat5), transcript variant a, mRNA.
NM_011643 1.21 9.08 Trrp1 Mus musculus transient receptor potential cation channel, subfamily C, member 1 (Trpc1), mRNA.
NM_008740 1.19 9.08 Nsf Mus musculus N-ethylmaleimide sensitive fusion protein (Nsf), mRNA.
NM_008398 0.78 9.08 Itga7 Mus musculus integrin alpha 7 (Itga7), mRNA.
NM_007436 0.71 9.08 Aldh3a1 Mus musculus aldehyde dehydrogenase family 3, subfamily A1 (Aldh3a1), mRNA.
NM_013540 1.61 10.06 Gria2 Mus musculus glutamate receptor, ionotropic, AMPA2 (alpha 2) (Gria2), transcript variant 1, mRNA.
NM_172544 1.42 10.06 Nrxn3 Mus musculus neurexin III (Nrxn3), mRNA.
NM_177027 1.35 10.06 D4Wsu132e
Mus musculus DNA segment, Chr 4, Wayne State University 132, expressed (D4Wsu132e), mRNA.
NM_009574 1.35 10.06 Zic2 Mus musculus zinc finger protein of the cerebellum 2 (Zic2), mRNA.
NM_173437 1.34 10.06 Nav1 Mus musculus neuron navigator 1 (Nav1), mRNA.
NM_177639 1.33 10.06 Dlgap1 Mus musculus discs, large (Drosophila) homolog-associated protein 1 (Dlgap1), mRNA.
NM_028835 1.31 10.06 Atg7 Mus musculus autophagy-related 7 (yeast) (Atg7), mRNA.
NM_022801 1.31 10.06 Mark3 Mus musculus MAP/microtubule affinity-regulating kinase 3 (Mark3), transcript variant 1, mRNA.
NM_134074 1.29 10.06 Dock9 Mus musculus dedicator of cytokinesis 9 (Dock9), transcript variant 1, mRNA.
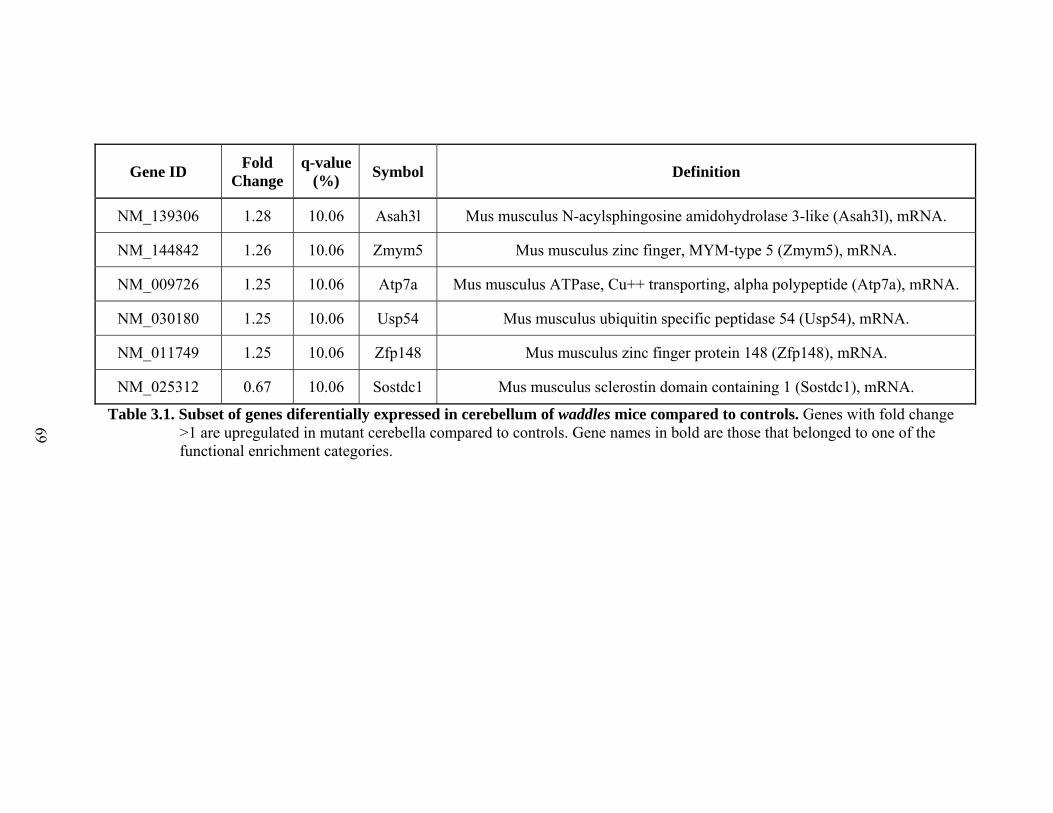
69
Gene ID Fold Change
q-value(%) Symbol Definition
NM_139306 1.28 10.06 Asah3l Mus musculus N-acylsphingosine amidohydrolase 3-like (Asah3l), mRNA.
NM_144842 1.26 10.06 Zmym5 Mus musculus zinc finger, MYM-type 5 (Zmym5), mRNA.
NM_009726 1.25 10.06 Atp7a Mus musculus ATPase, Cu++ transporting, alpha polypeptide (Atp7a), mRNA.
NM_030180 1.25 10.06 Usp54 Mus musculus ubiquitin specific peptidase 54 (Usp54), mRNA.
NM_011749 1.25 10.06 Zfp148 Mus musculus zinc finger protein 148 (Zfp148), mRNA.
NM_025312 0.67 10.06 Sostdc1 Mus musculus sclerostin domain containing 1 (Sostdc1), mRNA.
Table 3.1. Subset of genes diferentially expressed in cerebellum of waddles mice compared to controls. Genes with fold change >1 are upregulated in mutant cerebella compared to controls. Gene names in bold are those that belonged to one of the functional enrichment categories.

70
References
1 Jiao, Y., Yan, J., Zhao, Y., Donahue, L.R., Beamer, W.G., Li, X., Roe, B.A., Ledoux, M.S. and Gu, W. (2005) Carbonic anhydrase-related protein VIII deficiency is associated with a distinctive lifelong gait disorder in waddles mice. Genetics, 171, 1239-1246.
2 Kato, K. (1990) Sequence of a novel carbonic anhydrase-related polypeptide and its exclusive presence in Purkinje cells. FEBS Lett, 271, 137-140.
3 Keilin, D., Mann, T. (1939) Carbonic anhydrase. Nature, 144, 442-443.
4 Hewett-Emmett, D. and Tashian, R.E. (1996) Functional diversity, conservation, and convergence in the evolution of the alpha-, beta-, and gamma-carbonic anhydrase gene families. Mol Phylogenet Evol, 5, 50-77.
5 Hirota, J., Ando, H., Hamada, K. and Mikoshiba, K. (2003) Carbonic anhydrase-related protein is a novel binding protein for inositol 1,4,5-trisphosphate receptor type 1. Biochem J, 372, 435-441.
6 Streb, H., Irvine, R.F., Berridge, M.J. and Schulz, I. (1983) Release of Ca2+ from a nonmitochondrial intracellular store in pancreatic acinar cells by inositol-1,4,5-trisphosphate. Nature, 306, 67-69.
7 Berridge, M.J. (1993) Inositol trisphosphate and calcium signalling. Nature, 361, 315-325.
8 Maeda, N., Niinobe, M., Inoue, Y. and Mikoshiba, K. (1989) Developmental expression and intracellular location of P400 protein characteristic of Purkinje cells in the mouse cerebellum. Dev Biol, 133, 67-76.
9 Rong, Y., Wang, T. and Morgan, J.I. (2004) Identification of candidate Purkinje cell-specific markers by gene expression profiling in wild-type and pcd(3J) mice. Brain Res Mol Brain Res, 132, 128-145.
10 Sachs, A.J., Schwendinger, J.K., Yang, A.W., Haider, N.B. and Nystuen, A.M. (2007) The mouse mutants recoil wobbler and nmf373 represent a series of Grm1 mutations. Mamm Genome, 18, 749-756.
11 Matsumoto, M., Nakagawa, T., Inoue, T., Nagata, E., Tanaka, K., Takano, H., Minowa, O., Kuno, J., Sakakibara, S., Yamada, M. et al. (1996) Ataxia and epileptic seizures in mice lacking type 1 inositol 1,4,5-trisphosphate receptor. Nature, 379, 168-171.
12 van de Leemput, J., Chandran, J., Knight, M.A., Holtzclaw, L.A., Scholz, S., Cookson, M.R., Houlden, H., Gwinn-Hardy, K., Fung, H.C., Lin, X. et al. (2007) Deletion at ITPR1 underlies ataxia in mice and spinocerebellar ataxia 15 in humans. PLoS Genet, 3, e108.
13 Street, V.A., Bosma, M.M., Demas, V.P., Regan, M.R., Lin, D.D., Robinson, L.C., Agnew, W.S. and Tempel, B.L. (1997) The type 1 inositol 1,4,5-trisphosphate

71
receptor gene is altered in the opisthotonos mouse. J Neurosci, 17, 635-645.
14 Bomar, J.M., Benke, P.J., Slattery, E.L., Puttagunta, R., Taylor, L.P., Seong, E., Nystuen, A., Chen, W., Albin, R.L., Patel, P.D. et al. (2003) Mutations in a novel gene encoding a CRAL-TRIO domain cause human Cayman ataxia and ataxia/dystonia in the jittery mouse. Nat Genet, 35, 264-269.
15 Rozen, S. and Skaletsky, H. (2000) Primer3 on the WWW for general users and for biologist programmers. Methods Mol Biol, 132, 365-386.
16 Team, R.D.C. (2009) Computing, R.F.f.S. (ed.), Vienna, Austria.
17 Gentleman, R.C., Carey, V.J., Bates, D.M., Bolstad, B., Dettling, M., Dudoit, S., Ellis, B., Gautier, L., Ge, Y., Gentry, J. et al. (2004) Bioconductor: open software development for computational biology and bioinformatics. Genome Biol, 5, R80.
18 Bolstad, B.M., Irizarry, R.A., Astrand, M. and Speed, T.P. (2003) A comparison of normalization methods for high density oligonucleotide array data based on variance and bias. Bioinformatics, 19, 185-193.
19 Smyth, G.K. (2005) R. Gentleman, V.C., S. Dudoit, R. Irizarry, W. Huber (ed.), In Bioinformatics and Computational Biology Solutions using R and Bioconductor. Springer, New York.
20 Tusher, V.G., Tibshirani, R. and Chu, G. (2001) Significance analysis of microarrays applied to the ionizing radiation response. Proc Natl Acad Sci U S A, 98, 5116-5121.
21 Hosack, D.A., Dennis, G., Jr., Sherman, B.T., Lane, H.C. and Lempicki, R.A. (2003) Identifying biological themes within lists of genes with EASE. Genome Biol, 4, R70.
22 Ashburner, M., Ball, C.A., Blake, J.A., Botstein, D., Butler, H., Cherry, J.M., Davis, A.P., Dolinski, K., Dwight, S.S., Eppig, J.T. et al. (2000) Gene ontology: tool for the unification of biology. The Gene Ontology Consortium. Nat Genet, 25, 25-29.
23 Kanehisa, M., Araki, M., Goto, S., Hattori, M., Hirakawa, M., Itoh, M., Katayama, T., Kawashima, S., Okuda, S., Tokimatsu, T. et al. (2008) KEGG for linking genomes to life and the environment. Nucleic Acids Res, 36, D480-484.
24 Buschdorf, J.P., Li Chew, L., Zhang, B., Cao, Q., Liang, F.Y., Liou, Y.C., Zhou, Y.T. and Low, B.C. (2006) Brain-specific BNIP-2-homology protein Caytaxin relocalises glutaminase to neurite terminals and reduces glutamate levels. J Cell Sci, 119, 3337-3350.
25 Yamada, K., Watanabe, M., Shibata, T., Tanaka, K., Wada, K. and Inoue, Y. (1996) EAAT4 is a post-synaptic glutamate transporter at Purkinje cell synapses. Neuroreport, 7, 2013-2017.
26 Carlson, K.M., Andresen, J.M. and Orr, H.T. (2009) Emerging pathogenic pathways in the spinocerebellar ataxias. Curr Opin Genet Dev, 19, 247-253.

72
27 Bassani, S., Valnegri, P., Beretta, F. and Passafaro, M. (2009) The GLUR2 subunit of AMPA receptors: synaptic role. Neuroscience, 158, 55-61.
28 Bowie, D. and Mayer, M.L. (1995) Inward rectification of both AMPA and kainate subtype glutamate receptors generated by polyamine-mediated ion channel block. Neuron, 15, 453-462.
29 Passafaro, M., Nakagawa, T., Sala, C. and Sheng, M. (2003) Induction of dendritic spines by an extracellular domain of AMPA receptor subunit GluR2. Nature, 424, 677-681.
30 Hirasawa, M., Xu, X., Trask, R.B., Maddatu, T.P., Johnson, B.A., Naggert, J.K., Nishina, P.M. and Ikeda, A. (2007) Carbonic anhydrase related protein 8 mutation results in aberrant synaptic morphology and excitatory synaptic function in the cerebellum. Mol Cell Neurosci, 35, 161-170.
31 Yan, J., Jiao, Y., Jiao, F., Stuart, J., Donahue, L.R., Beamer, W.G., Li, X., Roe, B.A., LeDoux, M.S. and Gu, W. (2007) Effects of carbonic anhydrase VIII deficiency on cerebellar gene expression profiles in the wdl mouse. Neurosci Lett, 413, 196-201.
32 Berridge, M.J. (1998) Neuronal calcium signaling. Neuron, 21, 13-26.
33 Ehrengruber, M.U., Kato, A., Inokuchi, K. and Hennou, S. (2004) Homer/Vesl proteins and their roles in CNS neurons. Mol Neurobiol, 29, 213-227.
34 Ambudkar, I.S. (2007) TRPC1: a core component of store-operated calcium channels. Biochem Soc Trans, 35, 96-100.
35 Kim, S.J., Kim, Y.S., Yuan, J.P., Petralia, R.S., Worley, P.F. and Linden, D.J. (2003) Activation of the TRPC1 cation channel by metabotropic glutamate receptor mGluR1. Nature, 426, 285-291.
36 Lee, S.H., Liu, L., Wang, Y.T. and Sheng, M. (2002) Clathrin adaptor AP2 and NSF interact with overlapping sites of GluR2 and play distinct roles in AMPA receptor trafficking and hippocampal LTD. Neuron, 36, 661-674.
37 Pontier, S.M., Lahaie, N., Ginham, R., St-Gelais, F., Bonin, H., Bell, D.J., Flynn, H., Trudeau, L.E., McIlhinney, J., White, J.H. et al. (2006) Coordinated action of NSF and PKC regulates GABAB receptor signaling efficacy. EMBO J, 25, 2698-2709.
38 Goto, H., Terunuma, M., Kanematsu, T., Misumi, Y., Moss, S.J. and Hirata, M. (2005) Direct interaction of N-ethylmaleimide-sensitive factor with GABA(A) receptor beta subunits. Mol Cell Neurosci, 30, 197-206.
39 Gilbert, S.L., Zhang, L., Forster, M.L., Anderson, J.R., Iwase, T., Soliven, B., Donahue, L.R., Sweet, H.O., Bronson, R.T., Davisson, M.T. et al. (2006) Trak1 mutation disrupts GABA(A) receptor homeostasis in hypertonic mice. Nat Genet, 38, 245-250.

73
CHAPTER IV
ANALYSIS OF GENE EXPRESSION ASSOCIATION WITH BIPOLAR
DISORDER ASSOCIATED SNPS
Introduction.
In the previous two chapters I described our investigations utilizing gene
expression analyses to the study functional effects of highly penetrant Mendelian
disorders on expression of other genes in mouse models. However, most human disorders
are not caused by such single, fully penetrant mutations. The leading causes of disability
in humans are due to complex disorders, thought to be caused by combinations of many
different genetic variants, each increasing risk only by a little, in interaction with each
other, with development and with environmental factors (1-3). In this part of my thesis, I
utilized gene expression analysis to shed light on one such more complex illness, Bipolar
Disorder (BPD). Specifically, I investigated whether genetic variants, SNPs, that were
previously reported as being associated with BPD, significantly affect the expression
levels of genes in their vicinity.
Short introduction to Bipolar Disorder.
Bipolar Disorder is a life-long debilitating and often fatal psychiatric disorder. It
is characterized by episodes of severe depression and mania, with the latter characterized

74
by extremely elevated mood, unusual thought patterns and sometimes psychosis.
BPD has a prevalence of ~ 1% -2% in the general population (4, 5) and heritability
estimates range between 85% and 93% (6, 7). Numerous family, twin and adoption
studies over the last half a century have provided an impressive body of evidence that
genetic etiology plays an important role in the risk for this disorder. However, none of the
previous linkage and candidate gene studies have provided convincing evidence for any
specific gene involved in the etiology of BPD. The difficulties elucidating specific
genetic factors underlying BPD risk are attributed to multiple causes, including
phenotypic, environmental, and genetic complexities. Phenotypically, there are many
forms of bipolar disorder, called type I, type II, and schizoaffective bipolar type (8) ,
which may or may not constitute separate genetic etiology. In addition, some
symptoms/disorders (major depression, alcoholism) are more common in families with
BPD but also occur outside of BPD. Environmental factors also play a role in
presentation and risk, and have so far not been accounted for in genetic studies (9). In
addition to phenotypic issues, genetic heterogeneity is also likely to play a major role:
Heterogeneity may be manifest as locus or genetic heterogeneity, i.e. a large number of
different genes, each very rare but having a strong unique effect, or as polygenic
inheritance, in which a large number of genetic factors may additively increase or
decrease risk by a very small amount (odds ratio <2), or as allelic heterogeneity, with
multiple alleles in each locus. Either of these factors or, more likely, all to some extent,
may explain why identification of risk factors has so far been unsuccessful, despite high
heritability. A detailed discussion on these topics can be found in several recent reviews
(9, 10).

75
Genome Wide Association Studies of Bipolar Disorder.
Specific biological candidate genes have been tested for association with BPD for
many years, but no clearly reproducible association with BPD has emerged from these
studies. The recent availability and increasing affordability of high throughout genotyping
platforms allowed hypothesis-free Genome Wide Association (GWA) studies of complex
traits such as BPD. GWA studies (11) search for association between SNPs (usually
between 300,000 and 2,000,000) distributed all over the genome and the trait of interest,
comparing either allele frequencies between cases and controls, or testing association of
alleles with quantitative traits such as blood pressure or height. Because of the large
number of SNPs tested in a GWA analysis, correction for multiple testing is essential.
Because many SNPs are in LD with each other and thus highly correlated with each other,
the appropriate cutoff is not trivial to determine. Most studies consider a p-value < 2 x 10-
8, equivalent to correction for 2,500,000 independent SNPs, as significant, although others
(12) consider 2 x 10⁻⁷ as the relevant cut-off, arguing that most of the information of
2,500,000 SNPs can be assessed with only 250,000 SNPs. For our studies described later
in this chapter we considered all GWA findings with p-value ≤ 1*10-6.
According to the NIH GWA studies database, over 300 such studies have been
completed to date (13), most of them in the recent 2-3 years. This includes six different
GWA studies and meta-analyses of BPD. The first study by The Wellcome Trust Case-
Control Consortium (WTCCC) used ~2,000 BPD cases in comparison with ~3,000
population controls, and identified rs420259 in an intronic region of PALB2 gene on
chromosome 16 as the strongest signal in BPD with p = 6.3*10-8 (12). Baum et al (14)
used two independent case-control samples, one consisting of 461 BPD cases and 562

76
controls from the NIMH genetics initiative (http://nimhgenetics.org) using DNA pooling,
and the other consisting of independently recruited 772 BPD cases and 876 controls from
Germany. Selected pooling results were confirmed by individual genotyping. That study
identified rs1012053, in the first intron of DGKH on chromosome 13, as the strongest
signal with p = 1.5*10-8. Sklar et al (15) used 1461 BPD cases and 2008 controls and
identified two associations. One association was with SNP rs4939921, in an intronic
region of MYO5B gene on chromosome 18, with a p = 1.66*10-7, and the other with
rs1705236 in the TSPAN8 gene on chromosome 12 with a p = 6.11*10-7. Baum et al
collaborated with WTCCC (16) in a meta analysis of the first and second GWAS
mentioned above, which resulted in yet another SNP coming to the top, rs10791345 on
chromosome13 with a p = 1*10-6. Ferreira et al (17) used ~4300 BPD cases and ~6200
controls by combining data from the first two studies described above and genotyping
additional samples. They identified SNPs in three different regions: rs10994336 with a p-
value= 9.1*10-9 in ANK3 on chromosome 10, rs1006737 with a p-value =7*10-8 in
CACNA1C on chromosome 12, and rs112899449 with a p-value=3.5*10-7 on
chromosome 15 near several genes. The latest study, by Scott et al (18), used ~2000 BPD
cases and ~1600 controls from the NIMH (http://nimhgenetics.org), overlapping with
those from Baum et al., and the Prechter
(http://www.depressioncenter.org/prechterrepository/) repositories, samples collected in
London, Toronto, and Dundee sponsored by GlaxoSmithKline Research and Development
(Middlesex, United Kingdom), as well as ~2000 BPD cases and ~13000 reference controls
from the WTCCC, and identified 3 additional regions carrying variations that increased
risk for the disorder: rs472913 (p-value = 2*10-7) on chromosome 1 with no known genes

77
nearby, rs1042779 (p-value = 1.8*10-7) in the intron of the ITIH1 gene on chromosome 3,
and rs17418283 (p-value = 1.3*10-7) in the intron of the MCTP1 gene on chromosome 5.
Scott et al. also added to the emerging evidence for involvement of rs10994336 in ANK3,
albeit only with a p-value of 0.05. Thus, with the possible exception of a SNP in ANK3,
each study brought different SNPs and genes to the forefront, and the strongest evidence
for association was barely significant when accounting for multiple testing. To address
the problem of the non-replication, efforts are currently under way to combine existing
GWAS data to permit association tests of psychiatric disorders with larger sample sizes
(19).
Follow up analyses of GWAS findings.
With the difficulties encountered with purely genetic association studies, an
alternative to identify genes involved in psychiatric disorders such as BPD is to combine
genetic studies with functional pathway information from either the genetic studies or
from other, neurobiological studies (9, 20). Pathway analysis relies on our ability to know
or infer the identity of the gene(s) affected by any given SNP, e.g. from an association
study. Because most SNPs are not in the coding regions of genes, this question is not as
trivial as it may seem. One strategy is to presume a candidate gene to be the one closest
to the most significant GWAS SNPs in a given region and then follow with biological
pathways identification. For example, Torkamani et al (21) used pathways and network
based analysis to identify the most likely affected pathways in seven different disorders
investigated in the Wellcome Trust Case Control Consortium (WTCCC) GWA studies
(12). Their analysis involved first mapping SNPs onto genes and then using methods
developed for gene expression analysis to identify affected pathways. The SNP-to-gene
78
mapping was based on proximity, within 5Kb of each other, while prioritizing using the
following rule when multiple genes map in the vicinity of a SNP: coding >
intronic > 5’utr > 3’utr > 5’upstream > 3’upstream (21). Interestingly, this approach
would have yielded the wrong candidate gene in one of the few successful studies of this
type (see below) by Moffat et al (22), where the top GWAS SNP was located in an intron
of one gene, but significantly associated with expression levels of another nearby gene.
Therefore, simple one-to-one matching between a SNP and a closest gene may not be
effective at identifying proper biological candidates, and once the wrong gene is
assigned, all subsequent pathway analysis is flawed by that initial problematic SNP-to-
gene assignment.
Another approach is to combine genotyping data with data from other sources.
For example, Chen et al .(23) hypothesize that genes that tend to be differentially
expressed are more likely to be affected in common disorders. They thus suggest to use
expression data to identify the most likely defective gene in the region of a GWAS SNP
hit by considering all expression data publically available in the Gene Expression
Omnibus (GEO) database (24, 25), and developed a specific scoring system that gives
higher scores to genes that are differentially expressed in GEO than to genes with
invariable levels of expression. These authors support their hypothesis by showing that
their scores would have correctly identified a previously confirmed Type 2Diabetes
(T2D) candidate gene from the WTCCC T2D GWAS. However, it is not yet clear
whether the underlying hypothesis is true at all, or, if true, only in a small subset of
common disorders, and no new candidate gene has yet been identified and confirmed
using this approach.

79
A more direct approach is to test the effect of SNPs on expression, usually
requiring both genotype and expression data available from the same sample. In a GWA
study of ~1000 cases with childhood onset asthma and ~12000 controls, several markers
on chromosome 17 were identified as significantly associated with asthma risk (22). The
authors followed up on their findings with gene expression studies of genes near their top
GWA findings. Gene expression was measured in B-cell-derived EBV-transformed
lymphoblastoid cell lines (LCLs) obtained from samples of 112 cases and 266 controls.
The authors found one of their most significant GWA study SNPs to be significantly
associated with expression of one of the genes in the region, ORMDL3, encoding the
orosomucoid 1 like protein 3. Several conclusions can be drawn from this example. Only
one of the top GWAS findings showed association with expression. The biological
importance of the other findings could not be uncovered in the expression study. This
successful follow up analysis relied in part on the fact that gene expression changes in the
ORMDL3 gene were observable in blood-derived cell lines, which were available in large
numbers. Expression was actually measured in B-cell-lineage derived cell lines, which
may be a relevant cell type when it comes to inflammatory disease like asthma (22),
although other problems such as mutations and gene regulation changes in cell culture
may be confounding (26). In addition, not all genes are expressed in such readily
available tissue, and thus we cannot assume that LCLs would be appropriate for follow
up of findings in brain disorders. Studies are underway to assess to what extent
associations of gene expression changes in response to SNP variations in brain tissue are
comparable to those obtained using expression measures from cell lines (data not
published, M. Burmeister, B. Keller and E. Schmidt, personal communication).
80
However, it is likely that only a subset of such associations is in common between LCLs,
and brain, so ideally, this type of question is best addressed in the affected target tissue of
the disorder.
In psychiatric disorders, however, obtaining samples from the primary tissue of
interest, brain, is difficult and practically not possible for very large sample sizes, such as
the thousands of samples used in GWAS. In the study reported here, I analyzed
expression data obtained from postmortem brains from six different brain regions from
about 100 individuals. In particular, we tested whether there are polymorphic cis-
regulatory elements within regions around the top Bipolar GWAS findings. While we
found highly statistically significant association of SNPs with expression of nearby genes
in our brain samples, none were with the top Bipolar-associated SNPs. In addition, for
one of the GWAS regions, on chromosome 3, we successfully used expression data to
filter out genes from that chromosomal region as well as identified genes differentially
regulated in the brain.
Materials and methods. Sample preparation, hybridization and genotyping.
All sample collection and processing is the work of collaborators of Pritzker
Neuropsychiatric Disorders Consortium. Details of human brain sample collection,
dissection and RNA extraction can be found in Evans et al. (2003). RNA samples were
processed and hybridized to Illumina HumanRef-8 whole genome expression chip,
version2, according to manufacturer’s suggestions (Illumina, San Diego, CA, USA) by
Pritzker consortium members at Stanford University. For my analysis, RNA samples
from 109 individuals were extracted for 6 brain regions per individual. Brain regions
included the following: Anterior Cingulate (ACG), Amygdala (AMY), Cerebellum (CB),

81
Dorsolateral Prefrontal Cortex (DLPFC), Hippocampus (HC), nucleus Accumbens
(NAC). Some samples were removed from further analysis after hybridization
experiments were completed due to poor quality of sample hybridizations.
A collection of 156 samples, including the 106 samples mentioned above, from
the same Pritzker consortium brain bank were also used for whole genome genotyping
using Illumina high-definition chips Human610-Quad (Illumina, San Diego, CA, USA).
For this set of experiments, DNA from brain regions, usually cerebellum, was extracted
using the Gentra Puregene tissue kit (Qiagen, Valencia, CA, USA) with optional
overnight incubation at 55oC. After DNA extraction, genotyping on the Illumina
HUMAN 660W platform was performed using manufacturer’s standard protocol.
Data preprocessing and analysis.
For the analysis of gene expression, data average raw probe signals were exported
from Illumina BeadStudio® software and quantile normalized in R (27) separately for
each of the six brain regions using Bioconductor (28).
For regression analysis, only Caucasian samples were used. Altogether between
89 and 100 samples had both genotyping and expression data, depending on the brain
region tested. These samples were from individuals who had a history of several
different psychiatric disorders including Bipolar Disorder (BPD), Major Depressive
Disorder (MDD) and Schizophrenia (Schiz), as well as carefully screened unaffected
controls. More specifically, the breakdown of samples used in analysis was the following
for each brain region (Total : Controls/BPD/MDD/Schiz): ACG (99: 42/13/33/11), AMY
(89:42/13/33/11), CB (41/14/34/11), DLPFC (97:40/14/32/11), HC (98:40/14/33/ 11),
NAC (94:39/13/31/11).

82
We used linear regression to test for association between SNP variants and
expression of genes in regions around SNPs identified by any of several Bipolar GWAS
(12, 14-18). Regions were defined as +/- 600 Kb around the SNP reported as associated
with BPD with a p-value < 1*10^-6. SNPs falling within defined regions were tested for
association with expression of transcripts in the same region. We included several
covariates in the regression model to account for factors known to be associated with
change in expression levels, including age, gender and diagnosis. We used the following
model: exprij ~ snpkj + age + gender + diagnosis, where j is a chromosomal region
identifier, i is a transcript identifier and k enumerates SNPs in a region.
In the second set of analyses, to account for the effect of the top most significant
SNPs on chromosomes 3 and 5, we included those SNP genotypes as covariates in our
model. In other words, for chromosome 5 we consistently added as covariate the
genotype of SNP rs2112448 to the model.
Sequencing.
On the Illumina HumanRef-8 expression platform, three different probes measure
MCTP1 and one measures ITIH4 expression. Only one of the MCTP1 probes showed
significant associations with SNPs in cis, probe id ILMN_2499. We sequenced 12
different samples, 6 samples around and spanning the MCTP1 probe sequence
(ILMN_2499) and 6 samples spanning the ITIH4 probe sequence (ILMN_11142).
Samples were chosen from two groups: 3 showing highest and 3 showing lowest
expression patterns for each transcript.
Results
To test whether SNPs identified by any of six bipolar GWA studies we considered

83
here (12, 14-18) affected expression of physically nearby transcripts, i.e. in cis, we
analyzed expression data from postmortem human brain tissue and genotypes obtained
from the same set of subjects (see materials and methods for details). We used linear
regression analysis to test for association, while accounting for gender, age and diagnosis
as co-factors. These were chosen because our preliminary analysis (not shown)
determined that gender and age affected expression significantly, whereas diagnosis was
added as a precaution. Expression data were available from six brain regions: Anterior
Cingulate (ACG), Amygdala (AMY), Cerebellum (CB), Dorsolateral Prefrontal Cortex
(DLPFC), Hippocampus (HC), nucleus Accumbens (NAC). Data used for cis association
testing were all SNPs and all transcripts within 600Kb of target SNPs, which are those
that showed association in any of the BPD GWA studies with p-value 10-6 or less (Table
4.1). Not all SNPs and not all transcripts from every chromosomal region could be tested
due to limitations of either the genotyping or the expression technologies or both. For
example, for the MYO5B gene, the major target gene in region 18, no probe, and hence no
expression measures, was present on the Illumina HumRef-8 chips. Similarly, SNP
rs17418283 on chromosome 5, one of the top finding from Scott et al.(18), was not on
the genotyping panel, and only imputed data could be used to test for association with
this SNP.
We found many significant associations between SNPs and expression probes in
all six brain regions (Figure 4.1). The two most significant cis associations are with
MCTP1 and ITIH4 transcripts and are consistent across all six brain region we tested.
Figure 4.3 shows the changes in expression of MCTP1 gene with changes in genotype in
SNP rs2112448. Interestingly, this SNP-probe pair shows significant association in 4 out

84
of 6 brain regions (ACG p-value = 1.56*10-18 ; CB p-value = 4.5*10-15; DLPFC p-
value = 1.10*10-12 ; NAC p-value = 5.82*10-15 ) and the same trend, though not genome-
wide significant after multiple testing correction, in 2 additional brain regions (AMY p-
value = 6.98*10-4 ; HC p-value = 1.67*10-3 , Figure 4.3). Thus, different brain regions
provide confirmatory evidence, and we thus see no evidence for regional specificity
within the brain of this cis- association of the SNP with MCTP1 expression. SNPs
associated with ITIH4 transcript levels were the second most significant findings in AGC,
CB, DLPFC and NAC and were the most significant results in AMY and HC, passing the
multiple testing corrected p-value threshold in all 6 brain regions.
Because of LD between SNPs, many of the associations we found might be highly
correlated with each other. We therefore asked how many significant expression findings
will remain once the two strongest findings, between SNP rs2112448 and MCTP1-
expression and SNP rs17331151 and ITIH4–expression, are taken into account. We tested
regression again, this time placing these two SNPs into the regression model. Figure 4.2
illustrates the results of this analysis: Out of 10 chromosomal regions tested, all of
significant findings could be explained by SNPs in only these two LD blocks, around
MCTP1 and ITIH4 transcripts. Once these were taken into account, no other significant
association with expression remained.
It has previously been shown in our laboratory that SNP-probe associations could
arise as a result of an artifact, when either the SNP itself or another SNP in LD with the
one tested for association, is present in the probe sequence used to measure transcript
abundance (29). To determine whether this artifact may explain our data, we first
evaluated the region of the probes in dbSNP (30) and Ensembl (31), two databases with
85
SNP map information. No known SNP was found to map to the probe sequence. Since
only about half of the common human SNPs are known so far (32, 33), we also wanted to
ensure that no previously unknown SNP may have interfered with expression
measurements. We therefore chose 3 samples with the two types of homozygote
genotypes for the SNP and extreme expression differences for sequence analysis. After
PCR of the region around the probe and sequence analysis, none of the samples showed
any sequence variations. Therefore, we conclude that the cis associations on both
chromosomal regions 3 and 5 are not due to a confounding SNP on the expression probe.
The 10 regions tested for association with gene expression in cis were selected as
regions previously shown associated with bipolar disorder. We therefore next asked how
the gene expression association findings relate to the prior evidence for association with
bipolar disorder. The results are illustrated in Table 4.1: The most significant BPD-
associated SNPs are not associated with expression changes in genes in cis in the 6 brain
regions tested in the present study. Figure 4.4 further illustrates this point: the peak of the
GWAS bipolar associated SNPs (18) does not overlap with that of the SNP-expression
association peaks, i.e. the two sets of significant findings are different and independent.
Even though the top GWA studies SNPs were not associated with expression of
genes in cis, we asked further whether those SNPs that show association with expression
are affected or driven by the disease state, i.e. presence or absence of BPD. Figure 4.5
illustrates that this is not the case, i.e. the SNP-expression association is not driven by any
particular disorder or only present or absent in one sample group, but rather, the
association is seen across all 3 disorders and controls equally. Statistically, the disorder in
the regression analysis gave p values >0.15 for MCTP1 and ITIH4.

86
Although not all target genes and not all SNPs could be tested for expression due
to the expression and genotyping platform restrictions, our data suggest some additional
insight into possible target genes. In particular, a region on chromosome 3 identified by
our collaborators (Scott et. al.), is a large (>250 kb) LD block that contains 30 genes, all
of which have to be considered possible targets (Figure 4.6). Using only proximity to the
top GWA study SNP in that region, ITIH1 was the most likely primary target (18) .
However, our expression data indicate that this gene is not expressed at all in any of the
brain regions, making this gene an unlikely candidate. In contrast, we could identify 7
genes within the LD block that are clearly expressed in brain, including one, ITIH4, in
which we also saw association with expression, albeit not with the top GWAS SNP.
In summary, we identified candidate genes as expressed in brain near GWAS-
associated SNPs, and identified highly significant and consistent cis effects of SNPs on
expression of nearby genes. While these findings were in different SNPs than the most
significant GWAS findings, suggesting our findings on gene expression are independent
of those on association with BPD, they are highly significant. To better estimate the
genome-wide significance we carried out preliminary genome-wide cis analysis, using all
genotyped SNPs and all transcripts available in the dataset. We defined cis as within 600
Kb of the Illumina probe sequence. While this does not cover all possible cis
configurations, especially for genes longer than 600 Kb in length, this is in par with the
regions tested around GWAS SNPs. We find that out of ~2.5 million test genome-wide in
brain region ACG there are only 97 SNP-probe associations showing p-value <10-17.
These 97 associations represent results for only 31 unique transcripts, suggesting that the
two findings described in detail are among the top 50 findings genome-wide.

87
Discussion.
We began this study by asking whether gene expression from the most relevant
tissue can identify a functional effect of BPD-associated SNPs. Indeed, testing 40 genes
in 6 chromosomal regions and 2000 SNPs for cis association, we found a large number of
SNP- gene expression associations. However, none of these were between the SNPs
identified by GWA studies and gene expression. Taking into account two of the most
significant findings, association with MCTP1 and ITIH4 transcript levels, we find that
two SNPs near two different genes explain the majority of our findings. Figure 4.2
illustrates that the vast majority of the significant findings are accounted for by variations
at these two loci. We find that all other significant associations between allelic variants
and gene expression were with SNPs in LD with rs2112448 on chromosome 5 and
rs17331151 on chromosome 3.
In summary, although we find highly significant (p-value 10-14-10-18) associations
between SNPs and the expression of nearby genes in two out six chromosomal regions
that we tested, our results show that there is no apparent connection between the most
strongly BPD- associated SNPs and transcripts in cis. While disappointing, our result is
not unexpected. The effect size of GWAS SNPs is small, and only detectable in sample
sizes of several thousand. Just as BPD yielded fewer significant GWAS findings than
Type II diabetes (34), it may also be more difficult in this complex disorder to
convincingly move to the next step, the identification of the functional consequences of
these GWAS findings. Our data suggest that we have the power to identify cis
associations with expression, therefore further suggesting that such association between
the top GWA SNPs with expression in the six brain regions tested is unlikely. That does
88
not invalidate the SNPs brought into light by GWA studies, but may suggest that other
functional consequences (effect on microRNAs or other small RNAs, effects on splicing,
existence of previously unknown transcripts in the area) need to be considered as possible
consequences of the most significant GWAS findings. However, since the GWA findings
were typically only barely genome-wide significant (p=10-6-10-8), in contrast to type II
diabetes where the top GWA SNPs show association p values of <10-35, some of the SNPs
we analyzed may thus be false positives, and would not be expected to have any
functional consequences.
Although not directly relevant for GWA studies of BPD, our finding of two
different SNP-gene expression associations, with MCTP1 and ITIH4, are robust and very
likely true findings. The p-values (<10-18) are statistically significant even after the most
stringent multiple testing corrections, and were consistent across all brain regions tested.
In addition, a possible confounding factor, the presence of unknown SNPs on the
expression probe, was excluded by sequence analysis. We also find that preliminary
genome-wide cis analysis places our findings at the top 15% of unique cis associations
found in brain regions tested. Although several genome-wide association studies between
SNPs and gene expression have previously been published (35, 36), our findings of
association in brain have not been previously reported and are novel. More in-depth
analyses of genome-wide cis as well as trans expression-SNP association studies, testing
effects of SNPs not only on nearby genes but on all other genes, similar to the experiments
outlined in chapters 2 and 3 for Mendelian disorders in mouse are currently in progress.

89
Figure 4.1. Significant association between SNPs and transcripts in cis seen in all 6 brain regions tested. y-axis shows he distribution of –log10 of p-value for the genotype covariate; while x-axis shows the –log10 of the expected distribution.

90
Figure 4.2. Top cis associations are due to SNPs in LD with each other in regions on chromosome 3 and 5. qq-plot of –log10 p-values for genotype covariate before and after accounting for top two findings. a) results from the original analysis; b) results after accounting for genotype of rs2112448 on chromosome 5 and rs17331141 on chromosome 3
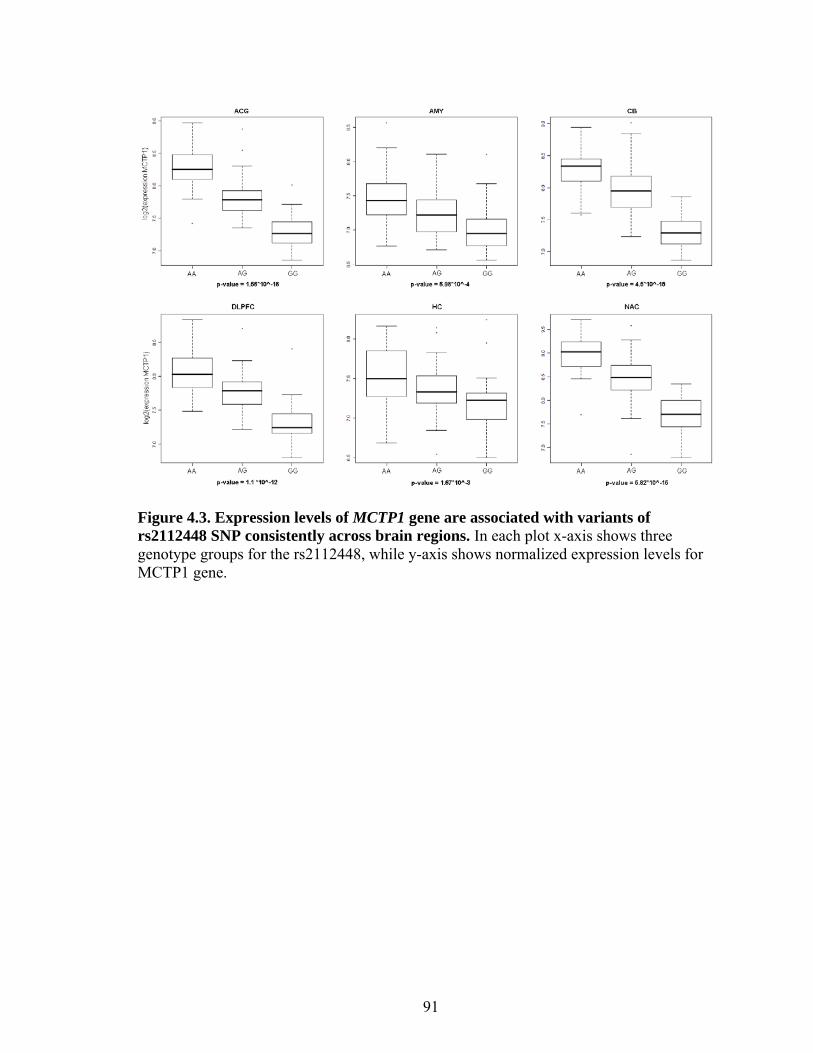
91
Figure 4.3. Expression levels of MCTP1 gene are associated with variants of rs2112448 SNP consistently across brain regions. In each plot x-axis shows three genotype groups for the rs2112448, while y-axis shows normalized expression levels for MCTP1 gene.

92
Figure 4.4. Bipolar GWAS association p-values peak does not overlap with SNP-expression p-values peak. Top panel adopted from Scott L.J. et at. (18) and shows plot of –log10 p-values for association from the meta-analysis for region on chromosome 5 refFLAT annotated genes are shown below the plot. Bottom panel shows –log10 p-values of SNPs – MCTP1 associations in the same chromosomal region, in brain region ACG.

93
Figure 4.5. Association between MCTP1 and rs211448 is replicated in all disorders sampled in this study. Red – subjects with Bipolar Disorder; Blue – subjects with Major Depressive Disorder; green – subjects with Schizophrenia, black – Control subjects

94
Figure 4.6. Plot of –log10 p-values for BP GWA study meta-analysis for region on chromosome3. refFLAT annotated genes are shown below the plot. Adopted from Scot et.al. (18)
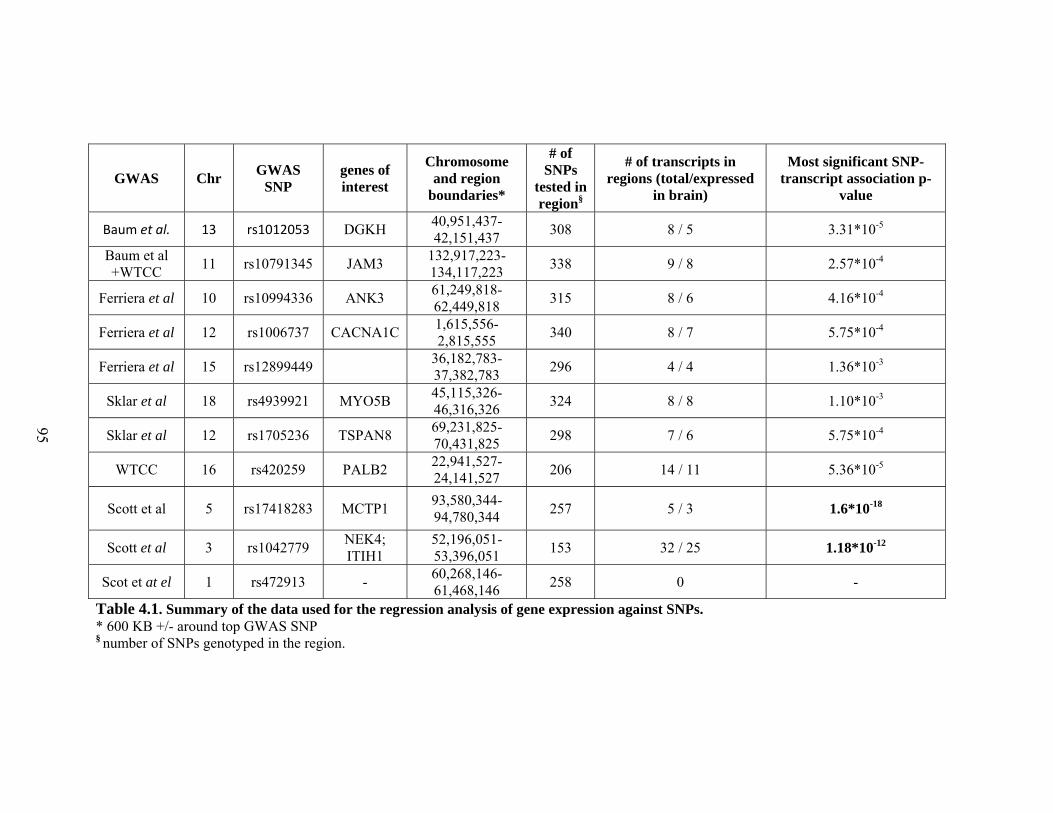
95
GWAS Chr GWAS SNP
genes of interest
Chromosome and region
boundaries*
# of SNPs
tested in region§
# of transcripts in regions (total/expressed
in brain)
Most significant SNP-transcript association p-
value
Baum et al. 13 rs1012053 DGKH 40,951,437-42,151,437 308 8 / 5 3.31*10-5
Baum et al +WTCC 11 rs10791345 JAM3 132,917,223-
134,117,223 338 9 / 8 2.57*10-4
Ferriera et al 10 rs10994336 ANK3 61,249,818-62,449,818 315 8 / 6 4.16*10-4
Ferriera et al 12 rs1006737 CACNA1C 1,615,556-2,815,555 340 8 / 7 5.75*10-4
Ferriera et al 15 rs12899449 36,182,783-37,382,783 296 4 / 4 1.36*10-3
Sklar et al 18 rs4939921 MYO5B 45,115,326-46,316,326 324 8 / 8 1.10*10-3
Sklar et al 12 rs1705236 TSPAN8 69,231,825-70,431,825 298 7 / 6 5.75*10-4
WTCC 16 rs420259 PALB2 22,941,527-24,141,527 206 14 / 11 5.36*10-5
Scott et al 5 rs17418283 MCTP1 93,580,344-94,780,344 257 5 / 3 1.6*10-18
Scott et al 3 rs1042779 NEK4; ITIH1
52,196,051-53,396,051 153 32 / 25 1.18*10-12
Scot et at el 1 rs472913 - 60,268,146-61,468,146 258 0 -
Table 4.1. Summary of the data used for the regression analysis of gene expression against SNPs. * 600 KB +/- around top GWAS SNP § number of SNPs genotyped in the region.

96
References.
1 Lesch, K.P. (2004) Gene-environment interaction and the genetics of depression. J Psychiatry Neurosci, 29, 174-184.
2 Doria, A., Patti, M.E. and Kahn, C.R. (2008) The emerging genetic architecture of type 2 diabetes. Cell Metab, 8, 186-200.
3 Stephens, J.W., Bain, S.C. and Humphries, S.E. (2008) Gene-environment interaction and oxidative stress in cardiovascular disease. Atherosclerosis, 200, 229-238.
4 Waraich, P., Goldner, E.M., Somers, J.M. and Hsu, L. (2004) Prevalence and incidence studies of mood disorders: a systematic review of the literature. Can J Psychiatry, 49, 124-138.
5 Weissman, M.M., Bland, R.C., Canino, G.J., Faravelli, C., Greenwald, S., Hwu, H.G., Joyce, P.R., Karam, E.G., Lee, C.K., Lellouch, J. et al. (1996) Cross-national epidemiology of major depression and bipolar disorder. JAMA, 276, 293-299.
6 Kieseppa, T., Partonen, T., Haukka, J., Kaprio, J. and Lonnqvist, J. (2004) High concordance of bipolar I disorder in a nationwide sample of twins. Am J Psychiatry, 161, 1814-1821.
7 McGuffin, P., Rijsdijk, F., Andrew, M., Sham, P., Katz, R. and Cardno, A. (2003) The heritability of bipolar affective disorder and the genetic relationship to unipolar depression. Arch Gen Psychiatry, 60, 497-502.
8 Braun, C.M., Daigneault, R., Gaudelet, S. and Guimond, A. (2008) Diagnostic and Statistical Manual of Mental Disorders, Fourth Edition symptoms of mania: which one(s) result(s) more often from right than left hemisphere lesions? Compr Psychiatry, 49, 441-459.
9 Burmeister, M., McInnis, M.G. and Zollner, S. (2008) Psychiatric genetics: progress amid controversy. Nat Rev Genet, 9, 527-540.
10 Craddock, N. and Sklar, P. (2009) Genetics of bipolar disorder: successful start to a long journey. Trends Genet, 25, 99-105.
11 McCarthy, M.I., Abecasis, G.R., Cardon, L.R., Goldstein, D.B., Little, J., Ioannidis, J.P. and Hirschhorn, J.N. (2008) Genome-wide association studies for complex traits: consensus, uncertainty and challenges. Nat Rev Genet, 9, 356-369.
12 WTCC (2007) Genome-wide association study of 14,000 cases of seven common diseases and 3,000 shared controls. Nature, 447, 661-678.
13 Hindorff LA, J.H., Mehta JP and Manolio TA (2008), In Available at: www.genome.gov/26525384., Vol. 2009.
14 Baum, A.E., Akula, N., Cabanero, M., Cardona, I., Corona, W., Klemens, B.,

97
Schulze, T.G., Cichon, S., Rietschel, M., Nothen, M.M. et al. (2008) A genome-wide association study implicates diacylglycerol kinase eta (DGKH) and several other genes in the etiology of bipolar disorder. Mol Psychiatry, 13, 197-207.
15 Sklar, P., Smoller, J.W., Fan, J., Ferreira, M.A., Perlis, R.H., Chambert, K., Nimgaonkar, V.L., McQueen, M.B., Faraone, S.V., Kirby, A. et al. (2008) Whole-genome association study of bipolar disorder. Mol Psychiatry, 13, 558-569.
16 Baum, A.E., Hamshere, M., Green, E., Cichon, S., Rietschel, M., Noethen, M.M., Craddock, N. and McMahon, F.J. (2008) Meta-analysis of two genome-wide association studies of bipolar disorder reveals important points of agreement. Mol Psychiatry, 13, 466-467.
17 Ferreira, M.A., O'Donovan, M.C., Meng, Y.A., Jones, I.R., Ruderfer, D.M., Jones, L., Fan, J., Kirov, G., Perlis, R.H., Green, E.K. et al. (2008) Collaborative genome-wide association analysis supports a role for ANK3 and CACNA1C in bipolar disorder. Nat Genet, 40, 1056-1058.
18 Scott, L.J., Muglia, P., Kong, X.Q., Guan, W., Flickinger, M., Upmanyu, R., Tozzi, F., Li, J.Z., Burmeister, M., Absher, D. et al. (2009) Genome-wide association and meta-analysis of bipolar disorder in individuals of European ancestry. Proc Natl Acad Sci U S A, 106, 7501-7506.
19 (2009) A framework for interpreting genome-wide association studies of psychiatric disorders. Mol Psychiatry, 14, 10-17.
20 Le-Niculescu, H., McFarland, M.J., Mamidipalli, S., Ogden, C.A., Kuczenski, R., Kurian, S.M., Salomon, D.R., Tsuang, M.T., Nurnberger, J.I., Jr. and Niculescu, A.B. (2007) Convergent Functional Genomics of bipolar disorder: from animal model pharmacogenomics to human genetics and biomarkers. Neurosci Biobehav Rev, 31, 897-903.
21 Torkamani, A., Topol, E.J. and Schork, N.J. (2008) Pathway analysis of seven common diseases assessed by genome-wide association. Genomics, 92, 265-272.
22 Moffatt, M.F., Kabesch, M., Liang, L., Dixon, A.L., Strachan, D., Heath, S., Depner, M., von Berg, A., Bufe, A., Rietschel, E. et al. (2007) Genetic variants regulating ORMDL3 expression contribute to the risk of childhood asthma. Nature, 448, 470-473.
23 Chen, R., Morgan, A.A., Dudley, J., Deshpande, T., Li, L., Kodama, K., Chiang, A.P. and Butte, A.J. (2008) FitSNPs: highly differentially expressed genes are more likely to have variants associated with disease. Genome Biol, 9, R170.
24 Edgar, R., Domrachev, M. and Lash, A.E. (2002) Gene Expression Omnibus: NCBI gene expression and hybridization array data repository. Nucleic Acids Res, 30, 207-210.
25 Barrett, T., Troup, D.B., Wilhite, S.E., Ledoux, P., Rudnev, D., Evangelista, C., Kim, I.F., Soboleva, A., Tomashevsky, M. and Edgar, R. (2007) NCBI GEO: mining tens of millions of expression profiles--database and tools update. Nucleic Acids Res, 35, D760-765.

98
26 Mohyuddin, A., Ayub, Q., Siddiqi, S., Carvalho-Silva, D.R., Mazhar, K., Rehman, S., Firasat, S., Dar, A., Tyler-Smith, C. and Mehdi, S.Q. (2004) Genetic instability in EBV-transformed lymphoblastoid cell lines. Biochim Biophys Acta, 1670, 81-83.
27 Team, R.D.C. (2009) Computing, R.F.f.S. (ed.), Vienna, Austria.
28 Gentleman, R.C., Carey, V.J., Bates, D.M., Bolstad, B., Dettling, M., Dudoit, S., Ellis, B., Gautier, L., Ge, Y., Gentry, J. et al. (2004) Bioconductor: open software development for computational biology and bioinformatics. Genome Biol, 5, R80.
29 Sliwerska, E., Meng, F., Speed, T.P., Jones, E.G., Bunney, W.E., Akil, H., Watson, S.J. and Burmeister, M. (2007) SNPs on chips: the hidden genetic code in expression arrays. Biol Psychiatry, 61, 13-16.
30 Sherry, S.T., Ward, M.H., Kholodov, M., Baker, J., Phan, L., Smigielski, E.M. and Sirotkin, K. (2001) dbSNP: the NCBI database of genetic variation. Nucleic Acids Res, 29, 308-311.
31 Birney, E., Andrews, T.D., Bevan, P., Caccamo, M., Chen, Y., Clarke, L., Coates, G., Cuff, J., Curwen, V., Cutts, T. et al. (2004) An overview of Ensembl. Genome Res, 14, 925-928.
32 Bentley, D.R., Balasubramanian, S., Swerdlow, H.P., Smith, G.P., Milton, J., Brown, C.G., Hall, K.P., Evers, D.J., Barnes, C.L., Bignell, H.R. et al. (2008) Accurate whole human genome sequencing using reversible terminator chemistry. Nature, 456, 53-59.
33 Wang, J., Wang, W., Li, R., Li, Y., Tian, G., Goodman, L., Fan, W., Zhang, J., Li, J., Guo, Y. et al. (2008) The diploid genome sequence of an Asian individual. Nature, 456, 60-65.
34 McCarthy, M.I. and Zeggini, E. (2009) Genome-wide association studies in type 2 diabetes. Curr Diab Rep, 9, 164-171.
35 Stranger, B.E., Nica, A.C., Forrest, M.S., Dimas, A., Bird, C.P., Beazley, C., Ingle, C.E., Dunning, M., Flicek, P., Koller, D. et al. (2007) Population genomics of human gene expression. Nat Genet, 39, 1217-1224.
36 Myers, A.J., Gibbs, J.R., Webster, J.A., Rohrer, K., Zhao, A., Marlowe, L., Kaleem, M., Leung, D., Bryden, L., Nath, P. et al. (2007) A survey of genetic human cortical gene expression. Nat Genet, 39, 1494-1499.

99
CHAPTER V
DISCUSSION
Gene expression microarrays were developed in the 1990’s to allow genome-wide
evaluation of expression levels of all known genes. Since their inception and first
publications (1-3), they have become an indispensible tool in biomedical science (4, 5).
Genome-wide expression analyses have since helped to illuminate the mechanism and
consequence of a large number of conditions and diseases in model organisms as well as
humans (6-8), with particularly notable advancements in cancer research and yeast
genetics (9-11). Microarray experiments usually compare whole genome expression
profiles under two or more biological conditions in various tissues and cell culture. These
can be cancer/normal tissue of the same person, mutant versus normal tissues from
human subjects or animal models, or cells treated with drugs or environmental
challenges. In a typical experiment expression profiles are compared between two groups
of samples for each transcript individually. In general, a well designed experiment results
in a list of hundreds or even thousands of transcripts that are differentially expressed.
Bioinformatics tools are then used to interrogate these lists to identify biological
pathways or specific cellular components particularly enriched among the differentially
expressed genes.

100
During my thesis work, I have used microarray technology to profile gene
expression changes in brain tissue in two different mouse models with two different
central nervous system (CNS) disorders. I have also analyzed existing gene expression
data from postmortem brain tissue isolated from human subjects. Expression studies in
the CNS present a number of challenges due to the heterogeneous and complex nature of
the tissue, making such studies more difficult than most studies of cancer or comparisons
of treated/untreated cultured cells. My work thus also suggests that the standards and
threshold typically used in microarray data analysis may need to be modified in view of
the complexity of the brain, and that new bioinformatic tools to combine microarray data
with other types of information might be useful to develop in the future. In this chapter, I
review some of the technical challenges facing researchers doing brain microarray
research, summarize our findings in light of these challenges and suggest future
directions.
Genetic heterogeneity of the disease.
The first two data chapters of my thesis describe our investigations of two mouse
models with ataxic disorders. We used microarray gene expression analysis to place an
uncharacterized Atcayswd/swd mutation into a functional context, namely disruption of
glutamate signaling between two types of cerebellar neurons. Furthermore, we found
evidence of downregulation in Atcayswd/swd of another gene, Car8, a mutation that is also
associated with ataxia and dystonia, both in mice (waddles) (12) and in humans (ataxia
with mild mental retardation and predisposition to quadrupedal gait) (13). Our studies
implicate dysregulation in Purkinje cell signaling and signal transduction in both mutants,
but with largely non-overlapping gene sets. Purkinje cells are highly specialized neurons

101
found only in the cerebellar cortex. Figure 5.1 illustrates the basic circuitry of the
cerebellar cortex, showing that input is received via mossy fibers, which relay the signal
via granule cells and parallel fibers, as well as climbing fibers (CF). Signals from CFs
and PFs then converge onto PCs, which subsequently provide the sole output from the
cerebellar cortex. The PF-PC synapse is the area where the majority of the changes we
observed in sidewinder and some of those observed in waddles mutants occur. Other
mutations in the genes at this synapse were already known to lead to other forms of ataxia
in animals and humans (Figure 2.2 in Chapter II). While all of these mutations fall under
a broad category of ataxia, each can be further distinguished by additional phenotypic
features. For example, patients with Cayman ataxia disorder have a characteristic
combination of hypotonia, nystagmus and non-progressive cerebellar dysfunction and
psychomotor retardation (14). It is this unique collection of identifiable phenotypic
features as well as the geographic isolation that allowed clinicians to sub-classify this
type of ataxia. Successful identification of genetic causes of the disorder depends greatly
on the ability to select a correct subset of mutation carriers from all those with other types
of ataxia.
This is in contrast to complex disorders, such as BPD, where phenotypic
heterogeneity and underlying genetic heterogeneity is not as easily identifiable, but might
nevertheless exist. In fact, while many attempts have been made to identify genetic, i.e.
familial, subtypes of Bipolar Disorder (15), collaborators in our laboratory have found
that most of such subtypes are diagnosed in a biased fashion by different clinical centers
(16), making the use of subtyping for genetic studies extremely difficult and not reliable.
It is possible that, just as in case of ataxias, mutations at different loci lead to a disease

102
phenotype known collectively as BPD, but that is has many different etiologies. In
addition, just as in the case of subsets of ataxias, different molecular causes may
converge on some signaling pathway somewhere in brain circuitry, leading to the BPD
phenotype. However, unlike in ataxias, where different molecular causes also result in
different, distinguishable phenotypes and therefore allow for investigations of each
separately, BPD cases with different molecular causes are indistinguishable
phenotypically. The high heritability of BPD (17, 18) suggests a high probability of the
existence of genetic components. However, if the majority of subjects with BPD have
mutations at different loci, pooling those cases together and studying them in large
numbers, as is done in Genome Wide Association (GWA) studies will dilute the signal
we are looking for and will make identification of most of the mutated loci impossible.
GWA studies operate under the assumption that most common disorders are caused by a
limited number of common variants, each with small effect size (19). Under the
alternative hypothesis, common disorders, like many common Mendelian disorders
exemplified by ataxia, but also by deafness or retinitis pigmentosa, are caused by a large
number of rare mutations in a large number of genes. Some have argued that this may
indeed be the case for common complex disorders as well (20). This possibility would
explain why the identification of BPD susceptibility loci has been so difficult. In Chapter
IV we detailed our follow-up investigations on SNP variants suspected to be associated
with BPD based on several GWA studies. While we were clearly able to identify SNPs
that were unequivocally associated with expression, validating out technique and power
to detect expression-associated SNPs, we could not identify transcriptional repercussions
of the GWA studies SNPs in the brain at the transcriptional level. Our lack of finding

103
association between any of the top GWAS-associated SNPs and transcription levels of
nearby genes leaves open other options: the SNPs could have other functional
repercussions, they might be associated with different splice variants not differentiated in
microarrays, there could be an effect of these SNPs on miRNAs or on epigenetic
regulation. Nevertheless, a clear other possibility remains that most of the GWAS
findings we started out with may have been false positives. In fact, while I was analyzing
the SNPs reported here, a meta analysis combining virtually all previous BPD GWA
studies confirmed only one of these loci, namely the SNPs near the ANK3 gene on
chromosome 10 (Scott et al, 2009, in preparation). This suggests that additional
confirmation is needed for other possible BPD susceptibility variants before carrying out
follow-up studies.
Although the studies described in this thesis answer very different biological
questions, I encountered some common challenges and obstacles, some technical, some
biological, which I talk about in detail next.
Heterogeneity of the brain
The human brain contains approximately 100 billion neurons and an estimated 10
times that number of glial cells (21). Glial cells are non-neuronal cell types that provide
support and nutrition to neurons and include astrocytes, oligodendrocytes and microglia
(21). In the last two decades, several groups attempted to estimate the number of neuronal
and non-neuronal cell types in the human brain (22, 23). Such studies showed that even
looking at something as simple as the cellular composition of the brain, we find great
regional heterogeneity. For example, the cerebral cortex, which constitutes 82% of the

104
total brain mass, contains only 19% of all brain neurons and 72% of non-neuronal cells,
while the cerebellum, which constitutes only 10% of the total brain mass, contained 80%
of neurons and 19% non-neuronal cell types (22). While other studies (22, 23) show that
these estimates vary by age, gender and are affected by technique used to investigate,
they highlight the fact that neuronal content and nature strongly depends on the specific
brain region in question.
Neurons and glia are the most general descriptors for the cellular types that make
up the brain tissue. Each can be further subdivided into a multitude of different subtypes.
For example, cerebellar neurons may refer to granule, unipolar brush, Golgi, basket,
stellate, and Purkinje cells, or to mossy or climbing fibers. Each cell type is highly
specialized and carries out specific sets of functions within brain region. On a
transcriptional level, this specialization is translated into a specific subset of genes being
expressed in each cell type.
It is this heterogeneity of the cellular and molecular composition of human and
other mammalian brain tissue that poses particular challenges for whole genome
transcriptional studies. Whole genome expression level measures are usually derived
from mRNA extracted from homogenate of cells from a brain or brain region. However,
the transcriptional level of genes changes from cell type to cell type. Any signal only
present in one cell type of the homogenate is therefore greatly diluted by the presence of
other transcripts from the other cell types. For example, Purkinje cells, one of the key
players in cerebellar function, make up only 3% of all cerebellar neurons (24).Therefore,
differentiating the true signal from one particular cell type, such as from Purkinje cells,
from the background noise becomes more difficult with increased complexity of the

105
tissue tested. This point was elegantly demonstrated by comparing the number of
differentially expressed genes of three different microarray experiments performed on
tissues with increasing complexity, all using the same analytical strategy: 100% of genes
found differentially expressed in a mouse cell line could be confirmed by qRT-PCR, but
only 75% of such genes in mouse hypothalamus, and only 43% of genes in mouse cortex
(25). This study also illustrates the much reduced magnitude of changes typically
observed in brain microarray experiments compared to, for instance, cancer research,
where any change less than 2 fold is often discarded, yet still hundreds of differentially
expressed genes are identified. In contrast, the qRT-PCR-confirmed transcriptional
changes in mouse hypothalamus and cortex, were between 1.3 and 2.3 fold, with only a
single gene passing a 2-fold threshold (25).
We made similar observations, as outlined in Chapters II and III, where I describe
the results of two whole genome microarray studies using two mouse models of ataxia
and dystonia. In one case we considered both whole brain and cerebellum while in the
second case cerebellum gene expression only. In all experiments very few genes were
found to be > 2 fold differentially expressed. In addition, when applying traditional
analysis and FDR thresholds, few transcripts were significantly differentially expressed.
Nevertheless, relaxing FDR threshold criteria allowed identification of additional
differentially expressed transcripts, which were subsequently confirmed in 8 out of 10
genes by qRT-PCR. Thus, relaxing of thresholds was indeed a sensible approach. How to
balance type I and type II errors, i.e. between being overwhelmed by false positives on
one hand, and missing the most important but subtle changes by using too stringent
thresholds, remains a challenge in analyzing microarray experiments of complex tissues

106
such as the brain. One obvious approach is to increase sample size, which in the case of
mouse are largely only limited by funds. Another approach, that we used here, is to be
fairly generous in the initial stages, and to use qRT-PCR as a secondary confirmation.
This, however, does not guard against sampling heterogeneity issues which I will discuss
next.
Sample and tissue sampling heterogeneity issues.
In Chapters II and III of this thesis, we used brain tissue from two different mouse
models of ataxic disorders to investigate downstream effects of specific mutations in the
brain. Our experimental design in both cases included careful matching of control
animals with those carrying mutations by gender and age, with each pair of matched
animals coming from the same litter. This matching allowed us to control for biological
factors known to contribute to variations in gene expression of some genes but not of
interest to our study. Without this matching, by simply comparing groups, fewer results
were obtained, and positive controls were not always correctly identified, demonstrating
the importance of carefully matching controls by age, birth cohort and gender, allowing a
more sensitive paired t-test in the analysis. On the other hand, such extensive matching is
largely only possible when dealing with animal models. In addition, it restricts the
number of samples available for testing.
In contrast to animal models, currently postmortem brain samples are the only
source for human brain tissue. Various brain banks have been set up over the years,
collecting samples from patients with specific disorders and their matched controls from
general population (26-31). While these controls can be matched by age and gender,

107
many additional confounds, for example genetic background, cannot be matched when
dealing with human tissues. In fact, our collaborator Jun Li as well as others
demonstrated that one important factor, the pre-mortem agony subjects were in before
dying, plays a more important role than age or gender or disease status in terms of gene
expression (32, 33). The fact that many control subjects died a slow, prolonged death,
whereas many subjects with bipolar disorder died a relatively sudden death due to
accidents or gunshots, illustrates that there may be, consequently, unrecognized
confounding factors that may need to be matched. Not recognizing confounds can lead to
both type I errors (if the controls and cases are mismatched by an important confound) or
type II errors (by introducing unaccounted for variability),
Work described in Chapter IV was possible due to such efforts by many members
of Pritzker Neuropsychiatric Disorders Consortium, who have organized collection of
such valuable material from patients with Bipolar and Major Depressive disorders,
Schizophrenia and controls (http://www.pritzkerneuropsych.org/about/overview.htm
#brainbank).
Due to the practical limitations of dealing with human sample collection, it is not
possible to perform the same stringent age, sex and background matching of human brain
samples as I found to be so important in the mouse. To some extent, this deficiency was
compensated by using a much larger sample size. In addition, whole genome gene
expression studies using human postmortem brain samples revealed the need for
additional important selection criteria such as for example postmortem interval (PMI) or
agonal state (33-37). Because the gene expression changes that many of these studies are
trying to identify are small, other biological factors, such as pH of the brain sample,

108
become an important limitation or confound. Tissue pH affects mRNA stability and
therefore samples with pH outside a certain range, approximately between 6.1 and 7 (38),
contain partially degraded mRNAs making them useless for expression studies (39, 40).
RNA quality can also be affected by post mortem interval (PMI), with shorter PMI
associated with better RNA quality (40). Another very important factor known to affect
both RNA quality and transcription levels of a large number of genes is the agonal state,
which contrasts slow, long death with pain and multiple organ failure as one extreme
with a quick death, for example by gun shot or accident (32, 33, 39). In our own study
using human brain samples, described in Chapter IV, all of these factors were taken into
consideration before analysis of the expression experiments.
Another crucial factor that may affect the quality of the results of an experiment
using brain tissue is the proper dissection of the brain regions. Since the different
neuronal and glial cell types are distributed quite differently in the regions of the brain
(22), and express different sets of genes, differences in dissection between samples are
expected to, in the best case, contribute to noise, in the worst case lead to false positive
associations with disease. Dissection may or may not be a major issue depending on the
level of precision required for a particular study, and on the region of interest. For
example, the mammalian cerebellum is anatomically distinct, fairly large, and can easily
be identified and dissected, requiring little expertise. However, the cerebellum consists of
several distinct layers that are characterized by combinations of different neuronal and
glial cells. Compared to the cerebellum, identification and dissection of other brain
regions requires significant additional expertise for precise realization. Some brain
regions, such as several nuclei, or the hippocampus, have significant microarchitecture,

109
with many different cell types expressing different types of genes in very close proximity,
making it difficult to dissect consistent regions. Recently, Laser Capture Microdissection
(LCM) has been developed to assure the required precision to capture very defined small
regions (41). Using this method, the region from which RNA is isolated is identified and
captured under the microscope on small tissue slices. It can be combined with in-situ
hybridization, which is performed on adjacent slice sections to guide the identification of
specific regions (42).
The nature of our experiments using mice did not require any specialized
dissection procedures. Tissue quality was assured by flash freezing brain and cerebellar
samples shortly after extraction. In contrast, the expression experiments using human
postmortem tissue dissections were carried out by highly skilled neuroanatomists. In
addition, many precautions in dissection and choice of brains with low agonal factor and
pH ranging between 6.3 and 7.25 were taken to allow the best possible outcome.
Technical and bioinformatics challenges associated with microarray data processing
and interpretation.
For all work in this thesis we used oligonucleotide microarray platforms from two
leading manufacturers, Affymetrix and Illumina. In general, oligo arrays consist of
probes, which are short nucleotide sequences designed to match known or predicted
genes, deposited onto a substrate. Fluorescently labeled cRNA from samples are then
hybridized producing a signal where probe-sample transcript matched. Scanners are then
used to detect the fluorescence emission signals, which are converted into relative
amount of each transcript being detected.

110
The Illumina and Affymetrix platforms are very different in design. The most
fundamental difference is in the way transcripts are being measured. Since I used both
types of array technology in some otherwise identically designed experiments, I could
also compare the results from the different technologies. While not a key aim of my
work, some observations can be made from my data. Affymetrix technology uses a set of
22 probes, each 25 nucleotide long, to measure expression of a single transcript. Eleven
of these probes were designed to be a perfect match to each transcript in question, while
the other eleven are the same oligos, but with a single, centrally placed mismatch
nucleotide, thus allowing measurement of non-specific hybridization. Each probeset is
meant to be representative of a different transcript, and assignment of each probe to a
probeset is recorded in the Chip Definition file (CDF) available from the manufacturer
website ( www.affymetrix.com ). Probe sequences for each probeset were originally
designed based on sequence information available in publicly available databases.
Unfortunately, the contents of these data bases are being constantly refined and redefined,
making some of the previously available information outdated on an almost a daily basis.
As described in Chapter II, for our analyses of Affymetrix data we used instead custom
CDF files, which redefine each probeset membership based on more recent gene
sequence information
(http://brainarray.mbni.med.umich.edu/Brainarray/Database/CustomCDF/genomic_
curated_CDF.asp ) (43). As described by Dai et al (43), custom CDF files were
constructed by BLASTing all Affymetrix probe sequences for each platform (human,
mouse, etc.) against various databases, such as RefSeq, UniGene, etc., followed by
filtering out probes that either did not have perfect match or had multiple perfect matches

111
to different chromosomal loci. Probesets were then defined based on matches that
remained after filtering (43). This procedure resulted in some probe sequences, and thus
hybridization measures, being discarded completely. Custom CDF files also are
periodically updated in order to incorporate the changing nature of the databases that are
used to construct them. For our analyses of Affymetrix data, Chapter II, we chose CDF
files that use RefSeq as the annotation base, because these reference sequences are one of
the more stable databases. Unfortunately, this choice also had a drawback. The original
design of the chip type we used for our experiments in Chapter II, called Affymetrix
Mouse Whole Genome 430 2.0 GeneChip, allowed measuring about 45,000 transcripts.
Remapping these probesets against RefSeq database limited this number to 25,000
transcripts. This is due to two factors: First, some genes no longer are covered by well
defined probes based on the above criteria, and thus are lost for analysis. Second, and
more importantly, the original 45,000 transcripts included many probesets that queried
different parts of the same transcripts. For example, the Affymetrix CDF file includes 3
probesets for the Atcay gene. Interestingly, a closer look at the Affymetrix Atcay
probesets showed that some of the Atcay probes do not align with the Atcay gene
sequence, demonstrating that the CDF correction measures were indeed necessary. On
the one hand, some criteria for the creation of custom CDF files may be too stringent, and
some loss of information may occur. On the other hand, this high stringency gives us
additional assurance that the actual measures we observe are more likely true.
Unlike Affymetrix, Illumina technology makes use of a single 50-mer probe to
measure each transcript. The greater length of the probe improves hybridization
reliability and increases the likelihood that the oligo sequence is unique in the genome.

112
However, just as in the case of Affymetrix probes, Illumina relies on sequence data
information from various sources that are still evolving. Illumina provides periodic
updates (version releases) of the manifest files which define probe-gene mapping.
The ever changing annotation issue means that no microarray data analysis can
ever be truly finalized and may need to be reconsidered periodically. The task of
reconsidering results of the Affymetrix experiment would mean completely redoing the
entire analysis top to bottom because the probeset definition is one of the first steps in the
analysis. Possible changes of the landscape of the results due to annotation was one of the
issues we considered when comparing our results with those of the rat experiment carried
out by a different group using Affymetrix platform (44). Re-annotation of the rat dataset
using custom CDF files did not change the overall landscape of the results. However,
some specific cases of genes that were found to be differentially expressed in the original
analysis, but were not confirmed by qRT-PCR, were not identified after re-annotation and
re-analysis, suggesting that the later re-annotation may have guarded against at least
some false positive findings.
For Illumina arrays, the task of re-annotation is much simpler. Because of the one
probe- one transcript design, statistical comparison of the sample groups would not have
to be repeated. All that might change is the annotation, i.e. the fact that 5th or 105th gene
on the list of differentially expressed genes is not the transcript we thought it was.
When planning a microarray experiment, of course one question that always
arises is which platform, of those currently available on the market, should be used. Over
the years, as microarray technology continued to evolve, questions of reliability and

113
reproducibility of various platforms have been voiced by many researches. Given the
impact of this technology on biomedical research, a group, called MicroArray Quality
Consortium (MAQC), have been assigned with the task of addressing these concerns. In a
series of landmark publications in 2006, MAQC have come to a conclusion that there is
“... a high level of interplatform concordance in terms of genes identified as differentially
expressed” (45). These findings confirm previous, smaller scale studies (46). Why then
did we find largely non-overlapping genes in our experiments using both platforms? The
seeming discrepancy lies in the nature of the comparisons. Studies aimed at comparing
different platforms typically first identify lists of transcripts being detected by both/all
platforms and then carry out the comparison of the platforms on that dataset. By contrast,
our main focus was on identification of downstream target genes, and thus we carried out
data analysis using all transcripts for each platform independently, then compared the
findings from both sets of experiments. Overall, there are only 8404 transcripts that are
detected in both Illumina and Affymetrix cerebellum experiments, which make up 83%
of all Affymetrix detected transcripts but only 30% of those detected by Illumina. Thus
discordance among results can be at three different levels: whether probes for a given
gene on one platform exist on the other platform, whether the probes detect the gene
above background, and lastly whether there are differences in level between the two
experimental conditions. Many of the discordant results between the lists of differentially
expressed genes in the two platforms turned out to be due differences in genes called
expressed in the first place, not due to differences in whether or not they are differentially
expressed. For example, out if 58 transcripts shown in Table 2.1, 26, or 45%, were

114
scored as undetected by the Illumina platform, but showed consistent results in both
Affymetrix experiments.
Thus, we conclude that Illumina and Affymetrix array analyses lead to largely
complementary results. A subset of results from both platforms could be confirmed by
qRT-PCR, and both analyses pointed often to similar pathways, suggesting that neither
platform completely captures all genes, but that they are complementary, neither
detecting a complete set of all differentially expressed genes
Confounding of expression results with genotypes.
Another challenge of interpreting expression results is the possible presence of
single nucleotide polymorphisms (SNPs) on chips (43, 47). This issue is particularly
pertinent to human expression data because samples are unrelated and thus the presence
or absence of a SNP differs between samples, in contrast to animal models where the
background is usually matched. When probe sequences contain a SNP, the SNP may
interfere with proper probe-to-sample hybridization in samples containing the alternate
allele, and therefore produce false differential expression results (47). This point is
particularly important when the SNPs are common and thus affect a large number of
samples, and when the test of association is with SNPs in linkage disequilibrium with the
SNPs on the probe, since the samples are then effectively stratified by genotype (47). To
partially address this problem, one can identify probes that contain a common SNP and
discard them from the analysis or consider them as a separate group. This, however, leads
to elimination of some genes from analysis. It would also not solve the issue completely,

115
since not all common SNP variants in the human genome are known yet – a recent
sequencing effort identified numerous new common SNPs and estimated that only half of
common SNPs are known (48, 49) - so filtering of all SNP containing probes is simply
not possible. In Chapter IV we describe another solution in addition to filtering by known
SNP. In order to ensure our highly significant findings were not due to a “SNP on chip”
artifact, we sequenced DNA from several high and low expressing samples near the
Illumina probes to determine whether there were any new previously unknown variations.
Since we did not find SNPs, this result increased our confidence in our association
findings of gene expression association with these SNPs.
Our data analysis of human brain expression changes concentrated on a few
chromosomal regions chosen because of their relevance to Bipolar Disorder based on
GWAS findings. The more comprehensive analysis, which is currently being carried out,
is to look for all possible associations or eQTLs between all measured transcripts and all
genotyped SNPs. This is likely to produce many more additional associations similar to
those that we have identified. As useful as re-sequencing was in our small study,
confirming all results of a larger, whole-genome association by designing and sequencing
regions around each associated probe may not be feasible or cost effective at present. One
way to forgo these and many other difficulties discussed in the preceding section in the
future would be to rely on next generation sequencing, which I will review next.
Future directions.
Next generation sequencing is a new technology of massively parallel high-
throughput DNA sequencing (50), with one possible application to quantify the

116
transcriptome. This method is referred to as RNA-Seq, which stands for RNA
sequencing, and conceptually consists of several steps: extracting RNA populations (such
as total mRNA) and converting it to cDNA, which is then sequenced in a high-throughput
manner (51). RNA-Seq has already been applied to study whole genome transcriptional
profiles of yeast and mouse tissue, as well as human cell lines (52-55). Several important
features of RNA-Seq offer solutions that address some of the problems encountered with
microarray hybridization based techniques. Most significantly, RNA-Seq does not require
a priori knowledge about specific transcripts being measured. Detection and
measurements are done for all RNA/cDNA species in the sample. Microarrays, on the
other hand, require predefined set of probes, which are then used to measure the presence
of a transcript. This particular feature also means that all splice variants present in the
sample can be detected and measured. While all microarray platform manufacturers strive
to offer this feature in their products, their ability to do so is limited by the current
knowledge about splice variants. RNA-Seq also allows identification and measurement of
novel transcripts. For example, RNA-Seq technology applied to mouse brain, muscle and
liver tissues allowed discovery of about 600 novel transcripts not previously annotated
(53). Another a striking feature of RNA-Seq compared to microarrays is its linear range,
i.e. its ability to detect low and very high abundance transcripts. Getting accurate readout
of the differential expression of transcripts detected at low level is particularly important
in brain tissue, as discussed above.
While promising to mend many of expression microarray shortcomings, as of
today the high cost of next generation sequencing technologies prohibits its widespread
use. This means that many more studies are yet to be done using Affymetrix, Illumina

117
and other platforms for hybridization based expression measures. In addition, many
challenges remain – next generation sequencing does not address the problems of genetic
heterogeneity, tissue heterogeneity and the resulting low signal to noise ratios.
Ultimately, the future of bioinformatics as applied to problems of both rare
Mendelian and common complex disorders will require new paradigms. These may
involve how to statistically adjust properly for stratification as well as differences in
procurement of cases. In addition, several scientists (56, 57) have argued that new
methods need to be developed for merging information from proteomics data sources and
the literature as well as pathways knowledge to enlighten the genetics. From my work it
is clear that expression analysis combined with genetics is just the beginning – merging
these fields with others may ultimately help stratify results by neurobiological relevance
and hence increase the likelihood of successful subsequent evaluation and verification in
the laboratory.
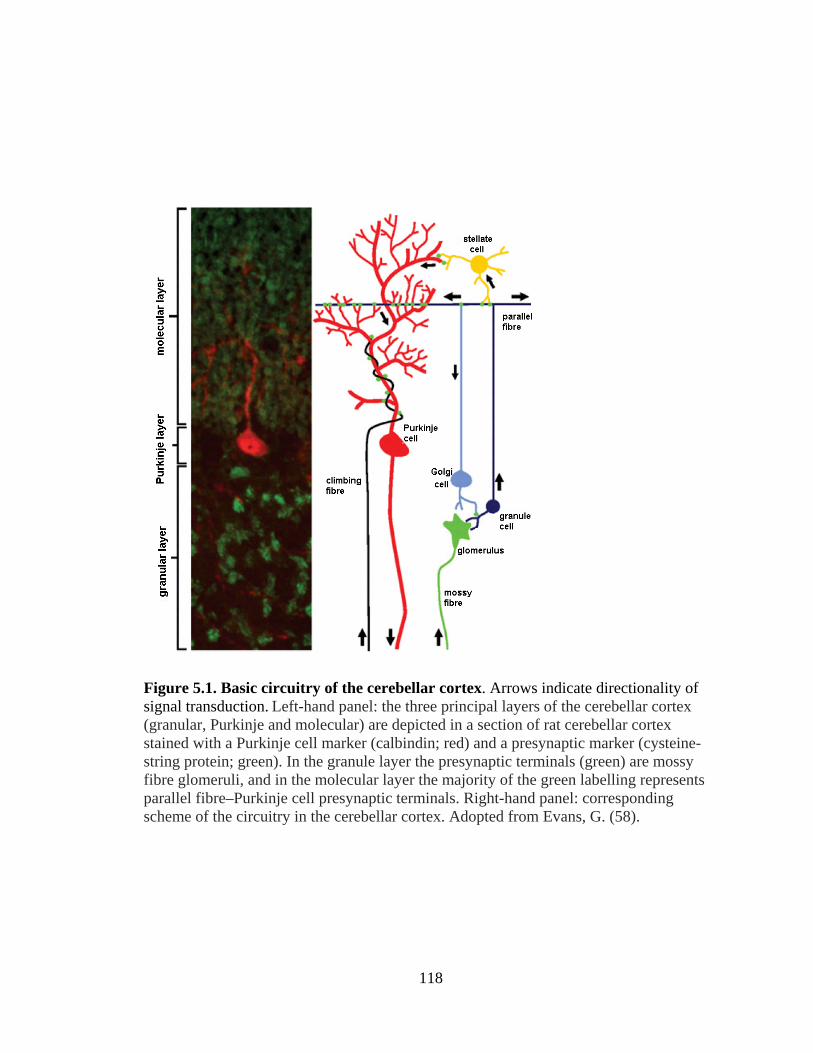
118
Figure 5.1. Basic circuitry of the cerebellar cortex. Arrows indicate directionality of signal transduction. Left-hand panel: the three principal layers of the cerebellar cortex (granular, Purkinje and molecular) are depicted in a section of rat cerebellar cortex stained with a Purkinje cell marker (calbindin; red) and a presynaptic marker (cysteine-string protein; green). In the granule layer the presynaptic terminals (green) are mossy fibre glomeruli, and in the molecular layer the majority of the green labelling represents parallel fibre–Purkinje cell presynaptic terminals. Right-hand panel: corresponding scheme of the circuitry in the cerebellar cortex. Adopted from Evans, G. (58).

119
References.
1 DeRisi, J., Penland, L., Brown, P.O., Bittner, M.L., Meltzer, P.S., Ray, M., Chen, Y., Su, Y.A. and Trent, J.M. (1996) Use of a cDNA microarray to analyse gene expression patterns in human cancer. Nat Genet, 14, 457-460.
2 Lockhart, D.J., Dong, H., Byrne, M.C., Follettie, M.T., Gallo, M.V., Chee, M.S., Mittmann, M., Wang, C., Kobayashi, M., Horton, H. et al. (1996) Expression monitoring by hybridization to high-density oligonucleotide arrays. Nat Biotechnol, 14, 1675-1680.
3 Schena, M., Shalon, D., Davis, R.W. and Brown, P.O. (1995) Quantitative monitoring of gene expression patterns with a complementary DNA microarray. Science, 270, 467-470.
4 Bunney, W.E., Bunney, B.G., Vawter, M.P., Tomita, H., Li, J., Evans, S.J., Choudary, P.V., Myers, R.M., Jones, E.G., Watson, S.J. et al. (2003) Microarray technology: a review of new strategies to discover candidate vulnerability genes in psychiatric disorders. Am J Psychiatry, 160, 657-666.
5 Brentani, R.R., Carraro, D.M., Verjovski-Almeida, S., Reis, E.M., Neves, E.J., de Souza, S.J., Carvalho, A.F., Brentani, H. and Reis, L.F. (2005) Gene expression arrays in cancer research: methods and applications. Crit Rev Oncol Hematol, 54, 95-105.
6 Love, D.R., Pichler, F.B., Dodd, A., Copp, B.R. and Greenwood, D.R. (2004) Technology for high-throughput screens: the present and future using zebrafish. Curr Opin Biotechnol, 15, 564-571.
7 Portman, D.S. (2006) Profiling C. elegans gene expression with DNA microarrays. WormBook, 1-11.
8 Gupta, V. and Oliver, B. (2003) Drosophila microarray platforms. Brief Funct Genomic Proteomic, 2, 97-105.
9 Ren, S., Liu, S., Howell, P., Jr., Xi, Y., Enkemann, S.A., Ju, J. and Riker, A.I. (2008) The impact of genomics in understanding human melanoma progression and metastasis. Cancer Control, 15, 202-215.
10 Marchionni, L., Wilson, R.F., Marinopoulos, S.S., Wolff, A.C., Parmigiani, G., Bass, E.B. and Goodman, S.N. (2007) Impact of gene expression profiling tests on breast cancer outcomes. Evid Rep Technol Assess (Full Rep), 1-105.
11 Horak, C.E. and Snyder, M. (2002) Global analysis of gene expression in yeast. Funct Integr Genomics, 2, 171-180.

120
12 Jiao, Y., Yan, J., Zhao, Y., Donahue, L.R., Beamer, W.G., Li, X., Roe, B.A., Ledoux, M.S. and Gu, W. (2005) Carbonic anhydrase-related protein VIII deficiency is associated with a distinctive lifelong gait disorder in waddles mice. Genetics, 171, 1239-1246.
13 Turkmen, S., Guo, G., Garshasbi, M., Hoffmann, K., Alshalah, A.J., Mischung, C., Kuss, A., Humphrey, N., Mundlos, S. and Robinson, P.N. (2009) CA8 mutations cause a novel syndrome characterized by ataxia and mild mental retardation with predisposition to quadrupedal gait. PLoS Genet, 5, e1000487.
14 Bomar, J.M., Benke, P.J., Slattery, E.L., Puttagunta, R., Taylor, L.P., Seong, E., Nystuen, A., Chen, W., Albin, R.L., Patel, P.D. et al. (2003) Mutations in a novel gene encoding a CRAL-TRIO domain cause human Cayman ataxia and ataxia/dystonia in the jittery mouse. Nat Genet, 35, 264-269.
15 Strasser, H.C., Lilyestrom, J., Ashby, E.R., Honeycutt, N.A., Schretlen, D.J., Pulver, A.E., Hopkins, R.O., Depaulo, J.R., Potash, J.B., Schweizer, B. et al. (2005) Hippocampal and ventricular volumes in psychotic and nonpsychotic bipolar patients compared with schizophrenia patients and community control subjects: a pilot study. Biol Psychiatry, 57, 633-639.
16 Saunders, E.H., Scott, L.J., McInnis, M.G. and Burmeister, M. (2008) Familiality and diagnostic patterns of subphenotypes in the National Institutes of Mental Health bipolar sample. Am J Med Genet B Neuropsychiatr Genet, 147B, 18-26.
17 Kieseppa, T., Partonen, T., Haukka, J., Kaprio, J. and Lonnqvist, J. (2004) High concordance of bipolar I disorder in a nationwide sample of twins. Am J Psychiatry, 161, 1814-1821.
18 McGuffin, P., Rijsdijk, F., Andrew, M., Sham, P., Katz, R. and Cardno, A. (2003) The heritability of bipolar affective disorder and the genetic relationship to unipolar depression. Arch Gen Psychiatry, 60, 497-502.
19 Cichon, S., other members of the Psychiatric GWAS Consortium Steering Committee (2009) A framework for interpreting genome-wide association studies of psychiatric disorders. Mol Psychiatry, 14, 10-17.
20 Schork, N.J., Murray, S.S., Frazer, K.A. and Topol, E.J. (2009) Common vs. rare allele hypotheses for complex diseases. Curr Opin Genet Dev, 19, 212-219.
21 Kandel, E.R., Schwartz, J.H. and Jessell, T.M. (1991) Principles of neural science. Elsevier, New York.

121
22 Azevedo, F.A., Carvalho, L.R., Grinberg, L.T., Farfel, J.M., Ferretti, R.E., Leite, R.E., Jacob Filho, W., Lent, R. and Herculano-Houzel, S. (2009) Equal numbers of neuronal and nonneuronal cells make the human brain an isometrically scaled-up primate brain. J Comp Neurol, 513, 532-541.
23 Pelvig, D.P., Pakkenberg, H., Stark, A.K. and Pakkenberg, B. (2008) Neocortical glial cell numbers in human brains. Neurobiol Aging, 29, 1754-1762.
24 Andersen, B.B., Korbo, L. and Pakkenberg, B. (1992) A quantitative study of the human cerebellum with unbiased stereological techniques. J Comp Neurol, 326, 549-560.
25 Wurmbach, E., Gonzalez-Maeso, J., Yuen, T., Ebersole, B.J., Mastaitis, J.W., Mobbs, C.V. and Sealfon, S.C. (2002) Validated genomic approach to study differentially expressed genes in complex tissues. Neurochem Res, 27, 1027-1033.
26 Haroutunian, V. and Pickett, J. (2007) Autism brain tissue banking. Brain Pathol, 17, 412-421.
27 Bell, J.E., Alafuzoff, I., Al-Sarraj, S., Arzberger, T., Bogdanovic, N., Budka, H., Dexter, D.T., Falkai, P., Ferrer, I., Gelpi, E. et al. (2008) Management of a twenty-first century brain bank: experience in the BrainNet Europe consortium. Acta Neuropathol, 115, 497-507.
28 Ravid, R. and Swaab, D.F. (1993) The Netherlands brain bank--a clinico-pathological link in aging and dementia research. J Neural Transm Suppl, 39, 143-153.
29 Torrey, E.F., Webster, M., Knable, M., Johnston, N. and Yolken, R.H. (2000) The stanley foundation brain collection and neuropathology consortium. Schizophr Res, 44, 151-155.
30 Grinberg, L.T., Ferretti, R.E., Farfel, J.M., Leite, R., Pasqualucci, C.A., Rosemberg, S., Nitrini, R., Saldiva, P.H. and Filho, W.J. (2007) Brain bank of the Brazilian aging brain study group - a milestone reached and more than 1,600 collected brains. Cell Tissue Bank, 8, 151-162.
31 Sheedy, D., Garrick, T., Dedova, I., Hunt, C., Miller, R., Sundqvist, N. and Harper, C. (2008) An Australian Brain Bank: a critical investment with a high return! Cell Tissue Bank, 9, 205-216.
32 Li, J.Z., Vawter, M.P., Walsh, D.M., Tomita, H., Evans, S.J., Choudary, P.V., Lopez, J.F., Avelar, A., Shokoohi, V., Chung, T. et al. (2004) Systematic changes in gene expression in postmortem human brains associated with tissue pH and terminal medical conditions. Hum Mol Genet, 13, 609-616.

122
33 Atz, M., Walsh, D., Cartagena, P., Li, J., Evans, S., Choudary, P., Overman, K., Stein, R., Tomita, H., Potkin, S. et al. (2007) Methodological considerations for gene expression profiling of human brain. J Neurosci Methods, 163, 295-309.
34 Stan, A.D., Ghose, S., Gao, X.M., Roberts, R.C., Lewis-Amezcua, K., Hatanpaa, K.J. and Tamminga, C.A. (2006) Human postmortem tissue: what quality markers matter? Brain Res, 1123, 1-11.
35 Cummings, T.J., Strum, J.C., Yoon, L.W., Szymanski, M.H. and Hulette, C.M. (2001) Recovery and expression of messenger RNA from postmortem human brain tissue. Mod Pathol, 14, 1157-1161.
36 Ferrer, I., Armstrong, J., Capellari, S., Parchi, P., Arzberger, T., Bell, J., Budka, H., Strobel, T., Giaccone, G., Rossi, G. et al. (2007) Effects of formalin fixation, paraffin embedding, and time of storage on DNA preservation in brain tissue: a BrainNet Europe study. Brain Pathol, 17, 297-303.
37 Ferrer, I., Santpere, G., Arzberger, T., Bell, J., Blanco, R., Boluda, S., Budka, H., Carmona, M., Giaccone, G., Krebs, B. et al. (2007) Brain protein preservation largely depends on the postmortem storage temperature: implications for study of proteins in human neurologic diseases and management of brain banks: a BrainNet Europe Study. J Neuropathol Exp Neurol, 66, 35-46.
38 Kingsbury, A.E., Foster, O.J., Nisbet, A.P., Cairns, N., Bray, L., Eve, D.J., Lees, A.J. and Marsden, C.D. (1995) Tissue pH as an indicator of mRNA preservation in human post-mortem brain. Brain Res Mol Brain Res, 28, 311-318.
39 Hynd, M.R., Lewohl, J.M., Scott, H.L. and Dodd, P.R. (2003) Biochemical and molecular studies using human autopsy brain tissue. J Neurochem, 85, 543-562.
40 Lipska, B.K., Deep-Soboslay, A., Weickert, C.S., Hyde, T.M., Martin, C.E., Herman, M.M. and Kleinman, J.E. (2006) Critical factors in gene expression in postmortem human brain: Focus on studies in schizophrenia. Biol Psychiatry, 60, 650-658.
41 Emmert-Buck, M.R., Bonner, R.F., Smith, P.D., Chuaqui, R.F., Zhuang, Z., Goldstein, S.R., Weiss, R.A. and Liotta, L.A. (1996) Laser capture microdissection. Science, 274, 998-1001.
42 Bernard, R., Kerman, I.A., Meng, F., Evans, S.J., Amrein, I., Jones, E.G., Bunney, W.E., Akil, H., Watson, S.J. and Thompson, R.C. (2009) Gene expression profiling of neurochemically defined regions of the human brain by in situ hybridization-guided laser capture microdissection. J Neurosci Methods, 178, 46-54.

123
43 Dai, M., Wang, P., Boyd, A.D., Kostov, G., Athey, B., Jones, E.G., Bunney, W.E., Myers, R.M., Speed, T.P., Akil, H. et al. (2005) Evolving gene/transcript definitions significantly alter the interpretation of GeneChip data. Nucleic Acids Res, 33, e175.
44 Xiao, J., Gong, S. and Ledoux, M.S. (2007) Caytaxin deficiency disrupts signaling pathways in cerebellar cortex. Neuroscience, 144, 439-461.
45 Shi, L., Reid, L.H., Jones, W.D., Shippy, R., Warrington, J.A., Baker, S.C., Collins, P.J., de Longueville, F., Kawasaki, E.S., Lee, K.Y. et al. (2006) The MicroArray Quality Control (MAQC) project shows inter- and intraplatform reproducibility of gene expression measurements. Nat Biotechnol, 24, 1151-1161.
46 Larkin, J.E., Frank, B.C., Gavras, H., Sultana, R. and Quackenbush, J. (2005) Independence and reproducibility across microarray platforms. Nat Methods, 2, 337-344.
47 Sliwerska, E., Meng, F., Speed, T.P., Jones, E.G., Bunney, W.E., Akil, H., Watson, S.J. and Burmeister, M. (2007) SNPs on chips: the hidden genetic code in expression arrays. Biol Psychiatry, 61, 13-16.
48 Wang, J., Wang, W., Li, R., Li, Y., Tian, G., Goodman, L., Fan, W., Zhang, J., Li, J., Guo, Y. et al. (2008) The diploid genome sequence of an Asian individual. Nature, 456, 60-65.
49 Bentley, D.R., Balasubramanian, S., Swerdlow, H.P., Smith, G.P., Milton, J., Brown, C.G., Hall, K.P., Evers, D.J., Barnes, C.L., Bignell, H.R. et al. (2008) Accurate whole human genome sequencing using reversible terminator chemistry. Nature, 456, 53-59.
50 Shendure, J. and Ji, H. (2008) Next-generation DNA sequencing. Nat Biotechnol, 26, 1135-1145.
51 Wang, Z., Gerstein, M. and Snyder, M. (2009) RNA-Seq: a revolutionary tool for transcriptomics. Nat Rev Genet, 10, 57-63.
52 Nagalakshmi, U., Wang, Z., Waern, K., Shou, C., Raha, D., Gerstein, M. and Snyder, M. (2008) The transcriptional landscape of the yeast genome defined by RNA sequencing. Science, 320, 1344-1349.
53 Mortazavi, A., Williams, B.A., McCue, K., Schaeffer, L. and Wold, B. (2008) Mapping and quantifying mammalian transcriptomes by RNA-Seq. Nat Methods, 5, 621-628.
124
54 Morin, R., Bainbridge, M., Fejes, A., Hirst, M., Krzywinski, M., Pugh, T., McDonald, H., Varhol, R., Jones, S. and Marra, M. (2008) Profiling the HeLa S3 transcriptome using randomly primed cDNA and massively parallel short-read sequencing. Biotechniques, 45, 81-94.
55 Lister, R., O'Malley, R.C., Tonti-Filippini, J., Gregory, B.D., Berry, C.C., Millar, A.H. and Ecker, J.R. (2008) Highly integrated single-base resolution maps of the epigenome in Arabidopsis. Cell, 133, 523-536.
56 Li, J. and Burmeister, M. (2005) Genetical genomics: combining genetics with gene expression analysis. Hum Mol Genet, 14 Spec No. 2, R163-169.
57 Le-Niculescu, H., McFarland, M.J., Mamidipalli, S., Ogden, C.A., Kuczenski, R., Kurian, S.M., Salomon, D.R., Tsuang, M.T., Nurnberger, J.I., Jr. and Niculescu, A.B. (2007) Convergent Functional Genomics of bipolar disorder: from animal model pharmacogenomics to human genetics and biomarkers. Neurosci Biobehav Rev, 31, 897-903.
58 Evans, G.J. (2007) Synaptic signalling in cerebellar plasticity. Biol Cell, 99, 363-378.