association of y chromosome haplogroup i with hiv progression, and haart outcome
DESCRIPTION
The host genetic basis of differential outcomes in HIV infection, progression, viral load set point andhighly active retroviral therapy (HAART) responses was examined for the common Y haplogroupsin European Americans and African Americans.TRANSCRIPT
7/18/2019 Association of Y chromosome haplogroup I with HIV progression, and HAART outcome
http://slidepdf.com/reader/full/association-of-y-chromosome-haplogroup-i-with-hiv-progression-and-haart-outcome 1/20
Association of Y chromosome haplogroup I wi th HIV progression,
and HAART outcome
Efe Sezgin,
Laboratory of Genomic Diversity, NCI-Frederick, Frederick, MD 21702, USA
Joanne M. Lind,
Laboratory of Genomic Diversity, NCI-Frederick, Frederick, MD 21702, USA
Sadeep Shrestha,
Laboratory of Genomic Diversity, NCI-Frederick, Frederick, MD 21702, USA, Basic Research
Program, SAIC-Frederick, Inc., NCI-Frederick, Frederick, MD 21702, USA
Sher Hendrickson,
Laboratory of Genomic Diversity, NCI-Frederick, Frederick, MD 21702, USA
James J. Goedert,
Viral Epidemiology Branch, National Cancer Institute, Rockville, MD 20582, USA
Sharyne Donfield,
Rho, Incorporated, Chapel Hill, NC 27517, USA
Gregory D. Kirk,
Department of Epidemiology, Johns Hopkins Bloomberg School of Public Health, Baltimore, MD
21205, USA
John P. Phair ,
Northwestern University Medical School, Comprehensive AIDS Center, 6980 North Lake Shore
Drive, Suite 1106, Chicago, IL 60611, USA
Jennifer L. Troyer ,
Laboratory of Genomic Diversity, NCI-Frederick, Frederick, MD 21702, USA, Basic Research
Program, SAIC-Frederick, Inc., NCI-Frederick, Frederick, MD 21702, USA
Stephen J. O'Brien, and
Laboratory of Genomic Diversity, NCI-Frederick, Frederick, MD 21702, USA
Michael W. Smith
Laboratory of Genomic Diversity, NCI-Frederick, Frederick, MD 21702, USA, Basic Research
Program, SAIC-Frederick, Inc., NCI-Frederick, Frederick, MD 21702, USA
Abstract
Correspondence to: Michael W. Smith.
Present Address: J. M. Lind, School of Medicine, University of Western Sydney, Sydney, AustraliaPresent Address: M. W. Smith, Genetics and Genomics, Advanced Technology Program, SAIC-Frederick, Inc., National Cancer Institute,915 Tollhouse Ave., Suite 211, Frederick, MD 21701, USA, [email protected] Address: S. Shrestha, Department of Epidemiology and International Health, School of Public Health, University of Alabama,Birmingham, AL 35294, USA
Electronic supplementary material The online version of this article (doi:10.1007/s00439-008-0620-7) contains supplementary material,
which is available to authorized users.
NIH Public AccessAuthor Manuscript Hum Genet . Author manuscript; available in PMC 2010 June 14.
Published in final edited form as:
Hum Genet . 2009 April ; 125(3): 281–294. doi:10.1007/s00439-008-0620-7.
NI H-P A A u
t h or Manus c r i pt
NI H-P A A ut h or Manus c r i pt
NI H-P A A ut h or M
anus c r i pt
7/18/2019 Association of Y chromosome haplogroup I with HIV progression, and HAART outcome
http://slidepdf.com/reader/full/association-of-y-chromosome-haplogroup-i-with-hiv-progression-and-haart-outcome 2/20
The host genetic basis of differential outcomes in HIV infection, progression, viral load set point and
highly active retroviral therapy (HAART) responses was examined for the common Y haplogroups
in European Americans and African Americans. Accelerated progression to acquired immune
deficiency syndrome (AIDS) and related death in European Americans among Y chromosome
haplogroup I (Y-I) subjects was discovered. Additionally, Y-I haplogroup subjects on HAART took
a longer time to HIV-1 viral suppression and were more likely to fail HAART. Both the accelerated
progression and longer time to viral suppression results observed in haplogroup Y-I were significant
after false-discovery-rate corrections. A higher frequency of AIDS-defining illnesses was alsoobserved in haplogroup Y-I. These effects were independent of the previously identified autosomal
AIDS restriction genes. When the Y-I haplogroup subjects were further subdivided into six I
subhaplogroups, no one subhaplogroup accounted for the effects on HIV progression, viral load or
HAART response. Adjustment of the analyses for population stratification found significant and
concordant haplogroup Y-I results. The Y chromosome haplogroup analyses of HIV infection and
progression in African Americans were not significant. Our results suggest that one or more loci on
the Y chromosome found on haplogroup Y-I have an effect on AIDS progression and treatment
responses in European Americans.
Introduction
Genetic variation has been shown to play an important role in acquired immune deficiencysyndrome (AIDS), with numerous AIDS restriction genes (ARGs) affecting HIV-1 cell entry,
acquired and innate immunity, and cytokine defenses against HIV-1 (O'Brien and Nelson
2004). In the United States, HIV is now one of the leading causes of death in young,
predominantly male, adults (Anderson 2001). While there is little evidence to suggest a gender
difference in progression to AIDS (Pezzotti et al. 1996), the immune environments between
males and females differ in T helper (TH) lymphocyte response, antibody production and cell-
mediated immunity (Gleicher and Barad 2007; Marriott and Huet-Hudson 2006; McCarthy
2000; Whitacre 2001; Whitacre et al. 1999). Proteins encoded by the Y chromosome may play
a role in this difference between male and female immune responses, as well as variable
immune responses within males (Teuschert et al. 2006; Wesley et al. 2007). In humans, males
are more likely to exhibit risky behaviors such as physical aggression, resulting in injuries, and
are more likely to travel to new geographical regions (Bosch et al. 2003; Carvajal-Carmona et
al. 2000; Carvajal-Carmona et al. 2003; Cavalli-Sforza and Hewlett 1982; Mesa et al. 2000),resulting in more exposure to infectious diseases. These and other circumstances have created
unique selective environments that likely specifically impacted Y chromosome evolution and
variation (Jobling et al. 1998).
The haploid 60-megabase Y chromosome is obviously unique for genetic studies because only
males are carriers. Further, 95% of the Y chromosome that does not undergo recombination
contains 78 redundant protein-coding genes that encode 27 distinct proteins (Jobling and Tyler-
Smith 2003; Skaletsky et al. 2003). Previous work has defined a Y chromosome phylogeny of
311 haplogroups where 20 major clades are evident (Karafet et al. 2008). Over the past decade
attempts have been made to carry out association studies of Y chromosome mutations with
differing male phenotypes and some effects related to infertility, testicular cancer and
hypertension have been suggested (Krausz et al. 2004).
Previous studies have also examined Y chromosome genes for immune cell expression,
immunological function, and the role of the encoded proteins in the transplantation response.
We know that of the 11 ubiquitously expressed genes, five ( DDX3Y , UTY , USP9Y , SMCY and
TMSB4Y ) are highly expressed in immunological tissues (Ditton et al. 2004; Lahn and Page
1997; Skaletsky et al. 2003). All five of these proteins also function as transplantation antigens
in graft-versus-host disease (Agulnik et al. 1994; Ivanov et al. 2005; Laurin et al. 2006; Torikai
Sezgin et al. Page 2
Hum Genet . Author manuscript; available in PMC 2010 June 14.
NI H-P A A
ut h or Manus c r i pt
NI H-P A A ut h or Manus c r i pt
NI H-P A A ut h or
Manus c r i pt
7/18/2019 Association of Y chromosome haplogroup I with HIV progression, and HAART outcome
http://slidepdf.com/reader/full/association-of-y-chromosome-haplogroup-i-with-hiv-progression-and-haart-outcome 3/20
et al. 2004; Vogt et al. 2000; Warren et al. 2000). These results suggest that several Y
chromosome genes play a role in immunological monitoring.
Extensive studies of Y chromosome variability have focused on human population structure
and migration patterns. Comparisons of the Y chromosome, autosomes, and the mitochondrial
DNA along with human history suggests different migration patterns of males and females
(Hamilton et al. 2005; Seielstad et al. 1998; Wilder et al. 2004; Wood et al. 2005). Some have
argued that, in general, females and males in pre-agricultural societies migrated at equal rates(Wilkins and Marlowe 2006). In contrast, some studies have reported elevated female
migration rates (Hamilton et al. 2005; Seielstad et al. 1998) which must be balanced with more
recent male directional migration associated with colonization (Bosch et al. 2003; Mesa et al.
2000; Wilkins 2006). Diamond (2005) and colleagues (Dobson and Carper 1996; Wolfe et al.
2007) have argued that infectious diseases played a major role in the European colonization
and the associated failure to expand in the tropics. Taken together, there is a unique history of
the Y chromosome relative to autosomes and the X chromosome.
We postulated that underlying functional variants in any infection response and resistance
could be identified by a Y chromosome major haplogroup analysis. Markers for the ten known
major haplogroups of European Americans and African Americans were genotyped in five
major HIV-1/AIDS cohorts. The haplogroups were then examined for association with HIV-1
infection, progression, viral load set point and highly active retroviral therapy (HAART)response.
Materials and methods
Study population
We studied 3,727 males (2,292 European Americans, 1,233 African Americans, and 202
individuals from other racial groups) from five HIV-1/AIDS cohorts: Multicenter AIDS Cohort
Study (MACS n = 1,594) (Phair et al. 1992); San Francisco City Cohort (SFCC n = 195)
(Buchbinder et al. 1994); Multicenter Hemophilia Cohort Study (MHCS n = 703) (Goedert et
al. 1989); Hemophilia Growth and Development Study (HGDS n = 213) (Hilgartner et al.
1993); and the AIDS Linked to Intravenous Experience (ALIVE n = 1,022) (Vlahov et al.
1998). Participants were divided into one of three categories as follows: seronegative (SN,
negative result with HIV antibody test, n = 656); seroconverter (SC, date of HIV-1 infectionknown, n = 920); and seroprevalent (SP, HIV-1-positive before study enrollment, n = 2,151).
SCs were limited to those with 2 years or fewer between first positive and last negative clinic
visits. Study subjects were HAART naïve individuals and thus were censored until a
conservative HAART initiation cutoff date of 1 January 1996 since HAART became available
in 1996. An exception to this was 467 MACS subjects that were only used for HAART analyses
(see “HAART analysis” section). Estimated dates of seroconversion were available for SP
subjects from their respective cohorts (Buchbinder et al. 1994; Goedert et al. 1989; Phair et al.
1992).
Individual DNA samples were extracted from the immortal lymphoblastoid B cell lines as
previously described (Dean et al. 1996). This study was approved by the Protocol Review
Office of the Institutional Review Board of the National Cancer Institute. Informed consent
was obtained from all individuals at the study sites.
Y chromosome analysis
Each male was genotyped for ten single nucleotide polymorphisms (SNPs) located on the non-
recombining region of the Y chromosome (NRY) using the 5′ nuclease assay (TaqMan Assay-
by-Design SNP genotyping products, Applied Biosystems) (Lind et al. 2007). Males were then
Sezgin et al. Page 3
Hum Genet . Author manuscript; available in PMC 2010 June 14.
NI H-P A A
ut h or Manus c r i pt
NI H-P A A ut h or Manus c r i pt
NI H-P A A ut h or
Manus c r i pt
7/18/2019 Association of Y chromosome haplogroup I with HIV progression, and HAART outcome
http://slidepdf.com/reader/full/association-of-y-chromosome-haplogroup-i-with-hiv-progression-and-haart-outcome 4/20
assigned to 1 of 11 major Y chromosome haplogroups (those common in Europeans and
Africans) according to the Y Chromosome Consortium (2002). Individuals who had the m89
derived allele but did not belong to the H, I or K haplogroups were joined to form the juxtaposed
F* (xI, H, K) group and referred as F* throughout the manuscript. After some promising results
were obtained for haplogroup I (Y-I), five additional markers, M253, M227, P37, M26, and
M223 (Cinnioglu et al. 2004; Rootsi et al. 2004; Underhill et al. 2001) were genotyped to define
the I1a*, I1a4, I1b*, I1b2, and I1c subhaplogroups (the corresponding YCC 2008 (Karafet et
al. 2008) names are I1, I1b, I2a, I2a2 and I2b, respectively). The remaining Y-I haplogroupsubjects who lacked the derived alleles at these five markers were assigned into the I* (xI1a*,
xI1a4, xI1b*, xI1b2, xI1c) paragroup.
Statistical analyses
Haplogroups with frequency less than 5% were excluded from statistical analysis. Haplogroups
compared were I, R and F* in European Americans, and I, R and E in African Americans.
Statistical analyses were performed with SAS 9.1 (SAS Institute, Cary, NC, USA). P values
reported were nominal and uncorrected for multiple comparisons. The proportion of false
positives due to multiple testing was estimated using the QVALUE (version 1.0) program
(Storey and Tibshirani 2003). A q value cutoff of 0.05 was used for significance. Throughout
the main body of this paper q values are given when P ≤ 0.05 and in the display items q values
≤0.05 are noted.
Population structure
For 90% of the European-American and 97% of the African-American SCs, 800K autosomal
SNP data from Affymetrix 6.0 Genechip platform (Troyer et al. in preparation) with call rates
greater than or equal to 95% was applied a principal components analysis (PCA) using the
EIGENSOFT (Price et al. 2006) program to examine and adjust for potential population
stratification. ANOVA F statistic was performed on the recovered eigenvectors given the Y
chromosome haplogroups. Further, the top three most informative eigenvector values for each
subject were included in a Cox proportional hazards model to correct for their contribution to
the estimated hazard ratios.
HIV infection and progression
Separate analyses were conducted for European-American and African-American subjects.
Haplogroup frequencies were compared in HIV-1-negative and HIV-1-positive subjects using
the log-likelihood chi-square test. For SC subjects the Kaplan–Meier and Cox proportional
hazard model analyses were used to examine the relationship between Y haplogroups and four
AIDS-related outcomes: time to CD4 T lymphocyte count of fewer than 200 per cubic
millimeter (CD4 < 200); AIDS-1993 definition (Centers for Disease Control 1992);
AIDS-1987 definition (Centers for Disease Control 1986); and death from AIDS-defining
illnesses prior to HAART use. The Cox models were run by stratifying for cohorts in order to
account for individual cohort effects. The nine ALIVE European American samples, of which
only three had AIDS outcome data, were not included the stratified analyses to maintain
statistical power. The time dependence of AIDS progression was examined initially using
graphical analyses and later with partitioned time interval Cox analysis. Genes known to
influence HIV-1 progression [CCR5-Δ
32 (Dean et al. 1996), CCR2-64I (Smith et al. 1997),CCR5-P1/P1 promoter (Martin et al. 1998), and IL10-5′ A (Shin et al. 2000)] were accounted
for in the Cox proportional hazard models. More generally, the full set of known ARGs was
summarized as a genetic propensity index (O'Brien and Nelson 2004) that also included HLA-
B*27 , HLA-B*57 , HLA-B*35, HLA-B*35Px, KIR3DS1, TSG101, SDF , RANTES , and HLA
class I heterozygosity for each subject for the four AIDS-related outcomes and used as a
continuous variable in the Cox analyses. SP subjects who avoided one or more AIDS outcomes
Sezgin et al. Page 4
Hum Genet . Author manuscript; available in PMC 2010 June 14.
NI H-P A A
ut h or Manus c r i pt
NI H-P A A ut h or Manus c r i pt
NI H-P A A ut h or
Manus c r i pt
7/18/2019 Association of Y chromosome haplogroup I with HIV progression, and HAART outcome
http://slidepdf.com/reader/full/association-of-y-chromosome-haplogroup-i-with-hiv-progression-and-haart-outcome 5/20
for more than 9 years were included only in the categorical analyses of AIDS progression and
outcomes similar to our previous reports (Martin et al. 1998; Shin et al. 2000; Smith et al.
1997).
HIV-1 viral load set point analysis
Viral load measurements for 381 European-American SCs from the MACS cohort were
quantified using either the reverse-transcription polymerase chain reaction (RT-PCR,
Amplicor; Roche Diagnostics, Nutley, NJ, USA) or the Roche Ultrasensitive Assay described previously (Lyles et al. 2000). Viral load set points were calculated as the mean of all viral
measurements for these SCs using the HIV-1 RNA measurements obtained between 6 months
to 3 years after the first HIV-seropositive visit and analyzed as log10 HIV-1 RNA copies/mL.
HAART analysis
HAART was defined (Office of AIDS Research Advisory Council 2006) as one of the
following: (1) two or more nucleoside reverse transcriptase inhibitors (NRTIs) in combination
with at least one protease inhibitors (PI) or one non-nucleoside reverse transcriptase inhibitors
(NNRTI); (2) one NRTI in combination with at least one PI and at least one NNRTI; (3) a
regimen consisting of ritonavir and saquinavir in combination with one NRTI and no NNRTIs;
and (4) an abacavir- or tenofovir- containing regimen of three or more NRTIs without both PIs
and NNRTIs. Combinations of zidovudine (AZT) and stavudine (d4T) with either a PI or NNRTI were not considered HAART. The date of HAART initiation was defined as the
midpoint between the last visit without HAART and the first visit at which HAART was
reported. Only subjects with less than 1 year between these visits were included in the study.
Baseline viral load and CD4 counts were taken within 6 months of HAART initiation.
We only used the European-American MACS cohort subjects to detect the suppression of viral
load upon HAART. Time to suppression was defined as the time from HAART initiation to
the first undetectable viral load visit for each subject. Differential survival rates were examined
graphically using Kaplan–Meier analyses and with the hazard ratio using Cox proportional
hazards models adjusted for clinical AIDS prior to HAART, baseline viral load, and CD4 cell
count, and CCR5-Δ32. The measurement of HIV-1 RNA was obtained by RT-PCR (Amplicor
HIV Monitor Assay, Roche Diagnostics, Nutley, NJ). We performed separate analysis of
subjects below thresholds of <200 copies/mL and <50 copies/mL. Failure of viral suppression(<200 copies/mL) was reported as HAART failure.
Results
In our analyses, we focused on the European-American and African-American samples, and
excluded other racial groups due to their small sample size in these cohorts. The Y major
haplogroup frequencies of the remaining 3,490 subjects are shown in Table 1.
European Americans
Population structure and stratification analysis—Since specific Y chromosomes track
population stratification in a population study, we determined whether any observed signals
were due to the Y chromosome itself or due to an autosomal region associated with the Y
chromosome because of geographical origins. We examined data for 800K autosomal SNPs
and applied the EIGENSOFT-PCA (Price et al. 2006) approach to identify and correct for
population stratification in the I, R and F* haplogroup subjects. The known substructure of
European Americans (Price et al. 2008) from northwest to southeast Europe and the division
within southern Europeans were evident. An ANOVA of the most significant (top three) eigen
vector values (principal components) showed that I and R haplogroup subjects were not
significantly different from each other (vector-1: P = 0.60; vector-2: P = 0.08; vector-3: P =
Sezgin et al. Page 5
Hum Genet . Author manuscript; available in PMC 2010 June 14.
NI H-P A A
ut h or Manus c r i pt
NI H-P A A ut h or Manus c r i pt
NI H-P A A ut h or
Manus c r i pt
7/18/2019 Association of Y chromosome haplogroup I with HIV progression, and HAART outcome
http://slidepdf.com/reader/full/association-of-y-chromosome-haplogroup-i-with-hiv-progression-and-haart-outcome 6/20
0.67). However, the distribution of the F* subjects along the first and second eigen vectors
were significantly different compared to the I and R subjects (vector-1: df = 2, P = 0.0001;
vector-2: df = 2, P = 0.001; vector-3: df = 2, P = 0.91). For completeness, the progression
analyses (of SCs) were corrected for these top three most informative eigen vectors.
HIV-1 infection and AIDS progression—An analysis of susceptibility to infection
showed no significant frequency difference when comparing HIV-1-negative and SC subjects
in European Americans (P = 0.38; Table 1). A survival difference for the AIDS-1987 outcomewas observed between the SCs belonging to the three most common (I, R, and F*) European-
American haplogroups (df = 2, log-rank P = 0.02, q = 0.19; Fig. 1), where faster disease
progression in the Y-I haplogroup subjects was evident. A trend toward faster AIDS
progression in the Y-I haplogroup was also suggested by the Cox proportional hazards analyses
[Table 2; relative hazard (RH) = 1.35, P = 0.07 for AIDS-1987]. A close examination of survival
plots indicated acceleration to AIDS in the latter stage of HIV-1 pathogenesis among the Y-I
haplogroup subjects. To address the time dependence of AIDS progression of Y-I haplogroup
individuals, various partitioned time intervals were examined (data not shown). Generally, the
most significant Cox models were divided into early progressors (0–7 years after
seroconversion) and late/slow progressors (>7 years after seroconversion) for CD4 < 200 and
AIDS-1993 outcomes; and at 9 years for the AIDS-1987 and death. Our Cox model interval
analyses indicated that Y-I haplogroup subjects depleted CD4 cells more quickly (RH = 2.05,
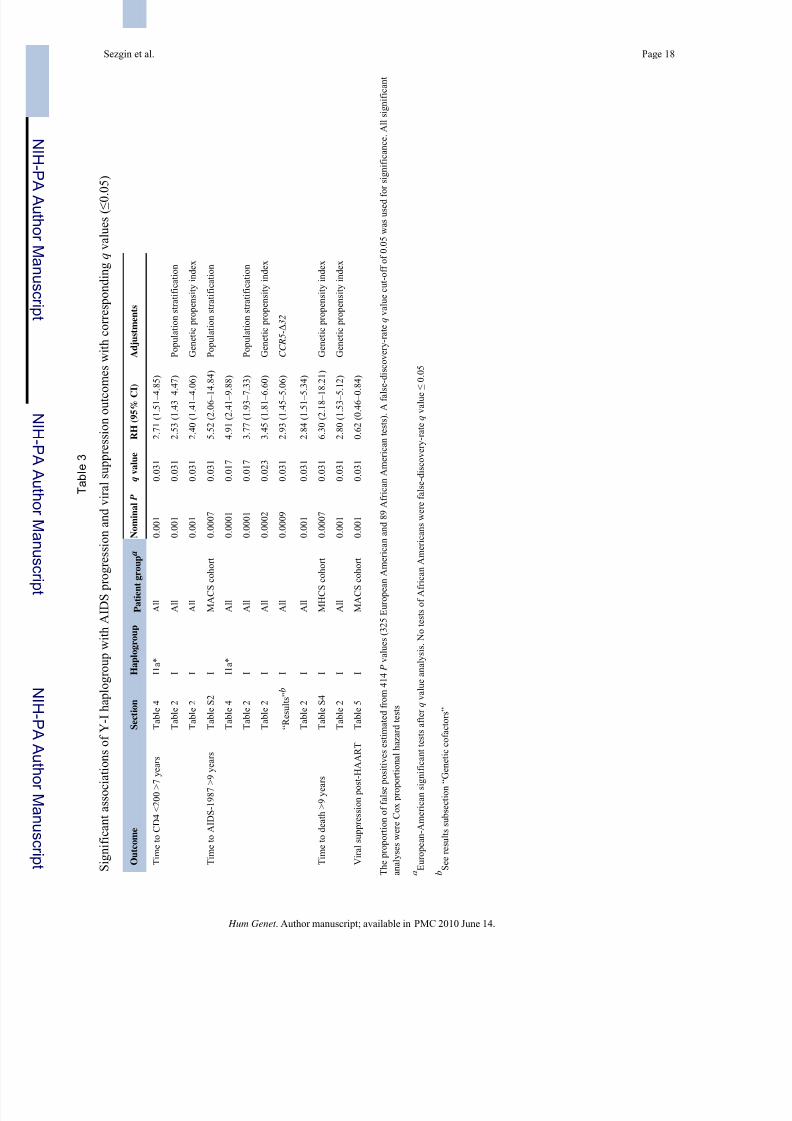
P = 0.007, q = 0.10) and progressed to AIDS (RH = 2.84, P = 0.001, q = 0.03) and death (RH= 2.48, P = 0.003, q = 0.07) faster in the latter phase (Table 2). The faster progression to
AIDS-1987 and death (in the MHCS cohort) results were significant after multiple test
corrections among the Y-I haplogroup individuals (Table 3). This direction of association was
consistent in all the cohorts, but the results were not always as significant (Supplementary
Table 1). An additional categorical analysis, including the seroprevalent subjects also showed
the same trend (results not shown).
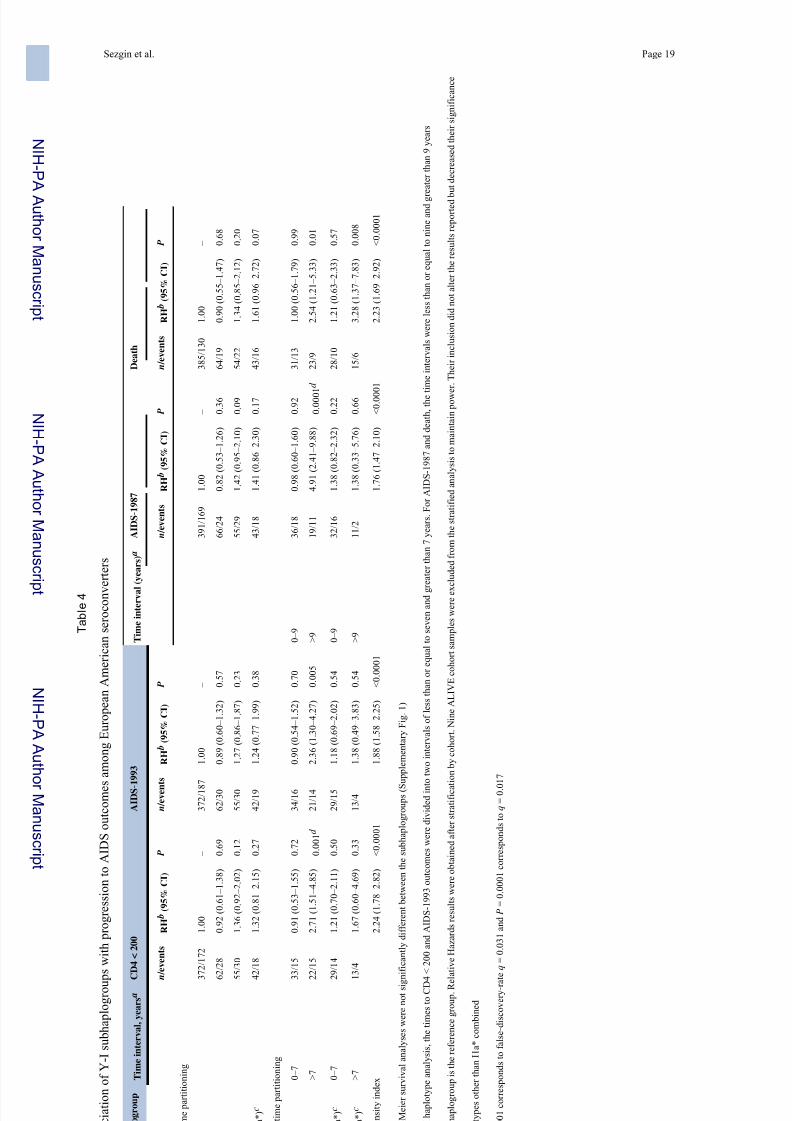
To address whether any one of the Y-I subhaplogroups carried the faster progression signal,
we further genotyped the Y-I haplogroup subjects for the most common Y-I subhaplogroup
markers (I1a*, I1a4, I1b*, I1b2 and I1c) known from Europe. Y-I subhaplogroups show
geographical frequency differences in Europe most probably representing their places of origin.
Subhaplogroups I1a* and I1a4 are mostly found in northern Europe. I1b* and I1b2 are most
frequent in Eastern Europe and the Balkans, with I1b2 reaching the highest frequency inSardinia. Finally, I1c despite its wide range in Europe, is found mostly in northwest Europe
(Rootsi et al. 2004). The observed frequencies of I1a*, I1a4, I1b*, I1b2 and I1c were 59.2, 0.3,
11.5, 2.8 and 23.1%, respectively. The remaining 3.1% of the Y-I haplogroup samples that
lacked these five subhaplogroup-defining derived alleles were labeled I*. The Cox analyses
suggested a relatively faster progression signal for the relatively common I1a* subhaplogroup
(RH = 1.42, P = 0.09 for AIDS-1987; Table 4) compared to the other subhaplogroups. However,
a Kaplan–Meier survival analysis did not find significant differences between the
subhaplogroups (df = 4, log-rank P = 0.72; Supplementary Fig. 1) indicating that the Y-I
haplogroup as a whole best explains the acceleration to AIDS outcomes rather than any
particular Y-I subhaplogroup. To correct for any population stratification effect, we included
the top three eigen values for each SC as a continuous variable in the Cox model. In these
adjusted COX models, Y-I haplogroup individuals trended toward faster CD4 depletion and
progression to AIDS and death later in HIV infection (Table 2). The faster progression to
AIDS-1987 result was significant after multiple test corrections (Table 3). This direction of
association was consistent in all the cohorts, but the results were not always as significant
(Supplementary Table 2).
We also examined the frequency of Y chromosome haplogroups among subjects with different
AIDS-defining illnesses (Supplementary Table 3). An analysis of haplogroup frequencies
Sezgin et al. Page 6
Hum Genet . Author manuscript; available in PMC 2010 June 14.
NI H-P A A
ut h or Manus c r i pt
NI H-P A A ut h or Manus c r i pt
NI H-P A A ut h or
Manus c r i pt
7/18/2019 Association of Y chromosome haplogroup I with HIV progression, and HAART outcome
http://slidepdf.com/reader/full/association-of-y-chromosome-haplogroup-i-with-hiv-progression-and-haart-outcome 7/20
among cases and controls for AIDS-defining disease revealed a trend toward elevated
frequency of Y-I haplogroup cases compared to SCs for all of the eight disease categories
examined and a trend toward elevated malignancy development (RH = 2.0, P = 0.009, q =
0.11) and Kaposi sarcoma (RH = 2.30, P = 0.007, q = 0.10) for the Y-I haplogroup
(Supplementary Table 3). These findings were consistent with a faster AIDS progression
observed in the Y-I haplogroup subjects. A similar analysis of AIDS-defining disease as the
first outcome showed seven of the eight disease categories with elevated Y-I haplogroup
frequencies. However, neither the results nor the Cox models for specific disease outcomeswere significant (results not shown).
Genetic co factors—We systematically examined and accounted for the effects of well-
known ARGs. First, to evaluate the CCR5-Δ32 influence on AIDS progression, we analyzed
the Y-I haplogroup association using CCR5-Δ32 in a Cox model as a covariate. Again, the
results indicated a significantly faster progression to AIDS-1987 (after 9 years) in the Y-I
haplogroup subjects (adjusted RH = 2.93, P = 0.0009, q = 0.03). The Y-I haplogroup also
maintained its significant result when CCR2-64I , CCR5-P1/P1 promoter and IL10-5′ A variants
were included in the Cox model (results not shown). Further, when we included a genetic
propensity index which accounts for HLA-B*27 , HLA-B*57 , HLA-B*35, HLA-B*35Px,
KIR3DS1, TSG101, SDF , RANTES and HLA class I heterozygosity effects in the Cox model,
the progression difference was still significant for the Y-I haplogroup (Table 2). This
progression difference was also observed in individual cohorts, but the results were not alwaysas significant (Supplementary Table 4). Moreover, the Y-I haplogroup association with rapid
CD4 cell depletion, and rapid progression to AIDS-1987 and to death remained significant
after multiple test corrections (Table 3).
Viral load and HAART—Plasma viral load set points among subjects infected with HIV-1
may be a strong indicator of future disease progression because higher viral load levels lead
to faster CD4 cell depletion and AIDS progression (Bruisten et al. 1997; Henrard et al. 1995;
Katzenstein et al. 1996; Lyles et al. 2000). An ANOVA analysis of plasma viral load set point
among HIV-infected patients showed no significant differences between I, R, and F*
haplogroup subjects (df = 2, P = 0.36; Supplementary Table 5). In contrast, among AIDS
patients treated with HAART, Y-I haplogroup-bearing subjects took significantly longer to
reach overall viral suppression in a Cox model (<200 HIV RNA copies/mL; RH = 0.62, P =
0.001, q = 0.03; Fig. 2) and to reach an undetectable viral load (<50 HIV RNA copies/mL; RH
= 0.69, P = 0.02, q = 0.19; Table 5). The slower viral suppression result observed in the Y-I
haplogroup was still significant after multiple test corrections (Table 3). The Y-I
subhaplogroups had the same trend for AIDS progression, but the significant result was not
due to a single subhaplogroup (Table 5). Overall, more individuals with the Y-I haplogroup
trended toward HAART failure [OR = 2.42 (95% CI 1.29–4.54), Fishers Exact P = 0.009, q =
0.11].
Analyses of African Americans
An initial analysis of susceptibility to infection showed no significant frequency difference
when comparing HIV-1-negative and SC subjects in African Americans (P = 0.45; Table 1).
A Kaplan–Meier survival analysis for AIDS-1987 outcome did not demonstrate a significant
difference between the SCs in seven African American Y haplogroups (df = 6, log-rank P =0.20; Fig. 1). A simplified Kaplan–Meier survival analysis for AIDS-1987 outcome using only
the E, R, and I haplogroups also did not demonstrate a significant difference between the three
haplogroups (df = 2, log-rank P = 0.34; Fig. 1). Furthermore, survival analyses using the Cox
proportional hazard model for CD4 < 200, AIDS-1993, AIDS-1987, and time-to-death
outcomes did not find a significant progression difference between the E, R, and I haplogroups
(Supplementary Table 6). Following modified Cox analyses, adjusting for the effects of ARGs
Sezgin et al. Page 7
Hum Genet . Author manuscript; available in PMC 2010 June 14.
NI H-P A A
ut h or Manus c r i pt
NI H-P A A ut h or Manus c r i pt
NI H-P A A ut h or
Manus c r i pt
7/18/2019 Association of Y chromosome haplogroup I with HIV progression, and HAART outcome
http://slidepdf.com/reader/full/association-of-y-chromosome-haplogroup-i-with-hiv-progression-and-haart-outcome 8/20
via genetic propensity index values (Supplementary Table 7) and population stratification
(Supplementary Table 8) also did not find a significant progression difference between the E,
R, and I haplogroups. Further analysis of specific outcomes in African Americans failed to
show any significant associations with the examined haplogroups.
Discussion
Our study is the first to examine whether major Y haplogroups have an association with HIVinfection and progression to AIDS. We genotyped subjects as one of 11 common Y haplogroups
in European Americans and African Americans, and observed faster progression to all four
AIDS outcomes in European-American Y-I haplogroup subjects in later years of infection. The
early and initial stages of AIDS development indicated by the HIV-1 infection rate and plasma
viral load levels, in the I, R, and F* haplogroups were not significantly different from each
other. However, the Y-I haplogroup showed significantly longer HIV-1 viral suppression time
and higher failure rate in HAART, outcomes that relate to later stages in AIDS progression.
Moreover, the significant results after false-discovery-rate corrections for AIDS-1987, AIDS-
related death, and HIV-1 viral suppression analyses suggest a potential biological basis for
these observations. An independent analysis of AIDS-related illnesses also suggests the
increased risk of the Y-I haplogroup in all disease categories. A non-significant opposite trend
was observed in African American samples, but results depended on only six individuals. It is
hard to draw haplogroup specific conclusions based on the few (<5%) Y-I haplogroup subjectsin African Americans.
There are two possible explanations for the Y-I haplogroup effect. First, a locus (or loci) on
the Y chromosome is responsible for faster progression to AIDS. As our results do not indicate
an infection difference between the haplogroups, this locus might influence the AIDS
progression pathway and lead to faster immunosuppression and AIDS outcomes. The relative
hazard ratio estimates (1.76–2.84, Table 2) indicate a moderate effect on AIDS progression in
the Y-I haplogroup. The alternative explanation for the Y chromosome signal is that we are
tracing an autosomal locus in European Americans associated with the Y-I haplogroup. In
European Americans, many ARG polymorphisms have been identified and found to influence
HIV-1 infection, AIDS progression and mortality (O'Brien and Nelson 2004). A classic
example of these protective genes against AIDS infection and progression, the CCR5-Δ32
variant, shows a north to south gradient in European populations (Libert et al. 1998). Similarly,the Y-I haplogroup is found mostly in northern Europe, and its frequency declines toward
southern Europe (Rootsi et al. 2004). This observation may suggest that we see an autosomal
loci effect rather than a true Y chromosome effect. However, the effect of the Y-I haplogroup
in the latter stage of disease progression is independent of the 13 well-studied autosomal AIDS
restriction/susceptibility loci considered in these analyses. Moreover, the European American
Y-I subhaplogroups and the population stratification analyses fail to show any specific
geographical or population substructure basis for the Y-I haplogroup AIDS progression effect.
Our report of the involvement of Y chromosome major haplogroups in HIV progression and
HAART outcomes has both strengths, largely elaborated above, and weaknesses. The
genotyping of the known major haplogroups from Europe and Africa precisely differentiated
relevant Y chromosome major haplogroups, yet failed to differentiate all of the underlying
subhaplogroups. Both progression and HAART viral suppression signals were seen for the Y-I haplogroup. Therefore, the five known Y-I subhaplogroups were genotyped, but none of them
specifically carried the associations. That these two major and different endpoints were both
associated with the Y-I haplogroup suggests that an underlying biological process could be at
work. A strict Bonferroni correction for the total 414 tests (325 European-American and 89
African-American Cox proportional hazards and viral load tests) presented in figures and tables
yields a significance cutoff of 0.05/414 = 1.2 × 10⁻⁴. Only one of the nominal P values across
Sezgin et al. Page 8
Hum Genet . Author manuscript; available in PMC 2010 June 14.
NI H-P A A
ut h or Manus c r i pt
NI H-P A A ut h or Manus c r i pt
NI H-P A A ut h or
Manus c r i pt

7/18/2019 Association of Y chromosome haplogroup I with HIV progression, and HAART outcome
http://slidepdf.com/reader/full/association-of-y-chromosome-haplogroup-i-with-hiv-progression-and-haart-outcome 9/20
this study was more significant than this stringent correction. However, applying the false-
discovery-rate approach, 12 P values (0.0001–0.001) yield q values (Storey and Tibshirani
2003) ≤0.05 (Table 3). Those 12 tests show that the Y-I haplogroup is significantly associated
with accelerated AIDS progression, particularly later in infection (after 7–9 years), and with
failure to suppress virus during HAART. While these results localize an AIDS progression and
HAART treatment signal to the Y chromosome, the underlying causative variant was not
identified.
Variation on the human Y chromosome is shaped by mutations ranging from single nucleotide
changes to inversions, duplications, and deletions, causing larger structural changes that
generate copy number variations (Repping et al. 2006). Some of these structural changes and
copy number variations have been linked to diseases such as oligo/azospermia and
gonadoblastoma, and shown to be represented frequently at certain Y haplogroups (Krausz et
al. 2004; Repping et al. 2003). However, no such mutation or structural change has been
documented to be particularly associated with the Y-I haplogroup. The non-recombining nature
of the Y chromosome makes the task of discovering the locus involved in HIV progression
significantly more difficult than it would be elsewhere in the genome. The Y chromosome can
be considered a complete haplotype block; therefore, all the genes on the Y chromosome are
positional candidate disease genes, with the primary candidates being those expressed in the
immune tissues and involved in the immunological response.
In conclusion, we present a unique association between infectious disease and the Y
chromosome haplogroup I (Y-I). The 12 significant false-discovery-rate q values for AIDS
progression and HAART outcomes observed in the Y-I haplogroup and the independence of
the Y chromosome effect from that of the examined autosomal loci suggest a causal variant at
a locus on the Y-I haplogroup. Eleven of these 12 associations are with survival and have strong
relative hazards ranging from 2.4 to 6.3. So while a “winners curse” may be inflating these
estimates, the consistency of these results points to a significant role for the Y chromosome in
human health. Further comprehensive genetic and functional studies of the Y chromosome
should speed the discovery of the hidden variation related to HIV-1/AIDS.
Supplementary Material
Refer to Web version on PubMed Central for supplementary material.
Acknowledgments
We thank the patients and staff of all the participating cohorts in the study. San Francisco City Cohort samples were
provided by Susan Buchbinder. We thank Drs. George W. Nelson, James Lautenberger, Cheryl Winkler, Taras Oleksyk
and Yvette Berthier-Schaad for helpful discussions. We are also grateful to Ann Truelove, Viktoriya Grinberg, Randy
Johnson, Bailey Kessing, Michael Malasky, and Mary Thompson for their assistance. The content of this publication
does not necessarily reflect the views or policies of the Department of Health and Human Services, nor does mention
of trade names, commercial products, or organizations imply endorsement by the U.S. government. The project
described in this manuscript has been funded in whole or in part with federal funds from the National Cancer Institute,
National Institutes of Health, under contract N01-CO-12400. The HGDS is supported by 1 R01 HD41224, NIH/
NCICHD.
References
Agulnik AI, Mitchell MJ, Lerner JL, Woods DR, Bishop CE. A mouse Y chromosome gene encoded by
a region essential for spermatogenesis and expression of male-specific minor histocompatibility
antigens. Hum Mol Genet 1994;3:873–878. [PubMed: 7524912]
Anderson, RN. National Vital Statistics Report. Vol. 49. National Centre for Health Statistics; Hyattsville:
2001. Deaths: leading Causes for 1999.
Sezgin et al. Page 9
Hum Genet . Author manuscript; available in PMC 2010 June 14.
NI H-P A A
ut h or Manus c r i pt
NI H-P A A ut h or Manus c r i pt
NI H-P A A ut h or
Manus c r i pt
7/18/2019 Association of Y chromosome haplogroup I with HIV progression, and HAART outcome
http://slidepdf.com/reader/full/association-of-y-chromosome-haplogroup-i-with-hiv-progression-and-haart-outcome 10/20
Bosch E, Calafell F, Rosser ZH, Norby S, Lynnerup N, Hurles ME, Jobling MA. High level of male-
biased Scandinavian admixture in Greenlandic Inuit shown by Y-chromosomal analysis. Hum Genet
2003;112:353–363. [PubMed: 12594533]
Bruisten SM, Frissen PH, Van Swieten P, Harrigan PR, Kinghorn I, Larder B, Weigel HM, De Vries E,
Regez RM, Henrichs JH, Koot M, Huisman JG. Prospective longitudinal analysis of viral load and
surrogate markers in relation to clinical progression in HIV type 1-infected persons. AIDS Res Hum
Retroviruses 1997;13:327–335. [PubMed: 9071432]
Buchbinder SP, Katz MH, Hessol NA, Omalley PM, Holmberg SD. Long-term HIV-1 infection without
immunological progression. AIDS 1994;8:1123–1128. [PubMed: 7986410]
Carvajal-Carmona LG, Soto ID, Pineda N, Ortiz-Barrientos D, Duque C, Ospina-Duque J, McCarthy M,
Montoya P, Alvarez VM, Bedoya G, Ruiz-Linares A. Strong Amerind/white sex bias and a possible
Sephardic contribution among the founders of a population in northwest Colombia. Am J Hum Genet
2000;67:1287–1295. [PubMed: 11032790]
Carvajal-Carmona LG, Ophoff R, Service S, Hartiala J, Molina J, Leon P, Ospina J, Bedoya G, Freimer
N, Ruiz-Linares A. Genetic demography of Antioquia (Colombia) and the Central Valley of Costa
Rica. Hum Genet 2003;112:534–541. [PubMed: 12601469]
Cavalli-Sforza LL, Hewlett B. Exploration and mating range in African Pygmies. Ann Hum Genet
1982;46:257–270. [PubMed: 7125597]
Centers for Disease Control. Classification system for human T-lymphotropic virus type III/
lymphadenopathy-associated virus infections. MMWR Morb Mortal Wkly Rep 1986;35:334–339.
[PubMed: 3010072]
Centers for Disease Control. 1993 revised classification system for HIV infection and expanded
surveillance case definition for AIDS among adolescents and adults. MMWR Recomm Rep
1992;41:1–19.
Chromosome Consortium Y. A nomenclature system for the tree of human Y-chromosomal binary
haplogroups. Genome Res 2002;12:339–348. [PubMed: 11827954]
Cinnioglu C, King R, Kivisild T, Kalfoglu E, Atasoy S, Cavalleri GL, Lillie AS, Roseman CC, Lin AA,
Prince K, Oefner PJ, Shen PD, Semino O, Cavalli-Sforza LL, Underhill PA. Excavating Y-
chromosome haplotype strata in Anatolia. Hum Genet 2004;114:127–148. [PubMed: 14586639]
Dean M, Carrington M, Winkler C, Huttley GA, Smith MW, Allikmets R, Goedert JJ, Buchbinder SP,
Vittinghoff E, Gomperts E, Donfield S, Vlahov D, Kaslow R, Saah A, Rinaldo C, Detels R, O'Brien
SJ. Genetic restriction of HIV-1 infection and progression to AIDS by a deletion allele of the CKR5
structural gene. Hemophilia Growth and Development Study, Multicenter AIDS Cohort Study,
Multicenter Hemophilia Cohort Study, San Francisco City Cohort, ALIVE Study. Science
1996;273:1856–1862. [PubMed: 8791590]
Diamond, JM. Guns, germs, and steel: the fates of human societies. Norton; New York: 2005.
Ditton HJ, Zimmer J, Kamp C, Rajpert-De Meyts E, Vogt PH. The AZFa gene DBY (DDX3Y) is widely
transcribed but the protein is limited to the male germ cells by translation control. Hum Mol Genet
2004;13:2333–2341. [PubMed: 15294876]
Dobson AP, Carper ER. Infectious diseases and human population history—throughout history the
establishment of disease has been a side effect of the growth of civilization. Bioscience 1996;46:115–
126.
Gleicher N, Barad DH. Gender as risk factor for autoimmune diseases. J Autoimmun 2007;28:1–6.
[PubMed: 17261360]
Goedert JJ, Kessler CM, Aledort LM, Biggar RJ, Andes WA, White GC, Drummond JE, Vaidya K, Mann
DL, Eyster ME, Ragni MV, Lederman MM, Cohen AR, Bray GL, Rosenberg PS, Friedman RM,
Hilgartner MW, Blattner WA, Kroner B, Gail MH. A prospective-study of human immunodeficiency
virus type-1 infection and the development of AIDS in subjects with hemophilia. N Engl J Med 1989;321:1141–1148. [PubMed: 2477702]
Hamilton G, Stoneking M, Excoffier L. Molecular analysis reveals tighter social regulation of
immigration in patrilocal populations than in matrilocal populations. Proc Natl Acad Sci USA
2005;102:7476–7480. [PubMed: 15894624]
Henrard DR, Phillips JF, Muenz LR, Blattner WA, Wiesner D, Eyster ME, Goedert JJ. Natural history
of HIV-1 cell-free viremia. JAMA 1995;274:554–558. [PubMed: 7629984]
Sezgin et al. Page 10
Hum Genet . Author manuscript; available in PMC 2010 June 14.
NI H-P A A
ut h or Manus c r i pt
NI H-P A A ut h or Manus c r i pt
NI H-P A A ut h or
Manus c r i pt
7/18/2019 Association of Y chromosome haplogroup I with HIV progression, and HAART outcome
http://slidepdf.com/reader/full/association-of-y-chromosome-haplogroup-i-with-hiv-progression-and-haart-outcome 11/20
Hilgartner MW, Donfield SM, Willoughby A, Contant CF, Evatt BL, Gomperts ED, Hoots WK, Jason
J, Loveland KA, Mckinlay SM, Stehbens JA. Hemophilia growth and development study—design,
methods, and entry data. Am J Pediatr Hematol Oncol 1993;15:208–218. [PubMed: 8498644]
Ivanov R, Hol S, Aarts T, Hagenbeek A, Slager EH, Ebeling S. UTY-specific TCR-transfer generates
potential graft-versus-leukaemia effector T cells. Br J Haematol 2005;129:392–402. [PubMed:
15842664]
Jobling MA, Tyler-Smith C. The human Y chromosome: an evolutionary marker comes of age. Nat Rev
Genet 2003;4:598–612. [PubMed: 12897772]
Jobling MA, Williams GA, Schiebel GA, Pandya GA, McElreavey GA, Salas GA, Rappold GA, Affara
NA, Tyler-Smith C. A selective difference between human Y-chromosomal DNA haplotypes. Curr
Biol 1998;8:1391–1394. [PubMed: 9889101]
Karafet TM, Mendez FL, Meilerman MB, Underhill PA, Zegura SL, Hammer MF. New binary
polymorphisms reshape and increase resolution of the human Y chromosomal haplogroup tree.
Genome Res 2008;18:830–838. [PubMed: 18385274]
Katzenstein TL, Pedersen C, Nielsen C, Lundgren JD, Jakobsen PH, Gerstoft J. Longitudinal serum HIV
RNA quantification: correlation to viral phenotype at seroconversion and clinical outcome. AIDS
1996;10:167–173. [PubMed: 8838704]
Krausz C, Quintana-Murci L, Forti G. Y chromosome polymorphisms in medicine. Ann Med
2004;36:573–583. [PubMed: 15768829]
Lahn BT, Page DC. Functional coherence of the human Y chromosome. Science 1997;278:675–680.
[PubMed: 9381176]
Laurin D, Spierings E, van der Veken LT, Hamrouni A, Falkenburg JH, Souillet G, Vermeulen C, Farre
A, Galambrun C, Rigal D, Bertrand Y, Goulmy E, Eljaafari A. Minor histocompatibility antigen
DDX3Y induces HLA-DQ5-restricted T cell responses with limited TCR-Vbeta usage both in vivo
and in vitro. Biol Blood Marrow Transplant 2006;12:1114–1124. [PubMed: 17085304]
Libert F, Cochaux P, Beckman G, Samson M, Aksenova M, Cao A, Czeizel A, Claustres M, de la Rua
C, Ferrari M, Ferrec C, Glover G, Grinde B, Guran S, Kucinskas V, Lavinha J, Mercier B, Ogur G,
Peltonen L, Rosatelli C, Schwartz M, Spitsyn V, Timar L, Beckman L, Parmentier M, Vassart G.
The deltaccr5 mutation conferring protection against HIV–1 in Caucasian populations has a single
and recent origin in Northeastern Europe. Hum Mol Genet 1998;7:399–406. [PubMed: 9466996]
Lind JM, Hutcheson-Dilks HB, Williams SM, Moore JH, Essex M, Ruiz-Pesini E, Wallace DC, Tishkoff
SA, O'Brien SJ, Smith MW. Elevated male European and female African contributions to the
genomes of African American individuals. Hum Genet 2007;120:713–722. [PubMed: 17006671]
Lyles RH, Munoz A, Yamashita TE, Bazmi H, Detels R, Rinaldo CR, Margolick JB, Phair JP, Mellors
JW. Natural history of human immunodeficiency virus type 1 viremia after seroconversion and
proximal to AIDS in a large cohort of homosexual men. Multicenter AIDS Cohort Study. J Infect
Dis 2000;181:872–880. [PubMed: 10720507]
Marriott I, Huet-Hudson YM. Sexual dimorphism in innate immune responses to infectious organisms.
Immunol Res 2006;34:177–192. [PubMed: 16891670]
Martin MP, Dean M, Smith MW, Winkler C, Gerrard B, Michael NL, Lee B, Doms RW, Margolick J,
Buchbinder S, Goedert JJ, O'Brien TR, Hilgartner MW, Vlahov D, O'Brien SJ, Carrington M. Genetic
acceleration of AIDS progression by a promoter variant of CCR5. Science 1998;282:1907–1911.
[PubMed: 9836644]
McCarthy M. The “gender gap” in autoimmune disease. Lancet 2000;356:1088. [PubMed: 11009154]
Mesa NR, Mondragon MC, Soto ID, Parra MV, Duque C, Ortiz-Barrientos D, Garcia LF, Velez ID, Bravo
ML, Munera JG, Bedoya G, Bortolini MC, Ruiz-Linares A. Autosomal, mtDNA, and Y-chromosome
diversity in Amerinds: pre- and post-Columbian patterns of gene flow in South America. Am J Hum
Genet 2000;67:1277–1286. [PubMed: 11032789]
O'Brien SJ, Nelson GW. Human genes that limit AIDS. Nat Genet 2004;36:565–574. [PubMed:
15167933]
Office of AIDS Research Advisory Council. Guidelines for the use of antiretroviral agents in HIV–1-
infected adults and adolescents. 2006.
http://aidsinfo.nih.gov/ContentFiles/AdultandAdolescentGL05042006050.pdf
Sezgin et al. Page 11
Hum Genet . Author manuscript; available in PMC 2010 June 14.
NI H-P A A
ut h or Manus c r i pt
NI H-P A A ut h or Manus c r i pt
NI H-P A A ut h or
Manus c r i pt
7/18/2019 Association of Y chromosome haplogroup I with HIV progression, and HAART outcome
http://slidepdf.com/reader/full/association-of-y-chromosome-haplogroup-i-with-hiv-progression-and-haart-outcome 12/20
Pezzotti P, Phillips AN, Dorrucci M, Lepri AC, Galai N, Vlahov D, Rezza G. Category of exposure to
HIV and age in the progression to AIDS: longitudinal study of 1199 people with known dates of
seroconversion. HIV Italian Seroconversion Study Group. Br Med J 1996;313:583–586. [PubMed:
8806246]
Phair J, Jacobson L, Detels R, Rinaldo C, Saah A, Schrager L, Munoz A. Acquired immune deficiency
syndrome occurring within 5 years of infection with human immunodeficiency virus type-1: the
Multicenter Aids Cohort Study. J Acquir Immune Defic Syndr Hum Retrovirol 1992;5:490–496.
Price AL, Patterson NJ, Plenge RM, Weinblatt ME, Shadick NA, Reich D. Principal components analysis
corrects for stratification in genome-wide association studies. Nat Genet 2006;38:904–909.
[PubMed: 16862161]
Price AL, Butler J, Patterson N, Capelli C, Pascali VL, Scarnicci F, Ruiz-Linares A, Groop L, Saetta AA,
Korkolopoulou P, Seligsohn U, Waliszewska A, Schirmer C, Ardlie K, Ramos A, Nemesh J,
Arbeitman L, Goldstein DB, Reich D, Hirschhorn JN. Discerning the ancestry of European
Americans in genetic association studies. PLoS Genet 2008;4:e236. [PubMed: 18208327]
Repping S, Skaletsky H, Brown L, van Daalen SK, Korver CM, Pyntikova T, Kuroda-Kawaguchi T, de
Vries JW, Oates RD, Silber S, van der Veen F, Page DC, Rozen S. Polymorphism for a 1.6-Mb
deletion of the human Y chromosome persists through balance between recurrent mutation and
haploid selection. Nat Genet 2003;35:247–251. [PubMed: 14528305]
Repping S, van Daalen SK, Brown LG, Korver CM, Lange J, Marszalek JD, Pyntikova T, van der Veen
F, Skaletsky H, Page DC, Rozen S. High mutation rates have driven extensive structural
polymorphism among human Y chromosomes. Nat Genet 2006;38:463–467. [PubMed: 16501575]
Rootsi S, Magri C, Kivisild T, Benuzzi G, Help H, Bermisheva M, Kutuev I, Barac L, Pericic M,
Balanovsky O, Pshenichnov A, Dion D, Grobei M, Zhivotovsky LA, Battaglia V, Achilli A, Al-
Zahery N, Parik J, King R, Cinnioglu C, Khusnutdinova E, Rudan P, Balanovska E, Scheffrahn W,
Simonescu M, Brehm A, Goncalves R, Rosa A, Moisan JP, Chaventre A, Ferak V, Furedi S, Oefner
PJ, Shen PD, Beckman L, Mikerezi I, Terzic R, Primorac D, Cambon-Thomsen A, Krumina A,
Torroni A, Underhill PA, Santachiara-Benerecetti AS, Villems R, Semino O. Phylogeography of Y-
chromosome haplogroup I reveals distinct domains of prehistoric gene flow in Europe. Am J Hum
Genet 2004;75:128–137. [PubMed: 15162323]
Seielstad MT, Minch E, Cavalli-Sforza LL. Genetic evidence for a higher female migration rate in
humans. Nat Genet 1998;20:278–280. [PubMed: 9806547]
Shin HD, Winkler C, Stephens JC, Bream J, Young H, Goedert JJ, O'Brien TR, Vlahov D, Buchbinder
S, Giorgi J, Rinaldo C, Donfield S, Willoughby A, O'Brien SJ, Smith MW. Genetic restriction of
HIV-1 pathogenesis to AIDS by promoter alleles of IL10. Proc Natl Acad Sci USA 2000;97:14467–
14472. [PubMed: 11121048]Skaletsky H, Kuroda-Kawaguchi T, Minx PJ, Cordum HS, Hillier L, Brown LG, Repping S, Pyntikova
T, Ali J, Bieri T, Chinwalla A, Delehaunty A, Delehaunty K, Du H, Fewell G, Fulton L, Fulton R,
Graves T, Hou SF, Latrielle P, Leonard S, Mardis E, Maupin R, McPherson J, Miner T, Nash W,
Nguyen C, Ozersky P, Pepin K, Rock S, Rohlfing T, Scott K, Schultz B, Strong C, Tin-Wollam A,
Yang SP, Waterston RH, Wilson RK, Rozen S, Page DC. The male-specific region of the human Y
chromosome is a mosaic of discrete sequence classes. Nature 2003;423:825–837. [PubMed:
12815422]
Smith MW, Dean M, Carrington M, Winkler C, Huttley GA, Lomb DA, Goedert JJ, O'Brien TR, Jacobson
LP, Kaslow R, Buchbinder S, Vittinghoff E, Vlahov D, Hoots K, Hilgartner MW, O'Brien SJ.
Contrasting genetic influence of CCR2 and CCR5 variants on HIV-1 infection and disease
progression. Hemophilia Growth and Development Study (HGDS), Multicenter AIDS Cohort Study
(MACS), Multicenter Hemophilia Cohort Study (MHCS), San Francisco City Cohort (SFCC),
ALIVE Study. Science 1997;277:959–965. [PubMed: 9252328]
Storey JD, Tibshirani R. Statistical significance for genomewide studies. Proc Natl Acad Sci USA
2003;100:9440–9445. [PubMed: 12883005]
Teuschert C, Noubade R, Spach K, McElvany B, Bunn JY, Fillmore PD, Zachary JF, Blankenhorn EP.
Evidence that the Y chromosome influences autoimmune disease in male and female mice. Proc Natl
Acad Sci USA 2006;103:8024–8029. [PubMed: 16702550]
Torikai H, Akatsuka Y, Miyazaki M, Warren EH 3rd, Oba T, Tsujimura K, Motoyoshi K, Morishima Y,
Kodera Y, Kuzushima K, Takahashi T. A novel HLA-A*3303-restricted minor histocompatibility
Sezgin et al. Page 12
Hum Genet . Author manuscript; available in PMC 2010 June 14.
NI H-P A A
ut h or Manus c r i pt
NI H-P A A ut h or Manus c r i pt
NI H-P A A ut h or
Manus c r i pt
7/18/2019 Association of Y chromosome haplogroup I with HIV progression, and HAART outcome
http://slidepdf.com/reader/full/association-of-y-chromosome-haplogroup-i-with-hiv-progression-and-haart-outcome 13/20
antigen encoded by an unconventional open reading frame of human TMSB4Y gene. J Immunol
2004;173:7046–7054. [PubMed: 15557202]
Underhill PA, Passarino G, Lin AA, Shen P, Lahr MM, Foley RA, Oefner PJ, Cavalli-Sforza LL. The
phylogeography of Y chromosome binary haplotypes and the origins of modern human populations.
Ann Hum Genet 2001;65:43–62. [PubMed: 11415522]
Vlahov D, Graham N, Hoover D, Flynn C, Bartlett JG, Margolick JB, Lyles CM, Nelson KE, Smith D,
Holmberg S, Farzadegan H. Prognostic indicators for AIDS and infectious disease death in HIV-
infected injection drug users: plasma viral load and CD4(+) cell count. JAMA 1998;279:35–40.
[PubMed: 9424041]
Vogt MH, de Paus RA, Voogt PJ, Willemze R, Falkenburg JH. DFFRY codes for a new human male-
specific minor transplantation antigen involved in bone marrow graft rejection. Blood 2000;95:1100–
1105. [PubMed: 10648428]
Warren EH, Gavin MA, Simpson E, Chandler P, Page DC, Disteche C, Stankey KA, Greenberg PD,
Riddell SR. The human UTY gene encodes a novel HLA-B8-restricted H-Y antigen. J Immunol
2000;164:2807–2814. [PubMed: 10679124]
Wesley JD, Tessmer MS, Paget C, Trottein F, Brossay L. A Y chromosome-linked factor impairs NK T
development. J Immunol 2007;179:3480–3487. [PubMed: 17785781]
Whitacre CC. Sex differences in autoimmune disease. Nat Immunol 2001;2:777–780. [PubMed:
11526384]
Whitacre CC, Reingold SC, O'Looney PA. A gender gap in autoimmunity. Science 1999;283:1277–1278.
[PubMed: 10084932]
Wilder JA, Kingan SB, Mobasher Z, Pilkington MM, Hammer MF. Global patterns of human
mitochondrial DNA and Y-chromosome structure are not influenced by higher migration rates of
females versus males. Nat Genet 2004;36:1122–1125. [PubMed: 15378061]
Wilkins JF. Unraveling male and female histories from human genetic data. Curr Opin Genet Dev
2006;16:611–617. [PubMed: 17067791]
Wilkins JF, Marlowe FW. Sex-biased migration in humans: what should we expect from genetic data?
Bioessays 2006;28:290–300. [PubMed: 16479583]
Wolfe ND, Dunavan CP, Diamond J. Origins of major human infectious diseases. Nature 2007;447:279–
283. [PubMed: 17507975]
Wood ET, Stover DA, Ehret C, Destro-Bisol G, Spedini G, McLeod H, Louie L, Bamshad M, Strassmann
BI, Soodyall H, Hammer MF. Contrasting patterns of Y chromosome and mtDNA variation in Africa:
evidence for sex-biased demographic processes. Eur J Hum Genet 2005;13:867–876. [PubMed:
15856073]
Sezgin et al. Page 13
Hum Genet . Author manuscript; available in PMC 2010 June 14.
NI H-P A A
ut h or Manus c r i pt
NI H-P A A ut h or Manus c r i pt
NI H-P A A ut h or
Manus c r i pt
7/18/2019 Association of Y chromosome haplogroup I with HIV progression, and HAART outcome
http://slidepdf.com/reader/full/association-of-y-chromosome-haplogroup-i-with-hiv-progression-and-haart-outcome 14/20
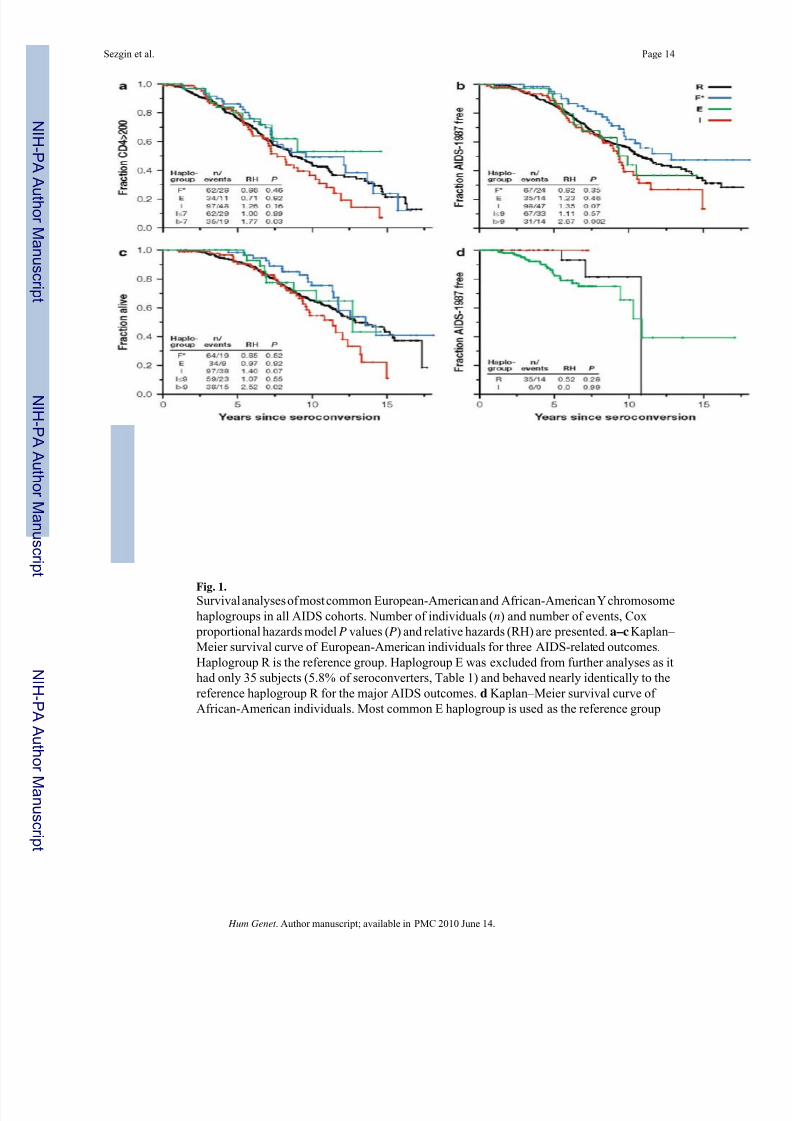
Fig. 1.Survival analyses of most common European-American and African-American Y chromosome
haplogroups in all AIDS cohorts. Number of individuals (n) and number of events, Cox
proportional hazards model P values (P) and relative hazards (RH) are presented. a–c Kaplan–
Meier survival curve of European-American individuals for three AIDS-related outcomes.
Haplogroup R is the reference group. Haplogroup E was excluded from further analyses as it
had only 35 subjects (5.8% of seroconverters, Table 1) and behaved nearly identically to the
reference haplogroup R for the major AIDS outcomes. d Kaplan–Meier survival curve of
African-American individuals. Most common E haplogroup is used as the reference group
Sezgin et al. Page 14
Hum Genet . Author manuscript; available in PMC 2010 June 14.
NI H-P A A
ut h or Manus c r i pt
NI H-P A A ut h or Manus c r i pt
NI H-P A A ut h or
Manus c r i pt
7/18/2019 Association of Y chromosome haplogroup I with HIV progression, and HAART outcome
http://slidepdf.com/reader/full/association-of-y-chromosome-haplogroup-i-with-hiv-progression-and-haart-outcome 15/20
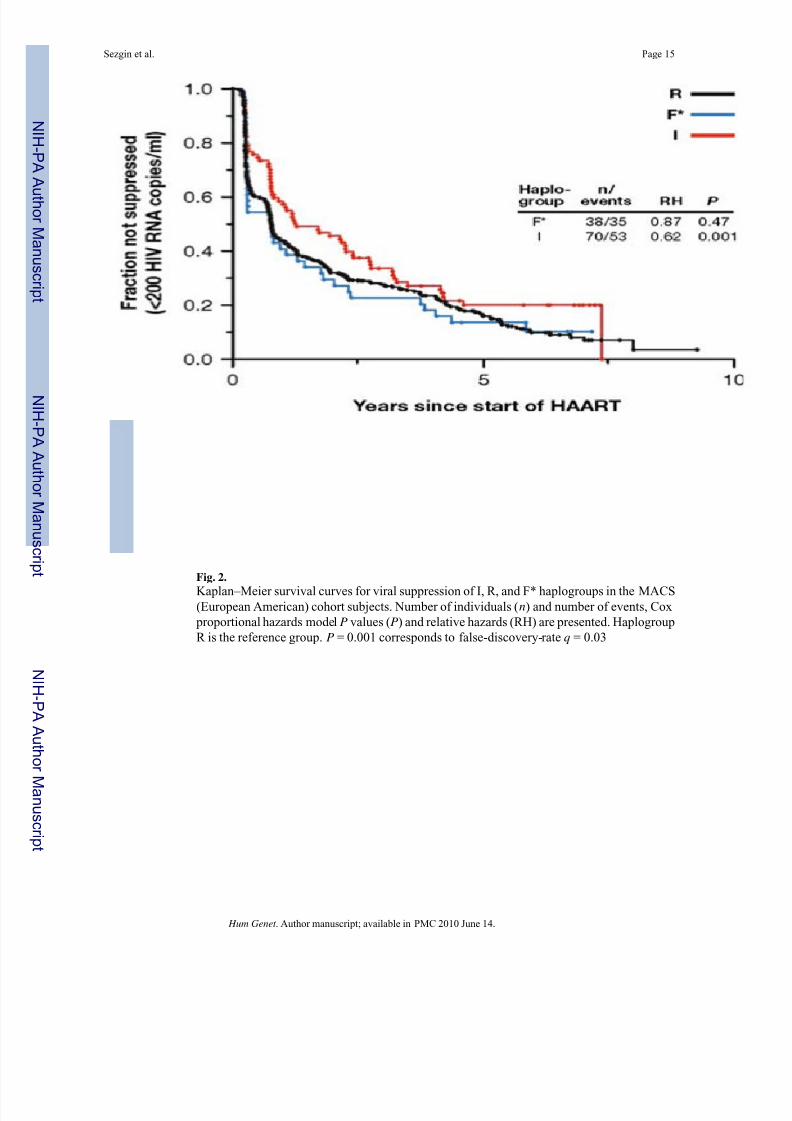
Fig. 2.
Kaplan–Meier survival curves for viral suppression of I, R, and F* haplogroups in the MACS(European American) cohort subjects. Number of individuals (n) and number of events, Cox
proportional hazards model P values (P) and relative hazards (RH) are presented. Haplogroup
R is the reference group. P = 0.001 corresponds to false-discovery-rate q = 0.03
Sezgin et al. Page 15
Hum Genet . Author manuscript; available in PMC 2010 June 14.
NI H-P A A
ut h or Manus c r i pt
NI H-P A A ut h or Manus c r i pt
NI H-P A A ut h or
Manus c r i pt
7/18/2019 Association of Y chromosome haplogroup I with HIV progression, and HAART outcome
http://slidepdf.com/reader/full/association-of-y-chromosome-haplogroup-i-with-hiv-progression-and-haart-outcome 16/20
NI H-P A
A ut h or Manus c r i pt
NI H-P A A ut h or Manus c r
i pt
NI H-P A A ut h
or Manus c r i pt
Sezgin et al. Page 16
T a b l e
1
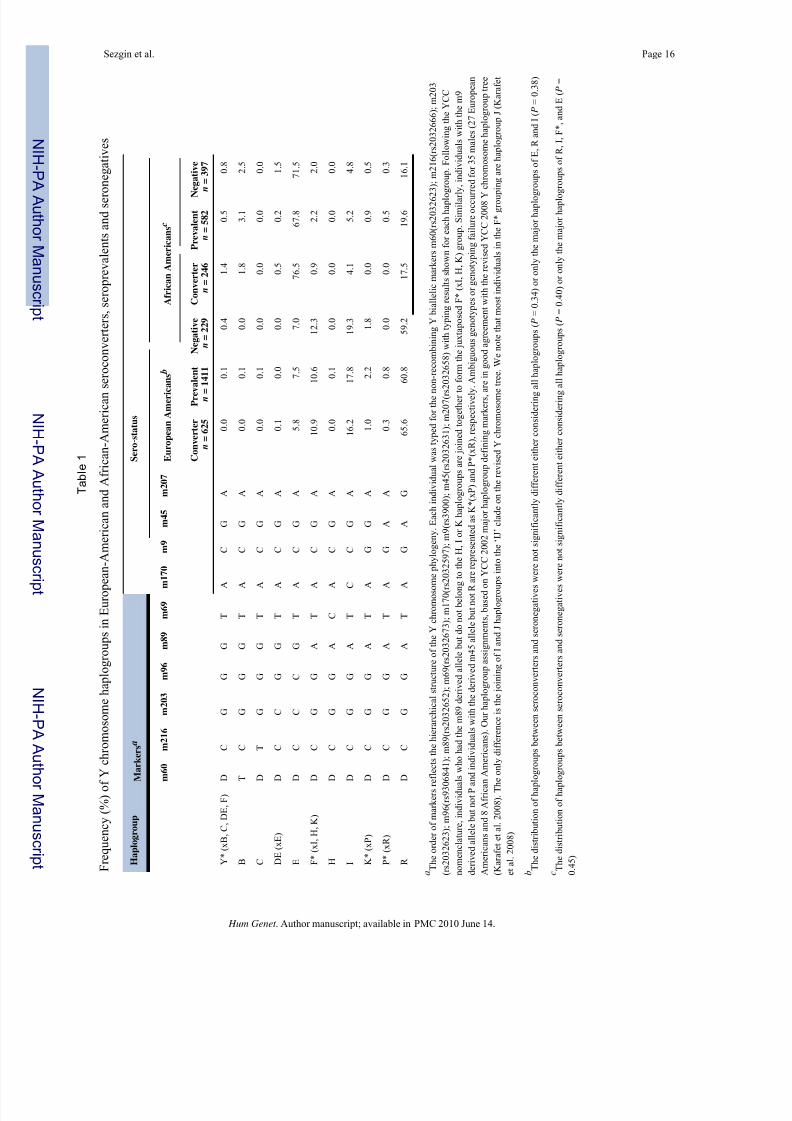
F r e q u e n c y ( % ) o f
Y c h r o m o s o m e h a p l o g r o u p s i n E u r o p
e a n - A m e r i c a n a n d A f r i c a n - A m e r i c a n s e r o c o n v e r t e r s , s e r o p r e v a l e n t s a n d s e r o n e g a t i v e s
H a p l o g r o u p
M a r k e r s a
S e r o - s t a t u s
m 6 0
m 2 1 6
m 2 0 3
m 9 6
m 8 9
m 6 9
m 1 7 0
m 9
m 4 5
m 2 0 7
E u r o p e a n A m e r i c a n s b
A f r i c a n A m e r i c a n s c
C o n v e r t e r
n = 6 2 5
P r e v a l e n t
n =
1 4 1 1
N e g a t i v e
n = 2 2 9
C o n v e r t e r
n = 2 4 6
P r e v a l e n t
n = 5 8 2
N
e g a t i v e
n = 3 9 7
Y * ( x B , C , D E , F )
D
C
G
G
G
T
A
C
G
A
0 . 0
0 . 1
0 . 4
1 . 4
0 . 5
0 . 8
B
T
C
G
G
G
T
A
C
G
A
0 . 0
0 . 1
0 . 0
1 . 8
3 . 1
2 . 5
C
D
T
G
G
G
T
A
C
G
A
0 . 0
0 . 1
0 . 0
0 . 0
0 . 0
0 . 0
D E ( x E )
D
C
C
G
G
T
A
C
G
A
0 . 1
0 . 0
0 . 0
0 . 5
0 . 2
1 . 5
E
D
C
C
C
G
T
A
C
G
A
5 . 8
7 . 5
7 . 0
7 6 . 5
6 7 . 8
7 1 . 5
F * ( x I , H , K )
D
C
G
G
A
T
A
C
G
A
1 0 . 9
1 0 . 6
1 2 . 3
0 . 9
2 . 2
2 . 0
H
D
C
G
G
A
C
A
C
G
A
0 . 0
0 . 1
0 . 0
0 . 0
0 . 0
0 . 0
I
D
C
G
G
A
T
C
C
G
A
1 6 . 2
1 7 . 8
1 9 . 3
4 . 1
5 . 2
4 . 8
K * ( x P )
D
C
G
G
A
T
A
G
G
A
1 . 0
2 . 2
1 . 8
0 . 0
0 . 9
0 . 5
P * ( x R )
D
C
G
G
A
T
A
G
A
A
0 . 3
0 . 8
0 . 0
0 . 0
0 . 5
0 . 3
R
D
C
G
G
A
T
A
G
A
G
6 5 . 6
6 0 . 8
5 9 . 2
1 7 . 5
1 9 . 6
1 6 . 1
a T h e o r d e r o f m a r k e r s r e f l e c t s t h e h i e r a r c h i c a l s t r u c t u r e o f t h e Y c h r o m o s o
m e p h y l o g e n y . E a c h i n d i v i d u a l w a s t y p e d f o r t h e n
o n - r e c o m b i n i n g Y b i a l l e l i c m a r k e r s m 6 0 ( r s 2 0 3 2 6 2
3 ) ; m 2 1 6 ( r s 2 0 3 2 6 6 6 ) ; m 2 0 3
( r s 2 0 3 2 6 2 3 ) ; m 9 6 ( r s 9 3 0
6 8 4 1 ) ; m 8 9 ( r s 2 0 3 2 6 5 2 ) ; m 6 9 ( r s 2 0 3 2 6 7 3 ) ; m 1 7 0 ( r s 2 0 3 2 5 9 7 ) ; m 9 ( r s 3 9 0 0 ) ; m 4 5 ( r s 2 0 3 2 6 3 1 ) ; m 2 0 7 ( r s
2 0 3 2 6 5 8 ) w i t h t y p i n g r e s u l t s s h o w n f o r e a c h h a p l o
g r o u p . F o l l o w i n g t h e Y C C
n o m e n c l a t u r e , i n d i v i d u a
l s w h o h a d t h e m 8 9 d e r i v e d a l l e l e b u t d o n o t b e l o n
g t o t h e H , I o r K h a p l o g r o u p s a r e j o i n e d t o g e t h e r t o f o r m t h e j u x t a p o s e d F * ( x I , H , K ) g r o u p . S i m i l a r l y , i n d i v i d u a l s w i t h t h e m 9
d e r i v e d a l l e l e b u t n o t P a
n d i n d i v i d u a l s w i t h t h e d e r i v e d m 4 5 a l l e l e b u t n o t R
a r e r e p r e s e n t e d a s K * ( x P ) a n d P * ( x R ) , r e s p e c t i v e l y
. A m b i g u o u s g e n o t y p e s o r g e n o t y p i n g f a i l u r e o c c u r r e d f o r 3 5 m a l e s ( 2 7 E u r o p e a n
A m e r i c a n s a n d 8 A f r i c a n A m e r i c a n s ) . O u r h a p l o g r o u p a s s i g n m e n t s , b a s e d o n Y C C 2 0 0 2 m a j o r h a p l o g r o u p d e f i n i n g m a r k e r s , a
r e i n g o o d a g r e e m e n t w i t h t h e r e v i s e d Y C C 2 0 0 8 Y
c h r o m o s o m e h a p l o g r o u p t r e e
( K a r a f e t e t a l . 2 0 0 8 ) . T h
e o n l y d i f f e r e n c e i s t h e j o i n i n g o f I a n d J h a p l o g r o u
p s i n t o t h e ‘ I J ’ c l a d e o n t h e r e v i s e d Y c h r o m o s o m e
t r e e . W e n o t e t h a t m o s t i n d i v i d u a l s i n t h e F * g r o u p i n g a r e h a p l o g r o u p J ( K a r a f e t
e t a l . 2 0 0 8 )
b T h e d i s t r i b u t i o n o f h a p
l o g r o u p s b e t w e e n s e r o c o n v e r t e r s a n d s e r o n e g a t i v e s w e r e n o t s i g n i f i c a n t l y d i f f e r e n t e i t h e r c o n s i d e r i n g
a l l h a p l o g r o u p s ( P = 0 . 3 4 ) o r o n l y t h e m a j o r h a p l o g
r o u p s o f E , R a n d I ( P = 0 . 3 8 )
c T h e d i s t r i b u t i o n o f h a p
l o g r o u p s b e t w e e n s e r o c o n v e r t e r s a n d s e r o n e g a t i v e s w e r e n o t s i g n i f i c a n t l y d i f f e r e n t e i t h e r c o n s i d e r i n g
a l l h a p l o g r o u p s ( P = 0 . 4 0 ) o r o n l y t h e m a j o r h a p l o g r o u p s o f R , I , F * , a n d E ( P =
0 . 4 5 )
Hum Genet . Author manuscript; available in PMC 2010 June 14.
7/18/2019 Association of Y chromosome haplogroup I with HIV progression, and HAART outcome
http://slidepdf.com/reader/full/association-of-y-chromosome-haplogroup-i-with-hiv-progression-and-haart-outcome 17/20
NI H-P A
A ut h or Manus c r i pt
NI H-P A A ut h or Manus c r
i pt
NI H-P A A ut h
or Manus c r i pt
Sezgin et al. Page 17
T a b l e
2
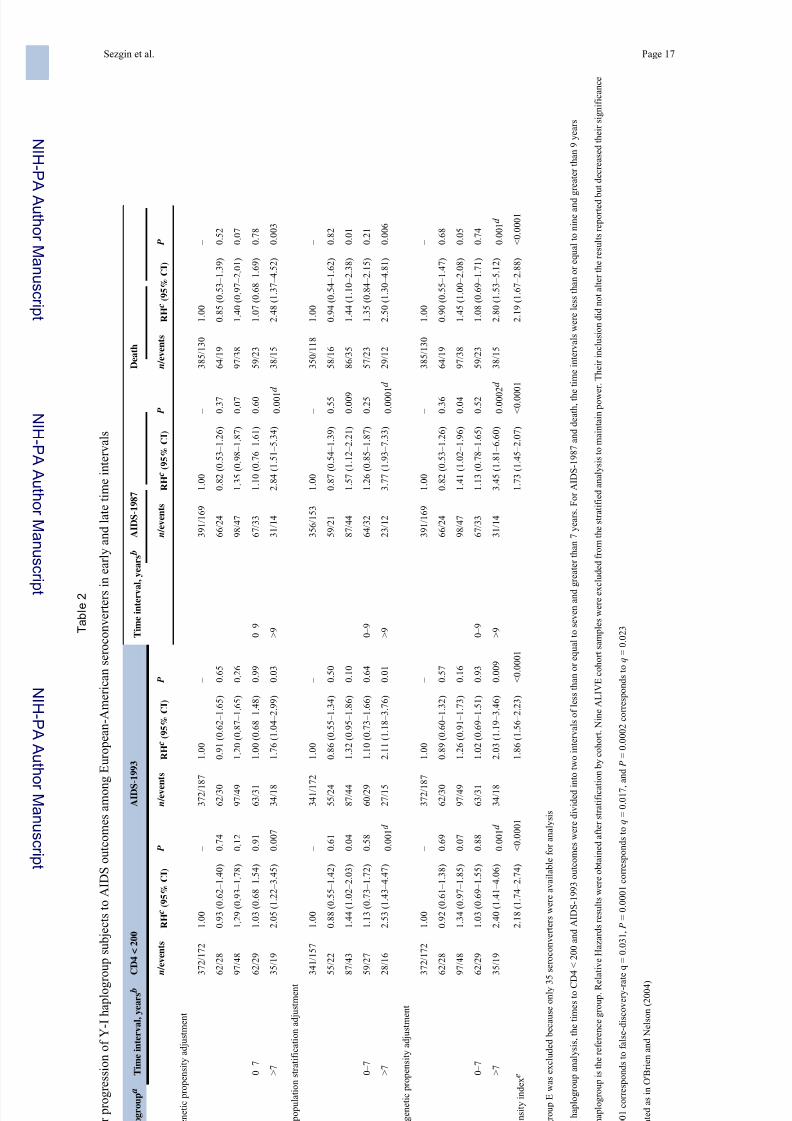
h a p l o g r
o u p s u b j e c t s t o A I D S o u t c o m e s a m o n g E u r o p e a n - A m e r i c a n s e r o c o n v e r t e r s i n e a r l y a n d l a t e t i m e i n t e r v a l s
, y e a r s b
C D 4 < 2 0 0
A I D S - 1 9 9 3
T i m e i n t e r v a
l , y e a r s
b
A I D S - 1 9 8 7
D e a t h
n / e v e n t s
R H c (
9 5 % C
I )
P
n / e v e n t s
R H c (
9 5 % C
I )
P
n / e v e n t s
R H c (
9 5 % C
I )
P
n / e v e n t s
R H c (
9 5 % C
I )
P
n t
3 7 2 / 1 7 2
1 . 0 0
–
3 7 2 / 1 8 7
1 . 0 0
–
3 9 1 / 1 6 9
1 . 0 0
–
3 8 5 / 1 3 0
1 . 0 0
–
6 2 / 2 8
0 . 9 3 ( 0 . 6 2 – 1 . 4 0 )
0 . 7 4
6 2 / 3 0
0 . 9 1 ( 0 . 6 2 – 1 . 6 5 )
0 . 6 5
6 6 / 2 4
0 . 8 2 ( 0 . 5 3 – 1 . 2 6 )
0 . 3 7
6 4 / 1 9
0 . 8 5 ( 0 . 5 3 – 1 . 3 9 )
0 . 5 2
9 7 / 4 8
1 . 2 9 ( 0 . 9 3 – 1 . 7 8 )
0 . 1 2
9 7 / 4 9
1 . 2 0 ( 0 . 8 7 – 1 . 6 5 )
0 . 2 6
9 8 / 4 7
1 . 3 5 ( 0 . 9 8 – 1 . 8 7 )
0 . 0 7
9 7 / 3 8
1 . 4 0 ( 0 . 9 7 – 2 . 0 1 )
0 . 0 7
6 2 / 2 9
1 . 0 3 ( 0 . 6 8 – 1 . 5 4 )
0 . 9 1
6 3 / 3 1
1 . 0 0 ( 0 . 6 8 – 1 . 4 8 )
0 . 9 9
0 – 9
6 7 / 3 3
1 . 1 0 ( 0 . 7 6 – 1 . 6 1 )
0 . 6 0
5 9 / 2 3
1 . 0 7 ( 0 . 6 8 – 1 . 6 9 )
0 . 7 8
3 5 / 1 9
2 . 0 5 ( 1 . 2 2 – 3 . 4 5 )
0 . 0 0 7
3 4 / 1 8
1 . 7 6 ( 1 . 0 4 – 2 . 9 9 )
0 . 0 3
> 9
3 1 / 1 4
2 . 8 4 ( 1 . 5 1 – 5 . 3 4 )
0 . 0 0 1 d
3 8 / 1 5
2 . 4 8 ( 1 . 3 7 – 4 . 5 2 )
0 . 0 0 3
d j u s t m e n t
3 4 1 / 1 5 7
1 . 0 0
–
3 4 1 / 1 7 2
1 . 0 0
–
3 5 6 / 1 5 3
1 . 0 0
–
3 5 0 / 1 1 8
1 . 0 0
–
5 5 / 2 2
0 . 8 8 ( 0 . 5 5 – 1 . 4 2 )
0 . 6 1
5 5 / 2 4
0 . 8 6 ( 0 . 5 5 – 1 . 3 4 )
0 . 5 0
5 9 / 2 1
0 . 8 7 ( 0 . 5 4 – 1 . 3 9 )
0 . 5 5
5 8 / 1 6
0 . 9 4 ( 0 . 5 4 – 1 . 6 2 )
0 . 8 2
8 7 / 4 3
1 . 4 4 ( 1 . 0 2 – 2 . 0 3 )
0 . 0 4
8 7 / 4 4
1 . 3 2 ( 0 . 9 5 – 1 . 8 6 )
0 . 1 0
8 7 / 4 4
1 . 5 7 ( 1 . 1 2 – 2 . 2 1 )
0 . 0 0 9
8 6 / 3 5
1 . 4 4 ( 1 . 1 0 – 2 . 3 8 )
0 . 0 1
5 9 / 2 7
1 . 1 3 ( 0 . 7 3 – 1 . 7 2 )
0 . 5 8
6 0 / 2 9
1 . 1 0 ( 0 . 7 3 – 1 . 6 6 )
0 . 6 4
0 – 9
6 4 / 3 2
1 . 2 6 ( 0 . 8 5 – 1 . 8 7 )
0 . 2 5
5 7 / 2 3
1 . 3 5 ( 0 . 8 4 – 2 . 1 5 )
0 . 2 1
2 8 / 1 6
2 . 5 3 ( 1 . 4 3 – 4 . 4 7 )
0 . 0 0 1 d
2 7 / 1 5
2 . 1 1 ( 1 . 1 8 – 3 . 7 6 )
0 . 0 1
> 9
2 3 / 1 2
3 . 7 7 ( 1 . 9 3 – 7 . 3 3 )
0 . 0 0 0 1 d
2 9 / 1 2
2 . 5 0 ( 1 . 3 0 – 4 . 8 1 )
0 . 0 0 6
m e n t
3 7 2 / 1 7 2
1 . 0 0
–
3 7 2 / 1 8 7
1 . 0 0
–
3 9 1 / 1 6 9
1 . 0 0
–
3 8 5 / 1 3 0
1 . 0 0
–
6 2 / 2 8
0 . 9 2 ( 0 . 6 1 – 1 . 3 8 )
0 . 6 9
6 2 / 3 0
0 . 8 9 ( 0 . 6 0 – 1 . 3 2 )
0 . 5 7
6 6 / 2 4
0 . 8 2 ( 0 . 5 3 – 1 . 2 6 )
0 . 3 6
6 4 / 1 9
0 . 9 0 ( 0 . 5 5 – 1 . 4 7 )
0 . 6 8
9 7 / 4 8
1 . 3 4 ( 0 . 9 7 – 1 . 8 5 )
0 . 0 7
9 7 / 4 9
1 . 2 6 ( 0 . 9 1 – 1 . 7 3 )
0 . 1 6
9 8 / 4 7
1 . 4 1 ( 1 . 0 2 – 1 . 9 6 )
0 . 0 4
9 7 / 3 8
1 . 4 5 ( 1 . 0 0 – 2 . 0 8 )
0 . 0 5
6 2 / 2 9
1 . 0 3 ( 0 . 6 9 – 1 . 5 5 )
0 . 8 8
6 3 / 3 1
1 . 0 2 ( 0 . 6 9 – 1 . 5 1 )
0 . 9 3
0 – 9
6 7 / 3 3
1 . 1 3 ( 0 . 7 8 – 1 . 6 5 )
0 . 5 2
5 9 / 2 3
1 . 0 8 ( 0 . 6 9 – 1 . 7 1 )
0 . 7 4
3 5 / 1 9
2 . 4 0 ( 1 . 4 1 – 4 . 0 6 )
0 . 0 0 1 d
3 4 / 1 8
2 . 0 3 ( 1 . 1 9 – 3 . 4 6 )
0 . 0 0 9
> 9
3 1 / 1 4
3 . 4 5 ( 1 . 8 1 – 6 . 6 0 )
0 . 0 0 0 2 d
3 8 / 1 5
2 . 8 0 ( 1 . 5 3 – 5 . 1 2 )
0 . 0 0 1 d
2 . 1 8 ( 1 . 7 4 – 2 . 7 4 )
< 0 . 0 0 0 1
1 . 8 6 ( 1 . 5 6 – 2 . 2 3 )
< 0 . 0 0 0 1
1 . 7 3 ( 1 . 4 5 – 2 . 0 7 )
< 0 . 0 0 0 1
2 . 1 9 ( 1 . 6 7 – 2 . 8 8 )
< 0 . 0 0 0 1
u s e o n l y 3 5 s e r o c o n v e r t e r s w e r e a v a i l a b l e f o r a n a l y s i s
i m e s t o C D
4 < 2 0 0 a n d A I D S - 1 9 9 3 o u t c o m e s w e r e d i v i d e d i n t o t w o i n t e r v a l s o f l e s s t h a n o r e q u a l t o s e v e n a n d g r e a t e r t h a n 7 y e a r s . F o r A I D S - 1 9 8 7 a n d d e a t h , t h e
t i m e i n t e r v a l s w e r e l e s s t h a n o r e q u a l t o n i n e a n d g r e a t e r t h a n 9 y e a r s
g r o u p . R e l a t i v e H a z a r d s r e s u l t s w e r e o b t a i n e d a f t e r s t r a t i f i c a t i o n b y c o h o r t . N i n e A L I V E c o h o r t s a m p l e s w e r e e x c l u d e d f r o m t h e s t r a t i f i e d a n a l y s i s t o m a i n t a i n p o w e
r . T h e i r i n c l u s i o n d i d n o t a l t e r t h e r e s u l t s r e p o r t e d b
u t d e c r e a s e d t h e i r s i g n i f i c a n c e
s c o v e r y - r a t e q = 0 . 0 3 1 , P = 0 . 0 0 0 1 c o r r e s p o n d s t o q = 0 . 0 1 7 , a n d P = 0 . 0 0 0 2 c o r r e s p o n d s t o q = 0 . 0 2 3
o n ( 2 0 0 4 )
7/18/2019 Association of Y chromosome haplogroup I with HIV progression, and HAART outcome
http://slidepdf.com/reader/full/association-of-y-chromosome-haplogroup-i-with-hiv-progression-and-haart-outcome 18/20
NI H-P A
A ut h or Manus c r i pt
NI H-P A A ut h or Manus c r
i pt
NI H-P A A ut h
or Manus c r i pt
Sezgin et al. Page 18
T a b l e
3
S i g n i f i c a n t a s s o c i a t i o n s o f Y - I h a p l o g r o u p w i t h A I D S p
r o g r e s s i o n a n d v i r a l s u p p r e s s i o n o u t c o
m e s w i t h c o r r e s p o n d i n g q v a l u e s ( ≤ 0 . 0 5 )
O u t c o m e
S e c t i o n
H a p l o g r o u p
P a t i e n
t g r o u p a
N o m i n a l P
q v a l u e
R H ( 9 5 % C
I )
A d j u s t m e n t s
T i m e t o C D 4 < 2 0 0 > 7 y e a r s
T a b l e 4
I 1 a *
A l l
0 . 0 0 1
0 . 0 3 1
2 . 7 1 ( 1 . 5 1 – 4 . 8 5 )
T a b l e 2
I
A l l
0 . 0 0 1
0 . 0 3 1
2 . 5 3 ( 1 . 4 3 – 4 . 4 7 )
P o p u l a t i o n s t r a t i f i c a t i o n
T a b l e 2
I
A l l
0 . 0 0 1
0 . 0 3 1
2 . 4 0 ( 1 . 4 1 – 4 . 0 6 )
G e n e t i c p r o p e n s i t y i n d e x
T i m e t o A I D S - 1 9 8 7 > 9 y e a r s
T a b l e S 2
I
M A C S
c o h o r t
0 . 0 0 0 7
0 . 0 3 1
5 . 5 2 ( 2 . 0 6 – 1 4 . 8 4 )
P o p u l a t i o n s t r a t i f i c a t i o n
T a b l e 4
I 1 a *
A l l
0 . 0 0 0 1
0 . 0 1 7
4 . 9 1 ( 2 . 4 1 – 9 . 8 8 )
T a b l e 2
I
A l l
0 . 0 0 0 1
0 . 0 1 7
3 . 7 7 ( 1 . 9 3 – 7 . 3 3 )
P o p u l a t i o n s t r a t i f i c a t i o n
T a b l e 2
I
A l l
0 . 0 0 0 2
0 . 0 2 3
3 . 4 5 ( 1 . 8 1 – 6 . 6 0 )
G e n e t i c p r o p e n s i t y i n d e x
“ R e s u l t s ” b
I
A l l
0 . 0 0 0 9
0 . 0 3 1
2 . 9 3 ( 1 . 4 5 – 5 . 0 6 )
C C R 5 - Δ 3 2
T a b l e 2
I
A l l
0 . 0 0 1
0 . 0 3 1
2 . 8 4 ( 1 . 5 1 – 5 . 3 4 )
T i m e t o d e a t h > 9 y e a r s
T a b l e S 4
I
M H C S
c o h o r t
0 . 0 0 0 7
0 . 0 3 1
6 . 3 0 ( 2 . 1 8 – 1 8 . 2 1 )
G e n e t i c p r o p e n s i t y i n d e x
T a b l e 2
I
A l l
0 . 0 0 1
0 . 0 3 1
2 . 8 0 ( 1 . 5 3 – 5 . 1 2 )
G e n e t i c p r o p e n s i t y i n d e x
V i r a l s u p p r e s s i o n p o s
t - H A A R T
T a b l e 5
I
M A C S
c o h o r t
0 . 0 0 1
0 . 0 3 1
0 . 6 2 ( 0 . 4 6 – 0 . 8 4 )
T h e p r o p o r t i o n o f f a l s e p o s i t i v e s e s t i m a t e d f r o m 4 1 4 P v a l u e s ( 3 2 5 E u r o p e a n A m e r i c a n a n d 8 9 A f r i c a n A m e r i c a n t e s t s ) . A f a l s e - d i s c o v e r y - r a t e q v a l u e c u t - o f f o f 0 . 0 5 w a s u s e d f o r s i g n i f i c a n c e . A l l s i g n i f i c a n t
a n a l y s e s w e r e C o x p r o p o r t i o n a l h a z a r d t e s t s
a E u r o p e a n - A m e r i c a n s i g n i f i c a n t t e s t s a f t e r q v a l u e a n a l y s i s . N o t e s t s o f A f r i c a n A m e r i c a n s w e r e f a l s e - d i s c o v e r y - r a t e q v a l u e ≤
0 . 0 5
b S e e r e s u l t s s u b s e c t i o n “ G e n e t i c c o f a c t o r s ”
Hum Genet . Author manuscript; available in PMC 2010 June 14.
7/18/2019 Association of Y chromosome haplogroup I with HIV progression, and HAART outcome
http://slidepdf.com/reader/full/association-of-y-chromosome-haplogroup-i-with-hiv-progression-and-haart-outcome 19/20
NI H-P A
A ut h or Manus c r i pt
NI H-P A A ut h or Manus c r
i pt
NI H-P A A ut h
or Manus c r i pt
Sezgin et al. Page 19
T a b l e
4
p l o g r o u p s w i t h p r o g r e s s i o n t o A I D S o u t c o m e s
a m o n g E u r o p e a n A m e r i c a n s e r o c o n v e r t e r s
y e a r s a
C D 4 < 2 0 0
A I D S - 1 9 9 3
T i m e i n t e r v a l
( y e a r s ) a
A I D S - 1 9 8 7
D e a t h
n / e v e n t s
R H b ( 9 5 % C
I )
P
n / e v e n t s
R H b ( 9 5 % C
I )
P
n / e v e n t s
R H b ( 9 5 % C
I )
P
n / e v e n t s
R H b ( 9 5 % C
I )
P
3 7 2 / 1 7 2
1 . 0 0
–
3 7 2 / 1 8 7
1 . 0 0
–
3 9 1 / 1 6 9
1 . 0 0
–
3 8 5 / 1 3 0
1 . 0 0
–
6 2 / 2 8
0 . 9 2 ( 0 . 6 1 – 1 . 3 8 )
0 . 6 9
6 2 / 3 0
0 . 8 9 ( 0 . 6 0 – 1 . 3 2 )
0 . 5 7
6 6 / 2 4
0 . 8 2 ( 0 . 5 3 – 1 . 2 6 )
0 . 3 6
6 4 / 1 9
0 . 9 0 ( 0 . 5 5 – 1 . 4 7 )
0 . 6 8
5 5 / 3 0
1 . 3 6 ( 0 . 9 2 – 2 . 0 2 )
0 . 1 2
5 5 / 3 0
1 . 2 7 ( 0 . 8 6 – 1 . 8 7 )
0 . 2 3
5 5 / 2 9
1 . 4 2 ( 0 . 9 5 – 2 . 1 0 )
0 . 0 9
5 4 / 2 2
1 . 3 4 ( 0 . 8 5 – 2 . 1 2 )
0 . 2 0
4 2 / 1 8
1 . 3 2 ( 0 . 8 1 – 2 . 1 5 )
0 . 2 7
4 2 / 1 9
1 . 2 4 ( 0 . 7 7 – 1 . 9 9 )
0 . 3 8
4 3 / 1 8
1 . 4 1 ( 0 . 8 6 – 2 . 3 0 )
0 . 1 7
4 3 / 1 6
1 . 6 1 ( 0 . 9 6 – 2 . 7 2 )
0 . 0 7
3 3 / 1 5
0 . 9 1 ( 0 . 5 3 – 1 . 5 5 )
0 . 7 2
3 4 / 1 6
0 . 9 0 ( 0 . 5 4 – 1 . 5 2 )
0 . 7 0
0 – 9
3 6 / 1 8
0 . 9 8 ( 0 . 6 0 – 1 . 6 0 )
0 . 9 2
3 1 / 1 3
1 . 0 0 ( 0 . 5 6 – 1 . 7 9 )
0 . 9 9
2 2 / 1 5
2 . 7 1 ( 1 . 5 1 – 4 . 8 5 )
0 . 0 0 1 d
2 1 / 1 4
2 . 3 6 ( 1 . 3 0 – 4 . 2 7 )
0 . 0 0 5
> 9
1 9 / 1 1
4 . 9 1 ( 2 . 4 1 – 9 . 8 8 )
0 . 0 0 0 1
d
2 3 / 9
2 . 5 4 ( 1 . 2 1 – 5 . 3 3 )
0 . 0 1
2 9 / 1 4
1 . 2 1 ( 0 . 7 0 – 2 . 1 1 )
0 . 5 0
2 9 / 1 5
1 . 1 8 ( 0 . 6 9 – 2 . 0 2 )
0 . 5 4
0 – 9
3 2 / 1 6
1 . 3 8 ( 0 . 8 2 – 2 . 3 2 )
0 . 2 2
2 8 / 1 0
1 . 2 1 ( 0 . 6 3 – 2 . 3 3 )
0 . 5 7
1 3 / 4
1 . 6 7 ( 0 . 6 0 – 4 . 6 9 )
0 . 3 3
1 3 / 4
1 . 3 8 ( 0 . 4 9 – 3 . 8 3 )
0 . 5 4
> 9
1 1 / 2
1 . 3 8 ( 0 . 3 3 – 5 . 7 6 )
0 . 6 6
1 5 / 6
3 . 2 8 ( 1 . 3 7 – 7 . 8 3 )
0 . 0 0 8
2 . 2 4 ( 1 . 7 8 – 2 . 8 2 )
< 0 . 0 0 0 1
1 . 8 8 ( 1 . 5 8 – 2 . 2 5 )
< 0 . 0 0 0 1
1 . 7 6 ( 1 . 4 7 – 2 . 1 0 )
< 0 . 0 0 0 1
2 . 2 3 ( 1 . 6 9 – 2 . 9 2 )
< 0 . 0 0 0 1
e r e n o t s i g n i f i c a n t l y d i f f e r e n t b e t w e e n t h e s u b h a p l o g r o u p s ( S u p p l e m e n t a r y F i g . 1 )
m e s t o C D 4 < 2 0 0 a n d A I D S - 1 9 9 3 o u t c o m e s w e r e d i v i d e d i n t o t w o i n t e r v a l s o f l e s s t h a n o r e q u a l t o s e v e n a n d g r e a t e r t h a n 7 y e a r s . F o r A I D S - 1 9 8 7 a n d d e a t h , t h e t i m e i n t e r v a l s w e r e l e s s t h a n o r e q u a l t o n i n e a n d g r e a t e r t h a n 9 y e a r s
g r o u p . R e l a t i v e H a z a r d s r e s u l t s w e r e o b t a i n e d a f t e r s t r a t i f i c a t i o n b y c o h o r t . N i n e A L I V E c o h o r t s a m p l e s w e r e e x c l u d e d f r o m t h e s t r a t i f i e d a n a l y s i s t o m a i n t a i n p o w e
r . T h e i r i n c l u s i o n d i d n o t a l t e r t h e r e s u l t s r e p o r t e d b
u t d e c r e a s e d t h e i r s i g n i f i c a n c e
b i n e d
s c o v e r y - r a t e q = 0 . 0 3 1 a n d P = 0 . 0 0 0 1 c o r r e s p o n d s t o q = 0 . 0 1 7

7/18/2019 Association of Y chromosome haplogroup I with HIV progression, and HAART outcome
http://slidepdf.com/reader/full/association-of-y-chromosome-haplogroup-i-with-hiv-progression-and-haart-outcome 20/20
NI H-P A
A ut h or Manus c r i pt
NI H-P A A ut h or Manus c r
i pt
NI H-P A A ut h
or Manus c r i pt
Sezgin et al. Page 20
T a b l e
5
S l o w e r H I V - 1 s u p p r e s s i o n o f Y - I s u b j e c t s a m o n g E u r o p
e a n A m e r i c a n h a p l o g r o u p s
H a p l o g r o u p
V i r a l s u p p r e s s i o n ( < 2 0 0 H I V R N A c o p i e s / m L )
V i r
a l s u p p r e s s i o n ( < 5 0 H I V R N A c o p i e s / m L )
C a t e g o r i c a l
S u r v i v a l
C a t e g o r i c a l
S u r v i v a l
N
O R
P a
n / e v e n t s
R H
P b
N
O R
P a
n / e v e n t s
R H
P b
R
3 2 9
1 . 0 0
–
2 5 3 / 2 2 2
1 . 0 0
–
3 2 9
1 . 0 0
–
2 5 3 / 2 0 6
1 . 0 0
–
F *
4 6
1 . 4 9
0 . 5 4
3 8 / 3 5
0 . 8 7
0 . 4 7
4 6
0 . 8 5
0 . 7 2
3 8 / 2 9
1 . 0 0
0 . 9 9
I
9 2
0 . 5 9
0 . 0 7
7 0 / 5 3
0 . 6 2
0 . 0 0 1 c
9 2
0 . 5 4
0 . 0 2
7 0 / 4 7
0 . 6 9
0 . 0 2
I 1 a *
6 0
0 . 7 2
0 . 1 8
5 0 / 3 7
0 . 6 9
0 . 0 6
5 6
0 . 7 0
0 . 1 1
5 0 / 3 2
0 . 7 2
0 . 0 9
I ( x I 1 a * )
3 2
0 . 6 4
0 . 9 6
2 0 / 1 6
0 . 5 9
0 . 0 4
3 6
0 . 5 9
0 . 4 4
2 0 / 1 5
0 . 7 0
0 . 1 5
C a t e g o r i c a l e v e n t s w e r e
d e f i n e d a s u n d e t e c t a b l e v i r a l R N A p o s t - H A A R T . S u r v i v a l a n a l y s e s w e r e a d j u s t e d f o r c l i n i c a l A I D S , b a s e l i n e v i r a l l o a d , a n d b a s e l i n e C D 4 c o u n t . A l l p a t i e n t s w e r e f r o m M A C S c o h o r t
a F i s h e r ' s e x a c t t e s t r e s u l t s . H a p l o g r o u p R i s t h e r e f e r e n c e g r o u p
b L o g - l i k e l i h o o d P v a l u e
s . H a p l o g r o u p R i s t h e r e f e r e n c e g r o u p
c F a l s e - d i s c o v e r y - r a t e q
= 0 . 0 3 1
Hum Genet . Author manuscript; available in PMC 2010 June 14.