association studies of complex diseases
DESCRIPTION
Association studies of complex diseases. COMPLEX DISEASES 1. 1. Incomplete penetrance (avaldumine) and phenocopy (fenokoopiad) 2. Genetic heterogeneity 3. Oligo/polygenic inheritance l i = l 1 l 2 l 3... l n (multiplicative effect) l i = l 1+ l 2+ l 3+...+ l n (addititive effekt). - PowerPoint PPT PresentationTRANSCRIPT
Association studies of complex Association studies of complex diseasesdiseases
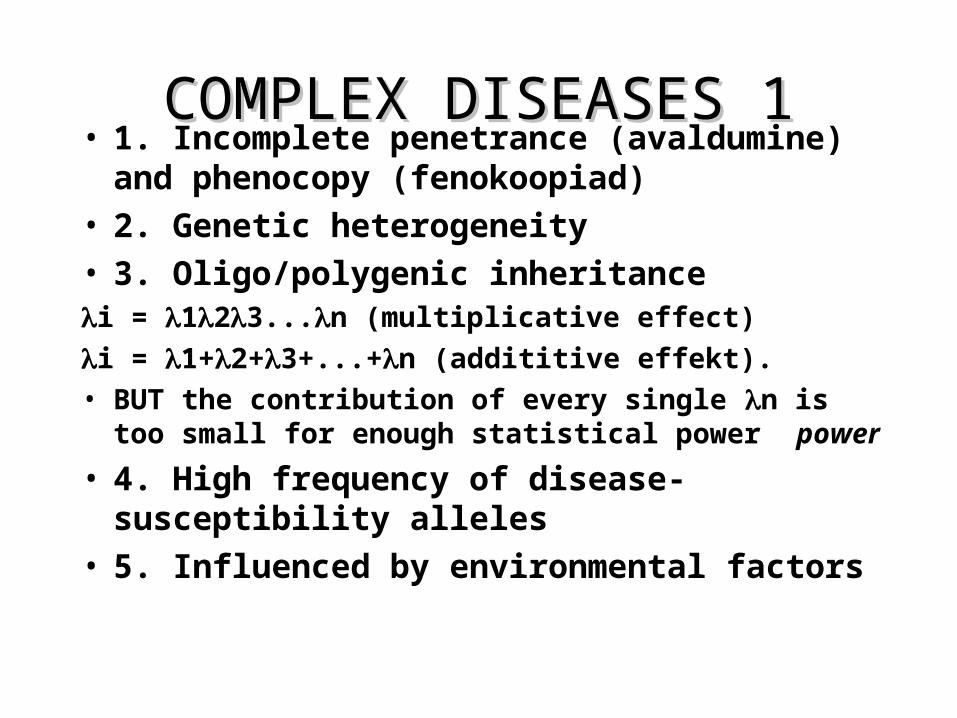
COMPLEX DISEASES 1COMPLEX DISEASES 1• 1. Incomplete penetrance (avaldumine) and
phenocopy (fenokoopiad)
• 2. Genetic heterogeneity
• 3. Oligo/polygenic inheritancei = 123...n (multiplicative effect) i = 1+2+3+...+n (addititive effekt).• BUT the contribution of every single n is
too small for enough statistical power power
• 4. High frequency of disease-susceptibility alleles
• 5. Influenced by environmental factors
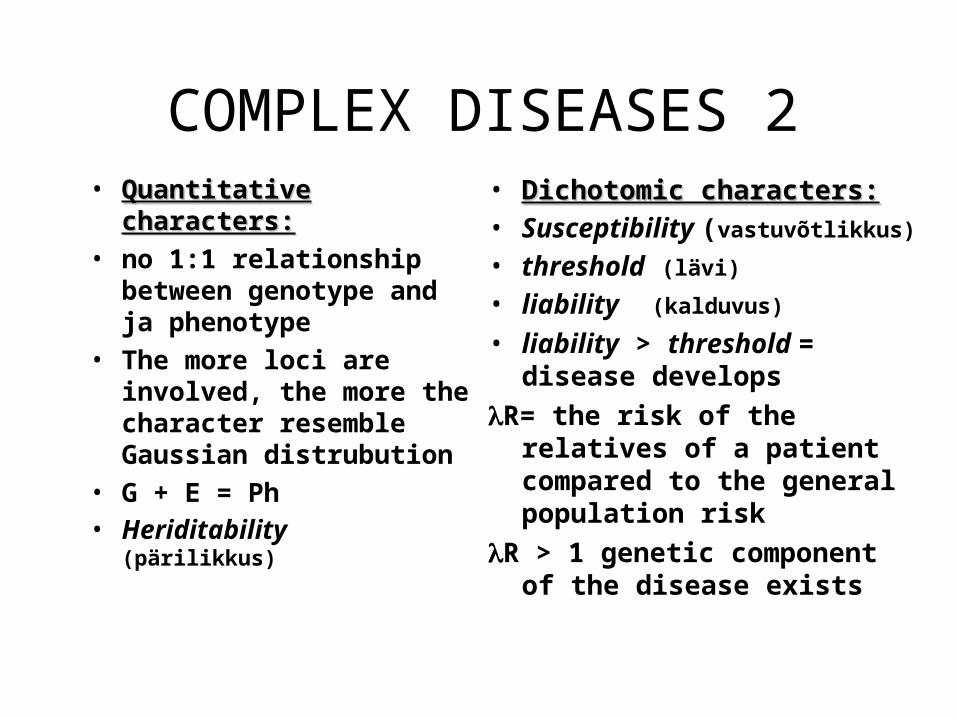
COMPLEX DISEASES 2• Quantitative Quantitative
characters:characters:• no 1:1 relationship
between genotype and ja phenotype
• The more loci are involved, the more the character resemble Gaussian distrubution
• G + E = Ph• Heriditability
(pärilikkus)
• Dichotomic characters:Dichotomic characters:• Susceptibility
(vastuvõtlikkus)
• threshold (lävi)
• liability (kalduvus)
• liability > threshold = disease develops
R= the risk of the relatives of a patient compared to the general population risk
R > 1 genetic component of the disease exists
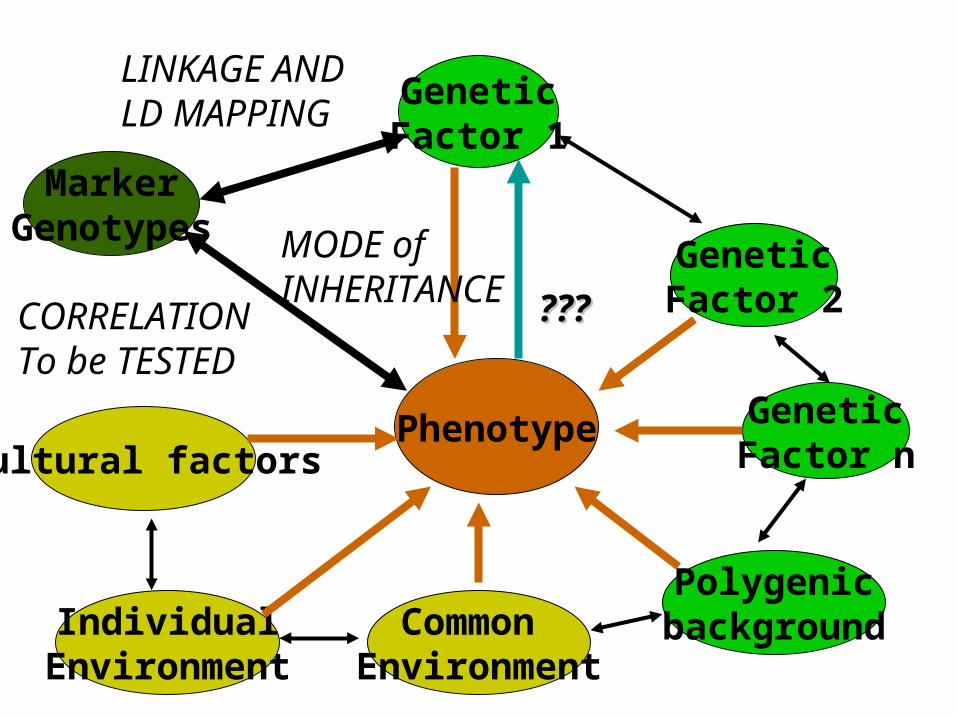
Phenotype
GeneticFactor 2
GeneticFactor 1
GeneticFactor n
PolygenicbackgroundCommon
EnvironmentIndividual
Environment
Cultural factors
MarkerGenotypes
??????
LINKAGE AND LD MAPPING
CORRELATIONTo be TESTED
MODE of INHERITANCE
GENOTYPE GENOTYPE
EFFECTEFFECT
PHENOTYPE PHENOTYPE
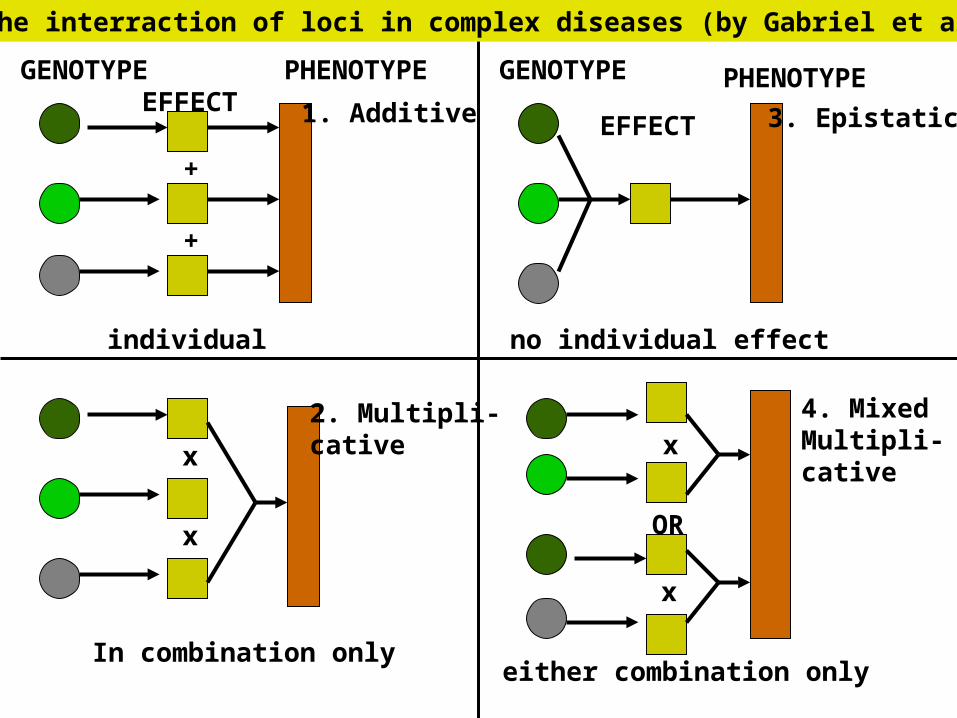
individual
In combination only
no individual effect
either combination only
1. Additive
2. Multipli-cative
3. Epistatic
4. MixedMultipli-cative
+
+
x
x
x
OR
x
Models for the interraction of loci in complex diseases (by Gabriel et al., 2002)
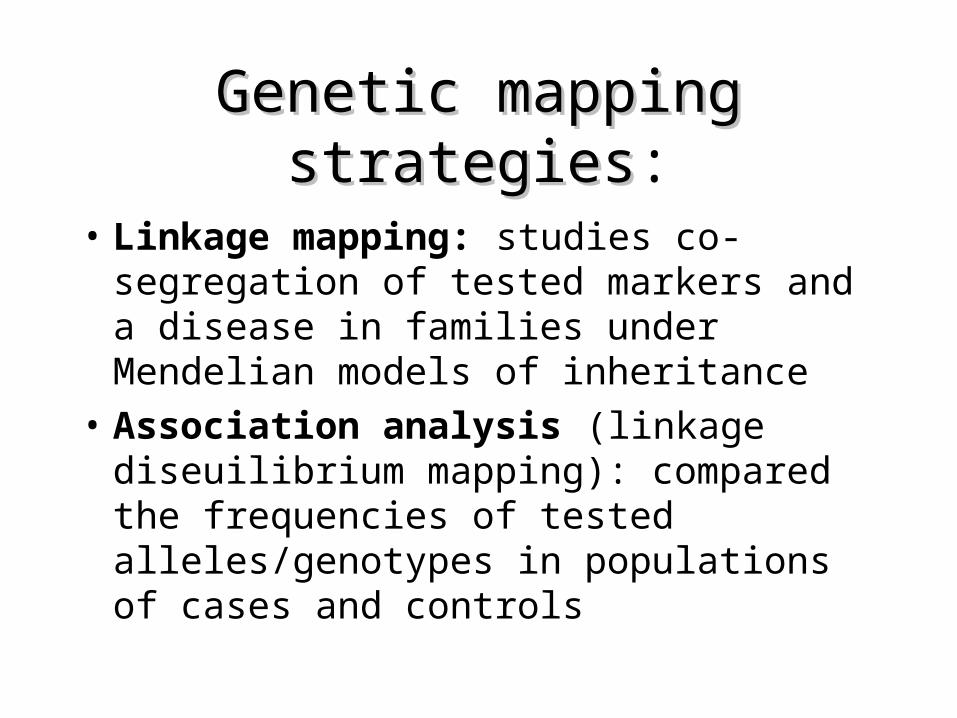
Genetic mapping strategiesGenetic mapping strategies:
• Linkage mapping: studies co-segregation of tested markers and a disease in families under Mendelian models of inheritance
• Association analysis (linkage diseuilibrium mapping): compared the frequencies of tested alleles/genotypes in populations of cases and controls
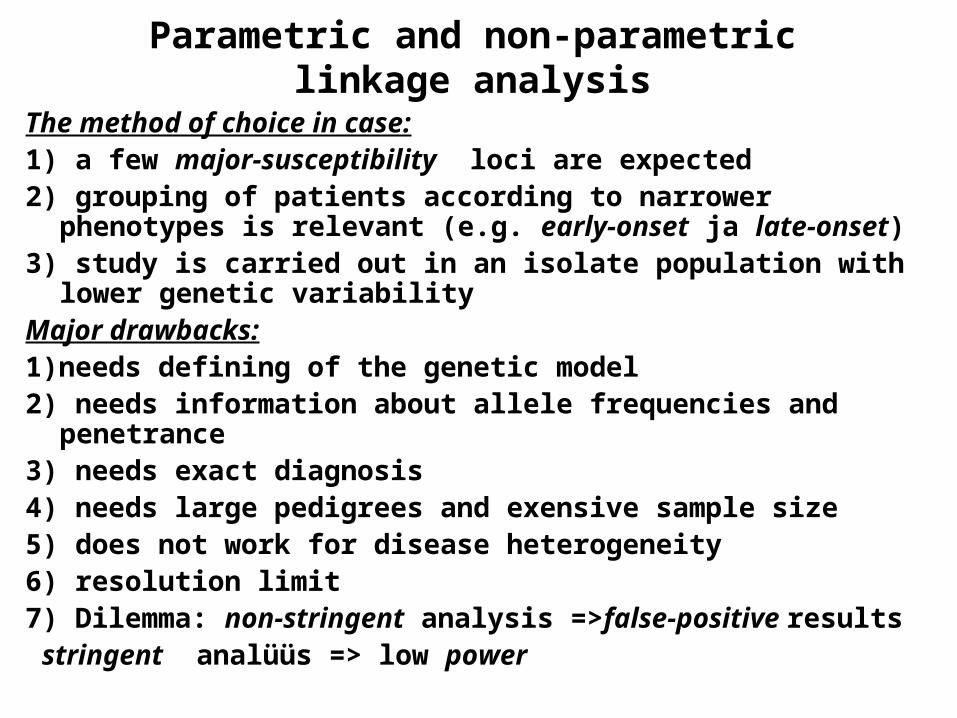
Parametric and non-parametric linkage analysis
The method of choice in case:1) a few major-susceptibility loci are expected2) grouping of patients according to narrower phenotypes
is relevant (e.g. early-onset ja late-onset)3) study is carried out in an isolate population with lower
genetic variabilityMajor drawbacks:1)needs defining of the genetic model2) needs information about allele frequencies and
penetrance3) needs exact diagnosis4) needs large pedigrees and exensive sample size5) does not work for disease heterogeneity6) resolution limit7) Dilemma: non-stringent analysis =>false-positive
results stringent analüüs => low power

Strategies used for successful complex Strategies used for successful complex disease studies by linkage analysisdisease studies by linkage analysis:
• I. Grouping of patients:
• A. family vrs. Sporiadic cases (breast, colon cancer)
• B. Detailed diagnosis (diabetes, Hirschprung disease)
• II. Linkage study using only the selected subgroup of patients followed by positional cloning or positional candidate approach
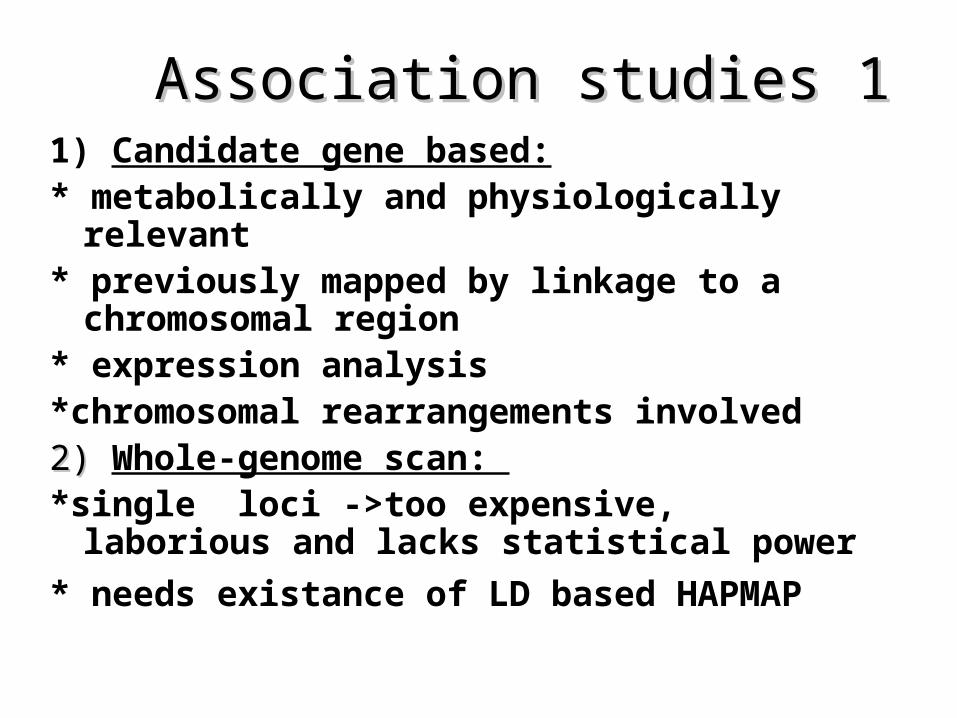
Association studies 1Association studies 11) Candidate gene based:* metabolically and physiologically relevant* previously mapped by linkage to a chromosomal
region* expression analysis*chromosomal rearrangements involved 2) 2) Whole-genome scan: *single loci ->too expensive, laborious and lacks
statistical power
* needs existance of LD based HAPMAP
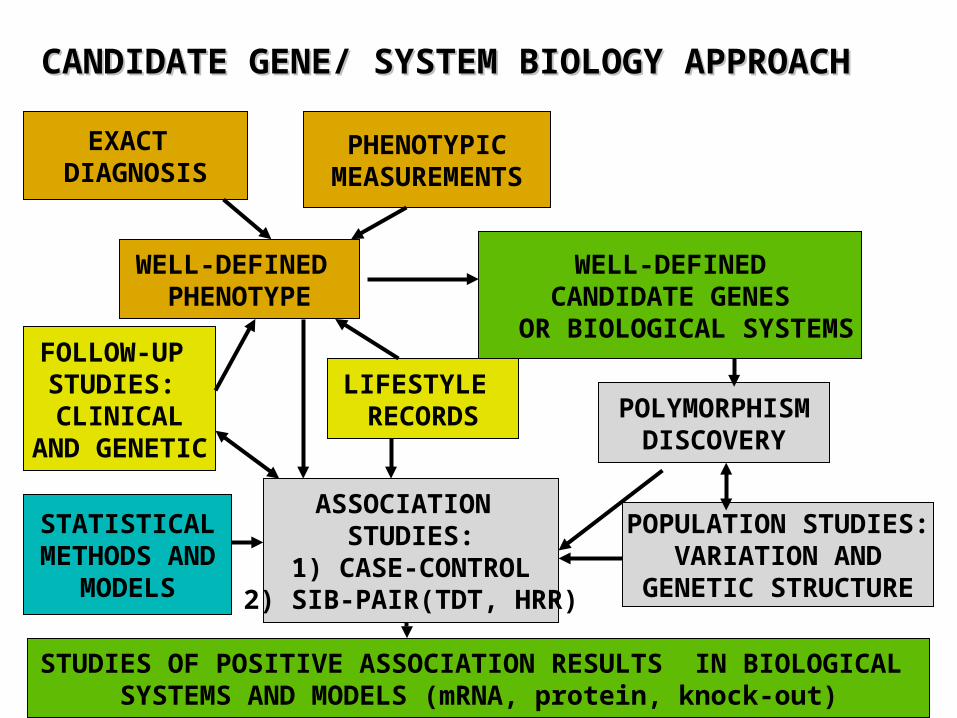
WELL-DEFINED PHENOTYPE
WELL-DEFINEDCANDIDATE GENES
OR BIOLOGICAL SYSTEMS
PHENOTYPICMEASUREMENTS
EXACT DIAGNOSIS
POLYMORPHISMDISCOVERY
LIFESTYLE RECORDS
ASSOCIATION STUDIES:
1) CASE-CONTROL2) SIB-PAIR(TDT, HRR)
FOLLOW-UP STUDIES: CLINICAL
AND GENETIC
CANDIDATE GENE/ SYSTEM BIOLOGY APPROACHCANDIDATE GENE/ SYSTEM BIOLOGY APPROACH
POPULATION STUDIES:VARIATION AND
GENETIC STRUCTURE
STATISTICALMETHODS AND
MODELS
STUDIES OF POSITIVE ASSOCIATION RESULTS IN BIOLOGICAL SYSTEMS AND MODELS (mRNA, protein, knock-out)
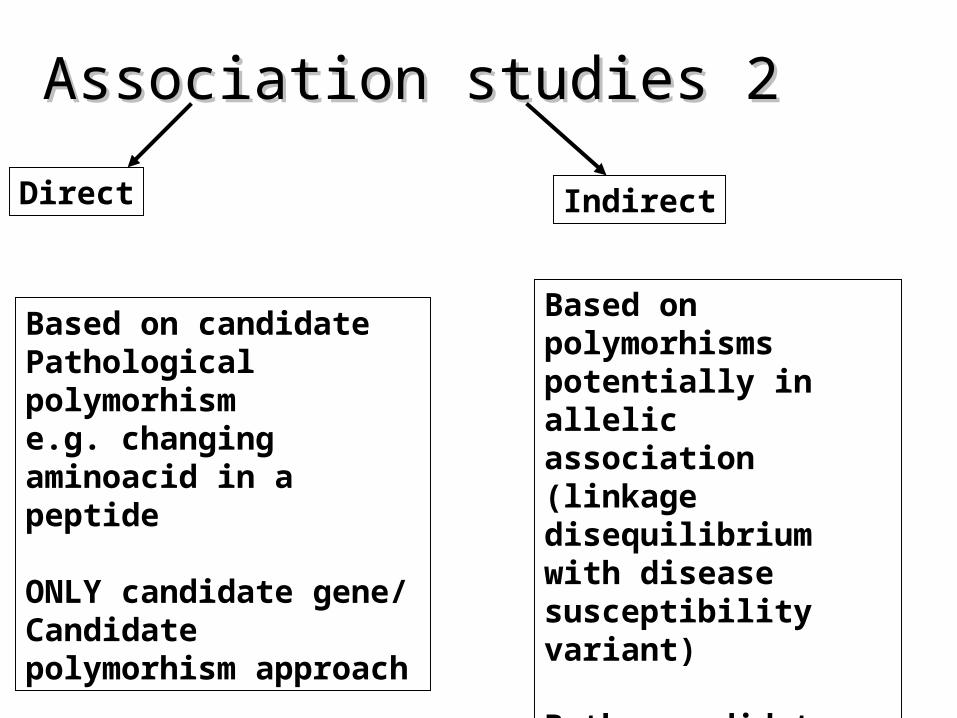
Association studies 2Association studies 2
Direct Indirect
Based on candidatePathological polymorhisme.g. changing aminoacid in a peptide
ONLY candidate gene/Candidate polymorhism approach
Based on polymorhisms potentially in allelic association (linkage disequilibrium with disease susceptibility variant)
Both, candidate gene or region and whole genome scan approaches
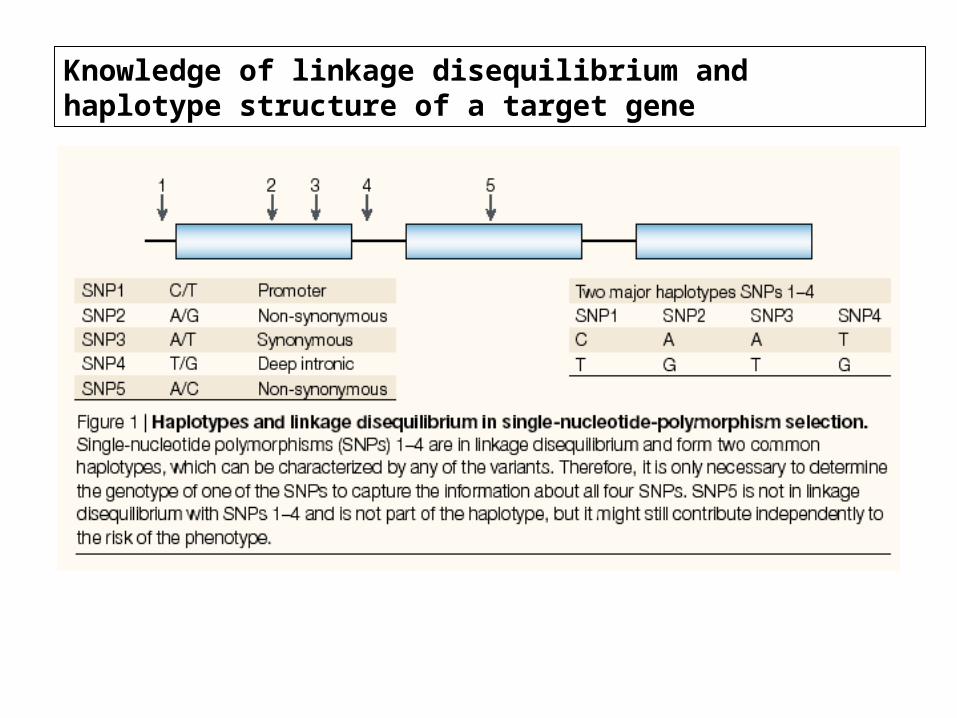
Knowledge of linkage disequilibrium and haplotype structure of a target gene
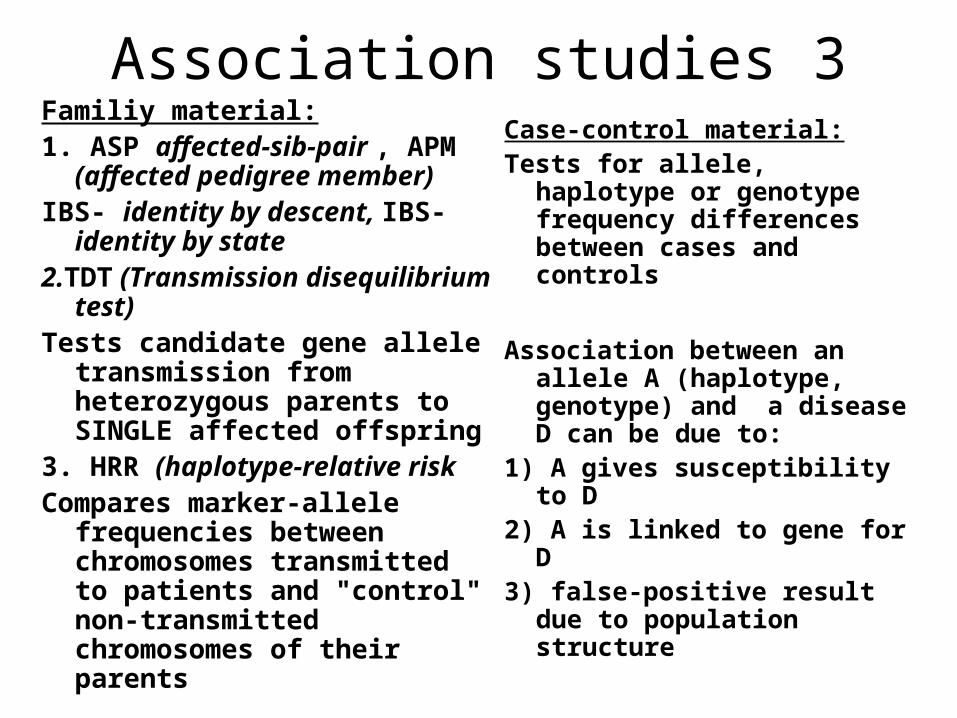
Association studies 3Familiy material:1. ASP affected-sib-pair , APM
(affected pedigree member) IBS- identity by descent, IBS-
identity by state2.TDT (Transmission
disequilibrium test)Tests candidate gene allele
transmission from heterozygous parents to SINGLE affected offspring
3. HRR (haplotype-relative risk
Compares marker-allele frequencies between chromosomes transmitted to patients and "control" non-transmitted chromosomes of their parents
Case-control material:Tests for allele, haplotype
or genotype frequency differences between cases and controls
Association between an allele A (haplotype, genotype) and a disease D can be due to:
1) A gives susceptibility to D
2) A is linked to gene for D
3) false-positive result due to population structure

Genetic studies and epidemiology
Epidemiology: based on observing and measuring disease patterns in populations, and using association and statistical correlation to identify factors (including genetic) that affect those patterns

Hirschhorn et. al.,2002:• summerized association studies conducted
1986-2000: 166 putative associations studies 3 or more times
• ONLY 6!!!6!!! Have been constantly replicated
• WHY?• 1) limited knowledge of candidate-genes? • 2) limited sample set?• 3) limited list of tested polymorphisms?• 4) limited genetic models and statistical power?
Errors is association studies:Errors is association studies:• Small sample size• Unmatched control-group• Unknown genetic structure (LD structure,
variability etc.) of a population • Unknonwn background-LD around tested
candidate region• Failure to attempt study replication
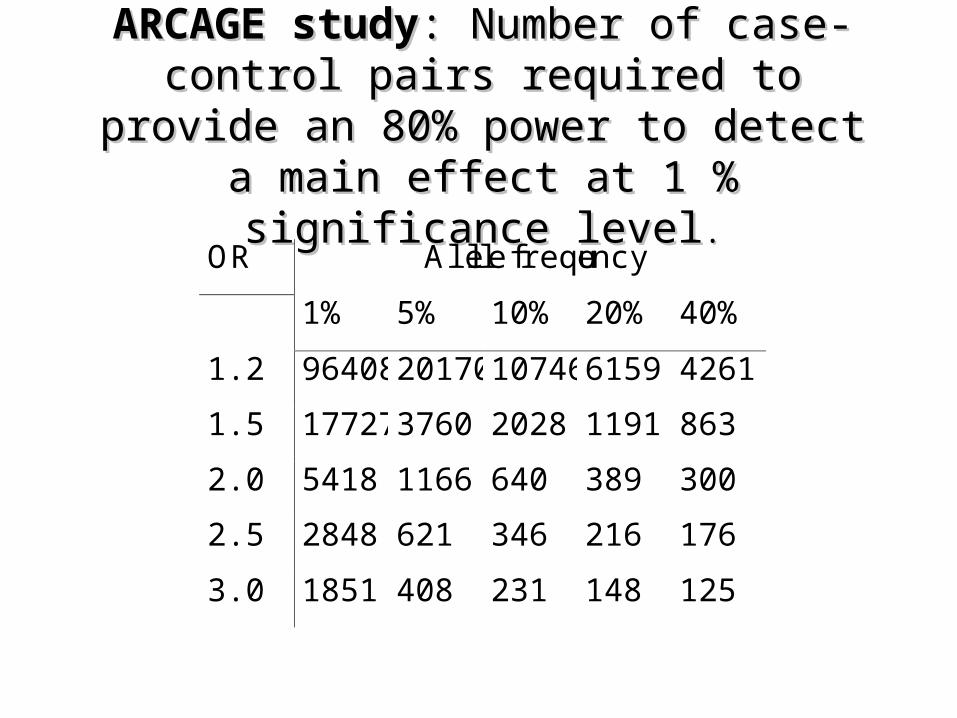
ARCAGE studyARCAGE study: Number of case-control : Number of case-control pairs required to provide an 80% power to pairs required to provide an 80% power to
detect a main effect at 1 % significance leveldetect a main effect at 1 % significance level ..
OR Allele frequency
1% 5% 10% 20% 40%
1.2 96408 20170 10746 6159 4261
1.5 17727 3760 2028 1191 863
2.0 5418 1166 640 389 300
2.5 2848 621 346 216 176
3.0 1851 408 231 148 125
CASES
CONTROLS
CASES
CONTROLS
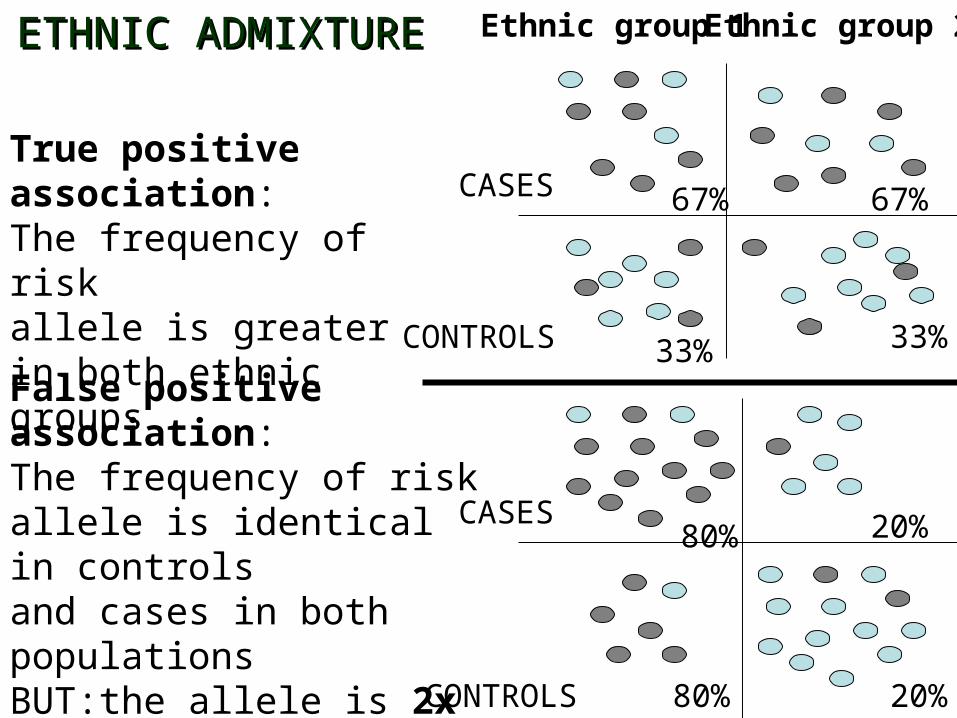
True positive association:The frequency of risk allele is greater in both ethnic groups
Ethnic group 1 Ethnic group 2
False positive association:The frequency of risk allele is identical in controlsand cases in both populationsBUT:the allele is 2x as frequentin cases of pooled population compared to controls
67% 67%
33% 33%
80% 20%
20%80%
ETHNIC ADMIXTUREETHNIC ADMIXTURE
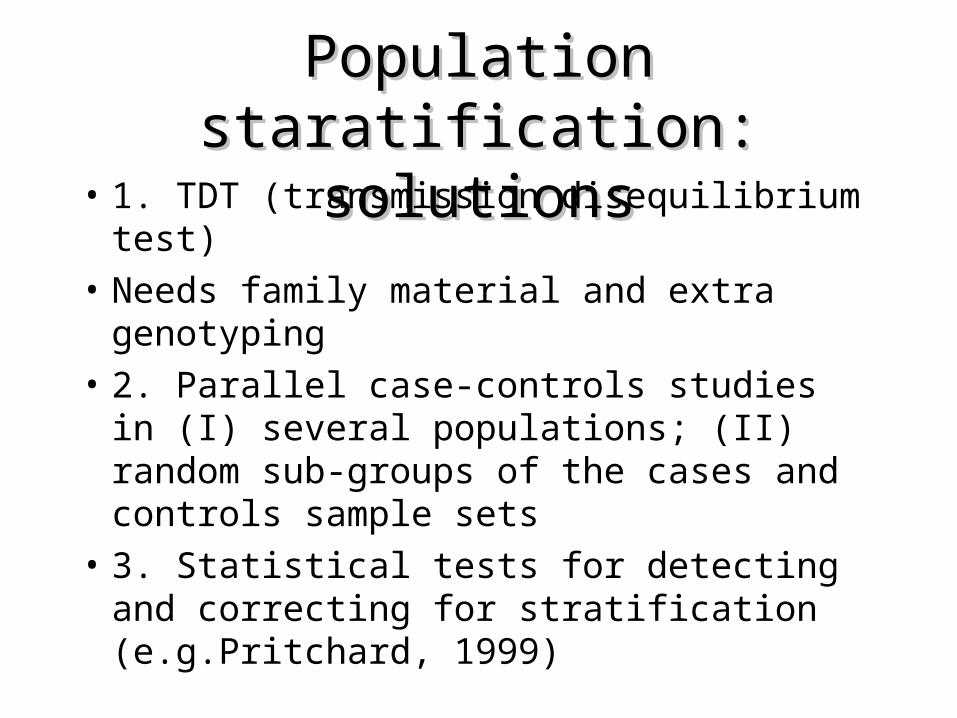
Population staratification: Population staratification: solutionssolutions
• 1. TDT (transmission disequilibrium test)
• Needs family material and extra genotyping
• 2. Parallel case-controls studies in (I) several populations; (II) random sub-groups of the cases and controls sample sets
• 3. Statistical tests for detecting and correcting for stratification (e.g.Pritchard, 1999)
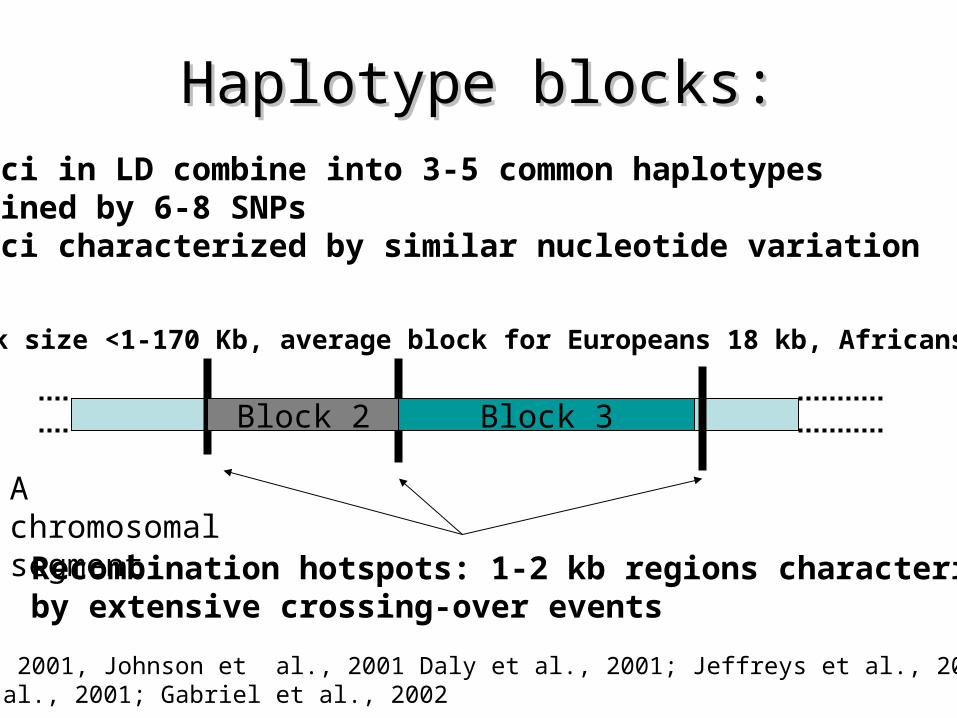
Haplotype blocks:Haplotype blocks:
Recombination hotspots: 1-2 kb regions characterizedby extensive crossing-over events
*loci in LD combine into 3-5 common haplotypes defined by 6-8 SNPs*loci characterized by similar nucleotide variation
Block 2 Block 3
A chromosomal segment
Reich et al., 2001, Johnson et al., 2001 Daly et al., 2001; Jeffreys et al., 2001; Goldstein et al., 2001; Gabriel et al., 2002
Block size <1-170 Kb, average block for Europeans 18 kb, Africans 9kb
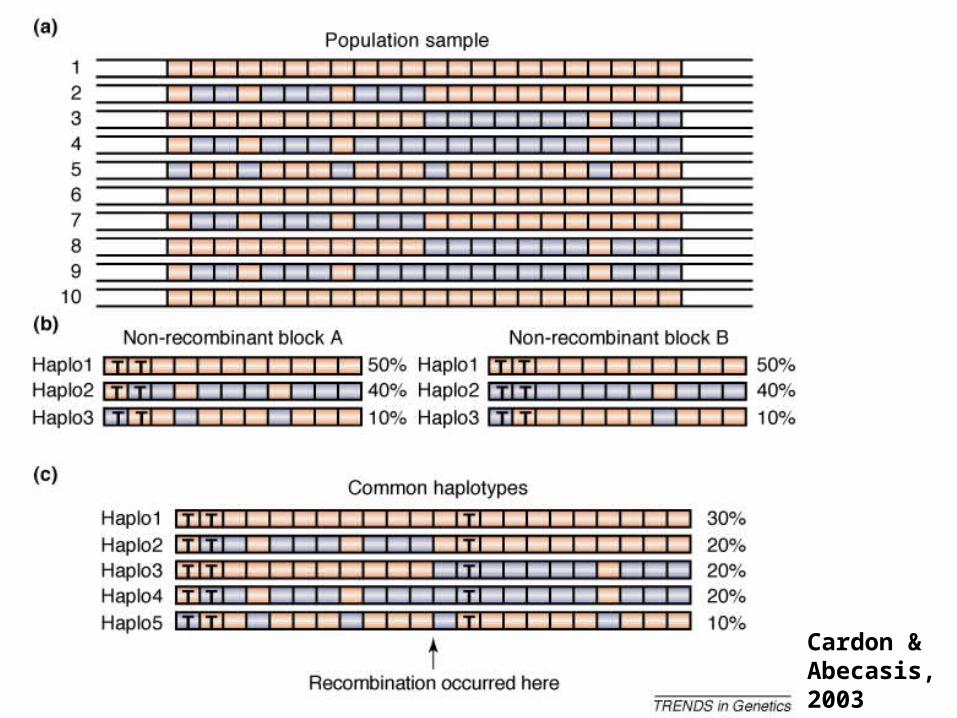
Cardon &Abecasis, 2003
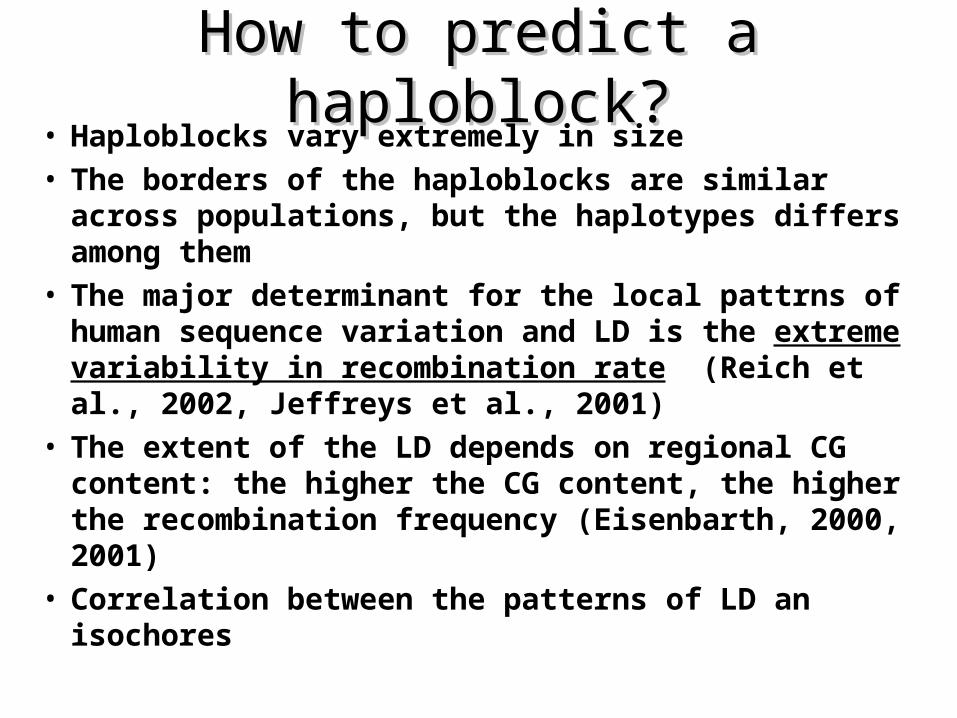
How to predict a haploblock?How to predict a haploblock?• Haploblocks vary extremely in size• The borders of the haploblocks are similar across
populations, but the haplotypes differs among them• The major determinant for the local pattrns of
human sequence variation and LD is the extreme variability in recombination rate (Reich et al., 2002, Jeffreys et al., 2001)
• The extent of the LD depends on regional CG content: the higher the CG content, the higher the recombination frequency (Eisenbarth, 2000, 2001)
• Correlation between the patterns of LD an isochores
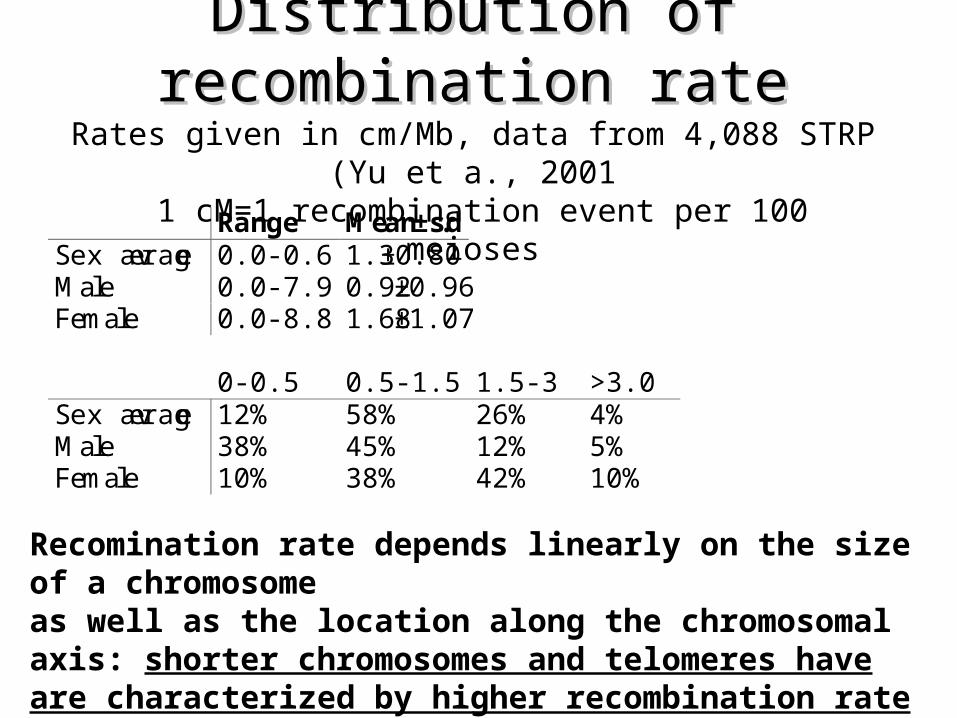
Distribution of recombination rateDistribution of recombination rateRates given in cm/Mb, data from 4,088 STRP (Yu et a., 2001
1 cM=1 recombination event per 100 meioses
Range Mean±s.dSex average 0.0-0.6 1.3±0.80Male 0.0-7.9 0.92±0.96Female 0.0-8.8 1.68±1.07
0-0.5 0.5-1.5 1.5-3 >3.0Sex average 12% 58% 26% 4%Male 38% 45% 12% 5%Female 10% 38% 42% 10%
Recomination rate depends linearly on the size of a chromosome as well as the location along the chromosomal axis: shorter chromosomes and telomeres have are characterized by higher recombination rate
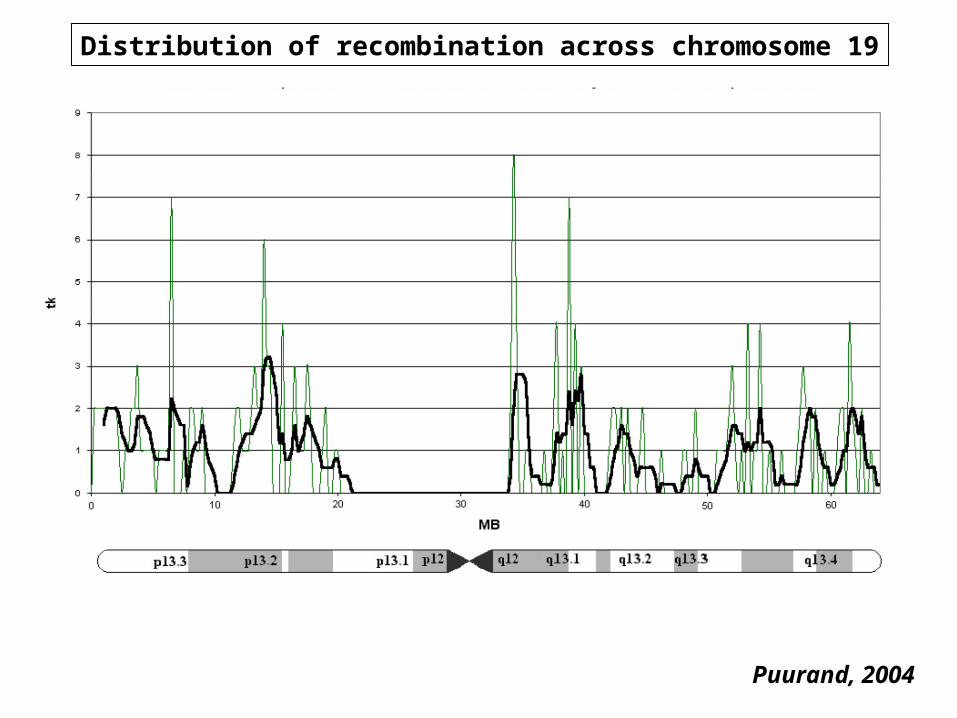
Distribution of recombination across chromosome 19
Puurand, 2004
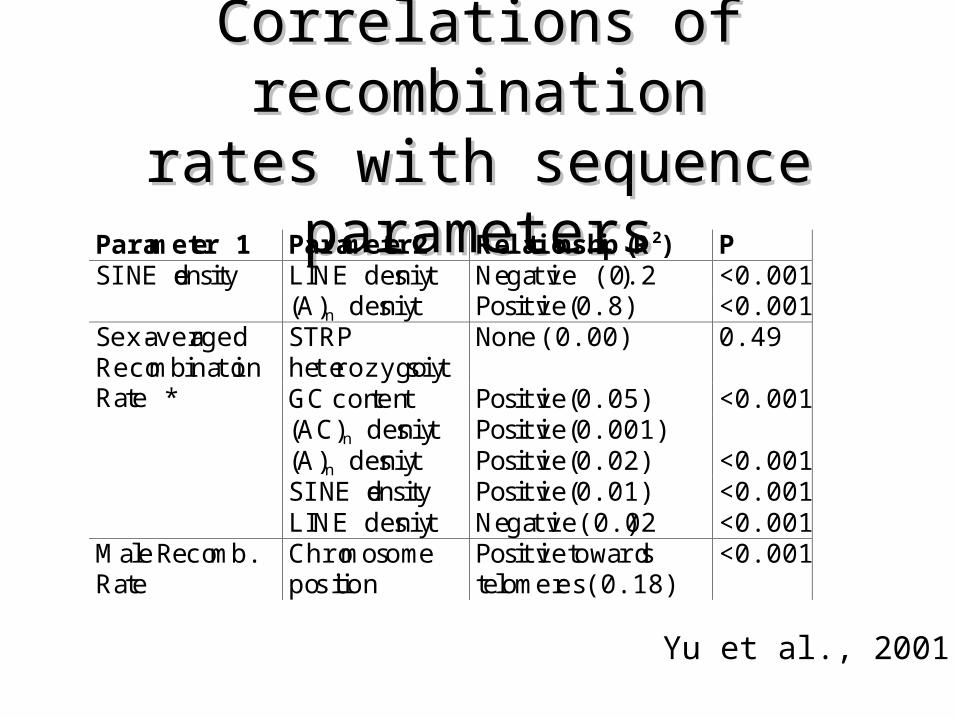
Correlations of recombinationCorrelations of recombinationrates with sequence parametersrates with sequence parameters
Parameter 1 Parameter2 Relationship (R2) PSINE density LINE density Negative (0.2) <0.001
(A)n density Positive (0.8) <0.001STRPheterozygosity
None (0.00) 0.49
GC content Positive (0.05) <0.001(AC)n density Positive (0.001)(A)n density Positive (0.02) <0.001SINE density Positive (0.01) <0.001
Sex-averagedRecombinationRate *
LINE density Negative(0.02) <0.001Male Recomb.Rate
Chromosomeposition
Positive towardstelomeres (0.18)
<0.001
Yu et al., 2001
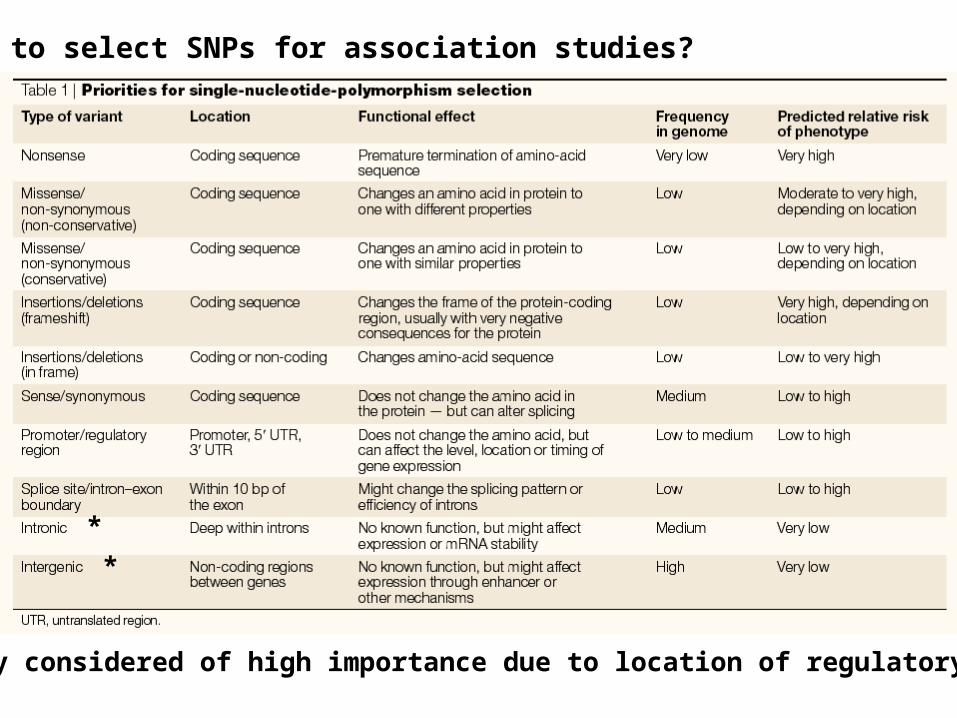
How to select SNPs for association studies?
*
*
* Currently considered of high importance due to location of regulatory regions
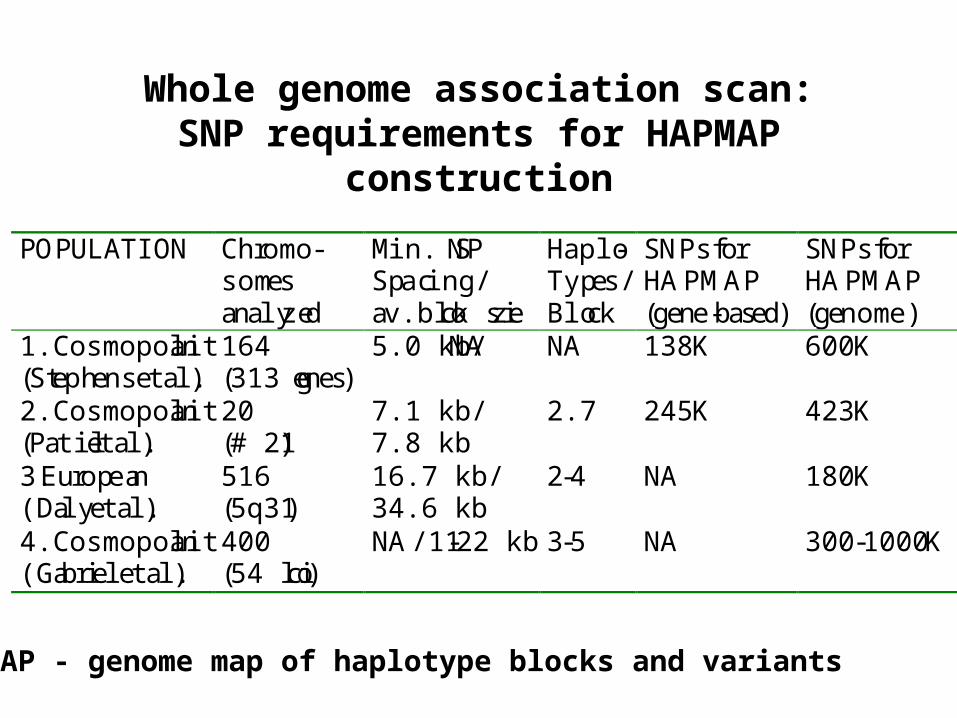
Whole genome association scan:SNP requirements for HAPMAP
construction
POPULATION Chromo-somesanalyzed
Min. SNPSpacing/av.block size
Haplo-Types/Block
SNPs forHAPMAP(gene-based)
SNPs forHAPMAP(genome)
1.Cosmopolitan(Stephens et al.)
164(313 genes)
5.0 kb/NA NA 138 K 600 K
2.Cosmopolitan(Patil et al.)
20(# 21)
7.1 kb/7.8 kb
2.7 245 K 423 K
3.European(Daly et al.)
516(5q31)
16.7 kb/34.6 kb
2-4 NA 180 K
4.Cosmopolitan(Gabriel et al.)
400(54 loci)
NA/11-22 kb 3-5 NA 300 -1000 K
HAPMAP - genome map of haplotype blocks and variants
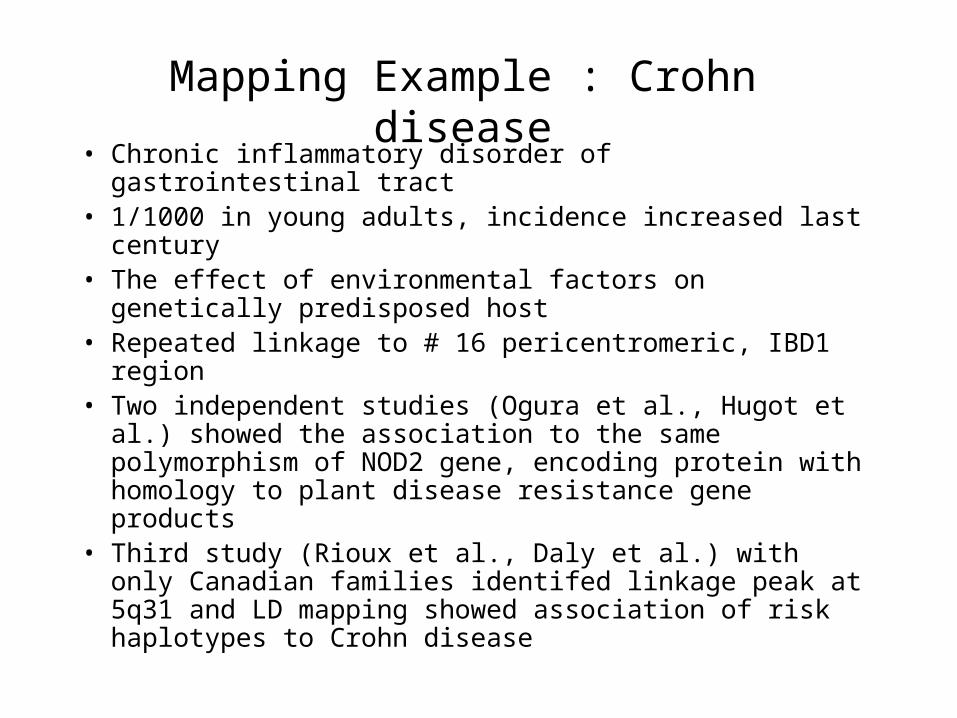
Mapping Example : Crohn disease• Chronic inflammatory disorder of gastrointestinal tract• 1/1000 in young adults, incidence increased last century• The effect of environmental factors on genetically
predisposed host• Repeated linkage to # 16 pericentromeric, IBD1 region• Two independent studies (Ogura et al., Hugot et al.)
showed the association to the same polymorphism of NOD2 gene, encoding protein with homology to plant disease resistance gene products
• Third study (Rioux et al., Daly et al.) with only Canadian families identifed linkage peak at 5q31 and LD mapping showed association of risk haplotypes to Crohn disease
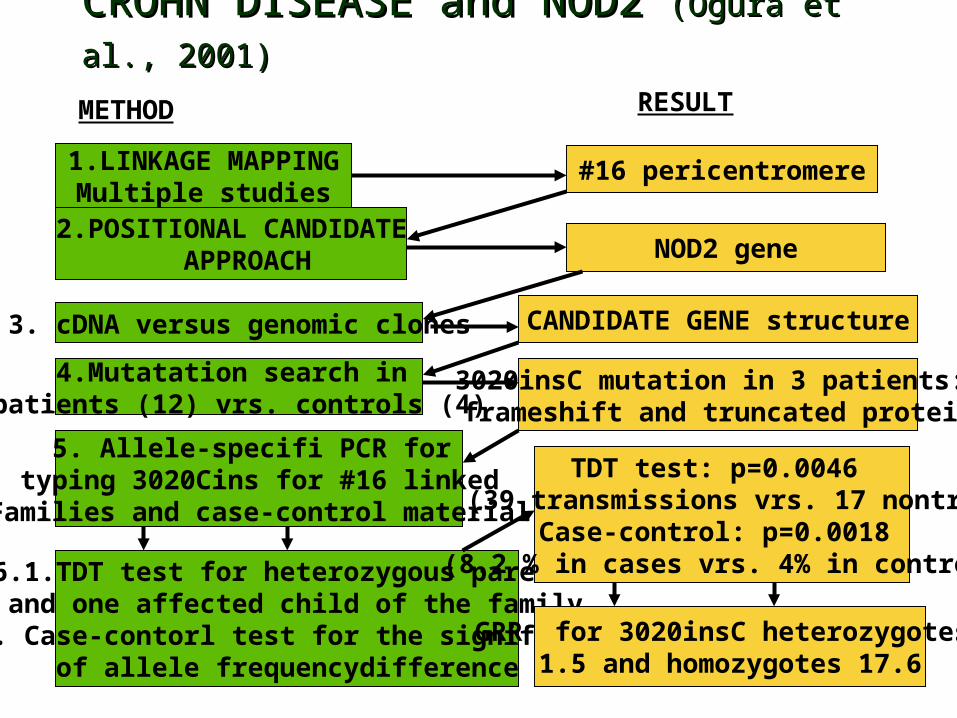
CROHN DISEASE and NOD2 CROHN DISEASE and NOD2 (Ogura et al., 2001)(Ogura et al., 2001)
1.LINKAGE MAPPINGMultiple studies
2.POSITIONAL CANDIDATE APPROACH
3. cDNA versus genomic clones
4.Mutatation search in patients (12) vrs. controls (4)
5. Allele-specifi PCR for typing 3020Cins for #16 linked
Families and case-control material
6.1.TDT test for heterozygous parents and one affected child of the family
6.2. Case-contorl test for the significanceof allele frequencydifference
#16 pericentromere
NOD2 gene
CANDIDATE GENE structure
3020insC mutation in 3 patients: frameshift and truncated protein
TDT test: p=0.0046 (39 transmissions vrs. 17 nontr)
Case-control: p=0.0018 (8.2 % in cases vrs. 4% in control)
METHOD RESULT
GRR for 3020insC heterozygotes 1.5 and homozygotes 17.6
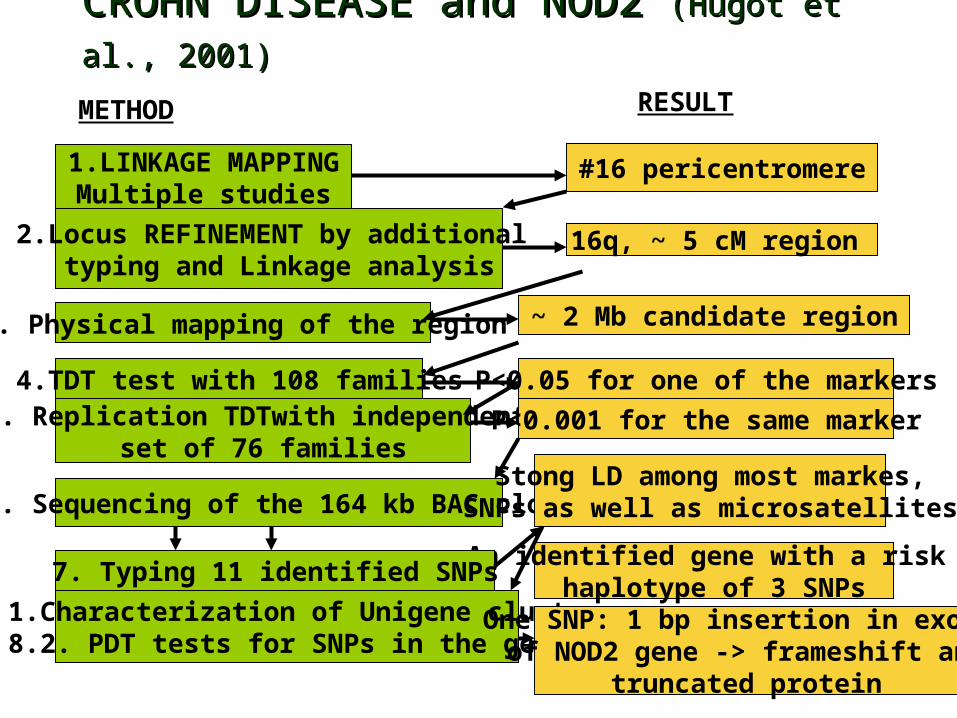
CROHN DISEASE and NOD2 CROHN DISEASE and NOD2 (Hugot et al., 2001)(Hugot et al., 2001)
1.LINKAGE MAPPINGMultiple studies
2.Locus REFINEMENT by additional typing and Linkage analysis
3. Physical mapping of the region
4.TDT test with 108 families5. Replication TDTwith independent
set of 76 families
6. Sequencing of the 164 kb BAC clone
#16 pericentromere
16q, ~ 5 cM region
~ 2 Mb candidate region
P<0.05 for one of the markers
Stong LD among most markes,SNPs as well as microsatellites
METHOD RESULT
An identified gene with a risk haplotype of 3 SNPs
P<0.001 for the same marker
7. Typing 11 identified SNPs
8. 1.Characterization of Unigene clusters8.2. PDT tests for SNPs in the gene
One SNP: 1 bp insertion in exon10of NOD2 gene -> frameshift and
truncated protein
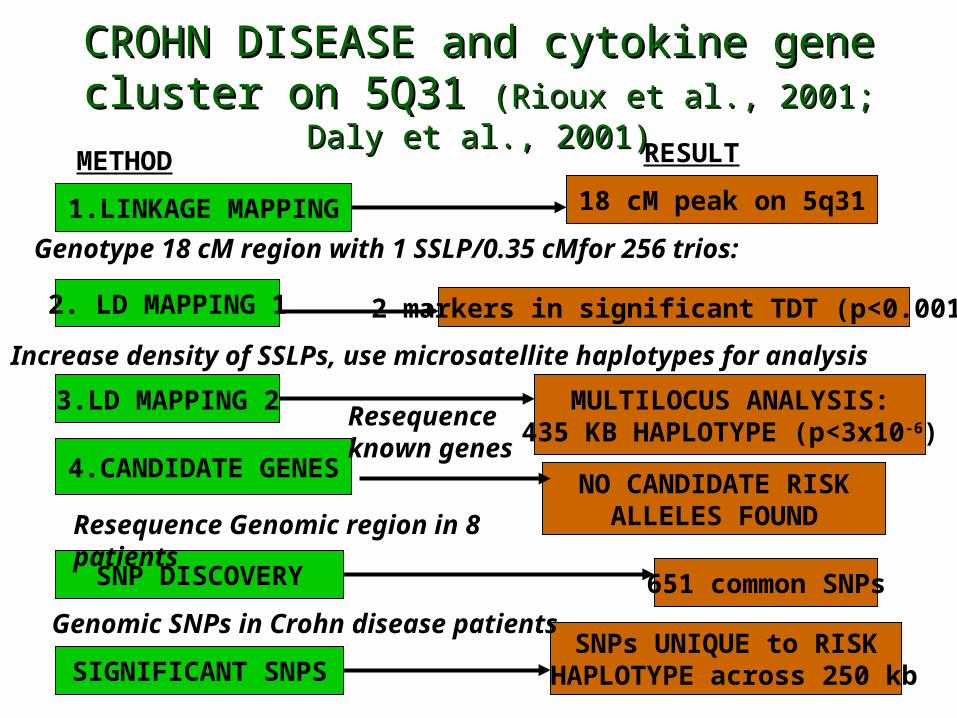
CROHN DISEASE and cytokine gene cluster CROHN DISEASE and cytokine gene cluster on 5Q31 on 5Q31 (Rioux et al., 2001; Daly et al., 2001)(Rioux et al., 2001; Daly et al., 2001)
1.LINKAGE MAPPING
2. LD MAPPING 1
3.LD MAPPING 2
4.CANDIDATE GENES
SNP DISCOVERY
SIGNIFICANT SNPS
18 cM peak on 5q31
2 markers in significant TDT (p<0.001)
MULTILOCUS ANALYSIS:435 KB HAPLOTYPE (p<3x10⁻⁶)
NO CANDIDATE RISKALLELES FOUND
651 common SNPs
SNPs UNIQUE to RISK HAPLOTYPE across 250 kb
Genotype 18 cM region with 1 SSLP/0.35 cMfor 256 trios:
Increase density of SSLPs, use microsatellite haplotypes for analysis
Resequenceknown genes
Resequence Genomic region in 8 patients
Genomic SNPs in Crohn disease patients
METHOD RESULT

CROHN DISEASE mapping and success• 1) multiple independent sets samples
• 2) availabilty of family material
• 3) combined methodology and haplotype analysis: the first application of LD mapping involving a systematic search for LD across a linkage peak and exhaustive ascertainment of SNPs in the critical region
• 4) for NOD2 - the same mutation identified in two independent studies!!
• 5) for cytokine cluster on 5q31 - the causal mutation has not yet been found. May be it is just the effect of haplotype or genotype effect of several combined loci, which counts….

Prerequisites for successful Prerequisites for successful association studiesassociation studies:
• 1. Detailed phenotype and diagnosis: maximized probability for the similar genetic factors for cases
• 2. Structure of control population : suitable controls• 3. Available family material• 4. Replicated results with independent sample sets• 5. Exhaustively characterized candidate regions for
genes, polymorphisms, population variation and LD• 5. Stringent criteria and testing of alternative genetic
models