associations of reward sensitivity with food consumption ... · 2 24 associations of reward...
TRANSCRIPT
1
Associations of Reward Sensitivity with Food Consumption, 1
Activity Pattern, and BMI in Children. 2
De Decker, Annelies1, Sioen, Isabelle
1, Verbeken, Sandra
2, Braet, Caroline
2, Michels, Nathalie
1, De 3
Henauw, Stefaan1. 4
1Faculty of Medicine and Health Sciences, Department of Public Health, Ghent University, De 5
Pintelaan 185 UZ 4K3, 9000 Gent, Belgium. 6
[email protected], [email protected], [email protected], 7
2Faculty of Psychology and Educational Sciences, Department of Developmental, Personality and 9
Social Psychology, Ghent University, Henri Dunantlaan 2, 9000 Gent, Belgium. 10
[email protected], [email protected]. 11
12
Corresponding author: 13
Annelies De Decker, Department of Public Health, Ghent University, De Pintelaan 185 UZ 4K3, 14
9000 Gent, Belgium. E-mail: [email protected]. Telephone: +32 (0)9 332 83 75. 15
16
17
18
19
20
21
22
23

2
Associations of Reward Sensitivity with Food Consumption, 24
Activity Pattern, and BMI in Children. 25
Abstract 26
In the current study, the associations of reward sensitivity with weight related behaviors and body 27
mass index were investigated in a general population sample of 443 Flemish children (50.3% boys) 28
aged 5.5-12 years. Cross-sectional data on palatable food consumption frequency, screen time, 29
physical activity, parental education level and measured length and weight were collected. The 30
Drive subscale of the ‘Behavioral Inhibition Scale/Behavioral Activation Scale’ was used as a short 31
method to measure reward sensitivity. A significant positive association of reward sensitivity with 32
the fast food and sweet drink consumption frequency was found. Furthermore, a significant positive 33
association of reward sensitivity with the z-score of body mass index was demonstrated, which 34
explained additional variance to the variance explained by palatable food consumption frequency, 35
screen time, physical activity and parental education level. Hence, the assessment of reward 36
sensitivity may have an added value to the assessment of weight-related behavior indicators when 37
evaluating the determinants of overweight in a child. In sum, children high in reward sensitivity 38
might be more attracted to fast food and sweet drinks, and hence, might be more vulnerable to 39
develop unfavorable food habits and overweight. These findings suggest that considering inter-40
individual differences in reward sensitivity is of importance in future childhood obesity prevention 41
campaigns. 42
Keywords: Reward sensitivity; Palatable food; Child; Body mass index; Overweight. 43
44
Introduction1 45
46
The prevalence of childhood overweight and obesity has increased dramatically since 1990 47
(Wang & Lim, 2012). Since childhood overweight and obesity is associated with multiple adverse 48
health outcomes, the current prevalence is identified as a global public health problem (Baker, 49
Olsen, & Sorensen, 2007; Deckelbaum & Williams, 2001; Shrivastava, Shrivastava, & Ramasamy, 50
2014). Moreover, overweight and obese youth have an increased risk of maintaining their 51
unfavorable weight status into adulthood (Singh, Mulder, Twisk, van, & Chinapaw, 2008). 52
1 Abbreviations: RS, reward sensitivity. BMI, body mass index. PA, physical activity. BIS, behavioral inhibition scales. BAS, behavioral activation scales. PAclub, physical activity in sports clubs. CF, weekly consumption frequency. zBMI, age- and sex-adjusted z-score of body mass index. ISCED, International Standard Classification of Education. PEL, highest parental education level of both parents.

3
Therefore, it is of the highest importance to prevent childhood overweight and obesity. 53
Unfortunately, current overweight prevention approaches have no or only small effects (Kamath et 54
al., 2008). A better understanding of the determinants of childhood overweight is needed to improve 55
future prevention approaches. 56
Research has demonstrated positive associations between Body Mass Index (BMI) and the 57
consumption of highly palatable, mostly energy dense foods in children, e.g. fast food (Fraser, 58
Clarke, Cade, & Edwards, 2012), sugar sweetened beverages (Malik, Pan, Willett, & Hu, 2013), 59
and artificially sweetened beverages (Sylvetsky, Rother, & Brown, 2011). For the consumption of 60
sweet food, a significant positive association with BMI was reported in adults, but this association 61
was not demonstrated in children (Te Morenga, Mann, & Mallard, 2013). Furthermore, positive 62
associations between BMI and screen time (Falbe et al., 2013), and negative associations between 63
BMI and physical activity (PA) have been found in children (Chaput et al., 2014). The current 64
western environment facilitates these unfavorable weight-related behaviors, i.e. a high consumption 65
of widely available palatable foods, prolonged engagement in screen time activities, and sedentary 66
lifestyle combined with low levels of PA (Lowe & Butryn, 2007). However, not all children 67
exposed to this obesogenic environment display these unfavorable weight-related behaviors and 68
become overweight (Blundell et al., 2005). It has been shown that some individuals are more 69
reactive to the palatable food environment (Paquet et al., 2010), and noteworthy, Forman et al. 70
reported that this reactivity codetermined the effect of the obesity prevention approaches used in 71
their study (Forman et al., 2007). Furthermore, this reactivity to the food environment depends upon 72
individual differences in reward sensitivity (RS) (Paquet et al., 2010). 73
RS is the tendency to engage in motivated approach behavior in the presence of 74
environmental cues associated with reward, such as the sight of palatable foods (Carver & White, 75
1994). Heightened RS has recently been associated with higher intakes of sugar-sweetened 76
beverages and unhealthy snacks in adolescents (De Cock et al., 2015), and with higher fat intake in 77
adults (Tapper, Baker, Jiga-Boy, Haddock, & Maio, 2015). Moreover, in normal to overweight 78
adolescents and adults, a positive association was reported between RS and BMI (Davis & Fox, 79
2008; Davis et al., 2007; Verbeken, Braet, Lammertyn, Goossens, & Moens, 2012). Unfortunately, 80
in children, findings are less consistent. One study did not find associations of RS with unhealthy 81
snack consumption and BMI in children (Scholten, Schrijvers, Nederkoorn, Kremers, & Rodenburg, 82
2014), while another study reported a positive association between RS and BMI in children, which 83
was mediated by overeating (van den Berg et al., 2011). These inconsistencies might be due to the 84
use of a different RS measure. 85

4
Besides consumption of palatable foods, also screen time (e.g. computer games) and PA 86
(e.g. endurance running) were reported to have rewarding potential (Buckley, Cohen, Kramer, 87
McAuley, & Mullen, 2014; Garland et al., 2011). This might implicate that RS also plays a role in 88
those weight-related behaviors (Buckley et al., 2014). Nevertheless, literature on the association of 89
RS with PA and screen time is to our knowledge absent in children and adolescents. In adults, one 90
study reported no relation between RS and PA (Finlayson, Cecil, Higgs, Hill, & Hetherington, 91
2012), whereas another study reported more PA in individuals with higher RS (Voigt et al., 2009). 92
Since previous research suggested that knowledge on the association of RS with weight-93
related behaviors and BMI is imperative for the development of effective prevention strategies, the 94
current study aimed to investigate these associations in a large general population sample of 95
children aged 5.5-12 years. Therefore, consumption frequencies of different types of palatable food, 96
screen time, PA, and BMI calculated upon measured weight and height were used. In accordance to 97
the studies in adolescents (De Cock et al., 2015; Verbeken et al., 2012), the current study used the 98
Drive subscale of the ‘Behavioral Inhibition/ Behavioral Activation Scales’ (BIS/BAS) as a 99
measure of RS, which is conceptualized as the motivation to approach potentially pleasurable 100
activities (Carver & White, 1994). Important advantages of the Drive subscale are that (a) it was 101
validated in neuro-imaging research (Beaver et al., 2006), (b) it is a short 4-item scale, easily and 102
practically applicable in epidemiological research, obesity prevention interventions and clinical 103
practice, and (c) it does not only measures reactivity to food, but to all kinds of reward, such that it 104
has the potential to be associated with food consumption as well as screen time and PA. 105
A positive association between RS and the consumption of high-fat fast food, sweet food, 106
and sugared and artificially sweetened beverages was hypothesized. Additionally, the relation of RS 107
with screen time and PA was explored. Further, it was hypothesized that RS was positively 108
associated with BMI and explained additional variance of BMI to the assessment of known 109
predictors of BMI (i.e. palatable food consumption, screen time, PA and parental education level). 110
111
Method 112
113
Study participants 114
115
Participants were Dutch-speaking Belgian children aged 5.5-12 years, recruited by random 116
cluster design for the longitudinal Children’s Body Composition and Stress (ChiBS) study (Michels 117
et al., 2012) that took place between 2010 and 2012. Children (in most cases accompanied by 118
minimum one parent) attended the survey centre at a prefixed appointment, during which the 119

5
anthropometric measurements of the child were conducted and questionnaires were filled in by the 120
parent. If the parent could not accompany the child, the parents were asked to fill in the 121
questionnaires at home. 122
The 455 children that participated in the ChiBS study wave of 2011 were included in the 123
current study. Of the 455 children, twelve children were excluded from the analyses (nine had 124
missing RS-data; three children reached the criteria for obesity, see discussion for argumentation on 125
exclusion of children with obesity). As such, the total study sample consisted of 443 children. A 126
post hoc power calculation was performed based on a sample size of 443 children and the mean of 127
the two squared correlation coefficients (i.e. 0.02) reported in the study of van den Berg et al. that 128
demonstrated a significant relation between scores on two RS measures and BMI in children (van 129
den Berg et al., 2011). This revealed a power of 0.79 to detect a true effect between RS and BMI in 130
the current study. 131
The ChiBS study was conducted according to the guidelines laid down in the Declaration of 132
Helsinki and was approved by the Ethics Committee of Ghent University Hospital. Written 133
informed consent was obtained from all parents and the children gave verbal assent. 134
135
Measures 136
137
RS. The BAS scale of the BIS/BAS scale consists of three subscales, namely the Drive, 138
Reward Responsiveness, and Fun Seeking subscale (Carver & White, 1994). The Drive subscale 139
was designed to reflect strong pursuit of appetitive goals and consists of four items which all need 140
to be scored on a 4-point Likert scale (1=not true, 2=somewhat true, 3=true, 4=very true; items are 141
(a) when your child wants something, he/she usually goes all the way to get it, (b) your child does 142
everything to get the things that he/she wants, (c) when your child sees an opportunity to get 143
something that he/she wants, he/she goes for it right away, (d) nobody can stop your child when 144
he/she wants something). Of the three BAS subscales, it has the highest internal consistency (De 145
Cock et al., 2015; Jorm et al., 1999) and the strongest relations with palatable food intake in 146
adolescents (De Cock et al., 2015). Furthermore, the Drive subscale is strongly associated with 147
neural responses to appetizing food-reward cues in the brain reward circuitry, and this association is 148
stronger than the associations between these neural responses and the other BAS subscales (Beaver 149
et al., 2006). Therefore, the term RS refers to the sum of the four items of the Drive subscale. 150
Because the youngest children of the cohort were too young to answer the questionnaire 151
themselves, parents answered a Dutch parent version of the BIS/BAS scale (Vervoort et al., 2015). 152
The Cronbach alpha coefficient of RS in the current study (0.85) was comparable to the alpha 153

6
reported by Vervoort et al. (i.e. 0.85) in children and adolescents aged 2-18 years (Vervoort et al., 154
2015). 155
Food indices. Parents completed the Children’s Eating Habits Questionnaire - Food 156
Frequency Questionnaire to report the child’s usual weekly consumption frequency (CF), thereby 157
considering the preceding 4 weeks. The questionnaire consists of 43 food items/categories and was 158
developed and validated within the EU FP6 IDEFICS project (Huybrechts et al., 2011; Lanfer et al., 159
2011). For each item, the following response options were used (the assigned score is indicated in 160
brackets): ‘never/less than once a week’ (value 0), ‘one to three times a week’ (value 2), ‘four to six 161
times a week’ (value 5), ‘one time a day’ (value 7), ‘two times a day’ (value 14), ‘three times a day’ 162
(value 21), ‘four or more times a day’ (value 30), or ‘I have no idea’ (missing). Based on this 163
questionnaire, three food indices were calculated by summing up the weekly CF’s of related food 164
items/categories: (a) Fast food CF, contains all fast food and combined sauces categories; (b) Sweet 165
food CF, contains all sweet food categories; (c) Sweet drink CF, contains all sweet tasting drink 166
categories (Table 1). 167
Screen time and PA. Parents reported on the number of hours of TV/DVD/video viewing 168
and computer/games-console use both for typical weekdays and weekend days. Response categories 169
included: ‘not at all’ (value zero), ‘<0.5 hours a day’ (value 0.25), ‘<1 hours a day’ (value 0.75), 170
‘between 1 and <2 hours a day’ (value 1.5), ‘between 2 and <3 hours a day’ (value 2.5), ‘>3 hours a 171
day’ (value 4). Children’s weekly TV/DVD/video viewing (5 times week and 2 times weekend 172
viewing) and computer/games-console use (5 times week and 2 times weekend use) were summed 173
to obtain the hours of screen time per week (Olafsdottir et al., 2014). 174
Parental report on “How much hours and minutes does he/she spend doing sport in a sports 175
club per week” (no response categories) was used as a proxy measure for moderate to vigorous PA, 176
further referred to as PA at sports clubs (PAclub). 177
BMI. Height (m) and body mass (kg) were measured. Children were not allowed to eat or 178
drink during 2 hours preceding the weighing. Upon weight and length data, BMI (kg/m2) was 179
calculated, and the standard deviation score of BMI (zBMI) was computed to adjust for age- and 180
sex using xILMS (i.e. an excel add-in for using growth reference data in the LMS format; 181
abbreviation LMS refers to smooth curve-L, mean-M and coefficient of variation-S) with Flemish 182
growth reference data of 2004 (Cole, Freeman, & Preece, 1998; Roelants, Hauspie, & 183
Hoppenbrouwers, 2009). According to the cut-offs of the International Obesity Task Force (Cole & 184
Lobstein, 2012), children with BMI z-scores of ≥ 2.29 for boys and ≥ 2.19 for girls (equivalent of 185
BMI 30 at age 18) were classified as obese, and excluded from further analyses. 186
7
Parental education level. The highest parental education level of both parents (PEL) was 187
categorized according to the International Standard Classification of Education (ISCED) 188
(UNESCO, 1997). Because of low numbers of participants in category zero to four, the ISCED-189
categories were aggregated into two levels (ISCED level 0 – 4 = low PEL, value zero; ISCED level 190
5-6 = high PEL, value one). 191
192
Statistical analyses 193
194
Analyses were performed using PASW Statistical Program version 20.0 (SPSS, IBM, IL, 195
USA). The two-sided level of significance was set at p<0.05. Missing values were not estimated 196
since most missing values were the consequence of questionnaires that were not filled in due to time 197
constraints. Histograms and boxplots were drawn to identify outliers and non-normal distributions. 198
Based on visual inspection, it was decided to exclude five extreme outliers of the sweet drink CF 199
and two of the sweet food CF from further analyses. The fast food, sweet food, and sweet drink CF, 200
and PAclub were found to be non-normally distributed. To use the food indices as dependent 201
variables in regressions, correlations, and t-tests, value one was added to the scores on the single 202
food items of the fast food, sweet food, and sweet drink CF, resulting in a food frequency range of 203
[1;31] instead of [0;30]. Then, the fast food CF, sweet food CF and sweet drink CF sum scores were 204
calculated again, and the natural logarithms (ln) of all food indices were computed, which 205
approached the normal distribution. For PAclub, transformations did not change the distribution 206
towards normality. To use PAclub as dependent variable in regressions, it was dichotomized (zero 207
to two hours per week = low PAclub, value zero; more than two hours per week= high PAclub, 208
value one). 209
Explorative unadjusted Pearson correlations (exception: Spearman correlation for PAclub) 210
and unpaired t-tests (exception: Mann-Whitney U test for PAclub) were conducted to find out if 211
age, sex and PEL had to be included as covariates when regressing weight-related behaviors on RS. 212
They were only included as covariates in regression models if (trend) significant associations were 213
present between age, sex or PEL and (a) the predictor, and (b) the dependent variable. 214
To investigate the research hypothesis that RS was positively associated with the three food 215
indices, three linear regression models were conducted with RS as predictor and fast food CF, sweet 216
food CF and sweet drink CF as dependent variables. To explore if RS was associated with screen 217
time and PAclub, a linear and a logistic regression were conducted respectively with RS as 218
predictor and screen time and PA club as dependent variables. 219

8
To investigate if RS was positively associated with zBMI and if it explained additional 220
variance to the assessment of known predictors, a hierarchical linear regression model with zBMI as 221
dependent variable was conducted. This analysis was conducted on a subsample of the total study 222
sample, for which all predictors included in the model were reported. In step 1 of the hierarchical 223
linear regression model, the three food indices, screen time, PAclub and PEL were added as 224
predictors. In step 2, also RS was added as predictor to the regression model. Since zBMI scores are 225
adjusted for age and sex, and inclusion of age and sex as covariate did not change the results, age 226
and sex were not included in the regression model. 227
For the linear regression models, semi-partial correlations were computed to measure the 228
effect size of RS (Aloe, 2014). Effects of 0.10 were interpreted as small, of 0.30 as medium and of 229
0.50 as large (Cohen, 1992). 230
231
Results 232
233
Descriptive statistics and comparisons between the total sample and subsample 234
235
Table 2 shows the descriptive statistics on age, RS, zBMI, and weight-related behaviors. Of 236
the total study sample of 443 children (50.3% boys), 22.6% had low PEL, 70.7% high PEL, and 237
6.8% missing PEL-data. Further, 46.7% children were categorized as low and 40.6% as high 238
PAclub; 12.7% had missing PAclub data. 239
The subsample of children for which all variables included in this study were reported 240
consisted of 344 children (50.6% boys; 21.8% low PEL; 51.7% low PAclub). Using unpaired t-241
tests, the mean RS and zBMI score did not significantly differ between the 344 participants with all 242
data and the 99 participants with missing data on one or more variables (RS: t(441)=0.52, p=0.60; 243
zBMI: t(441)=-0.11, p=0.91). 244
245
Association of RS with food indices, screen time and PAclub 246
247
Explorative analyses. Correlations and comparisons were performed to find out which 248
variables should be included as covariates in the regression models with RS as predictor and 249
weight-related behaviors as dependent variables (Table 3). Based on these results, age was included 250
as covariate in all five regression models with RS as predictor and the weight-related behaviors as 251
dependent variables because (a) a trend significant correlation between RS and age was present, and 252
(b) age was significantly related to screen time and PAclub, and trend significant to the fast food 253
9
and sweet food CF. Sex was only included as covariate in the regression model with screen time as 254
dependent variable, since trend significant sex differences were only present on RS and screen time. 255
PEL was not included as covariate in the regression models: although the CF of fast food and sweet 256
drink were significantly higher in low PEL (mean fast food CF low PEL=7.61, high PEL=5.57 257
times a week; mean sweet drink CF low PEL=11.39, high PEL=8.69 times a week), no association 258
was found between PEL and RS. 259
Regression analyses adjusted for covariates. Table 4 shows the results of the five 260
regressions. RS was significantly and positively related to the fast food CF and sweet drink CF, but 261
not to the sweet food CF, screen time, and PAclub. The models predict that children aged 8.86 years 262
(i.e. mean age) at percentile 10 versus 90 of RS consume fast food on average 4.89 versus 5.85 263
times a week respectively, and consume sweet drinks on average 6.95 versus 8.42 times a week, 264
respectively. 265
266
Association of RS with zBMI 267
268
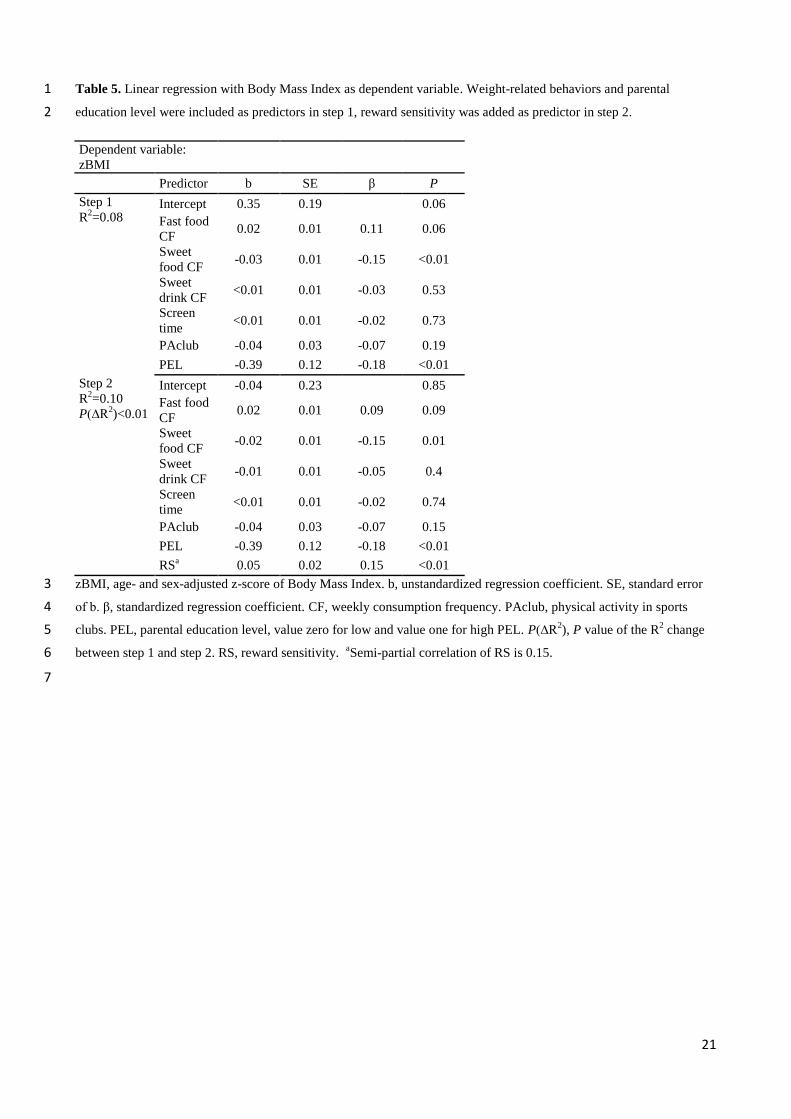
RS was significantly and positively associated with zBMI (Table 5). RS significantly 269
explained an extra 2% of the variance in zBMI to the variance explained by the weight-related 270
behaviors and PEL. Tolerance values to check multicollinearity were all above 0.8 in both steps of 271
the model. The model predicts that children at percentile 90 of RS have on average a 0.34 units 272
higher zBMI than children at percentile 10 of RS. 273
274
Discussion 275
276
The present study investigated the associations of the scores on a short RS questionnaire, 277
namely the Drive subscale of the BIS/BAS scale (Carver & White, 1994), with weight related 278
behaviors and zBMI in a general population sample of children aged 5.5-12 years. 279
The results confirmed that children with higher RS may consume more frequently fast food 280
and sweet drinks. Similar findings were recently found in adolescents aged 14-16 years (De Cock et 281
al., 2015). The current study findings suggest that even in children, whose access to food is strongly 282
determined by others (e.g. parents, teachers), the individual characteristic RS may play a role in 283
palatable food consumption. Children high in RS might be more easily tempted by palatable fast 284
food and sweet drink cues, and more motivated to consume them. This might shape unfavorable 285
food habits that continue during life. 286

10
The research hypothesis that RS was positively associated with the sweet food CF could not 287
be confirmed. Nevertheless, in line with other studies, the sweet food CF was not related to PEL, 288
whereas the fast food and sweet drink CF were related to PEL (Elinder, Heinemans, Zeebari, & 289
Patterson, 2014). Possibly, the fast food and sweet drink CF might be determined by different 290
parameters (PEL, RS) than the sweet food CF, which might be determined by habits in Flemish 291
primary schools (eating biscuits and/or chocolate bars as snacks during school breaks is common). 292
The present study found no associations between RS and the potentially rewarding 293
behaviors “screen time” and “physical activity in sports clubs”. Previous research on this 294
associations in primary school children is to our knowledge absent. Possibly, RS does not influence 295
these weight-related behaviors. Nonetheless, the lack of a relation between RS and screen time 296
might also be due to high parental control or restriction over screen time in this age group. 297
Additionally, screen time was measured in the current study by the sum of ‘hours of television 298
viewing’ and ‘hours in front of a computer/game console’, but only the hours of engagement in 299
rewarding computer games might be related to RS. Future research is therefore needed to replicate 300
these findings with refined measures of screen time, thereby differentiating between television and 301
gaming. The lack of a relation between RS and PAclub was in line with results of a systematic 302
review on children and adolescents, which concluded that PAclub was more consistently related to 303
environmental characteristics than to interpersonal factors (de Vet, de Ridder, & de Wit, 2011). 304
Indeed, whether children like sporting in a sports club or not, the hours of PAclub of primary school 305
children is dependent on the permission and logistic support of their parents and on nearby sports 306
club facilities. Further, future research in children might explore the relationship between RS and 307
objectively measured physical activity (e.g. with accelerometers), assessing the overall level of PA 308
during daytime. 309
In the current study, only a trend significant positive association between the fast food CF 310
and zBMI was present. No associations of the sweet drink CF, screen time, and PAclub with zBMI 311
were found. Recent reviews indicated that only some studies reported significant relations between 312
these parameters and BMI (Malik et al., 2013; Must, Barish, & Bandini, 2009). Probably, 313
differences in methodology can explain the different findings. Further, a negative relation between 314
sweet food CF and zBMI was found, which is in conflict with a meta-analysis that reported no 315
significant relationship between sweet food and BMI in children (Te Morenga et al., 2013). This 316
negative association might be due to the assessment of consumption frequencies without inquiring 317
portion sizes. Portion sizes of sweet food CF might vary substantially across children (e.g. one 318
versus three cookies per consumption). Hence, future research should include more detailed 319
assessment of dietary habits, identifying not only frequency but also portion size. 320

11
Finally, the current study demonstrated a positive association between RS, measured by the 321
Drive subscale of the BIS/BAS scale, and zBMI in normal to overweight children. This finding was 322
already reported in adolescents with the same RS questionnaire (Verbeken et al., 2012) and in 323
children with a different RS questionnaire (van den Berg et al., 2011). Another study in children 324
that used a behavioral task as RS measure did not find this association (Scholten et al., 2014). 325
Moreover, RS assessment explained additional variance of zBMI to the variance explained by food 326
consumption, activity pattern, and PEL. Therefore, the assessment of RS with this very short 327
questionnaire might have an added value in public health and pediatrics. 328
The positive association between RS and zBMI was found in a population of children 329
without obesity. Children with obesity were excluded from the analyses because (a) the focus of this 330
study is on obesity prevention, (b) the obesity rate in the current sample was too low to accurately 331
investigate the relation between RS and zBMI in obese children, and (c) most importantly, RS was 332
only positively associated with BMI in adolescents (Verbeken et al., 2012) and adults (Davis & 333
Fox, 2008) without obesity, but negatively associated with BMI in the obese population in both 334
studies. This inverted relation is probably due to changes in brain reward processes over the course 335
of obesity development (Kessler, Zald, Ansari, Li, & Cowan, 2014). 336
The positive associations of RS with fast food CF, sweet drink CF and zBMI reported in this 337
paper are relevant for future prevention strategies, certainly if future longitudinal studies can 338
confirm an increased obesity risk in high RS children. Such associations can offer an explanatory 339
framework for parents and health care workers on why some children are more tempted by 340
palatable food compared to other children. Further, specifically targeting children high in RS, which 341
are assumed to be more vulnerable to the obesogenic environment, may improve the effectiveness 342
of obesity prevention interventions. In fact, there is already some evidence in adults as to which 343
elements to include in prevention interventions tailored to this RS feature. Three such elements are 344
worth briefly describing in the context of this paper. First, messages that are framed in terms of the 345
benefits of adopting the recommendation (i.e. gain-frame) rather than the disadvantages and costs of 346
not adopting a recommendation are more effective in high RS individuals (Covey, 2014). Second, 347
the study of Forman et al. (2007) compared two methods designed to help individuals manage 348
palatable food cravings such that they do not lead to palatable food consumption: (a) ‘control-based 349
strategies’, e.g. removing palatable foods from the direct home or work environment, restructuring 350
thoughts that permit eating palatable food, and refocusing strategies designed to turn attention away 351
from food related stimuli towards non-food related stimuli; (b) acceptance-based strategies, e.g. 352
awareness and acceptance of the feelings of food cravings without trying to suppress or eliminate 353
them and without taking actions in order to consume the desired food. The method with acceptance-354

12
based strategies decreased the consumption of palatable foods in participants with high RS specific 355
to food, but increased food cravings in participants with low RS specific to food. Hence, 356
interventions using these acceptance-based strategies are useful only in high RS individuals. Third, 357
self-regulatory skills were found to moderate the relation between RS and BMI in adults (Lawrence, 358
Hinton, Parkinson, & Lawrence, 2012). Therefore, the training of self-regulatory skills (Verbeken, 359
Braet, Goossens, & van der Oord, 2013) might be effective to reduce palatable food consumption in 360
high RS individuals. Future research should clarify if also in children, these three intervention 361
techniques can be successfully applied. 362
The limitations of the current study include its cross-sectional design. Future longitudinal 363
research to confirm causality is needed. Further, although BMI is a frequently used measure of 364
adiposity, better measures exist (e.g. densitometry). Next, children with overweight and obesity, as 365
well as families with lower levels of parental education were relatively underrepresented in the 366
current study. Therefore, future research in a more representative sample is recommended. 367
Additionally, RS and all weight-related behaviors were based on subjective questionnaires. The 368
construct of RS could be confounded by parenting style, and the relation of RS and palatable food 369
consumption in children could be confounded by food provision patterns of parents, which were not 370
taken into account in the current study. Further, the PAclub measure did not include PA of the child 371
outside of sports clubs. The number of missing values on weight-related variables was high due to 372
time constraints of parents. However, no differences were found in RS and zBMI between the total 373
sample and the subsample. Because inclusion of portion size assessment in a cohort study is a high 374
burden for participants and would result in a reduced sample size, the food indices were only based 375
on consumption frequency assessments. Therefore, associations between the three food indices and 376
zBMI should be interpreted with caution. Unless the mentioned limitations, relationships between 377
the weight-related parameters screen time, the fast food CF, sweet food CF, sweet drink CF, and 378
PEL were as expected based on the literature (Fernandez-Alvira et al., 2015; Pearson & Biddle, 379
2011; Tandon et al., 2012). Further, the strengths of the current study include the large general 380
community sample of primary school children, the use of a simple and short RS questionnaire, the 381
consideration of multiple weight-related behaviors, and the objective measurement of weight and 382
length. 383
384
Conclusion 385
386
Overall, the results of the current study suggest that children high in RS are more easily 387
tempted by palatable fast food and sweet drink cues, which might lead to unhealthy food habits. 388
13
Further, children high in RS might be more prone to develop overweight. These findings suggest 389
that considering inter-individual differences in RS can be of importance in future childhood obesity 390
prevention campaigns. Future longitudinal research is warranted to verify that RS is a risk factor of 391
unfavorable food habits and overweight in children. 392
393
Acknowledgments 394
395
The authors want to thank the participating children and their parents for their voluntary 396
participation. 397
398
Financial support 399
400
This work was supported by the research council of Ghent University, the Institute for the 401
Promotion of Innovation through Science and Technology in Flanders (grant number SBO-120054), 402
and the Research Foundation – Flanders (I.S., grant number 1.2.683.14.N.00). These funders had no 403
role in the design, data collection, analyses or writing of this article, or the decision to submit this 404
article for publication. Further, this research received no specific grant from any commercial 405
funding agency. 406
14
References 407
Aloe, A. M. (2014). An Empirical Investigation of Partial Effect Sizes in Meta-Analysis of 408
Correlational Data. Journal of General Psychology, 141(1), 47-64. 409
doi:10.1080/00221309.2013.853021 410
Baker, J. L., Olsen, L. W., & Sorensen, T. I. (2007). Childhood body-mass index and the risk of 411
coronary heart disease in adulthood. New England Journal of Medicine, 357(23), 2329-412
2337. 413
Beaver, J. D., Lawrence, A. D., Van Ditzhuijzen, J., Davis, M. H., Woods, A., & Calder, A. J. 414
(2006). Individual differences in reward drive predict neural responses to images of food. 415
Journal of Neuroscience, 26(19), 5160-5166. doi:10.1523/jneurosci.0350-06.2006 416
Blundell, J. E., Stubbs, R. J., Golding, C., Croden, F., Alam, R., Whybrow, S. et al. (2005). 417
Resistance and susceptibility to weight gain: individual variability in response to a high-fat 418
diet. Physiology & Behavior, 86(5), 614-622. 419
Buckley, J., Cohen, J. D., Kramer, A. F., McAuley, E., & Mullen, S. P. (2014). Cognitive control in 420
the self-regulation of physical activity and sedentary behavior. Frontiers in Human 421
Neuroscience, 8. doi:10.3389/Mhum.2014.00747 422
Carver, C. S., & White, T. L. (1994). Behavioral-Inhibition, Behavioral Activation, and Affective 423
Responses to Impending Reward and Punishment - the Bis Bas Scales. Journal of 424
Personality and Social Psychology, 67(2), 319-333. 425
Chaput, J. P., Leduc, G., Boyer, C., Belanger, P., LeBlanc, A. G., Borghese, M. M., & Tremblay, 426
M. S. (2014). Objectively measured physical activity, sedentary time and sleep duration: 427
independent and combined associations with adiposity in canadian children. Nutrition & 428
Diabetes, 4, 5. doi:10.1038/nutd.2014.14 429
Cohen, J. (1992). A POWER PRIMER. Psychological Bulletin, 112(1), 155-159. doi:10.1037/0033-430
2909.112.1.155 431
Cole, T. J., Freeman, J. V., & Preece, M. A. (1998). British 1990 growth reference centiles for 432
weight, height, body mass index and head circumference fitted by maximum penalized 433
likelihood. Statistics in Medicine, 17(4), 407-429. doi:10.1002/(sici)1097-434
0258(19980228)17:4<407::aid-sim742>3.0.co;2-l 435
Cole, T. J., & Lobstein, T. (2012). Extended international (IOTF) body mass index cut-offs for 436
thinness, overweight and obesity. Pediatric Obesity, 7(4), 284-294. doi:10.1111/j.2047-437
6310.2012.000064.x 438
Covey, J. (2014). The Role of Dispositional Factors in Moderating Message Framing Effects. 439
Health Psychology, 33(1), 52-65. doi:10.1037/a0029305 440

15
Davis, C., & Fox, J. (2008). Sensitivity to reward and body mass index (BMI): evidence for a non-441
linear relationship. Appetite., 50(1), 43-49. 442
Davis, C., Patte, K., Levitan, R., Reid, C., Tweed, S., & Curtis, C. (2007). From motivation to 443
behaviour: a model of reward sensitivity, overeating, and food preferences in the risk profile 444
for obesity. Appetite., 48(1), 12-19. 445
De Cock, N., Van Lippevelde, W., Vervoort, L., Vangeel, J., Maes, L., Eggermont, S., et al. (2015). 446
Sensitivity to reward is associated with snack and sugar-sweetened beverage consumption in 447
adolescents. European journal of nutrition. doi:10.1007/s00394-015-0981-3 448
de Vet, E., de Ridder, D. T. D., & de Wit, J. B. F. (2011). Environmental correlates of physical 449
activity and dietary behaviours among young people: a systematic review of reviews. 450
Obesity Reviews, 12(501), e130-e142. doi:10.1111/j.1467-789X.2010.00784.x 451
Deckelbaum, R. J., & Williams, C. L. (2001). Childhood obesity: the health issue. Obesity 452
Research, 9(Suppl. 4), S239-S243. 453
Elinder, L. S., Heinemans, N., Zeebari, Z., & Patterson, E. (2014). Longitudinal changes in health 454
behaviours and body weight among Swedish school children - associations with age, gender 455
and parental education - the SCIP school cohort. Bmc Public Health, 14, 9. 456
doi:10.1186/1471-2458-14-640 457
Falbe, J., Rosner, B., Willett, W. C., Sonneville, K. R., Hu, F. B., & Field, A. E. (2013). Adiposity 458
and Different Types of Screen Time. Pediatrics, 132(6), E1497-E1505. 459
doi:10.1542/peds.2013-0887 460
Fernandez-Alvira, J. M., Bornhorst, C., Bammann, K., Gwozdz, W., Krogh, V., Hebestreit, A., et al. 461
(2015). Prospective associations between socio-economic status and dietary patterns in 462
European children: the Identification and Prevention of Dietary- and Lifestyle-induced 463
Health Effects in Children and Infants (IDEFICS) Study. British journal of nutrition, 113(3), 464
517-525. doi:10.1017/s0007114514003663 465
Finlayson, G., Cecil, J., Higgs, S., Hill, A., & Hetherington, M. (2012). Susceptibility to weight 466
gain. Eating behaviour traits and physical activity as predictors of weight gain during the 467
first year of university. Appetite, 58(3), 1091-1098. doi:10.1016/j.appet.2012.03.003 468
Forman, E. M., Hoffman, K. L., McGrath, K. B., Herbert, J. D., Brandsma, L. L., & Lowe, M. R. 469
(2007). A comparison of acceptance- and control-based strategies for coping with food 470
cravings: an analog study. Behaviour Research and Therapy, 45(10), 2372-2386. 471
Fraser, L. K., Clarke, G. P., Cade, J. E., & Edwards, K. L. (2012). Fast Food and Obesity A Spatial 472
Analysis in a Large United Kingdom Population of Children Aged 13-15. American Journal 473
of Preventive Medicine, 42(5), E77-E85. doi:10.1016/j.amepre.2012.02.007 474
16
Garland, T., Jr., Schutz, H., Chappell, M. A., Keeney, B. K., Meek, T. H., Copes, L. E., et al. 475
(2011). The biological control of voluntary exercise, spontaneous physical activity and daily 476
energy expenditure in relation to obesity: human and rodent perspectives. Journal of 477
Experimental Biology, 214(2), 206-229. doi:10.1242/jeb.048397 478
Huybrechts, I., Boernhorst, C., Pala, V., Moreno, L. A., Barba, G., Lissner, L., et al. (2011). 479
Evaluation of the Children's Eating Habits Questionnaire used in the IDEFICS study by 480
relating urinary calcium and potassium to milk consumption frequencies among European 481
children. International Journal of Obesity, 35, S69-S78. doi:10.1038/ijo.2011.37 482
Jorm, A. F., Christensen, H., Henderson, A. S., Jacomb, P. A., Korten, A. E., & Rodgers, B. (1999). 483
Using the BIS/BAS scales to measure behavioural inhibition and behavioural activation: 484
Factor structure, validity and norms in a large community sample. Personality and 485
Individual Differences, 26(1), 49-58. 486
Kamath, C. C., Vickers, K. S., Ehrlich, A., McGovern, L., Johnson, J., Singhal, V., et al. (2008). 487
Behavioral Interventions to Prevent Childhood Obesity: A Systematic Review and 488
Metaanalyses of Randomized Trials. Journal of Clinical Endocrinology & Metabolism, 489
93(12), 4606-4615. doi:10.1210/jc.2006-2411 490
Kessler, R. M., Zald, D. H., Ansari, M. S., Li, R., & Cowan, R. L. (2014). Changes in Dopamine 491
Release and Dopamine D2/3 Receptor Levels with the Development of Mild Obesity. 492
Synapse, 68(7), 317-320. doi:10.1002/syn.21738 493
Lanfer, A., Hebestreit, A., Ahrens, W., Krogh, V., Sieri, S., Lissner, L., et al. (2011). 494
Reproducibility of food consumption frequencies derived from the Children's Eating Habits 495
Questionnaire used in the IDEFICS study. International Journal of Obesity, 35, S61-S68. 496
doi:10.1038/ijo.2011.36 497
Lawrence, N. S., Hinton, E. C., Parkinson, J. A., & Lawrence, A. D. (2012). Nucleus accumbens 498
response to food cues predicts subsequent snack consumption in women and increased body 499
mass index in those with reduced self-control. Neuroimage, 63(1), 415-422. 500
Lowe, M. R., & Butryn, M. L. (2007). Hedonic hunger: A new dimension of appetite? Physiology 501
& Behavior, 91(4), 432-439. 502
Malik, V. S., Pan, A., Willett, W. C., & Hu, F. B. (2013). Sugar-sweetened beverages and weight 503
gain in children and adults: a systematic review and meta-analysis. American Journal of 504
Clinical Nutrition, 98(4), 1084-1102. doi:10.3945/ajcn.113.058362 505
Michels, N., Vanaelst, B., Vyncke, K., Sioen, I., Huybrechts, I., De Vriendt, T., & De Henauw, S. 506
(2012). Children's Body composition and Stress - the ChiBS study: aims, design, methods, 507
population and participation characteristics. Archives of Public Health, 70(1), 17. 508
17
Must, A., Barish, E. E., & Bandini, L. G. (2009). Modifiable risk factors in relation to changes in 509
BMI and fatness: what have we learned from prospective studies of school-aged children? 510
International Journal of Obesity, 33(7), 705-715. doi:10.1038/ijo.2009.60 511
Olafsdottir, S., Berg, C., Eiben, G., Lanfer, A., Reisch, L., Ahrens, W., et al. (2014). Young 512
children's screen activities, sweet drink consumption and anthropometry: results from a 513
prospective European study. European Journal of Clinical Nutrition, 68(2), 223-228. 514
Paquet, C., Daniel, M., Knauper, B., Gauvin, L., Kestens, Y., & Dube, L. (2010). Interactive effects 515
of reward sensitivity and residential fast-food restaurant exposure on fast-food consumption. 516
American Journal of Clinical Nutrition, 91(3), 771-776. 517
Pearson, N., & Biddle, S. J. H. (2011). Sedentary Behavior and Dietary Intake in Children, 518
Adolescents, and Adults A Systematic Review. American Journal of Preventive Medicine, 519
41(2), 178-188. doi:10.1016/j.amepre.2011.05.002 520
Roelants, M., Hauspie, R., & Hoppenbrouwers, K. (2009). References for growth and pubertal 521
development from birth to 21 years in Flanders, Belgium. Annals of Human Biology, 36(6), 522
680-694. 523
Scholten, E. W., Schrijvers, C. T., Nederkoorn, C., Kremers, S. P., & Rodenburg, G. (2014). 524
Relationship between impulsivity, snack consumption and children's weight. Plos One, 9(2), 525
e88851. 526
Shrivastava, S. R., Shrivastava, P. S., & Ramasamy, J. (2014). Childhood obesity: a determinant of 527
adolescent and adult hypertension. International Journal of Preventive Medicine, 5(Suppl 528
1), S71-S72. 529
Singh, A. S., Mulder, C., Twisk, J. W., van, M. W., & Chinapaw, M. J. (2008). Tracking of 530
childhood overweight into adulthood: a systematic review of the literature. Obesity Reviews, 531
9(5), 474-488. 532
Sylvetsky, A., Rother, K. I., & Brown, R. (2011). Artificial Sweetener Use Among Children: 533
Epidemiology, Recommendations, Metabolic Outcomes, and Future Directions. Pediatric 534
Clinics of North America, 58(6), 1467-1480. doi:10.1016/j.pcl.2011.09.007 535
Tandon, P. S., Zhou, C., Sallis, J. F., Cain, K. L., Frank, L. D., & Saelens, B. E. (2012). Home 536
environment relationships with children's physical activity, sedentary time, and screen time 537
by socioeconomic status. International Journal of Behavioral Nutrition and Physical 538
Activity, 9, 9. doi:10.1186/1479-5868-9-88 539
Tapper, K., Baker, L., Jiga-Boy, G., Haddock, G., & Maio, G. R. (2015). Sensitivity to reward and 540
punishment: Associations with diet, alcohol consumption and smoking. Personality and 541
Individual Differences, 72, 79-84. doi:10.1016/j.paid.2014.08.025 542

18
Te Morenga, L. A., Mann, J., & Mallard, S. (2013). Dietary sugars and body weight: systematic 543
review and meta-analyses of randomised controlled trials. BMJ-British Medical Journal, 544
346. doi:10.1136/bmj.e7492 545
UNESCO. (1997). International standard classification of education. 546
van den Berg, L., Pieterse, K., Malik, J. A., Luman, M., van Dijk, K. W., Oosterlaan, J., & 547
Delemarre-van de Waal, H. A. (2011). Association between impulsivity, reward 548
responsiveness and body mass index in children. International Journal of Obesity, 35(10), 549
1301-1307. 550
Verbeken, S., Braet, C., Goossens, L., & van der Oord, S. (2013). Executive function training with 551
game elements for obese children: A novel treatment to enhance self-regulatory abilities for 552
weight-control. Behaviour Research and Therapy, 51(6), 290-299. 553
doi:10.1016/j.brat.2013.02.006 554
Verbeken, S., Braet, C., Lammertyn, J., Goossens, L., & Moens, E. (2012). How is reward 555
sensitivity related to bodyweight in children? Appetite, 58(2), 478-483. 556
Vervoort, L., Vandeweghe, L., Vandewalle, J., Van Durme, K., Vandevivere, E., Wante, L., et al. 557
(2015). Measuring Punishment and Reward Sensitivity in children and adolescents with a 558
parent-report version of the Bis/Bas-scales. Personality and Individual Differences, 87, 272-559
277. doi:http://dx.doi.org/10.1016/j.paid.2015.08.024 560
Voigt, D. C., Dillard, J. P., Braddock, K. H., Anderson, J. W., Sopory, P., & Stephenson, M. T. 561
(2009). Carver and White's (1994) BIS/BAS scales and their relationship to risky health 562
behaviours. Personality and Individual Differences, 47(2), 89-93. 563
doi:10.1016/j.paid.2009.02.003 564
Wang, Y., & Lim, H. (2012). The global childhood obesity epidemic and the association between 565
socio-economic status and childhood obesity. International Review of Psychiatry, 24(3), 566
176-188. 567

19
568
Table 1. Food indices based on the food categories included in the Children’s Eating Habits Questionnaire – Food 569
Frequency Questionnaire 570
Fast food consumption frequency
=Weekly consumption frequency of the
following food categories
Fried potatoes, potato croquettes
Pizza as main dish
Chips, tortillas, popcorn
Sausage roll, cheese roll, pizza-snack
Hamburger, hotdog, kebab, wrap, pita, durum
Ketchup
Mayonnaise, mayonnaise based products
Sweet food consumption frequency
Candies, marshmallow
Chocolate, candy bars
Biscuits, cakes, pastries
Ice cream
Sweet drink consumption frequency
Fruit juice
Sweet and soft drinks
Light and zero soft drinks
Sugared milk
571
572
Table 2. Descriptive data of the key variables 573
N Min P25 P50 P75 Max M sd
Age (years) 443 5.65 7.80 8.98 10.07 11.95 8.86 1.48
RS (range 4-16) 443 4.00 6.00 8.00 11.00 16.00 8.66 2.84
Fast food CF (times per week) 427 0.00 2.00 6.00 8.00 20.00 6.09 4.26
Sweet food CF (times per week) 431 0.00 5.00 9.00 13.00 30.00 9.25 5.63
Sweet drink CF (times per week) 427 0.00 4.00 8.00 14.00 37.00 9.32 6.94
Screen time (hours per week) 383 0.50 6.75 9.50 15.25 33.00 11.06 6.07
PAclub (hours per week) 387 0.00 1.00 2.00 3.50 8.00 2.29 1.68
zBMI 443 -2.89 -0.83 -0.22 0.34 2.19 -0.22 0.91
N, number. Min, minimum. P25, percentile 25. P50, median. P75, percentile 75. Max, maximum. M, mean. sd, standard 574
deviation. RS, reward sensitivity. CF, weekly consumption frequency. PAclub, physical activity in sports clubs. zBMI, 575
age- and sex-adjusted z-score of Body Mass Index. 576

20
Table 3. Correlations between reward sensitivity, age and weight-related behaviors and comparisons of these variables across sex and parental education level 1
RS Age Fast food CFa Sweet food CF
a Sweet drink CF
a Screen time PAclub
r P r P r P r P r P r P r P
Ageb -0.09 0.06
Fast food CF
a, b 0.09 0.06 0.08 0.10
Sweet food CF
a, b -0.03 0.51 -0.09 0.07 0.10* 0.05
Sweet drink CF
a, b 0.09 0.06 0.03 0.57 0.26** <0.01 0.15** <0.01
Screen time
b 0.03 0.62 0.23** <0.01 0.29** <0.01 0.11* 0.04 0.14** 0.01
PAclub
c 0.02 0.67 0.16** <0.01 <-0.01 0.96 <-0.01 0.87 -0.03 0.55 0.03 0.63
t (df) P t (df) P t (df) P t (df) P t (df) P t (df) P U (Z) P
Sex 1.82 (441) 0.07 -0.35 (441) 0.73 0.59 (425) 0.56 0.54 (429) 0.59 0.82 (425) 0.41 1.76 (359.44) 0.08 16604.00 (-1.61) 0.11
PEL 0.47 (411) 0.64 1.66 (411) 0.10 3.99 (396) ** <0.01 -1.24 (400) 0.22 3.60 (395)** <0.01 3.15 (367)** <0.01 11294.00 (-1.07) 0.29
RS, reward sensitivity. CF, weekly consumption frequency. PAclub, physical activity in sports clubs. r, correlation coefficient. t(df), t-value and degrees of freedom of unpaired t-2
test. U(Z), Mann-Whitney U and Z test statistic. PEL, parental education level. aThe natural logarithm of the food indices was used.
b Pearson correlation was conducted.
c Spearman 3
correlation was conducted. *P<0.05, **P<0.01. 4
5
6
Table 4. Linear and logistic regressions with reward sensitivity as predictor and weight-related behaviors as dependent variables 7
Dependent variable
Intercept RS Ageb Sex
c
N b (SE) P b (SE) β P b (SE) β P b (SE) β P rsp (RS) R2
Fast food CFa 427 2.42 (0.05) <0.01 0.01 (0.01) 0.10 0.04 0.02 (0.01) 0.09 0.07
0.10 0.02
Sweet food CFa 431 2.55 (0.07) <0.01 -0.01 (0.01) -0.04 0.42 -0.03 (0.01) -0.09 0.06
-0.04 0.01
Sweet drink CFa 427 2.30 (0.08) <0.01 0.02 (0.01) 0.10 0.05 0.01 (0.02) 0.04 0.46
0.10 0.01
Screen time 383 10.92 (1.04) <0.01 0.08 (0.11) 0.04 0.44 0.96 (0.20) 0.24 <0.01 -1.13 (0.61) -0.09 0.10 0.04 0.06
N blog (SE) P blog (SE) OR P blog (SE) OR P Nagelkerke R2
PAclub 389 -0.57 (0.33) 0.09 0.05 (0.04) 1.05 0.18 0.27 (0.07) 1.32 <0.01 0.05
RS, reward sensitivity. rsp, semipartial correlation. b, unstandardized regression coefficient. SE, standard error of b. β, standardized regression coefficient. CF, weekly consumption 8
frequency. blog, logistic regression coefficient. OR, odds ratio. PAclub, dichotomized physical activity in sports clubs with value zero for low and value one for high PAclub. 9 aThe natural logarithm of the food indices was used.
bCentralized child age.
cValue zero for boys, value one for girls. 10
21
Table 5. Linear regression with Body Mass Index as dependent variable. Weight-related behaviors and parental 1
education level were included as predictors in step 1, reward sensitivity was added as predictor in step 2. 2
Dependent variable:
zBMI
Predictor b SE β P
Step 1
R2=0.08
Intercept 0.35 0.19 0.06
Fast food
CF 0.02 0.01 0.11 0.06
Sweet
food CF -0.03 0.01 -0.15 <0.01
Sweet
drink CF <0.01 0.01 -0.03 0.53
Screen
time <0.01 0.01 -0.02 0.73
PAclub -0.04 0.03 -0.07 0.19
PEL -0.39 0.12 -0.18 <0.01
Step 2
R2=0.10
P(∆R2)<0.01
Intercept -0.04 0.23 0.85
Fast food
CF 0.02 0.01 0.09 0.09
Sweet
food CF -0.02 0.01 -0.15 0.01
Sweet
drink CF -0.01 0.01 -0.05 0.4
Screen
time <0.01 0.01 -0.02 0.74
PAclub -0.04 0.03 -0.07 0.15
PEL -0.39 0.12 -0.18 <0.01
RSa 0.05 0.02 0.15 <0.01
zBMI, age- and sex-adjusted z-score of Body Mass Index. b, unstandardized regression coefficient. SE, standard error 3
of b. β, standardized regression coefficient. CF, weekly consumption frequency. PAclub, physical activity in sports 4
clubs. PEL, parental education level, value zero for low and value one for high PEL. P(∆R2), P value of the R
2 change 5
between step 1 and step 2. RS, reward sensitivity. aSemi-partial correlation of RS is 0.15. 6
7