aster dem based studies for geological and ... · pdf file2.1 data used a. aster gdem 30m...
TRANSCRIPT
International Journal of Scientific & Engineering Research, Volume 3, Issue 2, February-2012 1 ISSN 2229-5518
IJSER © 2012
http://www.ijser.org
ASTER DEM Based Studies for Geological and Geomorphological Investigation in and around Gola block, Ramgarh District, Jharkhand, India
M.P. Sharma, Anukaran Kujur
Abstract- Digital elevation models (DEMs) are increasingly used for visual analysis of topography, landforms, as well as modeling of surface processes. DEM of study area is generated form ASTER GDEM data of 30m resolution with the using software ARC GIS. The interpretation of the remote sensing data with conventional data and sufficient ground truth information makes possible to identify and delineate the various ground features such as geological structures, geomorphological features and their characters. The present aim of study is an attempt to delineate the geology and geomorphology in and around Gola block of Ramgargh district, Jharkhand, India, using integrated approach of Remote Sensing and GIS techniques especially ASTER DEM by observing the elevation, aspect, slope, lineament, and shaded relief of images. DEM has been an excellent supplementary information database for interpretations in the present study area along with other data. Index Terms- ASTER DEM, GIS, Geomorphology, Gola block, Remote sensing
—————————— ——————————
1. INTRODUCTION igital elevation models (DEMs) is a digital representation of the topographical surface. It is used for visual interpretation, analysis of topography,
landforms, lithology as well as modeling of surface processes. Present days GIS is being used in various purposes such as evaluation of surface features for geological and geomorphological studies. The modern computer technologies may provide additional tools for geological mapping which may improve better agreement of determined geological units with the terrain topography. One of such tools of GIS is the Digital Elevation Model (DEM) which can serve both as information source for
finding geological boundaries, controlling elevations, and at the same time play important role in preparation of the base map as well as various surfacial thematic maps (S. Ostaficzuk, 2005). It is also used for many purposes like providing flood and landslide risk zone, highways and corridor selection including cut and fill estimation etc. These data are also good for geological interpretation particularly in terms of geomorphology, rock type and structure (Sarapirome et al. 2002).
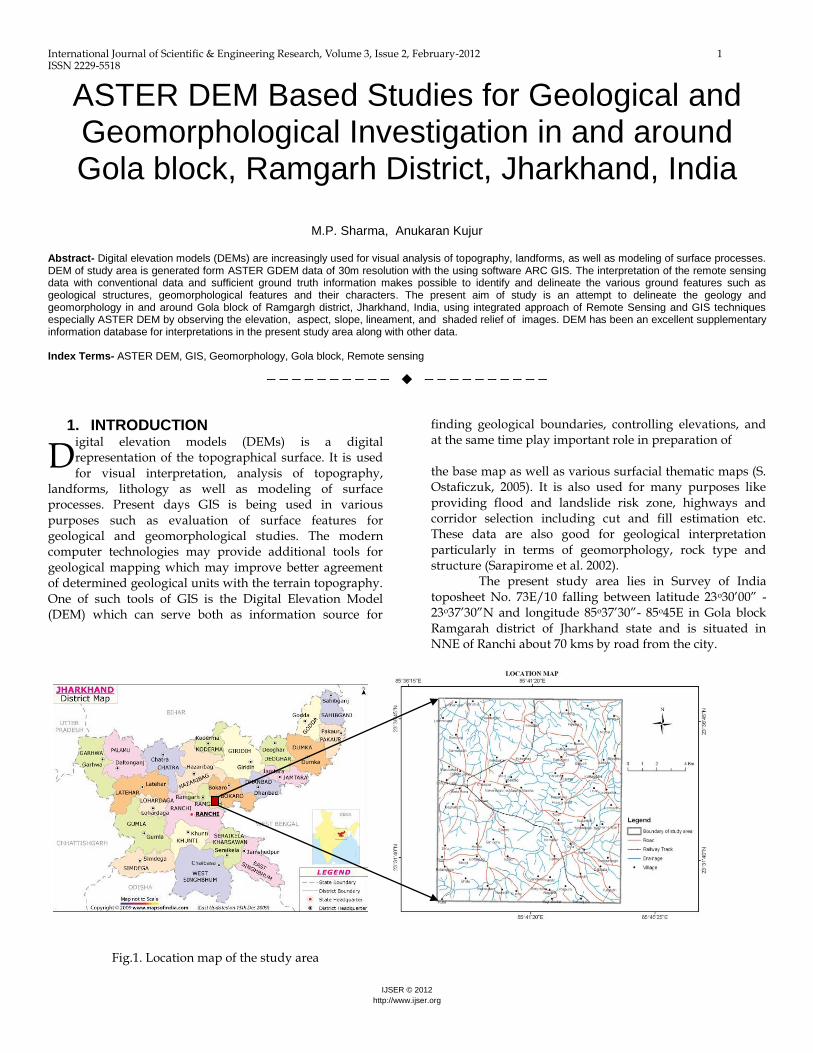
The present study area lies in Survey of India toposheet No. 73E/10 falling between latitude 23o30’00” - 23o37’30”N and longitude 85o37’30”- 85o45E in Gola block Ramgarah district of Jharkhand state and is situated in NNE of Ranchi about 70 kms by road from the city.
Fig.1. Location map of the study area
D
International Journal of Scientific & Engineering Research, Volume 3, Issue 2, February-2012 2 ISSN 2229-5518
IJSER © 2012
http://www.ijser.org
2. MATERIALS AND METHODOLOGY
2.1 Data Used
a. ASTER GDEM 30m (USGS/NASA ASTER DEM data), available from http://www.gdem.aster.ersdac.or.jp
b. ERDAS IMAGINE 9.2
c. ARC GIS 9.2
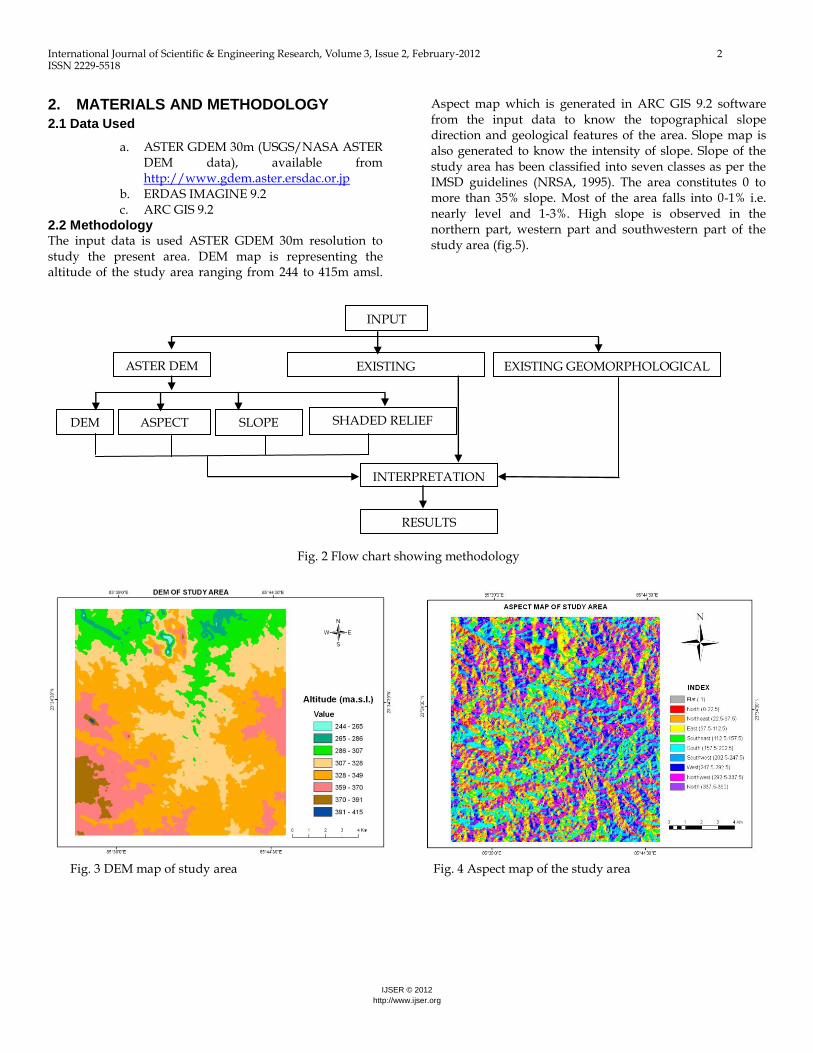
2.2 Methodology The input data is used ASTER GDEM 30m resolution to study the present area. DEM map is representing the altitude of the study area ranging from 244 to 415m amsl.
Aspect map which is generated in ARC GIS 9.2 software from the input data to know the topographical slope direction and geological features of the area. Slope map is also generated to know the intensity of slope. Slope of the study area has been classified into seven classes as per the IMSD guidelines (NRSA, 1995). The area constitutes 0 to more than 35% slope. Most of the area falls into 0-1% i.e. nearly level and 1-3%. High slope is observed in the northern part, western part and southwestern part of the study area (fig.5).
Fig. 2 Flow chart showing methodology
Fig. 3 DEM map of study area Fig. 4 Aspect map of the study area
INPUT
ASTER DEM EXISTING GEOMORPHOLOGICAL
MAP
EXISTING
LITHOLOGICALMAP
DEM ASPECT
MAP
SLOPE
MAP
SHADED RELIEF
IMAGES
INTERPRETATION
RESULTS

International Journal of Scientific & Engineering Research, Volume 3, Issue 2, February-2012 3 ISSN 2229-5518
IJSER © 2012
http://www.ijser.org
Fig. 5 Slope map of the study area Fig. 6 Shaded relief Image azimuth 315,
Sun angle75 and vertical exaggeration 5x
A number of shaded reliefs have also generated from DEM in different azimuth, sun angle and vertical exaggeration (Fig. 6, 7, 8, 9, 10 & 11). It is observed that the different azimuth and sun angle enhances to interpretations of the
present existing area. Various interpretations such as DEM, aspects, slope and shaded relief maps have been made with reference to the existing lithological and geological maps.
Fig.7 Shaded relief Image azimuth 315, Fig. 8 Shaded relief Image azimuth 315, Sun angle 45 and vertical exaggeration 5x Sun angle 45

International Journal of Scientific & Engineering Research, Volume 3, Issue 2, February-2012 4 ISSN 2229-5518
IJSER © 2012
http://www.ijser.org
Fig.9 Shaded relief Image azimuth 45, Fig.10 Shaded relief Image azimuth 315, Sun angle 45 Sun angle 10
Fig.11 Shaded relief Image azimuth 225 Sun angle 10
3. INTERPRETATIONS DEM of the study area indicates that the slope trends towards north from south. Shaded relief images can help to identify the information about geomorphometric features, rock types and structures of an area. From the shaded relief images, the geomorphometric features which is described as extent, tone, textures, size, shape, height, variation of slope and aspect on the surface can be identified. Geological structures look like a series of curvilinear features from southwest to northeast alternate banded appearance of soft and hard rocks. The data deciphers that in the southwestern part of the study area constitute hills like structures as identified, which may be of hard rocks’; like metamorphic quartzites, schists, etc. Tributaries are following the soft rocks, merging and making a form of river. A river flowing from south to north direction is totally structural controlled (a clear view of the river can be seen in Fig. 7, 8 & 9). In northwest part of the study area another river has been identified with the help of the generated data. Northern part of study area has a sudden change in the topography is rugged. There is supposed to be presence of sedimentary deposits also.

International Journal of Scientific & Engineering Research, Volume 3, Issue 2, February-2012 5 ISSN 2229-5518
IJSER © 2012
http://www.ijser.org
4. CONCLUSIONS DEM data can be used for visualization and interpretation of the area in terms of geology and geomorphology. In geological investigation we can delineate the changes in structures of the area and in the geomorphological features. We can identify the geomorphological features like lineaments, faults, fractures but not in details. DEM data, however cannot be ignored altogether as it can be very useful in giving an overview of the geology and geomorphology of any area especially where any other data
are not available for study. It can be used as a supplementary database in the visual interpretation of Remote Sensing and GIS. Reconnaissance survey before the interpretation can further helpful to identify the characteristic features seen through the imageries.
Further for better results an integrated datasets like topographical maps, geological maps, aerial photographs, satellite data and ground data generated by previous workers can be highly useful.
REFERENCES 1. Drury, S.A., (1987) Image Interpretation in
Geology, Allen & Unwin, London. 2. Lillesand, T.M., Kiefer, R.W., (1979) Remote
Sensing and Image Interpretation, John Wiley and Sons, New York.
3. Ostaficzuk, S (ed). (2005) The Current Role of Geological Mapping in Geosciences, Springer, Netherlands, pp. 89-96.
4. Sarapirome, S et.al (2002) Application of DEM data to Geological Interpretation: Tho Pha Phum Area, Thailand, 23rd Asian Conference on Remote Sensing, Birendra International Convention Centre, Kathmandu, Nepal.
5. Singh, B. and Dowerah, J. (2010) ASTER DEM Based Studies for Geological Investigation around Singhbhum Shear Zone (SSZ) in Jharkhand, India Journal of Geographic Information System, Published Online January 2010 (http://www.scirp.org/journal/jgis).
AUTHORS 1. Dr. Murari Prashad Sharma, Reader (Retd), University
Department of Geology, Ranchi University, Ranchi- 834008. 2. Anukaran Kujur Research Scholar, University Department of
Geology, Ranchi University, Ranchi – 834008 Corresponding Author’s e-mail ID-