astr 351 course stellar radiation characteristics ppart
TRANSCRIPT
AAssttrr 335511 ccoouurrssee
SStteellllaarr rraaddiiaattiioonn cchhaarraacctteerriissttiiccss
Part I: Part I: SSppeeccttrroossccooppyy
Stellar radiation characteristics Ast 351
Chapter 1
Spectroscopy: Unlocking the secret in starlight
1.1 Spectroscopy is a key tool in astronomy
By obtaining and analyzing the spectrum from a distant object, astronomers can identify what type of object it is and determine a wealth of characteristics for the object. These include its effective temperature, how fast it is rotating and whether it is moving towards or away from us, how large and dense it is and what it is made of. Within the last decade planets beyond our Solar System have been discovered via their effect on the parent star's spectrum.
1.2 Historical introduction to spectroscopy
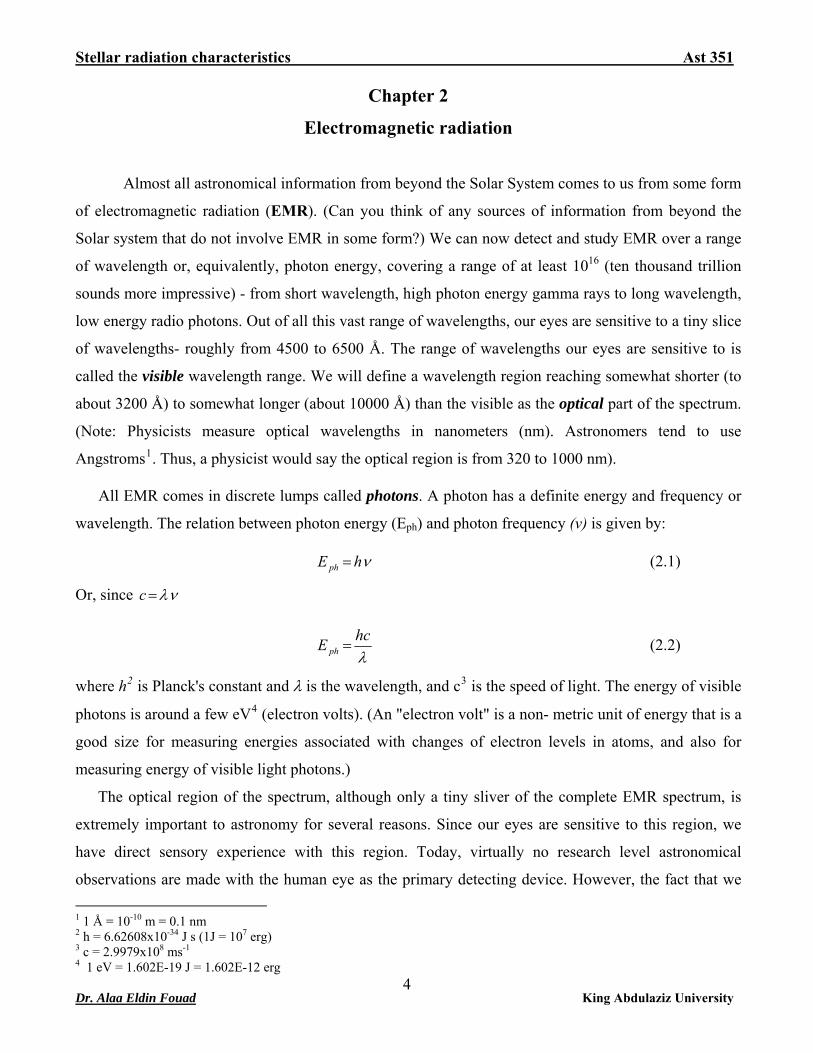
Before looking in detail at how spectra are formed and what they can tell us about stars and other celestial objects it is worth briefly discussing the rise of spectroscopy in astronomy. Isaac Newton showed that a glass prism could be used to split sunlight into a spectrum in 1666. Further studies by William Wollaston in 1802 revealed some black lines on the component colors of the solar spectrum. More detailed observations by Joseph von Fraunhofer resulted in 574 of these lines being mapped by 1815. These lines were named "Fraunhofer lines" in his honor. The image below shows a solar spectrum with Fraunhofer lines.
Sun's Spectrum showing Fraunhofer lines
Two key questions arise from studying these lines - what do they represent and how are they formed? The solutions to these questions were to take some time. Leon Focault matched the lines produced by a sodium lamp with some of the dark lines in a solar spectrum in 1849. In 1857 Gustav Kirchoff and Robert Bunsen identified sodium in a solar spectrum. They found that a luminous solid or highly compressed hot gas could produce a continuous spectrum whilst a diffuse hot gas produced a spectrum with narrow bright lines on a black background.
As spectroscopes were coupled to telescopes additional chemicals were identified in the spectra of stars and nebulae. Sir Norman Lockyer and Jules Janssen independently discovered the element helium in solar spectra before it was isolated in a laboratory on Earth in 1895. The use of spectroscopy, coupled
Dr. Alaa Eldin Fouad King Abdulaziz University 2
Stellar radiation characteristics Ast 351
with the spread of photography for astronomical purposes gave rise to the science of astrophysics from astronomy in the second half of the nineteenth century.
Three general types of spectra were now known, a continuous spectrum, showing all the component colors of the rainbow, and two types of line spectra, the first, dark-line spectra like the solar spectrum and those from stars and the second, bright-line spectra as emitted from gas discharge tubes and some nebulae. The Swiss school teacher, Johann Balmer in 1885 developed an empirical formula that determined the wavelengths of the four visible lines in hydrogen's spectrum. Five years later the Swedish physicist, Johannes Rydberg expanded Balmer's formula to apply to some other elements. The Danish physicist, Niels Bohr, finally provided an explanation as to how spectral lines formed in the 1920s. His work relied on quantum physics and the concept of energy shells or orbits for electrons.
___________________________________________________________________________________
1. How the dark lines in the solar spectrum are formed?
2. What do the dark lines in the solar spectrum represent?
3. Why the spectroscopy is a key tool in astronomy?
Dr. Alaa Eldin Fouad King Abdulaziz University 3
Stellar radiation characteristics Ast 351
Chapter 2
Electromagnetic radiation
Almost all astronomical information from beyond the Solar System comes to us from some form
of electromagnetic radiation (EMR). (Can you think of any sources of information from beyond the
Solar system that do not involve EMR in some form?) We can now detect and study EMR over a range
of wavelength or, equivalently, photon energy, covering a range of at least 1016 (ten thousand trillion
sounds more impressive) - from short wavelength, high photon energy gamma rays to long wavelength,
low energy radio photons. Out of all this vast range of wavelengths, our eyes are sensitive to a tiny slice
of wavelengths- roughly from 4500 to 6500 Å. The range of wavelengths our eyes are sensitive to is
called the visible wavelength range. We will define a wavelength region reaching somewhat shorter (to
about 3200 Å) to somewhat longer (about 10000 Å) than the visible as the optical part of the spectrum.
(Note: Physicists measure optical wavelengths in nanometers (nm). Astronomers tend to use
Angstroms1. Thus, a physicist would say the optical region is from 320 to 1000 nm).
All EMR comes in discrete lumps called photons. A photon has a definite energy and frequency or
wavelength. The relation between photon energy (Eph) and photon frequency (ν) is given by:
νhE ph = (2.1)
Or, since νλ=c
λhcE ph = (2.2)
where h2 is Planck's constant and λ is the wavelength, and c3 is the speed of light. The energy of visible
photons is around a few eV4 (electron volts). (An "electron volt" is a non- metric unit of energy that is a
good size for measuring energies associated with changes of electron levels in atoms, and also for
measuring energy of visible light photons.)
The optical region of the spectrum, although only a tiny sliver of the complete EMR spectrum, is
extremely important to astronomy for several reasons. Since our eyes are sensitive to this region, we
have direct sensory experience with this region. Today, virtually no research level astronomical
observations are made with the human eye as the primary detecting device. However, the fact that we 1 1 Å = 10-10 m = 0.1 nm 2 h = 6.62608x10⁻³⁴ J s (1J = 107 erg) 3 c = 2.9979x10⁸ ms-1
4 1 eV = 1.602E-19 J = 1.602E-12 erg
Dr. Alaa Eldin Fouad King Abdulaziz University 4
Stellar radiation characteristics Ast 351
see in visible light has driven a vast technological effort over the past century or two to develop devices
“photographic emulsions, photomultipliers, video cameras, various solid state imagers” that detect and
record visible light. The second overriding reason to study optical light is that the Earths atmosphere is
at least partially transparent to this region of the spectrum- otherwise you couldn't see the stars at night
(or the Sun during the day)! Much of the EMR spectrum is blocked by the atmosphere, and can only be
studied using telescopes placed above the atmosphere. Only in the optical and radio regions of the
spectrum are there large atmospheric windows - portions of the EMR spectrum for which the
atmosphere is at least partially transparent- which allow us to study the universe. Study of wavelengths
that don't penetrate the atmosphere using telescopes and detectors out in space- which we will call
space astronomy - is an extremely important part of modern astronomy which has fantastically enriched
our view of the universe over the past few decades. However, space astronomy is very expensive and
difficult to carry out.
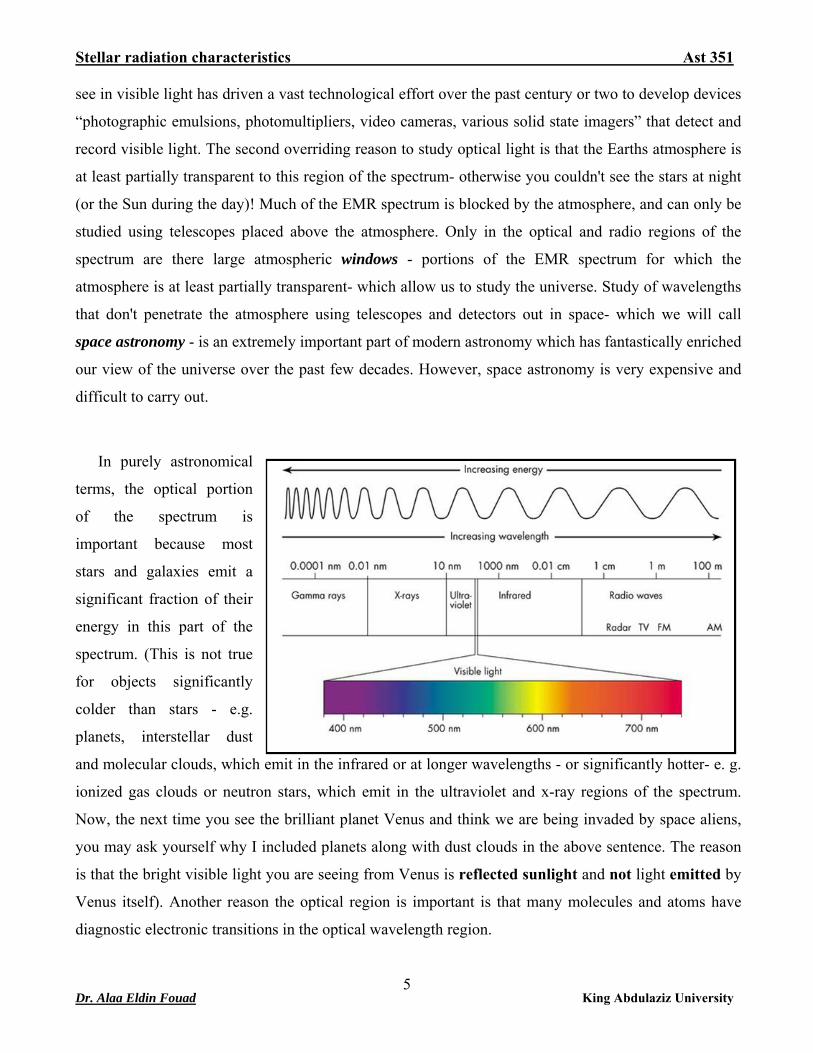
In purely astronomical
terms, the optical portion
of the spectrum is
important because most
stars and galaxies emit a
significant fraction of their
energy in this part of the
spectrum. (This is not true
for objects significantly
colder than stars - e.g.
planets, interstellar dust
and molecular clouds, which emit in the infrared or at longer wavelengths - or significantly hotter- e. g.
ionized gas clouds or neutron stars, which emit in the ultraviolet and x-ray regions of the spectrum.
Now, the next time you see the brilliant planet Venus and think we are being invaded by space aliens,
you may ask yourself why I included planets along with dust clouds in the above sentence. The reason
is that the bright visible light you are seeing from Venus is reflected sunlight and not light emitted by
Venus itself). Another reason the optical region is important is that many molecules and atoms have
diagnostic electronic transitions in the optical wavelength region.
Dr. Alaa Eldin Fouad King Abdulaziz University 5
Stellar radiation characteristics Ast 351
King Abdulaziz University 6
Dr. Alaa Eldin Fouad

Stellar radiation characteristics Ast 351
1. What do radio waves, infrared radiation, visible light, ultraviolet radiation, X-rays, and gamma rays
have in common? How do they differ? 2. What is the relationship between wavelength, wave frequency, and wave velocity? 3. What is the type of relation between the photon energy and the wavelength of light? 4. What is the type of relation between the photon energy and the frequency of light? 5. Why the optical region of the spectrum is extremely important? 6. Test the physical units in equations (2.1) and (2.2) 7. In what regions of the electromagnetic spectrum is the atmosphere transparent enough to allow
observations from the ground? 8. What we mean by space astronomy? 9. What we mean by “atmospheric window”? 10. Arrange the EMR from the shortest wavelength to the longest wavelength 11. Why are gamma rays generally harmful to life forms, but radio waves generally harmless? 12. What is the energy of a photon in the middle of the visible spectrum (λ = 550 nm)? 13. What would be the frequency of an electromagnetic wave having a wavelength equal to Earth's
diameter? In what part of the electromagnetic spectrum would such a wave lie? 14. What is the energy (in joules and electron volts) of a 450-nm blue photon? A 200-nm ultraviolet
photon? 15. A sound wave moving through water has a frequency of 256 Hz and a wavelength of 5.77 m. What
is the speed of sound in water? 16. What is the wavelength of a 100-MHz ("FM 100") radio signal?
Dr. Alaa Eldin Fouad King Abdulaziz University 7

Stellar radiation characteristics Ast 351
Chapter 3
How are spectra produced?
3.1 Types of Spectra
Spectra can be simplified to one of three basic types. Simple examples in the visible wavebands are shown below.
Type of Spectrum Photographic example
Continuous (or continuum)
Absorption (dark line)
Emission (bright line)
One means by which a continuous spectrum can be produced is by thermal emission from a black body. This is particularly relevant in astronomy and is discussed in the next section. Astronomical spectra can be combination of absorption and emission lines on a continuous background spectrum.
3.2 Black body Radiation
What gives rise to a continuous spectrum? Imagine heating a solid steel sphere with a blowtorch. When you remove the torch you can feel the heat being re-radiated by the sphere. Applying the torch again puts more energy into the sphere - it gets hotter. Eventually it starts to glow dimly. As you continue heating it the sphere glows first red, then orange, yellow then white hot. If you were able to keep heating it sufficiently it may even glow blue hot. This sphere approximates what physicists call a black body.
A black body radiator is a theoretical object that is totally absorbent to all thermal energy that falls on it, thus it does not reflect any light so appears black. As it absorbs energy it heats up and re-radiates the energy as electromagnetic radiation.
In the real world some objects approximate the behavior of blackbodies. These must be sources of thermal energy and must be sufficiently opaque that light interacts with the material inside the source. Examples of such objects include the tungsten filaments of incandescent lamps and the cores of stars. The continuous spectrum produced by a black body is distinctive and can be shown as an intensity plot
Dr. Alaa Eldin Fouad King Abdulaziz University 8
Stellar radiation characteristics Ast 351
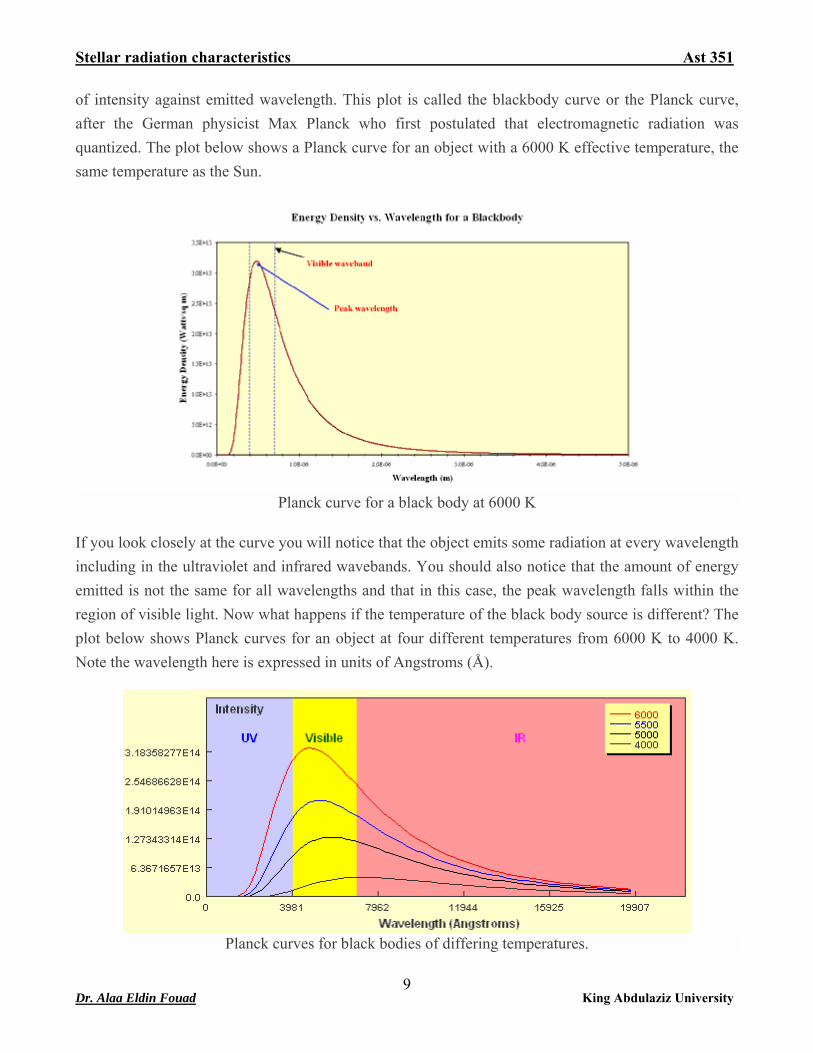
of intensity against emitted wavelength. This plot is called the blackbody curve or the Planck curve, after the German physicist Max Planck who first postulated that electromagnetic radiation was quantized. The plot below shows a Planck curve for an object with a 6000 K effective temperature, the same temperature as the Sun.
Planck curve for a black body at 6000 K
If you look closely at the curve you will notice that the object emits some radiation at every wavelength including in the ultraviolet and infrared wavebands. You should also notice that the amount of energy emitted is not the same for all wavelengths and that in this case, the peak wavelength falls within the region of visible light. Now what happens if the temperature of the black body source is different? The plot below shows Planck curves for an object at four different temperatures from 6000 K to 4000 K. Note the wavelength here is expressed in units of Angstroms (Å).
Planck curves for black bodies of differing temperatures.
Dr. Alaa Eldin Fouad King Abdulaziz University 9
Stellar radiation characteristics Ast 351
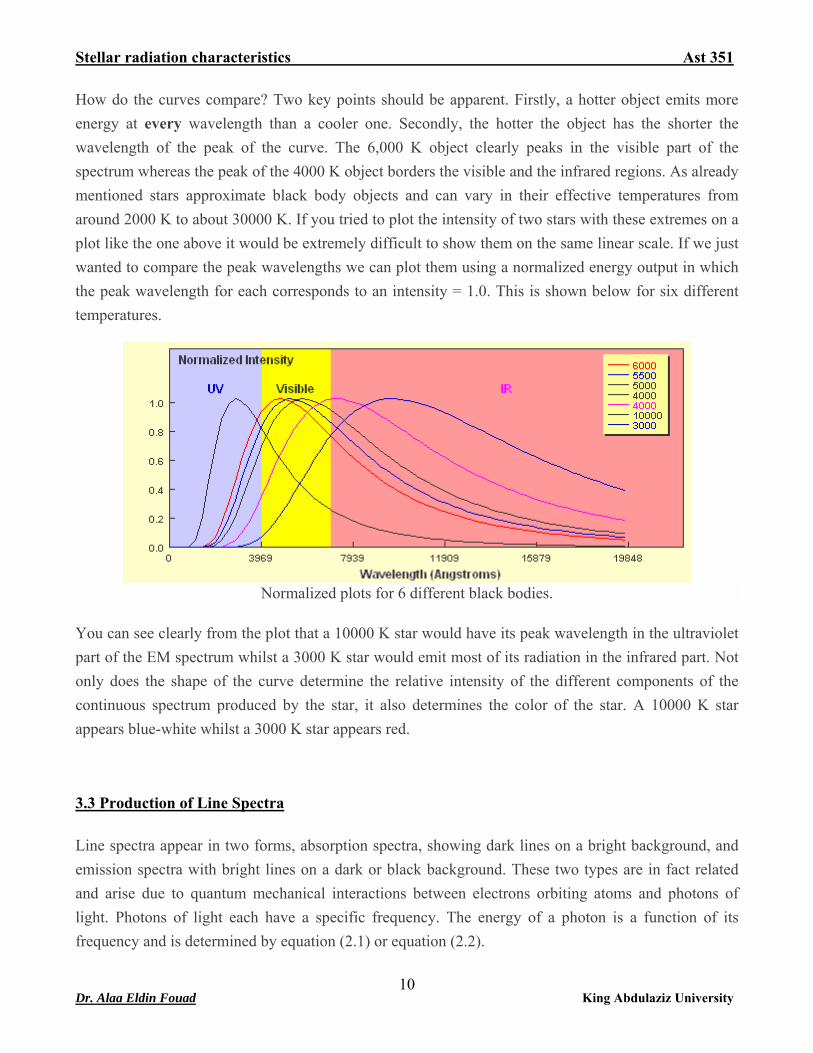
How do the curves compare? Two key points should be apparent. Firstly, a hotter object emits more energy at every wavelength than a cooler one. Secondly, the hotter the object has the shorter the wavelength of the peak of the curve. The 6,000 K object clearly peaks in the visible part of the spectrum whereas the peak of the 4000 K object borders the visible and the infrared regions. As already mentioned stars approximate black body objects and can vary in their effective temperatures from around 2000 K to about 30000 K. If you tried to plot the intensity of two stars with these extremes on a plot like the one above it would be extremely difficult to show them on the same linear scale. If we just wanted to compare the peak wavelengths we can plot them using a normalized energy output in which the peak wavelength for each corresponds to an intensity = 1.0. This is shown below for six different temperatures.
Normalized plots for 6 different black bodies.
You can see clearly from the plot that a 10000 K star would have its peak wavelength in the ultraviolet part of the EM spectrum whilst a 3000 K star would emit most of its radiation in the infrared part. Not only does the shape of the curve determine the relative intensity of the different components of the continuous spectrum produced by the star, it also determines the color of the star. A 10000 K star appears blue-white whilst a 3000 K star appears red.
3.3 Production of Line Spectra
Line spectra appear in two forms, absorption spectra, showing dark lines on a bright background, and emission spectra with bright lines on a dark or black background. These two types are in fact related and arise due to quantum mechanical interactions between electrons orbiting atoms and photons of light. Photons of light each have a specific frequency. The energy of a photon is a function of its frequency and is determined by equation (2.1) or equation (2.2).
Dr. Alaa Eldin Fouad King Abdulaziz University 10
Stellar radiation characteristics Ast 351
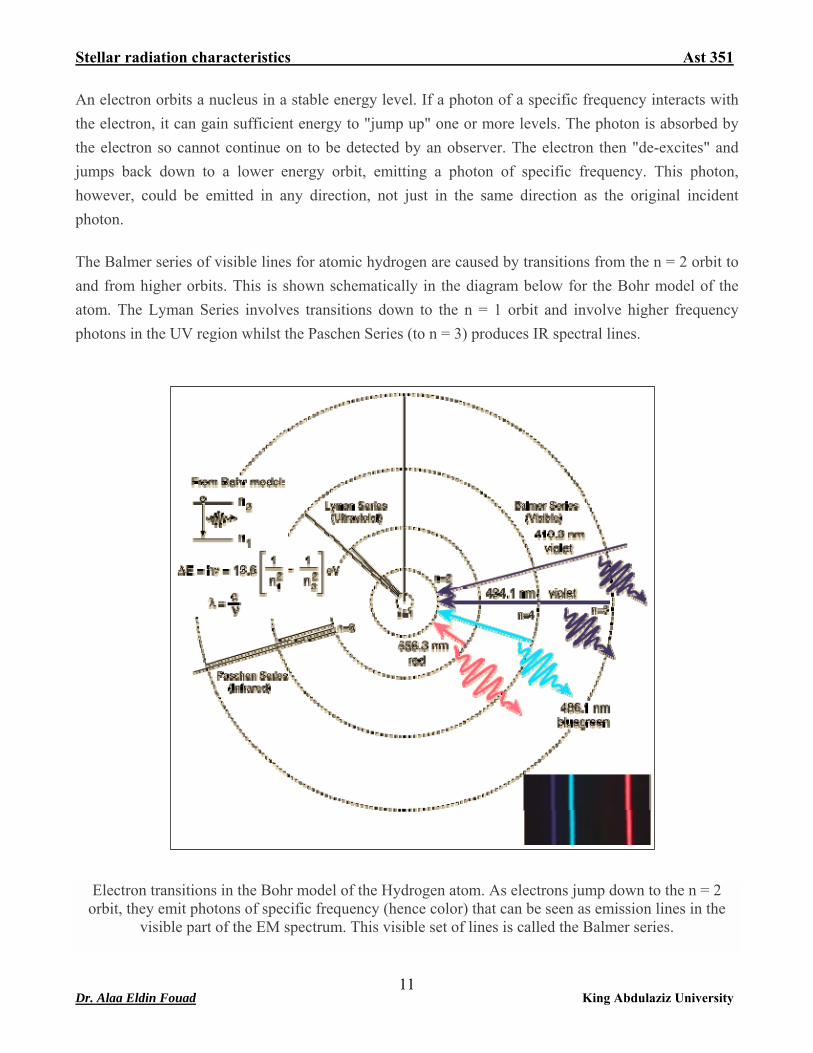
An electron orbits a nucleus in a stable energy level. If a photon of a specific frequency interacts with the electron, it can gain sufficient energy to "jump up" one or more levels. The photon is absorbed by the electron so cannot continue on to be detected by an observer. The electron then "de-excites" and jumps back down to a lower energy orbit, emitting a photon of specific frequency. This photon, however, could be emitted in any direction, not just in the same direction as the original incident photon.
The Balmer series of visible lines for atomic hydrogen are caused by transitions from the n = 2 orbit to and from higher orbits. This is shown schematically in the diagram below for the Bohr model of the atom. The Lyman Series involves transitions down to the n = 1 orbit and involve higher frequency photons in the UV region whilst the Paschen Series (to n = 3) produces IR spectral lines.
Electron transitions in the Bohr model of the Hydrogen atom. As electrons jump down to the n = 2
orbit, they emit photons of specific frequency (hence color) that can be seen as emission lines in the visible part of the EM spectrum. This visible set of lines is called the Balmer series.
Dr. Alaa Eldin Fouad King Abdulaziz University 11
Stellar radiation characteristics Ast 351
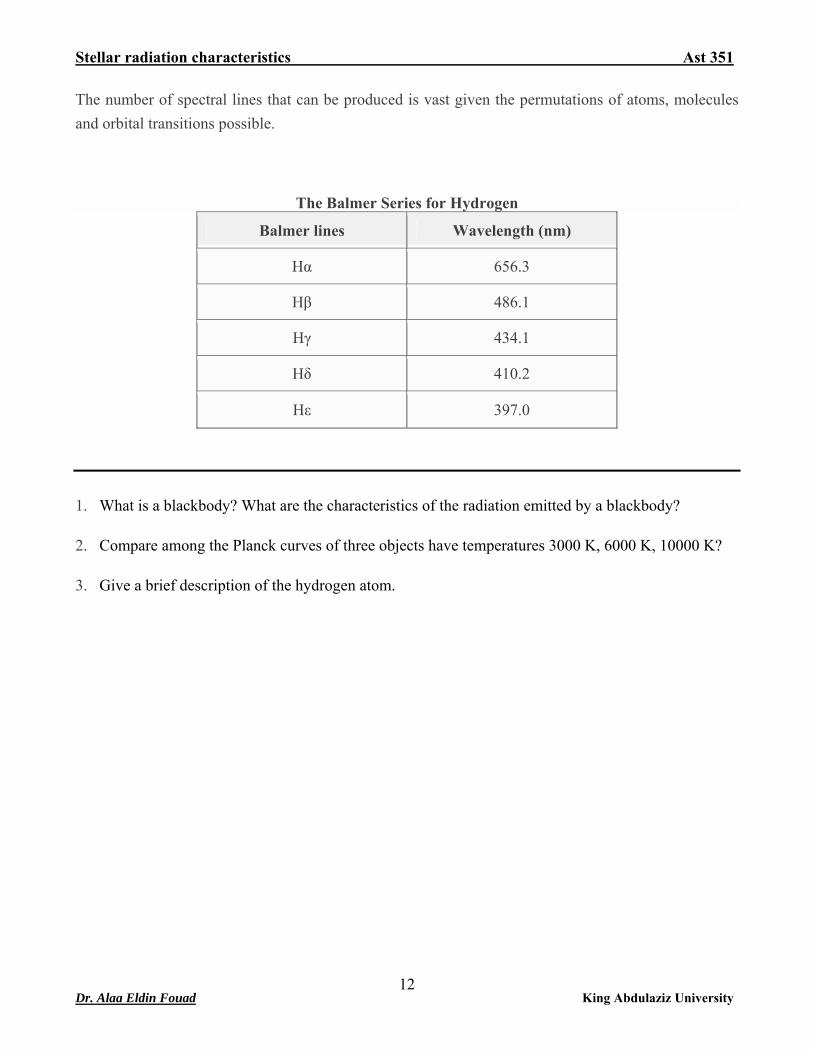
The number of spectral lines that can be produced is vast given the permutations of atoms, molecules and orbital transitions possible.
The Balmer Series for Hydrogen
Balmer lines Wavelength (nm)
Hα 656.3
Hβ 486.1
Hγ 434.1
Hδ 410.2
Hε 397.0
1. What is a blackbody? What are the characteristics of the radiation emitted by a blackbody?
2. Compare among the Planck curves of three objects have temperatures 3000 K, 6000 K, 10000 K?
3. Give a brief description of the hydrogen atom.
Dr. Alaa Eldin Fouad King Abdulaziz University 12
Stellar radiation characteristics Ast 351
Chapter 4
Obtaining astronomical spectra -spectrographs
4.1 How does a Spectrograph Work?
A spectrograph is an instrument used to obtain and record an astronomical spectrum. The spectrograph splits or disperses the light from an object into its component wavelengths so that it can be recorded then analyzed. These steps are discussed in more detail below.
4.1.1 Dispersing Light
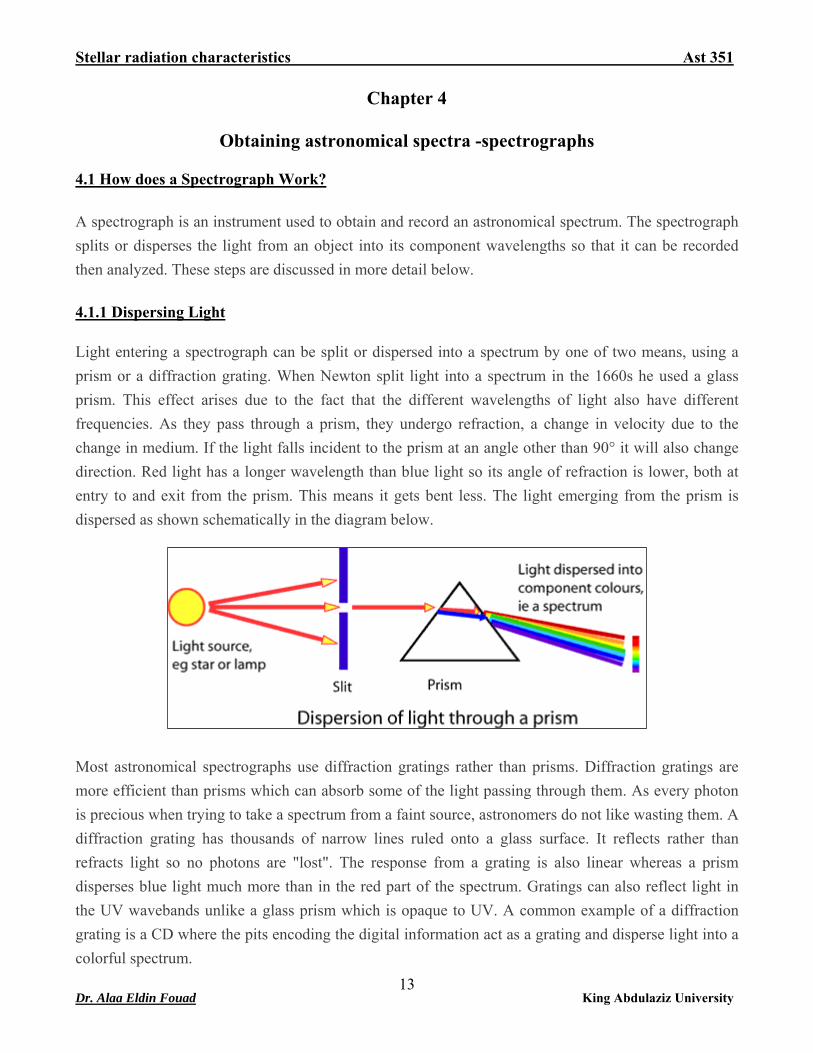
Light entering a spectrograph can be split or dispersed into a spectrum by one of two means, using a prism or a diffraction grating. When Newton split light into a spectrum in the 1660s he used a glass prism. This effect arises due to the fact that the different wavelengths of light also have different frequencies. As they pass through a prism, they undergo refraction, a change in velocity due to the change in medium. If the light falls incident to the prism at an angle other than 90° it will also change direction. Red light has a longer wavelength than blue light so its angle of refraction is lower, both at entry to and exit from the prism. This means it gets bent less. The light emerging from the prism is dispersed as shown schematically in the diagram below.
Most astronomical spectrographs use diffraction gratings rather than prisms. Diffraction gratings are more efficient than prisms which can absorb some of the light passing through them. As every photon is precious when trying to take a spectrum from a faint source, astronomers do not like wasting them. A diffraction grating has thousands of narrow lines ruled onto a glass surface. It reflects rather than refracts light so no photons are "lost". The response from a grating is also linear whereas a prism disperses blue light much more than in the red part of the spectrum. Gratings can also reflect light in the UV wavebands unlike a glass prism which is opaque to UV. A common example of a diffraction grating is a CD where the pits encoding the digital information act as a grating and disperse light into a colorful spectrum.
Dr. Alaa Eldin Fouad King Abdulaziz University 13
Stellar radiation characteristics Ast 351
Diffraction from the pits in a CD. Dispersion of light from a diffraction grating.
4.1.2 Structure of a Spectrograph
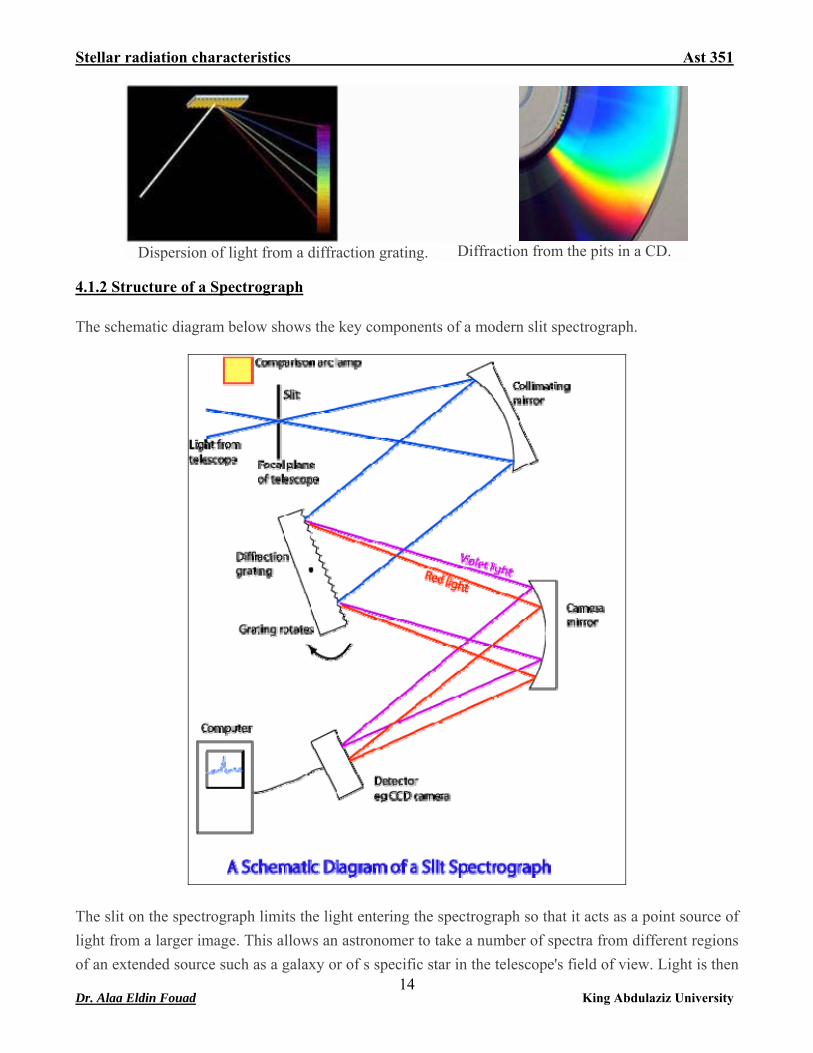
The schematic diagram below shows the key components of a modern slit spectrograph.
14
The slit on the spectrograph limits the light entering the spectrograph so that it acts as a point source of light from a larger image. This allows an astronomer to take a number of spectra from different regions of an extended source such as a galaxy or of s specific star in the telescope's field of view. Light is then
Dr. Alaa Eldin Fouad King Abdulaziz University
Stellar radiation characteristics Ast 351
collimated (made parallel) before hitting a diffraction grating. This disperses the light into component wavelengths which can then by focused by a camera mirror into a detector such as a charged-couple device (CCD). By rotating the grating different parts of the dispersed spectrum can be focused on the camera. The comparison lamp is vital in that it provides spectral lines of known wavelength (e.g. sodium or neon) at rest with respect to the spectrograph, allowing the spectrum of the distant source to be calibrated and any shift of spectral lines to be measured.
4.1.3 Recording the Spectrum
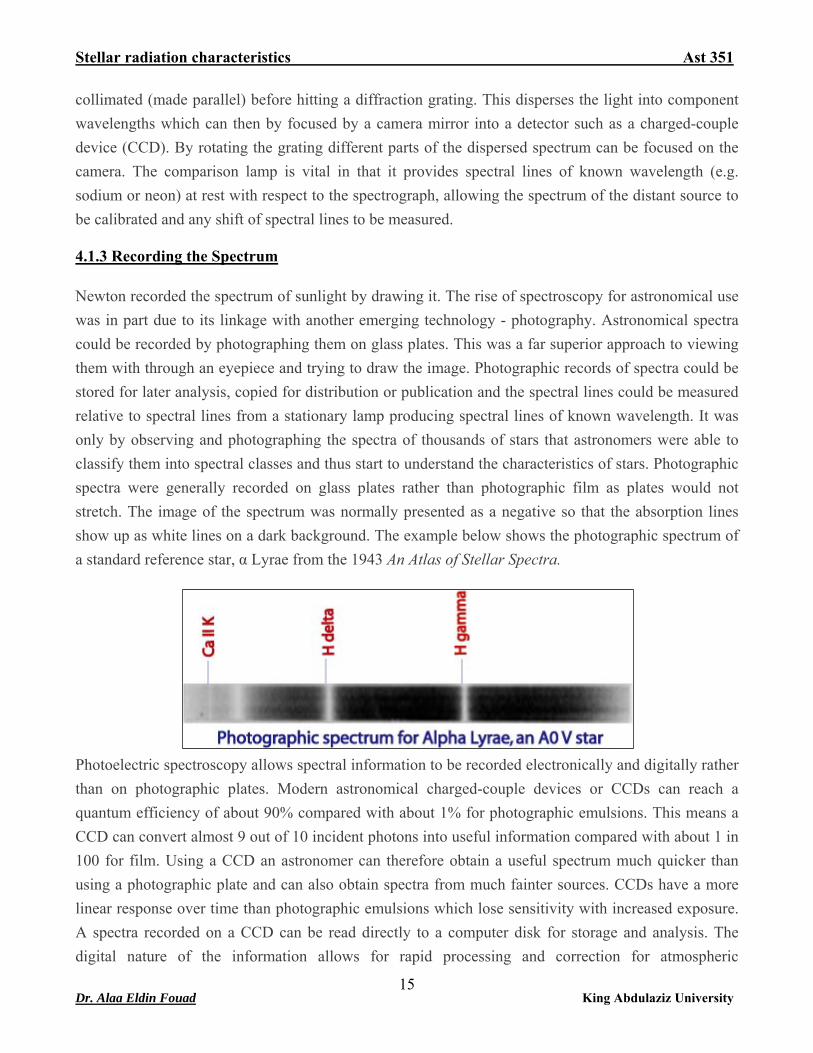
Newton recorded the spectrum of sunlight by drawing it. The rise of spectroscopy for astronomical use was in part due to its linkage with another emerging technology - photography. Astronomical spectra could be recorded by photographing them on glass plates. This was a far superior approach to viewing them with through an eyepiece and trying to draw the image. Photographic records of spectra could be stored for later analysis, copied for distribution or publication and the spectral lines could be measured relative to spectral lines from a stationary lamp producing spectral lines of known wavelength. It was only by observing and photographing the spectra of thousands of stars that astronomers were able to classify them into spectral classes and thus start to understand the characteristics of stars. Photographic spectra were generally recorded on glass plates rather than photographic film as plates would not stretch. The image of the spectrum was normally presented as a negative so that the absorption lines show up as white lines on a dark background. The example below shows the photographic spectrum of a standard reference star, α Lyrae from the 1943 An Atlas of Stellar Spectra.
Photoelectric spectroscopy allows spectral information to be recorded electronically and digitally rather than on photographic plates. Modern astronomical charged-couple devices or CCDs can reach a quantum efficiency of about 90% compared with about 1% for photographic emulsions. This means a CCD can convert almost 9 out of 10 incident photons into useful information compared with about 1 in 100 for film. Using a CCD an astronomer can therefore obtain a useful spectrum much quicker than using a photographic plate and can also obtain spectra from much fainter sources. CCDs have a more linear response over time than photographic emulsions which lose sensitivity with increased exposure. A spectra recorded on a CCD can be read directly to a computer disk for storage and analysis. The digital nature of the information allows for rapid processing and correction for atmospheric
Dr. Alaa Eldin Fouad King Abdulaziz University 15
Stellar radiation characteristics Ast 351
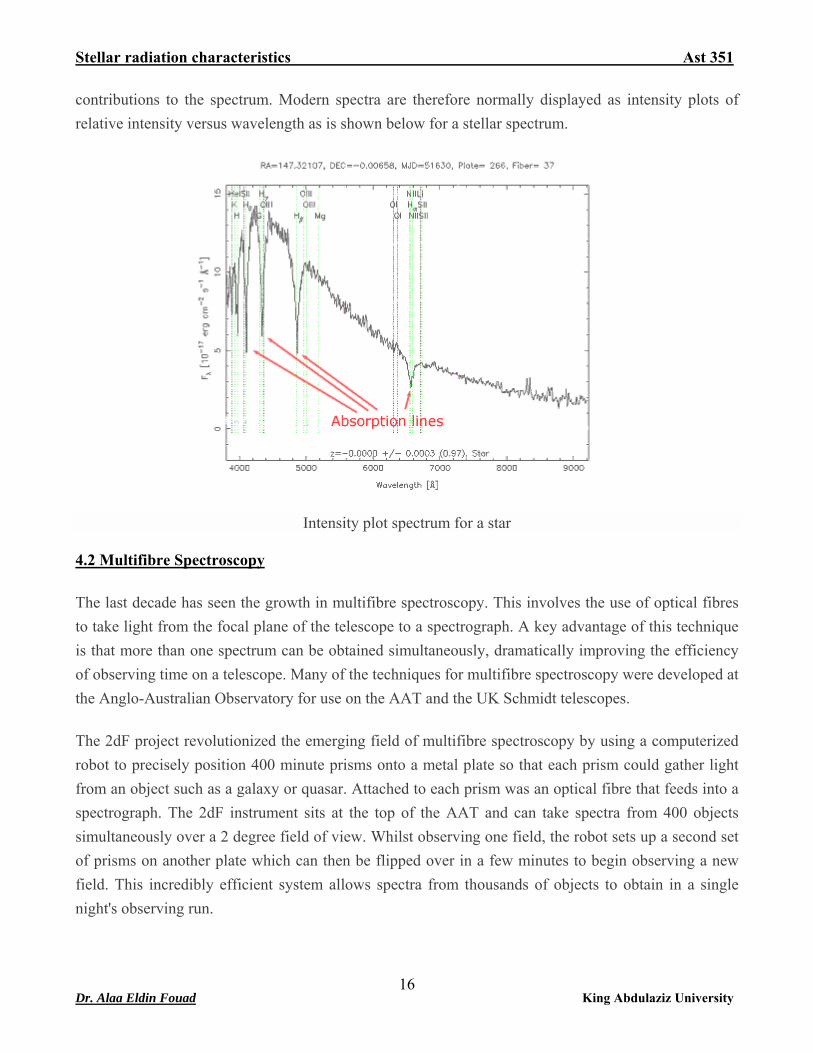
contributions to the spectrum. Modern spectra are therefore normally displayed as intensity plots of relative intensity versus wavelength as is shown below for a stellar spectrum.
Intensity plot spectrum for a star
4.2 Multifibre Spectroscopy
The last decade has seen the growth in multifibre spectroscopy. This involves the use of optical fibres to take light from the focal plane of the telescope to a spectrograph. A key advantage of this technique is that more than one spectrum can be obtained simultaneously, dramatically improving the efficiency of observing time on a telescope. Many of the techniques for multifibre spectroscopy were developed at the Anglo-Australian Observatory for use on the AAT and the UK Schmidt telescopes.
The 2dF project revolutionized the emerging field of multifibre spectroscopy by using a computerized robot to precisely position 400 minute prisms onto a metal plate so that each prism could gather light from an object such as a galaxy or quasar. Attached to each prism was an optical fibre that feeds into a spectrograph. The 2dF instrument sits at the top of the AAT and can take spectra from 400 objects simultaneously over a 2 degree field of view. Whilst observing one field, the robot sets up a second set of prisms on another plate which can then be flipped over in a few minutes to begin observing a new field. This incredibly efficient system allows spectra from thousands of objects to obtain in a single night's observing run.
Dr. Alaa Eldin Fouad King Abdulaziz University 16
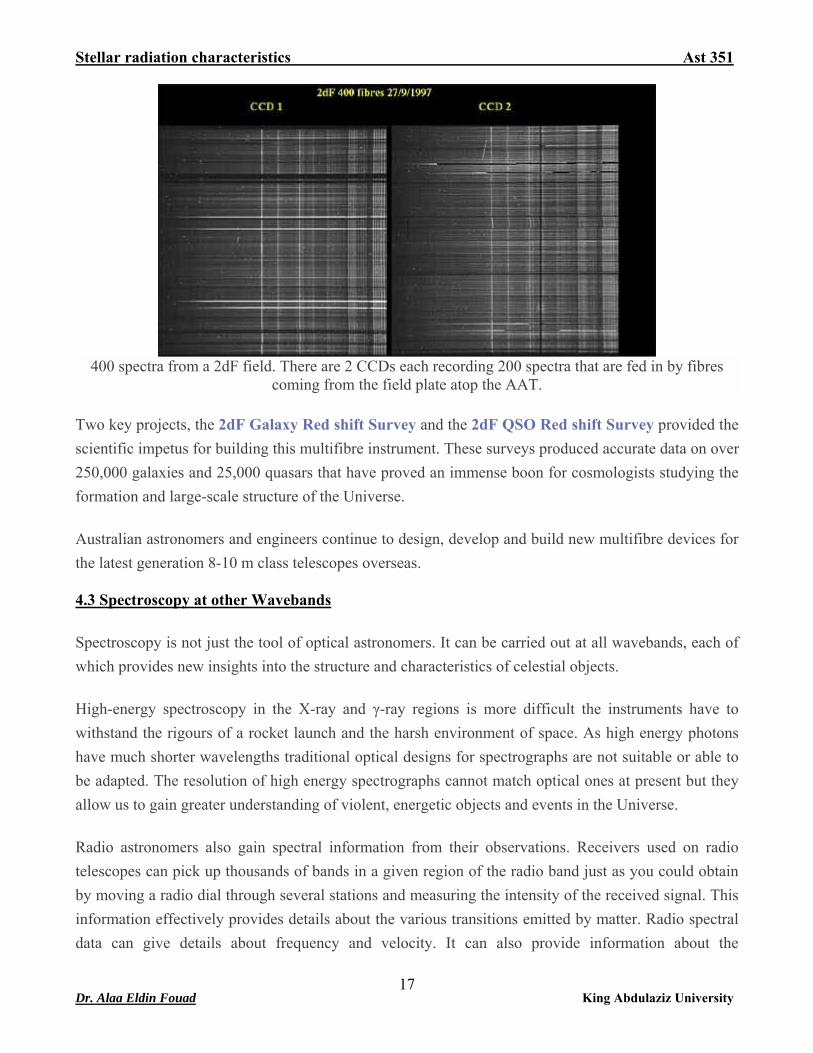
Stellar radiation characteristics Ast 351
400 spectra from a 2dF field. There are 2 CCDs each recording 200 spectra that are fed in by fibres
coming from the field plate atop the AAT.
Two key projects, the 2dF Galaxy Red shift Survey and the 2dF QSO Red shift Survey provided the scientific impetus for building this multifibre instrument. These surveys produced accurate data on over 250,000 galaxies and 25,000 quasars that have proved an immense boon for cosmologists studying the formation and large-scale structure of the Universe.
Australian astronomers and engineers continue to design, develop and build new multifibre devices for the latest generation 8-10 m class telescopes overseas.
4.3 Spectroscopy at other Wavebands
Spectroscopy is not just the tool of optical astronomers. It can be carried out at all wavebands, each of which provides new insights into the structure and characteristics of celestial objects.
High-energy spectroscopy in the X-ray and γ-ray regions is more difficult the instruments have to withstand the rigours of a rocket launch and the harsh environment of space. As high energy photons have much shorter wavelengths traditional optical designs for spectrographs are not suitable or able to be adapted. The resolution of high energy spectrographs cannot match optical ones at present but they allow us to gain greater understanding of violent, energetic objects and events in the Universe.
Radio astronomers also gain spectral information from their observations. Receivers used on radio telescopes can pick up thousands of bands in a given region of the radio band just as you could obtain by moving a radio dial through several stations and measuring the intensity of the received signal. This information effectively provides details about the various transitions emitted by matter. Radio spectral data can give details about frequency and velocity. It can also provide information about the
Dr. Alaa Eldin Fouad King Abdulaziz University 17

Stellar radiation characteristics Ast 351
polarization of the signal, information not normally available in visible spectra. Improvements in receivers and detectors now allow astronomers to routinely observe at mm-wavelengths where there is a wealth of spectral lines from molecules in space. Molecules such as acetic acid and formaldehyde have been discovered in interstellar clouds and the search continues for the signature of amino acids such as glycine. Information on these will prove vital for astrobiologists and astrochemists.
___________________________________________________________________________________
1. How does a spectrograph work?
2. Why is the diffraction grating more efficient than prism?
3. What are the tools of recording the celestial object spectrum?
4. What are the advantages of using the modern astronomical charged-couple devices?
5. What are the information of radio spectra and not available in visible spectra?
6. What is the key advantage of multifibre technique?
Dr. Alaa Eldin Fouad King Abdulaziz University 18
Stellar radiation characteristics Ast 351
Chapter 5
Astronomical spectra
5.1 Types of astronomical spectra
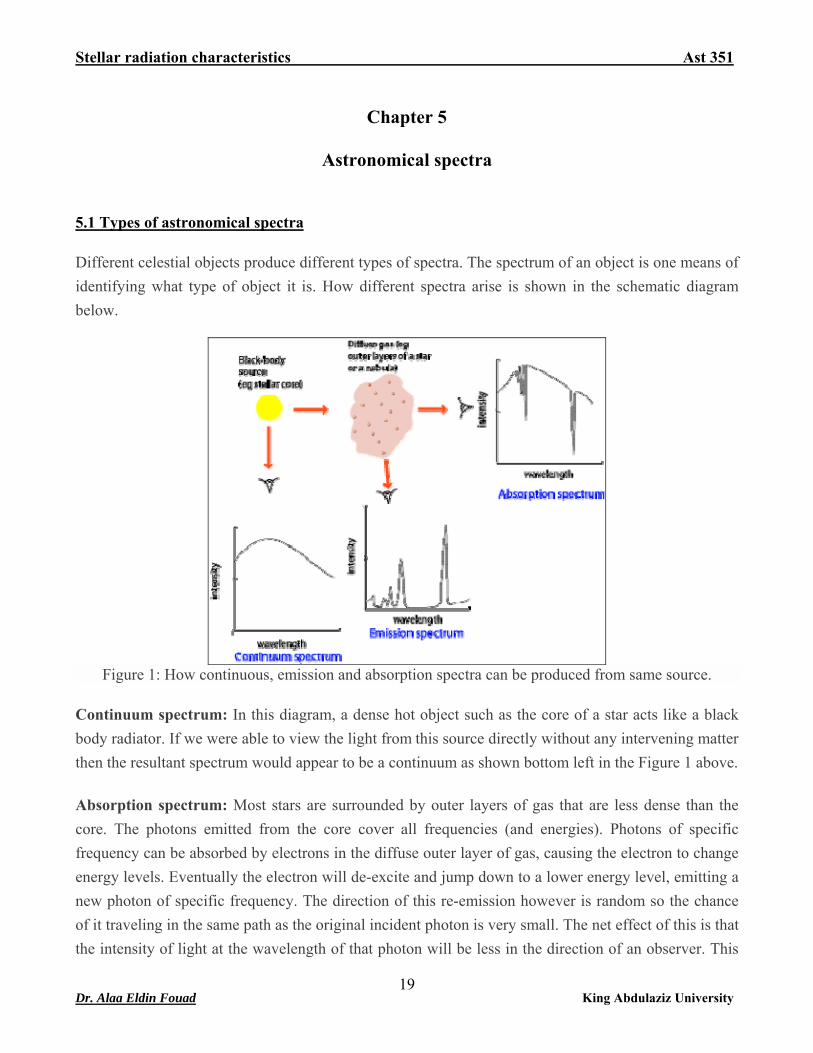
Different celestial objects produce different types of spectra. The spectrum of an object is one means of identifying what type of object it is. How different spectra arise is shown in the schematic diagram below.
Figure 1: How continuous, emission and absorption spectra can be produced from same source.
Continuum spectrum: In this diagram, a dense hot object such as the core of a star acts like a black body radiator. If we were able to view the light from this source directly without any intervening matter then the resultant spectrum would appear to be a continuum as shown bottom left in the Figure 1 above.
Absorption spectrum: Most stars are surrounded by outer layers of gas that are less dense than the core. The photons emitted from the core cover all frequencies (and energies). Photons of specific frequency can be absorbed by electrons in the diffuse outer layer of gas, causing the electron to change energy levels. Eventually the electron will de-excite and jump down to a lower energy level, emitting a new photon of specific frequency. The direction of this re-emission however is random so the chance of it traveling in the same path as the original incident photon is very small. The net effect of this is that the intensity of light at the wavelength of that photon will be less in the direction of an observer. This
Dr. Alaa Eldin Fouad King Abdulaziz University 19
Stellar radiation characteristics Ast 351
means that the resultant spectrum will show dark absorption lines or a decrease in intensity as shown in the dips in the absorption spectrum top right in the diagram above. Stellar spectra typically look like this.
Emission spectrum: A third possibility occurs if an observer is not looking directly at a hot black body source but instead at a diffuse cloud of gas that is not a black body. If this cloud can be excited by a nearby source of energy such as hot, young stars or an active galactic nucleus then the electrons in atoms of the gas cloud can get excited. When they de-excite they emit photons of specific frequency and wavelength. As these photons can re emitted in any direction an external observer will detect light at these wavelengths. The spectrum formed is an emission or bright line spectrum, as shown by the middle spectrum in Figure 1.
5.2 Spectra from astronomical objects
Let us know use these basic principles to account for and compare spectra produced by different types of astronomical objects.
aStellar Spectr.1 .25
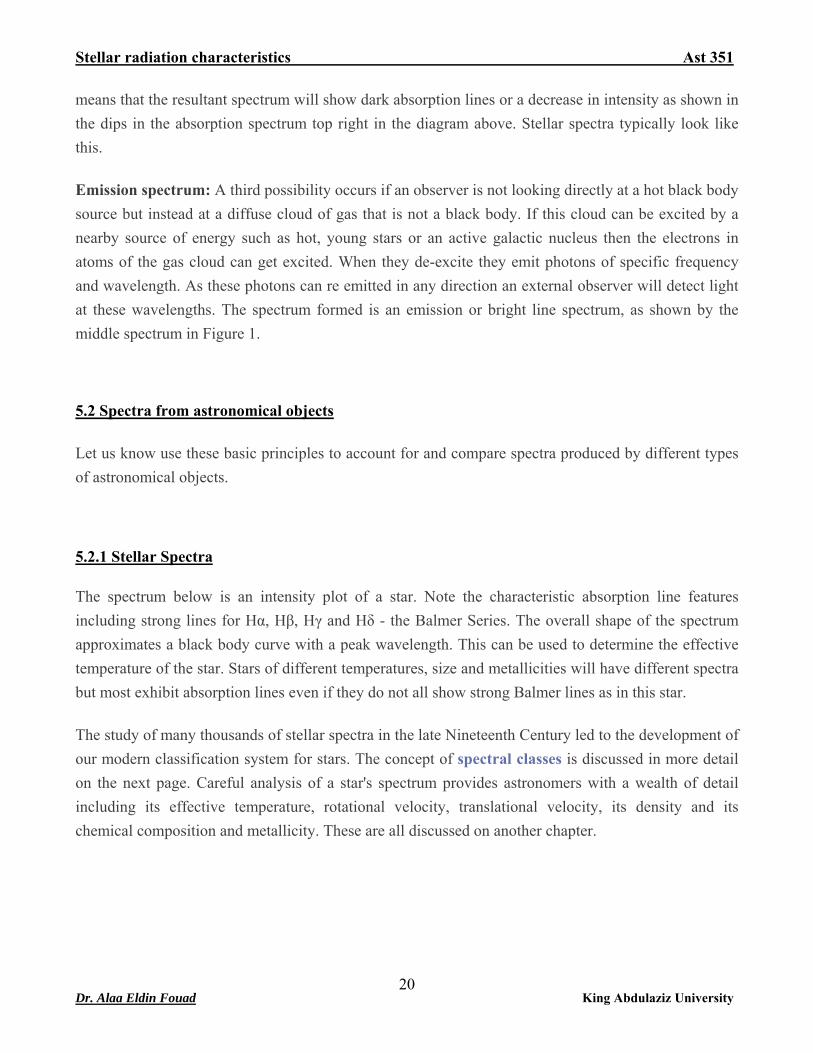
The spectrum below is an intensity plot of a star. Note the characteristic absorption line features including strong lines for Hα, Hβ, Hγ and Hδ - the Balmer Series. The overall shape of the spectrum approximates a black body curve with a peak wavelength. This can be used to determine the effective temperature of the star. Stars of different temperatures, size and metallicities will have different spectra but most exhibit absorption lines even if they do not all show strong Balmer lines as in this star.
The study of many thousands of stellar spectra in the late Nineteenth Century led to the development of our modern classification system for stars. The concept of spectral classes is discussed in more detail on the next page. Careful analysis of a star's spectrum provides astronomers with a wealth of detail including its effective temperature, rotational velocity, translational velocity, its density and its chemical composition and metallicity. These are all discussed on another chapter.
Dr. Alaa Eldin Fouad King Abdulaziz University 20
Stellar radiation characteristics Ast 351
Intensity plot spectrum for a star. Note the absorption lines for the Balmer Series.
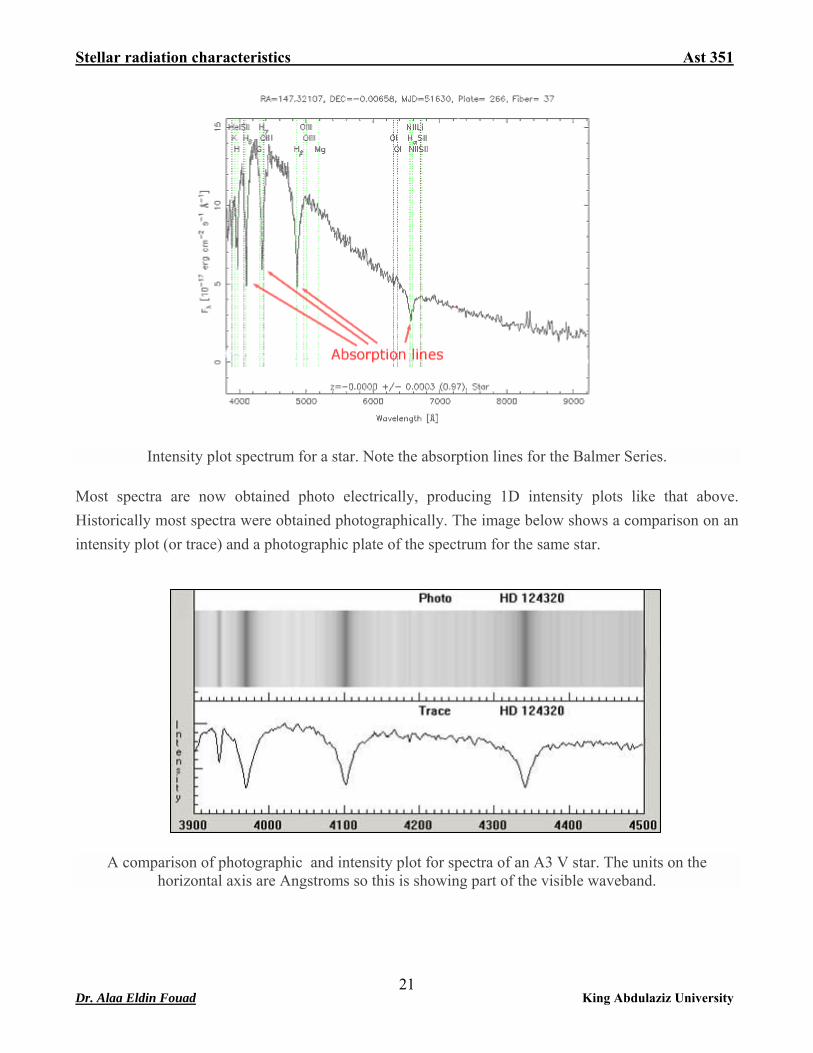
Most spectra are now obtained photo electrically, producing 1D intensity plots like that above. Historically most spectra were obtained photographically. The image below shows a comparison on an intensity plot (or trace) and a photographic plate of the spectrum for the same star.
A comparison of photographic and intensity plot for spectra of an A3 V star. The units on the
horizontal axis are Angstroms so this is showing part of the visible waveband.
Dr. Alaa Eldin Fouad King Abdulaziz University 21
Stellar radiation characteristics Ast 351
5.2.2 Emission Nebulae
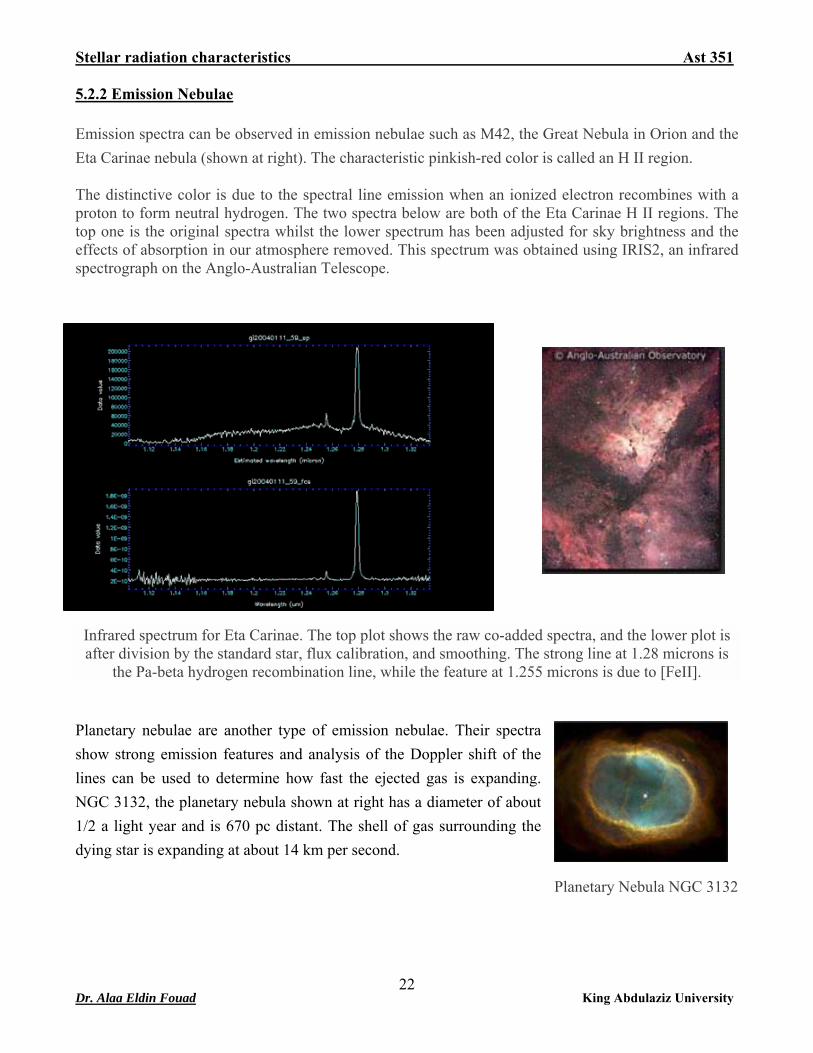
Emission spectra can be observed in emission nebulae such as M42, the Great Nebula in Orion and the Eta Carinae nebula (shown at right). The characteristic pinkish-red color is called an H II region.
The distinctive color is due to the spectral line emission when an ionized electron recombines with a proton to form neutral hydrogen. The two spectra below are both of the Eta Carinae H II regions. The top one is the original spectra whilst the lower spectrum has been adjusted for sky brightness and the effects of absorption in our atmosphere removed. This spectrum was obtained using IRIS2, an infrared spectrograph on the Anglo-Australian Telescope.
Infrared spectrum for Eta Carinae. The top plot shows the raw co-added spectra, and the lower plot is after division by the standard star, flux calibration, and smoothing. The strong line at 1.28 microns is
the Pa-beta hydrogen recombination line, while the feature at 1.255 microns is due to [FeII].
Planetary nebulae are another type of emission nebulae. Their spectra show strong emission features and analysis of the Doppler shift of the lines can be used to determine how fast the ejected gas is expanding. NGC 3132, the planetary nebula shown at right has a diameter of about 1/2 a light year and is 670 pc distant. The shell of gas surrounding the dying star is expanding at about 14 km per second.
Planetary Nebula NGC 3132
Dr. Alaa Eldin Fouad King Abdulaziz University 22
Stellar radiation characteristics Ast 351
5.2.3 Galaxy Spectra
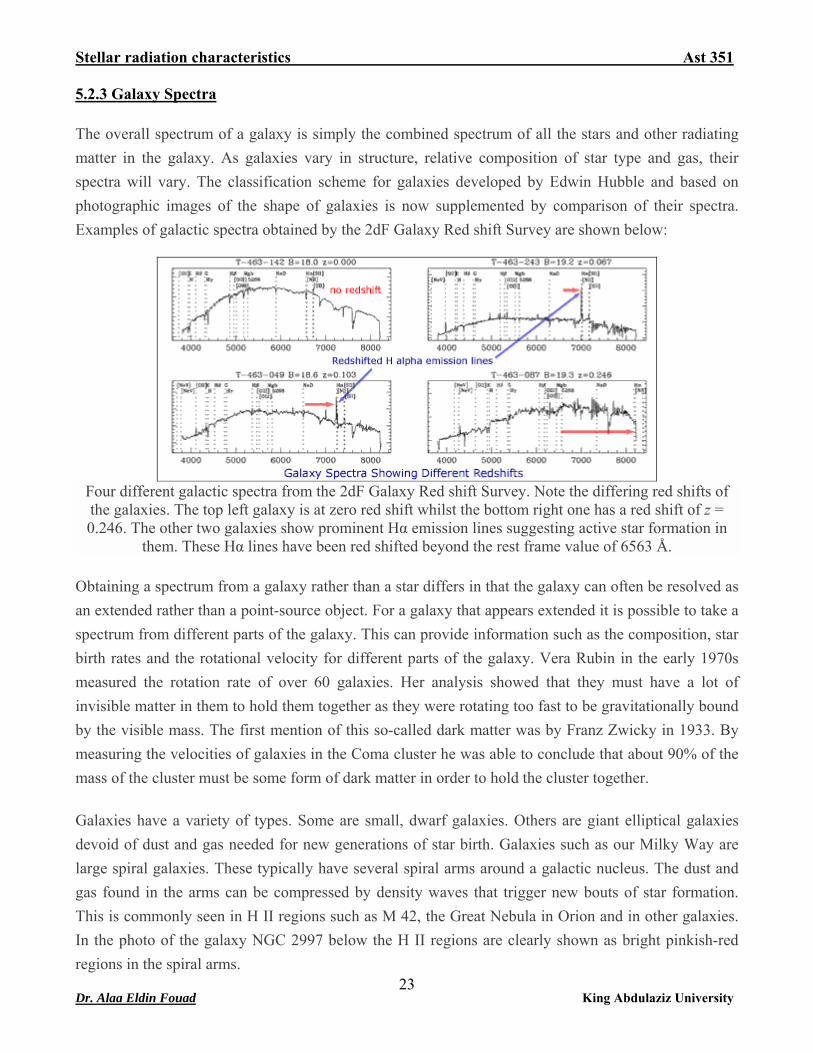
The overall spectrum of a galaxy is simply the combined spectrum of all the stars and other radiating matter in the galaxy. As galaxies vary in structure, relative composition of star type and gas, their spectra will vary. The classification scheme for galaxies developed by Edwin Hubble and based on photographic images of the shape of galaxies is now supplemented by comparison of their spectra. Examples of galactic spectra obtained by the 2dF Galaxy Red shift Survey are shown below:
Four different galactic spectra from the 2dF Galaxy Red shift Survey. Note the differing red shifts of the galaxies. The top left galaxy is at zero red shift whilst the bottom right one has a red shift of z = 0.246. The other two galaxies show prominent Hα emission lines suggesting active star formation in
them. These Hα lines have been red shifted beyond the rest frame value of 6563 Å.
Obtaining a spectrum from a galaxy rather than a star differs in that the galaxy can often be resolved as an extended rather than a point-source object. For a galaxy that appears extended it is possible to take a spectrum from different parts of the galaxy. This can provide information such as the composition, star birth rates and the rotational velocity for different parts of the galaxy. Vera Rubin in the early 1970s measured the rotation rate of over 60 galaxies. Her analysis showed that they must have a lot of invisible matter in them to hold them together as they were rotating too fast to be gravitationally bound by the visible mass. The first mention of this so-called dark matter was by Franz Zwicky in 1933. By measuring the velocities of galaxies in the Coma cluster he was able to conclude that about 90% of the mass of the cluster must be some form of dark matter in order to hold the cluster together.
23
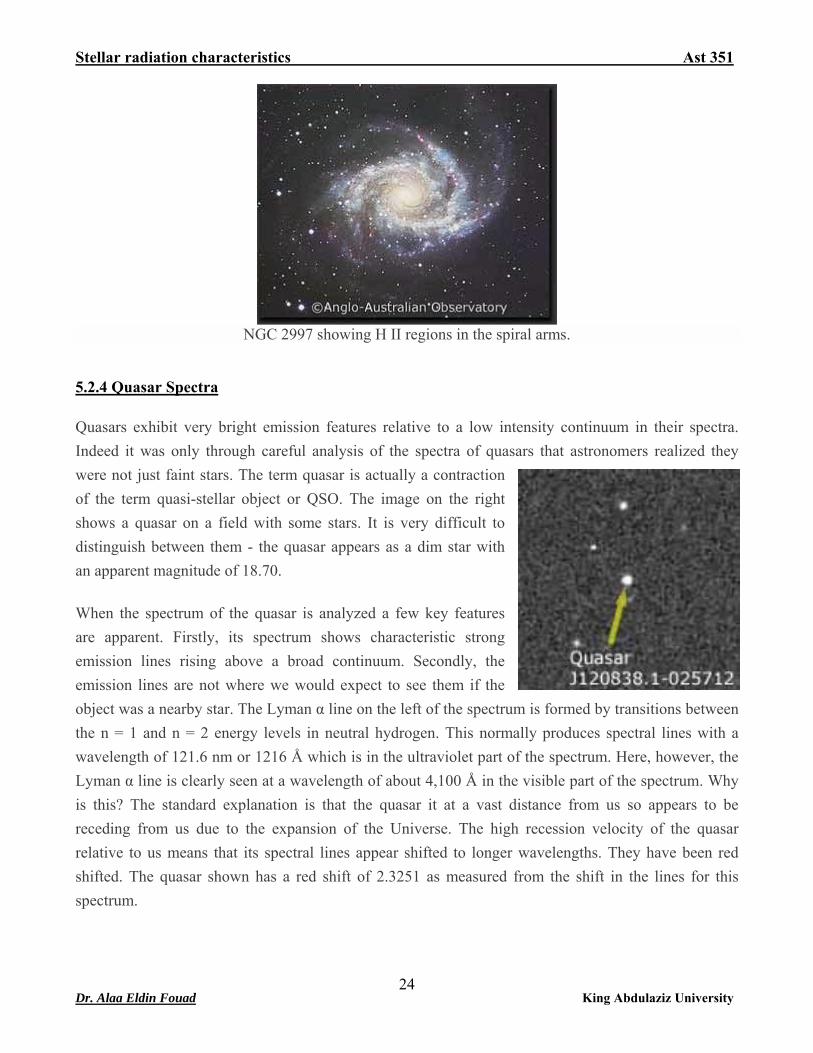
Galaxies have a variety of types. Some are small, dwarf galaxies. Others are giant elliptical galaxies devoid of dust and gas needed for new generations of star birth. Galaxies such as our Milky Way are large spiral galaxies. These typically have several spiral arms around a galactic nucleus. The dust and gas found in the arms can be compressed by density waves that trigger new bouts of star formation. This is commonly seen in H II regions such as M 42, the Great Nebula in Orion and in other galaxies. In the photo of the galaxy NGC 2997 below the H II regions are clearly shown as bright pinkish-red regions in the spiral arms.
Dr. Alaa Eldin Fouad King Abdulaziz University
Stellar radiation characteristics Ast 351
NGC 2997 showing H II regions in the spiral arms.
5.2.4 Quasar Spectra
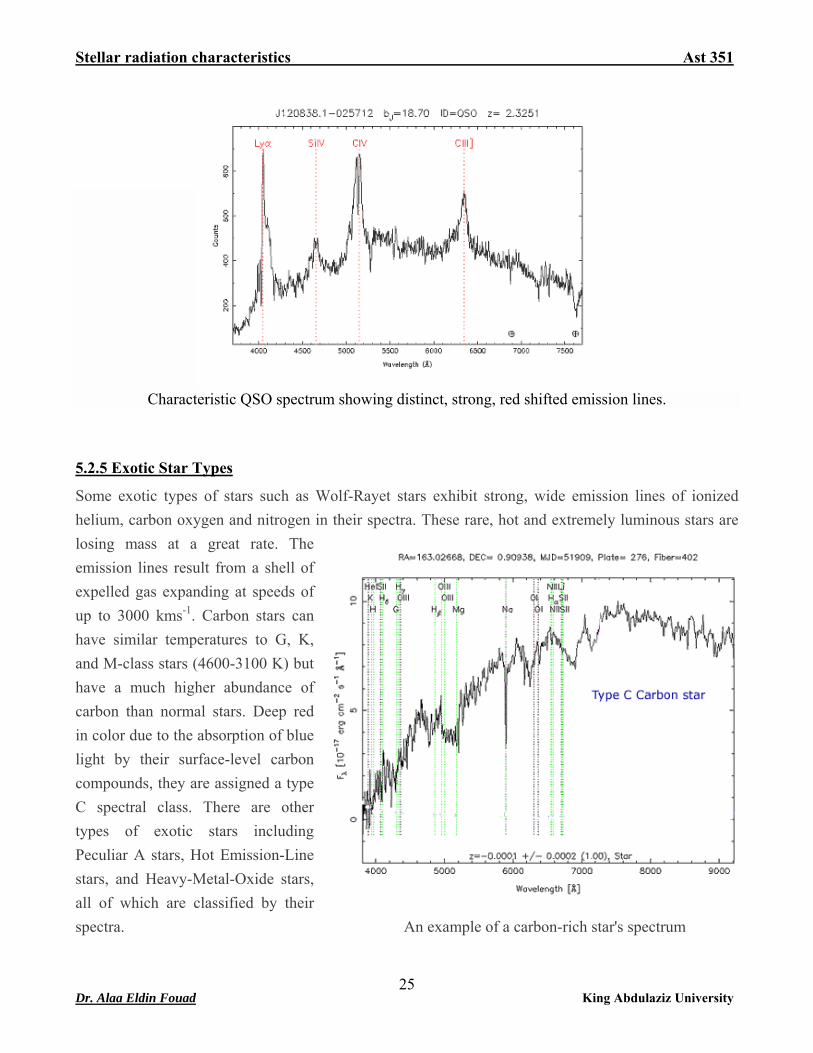
Quasars exhibit very bright emission features relative to a low intensity continuum in their spectra. Indeed it was only through careful analysis of the spectra of quasars that astronomers realized they were not just faint stars. The term quasar is actually a contraction of the term quasi-stellar object or QSO. The image on the right shows a quasar on a field with some stars. It is very difficult to distinguish between them - the quasar appears as a dim star with an apparent magnitude of 18.70.
When the spectrum of the quasar is analyzed a few key features are apparent. Firstly, its spectrum shows characteristic strong emission lines rising above a broad continuum. Secondly, the emission lines are not where we would expect to see them if the object was a nearby star. The Lyman α line on the left of the spectrum is formed by transitions between the n = 1 and n = 2 energy levels in neutral hydrogen. This normally produces spectral lines with a wavelength of 121.6 nm or 1216 Å which is in the ultraviolet part of the spectrum. Here, however, the Lyman α line is clearly seen at a wavelength of about 4,100 Å in the visible part of the spectrum. Why is this? The standard explanation is that the quasar it at a vast distance from us so appears to be receding from us due to the expansion of the Universe. The high recession velocity of the quasar relative to us means that its spectral lines appear shifted to longer wavelengths. They have been red shifted. The quasar shown has a red shift of 2.3251 as measured from the shift in the lines for this spectrum.
Dr. Alaa Eldin Fouad King Abdulaziz University 24
Stellar radiation characteristics Ast 351
Characteristic QSO spectrum showing distinct, strong, red shifted emission lines.
5.2.5 Exotic Star Types
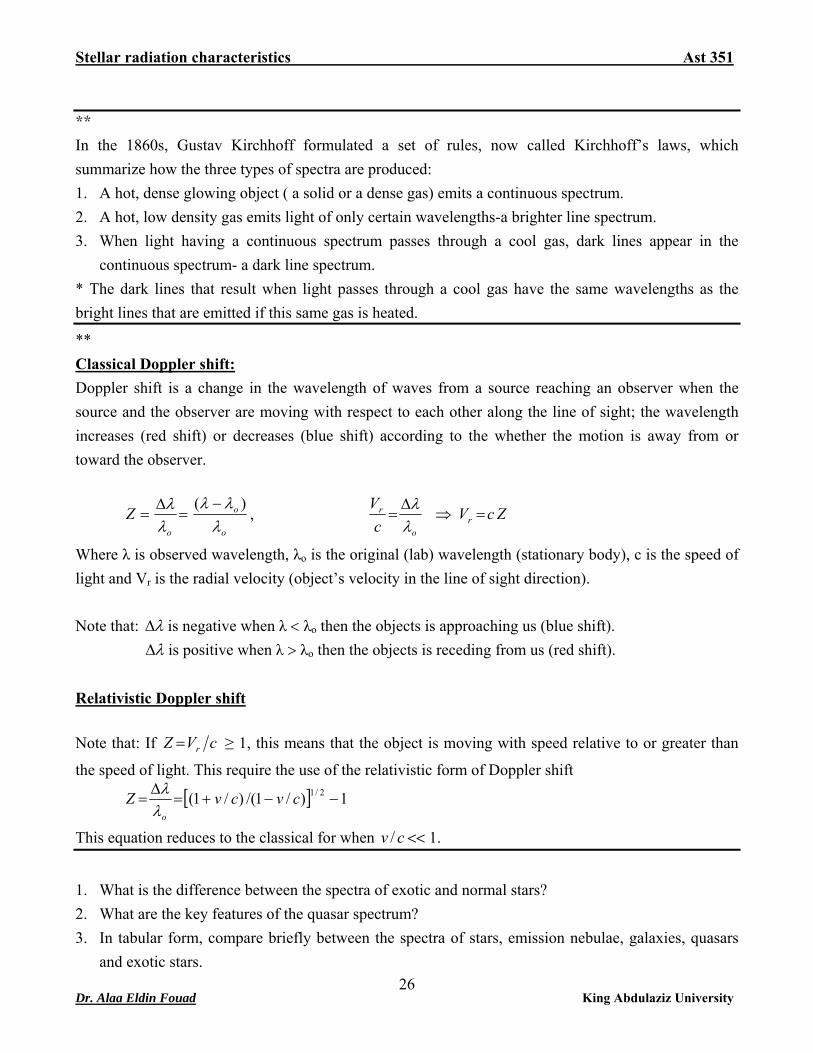
Some exotic types of stars such as Wolf-Rayet stars exhibit strong, wide emission lines of ionized helium, carbon oxygen and nitrogen in their spectra. These rare, hot and extremely luminous stars are losing mass at a great rate. The emission lines result from a shell of expelled gas expanding at speeds of up to 3000 kms-1. Carbon stars can have similar temperatures to G, K, and M-class stars (4600-3100 K) but have a much higher abundance of carbon than normal stars. Deep red in color due to the absorption of blue light by their surface-level carbon compounds, they are assigned a type C spectral class. There are other types of exotic stars including Peculiar A stars, Hot Emission-Line stars, and Heavy-Metal-Oxide stars, all of which are classified by their spectra. An example of a carbon-rich star's spectrum
Dr. Alaa Eldin Fouad King Abdulaziz University 25
Stellar radiation characteristics Ast 351
** In the 1860s, Gustav Kirchhoff formulated a set of rules, now called Kirchhoff’s laws, which summarize how the three types of spectra are produced: 1. A hot, dense glowing object ( a solid or a dense gas) emits a continuous spectrum. 2. A hot, low density gas emits light of only certain wavelengths-a brighter line spectrum. 3. When light having a continuous spectrum passes through a cool gas, dark lines appear in the
continuous spectrum- a dark line spectrum. * The dark lines that result when light passes through a cool gas have the same wavelengths as the bright lines that are emitted if this same gas is heated.
** Classical Doppler shift: Doppler shift is a change in the wavelength of waves from a source reaching an observer when the source and the observer are moving with respect to each other along the line of sight; the wavelength increases (red shift) or decreases (blue shift) according to the whether the motion is away from or toward the observer.
o
o
o
Zλλλ
λλ )( −=
Δ= , ZcV
cV
ro
r =⇒Δ
=λλ
Where λ is observed wavelength, λo is the original (lab) wavelength (stationary body), c is the speed of light and Vr is the radial velocity (object’s velocity in the line of sight direction). Note that: λΔ is negative when λ < λo then the objects is approaching us (blue shift). λΔ is positive when λ > λo then the objects is receding from us (red shift). Relativistic Doppler shift Note that: If cVZ r= ≥ 1, this means that the object is moving with speed relative to or greater than
the speed of light. This require the use of the relativistic form of Doppler shift
[ ] 1)/1/()/1( 2/1 −−+=Δ
= cvcvZoλλ
This equation reduces to the classical for when << 1. cv /
1. What is the difference between the spectra of exotic and normal stars? 2. What are the key features of the quasar spectrum? 3. In tabular form, compare briefly between the spectra of stars, emission nebulae, galaxies, quasars
and exotic stars.
Dr. Alaa Eldin Fouad King Abdulaziz University 26
Stellar radiation characteristics Ast 351
4. (a) At what wavelength will the following spectral lines be observed: (i) A line emitted at 500 nm by a star moving toward us at 100 km/s. (ii) The Ca II line emitted by a galaxy receding at 60,000 km/s
(b) A cloud of neutral hydrogen (H I) emits the 21cm radio line while moving away at 200 km/s. At what frequency will we observe this line. 5. At what wavelength will the spectral line be observed for a line emitted at 656.3 nm by a galaxy
moving away from us at 2100 km/s? 6. A simple form of the binomial theorem states that (1+x)n = 1 + nx + n(n-1)x2/2 + n(n-1)(n-2)x3/6 +
……… when x2 < 1. Starting with the relativistic expression, use this theorem to derive the classical equation for the Doppler shift in wavelength for the case in which v << c. - Classical equation of Doppler shift is )/1( cvo +=λλ - Relativistic expression of Doppler shift is 2/1)]/1/()/1[( cvcvo −+=λλ
Dr. Alaa Eldin Fouad King Abdulaziz University 27
Stellar radiation characteristics Ast 351
Chapter 6
Spectral classification and luminosity classes
6.1 Spectral classes
The rapid spread of spectroscopy in the late Nineteenth century resulted in a large number of stellar spectra. Astronomers faced the major challenge of trying to make sense of them. This was analogous to the problem faced earlier in the biological sciences and tackled by Linnaeus through his classification system of living organisms. The system now used was adopted in 1910 following detailed and extensive work by Annie Cannon and her team at Harvard Observatory. It has been refined since then but in essence is still the same.
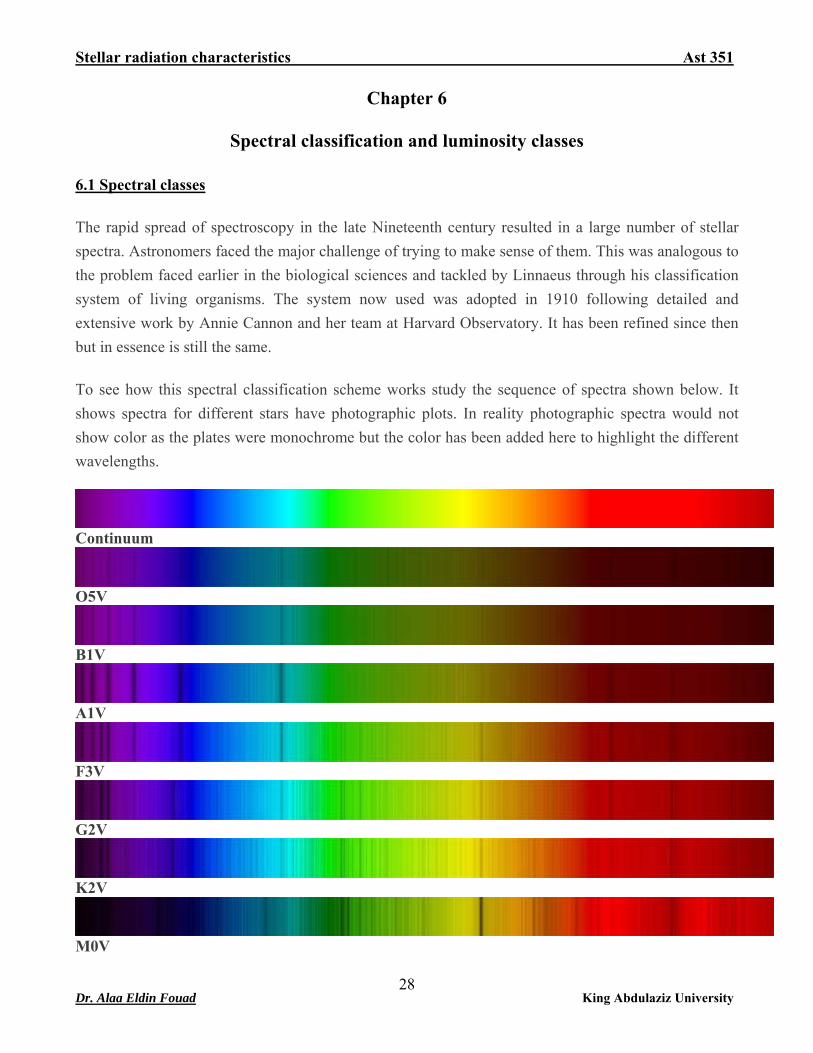
To see how this spectral classification scheme works study the sequence of spectra shown below. It shows spectra for different stars have photographic plots. In reality photographic spectra would not show color as the plates were monochrome but the color has been added here to highlight the different wavelengths.
Continuum
O5V
B1V
A1V
F3V
G2V
K2V
M0V
Dr. Alaa Eldin Fouad King Abdulaziz University 28
Stellar radiation characteristics Ast 351
If you study the spectra above you will notice some trends. The O-class spectrum has relatively weak lines but lines for ionized He+ are present. The B, A and F stars have a similar pattern of lines that are strongest in the A star. These are the H Balmer series for neutral hydrogen. F and G stars have lines corresponding to ionized Ca+. The K and M stars have many more lines visible but the Balmer series is very weak. These lines correspond to Fe, other neutral metals and molecules. TiO lines are visible in the spectrum of M stars.
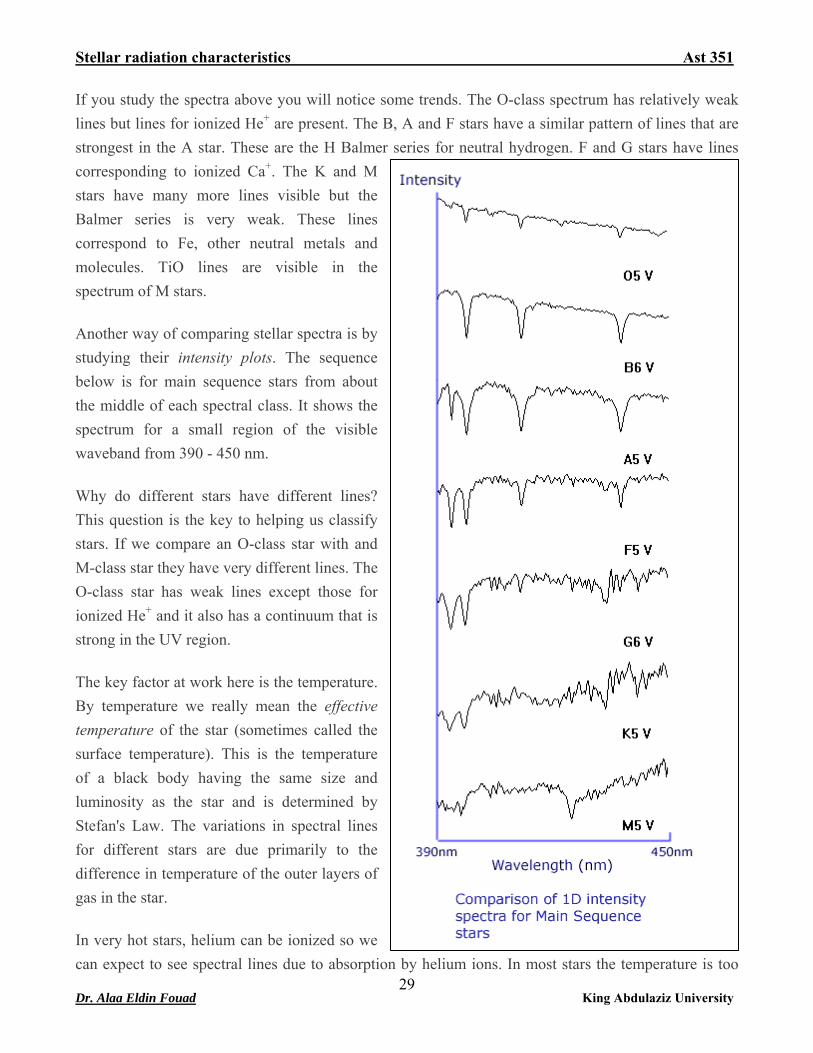
Another way of comparing stellar spectra is by studying their intensity plots. The sequence below is for main sequence stars from about the middle of each spectral class. It shows the spectrum for a small region of the visible waveband from 390 - 450 nm.
Why do different stars have different lines? This question is the key to helping us classify stars. If we compare an O-class star with and M-class star they have very different lines. The O-class star has weak lines except those for ionized He+ and it also has a continuum that is strong in the UV region.
The key factor at work here is the temperature. By temperature we really mean the effective temperature of the star (sometimes called the surface temperature). This is the temperature of a black body having the same size and luminosity as the star and is determined by Stefan's Law. The variations in spectral lines for different stars are due primarily to the difference in temperature of the outer layers of gas in the star.
29
In very hot stars, helium can be ionized so we can expect to see spectral lines due to absorption by helium ions. In most stars the temperature is too
Dr. Alaa Eldin Fouad King Abdulaziz University
Stellar radiation characteristics Ast 351
cool for helium to ionize so no such lines can form in the spectrum. Even though spectral lines due to helium are not found in cool stars it does not mean that helium is missing from the star. In fact helium is the second most abundant element in the Universe and in stars. The absence of helium lines simply means that the conditions are not right for helium lines to form or be abundant in that star.
Some stars are cool enough that molecules can exist in outer layers without being ripped apart. As the number of possible electron transitions is much greater in molecules than single atoms there are many possible spectral lines that can form hence cool stars typically have many lines.
The standard spectral class classification scheme is thus based on temperature. Most stars fit into one of the following types or spectral classes:
O, B, A, F, G, K, M
These classes go from hot to cool with O the hottest and M, cool. Recent discoveries have led to tentative new classifications for even cooler L-class stars. For the moment, however, we will focus on the seven original classes. The letters assigned to each class seem confusing and out of order. This is an historical artifact as classes were assigned to spectra before the underlying physical relationship was known. Rather than reassign letters to different spectra, some classes were merged and the whole sequence arranged in order of decreasing temperature.
How can you remember the sequence?
Many people use a memory device or mnemonic to help them. Here is a common example but feel free to make up your own.
Oh Be A Fine Girl (or Guy), Kiss Me!
The basic system of a letter to denote spectral class is further refined by adding a number from 0 to 9 following it. Each spectral class is thus broken down into ten subdivisions so that, for example, an F2 star is hotter than an F7 star.
The basic characteristics of each spectral class are summarized in the following table. The four columns on the right of the table provide comparison of a star's mass, radius and luminosity (power output) with respect to the Sun and the main sequence lifespan for a star of that spectral class.
Dr. Alaa Eldin Fouad King Abdulaziz University 30

Stellar radiation characteristics Ast 351
Spectral Class Summary Spectral
Class
Effective Temperature
(K) Color
H Balmer Features
Other Features M/MSun R/RSun L/LSun
Main Sequence Lifespan
O 28,000 – 50,000 Blue Weak Ionized He+ lines, strong UV continuum 20 - 60 9 – 15 90,000 -
800,000 1 - 10 Myr
B 10,000 – 28,000 Blue-white Medium Neutral He lines 3 - 18 3.0 - 8.4 95 - 52,000 11 - 400 Myr
A 7,500 - 10,000 White Strong Strong H lines, ionized metal lines 2.0 - 3.0 1.7 - 2.7 8 -55 400 Myr - 3
Gyr
F 6,000 - 7,500 White-yellow Medium Weak ionized Ca+ 1.1 - 1.6 1.2 - 1.6 2.0 - 6.5 3 - 7 Gyr
G 4,900 - 6,000 Yellow Weak Ionized Ca+, metal lines 0.85 - 1.1 0.85 - 1.1 0.66 - 1.5 7 - 15 Gyr
K 3,500 - 4,900 Orange Very weak Ca+, Fe, strong molecules, CH, CN
0.65 - 0.85
0.65 - 0.85 0.10 - 0.42 17 Gyr
M 2,000 - 3,500 Red Very weak Molecular lines, e.g. TiO, neutral metals
0.08 - 0.05
0.17 - 0.63 0.001 - 0.08 56 Gyr
L? <2,000 Tentative new (2000) classification for very low mass stars. <0.08 May or may not be fusing H in cores?
Some stars exhibit spectral anomalies resulting in them being given special classifications:
• R-class stars have the same temperature as K-class stars but have high abundances of carbon and carbon molecules.
• N-class stars are carbon-rich stars with the same temperature as M-class stars.
• S-class stars are similar temperature to M stars but have bands of zirconium oxide and lanthanum oxide.
• WN and WC are two types of Wolf-Rayet stars, the same temperature as O-class stars but showing strong broad emission lines of carbon and nitrogen respectively.
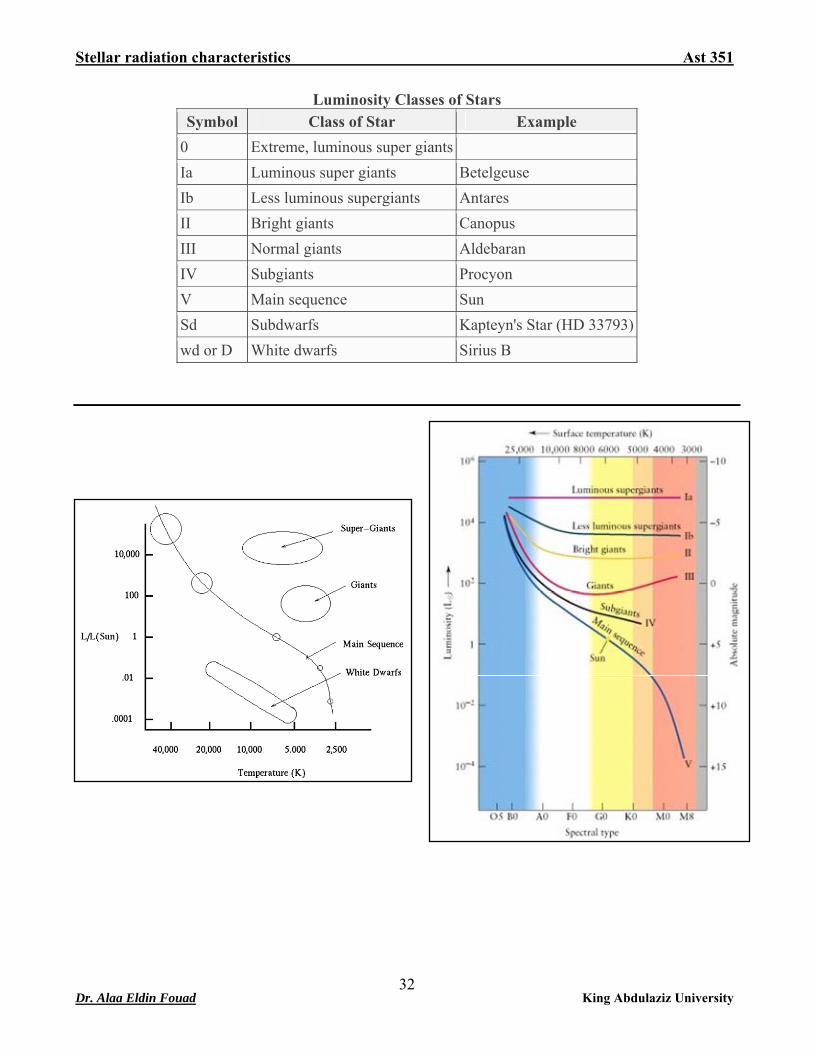
6.2 Luminosity Classes
One problem facing early attempts at classifying stellar spectra was the fact that two spectra could have the same lines present, indicating that the stars had the same effective temperature, but the lines in one star's spectrum were broader than in the other. When the star's were plotted on an HR diagram it also became apparent that two stars could have the same effective temperature (hence also color and spectral class) but vary enormously in luminosity and thus absolute magnitude. To account for this a second classification scheme of Luminosity Class was added to the original concept of Spectral Class. A simplified version of the MK system of luminosity classes is shown in the table below.
Dr. Alaa Eldin Fouad King Abdulaziz University 31
Stellar radiation characteristics Ast 351
Luminosity Classes of Stars Symbol Class of Star Example
0 Extreme, luminous super giants Ia Luminous super giants Betelgeuse Ib Less luminous supergiants Antares II Bright giants Canopus III Normal giants Aldebaran IV Subgiants Procyon V Main sequence Sun Sd Subdwarfs Kapteyn's Star (HD 33793) wd or D White dwarfs Sirius B
Dr. Alaa Eldin Fouad King Abdulaziz University 32
Stellar radiation characteristics Ast 351
___________________________________________________________________________________
Stefan-Boltzmann law
424 effTRL σπ=
where σ is the Stefan-Boltzmann constant, R is the stellar radius and Teff is the surface effective
temperature of the star. The surface flux of star is , and hence 2R4L π/
24
eff R4LTFπ
σ == ,
1. What information is needed to plot a star on the Hertzsprung—Russell diagram?
2. What is the main sequence? What basic property of a star determines where it lies on the main sequence?
3. Calculate the flux of radiation received on Earth if the Luminosity of the Sun was 6x1030 Watts.
4. Calculate the flux of radiation from the Sun at the surface of the Sun’s photosphere and from that calculate the surface temperature of the Sun.
5. From the previous answer, calculate the wavelength of the peak of the Sun’s radiation.
6. What two basic physical properties do astronomers use to classify stars?
7. What is luminosity and how do we determine it?
8. How are stars classified into spectral types?
9. Does a star’s spectral type depend on its composition?
10. What are the two main elements in all stars?
11. How do we classify stars?
12. Why is a star’s mass its most important property?
Dr. Alaa Eldin Fouad King Abdulaziz University 33
Stellar radiation characteristics Ast 351
Chapter 7
Information from astronomical spectra
The key point to remember about astronomical spectra is that they provide astronomers with a wealth of detail about the physical characteristics, motion and composition of objects. In this section we will examine what information can be obtained from spectra and how this is done.
7.1 Effective surface temperature and Wien's law
As we have already seen, the behavior of most stars approximates that of black body radiators. This means that they emit some energy at each wavelength but also have a peak wavelength and region in which they emit most of their energy. In the early 1890s Wilhelm Wien investigated thermodynamics and coined the term black body for an ideal radiator. He discovered that the wavelength of maximum energy emitted from a perfect black body was inversely proportional to the temperature of the body; λmax is proportional to 1/T. This relationship is known as Wien's law in his honor. T
Equation 1: Wien's Law, where λmax is the peak wavelength, T is the effective temperature of the black body and W5 is a constant called Wien's Constant and has a value of 2.898 x 10⁻³ for λmax in meters and T in Kelvin.
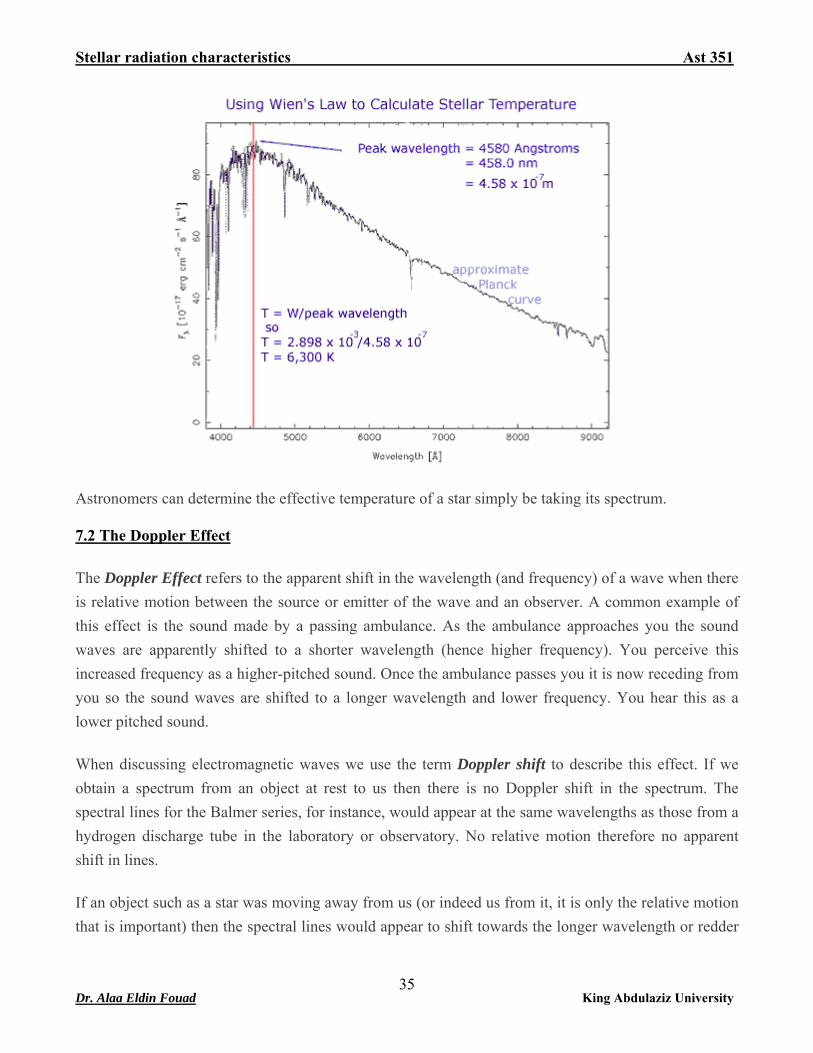
Wien's Law is a highly significant relationship. He used it to estimate the effective temperature of the Sun at 6000 K which was much closer than the previous estimate of 10000 K predicted using the Stefan-Boltzmann law of radiation. The value of Wien's relationship is that if you can measure the wavelength of maximum intensity from a spectrum, you can use it to calculate a value for the effective temperature. Let us see how this works in the example below. Remember, this is an actual stellar spectrum so it approximates a black body and has absorption lines in it rather than being a perfect continuum Planck curve.
5 W = 2.898x10⁶ (λ in nm) = 2.898x10⁷ (λ in angstrom)
Dr. Alaa Eldin Fouad King Abdulaziz University 34
Stellar radiation characteristics Ast 351
Astronomers can determine the effective temperature of a star simply be taking its spectrum.
7.2 The Doppler Effect
The Doppler Effect refers to the apparent shift in the wavelength (and frequency) of a wave when there is relative motion between the source or emitter of the wave and an observer. A common example of this effect is the sound made by a passing ambulance. As the ambulance approaches you the sound waves are apparently shifted to a shorter wavelength (hence higher frequency). You perceive this increased frequency as a higher-pitched sound. Once the ambulance passes you it is now receding from you so the sound waves are shifted to a longer wavelength and lower frequency. You hear this as a lower pitched sound.
When discussing electromagnetic waves we use the term Doppler shift to describe this effect. If we obtain a spectrum from an object at rest to us then there is no Doppler shift in the spectrum. The spectral lines for the Balmer series, for instance, would appear at the same wavelengths as those from a hydrogen discharge tube in the laboratory or observatory. No relative motion therefore no apparent shift in lines.
If an object such as a star was moving away from us (or indeed us from it, it is only the relative motion that is important) then the spectral lines would appear to shift towards the longer wavelength or redder
Dr. Alaa Eldin Fouad King Abdulaziz University 35
Stellar radiation characteristics Ast 351
part of the spectrum. Such a shift is termed a red shift. The amount of the shift would depend on the relative velocity between source and observer.
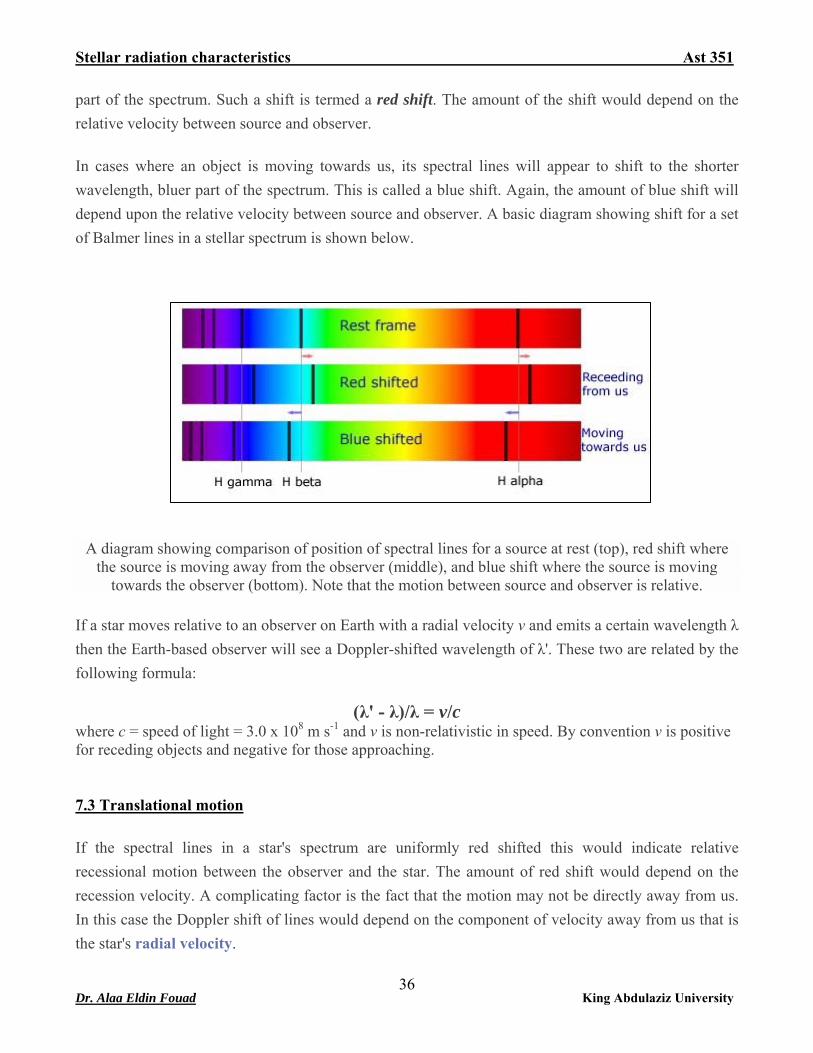
In cases where an object is moving towards us, its spectral lines will appear to shift to the shorter wavelength, bluer part of the spectrum. This is called a blue shift. Again, the amount of blue shift will depend upon the relative velocity between source and observer. A basic diagram showing shift for a set of Balmer lines in a stellar spectrum is shown below.
A diagram showing comparison of position of spectral lines for a source at rest (top), red shift where
the source is moving away from the observer (middle), and blue shift where the source is moving towards the observer (bottom). Note that the motion between source and observer is relative.
If a star moves relative to an observer on Earth with a radial velocity v and emits a certain wavelength λ then the Earth-based observer will see a Doppler-shifted wavelength of λ'. These two are related by the following formula:
(λ' - λ)/λ = v/c where c = speed of light = 3.0 x 10⁸ m s-1 and v is non-relativistic in speed. By convention v is positive for receding objects and negative for those approaching.
7.3 Translational motion
If the spectral lines in a star's spectrum are uniformly red shifted this would indicate relative recessional motion between the observer and the star. The amount of red shift would depend on the recession velocity. A complicating factor is the fact that the motion may not be directly away from us. In this case the Doppler shift of lines would depend on the component of velocity away from us that is the star's radial velocity.
Dr. Alaa Eldin Fouad King Abdulaziz University 36
Stellar radiation characteristics Ast 351
A star moving towards us would, of course, exhibit a blue shift in its spectral lines.
7.4 Rotational motion
Even though we can still only resolve most stars as point sources they are in fact large, roughly spherical balls of hot gas and plasma. Stars rotate, that is they spin on their axis. The Sun's sidereal rotational period is about 26 days on the solar equator and possibly up to 36 days at the poles. The different rates are due to the fact that it is not a solid sphere and the gas and plasma can rotate at different speeds.
If we obtain a spectrum from a distant star that is rotating in the same plane as us then the light gathered is a combination of light from across the disc of the star. As part of the star appears to rotate towards us its light will be blue shifted. The light from the part of the star rotating away from us will be red shifted. The section in the middle of the disc that is moving tangentially to us will not exhibit Doppler-shift.
What effect will this have on the star's spectrum?
The net effect is that the star's spectral lines will appear smeared out. This broadening of lines can be distinguished from the effects of pressure broadening due to stellar pressure discussed in the next section. The beauty of rotational broadening is that it can be used to measure the rotation rate of stars. As with translational velocity the alignment of the plane of rotation of the star with Earth is a factor and must be calculated from the spectrum.
7.5 Stellar density and pressure broadening
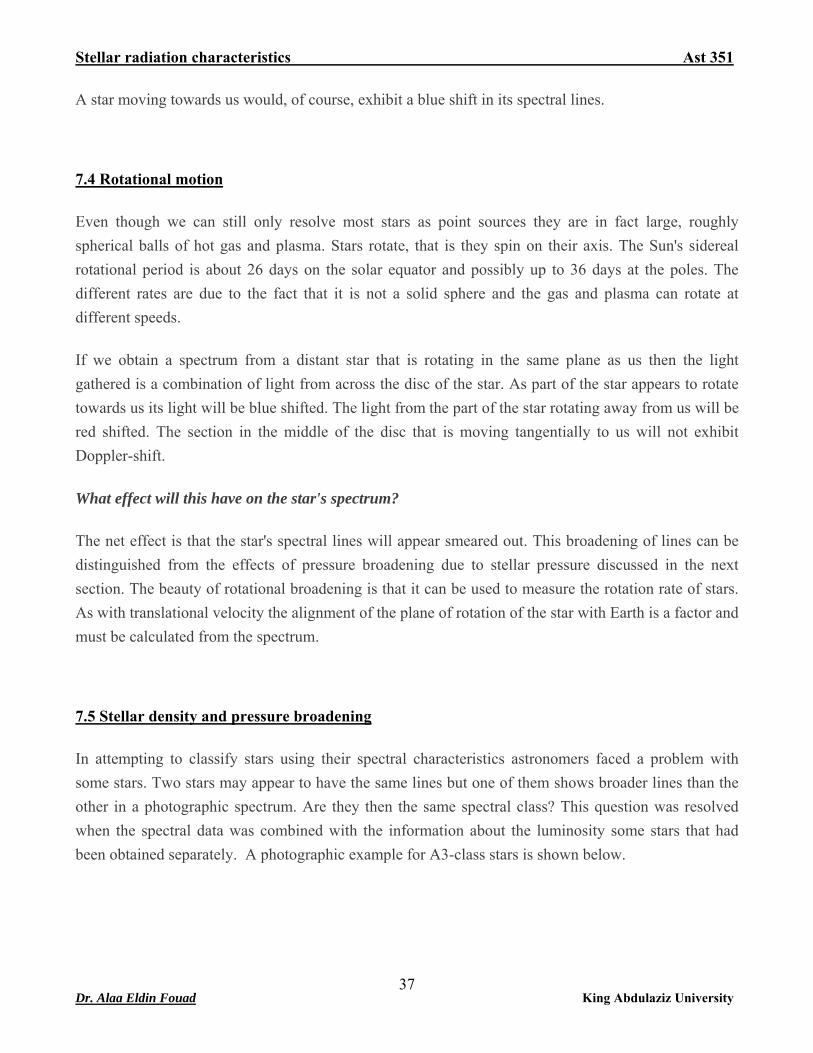
In attempting to classify stars using their spectral characteristics astronomers faced a problem with some stars. Two stars may appear to have the same lines but one of them shows broader lines than the other in a photographic spectrum. Are they then the same spectral class? This question was resolved when the spectral data was combined with the information about the luminosity some stars that had been obtained separately. A photographic example for A3-class stars is shown below.
Dr. Alaa Eldin Fouad King Abdulaziz University 37
Stellar radiation characteristics Ast 351
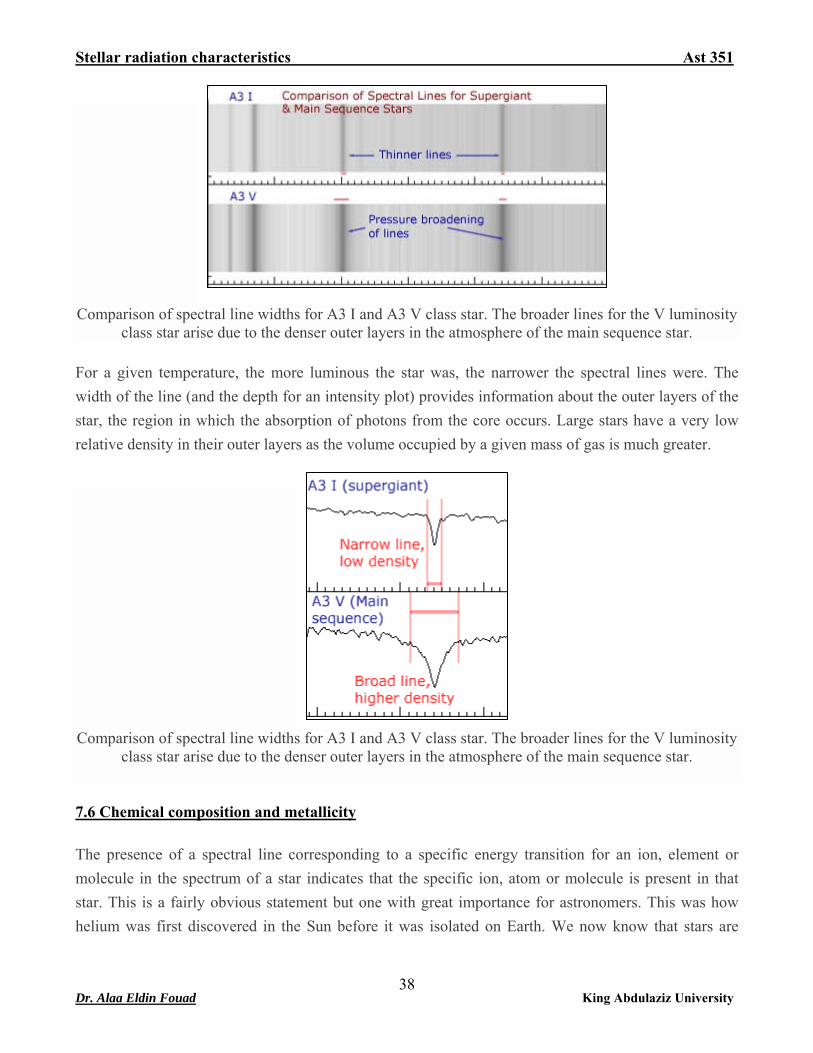
Comparison of spectral line widths for A3 I and A3 V class star. The broader lines for the V luminosity class star arise due to the denser outer layers in the atmosphere of the main sequence star.
For a given temperature, the more luminous the star was, the narrower the spectral lines were. The width of the line (and the depth for an intensity plot) provides information about the outer layers of the star, the region in which the absorption of photons from the core occurs. Large stars have a very low relative density in their outer layers as the volume occupied by a given mass of gas is much greater.
Comparison of spectral line widths for A3 I and A3 V class star. The broader lines for the V luminosity class star arise due to the denser outer layers in the atmosphere of the main sequence star.
7.6 Chemical composition and metallicity
The presence of a spectral line corresponding to a specific energy transition for an ion, element or molecule in the spectrum of a star indicates that the specific ion, atom or molecule is present in that star. This is a fairly obvious statement but one with great importance for astronomers. This was how helium was first discovered in the Sun before it was isolated on Earth. We now know that stars are
Dr. Alaa Eldin Fouad King Abdulaziz University 38
Stellar radiation characteristics Ast 351
mostly made up of hydrogen and helium, with small amounts of some other elements. This is only known due to spectroscopy.
A key point to remember, however, is that the absence of a spectral line does not also necessarily mean that that element is not present in that star. It simply means that the conditions in the layers of the star responsible for absorption and emission lines are not conducive to the formation of that specific transition or line.
Modern spectroscopy is highly efficient and is often conducted with very high resolution spectrographs that show spectral lines in fine detail. Astronomers can not only detect the presence of a line but they are often able to determine the relative amounts of different elements and molecules present. They can thus determine the metallicity of a star. In astronomy the term metal historically has been applied to any element heavier than helium so that even elements such as carbon and oxygen are called metals. When discussing metallicity then astronomers are actually talking about the relative chemical composition of a star. Stars with a higher proportion of metals are said to have higher metallicities. Why stars vary in metallicity will be discussed in the section on stellar evolution.
7.7 Other information
Astronomers can deduce even more about a star from its spectrum. Some of these are:
• Spectroscopic binaries: Some stars show a periodic splitting and recombination of spectral lines. This is caused by the fact that what we see as one star is in fact two stars orbiting each other as a close binary pair. Binary stars discovered by their spectra are termed spectroscopic binaries. Most binaries are discovered by this method. They are discussed in detail in later section.
• Helioseismology: The Sun vibrates much like a struck bell. As sections of its atmosphere pulse in an out the spectral lines produced from the emitted light show slight fluctuations. We can now measure variations on the Sun's surface of the order of a few cm.s-1. This information is used to compile harmonic oscillation modes for the Sun which provides details about the solar interior in much the same way as we use seismic waves to probe the Earth's interior. This technique, termed helioseismology is now also used to study other stars. As the sensitivity of instruments improved and the amount of data gathered increases astronomers are able to refine their models of processes that occur inside stars.
• Exoplanets: The first planet discovered orbiting a sun-like star was in 1995 when two Swiss astronomers detected a Jupiter-mass planet around the star 51 Pegasi. This followed the
Dr. Alaa Eldin Fouad King Abdulaziz University 39
Stellar radiation characteristics Ast 351
discovery of a planet orbiting a pulsar the previous year. Since then over 120 planets beyond our Solar System or exoplanets have been found. The bulk of these have been detected using a method known as the Doppler wobble in which the planet's mass causes slight shifts in the spectral lines from the star. As an unseen planet moves away from us when orbiting its parent star, it causes its light to be slightly red shifted. When the planet moves towards us the star's light is blue shifted slightly. Jupiter causes the Sun to wobble with a velocity of about 12 ms-1.
1. What information can be obtained from spectra?
2. Is the absence of a spectral line of a specific element means that element not present in the star?
3. What is the metallicity?
4. What we mean by Doppler wobble method?
5. What is the translational motion?
6. Calculate the wavelength of maximum radiation for the two stars: (a) Betegeuse (Orion constellation), with surface temperature of 3400 K, and (b) Rigel (Orion constellation), with surface temperature of 10100 K. At which band of electromagnetic radiation the two stars emit the maximum radiation, and what is the expected color for each of them.
7. According to Wien's law, how many times hotter is an object whose blackbody emission spectrum peaks in the ultraviolet, at a wavelength of 200 nm, than an object whose spectrum peaks in the red, at 650 nm? According to Stefan's law, how much more energy does it radiate per unit area per second?
8. The Sun has a luminosity of 3.86 × 1026 W and an effective temperature of 5.78 × 10³ K. Calculate its diameter.
9. Normal human body temperature is about 37°C. What is the peak wavelength emitted by a person with this temperature? In what part of the spectrum does this lie?
10. The Sun has a temperature of 5800 K, and its blackbody emission peaks at a wavelength of approximately 550 nm. At what wavelength does a protostar with a temperature of 1000 K radiate most strongly?
11. According to Stefan's law, how much energy is radiated into space per unit time by each square meter of the Sun's surface? If the Sun's radius is 696,000 km, what is the total power output of the Sun?
12. Two otherwise identical bodies have temperatures of 300 K and 1500 K, respectively. Which one radiates more energy, and by what factor does its emission exceed the emission of the other body?
Dr. Alaa Eldin Fouad King Abdulaziz University 40