astro-h space x-ray observatory white paper white dwarf
TRANSCRIPT

ASTRO-H Space X-ray ObservatoryWhite Paper
White Dwarf
K. Mukai (NASA/GSFC/CRESST & UMBC), T. Yuasa (RIKEN),A. Harayama (JAXA), T. Hayashi (JAXA), M. Ishida (JAXA), K. S. Long (STScI),
Y. Terada (Saitama University) and M. Tsujimoto (JAXA)on behalf of the ASTRO-H Science Working Group
Abstract
Interacting binaries in which a white dwarf accretes material from a companion — cataclysmic variables(CVs) in which the mass loss is via Roche-lobe overflow, and symbiotic stars in which the white dwarfcaptures the wind of a late type giant — are relatively commonplace. They display a wide range of behaviorsin the optical, X-rays, and other wavelengths, which still often baffles observers and theorists alike. They arelikely to be a significant contributor to the Galactic ridge X-ray emission, and the possibility that some CVsor symbiotic stars may be the progenitors of some of the Type Ia supernovae deserves serious consideration.Furthermore, these binaries serve as excellent laboratories in which to study physics of X-ray emission fromhigh density plasma, accretion physics, reflection, and particle acceleration. ASTRO-H is well-matched tothe study of X-ray emission from many of these objects. In particular, the excellent spectral resolution ofthe SXS will enable dynamical studies of the X-ray emitting plasma. We also discuss the possibility ofidentifying an accreting, near-Chandrasekhar-mass white dwarf by measuring the gravitational redshift ofthe 6.4 keV line.
1
arX
iv:1
412.
1163
v1 [
astr
o-ph
.HE
] 3
Dec
201
4

Complete list of the ASTRO-H Science Working Group
Tadayuki Takahashia, Kazuhisa Mitsudaa, Richard Kelleyb, Felix Aharonianc, Hiroki Akamatsud, Fumie Akimotoe,Steve Allenf, Naohisa Anabukig, Lorella Angelinib, Keith Arnaudh, Marc Audardi, Hisamitsu Awakij, Aya Bambak,
Marshall Bautzl, Roger Blandfordf, Laura Brennemanb, Greg Brownm, Edward Cackettn, Maria Chernyakovac,Meng Chiaob, Paolo Coppio, Elisa Costantinid, Jelle de Plaad, Jan-Willem den Herderd, Chris Donep, Tadayasu Dotania,
Ken Ebisawaa, Megan Eckartb, Teruaki Enotoq, Yuichiro Ezoer, Andrew Fabiann, Carlo Ferrignoi, Adam Fosters,Ryuichi Fujimotot, Yasushi Fukazawau, Stefan Funkf, Akihiro Furuzawae, Massimiliano Galeazziv, Luigi Gallow,Poshak Gandhip, Matteo Guainazzix, Yoshito Habay, Kenji Hamaguchih, Isamu Hatsukadez, Takayuki Hayashia,Katsuhiro Hayashia, Kiyoshi Hayashidag, Junko Hiragaaa, Ann Hornschemeierb, Akio Hoshinoab, John Hughesac,
Una Hwangad, Ryo Iizukaa, Yoshiyuki Inouea, Hajime Inouea, Kazunori Ishibashie, Manabu Ishidaa, Kumi Ishikawaq,Yoshitaka Ishisakir, Masayuki Itoae, Naoko Iyomotoaf, Jelle Kaastrad, Timothy Kallmanb, Tuneyoshi Kamaef,
Jun Kataokaag, Satoru Katsudaa, Junichiro Katsutau, Madoka Kawaharadaa, Nobuyuki Kawaiah, Dmitry Khangulyana,Caroline Kilbourneb, Masashi Kimuraai, Shunji Kitamotoab, Tetsu Kitayamaaj, Takayoshi Kohmuraak,
Motohide Kokubuna, Saori Konamir, Katsuji Koyamaal, Hans Krimmb, Aya Kubotaam, Hideyo Kuniedae,Stephanie LaMassao, Philippe Laurentan, Francois Lebrunan, Maurice Leuteneggerb, Olivier Limousinan,
Michael Loewensteinb, Knox Longao, David Lumbap, Grzegorz Madejskif, Yoshitomo Maedaa, Kazuo Makishimaaa,Maxim Markevitchb, Hironori Matsumotoe, Kyoko Matsushitaaq, Dan McCammonar, Brian McNamaraas, Jon Millerat,
Eric Millerl, Shin Mineshigeau, Ikuyuki Mitsuishie, Takuya Miyazawae, Tsunefumi Mizunou, Koji Moriz,Hideyuki Morie, Koji Mukaib, Hiroshi Murakamiav, Toshio Murakamit, Richard Mushotzkyh, Ryo Naginog,
Takao Nakagawaa, Hiroshi Nakajimag, Takeshi Nakamoriaw, Shinya Nakashimaa, Kazuhiro Nakazawaaa,Masayoshi Nobukawaal, Hirofumi Nodaq, Masaharu Nomachiax, Steve O’ Dellay, Hirokazu Odakaa, Takaya Ohashir,
Masanori Ohnou, Takashi Okajimab, Naomi Otaaz, Masanobu Ozakia, Frits Paerelsba, Stephane Paltanii, Arvind Parmarx,Robert Petreb, Ciro Pinton, Martin Pohli, F. Scott Porterb, Katja Pottschmidtb, Brian Ramseyay, Rubens Reisat,
Christopher Reynoldsh, Claudio Ricciau, Helen Russelln, Samar Safi-Harbbb, Shinya Saitoa, Hiroaki Sameshimaa,Goro Satoag, Kosuke Satoaq, Rie Satoa, Makoto Sawadak, Peter Serlemitsosb, Hiromi Setabc, Aurora Simionescua,Randall Smiths, Yang Soongb, Łukasz Stawarza, Yasuharu Sugawarabd, Satoshi Sugitaj, Andrew Szymkowiako,Hiroyasu Tajimae, Hiromitsu Takahashiu, Hiroaki Takahashig, Yoh Takeia, Toru Tamagawaq, Takayuki Tamuraa,
Keisuke Tamurae, Takaaki Tanakaal, Yasuo Tanakaa, Yasuyuki Tanakau, Makoto Tashirobc, Yuzuru Tawarae,Yukikatsu Teradabc, Yuichi Terashimaj, Francesco Tombesib, Hiroshi Tomidaai, Yohko Tsuboibd, Masahiro Tsujimotoa,Hiroshi Tsunemig, Takeshi Tsurual, Hiroyuki Uchidaal, Yasunobu Uchiyamaab, Hideki Uchiyamabe, Yoshihiro Uedaau,
Shutaro Uedag, Shiro Uenoai, Shinichiro Unobf, Meg Urryo, Eugenio Ursinov, Cor de Vriesd, Shin Watanabea,Norbert Wernerf, Dan Wilkinsw, Shinya Yamadar, Hiroya Yamaguchib, Kazutaka Yamaokae, Noriko Yamasakia,Makoto Yamauchiz, Shigeo Yamauchiaz, Tahir Yaqoobb, Yoichi Yatsuah, Daisuke Yonetokut, Atsumasa Yoshidak,
Takayuki Yuasaq, Irina Zhuravlevaf, Abderahmen Zoghbih, and John ZuHoneb
aInstitute of Space and Astronautical Science (ISAS), Japan Aerospace Exploration Agency (JAXA), Kanagawa 252-5210, JapanbNASA/Goddard Space Flight Center, MD 20771, USA
cAstronomy and Astrophysics Section, Dublin Institute for Advanced Studies, Dublin 2, IrelanddSRON Netherlands Institute for Space Research, Utrecht, The Netherlands
eDepartment of Physics, Nagoya University, Aichi 338-8570, JapanfKavli Institute for Particle Astrophysics and Cosmology, Stanford University, CA 94305, USA
gDepartment of Earth and Space Science, Osaka University, Osaka 560-0043, JapanhDepartment of Astronomy, University of Maryland, MD 20742, USA
iUniversite de Geneve, Geneve 4, SwitzerlandjDepartment of Physics, Ehime University, Ehime 790-8577, Japan
kDepartment of Physics and Mathematics, Aoyama Gakuin University, Kanagawa 229-8558, JapanlKavli Institute for Astrophysics and Space Research, Massachusetts Institute of Technology, MA 02139, USA
mLawrence Livermore National Laboratory, CA 94550, USAnInstitute of Astronomy, Cambridge University, CB3 0HA, UK
oYale Center for Astronomy and Astrophysics, Yale University, CT 06520-8121, USApDepartment of Physics, University of Durham, DH1 3LE, UK
qRIKEN, Saitama 351-0198, JapanrDepartment of Physics, Tokyo Metropolitan University, Tokyo 192-0397, Japan
sHarvard-Smithsonian Center for Astrophysics, MA 02138, USA
2
tFaculty of Mathematics and Physics, Kanazawa University, Ishikawa 920-1192, JapanuDepartment of Physical Science, Hiroshima University, Hiroshima 739-8526, Japan
vPhysics Department, University of Miami, FL 33124, USAwDepartment of Astronomy and Physics, Saint Mary’s University, Nova Scotia B3H 3C3, Canada
xEuropean Space Agency (ESA), European Space Astronomy Centre (ESAC), Madrid, SpainyDepartment of Physics and Astronomy, Aichi University of Education, Aichi 448-8543, Japan
zDepartment of Applied Physics, University of Miyazaki, Miyazaki 889-2192, JapanaaDepartment of Physics, University of Tokyo, Tokyo 113-0033, Japan
abDepartment of Physics, Rikkyo University, Tokyo 171-8501, JapanacDepartment of Physics and Astronomy, Rutgers University, NJ 08854-8019, USA
adDepartment of Physics and Astronomy, Johns Hopkins University, MD 21218, USAaeFaculty of Human Development, Kobe University, Hyogo 657-8501, Japan
afKyushu University, Fukuoka 819-0395, JapanagResearch Institute for Science and Engineering, Waseda University, Tokyo 169-8555, Japan
ahDepartment of Physics, Tokyo Institute of Technology, Tokyo 152-8551, JapanaiTsukuba Space Center (TKSC), Japan Aerospace Exploration Agency (JAXA), Ibaraki 305-8505, Japan
ajDepartment of Physics, Toho University, Chiba 274-8510, JapanakDepartment of Physics, Tokyo University of Science, Chiba 278-8510, Japan
alDepartment of Physics, Kyoto University, Kyoto 606-8502, JapanamDepartment of Electronic Information Systems, Shibaura Institute of Technology, Saitama 337-8570, Japan
anIRFU/Service d’Astrophysique, CEA Saclay, 91191 Gif-sur-Yvette Cedex, FranceaoSpace Telescope Science Institute, MD 21218, USA
apEuropean Space Agency (ESA), European Space Research and Technology Centre (ESTEC), 2200 AG Noordwijk, The NetherlandsaqDepartment of Physics, Tokyo University of Science, Tokyo 162-8601, Japan
arDepartment of Physics, University of Wisconsin, WI 53706, USAasUniversity of Waterloo, Ontario N2L 3G1, Canada
atDepartment of Astronomy, University of Michigan, MI 48109, USAauDepartment of Astronomy, Kyoto University, Kyoto 606-8502, Japan
avDepartment of Information Science, Faculty of Liberal Arts, Tohoku Gakuin University, Miyagi 981-3193, JapanawDepartment of Physics, Faculty of Science, Yamagata University, Yamagata 990-8560, Japan
axLaboratory of Nuclear Studies, Osaka University, Osaka 560-0043, JapanayNASA/Marshall Space Flight Center, AL 35812, USA
azDepartment of Physics, Faculty of Science, Nara Women’s University, Nara 630-8506, JapanbaDepartment of Astronomy, Columbia University, NY 10027, USA
bbDepartment of Physics and Astronomy, University of Manitoba, MB R3T 2N2, CanadabcDepartment of Physics, Saitama University, Saitama 338-8570, Japan
bdDepartment of Physics, Chuo University, Tokyo 112-8551, JapanbeScience Education, Faculty of Education, Shizuoka University, Shizuoka 422-8529, Japan
bfFaculty of Social and Information Sciences, Nihon Fukushi University, Aichi 475-0012, Japan
3
Contents
1 Top Science 5
2 Introduction 52.1 Abbreviations . . . . . . . . . . . . . . . . . . . . . . . . . . . . . . . . . . . . . . . . . . . 6
3 Gravitationally redshifted 6.4 keV line in massive accreting WDs 63.1 Background and Previous Studies . . . . . . . . . . . . . . . . . . . . . . . . . . . . . . . . 63.2 Prospects & Strategy . . . . . . . . . . . . . . . . . . . . . . . . . . . . . . . . . . . . . . . 63.3 Targets & Feasibility . . . . . . . . . . . . . . . . . . . . . . . . . . . . . . . . . . . . . . . 73.4 Beyond Feasibility . . . . . . . . . . . . . . . . . . . . . . . . . . . . . . . . . . . . . . . . 8
4 Detailed structure of the post-shock region in magnetic CVs 94.1 Background and Previous Studies . . . . . . . . . . . . . . . . . . . . . . . . . . . . . . . . 94.2 Prospects & Strategy . . . . . . . . . . . . . . . . . . . . . . . . . . . . . . . . . . . . . . . 10
4.2.1 Density diagnostics with Fe XXV triplets . . . . . . . . . . . . . . . . . . . . . . . . 104.2.2 Spectral model of the PSR updated for the SXS observation . . . . . . . . . . . . . . 10
4.3 Targets & Feasibility . . . . . . . . . . . . . . . . . . . . . . . . . . . . . . . . . . . . . . . 114.3.1 V1223 Sgr, the brightest magnetic CV, as an appropriate target . . . . . . . . . . . . . 114.3.2 Simulation of SXS spectra . . . . . . . . . . . . . . . . . . . . . . . . . . . . . . . . 12
4.4 Beyond Feasibility . . . . . . . . . . . . . . . . . . . . . . . . . . . . . . . . . . . . . . . . 13
5 Refection in accreting WDs 145.1 Background and Previous Studies . . . . . . . . . . . . . . . . . . . . . . . . . . . . . . . . 145.2 Prospects & Strategy . . . . . . . . . . . . . . . . . . . . . . . . . . . . . . . . . . . . . . . 145.3 Targets & Feasibility . . . . . . . . . . . . . . . . . . . . . . . . . . . . . . . . . . . . . . . 145.4 Beyond Feasibility . . . . . . . . . . . . . . . . . . . . . . . . . . . . . . . . . . . . . . . . 15
6 X-ray emission region in non-magnetic CVs 156.1 Background and Previous Studies . . . . . . . . . . . . . . . . . . . . . . . . . . . . . . . . 156.2 Prospects & Strategy . . . . . . . . . . . . . . . . . . . . . . . . . . . . . . . . . . . . . . . 166.3 Targets & Feasibility . . . . . . . . . . . . . . . . . . . . . . . . . . . . . . . . . . . . . . . 17
7 Anisotropic Radiative Transfer of Resonance photons 187.1 Background and Previous Studies . . . . . . . . . . . . . . . . . . . . . . . . . . . . . . . . 187.2 Prospects & Strategy . . . . . . . . . . . . . . . . . . . . . . . . . . . . . . . . . . . . . . . 217.3 Targets & Feasibility . . . . . . . . . . . . . . . . . . . . . . . . . . . . . . . . . . . . . . . 21
4

1 Top Science
The highest priority science of ASTRO-H for white dwarfs is the search for extremely massive white dwarfswith high accretion rates. We propose to do so by measuring the gravitational redshift of the 6.4 keV fluorescentFe line from the white dwarf surface using the SXS.
Observationally speaking, this is a relatively simple experiment, as long as a precise and accurate gain cali-bration is available for the SXS. There are potential targets which are known to have a strong enough 6.4 keVline and is thought to harbor a near Chandrasekhar mass white dwarf. Unlike some other worthy investigationsregarding accreting white dwarfs, this is a study that requires X-ray spectroscopy, while requiring relativelylittle multiwavelength support. Finally, if we can determine just one white dwarf mass above 1.3 M� sufficientaccurately, that would be a major result with implications on the debate over Type Ia supernova progenitorchannels.
2 Introduction
Some white dwarfs in CVs (and possibly also symbiotic stars) are magnetic enough that accretion proceedsalong field lines. The accretion flow in such cases is nearly vertical with respect to the white dwarf surface. Astrong stand-off shock forms just above the white dwarf surface; the post-shock plasma must cool and furtherslow down before settling onto the white dwarf. This cooling often happens primarily via emission of opti-cally thin, thermal X-rays. For a 0.6 M� white dwarf, the free-fall velocity is ∼4,300 km s−1 and the shocktemperature is ∼22 keV (6,900 km s−1 and 57 keV for a 1.0 M� white dwarf). For a specific accretion rateof 1 g s−1cm−2, the immediate post-shock density is ∼ 1015 cm−3 (∼ 6 × 1015 cm−3), the post-shock coolingtimescale is 0.7 s (1.8 s), and the shock height is 5% of the white dwarf radius, or 0.05 RWD (0.34 RWD). Thisbasic picture of the accretion column has been known for 40 years (Aizu, 1973). The observed X-ray emissionshould be the sum of emission at many temperatures, as the plasma cools, slows down, and becomes denser.We explore below whether we can obtain direct quantitative observational confirmation of this picture usingvelocity and density diagnostics of the high spectral resolution SXS data.
In non-magnetic CVs, the accretion proceeds via a disk. This is probably also true of the majority of sym-biotic stars that have been detected above ∼2 keV to date. In such cases, the X-rays are emitted from theboundary layer between the Keplerian disk and the white dwarf surface; the physics of the boundary layer isfar more complex than that of the accretion column. Can we apply similar diagnostics as for magnetic CVsto aide the theoretical efforts to understand the boundary layer? Moreover, while our understanding of thesteady-state accretion disk is fairly secure, it is less so for dwarf novae, for which the disk instability model(DIM) is widely adopted as the explanation. However, the basic version of DIM predicts the matter transferredfrom the secondary to pile up in the disk during quiescence (the low state) and hence very little accretion totake place onto the white dwarf. The observed X-ray luminosity is much higher than predicted. One possiblemodification of the DIM is that the quiescent disk has a central hole, replaced by an advective flow. We willexplore if ASTRO-H can constrain the reflection amplitude with sufficient accuracy to determine if such a holeexists in the quiescent disk.
If we can identify even a single massive white dwarf, close to the Chandrasekhar limit, in an accreting binary,such a discovery have a profound implications. The presence of such a binary is an important precondition forthe single degenerate channel of Type Ia supernovae. Conventional methods such as optical radial velocitystudies have not led to a secure identification of such a system. We believe that the ASTRO-H SXS can mea-sure the gravitational redshift of the 6.4 keV line produced via reflection on the white dwarf surface, if it issufficiently massive. Although success is not guaranteed, we consider this to be the most important ASTRO-Hscience topic for accreting white dwarf binaries.
The 2–10 keV luminosity of CVs and symbiotic stars range from ∼ 1029 ergs s−1 for the low accretion ratedwarf novae (Reis et al., 2013) to > 1034 ergs s−1 for the Swift BAT detected symbiotic stars (Kennea et al.,2009). Given their relative proximity (of order 100 pc for many CVs and of order 2 kpc for numerous symbioticstars), the potential target list numbers several dozen.
5

2.1 Abbreviations
BL Boundary Layer via which gas from an accretion disk settles on to the white dwarf surface
CV Cataclysmic Variable containing mass-accreting white dwarf
DIM Disk Instability Model
PSR Post-Shock Region of an accretion column
TNR Thermo-Nuclear Runaway
WD White Dwarf star
3 Gravitationally redshifted 6.4 keV line in massive accreting WDs
3.1 Background and Previous Studies
For the single degenerate channel for Type Ia supernovae to be viable, there must exist accreting binarieshosting massive (near Chandrasekhar mass) WDs. The WD mass in CVs and symbiotic stars would show asecular increase if accretion was the only factor involved. However, under many conditions, accreting WDsundergo thermonuclear runaways (TNRs) whenever a sufficient mass is accumulated. Such events are observedas nova eruptions, in which a large amount of mass is ejected from the WD surface. Observations often showthe nova ejecta to be enriched by the underlying WD material. Given this, it is unclear if WDs can grow in massthrough successive accretion-TNR cycles, and if so, under what conditions and at what efficiency (fraction ofthe accreted mass that is retained by the WD). This is a significant weakness of the single degenerate channel.
Given this, even a discovery of single system with, say, > 1.3 M� WD would be significant. Such a binarywas likely born with a somewhat less massive WD, with the WD mass growing over time; if the WD mass isdecreasing, the initial mass of the WD must be even closer to the Chandrasekhar limit, which seems an unlikelypossibility. Such a discovery would prove that one of the necessary conditions for the single degenerate channelto be viable is met.
There are indirect indications for high WD masses in accreting binaries. For example, recurrent novae —accreting WDs that have been seen to experience nova eruptions multiple times over the last century or so —are likely to have high mass WDs. This is because the critical density required for a TNR is unlikely to bereached within a span of a few decades after the previous TNR, unless the gravitational field of the WD isexceptionally strong. However, this line of reasoning is qualitative and not foolproof.
Direct observational determinations of WD mass in accreting binaries are often very imprecise. Dynamicaldetermination relies on radial velocity studies, but few accreting WD systems are double-line spectroscopicbinaries — the mass donors in CVs are often too faint, and those in symbiotic stars are too bright. Also, theradial velocity motion of the WD is usually inferred via the motion of accretion disk around it; any asymmetriesor azimuthal structures can easily mislead us. Furthermore, the binary inclination is uncertain unless the systemis eclipsing, which often translates to large uncertainties in the derived WD mass.
If we can measure the gravitational redshift of spectral features from the white dwarf surface, this can allchange. We believe there is a strong possibility that we can do so, by using ASTRO-H SXS to measure theenergy of the 6.4 keV line precisely.
3.2 Prospects & Strategy
For this method to work, several conditions must be met. The target must be hard X-ray bright, with a significant6.4 keV line as seen in previous observations. A large fraction of the 6.4 keV line flux must originate on theWD surface. The systemic velocity of the binary must be known, and ideally the orbital motion of the WDnegligible (∼10 km s−1). Most importantly, the WD must be sufficiently massive that the gravitational redshiftcan be measured against statistical and systematic uncertainties.
6

Figure 1: Gravitational redshift as a function of the WD mass, expressed in equivalent velocity and as energy shift for the 6.4 keV line.
We show the expected degree of gravitational redshift in Figure 1. As can be seen, the more massive the WD,the easier it will be to detect the redshift. For WD mass above 1.1 M�, the redshift will be larger than 2 eV,which we argue is easily within reach of SXS measurements. Moreover, the gravitational redshift is a sensitiveproxy of the WD mass just below the Chandrasekhar limit, precisely where a mass determination can have asignificant impact.
The first criterion can be satisfied by selecting a target detected in the Swift BAT survey of the hard X-raysky. Several dozen accreting WD systems have been detected to date, but most are magnetic CVs with onlymoderately massive WDs (0.8 − 1.0M�). Here we concentrate on the 4 symbiotic stars detected in the BATsurvey (Kennea et al., 2009). Since the M giant mass donor is the dominant source of optical and IR photons,their systemic velocity is (or can be) known accurately. Due to the large orbit and the long orbital period,the radial velocity motion of the WD is relatively small. Finally, there is no evidence that the WDs in thesesymbiotic stars are magnetic. Therefore, the very fact that they are detected by BAT indicates that the WDs aremassive (note that, for a given WD mass, the maximum temperature of the shock is factor of ∼2 higher in themagnetic than in the non-magnetic case, due to the difference in free-fall and Keplerian velocities).
3.3 Targets & Feasibility
One of the 4 symbiotic stars detected by BAT is T CrB, which is also a recurrent nova. Both this fact and thehard BAT spectrum indicates that its WD is exceptionally massive, perhaps around 1.35 M�. It has been alwaysactive and hard X-ray bright during the BAT survey. The WD photosphere is hidden in the optical/UV by thebright emissions from the M giant mass donor and the accretion disk. T CrB exhibits a strong 6.4 keV line,partly from the reflection off the WD surface. We therefore believe that T CrB is the best target for this study.
We guide our simulation (Figure 2) using the 46 ks Suzaku observation obtained in 2006. The XIS data arefit using a mildly broadened mkcflow model absorbed by a partial covering absorber with a single, narrowGaussian at 6.396 keV. The inset shows the difference between this simulation and one with a narrow Gaus-sian at 6.400 keV. This clearly shows that the ASTRO-H SXS has the statistical quality necessary to detect agravitational redshift of 4 eV. In the simulation, the following SXS instrumental response files were used:
• ah_sxs_5ev_basefilt_20100712.rmf (energy redistribution file),
• sxt-s_120210_ts02um_intallpxl.arf(auxiliary response file), and
7
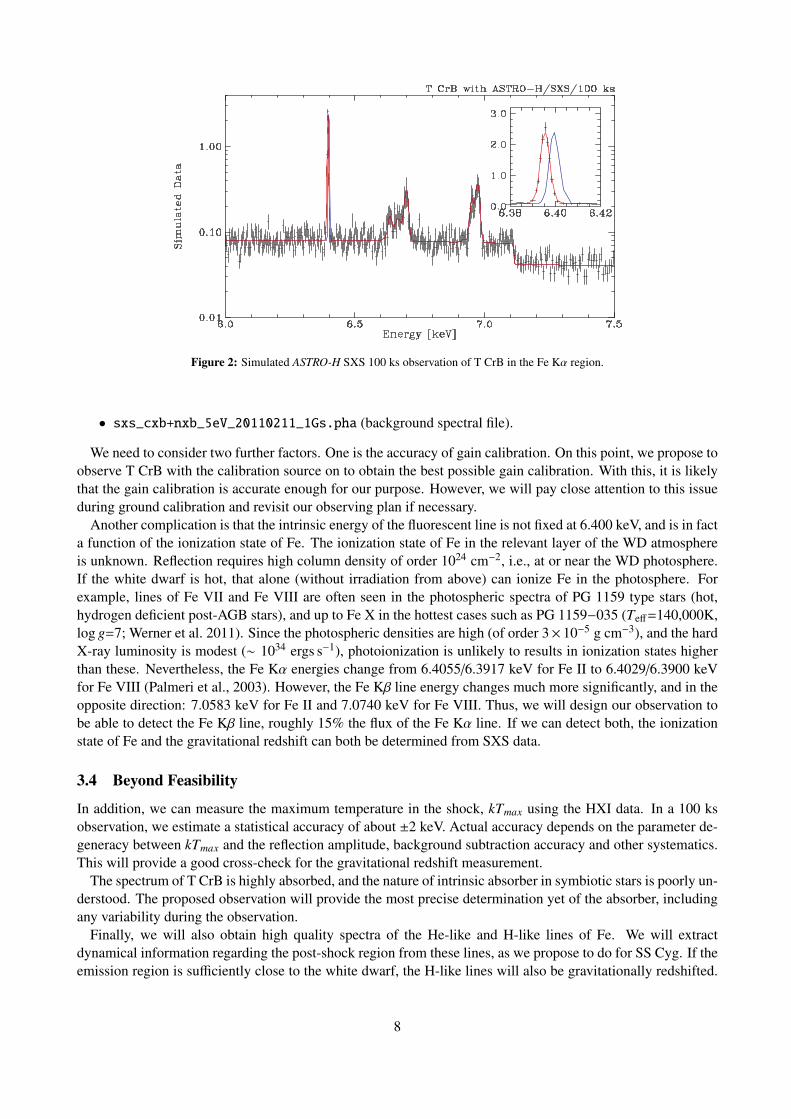
Figure 2: Simulated ASTRO-H SXS 100 ks observation of T CrB in the Fe Kα region.
• sxs_cxb+nxb_5eV_20110211_1Gs.pha (background spectral file).
We need to consider two further factors. One is the accuracy of gain calibration. On this point, we propose toobserve T CrB with the calibration source on to obtain the best possible gain calibration. With this, it is likelythat the gain calibration is accurate enough for our purpose. However, we will pay close attention to this issueduring ground calibration and revisit our observing plan if necessary.
Another complication is that the intrinsic energy of the fluorescent line is not fixed at 6.400 keV, and is in facta function of the ionization state of Fe. The ionization state of Fe in the relevant layer of the WD atmosphereis unknown. Reflection requires high column density of order 1024 cm−2, i.e., at or near the WD photosphere.If the white dwarf is hot, that alone (without irradiation from above) can ionize Fe in the photosphere. Forexample, lines of Fe VII and Fe VIII are often seen in the photospheric spectra of PG 1159 type stars (hot,hydrogen deficient post-AGB stars), and up to Fe X in the hottest cases such as PG 1159−035 (Teff=140,000K,log g=7; Werner et al. 2011). Since the photospheric densities are high (of order 3× 10⁻⁵ g cm−3), and the hardX-ray luminosity is modest (∼ 1034 ergs s−1), photoionization is unlikely to results in ionization states higherthan these. Nevertheless, the Fe Kα energies change from 6.4055/6.3917 keV for Fe II to 6.4029/6.3900 keVfor Fe VIII (Palmeri et al., 2003). However, the Fe Kβ line energy changes much more significantly, and in theopposite direction: 7.0583 keV for Fe II and 7.0740 keV for Fe VIII. Thus, we will design our observation tobe able to detect the Fe Kβ line, roughly 15% the flux of the Fe Kα line. If we can detect both, the ionizationstate of Fe and the gravitational redshift can both be determined from SXS data.
3.4 Beyond Feasibility
In addition, we can measure the maximum temperature in the shock, kTmax using the HXI data. In a 100 ksobservation, we estimate a statistical accuracy of about ±2 keV. Actual accuracy depends on the parameter de-generacy between kTmax and the reflection amplitude, background subtraction accuracy and other systematics.This will provide a good cross-check for the gravitational redshift measurement.
The spectrum of T CrB is highly absorbed, and the nature of intrinsic absorber in symbiotic stars is poorly un-derstood. The proposed observation will provide the most precise determination yet of the absorber, includingany variability during the observation.
Finally, we will also obtain high quality spectra of the He-like and H-like lines of Fe. We will extractdynamical information regarding the post-shock region from these lines, as we propose to do for SS Cyg. If theemission region is sufficiently close to the white dwarf, the H-like lines will also be gravitationally redshifted.
8
If that is the case, it is in some way a cleaner measurement than the reflection line, since the ionization state ofthe line-producing ions is not in doubt in this case.
4 Detailed structure of the post-shock region in magnetic CVs
4.1 Background and Previous Studies
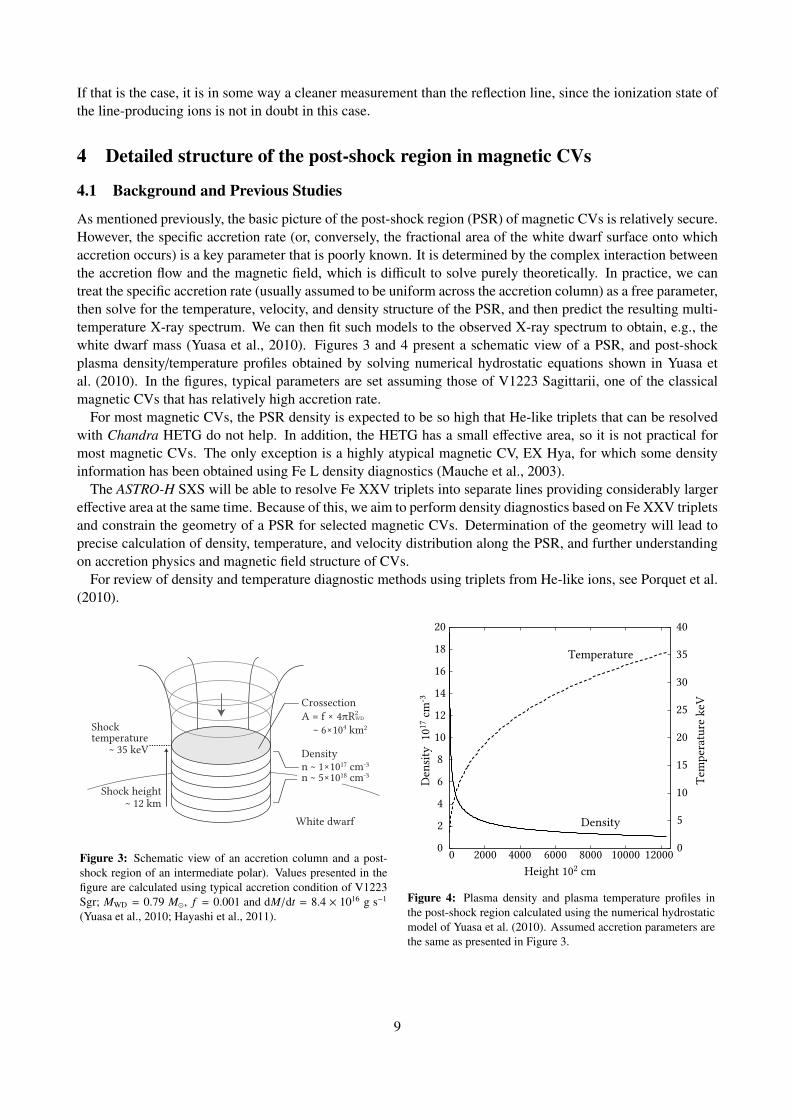
As mentioned previously, the basic picture of the post-shock region (PSR) of magnetic CVs is relatively secure.However, the specific accretion rate (or, conversely, the fractional area of the white dwarf surface onto whichaccretion occurs) is a key parameter that is poorly known. It is determined by the complex interaction betweenthe accretion flow and the magnetic field, which is difficult to solve purely theoretically. In practice, we cantreat the specific accretion rate (usually assumed to be uniform across the accretion column) as a free parameter,then solve for the temperature, velocity, and density structure of the PSR, and then predict the resulting multi-temperature X-ray spectrum. We can then fit such models to the observed X-ray spectrum to obtain, e.g., thewhite dwarf mass (Yuasa et al., 2010). Figures 3 and 4 present a schematic view of a PSR, and post-shockplasma density/temperature profiles obtained by solving numerical hydrostatic equations shown in Yuasa etal. (2010). In the figures, typical parameters are set assuming those of V1223 Sagittarii, one of the classicalmagnetic CVs that has relatively high accretion rate.
For most magnetic CVs, the PSR density is expected to be so high that He-like triplets that can be resolvedwith Chandra HETG do not help. In addition, the HETG has a small effective area, so it is not practical formost magnetic CVs. The only exception is a highly atypical magnetic CV, EX Hya, for which some densityinformation has been obtained using Fe L density diagnostics (Mauche et al., 2003).
The ASTRO-H SXS will be able to resolve Fe XXV triplets into separate lines providing considerably largereffective area at the same time. Because of this, we aim to perform density diagnostics based on Fe XXV tripletsand constrain the geometry of a PSR for selected magnetic CVs. Determination of the geometry will lead toprecise calculation of density, temperature, and velocity distribution along the PSR, and further understandingon accretion physics and magnetic field structure of CVs.
For review of density and temperature diagnostic methods using triplets from He-like ions, see Porquet et al.(2010).
Shock height
Shocktemperature
~ 12 km
~ 35 keV
A = f × 4πR2WD
~ 6×10⁴ km2
Crossection
Density
White dwarf
n ~ 5×1018 cm-3n ~ 5×1018 cm-3n ~ 1×1017 cm-3
Figure 3: Schematic view of an accretion column and a post-shock region of an intermediate polar). Values presented in thefigure are calculated using typical accretion condition of V1223Sgr; MWD = 0.79 M�, f = 0.001 and dM/dt = 8.4 × 10¹⁶ g s−1
(Yuasa et al., 2010; Hayashi et al., 2011).
0
2
4
6
8
10
12
14
16
18
20
0 2000 4000 6000 8000 10000 12000 0
5
10
15
20
25
30
35
40
Den
sity
1017
cm
-3
Tem
pera
ture
keV
Height 102 cm
Temperature
Density
Figure 4: Plasma density and plasma temperature profiles inthe post-shock region calculated using the numerical hydrostaticmodel of Yuasa et al. (2010). Assumed accretion parameters arethe same as presented in Figure 3.
9
4.2 Prospects & Strategy
4.2.1 Density diagnostics with Fe XXV triplets
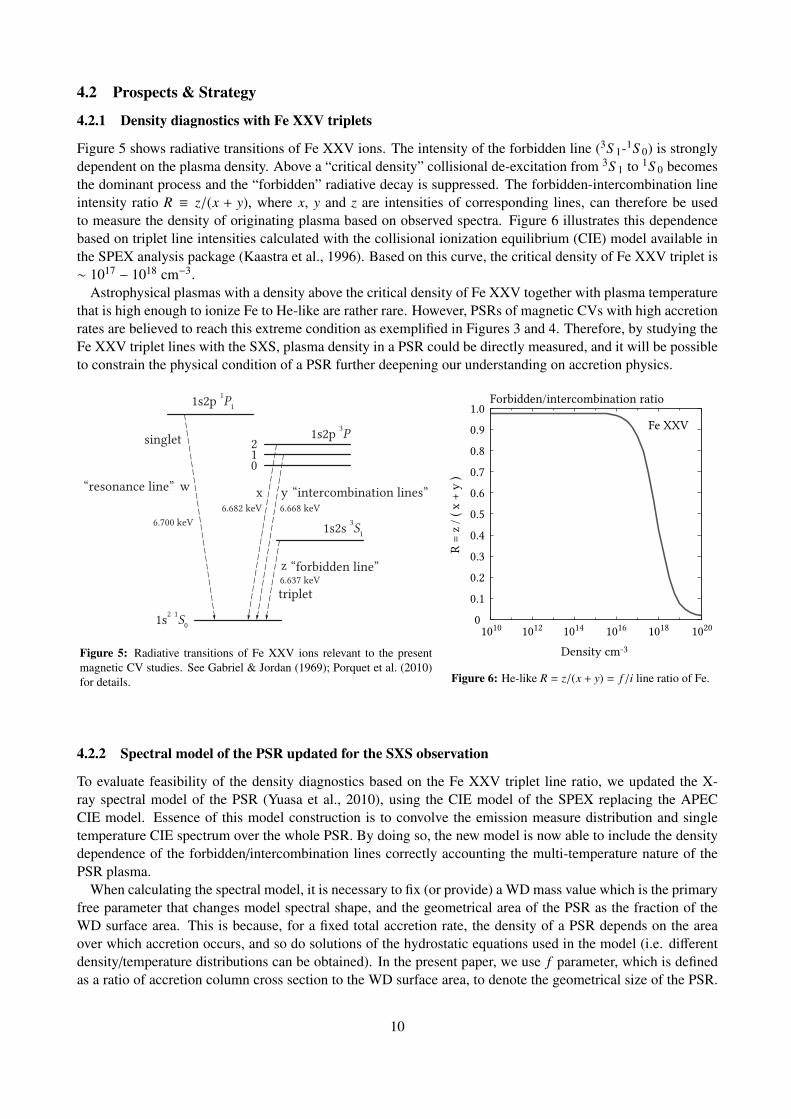
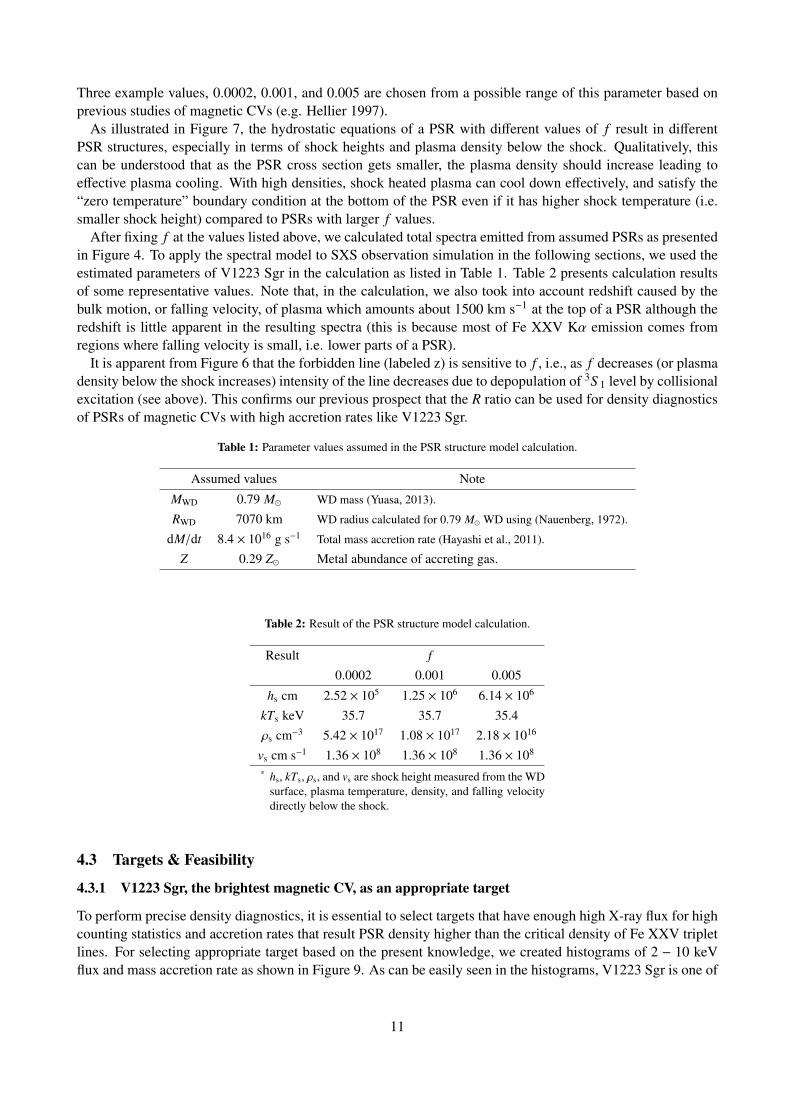
Figure 5 shows radiative transitions of Fe XXV ions. The intensity of the forbidden line (3S 1-1S 0) is stronglydependent on the plasma density. Above a “critical density” collisional de-excitation from 3S 1 to 1S 0 becomesthe dominant process and the “forbidden” radiative decay is suppressed. The forbidden-intercombination lineintensity ratio R ≡ z/(x + y), where x, y and z are intensities of corresponding lines, can therefore be usedto measure the density of originating plasma based on observed spectra. Figure 6 illustrates this dependencebased on triplet line intensities calculated with the collisional ionization equilibrium (CIE) model available inthe SPEX analysis package (Kaastra et al., 1996). Based on this curve, the critical density of Fe XXV triplet is∼ 1017 − 1018 cm−3.
Astrophysical plasmas with a density above the critical density of Fe XXV together with plasma temperaturethat is high enough to ionize Fe to He-like are rather rare. However, PSRs of magnetic CVs with high accretionrates are believed to reach this extreme condition as exemplified in Figures 3 and 4. Therefore, by studying theFe XXV triplet lines with the SXS, plasma density in a PSR could be directly measured, and it will be possibleto constrain the physical condition of a PSR further deepening our understanding on accretion physics.
1s2p 1P1
1s2s 3S1
1s2 1S0
1s2p 3P210
singlet
“resonance line”
6.700 keV
6.637 keV
6.668 keV6.682 keV
“forbidden line”
“intercombination lines”
triplet
w x y
z
Figure 5: Radiative transitions of Fe XXV ions relevant to the presentmagnetic CV studies. See Gabriel & Jordan (1969); Porquet et al. (2010)for details.
0
0.1
0.2
0.3
0.4
0.5
0.6
0.7
0.8
0.9
1.0
1010 1020 1018 1016 1014 1012
R =
z / (
x +
y )
Density cm-3
Forbidden/intercombination ratio
Fe XXV
Figure 6: He-like R = z/(x + y) = f /i line ratio of Fe.
4.2.2 Spectral model of the PSR updated for the SXS observation
To evaluate feasibility of the density diagnostics based on the Fe XXV triplet line ratio, we updated the X-ray spectral model of the PSR (Yuasa et al., 2010), using the CIE model of the SPEX replacing the APECCIE model. Essence of this model construction is to convolve the emission measure distribution and singletemperature CIE spectrum over the whole PSR. By doing so, the new model is now able to include the densitydependence of the forbidden/intercombination lines correctly accounting the multi-temperature nature of thePSR plasma.
When calculating the spectral model, it is necessary to fix (or provide) a WD mass value which is the primaryfree parameter that changes model spectral shape, and the geometrical area of the PSR as the fraction of theWD surface area. This is because, for a fixed total accretion rate, the density of a PSR depends on the areaover which accretion occurs, and so do solutions of the hydrostatic equations used in the model (i.e. differentdensity/temperature distributions can be obtained). In the present paper, we use f parameter, which is definedas a ratio of accretion column cross section to the WD surface area, to denote the geometrical size of the PSR.
10
Three example values, 0.0002, 0.001, and 0.005 are chosen from a possible range of this parameter based onprevious studies of magnetic CVs (e.g. Hellier 1997).
As illustrated in Figure 7, the hydrostatic equations of a PSR with different values of f result in differentPSR structures, especially in terms of shock heights and plasma density below the shock. Qualitatively, thiscan be understood that as the PSR cross section gets smaller, the plasma density should increase leading toeffective plasma cooling. With high densities, shock heated plasma can cool down effectively, and satisfy the“zero temperature” boundary condition at the bottom of the PSR even if it has higher shock temperature (i.e.smaller shock height) compared to PSRs with larger f values.
After fixing f at the values listed above, we calculated total spectra emitted from assumed PSRs as presentedin Figure 4. To apply the spectral model to SXS observation simulation in the following sections, we used theestimated parameters of V1223 Sgr in the calculation as listed in Table 1. Table 2 presents calculation resultsof some representative values. Note that, in the calculation, we also took into account redshift caused by thebulk motion, or falling velocity, of plasma which amounts about 1500 km s−1 at the top of a PSR although theredshift is little apparent in the resulting spectra (this is because most of Fe XXV Kα emission comes fromregions where falling velocity is small, i.e. lower parts of a PSR).
It is apparent from Figure 6 that the forbidden line (labeled z) is sensitive to f , i.e., as f decreases (or plasmadensity below the shock increases) intensity of the line decreases due to depopulation of 3S 1 level by collisionalexcitation (see above). This confirms our previous prospect that the R ratio can be used for density diagnosticsof PSRs of magnetic CVs with high accretion rates like V1223 Sgr.
Table 1: Parameter values assumed in the PSR structure model calculation.
Assumed values Note
MWD 0.79 M� WD mass (Yuasa, 2013).
RWD 7070 km WD radius calculated for 0.79 M� WD using (Nauenberg, 1972).
dM/dt 8.4 × 10¹⁶ g s−1 Total mass accretion rate (Hayashi et al., 2011).
Z 0.29 Z� Metal abundance of accreting gas.
Table 2: Result of the PSR structure model calculation.
Result f
0.0002 0.001 0.005
hs cm 2.52 × 10⁵ 1.25 × 10⁶ 6.14 × 10⁶
kTs keV 35.7 35.7 35.4ρs cm−3 5.42 × 10¹⁷ 1.08 × 10¹⁷ 2.18 × 10¹⁶
vs cm s−1 1.36 × 10⁸ 1.36 × 10⁸ 1.36 × 10⁸
* hs, kTs, ρs, and vs are shock height measured from the WDsurface, plasma temperature, density, and falling velocitydirectly below the shock.
4.3 Targets & Feasibility
4.3.1 V1223 Sgr, the brightest magnetic CV, as an appropriate target
To perform precise density diagnostics, it is essential to select targets that have enough high X-ray flux for highcounting statistics and accretion rates that result PSR density higher than the critical density of Fe XXV tripletlines. For selecting appropriate target based on the present knowledge, we created histograms of 2 − 10 keVflux and mass accretion rate as shown in Figure 9. As can be easily seen in the histograms, V1223 Sgr is one of
11

0.001f = 0.005 0.0002
Figure 7: Schematic view of PSR structures with dif-ferent cross sections but the same total mass accretionrates. The thicker parts correspond to higher densities.The scale of the PSR and the shock heights are exagger-ated.
10
20
30
40
50
60
70
80
90f = 0.005
100
6.6 6.62 6.64 6.66 6.68 6.7 6.72 6.74
10-4
Pho
tons
cm
-2 s-1
keV
-1Energy keV
f = 0.001f = 0.0002
resonancew
forbiddenz
intercombination y x
Figure 8: Close-up view of Fe XXV Kα spectra of X-ray emissioncalculated for multi-temperature and multi-density post-shock plasmaof V1223 Sgr. Dashed, solid, and dash-dotted curves are calculatedwith three different covering fraction f of 0.005, 0.001, and 0.0002.Note that the solid curve corresponds to total spectrum expected fromtemperature/density the distribution presented in Figure 4.
the brightest well known magnetic CVs, and at the same time, it has a relatively high total mass accretion thatcan create different forbidden line intensities depending on the PSR cross section f (as presented in Figure 8).
0
1
2
5
4
3
-2 cm-1 erg s-11Flux in 2-10 keV 102 4 6 8 10
0
1
2
3
4
EXHya
TVCol
V2400Oph
V709Cas
YYDra
BGCMi
IGRJ17303
XYAri
MUCam
TXCol
AOPsc
IGRJ17195
NYLup
EXHya
PQGem
RXJ2133
V1223Sgr
(a) (b)
-1 g s16Mass accretion rate 100 2 4 6 8 10 12 14 16 18 20
V2400Oph
EXHya
TXCol
V1062Tau
YYDra
TVCol
PQGem
V405Aur
AOPsc
BGCMi
V709Cas
V1223Sgr
FOAqr
Figure 9: Histograms of (a) 2 − 10 keV flux and (b) mass accretion rate of well-studied classical magnetic CVs (intermediate polars).To highlight V1223 Sgr, bins with an entry for the source is labeled with source name. Data from Yuasa et al. (2010) and Suleimanovet al. (2005).
Based on these facts, V1223 Sgr is an ideal target for an early observation with ASTRO-H. Not only thedensity diagnostics, but studies of X-ray reflection at the WD surface can be performed at the same time usinga single observation of V1223 Sgr (see next section).
4.3.2 Simulation of SXS spectra
Using the calculated spectral model (Figure 4), we simulated spectra obtained with the SXS using the followinginstrumental response files:
12

• ah_sxs_5ev_basefilt_20100712.rmf (energy redistribution file),
• sxt-s_100208_ts02um_intallpxl.arf (auxiliary response file), and
• sxs_nxb_5ev_20110211_1Gs.pha (background spectral file).
We assumed a net exposure of 100 ks to achieve statistically sufficient photon counts for detailed analysis of w,x, y, and z line intensities. Figure 8 presents three resulting spectra for f = 0.0002, 0.001, and 0.005. Althoughwe do not know the actual f value for V1223 Sgr, we believe that the three values cover most of a possiblerange, and therefore.
In each spectrum, we fitted emission lines with Gaussians, and estimated their intensities accompanied witherrors at the 90% confidence level as results listed in Table 3. From the fitting result, we calculated R = z/(x+y),and plotted against f in Figure 11. Based on the calculated R results, we expect that we can clearly distinguishf = 0.0002 and 0.001 cases, but for 0.001 and 0.005 cases, discrimination may be possible only marginallywithin the errors.
Although plasma density diagnostics have been a very important method which can apply to broad range ofdensities and wavelengths, those with Fe XXV triplet lines are only possible with the SXS, and in particular,with targets that exhibits high-rate mass accretion. By observing V1223 Sgr, we would like to exploit the SXScapability and realize one of long-standing challenges anticipated for X-ray micro calorimeters.
Cou
nts
s−1 k
eV−1
Cou
nts
s−1 k
eV−1
Cou
nts
s−1 k
eV−1
Energy keV6.70 6.726.686.666.646.62
0
1.0
2.0
1.5
0.5
0
1.0
2.0
1.5
0.5
0
1.0
2.0
1.5
0.5
f = 0.0002
f = 0.001
f = 0.005
z y x
w
Figure 10: Fe XXV Kα emission line spectra of the PSR ofV1223 Sgr simulated assuming a 100-ks SXS observation. Asused in Figure 8, we simulated three cases with different coveringfractions f = 0.005, 0.001, and 0.0002.
0.1
0.2
0.3
0.4
0.5
0.6
0.7
0.8
0.9
0.0002 0.001 0.005
R =
z /
(x +
y)
f
Exp = 100 ks
Figure 11: R ratios calculated from the x, y, and z intensitiesobtained from the gaussian fits of simulated 100-ks spectra. As-sociated errors are at the 90% confidence level.
4.4 Beyond Feasibility
The same observation of V1223 Sgr can be used to study reflection as a function of spin phase, and to searchfor gravitationally redshifted 6.4 keV line (see below). In addition, the spectrum of magnetic CVs are affected
13

Table 3: Results of the Gaussian fits to the simulated spectra of a 100-ks observation of V1223 Sgr.
f Intensity (10−5 photons s−1 cm−2) R
w x y z
0.005 4.80+0.25−0.37 1.00+0.18
−0.30 1.29+0.11−0.31 1.54+0.22
−0.19 0.68 ± 0.120.001 4.72+0.30
−0.37 0.99+0.190.27 1.38+0.20
−0.19 1.20+0.11−0.21 0.51 ± 0.10
0.0002 4.77+0.26−0.33 1.29+0.22
−0.18 1.68+0.23−0.18 0.67+0.17
−0.18 0.23 ± 0.06
by complex partial covering absorber (Done & Magdziarz, 1998), including warm absorber features (Mukaiet al., 2001). The SXS has large enough effective area and adequate spectral resolution below 1 keV to studythese.
5 Refection in accreting WDs
5.1 Background and Previous Studies
The primary X-rays emitted by accreting WDs can reflect off the WD surface and pre-shock accretion disk/column.This results in the reflection bump in >10 keV continuum and the 6.4 keV fluorescent line, and a physical un-derstanding requires both to be fit in a self-consistent manner. An accurate characterization of the reflectionbump is necessary for an accurate determination of the shock temperature, and hence the white dwarf mass.Unfortunately, most CVs and symbiotic stars are faint enough above 10 keV that the systematic uncertaintiesof the background in non-imaging detectors, including Suzaku HXD/PIN, have proved to be the limiting factor.
5.2 Prospects & Strategy
The combination of the high sensitivity of the ASTRO-H HXI for hard continuum and the spectral resolutionof the SXS will allow us to measure the reflection fraction (both the hard continuum bump and the 6.4 keVfluorescent line) with an unprecedented accuracy. For the X-ray brightest magnetic CVs, this can be donein several spin phases, which will test angle-dependent models of reflection. The 6.4 keV line may exhibitCompton shoulder in some cases. As first reported by Hayashi et al. (2011) in V1223 Sgr, fluorescence fromfree-falling pre-shock gas will have detectable redshift due to its line-of-sight velocity of several×1000 km s−1.A detection of redshifted Fe fluorescent line will improve our understanding of the accretion stream in magneticCVs. This can lead to further improvements in the PSR model calculation and, consequently, spectral modelcalculations.
Hard X-ray continuum spectra of bright magnetic CVs may be observed with NuSTAR well before ASTRO-H,and the combination of the NuSTAR data with those of Fe Kα lines from XMM-Newton or Suzaku may helpto some extent. However, ASTRO-H data will definitely offer an improvement since they will allow a fullyphysical treatment of geometry, fluorescent line from WD surface and pre-shock gas and its Comptonizationusing simultaneous HXI and SXS data.
5.3 Targets & Feasibility
The same accreting magnetic CV, V1223 Sgr, as the PSR structure study is the most appropriate target becausethis is the brightest CV in the hard X-ray band (>10 keV), and therefore, we can expect sufficient photoncounts within a realistic exposure. In addition, although this is a well studied classical magnetic CV, thereare discrepancies among published analysis of the reflection component using instruments onboard past andcurrent missions (e.g. Revnivtsev et al. 2004; Hayashi et al. 2011).
Figure 12 shows spin-resolved simulation spectra of V1223 Sgr. Spectral model of Yuasa (2013) has beenconvolved with the reflection model reflect assuming a large reflector that covers 50% of solid angle viewed
14

from the PSR. In this simulation, each spin-phase has net exposure of 20 ks (i.e. 100-ks observation is tenta-tively divided into five spin phases). Count rates in the HXI energy band are tabulated in Table 4.
Although differences between individual spin phases are not necessary obvious, the count rates can be usedas a nice estimator of reflection fraction, and variation of them may constrain angular coverage of reflectingmaterial (WD surface).
10
cosIncl0.450.650.85
05 1000250.01
0.1
keV
2 (P
hoto
ns c
m−2
s−1
keV
−1)
Energy (keV)
V1223 Sgr (cosIncl = 0.45; 20 ks)
Figure 12: Faked SXI+HXI νFν spectra of V1223 Sgr. A total exposure of 100 ks is assumed. The presented spin-phase-resolvedspectra are calculated with inclination angles (against the accretion column) cos θ = 0.45, 0.65, and 0.85 each with 20 ks (i.e. 100 ksexposure is divided into 5 spin phases).
Table 4: Simulated count rates of V1223 Sgr in the hard X-ray band.
cos θ1 0.25 0.45 0.65 0.85Count rate2 1.334 ± 0.008 1.456 ± 0.009 1.550 ± 0.009 1.605 ± 0.0091 Inclination between the line of sight and the PSR vertical direction (i.e. normal vector
of the WD surface where accreting gas lands).2 Total 10 − 70 keV count rate expected in the two HXI.
5.4 Beyond Feasibility
Based on previous studies, V1223 Sgr has a WD mass of ∼ 0.7 − 0.8 M�. Energies of fluorescent Fe Kα lineemitted at the WD surface should be affected by the gravitational redshift of an order or 1 eV. Although thisgravitational redshift should be cross-checked by observing CVs with heavier WDs to overcome systematicuncertainty of SXS energy scale (see below), if we can measure redshift amount in V1223 Sgr, we will be ableto improve reliability of our WD gravitational potential estimation, or mass estimation, supported by this whichis independent from other measurable quantities such as shock temperature or free-fall velocity of pre-shockgas.
6 X-ray emission region in non-magnetic CVs
6.1 Background and Previous Studies
Observers have long assumed that the Keplerian accretion disk in non-magnetic CVs extend down to the whitedwarf surface, and the boundary layer (BL) between the Keplerian disk and the white dwarf is the likely siteof much of the X-rays we observe (Patterson & Raymond, 1985). The detailed structure of the boundary
15
layer, unfortunately, remains poorly understood. In high accretion rate cases, the boundary layer is expectedto become optically thick, which should make it a soft X-ray source (say 20 eV blackbody), not a hard X-raysource. Yet, high accretion rate non-magnetic CVs are observed to emit hard X-rays. The origin of these hardX-rays, in systems that should have an optically thick boundary layer, is a major unanswered question. Asproposed in Ishida et al. (2009), an accretion disk wind, which is a common feature of high accretion ratedisks in CVs, may be connected with the hard X-ray emission in high accretion rates. At present, however,the study of wind in X-ray data is at a relatively early stage. Moreover, following the standard accretion diskShakura & Sunyaev (1973), half of the gravitational energy is released in the accretion disk and, hence, theother half is released in BL. Observations in the extreme-ultraviolet band of SS Cyg and VW Hyi, however,revealed that the fractional energy radiated from BL is only < 10% of the disk luminosity (Mauche et al. 1991,1995). According to classical theory, the temperature of BL in outburst is predicted to be 2–5 ×10⁵ K (Pandelet al., 2005), whereas the temperature estimated by ultraviolet and optical emission lines is constrained to asignificantly lower range of 5–10 ×104 K (Hoare & Drew, 1991). These discrepancies may be resolved if weassume that BL is terminated not on the static white dwarf surface, but on a rapidly rotating accretion belt onthe equatorial surface of the white dwarf (Paczynski et al. 1978; Kippenhahn & Thomas 1978). Suggestionsabout the accretion belt, rotating at a speed close to the local Keplerian velocity, have been reported from a fewnon-magnetic CVs in outburst (Huang et al. 1996; Sion et al. 1996; Cheng et al. 1997; Szkody et al. 1998).
In addition, there is a question of whether the disk reaches the surface in the case of low accretion rate disks.Dwarf novae are large subclass of non-magnetic CVs in which the mass transfer rate from the secondary islow, the disk is cold and dim most of the time (quiescence) with occasional outbursts when the disk is hot andbright. This is generally interpreted in the framework of the disk instability model, or DIM (Lasota, 2001).However, an essential feature of DIM is that the accretion rate through a disk is highly dependent on the radialdistance from the white dwarf: somewhat high near the outer edge, very low at the inner edge, hence matteraccumulates in the disk throughout the quiescent interval. The basic version of the DIM therefore predicts anextremely low accretion rate onto the white dwarf during quiescence. The X-ray luminosity of quiescent dwarfnovae immediately disproves this. One possible modification of DIM is that a central hole develops in quiescentdwarf nova.
6.2 Prospects & Strategy
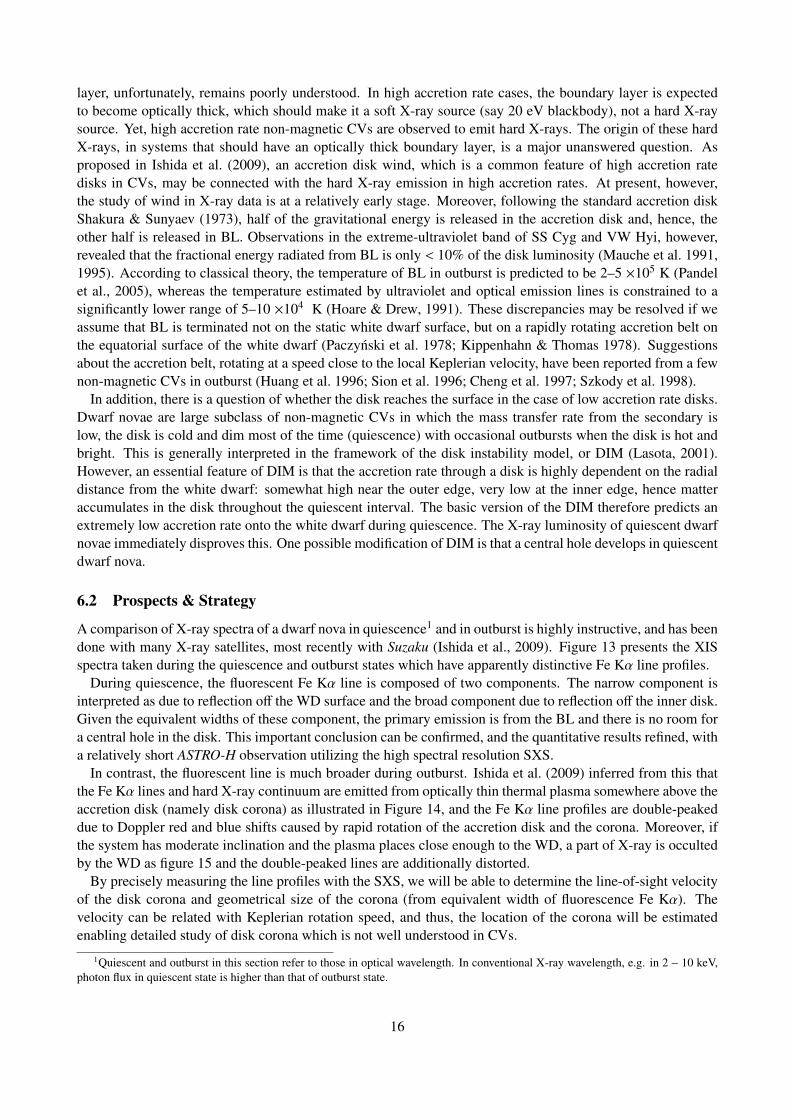
A comparison of X-ray spectra of a dwarf nova in quiescence1 and in outburst is highly instructive, and has beendone with many X-ray satellites, most recently with Suzaku (Ishida et al., 2009). Figure 13 presents the XISspectra taken during the quiescence and outburst states which have apparently distinctive Fe Kα line profiles.
During quiescence, the fluorescent Fe Kα line is composed of two components. The narrow component isinterpreted as due to reflection off the WD surface and the broad component due to reflection off the inner disk.Given the equivalent widths of these component, the primary emission is from the BL and there is no room fora central hole in the disk. This important conclusion can be confirmed, and the quantitative results refined, witha relatively short ASTRO-H observation utilizing the high spectral resolution SXS.
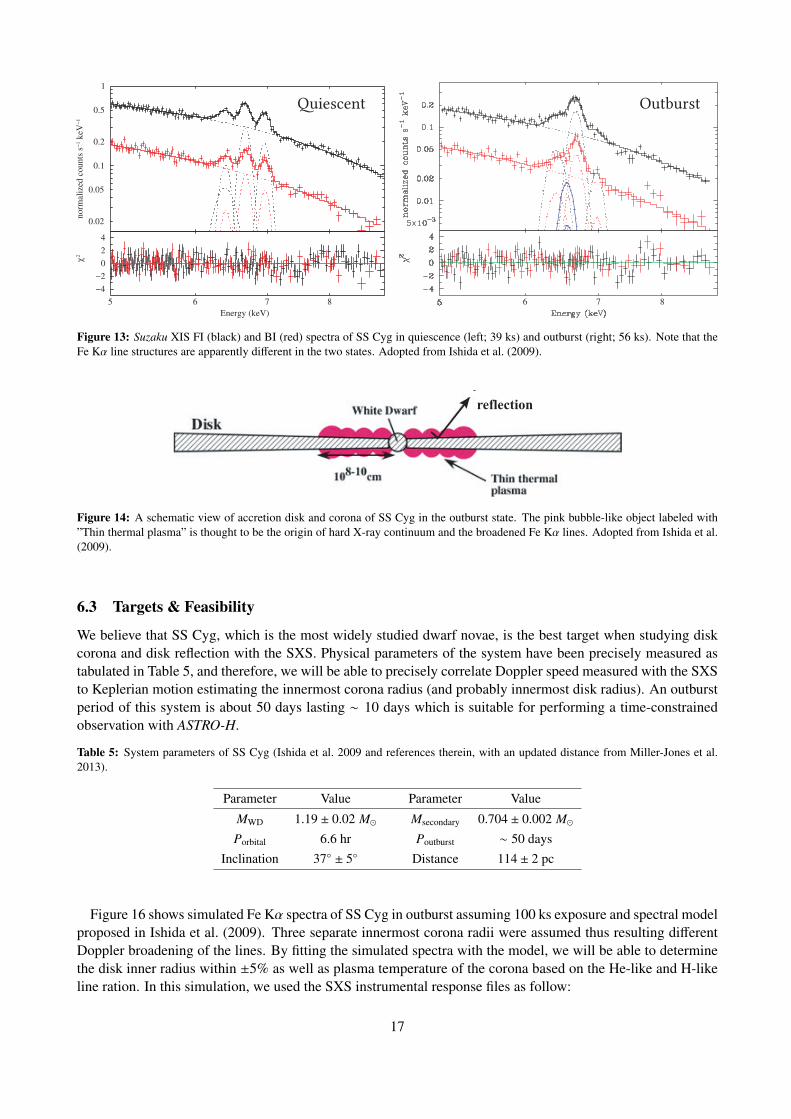
In contrast, the fluorescent line is much broader during outburst. Ishida et al. (2009) inferred from this thatthe Fe Kα lines and hard X-ray continuum are emitted from optically thin thermal plasma somewhere above theaccretion disk (namely disk corona) as illustrated in Figure 14, and the Fe Kα line profiles are double-peakeddue to Doppler red and blue shifts caused by rapid rotation of the accretion disk and the corona. Moreover, ifthe system has moderate inclination and the plasma places close enough to the WD, a part of X-ray is occultedby the WD as figure 15 and the double-peaked lines are additionally distorted.
By precisely measuring the line profiles with the SXS, we will be able to determine the line-of-sight velocityof the disk corona and geometrical size of the corona (from equivalent width of fluorescence Fe Kα). Thevelocity can be related with Keplerian rotation speed, and thus, the location of the corona will be estimatedenabling detailed study of disk corona which is not well understood in CVs.
1Quiescent and outburst in this section refer to those in optical wavelength. In conventional X-ray wavelength, e.g. in 2 − 10 keV,photon flux in quiescent state is higher than that of outburst state.
16
�iescent Outburst
Figure 13: Suzaku XIS FI (black) and BI (red) spectra of SS Cyg in quiescence (left; 39 ks) and outburst (right; 56 ks). Note that theFe Kα line structures are apparently different in the two states. Adopted from Ishida et al. (2009).
reflection
Figure 14: A schematic view of accretion disk and corona of SS Cyg in the outburst state. The pink bubble-like object labeled with”Thin thermal plasma” is thought to be the origin of hard X-ray continuum and the broadened Fe Kα lines. Adopted from Ishida et al.(2009).
6.3 Targets & Feasibility
We believe that SS Cyg, which is the most widely studied dwarf novae, is the best target when studying diskcorona and disk reflection with the SXS. Physical parameters of the system have been precisely measured astabulated in Table 5, and therefore, we will be able to precisely correlate Doppler speed measured with the SXSto Keplerian motion estimating the innermost corona radius (and probably innermost disk radius). An outburstperiod of this system is about 50 days lasting ∼ 10 days which is suitable for performing a time-constrainedobservation with ASTRO-H.
Table 5: System parameters of SS Cyg (Ishida et al. 2009 and references therein, with an updated distance from Miller-Jones et al.2013).
Parameter Value Parameter Value
MWD 1.19 ± 0.02 M� Msecondary 0.704 ± 0.002 M�Porbital 6.6 hr Poutburst ∼ 50 days
Inclination 37◦ ± 5◦ Distance 114 ± 2 pc
Figure 16 shows simulated Fe Kα spectra of SS Cyg in outburst assuming 100 ks exposure and spectral modelproposed in Ishida et al. (2009). Three separate innermost corona radii were assumed thus resulting differentDoppler broadening of the lines. By fitting the simulated spectra with the model, we will be able to determinethe disk inner radius within ±5% as well as plasma temperature of the corona based on the He-like and H-likeline ration. In this simulation, we used the SXS instrumental response files as follow:
17
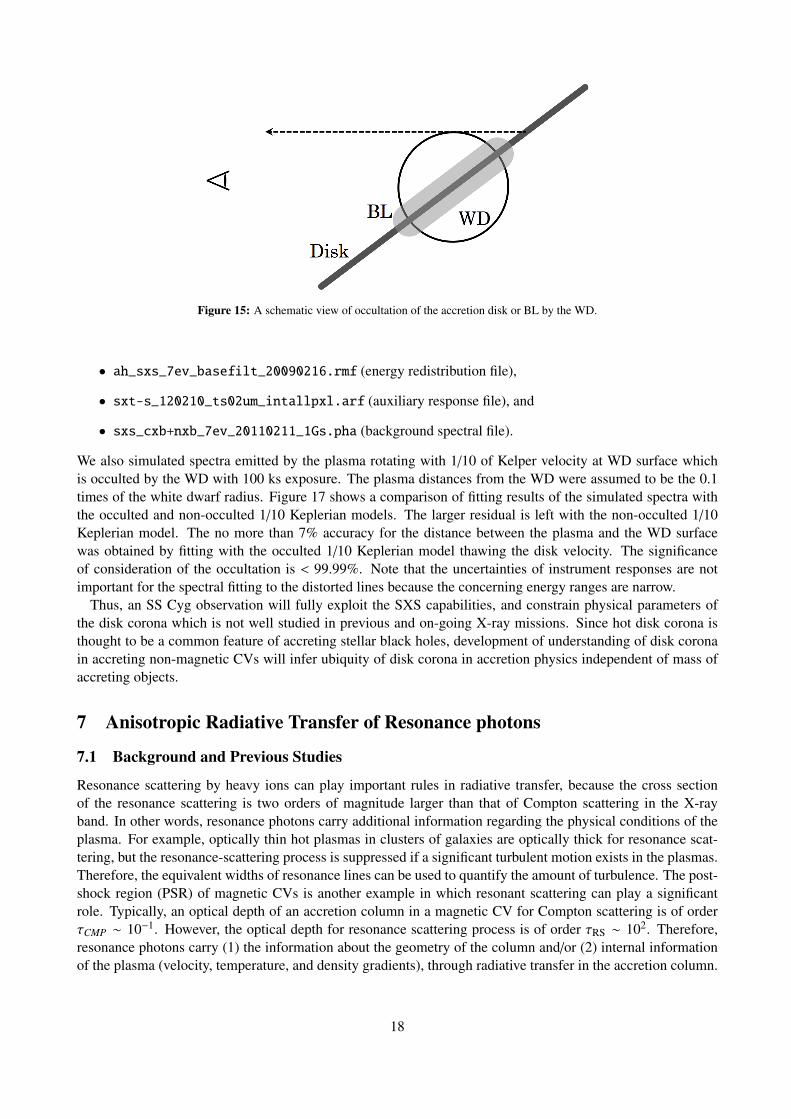
Figure 15: A schematic view of occultation of the accretion disk or BL by the WD.
• ah_sxs_7ev_basefilt_20090216.rmf (energy redistribution file),
• sxt-s_120210_ts02um_intallpxl.arf (auxiliary response file), and
• sxs_cxb+nxb_7ev_20110211_1Gs.pha (background spectral file).
We also simulated spectra emitted by the plasma rotating with 1/10 of Kelper velocity at WD surface whichis occulted by the WD with 100 ks exposure. The plasma distances from the WD were assumed to be the 0.1times of the white dwarf radius. Figure 17 shows a comparison of fitting results of the simulated spectra withthe occulted and non-occulted 1/10 Keplerian models. The larger residual is left with the non-occulted 1/10Keplerian model. The no more than 7% accuracy for the distance between the plasma and the WD surfacewas obtained by fitting with the occulted 1/10 Keplerian model thawing the disk velocity. The significanceof consideration of the occultation is < 99.99%. Note that the uncertainties of instrument responses are notimportant for the spectral fitting to the distorted lines because the concerning energy ranges are narrow.
Thus, an SS Cyg observation will fully exploit the SXS capabilities, and constrain physical parameters ofthe disk corona which is not well studied in previous and on-going X-ray missions. Since hot disk corona isthought to be a common feature of accreting stellar black holes, development of understanding of disk coronain accreting non-magnetic CVs will infer ubiquity of disk corona in accretion physics independent of mass ofaccreting objects.
7 Anisotropic Radiative Transfer of Resonance photons
7.1 Background and Previous Studies
Resonance scattering by heavy ions can play important rules in radiative transfer, because the cross sectionof the resonance scattering is two orders of magnitude larger than that of Compton scattering in the X-rayband. In other words, resonance photons carry additional information regarding the physical conditions of theplasma. For example, optically thin hot plasmas in clusters of galaxies are optically thick for resonance scat-tering, but the resonance-scattering process is suppressed if a significant turbulent motion exists in the plasmas.Therefore, the equivalent widths of resonance lines can be used to quantify the amount of turbulence. The post-shock region (PSR) of magnetic CVs is another example in which resonant scattering can play a significantrole. Typically, an optical depth of an accretion column in a magnetic CV for Compton scattering is of orderτCMP ∼ 10−1. However, the optical depth for resonance scattering process is of order τRS ∼ 102. Therefore,resonance photons carry (1) the information about the geometry of the column and/or (2) internal informationof the plasma (velocity, temperature, and density gradients), through radiative transfer in the accretion column.
18

Figure 16: Simulated SXS spectra of SS Cyg. Assumed exposure is 100-ks each, and three spectra were calculated for disk innerradius r of 100 RWD, 10 RWD, and 10 RWD from the top to the bottom.
0
0.5
1
Norm
aliz
ed c
ts s
−1 k
eV−
1
−4−2
024
χ
6.6 6.65 6.7 6.75 6.8
−4−2
024
χ
Energy (keV)
100 ksec
Occulted
Non−occulted
Figure 17: Top panel shows a simulated spectrum (black) for 100 ks exposure fitted with the occulted (red) and non-occulted (blue)1/10 Keplerian models. The middle and the bottom panel show residuals for the two models.
Compared with plasmas in clusters of galaxies, one advantage of magnetic CV observations is that we can scan
19
various viewing angles to the plasma using the spin of the WD.
accretion column
White Dwarf surface
standing shock
accretion flow
Low Opt. Depthfor resonance line
High Opt. Depthfor resonance line
Isotropiccontinumn
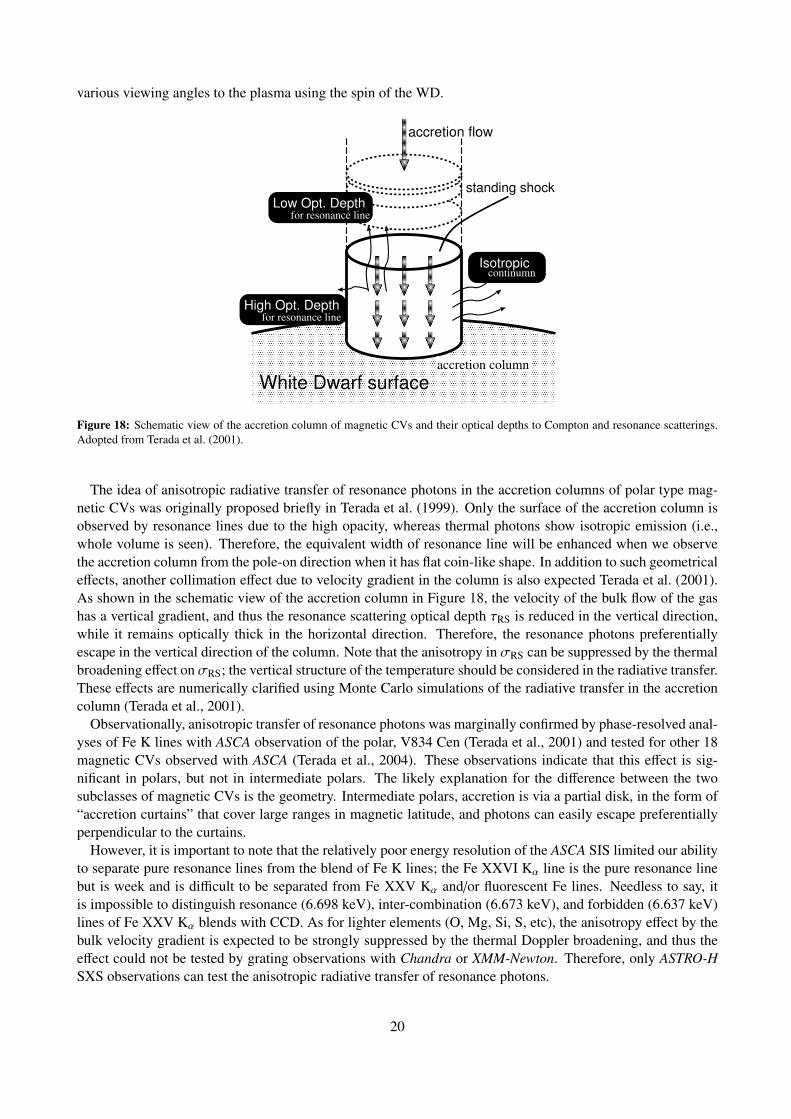
Figure 18: Schematic view of the accretion column of magnetic CVs and their optical depths to Compton and resonance scatterings.Adopted from Terada et al. (2001).
The idea of anisotropic radiative transfer of resonance photons in the accretion columns of polar type mag-netic CVs was originally proposed briefly in Terada et al. (1999). Only the surface of the accretion column isobserved by resonance lines due to the high opacity, whereas thermal photons show isotropic emission (i.e.,whole volume is seen). Therefore, the equivalent width of resonance line will be enhanced when we observethe accretion column from the pole-on direction when it has flat coin-like shape. In addition to such geometricaleffects, another collimation effect due to velocity gradient in the column is also expected Terada et al. (2001).As shown in the schematic view of the accretion column in Figure 18, the velocity of the bulk flow of the gashas a vertical gradient, and thus the resonance scattering optical depth τRS is reduced in the vertical direction,while it remains optically thick in the horizontal direction. Therefore, the resonance photons preferentiallyescape in the vertical direction of the column. Note that the anisotropy in σRS can be suppressed by the thermalbroadening effect on σRS; the vertical structure of the temperature should be considered in the radiative transfer.These effects are numerically clarified using Monte Carlo simulations of the radiative transfer in the accretioncolumn (Terada et al., 2001).
Observationally, anisotropic transfer of resonance photons was marginally confirmed by phase-resolved anal-yses of Fe K lines with ASCA observation of the polar, V834 Cen (Terada et al., 2001) and tested for other 18magnetic CVs observed with ASCA (Terada et al., 2004). These observations indicate that this effect is sig-nificant in polars, but not in intermediate polars. The likely explanation for the difference between the twosubclasses of magnetic CVs is the geometry. Intermediate polars, accretion is via a partial disk, in the form of“accretion curtains” that cover large ranges in magnetic latitude, and photons can easily escape preferentiallyperpendicular to the curtains.
However, it is important to note that the relatively poor energy resolution of the ASCA SIS limited our abilityto separate pure resonance lines from the blend of Fe K lines; the Fe XXVI Kα line is the pure resonance linebut is week and is difficult to be separated from Fe XXV Kα and/or fluorescent Fe lines. Needless to say, itis impossible to distinguish resonance (6.698 keV), inter-combination (6.673 keV), and forbidden (6.637 keV)lines of Fe XXV Kα blends with CCD. As for lighter elements (O, Mg, Si, S, etc), the anisotropy effect by thebulk velocity gradient is expected to be strongly suppressed by the thermal Doppler broadening, and thus theeffect could not be tested by grating observations with Chandra or XMM-Newton. Therefore, only ASTRO-HSXS observations can test the anisotropic radiative transfer of resonance photons.
20

7.2 Prospects & Strategy
0.3
0.4
0.5
0.6
0.7
0.8
0.9
1
2
3
0 10 20 30 40 50 60 70 80 90
pole angle (degrees)
no
rma
lize
d p
ho
ton
co
un
ts
Intercombination line
Uniform plasma
without Compton scattering
with Compton scattering
Figure 19: Angular distributions of resonance and inter-combination lines of Fe XXV Kα. Adopted from Terada et al. (2001).
According to the Monte Carlo simulation of radiative transfers of resonance and continuum photons in theaccretion column by Terada et al. (2001), we can expect a factor of 2 or 3 enhancement at maximum. Figure 19shows a distribution of photons as a function of the angle from the vertical axis of the column (pole angle; 0 and90 degrees mean pole-on and side-on views). For inter-combination lines, which must show isotropic emission,the photon flux has almost no dependency on the pole angle, as expected. On the other hand, resonance photonsis enhanced to the pole-on direction by factor 2 or 3, as illustrated in the vertical axis of the figure. For reference,the figure shows plots without Compton scattering or without vertical gradient of the bulk velocity.
By precise measurements of enhancement of resonance photons with the SXS, we can test the assumptionin the simulation on the structure of the plasma (i.e., the vertical gradient of the bulk velocity, temperature,and densities) independently from the measurements of the continuum or other lines described in the previoussections.
7.3 Targets & Feasibility
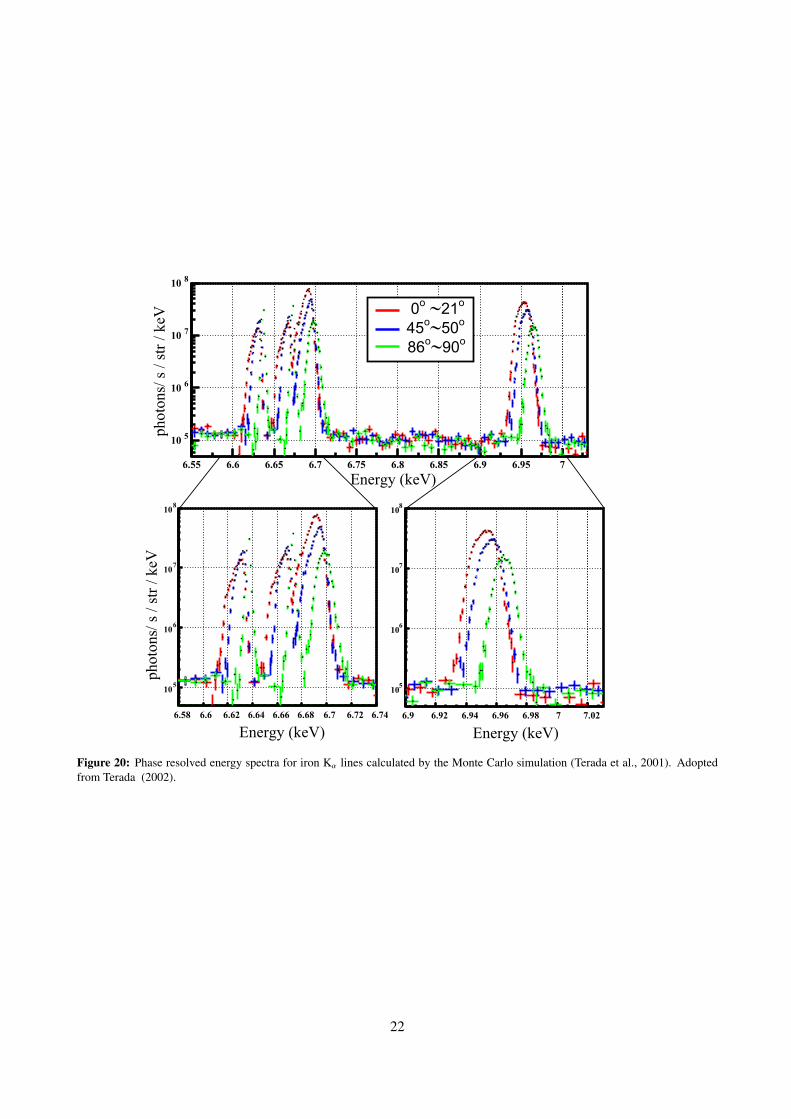
Figure 20 shows simulated phase-resolved X-ray spectra around Fe K band by the Monte Carlo simulation(Terada et al., 2001), under the assumption that we can observe the pole angle from 0 to 90 degrees. Thus, wecan expect the enhancement on the resonance line, as a function of Doppler shift by the vertical bulk motion ofthe gas. This is the direct verification of the anisotropic resonance-scattering effect.
We must select a target that allows us to observe a wide range of pole angles, using the tabulated values ofmagnetic colatitude β and the inclination angle i. They are summarized in Table 4 of Terada et al. (2001); by thiscriterion, the best candidates are VY For and EK UMa; AM Her, V834 Cen, and GG Leo (=RX J1015+09), arealso good candidates. Once we also considering the known hard X-ray fluxes, the latter three are more suitabletargets, however. In addition, polars are known to have low states in which the X-ray flux can drop by an orderof magnitude or more. An observation during a low state will likely be photon-starved and will not allow us totake advantage of the spectral resolution of the ASTRO-H SXS.
21
105
106
107
108
6.55 6.6 6.65 6.7 6.75 6.8 6.85 6.9 6.95 7
105
106
107
108
6.9 6.92 6.94 6.96 6.98 7 7.02
105
106
107
108
6.58 6.6 6.62 6.64 6.66 6.68 6.7 6.72 6.74
0o ∼21
o
86o∼90
o
45o∼50
o
Energy (keV)
photo
ns/
s /
str
/ k
eV
Energy (keV) Energy (keV)
photo
ns/
s /
str
/ k
eV
Figure 20: Phase resolved energy spectra for iron Kα lines calculated by the Monte Carlo simulation (Terada et al., 2001). Adoptedfrom Terada (2002).
22
ReferencesAizu, K. 1973, Prog. Theor. Phys 49, 1184
Cheng, F. H., Sion, E. M., Horne, K., Hubeny, I., Huang, M., &Vrtilek, S. D. 1997, AJ, 114, 1165
Done, C. & Magdziarz, P. 1998, MNRAS, 298, 737
Gabriel, A. H. & Jordan, C. 1969, MNRAS, 145, 241
Hayashi, T., Ishida, M., Terada, Y., Bamba, A., & Shionome, T.2011, PASJ, 63, 739
Hellier, C. 1997, MNRAS, 291, 71
Hoare, M. G., & Drew, J. E. 1991, MNRAS, 249, 452
Huang, M., Sion, E. M., Hubeny, I., Cheng, F. H., & Szkody, P.1996, ApJ, 458, 355
Ishida, M., Okada, S., Hayashi, T., Nakamura, R., Terada, Y.,Mukai, K., & Hamaguchi, K. 2009, PASJ, 61, S77
Kaastra, J. S., Mewe, R. & Nieuwenhuijzen, H. 1996, 11th Col-loquium on UV and X-ray Spectroscopy of Astrophysical andLaboratory Plasmas, 411
Kennea, J.A., Mukai, K., Sokoloski, J.L., Luna, G.J.M., Tueller,J., Markwardt, C.B., & Burrows, D.N. 2009, ApJ, 701, 1992
Kippenhahn, R., & Thomas, H.-C. 1978, A&A, 63, 265
Lasota, J.-P. 2001, New Astron. Rev. 45, 449
Mauche, C. W., Wade, R. A., Polidan, R. S., van der Woerd, H., &
Mauche, C. W., Raymond, J. C., & Mattei, J. A. 1995, ApJ, 446,842 Paerels, F. B. S. 1991, ApJ, 372, 659
Mauche, C.W., Liedahl, D.A., & Fournier, K.B. 2003, ApJ, 588,L101
Miller-Jones, J.C.A., Sivakoff, G.R., Knigge, C., Kording, E.G.,Templeton, M., & Waagen, E.O. 2013, Science, 340, 950
Mukai, K., Kallman, T., Schlegel, E., Bruch, A., Handler, G., &Kemp, J. ASPC, 251, 90
Nauenberg, M., 1972, ApJ, 175, 417
Palmeri, P., Mendoza, C., Kallman, T.R., Bautista, M.A. & Me-lendez, M. 2003, A&A, 410, 359
Pandel, D., Cordova, F. A., Mason, K. O., & Priedhorsky, W. C.2005, ApJ, 626, 396
Patterson, J. & Raymond, J.C. 1985, ApJ, 292, 535
Paczynski, B. 1978, in Nonstationary Evolution of Close Binaries,ed. A. Zytkow (Warsaw: Polish Academy of Science), 89
Porquet, D., Dubau, J., & Grosso, N., 2010, SSR, 157, 103
Revnivtsev, M., Lutovinov, A., Suleimanov, V., Sunyaev, R., &Zheleznyakov, V. 2004, A&A, 426, 253
Reis, R.C., Wheatley, P.J., Gansicke, B.T., & Osborne, J.P. 2013,MNRAS, 430, 1994
Sion, E. M., Cheng, F.-H., Huang, M., Hubeny, I., & Szkody, P.1996, ApJ, 471, L41
Shakura, N. I., & Sunyaev, R. A. 1973, A&A, 24, 337
Suleimanov, V., Revnivtsev, M. & Ritter, H. 2005, A&A, 435, 191
Szkody, P., Hoard, D. W., Sion, E. M., Howell, S. B., Cheng, F.H., & Sparks, W. M. 1998, ApJ, 497, 928
Terada, Y., Kaneda, H., Makishima, K., Ishida, M., MAtsuzaki,K., Nagase, F., & Kotani, T. 1999 PASJ 51, 39
Terada, Y., Ishida, M., Makishima, K., Imanari, T., Fujimoto, R.,Matsuzaki, K., & Kaneda, H. 2001, MNRAS, 328, 112
Terada, Y. 2002, Ph.D Thesis, University of Tokyo
Terada, Y., Ishida, M., & Makishima, K. 2004, PASJ, 56, 533
Werner, K., Rauch, T., Kruk, J.W. & Kurucz, R.L. 2011, A&A,531, A146
Yuasa, T., Nakazawa, K., Makishima, K., Saitou, K., Ishida, M.,Ebisawa, K., Mori, H., & Yamada, S. 2010, A&A, 520, A25
Yuasa, T. 2013, Springer Theses, ISBN13: 978-4431542186
23