astroinformatics - inaf-oac » homepage …brescia/documents/astroinfoedu/brescia_l1-e... · una...
TRANSCRIPT

Astroinformatics
http://dame.dsf.unina.it/astroinformatics.html

Science & Technology
2
Most of the first period has been spent to find a common language among members…
How astronomers see astroinformaticians
How astroinformaticians see astronomers
…with doubtful but promising results
The 4th paradigm
M. Brescia - Data Mining - lezione 1 3
Il recente riconoscimento a livello globale del concetto di Scienza data-centrica, ha indottouna rapida diffusione e proliferazione di nuove metodologie di data mining. Il concettochiave consegue dal quarto paradigma della Scienza moderna, ossia del "KnowledgeDiscovery in Databases" o KDD, dopo teoria, sperimentazione e simulazioni. Una delle causeprincipali è stata l'evoluzione della tecnologia e di tutte le scienze di base ed applicate, chefanno dell'esplorazione efficiente dei dati il principale mezzo per nuove scoperte.
Il data mining dunque si prefigge di gestire ed analizzare enormi quantità di dati eterogenei,avvalendosi di tecniche ed algoritmi auto-adattivi, afferenti al paradigma del MachineLearning.
Il presente corso intende quindi fornire i concetti fondamentali alla base della teoria del datamining, data warehousing e Machine Learning (reti neurali, logica Fuzzy, algoritmi genetici,Soft Computing), con tecniche pratiche derivanti dallo stato dell'arte dell'Information &Communication Technology (tecnologie web 2.0, calcolo distribuito e cenni allaprogrammazione su architetture parallele).
Il corso conterrà esempi di sviluppo di modelli di data mining, facendo uso di linguaggi diprogrammazione (C, C++, CUDA C);

Data Mining
M. Brescia - Data Mining - lezione 1 4
Data mining—core of knowledge discovery
process
Data Cleaning
Data Integration
Databases
Data Warehouse
Task-relevant Data
Selection
Data Mining
Pattern Evaluation
5
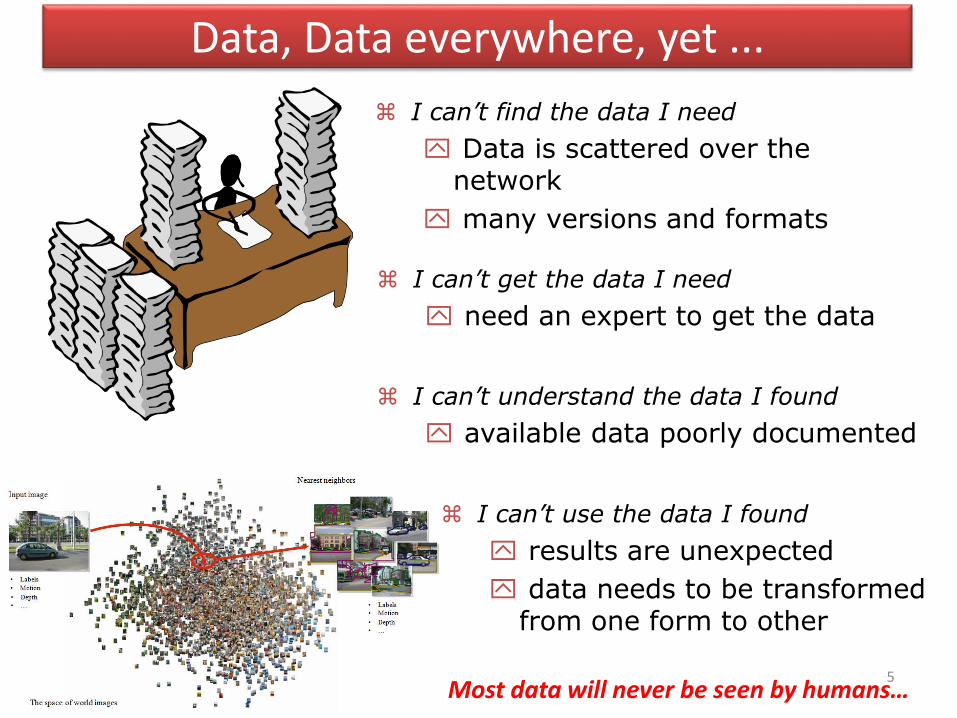
Data, Data everywhere, yet ...
I can’t get the data I need
need an expert to get the data
I can’t understand the data I found
available data poorly documented
I can’t use the data I found
results are unexpected
data needs to be transformed from one form to other
I can’t find the data I need
Data is scattered over the network
many versions and formats
Most data will never be seen by humans…
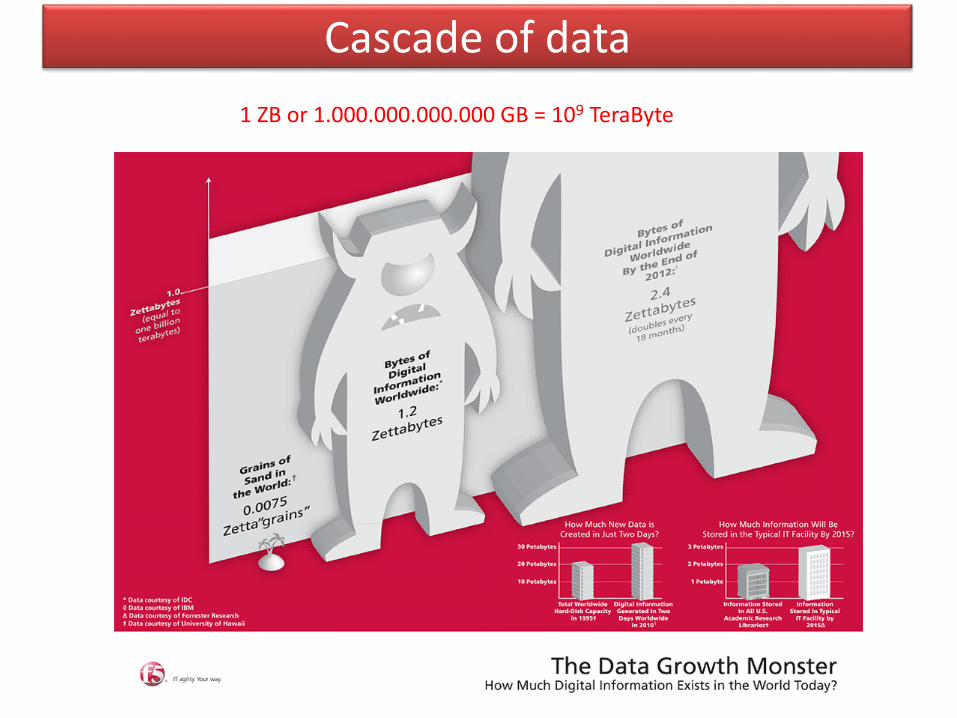
Cascade of data
1 ZB or 1.000.000.000.000 GB = 109 TeraByte

Tsunami of dataSmall, big, in a network, isolated … modern devices produce largeamounts of data and EACH DATA which is produced needs to bereduced, analyzed, interpreted…
Increase in number and size of devices or in efficiency or in number of bands … all cause an increase in pixels (worldwide)
Computing time and costs do not scale linearly with number of pixels
Moore law’s does not apply anymore. Slopes are changed.
International Technology Roadmap for Semiconductors

Tsunami of dataFor over two decades, before the advent of multi-core architectures,the general purpose CPUs have been characterized, at eachgeneration, by an almost linear increasing of performances togetherwith a decreasing of costs, also known as Moore’s Law (Moore 1965)
Increase in number and size of devices or in efficiency or in number of bands … all cause an increase in pixels (worldwide)
Computing time and costs do not scale linearly with number of pixels
So far, in order to maintain the cyclic hardware/software trend, the software applications had to change their perspective, moving towards parallel computing
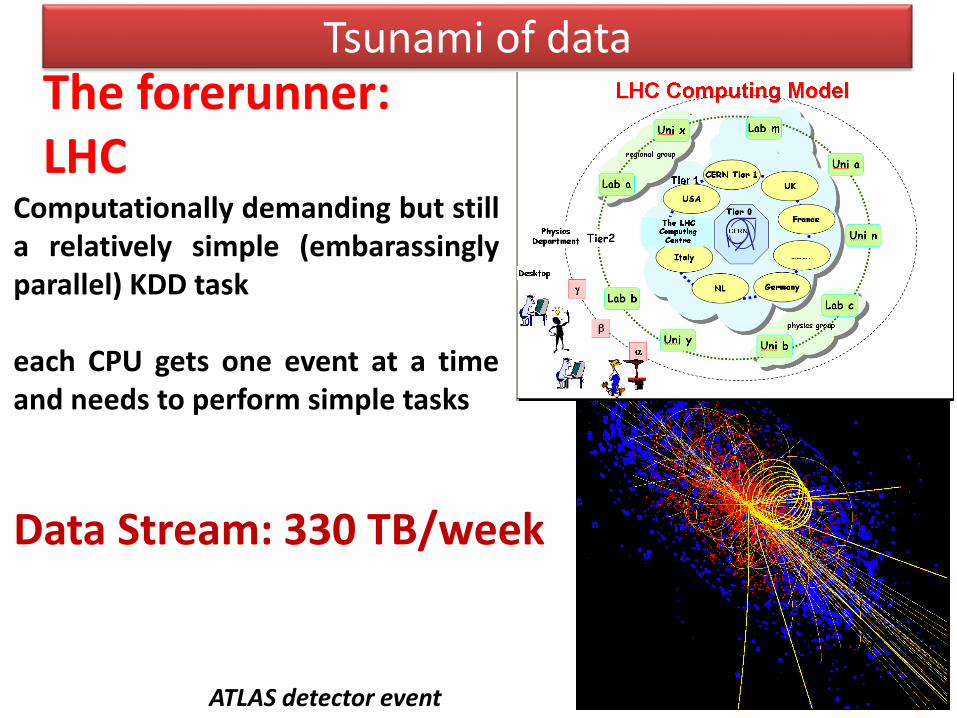
Tsunami of dataThe forerunner: LHC
Data Stream: 330 TB/week
ATLAS detector event
Computationally demanding but stilla relatively simple (embarassinglyparallel) KDD task
each CPU gets one event at a timeand needs to perform simple tasks
Tsunami of data
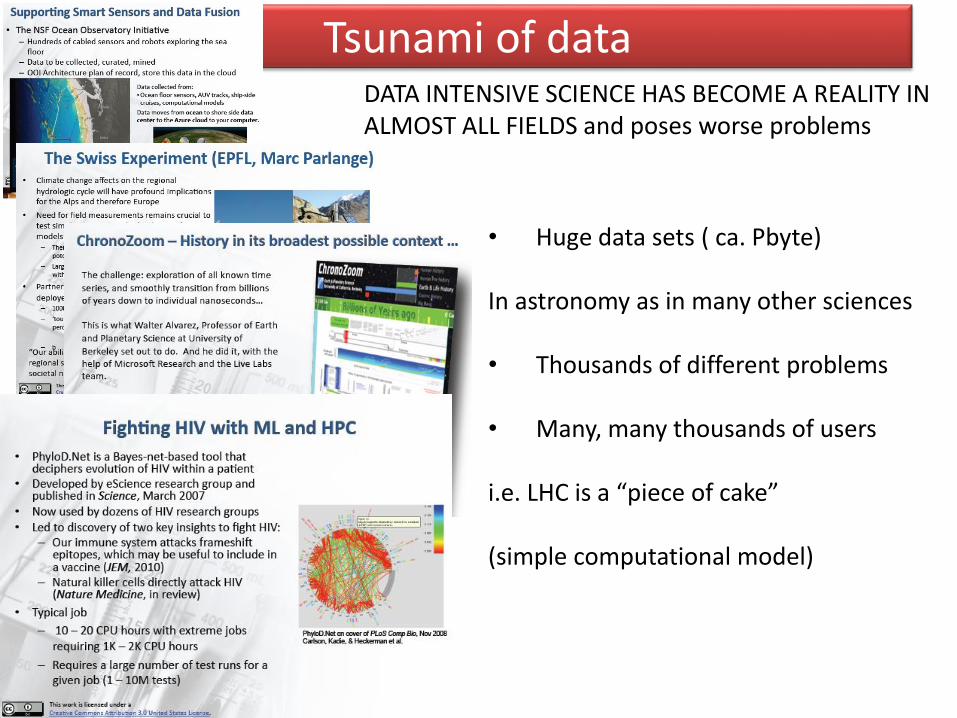
• Huge data sets ( ca. Pbyte)
In astronomy as in many other sciences
• Thousands of different problems
• Many, many thousands of users
i.e. LHC is a “piece of cake”
(simple computational model)
DATA INTENSIVE SCIENCE HAS BECOME A REALITY IN ALMOST ALL FIELDS and poses worse problems
Tsunami of data
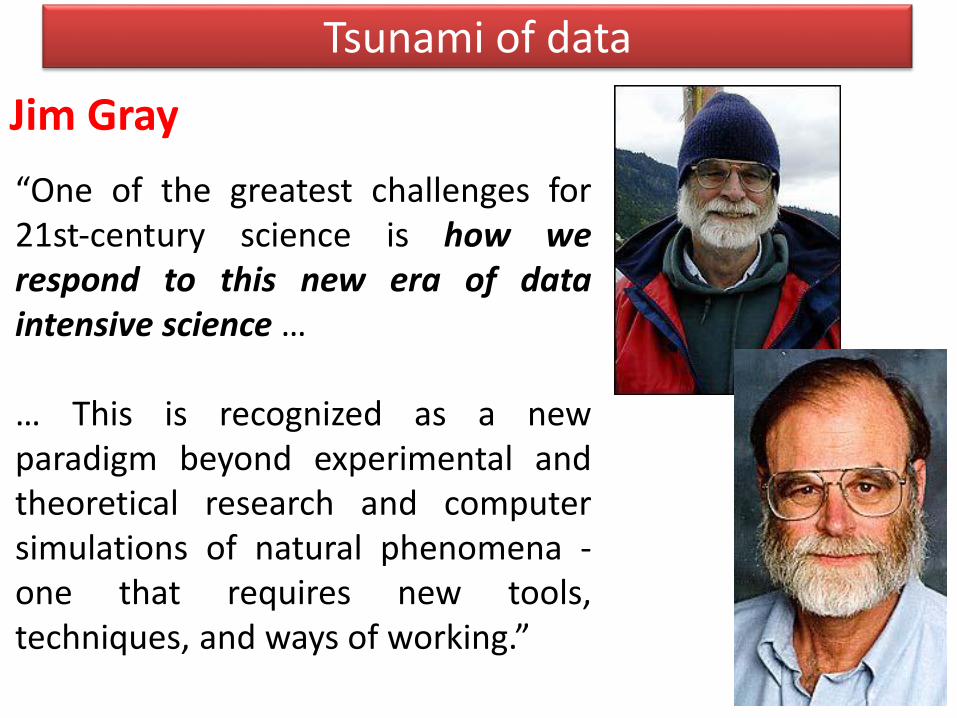
“One of the greatest challenges for21st‐century science is how werespond to this new era of dataintensive science …
… This is recognized as a newparadigm beyond experimental andtheoretical research and computersimulations of natural phenomena -one that requires new tools,techniques, and ways of working.”
Jim Gray
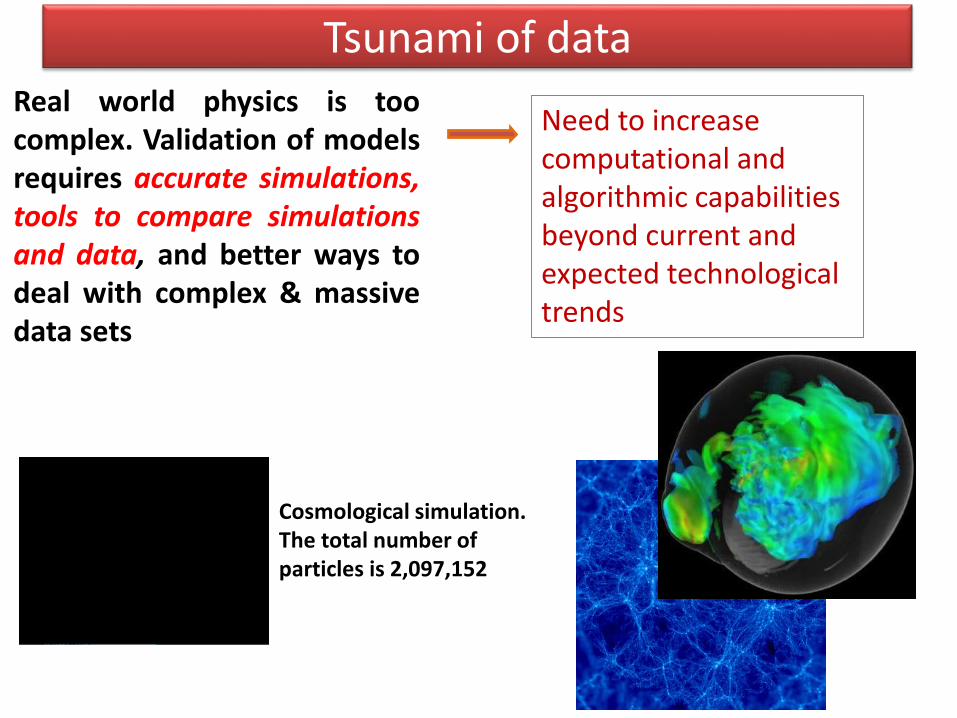
Tsunami of dataReal world physics is toocomplex. Validation of modelsrequires accurate simulations,tools to compare simulationsand data, and better ways todeal with complex & massivedata sets
Need to increase computational and algorithmic capabilities beyond current and expected technological trends
Cosmological simulation. The total number of particles is 2,097,152

ITC Revolution
Information & Communication Technologyrevolution is historically unprecedented -in its impact it is like the industrialrevolution and the invention of printingcombined
Yet, most fields of science and scholarship have notyet fully adopted the new ways of doing things, andin most cases do not understand them well…It is a matter of developing a new methodology ofscience and scholarship for the 21st century

eScience
What Is This Beast Called e-Science?
It depends on whom you ask, but somegeneral properties include:
• Computationally enabled• Data-intensive• Geographically distributed resources (i.e., Web-based)
However:
• All science in the 21st century is becoming cyber-science (aka e-Science) –so this is just a transitional phase• There is a great emerging synergy of the computationally enabled science,and the science-driven IT
Facing the Data Tsunami
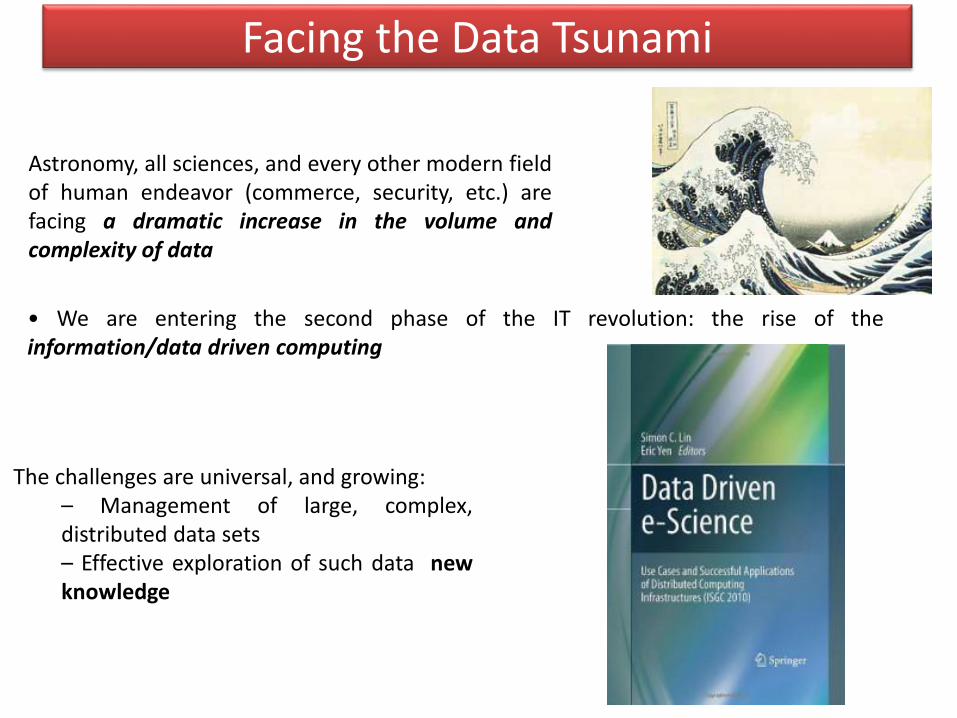
Astronomy, all sciences, and every other modern fieldof human endeavor (commerce, security, etc.) arefacing a dramatic increase in the volume andcomplexity of data
• We are entering the second phase of the IT revolution: the rise of theinformation/data driven computing
The challenges are universal, and growing:– Management of large, complex,distributed data sets– Effective exploration of such data newknowledge
An example: Astronomy
Astronomy Has Become Very Data-Rich• Typical digital sky survey now generates ~ 10 - 100 TB, plus acomparable amount of derived data products
– PB-scale data sets are on the horizon
LSST will produce a data stream of ~20 TB/night (1 million of transient eventsper night)
• Astronomy today has ~ 2PB of archived data, and generates a fewTB/day
– Both data volumes and data rates grow exponentially, with adoubling time ~ 1.5 years– Even more important is the growth of data complexity
• For comparison:Human memory ~ a few hundred MBHuman Genome < 1 GB1 TB ~ 2 million booksLibrary of Congress (print only) ~ 30 TB

The reaction
The Response of the Scientific Community to the IT Revolution
• The rise of Virtual Scientific Organizations:– Discipline-based, not institution based– Inherently distributed, and web-centric– Always based on deep collaborations between domain scientists and appliedCS/IT scientists and professionals– Based on an exponentially growing technology and thus rapidly evolvingthemselves– Do not fit into the traditional organizational structures– Great educational and public outreach potential
• However: Little or no coordination and interchange between different scientificdisciplines• Sometimes, entire new fields are created, e.g., bioinformatics, computational biology
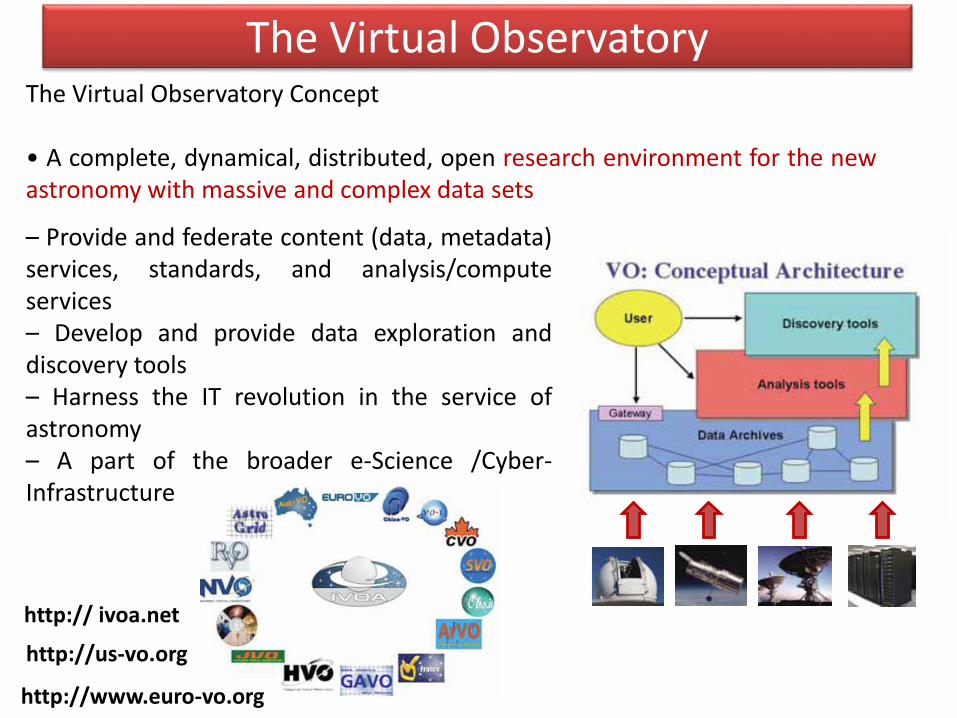
The Virtual ObservatoryThe Virtual Observatory Concept
• A complete, dynamical, distributed, open research environment for the newastronomy with massive and complex data sets
– Provide and federate content (data, metadata)services, standards, and analysis/computeservices– Develop and provide data exploration anddiscovery tools– Harness the IT revolution in the service ofastronomy– A part of the broader e-Science /Cyber-Infrastructure
http:// ivoa.net
http://us-vo.org
http://www.euro-vo.org
The world is flat
Professional Empowerment: Scientists and students anywhere with an internetconnection should be able to do a first-rate science (access to data and tools)– A broadening of the talent pool in astronomy, leading to a substantialdemocratization of the field
• They can also be substantial contributors, not only consumers
– Riding the exponential growth of the IT is far more cost effective than buildingexpensive hardware facilities, e.g., big telescopes, large accelerators, etc…– Especially useful for countries without major research facilities
Probably the most important aspect of the ITrevolution in science
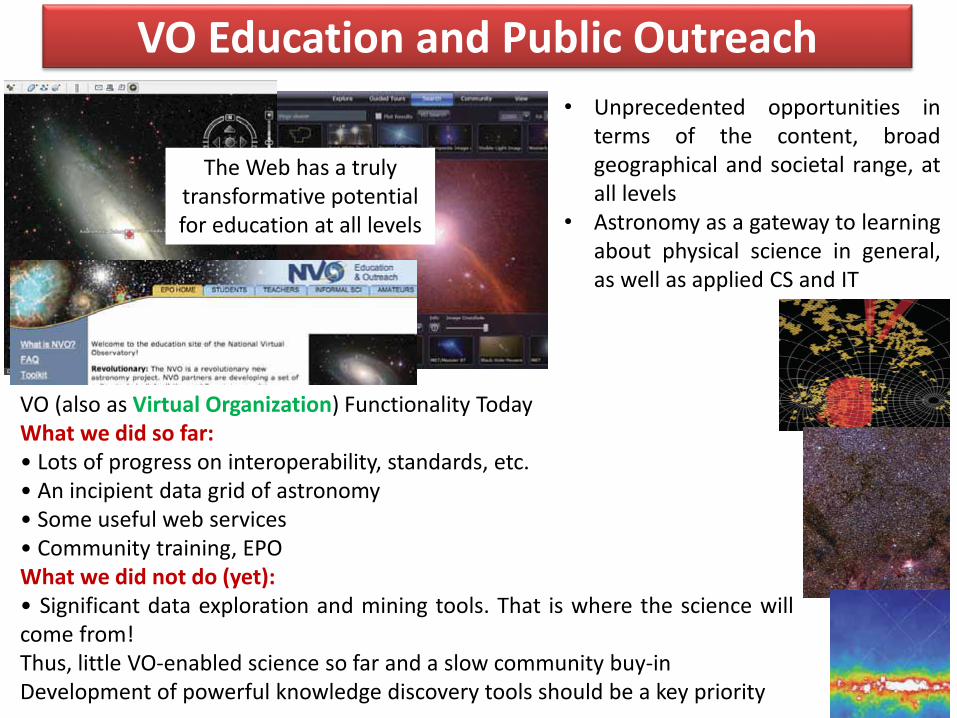
VO Education and Public Outreach
• Unprecedented opportunities interms of the content, broadgeographical and societal range, atall levels
• Astronomy as a gateway to learningabout physical science in general,as well as applied CS and IT
The Web has a trulytransformative potentialfor education at all levels
VO (also as Virtual Organization) Functionality TodayWhat we did so far:• Lots of progress on interoperability, standards, etc.• An incipient data grid of astronomy• Some useful web services• Community training, EPOWhat we did not do (yet):• Significant data exploration and mining tools. That is where the science willcome from!Thus, little VO-enabled science so far and a slow community buy-inDevelopment of powerful knowledge discovery tools should be a key priority
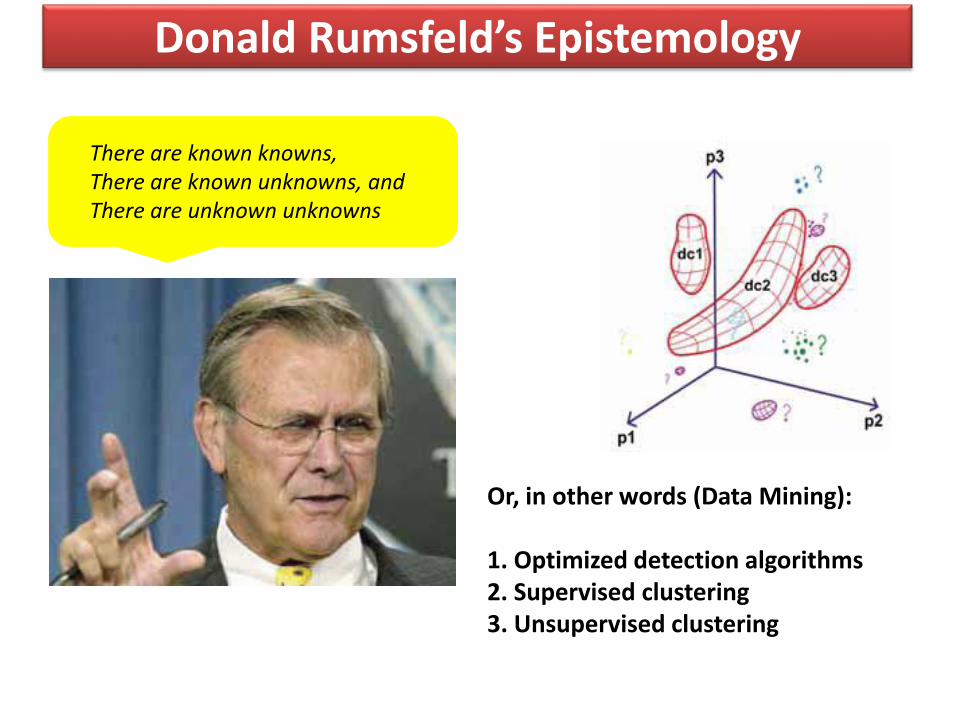
Donald Rumsfeld’s Epistemology
Or, in other words (Data Mining):
1. Optimized detection algorithms2. Supervised clustering3. Unsupervised clustering
There are known knowns,There are known unknowns, andThere are unknown unknowns

The Mixed Blessings of Data Richness
Modern digital sky surveys typically contain ~ 10 – 100 TB, detect Nobj ~ 108 - 109
sources, with D ~ 102 – 103 parameters measured for each one -- and multi-PB datasets are on the horizon
Nobj or data volume Big surveysNsurveys
2 (connections) Data federation
Great! However … DM algorithms scale very badly:– Clustering ~ N log N N2, ~ D2
– Correlations ~ N log N N2, ~ Dk (k 1)– Likelihood, Bayesian ~ Nm (m ≥ 3), ~ Dk (k ≥ 1)
Potential for discovery
Scalability and dimensionality reduction (without a significant loss of information) arecritical needs!

The Curse of Hyperdimensionality
Not a matter of hardwareor software, but new ideas
Visualization!
A fundamental limitation of the human perception: DMAX = 3? 5? 10?(We can understand mathematically much higher dimensionalities, butcannot really visualize them; our own Neural Nets are powerfulpattern recognition tools)
Interactive visualization must be a key part of the data mining process
Dimensionality reduction via machine discovery ofpatterns/substructures and correlations in the data?
DM Toolkit
VisualizationUser

Visualization
Effective visualization is the bridge between quantitativeinformation, and human intuition
L’uomo non è in grado di comprendere senzaimmagini; L’immagine è una similitudine di una cosa corporea, ma la comprensione è dell’universale astratto dai particolariAristotele, De Memoria et Reminiscentia
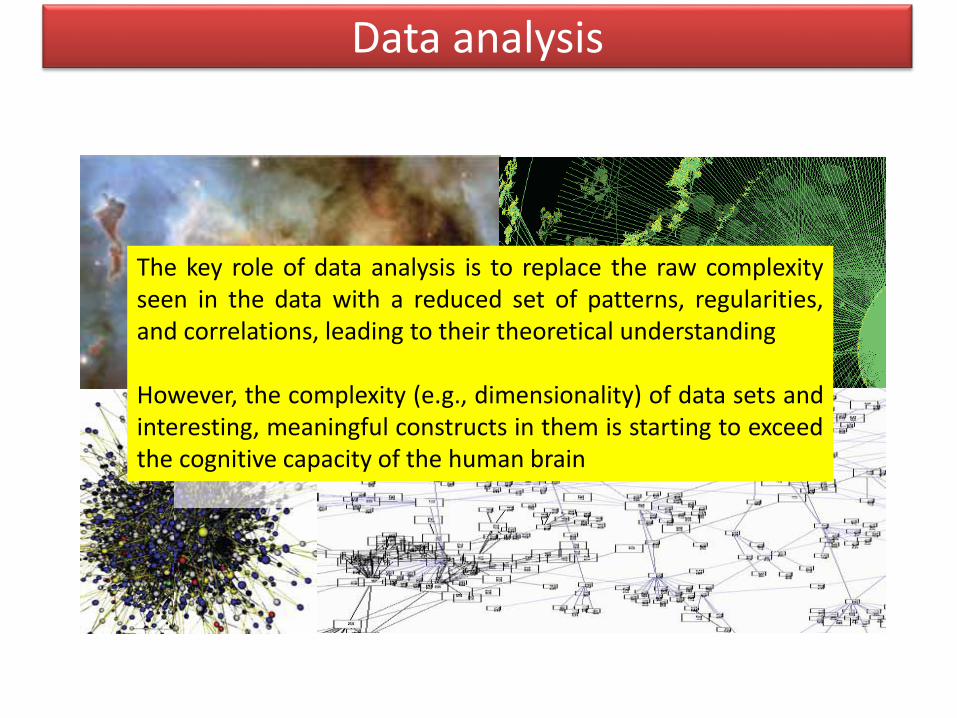
Data analysis
The key role of data analysis is to replace the raw complexityseen in the data with a reduced set of patterns, regularities,and correlations, leading to their theoretical understanding
However, the complexity (e.g., dimensionality) of data sets andinteresting, meaningful constructs in them is starting to exceedthe cognitive capacity of the human brain
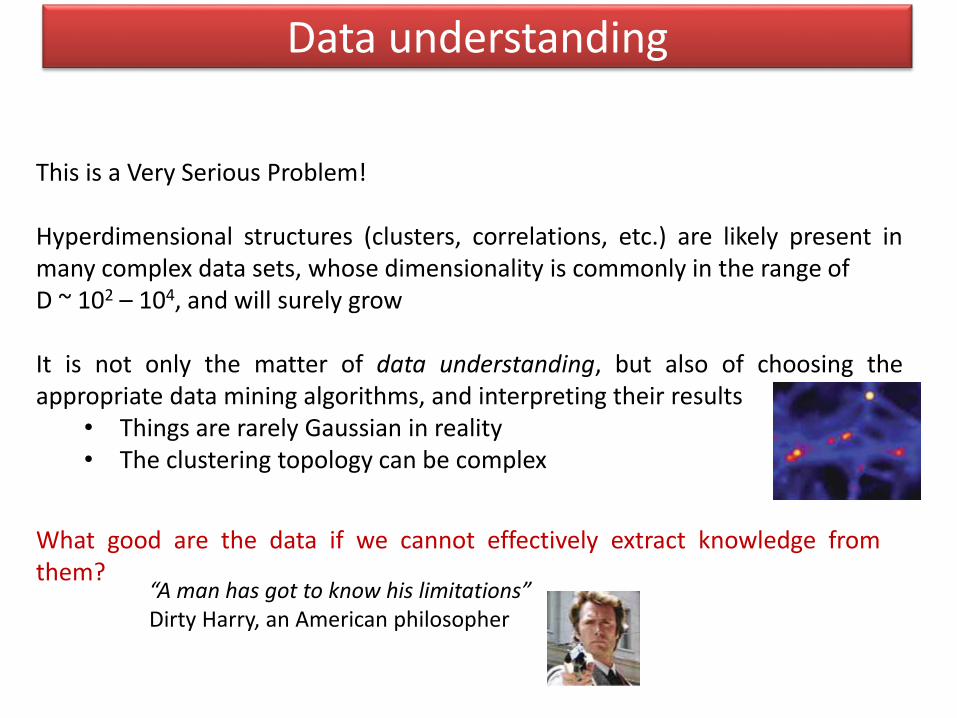
Data understanding
This is a Very Serious Problem!
Hyperdimensional structures (clusters, correlations, etc.) are likely present inmany complex data sets, whose dimensionality is commonly in the range ofD ~ 102 – 104, and will surely grow
It is not only the matter of data understanding, but also of choosing theappropriate data mining algorithms, and interpreting their results
• Things are rarely Gaussian in reality• The clustering topology can be complex
What good are the data if we cannot effectively extract knowledge fromthem?
“A man has got to know his limitations”Dirty Harry, an American philosopher

Knowledge Discovery in Databases

The new Science
Information Technology New Science
• The information volume grows exponentiallyMost data will never be seen by humans!The need for data storage, network, database-related technologies, standards,etc.
• Information complexity is also increasing greatlyMost data (and data constructs) cannot be comprehended by humansdirectly!The need for data mining, KDD, data understanding technologies,hyperdimensional visualization, AI/Machine-assisted discovery …
• We need to create a new scientific methodology on the basis of applied CSand IT
• Important for practical applications beyond science

Evolution of knowledge
The Evolving Paths to Knowledge
• The First Paradigm: Experiment/Measurement
• The Second Paradigm: Analytical Theory
• The Third Paradigm: Numerical Simulations
• The Fourth Paradigm: Data-Driven Science?

From numerical simulations…
Numerical Simulations:A qualitatively new (and necessary) wayof doing theory, beyond analyticalapproach
Formationof a cluster ofgalaxies
Turbulence in the Sun
Simulation output: a data set, the theoretical statement, not an equation

…to the fourth paradigm
Is this really something qualitatively new, rather than the same old dataanalysis, but with more data?
The information content of modern data sets is so high as toenable discoveries which were not envisioned by the dataoriginators (data mining)
Data fusion reveals new knowledge which was implicitlypresent, but not recognizable in the individual data sets
Complexity threshold for a human comprehension of complexdata constructs? Need new methods to make the dataunderstanding possible (machine learning)
Data Fusion + Data Mining + Machine Learning = The FourthParadigm
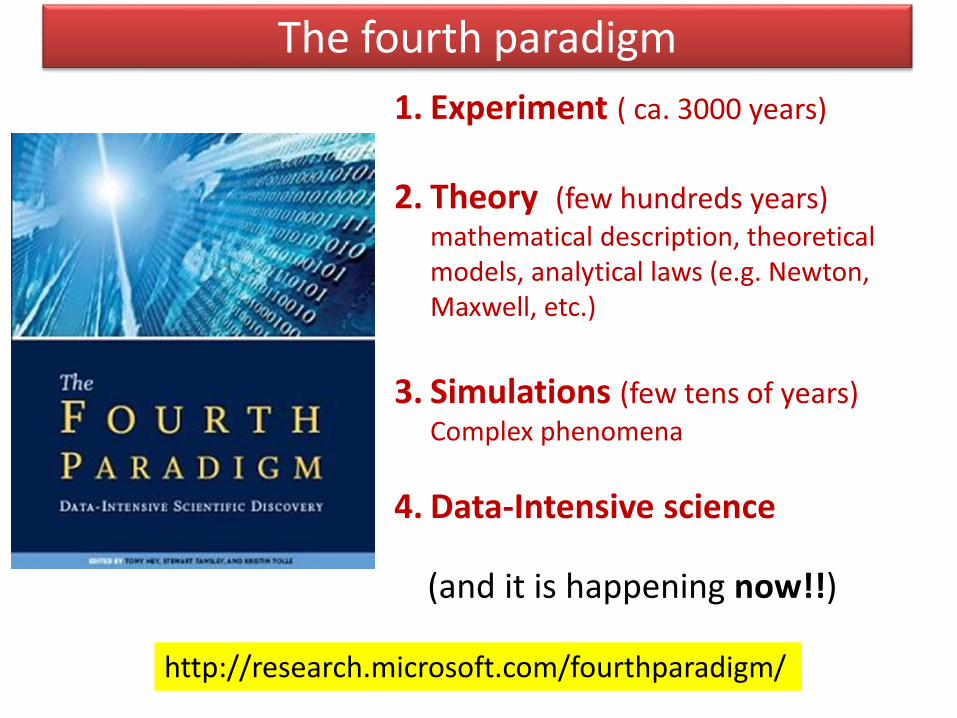
The fourth paradigm
1. Experiment ( ca. 3000 years)
2. Theory (few hundreds years) mathematical description, theoreticalmodels, analytical laws (e.g. Newton, Maxwell, etc.)
3. Simulations (few tens of years) Complex phenomena
4. Data-Intensive science
(and it is happening now!!)
http://research.microsoft.com/fourthparadigm/
Machine Learning
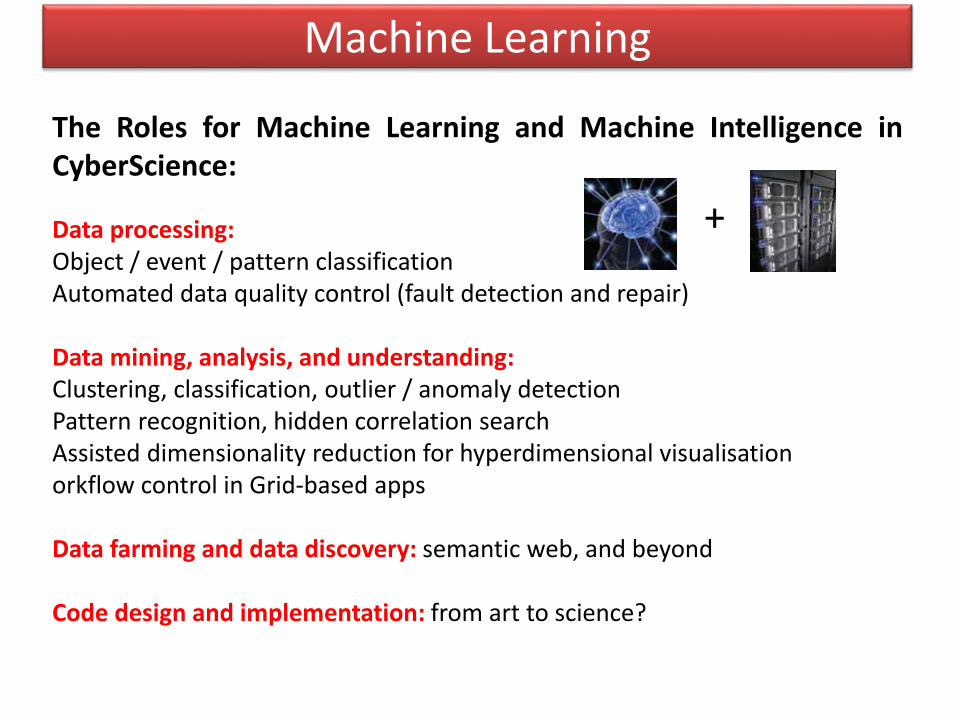
The Roles for Machine Learning and Machine Intelligence inCyberScience:
Data processing:Object / event / pattern classificationAutomated data quality control (fault detection and repair)
Data mining, analysis, and understanding:Clustering, classification, outlier / anomaly detectionPattern recognition, hidden correlation searchAssisted dimensionality reduction for hyperdimensional visualisationorkflow control in Grid-based apps
Data farming and data discovery: semantic web, and beyond
Code design and implementation: from art to science?
+
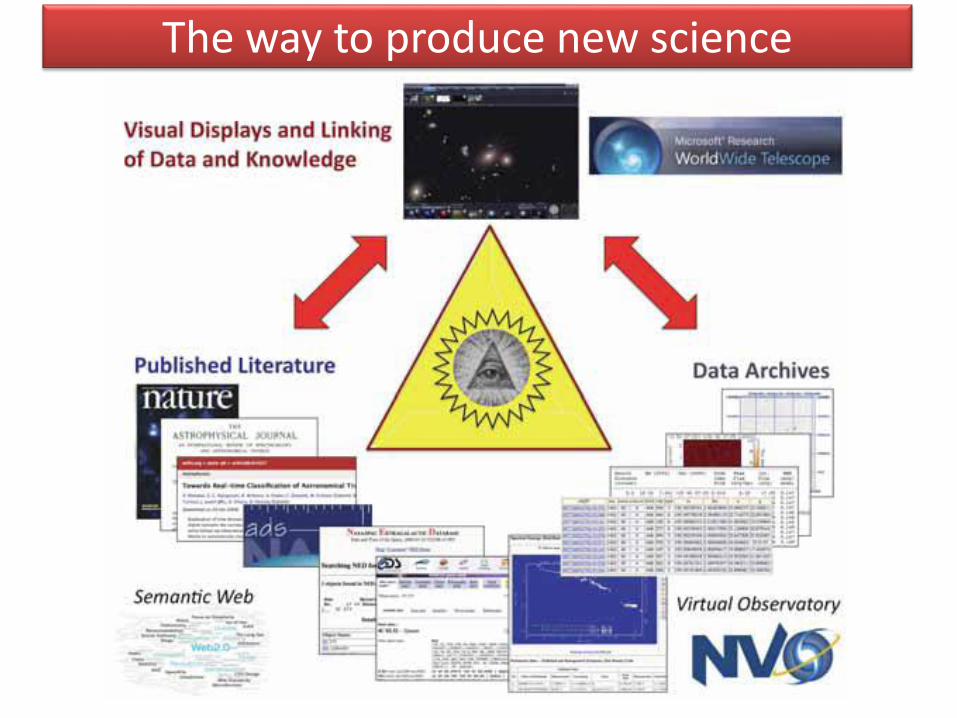
The way to produce new science

The old and the new
The Book and the Cathedral …
… and
the Web, and the Computer
Technologies for informationstorage and access areevolving, and so does scholarlypublishing
Origins of discovery
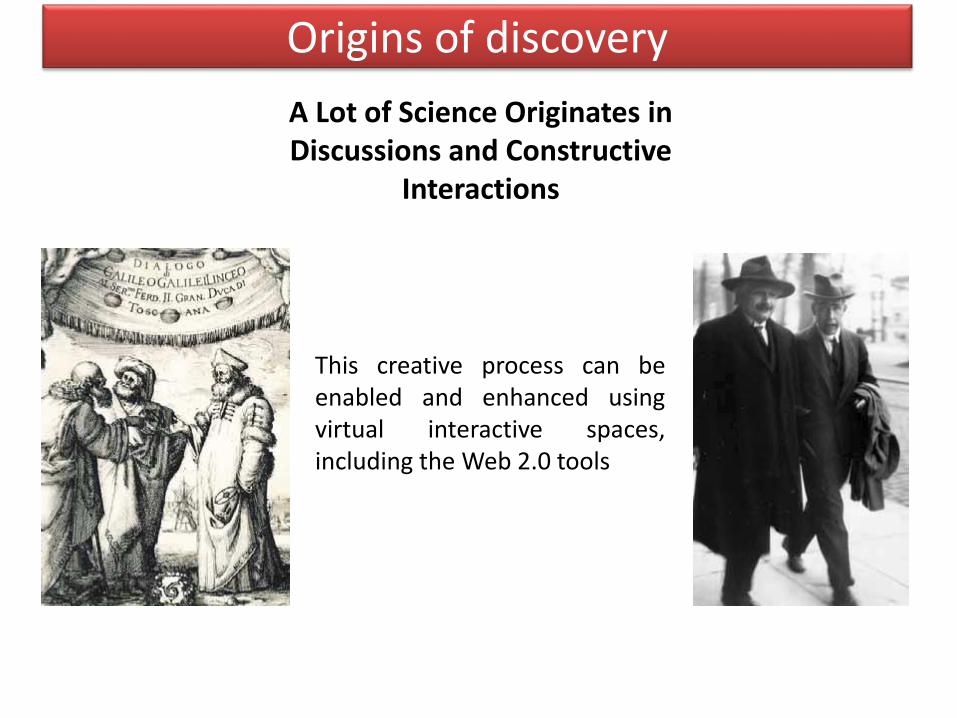
A Lot of Science Originates in Discussions and Constructive
Interactions
This creative process can beenabled and enhanced usingvirtual interactive spaces,including the Web 2.0 tools

Computing as a Communication Tool
With the advent of the Web, most of the computing usage is notin a number crunching, but in a search, manipulation, and displayof data and information, and increasingly also for humaninteractions (e.g., much of Web 2.0)

Information as communication
Information Technology as a Communication Medium: Social Networking and Beyond
• Science originates on the interface between human minds, and the human minds anddata (measurements, structured information, output of simulations)
• Thus, any technology which facilitates these interactions is an enabling technology forscience, scholarship, and intellectual progress more generally
• Virtual Worlds (or immersive VR) are one such technology, and will likely revolutionizethe ways in which we interact with each other, and with the world of information wecreate
• Thus, we started the Meta-Institute for Computational Astrophysics (MICA), the firstprofessional scientific organization based entirely in VWs (Second life)
Subjective experience quality much higherthan traditional videoconferencing (and itcan only get better as VR improves)Effective worldwide telecommuting, at ~zero costProfessional conferences easily organized,at ~ zero cost
http://slurl.com/secondlife/StellaNova

Immersive data visualization
Encode up to a dozen dimensions for a parameter space representationInteractive data exploration in a pseudo-3D environment
Multicolor SDSS data set onstars, galaxies and quasars
Immersive mathematical visualization
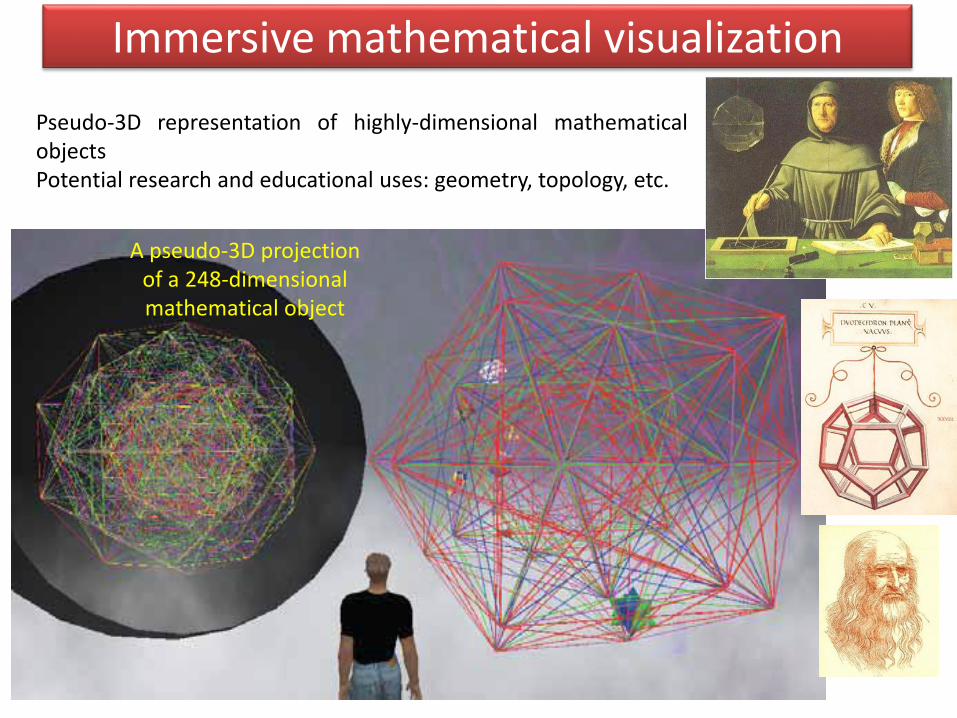
Pseudo-3D representation of highly-dimensional mathematicalobjectsPotential research and educational uses: geometry, topology, etc.
A pseudo-3D projectionof a 248-dimensionalmathematical object

The Core business of Academia
To discover, preserve, and disseminate knowledge To serve as a source of scientific and technological innovation To educate the new generations, in terms of the knowledge, skills, and tools
But when it comes to the adoption of computational tools and methods, innovation,and teaching them to our students, we are doing very poorly – and yet, the science andthe economy of the 21st century depend critically on these issues
Is the discrepancy of time scalesto blame for this slow uptake?
IT ~ 2 years Education ~ 20 years Career ~ 50 years Universities ~ 200 years
(Are universities obsolete?)
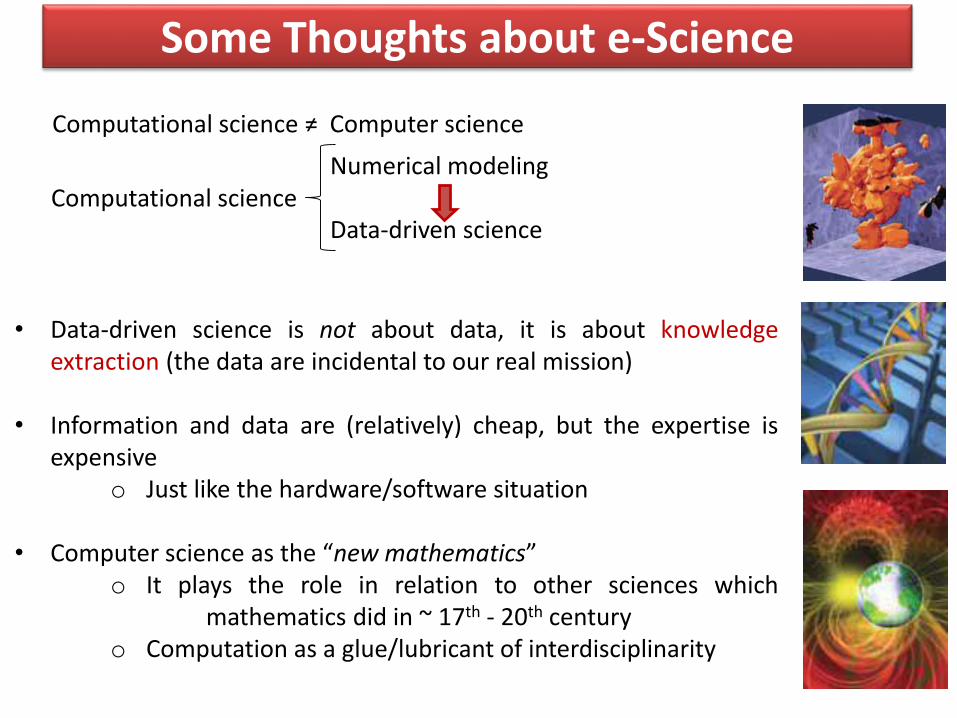
Some Thoughts about e-Science
Computational science ≠ Computer science
Numerical modeling
Data-driven scienceComputational science
• Data-driven science is not about data, it is about knowledgeextraction (the data are incidental to our real mission)
• Information and data are (relatively) cheap, but the expertise isexpensive
o Just like the hardware/software situation
• Computer science as the “new mathematics”o It plays the role in relation to other sciences which
mathematics did in ~ 17th - 20th centuryo Computation as a glue/lubricant of interdisciplinarity
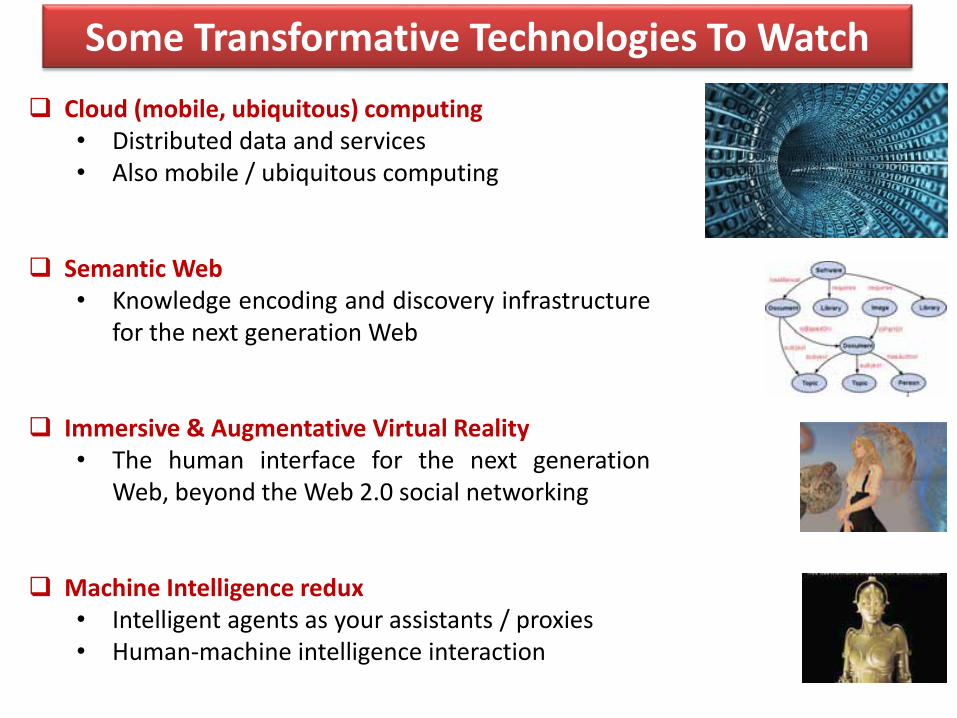
Some Transformative Technologies To Watch
Cloud (mobile, ubiquitous) computing• Distributed data and services• Also mobile / ubiquitous computing
Semantic Web• Knowledge encoding and discovery infrastructure
for the next generation Web
Immersive & Augmentative Virtual Reality• The human interface for the next generation
Web, beyond the Web 2.0 social networking
Machine Intelligence redux• Intelligent agents as your assistants / proxies• Human-machine intelligence interaction
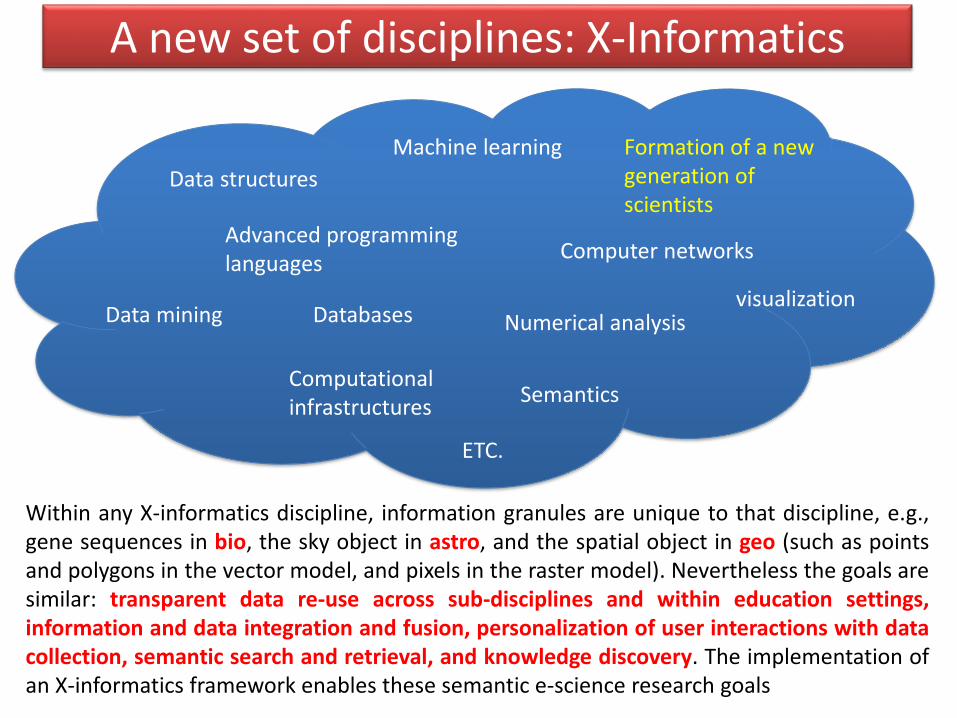
A new set of disciplines: X-Informatics
Databases
Data structures
Computationalinfrastructures
Computer networks
Numerical analysisData mining
Machine learning
Advanced programminglanguages
Semantics
visualization
Formation of a newgeneration of scientists
ETC.
Within any X-informatics discipline, information granules are unique to that discipline, e.g.,gene sequences in bio, the sky object in astro, and the spatial object in geo (such as pointsand polygons in the vector model, and pixels in the raster model). Nevertheless the goals aresimilar: transparent data re-use across sub-disciplines and within education settings,information and data integration and fusion, personalization of user interactions with datacollection, semantic search and retrieval, and knowledge discovery. The implementation ofan X-informatics framework enables these semantic e-science research goals

Some Speculations
We create technology, and it changes us, starting with the grasping of sticksand rocks as primitive tools, and continuing ever since
When the technology touches our minds, that process can have profoundevolutionary impact in the long term
Development of AI seems inevitable, and its uses in assisting us with theinformation management and knowledge discovery are already starting
In the long run, immersive VR may facilitate the co-evolution of human andmachine intelligence
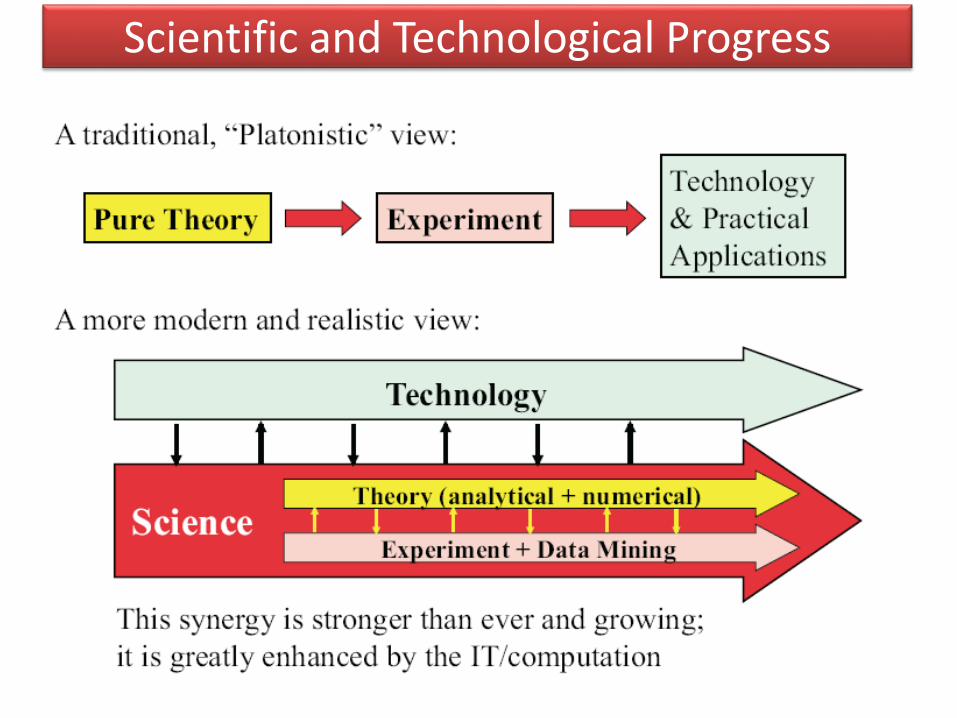
Scientific and Technological Progress

Mining of Warehouse Data
Data Mining + Data Warehouse = Mining of Warehouse Data
• For organizational learning to take place, data from must be gathered together
and organized in a consistent and useful way – hence, Data Warehousing (DW);
• DW allows an organization to remember what it has noticed about its data;
• Data Mining techniques should be interoperable with data organized in a DW.
VOregistries
Etc…
Observations Etc…
Simulations
DataWarehouse
Enterprise “Database”
Transactions
Copied, organizedsummarized
Data Mining
Data Miners:• “Farmers” – they know• “Explorers” - unpredictable

DM 4-rule virtuous cycle
• Finding patterns is not enough
• Science business must:
– Respond to patterns by taking action
– Turning:
• Data into Information
• Information into Action
• Action into Value
• Hence, the Virtuous Cycle of DM:
1. Identify the problem
2. Mining data to transform it into actionable information
3. Acting on the information
4. Measuring the results
• Virtuous cycle implementation steps:
– Transforming data into informationvia:
• Hypothesis testing
• Profiling
• Predictive modeling
– Taking action
• Model deployment
• Scoring
– Measurement
• Assessing a model’s stability &effectiveness before it is used

DM: 11-step Methodology
1. Translate any opportunity (science case) into DM opportunity (problem)
2. Select appropriate data
3. Get to know the data
4. Create a model set
5. Fix problems with the data
6. Transform data to bring information
7. Build models
8. Assess models
9. Deploy models
10. Assess results
11. Begin again (GOTO 1)
The four rules reflect into an 11-step exploded strategy, at the base of DAME (Data Analysis, Mining and Exploration) concept

Why Mine Data? Commercial Viewpoint
• Lots of data is being collected and warehoused – Web data, e-commerce
– purchases at department/stores
– Bank/Credit Card transactions
• Computers have become cheaper and more powerful
• Competitive Pressure is Strong – Provide better, customized services for an edge (e.g. in Customer
Relationship Management)
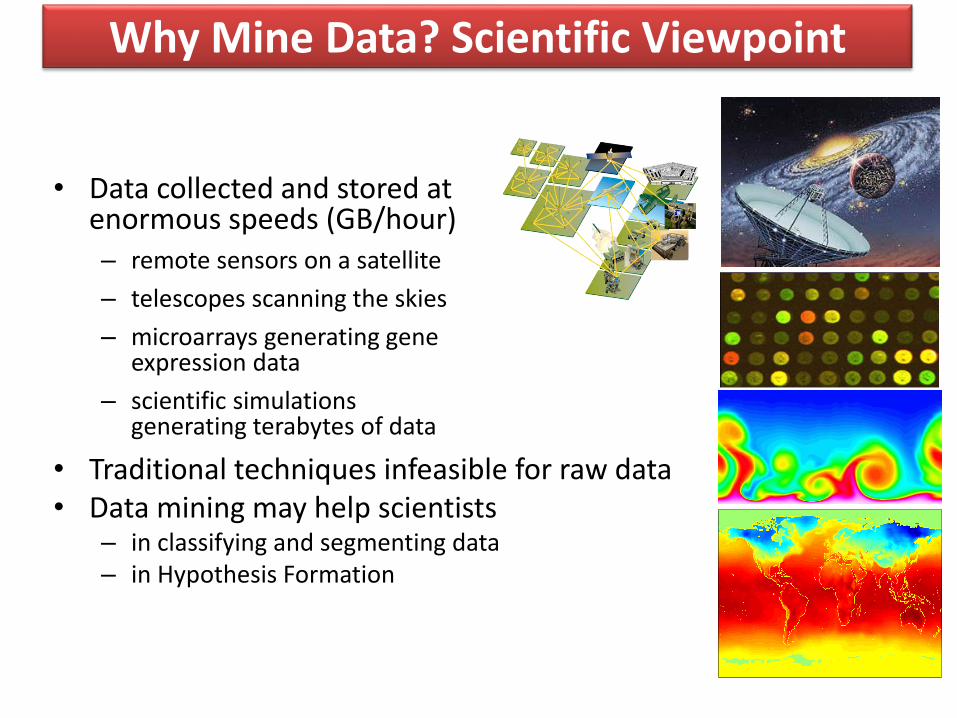
Why Mine Data? Scientific Viewpoint
• Data collected and stored at enormous speeds (GB/hour)– remote sensors on a satellite
– telescopes scanning the skies
– microarrays generating gene expression data
– scientific simulations generating terabytes of data
• Traditional techniques infeasible for raw data• Data mining may help scientists
– in classifying and segmenting data– in Hypothesis Formation

Terminology
• Components of the input:– Concepts: kinds of things that can be learned
• Aim: intelligible and operational concept description
– Instances: the individual, independent examples of a concept
• Note: more complicated forms of input are possible
– Features/Attributes: measuring aspects of an instance
• We will focus on nominal and numeric ones
– Patterns: ensemble (group/list) of features
• In a same dataset, a group of patterns are usually in a homogeneous format (same number, meaning and type of features)
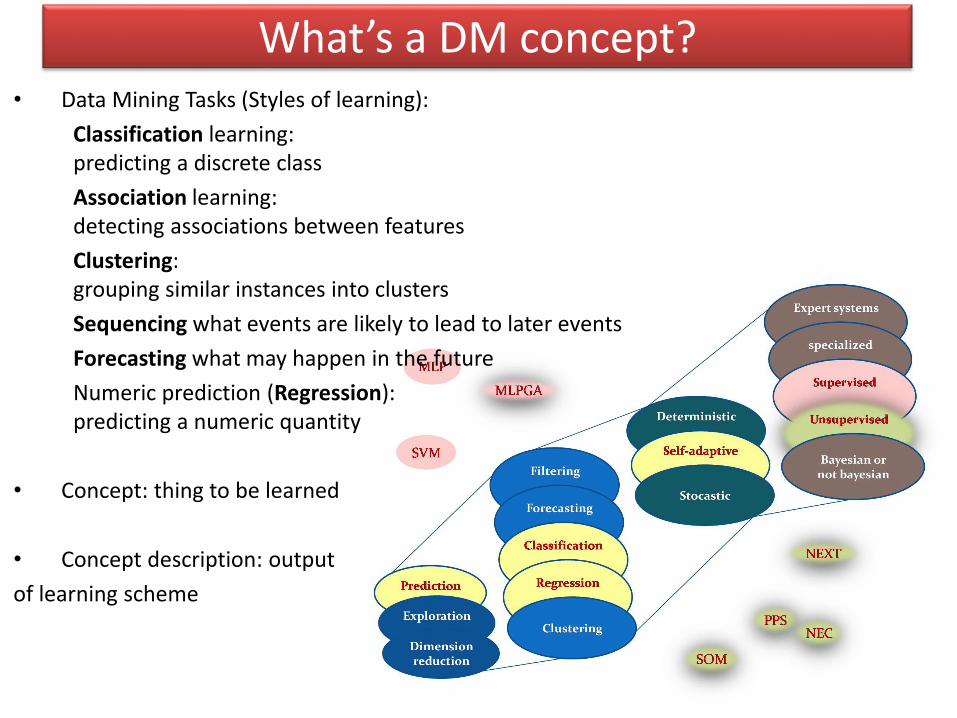
What’s a DM concept?• Data Mining Tasks (Styles of learning):
Classification learning:predicting a discrete class
Association learning:detecting associations between features
Clustering:grouping similar instances into clusters
Sequencing what events are likely to lead to later events
Forecasting what may happen in the future
Numeric prediction (Regression):predicting a numeric quantity
• Concept: thing to be learned
• Concept description: output
of learning scheme
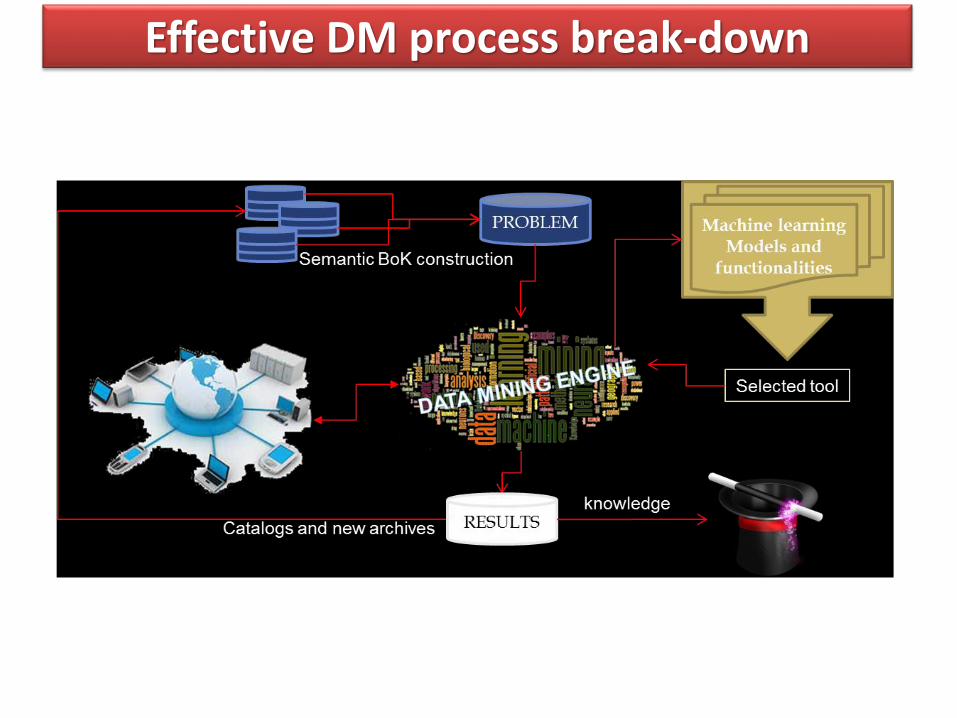
Effective DM process break-down

Market Analysis and Management
• Where does the data come from?—Credit card transactions, loyalty cards, discount coupons, customer complaint calls, plus (public) lifestyle studies
• Target marketing
– Find clusters of “model” customers who share the same characteristics: interest, income level, spending habits, etc.,
– Determine customer purchasing patterns over time
• Cross-market analysis—Find associations/co-relations between product sales, & predict based on such association
• Customer profiling—What types of customers buy what products (clustering or classification)
• Customer requirement analysis
– Identify the best products for different customers
– Predict what factors will attract new customers
• Provision of summary information
– Multidimensional summary reports
– Statistical summary information (data central tendency and variation)

Data quality and integrity problems
• Legacy systems no longer documented
• Outside sources with questionable quality procedures
• Production systems with no built in integrity checks and no integration
– Operational systems are usually designed to solve a specific business problem
and are rarely developed to a a corporate plan
• “And get it done quickly, we do not have time to worry about corporate
standards...”
• Same person, different spellings
– Agarwal, Agrawal, Aggarwal etc...
• Multiple ways to denote company name
– Persistent Systems, PSPL, Persistent Pvt. LTD.
• Use of different names
– mumbai, bombay
• Different account numbers generated by different applications for the same customer
• Required fields left blank
• Invalid product codes collected at point of sale
– manual entry leads to mistakes
– “in case of a problem use 9999999”
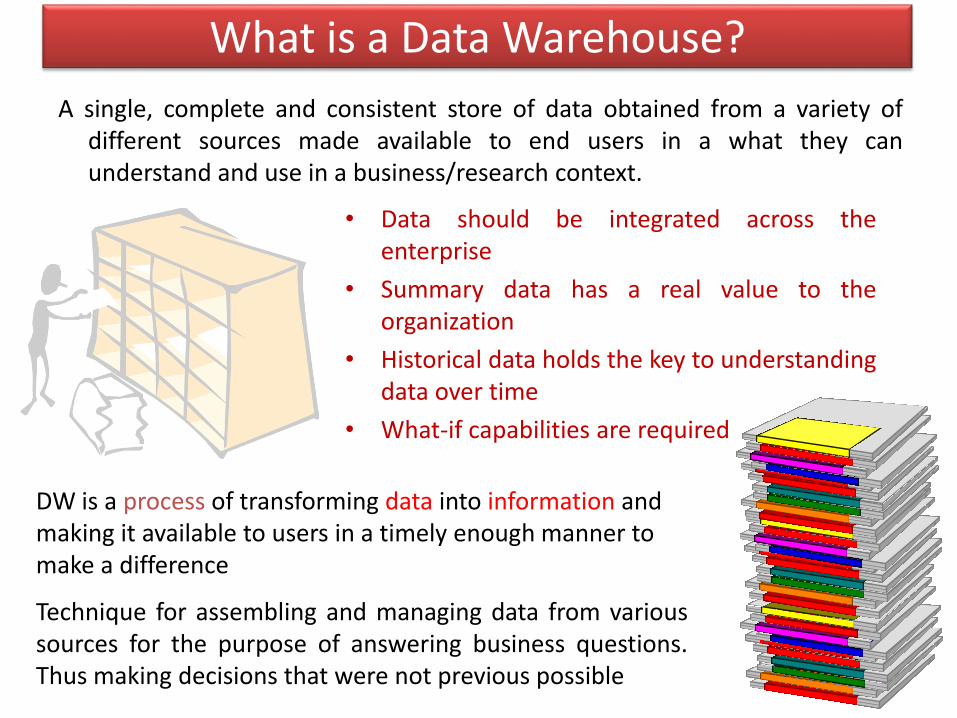
What is a Data Warehouse?
A single, complete and consistent store of data obtained from a variety ofdifferent sources made available to end users in a what they canunderstand and use in a business/research context.
• Data should be integrated across theenterprise
• Summary data has a real value to theorganization
• Historical data holds the key to understandingdata over time
• What-if capabilities are required
DW is a process of transforming data into information and making it available to users in a timely enough manner to make a difference
Technique for assembling and managing data from varioussources for the purpose of answering business questions.Thus making decisions that were not previous possible

The evolution of data analysis
Evolutionary Step
Business Question
Enabling
Technologies
Product Providers
Characteristics
Data Collection (1960s)
"What was my total
revenue in the last
five years?"
Computers, tapes,
disks
IBM, CDC
Retrospective,
static data delivery
Data Access (1980s)
"What were unit
sales in New
England last
March?"
Relational
databases
(RDBMS),
Structured Query
Language (SQL),
ODBC
Oracle, Sybase,
Informix, IBM,
Microsoft
Retrospective,
dynamic data
delivery at record
level
Data
Warehousing &
Decision Support
(1990s)
"What were unit
sales in New
England last
March? Drill down
to Boston."
On-line analytic
processing
(OLAP),
multidimensional
databases, data
warehouses
SPSS, Comshare,
Arbor, Cognos,
Microstrategy,NCR
Retrospective,
dynamic data
delivery at multiple
levels
Data Mining
(Emerging Today)
"What’s likely to
happen to Boston
unit sales next
month? Why?"
Advanced
algorithms,
multiprocessor
computers, massive
databases
SPSS/Clementine,
Lockheed, IBM,
SGI, SAS, NCR,
Oracle, numerous
startups
Prospective,
proactive
information
delivery
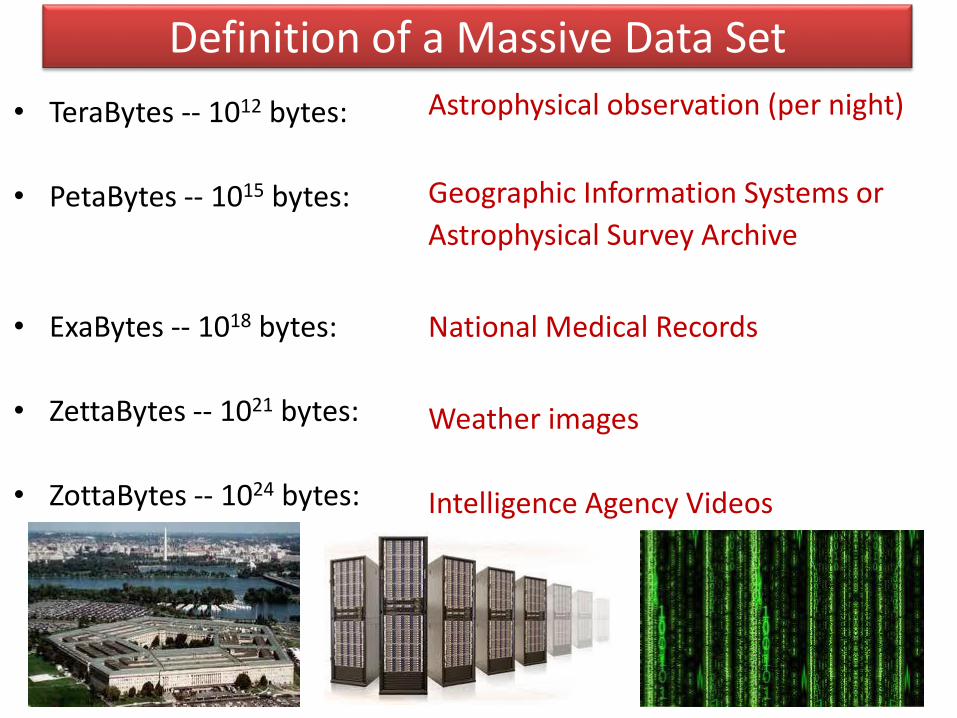
Definition of a Massive Data Set
• TeraBytes -- 1012 bytes:
• PetaBytes -- 1015 bytes:
• ExaBytes -- 1018 bytes:
• ZettaBytes -- 1021 bytes:
• ZottaBytes -- 1024 bytes:
Astrophysical observation (per night)
Geographic Information Systems or
Astrophysical Survey Archive
National Medical Records
Weather images
Intelligence Agency Videos

DM, Operational systems and DW
What makes data mining possible?
• Advances in the following areas are making data mining deployable:– data warehousing
– Operational systems
– the emergence of easily deployed data mining tools and
– the advent of new data mining techniques (Machine Learning)
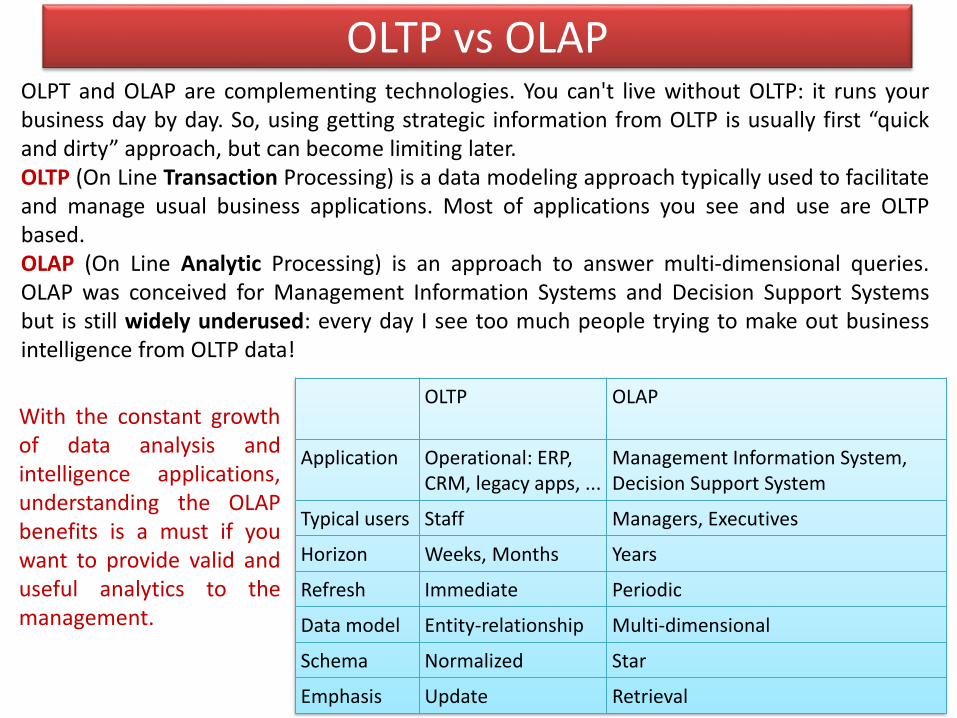
OLTP vs OLAP
OLTP OLAP
Application Operational: ERP, CRM, legacy apps, ...
Management Information System, Decision Support System
Typical users Staff Managers, Executives
Horizon Weeks, Months Years
Refresh Immediate Periodic
Data model Entity-relationship Multi-dimensional
Schema Normalized Star
Emphasis Update Retrieval
OLPT and OLAP are complementing technologies. You can't live without OLTP: it runs yourbusiness day by day. So, using getting strategic information from OLTP is usually first “quickand dirty” approach, but can become limiting later.OLTP (On Line Transaction Processing) is a data modeling approach typically used to facilitateand manage usual business applications. Most of applications you see and use are OLTPbased.OLAP (On Line Analytic Processing) is an approach to answer multi-dimensional queries.OLAP was conceived for Management Information Systems and Decision Support Systemsbut is still widely underused: every day I see too much people trying to make out businessintelligence from OLTP data!
With the constant growthof data analysis andintelligence applications,understanding the OLAPbenefits is a must if youwant to provide valid anduseful analytics to themanagement.

Examples of OLTP data systems
Data Industry Usage Technology Volumes
CustomerFile
All TrackCustomerDetails
Legacy application, flatfiles, main frames
Small-medium
AccountBalance
Finance Controlaccountactivities
Legacy applications,hierarchical databases,mainframe
Large
Point-of-Sale data
Retail Generatebills, managestock
ERP, Client/Server,relational databases
Very Large
CallRecord
Telecomm-unications
Billing Legacy application,hierarchical database,mainframe
Very Large
ProductionRecord
Manufact-uring
ControlProduction
(ERP) Enterprise Resource Planning,
relational databases
Medium
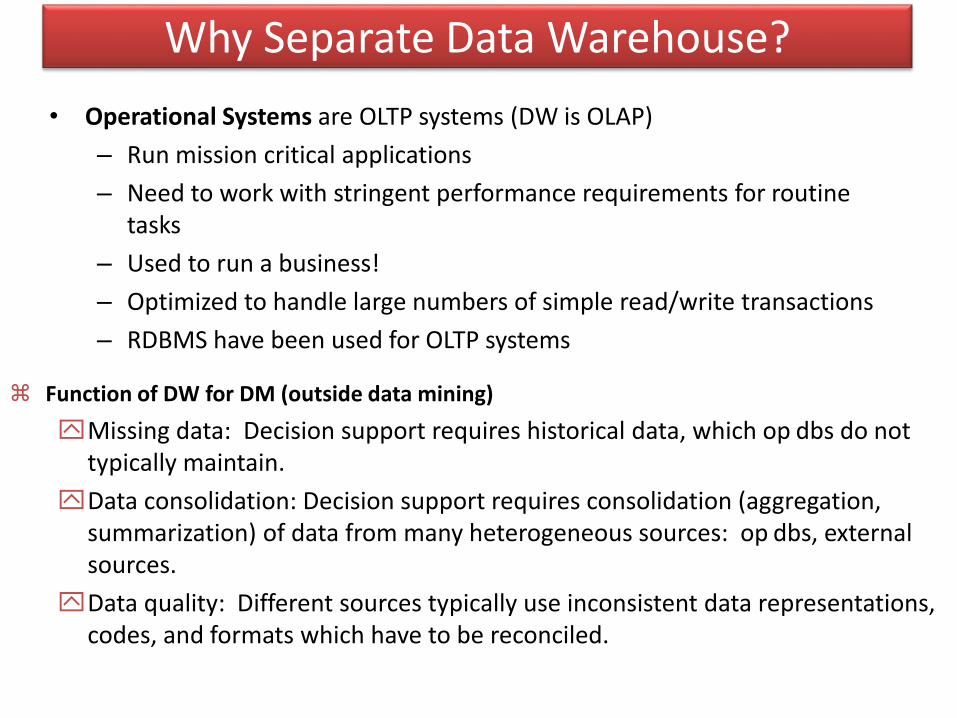
Why Separate Data Warehouse?
Function of DW for DM (outside data mining)
Missing data: Decision support requires historical data, which op dbs do not typically maintain.
Data consolidation: Decision support requires consolidation (aggregation, summarization) of data from many heterogeneous sources: op dbs, external sources.
Data quality: Different sources typically use inconsistent data representations, codes, and formats which have to be reconciled.
• Operational Systems are OLTP systems (DW is OLAP)
– Run mission critical applications
– Need to work with stringent performance requirements for routine tasks
– Used to run a business!
– Optimized to handle large numbers of simple read/write transactions
– RDBMS have been used for OLTP systems

So, what’s different?
Application-Orientation vs. Subject-Orientation
Application-Orientation
Operational Database
LoansCredit Card
Trust
Savings
Subject-Orientation
DataWarehouse
Customer
Vendor
Product
Activity

OLTP vs Data Warehouse
• OLTP (run a business)
– Application Oriented
– Used to run business
– Detailed data
– Current up to date
– Isolated Data
– Repetitive access
– Office worker User
• Warehouse (optimize a business)
– Subject Oriented
– Used to analyze business
– Summarized and refined
– Snapshot data
– Integrated Data
– Ad-hoc access
– Knowledge User (Manager)
– Performance Sensitive
– Few Records accessed at a time (tens)
– Read/Update Access
– No data redundancy
– Database Size 100MB -100GB
– Performance relaxed
– Large volumes accessed at a time (millions)
– Mostly Read (Batch Update)
– Redundancy present
– Database Size 100 GB – few TB
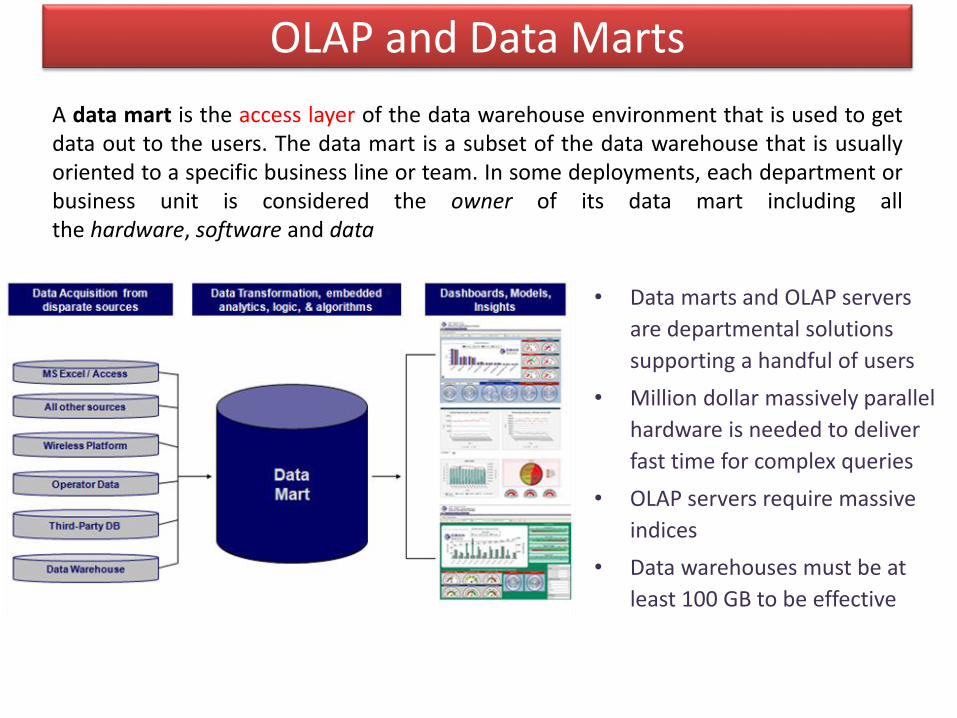
OLAP and Data Marts
A data mart is the access layer of the data warehouse environment that is used to getdata out to the users. The data mart is a subset of the data warehouse that is usuallyoriented to a specific business line or team. In some deployments, each department orbusiness unit is considered the owner of its data mart including allthe hardware, software and data
• Data marts and OLAP servers
are departmental solutions
supporting a handful of users
• Million dollar massively parallel
hardware is needed to deliver
fast time for complex queries
• OLAP servers require massive
indices
• Data warehouses must be at
least 100 GB to be effective

Components of the Warehouse• Data Extraction and Loading
• The Warehouse
• Analyze and Query -- OLAP Tools
• Metadata
Data Warehouse
Engine
Optimized Loader
Extraction
Cleansing
Analyze
Query
Metadata Repository
Relational
Databases
Legacy
Data
Purchased
Data
Enterprise
Resource
Planning
Systems
• Data Mart• Data Mining

True data warehouses
Data Marts
Data Sources
Data Warehouse
With data mart centric DWs, if you end up creating multiple warehouses, integrating them is a problem
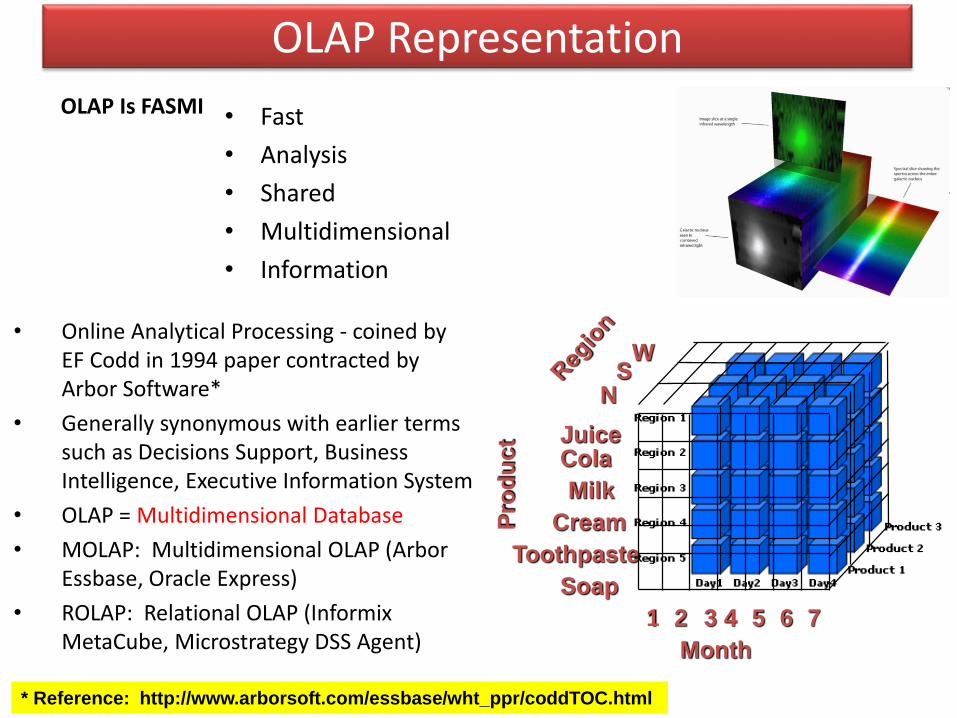
OLAP Representation
OLAP Is FASMI • Fast
• Analysis
• Shared
• Multidimensional
• Information
Month
1 2 3 4 76 5
Pro
du
ct
Toothpaste
JuiceCola
Milk
Cream
Soap
WS
N
• Online Analytical Processing - coined by EF Codd in 1994 paper contracted by Arbor Software*
• Generally synonymous with earlier terms such as Decisions Support, Business Intelligence, Executive Information System
• OLAP = Multidimensional Database
• MOLAP: Multidimensional OLAP (Arbor Essbase, Oracle Express)
• ROLAP: Relational OLAP (Informix MetaCube, Microstrategy DSS Agent)
* Reference: http://www.arborsoft.com/essbase/wht_ppr/coddTOC.html

OLAP vs SQLLimitation of SQL:
“A Freshman in Business needs a Ph.D. in SQL”
Ralph Kimball
• OLAP:
– powerful visualization paradigm
– fast, interactive response times
– good for analyzing time series
– It finds some clusters and outliers
– Many vendors offer OLAP tools
– Embedded SQL Extensions
• Nature of OLAP Analysis:
– Aggregation - (total sales, percent-to-total)
– Comparison -- Budget vs. Expenses
– Ranking -- Top 10, quartile analysis
– detailed and aggregate data
– Complex criteria specification
– Visualization

Relational OLAP
Data Warehouse Engine Decision Support Client
Database Layer Application Logic Layer Presentation Layer
Store atomic data in industry standard RDBMS.
Generate SQL execution plans in the engine to obtain OLAP functionality.
Obtain multi-dimensional reports from the DS Client.
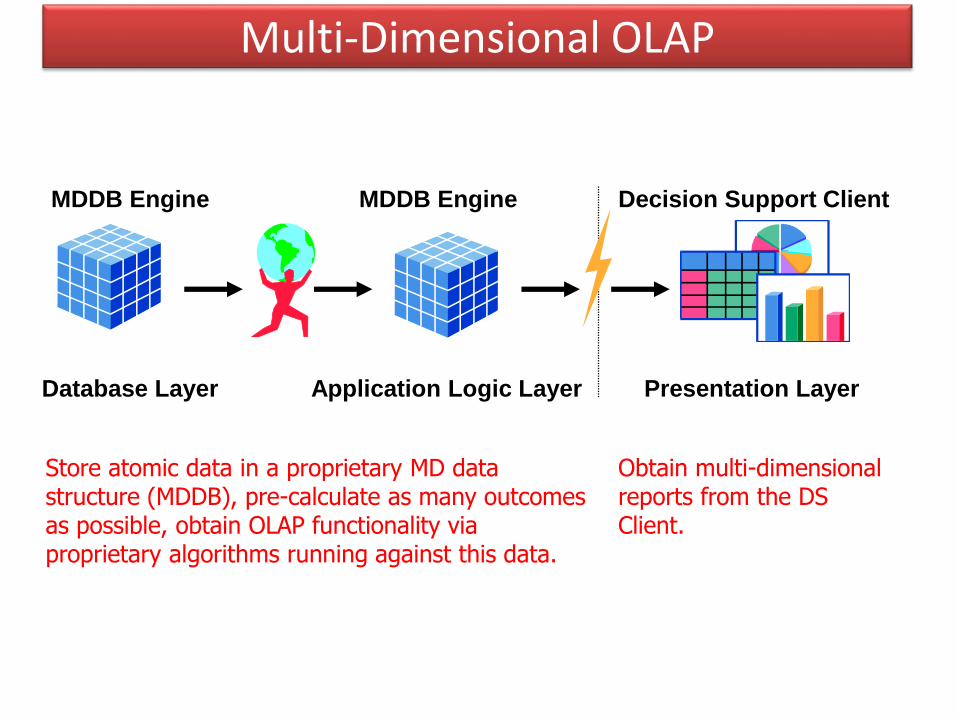
Multi-Dimensional OLAP
MDDB Engine MDDB Engine Decision Support Client
Database Layer Application Logic Layer Presentation Layer
Store atomic data in a proprietary MD data structure (MDDB), pre-calculate as many outcomes as possible, obtain OLAP functionality via proprietary algorithms running against this data.
Obtain multi-dimensional reports from the DS Client.
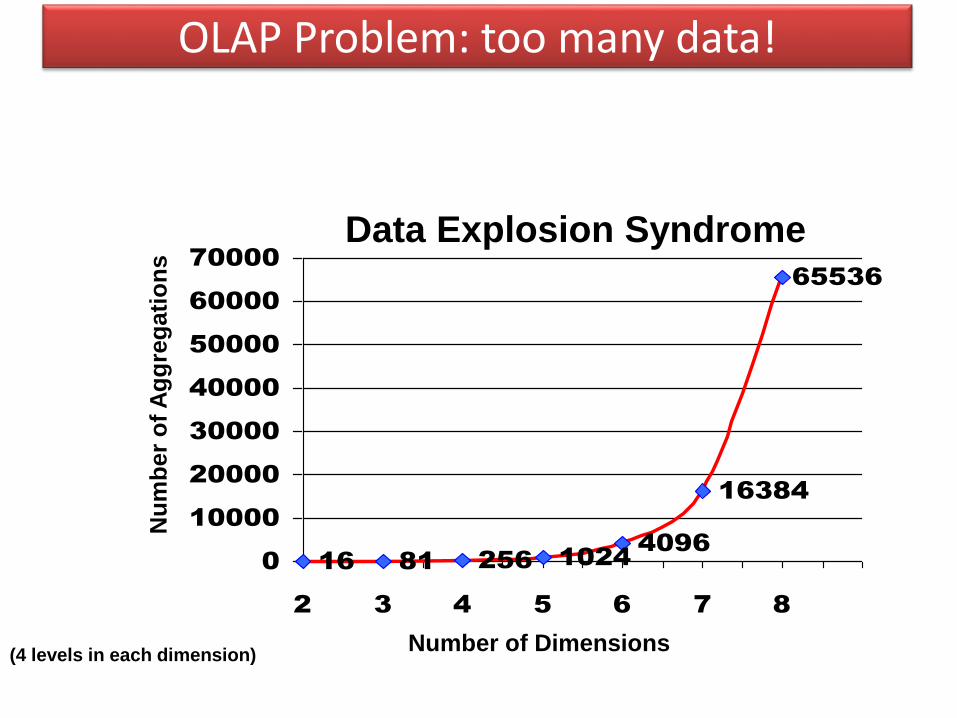
OLAP Problem: too many data!
16 81 256 10244096
16384
65536
0
10000
20000
30000
40000
50000
60000
70000
2 3 4 5 6 7 8
Data Explosion Syndrome
Number of Dimensions
Nu
mb
er
of
Ag
gre
gati
on
s
(4 levels in each dimension)

OLAP Solution: Metadata
With a unified meta-data source anddefinition, the business is embarking furtheron the analysis journey. OLAP reporting ismoving across stream with greater access to allemployees. Data mining models are now moreaccurate as the model sets can be scored andtrained on larger data sets
The primary rational for data warehousing isto provide businesses with analytics resultsfrom data mining, OLAP and reporting. Theability of obtaining front-end analytics islowered if there is an expensive data qualityall along the pipeline from data source toanalytical reporting.
Data Flow after Company-wide Metadata Implementation

Data Warehouse pitfalls• You are going to spend much time extracting, cleaning, and loading data
• Despite best efforts at project management, data warehousing project scope will increase
• You are going to find problems with systems feeding the data warehouse
• You will find the need to store data not being captured by any existing system
• You will need to validate data not being validated by transaction processing systems
• For interoperability among worldwide data centers, you need to move massive data sets on the network:
DISASTER!

Data Applications ?
Moving programs not data: the true bottle neck
Data Mining + Data Warehouse =Mining of Warehouse Data
• For organizational learning to take place, data from must be gathered together and
organized in a consistent and useful way – hence, Data Warehousing (DW);
• DW allows an organization to remember what it has noticed about its data;
• Data Mining apps should be interoperable with data organized and shared between DW.
DA1
DA2
Data+appsExchange
DA
WA
Data+appsExchange
WA
WA
Data+appsExchange
Full interoperability between DA (Desktop Applications)
Local user desktop fully involved (requires computing power)
Full WA DA interoperabilityPartial DA WA interoperability (such as remote file storing)MDS must be moved between local and remote apps
user desktop partially involved (requires minor computing and storage power)
Except from URI exchange, no interoperability and different accounting policy
MDS must be moved between remote apps (but larger bandwidth)
No local computing power required
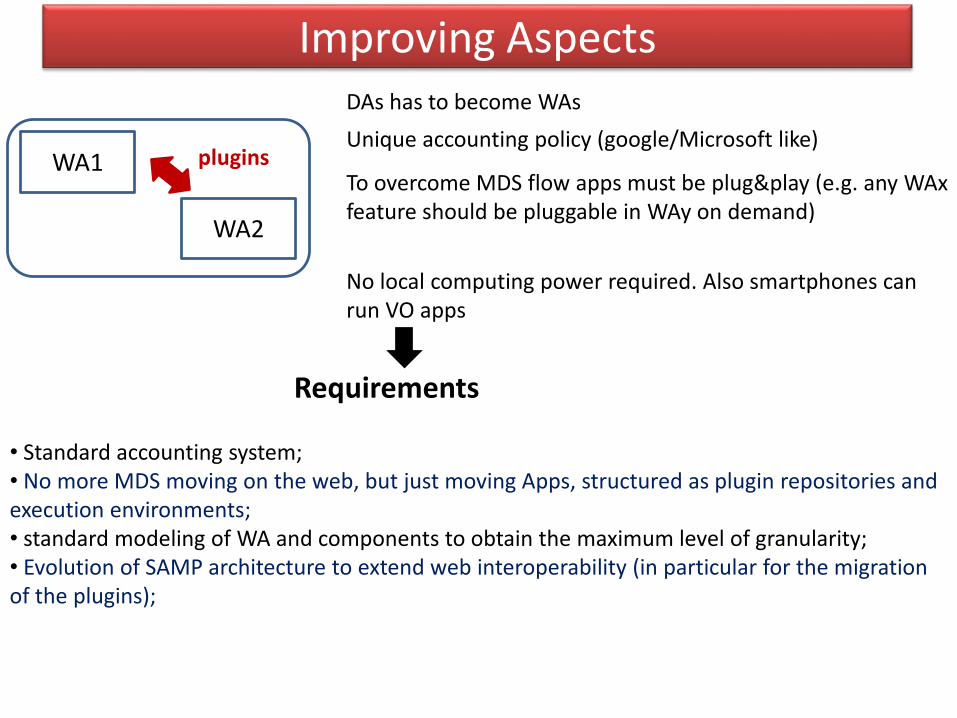
Improving Aspects
WA1
WA2
plugins
DAs has to become WAs
Unique accounting policy (google/Microsoft like)
To overcome MDS flow apps must be plug&play (e.g. any WAxfeature should be pluggable in WAy on demand)
No local computing power required. Also smartphones can run VO apps
Requirements
• Standard accounting system;• No more MDS moving on the web, but just moving Apps, structured as plugin repositories and execution environments;• standard modeling of WA and components to obtain the maximum level of granularity;• Evolution of SAMP architecture to extend web interoperability (in particular for the migration of the plugins);

Plugin granularity flow
WAx
Px-2
Px-1
Px-3
Px-…
Px-n
WAy
Py-1
Py-2
Py-…
Py-n
Px-33. Way execute Px-3
This scheme could be iterated and extended between more standardized web apps

WAx
Px-2
Px-1
Px-3
Px-…
Px-n
WAy
Py-1
Py-2
Py-…
Py-n
After a certain number of such iterations…
Px-2
Px-1
Px-3
Px-…
Px-n
Py-1
Py-2
Py-…
Py-n
The synchronization of pluginreleases between WSs is
performed at request time
The scenario will become:
No different WSs, but simply one WS with several sites (eventually
with different GUIs and computing environments)
All WS sites can become a mirror site of all the others
Minimization of data exchange flow (just few plugins in case of
synchronization between mirrors)
Conclusions
e-Science is a transitional phenomenon, and will become an overall researchenvironment of the data-rich, computationally enabled science of the 21stcentury
Essentially all of the humanity’s activities are being virtualized in some way,science and scholarship included
We see growing synergies and co-evolution between science, technology,society, and individuals, with an increasing fusion of the real and the virtual
Cyberspace, now embodied though the Web and its participants,is the arena in which these processes unfoldVR technologies may revolutionize the ways in which humans interact witheach other, and with the world of information
A synthesis of the semantic Web, immersive and augmentative VW, andmachine intelligence may shape our world profoundly
REFERENCES
Borne, K. D., 2009. X-Informatics: Practical Semantic Science. American Geophysical Union, Fall Meeting 2009, abstract #IN43E-01(http://adsabs.harvard.edu/abs/2009AGUFMIN43E..01B)
The Fourth Paradigm, Microsoft Research, http://research.microsoft.com/fourthparadigm/
Thomsen E., 1997. OLAP Solutions, John Wiley and Sons
Inmon W.H. , Zachman John A., Geiger Jonathan G. , 1997. Data Stores Data Warehousing and the Zachman Framework, McGraw Hill Series on Data Warehousing and Data Management
Inmon W.H., 1996. Building the Data Warehouse, Second Edition, John Wiley and Sons
Inmon W.H. , Welch J. D. , Glassey Katherine L., 1997. Managing the Data Warehouse, John Wiley and Sons
Devlin B., 1997. Data Warehouse from Architecture to Implementation, Addison Wesley Longman, Inc.
Lin S.C., Yen E., 2011. Data Driven e-Science; Use Cases and Successful Applications of Distributed Computing Infrastructures (ISGC 2010), Springer