aswath damodaran - nyupages.stern.nyu.edu/~adamodar/pdfiles/country/crisislessonscfo2012… ·...
TRANSCRIPT
Aswath Damodaran! 1!
Corporate Finance: The New World Order ���Lessons learned, unlearned and relearned from a crisis
Aswath Damodaran

Aswath Damodaran! 2!
Lesson 1: There may be no risk free investment…���CDS Spreads on US Government – 2008-2012

Aswath Damodaran! 3!
Response: Countries don’t have risk free rates, currencies do…
Aswath Damodaran! 4!
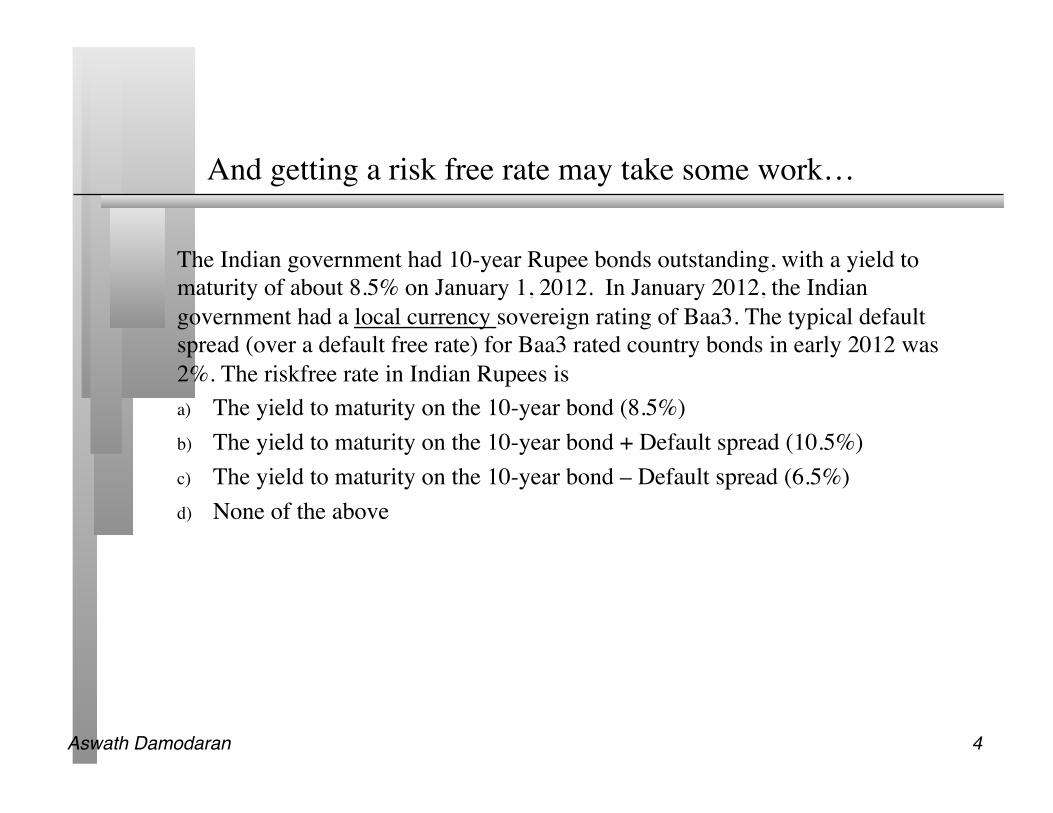
And getting a risk free rate may take some work…
The Indian government had 10-year Rupee bonds outstanding, with a yield to maturity of about 8.5% on January 1, 2012. In January 2012, the Indian government had a local currency sovereign rating of Baa3. The typical default spread (over a default free rate) for Baa3 rated country bonds in early 2012 was 2%. The riskfree rate in Indian Rupees is a) The yield to maturity on the 10-year bond (8.5%) b) The yield to maturity on the 10-year bond + Default spread (10.5%) c) The yield to maturity on the 10-year bond – Default spread (6.5%) d) None of the above

Aswath Damodaran! 5!
Lesson 2: Risk premiums should be forward looking, not backwards…
Historical premium!
" Arithmetic Average" Geometric Average" " Stocks - T. Bills" Stocks - T. Bonds" Stocks - T. Bills" Stocks - T. Bonds"1928-2011" 7.55%" 5.79%" 5.62%" 4.10%" " 2.22%" 2.36%" " "1962-2011" 5.38%" 3.36%" 4.02%" 2.35%" " 2.39%" 2.68%" " "2002-2011" 3.12%" -1.92%" 1.08%" -3.61%" " 6.46%" 8.94%" " "
January 1, 2012S&P 500 is at 1257.60Adjusted Dividends & Buybacks for 2011 = 59.29
In the trailing 12 months, the cash returned to stockholders was 74.17. Using the average cash yield of 4.71% for 2002-2011 the cash returned would have been 59.29.
Analysts expect earnings to grow 9.6% in 2012, 11.9% in 2013, 8.2% in 2014, 4.5% in 2015 and 2% therafter, resulting in a compounded annual growth rate of 7.18% over the next 5 years. We will assume that dividends & buybacks will grow 7.18% a year for the next 5 years.
After year 5, we will assume that earnings on the index will grow at 1.87%, the same rate as the entire economy (= riskfree rate).
68.11 73.00 78.24 83.86
Expected Return on Stocks (1/1/12) = 7.91%T.Bond rate on 1/1/12 = 1.87%Equity Risk Premium = 8.03% - 3.29% = 6.04%
63.54 Data Sources:Dividends and Buybacks last year: S&PExpected growth rate: News stories, Yahoo! Finance, Bloomberg
1257.60 = 63.54(1+ r)
+68.11(1+ r)2
+73.00(1+ r)3
+78.24(1+ r)4
+83.86(1+ r)5
+83.86(1.0187)(r −.0187)(1+ r)5

Aswath Damodaran! 6!
A history of implied ERP for US: 1960-2011

Aswath Damodaran! 7!
Risk premiums change dramatically even in mature markets: ���ERP from 9/12/2008 – 12/31/2008

Aswath Damodaran! 8!
The response: Get updated equity risk premiums
0.00%
1.00%
2.00%
3.00%
4.00%
5.00%
6.00%
7.00%
8.00%
1-A
ug-0
4
1-O
ct-0
4
1-D
ec-0
4
1-Fe
b-05
1-A
pr-0
5
1-Ju
n-05
1-A
ug-0
5
1-O
ct-0
5
1-D
ec-0
5
1-Fe
b-06
1-A
pr-0
6
1-Ju
n-06
1-A
ug-0
6
1-O
ct-0
6
1-D
ec-0
6
1-Fe
b-07
1-A
pr-0
7
1-Ju
n-07
1-A
ug-0
7
1-O
ct-0
7
1-D
ec-0
7
1-Fe
b-08
1-A
pr-0
8
1-Ju
n-08
1-A
ug-0
8
1-O
ct-0
8
Implied ERP by month: September 2008 - Current

Aswath Damodaran! 9!
Lesson 3: Even large cap stocks in developed markets can become illiquid..
Panic selling.. And buying…

Aswath Damodaran! 10!
Response: Illiquidity has to be considered explicitly in corporate finance & valuation… for all companies..
Build into value: If we accept the premise that illiquidity can be a significant problem, even with large market cap companies, we have to consider ways in which we can explicitly incorporate the illiquidity risk into value. In general, we have two choices:
• Adjust discount rates: As a general proposition, we could argue that illiquidity is a risk and that discount rates should be higher for illiquid companies. Holding cash flows constant, we will arrive at lower values for illiquid assets.
• Reduce estimated value for illiquidity: Alternatively, we can ignore illiquidity while estimating value but discount the expected value for illiquidity (like private company practitioners have.
Cash holdings: If illiquidity is a threat even to large market cap companies in developed markets, it behooves companies to hold larger cash balances both as a buffer against crises and as a “fund” to use to take advantage of unanticipated opportunities.

Aswath Damodaran! 11!
But not all companies have the license to hold cash…
Aswath Damodaran! 12!
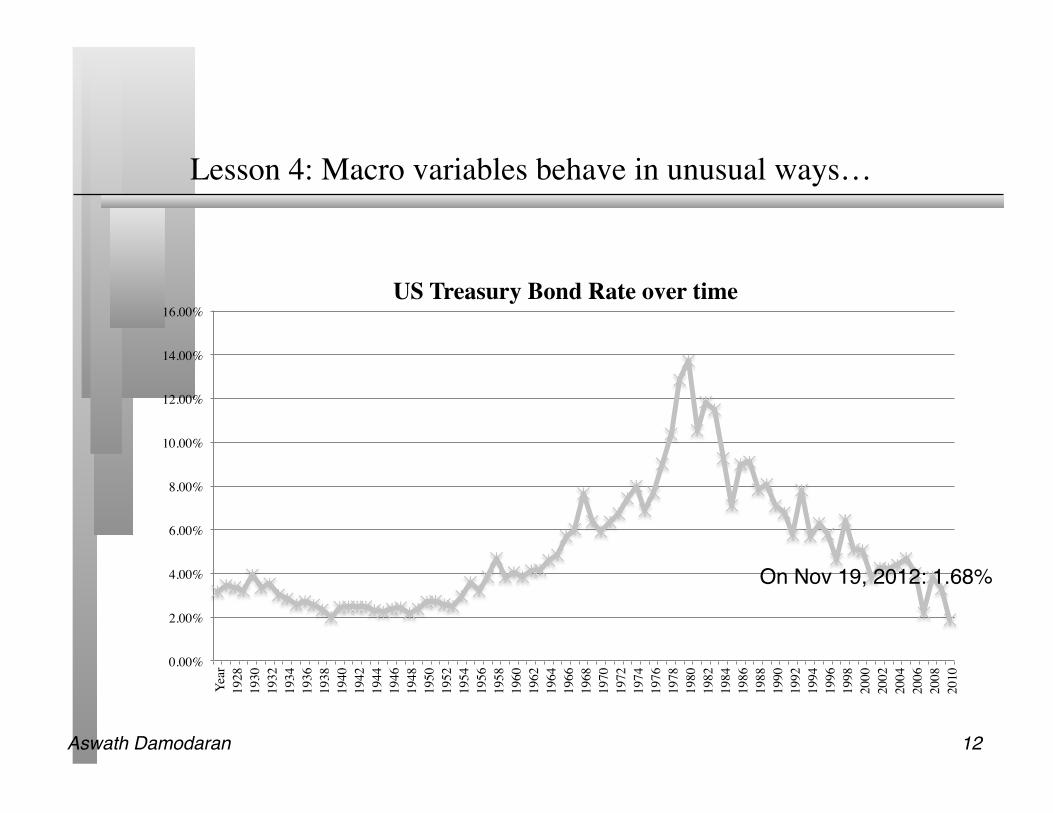
Lesson 4: Macro variables behave in unusual ways…
0.00%
2.00%
4.00%
6.00%
8.00%
10.00%
12.00%
14.00%
16.00%
Year
1928
1930
1932
1934
1936
1938
1940
1942
1944
1946
1948
1950
1952
1954
1956
1958
1960
1962
1964
1966
1968
1970
1972
1974
1976
1978
1980
1982
1984
1986
1988
1990
1992
1994
1996
1998
2000
2002
2004
2006
2008
2010
US Treasury Bond Rate over time
On Nov 19, 2012: 1.68%"

Aswath Damodaran! 13!
Response: Don’t let your macro views drive your corporate finance and valuation decisions…
Selective normalization: Analysts often pick and choose which variables they want to normalize. Thus, they may decide that interest are too low and use higher rates. However, the lower riskfree rate in early 2009 was the result of the market crisis (and the flight to safety), and the crisis also affected equity risk premiums and default spreads (pushing them to new highs) and economic growth (to lows). If you raise the riskfree rate but leave equity risk premiums, default spreads and real growth untouched, you are creating an inconsistent valuation.
Macro and micro views: When the macro environment becomes unstable, there will be strong disagreements about where the economy, interest rates and exchange rates will go in the near and far future. It is therefore important to separate out your views on the macro economy from your views on a company, when you do valuation. A person looking at your valuation can then decide which of your views is reasonable and which ones are not.

Aswath Damodaran! 14!
Lesson 5: There may be no normal…���Crude oil prices from 1988-2012

Aswath Damodaran! 15!
And value will be a function of your expectations…���Exxon Mobil’s value per share & oil price/barrel

Aswath Damodaran! 16!
Response: Draw on probabilistic tools…
Step 2: Look for relationship!Regression of Exxon income against oil price"Op Inc = -6,934 + 911 (Price per barrel of oil)"R squared = 94%"
Step 1: Look at history!
Step 3: Run simulation!

Aswath Damodaran! 17!
Lesson 6: Country risk can change over time and quickly…
0.00%
1.00%
2.00%
3.00%
4.00%
5.00%
6.00%
7.00%
8.00%
9.00%
2.50% 3.51% 4.05% 4.12% 3.95% 3.88% 3.95% 4.04% 4.55% 4.86% 5.10%
7.64% 6.41%
4.06% 3.15%
3.23% 4.00% 4.31%
3.70% 2.28%
0.82%
2.43% 0.86% 0.70%
0.69%
1.54%
Risk
Pre
miu
m
Implied Equity Risk Premium - Brazil
Brazil Country Risk US premium

Aswath Damodaran! 18!
Country Risk Premiums!June 2012!
Angola 10.88% 4.88% Botswana 7.50% 1.50% Egypt 13.50% 7.50% Mauritius 8.25% 2.25% Morocco 9.60% 3.60% Namibia 9.00% 3.00% South Africa 7.73% 1.73% Tunisia 9.00% 3.00% AFRICA 9.82% 3.82%
Bangladesh 10.88% 4.88% Cambodia 13.50% 7.50% China 7.05% 1.05% Fiji Islands 12.00% 6.00% Hong Kong 6.38% 0.38% India 9.00% 3.00% Indonesia 9.00% 3.00% Japan 7.05% 1.05% Korea 7.28% 1.28% Macao 7.05% 1.05% Malaysia 7.73% 1.73% Mongolia 12.00% 6.00% Pakistan 15.00% 9.00% New Guinea 12.00% 6.00% Philippines 10.13% 4.13% Singapore 6.00% 0.00% Sri Lanka 12.00% 6.00% Taiwan 7.05% 1.05% Thailand 8.25% 2.25% Vietnam 12.00% 6.00% ASIA 7.63% 1,63% WO JAPAN 7.77% 1.77%
Australia 6.00% 0.00% New Zealand 6.00% 0.00% AUS & NZ 6.00% 0.00%
Argentina 15.00% 9.00% Belize 9.00% 3.00% Bolivia 10.88% 4.88% Brazil 8.63% 2.63% Chile 7.05% 1.05% Colombia 9.00% 3.00% Costa Rica 9.00% 3.00% Ecuador 18.75% 12.75% El Salvador 10.13% 4.13% Guatemala 9.60% 3.60% Honduras 13.50% 7.50% Mexico 8.25% 2.25% Nicaragua 15.00% 9.00% Panama 9.00% 3.00% Paraguay 12.00% 6.00% Peru 9.00% 3.00% Uruguay 9.60% 3.60% Venezuela 12.00% 6.00% LAT AM 9.42% 3.42%
Albania 12.00% 6.00% Armenia 10.13% 4.13% Azerbaijan 9.00% 3.00% Belarus 15.00% 9.00% Bosnia 15.00% 9.00% Bulgaria 8.63% 2.63% Croatia 9.00% 3.00% Czech Republic 7.28% 1.28% Estonia 7.28% 1.28% Georgia 10.88% 4.88% Hungary 9.60% 3.60% Kazakhstan 8.63% 2.63% Latvia 9.00% 3.00% Lithuania 8.25% 2.25% Moldova 15.00% 9.00% Montenegro 10.88% 4.88% Poland 7.50% 1.50% Romania 9.00% 3.00% Russia 8.25% 2.25% Slovakia 7.50% 1.50% Slovenia [1] 7.50% 1.50% Ukraine 13.50% 7.50% E. EUROPE 8.60% 2.60%
Canada 6.00% 0.00% United States 6.00% 0.00% NORTH AM 6.00% 0.00%
Spain 9.00% 3.00% Austria 6.00% 0.00% Belgium 7.05% 1.05% Cyprus 10.88% 4.88% Denmark 6.00% 0.00% Finland 6.00% 0.00% France 6.00% 0.00% Germany 6.00% 0.00% Greece 16.50% 10.50% Iceland 9.00% 3.00% Ireland 9.60% 3.60% Italy 7.73% 1.73% Malta 7.73% 1.73% Netherlands 6.00% 0.00% Norway 6.00% 0.00% Portugal 10.88% 4.88% Sweden 6.00% 0.00% Switzerland 6.00% 0.00% Turkey 9.60% 3.60% United Kingdom 6.00% 0.00% W. EUROPE 6.80% 0.80%
Black #: Total ERP Red #: Country risk premium AVG: GDP weighted average
Bahrain 8.25% 2.25% Israel 7.28% 1.28% Jordan 10.13% 4.13% Kuwait 6.75% 0.75% Lebanon 12.00% 6.00% Oman 7.28% 1.28% Qatar 6.75% 0.75% Saudi Arabia 7.05% 1.05% UAE 6.75% 0.75% MIDDLE EAST 7.16% 1.16%

Aswath Damodaran! 19!
Response: Country risk derives from operations, not where you are incorporated..

Aswath Damodaran! 20!
Lesson 7: There is good growth… and bad…

Aswath Damodaran! 21!
Response: Be clear about what you are making on your investments…
ROC = EBIT ( 1- tax rate)
Book Value of Equity + Book value of debt - Cash
Adjust EBIT fora. Extraordinary or one-time expenses or incomeb. Operating leases and R&Dc. Cyclicality in earnings (Normalize)d. Acquisition Debris (Goodwill amortization etc.)
Use a marginal tax rateto be safe. A high ROC created by paying low effective taxes is not sustainable
Adjust book equity for1. Capitalized R&D2. Acquisition Debris (Goodwill)
Adjust book value of debt fora. Capitalized operating leases
Use end of prior year numbers or average over the yearbut be consistent in your application

Aswath Damodaran! 22!
Lesson 8: We under estimate truncation risk..
In both valuation and corporate finance, we under estimate the likelihood and consequences of truncation risk. Our assumptions of perpetual life and terminal value are based upon two premises:
• The consequences of getting into financial trouble are short term and easily reversed.
• Capital markets are always open and accessible. A company that needs to raise equity to cover negative cash flows or repay debt can always do so, albeit at a higher cost.
Lesson 10.1: Indirect bankruptcy costs are much higher than we thought. In other words, the perception that you are in trouble can be almost as damaging as being in trouble, especially in businesses that are dependent upon intangible assets.
Lesson 10.2: Capital markets can shut down, even in developed markets and even for the largest companies.

Aswath Damodaran! 23!
Response: Be more cautious about “financial leverage”
In conventional corporate finance, the trade off is between tax benefits on the one hand and expected bankruptcy costs on the other. While the former is straightforward, the latter is more complex and is composed of two components:
• The probability of bankruptcy: As earnings become more volatile, holding all else constant, the probability of bankruptcy increases.
• The cost of bankruptcy has two parts to it: a direct cost associated with the legal and deadweight costs of going bankrupt and an indirect cost that comes about because of the perception that you are in trouble.
When markets are roiled and economies are unsettled, the indirect bankruptcy costs become larger. Holding all else constant, that should translate into less debt at firms.

Aswath Damodaran! 24!
Lesson 9: Governments and regulators can affect value..
In most developed market valuations, there is little explicit consideration for how governments and politics affect value. In fact, the only effect on value that governments have on value is through tax policy, primarily through tax rates.
In this crisis, we have been reminded that governments can influence equity value in many ways…
• Bailouts: By determining who is “too large to fail” and who is not, governments can determine the destiniex of even large enterprises.
• Nationalizations: We used to think of the fear of nationalization as restricted to tinpot dictatorships in small emerging markets. No more!
• Regulations and rules: We think of rules and regulations as clearly defined boundaries and constraints. We forget that rules are written and enforced by human beings, and they can be changed by those same humans.
Implication: When valuing companies, especially regulated businesses, we have to consider the effects of not only existing regulations, but changes in those regulations.

Aswath Damodaran! 25!
Response: Incorporate the “Heavy Hand” into valuation and capital allocation…
Average for companies
where government has
large stake
Average for other companies
in the same sector
Tax Rate 41% 32% ROIC 7% 11% Debt ratio 43% 35%
Dividends/FCFE 135% 78%
If the company is badly run, can you do anything about it as a stockholder?!
The government’s interests may diverge from your interests.!- Dividend policy!- Cost cutting!- Taxes!
The Government put: The government will not let a company that it owns go under, offering bailouts and other measures to save the firm. This will increase the value of the firm."The Government call: If the firm becomes too valuable, the government may decide to expropriate the firm at favorable prices (nationalization)."
Aswath Damodaran! 26!
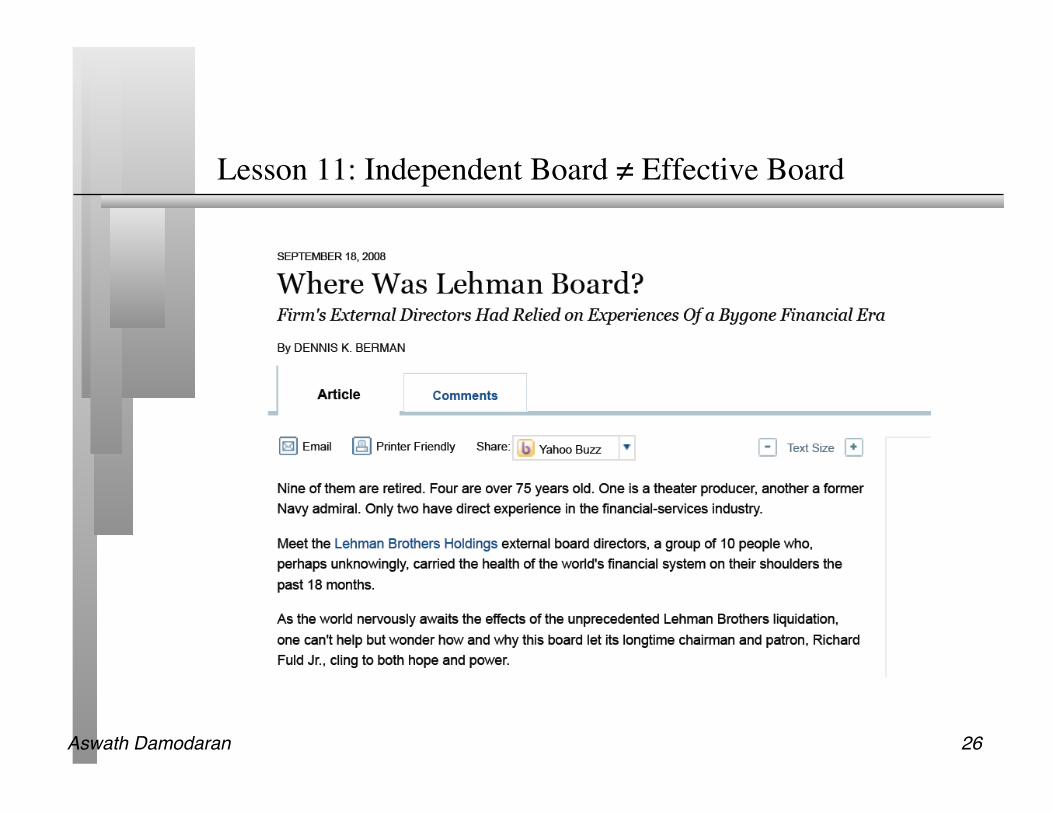
Lesson 11: Independent Board ≠ Effective Board

Aswath Damodaran! 27!
Response: Let’s think about effective boards… Directors should..
Know the business: If we want board members to oversee managers, we have to also accept the proposition that these board members understand the business that the company is in.
(At least some should) serve the interests of those most opposed to incumbent managers: If one of the problems with boards is that they are unwilling to challenge incumbent managers, we need directors who represent stockholders who most disagree with incumbent managers (proportional voting for directors versus majority voting).
Have a counter weight to the CEO: If it is human nature to assent to authority, we need to create counters to the power of the CEO. In effect, it may be time to create a “Devil’s Advocate” on the Board, with powers (and resources) to match the CEO.

Aswath Damodaran! 28!
Lesson 12: Fair value accounting is an oxymoron…���Here is a conventional balance sheet..
Assets Liabilities
Fixed Assets
Debt
Equity
Short-term liabilities of the firm
Intangible Assets
Long Lived Real Assets
Assets which are not physical,like patents & trademarks
Current Assets
Financial InvestmentsInvestments in securities &assets of other firms
Short-lived Assets
Equity investment in firm
Debt obligations of firm
Current Liabilties
Other Liabilities Other long-term obligations
The Balance Sheet
Assets are recorded at original cost, adjusted for depreciation. !
True intangible assets like brand name, patents and customer did not show up. The only intangible asset of any magnitude (goodwill) is a plug variable that is of consequence only if you do an acquisition.!
Valued based upon motive for investment – some marked to market, some recorded at cost and some at quasi-cost !
Equity reflects original capital invested and historical retained earnings. !

Aswath Damodaran! 29!
And an “intrinsic” value balance sheet
Assets Liabilities
Assets in Place Debt
Equity
Fixed Claim on cash flowsLittle or No role in managementFixed MaturityTax Deductible
Residual Claim on cash flowsSignificant Role in managementPerpetual Lives
Growth Assets
Existing InvestmentsGenerate cashflows todayIncludes long lived (fixed) and
short-lived(working capital) assets
Expected Value that will be created by future investments
Recorded at intrinsic value (based upon cash flows and risk), not at original cost!
Value will depend upon magnitude of growth investments and excess returns on these investments!
Intrinsic value of equity, reflecting intrinsic value of assets, net of true value of debt outstanding.!

Aswath Damodaran! 30!
Response: Don’t lose focus…
Financial statements should (and have been designed to) answer three questions:
• How much did you earn last year? • What do you own and how much did you invest to get what you own? • What do you owe?
In the process of moving to fair value accounting, we should not lose information that has been used to answer these questions. Therefore:
• Replacing existing book values of assets (which measure capital invested) with the fair or market value of those assets replaces a useful piece of information with one that is redundant (if it just reflects market value), misleading (if it incorrectly tries to reflect market value) or confusing (if no one is quite sure).
• Adjusting earnings for past mistakes in fair value assessment (inevitable with all fair value accounting) will make earnings less informative.
• Trying to include potential, possible and imagined liabilities in balance sheet dilutes the meaning of debt.