asx announcement · 10/1/2014 · asciano had another successful year in 2014, despite challenging...
TRANSCRIPT

ASX ANNOUNCEMENT
1 October 2014
The Manager
Company Announcements Office
Australian Securities Exchange
Level 4, North Tower Rialto
525 Collins Street
MELBOURNE VIC 3000
ELECTRONIC LODGEMENT
Dear Sir or Madam
Report to Shareholders and Notice of Meeting for 2014 Annual General Meeting
We attach the following documents:
1. A letter from Asciano’s Chairman to shareholders;
2. Asciano’s 2014 Annual Report;
3. A Notice of Annual General Meeting; and
4. Proxy Form
Documents will be mailed to Asciano Limited shareholders on or before 10 October 2014.
The Annual General Meeting of shareholders of Asciano Limited will be held at the Wesley
Centre, 220 Pitt Street, Sydney on Wednesday 12 November 2014 at 10.00am.
Yours faithfully
Lyndall Stoyles
Group General Counsel & Company Secretary
For
per
sona
l use
onl
y

Dear Asciano Shareholder,
Asciano Annual General Meeting Wednesday 12 November 2014, 10.00am
On behalf of the Board of Directors, it gives me great pleasure to invite you to attend Asciano’s 2014 Annual General Meeting to be held at 10.00am on Wednesday 12 November in the Wesley Centre, 220 Pitt Street, Sydney NSW.
The Notice of Meeting is enclosed and sets out in detail the items of business to be considered by shareholders at the meeting.
The Asciano Board of Directors considers the Annual General Meeting to be an important opportunity for us to engage with shareholders. We look forward to updating you on Asciano’s performance for the year while answering any questions you may have about our organisation.
In addition to the ordinary business of considering the financial report and remuneration report for the 2014 financial year, there are some additional items we will be asking shareholders to consider and vote on. These include the re-election of Mr Chris Barlow and Ms Shirley In’t Veld, a grant of rights to the Chief Executive Officer, Mr John Mullen for the 2015 financial year, and the renewal of proportional takeover provisions contained in Rule 15 of the Company’s constitution.
If you have any questions in relation to any of these items, or in relation to the upcoming Annual General Meeting generally please call the Asciano shareholder information line on 1300 729 310 or +61 3 9415 4608 if you are outside of Australia.
If you are not able to attend the meeting to vote in person, please complete the enclosed proxy form and return it to us by mail or fax. You may also register your proxy appointment and voting instructions electronically via www.investorvote.com.au. The details of how to lodge electronically are set out on the enclosed proxy form. The Board recommends that you vote in favour of all items of business.
You can choose to be a part of our Annual General Meeting via webcast. Visit www.asciano.com.au for full details.
Finally the Board of Directors and members of the Company’s Senior Leadership Team would like to invite you to join us for light refreshments following the meeting.
I look forward to welcoming you to the Asciano 2014 Annual General Meeting.
Yours sincerely,
Malcolm Broomhead Chairman Asciano Limited
Level 6/15 Blue Street North Sydney NSW 2060 Australia
Level 4/476 St Kilda Road Melbourne VIC 3004 Australia
For
per
sona
l use
onl
y

Key Financial Highlights
Performance at a Glance (year ended 30 June 2014)
The 2014 financial result was driven by strong growth in coal volumes and a second half pick-up in container volumes driven in part by new contract wins. We also had a higher contribution from Bulk & Automotive Port Services, with Patrick Autocare benefitting from stronger car volumes in the first half of the year and higher volumes in some parts of our bulk ports business.
Shareholders can read a more detailed review of the 2014 financial year in the Asciano Annual Report which can be found on the Asciano website – www.asciano.com.au
• Further good progress on the five year plan we announced three years ago
• Underlying revenue, net of coal access, increased 6.7% to $3.8 billion and underlying earnings before interest and tax increased 5% to $720.3 million
• Business Improvement Program cumulative savings of $115 million over the last three years; the five year FY16 target has now been doubled from $150 million to $300 million
• Fully franked final dividend of 8.5 cents per share, a 36% increase over the same period in the last financial year. Full year dividend a fully franked 14.25 cents per share, up 23.9% on the previous corresponding period, and
representing a payout ratio of 39.7%, at the top end of the payout ratio range established by the Board in 2013
• Balance sheet in a strong position to support our activities over the coming years
• Capital stock refresh program to be completed over the next two years, with annual sustaining capital expenditure expected to run at a steady state for the medium term of $300-400 million per annum
• Lower capital expenditure will drive strong growth in free cashflow enabling the Board to lift its dividend payout ratio beyond the current range of 20-40% when we believe it is appropriate
Earnings Summary
Twelve Months Ended 30 June ($‘m) 2013 3 2014 % chg
Underlying Revenue and other income ¹ 3,727.7 3,994.6 7.2
Pacific National Coal 1,017.2 1,159.9 14.0
– Pacific National Coal (net of access) 842.4 956.0 13.5
Pacific National Rail 1,360.9 1,329.1 (2.3)
Terminals & Logistics 731.5 748.6 2.3
Bulk & Automotive Port Services 680.5 793.4 16.6
Eliminations/unallocated (62.4) (36.4) (41.7)
Divisional Operating Performance
Twelve Months Ended 30 June ($‘m) 2013 3 2014 % chg
Pacific National Coal 287.9 332.3 15.4
Pacific National Rail 216.8 179.6 (17.2)
Terminals & Logistics 150.1 150.3 0.1
Bulk & Automotive Port Services 89.0 89.5 0.6
Corporate (57.8) (31.4) (45.7)
Underlying EBIT 2 686.0 720.3 5.0
1. FY13 underlying revenue and other income excludes the $17.1m accounting gain in relation to the revaluation of the Company’s existing 50% shareholding in C3 following the acquisition of the outstanding 50% interest in November 2012.
2. Underlying EBIT excludes material items of $136.3m (FY13 $19.0m).3. FY13 earnings have been restated to reflect the change in the Australian Accounting Standards Board (AASB) 119, accounting for
employee benefits, as reported in the FY13 financial accounts. The impact of the change is to reduce FY13 EBITDA & EBIT by an amount of $7.9m and FY13 NPAT by $5.6m.For
per
sona
l use
onl
y

ANNuAL rEpOrT 2014
ASC
IAN
O LIM
ITE
D
AN
NU
AL R
EPOR
T 20
14
0500 HRS | TUESDAY
PORT GERMEIN, SOUTH AUSTRALIA
MOVING DOMESTIC FREIGHT
2300 HR
S | TUESD
AY
PORT O
F FREMA
NTLE, W
ESTERN AU
STRALIA
STEVEDO
RING
AUSTRALIA’S IMPO
RTS
HOURS A DAY
DAYS A YEAR
24365
For
per
sona
l use
onl
y

Contents01 National Logistics Supply Chain | 02 Chairman & Chief Executive Officer’s Report
06 Operating & Financial Review | 38 Sustainability | 42 Senior Leadership Team
44 Board of Directors | 46 Financial Report | 165 Corporate Directory
Asciano Limited ABN 26 123 652 862
ANNuAL rEpOrT 2014
1000 hrs | tuesday
Port BotANy, New South w
ALeS
ThE pOrT BOTANy rEDEvELOpMENT prOjECT
wILL TrANSfOrM pATrICk’S pOrT BOTANy TErMINAL
INTO AN AuTOMATED, wOrLD-CLASS CONTAINEr hANDLINg fACILITy wITh
fOur BErThS ACrOSS 1,400 METrES Of quAy LINE
For
per
sona
l use
onl
y

Kalgoorlie
Regional Logistics
Marrar, Wagga,Ettamogah,Mooroopna,Tocumwal,Mildura, Donald,Warrnambool
To/from North Qld18 trains/week via PacificNational Queensland(the forward leg)
Concentrates haulage208 round trips per year
Coal haulage176m tonnes pa contracted toFY14 for North East Australiaand South East Australia
Whyalla – Newcastle5 steel trains/week(the forward leg)
North – South corridor13 intermodal & 5 steeltrains/week (the forward leg)Melbourne – Adelaide
8 intermodal trains/week(the forward leg)
East – West corridor20 intermodal &
3 steel trains/week(the forward leg)
Port HastingsGeelong
PortlandMELBOURNE
Bell Bay
Port Augusta
Whyalla
Esperance
Albany
HendersonFremantle
PERTH
Geraldton
Dampier
ADELAIDE
CANBERRAPort Kembla
NewcastleSYDNEY
BRISBANE
Port AlmaGladstone
Nebo
Cairns
Innisfail
TownsvilleMt. Isa
Alice Springs
Christmas and Cocos Islands DARWIN
NORTHERN TERRITORY
WESTERN AUSTRALIA
SOUTH AUSTRALIA
QUEENSLAND
NEW SOUTH WALES
VICTORIA
TAS
AUCKLAND
WELLINGTON
New Plymouth
Nelson
Marsden Point
TaurangaKawerau
GisborneNapier
Picton
ChristchurchTimaru
Dunedin
Railways
Coal Maintenance & Provisioning
Intermodal Terminals
Container Terminals
C3 OperationsAutocare
Regional Logistics
Mountain Industries
Port Logistics
Port Management & General Stevedoring
Bowen
Greta
MackayRockhampton
24 hours a day, 365 days a year, customers can rely on Asciano’s businesses to handle and haul millions of tonnes of agricultural and
resource commodities, retail goods, manufacturing products, construction and other materials produced for use across Australia
and through the export gateways to overseas markets.
With an unparalleled national network of port and rail heavy infrastructure assets, Asciano occupies market leading positions
across Australia’s import, export and domestic supply chains.
NATIONAL LOgISTICS
SuppLy ChAIN
Annual report 20141
For
per
sona
l use
onl
y

ThE yEAr’S rEvENuE AND EArNINgS pErfOrMANCE
rEfLECTS ANOThEr yEAr Of STrONg grOwTh IN COAL
vOLuMES
1100 hr
s | tu
esda
y
FLeMIN
Gto
N, N
ew So
uth
wA
LeS
Mo
ving
AustrAliA’s co
Al exports
ChAIrMAN & CEO’S rEpOrT
Asciano Limited2
For
per
sona
l use
onl
y

John MullenChief Executive Officer
The achievement of another year of increased revenue and earnings is the result of continued strong growth in our coal haulage business,
better volumes in the second half of the year in our container terminal business and a focus on cost reduction and constant
improvement in performance across the Group.
positioned well for future growth
Dear Shareholders,
Asciano had another successful year in 2014, despite challenging market conditions. The achievement of another year of increased revenue and earnings is the result of continued strong growth in our coal haulage business, better volumes in the second half of the year in our container terminal business and a focus on cost reduction and constant improvement in performance across the Group.
During the year, we made further good progress on the ambitious five year plan we announced three years ago. This plan has focused on stabilising and strengthening our balance sheet after significant losses in 2010, improving our business performance on key financial and non-financial measures and looking for new avenues of development and growth.
performanceRevenue and earningsrevenue and earnings growth have continued in the 2014 financial year. underlying revenue, net of coal access, increased 6.7% to $3.8 billion and underlying earnings before interest and tax (“eBIt”) increased 5% to $720.3 million. our eBIt compound annual growth rate (“CAGr”) over the last three years is over 10%.
the year’s revenue and earnings performance was driven by strong growth in coal volumes and a second half pick-up in container volumes driven in part by new contract wins. we also had a higher contribution from Bulk & Automotive Port Services, with Patrick Autocare benefiting from stronger car volumes in the first half of the year and higher volumes in some parts of our bulk ports business.
these gains were offset to an extent by challenging trading conditions for Pacific National in the intermodal and export grain haulage market and for Patrick in the logistics business,
along with falling investment in the resources sector, including the wind-down of the Agility contract in western Australia, impacting bulk stevedoring volumes at some ports.
Despite some positive signs in a couple of areas, we are moving forward assuming we will continue to face tough economic conditions across the business. this has driven our ongoing focus on cost reduction and the workforce changes we have announced over the past year.
Return on capital employed and return on equitywhile it impacted our return on capital employed (“roCe”) and return on equity (“roe”) performance this year, our aggressive capital expenditure program was required to update what was a rundown, unproductive and inefficient capital base. Despite this, our roe has increased 38% over last three years and, while improvement in roCe has slowed over the last year, we have also improved roCe over the three year period.
our $754 million capital expenditure spend over the last year was used to continue our business modernisation and upgrade program, including upgrades to our rail terminals, investment in new rail rolling stock, cranes and associated equipment, along with the acquisition of strategic rail terminals in Queensland and the ongoing redevelopment and automation of our Port Botany container terminal. this investment establishes a sustainable platform for the long-term growth of the business and will improve safety outcomes for our employees.
our capital expenditure program will be completed over the next two years, with annual sustaining capital expenditure expected to decline to a steady state for the medium term of $300-400 million annually. this is expected to result in significant growth in free cash flow which will enable the Board to lift its dividend payout ratio beyond the current range of 20-40% when we believe it is appropriate.
Malcolm BroomheadChairman
ChAIrMAN & CEO’S rEpOrT
Annual report 20143
For
per
sona
l use
onl
y
of performance as well as in our customers’ perception of our performance. our overall ACe score improved from 78 to 81, while our NPS improved from +6 to +18. Most importantly, we’ve seen absolutely dramatic improvements in some parts of our business, from heavily negative to strongly positive results in the space of just a year or two.
other key areas of progress in the customer area include empowering our business development teams to make strategic planning decisions to ensure that we deliver to our customers’ needs, linking our customer survey results to our employees’ short-term incentive program and the establishment of an Asciano Customer Council to drive new initiatives and ongoing improvements.
In the year ahead we will further accelerate our focus in this area with the formal recognition of our customer program at a Senior Leadership team level and the appointment of a Program Manager to drive our customer efforts.
people and Teamworkwe have put an increased focus on People and teamwork over the last few years and have made significant progress. we have structured our core human resources activities to ensure consistency in the way we recruit, manage, develop, engage and reward our people. we have also established a strong focus on building leadership capability at all levels of our organisation, with over 540 people from across the business attending our internal leadership development courses over the last two years.
our efforts have been part of a broader commitment to position Asciano as an attractive place to work and to continue to build a shared vision and unified culture across the business. one of our key initiatives in this area has been the launch of a Group-wide reward and recognition program. the inaugural thank you Initiative attracted over 500 nominations from across the business, culminating in our awards night where we celebrated the achievements of the deserving finalists in our four award categories.
Business improvement program (“BIP”)we originally targeted $150 million cost take-out through our BIP over five years and are pleased that after the first three years of the program we are ahead of the original schedule, reaching $115 million as at June this year. Given the unpredictable demand outlook in the Australian economy, we have taken significant measures over the last 12 months to make quantum changes to the cost base of our business. Most notably, this has included the integration of our two rail businesses to create a combined Pacific National business, which is expected to deliver material savings both in the short and medium term.
we have a number of plans in place that should drive significant savings over the coming years. this has resulted in us doubling our five year BIP target from the original $150 million plan to $300 million by the end of the 2016 financial year.
Balance sheetwe have worked hard to repair our balance sheet over the last three years to stabilise and position the business for future success. In 2011, we had a very significant short-term debt overhang which threatened the future of the Company. we are pleased, however, that this is now well and truly resolved.
today, we have an average debt maturity of just under 5 years and our leverage (net debt to eBItDA) has fallen from over 7 times to 3 times which is within our target range of 2.5 times to 3 times. our interest cover (eBItDA to net interest) is also now very comfortable at about 5 times, against our targeted minimum of 3.5 times.
the Board is comfortable that the balance sheet is in a strong position to support our activities over the coming years.
Dividendthe Board has declared a fully franked final dividend of 8.5 cents per share, a 36% increase over the same period in the last financial year. this takes the full year dividend to a fully franked 14.25 cents per share, up 23.9% on the previous corresponding period, and representing a payout ratio of 39.7%, at the top end of the payout ratio range established by the Board in the 2013 financial year.
while our payout ratio is still below the average industrial company in the Australian market, it has gone from zero to just below 40% in three years and we are pleased with this performance. with the wind-down of our capital expenditure program, which will result in improved free cash flow and balance sheet leverage over the coming years, we expect that we can continue to improve on this measure over time.
Customerthe success of a company is determined by the quality of its customer relationships and its ability to respond to each customer’s needs. we have had some wonderful examples of best practice customer service in our business; however, we recognise that we have also had some clear opportunities for improvement. we have put a lot of effort towards bringing the “voice of the customer” into our business over the last year and, while we are pleased with the significant progress we have made, there is still more to do.
we have undertaken our second Group-wide customer survey using the Actionable Customer engagement (“ACe”) and Net Promoter Score (“NPS”) methodologies. this year’s results showed a dramatic improvement in the underlying measures
“ The Board has declared a fully franked final dividend of 8.5 cents per share, a 36% increase over the same period in the last financial year. This takes the full year dividend to a fully franked 14.25 cents per share, up 23.9% on the previous corresponding period, and representing a payout ratio of 39.7%, at the top end of the payout ratio range established by the Board in the 2013 financial year.”
Chairman & CEO’s rEpOrt
Asciano Limited4
For
per
sona
l use
onl
y

John MullenChief Executive Officer
Malcolm BroomheadChairman
Looking ahead, we are committed to putting a comprehensive program in place to address the challenge of gender diversity across our business. this includes efforts to foster an environment that understands and supports gender difference, programs to attract more women to our recruitment processes, along with investment to develop our next female leaders. we have established a baseline of our gender diversity performance across these fronts and have set targets for improvement.
Safetyengagement on safety performance has continued to be a priority across the business, from the Board and Senior Leadership team down through our management to our employees on the ground. we have historically performed poorly in this area compared to other companies in the ASX 100, and we have worked hard to improve our performance over the last three years.
our continued focus on safety has resulted in dramatic improvements in safety performance. Since 2011, we have achieved a 57% decline in our recordable injury frequency rate and a 70% improvement in our lost time injury frequency rate. however, this year we sadly report on the death of a truck driver in our wholly owned subsidiary C3 Limited in New Zealand. the death of Mr Ian romley in August 2013 at a customer’s premises deeply impacted his family, friends and colleagues at C3. his death serves to remind us that we must continue to strive to make our workplaces safer and our people cognisant of the risks in their roles.
our safety focus in the last year has included further developing our Critical Safety essentials program to ensure we are able to better manage our most critical safety risks. the program has established standard controls for high risk activities and will engage our employees at the frontline to embed them into their workplaces. In addition to investing in developing safety leadership skills in frontline management, we have also developed our new occupational health and safety system to better track, notify and manage safety incidents.
over the next year we will launch our leading Home safely every Day program, aimed at reshaping the culture of safety in our business. this is a unique program which will build the individual competencies that our leadership team have defined as important to safety performance. It underpins our drive to continue to improve safety outcomes and be a leader on this front in Australian business.
OutlookAssuming no material change in the business environment, we expect underlying eBIt growth in the 2015 financial year to be higher than that achieved in the 2014 financial year.
In 2015, our combined Pacific National rail Division and terminals & Logistics Division should report eBIt growth from new contracts, GDP linked market growth and from the impact of improved productivity and reduced costs from our BIP. we expect Bulk & Automotive Port Services to report flat earnings year-on-year, given the wind-down of key contracts and current lower levels of project activity at some regional bulk ports around Australia and New Zealand.
we expect a reduced capital expenditure spend over the coming year, at the lower end of the forecast range of $600-700 million, in the absence of any new growth opportunities. the focus of our Senior Leadership team will be on extracting returns from the significant capital expenditure program over the last three years and on the completion of a number of strategic projects. this includes maximising operational and shareholder value from the integration of our two Pacific National rail Divisions and the successful completion of the Port Botany redevelopment project with no impact to customer service.
we would like to thank our shareholders and customers for their support and ongoing loyalty, along with our employees for their contribution over the last year. we also acknowledge the significant contribution of those people who have left the business following the integration of our two rail Divisions and other business improvement programs. redundancies are an unfortunate consequence of these changes and we wish all of these individuals well for the future. we would also like to thank our employees who were affected by these changes, many of whom have taken on additional responsibilities as we have transitioned through this process.
After heavy losses in the 2010 financial year, we have addressed our legacy debt issues and consolidated our balance sheet over the last few years. we have also focused on improving business performance in order to position Asciano for future growth and success. with significant milestones reached on both these fronts, we are now in a strong position to improve cash flow and shareholder returns and to examine new opportunities for growth. while there are obvious challenges in some of our key markets, we are confident that we are positioned well to deliver stronger returns for shareholders in the 2015 financial year.
Chairman & CEO’s rEpOrt
Annual report 20145
For
per
sona
l use
onl
y

group Operating performance
fy14 revenue Split by Division1
fy14 EBITDA Split by Division 1
1. Does not include corporate head office costs/eliminations.
Asciano is Australia’s largest national rail freight and cargo port operator. Asciano aims to be Australia’s leading provider of critical
logistics services within essential infrastructure-based supply chains. Asciano occupies all major segments of the import/export and domestic supply chains to offer a diverse freight
mix service offering. Asciano continues to pursue opportunities to provide integrated supply chain infrastructure solutions, leveraging the port and rail capabilities of the Group. the Group also seeks to
develop integrated service offerings such as the migration of port volumes from road to rail.
PN Coal PN Rail Terminals & Logistics Bulk & Auto
25%
35%
20%
21%
43%
27%
19%
11%
1130 h
rs | t
ue
sd
ay
eASt Sw
AN
SoN
Do
CK
, VIC
tor
IA
steveDo
ring
AustrA
liA’s iMpo
rts
ASCIANO IS AuSTrALIA’S LArgEST
NATIONAL rAIL frEIghT AND CArgO
pOrT OpErATOr.
OpErATINg & fINANCIAL
rEvIEw
Asciano Limited6
For
per
sona
l use
onl
y

Earnings Overview Twelve Months Ended June ($’m) 20134 2014 % chg
Statutory revenue and other income 3,744.8 3,994.6 6.7
underlying eBItDA ¹ 992.7 1,052.0 6.0
Statutory eBItDA 977.8 991.4 1.4
underlying eBIt ² 686.0 720.3 5.0
Statutory eBIt 667.0 584.0 (12.4)
underlying NPAt ³ after minority interests 342.5 349.8 2.1
Statutory NPAt after minority interests 334.4 254.4 (23.9)
1. Underlying EBITDA excludes material items of $60.6m (FY13 $14.9m). Details of the adjustments and a reconciliation are on page 10.2. Underlying EBIT excludes material items of $136.3m (FY13 $19.0m). Details of the adjustments and a reconciliation between underlying EBIT
and statutory EBIT is at page 12.3. Underlying NPAT excludes material items of $95.4m (FY13 $8.1m). A reconciliation between underlying NPAT and statutory NPAT is at page 13.4. FY13 earnings have been restated to reflect the change in the Australian Accounting Standards Board (“AASB”) 119, accounting for employee benefits,
as reported in the FY13 financial accounts. The impact of the change is to reduce FY13 EBITDA and EBIT by $7.9m and FY13 NPAT by $5.6m.* FY14 Interim Profit Release dated 18 February 2014.
For the FY14 reporting period, Asciano’s activities were divided into four reportable segments:
As announced in February 2014*, Asciano has moved to integrate its two rail divisions, Pacific National rail and Pacific National Coal, into one rail division, Pacific National.
Asciano’s head office functions have been established to provide an efficient organisation structure to extract synergies across Group-wide activities such as It, shared services, procurement and fuel.
pacific National Coal (“pN Coal”)Is the second largest coal rail haulage provider in Australia, moving export coal from mine to port and domestic coal from mine to power stations and steelworks primarily in New South wales and Queensland. Pacific National Coal also hauls coal by rail in South Australia servicing the local power industry. Detailed overview and review of operating performance at page 20
pacific National rail (“pN rail”)Provides intermodal rail services and bulk haulage rail services (excluding coal) throughout Australia. the intermodal business includes interstate container freight, interstate break bulk freight (steel), regional freight rail services in Queensland and hook and pull services for passenger trains. Detailed overview and review of operating performance at page 20
Terminals & LogisticsIs one of two major competitors in the Australian market providing container stevedoring services in the four largest container ports in Australia; east Swanson Dock in Melbourne, Port Botany in Sydney, Fisherman Islands in Brisbane and Fremantle in western Australia. the division also provides an integrated logistics service establishing the interface between the shipping lines and the beneficial freight owner. Detailed overview and review of operating performance at page 28
Bulk & Automotive port Services (“BApS”)Specialises in the management of bulk ports and supporting infrastructure and the provision of port related logistics at over 40 sites across Australia and New Zealand. It also operates an integrated service for the transportation, processing and storage of motor vehicles from the port to the beneficial freight owner. Detailed overview and review of operating performance at page 32
OpErATINg & fINANCIAL
rEvIEw
Annual report 20147
For
per
sona
l use
onl
y

key Business risksAsciano’s four reporting divisions are exposed to specific business risks. these specific risks are detailed on pages 21, 29 and 33. there are also a number of risks and challenges that Asciano as a whole faces in achieving its overall business objective. Asciano’s overarching key business risks include:
People and safety• Injury to employees, contractors
and other third parties
• Industrial relations activity that impacts the Company’s ability to meet its contractual and customer expectations
• Attraction and retention of key senior management and operational staff
Customer• Increased competition that results in
the loss of major customers, including government legislated changes to competition levels
• Counterparty risk
Environment • Climate change risk
• environmental regulation compliance risk. the Company’s approach to environmental regulation is set out in the Corporate Governance Statement in the Directors’ report and is available on our website
Asciano seeks to mitigate its risks through the effective management of and engagement with its key stakeholder base; an ongoing focus on its cost base and productivity improvements; and ensuring that it has effective systems and procedures in place to manage the business on a day-to-day basis and address the strategic issues and challenges that may impact the business over the medium term.
these risks are identified to assist investors in understanding the nature of the risks faced by Asciano and the industries in which it operates.
the Company’s risk management approach is set out in detail in the Corporate Governance Statement in the Directors’ report.
Strategic Objective
Asciano’s strategic objective is to be Australia’s leading provider of critical logistics services within essential infrastructure-based supply chains. The Company intends to maintain its position in the market by delivering measurably superior outcomes for customers, thereby generating consistently attractive returns for shareholders.Specifically, Asciano will achieve its strategic objective through:
• being the most innovative and customer centric intermodal and bulk haulage rail operator in Australia;
• being the leading container terminal operator and general stevedore in Australia with a clear service distinction compared to our competitors; and
• developing integrated strategies and service offering to leverage group assets across ports and rail.
Asciano’s operations are generally capital intensive. they deliver value to shareholders through effective asset utilisation and allocating capital across its portfolio of businesses to generate returns in excess of its cost of capital. the Company’s objective is to generate a return on capital employed (“roCe”) that exceeds the Group’s weighted average cost of capital (“wACC”) by Fy16/17.
In delivering the strategic objective, Asciano’s core values are:
• Safety – we are committed to getting our people home safely every day;
• Customer – Supporting our customers to succeed is at the heart of all we do;
• People & Teamwork – working together in partnership is how we achieve our goals; and
• Performance – our decisions and actions focus on delivering superior performance outcomes.
Global markets• exposure to volatility in commodity
flows and domestic and global economic cycles
• Ability to access financial markets when required at a competitive cost of capital
Changes in government policy, investment decisions and regulation• Infrastructure capacity constraints and
disruptions caused by the failure to invest in critical infrastructure to meet the requirements of the market place
• Changes in the Australian Accounting Standards and the Income tax Assessment Act that could have a material impact on the Company’s financial statements in future periods
Operational risk• Infrastructure capacity constraints and
disruptions caused by the failure of critical It platforms and support
• Performance and reputation issues
• Disruption or loss of critical supply inputs including security breaches of It platforms
• Integration risks associated with acquisitions and business restructures including the impact on customer service levels
Operating & Financial
review
Asciano Limited8
For
per
sona
l use
onl
y

fy14 Earnings OverviewEarnings Summary
Twelve Months Ended 30 June ($‘m) 20136 2014 % chg
Underlying revenue and other income ¹ 3,727.7 3,994.6 7.2
Pacific National Coal 1,017.2 1,159.9 14.0
– pacific national coal (net of access) 842.4 956.0 13.5
Pacific National rail 1,360.9 1,329.1 (2.3)
terminals & Logistics 731.5 748.6 2.3
Bulk & Automotive Port Services 680.5 793.4 16.6
eliminations/unallocated (62.4) (36.4) (41.7)
Underlying EBITDA ² 992.7 1,052.0 6.0
underlying depreciation 261.9 285.1 8.9
Amortisation 44.8 46.6 4.0
Pacific National Coal 287.9 332.3 15.4
Pacific National rail 216.8 179.6 (17.2)
terminals & Logistics 150.1 150.3 0.1
Bulk & Automotive Port Services 89.0 89.5 0.6
Corporate (57.8) (31.4) (45.7)
Underlying EBIT 3 686.0 720.3 5.0
Net interest and associated costs (199.7) (225.3) 12.8
underlying profit ² before tax 486.3 495.0 1.8
underlying tax expense (141.4) (142.6) 0.8
outside equity interests (2.4) (2.6) 8.3
Underlying net profit4 after tax and minority interests 342.5 349.8 2.1
Material items before tax 5 (19.0) (136.3)
Material items after tax (8.1) (95.4)
Profit attributable to owners of Asciano Limited 334.4 254.4 (23.9)
Full time employees at year end 8,891 8,827 (0.7)
eBItDA margin net of coal access (%) 27.9 27.8 (0.1)
eBIt margin net of coal access (%) 19.3 19.0 (0.3)
underlying fully diluted ePS (¢) 35.0 35.8 2.3
Basic earnings per share (¢) 34.3 26.1 (23.9)
Diluted earnings per share (¢) 34.2 26.1 (23.7)
Diluted weighted average shares (m) 977.6 976.4 (0.1)
1. FY13 underlying revenue and other income excludes the $17.1m accounting gain in relation to the revaluation of the Company’s existing 50% shareholding in C3 following the acquisition of the outstanding 50% interest in November 2012.
2. Underlying EBITDA excludes material items of $60.6m (FY13 $14.9m). Details of the adjustments and a reconciliation between underlying EBITDA and statutory EBITDA are on page 10.
3. Underlying EBIT excludes material items of $136.3m (FY13 $19.0m). Details of the adjustments and a reconciliation between underlying EBIT and statutory EBIT is at page 12.
4. Underlying NPAT excludes material items of $95.4m (FY13 $8.1m). A reconciliation between underlying NPAT and statutory NPAT is at page 13.5. A breakdown of material items is on page 14.6. FY13 earnings have been restated to reflect the change in the Australian Accounting Standards Board (“AASB”) 119, accounting for employee benefits,
as reported in the FY13 financial accounts. The impact of the change is to reduce FY13 EBITDA and EBIT by an amount of $7.9m and FY13 NPAT by $5.6m.
Operating & Financial
review
Annual report 20149
For
per
sona
l use
onl
y

reconciliation of Statutory EBITDA to underlying EBITDA
Year Ended 30 June 2014 ($’m) Group PN Coal PN RailTerminals
& LogisticsBulk
& Auto Corporate
Statutory EBITDA 991.4 448.0 268.6 180.7 115.6 (21.5)
Port Botany redevelopment 16.4 16.4restructuring charges associated with Pacific National integration
29.4 12.7 16.7
restructuring charges – other 14.8 3.9 4.4 6.5 Total material items before tax 60.6 12.7 16.7 20.3 4.4 6.5 underlying eBItDA 1,052.0 460.7 285.3 201.0 120.0 (15.0)
Depreciation and Amortisation Depreciation and Amortisation pre-material items increased 8.1% over the pcp to $331.7m driven by:
• the significant capital expenditure program over the last three years; and
• the impact of the recently acquired Mountain Industries and the consolidation of C3 following the acquisition of the outstanding 50% interest in November 2012.
Depreciation and Amortisation is expected to increase in Fy15 to a range of $380-390m.
fy14 Earnings Overviewunderlying revenue and other income increased 7.2% on the pcp to $3.99bn over the 12 month period to 30 June 2014 (underlying revenue net of coal access increased 6.7% to $3.8bn) driven by:
• a 13.5% increase in revenue generated by PN Coal to $956m, driven by new contracts and a higher percentage of coal hauled versus contracted compared to the pcp;
• a 2.3% increase in revenue generated by the terminals & Logistics Division to $748.6m, driven by 3.9% increase in revenue generated from the Container terminals business over the 12 month period, a function of new contracts and market growth. revenue growth was impacted by a lower contribution from the Logistics business driven by soft economic conditions;
• a 2.3% decline in revenue generated by PN rail to $1.3bn, reflecting a 5.1% decline in intermodal volumes (“NtKs”) and a 35.8% decline in export grain volumes; and
• a 16.6% increase in revenue generated by Bulk & Automotive Port Services to $793.4m, driven by a full period contribution from New Zealand-based forestry marshalling and port services business C3 Limited (“C3”), an initial eight month contribution from recently acquired integrated logistics solutions supplier Mountain Industries, organic growth at some bulk ports around Australia and the inclusion of a settlement with the Port of Melbourne Corporation (“PoMC”). the net settlement of $25m was reached to cover the costs associated with transition arrangements and the loss of future profits associated with the early termination of lease agreements associated with the redevelopment of webb Dock in Melbourne. the settlement has been largely offset by related cash outlays in Fy14. (refer eBIt bridge on page 35 for more information on net contribution.)
Asciano’s eBItDA margin (net of coal access) was flat on the pcp at approximately 28%, a good result in light of the soft top line growth in some areas of the business and external pressures
on some costs. operating expenses increased 7.5% over the 12 month period driven by:
• the acquisition of Mountain Industries on 31 october 2013 and a full 12 month period of the consolidated C3 business acquired on 28 November 2012. excluding the impact of these acquisitions, operating expenses increased 4.3%;
• wage rises mandated by enterprise agreements of between 4 and 5% across the four Divisions;
• a 5.3% increase in rail access charges reflecting new contracts in PN Coal and the increase in the tonnes under contract hauled. this cost is passed through to customers;
• an increase in lease costs of 8% associated with both underlying increases in lease costs on existing sites and the acquisition of Mountain Industries and C3; and
• a 10.7% increase in fuel and oil costs reflecting on average 7% increase in fuel prices and a 21.6% increase in NtKs in the Coal division.
Operating & Financial
review
Asciano Limited10
For
per
sona
l use
onl
y

group underlying EBIT Bridge
($’m) Bridge to FY14 EBIT
FY14 actual
FY13 actual
FY13 underlying EBIT reported 693.8
Impact of AASB 119 (7.9)
FY13 underlying EBIT restated 686.0
Price/mix/volume 73.9
Costs (75.3)
Depreciation and amortisation (24.9) (331.7) (306.8)
BIP 33.6
Industrial disputes 4.8 (1.4) (6.2)
Incidents 12.2 (5.0) (17.2)
Asset sales (0.1) 26.0 26.1
Business restructure and other 3.8 2.3 (1.5)
Actuarial valuations 6.3 3.0 (3.3)
FY14 underlying EBIT 720.3 (306.8) (308.9)
the key items driving eBIt in Fy14 compared to Fy13 include:
• volume growth in coal haulage, container lifts and car processing;
• a full 12 month contribution from C3;
• a turnaround in the impact of actuarial valuations of $6.3m;
• “Business restructuring and other” includes the impact of the redevelopment of webb Dock and the redundancies and costs associated with the winding down of the Agility contract; and
• a significant decline in the impact of rail incidents during the year.
underlying net corporate costs at the eBIt level were $31.4m, the result included:
• a $15.5m contribution from the divestment of properties no longer considered strategic;
• a positive impact from the movement in actuarial valuations of $3m.
the Fy15 full year net corporate cost impact on eBIt is expected to be approximately $50-55m, prior to the impact of any actuarial valuations.
Business Improvement programBIP initiatives contributed $33.6m in benefits in Fy14 above the original target of $32m for the year. the cumulative benefits derived following the introduction of the BIP five year plan stood at $115m at 30 June 2014 compared to $98m forecast in the original five year plan. the five year Fy16 target was increased in Fy14 from $150m to $300m.
PN Rail Terminals & Logistics BAPS
Corporate PN Coal
Corporate 0.3
fy14 BIp Divisional Split ($’m)
4.4
15.5
11.5
1.9 Pacific National BAPS Terminals & Logistics Corporate
Cumulative BIp Savings under five year plan ($’m)
161
17
88
34
46
12
47
9
33
8
31
9777
16
FY12 FY13 FY14 FY16F
37
81
115
300
Operating & Financial
review
Annual report 201411
For
per
sona
l use
onl
y

reconciliation of Divisional Statutory EBIT to Divisional underlying EBIT
Year Ended 30 June 2014 ($’m) Group PN Coal PN Rail
Terminals
& Logistics
Bulk
& Auto Corporate
Statutory EBIT 584.0 307.1 123.0 107.5 85.1 (38.7)
Port Botany redevelopment 38.5 38.5
restructuring charges associated with Pacific National integration
81.8 25.2 56.6
restructuring charges – other 16.0 4.3 4.4 7.3 Total material items before tax 136.3 25.2 56.6 42.8 4.4 7.3 Underlying EBIT 720.3 332.3 179.6 150.3 89.5 (31.4)
the difference between the statutory reported eBIt and Asciano’s underlying eBIt relate to the items listed in the table above which have been treated as material items for the purposes of this report.
reconciliation of Statutory EBIT to underlying EBIT
Twelve Months Ended 30 June ($’m) 2013¹ 2014
Statutory EBIT 667.0 584.0
Port Botany restructuring charges 38.5restructuring charges associated with Pacific National integration 81.8restructuring charges – other 24.1 16.0Settlement of legacy issues associated with demerger 12.0C3 fair value revaluation (17.1)Underlying EBIT 686.0 720.31. FY13 earnings have been restated to reflect the change in the Australian Accounting Standards Board (“AASB”) 119, accounting for employee benefits,
as reported in the FY13 financial accounts. The impact of the change is to reduce FY13 EBIT by an amount of $7.9m.
reconciliation of Statutory Net financing Costs to Cash Net financing Costs
Twelve Months Ended 30 June ($’m) 2013 2014
Statutory net ¹ financing costs 199.7 225.3 Net accrued interest and borrowing costs 4.0 (13.1)Capitalised interest 10.7 10.2 CVA² adjustment on derivatives – (8.0) Fair value of derivatives 11.8 (13.5)other non-cash (6.2) (2.9)Cash net ¹ financing costs 220.0 198.0 1. Net of interest income.2. CVA – credit value adjustment as per introduction of AASB 13.
Cash net financing costs decreased 10% over the pcp; however, net statutory financing costs increased 12.8% over the pcp to $225.3m driven by:
• the introduction of the new accounting standard AASB 13† effective from 1 January 2013 impacting derivative fair values by $8.0m;
• increased borrowings; and
• the turnaround in the impact of mark to market valuation on interest rate swaps which do not qualify for the hedge accounting impacting Fy14 by $13.5m.
Fy15 net financing costs before the impact of mark to market movements are forecast to be in the range of $210–$215m.
† AASB 13 was introduced to provide a standard framework for determining the fair value of both financial (i.e. derivatives) and non-financial items. Under AASB 13 the concept of fair value has changed to include an adjustment for the impact of credit risk. The new standard requires fair value to be measured as a transfer price, which requires adjustment for credit risk of both Asciano and its counterparties to derivative instruments and other financial instruments measured at fair value. The changes apply prospectively from 1 July 2013 for Asciano. The changes bring Australian standards into line with FASB 157 and IAS 13 in this area.
Operating & Financial
review
Asciano Limited12
For
per
sona
l use
onl
y

Tax
Twelve Months Ended 30 June ($‘m) 20131 2014
Reconciliation of income tax expense to prima facie tax payable
Profit before tax 467.3 358.7
Income tax at 30% (2013: 30%) 140.2 107.6
recognition of capital losses (1.1) –Non-assessable income (5.1) –Franking credits on taxable dividends (3.7) (3.5)other 0.2 (2.4)Income tax expense recognised in the profit or loss 130.5 101.71. FY13 earnings were restated for a change in Australian Accounting Standards Board (“AASB”) 119, accounting for employee benefits, as reported in
the FY13 financial accounts. The impact is to reduce reported FY13 tax expense by $2.4m and FY13 statutory NPAT by $5.6m.
tax expense declined 22% to $101.7m. the effective tax rate (before material items) was 28.8% (29.1% in the pcp) broadly in line with the corporate tax rate of 30%.
reconciliation of Statutory NpAT to underlying NpAT
Twelve Months Ended 30 June ($’m) 20131 2014Statutory NPAT after minority interests 334.4 254.4 Port Botany restructuring charges 14.7 27.0 restructuring charges associated with Pacific National integration – 57.2 restructuring charges – other 2.2 11.2 Settlement of legacy issues associated with demerger 8.3 –C3 fair value revaluation (17.1) –Total material items after tax 8.1 95.4 Underlying NPAT after minority interests 342.5 349.8 1. FY13 earnings were restated for a change in Australian Accounting Standards Board (“AASB”) 119, accounting for employee benefits, as reported in the FY13 financial
accounts. The impact is to reduce reported FY13 tax expense by $2.4m and FY13 statutory NPAT by $5.6m.
the difference between the Fy14 statutory NPAt and Asciano’s underlying NPAt relate to the items listed in the table above which have been treated as material items for the purposes of this report.
120
0 h
rs
| tu
es
da
yeA
St S
wA
NSo
N D
oC
K, V
ICto
rIA
Operating & Financial
review
Annual report 201413
For
per
sona
l use
onl
y

Material ItemsMaterial items totalled to a pre-tax loss of $136.3m ($95.4m after tax) compared to $8.1m after tax in Fy13. Material items reported in the Fy14 result are detailed in the table below.
Twelve Months Ended 30 June 2014 ($’m) Cash costs
Non-cash costs Total
Port Botany restructuring charges – redundancies 10.5 – 10.5 – write-down of equipment 22.1 22.1 – other 5.9 – 5.9 Pacific National integration – redundancies 26.2 – 26.2 – write-down of equipment 52.4 52.4 – other 3.2 3.2 Other restructure – redundancies 11.9 11.9 – write-down of equipment 1.2 1.2 – other 2.9 – 2.9 Total 60.6 75.7 136.3 tax attributed to material items (18.2) (22.7) (40.9) Material items after tax 42.4 53.0 95.4
Cash costs incurred in Fy14 related to material items disclosed in Fy14 and Fy13 were $33.7m pre-tax. Material costs provided for in Fy13 and Fy14 that will impact cash flow in Fy15 amount to $41.1m pre-tax. these costs primarily relate to the redundancies and other costs that will be incurred following the completion of the redevelopment of Port Botany and the migration to a fully automated container terminal.
Material items reported in the Fy13 result was a loss of $8.1m and included:
• An accounting gain of $17.1m on the fair value revaluation of the 50% of C3 already owned by Asciano prior to the acquisition of the outstanding 50% in November 2012.
• Asciano restructuring charges of $24.1m pre-tax including:
– $21.7m pre-tax ($15.2m after tax) provision for redundancies and other costs associated with the Port Botany redevelopment. of this amount $3.5m relates to redundancies taken in the Fy13 period
– redundancy costs in PN rail and the information technology division related to business restructure pre-tax $2.4m ($1.7m after tax).
• Charges relating to legacy issues that occurred prior to or around the time of the demerger from toll in 2007 of $12.0m pre-tax ($8.3m post-tax).
Operating & Financial
review
Asciano Limited14
For
per
sona
l use
onl
y

Cash flow
Twelve Months Ended 30 June ($’m) 2013 2014 % chg
Underlying EBITDA 992.7 1,052.0 6.0 Material items eBItDA (15.0) (60.6) 304.0 Net operating working capital 12.7 13.1 3.1other non-cash items (2.6) (42.7) –Operating cash flow before interest and tax 987.8 961.8 (2.6)Net interest and other costs of finance paid (219.9) (198.0) (10.0)tax paid (170.4) (157.0) (7.9)Net operating cash flows 597.5 606.8 1.6 Net spend on PP&e and It2 (586.0) (619.7) 5.8 other investing cash flows1 (51.0) (84.3) 65.3 Financing cash flows (80.2) 234.8 (392.8)Net movement in cash (119.7) 137.6 (215.0)Cash conversion % (oCF before net finance costs and tax/eBItDA) 101 97 (4.0)1. Includes C3 acquisition of net A$52.4m in FY13 and the acquisition of Mountain Industries of net A$83.6m in FY14. 2. Includes proceeds from asset sales of $27.2m in FY13 and proceeds from asset sales of $81.5m in FY14.
Net operating cash flow after tax and net financing costs increased 1.6% versus pcp to $606.8m. Cash conversion declined to 97% due primarily to accruals and provisions related to the Port Botany redevelopment and redundancies provided for but not paid in Pacific National and Bulk Ports.
Free cash flow after capital expenditure for the full year was negative $12.9m. Free cash flow after capital expenditure in the 2h Fy14 was $60.9m reflecting an improvement in net working capital compared to 1h Fy14 and proceeds from the sale of a number of non-strategic property holdings in the order of $81.5m. Free cash flow after capital expenditure and acquisitions was negative $97.2m in Fy14; this includes the acquisition of Mountain Industries in october 2013.
Capital Expenditure
Twelve Months Ended June ($’m) 2013 2014 % chg
Total capital expenditure 601.3 753.7 25.3 Growth capital expenditure 363.4 483.4 33.0 Sustaining capital expenditure 237.9 270.3 13.6
See Divisional Summaries on pages 20, 28 and 32 for further information about divisional capital expenditure.yo
rK
eS C
ro
SSIN
G, S
ou
th A
uSt
rA
LIA
Mo
vin
g D
oM
esti
c fr
eig
Ht
1230
hr
s | t
ue
sd
ay
Operating & Financial
review
Annual report 201415
For
per
sona
l use
onl
y

Capital ExpenditureKey capital expenditure projects in Fy14 included:
• the redevelopment of Port Botany;
• the acquisition of four strategic rail terminal properties in Queensland;
• the repowering of the Nr class locomotives;
• rolling stock for new bulk contracts secured by Pacific National; and
• upgrade of Asciano’s It platforms.
87
36
123
133
142
275
28
20
48
37
241
278
Terminals & Logistics
PN RailPN Coal Bulk & Auto Port Services
Corporate
fy14 Capital Expenditure by Division ($’m)
Growth Capex Sustaining Capex
27
29
2
FY11 FY13 FY15FY12 FY14 FY16F
119163
238 270
600
300
397
87
187
176
176
100
595
62
235
416
858
601
754
Total capex in $600–700m range
$300–400m sustaining
capex range
Capital Expenditure Outlook ($’m)
Growth Capex – Coal Growth Capex – rest of Asciano Sustaining Capex
1600 hrs | t
uesday
Port oF G
eeLoNG, VIC
torIA
increAsin
g trADe in regio
nAl victoriA
Fy15 capital expenditure is expected to be in the range of $600–700m. Capital expenditure projects in Fy15 include:
• the completion of the upgrade of Port Botany;
• the webb Dock PDI facility;
• the ongoing program related to the repowering of the Nr class locomotives; and
• rolling stock for coal haulage contracts.
Operating & Financial
review
Asciano Limited16
For
per
sona
l use
onl
y

Balance Sheet Leverage Net debt to eBItDA (x)*
FY11 FY11FY12 FY12FY13 FY13FY14 FY14
3.1 3.0 2.8
Interest Cover eBItDA to net interest (x)*
3.7 4.2 4.8 5.32.9
Debt Maturity profile ($’m)
FY15 FY16 FY19 FY23FY17 FY20 FY24FY18 FY22FY21
650
429
728
650 643
243
514
Undrawn bank facilities at 30 June 2014
BondsDrawn bank facilities at 30 June 2014
EMTN Program
Balance SheetNet debt and net interest cover
($’m) June 13 Dec 13 June 14
Gross borrowings at hedged values 2,854.4 3,118.2 3,208.0 Debt issuance costs (18.7) (20.3) (22.5) FX and fair value adjustments to bonds 235.2 313.9 185.1 Borrowings per balance sheet 3,070.9 3,411.8 3,370.6 Cash (29.7) (73.4) (167.3) Net debt 3,041.2 3,338.4 3,203.3 Leverage (net debt to eBItDA) (times)¹ 2.8 3.0 2.9Interest cover (times)² 4.8 5.2 5.31. Net interest and EBITDA based on a rolling 12 month period. Net debt is net of hedges.2. Includes capitalised interest, excludes non-cash items and mark to market.
* Net interest and EBITDA based on rolling 12 month period and includes capitalised interest. Excludes mark to market and other non cash items
Debt maturity profile Asciano has no debt due until September 2015 and a weighted average maturity of 4.9 years.
At 30 June 2014 the Company had a diversified mix of funding sources with approximately two-thirds of total available funding raised in international debt capital markets and the remaining capacity from a syndicate of 11 banks.
Asciano currently has a split credit rating, Moody’s rating is Baa2 (Stable) and Standard & Poor’s (S&P) rating is BBB- (Positive outlook). S&P has determined that for Asciano to move to BBB rating it must be sustainably reporting the following key financial metrics:
• funds from operations (FFo)/debt comfortably above 17.5%;
• gross eBItDA/Interest >3.0x; and
• positive free cash flow after capital expenditure.
Asciano has already met two of these three criteria for a ratings upgrade and moved into positive free cash flow after its capital expenditure position in 2h Fy14 in line with projections at the beginning of the year. Asciano expects to improve its free cash flow position further in Fy15 and Fy16.
At 30 June 2014 Asciano’s rolling 12 month net debt to eBItDA was 2.9x, within the Company’s target range of 2.5-3.0x. Gross debt net of cash at hedged values increased 5.3% over the 12 month period. the rolling 12 month interest cover was 5.3x compared to 4.8x at 30 June 2013, comfortably above the Company’s target of greater than 3.5x.
At 30 June 2014 the interest rate on approximately 71% of the Company’s debt was fixed.
Operating & Financial
review
Annual report 201417
For
per
sona
l use
onl
y

reconciliation of Loans and Borrowings
Facility Type MaturityDrawn
A$’mUndrawn
A$’m
Syndicated bank facility revolving cash advance oct-16 650.0 – Syndicated bank facility revolving cash advance oct-19 – 650.0 uS$ bonds 1 144a/ reg S Sep-15 428.8 uS$ bonds 1 144a/ reg S Apr-18 727.6 uS$ bonds 1 144a/ reg S Sep-20 643.2 uS$ bonds 1 144a/ reg S Apr-23 242.6 GBP bonds 1
eMtN Sep-23 514.0
Total hedged A$ equivalent balance 3,206.2 650.0Less: unamortised discount on uS$ bonds and GBP notes (5.9) Less: unamortised debt issuance costs (16.6) Add: unrealised foreign exchange loss on uS$ bond and GBP notes 108.3 Add: fair value adjustments to uS$ bonds 76.8 Add: C3 finance lease 1.8 Loans and borrowings as per statutory balance sheet at 30 June 2014 3,370.6 Cash and liquid assets as at 30 June 2014 (167.3) 167.3 Net debt/available liquidity as at 30 June 2014 3,203.3 817.3
1. Outstanding amounts for international issues are shown at the hedged A$ balances.
Available liquidity at 30 June 2014 was $817.3m consisting of $167.3m in cash and $650m in undrawn bank facilities.
reconciliation of Drawn Bank Debt and the Statutory Balance Sheet
($’m) June 2013 Dec 2013 June 2014
Drawn bank debt (excluding bank guarantees) 810.0 560.0 650.0 uS$ bonds (at hedged values) 2,042.2 2,042.2 2,042.2 GBP notes (at hedged values) 514.0 514.0 Less: unamortised discount on uS$ bonds (5.1) (6.4) (5.9) Less: unamortised debt issuance costs (13.6) (14.0) (16.6)Add (Less): unrealised foreign exchange movement on uS$ bonds and GBP notes 146.7 243.5 108.4 Add: fair value adjustments to uS$ bonds 88.5 70.5 76.8 Add: C3 finance lease 2.2 2.0 1.8 Loans and borrowings as per statutory balance sheet 3,070.9 3,411.8 3,370.6
Impact of the Mountain Industries Acquisition the acquisition of Newcastle-based logistics solution provider Mountain Industries was completed on 31 october 2013. the Fy14 Bulk & Automotive Port Services result includes an eight month eBIt contribution from Mountain Industries of $0.3m. the contribution in Fy14 was impacted by the drought in Northern NSw and Queensland on export grain volumes and the provision for a doubtful debt of $1.9m. the net cash consideration for the business was $83.6m. the consolidation of the business on the balance sheet included:
• Land & property, plant and equipment of $60.5m
• Goodwill of $21.7m
Operating & Financial
review
Asciano Limited18
For
per
sona
l use
onl
y

Shareholder returns
Year Ended June (%) FY13 FY14 bps chg
roCe 10.9 10.7 (23bps)roCe (excluding wIP) 12.2 11.7 (55bps)roCe (excluding goodwill) 18.5 17.5 (102bps)roe (pre-material items) 9.9 9.5 (45bps)Divisional ROCE Pacific National Coal* 10.9 13.1 220bpsPacific National Coal (excluding wIP)* 13.2 14.1 82bpsPacific National rail 15.2 11.6 (358bps)terminals & Logistics 7.2 6.8 (37bps)terminals & Logistics (excluding goodwill) 25.8 21.4 (436bps)terminals & Logistics (excluding wIP) 7.7 7.5 (18bps)Bulk & Automotive Port Services 20.8 15.5 (528bps)* FY13 ROCE calculated before the gain on the sale of Kooragang Island of $21.5m.
Group roCe has been impacted by the significant asset refresh program that has been carried out over the last few years combined with soft top line growth in some areas of the business. work in progress (PP&e and It) over the 12 month period increased from $499.8m to $699.0m driven primarily by the capital invested in the Port Botany redevelopment.
the focus of the Group will be on ensuring that the investment over the last few years is leveraged to drive further growth and improve returns. Asciano is targeting roCe above its cost of capital in Fy16/17.
Dividends
Year Ended June (cps) FY13 FY14 % chg
Interim dividend 5.25 5.75 9.5 Final dividend 6.25 8.50 36.0Full year dividend 11.5 14.25 23.9Payout ratio (%) 32.7 39.7 700bps
23.9% increase in Fy14 total dividend on pcp represents payout ratio of 39.7%.
the Board has resolved to pay a fully franked final dividend of 8.50 cents per share, an increase of 36% over the pcp representing a payout ratio of 51%. this takes the full year dividend to a fully franked dividend of 14.25 cents per share, an increase of 23.9% on the pcp and represents a full year payout ratio of 39.7%. 23.9%
Increase in full year dividend
1800 hrs | tuesday
MouNt MAuNGANuI, New ZeALANDstoring logs for export
Operating & Financial
review
Annual report 201419
For
per
sona
l use
onl
y

130
0 h
rs
| tu
es
da
yw
IND
Ah
, Qu
eeN
SLA
ND
M
ovi
ng
Au
strA
liA’
s co
Al
expo
rts
pACIfIC NATIONAL IS ONE Of ThE
LArgEST prOvIDErS Of rAIL frEIghT
SErvICES IN AuSTrALIA
pacific National
In February 2014, Asciano announced the decision to integrate its two rail divisions, Pacific National Rail and
Pacific National Coal. For the purposes of external reporting in FY14 the Company has maintained two
separate reporting entities.
David IrwinDirector, Pacific National
Operating & Financial
review
Asciano Limited20
For
per
sona
l use
onl
y

Business OverviewPacific National is one of the largest providers of rail freight services in Australia. Services are provided in the containerised, break bulk and bulk markets.
Pacific National has two broad business activities, National Intermodal freight haulage and Bulk haulage.
National Intermodal Pacific National provides interstate containerised freight services, interstate break bulk freight (steel), regional freight rail services in Queensland and hook and pull services for passenger trains. Pacific National has approximately 70% market share of the long haul intermodal market in Australia.
Pacific National’s intermodal customers include the largest freight forwarding companies in Australia including Linfox, toll, K&S, rand, Sadleirs and the steel manufacturers BlueScope Steel and Arrium. Contracts vary in length but are generally 5-10 years. the terms of the intermodal contracts vary, some have take or pay elements while others do not have volume commitments.
Bulk HaulagePacific National hauls a range of bulk goods by rail including coal, grain for domestic and export markets, minerals, concentrate and construction materials for customers around Australia. Pacific
National is the second largest coal rail haulage provider in Australia, performing over 41% export coal haulage activities from mine to port and in addition hauls coal for domestic use from mine to power stations and steelworks primarily in New South wales and Queensland. Pacific National also hauls coal by rail in South Australia servicing the local electricity industry.
the Bulk haulage business is divided into two geographically focused regions:
• Queensland – Pacific National entered the bulk haulage market in Queensland in 2009, securing coal haulage contracts with a number of customers in the coal chains of Central Queensland. the Division currently services mines in the Bowen Basin through the Goonyella, Blackwater and Newlands coal chain systems. In Fy14, Pacific National Coal hauled an estimated 30% (NtKs) of the Queensland coal haulage market, up from an estimated 21% in Fy13. the Division also has a contract to haul concentrates from Mt Isa and will continue to look for opportunities to expand its activities in the bulk sector in Queensland.
In Queensland, Pacific National’s major customers include Anglo American, BhP Mitsui Coal Glencore and rio tinto.
• South east Australia – Pacific National has had a long-term presence in the bulk haulage market in South east Australia. In NSw, Pacific National Coal is the largest coal hauler with an estimated 72% market share (NtKs). the company services the mines of the NSw hunter Valley, Illawarra, Lithgow, Mudgee and Gunnedah regions, hauling export coal into the ports of Newcastle and Port Kembla as well as domestic coal to power stations and steelworks located in NSw. An estimated 80% of the NSw coal market is thermal coal.
In South Australia, Pacific National hauls coal from the Leigh Creek coal mine to the power stations in Port Augusta for the supply of base load power to the state of South Australia.
the business operates short and medium distance intrastate services in NSw and Victoria hauling bulk freight including grain for domestic and export markets, minerals and construction materials. Pacific National hauls an estimated 75% of grain hauled by rail on the east coast of Australia.
Bulk haulage customers include rio tinto, whitehaven, Idemitsu, Graincorp, Manildra, Cargill, emerald, Boral, Glencore and holcim.
Contracts in Bulk haulage vary in length from 2-10 years and generally have take or pay or volume commitments.
key Business risksthe key business risks impacting Pacific National’s business are covered in the overarching business risks listed on page 8. Specific examples of these risks as they pertain to Pacific National’s business include:
Global demand for coal and other bulk resources and agricultural products• Global economic activity and in
particular growth in emerging markets, including India and China and the impact on demand for Australian coal exports
• the focus globally on the expansion of renewable and lower emission energy alternatives which could reduce the demand for thermal coal over time
• Demand and global supply of bulk resources and agricultural products including grain and timber
Strategic Objective
Pacific National’s strategy is to be the recognised market leader for bulk and intermodal rail freight in Australia, characterised by superior customer service and a focus on innovative solutions. Pursuing this strategy involves actively managing and utilising its locomotive and wagon fleet to ensure operating costs are optimised and our customers receive innovative and competitive services to fulfill their specific requirements. Focusing on customer needs and delivering innovative outcomes, combined with the scale of its operations and effective asset utilisation, underpin the Division’s sustainable competitive advantage.
Operating & Financial
review
Annual report 201421
For
per
sona
l use
onl
y

key Business Statistics as at 30 june 2014
Total annualised contracted coal tonnage in FY15¹ (m) 182.5
Estimated market share Coal (%)²– NSw total domestic and export 72.4%– Queensland 30.0%National Intermodal ~70%Number of locomotives 578Number of wagons 11,666Total insured value of fleet ($) 3.93b
Full time employees³ 3,771
Strategic rail facilities Nebo, Cairns, townsville, Mackay, rockhampton, Brisbane (Queensland),
Greta (hunter Valley, NSw), Adelaide, Kewdale (Perth), Chullora (Sydney), and Melbourne.
Average weighted coal contract maturity (years) 7.961. Does not include 4mtpa contract with Bandanna Energy; contract originally scheduled to commence 1 July 2014 now delayed. 2. Based on FY14 total domestic and export rolling 12 months NTK haulage against estimated total NTKs. 3. As at 30 June. Following the end of the period a further 157 employees have or will be made redundant. The cost of these redundancies is provided for in this result.
Customer demand for above rail haulage services• Sustained low thermal and
metallurgical coal prices and the impact lower prices may have on the viability of existing mines and small miners and the expansion plans of the coal miners
• the impact of seasonal weather patterns, in particular the wet season in Northern Australia
• the impact of a strong Australian dollar on coal mine viability and competitiveness
• Impact of weather on agricultural cycles and therefore volumes
• Movements in the competitive effectiveness of competing freight transport modes
Impact of competition on access to labour and infrastructure resources• Skills shortages driven by the ongoing
demand for labour from the mining related sectors of the Australian economy and its impact on wage inflation
• Coal chain infrastructure capacity, productivity and reliability including rail and coal port infrastructure
Impact of competition from other above rail operators and alternative transport modes• the expiry risk attached to major
contracts and the associated risk of stranded assets if contracts are not renewed
Australian GDP growth• Domestic economic growth and the
impact on demand for the movement of consumer goods across Australia
• Domestic construction cycle and the impact on the demand and movement of a range of building materials (including steel products) around the country
• Population growth and its impact on demand for goods
Ongoing below rail infrastructure investment to support growth in demandPacific National mitigates these risks through the use of performance-based take or pay contracts where significant capital investment is required, the effective management of its people and the rolling stock fleet across the Asciano Group and a focus on continually seeking ways to improve performance and customer satisfaction. It should be noted that not all of the above risks are within the direct control of Pacific National.
Operating & Financial
review
Asciano Limited22
For
per
sona
l use
onl
y

pacific National Coal fy14 Earnings and volume Overview
Twelve Months Ended 30 June 2013 2014 % chg
Volume – total NtK (m) 24,038.8 29,227.1 21.6 Queensland (m) 9,248.0 12,810.2 38.5South east Australia (m) 14,790.8 16,416.9 11.0Volume – total tonnes (m) 138.5 159.0 14.8 Queensland (m) 37.5 51.5 37.3South east Australia (m) 101.0 107.5 6.4revenue and other income ($’m) 1,017.2 1,159.9 14.0 Access revenue ($’m) 174.8 203.9 16.6 Revenue net of access ($’m) 842.4 956.0 13.5 underlying eBItDA ($’m) 407.5 460.7 13.1 Underlying EBIT ($’m) 287.9 332.3 15.4 operating eBItDA margin (%) (net of access)¹ 47.0 48.2 1.2 operating eBIt margin (%) (net of access)¹ 32.5 34.8 2.3 roCe (%)¹ 10.9 13.1roCe excl wIP (%)¹ 13.2 14.1Cash conversion (%) (operating cash flow/eBItDA) 90.5 90 (0.6)total capex ($’m) 209.5 123.0 (41.3)Growth capex ($’m) 176.2 87.4 (50.4)Sustaining capex ($’m) 33.3 35.6 6.9 Gain on asset sale ($’m) 21.5 – –1. Calculated before the gain on the Kooragang Island land sale of $21.5m.
PN Coal reported an increase in total revenue (net of access) of 13.5% over the pcp to $956m. operating revenue* net of access grew 16.5% over the pcp driven by a 14.8% increase in tonnes and 21.6% increase in NtKs. tonnage hauled over the 12 month period versus contracted was approximately 88.8% compared to 82% in the pcp.
tonnage hauled in South eastern Australia (“SeA”) increased 6.4% and NtKs hauled increased 11% over the period. the increase was driven by strong growth in the northern SeA region with a lower rate of growth in the southern SeA region. the performance of the SeA business was impacted by a range of factors including:
• an increase in the percentage of coal hauled versus contracted from 82.3% in the pcp to 88.8%, reflecting an increase in production and export of thermal coal;
• good organic growth in the hunter Valley coal chain volumes, in particular growth in volumes from the Gunnedah Basin region;
• improvement in the performance of the hunter Valley coal chain, including a reduction in cycle times, has contributed a positive impact on tonnage moving through the system; and
• volumes moved into Port Kembla were stronger than the pcp.
tonnage hauled in Queensland increased 37.3% on the pcp and NtKs increased 38.5% on the pcp. the result was driven by a number of factors including:
• a full year contribution from the 4.2mtpa contract with BhP Mitsui Coal (“BMC”) which commenced on 1 January 2013;
• a seven month contribution from the new 8.5mtpa contract with rio tinto Coal Australia which commenced in November 2013 for its hail Creek and Kestral mines; and
• an increase in the percentage of coal hauled versus contracted from 77.3% in the pcp to 88.6% which reflected an increase in export demand.
underlying eBItDA increased 13.1% to $460.7m, operating eBItDA* increased 19.4% to $460.7m.
* Increase calculated before the contribution from the proceeds of the Kooragang Island land sale in FY13.
Footnote ‘9’ is missing13.5%
Increase in total revenue (net of access)
Operating & Financial
review
Annual report 201423
For
per
sona
l use
onl
y

pacific National Coal EBIT Bridge
($’m) Bridge to FY14 EBIT
FY14 actual
FY13 actual
FY13 EBIT 287.9 Price/mix/volume 96.3 Costs (38.6) BIP 1.9 Depreciation and amortisation (8.7) (128.3) (119.6)Incidents 13.0 (1.5) (14.5) Sale of Kooragang Island land (21.5) 21.5 Industrial disputes 2.0 (2.0) FY14 underlying EBIT 332.3 (129.8) (114.6)
‡ Calculated before the contribution from the Kooragang Island sale in FY13.
underlying eBIt increased 15.4% to $332.3m. operating‡ eBIt increased 24.7% on the pcp. the result was impacted by:
• significant growth in volumes over the period and an increase in the distances hauled;
• an increase in the percentage of tonnes hauled versus contracted over the pcp;
• depreciation and amortisation over the period increased 7.3% to $128.3m reflecting the completion of Greta and Nebo train support facilities in Fy13 and the commencement of the depreciation of rolling stock utilised on new contracts commenced during the 12 month period; and
• business improvement initiatives associated with the hunter Valley Coal Chain cycle time trials had a positive impact on earnings directly as well as indirectly by driving a significant increase in the throughput of the coal chain system as a whole.
Capital expenditure over the period declined 41.3% to $123m. Capital expenditure over the 12 month period included investment in new rolling stock for contracts commencing in Fy14/15.
roCe‡ improved from 10.9% in the pcp to 13.1%.
the Division reported a pre-tax material item of $25.2m for the full year related to the costs associated with the merger of the two Pacific National divisions. of this item $12.7m represents cash costs primarily associated with redundancies, the majority of which were made in Fy14. the residual $12.5m represents the non-cash related write-down of rolling stock following the integration of the two rolling stock fleets.
1400 hrs | t
uesday
wIN
DAh, QueeNSLAND
Movin
g AustrAliA’s coAl exports
Operating & Financial
review
Asciano Limited24
For
per
sona
l use
onl
y

pacific National rail fy14 Earnings and volume Overview
Twelve Months Ended 30 June 2013 2014 % chgIntermodal – NtK (m) 22,657.3 21,492.1 (5.1)Intermodal – teu (‘000) 674.1 652.8 (3.2)Bulk – NtK (m) 6,009.6 5,114.8 (14.9)Bulk – tonnes (‘000) 16,760.2 14,775.8 (11.8)Steel tonnes (‘000) 2,821.5 2,923.8 3.6 Revenue and other income ($’m) 1,360.9 1,329.1 (2.3)underlying eBItDA ($’m)¹ 316.2 285.3 (9.8)Underlying EBIT ($’m)¹ 216.8 179.6 (17.2)underlying eBItDA margin¹ (%) 23.2 21.5 (1.7)underlying eBIt margin¹ (%) 15.9 13.5 (2.4)roCe (%) 15.2 11.6Cash conversion (%) (operating cash flow/eBItDA) 100.3 103.5 3.2total capex ($’m) 174.1 275.0 58.0 Growth capex ($’m) 75.5 132.7 75.8 Sustaining capex ($’m) 98.6 142.4 44.4 Gain on asset sales ($’m) 6.1 10.6 73.81. Pre-material items.
Pacific National rail reported a 2.3% decline in revenue over the pcp to $1.3bn. the result reflects a 5.1% decline in Intermodal NtKs and a 14.9% decline in Bulk rail NtKs.
total intermodal revenue was flat on the pcp driven by:
• a 5.1% decrease in total NtKs driven primarily by a 6.1% decline in east-west volumes. this was predominantly due to lower Forwarder volumes resulting in the consolidation of freight on a reduced number of Forwarder services. Volume heading back east was also down due to a decline in empty containers. the volume decline primarily reflects a very short peak season and the absence of a ramp up in volumes leading into the peak season compared to the pcp. Long haul north-south volumes were also weak; however, short haul volume north-south was up, reflecting a shift in modal use in the face of weak industry volumes overall;
• express volumes were down 3.4% over the period. Despite the decline in the contribution, demand for express services continues to be stronger than for standard Forwarder services reflecting ongoing above market demand by the customer base for “just in time” freight services and new express service offerings on the east coast corridors;
• automotive volumes increased 23.7% following the release of the new holden, reversing some of the sharp declines in recent years and customer repositioning of stock; and
• steel volumes increased 3.6% over the pcp.
Bulk revenue declined 7.7% driven by:
• a 35.8% decline in export grain volumes driven by the timing of harvest and shipping intentions and materially lower harvests in northern NSw and southern Queensland due to drought affected crops. though partly protected by the take or pay arrangements with export grain customers, the capacity utilisation and variation of contracted trains was significantly lower in Fy14 than the pcp; and
• increases in minerals and construction volumes due to the commencement of new contracts.
eBItDA declined 9.8% over the pcp to $285.3m. operating expenses were flat over the 12 month period driven by:
• a 6.1% decline in maintenance costs resulting from the renegotiation of its maintenance contract to a variable contract linked to usage and the initial impacts from investment in new equipment across the Division;
• a 3.3% increase in labour cost which was achieved despite the base line increase in wages of approximately 4% embedded in enterprise agreements across the Division; and
• a 1.3% decline in fuel costs over the period despite an average 7% increase in prices, which is recovered via a higher fuel surcharge, reflecting reduced services in response to lower volumes and improved fuel consumption.
BIP initiatives delivered sustainable cost savings of $11.5m. Programs that contributed to this included savings on asset management through a new contract with the maintenance provider, improved fuel consumption and crew optimisation. PN rail has now exceeded its five year plan to Fy16 to deliver $40m with cumulative total sustainable savings of $44.5m.
BIP initiatives within the integrated Pacific National Division will continue to focus on the six sigma programs developed in PN rail as well as ensuring that the benefits of the integration of the two divisions are delivered. the combined Pacific National Division is forecast to deliver $161m in cumulative benefits by the end of Fy16.
Operating & Financial
review
Annual report 201425
For
per
sona
l use
onl
y

pacific National rail underlying EBIT Bridge
($’m)
Bridge to FY14 underlying EBIT
FY14 actual
FY13 actual
FY13 underlying EBIT 216.8 Price/mix/volume (40.5)
Costs (7.2) BIP 11.5 Depreciation and amortisation (6.2) (105.6) (99.4)Asset sales 6.0 10.6 4.6 Incidents (0.8) (3.5) (2.7) FY14 underlying EBIT 179.6 (98.5) (97.5)
underlying eBIt declined 17.2% to $179.6m driven by:
• lower volumes reported in both Intermodal and export grain offset to an extent by higher volumes in steel and construction materials;
• depreciation and amortisation charges increased 6.2% over the period; and
• asset sales in the period reflect the sale of one parcel of property in Adelaide no longer required for the business.
Capital expenditure increased 58% over pcp to $275.0m. Sustaining capital expenditure increased 44.4% on pcp to $142.4m, reflecting the scheduled maintenance program currently underway on the locomotive fleet and spend on the upgrade of the freight terminal network. Growth capital expenditure increased 75.8% to $132.7m and reflects spend on rolling stock required for new export grain services for emerald, new express services and the hot rolled Coil steel services.
roCe declined from 15.2% to 11.6% over the 12 month period, reflecting the weak top line growth combined with additional investment in the Pacific National rail fleet and facilities to cement its competitive position and ensure customer service is improved including the acquisition of the toll intermodal terminals in Queensland. wIP at the end of the period was $174.8m, roCe excluding wIP was 12.9%.
the Division reported a pre-tax material item of $56.6m related to the costs of the merger of the two rail divisions. Cash costs, primarily related to redundancies, were $16.7m, the majority of these costs were made in the Fy14 period. the
$39.9m non-cash impact of the integration relates to the write-down in the value of older rolling stock following the integration of the two rail fleets.
In total across the merged Pacific National Division 106 locomotives and 1,874 wagons will be scrapped following the integration of the two fleets.
Following the end of the 12 month period, a further 157 employees across the two rail divisions have or will be made redundant. the cost of these redundancies was provided for in this result.
1500 hrs | tuesday
VALeS PoINt, New South w
ALeS
Moving coAl for DoMestic use
Operating & Financial
review
Asciano Limited26
For
per
sona
l use
onl
y

pacific National OutlookPacific National is expected to report higher earnings across both Intermodal and Bulk in Fy15. the Division’s performance and strategic focus will be driven by:
• the business improvement benefits and other cost savings associated with the integration of the two divisions. the ultimate aim is to sustainably reduce the cost base of the combined Division by 10%;
• capital expenditure for Pacific National in Fy15 is expected to be in the range of $320-340m;
• intermodal volumes will reflect activity levels in the Australian economy and a normalisation of demand following a number of years of very strong growth in western Australia. Asciano is not forecasting a significant lift in the intermodal market in Fy15;
• intermodal volumes will also be impacted by activity levels under the new agreement entered into in July 2012 with BlueScope Steel and Arrium for the continued provision of line haul services to both companies. existing arrangements expire on 31 December 2014 and the new agreement commences 1 January 2015 for a minimum period of seven years;
§ Refer ASX announcement released 23 December 2013 “Pacific National Rail extends and expands relationship with Toll Group”.
• activity levels will also be impacted by the ability to grow the Queensland intermodal business in Fy15 following the signing of a new rail services agreement with toll Group, which commenced 1 February 2014§;
• export grain volumes will be dependent on grain harvest levels and customer decisions around the timing of shipping grain. In Fy15, the Division is contracted to run a minimum of 12 trains; however, the number of trains and the utilisation may be impacted by lower rainfall in Queensland and Northern NSw which may divert export grain from southern NSw/Victoria to the domestic markets in the north;
• bulk volumes will benefit from a contract for haulage from Boral’s new Peppertree quarry that commenced in 4Q Fy14, a full year benefit from a new iron ore haulage contract with Mineral resources in western Australia and a contract to haul aggregate for holcim from the Linwood quarry commencing in Q4 Fy15;
• coal volumes hauled will be impacted by the proportion of coal hauled versus contracted. this rate can be impacted by factors including export coal demand, weather and production levels at the mine;
• the full year contribution from a 10 year performance-based contract with rio tinto Coal Australia that commenced in November 2013 for its hail Creek and Kestral mines;
• the ongoing impact of the hunter Valley planning and operational improvements and the improvement in the efficiency of the coal chain;
• the recently secured 12 year coal haulage agreement with the QCoal Group (“QCoal”). the new contract will see PN Coal haul up to 4mtpa from QCoal’s Drake coal project to the Abbot Point coal terminal near Bowen, Queensland. haulage is expected to commence in Fy16 and will be provided on a take or pay basis in line with production ramp-up at the mine; and
• the start-up of Bandanna energy’s Springsure Creek mine in Central Queensland, and the 4mtpa take or pay contract for coal haulage from the mine currently expected to now commence in Fy17.
Pacific National’s longer term outlook will be influenced by the level of GDP growth in Australia and the global demand for Australian thermal and metallurgical coal and other bulk commodities.
1430 hrs | tuesday
MeLBourNe FreIGht terMINAL,VICtorIA
unloADing contAineriseD iMports
Operating & Financial
review
Annual report 201427
For
per
sona
l use
onl
y

pATrICk’S MArkET ShArE fOr ThE
12 MONTh pErIOD ACrOSS ThE fOur TErMINALS wAS 48.5%, up frOM
47.5% IN ThE prEvIOuS COrrESpONDINg
pErIOD
patrick Terminals & Logistics
The Division is investing significant capital to sustain its competitive advantage. This will deliver a
superior customer service footprint and an operating model that is the lowest cost in the industry,
operating at productivity levels that provide a superior and reliable service to customers.
Alistair FieldDirector, Patrick Terminals & Logistics
1730 hrs | t
uesday
BrISBANe AutoStrAD terMINAL, Q
ueeNSLAND
steveDoring AustrAliA’s exports
Operating & Financial
review
Asciano Limited28
For
per
sona
l use
onl
y

Business Overviewthe terminals & Logistics Division operates in the market under the Patrick brand name. Patrick is one of two major competitors in the Australian market, providing container stevedoring services in the four largest container ports in Australia; east Swanson Dock in Melbourne, Port Botany in Sydney, Fisherman Islands in Brisbane and Fremantle in western Australia. A third entrant has recently commenced competing services in Brisbane and Sydney. A further entrant is expected to commence activities in the Melbourne market in 2017. Patrick’s market share for the 12 month period across the four terminals was 48.5% (based on contracted lifts, does not include subcontracted volume).
Patrick’s key customers in the terminals business are global shipping lines. Contracts are generally 3-5 years in length. Most contracts have pro forma volume estimates; however, they do not have specific volume commitments. Patrick is compensated on a per lift basis.
the Division has built an integrated port related logistics service offering, establishing the connection between the shipping lines, freight forwarders and the beneficial freight owner.
key Business risksthe key business risks impacting the terminals & Logistics business are covered in the overarching business risks listed on page 8. Specific examples of these risks as they pertain to the terminals & Logistics business include:
Australian GDP growth• GDP and population growth and the
flow-on impact to domestic demand and thus container volume growth
• the impact of the Australian dollar on the outsourcing of the Australian manufacturing sector and the general growth rate in the levels of imported product into Australia
The impact of commodity cycles on the growth in containerised exports
Increased competition• the impact on both volumes and
margins of new competition into the container ports Patrick operates in Australia
• Successful negotiation of long-term access, on acceptable terms, at Fremantle Port following the end of the current lease term in 2017
Customer consolidation• ongoing consolidation of the global
container shipping line market and potential changes to shipping consortia
Customer service• the execution of the Port Botany
automation and redevelopment project within the specified timeline and budget while minimising the impact on customers
• Loss of a major customer due to poor service standards or pricing
Industrial relations• the industrial relations environment
in Australia and specifically the activities of the Maritime union of Australia and its impact on our customer service performance
terminals & Logistics mitigates these risks through the effective management of its cost base; investment in capital equipment and technology to improve productivity and customer service; employing a robust project management framework; and an increased focus on employee engagement. It should be noted that not all of these risks are within the direct control of terminals & Logistics.
Strategic Objective
Terminals & Logistics’ key business objective is to be the market leader in Australian container terminals and port related supply chain services. The Division is investing significant capital to sustain its competitive advantage. This will deliver a superior customer service footprint and an operating model that is the lowest cost in the industry, operating at productivity levels that provide a superior and reliable service to customers.
$748.62,977.5
MILLION Fy14 revenue up 2.3% on previous
corresponding period
(‘000) teus handled
Operating & Financial
review
Annual report 201429
For
per
sona
l use
onl
y

key Business Statistics as at 30 june 2014
Container terminal presence
Lease term Footprint Equipment
Port Botany 2043 1,000 mtrs quay line, following completion of the knuckle 1,400mtrs3 berths (4 berths post knuckle)
8 cranes, 48 straddle carriers and other cargo handling equipment
east Swanson Dock 2034
885 mtrs quay line
3 berths 8 cranes, 49 straddle carriers and other cargo handling equipment
Fisherman Islands 2045
922 mtrs quay line
3 berths 4 cranes, 30 straddle carriers and other cargo handling equipment
Fremantle 2017
766 mtrs quay line
2 berths4 cranes, 41 cargo handling pieces of equipment
Key customers AAA consortium, CoSCo, Maersk, MSC
fy14 Earnings and volume Overview
Twelve Months Ended 30 June 2013 2014 % chgContainer volumes terminal volumes – Lifts (‘000) 1,938.8 2,011.0 3.7 terminal volumes – teu (‘000)¹ 2,908.7 2,977.5 2.4 Revenue and other income ($’m) 731.5 748.6 2.3 underlying eBItDA² ($’m) 197.7 201.0 1.7Underlying EBIT² ($’m) 150.1 150.3 0.1 underlying eBItDA margin (%) 27.0 26.9 (0.1)underlying eBIt margin (%) 20.5 20.1 (0.4)roCe (%) 7.2 6.8 (37bps)roCe excl wIP (%) 7.7 7.5 (18bps)roCe excluding goodwill (%) 25.8 21.4 –Cash conversion (%) (operating cash flow/eBItDA) 107.5 105.0 (2.5)total capex ($’m) 152.1 278.1 82.8 Growth capex ($’m) 81.0 240.7 197.2 Sustaining capex ($’m) 71.1 37.4 (47.4)Number of employees (Ftes) 1,831 1,894 3.41. TEU–twenty foot equivalent unit.2. Pre-material items.
terminals & Logistics reported a 2.3% increase in revenue to $748.6m on the pcp. revenue was driven by:
• a 3.9% increase in revenue from the Container terminals business over the pcp driven by a 3.7% increase in container lifts over the period. Lifts increased in Port Botany, east Swanson Dock and Fremantle compared to the pcp; however, lifts were down on the pcp in Fisherman Islands;
• a six month contribution from the commencement of a new service at Fremantle with K-Line and the contribution from expanded and upsized services run by existing customers;
• initial contributions from three new services into east Swanson Dock in Melbourne that commenced in 4Q Fy14;
• the increase in lifts in 2h Fy14 was 8.5%, reflecting the impact of the above new contract wins, offset to an extent by the closure of the CAX service in April 2013 and volume lost to new competing services. Lifts in 1h Fy14 were down 0.5%, reflecting the loss of CAX and a lower peak season in Q2;
• market share over the 12 months (excludes subcontracted volume) was 48.5% compared to 47.5% in the pcp. Market share over the period was volatile, impacted by consortia changes and the different growth rates of the shipping lines;
• Patrick recorded a material increase in subcontracted lifts in Fy14 which are over and above the market share data listed above; and
• revenue in the Logistics business declined 1.8% driven primarily by soft rail volumes into Adelaide and out of the riverina region.
eBItDA margins were flat over the period, a strong result in light of the extent of fixed cost in the business. Key movements in expenses during the period included:
• employee benefits over the period increased 4.1%, reflecting built in wage rises of 4-5% and an increase in labour at Fremantle following the K-Line contract win;
• insurance related costs declined 12%, reflecting the significant improvement in safety statistics and absenteeism reported over the last 18 months by the terminals business, in particular at Port Botany in Sydney; and
• operating lease costs increased 2.9% over the period driven by a full period impact of increases in lease costs at Port Botany and east Swanson Dock and a triennial market review at Fremantle in late Fy13.
Operating & Financial
review
Asciano Limited30
For
per
sona
l use
onl
y

Terminals & Logistics underlying EBIT Bridge
($’m) Bridge to FY14 EBIT
FY14 actual
FY13 actual
FY13 underlying EBIT 150.1 Price/mix/volume 17.2 Costs/other (32.9) BIP 15.5 Depreciation and amortisation (3.2) (50.8) (47.6)Business restructure 0.8 – (0.8) Industrial disputes 2.8 (1.4) (4.2) FY14 underlying EBIT 150.3 (52.2) (52.6)
underlying eBIt was flat on the prior year at $150.3m. Key factors impacting the result included:
• a 5.4% increase in eBIt from the terminals business;
• a lower contribution from the Logistics business resulting from weaker volumes;
• the cost of industrial disputes at Fremantle and in the Logistics business was $1.4m compared to the $4.2m in costs incurred in the pcp at Port Botany; and
• a 6.3% increase in depreciation, reflecting the capital expenditure program over the last two years, in particular the addition of new cranes at all terminals.
the BIP contributed $15.5m across the Division. Programs that contributed to these savings included efficiencies and maintenance savings from new operating equipment and labour savings from rostering changes and annual leave management.
Capital expenditure for the period increased 82.8% on the pcp to $278.1m, primarily reflecting expenditure on the redevelopment of Port Botany. Capital expenditure in Fy15 is expected to be in the range of $220-240m.
roCe declined to 6.8%, reflecting the significant level of capital investment in the Division at the current time combined with the lower volumes in Logistics. wIP increased 85% to $327.3m at the end of the period and was primarily associated with the Port Botany redevelopment project. roCe excluding wIP was 7.5%. roCe excluding goodwill remains high at 21.4%.
Customer KPIs for the 12 month period continued to improve, with coastal window performance now consistently above 95% and the national average gross crane rate increasing from 25 in the pcp to 28 lifts per hour. the LtIFr across the four terminals for the full year was down 65.2%.
the Division reported a net material cost before tax of $42.8m related to the redevelopment of Port Botany and restructuring of the Logistics business. the Fy14 cash impact of the material items was $7.3m. of the total expense, $22.1m pre-tax related to the non-cash write-down of obsolete equipment as part of the Port Botany redevelopment. the Fy15 cash flow impact of redundancies and other costs that were provided for in Fy13 and Fy14 is expected to be approximately $24.2m.
Outlookterminals & Logistics is expected to report an improved performance in Fy15. the factors that will impact its results include:
• the growth in the market for container volumes will be impacted primarily by domestic economic activity. Patrick continues to forecast Fy15 market growth aligned with projected Australian GDP growth which is supported by our shipping line customers’ expectations;
• the successful completion and launch of the automation project at Port Botany in 3Q Fy15 while minimising disruption to our customer base;
• the full year contribution from a new contract secured in Fremantle with K-Line. the contract commenced on 1 January 2014;
• the full year contribution from recent contract wins calling at east Swanson Dock in Melbourne;
• Patrick retaining its share of consortia volumes following any further changes in shipping line capacity sharing arrangements;
• the potential impact in the reduction of transhipment volumes between Australia and New Zealand due to the introduction of larger vessels;
• the ability to secure further market share through new contracts; and
• the Logistics business will continue to drive for new business with volumes also remaining sensitive to domestic economic growth.
the Division expects to renew its lease at Fremantle (which expires in 2017) over the next 12 months.
terminals & Logistics longer-term outlook will be influenced by factors such as the level of GDP growth in Australia and any further outsourcing of the Australian manufacturing sector offshore.
5.4%the terminals business reported a 5.4% increase in eBIt over the previous corresponding period
Operating & Financial
review
Annual report 201431
For
per
sona
l use
onl
y

1530 hrs | t
uesday
Port KeMBLA, New
South wALeS
steveDoring bulk copper
concentrAte for export
ThE DIvISION COMprISES TwO
OpErATIONS: pATrICk pOrTS & STEvEDOrINg
AND pATrICk AuTOCArE
patrick Bulk & Automotive port Services
Philip TonksDirector, Patrick Ports
& Stevedoring
Alex MilanGeneral Manager, Patrick Autocare
Operating & Financial
review
Asciano Limited32
For
per
sona
l use
onl
y

Business Overviewthe Division comprises two operations, Patrick Ports & Stevedoring and Patrick Autocare.
Patrick Ports & Stevedoring Ports & Stevedoring specialises in the management of ports and supporting infrastructure and the provision of port related logistics at more than 40 sites across Australia and New Zealand. Activities across these sites include:
• Port ownership and management
• Bulk stevedoring and cargo handling
• Forestry services
• transport and logistics
In october 2013, Asciano acquired Newcastle-based logistic solutions company Mountain Industries. Mountain Industries specialises in:
• Pit to port services complementing Asciano’s existing supply chain
• Bulk and general freight
• Intermodal – road, rail and wharf
• Containers – packing and handling
• Storage – warehousing, grain and bulk
Ports & Stevedoring has joint venture interests in:
• Port of Geelong unit trust – Asciano owns 50% of the Port of Geelong unit trust with Deutsche rreeF owning the remaining 50%. Ports & Stevedoring
Autocare’s principal activities involve:
• Distribution – providing local, country and interstate road and interstate rail transportation of cars and light trucks for local manufacturers, auto-importers and dealerships with logistics facilities in all states and the Northern territory. revenue is driven by the number of local, country and interstate vehicle movements.
• Vehicle processing – provides comprehensive services including the installation of high value accessories, completion of vehicle build to Australian standards, major fleet servicing and refurbishment. revenue is driven by the number of vehicles processed and build complexity.
• Vehicle storage – for automotive manufacturers, importers and dealerships on a short-term basis including facilities to accommodate vehicle washing, minor repairs and protection from the elements. revenue is driven by storage days.
key Business risksthe key business risks impacting the Division are covered in the overarching business risks listed on page 8. Specific examples of these risks as they pertain to the businesses include:
Competition• the bulk ports and stevedoring sector
is a fragmented, highly competitive market with generally low barriers creating an environment for potential price discounting and disruption to the market
• Market share losses by key automotive customers
• transition risk for the Autocare facilities during the transition phase at webb Dock
Activity levels in the resources, shipping, steel, agriculture, chemical and imported car industries which are linked with general economic activity both in Australia and globally
Rising land and rental coststhe Division seeks to mitigate these risks through an ongoing focus on customer service, innovation, a focus on the management of the cost base, productivity improvements and proactive and effective engagement with key external stakeholders. It should be noted that not all of these risks are within the direct control of the Division.
operates the port as well as carrying out stevedoring activities at the port.
• Australian Amalgamated terminals (AAt) – Asciano owns 50% of AAt with Qube owning the remaining 50% interest. AAt focuses on the development and operation of multi user facilities in port areas, such as providing specialist cargo handling facilities for stevedores and other waterfront service providers.
• Albany Bulk handling – Asciano owns 50% of a joint venture with Itochu owning the remaining 50%. the joint venture is a woodchip export facility in Albany, western Australia.
Patrick Autocare Autocare is Australia’s leading integrated service for the transportation, processing and storage of motor vehicles. Its key customers are the car companies and increasingly the beneficial freight owners (primarily the car dealers). Autocare is a joint venture between Asciano (80%) and NyK Line (20%) and is the manager of the Car Compounds of Australia joint venture with Mitsui o.S.K Lines (50% ownership by Asciano). the business operates out of wharf facilities in Queensland, New South wales, Victoria, South Australia and western Australia. Autocare handles approximately 50% of new automobile imports into Australia.
Strategic Objective
Bulk Ports’ strategy is to be the innovator in port services and integrated supply chain solutions that add value to customers. The business seeks to rapidly deploy capital and labour to exceed customer expectations. Its competitive advantage is underpinned by its scale and ability to manage complex customer requirements.
Autocare’s key objective is to provide a fully integrated service across processing, transport and storage domestically and abroad for own equipment manufacturers, dealers and other associated industries. The Autocare strategy is not capital intensive and its competitive advantage is based around a very efficient operating model that delivers an effective, low cost service.
Operating & Financial
review
Annual report 201433
For
per
sona
l use
onl
y

1000 hrs | tuesday
LAVertoN North, VICtorIA
Delivering AustrAliA’s cAr iMports
fy14 Earnings and volume Summary
Twelve Months Ended 30 June 2013 2014 % chgVehicles processed ¹ (‘000) 556.8 526.1 (5.5) Vehicle storage days (‘000) 18,641.5 22,715.3 21.9 Vehicle movements (‘000) 1,056.3 1,037.3 (1.8)Underlying revenue and other income ($’m) 680.5 793.4 16.6 underlying eBItDA ($’m) 112.2 120.0 7.0 Underlying EBIT ($’m) 89.0 89.5 0.6 eBItDA margin (%) 16.5 15.1 (1.4)eBIt margin (%) 13.1 11.3 (1.8)roCe (%) 20.8 15.5 –Cash conversion (%) (operating cash flow/eBItDA) 103.1 107.1 4.0total capex ($’m) 42.0 48.3 15.0 Growth capex ($’m) 19.9 20.1 1.0 Sustaining capex ($’m) 22.1 28.2 27.6 Full time employees 2,991 2,901 (3.0)
1. Now includes imported and exported vehicles handled.
16.6%Increase in underlying
revenue on pcp
underlying revenue increased 16.6% on the pcp to $793.4m. the result was driven by:
• Bulk Ports reported a 22.6% increase in revenue which included a full 12 months of the consolidated C3 business and eight month contribution from Mountain Industries acquired on 31 october 2013;
• Autocare reported a 5.5% increase in revenue includes a 21.9% increase in vehicle storage days. Vehicles moved were down due to lower long haul movements. Storage days declined 32% from the peak in January to the end of the 12 month period as customers ran down inventory levels. this trend is expected to continue in the first few months of Fy15. the 5.5% decline in vehicles processed reflects a drop off in volume in 2h Fy14 after 18 months of strong growth in volumes; and
• revenue growth includes a net settlement reached with the PoMC of $25m to cover the costs associated with transition arrangements and the early termination of lease agreements associated with the redevelopment of webb Dock in Melbourne. this settlement was reached to offset identified cash outlays and loss of future profits over the remaining life of the lease. revenue before the inclusion of the settlement payment increased 12.9% on the pcp.
underlying eBItDA increased 7% on pcp to $120m. the after tax contribution from equity accounted profits declined 13.8% to $13.6m. the contribution was impacted by:
• in Fy14, the results of C3 were consolidated for the 12 month period. the Fy13 result included five months of equity accounted profits from a 50% interest in C3 and seven months of 100% ownership. the outstanding 50% interest was acquired on 28 November 2012;
• the pre-tax contribution from the AAt joint venture was 28.6% below the pcp due to lower general cargo volumes in Brisbane and Port Kembla; and
• an 83% increase in the equity accounted contribution from the Port of Geelong unit trust, reflecting the strong performance of the underlying activity at the port.
Operating & Financial
review
Asciano Limited34
For
per
sona
l use
onl
y

Bulk & Automotive port Services underlying EBIT Bridge
($‘m) Bridge to FY14 EBIT
FY14 actual
FY13 actual
FY13 underlying EBIT 89.0 Price/mix/volume 0.9 Costs 0.4 Depreciation and amortisation (7.3) (30.5) (23.2)BIP 4.4 Business restructure and other 2.1 1.4 (0.7) FY14 underlying EBIT 89.5 (29.1) (23.9)
underlying eBIt increased 0.6% to $89.5m driven by:
• the Bulk Ports result was impacted by lower volumes under the Agility contract in western Australia as the contract winds down, lower project volumes in Gladstone and Fremantle as resource development projects move into the production phase and lower volumes at Port Kembla impacted by lower steel export volumes;
• the result includes redundancy costs associated with the expected wind-down of the contract with Agility in western Australia servicing the Gorgon contract;
• the Autocare result benefited from strong storage volumes over the year although storage days have declined from the peak in January 2014;
• underlying eBIt in Fy14 benefited from a full 12 month contribution from the consolidation of 100% of forestry marshalling and port services company C3. the outstanding 50% interest in C3 was acquired on 28 November 2012; and
• the result includes a settlement with the PoMC to cover the cash outlays associated with the transition arrangements and the early termination of lease agreements, including redundancies, associated with the redevelopment of webb Dock in Melbourne. the majority of these costs were incurred in Fy14; however, there will be further costs incurred in Fy15.
eBIt margins were impacted by the increased costs associated with the significant expansion in storage volumes in Autocare resulting in more expensive temporary facilities being utilised; and the 31.5% increase in depreciation and amortisation associated with the acquisition of the remaining shares in C3 and the acquisition of Mountain Industries.
roCe was lower in Fy14, reflecting the costs associated with the wind-down of the Agility contract and the webb Dock redevelopment and the impact of the acquisition of Mountain Industries. roCe at 15.5% remains above the Group’s wACC.
Capital expenditure over the period increased 15% to $48.3m and related to new equipment in Bulk Ports primarily related to new contracts and new equipment and maintenance projects in Autocare. Capital expenditure in Fy15 is expected to be in the range of $40-50m.
the BIP contributed $4.4m in savings over the 12 month period, representing operational labour and efficiency improvements as well as procurement savings and other initiatives across the Division.
the Division reported a material item pre-tax of $4.4m associated with the costs of restructuring and rationalisation of overheads.
OutlookBulk & Automotive Port Services is expected to report a flat underlying result in Fy15. the performance and strategic direction of the Division in Fy15 will be impacted by a number of factors including:
• the contract with Agility in western Australia is expected to finish in December 2014;
• following very strong imported car volumes over the last 18 months, volumes are expected to be flat in Fy15. higher transport volumes are expected to offset the impact of lower storage and processing volumes;
• there will be residual costs associated with the redevelopment of webb Dock in Melbourne incurred in Fy15 and the closure of webb Dock east in June 2014. Car stevedoring activities in Melbourne will continue at Appleton Dock and webb Dock west;
• the result will benefit from a full 12 month contribution from Mountain Industries and growth in C3’s Australian activities;
• C3 volumes in New Zealand are currently being impacted by the slowdown in demand for timber in China; and
• Autocare’s Fy15 earnings will include an initial contribution from Adelaide-based customs broker Smith Channon acquired as at 30 June 2014.
the Division’s longer-term outlook will be influenced by factors such as the level of GDP growth in Australia and global demand for Australian mineral services.
Operating & Financial
review
Annual report 201435
For
per
sona
l use
onl
y

group Outlook
• Assuming no material change in the business environment, Asciano currently expects underlying EBIT growth in FY15 to be higher than the underlying EBIT growth of 5% in FY14
– In Fy15, Asciano expects to report a material item in the order of $20m associated with the final costs associated with the Port Botany site commissioning and cut over to the automated facility.
• Key factors driving the earnings outlook include:
– the business improvement benefits and other cost savings associated with the integration of the two rail divisions. Benefits derived from the integration are expected to be in the order of $100m by the end of Fy16;
– rail volumes will be impacted by macro factors including Australian domestic activity, demand for Australian coal exports and weather impacts on agricultural and coal volumes;
– the growth in the market for container volumes will be impacted primarily by Australian domestic economic activity. Patrick continues to forecast Fy15 market growth aligned with projected Australian GDP growth which is supported by shipping line customer expectations;
– the full year impact of new shipping line contracts secured during Fy14 netted against the impact of the closure of services in Fy14 and the ongoing impact of any further changes in shipping line capacity sharing arrangements;
– the successful completion and launch of the automation project at Port Botany in 3Q Fy15; and
– activity levels at regional bulk ports will be impacted by resource project volumes and agricultural volumes. In particular the wind-down of the Agility contract in western Australia by December 2014 will impact volume levels.
• the Company remains focused on delivering its key target metrics under the five year Fy16 business plan and in particular:
– completion of the capital expenditure upgrade program by Fy16;
– strong free-cash flow positive position from Fy15 allowing leverage to reduce over time and an increase in the payout ratio;
– maintained commitment to 10%-15% eBIt CAGr over the five year period to Fy16; and,
– maintained commitment to internal return objectives of Group roCe above Group wACC by Fy16/17.
• Capital expenditure in Fy15 is forecast to be in a range of $600-700m. the forecast range for Fy16 for ongoing sustaining capital expenditure is $300-400m. Sustaining capital expenditure is expected to remain in this range for the foreseeable future
• expected that free cash flow in Fy15 will deliver the ability to increase the full year dividend at a materially faster rate than earnings growth to boost tSr
• Free cash flow in Fy15 is also expected to be sufficient to fully fund dividend payments in Fy15
• Asciano will continue to focus on its BIP. the Fy16 five year target for the program was doubled in Fy14 from $150m to $300m
• the Company will continue to pursue opportunities to generate value through strategic acquisitions, partnerships and joint ventures. however, this will not be at the expense of free cash flow, reduced leverage, or capital management objectives:
– bolt on opportunities in Bulk Ports and Port Logistics are being explored;
– larger inorganic growth opportunities will not be considered unless the above objectives are met; and
– consistent with ASX announcement of 18 July 2014, discussions with third parties in relation to strategic opportunities with the terminals & Logistics Division, including a potential sale of a non-controlling interest, continue to progress. these discussions are preliminary and incomplete and no agreement has been reached with any parties at this stage.
• Despite the difficult macro environment, Asciano remains committed to driving the programs introduced over the last few years around safety and stakeholder relationships, both internal and external. these programs contribute to establishing and shaping the cultural transformation required within the organisation to create a long-term, sustainable and successful business platform
2200 hrs | tuesday
Port KeMBLA, New
South wALeS
Moving AustrAliAn steel
for export
Operating & Financial
review
Asciano Limited36
For
per
sona
l use
onl
y

glossary
Definitions1H First half
2H Second half
BAPS Bulk & Automotive Port Services
BIP Business improvement program
Capital employed Net assets less cash, debt, other financial assets/liabilities, tax, and intercompany accounts (for divisional roCe), 12 months rolling
Cash conversion (divisional) operating cash flow/eBItDA
Cash conversion (group) oCFPIt/eBItDA
DPS Dividend per share
EBIT Profit before interest and tax
EBITDA Profit before interest, tax, depreciation and amortisation
EPS earnings per share (NPAt/weighted average number of shares outstanding)
FY Financial year
Material items Material items include continuing material items, discontinued material items and gains or losses on sale of discontinued operations
NPAT Net profit after tax
OCFPIT operating cash flow pre-interest and tax
Operating cash flow eBItDA plus change in net working capital plus interest paid plus tax paid
PCP Prior corresponding period
PoMC Port of Melbourne Corporation
Revenue revenue and other income
ROCE return on capital employed (eBIt/average capital employed) 12 months rolling
ROE return on equity (NPAt and material items/average total equity)
TEU twenty foot equivalent unit
TSR total shareholder return
WIP work in progress
Operating & Financial
review
Annual report 201437
For
per
sona
l use
onl
y

1630 hrs | tuesday
Port KeMBLA, New South wALeS
steveDoring winD turbines
Our COMpLETE 2014 SuSTAINABILITy rEpOrT
CAN BE vIEwED ONLINE AT
hTTp://ASCIANO2014.rEpOrTONLINE.COM.Au
Asciano Limited38
Sustainability
Our Marketplace responsible Business Practices• Excellent customer service
• Partnerships and collaboration with our customers
• Governance, ethics, cultural standards
• Create economic value
• Transparent communication and engagement
Our Environment Minimising our Footprint• Minimise environmental risks
• Improve resource efficiency and reduce carbon footprint
• Minimise risk of environmental incidents
Our People responsible employer• Home Safely Every Day
• Diversity and inclusiveness
• Health and wellbeing
• Professional development
• Employee engagement
Our Community Connecting with our Neighbours• Appropriate community
engagement programs
• Strategic community partnerships for long-term shared value
• Help build sustainable communities
Our sustainability ambition is to provide sustainable logistics solutions that are economically,
environmentally and socially viable. we do this by proactively managing the economic, environmental and
social developments that influence our long-term value to stakeholders.
our complete 2014 sustainability report can be viewed online at http://asciano2014.reportonline.com.au
SuSTAINABILITy
For
per
sona
l use
onl
y

Our Marketplace FY 2014 FY 2013 FY 2012 FY 2011Net Promoter Score (“NPS”) 1 18 6 – –Actionable Customer Engagement (“ACE”) 2 81 78 – –
Our PeopleLost Time Injury Frequency Rate (“LTIFR”) 3 4.6 8.8 12.4 15.2Recordable Injury Frequency Rate (“RIFR”) 4 15.9 25 31.3 36.7Senior Leadership Training (pax) 274 205 – –Employee turnover (%)5 10.7 10.4 12.7 16Gender diversity – female representation6
Non-Executive Directors (%) 13 14 14 –Senior executives (%) 10 20 30 –All employees (%) 10 9 9 –Employee engagement 7 – 73 – 68
Our EnvironmentCarbon emissions8
Tonnes of carbon dioxide equivalent (tCO2e) 9 1,249,419 1,243,658 1,157,794 1,124,360
Tonnes CO2e per $m revenue10 313 334 335 364
Energy intensity11
Pacific National GJ/m NTK12 251 271 274 280Terminals & Logistics GJ/TEU13 0.34 0.34 0.34 0.45Autocare GJ/vehicles carried 0.74 0.78 0.83 0.74Ports & Stevedoring GJ/$m revenue14 826 553 397 471Significant environmental incidents 15 1 1 2 –Environmental notices received 2 4 1 –EfficiencyEnergy consumption MWh/FTE16 509 562 578 601Fuel efficiency Rail L/mNTK17 6,242 6,685 6,822 7,076 Road L/km18 0.16 0.15 0.17 –
Our CommunityCommunity complaints 19 746 173 NSW 729 168 QLD 6 0 SA 6 2 VIC 5 3 Community investment total ($) 343,911 283,708 – –
1. Net Promoter Score is a universal tool used to measure customer loyalty/advocacy, based on the premise that every company’s customers can be grouped into three categories: “Promoters”, “Passives” (satisfied but not enthusiastic and can easily be wooed by competitors) and “Detractors” (unhappy customers trapped in a bad relationship).
2. Actionable Customer Engagement is determined through a customer survey conducted by external consultants using Market Intelligence Co. Methodology.
3. Lost time injuries per one million hours worked.
4. Recordable injuries per one million hours worked.
5. Turnover figures include full-time and part-time employees only. Turnover figures exclude C3 New Zealand, C3 Australia, and Mountain Industries.
6. Gender diversity figures exclude C3 Australia.
7. The employee engagement score is determined through a voluntary employee survey conducted internally using Towers Watson’s licensed survey methodology.
8. Carbon emissions calculated according to the National Greenhouse Accounts Factors 2013 (AUS), and Voluntary Greenhouse Gas Reporting Emission Factors 2011 (NZ).
9. Total includes Scope 1 (CO2, CH4, and N2O) and Scope 2 (CO2) emissions. Scope 1 excludes biogenic CO2 emissions. FY13 total includes C3 emissions which was excluded in the previous FY13 Sustainability Report.
10. Emissions Intensity includes Scope 1 (CO2, CH4, and N2O) and Scope 2 (CO2) emissions.
11. Energy intensity ratio includes energy consumed only within the organisation. Energy sources include fuel and electricity.
12. Gigajoules per million net tonne kilometres.13. Gigajoules per 20-foot equivalent unit.
14. Increase in Ports & Stevedoring energy intensity from FY13 onwards due to the acquisitions of C3 and Mountain Industries and increase in road-based transportation.
15. Significant environmental incidents are incidents classified as a Class 2 or higher.
16. Megawatt hours per full-time equivalent employee.
17. Litres per million net tonne kilometres.18. Litres per kilometre.19. Complaints recorded by our incident
management systems, Transport for NSW, as well as Australian Rail Track Corporation that relate to our operations. Increased numbers in FY14 are due to a new system capturing complaints where they weren’t previously recorded.
performance Scorecard
Annual report 201439
SuSTAINABILITy
For
per
sona
l use
onl
y

Our Marketplace Responsible Business Practices
Our peopleResponsible Employer
ACe up from 78 to 81 since Fy13
Decline in rIFr since 2011
Increase in employees participating in our
leadership training since last year
Decline in LtIFr since 2011
NPS up from +6 to +18 since Fy13
57% 70% 34%
Our performance
we have continued our focus on improving outcomes for our customers and measure our performance through annual customer surveys as well as six monthly “pulse checks”. our results show an improvement in our customer service with our Net Promoter Score (“NPS”) up from +6 to +18, and our Actionable Customer engagement Score (“ACe”) score up from 78 to 81. In the coming year, we will continue our efforts to improve customer service levels by listening to our customers’ feedback and implementing programs to support better outcomes.
this year, our focus has been on building stronger employee engagement through investment in leadership development, employee recognition and continuing to embed our core values. Next year, we will place increased focus on increasing diversity in our blue collar workforce though our “diversity in action” program.
our efforts to improve safety performance in Fy14 have continued to focus on the development of our Critical Safety essentials (“CSe”) program to better control and manage the critical safety risks we face in our operations each day. we have made significant improvements in both our recordable Injury Frequency rate (“rIFr”) and our Lost time Injury Frequency rate (“LtIFr”), which declined 57% and 70% respectively since 2011. Next year, we will kick off a safety leadership training program involving the top 500 leaders across the business.
We aim to be the leading provider of critical logistics services within the essential infrastructure-based supply chains.
At Asciano, we strive to create an environment where our people can come to work, feel safe, feel valued and have the equipment and support to do the best job they can.
Asciano Limited40
SuSTAINABILITy
For
per
sona
l use
onl
y

Increase in community investment since last year
to $343,911
Decrease in energy consumption per full-time
employee since Fy13
reduction in carbon footprint since Fy11 relative to total
revenue
14%
21%
9%
Our Environment Minimising Our Footprint
Our CommunityConnecting with Our Neighbours
one of our priorities this year has been to put into place a Group-wide environmental governance framework to help us achieve a consistent and efficient approach to environmental management across the Group. we also undertook a Group-wide risk assessment to identify our most significant environmental risks. Next year, we will seek to embed this framework into each of the business divisions, as well as develop environmental standards for each of the key environmental risks we have identified.
Due to our ongoing focus on fuel saving, we have reduced our carbon footprint by 14% relative to our total revenue since Fy11. we have also made a 9% decrease in energy consumption per full-time employee since Fy13.
to improve our understanding of our operation’s noise impacts, we have enhanced our internal oversight of community noise complaints, and commenced quarterly reporting of community complaint numbers by our hSe executive Committee and the Board’s Sustainability Committee. Next year, we will focus on enhancing our community complaint management system and develop a Group-wide complaint management governance framework. we will also be reviewing our community investment strategy.
Our approach to environmental management is to identify our material risks and allocate appropriate resources to ensure that these risks are appropriately managed.
We remain committed to connecting with the communities in the areas in which we operate and maintaining our social licence to operate.
Annual report 201441
SuSTAINABILITy
For
per
sona
l use
onl
y

Senior Leadership Teamjohn MullenChief Executive Officer and Managing DirectorJohn was appointed Chief executive officer on 14 February 2011 and Managing Director on 1 April 2011. John was previously the Global Chief executive officer of DhL express from 2006 to 2009 and Joint Chief executive officer in 2005. Prior to that, John had held several senior positions with DhL express Asia Pacific, tNt Group, Compagnie Internationale de restauration and Nacap BV.
John is a Non-executive Director of telstra Corporation Limited, and prior to joining Asciano he was a Non-executive Director at both Brambles Limited, and MAp Airports Limited.
Alexandra BadenochDirector, Human ResourcesAlexandra joined Asciano in May 2011 and has more than 15 years of experience in senior international and domestic human resources roles. Alexandra held the position of executive Director of organisational Development and talent at telstra, where her role was responsible for a direct workforce of 43,000 employees throughout Australia, Asia, the united States and europe.
Alexandra was previously human resources Director (Asia Pacific) for Novell and General Manager for organisational effectiveness at Coles Myer.
roger BurrowsChief Financial Officerroger joined the Asciano Senior Leadership team as Chief Financial officer on 18 February 2013.
roger has more than 25 years of experience in finance across a diverse range of industries including property, financial services, It services, professional services and manufacturing. Most recently, roger was Chief Financial officer of Perpetual Limited for five years and was previously Group Chief Financial officer at Lend Lease Group.
roger remains active in the broader finance community as a member of the Australian Government’s Financial reporting Council, a National executive Member of the Group of 100 and Chairman of the university of technology Bachelor of Accounting Program.
Saul CannonGroup General Counsel and Company SecretarySaul joined Asciano in July 2007 as Group General Counsel and was appointed as Company Secretary in June 2014, in addition to his existing responsibilities.
Prior to joining Asciano, Saul held the position of General Counsel – Mergers & Acquisitions and telstra Asia at telstra. he was the lead telstra lawyer on t3, the A$15.5 billion sale by the Commonwealth of its remaining shareholding in telstra. During his nine years at telstra, Saul also worked in a number of different business areas, including three years as General Counsel and Company Secretary of telstraClear Limited, telstra’s New Zealand business.
Prior to joining telstra, Saul worked for leading Australian law firm King & wood Mallesons (then Mallesons Stephen Jaques). In 2014, Saul completed the Advanced Management Program (AMP) at harvard Business School in Boston.
Asciano Limited42
SENIOr LEADErShIp
TEAMF
or p
erso
nal u
se o
nly

Alistair fieldDirector, Patrick Terminals & LogisticsAlistair was appointed to the role of Director, terminals & Logistics in January 2012. Prior to this, he was responsible for leading the Patrick terminals business, having joined the Company in August 2010 in the role of Divisional General Manager terminals & Logistics.
with more than 20 years of experience in the mining and manufacturing industries, Alistair has held a number of senior leadership positions, including most recently as Director operations for MAADeN Aluminium Project in Saudi Arabia and previously as the Chief operating officer for rio tinto Alcan’s Bauxite and Alumina Division in Australia.
David IrwinDirector, Pacific NationalDavid was appointed as Director, Pacific National Coal in April 2008 and, following the integration of Pacific National’s rail and Coal divisions, as Director, Pacific National in February 2014.
David joined Pacific National in 2003 with management accountabilities for the commercial, logistics and customer aspects of the Coal business. David has more than 20 years of experience working in the Australian coal and rail industries – primarily in management, commercial, financial, procurement, logistics, leadership and operational roles.
Prior to this, David played a key role in the establishment of the hunter Valley Coal Chain Logistics team while working in the role of Manager Planning at Port waratah Coal Services.
philip TonksDirector, Patrick Ports & StevedoringPhilip is the Director of Patrick Ports & Stevedoring and has more than 16 years of experience within the logistics, shipping and transport industries. Philip has held a number of senior executive roles within the wider Asciano organisation, including Project Director responsible for the establishment of Pacific National’s Queensland coal operations and Asciano’s Group General Manager, Commercial.
Prior to this, Philip was responsible for the expansion of toll Logistics in New Zealand. Philip has been a long serving Director on many Asciano associate and subsidiary boards including at various times AAt Pty Ltd, C3 Limited, CCA Pty Ltd, Albany Bulk handling Pty Ltd, one Stop Pty Ltd and Ports Pty Ltd.
Murray vitlichDirector, Strategy and Business DevelopmentMurray joined Asciano in February 2012 as the Director of Strategy and Business Development. Murray has a breadth of experience across operational leadership, business development and financial roles, with over 25 years of experience in various industrial sectors including rail, engineering services and forestry. Most recently, Murray held the role of Chief executive officer and Managing Director for water resources Group.
During the period 2006 to 2008, Murray held a number of senior roles with uGL Limited, including the role of Chief operating officer. Murray was previously the Chief executive officer of the Australian railroad Group and held a number of senior roles across various wesfarmers Limited divisions during his 15 year career with that company.
Annual report 201443
SENIOr LEADErShIp
TEAMF
or p
erso
nal u
se o
nly

Board of Directors
John Mullen
Shirley In’t Veld
Bob edgar
Malcolm Broomhead
Peter George
Chris Barlow
ralph watersGeoff Kleemann
Asciano Limited44
BOArD Of DIrECTOrS
For
per
sona
l use
onl
y

Malcolm BroomheadChairman and Independent Non-Executive DirectorMalcolm is regarded as one of Australia’s most experienced Board members and brings his significant expertise to the Asciano Board. he was previously Managing Director and Chief executive officer of orica and is currently a Non-executive Director of BhP Billiton Ltd and BhP Billiton Plc.
john MullenChief Executive Officer and Managing Director
John was appointed Chief executive officer on 14 February 2011 and Managing Director on 1 April 2011. John was previously the Global Chief executive officer of DhL express. John is a Non-executive Director of telstra Corporation Limited, and prior to joining Asciano he was a Non-executive Director at both Brambles Limited and MAp Airports Limited.
Chris BarlowIndependent Non-Executive DirectorChris has held a broad range of senior leadership roles through the transport infrastructure industry. he was previously Managing Director and Chief executive officer of Australia Pacific Airports Corporation prior to joining Asciano, and is currently Chairman of Northern territory Airports Pty Ltd and Melbourne Convention Bureau Ltd.
peter georgeIndependent Non-Executive DirectorPeter brings his extensive experience in corporate strategy and finance to his role as a Non-executive Director of Asciano. he is currently Managing Director of PMP Limited and was previously Managing Director of B Digital Limited and executive Director of Strategy and Policy for Cable and wireless optus Limited.
geoff kleemannIndependent Non-Executive DirectorGeoff has enjoyed a long and successful career in the finance discipline, including time as Chief Financial officer at organisations as diverse as Crown Limited, Publishing & Broadcasting Limited and woolworths Limited.
Bob EdgarIndependent Non-Executive DirectorBob’s significant financial experience culminated in his most recent role as Deputy Chief executive officer of ANZ Banking Group. Bob is a Director of transurban Group Ltd and Linfox Armaguard. Bob is also Chairman of both Federation Limited and Prince henry’s Institute of Medical research.
Shirley In’t veldIndependent Non-Executive DirectorShirley was Managing Director of Verve energy – western Australia’s largest energy generator – until April 2012. A lawyer by background, Shirley has a range of experience across corporate leadership roles. Shirley is on the board of the CSIro and a member of both the SMArt Infrastructure Advisory Council and a council member of the Australian Institute of Company Directors in western Australia.
ralph watersIndependent Non-Executive Directorralph is the newest member of the Asciano Board of Directors and has significant experience across a diverse range of industries. ralph is Chairman of woolworths Limited, Fletcher Building Limited and tyree Industries Pty Limited, and was previously Chairman of Fisher & Paykel Appliances holdings Limited and a Director of Fonterra Co-operative Group Limited and westpac New Zealand Limited.
All Directors’ full professional biographies are available in the Directors’ report.
Annual report 201445
BOArD Of DIrECTOrS
For
per
sona
l use
onl
y

CONTENTS
1. Directors 47
2. Legal framework 49
3. Group General Counsel and Company Secretary 49
4. Directors’ meetings 49
5. Corporate governance statement 50
6. Introduction to executive remuneration – unaudited 65
7. remuneration report – audited 68
8. Principal activities 83
9. operating and financial review 83
10. Dividends 84
11. Business strategies, prospects and likely developments 84
12. Directors’ interests 84
13. options over shares 84
14. Indemnities and insurance for Directors and officers 85
15. Legal matters 85
16. rounding of amounts 85
17. Non-audit services of the external auditor 85
18. events subsequent to the reporting date 85
19. outlook 85
20. Auditor’s independence declaration 86
the lead auditor’s independence declaration under section 307C of the Corporations Act 2001 87
Financial report
Consolidated Statement of Profit or Loss 89
Consolidated Statement of Comprehensive Income 90
Consolidated Statement of Financial Position 91
Consolidated Statement of Changes in equity 92
Consolidated Statement of Cash Flows 93
Directors’ declaration 160
Independent auditor’s report to the members of Asciano Limited 161
Asciano Limited46
For
per
sona
l use
onl
y

4 A S C I A N O L I M I T E D D I R E C T O R S ’ R E P O R T F O R T H E Y E A R E N D E D 3 0 J U N E 2 0 1 4
The Directors present their report, together with the financial report of Asciano Limited (“Company” or “Parent”) and its controlled entities (collectively referred to as “Asciano”) and the auditor’s report thereon, for the year ended 30 June 2014.
1. Directors The Directors of Asciano Limited at any time during or since the end of the financial year were as follows:
Name, qualifications and independence status Age Experience, special responsibilities and other directorships
Malcolm Broomhead BE, MBA
Chairman and Independent Non-Executive Director
62 Mr Malcolm Broomhead was appointed as a Non-Executive Director of Asciano Limited on 22 September 2009 and was appointed Chairman of the Board in October 2009. Mr Broomhead is Chairman of the Nomination and Succession Planning Committee. Mr Broomhead was Managing Director (“MD”) and Chief Executive Officer (“CEO”) of Orica Limited (“Orica”) from 2001 until September 2005. Prior to joining Orica, Mr Broomhead held a number of senior positions at North Limited including as MD and CEO. Mr Broomhead is also a Non-Executive Director of BHP Billiton Ltd and BHP Billiton Plc (appointed March 2010) and was a Non-Executive Director of Coates Hire Limited until his resignation on 29 July 2013. He is a Director of the Walter and Eliza Hall Institute, Chairman of Kilfinan Australia and a member of the Advisory Board of Opportunity International (Australia). Mr Broomhead holds a Bachelor of Engineering and an MBA from the University of Queensland.
John Mullen BSc
CEO
59 Mr John Mullen was appointed CEO of Asciano Limited on 14 February 2011 and as MD on 1 April 2011. Mr Mullen has extensive experience within the transport and logistics arena, most recently as the Global CEO of DHL Express from 2006 to 2009 and Joint CEO in 2005. Prior to this, he was CEO of DHL Express Asia Pacific and held senior positions within the TNT Group for 10 years. Previously, Mr Mullen held various general management positions in TNT Limited, Compagnie Internationale de Restauration and NACAP BV, Delft, Holland. Mr Mullen is a Non-Executive Director of Telstra Corporation Limited (“Telstra”) (appointed July 2008) and, prior to joining Asciano, was also a Non-Executive Director of Brambles Ltd and MAp Airports Ltd. Mr Mullen holds a Bachelor of Science from the University of Surrey, UK.
Chris Barlow BSc (Hons), CE
Independent Non-Executive Director
68 Mr Chris Barlow joined Asciano Limited as a Non-Executive Director on 15 June 2007. Mr Barlow is Chairman of the Remuneration Committee and is a member of the Nomination and Succession Planning Committee and the Sustainability Committee. Mr Barlow has held a range of senior roles in the transport infrastructure industry for many years. He was the MD and CEO of Australia Pacific Airports Corporation, the operator of Melbourne and Launceston Airports. Mr Barlow has over 30 years’ experience in the infrastructure industry, having joined BAA Limited (formerly British Airports Authority) as an Engineering Project Manager. He held a number of senior management positions within BAA managing airports and as Development Director was responsible for the A$1.5 billion business development program of the BAA Group. Mr Barlow is currently Chairman of Northern Territory Airports Pty Limited and Melbourne Convention and Visitors Bureau Limited. He is also a senior adviser on airports worldwide to IFM investors. Mr Barlow is a Chartered Engineer and holds a Bachelor of Science with Honours in Engineering from the University of London, UK.
Dr Robert Edgar BEc (Hons), PhD
Independent Non-Executive Director
68 Dr Robert Edgar was appointed by the Board of Directors of Asciano Limited as a Non-Executive Director on 22 September 2009. Dr Edgar is a member of the Audit and Risk Committee, the Remuneration Committee and the Nomination and Succession Planning Committee. Dr Edgar retired from a successful career at the ANZ Banking Group (“ANZ”) spanning more than 25 years, where his most recent role was as Deputy CEO. Before joining ANZ, Dr Edgar held senior positions with the Australian Bankers’ Association, and prior to that he worked at the Reserve Bank of Australia. Dr Edgar is a Director of Transurban Group Limited (appointed October 2009) and Linfox Armaguard. Dr Edgar is also Chairman of Federation Limited (formerly Centro Retail Limited) (appointed December 2011) and the Prince Henry's Institute of Medical Research. Dr Edgar holds a Bachelor of Economics with Honours from the University of Adelaide and a PhD from Ohio State University, USA.
Directors’ report
Annual report 201447
For
per
sona
l use
onl
y

5 A S C I A N O L I M I T E D D I R E C T O R S ’ R E P O R T F O R T H E Y E A R E N D E D 3 0 J U N E 2 0 1 4
1. Directors (continued)
Name, qualifications and independence status Age Experience, special responsibilities and other directorships
Peter George BCom, LLB
Independent Non-Executive Director
61 Mr Peter George was appointed as a Non-Executive Director of Asciano Limited on 5 March 2007. He is a member of the Audit and Risk Committee, the Nomination and Succession Planning Committee and the Sustainability Committee. Mr George is currently MD of PMP Limited, having been a Non-Executive Director with PMP Limited from 2002 until his appointment as MD in 2012. He is an experienced Executive and Non-Executive Director specialising in corporate strategy and finance including acquisitions, divestments, company refinancing and turnarounds. Mr George was a Non-Executive Director of Optus Communications from 1994 to 1998. He was the former MD of B Digital Limited from 2004 to 2006 and Executive Director of Strategy and Policy for Cable and Wireless Optus Limited from 1998 to 2002. Mr George holds a Bachelor of Commerce and a Bachelor of Laws from the University of New South Wales.
Shirley In’t Veld BCom, LLB (Hons)
Independent Non-Executive Director
59 Ms Shirley In’t Veld was appointed as a Non-Executive Director of Asciano Limited on 1 November 2010. She is the Chair of the Sustainability Committee and a member of the Nomination and Succession Planning Committee. Ms In’t Veld was the MD of Verve Energy, Western Australia’s biggest electricity generator, from 2007 to April 2012. Prior to this, Ms In't Veld was Vice President Primary Business Development with Alcoa, and from 2001 to 2004 she was the MD of Alcoa Australia Rolled Products, based in Geelong, Victoria. Ms In't Veld commenced her career as a commercial lawyer with Mallesons in Melbourne and has also held senior legal, commercial and marketing positions with WMC Resources Ltd, Bond Corporation and BankWest. She has been a board member of Alcoa of Australia and a number of industry representative groups. In June 2012, Ms In’t Veld was appointed to the board of the Commonwealth Scientific and Industrial Research Organisation (CSIRO), Australia’s national science agency. She also serves as a member of the SMART Infrastructure Advisory Council (University of Wollongong) and is a council member of the AICD in Western Australia. Ms In’t Veld received her Bachelor of Laws (Hons) and Bachelor of Commerce from the University of Melbourne.
Geoff Kleemann CA
Independent Non-Executive Director
65 Mr Geoff Kleemann was appointed by the Board of Directors of Asciano Limited as a Non-Executive Director on 22 September 2009. Mr Kleemann is Chairman of the Audit and Risk Committee and a member of the Remuneration Committee and the Nomination and Succession Planning Committee. Mr Kleemann had a long career as a senior executive in a listed company environment as Chief Financial Officer (“CFO”) at Crown Limited, Publishing & Broadcasting Limited and Woolworths Limited. Mr Kleemann has a chartered accounting background, commencing his career with Deloitte and working there for a number of years before becoming Chief Accountant at Industrial Equity Limited and Finance Director at Pioneer International.
Ralph Waters M Bus, CPEng (Hons), FIE Aust
Independent Non-Executive Director
65 Mr Ralph Waters was appointed by the Board of Directors of Asciano Limited as a Non-Executive Director on 23 August 2012. Mr Waters is a member of the Nomination and Succession Planning Committee and the Sustainability Committee. Mr Waters has been a Director of Woolworths Limited since January 2011 and was appointed as Chairman in November 2012. Mr Waters is also Chairman of Fletcher Building Limited (appointed 2001). In the past, Mr Waters was Chairman and Director of Fisher and Paykel Appliances Holdings Limited from 2001 to 2011, a Director of Fonterra Co-operative Group Limited from 2006 to 2013 and a Director of Westpac New Zealand Limited from 2006 to 2012. Mr Waters has had extensive experience in the Australasian building products industry, including as MD of Email Limited and as CEO of Fletcher Building Limited, as well as engineering and management experience in London and the Middle East. Mr Waters has a Master of Business from Curtin University of Technology, is a Chartered Professional Engineer and an Honorary Fellow of the Institution of Engineers Australia.
Directors’ report
Asciano Limited48
For
per
sona
l use
onl
y

6 A S C I A N O L I M I T E D D I R E C T O R S ’ R E P O R T F O R T H E Y E A R E N D E D 3 0 J U N E 2 0 1 4
2. Legal framework Asciano shares are listed on the Australian Securities Exchange (“ASX”).
3. Group General Counsel and Company Secretary Saul Cannon, LLB (Hons)/B.Com Mr Saul Cannon joined Asciano in July 2007 as Group General Counsel and was appointed Company Secretary in June 2014 in addition to his existing responsibilities. Prior to joining Asciano, Mr Cannon held the position of General Counsel for Mergers & Acquisitions and Telstra Asia at Telstra. Mr Cannon was the lead Telstra lawyer on T3, the A$15.5 billion sale by the Commonwealth of its remaining shareholding in Telstra. During his nine years at Telstra, Mr Cannon also worked in a number of different business areas, including three years as General Counsel and Company Secretary of TelstraClear Limited, Telstra’s New Zealand business. Prior to joining Telstra, Mr Cannon worked for the Australian law firm Mallesons Stephen Jaques. Mr Cannon received his Bachelor of Laws (Hons) and Bachelor of Commerce from the University of Melbourne. In 2014, Mr Cannon also completed the Advanced Management Program (AMP) at Harvard Business School in Boston.
4. Directors’ meetings The number of Directors’ meetings (including meetings of Committees of Directors) and the number of meetings attended by each of the Directors during the 2014 financial year were as follows:
Board Audit and Risk
Committee Remuneration
Committee
Nomination and Succession
Planning Committee Sustainability
Committee Director A B A B A B A B A B
Malcolm Broomhead 8 8 – – – – 4 4 – – John Mullen 8 8 – – – – – – – – Chris Barlow 8 8 – – 6 6 4 4 4 4 Robert Edgar 8 8 4 4 6 6 4 4 – – Peter George 8 8 4 4 – – 4 4 4 4 Shirley In’t Veld 8 8 – – – – 4 4 4 4 Geoff Kleemann 8 8 4 4 6 6 4 4 – – Ralph Waters* 8 7 – – – – 4 4 2 2 A – Number of meetings eligible to attend. B – Number of meetings attended. * Appointment to Sustainability Committee effective 19 December 2013.
Directors’ report
Annual report 201449
For
per
sona
l use
onl
y

7 A S C I A N O L I M I T E D D I R E C T O R S ’ R E P O R T F O R T H E Y E A R E N D E D 3 0 J U N E 2 0 1 4
5. Corporate governance statement Asciano believes that good corporate governance is an essential ingredient for a successful company. Asciano is committed to continue to work to meet stakeholder and community expectations of robust and best practice corporate governance. The Board of Directors is responsible for ensuring that Asciano has an appropriate corporate governance framework in place to add value for its stakeholders through effective oversight, strong risk management and well defined processes. This requires that appropriate accountability and control systems are in place. This corporate governance statement outlines Asciano’s main corporate governance practices in place for the 2014 financial year and at the date of this report. Copies or summaries of the corporate governance documents mentioned in this statement are available on Asciano’s website at www.asciano.com. The Board believes that Asciano’s corporate governance framework and policies comply with corporate governance best practice in Australia, including the ASX Governance Council’s Corporate Governance Principles and Recommendations (“ASX Principles”). The following table indicates where specific ASX Principles are dealt with in this statement:
ASX Principle Reference in statement Principle 1 Lay solid foundation for management and oversight 5.1, 5.2 and 5.3 Principle 2 Structure the board to add value 5.1 and 5.2 Principle 3 Promote ethical and responsible decision-making 5.4 Principle 4 Safeguard integrity in financial reporting 5.2 and 5.3 Principle 5 Make timely and balanced disclosure 5.4 Principle 6 Respect the rights of shareholders 5.4 Principle 7 Recognise and manage risk 5.3 Principle 8 Remunerate fairly and responsibly 5.2 and 5.5
Overview of corporate governance framework Asciano continues to be proactive in respect of its corporate governance framework and continues to evaluate, change and implement arrangements that it believes will maximise its effectiveness. The Board regularly reviews Asciano’s corporate governance framework to ensure that the responsibilities and reporting lines between the Board, the Board Committees and management are effective and comply with the Corporations Act 2001 and the ASX Principles. The Asciano corporate governance framework is detailed in the diagram on the next page.
5.1 Board of Directors
Relevant governance documents (see www.asciano.com)
Asciano Limited Constitution (“Constitution”) Board Charter Independence of Directors Guidelines Board Performance Evaluation Process
Directors’ report
Asciano Limited50
For
per
sona
l use
onl
y

Audit & risk
Audit & Risk Committee Charter
nominAtion
Nomination & Succession Planning Committee Charter
sustAinAbility
Sustainability Committee Charter
remunerAtion
Remuneration Committee Charter
external AuditorAuditor Independence Policy
external Remuneration
Consultant
Delegations of Authority
Company Policies
Chief exeCutive
offiCer
senior leADeRshiP
teAm
exeCutive risk
exeCutive sAfety
ComPAny seCretAry
ChAirmAn
boArd of direCtorsConstitution, Board Charter,
Independence of Directors Guidelines
Directors’ report
Annual report 201451
For
per
sona
l use
onl
y

9 A S C I A N O L I M I T E D D I R E C T O R S ’ R E P O R T F O R T H E Y E A R E N D E D 3 0 J U N E 2 0 1 4
5. Corporate governance statement (continued)
Board role and responsibilities The role of the Board is to oversee and guide the management of Asciano and its businesses while protecting and enhancing the interests of its shareholders and taking into account the interests of other stakeholders, including employees, customers, suppliers and the wider community. The Constitution provides that the business and affairs of the Company are to be managed by, or under the direction of, the Board. The Board has adopted a formal Board Charter which details the Board’s role, powers, duties and functions, the matters it has reserved for its own consideration and decision-making and the authority it has delegated to the CEO. The Board Charter and the delegations of authority are reviewed regularly. The Board’s reserved powers and responsibilities are set out in the Board Charter and include:
overseeing the composition of the Board, including consideration of the skills and competency of the Directors;
overseeing and appraising the strategies, policies and performance of Asciano;
approving annual budgets and major expenditure items;
overseeing Asciano’s risk management compliance and corporate governance policies;
approving and monitoring internal and external reporting;
approving dividends;
appointing (and if appropriate, removing) the CEO;
reviewing senior executive succession planning; and
approving Asciano’s remuneration arrangements including for the CEO and other senior executives.
Delegation to CEO and management The Board has delegated responsibility for the day-to-day management of the Company to the CEO pursuant to a formal delegation structure. This is complemented by a formal delegation of authority from the CEO to the management team.
Board composition and membership The Board (through the Nomination and Succession Planning Committee) actively seeks to ensure that the Board and its Committees continue to have the right balance of skills, knowledge, qualifications, diversity and business experience necessary to direct the Company in accordance with high standards of corporate governance. The skills, experience and expertise which the Board considers to be particularly relevant include those in the areas of transport and transport infrastructure, finance, capital management and external relations. The table below sets out some of the key skills the Directors are looking to achieve on the Board and the extent to which they are represented on the Board and its Committees.
Skills and experience Board Audit and Risk Committee
Remuneration Committee
Nomination and Succession Planning Committee
Sustainability Committee
Financial/ Commercial skills 8 Directors 3 Directors 3 Directors 7 Directors 4 Directors Heavy or related industry experience 6 Directors 2 Directors 2 Directors 6 Directors 4 Directors Other public company board 8 Directors 3 Directors 3 Directors 7 Directors 4 Directors
Board chair experience 4 Directors 2 Directors 1 Director 4 Directors 2 Directors
Government relations 5 Directors 2 Directors 2 Directors 4 Directors 3 Directors
Regulatory 3 Directors 2 Directors 2 Directors 3 Directors 2 Directors
Public company CEO 4 Directors 1 Director – 3 Directors 2 Directors
International 7 Directors 2 Directors 2 Directors 6 Directors 4 Directors
In respect of diversity on the Board, the Directors strongly believe that differences in gender, age, ethnicity and cultural background in Board membership encourages diversity of thought and decision-making which will, in turn, drive and improve business efficiency and results for the Company and shareholders. Additional information in relation to diversity is detailed in section 5.4 of this Directors’ report.
Directors’ report
Asciano Limited52
For
per
sona
l use
onl
y

1 0 A S C I A N O L I M I T E D D I R E C T O R S ’ R E P O R T F O R T H E Y E A R E N D E D 3 0 J U N E 2 0 1 4
5. Corporate governance statement (continued)
Director retirement and re-election The Board is currently comprised of seven Non-Executive Directors and the CEO. At this year’s Annual General Meeting (“AGM”), Mr Chris Barlow and Ms Shirley In’t Veld will be standing for re-election as Non-Executive Directors, in accordance with the Constitution, which requires the Directors to retire at the third AGM following their election or most recent re-election. Profiles of the Directors, including their qualifications, experience and date of appointment can be found in section 1 of this Directors’ report.
Director independence The Board’s guidelines on Director independence are that there should be a majority of independent Non-Executive Directors on the Board. This requirement is embodied in the Board Charter, ensuring that all Board discussions and decisions have the benefit of independent judgement. The criteria for assessing independence are set out in the Independence of Directors Guidelines adopted by the Board and available on Asciano’s website at www.asciano.com and comply with Box 2.1 of the ASX Recommendations. The Board reviews the independence of the Directors before they are appointed, on an annual basis and at any other time where the circumstances of a Director change such as to require reassessment. The Board assesses the materiality of any contractual relationship that may affect independence on a case-by-case basis, such assessment being undertaken from the perspective of both the Company and the Director. The Corporations Act 2001 requires Directors to advise the Board of any interest they have that has the potential to conflict with the interests of the Company, including any matter that may impact on perceived or actual independence. Procedures are in place for Asciano’s Directors to disclose actual or potential conflicts of interest and to ensure that a Director with an actual or potential conflict of interest does not receive Board papers or participate in decisions relevant to the matter. During the reporting period, the Board considered the circumstances of each Director, including whether they:
have a substantial holding of Asciano shares;
have been employed by the Company;
have association with any advisers to the Company;
are associated with a material supplier to the Company; and
have any material contractual relationship with the Company.
Following this evaluation, the Board determined that all Non-Executive Directors, including the Chairman, were independent.
Conflicts of interest Directors are requested, upon their appointment, to disclose to the Company any interests or directorships which they hold with other organisations and to update this information if it changes during the course of the directorship. Directors and senior management are also required to identify any conflicts of interest they may have in dealing with Asciano’s affairs and refrain, where required, from participating in any discussion or voting on these matters.
Chairman The Chairman of the Board, Mr Malcolm Broomhead, is considered by the Board to be an independent Non-Executive Director and is a resident Australian citizen. The Chairman is responsible for leadership and effective performance of the Board and for maintenance of productive relations between the Directors and the management team. The Chairman’s responsibilities are set out in more detail in the Board Charter. Mr Broomhead is also a Non-Executive Director of BHP Billiton Limited and BHP Billiton Plc and sits on the advisory board of Opportunity International (Australia).
Director appointment, training and continuing education The Nomination and Succession Planning Committee reviews and, where appropriate, makes recommendations to the Board on Director appointments and re-election, having regard to the size, composition and necessary competencies of the Board. Each independent Non-Executive Director has signed a letter of appointment detailing the terms of their appointment, which sets out the key terms and conditions of their appointment, including duties, rights and responsibilities and the matters recommended in the ASX Principles. Induction training is provided to all new Directors. It includes a comprehensive induction manual with information on the Company’s corporate strategy, financial position, culture and values, company policies, rights and responsibilities of Directors, meeting arrangements and the role of the Board and management. The Board has regular discussions with the CEO and management and is invited to attend regular site tours of Asciano’s operational sites. All Directors are expected to maintain the skills required to discharge their obligations to the Company. Asciano undertakes an ongoing program to keep Directors abreast of the nature of its business, current issues and corporate strategy. Directors also have access to, and are encouraged to undertake, continuing education opportunities to update and enhance their skills and knowledge and have a strong working relationship with operational management.
Directors’ report
Annual report 201453
For
per
sona
l use
onl
y

1 1 A S C I A N O L I M I T E D D I R E C T O R S ’ R E P O R T F O R T H E Y E A R E N D E D 3 0 J U N E 2 0 1 4
5. Corporate governance statement (continued)
Board and senior executive performance evaluation The Board has adopted a policy setting out a performance evaluation process for the Board and Board Committees. This policy is available on Asciano’s website (www.asciano.com) and provides that the performance of the Board, each of its Committees and each Director will be reviewed annually. Such review may be conducted by an external consultant. The Board Performance Evaluation Process also sets out matters that will be considered relevant in assessing their performance. Board, Committee and individual Director performance evaluations took place during the reporting period. As in previous years, an independent external consultant was engaged during the reporting period to carry out a review of the Board’s performance. This performance review involved:
the consultant preparing a confidential questionnaire for each Director and select members of the executive Senior Leadership Team to complete;
the consultant meeting with each Director, the CEO and select members of the executive Senior Leadership Team to discuss the Board’s performance and its relationship with management;
a report being prepared by the consultant setting out their findings and recommendations for any changes or improvements;
the Board meeting to discuss the report and its findings; and
the Chairman and the Company Secretary working with the Board and management to implement the recommendations as agreed with the Board.
A comprehensive process for the evaluation of the performance of senior executives is conducted on an annual basis. The results of this review are used by the Company in determining future remuneration. All senior executives undertook a performance evaluation during the reporting period using this process. A more detailed summary of senior executive performance evaluations completed during the reporting period is set out in the Remuneration report in section 7 of this Directors’ report. The Remuneration report also sets out how remuneration is structured for executives and for Non-Executive Directors.
Board access to information and independent advice Subject to identification of any conflict of interest, Directors of the Board have direct access to senior executives as required and to any Company information in the possession of management it considers necessary to make informed decisions and to discharge its responsibilities. All Directors have access to the Company Secretary, who is accountable to the Board, through the Chairman, on all matters to do with the proper functioning of the Board and corporate governance. The Board must approve the appointment and removal of the Company Secretary. Any Director can seek independent professional advice in the discharge of their duties and responsibilities to Asciano, such entitlement being detailed in the Nomination and Succession Planning Committee Charter. Asciano will reimburse reasonable expenses incurred in obtaining this advice. Unless the Chairman determines otherwise, the advice will generally be circulated to the Board.
Board meetings The Board and the Committees meet on a regular basis, and additional meetings are called when required to address specific issues. The Chairman, in conjunction with the CEO and the Company Secretary, sets the agenda for each meeting. Any Director may request that matters be included on the agenda. Directors receive Board papers in advance of Board meetings, and these papers provide them with sufficient information to enable them to participate in informed discussion at each meeting. It is the Board’s practice that Non-Executive Directors meet regularly without the presence of management. Details of Board meetings held during the 2014 financial year and attendance at those meetings are set out in section 4 of this Directors’ report.
Directors’ report
Asciano Limited54
For
per
sona
l use
onl
y

1 2 A S C I A N O L I M I T E D D I R E C T O R S ’ R E P O R T F O R T H E Y E A R E N D E D 3 0 J U N E 2 0 1 4
5. Corporate governance statement (continued)
5.2 Board Committees
Relevant governance documents (see www.asciano.com)
Audit and Risk Committee Charter Remuneration Committee Charter Nomination and Succession Planning Committee Charter Sustainability Committee Charter
Role, membership and charters The Board has the ability under the Constitution to delegate its powers and responsibilities to Committees of the Board. This allows the Directors to spend additional and more focused time on specific issues. The Board has established four standing Committees to assist with the effective discharge of its duties, as follows:
Audit and Risk Committee;
Remuneration Committee;
Nomination and Succession Planning Committee; and
Sustainability Committee.
Membership of the four Committees is based on the Directors’ qualifications, skills and experience. Each standing Committee is comprised of:
only independent Non-Executive Directors;
at least three members who are independent; and
a chairman appointed by the Board who is one of the independent Non-Executive Directors.
Non-Committee members, including the CEO, attend Committee meetings by invitation. The composition of each standing Committee, details of the members and areas of responsibility are set out in the table on the following page. Each Committee operates under a specific charter approved by the Board, detailing its role, duties and membership requirements. The Board regularly reviews the appropriateness of the existing Committee structure, as well as the membership and charter of each Committee. All Committee charters were reviewed during the 2014 financial year and, as required, revisions were adopted. Details of Committee meetings held during the 2014 financial year and attendance at those meetings are set out in section 4 of this Directors’ report.
Directors’ report
Annual report 201455
For
per
sona
l use
onl
y

1 3 A S C I A N O L I M I T E D D I R E C T O R S ’ R E P O R T F O R T H E Y E A R E N D E D 3 0 J U N E 2 0 1 4
5. Corporate governance statement (continued)
Audit and Risk Remuneration Nomination and Succession Planning Sustainability
Members Geoff Kleemann (Chair) Robert Edgar Peter George
Chris Barlow (Chair) Robert Edgar Geoff Kleemann
Malcolm Broomhead (Chair) Chris Barlow Robert Edgar Peter George Shirley In’t Veld Geoff Kleemann Ralph Waters
Shirley In’t Veld (Chair) Chris Barlow Peter George Ralph Waters
Composition The Committee must comprise: only Non-Executive Directors (the
majority being independent); at least three members; members who are all financially
literate; at least one member who is a
qualified accountant or other finance professional; and
some members with an understanding of the transport infrastructure industry.
The Committee will have a minimum of three Non-Executive Directors, the majority being independent Directors.
The Committee will have a minimum of three Non-Executive Directors, the majority being independent Directors.
The Committee will have a minimum of three Non-Executive Directors, the majority being independent Directors.
Main areas of responsibility The primary responsibility of the Committee is to review the integrity of Asciano’s financial reporting process and to report the results of its activities to the Board. The Committee is responsible for making recommendations to the Board on: approval of financial statements; appointment and independence
of the external auditor; and Asciano’s Group risk management
strategy, policy and key risk parameters.
The Committee is also responsible for approval and oversight of: terms of engagement of external and
internal audit (including audit plans); rotation of the external auditor; implementation of Asciano’s risk
management systems/enterprise risk plan;
Asciano’s risk management framework/internal control systems;
Asciano’s Group insurance policies; and
Asciano’s finance policies. The Committee meets with both the internal and external auditors on a regular basis.
The Committee is responsible for making recommendations to the Board on: Group remuneration policy; remuneration for Non-
Executive Directors; diversity measurable
objectives; remuneration
arrangements for the CEO and the executive Senior Leadership Team;
the service agreement for the CEO; and
new executive incentive plans.
The Committee is also responsible for approval and oversight of: Asciano’s superannuation
arrangements; amendment and testing
under executive incentive plans;
employee incentive plans; and
Asciano’s Remuneration report.
The Committee is responsible for making recommendations to the Board on: reviewing the size,
composition and necessary competencies, including diversity, of the Board;
the appointment and removal of Directors;
annual re-election of Directors; and
Committee composition. The Committee is also responsible for approval and oversight of: establishing guidelines for
the selection and appointment of new Directors;
training and education programs;
Non-Executive Director performance reviews;
succession plans for Directors; and
senior executive succession planning.
The Committee is responsible for making recommendations to the Board on: Asciano safety, health,
environment and sustainability (“SHES”) strategy; and
new SHES policies. The Committee is also responsible for approval and oversight of: Asciano’s sustainability
initiatives, response to carbon related issues, and energy efficiency systems and initiatives;
safety, health and wellbeing of Asciano’s employees and the Company’s health and safety compliance and risk management systems, policies and procedures as they relate to health and safety matters; and
the impact of Asciano’s business operations on the environment and SHES incident reporting.
Directors’ report
Asciano Limited56
For
per
sona
l use
onl
y

1 4 A S C I A N O L I M I T E D D I R E C T O R S ’ R E P O R T F O R T H E Y E A R E N D E D 3 0 J U N E 2 0 1 4
5. Corporate governance statement (continued)
5.3 Risk management
Relevant governance documents (see www.asciano.com)
Board Charter Audit and Risk Committee Charter Sustainability Committee Charter Risk Management Policy
Asciano believes that shareholder value is driven by taking considered risks, and that effective risk management is fundamental to achieving the strategic, operational and compliance objectives of Asciano. The Board is responsible for overseeing the implementation of an effective system of risk management and internal control. The responsibility for designing, implementing and maintaining a sound system of risk management and internal control has been delegated to management through the CEO. The Audit and Risk Committee assists the Board with its oversight responsibility by reviewing, assessing and making recommendations to the Board in relation to the risk management framework and internal control structures put in place by management. The Sustainability Committee assists the Board with its oversight responsibility in making recommendations to the Board in relation to health, safety and environment compliance and risk management systems, policies and procedures as they relate to health, safety and environmental matters. In order to assist the CEO in overseeing the implementation and effective operation of the systems of internal control and risk management, the Senior Leadership Team meets at least quarterly and formally reviews the material strategic, operational and compliance risks, the risk treatment plans and internal audit reports. Details of the division of responsibilities between the Board, the Audit and Risk Committee and management are set out in the table on the following page.
Directors’ report
Annual report 201457
For
per
sona
l use
onl
y

in relation to risk management, the Board is responsible for:Reviewing and approving the Group’s risk management strategy, policy and key risk parameters; and
Overseeing management’s implementation of an effective system of risk management and internal control.
Responsible for:Overseeing the establishment and implementation of Asciano’s risk management systems;
Making recommendations to the Board on the Group’s risk profile;
Reviewing and assessing internal controls;
Approving the Internal Audit plans;
Overseeing the independence of the external auditor;
Group insurance policies; and
Group risk management framework. Responsible for:Implementing a sound system of risk management and internal control;
Formally assessing risk in accordance with the Risk Management Policy on at least a quarterly basis;
Completing, on a six monthly basis, the internal control questionnaires supporting the s.295A compliance statements; and
Attending Audit and Risk Committee meetings, as required, to assist the Committee in its oversight of risk.
The senior leadership Team is responsible for:Assisting the CEO and CFO and executive management oversee the effective operation of the systems of internal controls and risk management; and
Assisting the CEO and CFO to assess and manage the Group’s risk profile.
Responsible for:Designing, implementing and maintaining a sound system of risk management and internal control; and
Assessing and providing assurance to the Board that the risk management and internal control systems are operating effectively.
Audit And risk Committee
boArd
mAnAgement
exeCutive risk oversight
Ceo And Cfo
1 3 A S C I A N O L I M I T E D D I R E C T O R S ’ R E P O R T F O R T H E Y E A R E N D E D 3 0 J U N E 2 0 1 4
5. Corporate governance statement (continued)
Audit and Risk Remuneration Nomination and Succession Planning Sustainability
Members Geoff Kleemann (Chair) Robert Edgar Peter George
Chris Barlow (Chair) Robert Edgar Geoff Kleemann
Malcolm Broomhead (Chair) Chris Barlow Robert Edgar Peter George Shirley In’t Veld Geoff Kleemann Ralph Waters
Shirley In’t Veld (Chair) Chris Barlow Peter George Ralph Waters
Composition The Committee must comprise: only Non-Executive Directors (the
majority being independent); at least three members; members who are all financially
literate; at least one member who is a
qualified accountant or other finance professional; and
some members with an understanding of the transport infrastructure industry.
The Committee will have a minimum of three Non-Executive Directors, the majority being independent Directors.
The Committee will have a minimum of three Non-Executive Directors, the majority being independent Directors.
The Committee will have a minimum of three Non-Executive Directors, the majority being independent Directors.
Main areas of responsibility The primary responsibility of the Committee is to review the integrity of Asciano’s financial reporting process and to report the results of its activities to the Board. The Committee is responsible for making recommendations to the Board on: approval of financial statements; appointment and independence
of the external auditor; and Asciano’s Group risk management
strategy, policy and key risk parameters.
The Committee is also responsible for approval and oversight of: terms of engagement of external and
internal audit (including audit plans); rotation of the external auditor; implementation of Asciano’s risk
management systems/enterprise risk plan;
Asciano’s risk management framework/internal control systems;
Asciano’s Group insurance policies; and
Asciano’s finance policies. The Committee meets with both the internal and external auditors on a regular basis.
The Committee is responsible for making recommendations to the Board on: Group remuneration policy; remuneration for Non-
Executive Directors; diversity measurable
objectives; remuneration
arrangements for the CEO and the executive Senior Leadership Team;
the service agreement for the CEO; and
new executive incentive plans.
The Committee is also responsible for approval and oversight of: Asciano’s superannuation
arrangements; amendment and testing
under executive incentive plans;
employee incentive plans; and
Asciano’s Remuneration report.
The Committee is responsible for making recommendations to the Board on: reviewing the size,
composition and necessary competencies, including diversity, of the Board;
the appointment and removal of Directors;
annual re-election of Directors; and
Committee composition. The Committee is also responsible for approval and oversight of: establishing guidelines for
the selection and appointment of new Directors;
training and education programs;
Non-Executive Director performance reviews;
succession plans for Directors; and
senior executive succession planning.
The Committee is responsible for making recommendations to the Board on: Asciano safety, health,
environment and sustainability (“SHES”) strategy; and
new SHES policies. The Committee is also responsible for approval and oversight of: Asciano’s sustainability
initiatives, response to carbon related issues, and energy efficiency systems and initiatives;
safety, health and wellbeing of Asciano’s employees and the Company’s health and safety compliance and risk management systems, policies and procedures as they relate to health and safety matters; and
the impact of Asciano’s business operations on the environment and SHES incident reporting.
Directors’ report
Asciano Limited58
For
per
sona
l use
onl
y

1 6 A S C I A N O L I M I T E D D I R E C T O R S ’ R E P O R T F O R T H E Y E A R E N D E D 3 0 J U N E 2 0 1 4
5. Corporate governance statement (continued)
Risk Management Policy Asciano’s Risk Management Policy applies an integrated, enterprise-wide framework approach to managing risk across all aspects of its business operations and provides a consistent and systematic view of the risks. The risk management framework is reviewed and updated on an annual basis. The risk identification, analysis, treatment and monitoring procedures implemented by Asciano are in accordance with Standards Australia AS/NZS ISO 31000: Risk management – Principles and Guidelines. The risk management framework incorporates input from a range of existing systems, programs and policies, including:
a comprehensive occupational health and safety program and the Company’s sustainability, climate change and energy plans, overseen by the Sustainability Committee;
a delegation of authority policy, including guidelines and approval limits for operational and capital expenditure and investments;
a comprehensive annual insurance program;
a Board approved finance policy to manage exposure to credit, liquidity and market risks; further details of Asciano’s policies relating to the management of these risks are included in note 3 to and forming part of the financial statements;
annual budgeting and monthly reporting systems for all divisions to monitor performance against budget targets;
the identification and assessment of strategic risks during the annual strategic planning cycle; and
an environmental regulation compliance policy and improvement strategies.
Management assurance As noted above, the Board has delegated responsibility to management for designing and implementing effective risk management and internal control systems to manage Asciano’s material business risks. Management has reported to the Board’s Audit and Risk Committee on the effectiveness of the risk management and internal control systems over the reporting period. The Board has further delegated responsibility to the Audit and Risk Committee for reviewing the integrity of Asciano’s financial reporting processes and for reviewing the effectiveness of the Company’s risk management and internal control systems. The Audit and Risk Committee provides a report to the Board addressing the results of those reviews. The CEO and the CFO have provided the Board with a declaration under s295A(2) of the Corporations Act 2001 that the financial statements are founded on a sound system of risk management and internal control and that the system is operating efficiently and effectively in all material respects. The declaration made by the CEO and the CFO is that, in their opinion:
the financial records of the consolidated entity for the financial year have been properly maintained in accordance with s286 of the Corporations Act 2001;
the financial statements are in accordance with the Corporations Act, give a true and fair view of the financial position and performance of the consolidated entity and comply with the accounting standards; and
there are reasonable grounds to believe that the consolidated entity will be able to pay its debts when they become due and payable. In accordance with Recommendation 7.3 of the ASX Principles, the CEO and the CFO have provided assurance to the Board that the declaration provided under s295A is founded on a sound system of risk management and internal control in relation to financial reporting risks and that the risk management and internal control system for the year ended 30 June 2014 were operating effectively in all material respects regarding financial reporting risks. In providing that assurance declaration, the CEO and the CFO require that management of the business divisions and corporate functions complete a detailed and comprehensive questionnaire on a six monthly basis. The questionnaire addresses the effectiveness of the risk management and internal control systems for the reporting period. These assurances form part of the process by which the Board determines the effectiveness of its risk management and internal control systems.
Internal audit The Asciano risk management and internal audit function reports to the Chairman of the Audit and Risk Committee and to the CFO. Internal audit conducts a series of risk-based audits based on a plan reviewed and approved by the Audit and Risk Committee. As the Group General Manager Risk and Internal Audit is responsible for developing the risk management framework and for undertaking the internal audit program, the Audit and Risk Committee undertakes a periodic independent assessment of the effectiveness of Asciano’s risk management framework.
Directors’ report
Annual report 201459
For
per
sona
l use
onl
y

1 7 A S C I A N O L I M I T E D D I R E C T O R S ’ R E P O R T F O R T H E Y E A R E N D E D 3 0 J U N E 2 0 1 4
5. Corporate governance statement (continued)
Security The Company has taken a risk-based approach to security management and resilience planning. It continues to develop, review and refine its general and anti-terrorist security management and response plans. This process includes engaging with key government agencies on strategies to: identify potential security threats;
implement appropriate counter measures; and
deliver full compliance with federal, state and territory security legislation. Within this broad security context, Asciano both attends and conducts simulated security exercises, involving key internal and external stakeholders, to test and improve preparedness and emergency and crisis response arrangements.
Inherent operational risks Asciano believes there are a number of overarching key business risks which are inherent to the industries in which it operates. The challenges and risks that Asciano and its operations may face in achieving its business strategy are set out in the Group Operating Performance section on page 8 of the Operating & Financial Review (“OFR”) which forms part of the Directors’ report. These risks are identified to assist investors in understanding the nature of the risks faced by Asciano and the industries in which it operates. They are not intended to be an exhaustive list of risks.
Workplace health and safety regulation Sadly, we report on the death of a truck driver in our wholly owned subsidiary C3 Limited in New Zealand in August 2013. Mr Ian Romley died as a result of injuries sustained when he fell through the roof of a structure protecting a void over a conveyor at a customer site. This tragic event serves to remind us of the need for constant vigilance in relation to hazard identification both at our sites and at the very many different locations where our staff work. The safety performance of Asciano as measured by the lag indicators of Recordable Injury Frequency Rate (“RIFR”) and Lost Time Injury Frequency Rate (“LTIFR”) has been extremely strong. Overall, Asciano has improved RIFR by 36.5% during the 2014 financial year. The average RIFR for the final quarter was 12.9, the best quarterly result for the Group on record. There have been year-on-year improvements across all divisions. Our LTIFR improved by 47.7%, with a final year result of 4.6. Our June 2014 LTIFR of 2.9 is again the best monthly result for the Group on record and is significantly better than our previous best month of 3.4. Importantly, this LTIFR result was driven by very low lost time injury numbers, not simply an excess of working hours. These results have been realised on the back of significant proactive work by each of the business units, as evidenced by the completion of 22,000 more safety observations during the 2014 financial year compared to the previous year and a slight improvement in the absolute number of hazards reported. In 2014, we continued to implement our key corporate safety initiatives including:
Critical Safety Essentials – common high risk standards applicable to all divisions; and
the SHED – the database of safety, health and environmental data. The Asciano divisions have implemented Occupational Health and Safety (“OHS”) Strategic Plans around a common framework. These plans are associated with tracked action plans, which are regularly reviewed by divisional leadership teams and the Asciano executive Senior Leadership Team. The executive Senior Leadership Team meets monthly in the guise of the Executive Safety Committee; these meetings are held on-site, they involve safety engagements on-site and have a defined agenda focusing on cross business issues.
Directors’ report
Asciano Limited60
For
per
sona
l use
onl
y

1 8 A S C I A N O L I M I T E D D I R E C T O R S ’ R E P O R T F O R T H E Y E A R E N D E D 3 0 J U N E 2 0 1 4
5. Corporate governance statement (continued)
5.4 Governance policies
Relevant governance documents (see www.asciano.com)
Code of Conduct Whistleblower Policy Fraud and Corruption Prevention Policy Share Trading Policy Disclosure Policy Auditor Independence Policy Diversity Policy
Code of Conduct Asciano has a Code of Conduct which outlines Asciano’s commitment to appropriate and ethical corporate practices. The Code of Conduct describes the corporate values of safety, customer service, teamwork and financial success approved by the Board. It sets out the principles, practices and standards of personal and corporate behaviour Asciano expects in daily business activities. The Code of Conduct covers matters such as compliance with applicable laws and regulations, standards of behaviour in relation to health and safety, communicating with and respecting the interests of all stakeholders, conflicts of interest, proper use of Asciano’s assets, appropriate employment practices, confidentiality, and complying with Asciano’s policies and procedures. All Directors, Officers and employees are required to comply with the Code of Conduct. Senior managers are expected to ensure that employees, contractors, consultants, agents and partners under their supervision are aware of the Code of Conduct and foster an environment that encourages compliance with the Code of Conduct. Employees are required to complete online Code of Conduct training upon appointment and, thereafter, annually. Asciano also has a very strict policy governing political donations. Failure to comply with the Code of Conduct is a serious breach of Asciano policy and will be investigated. The Code of Conduct requires reporting, in good faith, of any suspected violations of the Code of Conduct. Breaches may result in disciplinary action ranging from a verbal warning through to termination of employment.
Whistleblower Policy and Fraud and Corruption Prevention Policy Asciano’s Whistleblower Policy and Fraud and Corruption Prevention Policy document Asciano’s commitment to maintaining an open working environment which encourages employees and contractors to report concerns in relation to illegal, unethical and improper conduct without fear of intimidation or reprisal. Asciano is committed to supporting and protecting those who report suspected violations in good faith. The purpose of the Whistleblower Policy is to: help detect and address unacceptable conduct;
help provide employees and contractors with a supportive working environment in which they feel able to raise issues of legitimate concern;
provide an external confidential hotline which can be used for reporting unacceptable conduct; and
help protect people who report unacceptable conduct in good faith.
Directors’ report
Annual report 201461
For
per
sona
l use
onl
y

1 9 A S C I A N O L I M I T E D D I R E C T O R S ’ R E P O R T F O R T H E Y E A R E N D E D 3 0 J U N E 2 0 1 4
5. Corporate governance statement (continued)
Trading in Asciano shares The Board has adopted and implemented a Share Trading Policy that sets out the circumstances in which Directors and employees may deal in the Company’s shares. The policy is aligned with the ASX Listing Rules on trading policies and associated ASX guidelines. In accordance with the prohibition in the Corporations Act 2001, the Share Trading Policy states that Directors, senior executives and other nominated employees may not trade in the Company’s shares at any time if they are in possession of inside information. The policy prohibits Directors, senior executives, nominated employees and their “associates”, being spouses and direct family, from trading, procuring trading or hedging their interest in the Company’s shares during “blackout periods” (which are the four weeks leading up to the release of the annual/half year report, as well as any other periods that the Board or CEO may determine from time to time) or at any time when they may possess “inside information” about the Company. Directors and the CEO are required to seek the approval of the Chairman (and in the case of the Chairman, the Board; in the case of the senior executives, the CEO; and in the case of nominated employees, their manager) before dealing in the Company’s shares and must also seek clearance from the Company Secretary before proceeding to trade or otherwise deal. Under the Share Trading Policy, Directors and employees are also prohibited from dealing in the shares of other companies with which Asciano may have a close commercial relationship where they are in possession of inside information.
Continuous disclosure and market communications Asciano is committed to providing timely, open and accurate information to all of its stakeholders including shareholders, regulators and the investment community. The Board has adopted a Disclosure Policy that sets out the Company’s approach to continuous disclosure and to external announcements generally. The policy and the Company’s approach to managing continuous disclosure are consistent with the ASX’s revised Guidance Note 8. The policy provides an outline of the Company’s continuous disclosure obligations and sets out the measures it has implemented to ensure compliance with these obligations, including listing the kind of matters that would generally require disclosure. The policy also provides guidelines for the management of external announcements and specifies the Company’s authorised spokespeople. A Continuous Disclosure Committee manages compliance with market disclosure obligations and is responsible for implementing reporting processes and controls and setting the guidelines for release of information. The Committee is comprised of senior executives. Training continued to be rolled out in 2014 for Directors and senior executives regarding the Company’s continuous disclosure obligations. Training focuses on ensuring that those executives who may be likely to come in possession of confidential information have a full understanding of the legal requirement to disclose market sensitive information to the ASX and the Company’s internal processes for escalation and assessment of information prior to release to the ASX.
Shareholder communications Asciano is committed to the delivery of timely and relevant information to its shareholders and to the broader investment community. The Company’s approach to investor relations is to promote effective communication with shareholders of the Company and ensure that all information relevant to a shareholder about their shareholding is accessible. The Company’s investor relations program, including the Annual General Meeting (“AGM”) and other interactions with institutional investors, analysts and the financial media, is detailed on the Asciano website (www.asciano.com). The Asciano website (www.asciano.com) forms a key part of the Company’s communication to shareholders and the wider investor community. The Asciano website also provides a broad range of information about Asciano and is updated regularly. All Asciano media releases, ASX announcements, investor presentations and half and full year financial reports are made available on the website immediately after they have been released to the market.
Annual General Meeting The AGM is the primary opportunity for shareholders to meet face-to-face with the Board and senior executives. The Board encourages participation by shareholders at the AGM to ensure accountability and transparency. Shareholders are invited to submit questions ahead of, and during, the AGM. Directors also make themselves available after the formal part of the AGM to meet with shareholders. The external auditor attends the AGM to answer shareholder queries about the auditor’s report. For shareholders who are unable to attend in person, the AGM is webcast live on the Asciano website (www.asciano.com).
Auditor independence The Board has adopted an Auditor Independence Policy that sets out the Company’s policy in relation to the engagement of the external auditor for audit and non-audit services. It outlines the process for the approval of certain non-audit services that are not prohibited but which are considered material. Details of the amounts paid to the external auditor are set out in note 36 to and forming part of the financial statements. The Audit and Risk Committee is highly cognisant of the need for the Company to maintain an independent auditor.
Directors’ report
Asciano Limited62
For
per
sona
l use
onl
y

2 0 A S C I A N O L I M I T E D D I R E C T O R S ’ R E P O R T F O R T H E Y E A R E N D E D 3 0 J U N E 2 0 1 4
5. Corporate governance statement (continued)
Diversity The Board has a Diversity Policy, which sets out the principles guiding the Company’s commitment to diversity and inclusion at Board, executive and employee level, being: meritocracy;
fairness and equity; and
commercial success.
Asciano is committed to workplace diversity, with a particular focus on supporting the representation of all range of ages and women at all levels of the Company. The Company believes that developing a workforce which reflects the diversity of the community that it works in, in all levels of its business, is a commercial imperative. For Asciano, diversity includes, but is not limited to, gender, age, ethnicity and cultural background. Building an inclusive workforce enables diversity of thought, decision-making and ultimately better business outcomes. In turn, this will assist Asciano to build sustainable and valuable relationships with its customers, employees, suppliers, shareholders, governments and the community. The Company is committed to improving diversity in the workplace and ensuring alignment with the ASX Principles on diversity. The Company established measurable objectives for the 2014 financial year (“FY14”) for achieving diversity. Those measurable objectives and progress to date in achieving them, and the measurable objectives set for the 2015 financial year (“FY15”), are set out in the table below.
Measurable objectives and progress to date FY14 measurable objectives Progress/Performance FY15 objectives
Recruitment and selection Performance Asciano is committed to attracting and securing the best candidates from a broad talent pool, with a strong focus on competency and organisational fit. To support achievement of this goal, we will conduct a review of our recruitment and selection process to ensure that we provide a level playing field where selection, reward and advancement are based on merit.
In 2014, we deployed a number of strategies to proactively source and attract female candidates for vacant roles. We increased female applications for salaried roles to 31% and achieved disproportionate placements at 40%. Despite considerable effort, we were less successful in blue collar roles, with female applicants 8% and placements 6%. By identifying unintended barriers to female applications and ensuring that we appeal to a more diverse candidate pool, we have delivered tangible results in salaried roles. Longer-term solutions are required to increase the number of qualified female candidates for our traditionally male blue collar roles.
Increase female application rates for salaried roles from 31% to 35% and for blue collar roles from 8% to 10% (overall target 23%) by June 2015.
Increase female placements for salaried roles from 40% to 45% and for blue collar roles from 6% to 10% (overall target 23%) by June 2015.
Talent and succession management Performance Asciano is committed to developing a diverse pool of talented employees to ensure that we have the talent pipeline to fill critical roles now and into the future.
We have improved our annual talent review and development planning across the Group. A key step forward has been the running of thirteen Group-wide leadership programs over the past year. 25% of participants in our Executive Development Program were women. Our talent pipeline for executive roles is now 38% female, and our development programs continue to be a key support mechanism to accelerate women’s development to be ready for leadership roles.
Increase female succession representation for executive roles to 40% by 30 June 2015.
Minimum 25% female attendance at emerging and executive leadership development programs by 30 June 2015.
Reporting and monitoring progress Performance Asciano will develop a consistent diversity scorecard at both the Asciano Group and the divisional level to ensure that the review and management of diversity is a standard part of our Senior Leadership Team agenda.
A scorecard of key metrics has been developed and will form the baseline for measuring future performance and progress. Progress against our key diversity goals and initiatives is formally included in our monthly human capital reporting to ensure regular Senior Leadership Team focus and engagement in this area.
We will continue our monthly reporting process and seek to enhance the quality of insights to support taking appropriate action to achieve our goals.
Directors’ report
Annual report 201463
For
per
sona
l use
onl
y

2 1 A S C I A N O L I M I T E D D I R E C T O R S ’ R E P O R T F O R T H E Y E A R E N D E D 3 0 J U N E 2 0 1 4
5. Corporate governance statement (continued)
During FY14, our female placement rates were much higher than our female attrition rate, which has assisted in the improvement in our overall female representation. The focus in FY15 will be to further improve overall representation by increasing the number of women applying to work with us, especially for blue collar roles, improving our percentage of female new hires and supporting accelerated development for talented women in our business through our investment in leadership development. The table set out below shows the proportion of female representation across Asciano and at Board and senior executive level. Job level/Classification Male Female
Non-Executive Directors 86% 14% Senior executives 79% 21% All employees 90% 10%
Sustainability and environmental regulation The Board is committed to sustainable business practices by proactively managing the economic, environmental and social developments that influence long-term value to stakeholders. We report on our annual performance in our Sustainability report. The management and reporting of our sustainability performance seeks to address those issues that we believe are the most material to our business and stakeholders. Our Sustainability report follows the Global Reporting Initiative G4 Framework, and some of the data in our report are independently verified. Asciano’s operations are subject to significant environmental regulation under federal, state and territory legislation. The Company is required to comply with the National Greenhouse and Energy Reporting Act 2007 (“NGER Act”) and this year met all of our reporting obligations under this Act. In addition, during the year we commenced the second five year term of the Federal Government’s Energy Efficiency Opportunities (“EEO”) scheme; however, this legislation and our requirements under it were repealed by the Federal Government in May 2014. Further information on our environmental performance is available in our Sustainability report accessible via the Asciano website (www.asciano.com).
Directors’ report
Asciano Limited64
For
per
sona
l use
onl
y

2 2 A S C I A N O L I M I T E D D I R E C T O R S ’ R E P O R T F O R T H E Y E A R E N D E D 3 0 J U N E 2 0 1 4
6. Introduction to executive remuneration – unaudited The “Introduction to executive remuneration – unaudited” outlines Asciano’s remuneration framework, how it relates to the Company’s performance and the actual remuneration derived by executives in the 2014 financial year. This section is unaudited and provides information additional to requirements under the Corporations Act 2001. It should therefore be read together with the full Remuneration report on pages 68 to 83, which provides audited disclosure of the remuneration structure of the Company in accordance with statutory obligations.
6.1 Committee Chairman’s letter – update
Dear Shareholder I am pleased to introduce our Remuneration report for the 2014 financial year. My aim is to give you a concise and transparent view of the past year so you have the best possible information to consider our remuneration policy. There have been no fundamental changes to our remuneration structures this year. We feel consistency and stability are important as, after some significant changes over the last few years, the framework is now well understood and working effectively. This year we experienced business challenges, with a sluggish domestic economy depressing the amount of goods being moved around the country. Despite this, we are pleased to have delivered strong underlying performance. The linkage between business performance and remuneration outcomes in this report is clear. In particular, you will see how the great work by the PN Coal management team has delivered strong performance, which is reflected in the good payout for them from our incentive plan. Across the rest of the Group, we largely achieved the goals we set for the year, and the incentive payments reflect an on-target performance against our balance scorecard. We continue to link the pay of our key managers directly to our core strategy and the performance of the Company in order to drive shareholder value. In our Short Term Incentive Plan (“STI”), we measure earnings, safety and customer service, as well as specific success factors relevant to that manager’s part of the business. We now have a Company-wide customer satisfaction survey process in place and have included this as a hard measure in our STI for the first time in the 2014 financial year. We further align our executives to shareholder interest through the deferral plan within our executive STI plan, which means 25% of the incentive is delivered in share rights. In our Long Term Incentive Plan (“LTI”), return on capital employed (“ROCE”), and relative total shareholder return (“TSR”) are equally weighted measures. The first is essential for our continuing success as a capital intensive company, as we need to ensure that we create value for every dollar of capital spent. TSR directly aligns the rewards to managers with the returns that you, our shareholders seek. In line with our commitment to continuously challenge the way we work, this year we brought together two divisions into one Pacific National division. Combining the two businesses will improve customer focus, leverage our market scale, deliver cost and productivity efficiency, and accelerate improvement in our systems and processes. While this change represents opportunity, regretfully it has meant that Angus McKay has left our business. The termination payments to Mr McKay are detailed in this report. For the second year in a row, we have made the decision that, apart from where there is a substantive change in role and any statutory increase in superannuation, there will be no fixed remuneration increase for our CEO, Non-Executive Directors or Key Management Personnel (“KMP”) in the 2015 financial year. Instead, to improve our market relativity on total target remuneration, in the coming year we will be increasing the variable pay opportunity for our KMP (excluding the CEO). On behalf of the Board, I invite you to view the full report in the following pages. I trust the detail will demonstrate how we continue to link our business strategies to our remuneration plans and reinforce the direct link between management remuneration and shareholder value. Yours faithfully Chris Barlow Chairman, Asciano Remuneration Committee
Directors’ report
Annual report 201465
For
per
sona
l use
onl
y

2 3 A S C I A N O L I M I T E D D I R E C T O R S ’ R E P O R T F O R T H E Y E A R E N D E D 3 0 J U N E 2 0 1 4
6. Introduction to executive remuneration – unaudited (continued)
6.2 Remuneration framework and link to performance for the 2014 financial year In the 2012 financial year, Asciano implemented a new remuneration framework to strengthen alignment between Asciano’s recognised “key drivers” of business success and executive remuneration. The framework has been further embedded in the 2014 financial year. Each year, we review both our strategy and the ongoing alignment of our STI and LTI measures to support the achievement of our goals. This year, we delivered strong results against a number of our key measures and, as a result, there have been some strong payment results for our executive team. The connection between business and remuneration outcomes for the 2014 financial year is demonstrated in the table below and will continue in the 2015 financial year: Driver of success How this driver is recognised in the Asciano remuneration program
Strong financial success
STI – Inclusion of earnings before interest and tax (“EBIT”) measure as 50% of potential STI
Ensuring that our employees get home safely every day
STI – Inclusion of safety improvement measure as 15% of potential STI
Delivering outstanding service to our customers
STI – Inclusion of customer satisfaction measure as 15% of potential STI
Ensuring that our employees achieve their full potential and the goals that are set for them
STI – Individual performance goals constitute 20% of potential STI
Ensuring that our employees’ interests are aligned with those of our shareholders
STI – A mandatory deferral component in the STI Plan that requires up to 25% of the STI opportunity to be deferred into rights to the Company’s shares
Running our assets as efficiently and profitably as possible
LTI – Inclusion of ROCE as a performance hurdle in the LTI Plan
Increasing shareholder wealth LTI – Inclusion of relative TSR as a performance hurdle in the LTI Plan
Increasing shareholder wealth
6.3 Take home pay of the Chief Executive Officer and other executives for the year ended 30 June 2014 The following table sets out details of the take home pay of Asciano’s CEO and other continuing KMP, i.e. the gross salary package and actual incentives earned in the 2014 financial year. In line with last year, this table has been included to give shareholders a better understanding of the amounts the CEO and other KMP actually received (or were entitled to receive) for each component of remuneration during the 2014 financial year. This information is not compliant with International Financial Reporting Standards (“IFRS”) and is unaudited. The full statutory remuneration table (which is prepared in accordance with the accounting standards) can be found on page 78. As noted in the Committee Chairman’s letter accompanying the 2014 Remuneration report, there was no increase to the CEO’s remuneration in the 2014 financial year. The Board will continue to review the CEO’s remuneration each year to ensure appropriate relativities to market and forecast economic conditions, an accurate reflection of individual performance, and alignment to how well we are performing against our Company goals. Accounting standards require that the expense relating to equity instruments granted in relation to remuneration arrangements be reflected over the “performance period”, notwithstanding that the CEO and other executives may never receive any actual value from such a grant. For example, under Asciano’s LTI arrangements, the value ultimately received will depend on the share price at the time the performance right vests or the option is exercised. This disclosure, which shows only the total value of incentives that vested in the year, is in addition to that contained on page 78 in the Remuneration report (audited) in section 7 of the Directors’ report, which shows the full accounting expense for the year in accordance with the accounting standards.
Directors’ report
Asciano Limited66
For
per
sona
l use
onl
y

2 4 A S C I A N O L I M I T E D D I R E C T O R S ’ R E P O R T F O R T H E Y E A R E N D E D 3 0 J U N E 2 0 1 4
6. Introduction to executive remuneration – unaudited (continued) 2014 total remuneration components $
Fixed annual remuneration1
Short-term incentive2
Vested long-term
options3
Vested long-term
rights4
Vested short-term
rights5 Total
Take home pay – Cash
component
Performance related
remuneration6
Executive Director John Mullen
CEO 1,914,556 1,807,750 144,945 – 175,041 4,042,292 3,722,306 53%
Executives Roger Burrows
CFO 806,558 343,350 – – – 1,149,908 1,149,908 30% Alistair Field
Director Terminals & Logistics 672,933 281,264 34,667 – 25,741 1,014,605 954,197 34% David Irwin7 Director Pacific National 793,201 614,444 81,758 – 39,297 1,528,700 1,407,645 48% Philip Tonks Director Ports & General Stevedoring 543,024 248,339 49,017 – 56,104 896,984 791,863 39% 1. Fixed annual remuneration (“FAR”) is based on current gross salary package, which includes base salary, superannuation contributions and the value of non-salary benefits
provided to the executive (inclusive of all applicable taxes). This amount differs from the sum of the salary and fees, non-monetary benefits and superannuation in section 7.6 of this Directors’ report because it does not include the value of accrued leave.
2. STI amount represents the actual STI to be paid in October 2014 (75% cash component for the 2014 financial year), the remaining 12.5% deferred STI for the 2012 financial year and the initial 12.5% deferred STI tranche for the 2013 financial year that ceased to be restricted in September 2014. The remaining 12.5% deferred STI for the 2013 financial year and 25% for the 2014 financial year will remain restricted until future financial years.
3. Options granted in 2010 and subject to a TSR performance hurdle were retested on 1 July 2013 when 60% vested. Options granted in 2011 and subject to a TSR performance hurdle were initially tested on 1 July 2013 when 52% vested, the remaining unvested options were retested on 1 July 2014 and an additional 10% vested.
4. Rights granted in 2012 and subject to a ROCE performance hurdle were tested on 1 July 2014 and lapsed. Rights granted in 2012 and subject to a TSR performance hurdle were tested on 1 July 2014 and none vested. These rights are subject to retesting on 1 July 2015.
5. Tranche A of the STI rights granted during the 2013 financial year vested on 2 September 2013. 6. Excludes non-monetary benefits to show actual cash earnings of each executive for the 2014 financial year. 7. Mr David Irwin was eligible for a retention payment of 45% of FAR under a retention plan established 1 December 2011. This was in addition to his STI (50% of FAR) and was in
recognition of the importance of retaining Mr Irwin within one of the fastest growing areas of our business (see section 7.4 for further detail). With the merger of the PN Coal and PN Rail businesses to form a single Pacific National business, Mr Irwin’s role changed on 18 February 2014 from Director PN Coal to Director Pacific National. His remuneration was revised on this promotion, and the retention payment was removed.
Directors’ report
Annual report 201467
For
per
sona
l use
onl
y
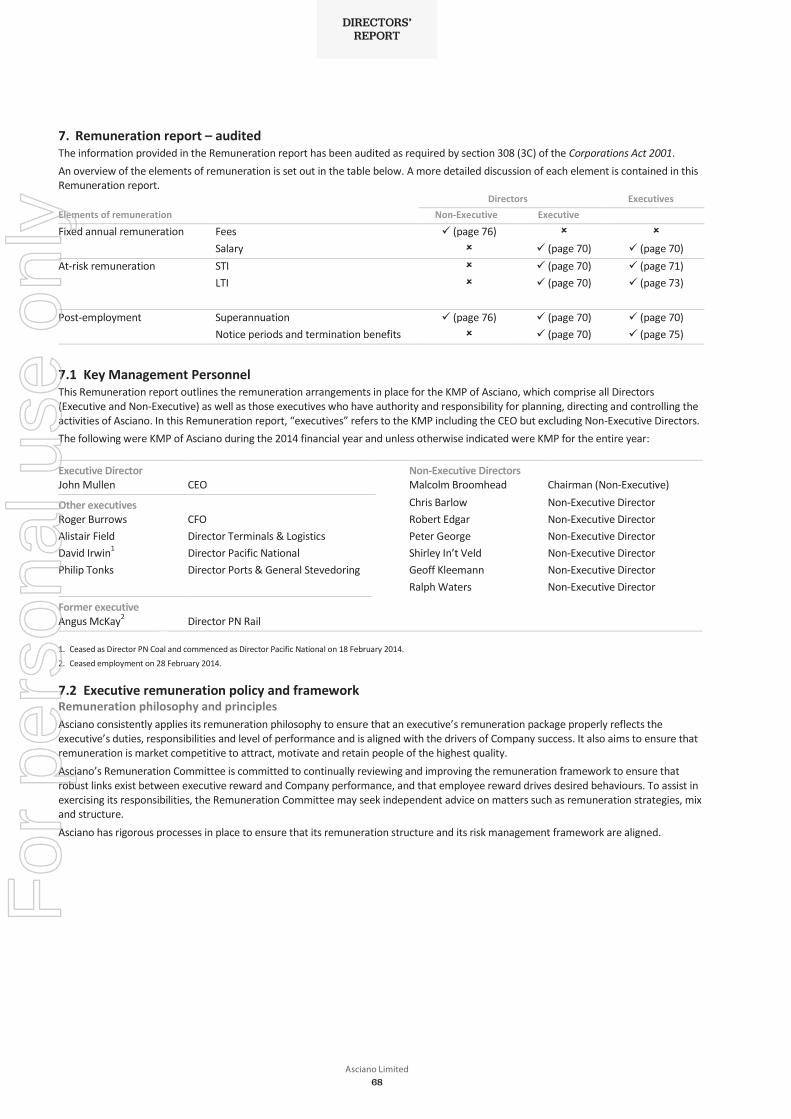
2 5 A S C I A N O L I M I T E D D I R E C T O R S ’ R E P O R T F O R T H E Y E A R E N D E D 3 0 J U N E 2 0 1 4
7. Remuneration report – audited The information provided in the Remuneration report has been audited as required by section 308 (3C) of the Corporations Act 2001. An overview of the elements of remuneration is set out in the table below. A more detailed discussion of each element is contained in this Remuneration report. Directors Executives Elements of remuneration Non-Executive Executive
Fixed annual remuneration Fees (page 76) Salary (page 70) (page 70)
At-risk remuneration STI (page 70) (page 71) LTI (page 70) (page 73)
Post-employment Superannuation (page 76) (page 70) (page 70) Notice periods and termination benefits (page 70) (page 75)
7.1 Key Management Personnel This Remuneration report outlines the remuneration arrangements in place for the KMP of Asciano, which comprise all Directors (Executive and Non-Executive) as well as those executives who have authority and responsibility for planning, directing and controlling the activities of Asciano. In this Remuneration report, “executives” refers to the KMP including the CEO but excluding Non-Executive Directors. The following were KMP of Asciano during the 2014 financial year and unless otherwise indicated were KMP for the entire year: Executive Director Non-Executive Directors John Mullen CEO Malcolm Broomhead Chairman (Non-Executive)
Other executives Chris Barlow Non-Executive Director Roger Burrows CFO Robert Edgar Non-Executive Director Alistair Field Director Terminals & Logistics Peter George Non-Executive Director David Irwin1 Director Pacific National Shirley In’t Veld Non-Executive Director Philip Tonks Director Ports & General Stevedoring Geoff Kleemann Non-Executive Director Ralph Waters Non-Executive Director
Former executive Angus McKay2 Director PN Rail 1. Ceased as Director PN Coal and commenced as Director Pacific National on 18 February 2014. 2. Ceased employment on 28 February 2014.
7.2 Executive remuneration policy and framework Remuneration philosophy and principles Asciano consistently applies its remuneration philosophy to ensure that an executive’s remuneration package properly reflects the executive’s duties, responsibilities and level of performance and is aligned with the drivers of Company success. It also aims to ensure that remuneration is market competitive to attract, motivate and retain people of the highest quality. Asciano’s Remuneration Committee is committed to continually reviewing and improving the remuneration framework to ensure that robust links exist between executive reward and Company performance, and that employee reward drives desired behaviours. To assist in exercising its responsibilities, the Remuneration Committee may seek independent advice on matters such as remuneration strategies, mix and structure. Asciano has rigorous processes in place to ensure that its remuneration structure and its risk management framework are aligned.
Directors’ report
Asciano Limited68
For
per
sona
l use
onl
y

2 6 A S C I A N O L I M I T E D D I R E C T O R S ’ R E P O R T F O R T H E Y E A R E N D E D 3 0 J U N E 2 0 1 4
7. Remuneration report – audited (continued)
Governance framework Asciano’s corporate governance framework ensures that processes are in place to prevent any undue influence by management on remuneration consultants making recommendations to the Remuneration Committee. In previous years, the Chair of the Remuneration Committee has engaged Ernst & Young (“EY”) to provide advice on specific remuneration matters (which included the provision of “remuneration recommendations” as defined in section 9B of the Corporations Act 2001). No remuneration recommendations were sought in the 2014 financial year. EY was however, engaged during the year to provide information on the following:
monitoring of LTI Plan performance; and
a review of Executive and Non-Executive Director remuneration in comparison to market to ensure that executive remuneration levels remain competitive and in line with current market trends.
Overview of remuneration framework and components as a proportion of total remuneration Components of total employment remuneration for the 2014 financial year were as follows:
Fixed annual remuneration (“FAR”)
Short-term incentive (“STI”)
Long-term incentive (“LTI”)
Fixed salary 12 month performance period Grant of performance rights Superannuation Salary-sacrificed non-monetary
benefits
Targets linked to Company, divisional and individual performance
Annual opportunity made up of 75% annual cash incentive and 25% deferred into time-based rights
3 year period Performance hurdles linked to TSR
and Asciano ROCE Optional deferral period for shares
allocated on vesting
The table below outlines executive FAR and target performance-based remuneration as a proportion of total remuneration in the 2014 financial year:
FAR % STI % LTI %
CEO 33 33 34 CFO 53 26 21 Director Terminals & Logistics
53 26 21 Director Pacific National (formerly Director PN Coal) 53 26 21 Director Ports & General Stevedoring 53 26 21 Director PN Rail1 46 31 23 1. Ceased employment on 28 February 2014.
• Fixed salary• Superannuation• Salary-sacrificed non-monetary
benefits
• 12 month performance period• Targets linked to company, divisional
and individual performance• Annual opportunity made up of 75%
annual cash incentive and 25% deferred into time-based rights
• Grant of performance rights• Three year period• Performance hurdles linked to TSR and
Asciano ROCE• Optional deferral period for shares
allocated on vesting
Fixed annual remuneration (“FAR”) short-term incentive (“sTi”) long-term incentive (“lTi”)
Directors’ report
Annual report 201469
For
per
sona
l use
onl
y

2 7 A S C I A N O L I M I T E D D I R E C T O R S ’ R E P O R T F O R T H E Y E A R E N D E D 3 0 J U N E 2 0 1 4
7. Remuneration report – audited (continued)
7.3 CEO remuneration arrangements for the 2014 financial year Details of Mr Mullen’s remuneration arrangements are summarised below: Fixed annual remuneration The CEO was entitled to FAR of $1,909,500 inclusive of superannuation contributions, effective from
1 July 2013. This was a nil % increase on his 2013 financial year FAR. Short-term incentive The CEO was eligible to participate in the Company’s STI Plan in the 2014 financial year, and his target
STI opportunity was equivalent to 100% of FAR. The CEO’s key performance indicators (“KPIs”) for the 2014 financial year were based on the measures used for all senior managers. His individual performance goals (see table on page 72) included: strategic plan and delivery; people and culture; and relationships and communication. Further details of the STI Plan, including actual STI payable for the 2014 financial year, are set out in section 7.4 of this report.
Long-term incentive The CEO received a grant of performance rights under the 2014 LTI Plan as approved by shareholders. The terms of these grants are the same as for other participants (see section 7.4 of this report). Further detail of the rights granted to the CEO during the 2014 financial year is set out in the tables in section 7.6 of this report. Subject to shareholder approval at this year’s AGM, the CEO is eligible to receive performance rights under the Company’s LTI Plan for the 2015 financial year.
Service agreement – key terms The CEO’s service agreement is of unlimited duration. The Company may terminate the CEO’s employment at any time for cause and, otherwise, by giving six months’ notice and with a severance payment equivalent to six months’ fixed remuneration. Mr Mullen must provide six months’ notice of resignation.
7.4 Executive remuneration arrangements for the 2014 financial year
Key developments: 2015 financial year Apart from where there is a substantive change in role and any statutory increase in superannuation, there will be no fixed
remuneration increase for either our CEO, our Non-Executive Directors or our KMP in the coming year. Any increases for KMP will be in variable rather than fixed remuneration.
Fixed annual remuneration (FAR) FAR consists of base compensation (calculated on a total basis and includes fringe benefits tax charges related to employee benefits including motor vehicles), as well as contributions to superannuation plans. The level of FAR for KMP has been determined with reference to executive pay in S&P/ASX 100 Index companies, taking into account the individual’s performance, responsibilities, and their level of knowledge, skills and experience. The Company considers the ASX 100 to be the appropriate benchmark so that we are well positioned to attract the best talent, inside or outside of our direct industry. Remuneration levels for executives are reviewed annually through a process which considers individual performance and overall performance of Asciano. When required, external consultants also provide analysis and guidance both to the Company and independently to the Board and the Remuneration Committee, to ensure that executive remuneration levels remain competitive and in line with current market trends.
Directors’ report
Asciano Limited70
For
per
sona
l use
onl
y

2 8 A S C I A N O L I M I T E D D I R E C T O R S ’ R E P O R T F O R T H E Y E A R E N D E D 3 0 J U N E 2 0 1 4
7. Remuneration report – audited (continued)
Short-term incentive (STI)
Key developments: 2015 financial year An improved method of capturing direct customer feedback was established in 2013. This data was gathered regularly throughout the
2014 year, and improvement targets will again be included in all STI scorecards in the 2015 financial year.
To improve our market relativity on total target remuneration, target STI opportunity for KMP (excluding the CEO) will be increased from 50% to 60% of fixed remuneration in the 2015 financial year.
STI performance: 2014 financial year Asciano’s STI is subject to three Company measures (EBIT, safety performance and customer satisfaction) and each executive’s individual performance goals. The financial component of Asciano’s STI is subject to a threshold level of performance before there is eligibility for any payment. Asciano’s overall financial performance in the 2014 financial year met the threshold level set by the Board, although it did not fully meet the target level. This performance is reflected in STI reward payments to the Company’s executive team. This result was due to Asciano’s underlying EBIT being $720.3 million before material items for the year ended 30 June 2014 (2013: $686.0 million before material items). While this represented a year-on-year improvement of $34.3 million, it did not completely meet the internal targets set by the Company. While we have used the Group’s EBIT before material items as a base, for the purposes of STI we have taken a conservative approach to what will be included as the basis for executive reward. We operate on overarching principles to exclude exceptional items (both positive and negative) and that unless both the cost and the benefit of any action are realised within the same year, we will exclude these items for the purposes of calculating our incentive outcomes. This ensures that there is no unintended inappropriate uplift to our incentive payments in any single year. This year, these adjustments resulted in a reduction of the EBIT outcome used as the basis for determining the payment against the EBIT component of the plan. Asciano’s safety performance is measured by RIFR (reportable injury frequency rate) which is MTIFR (medical treatment injury frequency rate) plus LTIFR (lost time injury frequency rate) per one million hours worked. A positive improvement of 36.5% in RIFR was achieved in the 2014 financial year, achieving the target set by the Board. Accordingly, the 15% of the STI measured against this target was paid. Asciano’s customer satisfaction metrics vary slightly by division to reflect the metrics important to each division’s customers and aggregate to a Group result. They include measures of performance to key contractual customer KPIs as well as direct feedback from customers, including customer satisfaction survey results. For the 2014 financial year, the 15% of the STI measured against this target was partially achieved, reflecting strong customer performance in some divisions and opportunities for improvement in others. Specific information relating to the actual STI payable, as well as the percentage forfeited by executives, is set out in the table on page 73. Mr David Irwin was eligible for a retention payment of 45% of FAR under a retention plan established 1 December 2011. This was in addition to his STI (50% of FAR) and was in recognition of the importance of retaining Mr Irwin within one of the fastest growing areas of our business. With the merger of the PN Coal and PN Rail businesses to form a single Pacific National business, Mr Irwin’s role changed on 18 February 2014 from Director PN Coal to Director Pacific National. His remuneration was revised on this promotion, and the retention payment was removed.
Detail of STI arrangements for the 2014 financial year What is the STI and who participates?
The STI Plan is a cash-based (75%) and rights to shares (25%) plan that rewards executives for achievement of Asciano, divisional and individual performance goals over the 12 month annual performance review period. Participation is for eligible employees whose performance is of strategic and operational importance to the Asciano Group.
What is the maximum amount that executives can earn?
The target STI opportunity for executives (excluding the CEO) is between 50% and 69% of FAR. The CEO has a target STI opportunity equivalent to 100% of FAR. The Director PN Coal had an additional opportunity of 45% of FAR. The retention component was in addition to Mr Irwin’s STI (50% of FAR). The metrics that underpinned the retention component are not the usual STI measures. They were based on year-on-year growth of the PN Coal Division. Mr Irwin’s role changed on 18 February 2014 from Director PN Coal to Director Pacific National. His remuneration was revised on this promotion, and the retention payment was removed. Executives are advised of their target STI at the start of the financial year. This is a percentage of their FAR and is based upon their measured job grade, utilising job grading methodology and general contribution to the profitability of Asciano. Payment is dependent on achievement against the STI performance measures (outlined above). Where the EBIT and safety targets are exceeded, there is the potential for executives to receive “above target” awards for exceptional performance. The executive will be allocated a performance review score based upon achievement against their pre-agreed personal goals. Executives who do not achieve the threshold annual performance rating are not eligible to receive an STI payment.
Directors’ report
Annual report 201471
For
per
sona
l use
onl
y

2 9 A S C I A N O L I M I T E D D I R E C T O R S ’ R E P O R T F O R T H E Y E A R E N D E D 3 0 J U N E 2 0 1 4
7. Remuneration report – audited (continued)
Detail of STI arrangements for the 2014 financial year (continued) What are the performance measures for the 2014 financial year?
For the 2014 financial year, the KPIs have been categorised into the performance clusters set out below. The financial performance measures are set at Group level for corporate executives and at a balance of Group and divisional level for the divisional executives.
Performance cluster Comment Allocation EBIT This target measures achievement against a set target EBIT at
divisional and/or Asciano level. It is subject to a threshold level of performance before there is eligibility for any payment. The EBIT KPI is leveraged up or down by a financial performance multiplier. The multiplier is uncapped, commencing at 0.7, provided a threshold of 90% of the target EBIT KPI is achieved.
50%
Safety This target measures absolute year-on-year improvement in RIFR at divisional and/or Asciano level. It is subject to a threshold level of performance before there is eligibility for any payment. Payment is capped at achievement of stretch performance.
15%
Customer satisfaction
This target measures achievement against key customer satisfaction targets at divisional and/or Asciano level. Payment is only made if target performance is achieved. Threshold and stretch do not apply.
15%
Personal goals This target measures achievement of key individual performance goals as part of the balanced scorecard approach. It is subject to a threshold level of performance before there is eligibility for any payment. Payment is capped at achievement of target performance.
20%
How and when is performance assessed?
The STI payable is determined after the preparation of the financial statements each year (in respect of the financial measures) and after the executive’s performance review score is determined by the CEO (or in the case of the CEO, by the Board). STI payments are generally made to executives in October.
Will the STI arrangements detailed above apply next year?
The STI arrangements outlined above will continue in the 2015 financial year. Executive benchmarking conducted since 2011 has consistently indicated that variable remuneration for Asciano executives is lower than ASX 100 benchmarks. The only change to STI in the 2015 financial year is that KMP (excluding the CEO) will have a target STI opportunity of 60% of fixed remuneration.
Why were these performance measures chosen again for the 2015 financial year?
The Board believes the above performance measures appropriately reflect Asciano’s current strategic priorities and value creating activities. Our strategy remains consistent with that implemented last year, so little will need to change.
Why aren’t the specific performance targets and their outcomes for each measure disclosed?
The Board believes that it would not be in the interests of shareholders to make specific disclosure of the actual targets set for executives in relation to EBIT, safety and customer satisfaction. Such disclosure would make commercially sensitive information available publicly.
Are there any arrangements to defer the STI into shares?
The STI is paid in cash (75%) and rights to shares (25%) (STI Rights) to reward short-term performance whilst still incentivising longer-term Company performance. Of the portion of the STI deferred into STI Rights, half will vest after one year and half will vest after two years. No dividends are payable on unvested rights to shares. Vesting of the STI Rights is subject to the executive’s ongoing employment with Asciano. The obligation for STI Rights that do vest will be satisfied by market purchase in accordance with Company policy.
What happens to the STI award on cessation of employment?
In general, where an executive’s employment is terminated by the Company “without cause” during the course of a performance year, the executive is entitled to a pro-rata STI for that proportion of the current financial year elapsed on the termination date. In general, where an executive’s employment ceases by reason of resignation or is terminated by the Company “for cause”, any STI opportunity lapses.
Directors’ report
Asciano Limited72
For
per
sona
l use
onl
y

3 0 A S C I A N O L I M I T E D D I R E C T O R S ’ R E P O R T F O R T H E Y E A R E N D E D 3 0 J U N E 2 0 1 4
7. Remuneration report – audited (continued)
Detail of STI arrangements for the 2014 financial year (continued) What are the minimum and maximum values of the STI opportunity?
The amount of STI payable in the 2014 financial year to KMP is set out as the short-term incentive payment in the table at 6.3. The STI Deferred Rights (number and value) are shown in table “Short-term incentive (STI) rights allocated under the STI Plan”.
Why is the STI opportunity in relation to EBIT uncapped?
The Board believes it is appropriate and in the interest of shareholders to encourage executives to overachieve as much as possible in relation to its EBIT targets.
The actual STI payable, the percentage of the total target STI payable and the percentage of the STI forfeited by executives for the 2014 financial year were as follows:
2014 executives Actual STI payable $
% of target STI payable
% of target STI forfeited
John Mullen 1,909,500 100% 0% Roger Burrows 400,000 100% 0% Alistair Field 340,000 100% 0% David Irwin1 434,538 111% 0% Philip Tonks 241,650 89.5% 10.5% Angus McKay2 412,300 66.4% 33.6% 1. Mr David Irwin was eligible for an additional 45% of FAR (total 100%) as an STI under a retention plan established 1 December 2011. This eligibility ceased on his appointment as
Director Pacific National on 18 February 2014. No retention payment will be made for the 2014 financial year. 2. Mr Angus McKay ceased to be a KMP on 28 February 2014, and the STI paid relates to this period only.
Long-term incentive (LTI)
Key developments: 2015 financial year Our LTI design was comprehensively reviewed against other LTI designs in the 2013 financial year, and further options were
considered in the 2014 financial year. The current LTI design continues to give the strongest alignment between long-term performance of the business and executive reward. For this reason, the LTI design is unchanged for the 2015 financial year.
To improve our market relativity on total target remuneration, target LTI opportunity for KMP (excluding the CEO) will be increased from 40% to 50% of fixed remuneration in the 2015 financial year.
LTI performance: 2014 financial year Two prior year LTI plans were due for testing on 30 June 2014 – the 2011 financial year plan and the 2012 financial year plan.
2011 financial year plan LTI options were granted to executives in 2011 with an exercise price of $5.01 and a performance period from 1 July 2010 to 30 June 2013 (with a retest hurdle of the TSR hurdle at 30 June 2014). The performance measure for this plan was TSR. These options were tested on 1 July 2013 and 52% vested. This plan was subject to a retest on 1 July 2014. On retesting, an additional 10% of these options vested and the remainder of these options lapsed.
2012 financial year plan LTI rights were granted to executives in 2012 with a performance period from 1 July 2011 to 30 June 2014 (with a retest hurdle of the TSR hurdle at 30 June 2015). The LTI Rights granted for the 2012 financial year are divided into two equal tranches, one with a ROCE hurdle and the other with a TSR hurdle. The portion related to ROCE were tested on 1 July 2014 and lapsed. The portion related to TSR did not vest and are subject to retesting on 1 July 2015.
2013 financial year plan LTI rights granted to executives in 2013 were not due for testing in the 2014 financial year. The test date is 1 July 2015. LTI rights were granted to executives in 2013 with a performance period from 1 July 2012 to 30 June 2015 (with a retest hurdle of the TSR hurdle at 30 June 2016). The LTI Rights granted for the 2013 financial year are divided into two equal tranches, one with a ROCE hurdle and the other with a TSR hurdle as disclosed in the 2013 Annual Report.
Directors’ report
Annual report 201473
For
per
sona
l use
onl
y

3 1 A S C I A N O L I M I T E D D I R E C T O R S ’ R E P O R T F O R T H E Y E A R E N D E D 3 0 J U N E 2 0 1 4
7. Remuneration report – audited (continued)
Detail of LTI arrangements for the 2014 financial year What is the 2014 LTI Plan and who participates?
The LTI component of remuneration is designed for selected executives with responsibility for significant Asciano outcomes. Under the current plan, executives are granted performance rights to a security in the future, subject to achievement of certain time-based and performance-based vesting conditions (LTI Rights). The LTI Plan is designed to align the interests of executives with those of Asciano’s shareholders, allow the executives to share in the growth in value of Asciano, and assist Asciano in building a performance-oriented culture over the long term.
How is the number of performance rights to be granted determined?
The LTI opportunity offered to each executive is determined using a Board approved internal framework which refers to relevant market benchmarks to establish the appropriate remuneration mix for executive roles. The number of LTI Rights issued to each executive is calculated by dividing the value of their LTI opportunity (calculated as a percentage of their FAR) by the valuation per right.
What are the performance hurdles and why were they chosen?
The LTI Rights granted for the 2014 financial year are divided into two equal tranches, one with a ROCE hurdle and the other with a TSR hurdle. ROCE is calculated using the formula, “EBIT divided by capital employed”, where:
EBIT is earnings before interest and tax, adjusted for material items; and
capital employed is the net operating assets of the Group.
The vesting schedule for ROCE is as follows:
Level of performance Percentage of rights that vest Less than threshold ROCE 0% vesting Threshold ROCE 50% vesting Between the threshold and target ROCE 75% vesting at midpoint between threshold and target ROCE target 100% vesting The level of ROCE required to attract full or partial vesting under this component of the LTI Plan is highly commercially sensitive and therefore will only be disclosed on a retrospective basis following the end of the performance period. Asciano’s TSR performance is calculated relative to companies in the S&P/ASX 100 Index (excluding resources and financial companies) over a three (or, where retesting occurs, four) year period. This peer group is used because the Board believes it represents the most appropriate comparator group, being broad-based and appropriate to Asciano’s market positioning. The vesting schedule for TSR performance is shown below and was chosen to ensure that executives are only rewarded when Asciano’s TSR is at least at the median against the comparator group of companies:
Percentile ranking Percentage of rights that vest* Less than the 50th percentile 0% vesting Equal to the 50th percentile 50% vesting Between the 50th and 75th percentile An additional 2% of rights will vest for each 1 percentile
increase above the 50th percentile Equal to the 75th percentile or above 100% vesting Awards vest progressively on a straight line basis, such that an additional 2% of rights vest for each 1 percentage increase above
the 50th percentile, capped at 100%.
The Board believes that TSR as a performance measure is both transparent and robust (i.e. it is not subject to the exercise of judgement or interpretation) and is generally well understood by both shareholders and management, thereby providing a “real” incentive to participants. It also ensures there is alignment between comparative shareholder return and executive rewards.
Directors’ report
Asciano Limited74
For
per
sona
l use
onl
y

3 2 A S C I A N O L I M I T E D D I R E C T O R S ’ R E P O R T F O R T H E Y E A R E N D E D 3 0 J U N E 2 0 1 4
7. Remuneration report – audited (continued)
Detail of LTI arrangements for the 2014 financial year (continued) What is the performance period for the 2014 financial year LTI and when do performance rights vest?
LTI Rights in the ROCE tranche vest over a three year period. LTI Rights in the TSR tranche vest over a three year period, with an extra year for retesting. Asciano believes that including this retest is appropriate given the long-term nature of many of the business decisions being made by its executives. Both tranches are subject to achieving the time-based and performance-based vesting conditions described above. No dividends are payable on unvested LTI Rights. For the grant of LTI Rights made during the 2014 financial year, the performance period commenced on 1 July 2013, with a test date of 1 July 2016. If required, the TSR tranche will have a retest on 1 July 2017. Any LTI Rights which do not vest at the end of the applicable performance period will lapse. The obligation for LTI Rights that do vest will be satisfied by market purchase in accordance with Company policy.
What are the minimum and maximum values of the grants?
The minimum value of the LTI grants is $nil. The maximum value is disclosed in the table headed “Rights allocated under the Asciano LTI Plan” on page 80.
Are there any restrictions on the trading of the shares once vested?
Shares allocated on vesting of LTI Rights are not subject to a holding lock unless requested by the executive. Executives offered the opportunity to participate in the LTI Rights offer have the option of requesting a five or seven year holding lock. If so requested, any shares acquired upon vesting LTI Rights will be subject to a holding lock (which means the relevant executive cannot transfer or otherwise dispose of the shares) for five or seven years from the date the LTI Rights are granted. If a holding lock is not requested, the shares are available on vesting. The Board may lift a holding lock upon application by an executive in exceptional circumstances. In accordance with the Corporations Act 2001, KMP or their related parties are prohibited from entering into any transaction that has the effect of limiting their exposure to fluctuations in the value of awards granted to them under the LTI or STI Plan. The ban is for the period in which the awards have not yet vested and for any subsequent period that the awards are subject to a holding lock. All trading is governed by the Company’s Share Trading Policy.
Is any amount payable on grant of the rights?
No amount is payable in respect of the grant of the LTI Rights.
What happens on a change of control of the Company?
In accordance with the plan rules, the Board has discretion to waive any vesting conditions attached to the STI or LTI Rights.
What happens if the executive ceases employment?
Where an executive ceases employment with Asciano, any unvested LTI Rights or any vested options that have not been exercised within the required period will lapse, except in specified circumstances in accordance with the plan rules.
Service agreements – executives Details of the service agreement for the CEO are set out in section 7.3 of this Remuneration report. All service agreements for the executives are for unlimited duration. The Company may terminate an executive’s employment by providing six months’ notice (or by making payment in lieu), and may terminate immediately for misconduct or where there is a material breach of contract. Each of the executives may terminate by giving three or six months’ notice to the Company depending on the individual’s service agreement. Executives are not entitled to any additional termination payments under their contracts of employment.
Former executive remuneration arrangements Mr Angus McKay ceased as Director Pacific National Rail on 28 February 2014. Details of Mr McKay’s remuneration for the year are set out in the remuneration table on page 78. On cessation, Mr McKay was paid in accordance with contractual entitlements. His contract was drafted on the commencement of his employment to comply with the key principles of the termination payment regulations contained in the Corporations Act. Under the terms of his contract, Mr McKay was entitled to six months’ payment in lieu of notice of $448,519 and severance payment of three weeks per year of service of $167,746. His annual leave of $9,442 was also paid. No additional termination payments were made.
Directors’ report
Annual report 201475
For
per
sona
l use
onl
y

3 3 A S C I A N O L I M I T E D D I R E C T O R S ’ R E P O R T F O R T H E Y E A R E N D E D 3 0 J U N E 2 0 1 4
7. Remuneration report – audited (continued)
Mr McKay was eligible to participate in the STI Plan for the 2014 financial year. As he was a good leaver, in accordance with plan rules, he received STI payment for the 2014 financial year pro-rated for his service to 28 February 2014. As detailed in the table on page 78, Mr McKay received an STI payment of $412,300 and forfeited the remainder of $208,700. In the 2012 and 2013 financial year STI Deferral Plans, Mr McKay earned rights which were under a time restriction. On cessation of employment, and in accordance with the plan rules for good leavers, this restriction was lifted and Mr McKay’s rights were converted to fully paid shares in Asciano. Further detail is in the remuneration tables and data in section 7.6 of this report. Mr McKay was a participant in the 2011, 2012, 2013 and 2014 financial year LTI Plans. His entitlements under these incentive arrangements were pro-rated for the period of his employment, and any remaining entitlement was forfeited. The pro-rated entitlements will stay on foot, and any future vesting or forfeiture will be based on performance of the plan against the applicable performance conditions at the end of the relevant period. Further detail is in the remuneration tables and data in section 7.6 of this report.
7.5 Non-Executive Director remuneration Remuneration policy Policy objective Comment
Aggregate fees approved by shareholders
The current aggregate fee pool for Non-Executive Directors of $3 million per annum was approved by shareholders at the 2010 AGM. Board and committee fees, as well as statutory superannuation contributions made on behalf of the Non-Executive Directors, are included in the aggregate fee pool.
Promote independence and objectivity
Non-Executive Directors receive a cash fee for service. To preserve independence and impartiality, Non-Executive Directors do not receive any performance related remuneration or any retirement benefits other than statutory superannuation.
Regular reviews of remuneration Non-Executive Director fees are determined by the Board by reference to Non-Executive Director fees paid by S&P/ASX 100 Index companies, whilst also considering the responsibilities, skills and workload of the Non-Executive Directors. The Board also seeks independent advice in benchmarking the level of fees paid.
Structure and level of fees
Key developments: 2015 financial year As we anticipate challenging market conditions in the coming year, we will not be increasing Non-Executive Director fees
in the 2015 financial year.
The table below shows the structure and level of Non-Executive Director fees as at the end of the 2014 and 2013 financial years:
Board/Committee Role 2014
$ 2013
$
Board Chairman Member
525,000 170,000
525,000 170,000
Audit and Risk Committee Chairman Member
40,000 20,000
40,000 20,000
Remuneration Committee Chairman Member
35,000 15,000
35,000 15,000
Nomination and Succession Planning Committee Chairman1 Member
– 12,000
– 12,000
Sustainability Committee Chair Member
25,000 12,000
25,000 12,000
1. The Chairman of the Board is currently Chairman of the Nomination and Succession Planning Committee, and no additional fee is payable for this role.
Directors’ report
Asciano Limited76
For
per
sona
l use
onl
y

3 4 A S C I A N O L I M I T E D D I R E C T O R S ’ R E P O R T F O R T H E Y E A R E N D E D 3 0 J U N E 2 0 1 4
7. Remuneration report – audited (continued)
Remuneration of Non-Executive Directors for the year ended 30 June 2014
Short-term benefits Post-employment
benefits
Non-Executive Directors Year Fees Non-monetary
benefits Sub-total Superannuation Total $ $ $ $
Malcolm Broomhead 2014 507,225 – 507,225 17,775 525,000 Independent Chairman 2013 508,530 – 508,530 16,470 525,000
Chris Barlow 2014 211,225 – 211,225 17,775 229,000 Independent Director 2013 212,530 – 212,530 16,470 229,000
Robert Edgar 2014 199,225 – 199,225 17,775 217,000 Independent Director 2013 200,530 – 200,530 16,470 217,000
Peter George 2014 196,225 – 196,225 17,775 214,000 Independent Director 2013 207,530 – 207,530 16,470 224,000
Shirley In’t Veld 2014 189,474 – 189,474 17,526 207,000 Independent Director 2013 190,530 – 190,530 16,470 207,000
Geoff Kleemann 2014 219,225 – 219,225 17,775 237,000 Independent Director 2013 210,530 – 210,530 16,470 227,000
Ralph Waters1,2 2014 172,082 – 172,082 15,918 188,000 Independent Director 2013 143,379 – 143,379 12,904 156,283
Total 2014 1,694,681 – 1,694,681 122,319 1,817,000 2013 1,673,559 – 1,673,559 111,724 1,785,283 1. Mr Ralph Waters was appointed to the Sustainability Committee on 19 December 2013.
2. Mr Ralph Waters was appointed a Non-Executive Director of Asciano Limited effective from 23 August 2012; therefore, remuneration disclosed for the comparative period is from this date onwards.
Directors’ report
Annual report 201477
For
per
sona
l use
onl
y

3 5 A S C I A N O L I M I T E D D I R E C T O R S ’ R E P O R T F O R T H E Y E A R E N D E D 3 0 J U N E 2 0 1 4
7. Remuneration report – audited (continued)
7.6 Remuneration tables and data Remuneration of the Executive Director and KMP for the year ended 30 June 2014
Short-term benefits
Post- employment
benefits
Other long-
term benefits
Termination
benefits Share-based payments
$ Year Salary
and fees1 Cash
incentive2
Non- monetary
benefit Sub-total Super-
annuation
Long service
accrual Termination
payments Equity
settled3
Value of awards as % of total
remune-ration
% performance
related Total
Executive Director John Mullen 2014 1,979,797 1,432,125 1,825 3,413,747 17,775 24,495 – 1,298,687 27 57 4,754,704 CEO 2013 2,023,550 1,404,915 1,252 3,429,717 16,470 27,539 – 1,443,540 29 58 4,917,266
Executives Roger Burrows4 2014 815,841 300,000 1,825 1,117,666 17,775 8,009 – 304,183 21 42 1,447,633 CFO 2013 320,021 294,300 479 614,800 8,235 2,736 – 84,155 12 53 709,926 Alistair Field 2014 629,312 255,000 2,635 886,947 25,837 9,114 – 203,535 18 41 1,125,433 Director Terminals & Logistics
2013 624,672 223,493 1,252 849,417 16,470 14,933 – 179,510 17 38 1,060,330
David Irwin5 2014 773,483 325,904 30,056 1,129,443 19,488 104,393 – 204,903 14 36 1,458,227
Director Pacific National
2013 655,340 571,428 34,250 1,261,018 18,184 46,996 – 344,424 21 55 1,670,622
Philip Tonks6 2014 524,182 181,238 2,278 707,698 26,305 6,698 – 224,247 23 42 964,948 Director Ports & General Stevedoring
2013 282,837 166,950 638 450,425 16,765 33,552 – 124,889 20 47 625,631
Former executive Angus McKay7
2014 525,662 412,300 1,840 939,802 13,331 – 625,707 313,379 17 38 1,892,219 Director PN Rail 2013 915,011 358,162 1,312 1,274,485 16,470 14,817 – 620,476 32 51 1,926,248
Total 2014 5,248,277 2,906,567 40,459 8,195,303 120,511 152,709 625,707 2,548,934 22 47 11,643,164
2013 4,821,431 3,019,248 39,183 7,879,862 92,594 140,573 – 2,796,994 26 53 10,910,023
1. Salary and fees includes cash salary and accrued annual leave. 2. The cash incentive amount represents the actual STI to be paid in October 2014 (75% cash component of the STI for the 2014 financial year). 3. Equity settled component of remuneration is comprised of the STI and LTI rights expense. 4. Mr Roger Burrows joined Asciano as CFO on 18 February 2013. Remuneration disclosed for the comparative period is from this date onwards. 5. Mr David Irwin was Director PN Coal up to 18 February 2014, when he commenced as Director Pacific National. 6. Mr Philip Tonks became a KMP on 1 January 2013. Remuneration disclosed for the comparative period is only for the period Mr Tonks was a KMP. 7. Mr Angus McKay ceased employment on 28 February 2014.
Directors’ report
Asciano Limited78
For
per
sona
l use
onl
y

3 6 A S C I A N O L I M I T E D D I R E C T O R S ’ R E P O R T F O R T H E Y E A R E N D E D 3 0 J U N E 2 0 1 4
7. Remuneration report – audited (continued)
Options allocated under the Asciano Options and Rights Plan The Option Plan was established to provide LTIs for executives and selected employees. Under the Option Plan, participants were granted options that only vest if certain time-based and performance-based vesting conditions are met. Participation in the Option Plan was at the Board’s discretion, and no individual had a contractual right to participate in the Option Plan or to receive any guaranteed benefits. The number of options granted to executives and selected employees was based upon their target LTI. This target LTI was determined based upon the executive’s or employee’s level of seniority and contribution to the profitability of Asciano. The options vest over a three to four year period and are subject to Asciano’s relative TSR performance against companies in the S&P/ASX 100 Index (excluding resources and financial companies). The options also have an additional, inherent, performance hurdle, being that the share price at vesting date must be above the exercise price. The options are equity settled. Vested options can be exercised to acquire shares in the Company, subject to paying an exercise price. No options were granted during the 2014 financial year, as the Company now uses a rights plan for its LTI Plan. The acquired shares are subject to a holding lock for a maximum period of seven years from the date the options were granted. Once the holding lock has lifted, the shares can be sold at any time subject to compliance with the Asciano Share Trading Policy. Options granted under the Option Plan are for no consideration and carry no dividend or voting rights. The table below sets out details of options held by and granted to executives during the 2014 financial year.
2014 Grant date Tranche1 Held at
1 July 2013
Granted during the
year
Fair value of options
granted during the
year ($)
Exercised during
the year
Lapsed during
the year
Held at 30 June
2014
Executives John Mullen3 10 November 2011 A 516,186 – – – – 516,186 Alistair Field3 17 December 2010 A 69,445 – – – – 69,445 David Irwin2,3 15 July 2010 A 123,457 – – – – 123,457 8 October 2009 A 17,730 – – 10,638 7,092 – 8 October 2009 B 53,192 – – 53,192 – – Philip Tonks2,3 17 December 2010 A 61,729 – – – – 61,729 8 October 2009 A 17,730 – – 10,638 7,092 – 8 October 2009 B 53,192 – – 53,192 – – Former executive Angus McKay3,4 17 December 2010 A 343,750 – – 178,750 – 165,000 1. Options allocated to executives in Tranche A are subject to the relative TSR performance hurdle, while options allocated in Tranche B are subject to the EBIT performance
hurdle. 2. Options granted on 8 October 2009 and subject to an EBIT hurdle vested during the 2013 financial year and were exercised during the current year. Options granted on
8 October 2009 and subject to the TSR hurdle were retested on 1 July 2013 and 60% vested. These vested options were also exercised during the current year, with the unvested balance lapsing.
3. Options granted on 15 July 2010, 17 December 2010 and 10 November 2011 are subject to a TSR hurdle. These options were tested on 1 July 2013 and 52% vested. The remaining unvested options under this plan were retested on 1 July 2014 and an additional 10% vested. Of the 1,114,567 options granted on 15 July 2010, 17 December 2010 and 10 November 2011 and held at 30 June 2014, 691,031 were vested options.
4. Mr Angus McKay ceased to be a KMP on 28 February 2014.
There were no vested options held by KMP that were not exercisable at 30 June 2014 or at 30 June 2013. The Non-Executive Directors did not hold any options during the reporting period.
Directors’ report
Annual report 201479
For
per
sona
l use
onl
y

3 7 A S C I A N O L I M I T E D D I R E C T O R S ’ R E P O R T F O R T H E Y E A R E N D E D 3 0 J U N E 2 0 1 4
7. Remuneration report – audited (continued)
Rights allocated under the Asciano LTI Plan The table below sets out details of the rights allocated to the executives during the 2014 financial year under the Asciano LTI Plan (as outlined in section 7.4).
2013 Grant date Tranche1 Held at
1 July 2013
Granted during the
year
Fair value of rights granted
during the year ($)2
Vested during
the year
Lapsed during
the year
Held at 30 June
2014
Executives John Mullen 12 November 2013 A – 236,674 939,596 – – 236,674 12 November 2013 B – 236,674 1,282,773 – – 236,674 15 November 2012 A 257,768 – – – – 257,768 15 November 2012 B 257,767 – – – – 257,767 10 November 20113 A 224,072 – – – – 224,072 10 November 20113 B 224,072 – – – – 224,072 Roger Burrows 20 August 2013 A – 37,126 124,743 – – 37,126 20 August 2013 B – 37,125 181,912 – – 37,125 3 November 2012 A 40,434 – – – – 40,434 3 November 2012 B 40,434 – – – – 40,434 Alistair Field 20 August 2013 A – 31,557 106,031 – – 31,557 20 August 2013 B – 31,556 154,624 – – 31,556 3 October 2012 A 31,842 – – – – 31,842 3 October 2012 B 31,842 – – – – 31,842 18 April 20123 A 13,181 – – – – 13,181 18 April 20123 B 13,180 – – – – 13,180 David Irwin 18 February 2014 A – 4,351 14,619 – – 4,351 18 February 2014 B – 4,351 21,320 – – 4,351 20 August 2013 A – 32,484 109,146 – – 32,484 20 August 2013 B – 32,484 159,171 – – 32,484 3 October 2012 A 34,693 – – – – 34,693 3 October 2012 B 34,692 – – – – 34,692 16 January 20123 A 28,998 – – – – 28,998 16 January 20123 B 28,997 – – – – 28,997 Philip Tonks 20 August 2013 A – 25,060 84,201 – – 25,060 20 August 2013 B – 25,059 122,789 – – 25,059 9 January 2013 A 13,394 – – – – 13,394 9 January 2013 B 13,394 – – – – 13,394
Former executive Angus McKay4 20 August 2013 A – 53,252 178,926 – – 53,252 20 August 2013 B – 53,251 260,930 – – 53,251 3 October 2012 A 57,998 – – – – 57,998 3 October 2012 B 57,997 – – – – 57,997 16 January 20123 A 50,526 – – – – 50,526 16 January 20123 B 50,526 – – – – 50,526 1. Rights allocated to executives in Tranche A are subject to the relative TSR performance hurdle, while rights allocated in Tranche B are subject to the ROCE performance hurdle. 2. The rights subject to the TSR hurdle have a fair value per right of $2.50, $2.87, $2.08, $3.01, $3.36, $3.97 and $3.90 on grant dates 3 October 2012, 3 November 2012,
14 November 2012, 9 January 2013, 20 August 2013, 12 November 2013 and 18 February 2014 respectively, and have been valued at grant date using a Monte Carlo simulation. The rights subject to the ROCE performance hurdle have a fair value per right of $4.19, $4.25, $3.95, $4.47, $4.90, $5.42 and $5.39 on grant dates 3 October 2012, 3 November 2012, 14 November 2012, 9 January 2013, 20 August 2013, 12 November 2013 and 18 February 2014 respectively, and have been valued using the Binomial methodology.
3. Rights allocated to executives during the 2012 financial year (10 November 2011, 16 January 2012 and 18 April 2012) were tested on 1 July 2014. The rights subject to the ROCE performance hurdle lapsed, while the rights subject to the TSR performance hurdle did not vest and are subject to retesting on 1 July 2015.
4. Mr Angus McKay ceased to be a KMP on 28 February 2014.
No rights allocated under the LTI Plan vested during the 2014 financial year, and there were no vested rights held by KMP that were exercisable at 30 June 2014.
Directors’ report
Asciano Limited80
For
per
sona
l use
onl
y

3 8 A S C I A N O L I M I T E D D I R E C T O R S ’ R E P O R T F O R T H E Y E A R E N D E D 3 0 J U N E 2 0 1 4
7. Remuneration report – audited (continued)
STI Rights allocated under the STI Plan The table below sets out details of the STI Rights allocated to the executives during the 2014 financial year under the STI Plan (as outlined in section 7.4).
2014 Grant date1 Tranche Held at
1 July 2013
Granted during
the year
Fair value of rights granted
($)2
Exercised during
the year
Lapsed during
the year
Held at 30 June
2014
Executives John Mullen 20 August 2013 A – 50,002 255,510 – – 50,002 20 August 2013 B – 50,002 249,510 – – 50,002 3 October 2012 A 40,147 – – 40,147 – – 3 October 2012 B 40,147 – – – – 40,147 Roger Burrows 20 August 2013 A – 10,475 53,527 – – 10,475 20 August 2013 B – 10,474 52,265 – – 10,474 Alistair Field 20 August 2013 A – 7,954 40,645 – – 7,954 20 August 2013 B – 7,954 39,690 – – 7,954 3 October 2012 A 5,904 – – 5,904 – – 3 October 2012 B 5,904 – – – – 5,904 David Irwin 20 August 2013 A – 9,345 47,753 – – 9,345 20 August 2013 B – 9,344 46,627 – – 9,344 3 October 2012 A 9,013 – – 9,013 – – 3 October 2012 B 9,012 – – – – 9,012 Philip Tonks 20 August 2013 A – 11,884 60,727 – – 11,884 20 August 2013 B – 11,884 60,727 – – 11,884 3 October 2012 A 12,868 – – 12,868 – – 3 October 2012 B 12,867 – – – – 12,867
Former executive Angus McKay3 20 August 2013 A – 12,747 65,137 12,747 – – 20 August 2013 B 12,747 63,608 12,747 – – 3 October 2012 A 13,579 – – 13,579 – – 3 October 2012 B 13,579 – – 13,579 – – 1. STI rights allocated to executives on 20 August 2013 are subject to a service condition whereby the executive is required to remain employed by the Asciano Group on
1 September 2014 (Tranche A) and 1 September 2015 (Tranche B). STI rights allocated to executives on 3 October 2012 are subject to a service condition whereby the executive is required to remain employed by the Asciano Group on 1 September 2013 (Tranche A) and 1 September 2014 (Tranche B).
2. The STI rights subject to a service condition to 1 September 2014 have a fair value per right of $5.11 and the STI rights subject to a service condition to 1 September 2015 have a fair value per right of $4.99. Both tranches have a grant date of 20 August 2013 and have been valued at grant date using the Binomial methodology. The STI rights subject to a service condition to 1 September 2013 have a fair value per right of $4.36 and the STI rights subject to a service condition to 1 September 2014 have a fair value per right of $4.27. Both tranches have a grant date of 3 October 2012 and have been valued at grant date using the Binomial methodology.
3. Mr Angus McKay ceased to be a KMP on 28 February 2014. As a result of Mr McKay being a “good leaver” all of his STI rights vested at that date.
For the year ended 30 June 2014, management has included an estimated expense for STI Rights in respect of the 2014 financial year which will be granted during the 2015 financial year. 120,584 STI Rights vested during the 2014 financial year.
Directors’ report
Annual report 201481
For
per
sona
l use
onl
y

3 9 A S C I A N O L I M I T E D D I R E C T O R S ’ R E P O R T F O R T H E Y E A R E N D E D 3 0 J U N E 2 0 1 4
7. Remuneration report – audited (continued)
Equity holdings and transactions The movement during the financial year in the number of Asciano’s shares held directly, indirectly or beneficially by KMP including their related parties, is set out in the following table:
2014 Opening balance Acquired Sold
Exercised options
during the year Other1
Closing balance
Non-Executive Directors2
Malcolm Broomhead 110,000 – – – – 110,000
Chris Barlow 8,759 – – – – 8,759
Robert Edgar 38,296 – – – – 38,296
Peter George 46 – – – – 46
Shirley In’t Veld – – – – – –
Geoff Kleemann 16,667 – – – – 16,667
Ralph Waters 25,000 – – – – 25,000
Executive Director
John Mullen – – – – 40,147 40,147
Executives
Roger Burrows – – – – – –
Alistair Field – – – – 5,904 5,904
David Irwin 47,413 – – 63,830 9,013 120,256
Philip Tonks 1,107 – – 63,830 12,868 77,805
Former executive
Angus McKay3 149,669 – (178,750) 178,750 52,652 202,321 1. The movement in “Other” includes the vesting of 81,511 and 13,579 of 2012 STI rights on 3 September 2013 and 28 February 2014 respectively, and 25,494 of 2013 STI rights on
28 February 2014. 2. A number of the Non-Executive Directors had intended to increase their shareholdings in Asciano during the 2014 financial year, however, were not able to do so due to the
requirements of Asciano’s Share Trading Policy. These Non-Executive Directors intend to increase their shareholdings in Asciano in the 2015 fianancial year if able to do so. 3. Mr McKay ceased to be a KMP on 28 February 2014.
Purchase of securities to satisfy employee entitlements Asciano’s policy is to satisfy all employee equity entitlements through on-market purchase. During the 2014 financial year, the Asciano Employee Share Plan Trust purchased 855,000 Asciano shares at an average price of $5.54 per share.
Loans with KMP No loans were made to KMP during the current or prior financial year.
Other transactions with KMP A number of KMP, or their related parties, hold positions in other entities that may from time to time transact with Asciano. The terms and conditions of any such transactions with KMP and their related parties are no more favourable than those available, or which might reasonably be expected to be available, on similar transactions to non-KMP related entities on an arm’s length basis.
7.7 Additional information – Company performance The table below summarises key indicators of Asciano’s performance and the effect on shareholder value for the past five financial years. The EBIT before material items and ROCE measures were used as measures in relation to the STI and LTI respectively for the 2014 financial year. EBIT growth per share was used as a performance measure for the tranche of the 2010 LTI grant retested in the 2014 financial year.
Directors’ report
Asciano Limited82
For
per
sona
l use
onl
y

4 0 A S C I A N O L I M I T E D D I R E C T O R S ’ R E P O R T F O R T H E Y E A R E N D E D 3 0 J U N E 2 0 1 4
7. Remuneration report – audited (continued)
Year ended 30 June 2014 RESTATED1
2013 2012 2011 2010
EBIT – before material items ($M) 720.3 686.0 616.7 539.1 442.8
EBIT – before material items per share (cents) 73.8 70.3 63.1 55.2 45.3
Net profit/(loss) after tax attributable to owners of Asciano ($M)
254.4 334.5 240.8 201.6 (788.6)
Parent diluted earnings per share (cents) 26.1 34.2 24.7 20.7 (84.9)
Dividends per share (cents) 8.5 11.5 7.5 6.0 –
Closing share price ($ as at 30 June) 5.63 5.02 4.35 4.92 4.863
ROCE (%)2 10.69 11.00 10.50 9.64 7.39 1. The restatement relates to the adoption of the amended accounting standard AASB 119 Employee Benefits (2011), as outlined in note 1(f) to the financial statements. 2. ROCE is calculated on the formula “EBIT divided by capital employed” where EBIT is earnings before interest and tax, (adjusted for material items); and capital employed is the
net operating assets of the business. 3. The opening share price at 1 July 2009 was $3.93 (post consolidation).
8. Principal activities The principal activities of Asciano during the course of the financial year were the ownership and management of ports and rail assets and associated operations and services. There has been no significant change in the nature of these activities of Asciano during the financial year.
9. Operating and financial review Asciano reported a net profit after tax (“NPAT”) attributable to the owners of Asciano Limited of $254.4 million representing a 23.9% decrease on the profit of $334.4 million in the 2013 financial year. The current year reported NPAT included material items (loss) of $95.4 million (2013: material items (loss) of $8.1 million). A reconciliation of the reported NPAT and the underlying NPAT for the various components of the after-tax material loss is provided in the table below:
2014
$M
RESTATED1 2013
$M
NPAT attributable to the owners of Asciano Limited 254.4 334.4
Pacific National integration 57.2 –
Port Botany redevelopment 27.0 14.7
Other restructuring expenses 11.2 2.2
Revaluation of the original investment in C3 to fair value – (17.1)
Legacy charges related to items arising on or before demerger – 8.3
Underlying NPAT 349.8 342.5
1. The restatement relates to the adoption of the amended accounting standard AASB 119 Employee Benefits (2011), as outlined in note 1(f) to the financial statements.
The Company reported a 2.1% increase in underlying NPAT to $349.8 million. The result was driven by strong growth in coal volumes driven by new contracts and a higher percentage of coal hauled versus contracted, good growth in container volumes in the second half of FY14 assisted by new contract wins, significant growth in car processing and storage volumes and a stronger growth in the contribution from Bulk Ports driven primarily by a full year contribution from C3 Limited and an initial contribution from the Mountain Industries entities. Reported NPAT declined 23.9% due to a significant increase in material costs from $8.1 million in the 2013 financial year to $95.4 million in the current year. Costs relate to the redevelopment of Port Botany, the costs of the integration of the two Pacific National divisions and the restructure of corporate and shared services. Of this cost, $71.8 million was non-cash and related primarily to the write-down of rolling stock following the announced integration of the two Pacific National divisions. A review of, and information about, the Asciano Group’s operations, including the results of those operations and changes in the state of affairs of the Asciano Group during the year, together with information about the Group’s financial position, business strategies and prospects for future financial years, appear on pages 6 to 36 of the OFR which forms part of the Directors’ report.
Directors’ report
Annual report 201483
For
per
sona
l use
onl
y

4 1 A S C I A N O L I M I T E D D I R E C T O R S ’ R E P O R T F O R T H E Y E A R E N D E D 3 0 J U N E 2 0 1 4
10. Dividends The Board of Directors determined on 21 August 2014 that a fully franked final dividend of 8.50 cents per share is payable by Asciano Limited on 19 September 2014. The record date for entitlement to the dividend is 1 September 2014. The dividend of $82.9 million was not recognised as a liability at 30 June 2014. A fully franked interim dividend of 5.75 cents per share was paid on 20 March 2014, with a record date for entitlement to the dividend of 6 March 2014.
11. Business strategies, prospects and likely developments The operating and financial review sets out information on the business strategies and prospects for future financial years, and refers to likely developments in Asciano's operations and the expected results of those operations in future financial years (see pages 6 to 36 of the OFR which forms part of the Directors' report). Information in the OFR is provided to enable shareholders to make an informed assessment about the business strategies and prospects for future financial years of the Asciano Group. Information that could give rise to likely material detriment to Asciano, for example, information that is commercially sensitive, confidential or could give a third party a commercial advantage has not been included. Other than the information set out in the OFR, information about other likely developments in Asciano's operations and the expected results of these operations in future financial years has not been included.
12. Directors’ interests The relevant interests of each Director (and their related parties) in the shares and options issued by the Company and other related bodies corporate, as notified by the Directors to the ASX in accordance with section 205G (1) of the Corporations Act 2001, are as set out below: Shares Options
Executive Director
John Mullen1 2,133,511 516,186
Non-Executive Directors2
Malcolm Broomhead 110,000 –
Chris Barlow 8,759 –
Robert Edgar 38,296 –
Peter George 46 –
Shirley In’t Veld – –
Geoff Kleemann 16,667 –
Ralph Waters 25,000 – 1. Amount disclosed includes share rights granted for the 2012, 2013 and 2014 financial years. 2. A number of the Non-Executive Directors had intended to increase their shareholdings in Asciano during the 2014 financial year, however, were not able to do so due to the
requirements of Asciano’s Share Trading Policy. These Non-Executive Directors intend to increase their shareholdings in Asciano in the 2015 fianancial year if able to do so.
13. Options over shares Options granted to Directors and executives of Asciano During the 2014 financial year, there were no options granted over Asciano shares to Directors or executives of Asciano as part of their remuneration. For options issued in prior years, in accordance with the Asciano Limited Executive Incentive Plan, Asciano has the discretion in deciding whether options will be satisfied upon exercise by purchase of ordinary shares on-market or by new issue.
Unissued shares under option All options expire on the earlier of their expiry date or termination of the executives’ employment (other than in exceptional circumstances where approved by the Board in accordance with the relevant LTI Plan rules). In addition, the ability to exercise the options is conditional on Asciano achieving a relative TSR performance hurdle. Further details are included in the Remuneration report in section 7 of this Directors’ report.
Shares issued on exercise of options 127,660 options were converted to ordinary shares during the 2014 financial year at an exercise price of $4.56 per option. No amounts remain unpaid on these options. No options have been converted to shares since the end of the 2014 financial year.
Directors’ report
Asciano Limited84
For
per
sona
l use
onl
y

4 2 A S C I A N O L I M I T E D D I R E C T O R S ’ R E P O R T F O R T H E Y E A R E N D E D 3 0 J U N E 2 0 1 4
14. Indemnities and insurance for Directors and Officers Asciano has entered into insurance contracts that indemnify current and former Directors and Officers of the Parent and its controlled entities against liabilities. In accordance with normal commercial practices, under the terms of the insurance contracts, the nature of the liabilities insured against and the amount of the premium paid are confidential. Indemnity agreements have been entered into between the Parent and each of the Directors and certain Officers (current and former). Under the agreement, the Parent has agreed to indemnify the Directors/Officers against any claim or for any expenses or costs, which may arise as a result of the performance of their duties as Directors/Officers. There are no monetary limits to the extent of these indemnities. The insurance contracts and indemnity agreements extend to former Directors and Officers but do not apply to the Company’s auditors. No amounts have been paid under either the insurance contracts or the indemnity agreements, and no action has been taken to enforce them during the 2014 financial year.
15. Legal matters From time to time, Asciano is subject to claims and litigation during the normal course of business. The Directors have given consideration to such matters, which are or may be subject to litigation at year end, and are of the opinion that, other than for specific provisions already raised, no material liability exists.
16. Rounding of amounts Asciano is an entity of a kind referred to in Class Order 98/100, issued by the Australian Securities and Investments Commission (“ASIC”), relating to the rounding off of amounts in the Directors’ report and the financial statements. Amounts in the Directors’ report have been rounded off in accordance with that class order to the nearest one hundred thousand dollars or, in certain cases, to the nearest one dollar.
17. Non-audit services of the external auditor During the year, KPMG, Asciano’s auditor, performed certain services in addition to its statutory duties as external auditor. Details of the amounts paid to KPMG and its related practices for statutory audit and non-audit services are set out in note 36 to and forming part of the financial statements. The Board is satisfied, based on advice from the Audit and Risk Committee, that the non-audit services provided are compatible with the general standard of independence for auditors imposed by the Corporations Act 2001 and do not undermine the general principles relating to auditor independence as set out in APES 110 Code of Ethics for Professional Accountants, as they did not involve reviewing or auditing the auditor’s own work, acting in a management or decision-making capacity for Asciano, acting as an advocate for Asciano or jointly sharing risks and rewards.
18. Events subsequent to the reporting date On 21 August 2014, Asciano announced a number of changes to its executive team. The current Director of the Group’s Ports and Stevedoring business, Philip Tonks, will be moving into a Group-wide role to support the Group’s focus on growth opportunities. As a result, Murray Vitlich, who has been with the business since January 2012 in the role of Director Strategy and Business Development, will be appointed to the role of Director Bulk Automotive and Ports Services. Saul Cannon, who has been with the Group for over 7 years and currently holds the role of Group General Counsel and Company Secretary, will move into the role of Director Strategy and Business Development. Ms Lyndall Stoyles, who is currently the Senior Legal Counsel for the Group’s Patrick Terminals and Logistics business, will replace Mr Cannon in the role of Group General Counsel and Company Secretary. In addition to these changes, we will be integrating the leadership of our Human Resources, Corporate Affairs and cross company customer initiatives under the leadership of our current Human Resources Director, Ms Alex Badenoch. Other than for the items noted above and the resolution to pay a final dividend of 8.50 cents per share (refer to section 10), there has not arisen in the interval between the end of the 2014 financial year and the date of this report, any item, transaction or event of a material and unusual nature likely, in the opinion of the Board, to significantly affect the operations of Asciano, the results of those operations, or the state of affairs of Asciano in future financial years.
19. Outlook A summary of the outlook for Asciano is included on page 36 of the OFR.
Directors’ report
Annual report 201485
For
per
sona
l use
onl
y

4 3 A S C I A N O L I M I T E D D I R E C T O R S ’ R E P O R T F O R T H E Y E A R E N D E D 3 0 J U N E 2 0 1 4
20. Auditor’s independence declaration A copy of the auditor’s independence declaration as required under section 307C of the Corporations Act 2001 is set out on page 87 and forms part of the Directors’ report. In line with previous years and in accordance with the Corporations Act 2001, the Directors’ report, with the exception of the Remuneration report detailed in section 7, including the Operating and financial review is unaudited. Notwithstanding this, the Directors’ report including the Operating and financial review contain disclosures which are extracted or derived from the Consolidated Financial Report for the year ended 30 June 2014 which has been audited by the Group’s independent auditor. This report is made in accordance with a resolution of the Directors. Malcolm Broomhead Chairman Sydney 21 August 2014
1 1 8 A S C I A N O L I M I T E D F I N A N C I A L R E P O R T F O R T H E Y E A R E N D E D 3 0 J U N E 2 0 1 4
Directors’ declaration For the year ended 30 June 2014 In the opinion of the Directors of Asciano Limited (“Company”): (a) the consolidated financial statements and notes set out on pages 89 to 159 and the Remuneration report in the Directors’ report, set
out on pages 68 to 83, are in accordance with the Corporations Act 2001, including: (i) giving a true and fair view of the Group’s financial position as at 30 June 2014 and of its performance for the financial year ended
on that date; and (ii) complying with Australian Accounting Standards (including the Australian Accounting Interpretations) and the Corporations
Regulations 2001; and (b) there are reasonable grounds to believe that the Company will be able to pay its debts as and when they become due and
payable; and (c) there are reasonable grounds to believe that the Company and the Group entities identified in note 37 will be able to meet any
obligations or liabilities to which they are or may become subject to by virtue of the deed of cross guarantee between the Company and those Group entities pursuant to ASIC Class Order 98/1418.
The Directors have been given the declarations required by section 295A of the Corporations Act 2001 from the Chief Executive Officer and Chief Financial Officer for the financial year ended 30 June 2014. The Directors draw attention to note 1 to the consolidated financial statements, which includes a statement of compliance with International Financial Reporting Standards. Signed in accordance with a resolution of the Directors: Malcolm Broomhead Chairman Sydney 21 August 2014
Directors’ report
Asciano Limited86
For
per
sona
l use
onl
y

ABCD
KPMG, an Australian partnership and a member firm of the KPMG network of independent member firms affiliated with KPMG International Cooperative Liability limited by a scheme approved under (“KPMG International”), a Swiss entity. Professional Standards Legislation
Lead Auditor’s Independence Declaration under Section 307C of the Corporations Act 2001
To: the directors of Asciano Limited
I declare that, to the best of my knowledge and belief, in relation to the audit for the financial year ended 30 June 2014 there have been:
(i) no contraventions of the auditor independence requirements as set out in the Corporations Act 2001 in relation to the audit; and
(ii) no contraventions of any applicable code of professional conduct in relation to the audit.
KPMG
Steven Gatt Partner
Sydney
21 August 2014
AuDITOr’S DECLArATION Of INDEpENDENCE
Directors’ report
Annual report 201487
For
per
sona
l use
onl
y

CONTENTS
Consolidated Statement of Profit or Loss 89
Consolidated Statement of Comprehensive Income 90
Consolidated Statement of Financial Position 91
Consolidated Statement of Changes in Equity 92
Consolidated Statement of Cash Flows 93
Notes to and forming part of the financial statements 94
1. Summary of significant accounting policies 94
2. Critical accounting estimates and judgements 106
3. Financial risk management 107
4. Segment reporting 120
5. Acquisition of subsidiary 122
6. Dividends 124
7. earnings per share 124
8. revenue and other income 125
9. Finance income and expense 125
10. expenses 126
11. taxes 128
12. Cash and cash equivalents 129
13. reconciliation of net operating cash flows 129
14. trade and other receivables 130
15. Prepayments 130
16. Inventories 130
17. Derivative financial assets 131
18. tax balances 131
19. equity accounted investments 134
20. Property, plant and equipment 135
21. Intangible assets 136
22. trade and other payables 138
23. Loans and borrowings 138
24. Derivative financial liabilities 140
25. Provisions and employee benefits 140
26. Contributed equity 142
27. reserves 143
28. Accumulated losses 144
29. Superannuation 144
30. operating and finance leases 148
31. Capital and other commitments 148
32. Contingencies 149
33. related parties 149
34. Share-based payments 151
35. events subsequent to the reporting date 154
36. Auditor’s remuneration 155
37. Deed of cross guarantee 155
38. Parent 159
Directors’ declaration 160
Independent auditor’s report to the members of Asciano Limited 161
Asciano Limited88
For
per
sona
l use
onl
y

4 7 A S C I A N O L I M I T E D F I N A N C I A L R E P O R T F O R T H E Y E A R E N D E D 3 0 J U N E 2 0 1 4
Consolidated Statement of Profit or Loss For the year ended 30 June 2014
Note 2014
$M
RESTATED1 2013
$M
Revenue from services rendered 8 3,926.1 3,688.2
Other income 8 68.5 56.6
Share of net profit of joint ventures 19 14.9 17.3
Operating expenses excluding depreciation and amortisation 10 (3,018.1) (2,784.4) Profit before depreciation, amortisation, net finance costs and tax 991.4 977.7
Depreciation 10 (360.8) (265.9)
Amortisation 10 (46.6) (44.8) Profit before net finance costs and tax 584.0 667.0
Finance income 9 2.4 17.5
Finance expense 9 (227.7) (217.2) Profit before tax 358.7 467.3
Tax expense 11 (101.7) (130.5) Profit after tax 257.0 336.8
Attributable to:
Owners of Asciano Limited 28 254.4 334.4
Non-controlling interests 2.6 2.4
257.0 336.8
Earnings per Parent share
Basic – cents 7 26.1 34.3
Diluted – cents 7 26.1 34.2 1. The restatement relates to the adoption of the amended accounting standard AASB 119 Employee Benefits (2011), as outlined in note 1(f).
The above Consolidated Statement of Profit or Loss should be read in conjunction with the accompanying notes.
CONSOLIDATED STATEMENT Of prOfIT Or LOSSFor the year ended 30 June 2014
financial report
fINANCIAL rEpOrT
Annual report 201489
For
per
sona
l use
onl
y

4 8 A S C I A N O L I M I T E D F I N A N C I A L R E P O R T F O R T H E Y E A R E N D E D 3 0 J U N E 2 0 1 4
Consolidated Statement of Comprehensive Income For the year ended 30 June 2014
Note 2014
$M
RESTATED1 2013
$M
Profit after tax 257.0 336.8
Other comprehensive (loss)/income
Items that will not be reclassified to profit or loss:
Defined benefit superannuation funds actuarial (losses)/gains 29 (6.3) 6.0
Income tax on items that will not be reclassified to profit or loss 1.9 (2.0)
Total items that will not be reclassified to profit or loss net of tax (4.4) 4.0
Items that may be reclassified subsequently to profit or loss:
Effective portion of changes in fair value of cash flow hedge (72.9) 46.1
Net loss on change in fair value of cash flow hedge reclassified to profit or loss – (1.1) Foreign currency translation differences for foreign operations 0.6 2.1
Income tax benefit/(expense) on items that may be reclassified subsequently to profit or loss 22.5 (13.3) Total items that may be reclassified subsequently to profit or loss net of tax (49.8) 33.8
Other comprehensive (loss)/income net of tax (54.2) 37.8
Total comprehensive income 202.8 374.6
Total comprehensive income attributable to:
Owners of Asciano Limited 200.2 372.2
Non-controlling interests 2.6 2.4
202.8 374.6 1. The restatement relates to the adoption of the amended accounting standard AASB 119 Employee Benefits (2011), as outlined in note 1(f).
The above Consolidated Statement of Comprehensive Income should be read in conjunction with the accompanying notes.
CONSOLIDATED STATEMENT Of COMprEhENSIvE INCOMEFor the year ended 30 June 2014
financial report
Asciano Limited90
For
per
sona
l use
onl
y

4 9 A S C I A N O L I M I T E D F I N A N C I A L R E P O R T F O R T H E Y E A R E N D E D 3 0 J U N E 2 0 1 4
Consolidated Statement of Financial Position As at 30 June 2014
Note 2014
$M
RESTATED1 2013
$M
Current assets Cash and cash equivalents 12 167.3 29.7 Trade and other receivables 14 429.2 392.4 Prepayments 15 25.7 30.9 Inventories 16 33.3 29.3 Derivative financial assets 17 4.1 12.5
Total current assets 659.6 494.8
Non-current assets Trade and other receivables 14 58.1 55.4 Prepayments 15 2.2 4.3 Inventories 16 31.6 40.5 Derivative financial assets 17 165.9 231.0 Net deferred tax assets 18 109.2 72.0 Equity accounted investments 19 30.9 28.4 Property, plant and equipment 20 4,306.7 3,926.4 Intangible assets 21 2,810.3 2,793.8 Other assets 1.7 1.9
Total non-current assets 7,516.6 7,153.7
Total assets 8,176.2 7,648.5
Current liabilities Trade and other payables 22 464.4 393.6 Loans and borrowings 23 0.6 0.6 Derivative financial liabilities 24 61.4 29.1 Current tax liabilities 18 10.4 52.1 Provisions and employee benefits 25 276.2 235.8
Total current liabilities 813.0 711.2
Non-current liabilities Trade and other payables 22 136.1 132.3 Loans and borrowings 23 3,370.0 3,070.3 Derivative financial liabilities 24 57.8 19.3 Provisions and employee benefits 25 83.1 93.1
Total non-current liabilities 3,647.0 3,315.0
Total liabilities 4,460.0 4,026.2
Net assets 3,716.2 3,622.3
Equity Contributed equity 26 8,609.3 8,606.1 Reserves 27 (4,721.2) (4,703.5) Accumulated losses 28 (189.3) (295.1)
Equity attributable to owners of Asciano Limited 3,698.8 3,607.5 Non-controlling interests 17.4 14.8
Total equity 3,716.2 3,622.3 1. The restatement relates to the adoption of the amended accounting standard AASB 119 Employee Benefits (2011), as outlined in note 1(f).
The above Consolidated Statement of Financial Position should be read in conjunction with the accompanying notes.
CONSOLIDATED STATEMENT Of fINANCIAL pOSITIONAs at 30 June 2014
financial report
Annual report 201491
For
per
sona
l use
onl
y

5 0 A S C I A N O L I M I T E D F I N A N C I A L R E P O R T F O R T H E Y E A R E N D E D 3 0 J U N E 2 0 1 4
Consolidated Statement of Changes in Equity For the year ended 30 June 2014
2014 $M
Contributed equity Reserves
Retained earnings Total
Non- controlling
interests Total
Restated balance at 1 July 20131 8,606.1 (4,703.5) (295.1) 3,607.5 14.8 3,622.3
Profit after tax – – 254.4 254.4 2.6 257.0
Other comprehensive income (“OCI”):
Net movement in cash flow hedge reserve – (72.9) – (72.9) – (72.9)
Defined benefit superannuation funds actuarial losses – – (6.3) (6.3) – (6.3)
Foreign currency translation differences for foreign operations – 0.6 – 0.6 – 0.6 Income tax benefit on OCI – 22.5 1.9 24.4 – 24.4
Total comprehensive income – (49.8) 250.0 200.2 2.6 202.8
Treasury shares allocated 7.9 – – 7.9 – 7.9
Treasury shares acquired (4.7) – – (4.7) – (4.7)
Transactions with owners in their capacity as owners:
Profits transferred to profit reserve – 144.2 (144.2) – – –
Dividends paid – (117.0) – (117.0) – (117.0)
Employee equity benefits – 4.9 – 4.9 – 4.9
– 32.1 (144.2) (112.1) – (112.1)
Balance at 30 June 2014 8,609.3 (4,721.2) (189.3) 3,698.8 17.4 3,716.2
Balance at 30 June 2013
- (-) (-) - - -
2013 $M
Restated balance at 1 July 20121 8,604.7 (4, 894.9) (388.4) 3,321.4 12.4 3,333.8
Profit after tax – – 334.4 334.4 2.4 336.8
Other comprehensive income:
Net movement in cash flow hedge reserve – 45.0 – 45.0 – 45.0
Defined benefit superannuation funds actuarial gains – – 6.0 6.0 – 6.0
Foreign currency translation differences for foreign operations – 2.1 – 2.1 – 2.1
Income tax benefit on OCI – (13.3) (2.0) (15.3) – (15.3)
Total comprehensive income – 33.8 338.4 372.2 2.4 374.6
Treasury shares allocated 1.4 – – 1.4 – 1.4
Transactions with owners in their capacity as owners:
Profits transferred to profit reserve – 244.9 (244.9) – – –
Dividends paid – (90.2) (0.2) (90.4) – (90.4)
Employee equity benefits – 2.9 – 2.9 – 2.9
– 157.6 (245.1) (87.5) – (87.5)
Restated balance at 30 June 20131 8,606.1 (4,703.5) (295.1) 3,607.5 14.8 3,622.3
1. The restatement relates to the adoption of the amended accounting standard AASB 119 Employee Benefits (2011), as outlined in note 1(f).
The above Consolidated Statement of Changes in Equity should be read in conjunction with the accompanying notes.
CONSOLIDATED STATEMENT Of ChANgES IN EquITyFor the year ended 30 June 2014
financial report
Asciano Limited92
For
per
sona
l use
onl
y

5 1 A S C I A N O L I M I T E D F I N A N C I A L R E P O R T F O R T H E Y E A R E N D E D 3 0 J U N E 2 0 1 4
Consolidated Statement of Cash Flows For the year ended 30 June 2014
Note 2014
$M 2013
$M
Operating cash flows
Receipts from customers 4,435.3 4,215.9
Payments to suppliers and employees (3,485.7) (3,246.7)
Interest and other costs of finance paid (200.4) (224.8)
Interest received 2.4 4.9
Dividends received from joint ventures 12.2 18.6
Net income tax payments (157.0) (170.4)
Net operating cash inflows 13 606.8 597.5
Investing cash flows
Payments for property, plant and equipment and intangible assets (701.2) (613.2)
Proceeds from sale of property, plant and equipment and intangible assets 81.5 27.2
Acquisition of subsidiaries, net of cash acquired 5 (84.8) (39.0)
Repayment of subsidiary loan – (13.1)
Proceeds on disposal of associate investment – 1.1
Repayment of loans by joint ventures 0.5 –
Net investing cash outflows (704.0) (637.0)
Financing cash flows
Treasury shares acquired 26 (4.7) –
Proceeds from exercise of share options 5.2 0.2
Proceeds from GBP bond issuance, net of transaction costs 511.8 –
Payment of finance lease liabilities (0.5) –
Repayments of borrowings (715.0) (160.0)
Drawdown of borrowings 555.0 170.0
Dividends paid 6 (117.0) (90.4)
Net financing cash inflows/(outflows) 234.8 (80.2)
Net increase/(decrease) in cash and cash equivalents 137.6 (119.7)
Cash and cash equivalents at the beginning of the year 29.7 149.4
Cash and cash equivalents at the end of the year 12 167.3 29.7
The above Consolidated Statement of Cash Flows should be read in conjunction with the accompanying notes.
CONSOLIDATED STATEMENT Of CASh fLOwSFor the year ended 30 June 2014
financial report
Annual report 201493
For
per
sona
l use
onl
y

5 2 A S C I A N O L I M I T E D F I N A N C I A L R E P O R T F O R T H E Y E A R E N D E D 3 0 J U N E 2 0 1 4
1. Summary of significant accounting policies Reporting entity The consolidated financial statements comprise the financial statements of the consolidated entity (“Asciano”) consisting of Asciano Limited (“Parent”) and its controlled entities (together “the Group”). Asciano Limited is a company domiciled in Australia. Asciano Limited is primarily involved in the ownership and management of port and rail assets and associated operations and services. The consolidated financial statements were authorised for issue by the Board of Directors on 21 August 2014. The significant accounting policies that have been adopted in the preparation of these consolidated financial statements are set out below.
Basis of preparation This general purpose financial report has been prepared in accordance with Australian Accounting Standards, including the Australian Accounting Interpretations adopted by the Australian Accounting Standards Board (“AASB”), and the Corporations Act 2001. The consolidated financial statements of Asciano comply with the International Financial Reporting Standards (“IFRS”) and the interpretations adopted by the International Accounting Standards Board (“IASB”). Asciano Limited is a for-profit entity for the purpose of preparing the financial statements.
Going concern Asciano has a net current asset deficiency at 30 June 2014 of $153.4 million. Given that Asciano has an unutilised syndicated revolving credit facility of $650 million maturing in October 2019, the Directors believe Asciano has the capacity to pay its debts in full as and when they fall due.
Change in accounting policy The Group has adopted the following new standards and amendments to standards, including any consequential amendments to other standards, with a date of initial application of 1 July 2013. (a) Disclosures – Offsetting Financial Assets and Financial Liabilities (b) AASB 10 Consolidated Financial Statements (2011) (c) AASB 11 Joint Arrangements (d) AASB 12 Disclosure of Interests in Other Entities (e) AASB 13 Fair Value Measurement (f) AASB 119 Employee Benefits (2011) (g) Recoverable Amount Disclosures for Non-Financial Assets (Amendments to AASB 136) (2013) The nature and the effect of the changes are further explained below.
(a) Offsetting of financial assets and financial liabilities As a result of adopting the amendments to AASB 7, Asciano has expanded its disclosures about the offsetting of financial assets and liabilities (refer to note 3(g)).
(b) Subsidiaries As a result of adopting AASB 10 (2011), the Group has changed its accounting policy for determining whether it has control over and consequently whether it consolidates its investees. AASB 10 (2011) introduces a new control model that is applicable to all investees, by focusing on whether the Group has power over an investee, exposure or rights to variable returns from its involvement with the investee and ability to use its power to affect those returns. In particular, AASB 10 (2011) requires the Group to consolidate investees that it controls on the basis of de facto circumstances. In accordance with the transitional provisions of AASB 10 (2011), the Group reassessed the control conclusion for its investees at 1 July 2013 and this has not resulted in any changes to the control conclusion for existing investees.
(c) Joint arrangements As a result of adopting AASB 11, the Group has changed its accounting policy for its interests in joint arrangements. Under AASB 11, the Group classifies its interests in joint arrangements as either joint operations or joint ventures depending on the Group’s rights to the assets and obligations for the liabilities of the arrangements. When making this assessment, the Group considers the structure of the arrangements, the legal form of any separate vehicles, the contractual terms of the arrangements and other facts and circumstances. Previously, the structure of the arrangement was the sole focus of classification. The Group has re-evaluated its joint arrangements. Notwithstanding the above, the new accounting standard has not resulted in any changes to the accounting treatment of existing joint arrangements.
NOTES TO AND fOrMINg pArT Of ThE fINANCIAL STATEMENTSFor the year ended 30 June 2014
financial report
Asciano Limited94
For
per
sona
l use
onl
y

5 3 A S C I A N O L I M I T E D F I N A N C I A L R E P O R T F O R T H E Y E A R E N D E D 3 0 J U N E 2 0 1 4
1. Summary of significant accounting policies (continued)
(d) Disclosure of interests in other entities As a result of adopting AASB 12, Asciano has materially complied with its disclosures about its interests in equity accounted investments (refer to note 19).
(e) Fair value measurement AASB 13 establishes a single framework for measuring fair value and making disclosures about fair value measurements, when such measurements are required or permitted by other AASBs. In particular, it unifies the definition of fair value as the price at which an orderly transaction to sell an asset or to transfer a liability would take place between market participants at the measurement date. It also replaces and expands the disclosure requirements about fair value measurements in other AASBs, including AASB 7 Financial Instruments: Disclosures. The Group has included additional disclosures in this regard (refer to note 3(b)). In accordance with the transitional provisions of AASB 13, the Group has applied the new fair value measurement guidance prospectively, and has not provided any comparative information for new disclosures. Notwithstanding the above, the change has resulted in an additional $8.0 million finance expense (before tax) for the year ended 30 June 2014, which arose from application of the new fair measurement guidance to the Group’s derivative financial assets and liabilities.
(f) Defined benefit plans As a result of adopting AASB 119 (2011), the Group has changed its accounting policy with respect to the basis for determining the income or expense related to defined benefit plans. Under the new standard and effective from 1 July 2013, the Group determines the net interest expense (income) for the period on the net defined benefit liability (asset) by applying the same discount rate used to measure the defined benefit obligation at the beginning of the annual period to the then net defined benefit liability (asset) after taking into account contributions and benefit payments during the period. Consequently, the net interest recognised in the statement of profit or loss now comprises:
interest cost on the defined benefit obligation at the start of the period; and
interest income on plan assets during the period. The difference between the actual return on plan assets for the year and the interest income on plan assets is recognised as part of remeasurements within other comprehensive income. Previously, the Group determined interest income on plan assets based on their long-term rate of expected return. The following table summarises the adjustments made to the statement of financial position on implementation of the new accounting standard:
Deferred tax asset
$M
Trade and other payables (non-current)
$M
Accumulated
losses $M
Balance at 30 June 2012 97.5 126.0 (374.8)
Impact of the changes in accounting policy 5.8 19.4 (13.6)
Restated balance at 30 June 2012 103.3 145.4 (388.4)
Balance at 30 June 2013 66.6 114.4 (282.6)
Impact of the changes in accounting policy 5.4 17.9 (12.5)
Restated balance at 30 June 2013 72.0 132.3 (295.1)
financial report
Annual report 201495
For
per
sona
l use
onl
y

notes to and forming part of the financial statements Continued
5 4 A S C I A N O L I M I T E D F I N A N C I A L R E P O R T F O R T H E Y E A R E N D E D 3 0 J U N E 2 0 1 4
1. Summary of significant accounting policies (continued)
The effect on the statement of profit or loss is as follows:
2014
$M 2013
$M
Increase in employee benefits expense (8.8) (7.9)
Decrease in tax expense 2.6 2.3
Decrease in profit (6.2) (5.6)
The effect on the statement of other comprehensive income is as follows:
Decrease in defined superannuation funds actuarial losses 8.8 9.5
Decrease in income tax benefit on other comprehensive income (2.6) (2.9)
Increase in other comprehensive income 6.2 6.6
The change in accounting policy also resulted in a reduction of the prior year basic earnings per share from 34.9 cents to 34.3 cents and a reduction in the diluted earnings per share from 34.8 cents to 34.2 cents for the comparative period.
(g) Disclosures of recoverable amount for non-financial assets As a result of the early adoption of AASB 2013-3 the requirement to disclose the recoverable amount of all cash-generating units that contain goodwill or identifiable assets with indefinite lives, regardless of impairments, has been removed. Additional requirements as a result of AASB 2013-3 are not applicable as Asciano uses the value in use valuation method.
Historical cost convention These consolidated financial statements have been prepared under the historical cost basis except for the following material items: derivative financial assets and liabilities are measured at fair value; and
a liability or asset in respect of defined benefit superannuation funds is measured as the present value of the defined benefit obligation less the fair value of the superannuation fund’s assets and any unrecognised past service cost.
Functional and presentation currency These consolidated financial statements are presented in Australian dollars, which is the Parent’s functional currency.
Rounding of amounts Asciano is of a kind referred to in Class Order 98/100, issued by the Australian Securities and Investments Commission, relating to the rounding off of amounts in the financial report. Amounts in the financial report have been rounded off in accordance with that class order to the nearest one hundred thousand dollars, or in certain cases, to the nearest one thousand dollars.
Principles of consolidation Non-controlling interests Other non-controlling interests are interests in partly owned subsidiaries, which are not held either directly or indirectly by Asciano Limited.
Business combinations involving entities under common control The opening Statement of Financial Position of Asciano, as at its formation on 15 June 2007, reflected the then book values for assets and liabilities acquired from Toll’s consolidated accounting records. As a common control transaction, the demerger did not reflect the fair value of assets and liabilities acquired or any recording of additional goodwill at the time of the formation of Asciano. The difference between the fair value of the consideration given and the carrying value of the assets and liabilities acquired was recognised as a common control reserve.
financial report
Asciano Limited96
For
per
sona
l use
onl
y

5 5 A S C I A N O L I M I T E D F I N A N C I A L R E P O R T F O R T H E Y E A R E N D E D 3 0 J U N E 2 0 1 4
1. Summary of significant accounting policies (continued)
Subsidiaries Subsidiaries are those entities over which Asciano has the power, directly or indirectly, to govern the financial and operating policies generally accompanied by an equity holding of more than half the voting rights. In assessing control, potential voting rights that presently are exercisable or convertible are taken into account. The financial statements of subsidiaries are included in the consolidated financial statements from the date that control of the subsidiary commences until the date that control ceases. Inter-entity transactions, balances and unrealised gains on transactions between group entities are eliminated.
Equity accounted investees A joint venture is an arrangement in which Asciano has joint control whereby the Group has rights to the net assets of the arrangement, rather than rights to its assets and obligations for its liabilities. The financial statements include Asciano’s share of the total recognised gains and losses on an equity accounted basis subsequent to initial recognition at cost, which includes transaction costs. When Asciano’s share of losses exceeds its interest in a joint venture, Asciano’s carrying amount is reduced to $nil and recognition of further losses is discontinued except to the extent that Asciano has incurred legal or constructive obligations or made payments on behalf of a joint venture. Unrealised gains on transactions between Asciano and its joint ventures are eliminated to the extent of Asciano’s interest in the joint ventures. Unrealised losses are also eliminated unless the transaction provides evidence of an impairment of the asset transferred. Accounting policies of joint ventures have been changed where necessary to ensure consistency with the policies adopted by Asciano.
Segment reporting A segment is a distinguishable component of Asciano that participates in business activities from which it may earn revenues and incur expenses. The operating results of the segments are regularly reviewed by the entity’s chief operating decision-maker enabling decisions about the allocation of resources to the segments and assess their performance. Segment information is comprised of reporting segments delineated according to services. Parts of the business are aggregated into segments where they have similar economic characteristics or are similar in regard to the nature of the services, type or class of customer or methods used to provide the services. The segments are not delineated on a geographical basis as all segments operate Australia-wide. Asciano comprises the following four segments:
PN Coal – consists of the haulage of export coal in bulk quantities from mine to port by rail, and domestic coal from mine to power stations and steelworks in New South Wales, Queensland and South Australia;
PN Rail – consists of interstate containerised and bulk rail freight and intermodal terminal services, operating approximately 180 services per week between all mainland state capital cities, and provides non-coal bulk rail services to the Australian grain and industrial sectors;
Terminals & Logistics – consists of container stevedoring and associated import/export container supply chain logistics services from ship to destination and origin to ship. This division holds long-term lease concessions at container terminals in Brisbane, Sydney, Melbourne and Perth (Fremantle).
Bulk & Automotive Port Services – consists of automotive stevedoring, vehicle processing, transport and storage, bulk and general stevedoring services, port related services and infrastructure management for bulk and general cargo.
Inter-segment pricing is determined on an arm’s length basis. Segment results, assets and liabilities include items directly attributable to a segment, as well as those that can be allocated on a reasonable basis. Unallocated items comprise mainly investments and related revenue, loans and borrowings and related expenses, corporate assets and head office expenses, and income tax assets and liabilities. Segment capital expenditure is the total cost incurred during the period to acquire property, plant and equipment, and intangible assets other than goodwill.
financial report
Annual report 201497
For
per
sona
l use
onl
y

notes to and forming part of the financial statements Continued
5 6 A S C I A N O L I M I T E D F I N A N C I A L R E P O R T F O R T H E Y E A R E N D E D 3 0 J U N E 2 0 1 4
1. Summary of significant accounting policies (continued)
Foreign currency transactions Transactions in foreign currencies are translated into the entity's functional currency at the exchange rate at the dates of the transactions. Monetary assets and liabilities denominated in foreign currencies at the reporting date are retranslated into the respective entity’s functional currency at the exchange rate at that date. Foreign exchange differences arising on translation are recognised in the statement of profit or loss or the statement of comprehensive income where appropriate.
Foreign operations The assets and liabilities of foreign operations, including goodwill and fair value adjustments arising on acquisition are translated to the functional currency at exchange rates applicable at the reporting date. The income and expenses of foreign operations are translated to Australian dollars at exchange rates at the dates of transactions. Foreign currency differences are recognised in other comprehensive income, and presented in the foreign currency translation reserve in equity.
Revenue Revenue is measured at the fair value of the consideration received or receivable net of GST. Revenue is recognised following the provision of the service and/or in accordance with agreed contractual terms in the period in which the service is provided. Amounts disclosed as revenue are net of rebates and amounts collected on behalf of third parties.
Expenses Operating lease payments Payments made under operating leases are recognised in the profit or loss on a straight line basis over the term of the lease. Lease incentives received are recognised in the profit or loss as an integral part of the total lease expense and spread over the lease term.
Finance lease payments Minimum lease payments are apportioned between the finance expense and the reduction of the outstanding liability. The finance expense is allocated to each period during the lease term so as to produce a constant periodic rate of interest on the remaining balance of the liability.
Borrowing costs Borrowing costs are expensed as incurred unless they relate to qualifying assets. Qualifying assets are assets that take more than 12 months to commission. In these circumstances, borrowing costs are capitalised to the cost of the assets. Capitalisation is based on the period of time that is required to complete and prepare the asset for its intended use.
Finance income and expense Dividends and distributions are recognised when Asciano’s right to receive payment is established. Finance income comprises interest income on funds invested, dividend income and gains on hedging instruments that are recognised in profit or loss. Interest income is recognised as it accrues, using the effective interest method. Finance expense comprises interest expense on loans and borrowings, unwinding of the discount on provisions, losses on hedging instruments that are recognised in profit or loss and impairment losses recognised on financial assets, other than trade receivables. All borrowing costs are recognised in profit or loss using the effective interest method, except for borrowing costs on capitalised qualifying assets that are deferred and amortised over the life of the underlying facilities.
Material items Material items comprise items of income or expense which are considered to be relevant to explaining the performance of Asciano and are, either individually or in aggregate, material to Asciano. Such items are likely to include, but are not restricted to, gains or losses on the sale or termination of operations, the cost of significant Asciano-wide reorganisations or restructurings, accelerated depreciation charges to tangible assets and write-off of deferred establishment costs. This information assists the users of Asciano’s financial statements in their understanding of the underlying business results.
financial report
Asciano Limited98
For
per
sona
l use
onl
y

5 7 A S C I A N O L I M I T E D F I N A N C I A L R E P O R T F O R T H E Y E A R E N D E D 3 0 J U N E 2 0 1 4
1. Summary of significant accounting policies (continued)
Taxes Tax expense comprises current and deferred tax. Tax expense is recognised in the statement of profit or loss except to the extent that it relates to items recognised directly within the statement of comprehensive income or equity, in which case it is recognised in other comprehensive income as appropriate. Current tax is the expected tax payable on the taxable income for the year using tax rates for each jurisdiction, enacted or substantially enacted at the reporting date, and any adjustment to tax payable in respect of previous years. Deferred tax is recognised in respect of temporary differences between the carrying amounts of assets and liabilities for financial reporting purposes and the amounts used for taxation purposes. Deferred tax is not recognised for:
the initial recognition of goodwill;
the initial recognition of assets or liabilities in a transaction that is not a business combination and affects neither accounting nor taxable profit or loss; and
differences relating to investments in subsidiaries and joint ventures to the extent that they will probably not reverse in the foreseeable future.
Deferred tax is measured at the tax rates that are expected to be applied to the temporary differences when they reverse, using tax rates enacted or substantively enacted at the reporting date. A deferred tax asset is recognised to the extent that it is probable that future taxable profits will be available against which the asset can be utilised. Deferred tax assets are reviewed at each reporting date and are reduced to the extent that it is no longer probable that the related tax benefit will be realised. Deferred tax assets and liabilities are offset when there is a legally enforceable right to offset current tax assets and liabilities and they relate to taxes levied by the same tax authority on the same taxable entity, or on different tax entities, but they intend to settle current tax liabilities and assets on a net basis, or their tax assets and liabilities will be realised simultaneously. Additional income tax that arises from the distribution of dividends is recognised at the same time as the liability to pay the related dividend.
Tax consolidation Asciano Limited and its wholly owned Australian resident entities are part of a tax consolidated group and are therefore taxed as a single entity. The head entity within the tax consolidated group is Asciano Limited. The head entity, in conjunction with other members of the tax consolidated group, has entered into a tax sharing agreement. The tax sharing agreement provides for the determination of the allocation of income tax liabilities between the entities should the head entity default on its tax obligations. Current tax expense/income, deferred tax liabilities and deferred tax assets arising from temporary differences of the members of the tax consolidated group are recognised in the separate financial statements of the members of the tax consolidated group using the “group allocation method” by reference to the carrying amounts in the separate financial statements of each entity and the tax values applying under tax consolidation. Assets or liabilities arising under tax funding arrangements with the tax consolidated entities are recognised as amounts receivable from or payable to other entities in the Group, and are due and payable as requested by the head entity.
Impairment Goodwill and intangible assets that have indefinite lives or that are not yet available for use are tested annually for impairment or more frequently if events or changes in circumstances indicate that they might be impaired. Other assets are reviewed for impairment whenever events or changes in circumstances indicate that the carrying amount may not be recoverable. An impairment loss is recognised if the carrying amount of an asset or its cash-generating unit (“CGU”) exceeds its recoverable amount. A CGU is the smallest identifiable asset group that generates cash flows that largely are independent from those of other assets and groups. Subject to an operating segment ceiling test, for the purpose of goodwill impairment testing, CGUs to which goodwill has been allocated are aggregated so that the level at which impairment testing is performed reflects the lowest level at which goodwill is monitored for internal reporting purposes. Impairment losses are recognised in the profit or loss. Impairment losses recognised in respect of an impaired CGU are allocated first to reduce the carrying amount of any goodwill allocated to the impaired CGU and then to reduce the carrying amount of the other assets on a pro-rata basis. The Group’s corporate assets do not generate separate cash inflows and are utilised by more than one CGU. Corporate assets are allocated to CGUs on a reasonable and consistent basis and tested for impairment as part of the testing of the CGU to which the corporate asset is allocated.
financial report
Annual report 201499
For
per
sona
l use
onl
y

notes to and forming part of the financial statements Continued
5 8 A S C I A N O L I M I T E D F I N A N C I A L R E P O R T F O R T H E Y E A R E N D E D 3 0 J U N E 2 0 1 4
1. Summary of significant accounting policies (continued)
The recoverable amount of an asset or CGU is the greater of its value in use, and its fair value less costs to sell. In assessing value in use, the estimated future cash flows are discounted to their present value using a pre-tax discount rate that reflects current market assessments of the time value of money and the risks specific to the asset or CGU. An impairment loss in respect of goodwill is not reversed. In respect of other non-financial assets, impairment losses recognised in prior periods are assessed at each reporting date for any indications that the loss has decreased or no longer exists. An impairment loss is reversed if there has been a change in the estimates used to determine the recoverable amount. An impairment loss is reversed only to the extent that the asset’s carrying amount does not exceed the carrying amount that would have been determined, net of depreciation or amortisation, if no impairment loss had been recognised. Individually significant financial assets are tested for impairment on an individual basis.
Leased assets Leases under which Asciano assumes substantially all the risks and rewards of ownership are classified as finance leases. On initial recognition, the leased asset is measured at an amount equal to the lower of its fair value and the present value of the minimum lease payments. Subsequent to initial recognition, the asset is accounted for in accordance with the accounting policy applicable to that asset. The corresponding liability is also established with lease payments allocated between the lease liability and finance cost. The finance cost is charged to the profit or loss over the lease period so as to produce a constant periodic rate of interest on the remaining balance of the liability for each period. The property, plant and equipment acquired under finance leases are depreciated over the shorter of the asset’s useful life and the lease term. Other leases are operating leases and the leased assets are not recognised on the statement of financial position.
Cash and cash equivalents Cash and cash equivalents comprise cash balances, short-term bills and term deposits. Bank overdrafts that are repayable on demand and form an integral part of Asciano’s cash management are included as a component of cash and cash equivalents for the purpose of the Statement of Cash Flows. Bank overdrafts are shown within loans and borrowings in current liabilities on the statement of financial position.
Trade and other receivables Trade and other receivables are stated at their amortised cost using the effective interest method, less impairment losses. Trade receivables are generally due for settlement after 30 days. Collectability of trade receivables is reviewed on an ongoing basis. Debts that are known to be uncollectable are written off. An allowance for impairment of trade receivables is established when there is objective evidence that Asciano will not be able to collect all amounts due according to the original terms of receivables. Significant financial difficulties of the debtor, probability that the debtor will enter bankruptcy or financial reorganisation, and default or delinquency in payments (more than 180 days overdue) are considered indicators that the trade receivable is impaired. Cash flows relating to short-term receivables are not discounted.
Inventories Inventories consist predominantly of spare parts and consumables used in maintenance activities and are stated at the lower of cost and net realisable value. Cost of inventories includes all costs of purchases and other expenses incurred in bringing the inventories to their present location and condition. Costs are assigned to individual items of inventory on the basis of either weighted average cost or a first in, first out basis unless specific identification is possible. Non-current inventories represent long lived spare parts also known as capital spares. This class of inventory represents major spare parts that can be cyclically overhauled and reused, and as such, are depreciated over the lower of their expected useful life and the expected useful life of the equipment they are used in. Specific obsolete items of inventory are written off.
Investments and other financial assets Loans and receivables are non-derivative financial assets with fixed or determinable payments that are not quoted in an active market. They arise when Asciano provides cash or services directly to a debtor with no intention of selling the receivable. They are included in current assets, except for those with maturities greater than 12 months after the end of period date, which are classified as non-current assets.
financial report
Asciano Limited100
For
per
sona
l use
onl
y

5 9 A S C I A N O L I M I T E D F I N A N C I A L R E P O R T F O R T H E Y E A R E N D E D 3 0 J U N E 2 0 1 4
1. Summary of significant accounting policies (continued)
Derivative financial instruments Asciano enters into derivative financial instruments from time to time to hedge its interest rate and foreign currency risk exposures. At the inception of the hedging transaction, Asciano documents the type of hedge, the hedged item or transaction, the hedging instrument, the nature of the risk being hedged, the relationship between the hedging instrument and hedged item, as well as its risk management objective and strategy for undertaking the relevant hedge transaction. Asciano’s hedge documentation also demonstrates, both at hedge inception and on an ongoing basis that the hedge has been and is expected to continue to be highly effective. Derivatives are recognised initially at fair value. Subsequent to initial recognition, derivatives are measured at fair value, and changes therein are accounted for as described below:
Derivatives that qualify for hedge accounting Fair value hedges For a derivative or financial instrument designated as hedging the change in fair value of a recognised asset or liability, the gain or loss on the derivative or financial instrument is recognised in the profit or loss immediately, together with the loss or gain on the hedged asset or liability that is attributable to the hedge risk.
Cash flow hedges Changes in the fair value of derivatives designated as cash flow hedges are recognised directly in other comprehensive income to the extent that the hedge is highly effective. To the extent that the hedge is not highly effective, changes in fair value are recognised immediately in the profit or loss within finance income or expense. If the derivative no longer meets the criteria for hedge accounting, expires or is sold, terminated or exercised or the designation is revoked, then hedge accounting is discontinued prospectively. The cumulative gain or loss previously recognised in equity remains there until the underlying forecast transaction occurs. When the hedged item is a non-financial asset, the amount recognised in equity is transferred to the carrying amount of the asset when it is recognised. In other cases, the amount recognised in equity is transferred to the profit or loss in the same period that the hedged item affects the profit or loss.
Derivatives that do not qualify for hedge accounting Changes in the fair value of any derivative instruments that do not qualify for hedge accounting are recognised immediately in the profit or loss.
Fair value estimation The fair value of financial assets and liabilities must be estimated for recognition and measurement or for disclosure purposes. The fair value of financial instruments traded in active markets (such as publicly traded derivatives and shares) is based on quoted market prices at the reporting date. The fair value of financial instruments that are not traded in an active market is determined using valuation techniques. Asciano uses a variety of methods and makes assumptions that are based on market conditions existing at each reporting date. The fair value of interest rate swaps and cross-currency interest rate swaps is calculated as the present value of the estimated future cash flows. The fair value of forward exchange contracts is determined using spot foreign exchange market rates and market forward curves for each currency pair at the end of period date. The nominal value less estimated credit adjustments of short-term receivables and payables are assumed to approximate their fair values. The fair value of non-derivative financial liabilities for disclosure purposes is estimated by discounting the future contractual cash flows at the current market interest rate that is available to Asciano for similar instruments. The fair value of the Asciano employee options and rights plan is measured using the Monte Carlo simulation methodology and Binomial tree methodology. Measurement inputs include the share price on the measurement date, the exercise price of the instrument, expected volatility, expected term of the instruments, expected dividends, and the risk-free interest rate (based on Commonwealth government bonds). Service and non-market performance conditions attached to the transactions are not taken into account in determining fair value.
financial report
Annual report 2014101
For
per
sona
l use
onl
y

notes to and forming part of the financial statements Continued
6 0 A S C I A N O L I M I T E D F I N A N C I A L R E P O R T F O R T H E Y E A R E N D E D 3 0 J U N E 2 0 1 4
1. Summary of significant accounting policies (continued)
Property, plant and equipment Recognition and measurement Items of property, plant and equipment are stated at cost less accumulated depreciation and any impairment losses. The cost of self-constructed assets includes the cost of materials, direct labour, other directly attributable costs, where applicable, the cost of dismantling and removing the items and restoring the sites on which they are located, and capitalised borrowing costs. Subsequent costs of replacing a component of an item of property, plant and equipment is recognised in the carrying amount of the item if it is probable that the future economic benefits embodied within the component will flow to Asciano, and its cost can be measured reliably. The carrying amount of the replaced part is derecognised. The costs of the day-to-day servicing of property, plant and equipment are recognised in profit or loss as incurred. Where parts of an item of property, plant and equipment have different useful lives, they are accounted for as separate components of property, plant and equipment. The gain or loss on disposal of assets is brought to account at the date an unconditional offer and acceptance of sale are determined. The gain or loss on disposal is calculated as the difference between the carrying amount of the asset at the time of disposal and the net proceeds on disposal, and is recognised in other income in the profit or loss.
Depreciation Items of property, plant and equipment, including buildings and leasehold property but excluding freehold land, are depreciated on a straight line basis over their estimated useful lives. Significant components of individual assets are assessed and if a component has a useful life that is different from the remainder of that asset, that component is depreciated separately. Leased assets are depreciated over the shorter of the lease term and their useful lives. Depreciation rates used for each class of asset in the current and comparative year are as follows: buildings – 20 to 40 years;
plant and equipment – 3 to 45 years; and
leasehold improvements – 5 to 40 years.
Depreciation methods and useful lives, as well as residual values, are reassessed annually.
Intangible assets Goodwill Goodwill represents the excess of the cost of an acquisition over the fair value of Asciano’s share of the net identifiable assets of the acquired subsidiary at the date of acquisition. Goodwill on acquisition of subsidiaries is included in intangible assets. Goodwill is stated at cost less any accumulated impairment losses. Goodwill is allocated to CGUs and is not amortised but is tested at least annually for impairment. In respect of joint ventures, the carrying amount of goodwill is included in the carrying amount of the investment in the joint venture. Gains and losses on the disposal of an entity include the carrying amount of goodwill relating to the entity sold. Negative goodwill arising on an acquisition is recognised directly in the profit or loss.
IT development and software Research costs are expensed as incurred. Costs incurred in developing products or systems and costs incurred in acquiring software and licences that will contribute to future period financial benefits through revenue generation and/or cost reduction are capitalised to software and systems. Costs capitalised include external direct costs of materials and services, and direct payroll and payroll related costs of employees’ time spent on the project. Amortisation is calculated on a straight line basis over periods generally ranging from three to 15 years. IT development costs include only those costs directly attributable to the development phase and are only recognised following completion of technical feasibility and where Asciano has an intention and ability to use the asset.
Customer contracts and relationships Customer contracts and relationships acquired as part of a business combination are recognised separately from goodwill. The customer contracts and relationships are carried at their fair value at the date of acquisition. Subsequent to acquisition, customer contracts and relationships are amortised over their estimated useful lives, which range from five to 10 years.
Brand names Brand names recognised by Asciano that have an indefinite useful life are not amortised. The useful life of brand names is reviewed each period to determine whether events and circumstances continue to support an indefinite useful life assessment for the asset, which is tested for impairment annually.
Other intangible assets Other intangible assets that are acquired by the Group and have finite useful lives are measured at cost less accumulated amortisation and any accumulated impairment losses.
financial report
Asciano Limited102
For
per
sona
l use
onl
y

6 1 A S C I A N O L I M I T E D F I N A N C I A L R E P O R T F O R T H E Y E A R E N D E D 3 0 J U N E 2 0 1 4
1. Summary of significant accounting policies (continued)
Trade and other payables Trade and other payables are stated at their amortised cost. Trade payables are non-interest bearing.
Interest bearing loans and borrowings Interest bearing loans and borrowings are recognised initially at fair value less attributable transaction costs. Subsequent to initial recognition, these financial liabilities are stated at amortised cost, with any difference between cost and redemption value being recognised in the profit or loss over the period of the loans and borrowings on an effective interest basis.
Provisions A provision is recognised if, as a result of a past event, Asciano has a present legal or constructive obligation that can be estimated reliably, and it is probable that an outflow of economic benefits will be required to settle the obligation. Provisions are determined by discounting the expected future cash flows at a pre-tax rate that reflects current market assessments of the time value of money and the risks specific to the liability. The unwinding of the discount is recognised as a finance cost.
Workers compensation self-insurance Where Asciano acts as a self-insurer for workers compensation claims under relevant federal, state and territory legislation, a provision is made for all individual workers compensation claims incurred and both reported and not reported claims up to $1.0 million. Independent actuarial valuations are used to estimate the provision required. Individual claims over $1.0 million are reinsured.
Restructuring A provision for restructuring is recognised when the business has approved a detailed and formal restructuring plan and the restructuring has either commenced or has been announced publicly and there is a valid expectation amongst those affected. A restructuring provision includes only the direct expenditures arising from the restructuring and does not include future operating costs.
Incident Where Asciano is involved in an incident, such as a train derailment, and it is probable that Asciano will be held liable for the consequential damage, a provision equal to the estimated cost of third party claims is set aside. The cost estimate is made by loss adjusters where material, but the final quantum of the potential claims can be significantly different to the estimate. Adjustments to the provision are booked to earnings in the period when any changes in estimates are made.
Travel passes Asciano’s net obligation in respect of travel passes is the amount of expected future benefits that employees/retirees have earned in return for their service in the current and prior periods as determined by a qualified actuary. The obligation for travel passes is based on the age of the passholder, length of service, expected exit date, and life expectancy. A significant portion of the liability is in relation to retirees who were never employees of Asciano, but the liability was assumed by Asciano as a result of a business combination in 2002, and therefore the provision is not treated as an employee benefit for reporting purposes.
Site restoration In accordance with the environment policy and applicable legal requirements, provision for site restoration costs in respect of contaminated land is recognised when the need for restoration is identified. The provision represents the best estimate of the present value of the expenditure required to settle the site restoration obligation at the reporting date, based on current legal requirements and technology. Future site restoration costs are reviewed annually and any change is reflected in the profit or loss.
Employee benefits Long-term service benefits Asciano’s net obligation in respect of long-term service benefits, other than superannuation, is the amount of future benefits that employees have earned in return for their service in the current and prior periods. That benefit is calculated using expected future increases in wage and salary rates including related on-costs and expected settlement dates, and is discounted using the rates attached to the Commonwealth Government bonds that have maturity dates approximating the terms of Asciano’s obligations. Long service leave is classified as current where the leave has vested, or will vest within the next 12 months, in accordance with the relevant state legislation under which the employee operates.
Defined contribution superannuation funds Obligations for contributions to defined contribution superannuation funds are recognised as an expense in the profit or loss as incurred.
financial report
Annual report 2014103
For
per
sona
l use
onl
y

notes to and forming part of the financial statements Continued
6 2 A S C I A N O L I M I T E D F I N A N C I A L R E P O R T F O R T H E Y E A R E N D E D 3 0 J U N E 2 0 1 4
1. Summary of significant accounting policies (continued)
Defined benefit superannuation funds Asciano’s net obligation in respect of defined benefit superannuation funds is calculated separately for each fund by estimating the amount of future benefit that employees have earned in return for their service in the current and prior periods. The benefit is discounted to determine its present value and the fair value of any fund assets and any unrecognised past service cost is deducted. The discount rate is the yield at the end of period date on Commonwealth Government bonds that have maturity dates approximating to the terms of Asciano’s obligations. The calculation is performed annually by a qualified actuary using the projected unit credit method. Consideration is given to expected future wage and salary levels, experience of employee departures, periods of service and taxes. When the benefits of a fund are improved, the portion of the increased benefit relating to past service by employees is recognised in the profit or loss on a straight line basis over the average period until the benefits become vested. To the extent that the benefits vest immediately, the expense is recognised immediately in the profit or loss. Actuarial gains and losses are recognised directly in other comprehensive income. Asciano determines the net interest expense (income) for the period on the net defined benefit liability (asset) by applying the same discount rate used to measure the defined benefit obligation at the beginning of the annual period to the then net defined benefit liability (asset) after taking into account contributions and benefit payments during the period. Consequently, the net interest recognised in the statement of profit or loss comprises:
interest cost on the defined benefit obligation at the start of the period; and
interest income on plan assets during the period. The difference between the actual return on plan assets for the year and the interest income on plan assets is recognised as part of remeasurements within other comprehensive income.
Share-based payment transactions The Asciano Limited Executive Incentive Plan allows executives and selected employees to acquire shares in the Company. The fair value of options or rights granted is recognised as an employee benefits expense with a corresponding increase in equity. The fair value is measured at grant date and spread over the period during which the employees become unconditionally entitled to the options or rights. The fair value of the options or rights granted is measured using the Monte Carlo and Binomial methods, taking into account the terms and conditions upon which the options or rights were granted. The amount recognised as an expense is adjusted to reflect the actual number of options or rights that vest except where forfeiture is only due to share prices not achieving the threshold for vesting.
Short-term employee benefits Liabilities for employee benefits for wages, salaries, annual leave and sick leave that are due within 12 months of the reporting date represent present obligations resulting from employees’ services provided at the reporting date. These balances are calculated at undiscounted amounts based on remuneration wage and salary rates that Asciano expects to pay as at the reporting date including related on-costs, such as workers compensation insurance and payroll tax. Non-accumulating non-monetary benefits (such as parking and mobile telephone expenses) are expensed based on the net marginal cost to Asciano as the benefits are taken by the employees.
Termination benefits Termination benefits are payable when employment is terminated before the normal retirement date, or when the employee accepts voluntary redundancy in exchange for these benefits. Asciano recognises termination benefits when it is demonstrably committed to either terminating the employment of current employees according to a detailed formal plan without possibility of withdrawal or to providing termination benefits as a result of an offer made to encourage voluntary redundancy. Benefits falling due more than 12 months after the end of reporting date are discounted to present value.
Contributed equity Ordinary shares are classified as equity. Incremental costs directly attributable to the issue of new shares are shown in contributed equity as a deduction, net of tax, from the proceeds of issue.
Treasury shares The acquisition of Asciano’s own equity instruments are not recognised as financial assets regardless of the reason for which they are reacquired. If Asciano reacquires its own equity instruments, the amount of consideration paid for those instruments (“treasury shares”) is recognised as a deducted from equity. No gain or loss is recognised in the profit or loss on the purchase, sale, issue or cancellation of Asciano’s own equity instruments. Such treasury shares may be acquired and held by the Parent or by other members of the consolidated group. Consideration paid or received for the transfer of treasury shares is recognised directly in equity.
Dividends Once resolved to be paid, dividends are a liability of Asciano and, to the extent they are not paid at the reporting date, are accounted for as other financial liabilities.
financial report
Asciano Limited104
For
per
sona
l use
onl
y

6 3 A S C I A N O L I M I T E D F I N A N C I A L R E P O R T F O R T H E Y E A R E N D E D 3 0 J U N E 2 0 1 4
1. Summary of significant accounting policies (continued)
Earnings per share Basic earnings per share is calculated by dividing the net profit or loss attributable to shareholders of the Parent by the weighted average number of ordinary shares outstanding during the year. Diluted earnings per share adjusts the figures used in the determination of basic earnings per share to take into account the post-tax effect of interest and other financing costs associated with dilutive ordinary shares and the weighted average number of shares assumed to have been issued for no consideration in relation to dilutive potential ordinary shares.
New accounting standards and interpretations Certain new accounting standards and interpretations have been published that are not mandatory for 30 June 2014 reporting periods and have not been early adopted by the Group. The Group’s assessment of the impact of these new standards and interpretations that are likely to impact Asciano are set out below: AASB 9 Financial Instruments (2013) – Mandatory Effective Date of AASB 9 and Transitional Disclosures from 1 January 2018. The Group has not yet completed its assessment of how its own hedging arrangements would be affected by the new rules, and therefore has not yet decided whether to adopt any parts of AASB 9 early. The Group is not required to adopt this new standard until the annual reporting period ending 30 June 2019. There are no other standards that are not yet effective and that are expected to have a material impact on the entity in the current or future reporting periods and on foreseeable future transactions.
financial report
Annual report 2014105
For
per
sona
l use
onl
y

notes to and forming part of the financial statements Continued
6 4 A S C I A N O L I M I T E D F I N A N C I A L R E P O R T F O R T H E Y E A R E N D E D 3 0 J U N E 2 0 1 4
2. Critical accounting estimates and judgements The preparation of financial statements requires management to make judgements, estimates and assumptions that affect the application of accounting policies and the reported amounts of assets, liabilities, income and expenses. Actual results may differ from these estimates. Estimates and underlying assumptions are reviewed on an ongoing basis. Revisions to accounting estimates are recognised in the period in which the estimate is revised and in any future periods affected. In particular, information about significant areas of estimation and critical judgements in applying accounting policies that have had the most significant effect on the amounts recognised in the financial statements are described below. Further details of the nature of these assumptions and conditions may be found in the relevant notes. Further information about the assumptions made in measuring fair values in respect of financial assets and liabilities is included in note 3(b).
Impairment Asciano assesses whether goodwill and intangible assets with indefinite useful lives are impaired at least annually, in accordance with the accounting policy in note 1. These calculations involve making an estimate of the recoverable amount of the cash-generating units (“CGUs”) to which goodwill and intangible assets with indefinite useful lives have been allocated. The recoverable amounts of CGUs have been determined based on value-in-use calculations. These calculations require the use of assumptions, which are detailed in note 21. Asciano assesses impairment by evaluating conditions specific to Asciano and to the particular asset, which may lead to impairment. These include technological, market, economic or legal environments in which Asciano operates. If an indicator of impairment exists, the recoverable amount of the asset is determined.
Taxation Interpretation and application of tax legislation Asciano’s accounting for income tax requires management’s judgement as to the types of arrangements considered to be subject to tax. Judgement is also required in relation to the application of existing tax legislation, including the impact of Australian Taxation Office interpretation and ongoing Federal Government reviews of existing legislation.
Recoverability of deferred tax assets Deferred tax assets, including those arising from carried forward losses, capital losses and temporary differences, are recognised when it is considered more likely than not that they will be recovered. Recoverability is dependent on the generation of sufficient future taxable profits. Assumptions about the generation of future taxable profits depend on management’s estimates of future cash flows, which in turn depend on estimates of future sales volumes, operating costs, capital expenditure, dividends to shareholders and other capital management transactions.
Workers compensation self-insurance provision Independent actuarial valuations are used to estimate the provision required for self-insured workers compensation. The determination of the provision required is dependent on a number of assumptions including the total future cost to finalise existing open claims, wage increases that will impact existing claims, a discount rate that is based on Commonwealth Government bond yields, inflation, and the amount of claims that have been incurred but not yet reported. Variances in any of the assumptions used, and in particular the costs associated with claims, can have a material impact on the provision estimates in the following year.
financial report
Asciano Limited106
For
per
sona
l use
onl
y

6 5 A S C I A N O L I M I T E D F I N A N C I A L R E P O R T F O R T H E Y E A R E N D E D 3 0 J U N E 2 0 1 4
2. Critical accounting estimates and judgements (continued)
Restructuring provision Although a restructuring provision is based on a detailed plan, the provision calculation includes several estimates and assumptions including the timing and cost of site closures, timing and cost of curtailment of operations and costs for incidental services such as legal, accounting and consulting. Estimates are also required of the likely number of employees who will exit the business, number of staff who may accept redeployment, final cost of property and site make-good, asset valuations and realisation from sale of discontinued assets.
Incident provision Where Asciano is involved in an incident, such as a train derailment, and it is probable that Asciano will be held liable for the consequential damage, a provision equal to the estimated cost of third party claims is set aside. The cost estimate is made by loss adjusters where material, but the final quantum of the potential claims can be significantly different to the estimate. Adjustments to the provision are booked to earnings in the period when any changes in estimates are made.
Site restoration provision The provision is the best estimate of the present value of the expenditure required to settle the restoration obligation at the reporting date, based on current legal requirements and technology. Future restoration costs are reviewed annually and any changes are reflected in the present value of the restoration provision at the end of the reporting period. Significant uncertainties exist as to the amount of restoration obligations that will be incurred due to the uncertainty as to the remaining life of existing operating sites, and the impact of changes in environmental legislation. Assumptions have been made as to the remaining life of existing sites based on studies conducted by independent technical advisers.
Travel passes The travel passes provision relates to the cost of retiree rail travel passes, including the associated fringe benefit tax, and is based on an independent actuarial assessment conducted by ABS (PL) Pty Limited. Retiree rail travel passes relate to retired ex-employees of FreightCorp (the business acquired by an Asciano subsidiary in 2002) who held a life-long travel pass and ex-employees of FreightCorp who became employees of Pacific National who were expected to become entitled to a retiree pass on exiting the business. The amount and timing of the expenditure is dependent upon the age of the passholder, length of service, expected exit date and life expectancy.
Defined benefit superannuation funds A liability or asset in respect of defined benefit superannuation funds is recognised in the statement of financial position, and is measured as the present value of the defined benefit obligation less the fair value of the superannuation fund’s assets and any unrecognised past service cost. The present value of the defined benefit obligation is based on expected future payments which arise from membership of the fund to the reporting date, calculated annually by independent actuaries using the projected unit credit method. Assumptions have been made by the actuaries as to expected future wage and salary levels, experience of employee departures and periods of service.
3. Financial risk management (a) Overview Asciano has exposure to credit, liquidity and market risks relating to its use of financial instruments. This note presents information about Asciano's exposure to each of these risks, Asciano’s objectives, policies and processes for measuring and managing risk, and the management of capital. Further quantitative disclosures are included throughout the financial statements. The Board has overall responsibility for the establishment and oversight of Asciano’s risk management framework. The Board has established the Audit and Risk Committee, which is responsible for developing and monitoring Asciano’s risk management policies. The committee reports regularly to the Board on its activities. Asciano’s risk management policies are established to identify and analyse the risks faced by Asciano, to set appropriate risk limits and controls, and to monitor risks and adherence to limits. Risk management policies and systems are reviewed to reflect changes in market conditions and Asciano’s activities. Asciano, through its management standards and procedures, aims to develop a disciplined and constructive control environment in which all employees understand their roles and obligations. The Audit and Risk Committee oversees how management monitors compliance with Asciano’s risk management policies and procedures and reviews the adequacy of the risk management framework in relation to the risks faced by Asciano. The Audit and Risk Committee is assisted in its oversight role by internal audit. Internal audit undertakes reviews of risk management controls and procedures, the results of which are reported to the committee.
(b) Fair values The fair values of financial assets and liabilities, together with the carrying amounts shown in the statement of financial position, are presented on the following page:
financial report
Annual report 2014107
For
per
sona
l use
onl
y

notes to and forming part of the financial statements Continued
6 6 A S C I A N O L I M I T E D F I N A N C I A L R E P O R T F O R T H E Y E A R E N D E D 3 0 J U N E 2 0 1 4
3. Financial risk management (continued)
2014 Note
Carrying amount
$M Fair value
$M
Financial assets
Cash and cash equivalents 12 167.3 167.3
Trade and other receivables 14 431.1 431.1
Forward exchange contracts 17 0.7 0.7
Loans to joint ventures 14 56.2 56.2
Interest rate swaps – at fair value through profit or loss 17 2.3 2.3
Cross-currency swaps – fair value hedging instruments 17 76.8 76.8
Cross-currency swaps – cash flow hedging instruments 17 90.2 90.2
824.6 824.6
Financial liabilities
Trade and other payables 22 479.7 479.7
Forward exchange contracts 24 7.3 7.3
Syndicated bank loan 23 650.0 650.0
US dollar bonds, gross of discount and unrealised fair value loss 23 2,197.3 2,264.8
GBP bonds, gross of discount 23 544.0 570.3
Interest rate swaps – at fair value through profit or loss 24 4.1 4.1
Interest rate swaps – cash flow hedging instruments 24 1.5 1.5
Cross-currency swaps – cash flow hedging instruments 24 106.3 106.3
3,990.2 4,084.0
Net financial liabilities (3,165.6) (3,259.4)
2013
Financial assets
Cash and cash equivalents 12 29.7 29.7
Trade and other receivables 14 394.8 394.8
Forward exchange contracts 17 8.8 8.8
Loans to joint ventures 14 53.0 53.0
Interest rate swaps – cash flow hedging instruments 17 1.6 1.6
Interest rate swaps – at fair value through profit or loss 17 12.6 12.6
Cross-currency swaps – fair value hedging instruments 17 174.1 174.1
Cross-currency swaps – cash flow hedging instruments 17 46.4 46.4
721.0 721.0
Financial liabilities
Trade and other payables 22 406.9 406.9
Syndicated bank loan 23 810.0 810.0
US dollar bonds, gross of discount and unrealised fair value loss 23 2,277.4 2,106.2
Interest rate swaps – at fair value through profit or loss 24 0.9 0.9
Cross-currency swaps – cash flow hedging instruments 24 47.5 47.5
3,542.7 3,371.5
Net financial liabilities (2,821.7) (2,650.5)
The fair value of the US dollar bonds and GBP bonds has been determined using market prices from third party information.
financial report
Asciano Limited108
For
per
sona
l use
onl
y

6 7 A S C I A N O L I M I T E D F I N A N C I A L R E P O R T F O R T H E Y E A R E N D E D 3 0 J U N E 2 0 1 4
3. Financial risk management (continued)
All derivative financial instruments are carried at fair value, by valuation method. The different levels have been defined as follows:
Level 1: quoted price (unadjusted) in active markets for identical assets or liabilities;
Level 2: inputs other than quoted prices included within Level 1 that are observable for the asset or liability, either directly (i.e. as prices) or indirectly (i.e. derived from prices); and
Level 3: inputs for the asset or liability that are not based on observable market data.
All of Asciano’s financial instruments fall into the Level 2 classification. The Group determines Level 2 fair values for debt securities using a discounted cash flow technique, which uses contractual cash flows and a market related discount rate. Level 2 fair values for simple over-the-counter derivative financial instruments are based on broker quotes. Those quotes are tested for reasonableness by discounting expected future cash flows using market interest rate for a similar instrument at the measurement date. Fair values reflect the credit risk of the instrument and include adjustments to take account of the credit risk of the Group entity and counterparty when appropriate. The Group recognises transfers between levels of the fair value hierarchy as of the end of the reporting period during which the transfer has occurred. There were no transfers between Level 1 to Level 2 of the fair value hierarchy at 30 June 2014. The Group has an established control framework with respect to the measurement of fair values. This framework mandates that valuations are reported directly to the Chief Financial Officer, who has overall responsibility for all significant fair value measurements. Regular reviews are conducted on significant unobservable inputs and valuation adjustments. If third party information, such as broker quotes or pricing services, is used to measure fair value, then management assesses and documents the evidence obtained from the third parties to support the conclusion that such valuations meet the requirements of AASBs, including the level in the fair value hierarchy the resulting fair value estimate should be classified. Significant valuation issues are reported to the Group Audit and Risk Committee.
financial report
Annual report 2014109
For
per
sona
l use
onl
y

notes to and forming part of the financial statements Continued
6 8 A S C I A N O L I M I T E D F I N A N C I A L R E P O R T F O R T H E Y E A R E N D E D 3 0 J U N E 2 0 1 4
3. Financial risk management (continued)
Interest rates used in determining fair value The interest rates used to discount estimated cash flows, where applicable, are based on the Australian dollar, US dollar and GBP yield curves at the reporting date and were as follows:
2014 % pa
2013 % pa
Australian dollar derivatives 2.7 to 4.1 2.8 to 5.0
US dollar derivatives and fair value adjustments to US dollar bonds 0.2 to 2.6 0.3 to 2.7
GBP derivatives and fair value adjustments to GBP bonds 0.5 to 2.8 –
(c) Credit risk Credit risk is the risk of financial loss to Asciano if a customer or counterparty to a financial instrument fails to meet its contractual obligations, and arises principally from Asciano’s receivables from customers and from treasury activities. Asciano’s credit risk is managed within the limits set by the Board.
Trade and other receivables exposure Asciano’s credit risk on trade and other receivables arises principally from the creditworthiness of individual customers. Asciano's customers are primarily large Australian and international companies of good credit standing. The vast majority of receivables are denominated in Australian dollars.
Ageing profile of trade receivables 2014
$M 2013
$M
Current 300.6 271.4
31 to 60 days overdue 49.0 46.5
Over 61 days overdue 10.7 9.0
360.3 326.9
The allowance for impairment losses of $6.7 million (2013: $4.4 million) (refer to note 14) primarily related to items aged within the over 61 days overdue category. All other receivables are current. Management believes that the unimpaired amounts are still collectible in full based on historic payment behaviours. Asciano has established a credit policy under which each new customer is analysed individually for creditworthiness before Asciano’s standard payment and delivery terms and conditions are offered, and credit limits are then established for each customer. Asciano's credit policy includes collection guidelines, such as the setting of collection targets, as well as follow-up procedures to manage overdue accounts and minimise collection risk. Asciano's allowance for impairment represents its estimate of incurred losses in respect of trade and other receivables. The allowance is composed of a specific loss component that relates to individually significant exposures, and a collective loss component established for groups of similar assets in respect of losses that have been incurred but not yet identified. The collective loss allowance is determined based on analysis of historical data, including payment statistics for similar financial assets.
Treasury activities The Board has established policies governing Asciano's treasury activities, including the monitoring and management of credit risks arising from the use of derivatives. Cash is deposited with creditworthy counterparties in accordance with Board approved credit limits. The table in note 3(b) shows the carrying amount of financial assets that represents the maximum credit exposure at the reporting date.
financial report
Asciano Limited110
For
per
sona
l use
onl
y

6 9 A S C I A N O L I M I T E D F I N A N C I A L R E P O R T F O R T H E Y E A R E N D E D 3 0 J U N E 2 0 1 4
3. Financial risk management (continued)
(d) Liquidity risk Liquidity risk is the risk that Asciano will not be able to meet its financial obligations as they fall due. Asciano’s policy in managing liquidity risk is to ensure that it always has sufficient liquidity to meet its financial obligations when due, as well as to accommodate unforeseen cash requirements over both the short and long term. Asciano's liquidity risk is managed through:
maintenance of at call access to funds in the form of cash balances or committed, available revolving credit facilities;
maintenance of rigorous and regular cash flow forecasts;
regular review of the adequacy of banking arrangements; and
centralisation of surplus cash balances, and management thereof in compliance with Asciano's credit risk policies.
The following table provides maturities of both the principal and interest components of Asciano’s financial liabilities:
2014 Note
Carrying amount
$M
Less than 1 year
$M
1 to 2 year(s)
$M
2 to 5 years
$M
Over 5 years
$M Total
$M
Non-derivatives
Syndicated bank loans 23 650.0 24.8 27.7 664.3 – 716.8
US dollar bonds, gross of discount 23 2,197.3 98.3 515.8 1,010.7 1,008.9 2,633.7
GBP bonds gross of discount 23 544.0 27.2 27.2 81.6 680.1 816.1
Trade and other payables 22 464.4 464.4 – – – 464.4
Derivatives
Forward exchange contracts 17 & 24 6.6 144.9 38.9 – – 183.8
Interest rate swaps 17 & 24 3.3 (4.4) (3.5) 1.6 6.1 (0.2)
Cross-currency swaps 17 & 24 (60.7) 58.9 48.6 48.1 46.3 201.9
Total financial liabilities 3,804.9 814.1 654.7 1,806.3 1,741.4 5,016.5
2013
Non-derivatives
Syndicated bank loans 23 810.0 33.3 35.0 877.4 – 945.7
US dollar bonds, gross of discount 23 2,277.4 101.5 101.5 721.6 1,996.9 2,921.5
Trade and other payables 22 393.6 393.6 – – – 393.6
Derivatives
Interest rate swaps 17 & 24 (13.3) 3.4 3.7 (13.1) (11.7) (17.7)
Cross-currency swaps 17 & 24 (173.0) 35.5 35.3 (1.2) 29.5 99.1
Total financial liabilities 3,294.7 567.3 175.5 1,584.7 2,014.7 4,342.2 In addition to the principal amounts under bank loans, interest is accrued at a floating rate. The weighted average rate as at 30 June 2014 was 3.1% (2013: 4.9%) per annum. In addition to the principal amounts of US dollar bonds and GBP bonds interest is accrued at fixed coupon rates. The weighted average rate as at 30 June 2014 was 4.8% (2013: 4.7%) per annum across both the US dollar and GBP bonds.
financial report
Annual report 2014111
For
per
sona
l use
onl
y

notes to and forming part of the financial statements Continued
7 0 A S C I A N O L I M I T E D F I N A N C I A L R E P O R T F O R T H E Y E A R E N D E D 3 0 J U N E 2 0 1 4
3. Financial risk management (continued)
(e) Market risk Market risk is the risk that changes in market prices, such as interest rates, foreign exchange rates and other market prices, impact on cash flows and the value of assets or liabilities, and as a consequence, on the value of Asciano. The goal of Asciano's hedging activities is to manage and control, within acceptable parameters and in a cost effective manner, the potential adverse variations in Asciano’s value due to movements in market prices or rates. Asciano uses derivative financial instruments to hedge market risks where appropriate. All hedging activity is subject to the financial risk management policies approved by the Board. The following principles govern Asciano's use of derivative instruments:
no speculative transactions are permitted;
only transactions involving approved instruments are allowed; and
transactions are not permitted unless in compliance with approved credit limits and delegated authorities.
Generally, Asciano seeks to apply hedge accounting principles in respect of derivative instruments.
Interest rate risk Asciano borrows at floating rates of interest and holds cash or short-term investments that earn interest at floating rates. Consequently, Asciano's cash flows are exposed to the impact of adverse changes in benchmark interest rates. Asciano also borrows at fixed rates of interest and may, from time to time, hold investments that earn interest at fixed rates. Where this occurs, the fair value of Asciano's assets and liabilities are exposed to the impact of adverse changes in benchmark interest rates. Asciano manages its interest rate exposures by maintaining a policy to combine fixed and floating rate liabilities, through the use of approved derivative instruments and entry into fixed rate borrowings. Fixed rate borrowings and receivables are carried at amortised cost. They are therefore not subject to interest rate risk as defined by AASB 7, since neither the carrying amount nor the future cash flows will fluctuate because of a change in market interest rates.
Interest rate swaps The notional amount of interest rate derivative contracts at 30 June 2014 was $700 million (2013: $1.0 billion) including $200 million (2013: $200 million) designated as hedges against syndicated bank loans and $500 million hedging US Bonds (see below). All outstanding derivative interest rate contracts have been stated at their fair value at the reporting date. During the period between designation of these derivative interest rate contracts and the reporting date, the ineffective portion of movements in fair value was nil (2013: a gain of $0.8 million as identified by Asciano’s retrospective and prospective effectiveness testing over this period and was recorded in the profit or loss). Under AASB 13, the concept of fair value changed to include an adjustment for the impact of credit. During the year, a credit adjustment loss of $0.1 million was recorded in the profit or loss in respect of interest rate swaps. The effective portion of movements in fair value over the life of the instrument was a cumulative liability of $1.5 million (2013: $1.5 million cumulative asset) after tax. This was deferred in the hedge reserve to be released to the profit or loss either over the life of the hedging relationship or when the anticipated transaction occurs.
Cross-currency swaps The notional US dollar bond balance is US$2.0 billion, of which US$1.0 billion is hedged under fixed-for-fixed cross-currency interest rate swaps (“CCIRS”). The remaining US$1.0 billion is hedged under fixed-for-floating CCIRS of which $500 million is economically hedged using floating-for-fixed Australian dollar interest rate swaps, which under AASB 139 do not qualify for hedge accounting. The fair value movement of these interest rate swaps was a loss of $13.7 million (2013: gain of $11.8 million). The notional balance of GBP bond balance is £300 million which is fully hedged under a fixed-for-fixed CCIRS. In relation to all CCIRS a credit adjustment of $7.9 million was recorded in profit or loss for the year as an expense.
financial report
Asciano Limited112
For
per
sona
l use
onl
y

7 1 A S C I A N O L I M I T E D F I N A N C I A L R E P O R T F O R T H E Y E A R E N D E D 3 0 J U N E 2 0 1 4
3. Financial risk management (continued)
The following table summarises Asciano's exposure to interest rate risk:
Fixed interest rate
2014 Note
Variable notional amount
$M
Less than 1 year
$M
1 to 2 year(s)
$M
2 to 5 years
$M
Over 5 years
$M Total
$M
Financial assets
Cash and cash equivalents 12 167.3 – – – – 167.3
Interest rate swaps 150.0 – – – (150.0) –
317.3 – – – (150.0) 167.3
Non-interest bearing:
Trade and other receivables 14 431.1
Forward exchange contracts 17 0.7
Loans to joint ventures 14 53.5
Interest bearing:
Loans to joint ventures 14 2.7
Total financial assets 655.3
Financial liabilities
Syndicated bank loans 23 650.0 – – – – 650.0
US dollar bonds, gross of discount 23 – – 424.1 1,431.3 265.1 2,120.5
GBP bonds, gross of discount 23 – – – – 544.0 544.0
Interest rate swaps1 (700.0) – – 550.0 150.0 –
Cross-currency swaps2 1,604.3 – (424.1) – (1,180.2) –
1,554.3 – – 1,981.3 (221.1) 3,314.5
Non-interest bearing:
Trade and other payables 22 479.7
Unrealised fair value loss on US dollar bonds 23 76.8
Interest rate swaps 24 5.6
Cross-currency swaps 24 106.3
Total financial liabilities 3,982.9 1. Notional principal amounts of floating for fixed interest rate swaps.
2. Notional USD and GBP (2014) principal amounts of fixed-for-floating cross currency swaps as translated at the year end exchange rate.
financial report
Annual report 2014113
For
per
sona
l use
onl
y

notes to and forming part of the financial statements Continued
7 2 A S C I A N O L I M I T E D F I N A N C I A L R E P O R T F O R T H E Y E A R E N D E D 3 0 J U N E 2 0 1 4
3. Financial risk management (continued)
The following table summarises Asciano's exposure to interest rate risk:
Fixed interest rate
2013 Note
Variable notional amount
$M
Less than 1 year
$M
1 to 2 year(s)
$M
2 to 5 years
$M
Over 5 years
$M Total
$M
Financial assets
Cash and cash equivalents 12 29.7 – – – – 29.7
Interest rate swaps 700.0 – – (550.0) (150.0) –
729.7 – – (550.0) (150.0) 29.7
Non-interest bearing:
Trade and other receivables 14 394.8
Forward exchange contracts 17 8.8
Loans to joint ventures 14 53.0
Total financial assets 486.3
Financial liabilities
Syndicated bank loans 23 810.0 – – – – 810.0
US dollar bonds, gross of discount 23 – – – 437.8 1,751.0 2,188.8
Interest rate swaps1 (250.0) 250.0 – – – –
Cross-currency swaps2 1,094.4 – – – (1,094.4) –
1,654.4 250.0 – 437.8 656.6 2,998.8
Non-interest bearing:
Trade and other payables 22 406.9 Unrealised fair value loss on US dollar bonds
23
88.5
Interest rate swaps 24 0.9
Cross-currency swaps 24 47.5
Total financial liabilities 3,542.6
1. Notional principal amounts of floating for fixed interest rate swaps. 2. Notional USD principal amounts of fixed-for-floating cross currency swaps as translated at the year end exchange rate.
Fair value sensitivity analysis for fixed interest rate instruments As at 30 June 2014, Asciano had US dollar fixed interest rate borrowings recorded at amortised cost. At inception, these were designated into fair value hedge relationships whereby the fair value impact for changes in interest rates of the hedged item were offset by an opposite impact in the fair value of the hedging instruments. Consequently, a change in interest rates at the reporting date would not have a material net impact on the profit or loss.
financial report
Asciano Limited114
For
per
sona
l use
onl
y

7 3 A S C I A N O L I M I T E D F I N A N C I A L R E P O R T F O R T H E Y E A R E N D E D 3 0 J U N E 2 0 1 4
3. Financial risk management (continued)
Cash flow sensitivity analysis for variable interest rate instruments A 1.0% (100 basis points) per annum change in interest rates at the reporting date would have increased/(decreased) the profit or loss interest expense and equity by the amounts shown below. This analysis assumes that all other variables remain constant.
Profit or Loss Equity
2014 1% pa increase
$M 1% pa decrease
$M 1% pa increase
$M 1% pa decrease
$M
Variable interest rate instruments 6.7 (6.7) – –
Interest rate swaps 26.5 (26.5) 5.5 (5.5)
33.2 (33.2) 5.5 (5.5)
2013
Variable interest rate instruments 7.1 (7.1) – –
Interest rate swaps 23.3 (23.3) 7.5 (7.5)
30.4 (30.4) 7.5 (7.5)
Exchange rate risk Asciano is exposed to exchange rate risk where it has entered into transactions denominated in foreign currencies. The principal source of Asciano's foreign exchange exposure is the purchase of capital equipment and the issuance of US dollar bonds and GBP bonds. From time to time, exchange rate exposures may also arise from operational outgoings and receipts. The exchange rates to which Asciano is primarily exposed are US dollars, euros and the GBP. Asciano manages its exchange rate exposures by passing on the impact of adverse exchange rate movements, where possible and appropriate, to customers, and through the use of derivative instruments in accordance with the policy approved by the Board. The table below provides details of settlement dates, amounts to be received and contractual exchange rates of Asciano's outstanding currency derivative contracts:
financial report
Annual report 2014115
For
per
sona
l use
onl
y

notes to and forming part of the financial statements Continued
7 4 A S C I A N O L I M I T E D F I N A N C I A L R E P O R T F O R T H E Y E A R E N D E D 3 0 J U N E 2 0 1 4
3. Financial risk management (continued)
2014
Weighted average
exchange rate
Foreign currency
$M
Contract value at
inception $M
Fair value gain/(loss)
$M
Less than
1 year $M
1 to 2 year(s)
$M
2 to 5 years
$M
Over 5 years
$M Total
$M
Assets
Buy US dollar 0.983 10.8 11.0 0.6 0.6 – – – 0.6
Buy euro 0.747 0.9 1.2 0.1 0.1 – – – 0.1
Cross-currency swaps – USD 0.979 2,000.0 2,042.2 78.3 – (4.7) 67.6 15.4 78.3
Cross-currency swaps – GBP 0.584 300.0 514.0 30.1 – – – 30.1 30.1
2,568.4 109.1 0.7 (4.7) 67.6 45.5 109.1
Liabilities
Buy US dollar 0.893 89.6 100.4 3.5 2.3 1.2 – – 3.5
Buy euro 0.646 45.2 70.0 3.7 3.7 – – – 3.7
170.4 7.2 6.0 1.2 – – 7.2
2013
Assets Buy US dollar 0.975 82.6 84.9 6.6 6.4 0.2 – – 6.6
Buy euro 0.730 32.9 45.2 2.2 2.2 – – – 2.2
130.1 8.8 8.6 0.2 – – 8.8
Liabilities
Buy euro 0.667 2.4 3.7 – – – – – –
Cross-currency swaps – USD 0.979 2,000.0 2,042.2 146.6 – – 8.9 137.7 146.6
2,045.9 146.6 – – 8.9 137.7 146.6
There has been no material hedge ineffectiveness during the period between designation of these forward exchange rate contracts and the reporting date. The movement in fair value over the life of the instrument was a cumulative gain of $4.6 million (2013: $6.1 million loss) after tax, which has been deferred in the hedge reserve and will be released to the comprehensive income when the anticipated transaction occurs. The forward exchange contracts Asciano has entered into to hedge certain and highly probable foreign currency transactions are designated as cash flow hedges. The following table summarises the fair value of the net hedging assets/(liabilities) used by Asciano to manage exchange rate risk and maturity profile:
2014
Carrying amount
$M
Expected cash flow
Less than 1 year
$M
1 to 2 year(s)
$M
2 to 5 years
$M
Over 5 years
$M Total
$M
Forward exchange contracts (6.5) (6.5) (5.3) (1.2) – – (6.5)
Cross-currency swaps 60.7 108.4 – (4.7) 67.6 45.5 108.4
54.2 101.9 (5.3) (5.9) 67.6 45.5 101.9
2013
Forward exchange contracts 8.8 8.8 8.6 0.2 – – 8.8
Cross-currency swaps 173.0 146.6 – – 8.9 137.7 146.6
181.8 155.4 8.6 0.2 8.9 137.7 155.4
financial report
Asciano Limited116
For
per
sona
l use
onl
y

7 5 A S C I A N O L I M I T E D F I N A N C I A L R E P O R T F O R T H E Y E A R E N D E D 3 0 J U N E 2 0 1 4
3. Financial risk management (continued)
The notional value of Asciano’s foreign exchange contracts at balance date were as follows:
2014 US dollar
$M Euro
$M GBP $M
Forward exchange contracts 111.4 46.1 –
Cross-currency swaps 2,000.0 – 300.0
2,111.4 46.1 300.0
2013
Forward exchange contracts 82.6 35.4 35.4
Cross-currency swaps 2,000.0 – –
2,082.6 35.4 35.4
The following significant exchange rates applied during the financial year:
2014 Average
rate Year end rate
30 June
US dollar 0.918 0.943
GBP 0.565 0.551
Euro 0.677 0.689
2013
US dollar 1.027 0.914
Euro 0.795 0.703
Currency sensitivity analysis The profit or loss impact of a 10% per annum change in the Australian dollar, against the US dollar and euro, would be $nil during the period between designation and the reporting date as no ineffective portion of movements in fair value was identified by Asciano’s hedge effectiveness testing. A 10% per annum change in the Australian dollar against the following currencies at 30 June 2014 would have (increased)/decreased equity by the amounts shown in the table below. This analysis assumes that all other variables, in particular interest rates, remain constant.
2014 10% pa increase
$M
2014 10% pa decrease
$M
2013 10% pa increase
$M
2013 10% pa decrease
$M
US dollar (10.2) 12.6 (11.8) 14.6
Euro (8.5) 11.3 (6.6) 8.8
(18.7) 23.9 (18.4) 23.4
No currency sensitivity analysis is presented in respect of the US dollar bonds and Sterling bonds as the cross-currency swaps that Asciano has put in place fully hedge any currency movements.
Other market price risk Asciano is exposed to market price risk on contracts for the purchase of fuel. Asciano manages its exposure by passing on the impact of fuel price movements, where possible and appropriate, to customers. Given the objective of Asciano's financial risk management is to reduce the risk from potential adverse market price movements to acceptable levels on a cost effective basis, active management of this exposure via the use of approved derivative instruments is not considered necessary. This exposure is reviewed at least annually to ensure the treatment remains appropriate.
financial report
Annual report 2014117
For
per
sona
l use
onl
y

notes to and forming part of the financial statements Continued
7 6 A S C I A N O L I M I T E D F I N A N C I A L R E P O R T F O R T H E Y E A R E N D E D 3 0 J U N E 2 0 1 4
3. Financial risk management (continued)
(f) Capital management Asciano’s capital management strategy has two purposes:
to support and facilitate the business strategy; and
to minimise the costs of financing the business. Supporting and facilitating Asciano’s business strategy means:
providing sufficient financial flexibility to enable the Group to pursue its growth aspirations;
maintaining access to a broad range of funding sources; and
ensuring financial strategies and policies do not conflict with business strategy. Minimising the costs of funding the business means:
using a mix of debt, equity and hybrid funds that will deliver the lowest cost overall; and
raising funds, in whatever form, from the most cost effective sources available. Capital management means optimising capital structure and minimising non-debt funding costs: Optimising capital structure:
medium-term financial targeting; and
distribute/raise capital consistent with targets. Minimising non-debt funding costs:
raise capital in most efficient sources/forms; and
distribution policy: deliver returns efficiently. The appropriate capital structure for Asciano depends on the number and size of growth opportunities available to it, the earnings and cash flows generated from its businesses and the desire to minimise the overall cost of funds. Appropriate financial targets shall be based on:
the strength and stability of the Group’s businesses and cash flows;
the Group’s growth aspirations;
the desire to minimise overall WACC;
the desire to maintain a sufficient degree of financial flexibility and ease of access to financial markets in order to support the pursuit of its growth strategy;
an assessment of the relative costs and benefits of alternatives; and
the credit ratings that result, in part, from such targets.
financial report
Asciano Limited118
For
per
sona
l use
onl
y

7 7 A S C I A N O L I M I T E D F I N A N C I A L R E P O R T F O R T H E Y E A R E N D E D 3 0 J U N E 2 0 1 4
3. Financial risk management (continued)
(g) Master netting or similar agreements Asciano enters into derivative transactions under International Swaps and Derivatives Association (“ISDA”) master netting agreements. In general, under such agreements the amounts owed by each counterparty on a single day in respect of all transactions outstanding in the same currency are aggregated into a single net amount that is payable by one party to the other. In certain circumstances, e.g. when a credit event such as a default occurs, all outstanding transactions under the agreement are terminated, the termination value is assessed and only a single net amount is payable in settlement of all transactions. The ISDA agreements do not meet the criteria for offsetting in the statement of financial position. This is because Asciano does not have any currently legally enforceable right to offset recognised amounts, because the right to offset is enforceable only on the occurrence of future events such as a default on the bank loans or other credit events. The following table sets out the carrying amounts of recognised financial instruments that are subject to the above agreements.
2014
Gross and net amounts of
financial instruments in the statement
of financial position
$M
Related financial
instruments that are not
offset $M
Net amount $M
Financial assets
Interest rate swaps 1.1 – 1.1
Forward exchange contracts 0.7 0.5 0.2
Cross-currency swaps 157.9 85.1 72.8
159.7 85.6 74.1
Financial liabilities
Interest rate swaps 4.5 – 4.5
Forward exchange contracts 7.2 0.5 6.7
Cross-currency swaps 97.2 85.1 12.1
108.9 85.6 23.3 2013
Financial assets
Interest rate swaps 14.2 – 14.2
Forward exchange contracts 8.8 – 8.8
Cross-currency swaps 213.0 40.0 173.0
236.0 40.0 196.0
Financial liabilities
Interest rate swaps 0.9 – 0.9
Cross-currency swaps 40.0 40.0 –
40.9 40.0 0.9
financial report
Annual report 2014119
For
per
sona
l use
onl
y

notes to and forming part of the financial statements Continued
7 8 A S C I A N O L I M I T E D F I N A N C I A L R E P O R T F O R T H E Y E A R E N D E D 3 0 J U N E 2 0 1 4
3. Financial risk management (continued)
The following table provides a reconciliation of recognised financial instruments that are subject to the master netting or similar agreements to derivative disclosures per the statement of financial position. Gross and net amounts of financial instruments in the statement of financial position
2014 $M
2013 $M
Total gross assets 159.7 236.0
Total gross liabilities 108.9 40.9
50.8 195.1
Reconciliation to statement of financial position
Derivative financial assets – current 4.1 12.5
Derivative financial assets – non-current 165.9 231.0
Derivative financial assets 170.0 243.5
Derivative financial liabilities – current 61.4 29.1
Derivative financial liabilities – non-current 57.8 19.3
Derivative financial liabilities 119.2 48.4
Net balance sheet 50.8 195.1
4. Segment reporting 2014 $M PN Coal PN Rail
Terminals & Logistics
Bulk & Auto Port Services
Eliminations/ unallocated Total
Revenue
External revenue 1,159.5 1,289.6 704.2 761.2 11.6 3,926.1
Inter-segment revenue – 22.3 44.4 – (66.7) –
1,159.5 1,311.9 748.6 761.2 (55.1) 3,926.1
Other income 0.4 17.2 – 32.2 18.7 68.5 Revenue and other income 1,159.9 1,329.1 748.6 793.4 (36.4) 3,994.6
Operating expenses (699.2) (1,043.8) (548.9) (687.0) 21.4 (2,957.5) Share of net profit of joint ventures – – 1.3 13.6 – 14.9
Profit/(loss) before depreciation, amortisation, net finance costs, material items and tax 460.7 285.3 201.0 120.0 (15.0) 1,052.0
Depreciation (98.6) (104.8) (48.6) (28.4) (4.7) (285.1)
Amortisation (29.8) (0.9) (2.1) (2.1) (11.7) (46.6)
Profit before net finance costs, material items and tax
332.3
179.6
150.3
89.5
(31.4) 720.3
Finance income 2.4
Finance expense (227.7)
Profit before material items and tax 495.0
Material items
Pacific National integration (25.2) (56.6) – – – (81.8)
Port Botany redevelopment – – (38.5) – – (38.5)
Other restructuring expenses – – (4.3) (4.4) (7.3) (16.0)
Profit before tax 358.7
Tax expense (101.7)
Profit after tax 257.0
financial report
Asciano Limited120
For
per
sona
l use
onl
y

7 9 A S C I A N O L I M I T E D F I N A N C I A L R E P O R T F O R T H E Y E A R E N D E D 3 0 J U N E 2 0 1 4
4. Segment reporting (continued) 2013 (RESTATED1) $M PN Coal PN Rail
Terminals & Logistics
Bulk & Auto Port Services
Eliminations/ unallocated Total
Revenue
External revenue 996.1 1,330.8 676.2 674.7 10.4 3,688.2
Inter-segment revenue – 21.3 54.2 – (75.5) –
996.1 1,352.1 730.4 674.7 (65.1) 3,688.2
Other income 21.1 8.8 1.1 5.8 2.7 39.5
Revenue and other income 1,017.2 1,360.9 731.5 680.5 (62.4) 3,727.7
Operating expenses (609.7) (1,044.7) (535.3) (584.1) 21.5 (2,752.3) Share of net profit of joint ventures – – 1.5 15.8 – 17.3
Profit/(loss) before depreciation, amortisation, net finance costs, material items and tax 407.5 316.2 197.7 112.2 (40.9) 992.7 Depreciation (90.8) (99.0) (45.7) (21.8) (4.6) (261.9)
Amortisation (28.8) (0.4) (1.9) (1.4) (12.3) (44.8) Profit/(loss) before net finance costs, material items and tax 287.9 216.8 150.1 89.0 (57.8) 686.0
Finance income 17.5
Finance expense (217.2) Profit before material items and tax 486.3 Material items
Remeasurement to fair value of existing investment in C3 Ltd – – – 17.1 – 17.1
Restructuring expenses – (1.7) (21.7) – (0.7) (24.1)
Legacy changes related to items arising on or before demerger – – – – (12.0) (12.0)
Profit before tax 467.3 Tax expense (130.5) Profit after tax 336.8 1. The restatement relates to the adoption of the amended accounting standard AASB 119 Employee Benefits (2011), as outlined in note 1(f).
financial report
Annual report 2014121
For
per
sona
l use
onl
y

notes to and forming part of the financial statements Continued
8 0 A S C I A N O L I M I T E D F I N A N C I A L R E P O R T F O R T H E Y E A R E N D E D 3 0 J U N E 2 0 1 4
4. Segment reporting (continued) 2014 $M PN Coal PN Rail
Terminals & Logistics
Bulk & Auto Port Services
Eliminations/ unallocated Total
Assets 2,596.4 1,711.2 2,490.4 639.9 707.4 8,145.3
Equity accounted investments – – 2.9 28.0 – 30.9
Segment assets 2,596.4 1,711.2 2,493.3 667.9 707.4 8,176.2
Segment liabilities (299.9) (199.3) (380.1) (321.6) (3,259.1) (4,460.0)
Net assets/(liabilities) 2,296.5 1,511.9 2,113.2 346.3 (2,551.7) 3,716.2
Capital expenditure 123.0 275.1 278.1 48.3 29.2 753.7
2013 (RESTATED1)
Assets 2,564.4 1,570.5 2,270.8 523.0 691.4 7,620.1
Equity accounted investments – – 2.3 26.1 – 28.4
Segment assets 2,564.4 1,570.5 2,273.1 549.1 691.4 7,648.5
Segment liabilities (239.8) (143.3) (278.5) (289.8) (3,074.8) (4,026.2)
Net assets/(liabilities) 2,324.6 1,427.2 1,994.6 259.3 (2,383.4) 3,622.3
Capital expenditure 209.5 174.1 152.1 42.0 23.6 601.3
1. The restatement relates to the adoption of the amended accounting standard AASB 119 Employee Benefits (2011), as outlined in note 1(f).
Asciano operates principally in Australia and has no single external customer for which revenues amount to 10% or more of total revenue.
5. Acquisition of subsidiary On 31 October 2013, Asciano Limited acquired 100% of the voting shares in the Mountain Industries group, a group of private companies based in Newcastle, New South Wales and specialising in the provision of transport, storage and bulk management services for products such as minerals, grain and fertiliser. Since acquisition, Mountain Industries has contributed revenue of $57.1 million and profit after tax of $0.2 million to the Group’s results. Management estimates that if the acquisition had occurred on 1 July 2013, Mountain Industries would have contributed revenue of $95.1 million and a loss after tax of $0.6 million to the Group’s result.
Consideration transferred The following table summarises the acquisition date fair value of each major class of consideration transferred.
2014
$M
Cash paid 87.9
Other purchase price adjustments (2.8)
Total consideration 85.1
Cash acquired (1.5)
Net cash consideration 83.6
The $83.6 million net cash consideration disclosed together with other minor acquisitions forms the $84.8 million for acquisitions of subsidiaries, net of cash acquired disclosed in the consolidated statement of cash flows. Other purchase price adjustments Under the terms of the sale and purchase agreement, an exercise was completed to make adjustment for the balance sheet movements between the date of agreement and the date of completion. This resulted in the former owners of Mountain Industries having to refund Asciano an amount of $2.8 million. The acquisition agreement also contained an amount of contingent consideration payable to the former owners of Mountain Industries on the condition of the business achieving a target level of earnings before interest, tax, depreciation and amortisation for the year ended 30 June 2014. This target was not met and therefore no further consideration was paid.
financial report
Asciano Limited122
For
per
sona
l use
onl
y

8 1 A S C I A N O L I M I T E D F I N A N C I A L R E P O R T F O R T H E Y E A R E N D E D 3 0 J U N E 2 0 1 4
5. Acquisition of subsidiary (continued)
Identifiable assets acquired and liabilities assumed The following summarises the fair value of net assets acquired and liabilities assumed at the acquisition date which have been determined on a provisional basis.
2014
$M
Cash and cash equivalents 1.5
Trade and other receivables 18.1
Prepaid other 0.4
Inventories 0.2
Land and buildings 40.2
Plant and equipment 20.3
Customer contracts 2.4
Trade and other payables (16.0)
Loans and borrowings (0.6)
Provisions (1.4)
Current tax liabilities (0.2)
Deferred tax liabilities (1.5)
Total net identifiable assets acquired and liabilities assumed 63.4
Goodwill
Goodwill arising from the acquisition has been recognised as follows:
Total consideration 85.1
Fair value of identifiable assets and liabilities (63.4)
Goodwill on consolidation 21.7
In addition to goodwill of $21.7 million acquired on the acquisition of Mountain Industries, during the period an additional $0.6 million of goodwill was acquired in relation to other minor acquisitions.
Acquisition related costs During the reporting period, Asciano incurred acquisition related costs of $0.6 million (June 2013: $0.2 million) related to external legal fees and due diligence costs and $2.7 million of stamp duty. These costs have been included in operating expenses in the consolidated statement of profit or loss.
financial report
Annual report 2014123
For
per
sona
l use
onl
y

notes to and forming part of the financial statements Continued
8 2 A S C I A N O L I M I T E D F I N A N C I A L R E P O R T F O R T H E Y E A R E N D E D 3 0 J U N E 2 0 1 4
6. Dividends The following dividends were paid by the Company in the 2014 financial year:
Cents
per share Total amount
$M Franked/
unfranked Date of payment
Final dividend 6.25 61.0 Fully franked 18 September 2013
Interim dividend 5.75 56.0 Fully franked 20 March 2014
Franked dividends paid during the year were franked at the tax rate of 30%. On 21 August 2014, the Board resolved to pay a fully franked final dividend of 8.50 cents per share. The record date for entitlement to the dividend is 1 September 2014. The dividend of $82.9 million was not recognised as a liability at 30 June 2014.
Cents
per share Total amount
$M Franked/
unfranked Date of payment
Final dividend 8.50 82.9 Fully franked 19 September 2014
Dividend franking account The balance in the franking account as at 30 June 2014 of $267,362,022 (2013: $161,261,472) arises from income tax paid and franked dividends received or receivable by the Asciano tax consolidated group, adjusted for franking credits that would arise from the payment of any current tax liabilities. The ability to utilise the franking credits is dependent upon there being sufficient available profit. The impact on the dividend franking account of dividends proposed after the end of period date but not recorded as a liability is to reduce it by $35.5 million. The balance in the New Zealand imputation account as at 30 June 2014 of A$8,026,279 (2013: of A$3,598,906) arises from income tax paid and franked dividends received or receivable by C3 Limited (a wholly owned subsidiary of Asciano which is registered and domiciled in New Zealand). Asciano has not elected into the trans-Tasman imputation regime and the New Zealand imputation credits would not be available to the shareholders of Asciano Limited.
7. Earnings per share
2014 cents
RESTATED1 2013 cents
Parent basic earnings per share 26.1 34.3
Parent diluted earnings per share 26.1 34.2
The calculation of earnings per share was based on the information as follows:
Profit attributable to Parent shareholders 254.4 334.4
1. The restatement relates to the adoption of the amended accounting standard AASB 119 Employee Benefits (2011), as outlined in note 1(f). Basic weighted average number of ordinary shares
In thousands of shares
Issued shares 975,386 975,386
Effect of own shares held (921) (1,185)
Effect of own shares acquired (222) –
Effect of share awards exercised 446 20
Balance at end of financial year 974,689 974,221
Basic weighted average number of ordinary shares 974,689 974,221
Shares issuable under equity-based compensation plans 1,700 3,374
Diluted weighted average number of ordinary shares 976,389 977,595
At 30 June 2014, there were 0.7 million options and 2.7 million rights (2013: 2.7 million options) excluded from the diluted weighted average number of ordinary shares calculation as their effect would have been anti-dilutive.
financial report
Asciano Limited124
For
per
sona
l use
onl
y

8 3 A S C I A N O L I M I T E D F I N A N C I A L R E P O R T F O R T H E Y E A R E N D E D 3 0 J U N E 2 0 1 4
8. Revenue and other income
2014
$M 2013
$M
Revenue
Services rendered 3,926.1 3,688.2
Other income
Net gain on sale of property, plant and equipment 26.0 26.1
Lease rental income 13.3 9.9
Gain on remeasurement to fair value of existing 50% interest in C3 Limited – 17.1
Other 29.2 3.5
Total other income 68.5 56.6
The net profit from the sale of property, plant and equipment is inclusive of a gain of $14.7 million in respect of the sale of land at Ingleburn and a gain of $10.7 million in respect of the sale of land at Pedders Creek, Adelaide. In the comparative period, the net profit from sale of property, plant and equipment is inclusive of a gain of $21.5 million in respect of the sale of a parcel of land at Kooragang Island and a $4.6 million gain in respect of the sale of land at Dubbo. Other income is inclusive of the income arising on the settlement reached with the Port of Melbourne Corporation in relation to covering the costs associated with termination arrangements and the early lease termination at Webb Dock.
9. Finance income and expense Finance income and expense is reconciled to the Consolidated Statement of Profit or Loss and Consolidated Statement of Comprehensive Income as follows:
2014
$M 2013
$M
Interest income 2.4 4.9
Hedge ineffectiveness recognised in the profit or loss – 0.8
Net change in fair value of derivatives not designated in a hedge relationship – 11.8
Net finance income 2.4 17.5
Interest expense (202.1) (213.1)
Borrowing costs capitalised to qualifying asset 10.2 10.7
Amortisation of capitalised borrowing costs (4.7) (3.9)
Guarantee and commitment fees (7.5) (7.8)
Unwind of discount on long-term provisions (2.1) (3.1)
Hedge ineffectiveness recognised in the profit or loss (8.0) –
Net change in fair value of derivatives not designated in a hedge relationship (13.5) –
Finance expense (227.7) (217.2)
Recognised directly in the statement of comprehensive income
Effective portions of changes in fair value of cash flow hedges (72.9) 46.1
Net change in fair value of cash flow hedge reclassified to profit or loss – (1.1)
Tax on finance income and finance costs recognised in the Statement of Comprehensive Income 22.5 (13.3)
Finance income recognised directly in the statement of comprehensive income, net of tax (50.4) 31.7
financial report
Annual report 2014125
For
per
sona
l use
onl
y

notes to and forming part of the financial statements Continued
8 4 A S C I A N O L I M I T E D F I N A N C I A L R E P O R T F O R T H E Y E A R E N D E D 3 0 J U N E 2 0 1 4
9. Finance income and expense (continued)
The net interest expense arising from financial assets or liabilities that are not at fair value through the profit or loss for the year is as follows:
2014
$M 2013
$M
Total interest income 2.4 4.9
Total interest expense1 (191.9) (202.4)
Total interest expense (189.5) (197.5)
1. Interest expense during the year ended 30 June 2014 is net of $10.2 million of capitalised borrowings on qualifying assets (2013: $10.7 million).
10. Expenses
2014
Expenses before material items
$M Material items
$M
Expenses after material items
$M
Employee benefits 1,275.6 48.7 1,324.3
Rail access 449.3 – 449.3
Fuel, oil and power 418.2 – 418.2
Repairs and maintenance 315.8 – 315.8
Lease and hire 200.6 – 200.6
Insurance related 53.2 – 53.2
Other 244.8 11.9 256.7
Operating expenses excluding depreciation and amortisation 2,957.5 60.6 3,018.1
Depreciation 285.1 75.7 360.8
Amortisation 46.6 – 46.6
Total expenses 3,289.2 136.3 3,425.5 2013 (RESTATED1)
Employee benefits 1,170.3 19.4 1,189.7
Rail access 426.6 – 426.6
Fuel, oil and power 377.8 – 377.8
Repairs and maintenance 318.1 – 318.1
Lease and hire 192.8 – 192.8
Insurance related 60.1 – 60.1
Other 206.6 12.7 219.3
Operating expenses excluding depreciation and amortisation 2,752.3 32.1 2,784.4
Depreciation 261.9 4.0 265.9
Amortisation 44.8 – 44.8
Total expenses 3,059.0 36.1 3,095.1
1. The restatement relates to the adoption of the amended accounting standard AASB 119 Employee Benefits (2011), as outlined in note 1(f).
financial report
Asciano Limited126
For
per
sona
l use
onl
y

8 5 A S C I A N O L I M I T E D F I N A N C I A L R E P O R T F O R T H E Y E A R E N D E D 3 0 J U N E 2 0 1 4
10. Expenses (continued)
Material items – Port Botany redevelopment The redevelopment of the Port Botany terminal has continued throughout the year resulting in a number of one-off costs which have been recognised as material items. Each of these cost items is deemed to be of a non-recurring nature and has arisen as a direct result of the redevelopment. The main costs recognised during the 2014 financial year include: restructuring costs of $10.5 million recognised as part of the employee benefits expense;
an additional depreciation charge of $22.1 million reflecting both the write-off of assets and the shorter useful economic life of assets that have become obsolete during the year or will become so by the end of the redevelopment; and
other costs of $5.9 million reflecting additional operational costs as a result of the impact of construction works and the costs associated with training the workforce to operate the automated terminal.
Material items – Pacific National integration On 18 February 2014, Asciano announced a formal program to integrate the PN Coal and PN Rail businesses into a single Pacific National business. This integration process has resulted in a number of one-off material costs in the 2014 financial year including: employee restructuring costs of $26.2 million recognised as part of the employee benefit expense;
asset write-offs of $52.4 million principally related to the scrapping of locomotives and wagons and are included as part of the depreciation expense; and
other project related costs of $3.2 million.
Material items – other restructuring On 18 February 2014, Asciano announced an expansion of its Business Improvement Program including a review of corporate and divisional support functions as well as operational functions across the Group. As a result of these reviews, the Group has recognised other restructuring costs of $16.0 million in the 2014 financial year including: $12.0 million of employee restructuring costs across the Corporate function and the Logistics Ports Services and Autocare businesses;
$1.5 million of onerous lease costs; and
other costs of $2.5 million including some minor assets write-offs and project costs.
financial report
Annual report 2014127
For
per
sona
l use
onl
y

notes to and forming part of the financial statements Continued
8 6 A S C I A N O L I M I T E D F I N A N C I A L R E P O R T F O R T H E Y E A R E N D E D 3 0 J U N E 2 0 1 4
11. Taxes
Note 2014
$M
RESTATED1 2013
$M
Current tax expense 119.6 125.4
Deferred tax (benefit)/expense (15.4) 7.2
Recognition of capital losses – (1.1)
Adjustments of deferred tax for prior periods 0.6 –
Adjustments of current tax for prior periods (3.1) (1.0)
Total income tax expense 101.7 130.5
Reconciliation of income tax expense to prima facie tax payable
Profit before tax 358.7 467.3
Income tax at 30% (2013: 30%) 107.6 140.2
Other non-deductible items 0.5 0.6
Recognition and derecognition of temporary differences – 0.6
Non-assessable equity accounted profit (4.6) (5.1)
Assessable income and distributions from associate investments 4.7 5.0
Recognition of capital losses – (1.1)
Non-assessable income – (5.1)
Franking credits on taxable dividends (3.5) (3.7)
Adjustments of current tax for prior periods (3.1) (0.9)
Adjustments of deferred tax for prior periods 0.6 –
Difference in overseas tax rates (0.5) –
Income tax expense recognised in the profit or loss 101.7 130.5
Tax recognised directly in other comprehensive income
Changes in fair value of cash flow hedge (22.5) 13.3 Defined benefit superannuation funds actuarial (losses)/gains 29 (1.9) 2.0 (24.4) 15.3
Other
Deferred tax balances acquired in business combinations (1.5) (3.0) 1. The restatement relates to the adoption of the amended accounting standard AASB 119 Employee Benefits (2011), as outlined in note 1(f).
financial report
Asciano Limited128
For
per
sona
l use
onl
y

8 7 A S C I A N O L I M I T E D F I N A N C I A L R E P O R T F O R T H E Y E A R E N D E D 3 0 J U N E 2 0 1 4
12. Cash and cash equivalents
2014
$M 2013
$M
Bank balances 167.3 29.7
13. Reconciliation of net operating cash flows
Profit after tax 257.0 336.8
Adjustments for non-cash items:
Depreciation 360.8 265.9
Amortisation of intangible assets 46.6 44.9
Amortisation of capitalised borrowing costs 4.7 3.9
Unwind of discount on long-term provisions 2.3 3.1
Share of joint ventures’ profit net of distributions received (2.7) 1.3
Net gain on sale of property, plant and equipment (26.0) (26.1)
Revaluation gain on remeasurement to fair value of existing interest in C3 – (17.1)
Equity-settled share-based payment transactions 4.9 6.4
Borrowing costs capitalised to qualifying assets (10.2) (10.7)
Hedge ineffectiveness 8.0 (0.8)
Fair value movements of derivatives not designated in a hedge relationship 13.5 (11.8)
Other non-cash items (13.4) 5.8
(Increase)/decrease in assets
Trade and other receivables (20.8) 3.0
Inventories 5.2 (10.3)
Prepayments and other assets 8.4 (4.3)
Change in net deferred tax assets (21.1) 15.7
Increase/(decrease) in liabilities
Trade and other payables 1.0 9.9
Current tax liabilities (42.0) (53.2)
Provisions and employee benefits 30.6 35.1
Net operating cash flows 606.8 597.5
financial report
Annual report 2014129
For
per
sona
l use
onl
y

notes to and forming part of the financial statements Continued
8 8 A S C I A N O L I M I T E D F I N A N C I A L R E P O R T F O R T H E Y E A R E N D E D 3 0 J U N E 2 0 1 4
14. Trade and other receivables
2014
$M 2013
$M
Current
Trade receivables 360.3 326.9
Allowance for impairment losses (6.7) (4.4)
353.6 322.5
Other receivables 75.6 69.9
429.2 392.4
Non-current
Loans to joint ventures 56.2 53.0
Other receivables 1.9 2.4
58.1 55.4
15. Prepayments
Current
Rent 9.7 12.2
Insurance 2.9 3.8
Registrations 3.4 3.4
Other 9.7 11.5
25.7 30.9
Non-current
Rent 2.2 4.3
16. Inventories
Current
Inventories 37.2 32.6
Provision for obsolete and slow-moving items (3.9) (3.3) 33.3 29.3
Non-current
Inventories 66.3 75.4
Provision for obsolete items including depreciation of capital spares (34.7) (34.9)
31.6 40.5
financial report
Asciano Limited130
For
per
sona
l use
onl
y
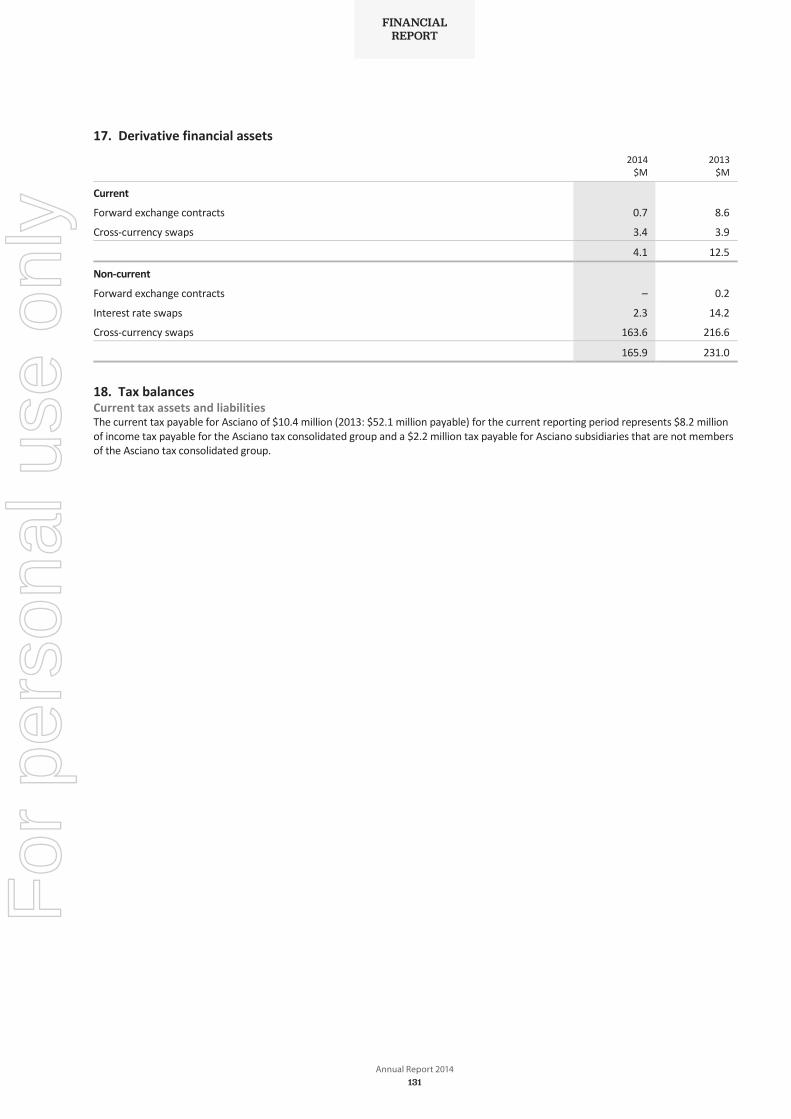
8 9 A S C I A N O L I M I T E D F I N A N C I A L R E P O R T F O R T H E Y E A R E N D E D 3 0 J U N E 2 0 1 4
17. Derivative financial assets
2014
$M 2013
$M
Current
Forward exchange contracts 0.7 8.6
Cross-currency swaps 3.4 3.9
4.1 12.5
Non-current
Forward exchange contracts – 0.2
Interest rate swaps 2.3 14.2
Cross-currency swaps 163.6 216.6
165.9 231.0
18. Tax balances Current tax assets and liabilities The current tax payable for Asciano of $10.4 million (2013: $52.1 million payable) for the current reporting period represents $8.2 million of income tax payable for the Asciano tax consolidated group and a $2.2 million tax payable for Asciano subsidiaries that are not members of the Asciano tax consolidated group.
financial report
Annual report 2014131
For
per
sona
l use
onl
y

notes to and forming part of the financial statements Continued
9 0 A S C I A N O L I M I T E D F I N A N C I A L R E P O R T F O R T H E Y E A R E N D E D 3 0 J U N E 2 0 1 4
18. Tax balances (continued)
Recognised deferred tax assets and liabilities Deferred tax assets and liabilities are attributable to the following temporary differences:
2014 Assets
$M Liabilities
$M Net $M
Property, plant and equipment 44.9 (105.5) (60.6)
Intangible assets – (27.6) (27.6)
Derivatives 55.5 (15.2) 40.3
Inventories 14.5 (1.2) 13.3
Annual leave 27.7 – 27.7
Long service leave 32.5 – 32.5
Other employee provisions 53.7 – 53.7
Restructuring provision 12.8 – 12.8
Other provisions 7.7 0.2 7.9
Other items 14.7 (5.5) 9.2
Net tax assets/(liabilities) 264.0 (154.8) 109.2
2013 (RESTATED1)
Property, plant and equipment 56.9 (99.0) (42.1)
Intangible assets – (35.5) (35.5)
Derivatives 70.8 (58.5) 12.3
Inventories 8.2 (1.9) 6.3
Annual leave 26.3 – 26.3
Long service leave 30.6 – 30.6
Other employee provisions 49.7 – 49.7
Restructuring provision 5.6 – 5.6
Other provisions 10.4 – 10.4
Other items 17.6 (9.2) 8.4
Net tax assets/(liabilities) 276.1 (204.1) 72.0 1. The restatement relates to the amendment of accounting standard AASB 119 Employee Benefits (2011), as outlined in note 1(f).
The Asciano tax consolidated group has $22.7 million of unrecognised temporary differences ($6.8 million deferred tax asset) relating to capital assets which have not been recognised as it is not considered probable that there would be taxable income against which they could be utilised.
financial report
Asciano Limited132
For
per
sona
l use
onl
y

9 1 A S C I A N O L I M I T E D F I N A N C I A L R E P O R T F O R T H E Y E A R E N D E D 3 0 J U N E 2 0 1 4
18. Tax balances (continued)
Movement in temporary differences during the year
2014
Balance 1 July
$M
Recognised in the
statement of profit or loss
$M
Acquired in business
combinations $M
Recognised in equity
$M
Utilisation of tax losses
$M
Balance 30 June
$M
Property, plant and equipment (42.1) (17.0) (1.5) – – (60.6)
Intangible assets (35.5) 8.6 (0.7) – – (27.6)
Derivatives 12.3 5.5 – 22.5 – 40.3
Inventories 6.3 7.0 – – – 13.3
Annual leave 26.3 1.0 0.4 – – 27.7
Long service leave 30.6 1.9 – – – 32.5
Other employee provisions 49.7 2.1 – 1.9 – 53.7
Restructuring provision 5.6 7.2 – – – 12.8
Other provisions 10.4 (2.6) 0.1 – – 7.9
Other 8.4 1.1 (0.3) – – 9.2
Tax losses carried forward:
Revenue – – 0.5 – (0.5) –
Net tax assets/(liabilities) 72.0 14.8 (1.5) 24.4 (0.5) 109.2
2013 (RESTATED1)
Property, plant and equipment (21.3) (20.8) – – – (42.1)
Intangible assets (41.4) 10.1 (4.2) – – (35.5)
Derivatives 29.4 (3.8) – (13.3) – 12.3
Inventories 7.3 (1.0) – – – 6.3
Annual leave 22.0 4.3 – – – 26.3
Long service leave 26.4 4.2 – – – 30.6
Other employee provisions 49.9 1.8 – (2.0) – 49.7
Restructuring provision 1.0 4.6 – – – 5.6
Other provisions 11.0 (0.6) – – – 10.4
Other 13.2 (6.0) 1.2 – – 8.4
Tax losses carried forward:
Capital 6.0 1.1 – – (7.1) –
Net tax assets/(liabilities) 103.5 (6.1) (3.0) (15.3) (7.1) 72.0 1. The restatement relates to the amendment of accounting standard AASB 119 Employee Benefits (2011), as outlined in note 1(f).
financial report
Annual report 2014133
For
per
sona
l use
onl
y
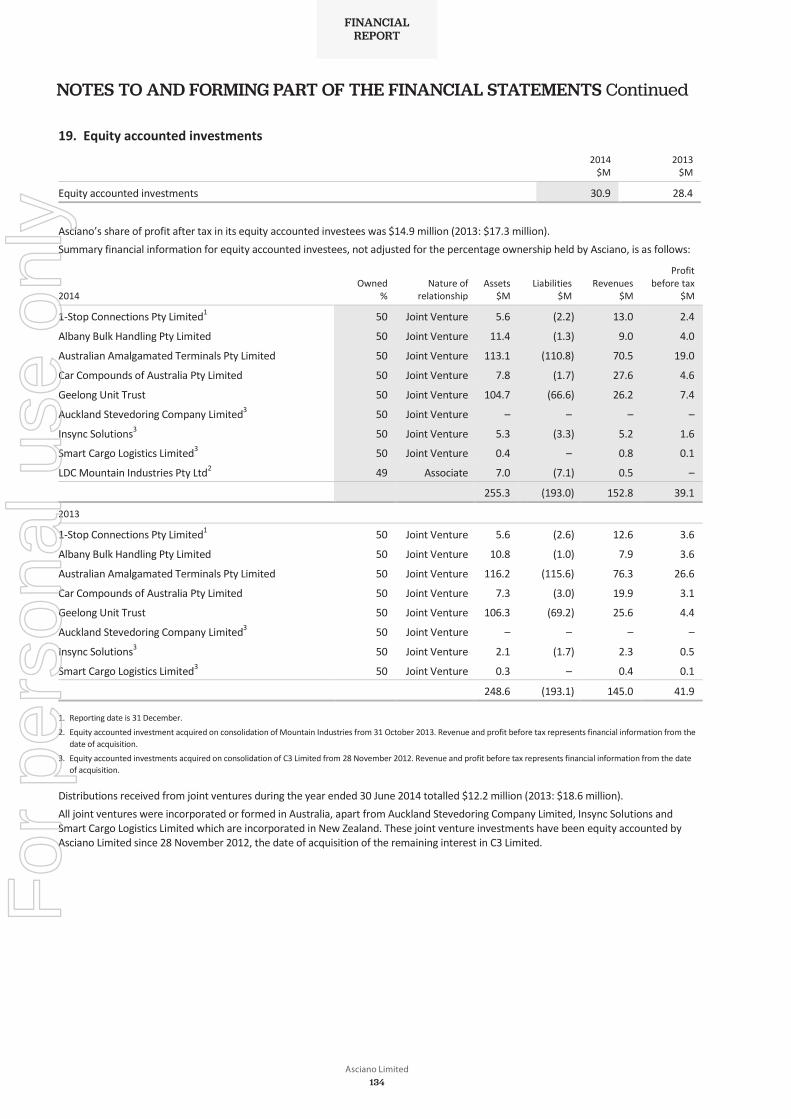
notes to and forming part of the financial statements Continued
9 2 A S C I A N O L I M I T E D F I N A N C I A L R E P O R T F O R T H E Y E A R E N D E D 3 0 J U N E 2 0 1 4
19. Equity accounted investments
2014
$M 2013
$M
Equity accounted investments 30.9 28.4
Asciano’s share of profit after tax in its equity accounted investees was $14.9 million (2013: $17.3 million). Summary financial information for equity accounted investees, not adjusted for the percentage ownership held by Asciano, is as follows:
2014
Owned
% Nature of
relationship Assets
$M Liabilities
$M Revenues
$M
Profit before tax
$M
1-Stop Connections Pty Limited1 50 Joint Venture 5.6 (2.2) 13.0 2.4
Albany Bulk Handling Pty Limited 50 Joint Venture 11.4 (1.3) 9.0 4.0
Australian Amalgamated Terminals Pty Limited 50 Joint Venture 113.1 (110.8) 70.5 19.0
Car Compounds of Australia Pty Limited 50 Joint Venture 7.8 (1.7) 27.6 4.6
Geelong Unit Trust 50 Joint Venture 104.7 (66.6) 26.2 7.4
Auckland Stevedoring Company Limited3 50 Joint Venture – – – –
Insync Solutions3 50 Joint Venture 5.3 (3.3) 5.2 1.6
Smart Cargo Logistics Limited3 50 Joint Venture 0.4 – 0.8 0.1
LDC Mountain Industries Pty Ltd2 49 Associate 7.0 (7.1) 0.5 – 255.3 (193.0) 152.8 39.1
2013
1-Stop Connections Pty Limited1 50 Joint Venture 5.6 (2.6) 12.6 3.6
Albany Bulk Handling Pty Limited 50 Joint Venture 10.8 (1.0) 7.9 3.6
Australian Amalgamated Terminals Pty Limited 50 Joint Venture 116.2 (115.6) 76.3 26.6
Car Compounds of Australia Pty Limited 50 Joint Venture 7.3 (3.0) 19.9 3.1
Geelong Unit Trust 50 Joint Venture 106.3 (69.2) 25.6 4.4
Auckland Stevedoring Company Limited3 50 Joint Venture – – – –
Insync Solutions3 50 Joint Venture 2.1 (1.7) 2.3 0.5
Smart Cargo Logistics Limited3 50 Joint Venture 0.3 – 0.4 0.1
248.6 (193.1) 145.0 41.9 1. Reporting date is 31 December. 2. Equity accounted investment acquired on consolidation of Mountain Industries from 31 October 2013. Revenue and profit before tax represents financial information from the
date of acquisition. 3. Equity accounted investments acquired on consolidation of C3 Limited from 28 November 2012. Revenue and profit before tax represents financial information from the date
of acquisition.
Distributions received from joint ventures during the year ended 30 June 2014 totalled $12.2 million (2013: $18.6 million). All joint ventures were incorporated or formed in Australia, apart from Auckland Stevedoring Company Limited, Insync Solutions and Smart Cargo Logistics Limited which are incorporated in New Zealand. These joint venture investments have been equity accounted by Asciano Limited since 28 November 2012, the date of acquisition of the remaining interest in C3 Limited.
financial report
Asciano Limited134
For
per
sona
l use
onl
y

9 3 A S C I A N O L I M I T E D F I N A N C I A L R E P O R T F O R T H E Y E A R E N D E D 3 0 J U N E 2 0 1 4
20. Property, plant and equipment
2014 Land
$M Buildings
$M
Plant and equipment
$M
Leasehold improvements
$M
Work in progress
$M Total
$M
Cost
Opening balance 290.2 247.0 4,380.4 660.3 499.7 6,077.6
Acquisitions1 21.1 15.0 62.1 – 689.0 787.2
Acquisitions through business combinations2
27.7 12.5 20.3 – – 60.5
Transfers3 – 13.6 446.8 18.9 (517.0) (37.7)
Disposals (57.4) (9.6) (66.7) (54.5) – (188.2)
Closing balance 281.6 278.5 4,842.9 624.7 671.7 6,699.4
Accumulated depreciation and impairment losses
Opening balance – (50.2) (1,735.3) (365.9) – (2,151.4)
Depreciation – (8.6) (271.1) (26.7) – (306.4)
Impairment – – (38.7) (4.0) – (42.7)
Disposals – 1.8 59.9 46.1 – 107.8
Closing balance – (57.0) (1,985.2) (350.5) – (2,392.7)
Carrying amounts
At 1 July 2013 290.2 196.8 2,645.1 294.6 499.7 3,926.4
At 30 June 2014 281.6 221.5 2,857.7 274.2 671.7 4,306.7
2013
Cost
Opening balance 291.4 110.9 3,626.7 648.4 834.9 5,512.3
Acquisitions1 – – – – 616.1 616.1
Acquisitions through business combinations – 0.9 21.1 – – 22.0
Transfers2 2.9 135.5 775.8 13.8 (951.3) (23.3)
Disposals (4.1) (0.3) (43.2) (1.9) – (49.5)
Closing balance 290.2 247.0 4,380.4 660.3 499.7 6,077.6
Accumulated depreciation and impairment losses
Opening balance – (41.2) (1,553.2) (336.2) – (1,930.6)
Depreciation – (9.3) (225.3) (31.3) – (265.9)
Disposals – 0.3 43.2 1.8 – 45.3
Closing balance – (50.2) (1,735.3) (365.7) – (2,151.2)
Carrying amounts
At 1 July 2012 291.4 69.7 2,073.5 312.2 834.9 3,581.7
At 30 June 2013 290.2 196.8 2,645.1 294.6 499.7 3,926.4 1. Included in the cost of property, plant and equipment acquisitions is $10.2 million (2013: $10.7 million) of borrowing costs capitalised to qualifying assets. An average
capitalisation rate of 6.8% (2013: capitalisation rate of 7.2%) was used. 2. Acquisitions acquired through business combinations relate to the acquisition of Mountain Industries. Refer to note 5. 3. Transfers include $33.6 million (2013: $23.3 million) of software and $3.4 million of future track access rights transferred from plant and equipment to intangible assets.
financial report
Annual report 2014135
For
per
sona
l use
onl
y

notes to and forming part of the financial statements Continued
9 4 A S C I A N O L I M I T E D F I N A N C I A L R E P O R T F O R T H E Y E A R E N D E D 3 0 J U N E 2 0 1 4
20. Property, plant and equipment (continued)
Work in progress Work in progress comprises amounts spent on various capital projects including construction and capital improvement of locomotives, wagons and lifting equipment, and development works at various rail and port terminals.
Leased assets As at 30 June 2014 the carrying value of plant and equipment under finance lease is $1.8 million (2013: $2.2 million).
21. Intangible assets
2014 Goodwill
$M
IT development and software
$M
Customer contacts and relationships
$M Brand name
$M
Other* $M
Total $M
Cost
Opening balance 3,566.0 172.6 458.6 25.0 13.9 4,236.1
Acquisitions – – – – 0.9 0.9
Acquisitions through business combinations 22.3 – 2.4 – – 24.7 Transfers from property, plant and equipment – 5.6 – – 32.1 37.7 Disposals – (24.5) – – – (24.5) Closing balance 3,588.3 153.7 461.0 25.0 46.9 4,274.9 Accumulated amortisation and impairment losses
Opening balance (962.9) (128.0) (351.4) – – (1,442.3)
Amortisation – (15.8) (28.3) – (2.5) (46.6)
Disposals – 24.6 – – – 24.6
Other – – (0.3) – – (0.3)
Closing balance (962.9) (119.2) (380.0) – (2.5) (1,464.6)
Carrying amounts
At 1 July 2013 2,603.1 44.6 107.2 25.0 13.9 2,793.8
At 30 June 2014 2,625.4 34.5 81.0 25.0 44.4 2,810.3
2013
Cost
Opening balance 3,514.1 163.9 445.9 25.0 – 4,148.9
Acquisitions through business combinations 51.9 1.2 12.7 – – 65.8
Transfers from property, plant and equipment – 9.4 – – 13.9 23.3
Disposals – (1.9) – – – (1.9)
Closing balance 3,566.0 172.6 458.6 25.0 13.9 4,236.1
Accumulated amortisation and impairment losses
Opening balance (962.9) (114.0) (321.7) – – (1,398.6)
Amortisation – (15.2) (29.7) – – (44.9)
Disposals – 1.2 – – – 1.2
Closing balance (962.9) (128.0) (351.4) – – (1,442.3)
Carrying amounts
At 1 July 2012 2,551.2 49.9 124.2 25.0 – 2,750.3
At 30 June 2013 2,603.1 44.6 107.2 25.0 13.9 2,793.8 * Other intangible assets comprise future track access rights.
financial report
Asciano Limited136
For
per
sona
l use
onl
y

9 5 A S C I A N O L I M I T E D F I N A N C I A L R E P O R T F O R T H E Y E A R E N D E D 3 0 J U N E 2 0 1 4
21. Intangible assets (continued)
Indefinite useful life of brand name The Patrick brand is associated with businesses that currently operate within markets with high pecuniary, legislative and availability of resource barriers to entry. It is anticipated that there is no foreseeable limit to the period over which the brand name is expected to generate net cash inflows for Asciano, and as such has been regarded as an indefinite useful life intangible asset.
Allocation of goodwill to CGUs
2014
$M 2013
$M
PN Coal 524.0 524.0
PN Rail 350.0 350.0
Container Ports 1,497.5 1,497.5
General Stevedoring 107.1 84.8
Autocare 94.9 94.9
C3 Limited 51.9 51.9
Total goodwill 2,625.4 2,603.1
No goodwill is allocated to the Bulk Ports CGU. The assessment of the recoverable amounts of goodwill is based on value-in-use calculations undertaken at the CGU level. Value in use is calculated using a discounted cash flow methodology covering a 10 year period with a terminal value at the end of the period. The carrying amounts of goodwill in the CGUs were fully supported as at the reporting date. The following describes the key assumptions supporting the cash flow projections:
Cash flow forecasts Cash flow forecasts are based on the most recent 10 year financial projections and have been adjusted to exclude the costs and benefits of non-committed expansionary capital expenditure. The 10 year period is considered to be a more reliable and accurate prediction of the eventual cash flows than shorter term (five year) forecasts, due to the quantum of upfront investment, the length of time and capital expenditure required to bring the infrastructure assets into full production, the longevity of the infrastructure assets, the lack of available substitutes and the strategic importance of the various infrastructure business to the economy.
Growth rates Growth rates used in the financial projections are based on management’s expectations for future performance and do not normally exceed the long-term growth rate for the business in which each CGU operates. Average annual growth rates range between 3.6% and 9.6% per annum (2013: 0% and 10.9% per annum).
Terminal values Terminal values calculated after year 10 have been determined using the stable growth model, having regard to the weighted average cost of capital (“WACC”) and terminal growth factor of 2.75% (2013: 2.5%) per annum which is considered appropriate to the businesses in which each CGU operates.
Discount rates Discount rates used are the pre-tax WACC and include a premium for market risks appropriate to the relevant CGU. The WACCs range from 12.0% to 13.6% (2013: WACC of 12.5% for all CGUs) per annum.
Impact of possible changes in key assumptions The value-in-use calculations are sensitive to changes in the key assumptions used in the impairment testing. As such, a sensitivity analysis was undertaken by management to examine the effect of changes in key assumptions which would cause the carrying amount to exceed the recoverable amount for each CGU. Management is satisfied that any reasonably likely changes in the key assumptions would not cause the carrying value of each CGU to materially exceed its recoverable amount.
financial report
Annual report 2014137
For
per
sona
l use
onl
y

notes to and forming part of the financial statements Continued
9 6 A S C I A N O L I M I T E D F I N A N C I A L R E P O R T F O R T H E Y E A R E N D E D 3 0 J U N E 2 0 1 4
22. Trade and other payables
Note 2014
$M
RESTATED1
2013 $M
Current
Trade payables 152.8 129.5
Other payables and accrued expenses 311.6 264.1
464.4 393.6
Non-current
Defined benefit plan liability 29 120.8 119.0
Other payables and accrued expenses 15.3 13.3
136.1 132.3 1. The restatement relates to the adoption of the amended accounting standard AASB 119 Employee Benefits (2011), as outlined in note 1(f).
23. Loans and borrowings
2014
$M 2013
$M
Current
Finance lease liabilities 0.6 0.6
Non-current
Syndicated bank loan 650.0 810.0
US dollar bonds, net of discount 2,116.3 2,183.8
GBP bonds, net of discount 542.3 –
Unrealised fair value loss on US dollar bonds 76.8 88.5
Capitalised borrowing costs (16.6) (13.6)
Finance lease liabilities 1.2 1.6 3,370.0 3,070.3
On 19 September 2013, Asciano Finance Limited issued GBP 300.0 million of 5.0% Medium Term Notes due in September 2023 (“GBP bond issuance”) which are guaranteed by Asciano Limited and each subsidiary. On 20 September 2013, the proceeds from this GBP bond issuance were used to repay A$270.0 million of the syndicated term loan maturing in October 2014 and A$200.0 million of the syndicated term loan maturing in October 2016. As at 30 June 2014, all syndicated bank loans and US dollar bonds and GBP bonds were unsecured.
financial report
Asciano Limited138
For
per
sona
l use
onl
y

9 7 A S C I A N O L I M I T E D F I N A N C I A L R E P O R T F O R T H E Y E A R E N D E D 3 0 J U N E 2 0 1 4
23. Loans and borrowings (continued)
Bank facilities The following table provides details of the components of the bank facilities and cash:
2014 2013
$M Maturity Facility Utilised Facility Utilised
Syndicated revolving credit facility October 2016 650.0 650.0 650.0 160.0
Syndicated revolving credit facility October 2019 650.0 – 650.0 650.0
Less: cash and cash equivalents – (167.3) – (29.7)
Net bank debt 1,300.0 482.7 1,300.0 780.3
Working capital facilities October 2013 – – 150.0 83.6
Bank guarantee facility1 June 2016 150.0 73.7 – –
1,450.0 1,450.0
1. All drawings under the bank guarantee facility as at 30 June 2014 are in the form of performance bonds and bank guarantees. 2. Asciano pays interest on its bank facilities at a margin above the bank bill swap rate. As at 30 June 2014 Asciano’s bank debt was hedged to 31% (2013: 25%) by interest
rate swaps.
US dollar bonds The following table provides details of the components of the US dollar bonds:
2014 2013
$M Maturity US$ A$1 US$ A$
US dollar 5 year bonds September 2015 400.0 424.1 400.0 437.8
US dollar 7 year bonds April 2018 750.0 795.2 750.0 820.9
US dollar 10 year bonds September 2020 600.0 636.1 600.0 656.6
US dollar 12 year bonds April 2023 250.0 265.1 250.0 273.6
Discount on US dollar bonds (6.0) (4.2) (6.0) (5.1)
1,994.0 2,116.3 1,994.0 2,183.8
1. Australian dollar equivalent calculated at the spot rate on 30 June 2014.
The US dollar bonds maturing in 2015 and 2020 are hedged by cross-currency swaps, which were entered into at the time the bonds were priced, in order to convert US dollar fixed rate borrowings into Australian dollar fixed rate borrowings. The US dollar bonds maturing in 2018 and 2023 are hedged by cross-currency swaps, which were entered into at the time the bonds were priced, to convert US dollar fixed rate borrowings (in combination with redesignated interest rate swaps) into Australian dollar fixed rate and Australian dollar floating rate borrowings.
Sterling bonds The following table provides details of the components of the GBP bonds:
2014 2013
$M Maturity GB£ A$1 GB£ A$
GBP 10 year bonds September 2023 300.0 544.0 – –
Discount on GBP bonds (1.1) (1.7) – –
298.9 542.3 – –
1. Australian dollar equivalent calculated at the spot rate on 30 June 2014.
The GBP bonds maturing in 2023 are hedged by cross-currency swaps, which were entered into on 19 September 2013 to convert GBP fixed rate borrowings into Australian dollar fixed rate borrowings. As at 30 June 2014, Asciano had fixed the interest rates in respect of 77% of the US bonds (2013: 77%) and fully hedged its currency exposure (30 June 2013: 100%). As at 30 June 2014, Asciano had fixed 100% of the interest rates on GBP bonds and fully hedged its currency exposure. Details of exposure to risks from current and non-current borrowings are set out in note 3.
financial report
Annual report 2014139
For
per
sona
l use
onl
y

notes to and forming part of the financial statements Continued
9 8 A S C I A N O L I M I T E D F I N A N C I A L R E P O R T F O R T H E Y E A R E N D E D 3 0 J U N E 2 0 1 4
24. Derivative financial liabilities
2014
$M 2013
$M
Current
Forward exchange contracts 6.0 –
Interest rate swaps 3.6 0.9
Cross-currency swaps 51.8 28.2 61.4 29.1
Non-current
Forward exchange contracts 1.3 –
Interest rate swaps 2.0 –
Cross-currency swaps 54.5 19.3 57.8 19.3
25. Provisions and employee benefits
Current
Workers compensation 5.0 8.0
Restructuring 43.2 4.1
Incident 15.2 20.3
Travel passes 1.5 2.4
Site restoration 4.0 4.0
Other 5.5 4.9
Balance before employee benefits 74.4 43.7
Long service leave 90.7 85.5
Annual leave 92.2 90.0
Other employee entitlements 18.9 16.6
276.2 235.8
Non-current
Workers compensation 23.1 24.9
Restructuring 1.3 13.0
Travel passes 33.8 32.9
Site restoration 5.7 5.7
Other 1.5 –
Balance before employee benefits 65.4 76.5
Long service leave 17.7 16.6
83.1 93.1
financial report
Asciano Limited140
For
per
sona
l use
onl
y

9 9 A S C I A N O L I M I T E D F I N A N C I A L R E P O R T F O R T H E Y E A R E N D E D 3 0 J U N E 2 0 1 4
25. Provisions and employee benefits (continued)
Movements in non-employee provisions
2014 $M
Workers compensation Restructuring Incident
Travel passes
Site restoration Other Total
Opening balance 32.9 17.1 20.3 35.3 9.7 4.9 120.2
Made 8.3 60.1 5.1 0.8 – 9.0 83.3
Utilised (13.8) (32.7) (8.6) (2.2) – (5.4) (62.7)
Reversed – – (1.6) – – (1.5) (3.1)
Discount unwind 0.7 – – 1.4 – – 2.1
Closing balance 28.1 44.5 15.2 35.3 9.7 7.0 139.8
Represented by:
Current 5.0 43.2 15.2 1.5 4.0 5.5 74.4
Non-current 23.1 1.3 – 33.8 5.7 1.5 65.4
28.1 44.5 15.2 35.3 9.7 7.0 139.8
Workers compensation provision Workers compensation relates to Pacific National (NSW) Pty Limited, which is a licensed self-insurer for workers compensation claims made under the Workers Compensation Act 1987 (NSW) and the Workplace Injury Management and Workers Compensation Act 1998 (NSW). Asciano Services Pty Limited is also self-insured under the Safety, Rehabilitation and Compensation Act 1988 (Cth). As a condition of the licences, Asciano maintains an “excess of loss” (workers compensation) insurance policy for each licence for any one event exceeding $1 million (indexed). A provision is maintained to cover claims made or likely to be made by employees up to $1 million for any one event. The provision is made in accordance with an independent actuarial assessment of the liability for workers compensation claims conducted by McMahon Actuarial Services Pty Limited.
Restructuring provision The restructuring provision represents the estimated cost of the termination payments to be made to employees impacted by the restructuring commenced during the year or in association with the redevelopment of Port Botany. The expenditure is expected to be incurred in the next six months with the exception of approximately $23.2 million which will be paid out on completion of the automation cutover at Port Botany.
Incident provision The incident provision is the expected cost of claims relating to train and other incidents. The timing of this expenditure is expected to be within the next year.
Travel passes provision The travel passes provision relates to the cost of retiree rail travel passes and is based on an independent actuarial assessment conducted by ABS (PL) Pty Limited. Retiree rail travel passes relate to retired ex-employees of FreightCorp (the business acquired by an Asciano subsidiary in 2002) who held a life-long travel pass and ex-employees of FreightCorp who became employees of Pacific National who were expected to become entitled to a retiree pass on exiting the business. Timing of the expenditure is dependent upon the age of the passholder, length of service, expected exit date and life expectancy.
Site restoration provision The site restoration provision is an estimate of environmental costs to be incurred in the future. A provision for site restoration in respect of contaminated land and the related expense are recognised when the need is identified. The provision is the best estimate of the present value of the expenditure required to settle the site restoration obligation at the reporting date, based on current legal requirements and technology.
Other provisions Other provisions include, for example, the decommissioning provision and legal provisions. Legal provisions represent an estimate of the cost of defending and/or settling any claims against Asciano. Timing of expenditure varies on a case-by-case basis.
financial report
Annual report 2014141
For
per
sona
l use
onl
y

notes to and forming part of the financial statements Continued
1 0 0 A S C I A N O L I M I T E D F I N A N C I A L R E P O R T F O R T H E Y E A R E N D E D 3 0 J U N E 2 0 1 4
26. Contributed equity There is no “par value” for ordinary shares. The holders of ordinary shares are entitled to receive dividends as declared from time to time, and are entitled to one vote per share at meetings of the Company.
Movement in number of issued shares
2014 Date
Price per share
$
Number of fully paid ordinary
shares $M
Parent
Balance at 1 July 2013 975,385,664 8,606.1
Treasury shares acquired (4.7)
Treasury shares allocated 7.9
Balance 30 June 2014 975,385,664 8,609.3
2013
Balance at 1 July 2012 975,385,664 8,604.7
Treasury shares allocated 1.4
Balance 30 June 2013 975,385,664 8,606.1
Treasury shares consist of shares held in trust for Asciano employees in relation to equity compensation plans. These shares will transfer to the participating executives on satisfaction of the relevant time and/or performance-based conditions. At 30 June 2014 210,136 (2013: 920,648) shares were held in trust and classified as treasury shares.
Distribution Reinvestment Plan The Distribution Reinvestment Plan (“DRP”) was announced in May 2008 and allows shareholders to reinvest all or part of their dividends in additional shares. The DRP was not activated during either of the 2014 or 2013 financial years.
financial report
Asciano Limited142
For
per
sona
l use
onl
y

1 0 1 A S C I A N O L I M I T E D F I N A N C I A L R E P O R T F O R T H E Y E A R E N D E D 3 0 J U N E 2 0 1 4
27. Reserves Movement in reserves
2014
Common control
$M Translation
$M Hedge
$M
Employee equity
benefits $M
Corporatisation $M
Profit $M
Total $M
Opening balance (4,911.2) 1.0 (36.3) 10.2 9.3 223.5 (4,703.5)
Other comprehensive income – 0.6 (50.4) – – – (49.8)
Profits transferred from retained earnings – – – – –
144.2 144.2
Dividends paid – – – – – (117.0) (117.0)
Employee equity benefits – – – 4.9 – – 4.9
Closing balance (4,911.2) 1.6 (86.7) 15.1 9.3 250.7 (4,721.2)
2013
Opening balance (4,911.2) (1.1) (68.0) 7.3 9.3 68.8 (4,894.9)
Other comprehensive income – 2.1 31.7 – – – 33.8
Profits transferred from retained earnings – – – – –
244.9 244.9
Dividends paid – – – – – (90.2) (90.2)
Employee equity benefits – – – 2.9 – – 2.9
Closing balance (4,911.2) 1.0 (36.3) 10.2 9.3 223.5 (4,703.5)
Common control reserve As a result of combinations of entities under common control, an equity account was created as a component of equity, called the common control reserve. The balance of the account represents the excess of the fair value of Asciano shares as traded on 15 June 2007 over the initial carrying value of the Patrick, Pacific National and Toll Ports businesses transferred from Toll to Asciano at the time of the demerger.
Translation reserve The translation reserve comprises all foreign currency differences arising from the translation of liabilities that hedge the net investment loans in foreign operations.
Hedge reserve The hedge reserve comprises the effective portion of the cumulative net change in the fair value of cash flow hedging instruments, net of tax, related to hedged transactions that have not yet occurred.
Employee equity benefits reserve The employee equity benefits reserve is used to record the value of share-based payments provided to employees, including KMP, as part of their remuneration. The current balance relates to unexercised options issued to senior executives under the Asciano Options and Rights Plan (“Option Plan”). The initial fair value attributed to the options at grant date is recognised on a straight line basis over the vesting period. This reserve will be reversed against contributed equity if the underlying options are exercised and result in shares being issued. Refer to note 34(a) for further details of the Option Plan. The treasury share reserve, also part of the employee equity benefits reserve, is used to record the value of the rights issued under the Asciano Options and Rights Plan share-based payments which are provided to employees, including KMP, as part of their remuneration. The initial fair value attributed to the Rights Plans is recognised on a straight line basis over the vesting period. Refer to notes 34(b) to 34(c) for further details of the Rights Plans.
Corporatisation reserve The Trust became a member of the Asciano tax consolidated group on corporatisation. The corporatisation reserve relates to deferred tax amounts which have been recognised on entry by the Trust to the Asciano tax consolidated group.
Profit reserve The profit reserve was established to record profits from which franked dividends can be paid.
financial report
Annual report 2014143
For
per
sona
l use
onl
y

notes to and forming part of the financial statements Continued
1 0 2 A S C I A N O L I M I T E D F I N A N C I A L R E P O R T F O R T H E Y E A R E N D E D 3 0 J U N E 2 0 1 4
28. Accumulated losses
2014
$M
RESTATED1 2013
$M
Opening balance (295.1) (388.4) Profit after tax attributable to owners of Asciano Limited 254.4 334.4 Other comprehensive income (4.4) 4.0
Profits transferred to profit reserve (144.2) (244.9)
Dividends – (0.2)
Closing balance (189.3) (295.1) 1. The restatement relates to the adoption of the amended accounting standard AASB 119 Employee Benefits (2011), as outlined in note 1(f).
Total
–
12.5
29. Superannuation Defined contribution funds Asciano contributes to a number of defined contribution funds on behalf of employees. Under current legislation, employees are able to choose the fund into which these contributions are made, and Asciano pays contributions into the various funds in accordance with the employees' instructions. Contributions made to the funds were $48.9 million (2013: $42.5 million).
Victorian State Superannuation Fund Asciano also contributes on behalf of certain employees to defined benefit schemes that are part of the Victorian State Superannuation Fund (“VSSF”). Certain employees of V/Line Freight Corporation, which was acquired by Freight Victoria Limited (subsequently renamed Pacific National (Victoria) Limited) on 1 May 1999, elected to continue their membership of the defined benefit schemes at acquisition. Membership of the defined benefit schemes had been closed to new members prior to 1 May 1999. As at 30 June 2014, there were 34 (2013: 34) employees still in the defined benefit schemes. The State Government of Victoria retains liability for investment risk in the VSSF while Asciano’s exposure is in relation to future contribution rates only. Contribution rates may increase above current rates where the level of salary and wage increases exceeds that assumed by the actuary. The level of contributions in respect of these funds is determined by the VSSF’s board based on advice from the actuary. For accounting purposes, the State Government of Victoria recognises the unfunded superannuation liability in respect of the Emergency Services Superannuation Scheme (“ESSS”) (of which the VSSF is a sub scheme) in its financial statements. David Knox (BA, PhD, FIA, FIAA), the actuary who prepares the AASB 119 Employee Benefits liabilities for the State Government of Victoria, has advised that given the nature of the ESSS, the State Government of Victoria’s commitment to the ESSS, the pooling of risk and the difficulties in reliably allocating the benefit liabilities and assets between entities, it is appropriate for Asciano to use the defined contribution reporting approach available under the multi employer fund provisions of AASB 119. This approach is also consistent with the treatment of Asciano's contribution in the calculation of the State Government of Victoria's balances.
Stevedoring Employees Retirement Fund Asciano also contributes on behalf of certain employees into the Stevedoring Employees Retirement Fund (“SERF”). The SERF is a superannuation fund that, in addition to providing defined contribution benefits to some categories of members, provides other members with defined benefits. There were 35 (2013: 36) employees in the defined benefit fund and 1,926 (2013: 2,131) employees in the defined contribution fund as at 30 June 2014. The SERF is a multi employer industry based superannuation fund. There is no basis that could be used to definitively apportion the benefits, assets and costs associated with the SERF between the various full participating employers. The SERF’s actuary advised that the surplus in the fund continues to be $nil at 30 June 2014, primarily as a result of the performance of equity markets during the period. The actuary used a net of tax discount rate of 5.8% (2013: 5.8%) per annum and an assumed wage escalation rate of 4.0% (2013: 4.0%) per annum. Asciano has made normal contributions to the fund in 2014 at the request of the fund trustee.
Defined benefit funds Asciano is a sponsor of a number of pooled defined benefit funds relating to employees it took over from closed New South Wales public sector entities. The funds include the State Superannuation Scheme (“SSS”), the State Authorities Superannuation Scheme (“SASS”) and the State Authorities Non-Contributory Superannuation Scheme (“SANCS”). These schemes are all defined benefit schemes and at least one component of the final benefit is derived from a multiple of member salary and years of membership. There were 443 (2013: 482) employees and former employees in these defined benefit funds as at 30 June 2014.
financial report
Asciano Limited144
For
per
sona
l use
onl
y
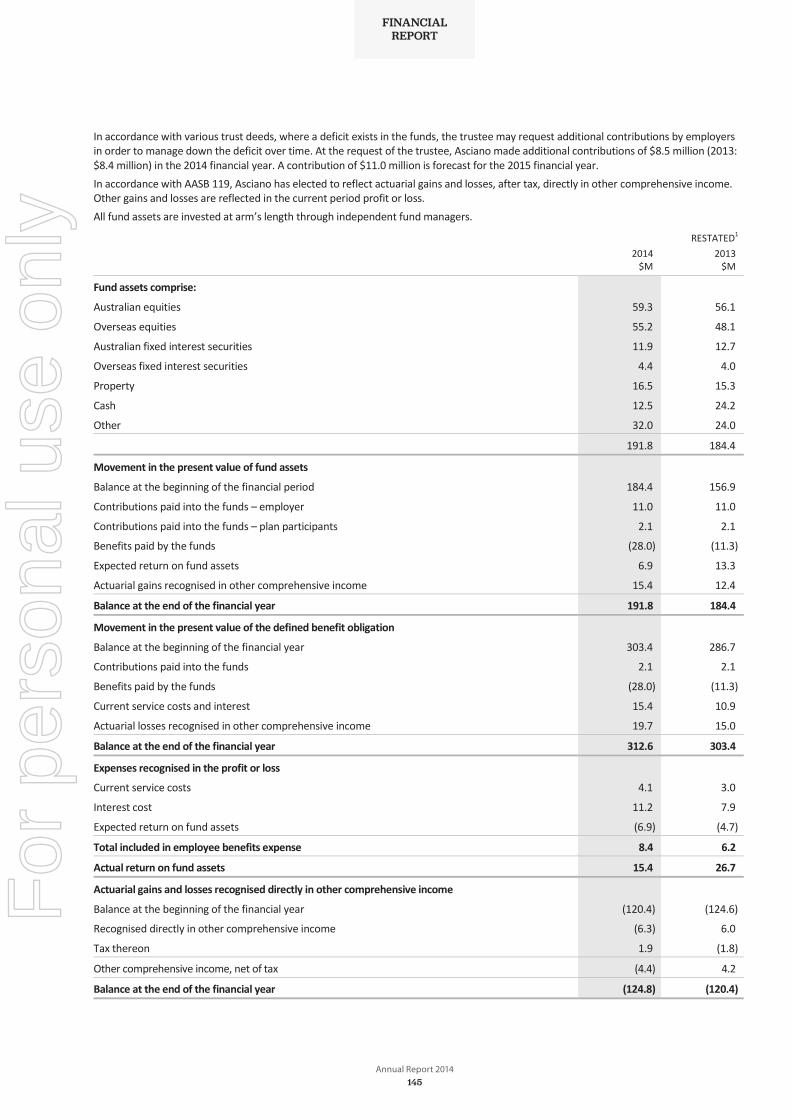
1 0 3 A S C I A N O L I M I T E D F I N A N C I A L R E P O R T F O R T H E Y E A R E N D E D 3 0 J U N E 2 0 1 4
29. Superannuation (continued)
In accordance with various trust deeds, where a deficit exists in the funds, the trustee may request additional contributions by employers in order to manage down the deficit over time. At the request of the trustee, Asciano made additional contributions of $8.5 million (2013: $8.4 million) in the 2014 financial year. A contribution of $11.0 million is forecast for the 2015 financial year. In accordance with AASB 119, Asciano has elected to reflect actuarial gains and losses, after tax, directly in other comprehensive income. Other gains and losses are reflected in the current period profit or loss. All fund assets are invested at arm’s length through independent fund managers.
2014
$M
RESTATED1
2013 $M
Fund assets comprise:
Australian equities 59.3 56.1
Overseas equities 55.2 48.1
Australian fixed interest securities 11.9 12.7
Overseas fixed interest securities 4.4 4.0
Property 16.5 15.3
Cash 12.5 24.2
Other 32.0 24.0
191.8 184.4
Movement in the present value of fund assets
Balance at the beginning of the financial period 184.4 156.9
Contributions paid into the funds – employer 11.0 11.0
Contributions paid into the funds – plan participants 2.1 2.1
Benefits paid by the funds (28.0) (11.3)
Expected return on fund assets 6.9 13.3
Actuarial gains recognised in other comprehensive income 15.4 12.4
Balance at the end of the financial year 191.8 184.4
Movement in the present value of the defined benefit obligation
Balance at the beginning of the financial year 303.4 286.7
Contributions paid into the funds 2.1 2.1
Benefits paid by the funds (28.0) (11.3)
Current service costs and interest 15.4 10.9
Actuarial losses recognised in other comprehensive income 19.7 15.0
Balance at the end of the financial year 312.6 303.4
Expenses recognised in the profit or loss
Current service costs 4.1 3.0
Interest cost 11.2 7.9
Expected return on fund assets (6.9) (4.7)
Total included in employee benefits expense 8.4 6.2
Actual return on fund assets 15.4 26.7
Actuarial gains and losses recognised directly in other comprehensive income
Balance at the beginning of the financial year (120.4) (124.6)
Recognised directly in other comprehensive income (6.3) 6.0 Tax thereon 1.9 (1.8) Other comprehensive income, net of tax (4.4) 4.2
Balance at the end of the financial year (124.8) (120.4)
Total
–
12.5
financial report
Annual report 2014145
For
per
sona
l use
onl
y

notes to and forming part of the financial statements Continued
1 0 4 A S C I A N O L I M I T E D F I N A N C I A L R E P O R T F O R T H E Y E A R E N D E D 3 0 J U N E 2 0 1 4
29. Superannuation (continued)
2014 % pa
2013 % pa
Actuarial assumptions
Discount rate 3.6 3.8
Future salary increases 4.0 4.0
Rate of Consumer Price Index (“CPI”) increase 2.5 2.5
Expected rate of return on assets 8.3 8.6
Pensioner mortality as per the 2012 Actuarial Investigation of the Pooled Fund – –
The sensitivity of the defined benefit obligation to changes in the significant assumptions is:
Impact on defined benefit obligation Change in
assumptions Increase in
assumption Decrease in assumption
Actuarial assumptions
Discount rate 1.0% (29.4) 36.1 Future salary increases 0.5% 9.4 (8.9) Rate of Consumer Price Index (“CPI”) increase 0.5% 7.0 (6.4) Pensioner mortality 5.0% (1.2) 1.2
Comparative information has not been provided for the sensitivity analysis as permitted by the transitional provisions of the revised standard. The above sensitivity analyses are based on a change in an assumption while holding all other assumptions constant. In practice, this is unlikely to occur, and changes in some of the assumptions may be correlated. When calculating the sensitivity of the defined benefit obligation to significant actuarial assumptions the same method (present value of the defined benefit obligation calculated with the projected unit credit method at the end of the reporting period) has been applied as when calculating the defined benefit liability recognised in the statement of financial position.
financial report
Asciano Limited146
For
per
sona
l use
onl
y

1 0 5 A S C I A N O L I M I T E D F I N A N C I A L R E P O R T F O R T H E Y E A R E N D E D 3 0 J U N E 2 0 1 4
29. Superannuation (continued)
Employer contributions Employer contributions to the funds are based on recommendations by the funds’ actuaries. Actuarial assessments are made on an annual basis and the last such assessment was conducted as at 30 June 2014.
Historical information
2014 SSS $M
SASS $M
SANCS $M
Total $M
Defined benefit obligation (3.2) (281.8) (27.6) (312.6)
Fund assets 5.9 164.5 21.4 191.8
Net surplus/(deficit) 2.7 (117.3) (6.2) (120.8)
Experience adjustments – fund liabilities 0.6 (14.0) (0.9) (14.3)
Experience adjustments – fund assets – – – –
20131
Defined benefit obligation (3.3) (272.2) (27.9) (303.4)
Fund assets 5.3 158.7 20.4 184.4
Net surplus/(deficit) 2.0 (113.5) (7.5) (119.0)
Experience adjustments – fund liabilities 0.5 (15.1) (0.4) (15.0)
Experience adjustments – fund assets 0.6 18.1 2.3 21.0
2012
Defined benefit obligation (3.8) (256.5) (26.4) (286.7)
Fund assets 4.6 136.5 15.8 156.9
Net surplus/(deficit) 0.8 (120.0) (10.6) (129.8)
Experience adjustments – fund liabilities 1.2 28.2 3.3 32.7
Experience adjustments – fund assets 0.4 13.5 1.4 15.3
2011
Defined benefit obligation (2.5) (210.4) (21.9) (234.8)
Fund assets 4.6 145.0 16.4 166.0
Net surplus/(deficit) 2.1 (65.4) (5.5) (68.8)
Experience adjustments – fund liabilities – 5.5 0.4 5.9
Experience adjustments – fund assets – 2.4 – 2.4
2010
Defined benefit obligation (2.5) (204.1) (20.7) (227.3)
Fund assets 4.3 141.4 14.4 160.1
Net surplus/(deficit) 1.8 (62.7) (6.3) (67.2)
Experience adjustments – fund liabilities 0.1 10.3 1.0 11.4
Experience adjustments – fund assets – 2.7 – 2.7 1. The restatement relates to the adoption of the amended accounting standard AASB 119 Employee Benefits (2011), as outlined in note 1(f).
financial report
Annual report 2014147
For
per
sona
l use
onl
y

notes to and forming part of the financial statements Continued
1 0 6 A S C I A N O L I M I T E D F I N A N C I A L R E P O R T F O R T H E Y E A R E N D E D 3 0 J U N E 2 0 1 4
30. Operating and finance leases
2014
$M 2013
$M
Non-cancellable operating lease rentals are payable as follows:
Within one year 124.1 116.2
One year or later and no later than five years 343.4 343.2
Later than five years 842.7 685.5 1,310.2 1,144.9
Asciano leases property under non-cancellable operating leases expiring between two and 45 years. Lease payments comprise a base amount plus an incremental contingent rental (if required). Contingent rentals are based on either movements in the CPI or operating criteria.
2014
$M 2013
$M
Non-cancellable finance lease rentals are payable as follows:
Within one year 0.6 0.6
One year or later and no later than five years 1.2 1.6 1.8 2.2
31. Capital and other commitments
Plant and equipment
Contracted capital expenditure committed but not yet payable:
Within one year 305.0 291.7
One year or later and no later than five years 161.7 137.4
Later than five years 9.3 2.4
476.0 431.5
Maintenance commitments
Non-cancellable maintenance contracts committed but not yet payable:
Within one year 19.7 10.6
One year or later and no later than five years 30.6 31.4
Later than five years – 12.4
50.3 54.4
Other commitments
Non-cancellable other contracts committed but not yet payable:
Within one year 24.9 33.3
One year or later and no later than five years 0.5 4.3
25.4 37.6
Total
–
12.5
financial report
Asciano Limited148
For
per
sona
l use
onl
y

1 0 7 A S C I A N O L I M I T E D F I N A N C I A L R E P O R T F O R T H E Y E A R E N D E D 3 0 J U N E 2 0 1 4
32. Contingencies Litigation From time to time, Asciano is subject to claims and litigation during the normal course of business. The Board has given consideration to such matters, which are or may be subject to litigation at year end and, subject to specific provisions raised, is of the opinion that no material liability exists.
Environmental liabilities Asciano provides for all known environmental liabilities. While the Board believes that its provisions for environmental rehabilitation are adequate, there can be no assurance that material new provisions will not be required as a result of new information or regulatory requirements with respect to known sites or identification of new remedial obligations at other sites.
33. Related parties (a) KMP Details on the remuneration paid to the Non-Executive Directors, the Executive Director and those other executives who at any point during the financial year had authority and responsibility for planning, directing and controlling the activities of Asciano are provided under section 7 of the Directors’ report.
KMP remuneration
2014 $000
2013 $000
Remuneration elements
Short-term employee benefits 8,195 7,880 Post-employment benefits 121 93
Other long-term employee benefits 153 140
Share-based payments 2,549 2,797
Total remuneration 11,018 10,910
– 9,997
(b) Significant subsidiaries All significant operating subsidiaries listed below were incorporated in Australia, except C3 Limited which is incorporated in New Zealand and are 100% owned, except Patrick Autocare Pty Limited which is 80% owned. Asciano Finance Limited Asciano Services Pty Limited Pacific National (NSW) Pty Limited Pacific National (QLD) Pty Limited Pacific National (Queensland Coal) Pty Limited Patrick Autocare Pty Limited Patrick Container Ports Pty Limited Patrick Ports Pty Limited Patrick Stevedores Holdings Pty Limited Patrick Stevedores Operations Pty Limited Patrick Stevedores Operations No 2 Pty Limited Patrick Stevedoring Pty Limited Plzen Pty Limited PSL Services Pty Limited C3 Limited Mountain Industries Pty Ltd MTN Industries Pty Ltd
financial report
Annual report 2014149
For
per
sona
l use
onl
y

notes to and forming part of the financial statements Continued
1 0 8 A S C I A N O L I M I T E D F I N A N C I A L R E P O R T F O R T H E Y E A R E N D E D 3 0 J U N E 2 0 1 4
33. Related parties (continued)
(c) Transactions with related parties
2014
$M 2013
$M
Transactions with joint ventures
Sales revenue 4.8 1.8
Purchases/services received 49.8 42.5
Dividend revenue 12.2 18.6
Interest revenue 0.2 –
Total remuneration
– 9,997
Balances of loans with joint ventures are disclosed in note 14. As at 30 June 2014 there are $2.7 million of interest bearing loans to joint ventures (2013: $nil).
(d) Terms and conditions Transactions relating to dividends were on the same terms and conditions that applied to other shareholders. All other transactions were made on normal commercial terms and conditions and at market rates, except that there are no fixed terms for the repayment of loans between the parties.
financial report
Asciano Limited150
For
per
sona
l use
onl
y

1 0 9 A S C I A N O L I M I T E D F I N A N C I A L R E P O R T F O R T H E Y E A R E N D E D 3 0 J U N E 2 0 1 4
34. Share-based payments (a) Asciano Options and Rights Plan The Option Plan was established to provide LTIs for executives and selected employees. Under the Option Plan, participants are granted options that only vest if certain time-based and performance-based vesting conditions are met. Participation in the Option Plan is at the Board’s discretion and no individual has a contractual right to participate in the Option Plan or to receive any guaranteed benefits. The number of options granted to executives and selected employees are based upon their target LTI. This target LTI is determined based upon the executive’s or employee’s level of seniority and contribution to the profitability of Asciano. The options vest over a three to four year period and are subject to Asciano’s relative TSR performance against companies in the S&P/ASX 100 Index (excluding resources and financial companies). The options also have an additional, inherent, performance hurdle, being that the share price at vesting date must be above the exercise price. The options are equity-settled. Vested options can be exercised to acquire shares in the Company, subject to paying an exercise price. The acquired shares are subject to a holding lock for a maximum period of seven years from the date the options were granted. Once the holding lock has lifted, the shares can be sold at any time subject to compliance with the Asciano Share Trading Policy. Options granted under the Option Plan are for no consideration and carry no dividend or voting rights. No options were granted during the 2014 financial year as the Company now uses a Rights plan for its LTI plan.
Set out below are the key terms of options granted under the Option Plan:
Grant date Tranche
Expiry date
Exercise price
$
Fair value of grant
$ Opening balance Granted Exercised Lapsed
Closing balance
2014
08/10/09 A 30/06/14 4.56 1.59 777,796 – (719,938) (57,858) –
08/10/09 B 30/06/14 4.56 1.53 259,251 – (155,551) (103,700) –
15/07/10 B 30/06/15 5.01 1.02 1,067,635 – (172,687) – 894,948
17/12/10 B 30/06/15 5.01 0.96 482,640 – (178,750) – 303,890
10/11/11 B 30/06/15 5.04 0.54 516,186 – – – 516,186
3,103,508 – (1,226,926) (161,558) 1,715,024
2013
23/09/08 A 30/06/13 12.72 2.73 519,552 – – (519,552) –
08/10/09 A 30/06/14 4.56 1.59 932,053 – (47,873) (106,384) 777,796
08/10/09 B 30/06/14 4.56 1.53 310,677 – – (51,426) 259,251
15/07/10 B 30/06/15 5.01 1.02 1,277,498 – – (209,863) 1,067,635
17/12/10 B 30/06/15 5.01 0.96 482,640 – – – 482,640
10/11/11 B 30/06/15 5.04 0.54 516,186 – – – 516,186
4,038,606 – (47,873) (887,225) 3,103,508
Tranche A refers to the options subject to EBIT growth per share and Tranche B refers to the options subject to the relative TSR hurdle. Tranche A options have been valued using the Binomial model and their value is exclusive of performance hurdles. Tranche B options have been valued using a Monte Carlo simulation that takes into account the relative TSR hurdle.
financial report
Annual report 2014151
For
per
sona
l use
onl
y

notes to and forming part of the financial statements Continued
1 1 0 A S C I A N O L I M I T E D F I N A N C I A L R E P O R T F O R T H E Y E A R E N D E D 3 0 J U N E 2 0 1 4
34. Share-based payments (continued)
The options granted during the 2011 financial year and subject to the TSR performance hurdle were tested on 1 July 2013 and 52% vested. These options were retested on 1 July 2014 and an additional 10% vested. The remaining contractual life of the options outstanding at the end of the year is one year. The model inputs used in determining the fair value of options granted in the 2012 financial year under the Option Plan are provided below:
Grant date Performance
hurdle Expiry
date
Exercise price
$
Fair value
$
Share price at
grant date $
Expected price
volatility %
Expected dividend
yield %
Risk-free rate
%
10 November 2011 TSR 30 June 2015 5.04 0.54 4.47 25 1.7 3.4
The model inputs used in determining the fair value of options granted in the 2011 financial year under the Option Plan are provided below:
Grant date Performance
hurdle Expiry
date
Exercise price
$
Fair value
$
Share price at
grant date $
Expected price
volatility %
Expected dividend
yield %
Risk-free rate
%
15 July 2010 TSR 30 June 2015 5.01 1.02 5.10 25 2.7 4.65
27 October 2010 TSR 30 June 2015 5.01 0.87 4.71 25 1.3 4.94
17 December 2010 TSR 30 June 2015 5.01 0.96 4.80 25 1.3 5.24
Reconciliation of outstanding share options The number and weighted average exercise prices of share options under the Asciano Option Plan are as follows:
Number of options in thousands
2014
Weighted average exercise
price 2014
Number of options
in thousands 2013
Weighted average
exercise price 2013
In thousands of options
Outstanding at 1 July 3,104 4.86 4,039 5.87
Forfeited during the year (58) 4.56 (367) 4.82
Exercised during the year (1,227) 5.07 (48) 4.56
Expired during the year (104) 4.56 (520) 12.72
Granted during the year – – – –
Outstanding at 30 June 1,715 5.02 3,104 4.86
Exercisable at 30 June 729 5.02 778 4.56
The options outstanding as at 30 June 2014 have an exercise price of $5.02 (2013: $4.56 and $5.04) and a contractual life of one year.
(b) Asciano Short Term Incentive (STI) Plan Under Asciano’s STI Plan, certain participating employees receive 75% of the annual STI achieved in cash and 25% in the form of STI rights to shares of Asciano. Of the STI rights allocated on 3 October 2012, for the 2012 financial year, half vested on 1 September 2013 and the other half will vest on 1 September 2014. The rights automatically convert into one ordinary share each on vesting at an exercise price of nil. The participating employees do not receive any dividends and are not entitled to vote in relation to the deferred shares during the vesting period. If the participating employee ceases to be employed by the Asciano Group within this period, the rights will be forfeited, except in limited circumstances that are approved by the Board on a case-by-case basis. The shares are acquired on market as required, and prior to each vesting date, and are held as treasury shares until such time as they are vested. Forfeited shares are reallocated in subsequent grants.
financial report
Asciano Limited152
For
per
sona
l use
onl
y

1 1 1 A S C I A N O L I M I T E D F I N A N C I A L R E P O R T F O R T H E Y E A R E N D E D 3 0 J U N E 2 0 1 4
34. Share-based payments (continued)
Set out below are the key terms of the STI rights granted under the STI Plan. STI rights granted during the 2013 financial year in respect of the 2012 financial year
Time based condition
Grant date Vesting
date
Risk-free interest rate
%
Share price at grant date
$
Expected price
volatility %
Expected dividend
yield %
Fair value $
Number of STI rights
3 October 2012 1 September 2014 2.38 4.45 25 2.2 4.27 211,916
4,979,493
(1,457,073)
STI rights granted during the 2014 financial year in respect of the 2013 financial year
Time based condition
Grant date Vesting
date
Risk-free interest rate
%
Share price at grant date
$
Expected price
volatility %
Expected dividend
yield %
Fair value $
Number of STI rights
20 August 2013 1 September 2014 2.39 5.23 25 2.3 5.11 91,932
20 August 2013 1 September 2015 2.56 5.23 25 2.3 4.99 91,931
3 October 2013 1 September 2014 2.45 5.87 25 2.6 5.73 185,034
3 October 2013 1 September 2015 2.62 5.87 25 2.6 5.58 185,003
4,979,493
(1,457,073)
The number of rights to be granted is determined based on the dollar value of the achieved STI divided by the weighted average price at which the Company’s shares are traded on the ASX during the week up to and including the date of the grant. The fair value of the rights at grant date was estimated based on market price of the Company’s shares on that date, with downward adjustment to take into account the present value of dividends that will not be received by executives on their rights during the two year vesting period. As at 30 June 2014, the balance of the STI rights was 602,872 following the issue of 553,900 STI rights, vesting of 338,586 STI rights and the forfeiture of 5,410 STI rights. For the year ended 30 June 2014, management has included an estimated expense of $1.1 million for STI rights in respect of the 2014 financial year which will be allocated during the 2015 financial year.
(c) Asciano LTI Plan The Asciano LTI Plan was established to provide LTIs for executives and selected employees. Under the LTI Plan, participants are granted rights that only vest if certain time-based and performance-based vesting conditions are met. Participation in the LTI Plan is at the Board’s discretion and no individual has a contractual right to participate in the LTI Plan or to receive any guaranteed benefits. The number of rights granted to executives is based upon their target LTI. This target LTI is determined based upon the executive’s level of seniority and contribution to the profitability of Asciano.
financial report
Annual report 2014153
For
per
sona
l use
onl
y

notes to and forming part of the financial statements Continued
1 1 2 A S C I A N O L I M I T E D F I N A N C I A L R E P O R T F O R T H E Y E A R E N D E D 3 0 J U N E 2 0 1 4
34. Share-based payments (continued)
The rights vest over a three year period and are subject to two equally weighted performance hurdles, being Asciano’s relative TSR performance against companies in the S&P/ASX 100 Index (excluding resources and financial companies) and the ROCE hurdle. The rights also have an additional, inherent, performance hurdle, being that the share price at vesting date must be above the exercise price. The rights are equity-settled.
Non-market
performance condition Market performance
condition
Grant date Vesting date
Risk-free interest
rate %
Share price at grant date
$
Expected price
volatility %
Expected dividend
yield %
Fair value
$
Number of rights to
shares
Fair value
$
Number of rights to
shares
18 February 2014 30 June 2016 3.00-3.04 5.74 25 2.6 5.39 4,351 3.90 4,351
12 November 2013 30 June 2016 3.00-3.04 5.81 25 2.6 5.42 236,674 3.97 236,674
20 August 2013 30 June 2016 2.75-2.79 5.23 25 2.3 4.90 303,287 3.36 303,293
9 January 2013 30 June 2015 2.60 4.74 25 2.2 4.47 13,394 3.01 13,394
15 November 2012 30 June 2015 2.57 4.18 25 2.2 3.95 257,768 2.08 257,767
3 November 2012 30 June 2015 2.60 4.51 25 2.2 4.25 40,434 2.87 40,434
3 October 2012 30 June 2015 2.33 4.45 25 2.2 4.19 254,902 2.50 254,902
16 January 2012 30 June 2014 4.87 4.62 25 1.3 4.44 173,780 3.00 173,777
29 August 2011 30 June 2014 3.82 4.53 25 1.7 4.32 9,227 2.94 9,226
10 November 2011 30 June 2014 3.41 4.47 25 1.7 4.26 224,072 2.88 224,072
18 April 2012 30 June 2014 3.23 4.75 25 2.4 4.51 21,432 2.90 21,431
The Non-market performance condition tranche refers to the rights subject to the ROCE hurdle and the Market performance condition tranche refers to the rights subject to the relative TSR hurdle. The rights subject to the ROCE hurdle have been valued using the Binomial model and their value is exclusive of market performance hurdles while the rights subject to the TSR hurdle have been valued using a Monte Carlo simulation that takes into account the relative TSR hurdle.
(d) Expenses arising from share-based payment transactions Total expenses arising from share-based payment transactions recognised during the financial year as part of employee benefits expense were as follows:
2014
$M 2013
$M
Options and rights issued under the Asciano Options and Rights Plan 4.9 6.4
35. Events subsequent to the reporting date On 21 August 2014, Asciano announced a number of changes to its executive team. The current Director of the Group’s Ports and Stevedoring business, Philip Tonks, will be moving into a Group-wide role to support the Group’s focus on growth opportunities. As a result, Murray Vitlich, who has been with the business since January 2012 in the role of Director Strategy and Business Development, will be appointed to the role of Director Bulk Automotive and Ports Services. Saul Cannon, who has been with the Group for over seven years and currently holds the role of Group General Counsel and Company Secretary, will move into the role of Director Strategy and Business Development. Ms Lyndall Stoyles, who is currently the Senior Legal Counsel for the Group’s Patrick Terminals and Logistics business, will replace Mr Cannon in the role of Group General Counsel and Company Secretary. In addition to these changes, we will be integrating the leadership of our Human Resources, Corporate Affairs and cross company customer initiatives under the leadership of our current Human Resources Director, Ms Alex Badenoch. Other than for the items noted above and the resolution to pay a final dividend of 8.50 cents per share (refer to note 6), there has not arisen in the interval between the end of the 2014 financial year and the date of this report, any item, transaction or event of a material and unusual nature likely, in the opinion of the Board, to significantly affect the operations of Asciano, the results of those operations, or the state of affairs of Asciano in future financial years.
financial report
Asciano Limited154
For
per
sona
l use
onl
y

1 1 3 A S C I A N O L I M I T E D F I N A N C I A L R E P O R T F O R T H E Y E A R E N D E D 3 0 J U N E 2 0 1 4
36. Auditor’s remuneration KPMG is the auditor of Asciano. Amounts received or due and receivable by KPMG are detailed below:
2014 $000
2013 $000
Audit services
Audit and review of financial reports – KPMG Australia 1,500 1,483
Audit and review of financial reports – KPMG New Zealand 65 60
Other services – KPMG Australia
Taxation services 50 27
Other assurance related services 316 55
1,931 1,625
Total remuneration – 9,997 37. Deed of cross guarantee Pursuant to ASIC Class Order 98/1418 dated 13 August 1998 (as amended by individual ASIC Order 08/0062 issued to the Parent on 31 January 2008), the wholly owned subsidiaries of the Parent listed below are relieved from the Corporations Act 2001 requirements for preparation, audit and lodgement of financial reports and Directors’ reports. It is a condition of the class order and individual ASIC Order 07/0813 issued to the Parent on 12 October 2007 that the Parent and each of the wholly owned subsidiaries enter into a deed of cross guarantee. The effect of the deed is that the Parent guarantees to each creditor payment in full of any debt in the event of the winding up of any of the wholly owned subsidiaries under certain provisions of the Corporations Act 2001. If a winding up occurs under other provisions of the Act, the Parent will only be liable in the event that after six months any creditor has not been paid in full. The wholly owned subsidiaries have also given similar guarantees in the event that the Parent is wound up.
financial report
Annual report 2014155
For
per
sona
l use
onl
y

notes to and forming part of the financial statements Continued
1 1 4 A S C I A N O L I M I T E D F I N A N C I A L R E P O R T F O R T H E Y E A R E N D E D 3 0 J U N E 2 0 1 4
37. Deed of cross guarantee (continued)
The subsidiaries subject to the deed are as follows:
Asciano Executive Services Pty Ltd Asciano Holdings (Containers) Pty Ltd
Asciano Holdings (Corporate) Pty Ltd Asciano Holdings (Executive) Pty Ltd
Asciano Holdings (General & Bulk) Pty Ltd Asciano Holdings (Properties) Pty Ltd
Asciano Holdings (Rail) Pty Ltd Asciano Properties Operations Pty Ltd4
Asciano Properties Pty Ltd Asciano Rail Holdings Pty Ltd
Asciano Services Pty Ltd Asciano (Employee Share Plans) Pty Ltd
ATN Access Pty Limited Eastern Basin Pty Ltd5
C3 Australia Pty Ltd National Rail Consortium (Insurance) Pty Ltd
National Stevedoring Holdings Pty Limited Pacific National (Bulk Rail) Pty Ltd
Pacific National (NSW) Pty Ltd Pacific National (QLD) Pty Ltd
Pacific National (Queensland Coal) Pty Ltd Pacific National (Queensland Coal Holdco) Pty Ltd
Pacific National (Tasmania) Pty Limited Pacific National Pty Ltd
Patrick Auto, Bulk and General Ports Pty Ltd Patrick BWL Pty Limited
Patrick Container Ports Pty Ltd1 Patrick Distribution Pty Limited
ACN 095 062 570 Pty Limited2 Patrick Port Services Pty Limited
Patrick Portlink Pty Limited Patrick Ports Pty Ltd
Patrick Stevedores Operations Pty Limited Patrick Stevedores Holdings Pty Limited
Patrick Stevedoring Pty Ltd Patrick Stevedores Operations No 2 Pty Limited
Plzen Pty Limited Patrick Stevedoring (BSL) Pty Ltd
PN Tas (Services) Pty Limited Phillips Transport Pty Limited
Terminals Australia Pty Limited PN Tas (Operations) Pty Limited
WA Grain Stevedores Pty Ltd PSL Services Pty Limited
Patrick Projects Pty Ltd Strang Patrick Holdings Pty. Limited
Infrastructure Investment Corporation Pty Ltd Train Crewing Services Pty Ltd
Mountain Industries Pty Ltd Mountain Bulk Haulage Pty Ltd
MTN Industries Pty Ltd Geelongport Pty Limited
ACN 065 981 526 Pty Ltd3
1. Formerly Patrick Logistics Pty Ltd. 2. Formerly Patrick Port Services (No 1) Pty Limited. 3. Formerly Equitius Pty Ltd. 4. As trustee for Asciano Properties Trust.
5. As trustee for Eastern Basin Unit Trust.
Control was lost over Alpen’s (Griffith) Pty Ltd due to deregistration with ASIC on 23 February 2014 and Patrick Technology & Systems Pty Limited on 26 February 2014. Mountain Industries Pty Ltd, Mountain Bulk Haulage Pty Ltd and MTN Industries Pty Ltd were acquired on 31 October 2013 when Asciano Limited acquired 100% of the voting rights in the Mountain Industries group of entities. All three Mountain Industries entities and C3 Australia Pty Ltd were added to the Deed of Cross Guarantee during the current financial year.
financial report
Asciano Limited156
For
per
sona
l use
onl
y

1 1 5 A S C I A N O L I M I T E D F I N A N C I A L R E P O R T F O R T H E Y E A R E N D E D 3 0 J U N E 2 0 1 4
37. Deed of cross guarantee (continued)
A consolidated statement of comprehensive income, a summary of accumulated losses, and a consolidated statement of financial position, comprising the Parent and controlled entities that are a party to the deed of cross guarantee, after eliminating all transactions between parties to the deed, at 30 June 2014 are set out as follows:
Consolidated Statement of Comprehensive Income 2014
$M
RESTATED1 2013
$M
Revenue from services rendered 3,511.5 3,185.8
Other income 21.5 286.7
Share of net profit of joint ventures 16.5 18.1
Operating expenses excluding depreciation and amortisation (2,539.6) (2,447.2)
Profit before depreciation, amortisation, net finance costs and tax 1,009.9 1,043.4
Depreciation (336.0) (239.9)
Amortisation (46.0) (43.4)
Profit before net finance costs and tax 627.9 760.1
Net finance expense (160.4) (137.4)
Profit before tax 467.5 622.7
Tax expense (134.0) (173.2)
Profit after tax 333.5 449.5
Other comprehensive income 60.6 142.8
Profit for the period 394.1 592.3
Accumulated losses at beginning of year (693.0) (1,040.2)
Dividends paid – (0.2)
Transfers to reserves (144.2) (244.9)
Accumulated losses at end of the year (443.1) (693.0)
Total
–
12.5
1. The restatement relates to the adoption of the amended accounting standard AASB 119 Employee Benefits (2011), as outlined in note 1(f).
financial report
Annual report 2014157
For
per
sona
l use
onl
y

NOTES TO AND fOrMINg pArT Of ThE fINANCIAL STATEMENTS Continued
1 1 6 A S C I A N O L I M I T E D F I N A N C I A L R E P O R T F O R T H E Y E A R E N D E D 3 0 J U N E 2 0 1 4
37. Deed of cross guarantee (continued)
Consolidated Statement of Financial Position 2014
$M
RESTATED1 2013
$M
Current assets
Cash and cash equivalents 167.3 23.1
Trade and other receivables 378.2 284.6
Prepayments 21.3 25.8
Inventories 32.0 26.0
Derivative financial assets 4.1 12.4
Other assets – 0.1
Total current assets 602.9 372.0
Non-current assets
Trade and other receivables 58.1 55.4
Prepayments 2.2 4.3
Inventories 31.6 40.5
Other financial assets including derivatives 1,704.8 1,779.3
Net deferred tax assets 69.3 15.8
Equity accounted investments 30.9 26.1
Property, plant and equipment 3,985.8 3,570.4
Intangible assets 2,607.1 2,577.8
Other assets 1.7 2.0
Total non-current assets 8,491.5 8,071.6
Total assets 9,094.4 8,443.6
Current liabilities
Current tax liabilities 9.2 45.6
Trade and other payables 434.4 373.0
Loans and borrowings 0.6 –
Derivative financial liabilities 61.4 29.1
Provisions and employee benefits 214.3 170.1
Total current liabilities 719.9 617.8
Non-current liabilities
Trade and other payables 132.4 132.3
Loans and borrowings 4,230.8 3,915.0
Derivative financial liabilities 57.8 19.3
Provisions and employee benefits 82.8 92.7
Total non-current liabilities 4,503.8 4,159.3
Total liabilities 5,223.7 4,777.1
Net assets 3,870.7 3,666.5
Equity
Contributed equity 9,661.9 9,642.3
Reserves (5,351.1) (5,282.8)
Other comprehensive income 3.0 –
Accumulated losses (443.1) (693.0)
Total equity 3,870.7 3,666.5
Total – 3,411.6
1. The restatement relates to the adoption of the amended accounting standard AASB 119 Employee Benefits (2011), as outlined in note 1(f).
financial report
Asciano Limited158
For
per
sona
l use
onl
y

1 1 7 A S C I A N O L I M I T E D F I N A N C I A L R E P O R T F O R T H E Y E A R E N D E D 3 0 J U N E 2 0 1 4
38. Parent As at, and throughout the 2014 financial year, the parent company of Asciano was Asciano Limited.
2014
$M 2013
$M
Result of the Parent
Profit after tax 144.2 244.8
Other comprehensive income (50.4) 31.7
Total comprehensive income 93.8 276.5
Financial position
Current assets 36.1 14.1
Non-current assets 8,465.1 8,408.0
Total assets 8,501.2 8,422.1
Current liabilities 70.6 79.6
Non-current liabilities 4,504.6 4,392.8
Total liabilities 4,575.2 4,472.4
Net assets 3,926.0 3,949.7
Equity
Contributed equity 9,646.6 9,646.6
Reserves 163.4 187.1
Accumulated losses (5,884.0) (5,884.0)
Total equity 3,926.0 3,949.7
Total
–
12.5
The Parent has a net current asset deficiency at 30 June 2014 of $34.5 million (2013: $65.5 million). Given that Asciano has an unutilised syndicated revolving credit facility of $650 million maturing in October 2019, the Directors believe the Parent has the capacity to pay its debts as and when they fall due.
Capital commitments for acquisition of property, plant and equipment The Parent did not have any capital commitments for acquisition of property, plant and equipment at 30 June 2014 or 30 June 2013.
Capital guarantees in respect of debts of certain subsidiaries The Parent has entered into a deed of cross guarantee with the effect that the Parent guarantees debts in respect of wholly owned subsidiaries. Under the deed of cross guarantee, the subsidiaries provide financial security to the Parent. Further details of the deed of cross guarantee and the wholly owned subsidiaries subject to the deed, are disclosed in note 37.
Parent contingent liabilities There are no contingent liabilities in the Parent. The contributed equity in the Parent differs to the contributed equity in the consolidated financial statements due to the elimination of the treasury shares and the corporatisation adjustment which arose from the acquisition of the Asciano Finance Trust.
financial report
Annual report 2014159
For
per
sona
l use
onl
y

1 1 8 A S C I A N O L I M I T E D F I N A N C I A L R E P O R T F O R T H E Y E A R E N D E D 3 0 J U N E 2 0 1 4
Directors’ declaration For the year ended 30 June 2014 In the opinion of the Directors of Asciano Limited (“Company”): (a) the consolidated financial statements and notes set out on pages 89 to 159 and the Remuneration report in the Directors’ report, set
out on pages 68 to 83, are in accordance with the Corporations Act 2001, including: (i) giving a true and fair view of the Group’s financial position as at 30 June 2014 and of its performance for the financial year ended
on that date; and (ii) complying with Australian Accounting Standards (including the Australian Accounting Interpretations) and the Corporations
Regulations 2001; and (b) there are reasonable grounds to believe that the Company will be able to pay its debts as and when they become due and
payable; and (c) there are reasonable grounds to believe that the Company and the Group entities identified in note 37 will be able to meet any
obligations or liabilities to which they are or may become subject to by virtue of the deed of cross guarantee between the Company and those Group entities pursuant to ASIC Class Order 98/1418.
The Directors have been given the declarations required by section 295A of the Corporations Act 2001 from the Chief Executive Officer and Chief Financial Officer for the financial year ended 30 June 2014. The Directors draw attention to note 1 to the consolidated financial statements, which includes a statement of compliance with International Financial Reporting Standards. Signed in accordance with a resolution of the Directors: Malcolm Broomhead Chairman Sydney 21 August 2014
DIrECTOrS’ DECLArATION
Asciano Limited160
fINANCIAL rEpOrT
For
per
sona
l use
onl
y

INDEpENDENT AuDITOr’S rEpOrT
ABCD
KPMG, an Australian partnership and a member firm of the KPMG network of independent member firms affiliated with KPMG International Cooperative Liability limited by a scheme approved under (“KPMG International”), a Swiss entity. Professional Standards Legislation
Independent auditor’s report to the members of Asciano Limited
Report on the financial report We have audited the accompanying financial report of Asciano Limited (the company), which comprises the consolidated statement of financial position as at 30 June 2014, and consolidated statement of profit and loss and consolidated statement of comprehensive income, consolidated statement of changes in equity and consolidated statement of cash flows for the year ended on that date, notes 1 to 38 comprising a summary of significant accounting policies and other explanatory information and the directors’ declaration of the Group comprising the company and the entities it controlled at the year’s end or from time to time during the financial year.
Directors’ responsibility for the financial report
The directors of the company are responsible for the preparation of the financial report that gives a true and fair view in accordance with Australian Accounting Standards and the Corporations Act 2001 and for such internal control as the directors determine is necessary to enable the preparation of the financial report that is free from material misstatement whether due to fraud or error. In note 1, the directors also state, in accordance with Australian Accounting Standard AASB 101 Presentation of Financial Statements, that the financial statements of the Group comply with International Financial Reporting Standards.
Auditor’s responsibility
Our responsibility is to express an opinion on the financial report based on our audit. We conducted our audit in accordance with Australian Auditing Standards. These Auditing Standards require that we comply with relevant ethical requirements relating to audit engagements and plan and perform the audit to obtain reasonable assurance whether the financial report is free from material misstatement.
An audit involves performing procedures to obtain audit evidence about the amounts and disclosures in the financial report. The procedures selected depend on the auditor’s judgement, including the assessment of the risks of material misstatement of the financial report, whether due to fraud or error. In making those risk assessments, the auditor considers internal control relevant to the entity’s preparation of the financial report that gives a true and fair view in order to design audit procedures that are appropriate in the circumstances, but not for the purpose of expressing an opinion on the effectiveness of the entity’s internal control. An audit also includes evaluating the appropriateness of accounting policies used and the reasonableness of accounting estimates made by the directors, as well as evaluating the overall presentation of the financial report.
We performed the procedures to assess whether in all material respects the financial report presents fairly, in accordance with the Corporations Act 2001 and Australian Accounting Standards, a true and fair view which is consistent with our understanding of the Group’s financial position and of its performance.
We believe that the audit evidence we have obtained is sufficient and appropriate to provide a basis for our audit opinion.
financial report
Annual report 2014161
For
per
sona
l use
onl
y

INDEpENDENT AuDITOr’S rEpOrT Continued
ABCD
Independence
In conducting our audit, we have complied with the independence requirements of the Corporations Act 2001.
Auditor’s opinion
In our opinion:
(a) the financial report of the Group is in accordance with the Corporations Act 2001, including:
(i) giving a true and fair view of the Group’s financial position as at 30 June 2014 and of its performance for the year ended on that date; and
(ii) complying with Australian Accounting Standards and the Corporations Regulations 2001.
(b) the financial report also complies with International Financial Reporting Standards as disclosed in note 1.
Report on the remuneration report We have audited the Remuneration Report included in Section 7 of the directors’ report for the year ended 30 June 2014. The directors of the company are responsible for the preparation and presentation of the remuneration report in accordance with Section 300A of the Corporations Act 2001. Our responsibility is to express an opinion on the remuneration report, based on our audit conducted in accordance with auditing standards.
Auditor’s opinion
In our opinion, the remuneration report of Asciano Limited for the year ended 30 June 2014, complies with Section 300A of the Corporations Act 2001.
KPMG
Steven Gatt Partner
Sydney
21 August 2014
Asciano Limited162
fINANCIAL rEpOrT
For
per
sona
l use
onl
y

ADDITIONAL INfOrMATION
Additional information required by the Australian Securities exchange Listing rules and not disclosed elsewhere in the full year report is set out below. this shareholder information was applicable at 30 August 2014, unless otherwise indicated.
voting rights Sharesthere are 39,021 shareholders of the 975,385,664 shares in Asciano.
the voting rights attached to the shares are set out in clause 37 of Asciano’s Constitution, which is available on Asciano’s website.
Options and rightsthere are 40 holders of options and 64 holders of rights over Asciano shares issued under the Asciano options and rights Plan. there are no voting or distribution rights attached to either the options or rights. Some previous holders of options have left their employment with Asciano and their options have lapsed.
Distribution of fully paid shares
Range Total holders Units % of issued capital1 – 1,000 17,586 6,451,910 0.661,001 – 5,000 12,379 29,562,987 3.035,001 – 10,000 2,523 17,987,737 1.8410,001 – 100,000 1,478 31,337,510 3.21100,001 – 999,999,999 109 890,045,520 91.251,000,000,000 – 9,999,999,999 0 0 0.00
Rounding 0.01Total 34,075 975,385,664 100.00
Unquoted options and rights over securitiesthere are 888,392 unquoted options and 2,983,772 unquoted rights over fully paid ordinary shares issued under the Asciano options and rights Plan to members of senior management as part of their remuneration.
Substantial security holdersthe names of substantial security holders who have notified the Company in accordance with the corporations Act 2001 as at 30 August 2014 are:
Holder Disclosure dateNumber of
securities held % of issued securitiesCommonwealth Bank of Australia 30/04/2014 119,271,977 12.22westpac Banking Corporation 9/04/2013 65,107,964 6.68Blackrock Group 22/04/2014 59,602,365 6.11uBS AG 27/02/2014 49,456,913 5.07National Australia Bank 23/07/2014 49,163,018 5.04
Annual report 2014163
ADDITIONALINfOrMATION
For
per
sona
l use
onl
y

Twenty largest investors
Top holders snapshot
Fully paid ordinary shares (total) as of 30 Aug 2014
Composition : FP
Rank Name Units % of units1. hSBC CuStoDy NoMINeeS (AuStrALIA) LIMIteD 279,084,878 28.612. J P MorGAN NoMINeeS AuStrALIA LIMIteD 188,229,017 19.303. NAtIoNAL NoMINeeS LIMIteD 155,945,174 15.994. CItICorP NoMINeeS Pty LIMIteD 79,405,013 8.145. CItICorP NoMINeeS Pty LIMIteD <CoLoNIAL FIrSt StAte INV A/C> 63,208,740 6.486. BNP PArIBAS NoMS Pty LtD <DrP> 22,938,386 2.357. rBC INVeStor SerVICeS AuStrALIA NoMINeeS Pty LIMIteD <BKCuSt A/C> 8,058,010 0.838. uBS weALth MANAGeMeNt AuStrALIA NoMINeeS Pty LtD 7,518,032 0.779. ArGo INVeStMeNtS LIMIteD 6,543,086 0.67
10. uBS NoMINeeS Pty LtD 6,228,991 0.6411. hSBC CuStoDy NoMINeeS (AuStrALIA) LIMIteD <Nt-CoMNwLth SuPer CorP A/C> 5,199,357 0.5312. AMP LIFe LIMIteD 5,161,420 0.5313. PGA (INVeStMeNtS) Pty LtD 5,000,000 0.5114. rBC INVeStor SerVICeS AuStrALIA NoMINeeS Pty LIMIteD <GSAM A/C> 3,995,509 0.4115. BNP PArIBAS NoMINeeS Pty LtD <AGeNCy LeNDING DrP A/C> 3,862,968 0.4016. QIC LIMIteD 3,857,989 0.4017. uBS NoMINeeS Pty LtD 3,562,500 0.3718. hSBC CuStoDy NoMINeeS (AuStrALIA) LIMIteD–GSCo eCA 3,030,132 0.3119. the SeNIor MASter oF the SuPreMe Court <CoMMoN FuND No 3 A/C> 2,301,591 0.2420. CS Fourth NoMINeeS Pty LtD 2,231,155 0.23
Totals: Top 20 holders of fully paid ordinary shares (total) 855,361,948 87.69
Total remaining holders balance 120,023,716 12.31
Asciano Limited164
ADDITIONAL INfOrMATION
For
per
sona
l use
onl
y

Annual report 2014165
COrpOrATE DIrECTOry
Share registryComputershare Investor Services Pty Limited yarra Falls 452 Johnston Street Abbotsford VIC 3067 Australia
enquiries (within Australia) 1300 729 310 (outside Australia) +61 3 9415 4608 Facsimile + 61 3 9473 2500
[email protected] www.computershare.com
registered OfficeAsciano Limited ABN 26 123 652 862
Level 4/476 St Kilda road Melbourne VIC 3004 Australia
[email protected] www.asciano.com.au
head OfficeLevel 6/15 Blue Street North Sydney NSw 2060 Australia
Board of DirectorsMalcolm Broomhead (Chairman) John Mullen (Chief executive officer and Managing Director) Chris Barlow Bob edgar Peter George Geoff Kleemann Shirley In’t Veld ralph waters
Company SecretaryLyndall Stoyles (appointed 1 September 2014)
For
per
sona
l use
onl
y

ASC
IAN
O LIM
ITE
D
AN
NU
AL R
EPOR
T 20
14
asciano2014.reportonline.com.au
For
per
sona
l use
onl
y

Notice of meetiNg
2014
0500 HRS | TUESDAY
PORT GERMEIN, SOUTH AUSTRALIA
MOVING DOMESTIC FREIGHT
2300 HR
S | TUESD
AY
PORT O
F FREMA
NTLE, W
ESTERN AU
STRALIA
STEVEDO
RING
AUSTRALIA’S IMPO
RTS
HOURS A DAY
DAYS A YEAR
24365
For
per
sona
l use
onl
y

43%
27%
19%
11%
fY14 eBitDA Split by Division 1
1. Does not include corporate head office costs/eliminations
25%
35%
20%
21%
fY14 Revenue Split by Division1
earnings overview
Twelve Months Ended June ($’m) 20134 2014 % chg Statutory Revenue and other income 3,744.8 3,994.6 6.7
Underlying EBITDA ¹ 992.7 1,052.0 6.0
Statutory EBITDA 977.8 991.4 1.4
Underlying EBIT ² 686.0 720.3 5.0
Statutory EBIT 667.0 584.0 (12.4)
Underlying NPAT ³ after minority interests 342.5 349.8 2.1
Statutory NPAT after minority interests 334.4 254.4 (23.9)
1. Underlying EBITDA excludes material items of $60.6m (FY13 $14.9m). 2. Underlying EBIT excludes material items of $136.3m (FY13 $19.0m). 3. Underlying NPAT excludes material items of $95.4m (FY13 $8.1m). 4. FY13 earnings have been restated to reflect the change in the Australian Accounting Standards Board (AASB) 119, accounting for employee
benefits, as reported in the FY13 financial accounts. The impact of the change is to reduce FY13 EBITDA & EBIT by $7.9m and FY13 NPAT by $5.6m.
FY14 FY13 FY12
Dividend per share (cents)
UP
23.9%oN PcP 14.25
11.5
7.5
PN Coal PN Rail Terminals & Logistics BAPS
Asciano Limited2
For
per
sona
l use
onl
y

Annual Report 20143
The Annual General Meeting of shareholders of Asciano Limited (Asciano or Company) will be held at the Wesley Centre, 220 Pitt Street, Sydney on Wednesday,
12 November 2014 at 10.00am.
Notice of meeting
items of Business1. Financial Statements and Reports �
To receive and consider the consolidated Financial Report of the Company as well as the reports of the Directors and the Auditors for the financial year ended 30 June 2014.
2. Remuneration Report To consider and, if thought fit, pass the following resolution as an ordinary resolution: “That the Remuneration Report for the financial year ended 30 June 2014 be adopted.” Voting on Item 2: A voting exclusion applies to this resolution (please see the Notes to this Notice). The vote on this resolution is advisory only and does not bind the Company or the Directors.
3. �Re-election of Director – Mr Barlow To consider and, if thought fit, pass the following resolution as an ordinary resolution: “That Mr Chris Barlow, who retires under Article 9.2(a) of the Company’s constitution and, being eligible, offers himself for election, be re-elected as a Director of the Company.”
Details of the qualifications and experience of Mr Barlow and the recommendation of the Board in relation to his re-election are set out in the Explanatory Notes.
4. Re-election of Director – Ms In’t Veld To consider and, if thought fit, pass the following resolution as an ordinary resolution:�“That Ms Shirley In’t Veld, who retires under Article 9.2(a) of the Company’s constitution and, being eligible, offers herself for election, be re-elected as a Director of the Company.”
Details of the qualifications and experience of Ms In’t Veld and the recommendation of the Board in relation to her re-election are set out in the Explanatory Notes.
5. Grant of Rights to Chief Executive Officer – 2015 Financial Year To consider and, if thought fit, pass the following resolution as an ordinary resolution: “That approval be given for the grant of a maximum of 418,234 rights to acquire shares in the Company to the Managing Director and Chief Executive Officer, Mr John Mullen, in accordance with the rules of the Asciano Limited Long Term Incentive Plan and that approval be given for the purposes of sections 200B and 200E of the Corporations Act 2001 for the giving of benefits to Mr John Mullen under the Plan, on the terms summarised in the Explanatory Notes.”
Voting on Item 5: A voting exclusion applies to this resolution (please see the Notes to this Notice).
6. Renewal of Proportional Takeover Provisions To consider and, if thought fit, pass the following resolution as a special resolution:�“That the proportional takeover provisions contained in Rule 15 of the Company’s constitution be renewed with effect from the date of this meeting for a further period of 3 years.”
By Order of the BoardLyndall StoylesGroup General Counsel and Company Secretary22 September 2014
Notice of Meeting 20143
For
per
sona
l use
onl
y

Voting exclusions1. Item 2 (Remuneration Report):
The Company will disregard any votes cast on the proposed resolution in Item 2:
• by or on behalf of members of the Company’s key management personnel (KMP), being the Directors and the other KMP as disclosed in the Remuneration Report for the financial year ended 30 June 2014, or their closely related parties, regardless of the capacity in which the vote is cast; or
• as a proxy by a person who is a member of the Company’s KMP at the date of the Annual General Meeting or their closely related parties,
unless the vote is cast as proxy for a person entitled to vote on Item 2:
• in accordance with a direction on the proxy form; or
• by the Chairman of the meeting pursuant to an express authorisation to vote undirected proxies as the Chairman sees fit.
2. Item 5 (Grant of Rights to Chief Executive Officer): The Company will disregard any votes cast on the proposed resolution in Item 5:
• by Mr Mullen and any of his associates, regardless of the capacity in which the vote is cast;
• as a proxy by members of the KMP at the date of the meeting and their closely related parties,
unless the vote is cast as proxy for a person entitled to vote on Item 5:
• in accordance with a direction on the proxy form; or
• by the Chairman of the meeting pursuant to an express authorisation to vote undirected proxies as the Chairman sees fit.
Voting, Proxies and corporate Representatives1. For the purposes of the meeting, shares
will be taken to be held by the persons who are registered as shareholders as at 7pm (AEDT) on Monday 10 November 2014.
2. A shareholder can attend and vote at the meeting either by:
• attending and voting in person (if the shareholder is a corporation, it can do so by appointing an individual person as its corporate representative); or
• by appointing a proxy to attend and vote on the shareholders behalf.
3. If a shareholder is a corporation and wishes to appoint a corporate representative, the corporate representative must produce a certificate of appointment prior to admission to the meeting signed in accordance with section 127 of the Corporations Act.
4. A shareholder is entitled to appoint not more than 2 proxies. A proxy need not be a shareholder of Asciano.
5. A proxy may be either an individual or a body corporate.
6. If a shareholder wishes to appoint a body corporate to act as a proxy, the shareholder must specify on the proxy form:
• the full name of the body corporate appointed as proxy; and
• the full name or title of the individual representative of the body corporate at the meeting.
7. Where 2 proxies are appointed, each proxy may be appointed to represent a specified proportion or number of the voting rights of the shareholder. If no proportion is specified, each proxy may exercise half the member’s votes. Neither proxy is entitled to vote on a show of hands if more than one proxy attends the meeting. If you want to appoint 2 proxies, an additional proxy form can be obtained from Computershare Investor Services Pty Limited.
8. If your proxy chooses to vote, they must vote in accordance with your directions. If you have directed your proxy to vote, and they choose to not vote on a poll, then the Chairman of the Meeting will vote your proxies as directed by you.
9. Subject to the voting restrictions set out above, if you do not mark a box, your proxy may vote as they choose on that item of business.
10. If your proxy does not attend the meeting, the Chairman will become your proxy by default.
11. Completed proxy forms (together with any authority under which the proxy was signed or a certified copy of the authority) must be returned:
• personally or by post to: Computershare Investor Services Pty Limited GPO Box 242 Melbourne VIC 3000;
• online at�www.investorvote.com.au
or
• by facsimile: Computershare Investor Services Pty Limited +61 3 9473 2555 or 1800 783 447
prior to 10.00am (AEDT) on Monday 10 November 2014.
conducting the Annual general meetingThe Annual General Meeting is intended to give our shareholders the opportunity to:
• hear from the Chairman and the Managing Director and Chief Executive Officer about the performance and the operations of Asciano and the outlook for the year ahead;
• consider and vote on the items before the meeting including a non-binding resolution on the adoption of the Remuneration Report; and
• ask questions of the Board, management and the auditor. The Chairman and the Managing Director and Chief Executive Officer will generally answer questions on behalf of the Board and the management team.
If questions cannot be answered at the meeting, we will seek to provide a response to the shareholder as soon as possible after the meeting.
Asciano will webcast the meeting for the benefit of shareholders who are unable to attend and will also allow shareholders a chance to raise questions before the meeting.
We ask that shareholders:
• are courteous and respectful to all attendees at the meeting, including not photographing, videotaping or recording the meeting;
• keep their questions to a reasonable length to allow as many shareholders as possible to participate; and
• confine their questions to matters being considered at the meeting and matters relevant to shareholders as a whole. Questions relating to the shareholder’s personal circumstances can be raised with Company or Computershare representatives who will be available at the meeting.
Notes
Asciano Limited4
For
per
sona
l use
onl
y

These Explanatory Notes have been prepared to help shareholders understand the business to be put to shareholders at the Annual General Meeting. They relate to the items set out in this Notice of Meeting and form part of the Notice of Meeting.
item 1. financial Statements and ReportsNo vote is required to be held on this item. Shareholders will be given an opportunity to ask questions regarding the management of the Company at this time.
item 2. Remuneration Report The vote on Item 2 relates to the Company’s remuneration policy and outcomes for the 2014 financial year. Accordingly, shareholders are asked to adopt the Company’s Remuneration Report for the financial year ended 30 June 2014. The Remuneration Report is set out in the Directors’ Report section of the 2014 Annual Report and is also available on Asciano’s website at www.asciano.com.
Asciano’s Remuneration Report demonstrates how the Company continues to align its business strategies with its remuneration plans. This reinforces the direct link the Company has in place between Asciano’s results and the remuneration of Key Management Personnel.
The vote on this resolution is advisory only and does not bind the Company or its Directors. However, shareholders will be provided with a reasonable opportunity to ask questions about, or make comments on, the Remuneration Report. The Remuneration Committee will take the discussion on this resolution and the outcome of the vote into account when considering the future remuneration arrangements of the Company.
The Board unanimously recommends that shareholders vote in favour of this resolution.
item 3. Re-election of Director – mr BarlowMr Chris Barlow, a Director of the Company, retires in accordance with Article 9.2(a) of the Company’s constitution and, being eligible, offers himself for re-election. A brief biography of Mr Barlow follows:
Mr Chris Barlow was appointed a Non-Executive Director of Asciano Limited on 15 June 2007. He is Chairman of the Remuneration Committee and is a member of the Nomination and Succession Planning Committee and the Sustainability Committee.
Mr Barlow has held a range of senior roles in the transport infrastructure industry for many years. He was the Managing Director and Chief Executive Officer of Australia Pacific Airports Corporation, the operator of Melbourne and Launceston Airports.
Mr Barlow has over 30 years’ experience in the infrastructure industry, having joined BAA Limited (formerly British Airports Authority) as an Engineering Project Manager. He held a number of senior management positions within BAA managing airports and as Development Director was responsible for the A$1.5 billion business development program of the BAA Group.
Mr Barlow is a Chartered Engineer and holds a Bachelor of Science with Honours in Engineering from The University of London, UK.
Mr Barlow is currently Chairman of Northern Territory Airports Pty Limited and Melbourne Convention and Visitors Bureau Limited. He is also a senior advisor on airports worldwide to IFM Investors.
The Board considers Mr Barlow to be an Independent Director.
As in previous years, the Board has conducted an annual assessment of its own and its Committees’ performance. The performance of each individual Director has also been assessed as part of this process. Based on the outcome of this assessment, the Board (other than Mr Barlow) recommends that shareholders vote in favour of this resolution.
item 4. Re-election of Director – ms in’t VeldMs Shirley In’t Veld, a Director of the Company, retires in accordance with Article 9.2(a) of the Company’s constitution and, being eligible, offers herself for re-election. A brief biography of Ms In’t Veld follows:
Ms Shirley In’t Veld was appointed as a Non Executive Director of Asciano Limited on 1 November 2010. She is the Chair of the Sustainability Committee and a member of the Nomination and Succession Planning Committee.
Ms In’t Veld was the Managing Director of Verve Energy, Western Australia’s biggest electricity generator, from 2007 to April 2012. Prior to this, Ms In’t Veld was Vice President Primary Business Development with Alcoa, and from 2001-2004 she was the Managing Director of Alcoa Australia Rolled Products, based in Geelong, Victoria.
Ms In’t Veld commenced her career as a commercial lawyer with Mallesons in Melbourne and has also held senior legal, commercial and marketing positions with WMC Resources Ltd, Bond Corporation and BankWest. She has been a board member of Alcoa of Australia and a number of industry representative groups.
Ms In’t Veld has been on the Board of the Commonwealth Scientific and Industrial Research Organisation (CSIRO) since 2012, and was appointed to sit on the Renewable Energy Target Review Panel in March 2014. Ms In’t Veld is a Nominee Director for Sunsuper and Group Super (Commonwealth Bank Group Super), in relation to their interests in Perth Airport (appointed 2013). She also serves as a Board member of Juniper Uniting Church Aged Care (appointed 2013), is a member of the SMART Infrastructure Advisory Council (University of Wollongong) (appointed 2011) and is a council member of the AICD in Western Australia (appointed 2012).
Ms In’t Veld received her Bachelor of Laws (Hons) and Bachelor of Commerce from The University of Melbourne.
The Board considers Ms In’t Veld to be an Independent Director.
As in previous years, the Board has conducted an annual assessment of its own and its Committees’ performance. The performance of each individual Director has also been assessed as part of this process. Based on the outcome of this assessment, the Board (other than Ms In’t Veld) recommends that shareholders vote in favour of this resolution.
item 5. grant of Rights to chief executive officerOverview of grantIt is proposed that a grant of performance rights be made to the Managing Director and Chief Executive Officer, Mr John Mullen, in the 2015 financial year under the terms of the Asciano Limited Long Term Incentive Plan (LTI Plan).
The primary objectives of the Remuneration Committee and the Board in setting Mr Mullen’s remuneration package for the 2015 financial year are to:
• align Mr Mullen’s interests with the interests of shareholders;
• ensure that Mr Mullen’s remuneration is competitive and aligned with market remuneration in the Australian transport infrastructure sector; and
• encourage the achievement of performance goals and growth of Asciano’s business.
explanatory Notes
Notice of Meeting 20145
For
per
sona
l use
onl
y

Why is shareholder approval required?Under ASX Listing Rule 10.14, shareholder approval is required in order for a director to be issued securities under an employee incentive scheme. Accordingly, approval is sought for the grant to the Managing Director and Chief Executive Officer of up to 418,234 rights under the LTI Plan.
Approval is also sought under section 200B and section 200E of the Corporations Act for the pro rata vesting of the rights in the event of cessation of Mr Mullen’s employment in limited circumstances.
A brief overview of the details of the proposed grant are set out in the table below. Further details of Mr Mullen’s remuneration package and a summary of the operation of the LTI Plan are set out in the Remuneration Report on pages 68 to 83 of the Annual Report.
Number allocated
The Board has invited and Mr Mullen has applied for a grant of up to 418,234 performance rights over shares in the Company.
The number of rights was determined by dividing the target remuneration amount by a Black Scholes rights value.
Each right is to acquire one share in the Company. Accordingly, the maximum number of shares that may be acquired by Mr Mullen is 418,234 shares (subject to any adjustment made in accordance with the LTI Plan).
Date of grant If shareholder approval is obtained, the rights will be granted to Mr Mullen shortly after the meeting but, in any event, within 12 months after the date of the meeting.
Performance hurdle/s
The rights are subject to two performance hurdles which are independent and will be tested separately.
1. TSR Performance50% of the rights are tested based on Asciano’s Total Shareholder Return (TSR) performance relative to companies in the S&P/ASX 100 index (excluding resources and financials) over the performance period.
The vesting schedule for this component of the rights is as follows:• no rights will vest if Asciano’s TSR performance is less than the 50th percentile• if performance is at the 50th percentile then 50% of the rights will vest• an additional 2% of rights will vest for every 1 percentile increase above the 50th percentile up to the
75th percentile at which 100% of this component of the rights will vest.
2. Return on Capital Employed50% of the rights are tested based on Return on Capital Employed (ROCE). ROCE is calculated on the formula “EBIT divided by Capital Employed”.
EBIT is Earnings before Interest and Tax, adjusted for material items. Capital Employed is the net operating assets of each business.
Asciano has set a threshold ROCE hurdle and a target ROCE hurdle. These targets have been set based on the Company’s strategic plan, which is updated each year.
None of this component of the rights will vest if Asciano’s ROCE is less than its defined threshold ROCE. If the threshold ROCE is achieved then 50% of this component of rights will vest. There will be a 75% vesting at the midpoint between the threshold and the target. If target ROCE is achieved then 100% vesting will occur.
The level of ROCE required to attract full or partial vesting under this component of the LTI Plan is commercially sensitive and will be disclosed, where the target is achieved, on a retrospective basis following the end of the performance period.
Performance period and vesting
The performance period is 3 years, commencing 1 July 2014. Both performance hurdles are tested following 30 June 2017, with an additional test for the TSR hurdle following 30 June 2018.
Any rights which do not vest at the end of the applicable performance period will lapse.
Trading restrictions
Unless otherwise requested, any shares allocated following satisfaction of the performance hurdles will not be subject to any trading restrictions other than those imposed by Asciano’s Share Trading Policy.
A participant is able to elect that shares be subject to a holding lock for either 5 or 7 years from the date the rights are granted. The holding lock will be lifted upon earlier cessation of employment. In addition, the Board may lift this restriction on trading upon application in exceptional circumstances.
Price payable for rights
No amount will be payable in respect of the grant, or on the vesting, of the rights. No loan has been made in relation to the grant.
Cessation of employment
If Mr Mullen ceases employment with the Company prior to satisfaction of the performance hurdles applicable to the rights, then any entitlement he may have to the rights will depend on the circumstances of the cessation. All rights will lapse in the event of resignation or termination for cause.
In accordance with the LTI Plan, in limited circumstances, including death, disability, redundancy or termination by the Company for convenience, Mr Mullen may become entitled to a pro rata number of rights reflecting the part of the performance period elapsed and the extent to which the applicable performance hurdles have been satisfied at the time of ceasing employment.
Other required information – ASX Listing Rules
Mr Mullen is the only Director of the Company entitled to participate in the LTI Plan.
Following shareholder approval at the 2013 AGM, 473,348 rights were granted to Mr Mullen. Since this approval, no other rights have been granted under the LTI Plan to Mr Mullen or any other Director.
explanatory Notes cont’d
Asciano Limited6
For
per
sona
l use
onl
y

item 6. Renewal of Proportional takeover ProvisionsAt the Company’s Annual General Meeting (AGM) in 2011, shareholders voted to insert into the Company’s constitution the proportional takeover provisions set out in Rule 15. At that time, the proportional takeover provisions were approved with effect from the date of the AGM for a period of 3 years.
The Directors consider it in the interests of shareholders to continue to have a proportional takeover provision in the constitution. Accordingly, shareholders are requested to approve the proportional takeover provisions as set out in Rule 15 of the constitution with effect from the date of this meeting for a further period of 3 years.
Reasons to adopt the proportional takeover provisions A proportional takeover bid is an off-market takeover offer sent to each shareholder, but only for a specified proportion of the shares (ie less than 100%) held by the shareholder. Therefore, shareholders who accept such a proportional takeover offer in full will only dispose of that specified proportion and retain the balance of their shares.
A proportional takeover bid may result in effective control of the Company changing hands without shareholders having the opportunity to sell all of their shares to the bidder. Shareholders could be at risk being locked in holding residual shares as a minority and the bidder may acquire control of the Company without paying an adequate control premium to shareholders.
To deal with this possibility, a company may provide in its constitution that if a proportional takeover bid is made for shares in the company, shareholders must vote on whether to accept or reject the offer and that decision will be binding on all the shareholders.
The benefit of the provision is that shareholders are able to decide collectively whether the proportional offer is acceptable in principle and it may ensure that any partial offer is appropriately priced.
Effect of the proportional takeover provisionsIf Rule 15 is included in the constitution, in the event a proportional takeover bid is made, the Directors must ensure that a general meeting is held by the 14th day before the last day of the bid period, at which shareholders will consider a resolution to approve the takeover bid.
Each shareholder will have one vote for each fully paid share held, with the vote to be decided on a simple majority.
The resolution shall be taken to have been passed if a majority of shares voted at the meeting, excluding the shares of the bidder and its associates, vote in favour of the resolution. If no resolution is voted on by the 14th day before the last day of the bid period, the resolution will be deemed to have been passed. Where the resolution approving the offer is passed or deemed to have been passed, transfers of shares resulting from accepting the offer will be registered provided they otherwise comply with the Corporations Act, the ASX Listing Rules, the ASTC Operating Rules and the Company’s constitution. If the resolution is rejected, then in accordance with the Corporations Act the offer will be deemed to be withdrawn.
The proportional takeover approval provisions do not apply to full takeover bids and only apply for 3 years after the date of adoption of the provisions. The provisions may be renewed for a further 3 years by special resolution.
Potential advantages and disadvantages for Directors and shareholders The Directors consider that the takeover approval provisions have no potential advantages for them.
The potential advantages of Rule 15 for shareholders include the following:
• the right for shareholders to meet and decide, by majority vote, whether to accept a proportional takeover bid;
• it may help shareholders to avoid being locked in holding residual shares as a minority and may prevent a bidder
acquiring control of the Company without paying an adequate control premium (ie paying for all of their shares);
• it increases shareholders’ bargaining power and may help ensure that any bid is adequately priced; and
• knowing the view of the majority of shareholders may help each individual shareholder to decide whether to accept or reject the offer.
However, the inclusion of Rule 15 may potentially discourage proportional takeover bids being made for shares in the Company or reduce the likelihood of a proportional takeover succeeding, which may result in shareholders losing an opportunity to sell some of their shares at a premium.
The Directors consider that the potential advantages for shareholders of the proportional takeover provisions operating for the next 3 years outweigh the potential disadvantages.
While similar proportional takeover approval provisions have been in effect in the past, there have been no full or proportional takeover bids for the company. Therefore, there has been no example against which to review the advantages or disadvantages of the provisions for the directors and the shareholders, respectively, during the period during which the proportional takeover provisions have been in effect.
Knowledge of Takeover Bids As at the date of this Notice of Meeting, no Director is aware of any proposal to acquire or to increase the extent of a substantial interest in the Company.
Directors’ recommendation The Board unanimously recommends the renewal of the proportional takeover provisions.
If this resolution is approved, the existing proportional takeover provisions in the Company’s constitution will take effect for a further period of 3 years from the date of this meeting.
If approval is given for the issue of securities under ASX Listing Rule 10.14, approval is not required under ASX Listing Rule 7.1. The Board (other than Mr Mullen) recommends that shareholders vote in favour of this resolution.
Other required information – section 200E Corporations Act
The value of the rights that may vest on cessation of employment cannot be currently ascertained.
The circumstances that may affect the calculation of this value include:• the performance against the performance hurdles at the time employment ceases;• the part of the performance period that has elapsed at the time employment ceases; and• the number of rights that lapse on cessation of employment.
If shareholder approval is obtained and the Board exercises its discretion to vest some or all of Mr Mullen’s unvested performance rights (or to provide that Mr Mullen’s performance rights do not lapse but will continue and be tested in the ordinary course), the value of that benefit will be disregarded when calculating the relevant termination benefits cap for Mr Mullen under subsection 200F(2)(b) or subsection 200G(1)(c) of the Act.
Notice of Meeting 20147
For
per
sona
l use
onl
y

Dividend per Share (cents)
Return on equity (Roe) (%)
cumulative Business improvement Program Savings Under five Year Plan ($m)
further good progress on our ambitious five year plan we announced three years ago
eBitDA to Net interest (times)*
Net Debt to eBitDA (times)*
FY12
FY12
FY13
FY13
FY14
FY14
7.5
7.7
11.5
9.9
14.25
9.5
Final DividendInterim Dividend
4.0
3.5
6.25
5.25
8.5
5.75
FY12FY11 FY13 FY14
4.23.7
Interest cover target 3.5
Target range
4.85.3
FY12FY11 FY13 FY14
3.03.1
2.5x
3.0x2.8 2.9
We have doubled our five year business improvement program target from the original $150m plan to $300m by the end of fY16
Roe has improved 23.4% over the three year period
Pacific National BAPS Terminals & Logistics Corporate
Strong dividend growth in fY14 with final dividend increasing 36% and full year dividend increasing 23.9%
Balance sheet in a strong position to support our activities over the coming years
37
115
81
161
17
88
34
46
12
47
9
33
8
31
9777
16
FY12 FY13 FY14 FY16F
300
For
per
sona
l use
onl
y

SRN/HIN: I9999999999
Lodge your vote:Online:www.investorvote.com.au
By Mail:Computershare Investor Services Pty LimitedGPO Box 242 MelbourneVictoria 3001 Australia
Alternatively you can fax your form to(within Australia) 1800 783 447(outside Australia) +61 3 9473 2555
For Intermediary Online subscribers only(custodians) www.intermediaryonline.com
For all enquiries call:(within Australia) 1300 850 505(outside Australia) +61 3 9415 4000
Proxy Form
For your vote to be effective it must be received by 10:00am (AEDT) Monday 10 November 2014
How to Vote on Items of BusinessAll your securities will be voted in accordance with your directions.Appointment of ProxyVoting 100% of your holding: Direct your proxy how to vote by markingone of the boxes opposite each item of business. If you do not mark a boxyour proxy may vote or abstain as they choose (to the extent permitted bylaw). If you mark more than one box on an item your vote will be invalidon that item.
Voting a portion of your holding: Indicate a portion of your voting rightsby inserting the percentage or number of securities you wish to vote in theFor, Against or Abstain box or boxes. The sum of the votes cast must notexceed your voting entitlement or 100%.
Appointing a proxy: If you wish to appoint the Chairman of the Meetingas your proxy, mark the box in Step 1. If the person you wish to appointas your proxy is someone other than the Chairman of the Meeting, pleasewrite the name of that person in Step 1. If you leave this section blank, oryour named proxy does not attend the meeting,the Chairman of the meeting will be your proxy. If your named proxyattends the meeting but does not vote as directed on a poll on an item ofbusiness, the Chairman of the meeting will become your proxy in respectof that item. A proxy need not be a shareholder of the Company.
Appointing a second proxy: You are entitled to appoint up to twoproxies to attend the meeting and vote on a poll. If you want to appointtwo proxies, an additional proxy form can be obtained fromComputershare Investor Services Pty Limited. If you appoint two proxiesyou must specify the percentage of votes or number of securities for eachproxy, otherwise each proxy may exercise half of the votes.
Voting restrictions applying to Key Management Personnel: If youappoint a member of the Key Management Personnel of the Company(“KMP”) or one of their closely related parties as your proxy, that personwill not be able to cast your votes on Items 2 & 5 unless you direct themhow to vote or the Chairman of the Meeting is your proxy. “KeyManagement Personnel” includes each of the directors of the company,all those executives named in the company’s 2014 Remuneration Reportand any other persons who are the company’s Key ManagementPersonnel at the date of the meeting.
Signing Instructions for Postal FormsIndividual: Where the holding is in one name, the securityholder mustsign.Joint Holding: Where the holding is in more than one name, all of thesecurityholders should sign.Power of Attorney: If you sign this form under Power of Attorney and youhave not already lodged the Power of Attorney with the registry, pleaseattach a certified photocopy of the Power of Attorney to this form when youreturn it.Companies: Where the company has a Sole Director who is also the SoleCompany Secretary, this form must be signed by that person. If thecompany (pursuant to section 204A of the Corporations Act 2001) does nothave a Company Secretary, a Sole Director can also sign alone. Otherwisethis form must be signed by a Director jointly with either another Director ora Company Secretary. Please sign in the appropriate place to indicate theoffice held. Delete titles as applicable.
Attending the MeetingBring this form to assist registration. If a representative of a corporatesecurityholder or proxy is to attend the meeting you will need to provide theappropriate “Certificate of Appointment of Corporate Representative” priorto admission. A form of the certificate may be obtained fromComputershare or online at www.investorcentre.com under the help tab,"Printable Forms".
Comments & Questions: If you have any comments or questions for thecompany, please write them on a separate sheet of paper and return withthis form.
GO ONLINE TO VOTE, or turn over to complete the form
Asciano Limited ABN 26 123 652 862
Control Number: 999999
PIN: 99999
Go to www.investorvote.com.au or scan the QR Code with your mobile device.Follow the instructions on the secure website to vote.
Vote and view the annual report online
Your access information that you will need to vote:
PLEASE NOTE: For security reasons it is important that you keep your SRN/HIN confidential.
••
If you appoint the Chairman of the Meeting as your proxy or the Chairmanof the Meeting is appointed as your proxy by default, and you do not marka voting box for Item 2 & 5 then by signing and returning this form you willbe expressly authorising the Chairman of the meeting to exercise the proxyin respect of the relevant item even though the item is connected with theremuneration of the company's KMP.
T 000001 000 AIO
MR SAM SAMPLEFLAT 123123 SAMPLE STREETTHE SAMPLE HILLSAMPLE ESTATESAMPLEVILLE VIC 3030
Samples/000001/000001/i
*S000001Q01*
For
per
sona
l use
onl
y

I 9999999999
Important Note: If the Chairman of the Meeting is (or becomes) your proxy you can direct the Chairman to vote for or against or abstain fromvoting by marking the appropriate box in Step 2 below.
Change of address. If incorrect,mark this box and make thecorrection in the space to the left.Securityholders sponsored by abroker (reference numbercommences with ’X’) should adviseyour broker of any changes.
Proxy Form Please mark to indicate your directions
Appoint a Proxy to Vote on Your BehalfI/We being a member/s of Asciano Limited hereby appoint
STEP 1
the Chairman ORPLEASE NOTE: Leave this box blank ifyou have selected the Chairman of theMeeting. Do not insert your own name(s).
or failing the individual or body corporate named, or if no individual or body corporate is named, the Chairman of the Meeting, as my/our proxyto act generally at the Meeting on my/our behalf and to vote in accordance with the following directions (or if no directions have been given, andto the extent permitted by law, as the proxy sees fit) at the Annual General Meeting of Asciano Limited to be held at the Wesley Centre, 220 PittStreet, Sydney on Wednesday, 12 November 2014 at 10:00am (AEDT) and at any adjournment or postponement of that Meeting.
STEP 2 Items of Business PLEASE NOTE: If you mark the Abstain box for an item, you are directing your proxy not to vote on yourbehalf on a show of hands or a poll and your votes will not be counted in computing the required majority.
SIGN Signature of Securityholder(s) This section must be completed.Individual or Securityholder 1 Securityholder 2 Securityholder 3
Sole Director and Sole Company Secretary Director Director/Company Secretary
ContactName
ContactDaytimeTelephone Date
The Chairman of the Meeting intends to vote undirected proxies in favour of each item of business. In exceptional circumstances, the Chairman of the Meeting maychange his/her voting intention on any resolution, in which case an ASX announcement will be made.
of the Meeting
I ND
A I O 9 9 9 9 9 9 A
MR SAM SAMPLEFLAT 123123 SAMPLE STREETTHE SAMPLE HILLSAMPLE ESTATESAMPLEVILLE VIC 3030
/ /
XX
Chairman authorised to exercise undirected proxies on remuneration related resolutions: Where I/we have appointed the Chairman ofthe Meeting as my/our proxy (or the Chairman becomes my/our proxy by default), by signing and returning this form I/we expressly authorise theChairman to exercise my/our proxy on Items 2 & 5 (except where I/we have indicated a different voting intention below) even though Items 2 & 5are connected directly or indirectly with the remuneration of a member of key management personnel, which includes the Chairman.
ForA
gainst
Absta
in
Item 2 Remuneration Report
Item 3 Re-election of Director - Mr Chris Barlow
Item 4 Re-election of Director - Ms Shirley In'tVeld
Item 5 Grant of rights to Chief Executive Officer
Item 6 Renewal of proportional takeover provisions
For
per
sona
l use
onl
y