asx listed company executive remuneration study - · pdf fileasx listed company executive...
TRANSCRIPT

ASX Listed Company Executive Remuneration StudyTrends and valuation traps in the increasing use of long-term incentives
March 2013

2

3
Key findings
The Trends
1. The use of LTIs has increased – on average, 28% of executives’ total remuneration was paid in the form of LTIs, a significant increase over the 20% proportion found in our 2011 survey.
2. Performance rights continued as the primary LTI instrument issued – in excess of 50% in both surveys.
3. Market based performance hurdles, such as TSR, continue to dominate most LTI schemes, either as singular hurdles or in tandem with others – circa 70% in both surveys.
4. Many companies have simplified the operation of LTI performance hurdles by comparing company performance relative to a market index [rather than a select comparator group of companies].
5. However, a more significant proportion of companies have opted for a specific and narrower ‘peer benchmark’ comparator group [increasing from 29% to 37%].
The Valuation Traps
1. Companies are unnecessarily exaggerating their LTI expense through continuing to use the Black-Scholes option pricing model for expensing LTI share-based payments [over 50% of sampled companies].
2. Any overstatement of the LTI annual expense as a result of using the Black-Scholes valuation model at the inception of the performance period is permanent – it cannot be reversed and hence reported entity profit performance is unnecessarily and negatively impacted.
3. Comparator [or benchmark] Group selection continues to be an area of ‘inexact’ science potentially opening the door to unintended outcomes.

4
Introduction
In recent years, ASX listed companies have confronted mounting challenges in not only effectively structuring executive remuneration, but also dealing with the widening spotlight on governance and the call for greater clarity and proactive engagement around Remuneration Report disclosure.
Many ASX listed companies now produce a complex and often difficult to navigate Remuneration Report and, most importantly, all companies are subject to the contentious ‘two-strikes’ rule at the AGM. The latter has provided shareholders with unprecedented powers in influencing executive remuneration.
Much of the increased governance and reporting challenges have come about through escalating shareholder ‘activism’ at the apparent misalignment between executive remuneration, successful strategy execution and delivering sustainable shareholder value.
Amongst Australian listed companies, Long-Term Incentive [“LTI”] executive remuneration is generally accommodated through granting of performance rights, options or shares in the company.
The use of a properly structured LTI plan should align executive performance to delivering shareholder value and increased Total Shareholder Returns [“TSR”].
This study, updating our earlier work in 2011, was undertaken to determine:
1. Shifts in remuneration structuring prompted by the new ‘two-strikes’ rule;
2. Shifts in the use of share–based LTIs;
3. Shifts in the type of LTI instruments used;
4. Shifts in the type of LTI performance hurdles and benchmark indexes adopted;
and importantly,
5. Whether LTI share-based expensing techniques are based on the most appropriate valuation methodology.

5
Previous study
In September 2011 VAA published a high level study on incentive compensation packages paid to executives of ASX listed companies. A sample of 70 companies was studied, 50 from the ASX top 100 and 20 small cap companies, with the aim of providing market based evidence on the design and implementation of Australian executive compensation.
VAA believes that executive compensation should be directly linked to shareholder value creation. Specifically, the study was undertaken to determine whether the structure and implementation of executive compensation packages was in fact linked to value creation and, most importantly, encouraged executives to act in the best interest of shareholders.
The study canvassed several areas of plan design including the overall category split between base salary and ‘at risk’ compensation [i.e. short term incentives [“STI”] and LTIs] and how this split differs between sectors and between executives. Incentive implementation was then analysed, providing data on the use of cash payments, share incentives [e.g. options, performance rights] and non-cash benefits [e.g. car, phone, and parking space]. Also considered were the benchmarks and performance hurdles used to measure the amount of compensation each executive was eligible to receive. Finally, the valuation technique used to value share-based payments was also analysed.
The study results can be found along with further publications on the VAA website: www.vaassociates.com.au

6
14%
7%
8%
13%
10%
17%
8%
20%
1%
2%
The updated study conducted in March 2013 expands the data sample, covering a total of 80 ASX listed companies.
The updated research has focused primarily on long term incentives, in particular:
1. The structure of executive compensation. What proportion of compensation was paid as base salary and what proportion was ‘at risk’;
2. The performance hurdles used to measure executive performance and therefore determine how much compensation the executives are entitled to receive;
3. What valuation method is used to expense share-based executive compensation; and
4. What changes, if any, have occurred since the last study date [September 2011].
Description of data sample
A total of 80 companies were studied. 45 of these were taken from the ASX100, a further 8 from the ASX200 and 27 are considered small cap.
The sample stretched across all of the ten Global Industry Classification System [“GICS”] sectors; Consumer Discretionary, Consumer Staples, Energy, Financials, Health Care, Industrials, Information Technology, Materials, Telecommunication Services and Utilities. Figure 1 displays the representation of each GICS sector in the data sample.
Figure 1: Division of Industries within Data Sample (%)
March 2013 update
Consumer Discretionary
Consumer Staples
Energy
Financials
Health Care
Industrials
Materials
Information Technology
Telecommunication ServicesUtilities
7
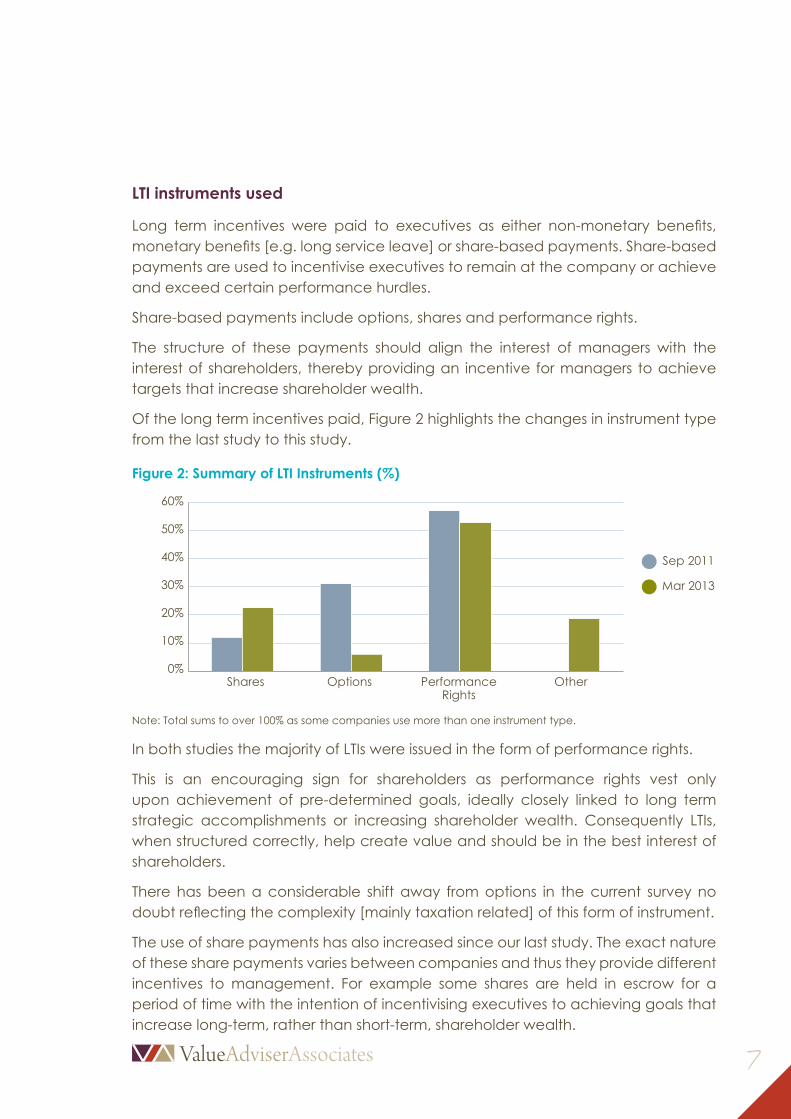
LTI instruments used
Long term incentives were paid to executives as either non-monetary benefits, monetary benefits [e.g. long service leave] or share-based payments. Share-based payments are used to incentivise executives to remain at the company or achieve and exceed certain performance hurdles.
Share-based payments include options, shares and performance rights.
The structure of these payments should align the interest of managers with the interest of shareholders, thereby providing an incentive for managers to achieve targets that increase shareholder wealth.
Of the long term incentives paid, Figure 2 highlights the changes in instrument type from the last study to this study.
Figure 2: Summary of LTI Instruments (%)
60%
50%
40%
30%
20%
10%
0%Shares Options Performance
RightsOther
Note: Total sums to over 100% as some companies use more than one instrument type.
In both studies the majority of LTIs were issued in the form of performance rights.
This is an encouraging sign for shareholders as performance rights vest only upon achievement of pre-determined goals, ideally closely linked to long term strategic accomplishments or increasing shareholder wealth. Consequently LTIs, when structured correctly, help create value and should be in the best interest of shareholders.
There has been a considerable shift away from options in the current survey no doubt reflecting the complexity [mainly taxation related] of this form of instrument.
The use of share payments has also increased since our last study. The exact nature of these share payments varies between companies and thus they provide different incentives to management. For example some shares are held in escrow for a period of time with the intention of incentivising executives to achieving goals that increase long-term, rather than short-term, shareholder wealth.
Sep 2011
Mar 2013

8
LTI performance hurdles and benchmarkingIn order to receive long term incentives, executives are required to achieve particular performance hurdles set by the board. These performance benchmarks can be market based [e.g. total shareholder return] or non–market based. Non-market based measures are further split into financial targets [e.g. EPS growth, profit margins, ROA, ROE] and non-financial targets [e.g. achieving company milestones, leadership, safety].Approximately 68% of companies in our sample used a market based measure [TSR], very similar to the 70% recorded in our last study. Of the companies using TSR, they used either or both an absolute figure measured against a pre-determined target or a relative TSR compared to a benchmark of comparator companies.
When using a relative benchmark, companies measured their TSR against one or more of the following groups:1. A broad based market index [e.g. ASX100, ASX200 Industrials].
2. An adjusted market index [e.g. ASX200 excluding resources].
3. A select group of peer companies which are considered close comparators by the board or remuneration committee.
Each benchmark has its own advantages and disadvantages, dependent upon a large variety of factors such as the sector in which the company operates, the company’s position in its life cycle [e.g. early stage start-up, growing, mature], the number of available peer companies and so forth.
Approximately 7% of companies in our sample use the absolute TSR measure, 41% use relative TSR versus a broad market index, 24% use relative TSR versus an adjusted market index and 37% use relative TSR versus a selected peer group.
Figure 3 highlights the difference in TSR benchmark selection between the two studies. Interestingly the number of companies using one or more benchmarks has increased.
Figure 3: Summary of TSR Hurdles Used (%)
Note: Total sums to over 100% as some companies use more than one benchmark
Absolute
45%
40%
35%
30%
25%
20%
15%
10%
5%
0%Company vs.
broad market index
Company vs. adjusted
market index
Company vs. select peer group
Sep 2011
Mar 2013

9
The number of companies in our sample that use a broad based index has increased. This could be due to the ease of selecting and measuring the performance of a popular broad based index such as the ASX200. Minimal time is required to analyse and select specific comparator companies and performance data is readily available. Additionally no further work is required to monitor or adjust the index. The use of a broad based index does have its drawbacks however, such as containing companies that cannot be considered close peers and some indexes being dominated by particular industries [e.g. ASX200 contains very large number of banks and resource companies].
Selecting a specific comparator peer group on the other hand can be a time-intensive method of selecting a relative TSR benchmark and can give rise to a number of possible biases.
The peer groups selected by companies vary in both size and constituents. Some companies choose a very small peer group [under 10] whilst some opted for a larger sample. We also witnessed examples of peer groups selected which contain companies we would not classify as a close peer [e.g. an industrial company using a financial services company in its peer group].
If the peer group selected is too small, idiosyncratic factors can have a large effect on remuneration outcomes. However if the peer group is too large, it would be simpler to use a broad based index or an adjusted index. Select peer groups also require continued monitoring to ensure the selected companies remain relevant peers – both in terms of exhibited business risks [equity beta] and business structure [main income drivers].
Out of the 68% of companies that use a TSR benchmark, Table 1 displays the split between sectors [e.g. 13% of the companies using a TSR benchmark are in the consumer discretionary sector].
Table 1: Sectors Using TSR Benchmark (%)
Consumer Discretionary 13.0%Consumer Staples 11.1%Energy 7.4%Financials 13.0%Health Care 7.4%Industrials 20.4%Information Technology 7.4%Materials 16.7%Telecommunication Services 1.9%Utilities 1.9%

10
Approximately 50% of companies in our sample use non-market measures and of these, the great majority use an EPS hurdle. This figure is down from 61% of companies using non-market measures in the last study. This could indicate a larger number of companies now using market based shareholder return measures.
A shift towards more directly measurable value creating measures should be considered positive by shareholders. EPS remains the major non-market measure used as it was in the last study.
Valuing and expensing share-based compensation
AASB 2 requires each company using share-based incentives to have them valued so an annual expense can be allocated to the income statement.
As the expense is not directly observable, a valuation model must be used to calculate several unknown factors such as the probability of the TSR exceeding a particular level and the probability of granted options actually being exercised.
Three valuation methods are available: Monte Carlo simulation, the Black-Scholes option pricing model, and the Binomial method.
Some companies prefer to use different models to value different elements [e.g. Monte Carlo simulation to determine the probability of reaching the EPS hurdle and the Black-Scholes model to value the options], whilst other companies prefer the use of a single method for all share-based expenses. Table 2 demonstrates this split.
Table 2: Summary of Valuation Method Used (%)
Black-Scholes 28.75%
Monte Carlo 18.75%
Binomial 2.50%
Monte Carlo and Black-Scholes 22.50%
Black-Scholes and Binomial 1.25%
Monte Carlo and Binomial 1.25%
All three 2.50%
n/a 22.50%
Note: companies that use no valuation technique or do not mention which technique they use are listed as “n/a”

11
Figure 4 displays the use of each valuation model. Interestingly the Black-Scholes technique is the most widely applied method for valuing share-based payments.
Figure 4: Summary of Valuation Model Used (%)
60%
50%
40%
30%
20%
10%
0%Black-Scholes Monte Carlo Bionomial
Note: Total exceeds 100% as some companies use more than one measure.
The use of the Black-Scholes option pricing model is ingrained in the thinking of many accounting firms and CFOs.
Unfortunately, what few appreciate is that the Black-Scholes model is incapable of reliably valuing many LTI plans.
The Black-Scholes model was never designed to handle a performance condition as complex, for example, as benchmarking an entity’s TSR to the S&P/ASX300 constituents.
Employing the Black-Scholes model completely ignores the TSR performance hurdle and therefore overstates the expense.
The only way to reliably value [and therefore expense] LTI plans is through the use of Monte Carlo simulation of the possible outcomes.
The Monte Carlo approach can factor in the likelihood of an entity satisfying the TSR performance hurdles, as required by AASB 2. If the entity does not fully satisfy the TSR performance condition, not all of the underlying instrument [performance rights for example] will vest. In fact, it is possible that none of them will vest. By incorporating these possibilities, the Monte Carlo valuation is lower – but nonetheless more accurate – than Black-Scholes.

12
Why does that matter?
As most CFOs and Remuneration Committee Chairs will be well aware, share-based expenses booked to reflect the TSR component of LTI hurdles are not able to be adjusted or ‘trued up’ to reflect the actual outcome of vesting calculations completed at the end of the performance period.
Specifically, AASB 2 (paragraph 23) does not permit subsequent accounting adjustments if TSR hurdled securities do not vest. As such, it is imperative that the fair value of share-based payments be accurately estimated when the securities are initially granted.
That means that any overstatement of the LTI annual expense as a result of using the Black-Scholes valuation model at the inception of the performance period is permanent – it cannot be reversed and hence reported entity profit performance is unnecessarily and negatively impacted.
Getting the executive remuneration conundrum right is hard enough, let alone taking hits to the bottom line through applying ill-conceived valuation methodologies.
So VAA focuses on the Monte-Carlo based valuation and expensing techniques in all our client valuations.

13
Appendix: Incentive Structure
How executive compensation packages are structured plays an important role, not just in the amount of remuneration received by executives, but more importantly whether the scheme provides incentives that encourage the creation of shareholder value. A well designed compensation system can help mitigate agency problems faced by publicly listed entities through aligning the interest of management and shareholders. Because of this, designing a well-structured compensation system is a crucial part of a company’s corporate governance.
On average, approximately 42% of executive remuneration was paid as base salary [including superannuation], 25% as STI, 28% as LTI and 5% as other [mainly non-monetary benefits]. Figure 5 highlights the comparison between the results of this study and last study.
Figure 5: Summary of Average Remuneration Structure
The base salary component has decreased notably whilst the LTI portion has risen. This may well imply a shift away from paying higher base salaries and instead remunerating executives with higher long term incentives. If the LTIs are structured correctly, shareholders should regard this positively as nearly all LTI payments are directly linked to company performance and shareholder returns, both of which can mitigate agency problems.
This shift toward a higher percentage of executive pay being distributed as LTIs is possibly linked to the ASX’s new ‘two-strikes’ rule which gives shareholders greater power to hold executives accountable on their pay packets. Companies are now facing protest votes from shareholders if they are at all disgruntled about the size and structure of the company’s remuneration package. Judging by the higher proportion of LTI being used by our sample, it suggests incentive schemes are beginning to focus on aligning manager and shareholder interests by linking executive pay to the long term performance of the company and shareholder returns.
60%
50%
40%
30%
20%
10%
0%
Sep 2011
Mar 2013
Base STI LTI Other

14
Incentive structure across sectors
The split of remuneration across sectors is highlighted in Figure 6. Utilities had the highest percentage of base salary and the lowest percentage of LTI. Financials on the other hand had the lowest fixed salary however the ‘at risk’ component was very large, especially STIs.
Figure 6: Summary Remuneration Structure Across Industries
Utilities
Consumer Discretionary
Information Technology
Industrials
Health Care
Energy
Materials
Consumer Staples
Telecommunication Services
Financials
0% 10% 20% 30% 40% 50% 60% 70% 80% 90% 100%
Base STI LTI Other

15
This executive remuneration study was undertaken by Kalem Sammut, an Analyst in the VAA specialist team. It is an update of the original research conducted in September 2011.
VAA’s remuneration study provides market-based evidence and thought leadership on the trends within executive compensation and the most efficient way for a company to structure their LTI with the ultimate goal of creating value for shareholders.
With the assistance from the information provided by this research, the expert team at VAA are confident in providing an accurate and comprehensive AASB compliant valuation outcome for ASX listed companies’ LTI schemes. In addition VAA can assist companies in the selection of an appropriate peer group, ensuring remuneration policy is effective and valuations are simple and accurate.
About the study

If you want to get your valuations right and your comparator group selection spot on, contact VAA’s remuneration valuation specialists via email or call 1800 912 226.
Melbourne | Sydney | Adelaidewww.vaassociates.com.auFreecall 1800 912 226Value Adviser Associates Pty Ltd | ABN 54 131 852 607
Nick Burrows CFO [email protected]
Gareth Thompson Senior Analyst [email protected]
Kalem Sammut Analyst [email protected]