asx release 2009 annual report for personal use only€¦ · melbourne cbd, which is expected to...
TRANSCRIPT

Tatts Group Limited ABN 19 108 686 040 615 St Kilda Road, Melbourne, Victoria, 3004, Australia
Locked Bag 888, St Kilda Road Central, Melbourne, Victoria, 8008, Australia Tel: 61 3 8517 7777 Fax: 61 3 8517 7752
www.tattsgroup.com
28 September, 2009
ASX RELEASE
2009 Annual Report
Attached is a copy of the Company’s Annual Report for the year ended 30 June 2009, which will be dispatched to shareholders today. The Company’s Annual Report will be available for download from the Company’s website at www.tattsgroup.com/investors. Contact: Michael Mangos – General Manager, External Communications – 0419 551 980 Gary Woodford – General Manager, Investor Relations – (03) 8517 7530
For
per
sona
l use
onl
y

Annual Report 2009
For
per
sona
l use
onl
y

Tatts is a network of neighbourhood based businesses that reach out to our customers through advanced wide area technology
ContentsHighlights 1Chairman’s Report 2Review of Operations 4Community, Environment and Employees 10Corporate Governance Statement 12Directors’ Report (including Remuneration Report) 18
Financial Statements 39Notes to the Financial Statements 43Directors’ Declaration 102Independent Auditor’s Report 103Shareholder Information 105Corporate Directory and Shareholder Calendar 107
Tatts is committed to ensuring the responsible delivery of our products and services
Tatts Group Limited ABN 19 108 686 040
For
per
sona
l use
onl
y

1
www.tattsgroup.com
The earnings from Tatts’ portfolio of networked gambling businesses have again proven to be reliable and robust. Our licences provide the underlying business stability, while our core business strengths, strong balance sheet and conviction of our people positions the business to optimise our future.
NPAT $277.4 million up 7.7%
Net Debt to EBITDA of around 1.2 times
Dividend Payout Ratio of 96%
For
per
sona
l use
onl
y

2 | Tatts Group Limited Annual Report 2009
The cornerstone of Tatts’ ability to deliver an improved financial result over the past year is our collection of strong businesses with a track record of performance under all conditions. In the 2009 financial year Tatts has delivered:
Group revenue up 5.1%•Group NPAT up 7.7%•Dividends up 5.0%•
Contributions to the group result have come from all parts of the business. The ensuing pages of this report provide more colour in respect of each business unit, however it is worth briefly highlighting a few standout performances.
Tatts Lotteries has had an unprecedented year to again demonstrate its ability to cut through any macro economic waves. The business has adapted well to the introduction of competition in Victoria, and its consistency of earnings through difficult times has been impressive. The strong run of jackpots in Powerball in 2008 has now been exceeded by the run in Oz Lotto – the financial year concluding with an Australian record $106 million jackpot.
UNiTAB Wagering has delivered sustained growth over a long period, and the 2009 financial year has been no different. The strong percentage increase in revenue over the prior financial year was largely due to the expected return to long term growth rates following the disruption to racing from equine influenza during 2007.
The gaming industry in Victoria is constantly at the centre of attention for public scrutiny and ever more restrictive regulation. In this environment, Tatts Pokies remains focussed on optimising profitability to the end of the licence in 2012. This clear direction has seen Tatts Pokies deliver its best ever financial performance. To perform so strongly in a continually challenged environment is testament to the dedication of management and employees within this business and the willingness of players to voluntarily commit part of their disposable incomes to playing the gaming machines which largely fund the entertainment provided by neighbourhood hotels and clubs, as well as a host of related sporting and social activities.
The world financial turmoil has hit particularly hard in the United Kingdom placing pressure on our U.K. business, Talarius. Signs are emerging in more recent periods that the business is recovering. We continue our strategy to invest moderately in the business to position Talarius to ride the economic recovery. Our commitment to the long term prospects of this business remains unchanged.
Meanwhile, our South African business experienced the disappointment of not being issued a gaming operator licence in the important Gauteng province, which covers the city of Johannesburg and surrounds. The business is now concentrating on the continued success of the two provinces in which we do operate, namely KwaZuluNatal and Western Cape, and will seek any further licence opportunities should they present.
Tatts’ neighbourhood gambling businesses rely on its wide area technology to distribute its services. Tatts retains a strong in-house technology skill base with a proven ability to economically deliver reliable and high quality systems and is committed to a continual
Chairman’s Report
30 June 2009 30 June 2008 30 June 2007 30 June 2006
A$m A$m A$m1 A$m
Revenue 3,252.5 3,094.2 2,412.6 1,855.2
Statutory Charges – Government – Other
1,479.7
625.7
1,439.5
603.2
1,119.7
504.0
1,018.3
442.2
Operating Costs 587.7 535.7 396.6 172.8
EBITDA 559.4 515.8 392.3 221.9
NPBT 400.5 370.6 330.4 188.8
NPAT 277.4 257.6 231.2 128.5
Cents Cents Cents Cents
Earnings per Share2 21.9 20.4 20.9 18.3
Dividend per Share 21.0 20.0 18.0 16.25
Dividend Payout Ratio 96.0% 98.2% 98.5% 89.3%
1. The 30 June 2007 reported result has been adjusted to exclude the impact of the settlement of the Trustee Commission Claim and the resulting special dividend of 4 cents per share.
2. The EPS was calculated using the weighted average number of shares on issue through the year of 1,266.50m.
A strong and consistent business delivering excellent margins from ongoing development of technology and customer service
For
per
sona
l use
onl
y

3
www.tattsgroup.com
investment in technology infrastructure and extending this core competency across the businesses.
The development of our own lottery system utilising our existing wagering backbone will deliver considerable savings and operational advantage over the next three years. Tatts’ technology team has also adapted our proprietary Maxsys gaming machine monitoring system for Talarius in the UK, again using the company’s strong technological infrastructure for the benefit of the group as a whole.
Underpinning Tatts’ financial performance and strategic direction is a disciplined and measured approach to financial management.
Tatts’ balance sheet remains extremely strong, with considerable capacity to undertake appropriate strategic acquisitions at realistic prices. At 30 June 2009, Tatts has EBITDA to net interest of approximately 11.4 times, a net debt to EBITDA ratio of around 1.2 times, and our cash flow generation is first class. Importantly, we have successfully structured the maturities on our existing debt facilities to June 2011 and 2013 to remove exposure to refinancing in these current difficult times.
Potential opportunities ahead for Tatts are emerging for each of our businesses. Tatts has an enviable balance sheet, strong financial disciplines and a proven ability to use its technical and operational expertise to deliver high volume transaction services. We have previously indicated our intention to consider opportunities outside the gambling industry that leverage our core expertise. We will continue to apply rigorous criteria in determining which, if any, opportunity we actively pursue.
OutlookUndoubtedly, the 2010 financial year will not be an easy one. However, our businesses have a long history of proven performance through all market conditions, and whilst growth rates are expected to moderate in the short term, we see no reason why growth should not continue.
As indicated, our future is not limited to organic growth alone. Where appropriate, we will continue to seek out earnings accretive strategic opportunities as we strive to further improve shareholder value and returns.
Importantly for shareholders, your Board has maintained its policy of paying out a high
proportion of profits as dividends. Tatts has delivered 21 cents per share for the 2009 financial year (previously 20 cents), representing a 96% payout ratio. Subject to trading conditions and actual financial performance, the Board remains committed to maintaining a high payout ratio in the near term.
It is important to recognize that we have experienced directors, management and employee teams in place throughout Australia and overseas who are helping shape the business as it is today and positioning us well for the initiatives and challenges of tomorrow.
The journey ahead promises to be exciting and stimulating.
Harry Boon
Chairman
Tatts Lotteries highlights the benefit that is achievable from the central management of fragmented businesses
Optimising business performance to 2012
With 23% of Australian TAB betting, UNiTAB is well positioned in responding more aggressively to the changing wagering landscape
For
per
sona
l use
onl
y

4 | Tatts Group Limited Annual Report 2009
Tatts Pokies had one of its best years since 2000, with EBIT up 10.5% to $215.6 million for the 2009 financial year. Revenue for the year was up 1.8% to $1.3 billion.
The improvement in EBIT largely came from a focus on minimising controllable costs. These costs in Tatts Pokies reduced by 17.7%, and are expected to further reduce as we move closer to the end of the current licence in 2012.
Tatts Pokies offers a form of entertainment, the level of which is heavily influenced by household disposable income. As with most retail and entertainment based companies, Tatts Pokies appears to have gained some benefit from lower interest rates, stabilised petrol prices, and the Federal Government stimulus payments during the year.
Tatts Pokies has a relatively modern network of electronic gaming machines (EGMs) as a result of the significant investment leading up to last financial year. Future expenditure will focus more on jackpot licence renewals and game replacements to ensure we provide our customers with quality product over the remaining years of our existing licence.
Meanwhile, we have maintained the commitment to invest in previously announced new venue developments. The Lynbrook Tavern commenced operations in August 2009, with
up to 55 EGMs expected to be installed in the venue by December 2009.
The Brook Club at Point Cook opened for trade in June 2009, operating with 80 EGMs. Construction has also commenced on the West Waters Hotel in Caroline Springs, which has approval for the deployment of 80 EGMs and is expected to be operational by early 2011. These developments in Point Cook and Caroline Springs will enable Tatts Pokies to continue to improve facilities and services to residents in the western suburbs growth corridor.
Approval has recently been granted for 80 EGMs for the Mail Exchange Hotel in the Melbourne CBD, which is expected to open in September 2010.
Tatts Pokies has a further 79 EGMs approved for relocation and deployment throughout the network, and an additional 161 EGM applications currently awaiting hearings by, or decisions from, regulatory authorities.
Nevertheless, it is likely that Tatts Pokies will remain below the 13,750 EGM cap throughout the 2010 financial year. At 30 June 2009, we had 252 venues housing 13,326 EGMs.
The 2010 financial year will undoubtedly provide some challenges for a business dependent on discretionary income. With the Tatts Pokies licence set to expire in 2012, the focus will continue on optimising the returns
from the network in the remaining years. This may result in underperforming EGMs being removed to avoid uneconomic fixed charges and government fees, as has already occurred in some instances this year. With a clear focus on reducing costs and maximising the EGM network in operation, we remain confident that Tatts Pokies is well positioned to continue to deliver strong profitability and cash flow.
30 June 09 30 June 08
A$m A$m
Revenue 1,292.2 1,268.9
Total Expenses
1,053.4
1,042.8
EBITDA 238.8 226.1
Depreciation & Amortisation
23.2
30.9
EBIT 215.6 195.2
Tatts Pokies
Optimising the EGM network to improve profitability and cash flow
Controllable costs reduced by 17.7%
For
per
sona
l use
onl
y
5
www.tattsgroup.com
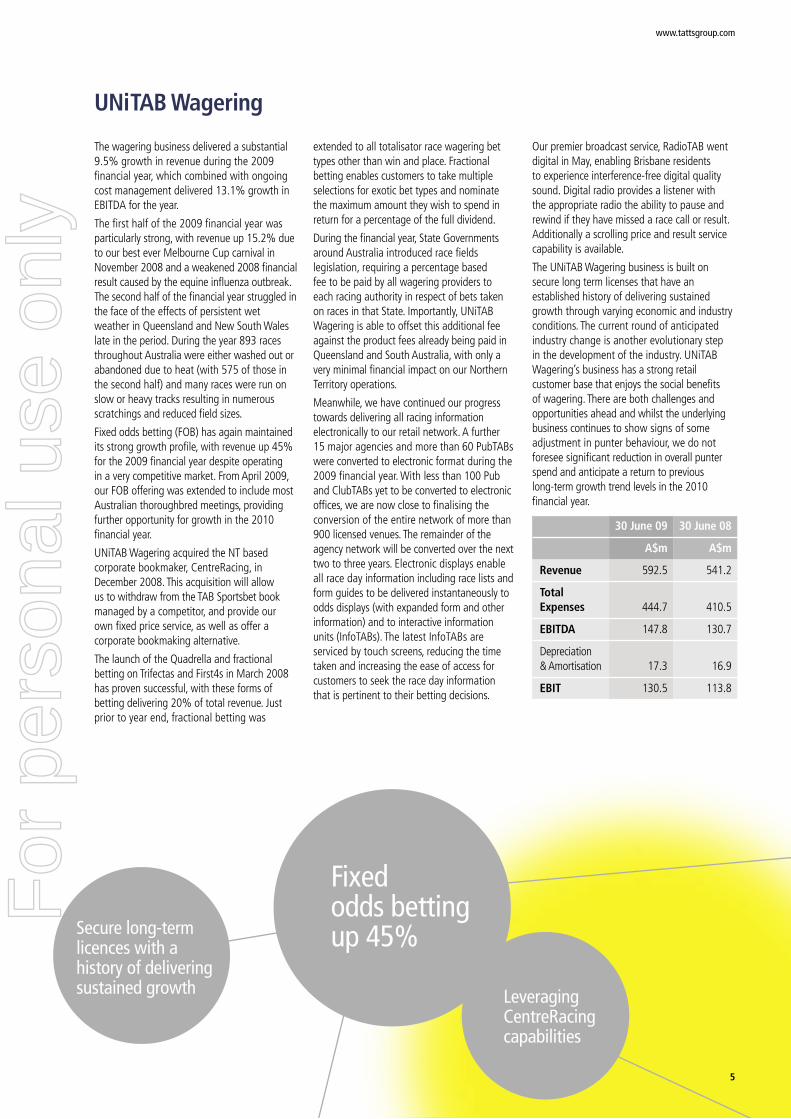
The wagering business delivered a substantial 9.5% growth in revenue during the 2009 financial year, which combined with ongoing cost management delivered 13.1% growth in EBITDA for the year.
The first half of the 2009 financial year was particularly strong, with revenue up 15.2% due to our best ever Melbourne Cup carnival in November 2008 and a weakened 2008 financial result caused by the equine influenza outbreak. The second half of the financial year struggled in the face of the effects of persistent wet weather in Queensland and New South Wales late in the period. During the year 893 races throughout Australia were either washed out or abandoned due to heat (with 575 of those in the second half) and many races were run on slow or heavy tracks resulting in numerous scratchings and reduced field sizes.
Fixed odds betting (FOB) has again maintained its strong growth profile, with revenue up 45% for the 2009 financial year despite operating in a very competitive market. From April 2009, our FOB offering was extended to include most Australian thoroughbred meetings, providing further opportunity for growth in the 2010 financial year.
UNiTAB Wagering acquired the NT based corporate bookmaker, CentreRacing, in December 2008. This acquisition will allow us to withdraw from the TAB Sportsbet book managed by a competitor, and provide our own fixed price service, as well as offer a corporate bookmaking alternative.
The launch of the Quadrella and fractional betting on Trifectas and First4s in March 2008 has proven successful, with these forms of betting delivering 20% of total revenue. Just prior to year end, fractional betting was
extended to all totalisator race wagering bet types other than win and place. Fractional betting enables customers to take multiple selections for exotic bet types and nominate the maximum amount they wish to spend in return for a percentage of the full dividend.
During the financial year, State Governments around Australia introduced race fields legislation, requiring a percentage based fee to be paid by all wagering providers to each racing authority in respect of bets taken on races in that State. Importantly, UNiTAB Wagering is able to offset this additional fee against the product fees already being paid in Queensland and South Australia, with only a very minimal financial impact on our Northern Territory operations.
Meanwhile, we have continued our progress towards delivering all racing information electronically to our retail network. A further 15 major agencies and more than 60 PubTABs were converted to electronic format during the 2009 financial year. With less than 100 Pub and ClubTABs yet to be converted to electronic offices, we are now close to finalising the conversion of the entire network of more than 900 licensed venues. The remainder of the agency network will be converted over the next two to three years. Electronic displays enable all race day information including race lists and form guides to be delivered instantaneously to odds displays (with expanded form and other information) and to interactive information units (InfoTABs). The latest InfoTABs are serviced by touch screens, reducing the time taken and increasing the ease of access for customers to seek the race day information that is pertinent to their betting decisions.
Our premier broadcast service, RadioTAB went digital in May, enabling Brisbane residents to experience interference-free digital quality sound. Digital radio provides a listener with the appropriate radio the ability to pause and rewind if they have missed a race call or result. Additionally a scrolling price and result service capability is available.
The UNiTAB Wagering business is built on secure long term licenses that have an established history of delivering sustained growth through varying economic and industry conditions. The current round of anticipated industry change is another evolutionary step in the development of the industry. UNiTAB Wagering’s business has a strong retail customer base that enjoys the social benefits of wagering. There are both challenges and opportunities ahead and whilst the underlying business continues to show signs of some adjustment in punter behaviour, we do not foresee significant reduction in overall punter spend and anticipate a return to previous long-term growth trend levels in the 2010 financial year.
30 June 09 30 June 08
A$m A$m
Revenue 592.5 541.2
Total Expenses
444.7
410.5
EBITDA 147.8 130.7
Depreciation & Amortisation
17.3
16.9
EBIT 130.5 113.8
UNiTAB Wagering
Secure long-term licences with a history of delivering sustained growth Leveraging
CentreRacing capabilities
Fixed odds betting up 45%
For
per
sona
l use
onl
y

6 | Tatts Group Limited Annual Report 2009
Tatts Lotteries has again demonstrated the resilience of the business model. Total sales revenue for the 2009 financial year was up by 2.3% to $1.1 billion. This is an outstanding result considering sales in the previous year included products no longer available for sale by Tatts Lotteries under the new licence in Victoria – they previously represented approximately 15% of sales in that State.
Importantly, operational leverage continued to improve with controllable costs representing only 6.4% of total sales. EBITDA for the financial year was well ahead of the 2008 financial year, up 12.7% to $118.8 million. This result was all the more impressive considering we donated to the Alfred Hospital Burns Unit our share of the proceeds from the Tattslotto Bushfire Benefit Draw held in Victoria on 21 February 2009.
In Victoria, Tatts Lotteries completed a smooth transition to the new competitive lottery market from 1 July 2008. In the first year of the new ten year licence, Tatts Lotteries exceeded the licence sales performance target by 10.6%.
Oz Lotto (marketed as Super 7’s Oz Lotto and Oz 7 Lotto) has had an extraordinary year, reporting the strongest ever growth across the entire product range with sales up 82.7%. Oz Lotto started the financial year with an unprecedented $50 million jackpot roll. Strong sales continued throughout the year with a further $40 million jackpot achieved. The financial year ended even stronger with an incredible $106 million jackpot – a record for the Australian lottery market.
The run of high jackpots was not replicated in Powerball. There was only one $20 million jackpot during the financial year, which is below the statistical expectations of the game. As a result, following Powerball’s record-breaking $50 million jackpot roll in the previous financial year, the lower jackpot activity during 2009 resulted in a decline in sales of 22.3% on the 2008 financial year.
This year has seen a resurgence in Tatts Lotteries’ most popular game, Saturday Lotto (marketed as Saturday Tattslotto and Saturday Gold Lotto). The game achieved sales 4.5% above the previous year, benefitting from a price increase and new Superdraw strategies. Wednesday Gold Lotto (a Queensland only game) also performed well, with sales 5.4% above the previous year.
In October 2008, Monday and Wednesday Lotto was launched in Victoria, ACT, NT and Tasmania. Following the initial start up phase, sales of this product now exceed the sales of the previous Wednesday only Tattslotto game.
During the year, Tatts Lotteries launched and rolled out 174 TattsQuick outlets into 7-Eleven stores across Victoria. The TattsQuick outlets complement the existing retail network and extend the reach to a broader untapped market across longer trading hours.
Tatts Lotteries also introduced Golden Casket Instant Scratch-Its tickets into Tasmania and NT during the year. These jurisdictions have embraced these new products, and sales have already exceeded those of the previous financial year’s Tatts Scratchies by 16.6%. This early success has helped to boost Golden Casket’s total Instant Scratch-Its sales to 5.1% higher than in the 2008 financial year.
Business integration of the various lotteries gained momentum during the financial year, including the establishment of a national lottery customer contact centre, and centralised distribution, marketing and advertising functions. New retail terminals were rolled out to Queensland agents together with a new telecommunications network across all Tatts Lotteries’ jurisdictions.
Meanwhile, work continues on the long term project to develop a new in-house lottery system that will provide a common technology platform for the lottery businesses, reduce third party licensing fees, and deliver better control
over product enhancement and development cycles. This project continues to progress as planned following the Victorian internet application successfully moving into production in May 2009. The retail application is scheduled to roll out in Victoria during 2010 and Queensland during 2011.
Players also appreciated the convenience and security of Tatts Lotteries’ internet sites with internet sales enjoying good growth and now contributing around 4% of sales of total lotto style games. Player convenience was further enhanced with the ability for players to access our web sites for purchasing via internet-enabled mobile phones and small-screen devices.
The underlying lottery business continues to improve, with average spend per player steady or improved across the product range and the total number of tickets sold increasing. Combined with continued tight management, we are confident that the 2010 financial year will again be a positive year for the Tatts Lotteries business.
30 June 09 30 June 08
A$m A$m
Revenue 1,070.7 1,046.5
Total Expenses
951.9
941.1
EBITDA 118.8 105.4
Depreciation & Amortisation
10.3
11.7
EBIT 108.5 93.7
Tatts Lotteries
Strong underlying business performance further benefiting from astonishing jackpot activity
For
per
sona
l use
onl
y

7
www.tattsgroup.com
Maxgaming revenue for the year grew 3.9% to $117.8 million and EBITDA increased by 1.6% to $65.3 million.
The financial year was marked by the release of a number of new systems and the continued development of new technologies that will lay the foundation for future expansion.
Investment in technology and a commitment to superior service levels continues to be at the heart of defending our Queensland market share, which finished the year at 82%.
A card based cashless gaming system, Simplay, received rollout approval from the Queensland regulator in May 2009. Marketplace acceptance has been overwhelming. In the limited period to 30 June 2009 contracts have been signed with 37 venues covering over 3,200 EGMs, and demand continues to be strong. In addition to its card based cashless gaming facility, Simplay also provides players with a suite of pre-commitment tools to assist management of spend and play time. The system also offers venues substantial cash handling and customer service advantages.
The second half of the financial year also featured the rollout of Stand Alone Play technology to New South Wales statewide linked venues, which allows linked EGMs to remain playable in the event of an interruption to the statewide linked communications network or host system.
Total New South Wales monitored devices stand at 97,934 down 1,285 units over the
previous year, while statewide linked EGMs were also down by 276 units to 4,067. In response, our focus was on diversifying our statewide linked products and improving business efficiencies such as the EGM term purchase and game/link package called Maximise which was launched in conjunction with Aristocrat. Similar arrangements are now in place with other machine manufacturers. The package provides venues with a ‘no upfront’ cost option to buy EGMs and has proven to be very popular.
Following on from success in the club market, Wheel of Fortune was successfully launched in conjunction with IGT to the hotel market in April where strong performance is leading to continued growth. A further highlight was the May launch of the Panthers Group fraternal link which, with over 200 EGMs, is the largest club fraternal jackpot link in New South Wales.
This financial year the Maxgaming Integrated Gaming System project (Maxsys) delivered its first releases of new technology and applications to Maxgaming. The introduction of web-based reporting and analysis tools for venues is creating additional revenue opportunities, as well as operational efficiencies for Maxgaming through automation of many manual tasks associated with past report preparation and distribution methods. Three separate billing systems were also retired with the introduction of the Maxsys billing and administration system. The continual retirement of legacy systems will mean reduced costs of support and maintenance in the future.
While there has been a dedicated focus on providing internal operational efficiencies and revenue opportunities, successful technical trials of the new Maxsys monitoring hardware were also completed in New South Wales.
Maxgaming is also leveraging its technology and expertise for the benefit of the broader Tatts group, implementing the Maxsys monitoring system for Talarius in the United Kingdom.
The underlying technology of Maxsys provides a ‘future proof’ foundation that will enable the continual development of new and exciting revenue generating opportunities to any jurisdiction and provide the most efficient operational processes to complement it.
30 June 09 30 June 08
A$m A$m
Revenue 117.8 113.4
Total Expenses
52.5
49.1
EBITDA 65.3 64.3
Depreciation & Amortisation
24.3
24.3
EBIT 41.0 40.0
Maxgaming
Monitoring over 133,000 EGMs
The launch of Simplay has delivered card based cashless gaming with pre-commitment capability
For
per
sona
l use
onl
y

8 | Tatts Group Limited Annual Report 2009
Tatts International
United KingdomThe 2009 financial year has been a difficult trading period. The global financial crisis has seen the UK economy enter recession with the effects particularly felt in the high streets of the UK. This follows the dual effects of the earlier ban on smoking in venues and the reduction in size of maximum bet and payout from EGMs.
As a result, in our first full year of ownership, revenue reached A$99.8 million and EBITDA A$11.2 million.
Whilst the result is disappointing, the business has stabilised and signs are emerging of a steady business recovery aided by some positive regulatory change.
A Value Added Tax (VAT) holiday in the UK provides some temporary relief from the end of calendar year 2008. More importantly long term, the UK Government recently approved the increase of the £1 maximum bet and £70 maximum payout on the bulk of our EGMs. Critically, recent investment by Talarius means it is well placed to move quickly and economically in converting our EGMs to the new configuration.
We have moved to further strengthen our market position and place the business in a strong position to ride the recovery. Specifically we have:
An additional 30 venues since last year to •complement the existing network. Talarius now has 218 venues operating 8,478 EGMs;
Restructured and strengthened our •operations through the recruitment of experienced leaders in the gaming, hospitality and leisure industries;
Continued to invest in new product •acquiring over 400 new EGMs and converting around 800 EGMs to the higher stake and prizes; and,
Rejuvenated the Talarius Quicksilver venues, •offering more contemporary gaming environments.
Talarius has also completed a strategic review of the online business Cyberslotz, resulting in the re-launch of the new and expanded online platform Quicksilvergames.co.uk. The re-launched platform, under the Quicksilver brand, now reaches a much wider target audience, is scalable and has the ability to offer broader online gaming solutions.
Talarius is currently in the process of introducing Maxgaming’s Maxsys system throughout the network. The Maxsys infrastructure will introduce EGM monitoring to the business to enable management to better manage and understand the performance of EGMs and venues throughout the network.
The 2010 financial year is shaping as a better but still difficult period. Whilst the timing of the economic recovery is uncertain, the investment by Talarius in infrastructure, people, and processes is positioning Talarius to maximize its recovery potential.
South AfricaThe South African operations have again performed strongly with revenue up 26.8%
to A$38.9 million and EBITDA up 49.2% to A$5.9 million.
The successful deployment of EGMs in KwaZuluNatal (KZN) has continued. Holding a licence to operate 1,000 EGMs, 653 EGMs have now been rolled out, an increase of 77.4% over the previous year. The EGMs are operating in 136 venues with net machine revenue (NMR) currently averaging 332 Rand per EGM per day.
As at 30 June 2009 the performance of EGMs in Western Cape is down slightly on the previous year with NMR now averaging 559 Rand per EGM per day. With Western Cape operations having been in existence longer than KZN, Western Cape is near its cap of 1,000 EGMs, with 928 EGMs operating in 200 venues.
The 2010 financial year will see the continued roll out of EGMs in the jurisdictions in which we currently operate, contributing to further improvement in profitability. We will also actively pursue further operational opportunities outside our current jurisdictions as they emerge.
30 June 09 30 June 08
A$m A$m
Revenue 139.3 81.3
Total Expenses
123.4
70.9
EBITDA 15.9 10.4
Depreciation & Amortisation
18.2
7.9
EBIT (2.3) 2.5
Investment in infrastructure, technology and people has strengthened our market position in the UK
For
per
sona
l use
onl
y

9
www.tattsgroup.com
Bytecraft’s reported revenue of $70.0 million and EBITDA of $5.7 million reflect the reduction of margins on inter-company charges within the group, not operational performance.
In fact, Bytecraft achieved growth in its externally generated revenue (from non- Tatts Group companies) during the 2009 financial year, which now takes externally generated revenue to a pleasing 53% of total revenue.
Importantly, Bytecraft has moved to secure a strong future with the majority of key external customers signing extended contracts, securing the business beyond 2012. Simultaneously, Bytecraft has ensured its ability to continue to meet service level requirements through an extended collective agreement with employees, providing workforce security and embracing the terms and conditions of the new Fair Work Act.
In addition, the upgrade to Bytecraft’s BSuite web based service management system has been completed. The BSuite proprietary system provides efficiency gains and improved functionality to the Bytecraft operation with field technicians now having real time access to customer account information, service call data, spare parts availability, automated billing processes, contract cost allocation and project scheduling. The system is an integral part of ensuring Bytecraft continues to provide high levels of customer service and satisfaction as the business expands.
The 2010 financial year again looks promising for Bytecraft. A majority of key existing customers are signed to long term contracts providing a secure base. In addition, there are also indications that the economic conditions are prompting retailers and financial institutions
to re-evaluate their technical support servicing requirements, paving the way for Bytecraft to actively seek out new opportunities.
30 June 09 30 June 08
A$m A$m
Revenue 70.0 74.3
Total Expenses
64.3
66.1
EBITDA 5.7 8.2
Depreciation & Amortisation
1.7
1.8
EBIT 4.0 6.4
Bytecraft
Focused on high levels of customer service and satisfaction
Security through long term contracts
53% of revenue from external sourcesF
or p
erso
nal u
se o
nly

10 | Tatts Group Limited Annual Report 2009
Responsible GamblingTatts takes seriously its obligation to provide its services in a responsible manner. Tatts promotes the responsible use of its gaming, wagering and lottery services in all its trading jurisdictions. Tatts achieves this through collaboration with all relevant stakeholders, including representatives of the community, counselling and welfare agencies; gambling industry associations; local Government; state Government policy makers and regulators.
We recognise that a very small minority of gamblers have difficulty controlling their behaviour. New player protection and harm minimisation measures continue to be implemented on a regular basis to protect customers from the consequences of problem gambling.
Responsible Gambling Codes of Conduct exist in each of Tatts’ trading jurisdictions. These codes contain a variety of measures that respond to community expectations in regard to player protection and harm minimisation. These measures include responsible gambling information, game rules, advertising restrictions, customer complaint mechanisms and self-exclusion programs to name a few.
Community SupportFollowing several decisions by the Victoria Government in the preceding year that adversely impacted Tatts’ business, significant cuts were made to Tatts’ corporate sponsorship activities. The group’s corporate sponsorships have largely been curtailed apart from contracted arrangements with the Tatts Cox Plate, Tattersall’s Park in Hobart and a commitment to selected programs in the Northern Territory.
Corporate activity aside, Tatts continues to make a significant contribution to the community.
The Tattersall’s George Adams Foundation provided donations of approximately $2 million to a variety of community projects and programs. Beneficiaries of the Foundation’s philanthropic activities included Very Special Kids, Royal Women’s Hospital and Orchestra Victoria’s provincial program.
Golden Casket continued to fulfil its commitment to donate $10 million to three specified charities in Queensland over a three year period ending in the 2010 financial year. This year’s donation of $3.5 million was shared equally by the Starlight Children’s Foundation, Royal Children’s Hospital Foundation and Mater Foundation.
Golden Casket also continued its annual allocation of $1.5 million to child health and wellbeing. The Royal Children’s Hospital Foundation and the Mater Children’s Hospital each received $500,000 with the remainder distributed by Queensland Health to children’s health projects across Queensland.
Following the devastating Victorian bushfires, Tatts raised $441,000 for the Alfred Hospital Burns Unit from the Tattslotto Bushfire Benefit Draw held on 21 February 2009. The money raised included Tatts’ Victorian proceeds from this dedicated Tattslotto draw.
This money helped the hospital to continue to provide its expert care for the bushfires’ most seriously injured victims at the time, as well as help with the future redevelopment of the Burns Unit into a state-of-the art facility for Victorians suffering from burns.
EnvironmentTatts’ response to the environmental issues facing society continues to evolve and develop.
As a wide area network company, Tatts does tread relatively lightly on the planet. Initial estimates have identified that Tatts’ total greenhouse gas emissions and energy consumption levels are significantly below the legislative reporting thresholds.
Nonetheless, Tatts’ goal is to continue to rationally reduce our footprint to ensure the long term sustainability of our products and services. Initiatives to date have included:
Converting our products and services from •paper to electronic systems, with UNiTAB Wagering achieving over 60% of its betting sales with electronically delivered racing information last year;
Adopting virtual server platforms in our •database centres to reduce the draw on power supplies;
Communicating electronically to over 90% •of our shareholders;
Supporting reforestation through donations •to the E-Tree program run by Computershare;
Engaging employees to formulate and drive •intra-site impact reduction initiatives to help deliver Tatts’ goal; and,
The ongoing review of office requirements •and consumption levels.
Updates on progress with environmental issues are provided to the Audit, Risk and Compliance Committee.
EmployeesTatts has set performance targets for Occupational Health and Safety (OH&S) based on comparison with similar occupations and industries. The key measure is Lost Time Injury Frequency Rate and Tatts’ performance has improved consistently during the past 12 months. The annual averages for Tatts overall and for the business units where work involves the greatest health and safety risks are below external industry benchmarks. The Board reviews reports of all injuries, near misses and workers compensation claims each month. Tatts’ approach to management of health and safety for employees includes active local OH&S committees, regular audits to eliminate hazards and education for all employees and managers on safe work practices.
Community, Environment and Employees
For
per
sona
l use
onl
y

11
www.tattsgroup.com
Corporate Governance Statement 12Directors’ Report (Including Remuneration Report) 18Auditor’s Independence Declaration 38Income Statements 39Balance Sheets 40Statements of recognised Income and Expenses 41Cash Flow Statements 42Notes to the Financial Statements 43Directors’ Declaration 102Independent Auditor’s Report 103Shareholder Information 105Corporate Directory 107Dividend History 108Shareholder Calendar 108
Underpinning the group’s financial performance and strategic direction is a disciplined and measured approach to financial management
For
per
sona
l use
onl
y

12 | Tatts Group Limited Annual Report 2009
Corporate Governance StatementThe Board recognises the importance of good corporate governance and establishing accountability of the Board and management.
The Board is reporting against the ASX Corporate Governance Council’s Corporate Governance Principles and Recommendations 2007 (ASX Recommendations). Tatts Group Limited (the Company or Tatts Group) and its subsidiaries’ (Group) corporate governance policies centre around the Board, the Board committees and the principles that govern their interaction with, and oversight of, management. The Board is satisfied with the Group’s application of the principles in the ASX Recommendations and that the Group’s corporate governance framework, policies and practices will ensure the continued effective management and operation of the Group.
Tatts Group’s corporate governance framework, policies and practices will remain under regular review as expectations and requirements develop to ensure that Tatts Group continues to comply with industry practice.
The Role of the BoardThe Board is committed to act in the best interests of Tatts Group to ensure that the Group is properly managed and consistently improved.
The principal role of the Board is to:
Protect and enhance the interests of shareholders;•
Influence and monitor strategy;•
Oversee the management of Tatts Group and evaluate the performance of the Managing Director/Chief Executive and other executives;•
Provide guardianship of Tatts Group’s corporate values;•
Monitor the integrity of financial reporting;•
Oversee risk management and legal compliance; and•
Oversee shareholder communications.•
Board CompositionThe minimum number of Tatts Group Directors is three and the maximum number is nine unless the shareholders resolve to vary that number. Tatts Group Directors are elected at Annual General Meetings of Tatts Group. The Board resolved, effective upon George Chapman’s retirement, that it be comprised of seven members. The Board currently comprises six Non-executive Directors and the Managing Director/Chief Executive. All Directors have entered into appointment agreements and deeds of indemnity, insurance and access.
The Managing Director/Chief Executive will not retire by rotation. Provided that Tatts Group has three or more Directors, one third of the Directors (rounded down to the nearest whole number) will retire at each Annual General Meeting. In any case, no Director may retain office for more than three years or after the third Annual General Meeting following the Director’s appointment, whichever is the longer period. In each case, the retiring Director may then seek re-election.
Board CharterThe Board has developed a charter to provide a framework for the effective operation of the Board. The charter addresses the following matters:
Responsibilities of the Board;•
Relationship between the Board and management;•
Appointment and role of the Chairman;•
Composition of the Board;•
Performance of the Board;•
Board committees;•
Board meetings; and•
Access by Directors to independent advice.•
The Company has established the functions reserved to the Board and these are contained in its charter. The Chief Executive and senior executive group, who are accountable to the Board, are responsible for matters which are not specifically reserved to the Board, which can be summarised as the day-to-day operation and management of the Group.
The Board charter can be found at www.tattsgroup.com/investors.
Independence of DirectorsEach member of the Board is required to apply independent judgement to decision making in their capacity as a Director. A Non-executive Director will be considered independent by the Board if no relationship exists between the Director and Tatts Group that may interfere with the exercise of their independent judgement. The Board considers the factors outlined below when assessing the independence of each Non-executive Director, being whether:
For
per
sona
l use
onl
y

13
www.tattsgroup.com
The Director is or has been a substantial shareholder of the Company or an officer of, or otherwise associated directly with, a substantial shareholder •of the Company;
The Director is or has been employed in an executive capacity by the Group and there has not been a period of at least three years between ceasing •such employment and serving on the Board;
The Director is or has been a material professional adviser or consultant to the Group or an employee materially associated with the service provided •in the previous three years;
The Director is a material supplier or customer of the Group or an officer of, or otherwise associated directly or indirectly with, a material supplier •or customer; or
The Director has a material contractual relationship with the Group other than as a Director.•
Family ties and cross directorships may also be relevant in considering interests and relationships which may compromise a Non-executive Director’s independence. The test of whether a relationship is material is based on the nature of the relationship and the circumstances of the Director. Materiality is considered from the perspective of the Company, the Director and the person or entity with which the Director has a relationship.
The Board considers the factors relevant to assessing independence and determines the independence of its Non-executive Directors, and the Board as a whole, each year. This review has been carried out for this reporting period in respect of members of the Board. All Non-executive Directors were considered to be independent with the exception of Mr Bob Bentley, who is Chairman of Queensland Racing Limited which controls a material supplier to UNiTAB Limited. The Board acknowledges that, in accordance with the ASX Recommendations, it has a majority of Directors (including the Chairman) who are considered to be independent.
Independent Professional AdviceExternal advice may be sought by a Director in accordance with the terms of the Director’s appointment agreement.
Each Non-Executive Director’s appointment agreement provides that:
Professional advice generally in relation to the discharge of the Director’s responsibilities to the Company may be sought;•
The Chairman must be notified before advice is sought;•
Any advice obtained may be given to the Board, if appropriate as determined by the Chairman; and•
The Company will reimburse reasonable expenses where the above procedures have been followed.•
Senior Executive Performance EvaluationThe process for evaluating the performance of senior executives is detailed in the Remuneration Report. A performance evaluation for senior executives, which accords with the process described, has taken place in the reporting period.
Director induction and professional developmentTatts Group has an induction program to facilitate immediate involvement in Board activities by any new Director.
Tatts Group also recognises that Board members must be provided with a range of opportunities for professional development. The Board encourages Directors to identify areas for professional development, and Tatts Group will provide the Directors with sufficient access to appropriate resources.
Board CommitteesThe Board has established appropriate Committees to assist it in the discharge of its responsibilities. However, the Board has not delegated any of its decision making authority to those Committees except as expressly specified in the Committee charters.
Composition of Board Committees
RoleAudit, Risk and Compliance
Governance and Nomination Remuneration
Chairman Brian Jamieson Harry Boon Julien Playoust
Members Lyndsey Cattermole Bob Bentley Bob Bentley
Julien Playoust Julien Playoust Brian Jamieson
Kevin Seymour Kevin Seymour
Other Committees may be established by the Board as and when required. Membership of Board committees will be based on the needs of Tatts Group, relevant legislative and other requirements and the skills and experience of individual Directors.
For
per
sona
l use
onl
y

14 | Tatts Group Limited Annual Report 2009
The Board has reviewed the performance of each Committee for the reporting period. Evaluation questionnaires were completed by the Board and Committee members, and results were compiled on a confidential basis and circulated to Board and Committee members and discussed as relevant. The results confirmed that the Committees continue to function in an appropriate manner.
The charter of each Board committee is available on the Company’s website at www.tattsgroup.com/investors.
Audit, Risk and Compliance CommitteeCompositionThe Chairman and members of the Audit, Risk and Compliance Committee are shown in the previous table. The Board will ensure that an independent Director who is not Chairman of the Board, remains Chairman of the Committee and that the Committee will have between three and six members, the majority of whom are independent Directors.
ResponsibilitiesThe Audit, Risk and Compliance Committee will assist the Board in its oversight responsibilities by monitoring and advising on:
The truth and fairness of the view given by the financial statements of the Group;•
The integrity of the Group’s accounting and financial reporting;•
The Group’s accounting policies and practices and consistency with accounting standards;•
The scope of work, independence and performance of the internal and external auditors;•
Compliance with legal and regulatory requirements;•
Compliance with the Group’s risk policy framework;•
The Group’s control environment;•
Related party transactions;•
The overall efficiency and effectiveness of the Group’s financial operations; •
The Group’s credit policies and operational risk limits; and•
The Group’s overall risk management program.•
External auditorIt is the responsibility of the Audit, Risk and Compliance Committee to review and approve the external auditor’s arrangement for the rotation and succession of audit and review partners, including their approach to managing the transition. The procedure for the selection and appointment of the external auditor and the Committee’s policy for the rotation of external audit engagement partners are outlined in the Audit, Risk and Compliance Committee’s charter and described on the Company’s website at www.tattsgroup.com/investors.
The external auditor must attend the Company’s Annual General Meetings, and be available to answer shareholders’ questions regarding:
The conduct of the audit;•
The preparation and the content of the audit report;•
Accounting policies adopted by the Company in relation to the preparation of the financial statements; and•
The independence of the auditor in relation to the conduct of the audit.•
Governance and Nomination CommitteeCompositionThe Chairman and members of the Governance and Nomination Committee are shown in the previous table. The Board will ensure that the Chairman of the Committee is the Chairman of the Board or an independent Director and that the Committee will have between three and six members, the majority of whom are independent Directors.
ResponsibilitiesThe Governance and Nomination Committee will assist the Board in its oversight responsibilities by monitoring and advising on:
Board composition and succession planning;•
The identification of persons for appointment to the Board;•
The appointment of the Managing Director/Chief Executive;•
The process of reviewing the independence of Directors;•
Board performance evaluation;•
A procedure to address the induction and education needs of Directors;•
Corporate governance developments; and•
The development and implementation of the Group’s code of conduct.•
Corporate Governance Statement (continued)
For
per
sona
l use
onl
y

15
www.tattsgroup.com
Board Performance EvaluationThe Committee has responsibility for organising Board performance evaluation. A Board evaluation process was undertaken during the previous reporting period. An evaluation process was also undertaken of individual Non-executive Directors. It is proposed that a further evaluation of the Board and individual Non-executive Directors will occur in the 2010 financial year.
The evaluation process occurs by questionnaire to Directors. The results are compiled on a confidential basis and discussed by the Board or provided to the relevant Director and the Chairman (and for the Chairman, to the Chairman of the Audit, Risk and Compliance Committee) (Individual Evaluation). The results of the Individual Evaluation for those Directors standing for re-election at the 2009 Annual General Meeting were considered by the Governance and Nomination Committee as were each Director’s external commitments.
Appointment of New Directors and Re-election of Incumbent DirectorsPotential Directors will be nominated for appointment to the Board on the basis of a number of criteria including their identified skills and experience. This information will be communicated to shareholders to assist them in their decision whether to elect the nominee at the relevant Annual General Meeting.
Any person invited to join the Board will enter into an appointment agreement setting out the Director’s duties, rights, responsibilities and the terms and conditions associated with that appointment. All new Directors appointed to the Board will undertake an induction program co-ordinated by the Company Secretary.
The process for re-election of incumbent Directors can be found on the Company’s website at www.tattsgroup.com/investors.
Remuneration CommitteeCompositionThe Chairman and members of the Remuneration Committee are shown in the previous table. The Board will ensure that an independent Director who is not the Chairman of the Board remains Chairman of the Committee. The Managing Director/Chief Executive is an ex-officio attendee of the Remuneration Committee and invited to attend meetings at the request of the Committee members. The Board will ensure that the Committee will have a minimum of three Non-executive Director members and have no more than six members, the majority of whom are independent Directors.
ResponsibilitiesThe Remuneration Committee will assist the Board in its oversight responsibilities by monitoring and advising on:
Non-executive Director remuneration;•
Managing Director/Chief Executive performance review, remuneration, short term and long term incentives;•
Executive remuneration and allocations of short term and long term incentives;•
Employee equity plans;•
Executive recruitment, retention, termination policies and succession planning; •
Remuneration disclosure; and•
Risk management and controls regarding remuneration.•
Risk Management Tatts Group operates a risk management framework that provides the Board with a communication process to continually assure them that risks inherent in the operations and activities of the Group have been prudently managed.
The Board has delegated the review of risk management practices to the Audit, Risk and Compliance Committee. As part of this role, the Committee regularly reviews the effectiveness of the risk management system and reports to the Board on the risk management framework throughout the year. As part of this process, the Board adopted a formal policy to provide a system for managing risks and informing stakeholders.
Tatts Group management team is responsible for identifying risks to the business, developing and implementing risk mitigation strategies and reporting the effectiveness of managing these risks to the Board. Internal Audit provides assurance to management, the Committee and the Board on the adequacy of the risk management and internal control systems. Management reports to the Committee on the material business risks and the extent to which it believes these risks are being managed, at least annually.
Management has identified risks in four core areas: strategic risk, operational risk, financial risk and compliance risk. By way of illustration, management identified a series of operational risks which include:
Narrow markets and reliance on licences;•
Partners and others (e.g. racing industry, Agents and Lottery Bloc);•
Reliance on technology; and•
Reputation/social responsibility.•
For
per
sona
l use
onl
y

16 | Tatts Group Limited Annual Report 2009
Corporate Governance Statement (continued)
Management has also identified particular internal controls to mitigate these risks which include:
Corporate planning and key strategic project implementation;•
The financial practices undertaken pursuant to the policies and procedures such as delegations of authority, budget monitoring and project •performance reports;
The operation and reporting structures of Tatts Group compliance programs in relation to regulatory requirements of Tatts Group businesses •and industry practice which deal with specific areas of risk such as licensing requirements, contractual obligations, OH&S and Treasury risk (further information on Tatts Group’s approach regarding responsible gambling, the environment and OH&S is contained on page 10);
Technology focussed disaster recovery plans and security policy processes and practices and other technology related management structures; and•
An annual review of the insurance program to ensure adequate coverage of insurable risks.•
Internal Audit develops an annual audit program in consultation with management and the Audit, Risk and Compliance Committee which focuses on testing the efficacy of operational, financial and compliance risks. Regular reports are provided to the Board.
For the reporting period, management has reported to the Board, in accordance with ASX Recommendation 7.2, as to the effectiveness of the Company’s management of the Group’s material business risks. The Managing Director/Chief Executive and the Chief Financial Officer have provided assurance to the Board, in accordance with ASX Recommendation 7.3, that the declaration provided in accordance with Section 295A of the Corporations Act 2001 is founded on a sound system of risk management and internal control and the system is operating effectively in all material respects in relation to financial reporting risks. The Board notes that assurance from the Managing Director/Chief Executive and Chief Financial Officer can only be reasonable assurance rather than absolute. This is because of such factors as the need for judgement and limitations on internal controls.
Tatts Group will provide updates to its risk management framework on the Company’s website at www.tattsgroup.com/investors.
Key Policies
Continuous disclosure policyTatts Group is committed to complying with its continuous disclosure obligations under the Corporations Act 2001 and the ASX Listing Rules and releasing relevant information to the market and shareholders in a timely and direct manner.
The Board has adopted a policy which is designed to ensure that information which is not generally available and which may have a material effect on the price or value of the Company’s securities (price sensitive information) is identified and appropriately considered by the Board, where relevant, and senior executives for disclosure to the market. The policy is also designed to ensure accountability at a senior executive level for that compliance. The policy also sets out procedures which must be followed in relation to releasing announcements to the market and discussion with analysts, the media or shareholders.
A summary of the continuous disclosure policy is available on the Company’s website at www.tattsgroup.com/investors. Tatts Group market announcements are also available on the Company’s website after they are released to ASX.
Whistleblower’s policyThe Board has adopted a policy which outlines the steps which Directors and employees should take if they have a genuine suspicion of improper conduct (as described in the policy) regarding Group activities.
A summary of the whistleblower’s policy is available on the Company’s website at www.tattsgroup.com/investors.
Securities trading policy and Securities hedging policyThe Board has adopted a policy which sets out the circumstances in which Directors and employees of the Group may deal in Company securities and enter into transactions in products which operate to limit the economic risk of holding the Company’s securities.
An overriding principle of the policy is that Directors and employees who possess price sensitive information must not deal in Company securities or enter into any transactions in risk limiting products. The policy specifies ‘blackout periods’ during which Directors and employees must not deal in Company securities or enter into transactions in risk limiting products, regardless of whether or not they are in possession of price sensitive information. The policy has limited exceptions (e.g. acquisitions under employee equity plans).
The Company has adopted a policy prohibiting executives from entering transactions which limit that individual’s economic exposure to unvested entitlements under the Company’s long term incentive plan.
A summary of each of the securities trading policy and the securities hedging policy is available on the Company’s website at www.tattsgroup.com/investors.F
or p
erso
nal u
se o
nly

17
www.tattsgroup.com
Shareholder CommunicationThe Board has adopted shareholder communication practices to promote effective communication, ready access to information and ease of participation in general meetings. The Company’s website (www.tattsgroup.com/investors) contains all relevant material (including its policy) and the Company will provide a simultaneous web cast of the Annual General Meeting.
Code of ConductTatts Group is committed to promoting ethical and compliant behaviour among Directors and employees. To this end the Board has adopted a Code of Conduct applying to all Directors and employees. The Code promotes:
Acting with honesty, integrity and fairness;•
Acting in accordance with the law; and•
Using the Group’s property and resources appropriately which includes:•
– promotion of confidentiality;
– avoidance of conflict of interest;
– seeking effective and efficient outcomes for the Group.
The Code of Conduct can be found on the Company’s website at www.tattsgroup.com/investors.
Chairman and Chief Executive (CE)The Chairman is responsible for leading the Board, ensuring Directors are properly briefed on all matters relevant to their role and responsibilities, facilitating Board discussions and managing the Board’s relationship with the Group’s senior executives.
The CE is responsible for implementing Group strategies and policies.
The Board charter specifies that there must be clear division of roles between the Chairman and CE.
CommitmentThe Board held 10 Board meetings during the year. The number of Board and Committee meetings held during each Director’s period of appointment and attended by each Director is disclosed on page 23.
The commitments of Non-executive Directors will be considered by the Governance and Nomination Committee prior to a Director’s appointment to the Board of the Company and reviewed as part of performance assessment.
This Corporate Governance Statement should be read in conjunction with the Director’s Report and the Remuneration Report (contained in the Director’s Report) as those Reports also contain information required to be included by the ASX Recommendations.
For
per
sona
l use
onl
y

18 | Tatts Group Limited Annual Report 2009
Your Directors present their Report on the consolidated entity consisting of Tatts Group Limited (the Company or Tatts Group) and the entities it controls (the Group) at the end of, or during, the year ended 30 June 2009.
DirectorsThe following persons were Directors of the Company during the whole of the financial year and up to the date of this Directors’ Report:
Harry Boon•
Dick McIlwain•
Robert Bentley•
Lyndsey Cattermole AM•
Brian Jamieson•
Julien Playoust•
Kevin Seymour AM•
George Chapman AO retired from the Board on 31 August 2008.
Harry Boon Chairman Non-executive DirectorMember of the Board since 31 May 2005.
Harry retired in 2004 as Chief Executive Officer and Managing Director of ASX listed company Ansell Limited, a position which capped a career spanning some 28 years with the Ansell Group. Harry has lived, and worked in senior positions, in Australia, Europe, the US and Canada, and has broad based experience in global marketing and sales, manufacturing and product development. He is multi lingual and has a strong track record in delivering business results through setting ambitious goals, building the appropriate organisation and relationships and relentlessly pursuing objectives.
Harry holds a Bachelor of Laws (Honours) and a Bachelor of Commerce from the University of Melbourne.
Other Current DirectorshipsHarry is currently Chairman of Gale Pacific Limited (Director since August 2005) and a Non-executive Director of Toll Holdings Limited (Director since November 2006), PaperlinX Limited (Director since May 2008) and Hastie Group Limited (Director since February 2005), all ASX listed companies.
Special ResponsibilitiesChairman of Governance and Nomination Committee
Former Listed Public Company Directorships in last 3 years:Funtastic Limited (September 2004 to February 2007)
Directors’ Report
Harry Boon Dick McIlwainJulien Playoust Brian Jamieson Kevin SeymourLyndsey Cattermole Robert Bentley
For
per
sona
l use
onl
y
19
www.tattsgroup.com
Dick McIlwain Managing Director and Chief ExecutiveMember of the Board since 12 October 2006.
Dick is the Managing Director and Chief Executive of Tatts Group, previously having joined UNiTAB as Chief Executive in 1989. He was appointed as a Director of UNiTAB in September 1999.
Dick is a fellow of the Australian Institute of Company Directors and holds a Bachelor of Arts from the University of Queensland.
Other Current DirectorshipsDick is the Non-executive Chairman of Super Cheap Auto Group Limited (Director since May 2004) and Wotif.com Holdings Limited (Director since April 2006), both ASX listed companies.
Robert Bentley Non-executive DirectorMember of the Board since 12 October 2006, previously having been appointed to the UNiTAB Board in July 1999.
Bob has extensive business experience in the racing, pastoral and timber related industries and property development.
Bob was previously Chairman and Managing Director of Austral Plywoods Pty Ltd and Chairman of the Plywoods Manufacturers Association of Australia, Chairman of the Three Codes Racing Industry Coordinating Committee and Chairman of the Statutory Thoroughbred Control Board (from 1992 to 1996).
Other Current DirectorshipsBob is Chairman of Queensland Racing Limited and Chairman of the Australian Racing Board. He is also Vice-Chairman of the Asian Racing Federation and Chairman of Sunshine Coast Racing Pty Ltd.
Special ResponsibilitiesMember of the Governance and Nomination Committee Member of the Remuneration Committee
Lyndsey Cattermole AM Non-executive DirectorMember of the Board since 31 May 2005.
Lyndsey was the founder and Managing Director of Aspect Computing Pty Limited from 1974 to 2003, and a Director of Kaz Group Limited from 2001 to 2004. Lyndsey has also held many board and other membership positions on a range of government, advisory, association and not-for-profit committees including the Committee for Melbourne, the Australian Information Industries Association and the Victorian Premier’s Round Table and as Chairman of the Woman’s and Children’s Health Care Network.
Lyndsey holds a Bachelor of Science from the University of Melbourne and is a Fellow of the Australian Computer Society.
Other Current DirectorshipsLyndsey is a Non-executive Director of Foster’s Group Limited (Director since October 1999), an ASX listed company. She is also the Chairman of Methodist Ladies’ College and holds directorships with the Melbourne Theatre Company, the Victorian Major Events Committee, Tattersall’s George Adams Foundation, Lansa Holdings Inc., JadeLynx Pty Limited, Madowla Park Holdings Pty Ltd, Acumen People and Productivity Pty Ltd and Acumentum Pty Ltd. Lyndsey is also on the advisory board of PACT Group Pty Ltd.
Special ResponsibilitiesMember of the Audit, Risk and Compliance Committee
For
per
sona
l use
onl
y

20 | Tatts Group Limited Annual Report 2009
Directors’ Report (continued)
Brian Jamieson Non-executive DirectorMember of the Board since 31 May 2005.
Brian Jamieson was Chief Executive of Minter Ellison Melbourne from 2002 – 2005. Brian retired as Chief Executive of Minter Ellison Melbourne on 31 December 2005. Prior to joining Minter Ellison, he was the Chief Executive Officer at KPMG from 1998 – 2000; Managing Partner of KPMG Melbourne and Southern Regions from 1993 – 1998 and Chairman of KPMG Melbourne from 2001 – 2002. He was also a KPMG Board member in Australia, and a member of the USA Management Committee.
Brian has over 30 years of experience in providing advice and audit services to a diverse range of public and large private companies.
Brian is a Fellow of the Institute of Chartered Accountants in Australia.
Other Current DirectorshipsBrian is Chairman of Mesoblast Limited (Director since November 2007) and a Non-executive Director of Sigma Pharmaceuticals Limited (Director since December 2005) and Oz Minerals Limited (Director since August 2004), all ASX listed companies. He is also a Non-executive Director of the Bank of Western Australia Ltd, a subsidiary of the Commonwealth Bank of Australia Ltd. Further he is a Director and Treasurer of the Bionic Ear Institute, a Director of The Sir Robert Menzies Foundation and Chairman of the Tattersall’s George Adams Foundation.
Special ResponsibilitiesChairman of Audit, Risk and Compliance Committee Member of Remuneration Committee
Julien Playoust Non-executive DirectorMember of the Board since 21 November 2005.
Julien is Managing Director of AEH Group, a Sydney-based investment company. His professional career includes management consulting with Andersen Consulting and Accenture. He has experience in mergers and acquisitions, strategy, change, technology and supply-chain programs within consumer discretionary, property, banking, financials and resource sectors.
Julien is a member of the Australian Institute of Company Directors, Australian Institute of Management, Royal Australian Institute of Architects and The Executive Connection.
Julien holds a Masters of Business Administration from AGSM, Bachelor of Architecture, First Class Honours, a Bachelor of Science from Sydney University and a Company Director Course Diploma from Australian Institute of Company Directors.
Other Current DirectorshipsJulien is a Non-executive Director of Australian Renewable Fuels Limited (Director since April 2009), an ASX listed company. He is a director of private equity company MGB Equity Growth Pty Limited, Trustee of the Art Gallery NSW Foundation and on the Advisory Board of The Nature Conservancy.
Special responsibilitiesMember of the Audit, Risk and Compliance Committee Member of the Governance and Nomination Committee Member of Remuneration Committee and Chairman from 1 September 2008
Kevin Seymour AM Non-executive DirectorMember of the Board since 12 October 2006, previously having been appointed to UNiTAB’s Board in September 2000.
Kevin is Executive Chairman of Seymour Group which is one of the largest private property development and investment companies in Queensland. He has substantial experience in the equities market in Australia. Kevin also has extensive management and business experience including company restructuring. Kevin was previously the independent Chairman of the Queensland Government and Brisbane City Council’s Brisbane Housing Company Limited and Chairman of QCTV (formerly Briz31 Community TV) and has served on the Lord Mayor’s Drugs Taskforce and is an Honorary Ambassador for the City of Brisbane.
Other Current Directorships Kevin is Chairman of Watpac Limited (Director since May 1996) and Deputy Chairman of Ariadne Australia Limited (Director since December 1992), both ASX listed companies. He is Deputy Chairman of Queensland Harness Racing Limited and also holds board positions with several private companies in Australia.
Special ResponsibilitiesMember of Audit, Risk and Compliance Committee Member of Governance and Nomination Committee
For
per
sona
l use
onl
y

21
www.tattsgroup.com
George Chapman AO Retired Non-Executive DirectorMember of the Board from 12 October 2006 to 31 August 2008, previously having been Non-executive Chairman of the UNiTAB Board since July 1999.
George was previously Chairman of the Cairns Port Authority, Chairman of Telecasters North Queensland Limited (Chairman from November 1992 to April 1998, and a Director since 1990) and was a Director of Ten Group Limited (from December 1992 to September 1999) and Ten Network Holdings Limited (from April 1998 to September 1999).
As a former surveyor, George has been engaged in real estate development for 40 years.
George is a Fellow of the Australian Institute of Company Directors.
Other Current DirectorshipsGeorge is the Executive Chairman of the Chapman Group which has extensive interests in tourism, real estate and aquaculture.
Special ResponsibilitiesChairman of the Remuneration Committee until 31 August 2008
Dividends The Board continues its previously indicated commitment to maintaining a high dividend payout ratio. The total dividend paid or payable in respect of this year is 21.0 cents per share. The following dividends (including any special dividends) have been paid, determined, declared or recommended by the Company since the end of the preceding financial year:
Dividends ($000)
Final Dividend 2009Fully franked final dividend for 2009 of 11.0 cents per ordinary share as determined by Directors on 27 August 2009 with a record date of 8 September 2009 and payable on 2 October 2009 139,708
Interim Dividend 2009Fully franked interim dividend for 2009 of 10.0 cents per ordinary share as determined by the Directors on 27 February 2009 with a record date of 12 March 2009 and paid on 3 April 2009 126,542
Special Dividend 2008Fully franked special dividend of 10.5 cents per ordinary share as determined by the Directors on 28 August 2008 with a record date of 12 September 2008 and paid on 3 October 2008(¹) 132,862
(1) The 2008 special dividend was paid in place of the 2008 final dividend, effectively substituting the final dividend both in quantum and timing.
All dividends are fully franked.
Dividend Reinvestment Plan (DRP)The Company has a DRP in operation. The last date for receipt of a DRP Notice of Election to enable participation for the final dividend is 8 September 2009. No discount is applicable to shares acquired under the DRP. Shares acquired by a participant under the DRP will be provided via a share issue.
Further information in relation to dividends can be found in Note 27 to the financial statements.
Principal activitiesThe principal activities of the Group during the financial year consisted of:
The operation of licensed gaming machines in Victoria;•
The operation of regulated lotteries in Victoria, Queensland, Tasmania, the Australian Capital Territory, and the Northern Territory;•
The conduct of wagering and sports betting in Queensland, South Australia and the Northern Territory;•
The conduct of gaming machine monitoring and supply of jackpot and other value add services in Queensland, New South Wales and the Northern •Territory. In New South Wales this includes exclusive licences to operate inter-venue linked jackpots;
The provision of third party installation, repair and maintenance services for gaming, wagering, lottery, banking, point of sale and other transactional •equipment and systems throughout Australia;
The operation of licensed gaming venues throughout the United Kingdom; and •
Interests in licensed gaming operations in South Africa.•
Financial PositionThe reported Group Net Profit After Tax (NPAT) for the year ended 30 June 2009 was $277.4 million up 7.7%. Adjusting for the one-off $3.4 million after tax write-down of the carrying value of the Group’s investment in Sky City Entertainment Group Limited, underlying NPAT was up 9.0% to $280.8 million.
For
per
sona
l use
onl
y

22 | Tatts Group Limited Annual Report 2009
This result was achieved from reported Group revenue and other income of $3,252.5 million, up 5.1% on the previous year. The comparative figures do not include the full ownership of Talarius Limited, which was 100% acquired on 3 January 2008.
During the year, the Group extended a maturity under the existing $1.1 billion syndicated debt facility. The Group’s debt now matures in June 2011 and June 2013. At 30 June 2009, $910.4 million of the facility was drawn down. With the Group’s cash holdings this represents a relatively modest net debt burden for the Group relative to its annual business profitability and cash flows. These strong cash flows also underpin the Group’s significant levels of intangible assets that are a characteristic of the low tangible assets, high value networked gambling businesses comprising the Tatts Group.
Review of OperationsThe Group is a diversified network of neighbourhood based businesses relying on wide area network technology to deliver services to our customers in gaming, wagering, lotteries, gaming services and technical maintenance and support services. The Group has operations across every State and Territory in Australia, and in South Africa and the United Kingdom.
The 2009 financial year has again demonstrated the resilient nature of the Company’s diversified neighbourhood business model.
Tatts Pokies achieved strong growth for the year, with revenue up 1.8% to $1,292.2 million. Earnings before Interest and Tax (EBIT) were up 10.5% on the previous year to $215.6 million, reflecting the focus on reducing controllable costs as the business heads towards the end of its operating licence in 2012.
UNiTAB Wagering had an exceptionally strong first half, with revenue up 15.2% for the first half reflecting the weak prior year comparison as a result of the outbreak of equine influenza in the previous year. Revenue returned to more normal growth rates in the second half giving a full year revenue growth of 9.5% to $592.5 million. The strong result was achieved despite almost 900 races being cancelled during the year due to either wet weather or heat. EBIT was up 14.6% to $130.5 million for the year.
Tatts Lotteries business delivered revenue for the year up 2.3%, an impressive result considering that under the new licence regime that has been operating since 1 July 2008 the sales in Victoria no longer include products that previously represented approximately 15% of Victorian sales. EBIT for Lotteries was up 15.8% to $108.5 million for the year. Tatts Lotteries benefitted from an extraordinary run of jackpots in Super7’s Oz Lotto late in the financial year, culminating in a $106 million jackpot on 30 June 2009.
Maxgaming continued to demonstrate its ability to deliver consistent earnings and strong margins in any operating environment. Despite the economic conditions impacting the hotel and club network in New South Wales, revenue for the year was up 3.9% to $117.8 million. The reliance on information technology enabled Maxgaming to contain costs and deliver EBIT of $41.0 million, up 2.5%, whilst at the same time positioning the business for sustained performance.
Bytecraft Systems revenue of $70.0 million was down 5.9% and EBIT of $4.0 million was down 37.6%, both reflecting the reduction on margins from inter-company charges within the Group. Externally generated revenue grew during the year and now represents a majority of Bytecraft’s total revenue.
Tatts International includes the Group’s South African and the United Kingdom businesses. In South Africa, the Group currently has licences to operate 1,000 electronic gaming machines in each of KwaZulu Natal and Western Cape. At 30 June 2009 there were 653 and 928 gaming machines respectively in operation. The total South African gaming operations generated revenue of A$38.9 million up 26.8%, and contributed A$2.3 million to EBIT for the year, up 19.1% on the previous year.
The Group’s UK operations are conducted through Talarius, which operates 218 venues with more than 8,400 gaming machines. The performance of Talarius has been hampered by the flow on effects of smoking bans in venues, regulatory changes to game play, and the UK economy entering recession. Talarius delivered revenue of A$99.8 million for the year, and a loss at EBIT of A$3.3 million.
Significant changes in the state of affairsThere were no significant changes in the state of affairs of the Group during the year.
Matters subsequent to the end of the financial yearOther than as stated elsewhere in this Directors’ Report, no other matters or circumstances have arisen since 30 June 2009 which have significantly affected or may significantly affect the operations of the Group, the results of those operations or the state of affairs of the Group in future financial years.
Likely developments and expected results of operationsThe Victoria State Government is undergoing processes to facilitate future changes to the Gaming, Wagering and Keno licensing arrangements in Victoria post 2012. These processes were not finalised at the date of this Directors’ Report, and it is likely that further information will be made available during the 2010 financial year.
The New South Wales Government announced an intention to dispose of the NSW Lotteries business. With enabling legislation yet to pass through the NSW Parliament, at the date of this Directors’ Report, the process is yet to progress but could do so during the 2010 financial year.
The Victorian Parliament has passed legislation that allows for the extension of Tatts Group’s gaming licence from an expiry date of 14 April 2012 to 15 August 2012. It is likely that further information on this matter will be made available during the 2010 financial year.
In the Directors’ opinion, any further disclosure of information would be likely to result in unreasonable prejudice to the Group.
Directors’ Report (continued)
For
per
sona
l use
onl
y

23
www.tattsgroup.com
Business Strategies and future developmentsBusiness strategies aimed at achieving the Group’s goals will include:
Optimising our existing licences and underlying businesses to achieve continued growth and operational efficiencies;•
Considering our strategy and involvement in the processes relating to the future of Gaming, Wagering and Keno in Victoria when further information •is made available by the Government;
Involvement to the extent appropriate in the sale processes of State Government owned gambling assets; and•
Maintaining a flexible balance sheet to support business opportunities that fit with the Group’s core competencies.•
In the Directors’ opinion, any further disclosure of information would be likely to result in unreasonable prejudice to the Group.
Environmental regulationThe operations of the Group are not subject to any particular and significant environmental regulation under any law of the Commonwealth of Australia or any of its States or Territories.
Directors’ Interests in SharesThe relevant interest of each Director in the share capital of the Company at the date of this Directors’ Report is as follows:
DirectorRelevant Interest in
Ordinary SharesOptions over
Ordinary Shares
Harry Boon 150,000 Nil
Dick McIlwain 1,947,500 2,000,000
Robert Bentley 160,000 Nil
Lyndsey Cattermole 172,663 Nil
Brian Jamieson 78,000 Nil
Julien Playoust 75,000 Nil
Kevin Seymour 24,000,000 Nil
On his retirement from the Board on 31 August 2008, George Chapman had a relevant interest in 4,011,745 shares in the Company.
Executive Directors are the only Directors entitled to participate in the Long-Term Incentive Plan. Details of these interests are disclosed in the Remuneration Report which appears on pages 24 to 35 of this report.
Company SecretaryPenny Grau was appointed to the position of Company Secretary on 3 April 2007. Prior to this appointment, Penny practiced as a corporate lawyer for 18 years, the last 8 years as a partner with national law firm Clayton Utz. Penny holds Bachelors of Laws and Commerce, a Masters of Laws and a Graduate Diploma in Applied Finance and Investment.
Meetings of DirectorsThe number of scheduled Board meetings and meetings of Board Committees, and the number of meetings attended by each of the Directors of the Company during the year were:
Board of Directors meetings
Audit, Risk & Compliance
Governance & Nomination
Remuneration
A B A B A B A B
Harry Boon 10 10 nm nm 2 2 nm nm
Dick McIlwain(a) 10 10 nm nm nm nm 3 2(b)
Robert Bentley 10 10 nm nm 2 2 3 2
Lyndsey Cattermole 10 10 4 4 nm nm nm nm
George Chapman 1 1 nm nm nm nm 1 1
Brian Jamieson 10 9 4 4 nm nm 3 3
Julien Playoust 10 9 4 4 2 2 3 3
Kevin Seymour 10 8 4 2 2 2 nm nm
Column A – Number of meetings during the year while the Director was a member of the Board or Committee. Column B – Number of meetings attended by the Director during the year. nm – Not a member of the relevant Committee (a) Managing Director, not a Non-executive Director (b) Ex-officio attendee
For
per
sona
l use
onl
y

24 | Tatts Group Limited Annual Report 2009
Remuneration ReportThe remuneration report is set out under the following main headings:
A Remuneration Policy
B Remuneration Committee
C Non-executive Directors
D Executive Remuneration Structure
(i) Fixed Annual Remuneration
(ii) Short-Term Incentive Plan
(iii) Long-Term Incentive Plan
E Employee Share Plan
F Employment Contracts of Managing Director/Chief Executive and Executives
G Details of Remuneration
H Share Based Compensation Options and Rights
I Additional Information
(i) Performance of the Group
(ii) Details of remuneration – performance options and rights
(iii) Share based compensation: Options and Rights
The information provided in this Remuneration Report has been audited as required by section 308 (3C) of the Corporations Act 2001.
A Remuneration Policy The Board’s objective of the Group executive reward framework is to link remuneration to financial performance and shareholder value, and to offer competitive and appropriate remuneration for the results delivered. The remuneration strategy and structure are described in this Remuneration Report to indicate the structure and processes in place throughout the financial year.
The remuneration philosophy aims to deliver rewards consistent with the responsibilities and performance of executives, and be competitive enough to attract and retain high performers. The framework comprises fixed annual remuneration, a short-term incentive and a long-term incentive. Incentives are only payable in the event financial and non-financial targets are achieved. As such, the remuneration strategy aligns executive reward with the achievement of corporate strategic objectives and the interests of shareholders, thereby conforming with market practice in this regard.
B Remuneration Committee The Remuneration Committee aims to ensure the Group has appropriate remuneration policies and procedures that fairly and responsibly reward executives. The Committee operates under the delegated authority of the Board. The Committee comprises three Non-executive Directors (one of which is the Committee Chair). The Managing Director/Chief Executive attends on an ex officio basis.
The Board will ensure a Non-executive director continues to chair this Committee. The areas of responsibility of the Remuneration Committee include advising on the following:
Non-executive Director remuneration;•
Managing Director/Chief Executive performance review, remuneration, short-term and long-term incentives; •
Executive remuneration and allocations of short-term and long-term incentives;•
Employee equity plans;•
Remuneration disclosure;•
Executive recruitment, termination policies, and arrangements for superannuation and succession; and•
Risk management and controls regarding remuneration.•
C Non-executive Directors Fees to Non-executive Directors reflect the demands which are made on, and the responsibilities of, the Directors. Fees are reviewed annually by the Board to ensure Non-executive Directors’ fees are appropriate and consistent with market practice. Non-executive Directors’ fees are determined within an aggregate fee pool limit, which if increased requires shareholder approval. The current maximum total Non-executive Directors’ fee pool is $1.5 million per annum.
Directors’ Report (continued)
For
per
sona
l use
onl
y
25
www.tattsgroup.com
The annual fee amount is determined on a total cost basis representing cash and superannuation. Fees are paid on the following basis: Chairman $313,500 per annum; Non-executive Director: $137,940 per annum. Fees for the Chairman of the Audit, Risk and Compliance Committee and Chairman of the Remuneration Committee are an additional $20,900 and $13,063 respectively, in recognition of the increased workload and responsibilities of these Committee Chair positions.
Non-executive Directors are expected to hold shares in the Company at a level determined by the Board from time to time. Any person invited to join the Board will enter into an Appointment Agreement setting out the director’s duties, rights, responsibilities and the terms and conditions associated with that appointment.
Retirement Benefits of Non-executive DirectorsThere are no retirement benefit schemes for Non-executive Directors, other than statutory superannuation contributions.
The Group has a practice of not offering retirement benefits to Non-executive Directors.
Non-Monetary Benefits of Non-executive DirectorsThere are no non-monetary benefits offered to Non-executive Directors.
D Executive Remuneration StructureThe aim of the Group’s executive remuneration philosophy and structure is to ensure that the overall remuneration of executives reflects their duties and responsibilities, and importantly, to encourage and reward performance. The Group is committed to adhering to appropriate corporate governance standards for executive remuneration, having regard to the ASX Corporate Governance Council’s Recommendations and relevant stakeholder bodies.
Reward Structure and MixThe following components comprise the total annual reward (TAR) framework for executive and employee remuneration:
Fixed annual remuneration (FAR) comprising base pay and superannuation;•
Short-term performance payments via the Short-Term Incentive Plan (STIP); and•
Long-term incentive awards through participation in the Long-Term Incentive Plan (LTIP).•
(i) Fixed Annual Remuneration Fixed annual remuneration is determined by reference to the scope and size of the role and the level of skill and experience of the individual, in conjunction with a performance rating framework designed to assess an individual’s performance over the preceding 12 month period. The Group aligns executive remuneration to the market at or above the 50th percentile for fixed annual remuneration. Fixed annual remuneration is reviewed annually and adjusted subject to market movements, Group profitability, individual performance and movements in the CPI.
The Group uses nationally recognised job evaluation systems to assess the scope and size of roles against which industry benchmarking is carried out and internal relativities maintained. Individual performance is assessed by reference to a set of key performance areas which include financial and non-financial measures. The weighting attributed to these performance areas will vary depending on the individual’s role.
For salaried employees, salary adjustments are made after assessment of (a) an employee’s positioning relative to the market range for the type of position held; and (b) how an individual has performed relative to their peer group.
The performance rating for each executive is determined through an annual performance review conducted by the manager to whom the executive reports. In the case of the named executives in this report the review is conducted by the Chief Executive, and the Chairman reviews the Managing Director/Chief Executive’s performance. Such reviews are conducted against individual KPIs and accountabilities and goals specific to each executive’s responsibilities. Performance is then rated according to an achievement scale and weighted in line with the relative importance of the respective performance areas. Scores are aggregated to arrive at an overall individual performance rating.
There are no guaranteed base pay increases in any executive contracts of employment.
(ii) Short-Term Incentive Plan (STIP)The Group’s short-term incentive framework is structured to reward performance based on the performance of the Group, of the Strategic Business Unit (SBU) or division to which an individual belongs, and the individual’s personal performance. There is also a component available at the discretion of the Managing Director/Chief Executive and the Remuneration Committee to recognise special contributions. Employees must have a minimum of six months’ service to be eligible to participate in the STIP.
SBU/Divisional and individual performance outcomes align with the Group’s strategic objectives over a 12 month period. Any awards provided under the STIP are subject to the achievement of Group profitability targets, determined annually in line with the Group’s business planning process, and which are approved by the Board. The size of the total available Short-Term Incentive (STI) pool will vary depending on the level of profitability achieved. Performance above the business plan profit target is leveraged to ensure an acceptable return to both shareholders and executives. If either Group performance or individual performance is not achieved at the target level, no STI may be awarded. The Board reserves its right to adjust up or down total STI payments under the STIP in line with under or over-achievement against target performance levels.
For
per
sona
l use
onl
y

26 | Tatts Group Limited Annual Report 2009
The total STI bonus pool is divided into three pools to enable payments to be allocated based on Group performance, SBU/Divisional performance and special individual contributions. The relative contribution by each SBU/Division to the targets used to determine the total STIP Pool will have a significant bearing on how much, if anything, is available for allocation in the SBU/Divisional pool. SBU/Divisional targets include profit outcomes, revenue growth performance, expense management, project delivery, product development and margin improvement.
Pool ($) X (Individual Bonus Entitlement (IBE)
÷Total Individual Bonus
Entitlements (TIBE)) =
Individual Bonus from Pool ($)
The quantum of STI paid to an executive is determined by the individual’s performance rating based on an annual assessment, the individual’s Fixed Annual Remuneration and the STI percentage of Fixed Annual Remuneration applicable to that executive. This is used to calculate what proportion of each of the Group and SBU/Divisional pools will be paid to the executive as a short term incentive. The Remuneration Committee, in consultation with the Managing Director/Chief Executive and SBU/Divisional Heads, will make allocations from the special contributions pool based upon the achievement of key strategic initiatives.
Band FAR ($) X STI % of FAR XIndividual Performance
Rating (IPR)=
Individual Bonus Entitlement (IBE)
Under the Managing Director/Chief Executive’s employment contract to apply from 12 October 2009, one half of his STIP will be subject to similar financial criteria as outlined above. The other half will be determined by the Board based on the Managing Director/Chief Executive’s performance in meeting key performance indicators set by the Board and not dependent on the Group’s profitability.
(iii) Long-Term Incentive Plan (LTIP)The long-term incentive plan in the form of performance options and/or performance rights aims to focus appropriate management personnel on improving the Group’s performance over a three to five year horizon.
Vesting of performance options and/or performance rights granted under the LTIP prior to 1 July 2008 is based on performance against Relative Total Shareholder Return (TSR) targets. Vesting of performance options and/or performance rights granted after 1 July 2008 is based on a combination of Relative TSR and Earnings Per Share (EPS) targets, with up to half of the options and/or rights vesting for executives if TSR targets are achieved and up to half if EPS targets are achieved.
The Relative TSR measure, combining dividend returns and share price appreciation, reflects a performance condition under which the Group’s growth in TSR since the determination date of the instrument is measured against a representative peer group of the top 100 ASX listed companies (by market capitalisation, excluding companies in the oil and gas, metal and mining and related industries, real estate, financial services, and building and construction industries). The peer group is compiled from the Top 100 companies on the determination date of instruments provided under the plan. The peer group used for instruments granted before the 2009 financial year excluded just oil and gas, real estate and metals and mining companies, with the broader exclusions going forward now providing a more comparable peer group for Tatts Group.
Whilst annual allocations of instruments will be made, a three year vesting test period applies with a further one year period for testing comprising two further tests at six monthly intervals. (A two year period applies for such retesting for performance options and performance rights granted prior to 1 July 2008). The exercise period expires on the seventh anniversary of the determination date.
TSR, being an externally based market measure which is a relative performance measure against public company peers, provides a strong link between this remuneration component and shareholder value creation. It is Tatts Group’s view the shareholders’ interests are best met by combining the achievement of appropriate TSR growth with sustained growth in EPS. At the same time, EPS represents a more relevant and transparent measure for motivating LTIP participants.
The EPS performance condition will be measured on the basis of the actual EPS percentage increase achieved over a three year period from the 1st of July in the financial year in which the performance options and/or performance rights are granted. This will be assessed against target levels for the Group. For LTIP instruments granted after 1 July 2009 the relevant EPS measure in this regard will exclude the Tatts Pokies segment net profit after tax, due to the run-off of this business by 2012.
Details of the remuneration of Directors, key management personnel and other executives are set out at pages 28 to 35.
Allocation/Vesting/ExerciseExecutives and senior managers may be granted performance options and/or performance rights at the discretion of the Board. The potential grant is determined by the participant’s level within the Group structure. No amount is payable by the recipient upon grant of performance options or rights.
The potential number of performance options and/or performance rights to be granted to each participant will be determined by dividing the value of the options and/or rights to be granted as part of their long-term incentive award by the market value of the option and/or right at the determination date. The market value of the option and/or right will be determined by applying an accepted valuation methodology to the Company’s share price at the determination date.
Directors’ Report (continued)
For
per
sona
l use
onl
y

27
www.tattsgroup.com
Allocations of performance options and performance rights may be exercised upon vesting (following satisfaction of the performance and time based vesting conditions as set out below). Up to 100% of performance options and performance rights granted prior to 1 July 2008 may vest subject to achievement of a Relative TSR hurdle in comparison to the peer group that applied at that time. For equity instruments granted after 1 July 2008 but prior to 1 July 2009, vesting for half the instruments granted to executives who lead SBUs or divisions may vest subject to achievement of a Relative TSR hurdle and half based on achievement of an EPS growth target. For LTIP participants who did not lead SBU’s or divisions in the 2009 financial year, vesting for equity instruments granted after 1 July 2008 but prior to 1 July 2009 is based solely on achievement of an EPS growth target.
TargetPercentage of Instruments
that Vest in Given Year
Group annual TSR does not meet performance of the median company in peer group 0%
Group annual TSR achieves or exceeds performance of the median company in peer group 50%
Group annual TSR ranked in third quartile of companies in peer group Pro rata between 50% and 100%
Group annual TSR ranked in fourth quartile of companies in peer group 100%
The percentage of performance options and/or performance rights which become exercisable increases from the 50th percentile up to the 75th percentile by 2% increases in the number of instruments vested for each 1% increase in the percentile of the TSR of the Company compared to the average TSR of the peer group.
From 1 July 2009 50% of performance options and/or performance rights granted to all LTIP participants may vest based on Relative TSR performance as measured against the more targeted peer group described above, and 50% may vest if EPS growth targets are achieved. In relation to both measures, the vesting of performance options and/or performance rights granted post 1 July 2008 will be tested over 3 years, with 2 subsequent retests at six monthly intervals thereafter for instruments that are subject to TSR hurdles. Instruments issued pre 1 July 2008 will be retested on 4 subsequent occasions at six monthly intervals.
On exercise of vested performance options and performance rights, which may occur up to 7 years from determination date, the Company may deliver shares by new issue or by purchasing shares on market for transfer to participants. The exercise price of the performance options is determined by reference to the thirty day volume weighted average price of the shares as traded on the ASX in the thirty days up to and including the determination date.
Grants of shares under the LTIP will be subject to a 5% cap. This is inclusive of shares that may be issued in respect of each outstanding offer or grant of shares and options or rights to acquire unissued shares if accepted or exercised under other equity plans of the Company for employees and Non-executive Directors, but disregarding offers made outside of Australia, made under a disclosure document or which do not require a disclosure document.
Expiry of Unvested Performance Options and Performance RightsPerformance options and performance rights that have not vested before the end of the vesting period will lapse on the expiry date specified at the date of grant or if the Board determines that they are to be forfeited. Where employment ceases, entitlement to any unvested performance options or performance rights will ordinarily lapse, subject to the Board having otherwise agreed at the date of grant or using its discretion to waive some or all of the vesting conditions if the reason for ceasing employment is death, total and permanent disability or redundancy.
HedgingParticipants in the LTIP may not enter into any contract, arrangement or transaction which is designed or intended to hedge or otherwise limit exposure to the Group’s shares which are subject to an unvested award under the plan. Any person who is proven to have contravened the hedging policy may face disciplinary action which, depending on the seriousness of the breach, could include termination of employment.
Restrictions on Shares and Forfeiture ConditionsPerformance options and performance rights, and shares delivered on exercise, may be subject to forfeiture (which may be subject to lifting at the discretion of the Board) if a participant commits any act of fraud, defalcation or gross misconduct in relation to the Group. Shares delivered on exercise may be subject to disposal restrictions (subject to removal at the discretion of the Board).
E Employee Share Plan The general share acquisition plan was a general employee share plan by which offers were made to eligible employees to acquire restricted shares. The plan was discontinued as at 1 July 2007. A holding lock has been placed on shares by placing them in a restricted class, to ensure they cannot be disposed of whilst subject to a disposal restriction and/or forfeiture condition.F
or p
erso
nal u
se o
nly

28 | Tatts Group Limited Annual Report 2009
F Employment Contracts of the Managing Director/Chief Executive and ExecutivesThe employment conditions of the Managing Director/Chief Executive, Dick McIlwain, and specified executives are formalised in contracts of employment. Other than the Managing Director/Chief Executive, all other executives are employed under contracts of no fixed duration.
Termination Payment Benefits (other than termination for gross misconduct or retrenchment)
Name Term of Contract Period of Notice Amount of Payment
D McIlwain 3 year term contract – commenced on 12 October 2006(1)
6 months written notice No notice or severance payment required upon expiry of contractual term. Where terminated early entitled to no more than that allowed per Part 2 Division 2 of Chapter 2D of the Corporations Act 2001.
M Carr No fixed duration 12 months written notice A combination of notice and payment in lieu of notice totalling no less than 12 months.
B Fletton No fixed duration 12 months written notice A combination of notice and payment in lieu of notice totalling no less than 12 month.
P Grau No fixed duration 12 months written notice A combination of notice and payment in lieu of notice totalling no less than 12 months.
R Gunston No fixed duration 12 months written notice A combination of notice and payment in lieu of notice totalling no less than 12 months.
B Houston No fixed duration 12 months written notice A combination of notice and payment in lieu of notice totalling no less than 12 months.
S Lawrie No fixed duration 12 months written notice A combination of notice and payment in lieu of notice totalling no less than12 months.
B Redmond No fixed duration 12 months written notice A combination of notice and payment in lieu of notice totalling no less than 12 months
(1) On 27 March 2009 D McIlwain’s contract was amended with effect from 12 October 2009 and extended for a further 3 years to 12 October 2012. It provides for notice on termination of the lesser of 12 months or the period remaining until 12 October 2012.
In November 2008 the notice period for termination was changed to 12 months for those not previously at this level for all the above executives, other than the Managing Director/Chief Executive, to provide consistency across the executive group. The Group may terminate an employment contract without cause by providing written notice, in accordance with the specified period or making payment in lieu of notice, based on the individual’s fixed annual remuneration component.
Termination payments are not payable on resignation or dismissal for serious misconduct. In the instance of serious misconduct, the Company may terminate employment at any time. Any options or rights not exercised before or on the date of termination may lapse.
G Details of RemunerationAmounts of remunerationDetails of the remuneration of the Directors of the Company, the key management personnel of the Group and specified executives who received the highest remuneration for the year ended 30 June 2009 are set out in the following tables.
The key management personnel of the Group include the Directors as per pages 18 to 21 above and the following executive officers:
Ray Gunston – Chief Financial Officer•
Stephen Lawrie – Chief Information Officer•
The key management personnel of the Group have been refined this financial year to include only those executives with responsibility for the planning, controlling and directing of the Group and therefore excludes those executives who lead individual SBUs. The comparative figures in the following tables represent Directors’ fees and executive remuneration for the key management personnel of the reporting period 1 July 2007 to 30 June 2008.
In addition, the following persons must be disclosed under the Corporations Act 2001 as they are among the 5 highest remunerated Group and/or Company executives:
Michael Carr – Chief Executive, MaxGaming•
Barrie Fletton – Chief Executive, UNiTAB Wagering•
Penny Grau – General Counsel & Company Secretary•
Bruce Houston – Executive General Manager, Media, Government & Community Relations•
Brendan Redmond – Executive General Manager, Business Development & International Investments•
Directors’ Report (continued)
For
per
sona
l use
onl
y

29
www.tattsgroup.com
Key Management personnel and other executives of the Group and other executives of the company and group
2009 Short-term benefits1
Post- employment
benefitsLong-term benefits Share-based payment
Name
Cash salary
and fees$
Cash Bonus (STI)2
$Other3
$
Super- annuation
$
Long Service
Leave$
Performance Options (LTI)
$
Performance Rights (LTI)
$Total
$
Non-executive Directors
Harry Boon 309,000 N/A – – – N/A N/A 309,000
Robert Bentley 124,734 N/A – 11,226 – N/A N/A 135,960
Lyndsey Cattermole 135,960 N/A – – – N/A N/A 135,960
George Chapman4 22,094 N/A – 1,988 – N/A N/A 24,082
Brian Jamieson 143,633 N/A – 12,927 – N/A N/A 156,560
Julien Playoust 134,635 N/A – 12,117 – N/A N/A 146,752
Kevin Seymour 124,775 N/A – 11,185 – N/A N/A 135,960
Sub-total – Non-executive Directors 994,831 N/A – 49,443 – N/A N/A 1,044,274
Executive Director
Dick McIlwain5 (Managing Director/Chief Executive) 1,737,567 935,550 – 13,745 29,329 666,667 – 3,382,858
Other Key Management Personnel 6
Ray Gunston7, 8 702,922 247,000 – 13,745 11,796 132,704 21,511 1,129,678
Stephen Lawrie7, 8 453,755 118,000 – 13,745 7,650 83,109 12,456 688,715
Sub-total – other Key Management Personnel 1,156,677 365,000 – 27,490 19,446 215,813 33,967 1,818,393
Other Executives
Michael Carr8 452,755 93,000 – 14,334 7,962 85,917 13,547 667,515
Barrie Fletton8 443,178 86,000 – 13,745 7,791 84,260 13,391 648,365
Penny Grau7 422,922 70,000 – 13,745 7,070 26,843 – 540,580
Bruce Houston7 327,922 55,000 – 13,745 5,494 25,382 6,218 433,761
Brendan Redmond7, 8 427,921 87,000 684,914 13,745 7,152 81,281 12,830 1,314,843
Sub-total – other Executives 2,074,698 391,000 684,914 69,314 35,469 303,683 45,986 3,605,064
Totals 5,963,773 1,691,550 684,914 159,992 84,244 1,186,163 79,953 9,850,589
1 Short-term benefits may include amounts paid to superannuation at the discretion of the individual.
2 These cash bonuses represent 100% of the cash bonus paid to each executive in respect of the financial year. Where the individuals’ STI target has been exceeded, the Board has exercised its right to adjust upwards the total STI payments (cash bonuses) in line with over-achievement against target performance levels. The following executives have received the following percentage of their target STI cash bonus: Dick McIlwain (75%), Ray Gunston (102%), Stephen Lawrie (75%), Michael Carr (59%), Barrie Fletton (56%), Penny Grau (56%), Bruce Houston (56%), Brendan Redmond (59%).
3 Other payments as follows – Brendan Redmond – Includes the value of expatriate and living away from home benefits in respect of his role as Executive General Manager, Business Development and International Investments.
4 George Chapman retired from the Board on 31 August 2008.
5 The Managing Director/Chief Executive has 51% of his total remuneration related to the performance of the Group, and 49% which is not directly linked to the Group’s performance.
6 As required to be disclosed under the Corporations Act 2001, except for Penny Grau and Bruce Houston, 60% of the total remuneration of key management personnel and other executives is not related to the performance of the Group, and 40% is related to the Group’s performance. For Penny Grau and Bruce Houston, these percentages are 70% and 30%.
7 Denotes one of the 5 highest paid executives of the Company, as required to be disclosed under the Corporations Act 2001.
8 Denotes one of the 5 highest paid executives of the Group, as required to be disclosed under the Corporations Act 2001.
For
per
sona
l use
onl
y

30 | Tatts Group Limited Annual Report 2009
2008 Short-term benefits1
Post- employment
benefitsLong-term benefits Share-based payment
Name
Cash salary
and fees$
Cash Bonus (STI)3
$Other4
$
Super- annuation
$
Long Service
Leave$
Performance Options (LTI)
$
Performance Rights (LTI)
$Total
$
Non-executive Directors
Harry Boon 283,333 N/A – – – N/A N/A 283,333
Robert Bentley 117,431 N/A – 10,569 – N/A N/A 128,000
Lyndsey Cattermole 128,000 N/A – – – N/A N/A 128,000
George Chapman 128,899 N/A – 11,601 – N/A N/A 140,500
Brian Jamieson 135,780 N/A – 12,220 – N/A N/A 148,000
Julien Playoust 117,431 N/A – 10,569 – N/A N/A 128,000
Kevin Seymour 117,431 N/A – 10,569 – N/A N/A 128,000
Sub-total – Non-executive Directors 1,028,305 N/A – 55,528 – N/A N/A 1,083,833
Executive Director
Dick McIlwain2 (Managing Director/Chief Executive) 1,752,712 787,850 – 12,035 – 666,667 – 3,219,264
Other Key Management Personnel5
Michael Carr7 401,662 105,000 – 45,249 10,922 40,278 13,547 616,658
Barrie Fletton7 391,611 105,000 – 46,466 10,672 39,587 13,391 606,727
Penny Grau6 406,871 90,000 – 13,129 6,729 8,509 – 525,238
Ray Gunston6,7 657,704 325,000 – 13,129 10,946 88,195 33,777 1,128,751
Bruce Houston6 309,371 65,000 – 13,129 5,158 10,471 6,218 409,347
Stephen Lawrie6 369,695 135,000 – 32,882 6,894 37,802 12,456 594,729
Frank Makryllos 370,204 115,000 – 13,129 6,398 35,431 13,080 553,242
Brendan Redmond6,7 444,028 110,000 380,853 13,129 6,812 38,091 12,830 1,005,743
Kevin Szekely 249,204 70,000 – 13,129 4,166 8,324 4,729 349,552
Bill Thorburn 329,889 130,000 – 41,190 5,443 19,833 – 526,355
Sub-total – other Key Management Personnel 3,930,239 1,250,000 380,853 244,561 74,140 326,521 110,028 6,316,342
Other Executives5
Peter Fonseca7 215,060 26,510 416,480 13,129 3,587 7,407 4,395 686,568
Totals 6,926,316 2,064,360 797,333 325,253 77,727 1,000,595 114,423 11,306,007
1 Short-term benefits may include amounts paid to superannuation at the discretion of the individual.
2 The Managing Director/Chief Executive has 52% of his total remuneration related to the performance of the Group, and 48% which is not directly linked to the Group’s performance.
3 These cash bonuses represent 100% of the cash bonus paid to each executive in respect of the financial year. Where the individuals’ STI target has been exceeded, the Board has exercised its right to adjust upwards the total STI payments (cash bonuses) in line with over-achievement against target performance levels. The following executives have received the following percentage of their target STI cash bonus: Dick McIlwain (68%), Michael Carr (71%), Barrie Fletton (72%), Ray Gunston (100%), Brendan Redmond (78%) and Peter Fonseca (40%). Ray Gunston received an ex gratia payment of $100,000.
4 Other payments as follow: Brendan Redmond – Includes the value of expatriate and living away from home benefits in respect of his role as Executive General Manager, Business Development and International Investments. Peter Fonseca – Includes the value of expatriate and living away from home benefits in respect of his role as Director, Thuo Gaming, South Africa.
5 As required to be disclosed under the Corporations Act 2001, except for Peter Fonseca, Penny Grau and Bruce Houston, 60% of the total remuneration of key management personnel is not related to the performance of the Group, and 40% is related to the Group’s performance. For Peter Fonseca, Penny Grau and Bruce Houston, these percentages are 70% and 30%.
6 Denotes one of the 5 highest paid executives of the Company, as required to be disclosed under the Corporations Act 2001.
7 Denotes one of the 5 highest paid executives of the Group, as required to be disclosed under the Corporations Act 2001.
Directors’ Report (continued)
For
per
sona
l use
onl
y

31
www.tattsgroup.com
H Share Based Compensation Options and RightsEmployees eligible to participate in the LTIP are those of senior management level and above, including the Managing Director/Chief Executive, whose performance is of strategic and operational importance to the Group.
Options and/or rights are granted annually to eligible participants but do not vest unless both performance and time-based hurdles are met. These conditions ensure that eligible employees are rewarded only when percentage EPS growth and/or TSR growth targets are met as set out in Section D (iii) of this Remuneration Report.
Options and rights granted in 2005 were retested on 7 January 2009 and 84.72% of these vested to participants, representing 232,925 options and 70,784 rights, given the Company’s TSR performance at the 67th percentile of the peer group. Further testing at 7 July 2009 did not result in any further vesting of the remaining options and rights. Testing of the remaining options and rights yet to vest will continue at six monthly intervals until 7 July 2010.
The terms and conditions of each grant of options and rights affecting remuneration in the previous and current reporting periods are as follows:
Award Type Grant Date Expiry Date Exercise Price
Value per option/right
at grant date Date Exercisable
Performance Option 16 December 2005 07 July 2012 $3.10 $0.67 7 July 2008
30 November 2006 30 November 2013 $3.65 $0.80 30 November 2009
30 November 2007 30 November 2014 $3.99 $1.02 30 November 2010
30 November 2008(1) 30 November 2015 $2.56 $0.31 30 November 2011
30 November 2008(2) 30 November 2015 $2.56 $0.33 30 November 2011
Performance Option (Chief Executive) 30 November 2006 30 November 2013 $3.13 $1.00 30 November 2009
Performance Right 16 December 2005 07 July 2012 N/A $1.80 7 July 2008
30 November 2006 30 November 2013 N/A $2.56 30 November 2009
(1) Options granted with TSR market based vesting conditions (2) Options granted with EPS non-market based vesting conditions
Options and rights granted under the LTIP carry no dividend or voting rights. Options and rights do not entitle option or right holders to participate in issues of shares except in respect of pro-rata bonus issues and rights issues in the manner specified by the ASX Listing Rules.
The exercise price of options awarded is based on the weighted average price at which the Company’s shares traded on the ASX in the thirty days up to and including the determination date.
Details of performance options over ordinary shares in the Company granted during the reporting period as remuneration to the only executive director of the Company and each of the key management personnel and selected other executives of the Group who remained employed within the Group at the date of this Remuneration Report are set out below. Upon exercise of each option or exercise of each right, the holder receives one fully paid ordinary share of the Company. Further information on the options and rights is set out in Notes 28 and 39 of the audited Financial Report.
For
per
sona
l use
onl
y

32 | Tatts Group Limited Annual Report 2009
Number of options granted during the year
Number of options vested during the year
Number of rights vested during the year
2009 2008 2009 2008 2009 2008
Executive Director of Tatts Group Limited
Dick McIlwain (Managing Director/Chief Executive) – – – – – –
Other key management personnel of Group
Ray Gunston 755,200 160,554 105,794 – 19,111 –
Stephen Lawrie 494,800 102,279 – – – –
Sub-total – other Key Management Personnel 1,250,000 262,833 105,794 – 19,111 –
Other executives
Michael Carr 489,300 107,036 – – – –
Barrie Fletton 479,200 104,657 – – – –
Penny Grau 196,800 42,900 – – – –
Bruce Houston 159,100 33,196 – – – –
Brendan Redmond 463,500 101,089 – – – –
Total options/rights 3,037,900 651,711 105,794 – 19,111 –
No performance options were exercised during the period covered by this Remuneration Report.
Details of the ordinary shares provided as a result of the exercise of vested rights are as follows:
Number of ordinary shares issued on exercise of rights during the year
Date of exercise of rights 2009 2008
Other key management personnel of Group
Ray Gunston 2 March 2009 19,111 –
Total options/rights 19,111 –
No consideration is paid on the exercising of rights.
Directors’ Report (continued)
For
per
sona
l use
onl
y

33
www.tattsgroup.com
I Additional Information (i) Performance of the GroupIn considering the Group’s performance and its implications for shareholders’ wealth in the context of appropriate remuneration levels and structures, the Remuneration Committee has regard to measures such as net profit, dividends paid, earnings per share, and changes in the share price, in the current and previous financial years.
As the Company listed on the Australian Stock Exchange on 7 July 2005, financial information prior to this date is not relevant. Since that time, there have been a number of events, including mergers, acquisitions, licence renewal outcomes, and the settlement of the Trustee Commission Claim which have created substantial volatility in the measures outlined above. This is reflected in the following table:
2009 2008 2007* 2006
Net profit attributable to equity holders of the Company ($’000) 277,441 257,586 288,581 128,542
Dividends paid/payable ($’000) 266,250 253,071 278,377 114,850
Dividend payout ratio (%) 96.0 98.2 96.5 89.3
EPS (¢) 21.9 20.4 26.1 18.3
STIP as percentage of net profit (%) 1.78 1.71 1.90 1.17
* The net profit in 2007 includes the gain from the provision reversal on the Trustee Commission Claim settlement. As a result, a special dividend of 4 cents per share was paid.
As outlined earlier, a net profit target is established by the Board and an STI is awarded if the net profit target is achieved or exceeded. The STI is determined as a declining proportion of above target performance. Assessment of performance against target involves making appropriate adjustments to actual profit to ensure that only the performance attributable to management activity is rewarded under this approach.
While the LTIP options and rights granted in 2005 having reached the three year vesting test conditions in the 2009 financial year, the graph below reflects that during the year the Group TSR outcome exceeded the 50th percentile level TSR ASX Peer Group. In fact, at the retest date of 7 January 2009 the Group’s TSR performance achieved the 67th percentile of the peer group. This followed on from the relative underperformance in the 2008 financial year where the share price was adversely affected by the Victorian Government’s announcement on the gambling licence arrangements that will apply beyond 2012.
TSR 50th Percentile Index – Tatts Group Limited vs ASX Peer Group 7 July 2005 Index = 100
Index
200
180
160
140
120
100
80
60
40
Index TSR 50th Percentile ASX Peer Group Index Tatts Group TSR
2005 2006 2007 2008 2009
For
per
sona
l use
onl
y

34 | Tatts Group Limited Annual Report 2009
(ii) Details of remuneration – performance options and rightsFor each grant of options and rights as set out below, the percentage of the maximum grant that was paid, or that vested, in the financial year is provided.
Options/Rights
NameFinancial year
granted Vested % Forfeited %
Financial years in which options/rights
may vest
Minimum total value
of grant yet to vest $
Maximum total value
of grant yet to vest $
Dick McIlwain 2007 – – 30/06/2010 nil 277,778
Michael Carr 2009 – – 30/06/2012 nil 126,254
2008 – – 30/06/2011 nil 51,556
2007 – – 30/06/2010 nil 13,582
Barrie Fletton 2009 – – 30/06/2012 nil 123,648
2008 – – 30/06/2011 nil 50,410
2007 – – 30/06/2010 nil 13,425
Penny Grau 2009 – – 30/06/2012 nil 50,781
2008 – – 30/06/2011 nil 20,664
Ray Gunston 2009 – – 30/06/2012 nil 194,864
2008 – – 30/06/2011 nil 77,333
2007 – – 30/06/2010 nil 20,294
2006 84.72% – – – –
Bruce Houston 2009 – – 30/06/2012 nil 42,294
2008 – – 30/06/2011 nil 15,989
2007 – – 30/06/2010 nil 4,210
Stephen Lawrie 2009 – – 30/06/2012 nil 127,673
2008 – – 30/06/2011 nil 49,265
2007 – – 30/06/2010 nil 12,489
Brendan Redmond 2009 – – 30/06/2012 nil 119,597
2008 – – 30/06/2011 nil 48,691
2007 – – 30/06/2010 nil 12,863
No options were exercised during the year and therefore no shares were issued. Some rights vested and were exercised during the year – refer to section H of the Remuneration Report for further details.
Directors’ Report (continued)
For
per
sona
l use
onl
y

35
www.tattsgroup.com
(iii) Share based compensation: Options and Rights
Name
A Remuneration
consisting of options and rights
%
B Value at
grant date $
C Value at
exercise date $
D Value at
lapse date $
Dick McIlwain 19.7 – – –
Michael Carr 14.9 156,729 – –
Barrie Fletton 15.1 153,494 – –
Penny Grau 5.0 63,054 – –
Ray Gunston 13.7 241,900 34,400 –
Bruce Houston 7.3 52,503 – –
Stephen Lawrie 13.9 158,490 – –
Brendan Redmond 7.2 148,468 – –
A The percentage of the value of remuneration consisting of options and rights, based on the value of options and rights expensed during the current year.
B The value at grant date calculated in accordance with AASB 2 Share-based Payment of options and rights granted during the year as part of remuneration.
C The value at exercise date of options and rights that were granted as part of remuneration and were exercised during the year, being the intrinsic value of the options and rights at that date.
D The value at lapse date of options and rights that were granted as part of remuneration and that lapsed during the year because a vesting condition was not satisfied. The value is determined at the time of lapsing, but assuming the condition was satisfied.
Loans to Directors and ExecutivesThere were no loans to Directors and executives during the financial year.
Shares under options and rightsUnissued ordinary shares of the Company under options or rights at the date of this report are as follows:
Award type Grant date Expiry date Exercise priceNumber under options/rights
Performance option 16 December 2005 07 July 2012 $3.10 274,935
Performance right 16 December 2005 07 July 2012 N/A 12,768
Performance option 30 November 2006 30 November 2013 $3.13 2,000,000
Performance option 30 November 2006 30 November 2013 $3.65 628,106
Performance right 30 November 2006 30 November 2013 N/A 194,219
Performance option 30 November 2007 30 November 2014 $3.99 1,322,369
Performance option 30 November 2008 30 November 2015 $2.56 7,139,200
Total 11,571,597
Shares issued on the exercise of rightsDuring the year ended 30 June 2009, employees and executives have exercised 70,784 rights with a grant date of 16 December 2005 at an issue price of $1.80. No further shares have been issued since that date. No consideration is paid on the exercising of rights.
Indemnities and InsuranceArticle 7.3 of the Company’s Constitution provides that every person who is or has been a Director or Secretary of the Company or of a subsidiary of the Company may be indemnified by the Company, to the extent permitted by law, against liabilities:
incurred by the person as an officer (as defined in the • Corporations Act 2001) of the Company or a subsidiary of the Company; and
for legal costs incurred by the person in defending an action for a liability incurred by that person as an officer of the Company or a subsidiary •of the Company.F
or p
erso
nal u
se o
nly

36 | Tatts Group Limited Annual Report 2009
The Company has executed Deeds of Indemnity, Insurance and Access, consistent with this Article, in favour of all current and former Directors of the Company, certain current and former Directors of related bodies corporate of the Company, and the current and certain former Secretaries of the Company. Each Deed indemnifies those persons for the full amount of all such liabilities including costs and expenses.
For the year ended 30 June 2009, $nil (2008: $5,251) in aggregate has been paid pursuant to the Deeds in respect of legal costs incurred by certain former Directors of the Company.
The Company’s Constitution also allows the Company to pay insurance premiums for contracts insuring the officers of the Company in relation to any such liabilities and legal costs.
During or since the end of the financial year, consistent with the Company’s Constitution, the Company has paid the premium in respect of a contract insuring each of the Directors and the Secretary named in this Directors’ Report, the former Directors, and the officers of the Company and its subsidiaries as permitted by the Corporations Act 2001. The class of officers insured by the policy includes all officers involved in the management of the Group. The terms of the contract of insurance prohibit the disclosure of the nature of the liabilities insured against and the amount of the premium.
Pursuant to the terms of the Company’s standard engagement letter with PricewaterhouseCoopers (PwC), it indemnifies PwC against any liabilities, losses, claims, costs, damages or expenses that may result from third party claims arising out of or in relation to the provision of services or the use of any work performed under the engagement letter. The indemnity is for the full amount of all such liabilities including costs and expenses. The indemnity does not apply if prohibited by the Corporations Act 2001.
Proceedings on behalf of the CompanyNo person has applied to the Court under section 237 of the Corporations Act 2001 for leave to bring proceedings on behalf of the Company, or to intervene in any proceedings to which the Company is a party, for the purpose of taking responsibility on behalf of the Company for all or part of those proceedings.
No proceedings have been brought or intervened in on behalf of the Company with leave of the Court under section 237 of the Corporations Act 2001.
Non-Audit ServicesThe Company may decide to employ the auditor on assignments additional to their statutory audit duties where the auditor’s expertise and experience with the Group is important.
Details of the amounts paid or payable to the auditor (PricewaterhouseCoopers) for audit and non-audit services provided in respect of the Group during the year are set out below.
The Board of Directors has considered the position and, in accordance with the advice received from the Audit, Risk and Compliance Committee, is satisfied that the provision of the non-audit services is compatible with the general standard of independence for auditors imposed by the Corporations Act 2001. The Directors are satisfied that the provision of non-audit services by the auditor, as set out below, given the amounts paid and the type of work undertaken, did not compromise the auditor independence requirement of the Corporations Act 2001 for the following reasons:
all non-audit services have been reviewed by the Audit, Risk and Compliance Committee to ensure they do not impact the impartiality and objectivity •of the auditor; and
none of the services undermine the general principles relating to auditor independence as set out in APES 110 • Code of Ethics for Professional Accountants, including reviewing or auditing the auditor’s own work, acting in a management or decision making capacity for the Group, acting as advocate for the Group or jointly sharing economic risk and rewards.
Directors’ Report (continued)
For
per
sona
l use
onl
y

37
www.tattsgroup.com
During the year the following fees were paid or payable to PricewaterhouseCoopers for the provision of non-audit services:
Consolidated
2009 $
2008 $
Non-audit services
(a) Other assurance services
Fees paid to PricewaterhouseCoopers Australian firm:
Audit of regulatory returns 51,335 40,935
Due diligence services 30,000 –
Total remuneration for other assurance services 81,335 40,935
(b) Taxation services
Fees paid to PricewaterhouseCoopers Australian firm:
Tax compliance services, including review of company tax returns 26,643 7,477
Total remuneration for taxation services 26,643 7,477
Total remuneration for non-audit services 107,978 48,412
Subject to maintaining their independence, it is the Group’s policy to employ the services of PricewaterhouseCoopers on assignments additional to their statutory audit duties where PricewaterhouseCoopers’ expertise and experience with the Group is important. These assignments are principally tax advice and due diligence reporting on acquisitions.
Auditor’s IndependenceA copy of the auditor’s independence declaration as required under section 307C of the Corporations Act 2001 is set out on page 38, and forms part of the Directors’ Report for the financial year ended 30 June 2009.
Rounding of amountsThe Company is of a kind referred to in Class Order 98/010, issued by the Australian Securities and Investments Commission, relating to the “rounding off” of amounts in the Directors’ Report. Amounts in the Directors’ Report have been rounded off in accordance with that Class Order to the nearest thousand dollars, or in certain cases, to the nearest dollar.
Directors’ ResolutionThis Directors’ Report is made in accordance with a resolution of the Directors.
Harry Boon Dick McIlwain Chairman Managing Director/Chief Executive
Melbourne 27 August 2009
For
per
sona
l use
onl
y

38 | Tatts Group Limited Annual Report 2009
As lead auditor for the audit of Tatts Group Limited for the year ended 30 June 2009, I declare that to the best of my knowledge and belief, there have been:
a) no contraventions of the auditor independence requirements of the Corporations Act 2001 in relation to the audit; and
b) no contraventions of any applicable code of professional conduct in relation to the audit.
This declaration is in respect of Tatts Group Limited and the entities it controlled during the period.
Con Grapsas Partner PricewaterhouseCoopers
Melbourne 27 August 2009
Auditor’s Independence Declaration
PricewaterhouseCoopers ABN 52 780 433 757
Freshwater Place 2 Southbank Boulevard SOUTHBANK VIC 3006 GPO Box 1331 MELBOURNE VIC 3001 DX 77 Telephone 61 3 8603 1000 Facsimile 61 3 8603 1999
Liability limited by a scheme approved under Professional Standards Legislation.
For
per
sona
l use
onl
y

39
www.tattsgroup.com
Income Statements For the year ended 30 June 2009
Consolidated Parent entity2009 2008 2009 2008
Notes $’000 $’000 $’000 $’000Revenue from continuing operations 5 3,250,800 3,085,565 421,187 135,119Statutory outgoingsGovernment share (1,479,721) (1,439,504) – –Venue share/commission (625,715) (603,167) – –Other income 6 1,684 8,599 – 88Other expenses from ordinary activities 7Product/program fees (186,215) (170,971) – –Employee expenses (161,959) (140,905) (7,442) (5,920)Operating fees and direct costs (66,617) (65,113) – –Telecommunications and technology (35,042) (35,447) – –Marketing and promotions (34,880) (36,545) – –Information services (12,091) (12,297) – –Property expenses (53,365) (36,526) (28) (221)Restructuring costs 7 (2,472) (4,237) (359) –Other expenses (34,947) (33,632) (3,499) (4,058)Share of net loss of associates and joint ventures accounted for using the equity method 36(b) (105) (4,133) – –Profit before interest, income tax, depreciation, amortisation and impairment 559,355 511,687 409,859 125,008Impairment of assets 7 (4,857) – – (775,910)Depreciation and amortisation 7 (104,745) (98,739) (46) (100)Interest income 8,423 9,587 33,396 7,785Finance costs 7 (57,650) (53,625) (48,607) (9,333)Profit/(loss) before income tax 400,526 368,910 394,602 (652,550)Income tax (expense)/benefit 8 (122,478) (112,070) 6,639 (28,589)Profit/(loss) from continuing operations 278,048 256,840 401,241 (681,139)Profit from discontinued operations 9 – 1,197 – –Profit/(loss) for the year 278,048 258,037 401,241 (681,139)Profit/(loss) is attributable to: Ordinary equity holders of Tatts Group Limited 26(b) 277,441 257,586 401,241 (681,139) Minority interest 607 451 – –
278,048 258,037 401,241 (681,139)
Earnings per share for profit from continuing operations attributable to the ordinary equity holders of the Company: Cents CentsBasic earnings per share 38 21.9 20.3Diluted earnings per share 38 21.9 20.3Earnings per share for profit attributable to the ordinary equity holders of the Company: Cents CentsBasic earnings per share 38 21.9 20.4Diluted earnings per share 38 21.9 20.4The above income statements should be read in conjunction with the accompanying notes.
For
per
sona
l use
onl
y

40 | Tatts Group Limited Annual Report 2009
Consolidated Parent entity
Notes2009$’000
2008$’000
2009$’000
2008$’000
ASSETSCurrent assetsCash and cash equivalents 10 373,761 251,939 64,367 45,359Trade and other receivables 11 158,138 68,369 752,651 604,861Inventories 12 7,001 7,976 – –Total current assets 538,900 328,284 817,018 650,220Non-current assetsTrade and other receivables 11 89 38 – –Investments accounted for using the equity method 36 8,605 7,917 – –Available-for-sale financial assets 13 29,241 28,444 – –Derivative financial instruments 14 – 2,066 – –Property, plant and equipment 15 302,328 344,802 7,765 7,811Investment properties 16 14,939 8,745 – –Intangible assets 17 3,310,964 3,274,079 – –Deferred tax assets 18 40,405 38,335 5,077 7,704Other non-current assets 19 1,707 2,901 2,777,539 2,676,481Total non-current assets 3,708,278 3,707,327 2,790,381 2,691,996Total assets 4,247,178 4,035,611 3,607,399 3,342,216LIABILITIESCurrent liabilitiesTrade and other payables 20 462,987 313,218 12,189 8,414Interest bearing liabilities 21 3,473 230,127 – 218,056Derivative financial instruments 14 594 – 594 –Current tax liabilities 29,249 24,808 28,087 24,117Provisions 22 18,205 9,552 549 471Total current liabilities 514,508 577,705 41,419 251,058Non-current liabilitiesTrade and other payables 20 43,484 48,466 – –Interest bearing liabilities 21 904,255 649,657 748,776 429,855Derivative financial instruments 14 8,733 – 8,733 –Provisions 22 4,054 10,595 54 19Deferred tax liabilities 23 176,718 171,329 2,530 1,757Total non-current liabilities 1,137,244 880,047 760,093 431,631Total liabilities 1,651,752 1,457,752 801,512 682,689Net assets 2,595,426 2,577,859 2,805,887 2,659,527EQUITYContributed equity 25 2,333,193 2,321,082 3,432,660 3,420,549Reserves 26 (2,829) 2,745 (5,388) 2,200Retained profits 26 265,744 254,553 (621,385) (763,222)Parent entity interest 2,596,108 2,578,380 2,805,887 2,659,527Minority interest (682) (521) – –Total equity 2,595,426 2,577,859 2,805,887 2,659,527
The above balance sheets should be read in conjunction with the accompanying notes.
Balance Sheets As at 30 June 2009
For
per
sona
l use
onl
y

41
www.tattsgroup.com
Consolidated Parent entity
Notes2009$’000
2008$’000
2009$’000
2008$’000
Changes in the fair value of available-for-sale financial assets, net of deferred tax 26 (874) (3,613) – –Impairment of available-for-sale assets, net of deferred tax 26 3,400 – – –Changes in the value of interest rate swaps, net of deferred tax 26 (15,278) 8,912 (8,732) –Gain on realisation of interest rate swap, net of deferred tax 26 (2,366) – – –Changes in the value of forward foreign exchange contracts, net of deferred tax 26 (594) – (594) –Changes in the value of foreign currency net investment hedges 26 4,945 13,325 – –Exchange difference on translation of foreign operations 26 (3,391) (13,090) – –Actuarial loss on retirement benefit asset, net of tax 26 – (3,411) – –Net (expense)/income recognised directly in equity (14,158) 2,123 (9,326) –Profit/(loss) for the year 278,048 258,037 401,241 (681,139)Total recognised income and expense for the year 263,890 260,160 391,915 (681,139)Total recognised income and expense for the year is attributable to: Ordinary equity holders of Tatts Group Limited 263,283 259,709 391,915 (681,139) Minority interest 607 451 – –
263,890 260,160 391,915 (681,139)
The above statements of recognised income and expense should be read in conjunction with the accompanying notes.
Statements of recognised income and expenseFor the year ended 30 June 2009
For
per
sona
l use
onl
y

42 | Tatts Group Limited Annual Report 2009
Consolidated Parent entity
Notes2009$’000
2008$’000
2009$’000
2008$’000
Cash flows from operating activitiesReceipts from customers (inclusive of GST) net of prizes paid 3,264,487 3,139,485 436 110,119Payments to suppliers and employees (inclusive of GST) (414,426) (388,301) (8,835) (9,390)Payments to Government (1,423,507) (1,431,006) – –Payments to venues/commissions (625,715) (603,168) – –Payment for product and program fees (186,215) (170,971) – –
614,624 546,039 (8,399) 100,729Interest received 14,103 18,098 2,538 7,754Interest paid (59,376) (51,959) (47,998) (7,118)Income taxes paid (116,092) (124,827) (114,798) (116,262)Repayments received from entities in the tax consolidated group – – 128,808 73,277Net cash inflow/(outflow) from operating activities 37 453,259 387,351 (39,849) 58,380
Cash flows from investing activitiesPayments for purchase of subsidiaries, net of cash acquired (35,608) (60,527) – (62,208)Payments for investments in joint venture entities (793) (716) – –Payments for other assets – (10) – –Payments for property, plant and equipment (68,005) (81,199) – –Payments for investment properties (140) – – –Payments for intangibles (8,778) (21,827) – –Payments for deferred expenditure (158) (488) – –Loans from/(to) non-related parties (714) (8,500) – –Loans (to)/from related parties (4,498) (2,875) 307,304 186,833Proceeds from sale of other assets 884 4,527 – –Proceeds from sale of property, plant and equipment 1,287 16,920 – 11,650Proceeds from disposal of subsidiary, net of cash disposed – 145 – –Net cash (outflow)/inflow from investing activities (116,523) (154,550) 307,304 136,275
Cash flows from financing activitiesDividends paid (247,384) (297,359) (247,384) (297,359)Dividends paid to minority interests (682) – – –Proceeds from borrowings 47,057 950,635 – 647,929Repayment of borrowings (11,514) (906,380) (1,063) (530,000)Net cash outflow from financing activities (212,523) (253,104) (248,447) (179,430)
Net increase/(decrease) in cash and cash equivalents 124,213 (20,303) 19,008 15,225Cash and cash equivalents at beginning of the financial year 250,770 272,906 45,359 30,134Effect of exchange rate movements on cash and cash equivalents (1,973) (1,833) – –Cash and cash equivalents at end of the financial year 10 373,010 250,770 64,367 45,359
The above cash flow statements should be read in conjunction with the accompanying notes.
Cash Flow StatementsFor the year ended 30 June 2009
For
per
sona
l use
onl
y

43
www.tattsgroup.com
Note 1 Summary of significant accounting policiesThe principal accounting policies adopted in the preparation of the financial report are set out below. These policies have been consistently applied to all the years presented, unless otherwise stated. The financial report includes separate financial statements for Tatts Group Limited as an individual entity and the consolidated entity consisting of Tatts Group Limited and its subsidiaries.
(a) New accounting policies and changes in presentationThe accounting policies adopted are consistent with those of the previous financial year.
(b) Basis of preparation This general purpose financial report has been prepared in accordance with Australian Accounting Standards, other authoritative pronouncements of the Australian Accounting Standards Board (AASB) and the Corporations Act 2001.
Compliance with IFRSAustralian Accounting Standards include Australian equivalents to International Financial Reporting Standards (AIFRS). Compliance with AIFRS ensures that the financial statements and notes of Tatts Group Limited comply with International Financial Reporting Standards (IFRS), as issued by the International Accounting Standards Board (IASB).
Historical cost conventionThese financial statements have been prepared under the historical cost convention, as modified by the revaluation of available-for-sale financial assets, financial assets and liabilities (including derivative instruments) at fair value through profit and loss.
Critical accounting estimatesThe preparation of financial statements in conformity with AIFRS requires the use of certain critical accounting estimates. It also requires management to exercise its judgment in the process of applying the Tatts Group Limited group’s accounting policies. The areas involving a higher degree of judgement or complexity, or areas where assumptions and estimates are significant to the financial statements are disclosed in Note 3.
(c) Principles of consolidation(i) SubsidiariesThe consolidated financial statements incorporate the assets and liabilities of all subsidiaries of Tatts Group Limited (“Company” or “parent entity”) as at 30 June 2009 and the results of all subsidiaries for the year then ended. Tatts Group Limited and its subsidiaries together are referred to in this financial report as the Group or the consolidated entity.
Subsidiaries are all those entities (including special purpose entities) over which the Group has power to govern the financial and operating policies, generally accompanying a shareholding of more than one-half of the voting rights. The existence and effect of potential voting rights that are currently exercisable or convertible are considered when assessing whether the Group controls another entity.
Subsidiaries are fully consolidated from the date on which control is transferred to the Group. They are de-consolidated from the date that control ceases.
The purchase method of accounting is used to account for the acquisition of subsidiaries by the Group (refer Note 1(i)).
Intercompany transactions, balances and unrealised gains on transactions between Group companies are eliminated. Unrealised losses are also eliminated unless the transaction provides evidence of the impairment of the asset transferred. Accounting policies of subsidiaries have been changed where necessary to ensure consistency with the policies adopted by the Group.
Investments in subsidiaries are accounted for at cost in the individual financial statements of the Company.
The Group applies a policy of treating transactions with minority interests as transactions with parties external to the Group. Disposals to minority interests result in gains and losses for the Group that are recorded in the income statement. Purchases from minority interests result in goodwill, being the difference between any consideration paid and the relevant share acquired of the carrying value of identifiable net assets of the subsidiary.
Minority interests in the results and equity of subsidiaries are shown separately in the consolidated income statement and balance sheet respectively.
European Gaming Group (refer Note 33 and Note 36)
The investment in the European Gaming Group has been partially financed by a loan denominated in GBP that has been designated as a net investment hedge within the consolidated financial statements.
In the Company, a proportion of the investment is designated as a fair value hedge of the foreign currency risk associated with the loan. The proportion of the investment that is hedged has been revalued based on the closing GBP/AUD exchange rate with the gain/loss on revaluation being recognised in the income statement in line with the corresponding gain/loss arising on the revaluation of the GBP loan. The proportion of the investment that is not hedged is valued at cost.
Notes to the Financial StatementsFor the year ended 30 June 2009
For
per
sona
l use
onl
y

44 | Tatts Group Limited Annual Report 2009
Note 1 Summary of significant accounting policies (continued)(ii) AssociatesAssociates are all entities over which the Group has significant influence but not control, generally accompanying a shareholding of between 20% and 50% of the voting rights. Investments in associates are accounted for in the deemed parent entity financial statements using the cost method and in the consolidated financial statements using the equity method of accounting, after initially being recognised at cost. The Group’s investments in associates includes goodwill (net of any accumulated impairment loss) identified on acquisition.
The Group’s share of its associates’ post-acquisition profits or losses is recognised in the income statement, and its share of post-acquisition movements in reserves is recognised in reserves. The cumulative post-acquisition movements are adjusted against the carrying amount of the investment. Dividends receivable from associates are recognised in the parent entity’s income statement, while in the consolidated financial statements they reduce the carrying amount of the investment.
When the Group’s share of losses in an associate equals or exceeds its interest in the associate, including any other unsecured receivables, the Group does not recognise further losses, unless it has incurred obligations or made payments on behalf of the associate.
Unrealised gains on transactions between the Group and its associates are eliminated to the extent of the Group’s interest in the associates. Unrealised losses are also eliminated unless the transaction provides evidence of an impairment of the asset transferred.
(iii) Joint VenturesInterests in joint venture entities and partnerships are accounted for in the consolidated financial statements using the equity method and are carried at cost by the parent entity. Under the equity method, the share of the profits or losses of the joint venture is recognised in the income statement, and the share of movements in reserves is recognised in reserves in the balance sheet (refer Note 36).
Profits or losses on transactions establishing joint venture entities and partnerships and transactions with the joint venture entities and partnerships are eliminated to the extent of the Group’s ownership interest until such time as they are realised by the joint venture entity/partnership on consumption or sale, unless they relate to an unrealised loss that provides evidence of the impairment of an asset transferred.
(d) Segment reportingA business segment is a group of assets and operations engaged in providing products or services that are subject to risks and returns that are different to those of other business segments. A geographical segment is engaged in providing products or services within a particular economic environment and is subject to risks and returns that are different from those of segments operating in other economic environments.
(e) Foreign currency translation(i) Functional and presentation currencyItems included in the financial statements of each of the Group’s entities are measured using the currency of the primary economic environment in which the entity operates (‘the functional currency’). The consolidated financial statements are presented in Australian dollars, which is the Company’s functional and presentation currency.
(ii) Transactions and balancesForeign currency transactions are translated into the functional currency using the exchange rates prevailing at the dates of the transactions. Foreign exchange gains and losses resulting from the settlement of such transactions and from the translation at year-end exchange rates of monetary assets and liabilities denominated in foreign currencies are recognised in the income statement, except when deferred in equity as qualifying cash flow hedges and qualifying net investment hedges.
Translation differences on non-monetary items, such as equities held at fair value through profit or loss, are reported as part of the fair value gain or loss. Translation differences on non-monetary items, such as equities classified as available-for-sale financial assets, are included in the fair value reserve in equity.
(iii) Group companiesThe results and financial position of all the Group entities (none of which has the currency of a hyperinflationary economy) that have a functional currency different from the presentation currency are translated into the presentation currency as follows:
assets and liabilities for each balance sheet presented are translated at the closing rate at the date of that balance sheet;•
income and expenses for each income statement are translated at average exchange rates (unless this is not a reasonable approximation •of the cumulative effect of the rates prevailing on the transaction dates, in which case income and expenses are translated at the dates of the transactions); and
all resulting exchange differences are recognised as a separate component of equity.•
On consolidation, exchange differences arising from the translation of any net investment in foreign entities, and of borrowings and other currency instruments designated as hedges of such investments, are taken to shareholders’ equity. When a foreign operation is sold or borrowings forming part of the net investment are repaid, a proportionate share of such exchange differences is recognised in the income statement as part of the gain or loss on sale.
Goodwill and fair value adjustments arising on the acquisition of a foreign entity are treated as assets and liabilities of the foreign entity and translated at the closing rate.
Notes to the Financial Statements for the year ended 30 June 2009 (continued)
For
per
sona
l use
onl
y

45
www.tattsgroup.com
Note 1 Summary of significant accounting policies (continued)(f) Revenue recognitionRevenue is measured at the fair value of the consideration received or receivable. Revenue is recognised for the major business activities as follows:
Gaming revenueGaming gross turnover less prizes returned to the player is recorded as revenue at the point when the game has been completed in relation to Victorian and International gaming operations.
Gaming monitoring revenueGaming revenue in relation to monitoring activities/services provided by Maxgaming in Queensland and New South Wales is recognised when goods and/or services are provided.
Lotteries revenueGross subscriptions received for lotteries less prizes payable are recognised as revenue when the official draw for each game is completed. Subscriptions received during the year which will be drawn in the next financial period, are deferred and recognised as revenue in the next financial period.
Revenue from lottery card subscriptions is recognised over the life of the subscription.
Revenue for Club Keno is recognised when the official draw for each game is completed.
Wagering revenueWagering revenue is the residual value after deducting the statutory returns to customers from wagering turnover. Revenue is recognised at the point when the event on which the wagering investment is made is officially completed.
Rendering of servicesRevenue from the sale of goods or the rendering of a service is recognised upon the delivery of the goods or service to customers.
Interest revenueInterest revenue is recognised on a time proportion basis using the effective interest method.
Interest revenue earned on prize reserves and unpaid prizes are included in revenue from continuing operations. Interest revenue from all other balances is included in interest income.
Other revenueDividend revenue is recognised when the right to receive a dividend has been established.
(g) Income taxThe income tax expense or revenue for the year is the tax payable on the current year’s taxable income based on the income tax rate for each jurisdiction adjusted by changes in deferred tax assets and liabilities attributable to temporary differences between the tax bases of assets and liabilities and their carrying amounts in the financial statements, and to unused tax losses.
Deferred income tax is provided in full, using the liability method, on temporary differences arising between the tax bases of assets and liabilities and their carrying amounts in the consolidated financial statements. However, the deferred income tax is not accounted for if it arises from initial recognition of an asset or liability in a transaction other than a business combination that at the time of the transaction affects either accounting or taxable profit or loss. Deferred income tax is determined using tax rates (and laws) that have been enacted or substantially enacted by the balance sheet date and are expected to apply when the related deferred income tax asset is realised or the deferred income tax liability is settled.
Deferred tax assets are recognised for deductible temporary differences and unused tax losses only if it is probable that future taxable amounts will be available to utilise those temporary differences and losses.
Deferred tax liabilities and assets are not recognised for temporary differences between the carrying amount and tax bases of investments in controlled entities where the Company is able to control the timing of the reversal of the temporary differences and it is probable that the differences will not reverse in the foreseeable future.
Deferred tax assets and liabilities may be offset when there is a legally enforceable right to offset current tax assets and liabilities and when the deferred tax balances relate to the same taxation authority. Current tax assets and tax liabilities are offset where the entity has a legally enforceable right to offset and intends either to settle on a net basis, or to realise the asset and settle the liability simultaneously.
Current and deferred tax balances attributable to amounts recognised directly in equity are also recognised directly in equity.
Tax consolidation legislationTatts Group Limited and its wholly owned Australian subsidiaries have adopted the tax consolidation legislation. From 31 May 2005 Tatts Group Limited assumed the status of head entity under the tax consolidation legislation following a private binding ruling issued by the Australian Taxation Office.
For
per
sona
l use
onl
y

46 | Tatts Group Limited Annual Report 2009
Note 1 Summary of significant accounting policies (continued)The head entity, Tatts Group Limited, and the controlled entities in the tax consolidated group continue to account for their own current and deferred tax amounts. These tax amounts are measured as if each entity in the tax consolidated group continues to be a stand alone tax payer in its own right.
In addition to its own current and deferred tax amounts, Tatts Group Limited also recognises the current tax liabilities (or assets) and the deferred tax assets arising from unused tax losses and unused tax credits assumed from controlled entities in the tax consolidated group.
Assets or liabilities arising under tax funding agreements with the tax consolidated entities are recognised as amounts receivable from or payable to other entities in the Group. Details about the tax funding agreement are disclosed in Note 8.
Any difference between the amounts assumed and amounts receivable or payable under the tax funding agreement are recognised as a contribution to (or distribution from) wholly owned tax consolidated entities.
(h) Leases Leases of property, plant and equipment where the Group has substantially all the risks and rewards of ownership are classified as finance leases. Finance leases are capitalised at the lease’s inception at the fair value of the leased asset or, if lower, the present value of the minimum lease payments, including any guaranteed residual values. The corresponding obligation, net of finance charges, is included in interest bearing liabilities. Each lease payment is allocated between the liability and finance cost. The interest element of the finance cost is charged to the income statement over the lease period so as to produce a constant periodic rate of interest on the remaining balance of the liability for each period. Leased assets are depreciated on a straight-line basis over their estimated useful lives where it is likely that the Company will obtain ownership of the asset, and otherwise over the term of the lease.
Leases in which a significant portion of the risks and rewards of ownership are retained by the lessor are classified as operating leases (refer Note 31). Payments made under operating leases (net of any incentives received from the lessor) are charged to the income statement on a straight-line basis over the period of the lease.
Lease income from operating leases where the Group is a lessor is recognised in income on a straight-line basis over the lease term (refer Note 16).
(i) Acquisition of assetsThe purchase method of accounting is used to account for all acquisitions of assets (including business combinations) regardless of whether equity instruments or other assets are acquired. Cost is measured as the fair value of the assets given, equity instruments issued or liabilities incurred or assumed at the date of exchange plus costs directly attributable to the acquisition. Where equity instruments are issued in an acquisition, the fair value of the instruments is their published market price as at the date of exchange unless, in rare circumstances, it can be demonstrated that the published price at the date of exchange is an unreliable indicator of fair value and that other evidence and valuation methods provide a more reliable measure of fair value. Transaction costs arising on the issue of equity instruments are recognised directly in equity.
Identifiable assets and liabilities acquired and contingent liabilities assumed in a business combination are measured initially at their fair values at the acquisition date, irrespective of the extent of any minority interest. The excess of the cost of acquisition over the fair value of the Group’s share of the identifiable net assets acquired is recorded as goodwill (refer Note 1(s)). If the cost on acquisition is less than the Group’s share of the fair value of the net assets of the subsidiary acquired, the difference is recognised directly in the income statement, but only after a reassessment of the identification and measurement of the net assets acquired.
Where settlement of any part of cash consideration is deferred, the amounts payable in the future are discounted to their present value as at the date of exchange. The discount rate used is the entity’s incremental borrowing rate, being the rate at which a similar borrowing could be obtained from an independent financier under comparable terms and conditions.
(j) Impairment of assetsIntangible assets that have an indefinite useful life are not subject to amortisation and are tested six monthly for impairment or more frequently if events or changes in circumstances indicate that they may be impaired. Other assets are reviewed for impairment whenever events or changes in circumstances indicate that the carrying amount may not be recoverable. An impairment loss is recognised for the amount by which the asset’s carrying amount exceeds its recoverable amount. The recoverable amount is the higher of an asset’s fair value less costs to sell and value in use. For the purposes of assessing impairment, assets are grouped at the lowest levels for which there are separately identifiable cash flows (cash generating units).
(k) Cash and cash equivalentsCash and cash equivalents includes cash on hand, deposits held at call with financial institutions, other short-term, highly liquid investments with original maturities of three months or less that are readily convertible to known amounts of cash and which are subject to an insignificant risk of changes in value, and bank overdrafts. Bank overdrafts are shown within interest bearing liabilities in current liabilities on the balance sheet.
Notes to the Financial Statements for the year ended 30 June 2009 (continued)
For
per
sona
l use
onl
y

47
www.tattsgroup.com
Note 1 Summary of significant accounting policies (continued)(l) Trade receivablesTrade receivables are recognised initially at fair value and subsequently measured at amortised cost, less provision for impairment. Trade receivables are due for settlement between no more than 2 to 30 days from the date of recognition.
Collectability of trade receivables is reviewed on an ongoing basis. Debts which are known to be uncollectible are written off by reducing the carrying amount directly. A provision for the impairment of receivables is established when there is objective evidence that the Group will not be able to collect all amounts due according to the original terms of receivables. The amount of the impairment provision is the difference between the asset’s carrying amount and the present value of estimated future cash flows, discounted at the effective interest rate.
The amount of the impairment is recognised in the income statement within other expenses. Subsequent recoveries of amounts previously written off are credited against other expenses in the income statement.
(m) InventoriesRaw materials and stores, work in progress and finished goods are stated at the lower of cost and net realisable value. Inventories of spare parts are measured at cost, less accumulated depreciation. Depreciation of spare parts is based upon their estimated useful life. Costs are assigned on a first in first out basis and comprise direct materials. Net realisable value is the estimated selling price in the ordinary course of business less the estimated costs of completion and the estimated costs necessary to make the sale.
(n) Non-current assets held for sale and discontinued operations Non-current assets are classified as held for sale and stated at the lower of their carrying amount and fair value less costs to sell if their carrying amount will be recovered principally through a sale transaction rather than through continuing use.
An impairment loss is recognised for any initial or subsequent write down of the asset to fair value less costs to sell. A gain is recognised for any subsequent increases in fair value less costs to sell of an asset, but not in excess of any cumulative impairment loss previously recognised. A gain or loss not previously recognised by the date of the sale of the non-current asset is recognised at the date of derecognition.
Non-current assets are not depreciated or amortised while they are classified as held for sale. Non-current assets classified as held for sale are presented separately from the other assets in the balance sheet.
A discontinued operation is a component of the entity that has been disposed of or is classified as held for sale and that represents a separate major line of business or area of operations, is part of a single co-ordinated plan to dispose of such a line of business or area of operations, or is a subsidiary acquired exclusively with a view to resale. The results of discontinued operations are presented separately on the face of the income statement.
(o) Investments and other financial assetsClassificationThe Group classifies its investments in the following categories: financial assets at fair value through profit or loss, loans and receivables, held-to-maturity investments, and available-for-sale financial assets. The classification depends on the purpose for which the investments were acquired. Management determines the classification of its investments at initial recognition and re-evaluates this designation at each reporting date.
(i) Financial assets at fair value through profit or loss Financial assets at fair value through profit or loss are financial assets held for trading. A financial asset is classified in this category if acquired principally for the purpose of selling in the short term. Derivatives are also categorised as held for trading unless they are designated as hedges. Assets in this category are classified as current assets if they are either held for trading or are expected to be realised within 12 months of the balance sheet date.
(ii) Loans and receivablesLoans and receivables are non-derivative financial assets with fixed or determinable payments that are not quoted in an active market. They arise when the Group provides money, goods or services directly to a debtor with no intention of selling the receivable. They are included in current assets, except for those with maturities greater than 12 months after the balance sheet date which are classified as non-current assets. Loans and receivables are included in receivables in the balance sheet.
(iii) Held-to-maturity investmentsHeld-to-maturity investments are non-derivative financial assets with fixed or determinable payments and fixed maturities that the Group’s management has the positive intention and ability to hold to maturity. Assets in this category are classified as non-current assets, except for those with maturities less than 12 months from reporting date, which are classified as current assets.F
or p
erso
nal u
se o
nly

48 | Tatts Group Limited Annual Report 2009
Note 1 Summary of significant accounting policies (continued)(iv) Available-for-sale financial assetsAvailable-for-sale financial assets, comprising principally marketable equity securities, are non-derivatives that are either designated in this category or not classified in any of the other categories. They are included in non-current assets unless management intends to dispose of the investment within 12 months of the balance sheet date. Investments are designated as available-for-sale if they do not have fixed maturities and fixed or determinable payments and management intends to hold them for the medium to long term.
Recognition and derecognitionPurchases and sales of investments and other financial assets are recognised on trade date, being the date on which the Group commits to purchase or sell the asset. Investments are initially recognised at fair value plus transaction costs for all financial assets not carried at fair value through profit or loss. Financial assets are derecognised when the rights to receive cash flows from the financial assets have expired or have been transferred and the Group has transferred substantially all the risks and rewards of ownership.
When securities classified as available-for-sale are sold, the accumulated value adjustments recognised in equity are included in the income statement as gains and losses from investment securities.
Subsequent measurementAvailable-for-sale financial assets and financial assets at fair value through profit and loss are subsequently carried at fair value. Loans and receivables and held-to-maturity investments are carried at amortised cost using the effective interest method. Realised and unrealised gains and losses arising from changes in the fair value of the ‘financial assets at fair value through profit and loss’ category are included in the income statement in the period in which they arise. Unrealised gains and losses arising from changes in the fair value of available-for-sale financial assets are recognised in equity in the available-for-sale financial assets revaluation reserve. When securities classified as available-for-sale are sold or impaired, the accumulated fair value adjustments are included in the income statement as gains and losses from investment securities.
The fair values of quoted investments are based on current bid prices. If the market for a financial asset is not active, and for unlisted securities, the Group establishes fair value by using valuation techniques. These include reference to the fair values of recent arm’s length transactions, involving the same instruments or other instruments that are substantially the same, discounted cash flow analysis, and option pricing models refined to reflect the issuer’s specific circumstances.
ImpairmentThe Group assesses at each balance date whether there is objective evidence that a financial asset or group of financial assets is impaired. In the case of equity securities classified as available-for-sale, a significant or prolonged decline in the fair value of a security below its cost is considered in determining whether the security is impaired. If any such evidence exists for available-for-sale financial assets, the cumulative loss – measured as the difference between the acquisition cost and the current fair value, less any impairment loss on that financial asset previously recognised in profit and loss – is removed from equity and recognised in the income statement. Impairment losses recognised in the income statement on equity instruments classified as available-for-sale are not reversed through the income statement.
(p) Derivatives Derivatives are initially recognised at fair value on the date the derivative contract is entered into and are subsequently remeasured to their fair value at each reporting date. The accounting for subsequent changes in the fair value depends on whether the derivative is designated as a hedging instrument, and if so, the nature of the item being hedged. The Group designates derivatives as either:
hedges of the fair value of recognised assets or liabilities or a firm commitment (fair value hedges); •
hedges of the cash flows of recognised assets and liabilities and highly probable forecast transactions (cash flow hedges); or •
hedges of a net investment in a foreign operation (net investment hedges).•
The Group documents at the inception of the transaction the relationship between hedging instruments and hedged items, as well as its risk management objective and strategy for undertaking various hedge transactions. The Group also documents its assessment, both at hedge inception and on an ongoing basis, of whether the derivatives that are used in hedging transactions have been and will continue to be highly effective in offsetting changes in fair values or cash flows of hedged items.
The fair values of various derivative financial instruments used for hedging purposes are disclosed in Note 14, while movements in the hedging reserve are shown in Note 26. The full fair value of a hedging derivative is classified as a non-current asset or liability when the remaining maturity of the hedged items is more than 12 months. It is classified as a current asset or liability when the remaining maturity of the hedged item is less than 12 months.
(i) Fair value hedgeChanges in the fair value of derivatives that are designated and qualify as fair value hedges are recorded in the income statement, together with any changes in the fair value of the hedged asset or liability that are attributable to the hedged risk.
If the hedge no longer meets the criteria for hedge accounting, the adjustment to the carrying amount of a hedge item for which the effective interest method is used is amortised to profit or loss over the period to maturity using a recalculated effective interest rate.
Notes to the Financial Statements for the year ended 30 June 2009 (continued)
For
per
sona
l use
onl
y

49
www.tattsgroup.com
Note 1 Summary of significant accounting policies (continued)(ii) Cash flow hedgeThe effective portion of changes in the fair value of derivatives that are designated and qualify as cash flow hedges is recognised in equity in the hedging reserve. The gain or loss relating to the ineffective portion is recognised immediately in the income statement.
Amounts accumulated in equity are recycled in the income statement in the periods when the hedged item will affect profit or loss (for instance when the forecast sale that is hedged takes place). The gain or loss relating to the effective portion of the interest rate swaps hedging variable rate borrowings and forward contracts hedging foreign currency operating and interest payments is recognised in the income statement within finance costs. However, when the forecast transaction that is hedged results in the recognition of a non-financial asset (for example, inventory or fixed assets) or a non-financial liability, the gains and losses previously deferred in equity are transferred from equity and included in the measurement of the initial cost or carrying amount of the asset or liability.
When a hedging instrument expires or is sold or terminated, or when a hedge no longer meets the criteria for hedge accounting, any cumulative gain or loss existing in equity at that time remains in equity and is recognised when the forecast transaction is ultimately recognised in the income statement. When a forecast transaction is no longer expected to occur, the cumulative gain or loss that was reported in equity is immediately transferred to the income statement.
(iii) Net investment hedgeHedges of a net investment in a foreign operation, including a hedge of a monetary item that is accounted for as part of the net investment, are accounted for in a similar way to cash flow hedges. Gains or losses on the hedging instrument relating to the effective portion of the hedge are recognised directly in equity while any gains or losses relating to the ineffective portion are recognised in profit or loss. On disposal of the foreign operation, the cumulative value of any such gains or losses recognised directly in equity is transferred to profit or loss.
(iv) Derivatives that do not qualify for hedge accountingCertain derivative instruments do not qualify for hedge accounting. Changes in the fair value of any derivative instrument that does not qualify for hedge accounting are recognised immediately in the income statement.
(q) Property, plant and equipment Property, plant and equipment (including investment properties, refer Note 1(r)) is stated at historical cost less depreciation. Historical cost includes expenditure that is directly attributable to the acquisition of the items. Cost may also include transfers from equity of any gains/losses on qualifying cash flow hedges of foreign currency purchases of property, plant and equipment.
Subsequent costs are included in the asset’s carrying amount or recognised as a separate asset, as appropriate, only when it is probable that future economic benefits associated with the item will flow to the Group and the cost of the item can be measured reliably. All other repairs and maintenance are charged to the income statement during the financial period in which they are incurred.
Land is not depreciated. Depreciation on other assets is calculated using the straight-line method to allocate their cost or revalued amounts, net of their residual values, over their useful lives, as follows:
Buildings 25-50 yearsFreehold improvements 25-40 yearsPlant and equipment 2-10 yearsLeasehold improvements 7 years
The assets’ residual values and useful lives are reviewed, and adjusted if appropriate, at each balance sheet date (refer Note 3(c)). An asset’s carrying amount is written down immediately to its recoverable amount if the asset’s carrying amount is greater than its estimated recoverable amount (Note 1(j)).
Plant and equipment under development is not depreciated. Depreciation will commence on completion of the development when the assets are available for use.
Gains and losses on disposals are determined by comparing proceeds with carrying amount. These are included in the income statement.
(r) Investment propertyInvestment property, principally comprising land and buildings of gaming venues and freehold commercial buildings, is held for long-term rental yields and is not occupied by the Group. Investment property is carried at cost less subsequent depreciation.
Depreciation is calculated using the straight-line method in accordance with the accounting policy for property, plant and equipment (Note 1(q)).
A property’s carrying amount is written down immediately to its recoverable amount if the property’s carrying amount is greater than its estimated recoverable amount (Note 1(j)).
For
per
sona
l use
onl
y

50 | Tatts Group Limited Annual Report 2009
Note 1 Summary of significant accounting policies (continued)(s) Intangible assets(i) GoodwillGoodwill represents the excess of the cost of an acquisition over the fair value of the Group’s share of the net identifiable assets of the acquired subsidiary/associate at the date of acquisition. Goodwill on acquisitions of subsidiaries is included in intangible assets. Goodwill on acquisitions of associates is included in investments in associates. Goodwill acquired in business combinations is not amortised. Instead, goodwill is tested for impairment annually or more frequently if events or changes in circumstances indicate that it might be impaired, and is carried at cost less accumulated impairment losses. Gains and losses on the disposal of an entity include the carrying amount of goodwill relating to the entity sold.
Goodwill is allocated to cash-generating units for the purpose of impairment testing.
(ii) Licences Licences that have a finite useful life are carried at cost less accumulated amortisation and impairment losses. Amortisation is calculated using the straight-line method to allocate the cost of licences over their estimated useful lives.
The expected useful lives used for licences are as follows:
Race wagering licence – Qld 92 years Expires 2098Sports wagering licence - Qld 8 years Expires 2014Totalisator licence – NT 9 years Expires 2015Sports bookmaker licence - NT 9 years Expires 2015Major betting operations licence - SA 94 years Expires 2100Gaming machine monitoring operator’s licence – Qld 10 years Expires 2017Monitoring provider’s licence – NT 5 years Expires 2011Centralised monitoring system licence – NSW 10 years Expires 2016Inter-club linked gaming system licence – NSW 11 years Expires 2017Inter-hotel linked gaming system licence – NSW 13 years Expires 2019Radio licences 11 years Expires 2014Victorian lotteries licence 10 years Expires 2018
The Victorian gaming licence was not amortised as the licence expiry payment which may be paid to the Company at the end of the licence period was expected to be not less than the carrying value of the asset. The licence has now been fully impaired (refer Note 17).
The carrying value of licences is reviewed annually and any balance representing future benefits for which realisation is considered to be no longer probable is written off.
(iii) Brand The Tattersall’s brand was carried at cost by the Company. Due to AASB 3 Business Combinations requirements the balance was eliminated on consolidation. The Tattersall’s brand has now been fully impaired (refer Note 17).
The UNiTAB brand is an indefinite life asset carried at cost being the fair value on acquisition of UNiTAB. It is reviewed annually by reference to future cash flows to ensure it is not carried in excess of recoverable amount.
Brands with a finite useful life are carried at cost less accumulated depreciation and impaired losses. Amortisation is calculated using the straight line method to allocate the cost of the brands over their estimated useful lives.
The expected useful lives used for brands are as follows:
Brand name – SA 16 yearsGolden Casket Brands – Qld 65 years
(iv) Research and developmentExpenditure on research activities, undertaken with the prospect of obtaining new technical knowledge and understanding, is recognised in the income statement as an expense when it is incurred.
Notes to the Financial Statements for the year ended 30 June 2009 (continued)
For
per
sona
l use
onl
y

51
www.tattsgroup.com
Note 1 Summary of significant accounting policies (continued)(v) IT development and softwareCosts incurred in developing products or systems that will contribute to future period financial benefits through revenue generation and/or cost reduction are capitalised to software. Costs capitalised include external direct costs of materials and service, direct payroll and payroll related costs of employees’ time spent on the project.
Capitalised software is carried at cost less accumulated amortisation and impaired losses. Amortisation is calculated using the straight line method to allocate the cost of the software over its estimated useful life of 2 to 14 years.
(vi) OtherThe cost associated with the Golden Casket Lottery Operator Agreement is carried at cost less accumulated depreciation and impaired losses. Amortisation is calculated using the straight line method to allocate the cost of the agreement over the term of 65 years, expiring in 2072.
(t) Trade and other payablesThese amounts represent liabilities for goods and services provided to the Group prior to the end of the financial year which are unpaid. The amounts are unsecured and are usually paid within 30 days of recognition.
Prizes payable to ‘Set for Life’ major prize winners are payable over periods exceeding 12 months and are valued at the net present value of the future expected cash flows. The portion of this liability which is payable more than 12 months post balance date is reported as a non-current liability.
(u) Interest bearing liabilitiesInterest bearing liabilities, such as loans, are initially recognised at fair value, net of transaction costs incurred and subsequently measured at amortised cost. Any difference between the proceeds (net of transaction costs) and the redemption amount is recognised in the income statement over the period of the borrowings using the effective interest method.
Interest bearing liabilities are classified as current liabilities unless the Group has an unconditional right to defer settlement of the liability for at least 12 months after the balance sheet date.
(v) Finance costs Finance costs incurred for the acquisition, construction or production of any qualifying asset are capitalised during the period of time that is required to complete and prepare the asset for its intended use or sale. Other finance costs are expensed.
(w) ProvisionsProvisions are recognised when:
the Group has a present legal or constructive obligation as a result of past events; •
it is probable that an outflow of resources will be required to settle the obligation; and•
the amount has been reliably estimated.•
Provisions are not recognised for future operating losses.
Where there are a number of similar obligations, the likelihood that an outflow will be required in settlement is determined by considering the class of obligations as a whole. A provision is recognised even if the likelihood of an outflow with respect to any one item included in the same class of obligations may be small.
Provisions are measured at the present value of the best estimate of the expenditure required to settle the present obligation.
(x) Employee benefits(i) Wages and salaries and annual leave Liabilities for wages and salaries, including non-monetary benefits and annual leave expected to be settled within 12 months of the reporting date, are recognised in other payables in respect of employees’ services up to the reporting date and are measured at the amounts expected to be paid when the liabilities are settled.
(ii) Long service leaveThe liability for long service leave is recognised in the provision for employee benefits and measured as the present value of expected future payments to be made in respect of services provided by employees up to the reporting date using the projected unit credit method. Consideration is given to expected future wage and salary levels, experience of employee departures and periods of service. Expected future payments are discounted using market yields at the reporting date on national government bonds with terms to maturity and currency that match, as closely as possible, the estimated future cash outflows.
For
per
sona
l use
onl
y

52 | Tatts Group Limited Annual Report 2009
Note 1 Summary of significant accounting policies (continued)(iii) Retirement benefit obligationsAll Group employees are entitled to become members of the Group’s accumulation (defined contribution) plan, whilst some employees employed by Golden Casket Lottery Corporation Limited (and previously UNiTAB Limited) have previously elected into the plans as outlined below. The accumulation plan receives superannuation guarantee contributions from Group companies and the Group’s legal or constructive obligation is limited to these contributions.
UNiTAB Limited and its controlled entities were acquired on 12 October 2006. UNiTAB Limited and certain controlled entities contributed to one defined benefit and several accumulation employee superannuation plans. Contributions by these entities of up to 9% of employees’ wages and salaries are legally enforceable.
In the prior year the defined benefit plan contributed to by employees of UNiTAB Limited was closed with all assets/obligations being converted into assets/entitlements within either the Group accumulation plan or another suitable plan nominated by the former members.
Golden Casket Lottery Corporation Limited and its controlled entities contribute to the State Public Sector Superannuation Scheme (Q-Super), with all contributions recognised as an expense when incurred. Benefits are provided to employees on either a defined benefit basis or through an accumulation fund. Both funds are administered by the Queensland Government Superannuation Office. No liability is recognised for superannuation benefits in respect of defined benefit and accumulation plans to which Golden Casket Lottery Corporation Limited and its controlled entities contributes as this liability is held on a Whole of Government basis and reported in the Whole of Government financial statements.
A liability or asset in respect of defined benefit superannuation plans is recognised in the balance sheet, and is measured as the present value of the defined benefit obligation at the reporting date less the fair value of the superannuation fund’s assets at that date and any unrecognised past service cost. The present value of the defined benefit obligation is based on expected future payments which arise from membership of the fund to the reporting date, calculated annually by independent actuaries using the projected unit credit method. Consideration is given to expected future wage and salary levels, experience of employee departures and periods of service.
Expected future payments are discounted using market yields at the reporting date on national government bonds with terms to maturity and currency that match, as closely as possible, the estimated future cash outflows.
Actuarial gains and losses arising from experience adjustments and changes in actuarial assumptions are recognised in the period in which they occur, directly in equity.
Past service costs are recognised immediately in income, unless the changes to the superannuation fund are conditional on the employees remaining in service for a specified period of time (the vesting period). In this case, the past service costs are amortised on a straight-line basis over the vesting period.
Future taxes that are funded by the entity as part of the provision of the existing benefit obligation (e.g. taxes on investment income and employer contributions) are taken into account in measuring the net liability or asset.
Contributions to defined contribution funds are recognised as an expense as they become payable. Prepaid contributions are recognised as an asset to the extent that a cash refund or a reduction in the future payments is available.
(iv) Share-based payments (Long-Term Incentive Plan)Share-based compensation benefits are provided to employees via the Long-Term Incentive Plan (LTIP), an equity settled plan.
The fair value of performance options and rights granted under the LTIP is recognised as an employee benefit expense with a corresponding increase in equity. The fair value is measured at determination date and recognised over the period during which the employees become unconditionally entitled to the options.
The assessed fair value at determination date of options and rights granted to the individuals is allocated equally over a three year period from determination date. Fair values at determination date were determined using a Monte-Carlo Simulation Valuation methodology that takes into account the exercise price, the term of the option, the impact of dilution, the share price at determination date and expected price volatility of the underlying share, the expected dividend yield and the risk-free interest rate for the term of the option.
The fair value of the options and rights granted excludes the impact of any non-market vesting conditions (for example, profitability and sales and growth targets). Non-market vesting conditions are included in assumptions about the number of options that are expected to become exercisable. At each balance sheet date, the Group revises its estimates of the number of options that are expected to become exercisable.
Upon the exercise of options, the balance of the share-based payments reserve relating to those options is transferred to share capital.
The market value of shares issued to employees for no cash consideration under the LTIP is recognised as an employee benefits expense with a corresponding increase in equity when the employees become entitled to the shares.
Notes to the Financial Statements for the year ended 30 June 2009 (continued)
For
per
sona
l use
onl
y
53
www.tattsgroup.com
Note 1 Summary of significant accounting policies (continued)(v) Short-Term Incentive Plan The Group recognises a liability and an expense for bonuses and profit-sharing based on a formula that takes into consideration the profit attributable to the Company’s shareholders after certain adjustments. The Group recognises a provision where contractually obliged or where there is a past practice that has created a constructive obligation.
(vi) Termination benefitsTermination benefits are payable when employment is terminated before the normal retirement date, or when an employee accepts voluntary redundancy in exchange for these benefits. The Group recognises termination benefits when it is demonstrably committed to either terminating the employment of current employees according to a detailed formal plan without possibility of withdrawal or providing termination benefits as a result of an offer made to encourage voluntary redundancy.
(y) Contributed equityOrdinary shares are classified as equity.
Incremental costs directly attributable to the issue of new shares or options are shown in equity as a deduction, net of tax, from the proceeds. Incremental costs directly attributable to the issue of new shares or options, for the acquisition of a business, are not included in the cost of the acquisition as part of the purchase consideration.
(z) DividendsProvision is made for the amount of any dividend determined, being appropriately authorised on or before the end of the financial year but not distributed at balance sheet date.
(aa) Earnings per share(i) Basic earnings per shareBasic earnings per share is calculated by dividing the profit attributable to equity holders of the Company, excluding any costs of servicing equity other than ordinary shares, by the weighted average number of ordinary shares outstanding during the financial year, adjusted for bonus elements in ordinary shares issued during the year.
(ii) Diluted earnings per shareDiluted earnings per share adjusts the figures used in the determination of basic earnings per share to take into account the after income tax effect of interest and other financial costs associated with dilutive potential ordinary shares and the weighted average number of shares assumed to have been issued for no consideration in relation to dilutive potential ordinary shares.
(ab) Goods and Services Tax (GST)Revenues, expenses and assets are recognised net of the amount of the associated GST unless the GST incurred is not recoverable from the taxation authority. In this case it is recognised as part of the cost of acquisition of the asset or as part of the expense.
Receivables and payables are stated inclusive of the amount of GST receivable or payable. The net amount of GST recoverable from, or payable to, the taxation authority is included with other receivables or payables in the balance sheet.
Cash flows are presented on a gross basis. The GST components of cash flows arising from investing or financing activities which are recoverable from, or payable to, the taxation authority, are presented as operating cash flow.
(ac) Rounding of amountsThe Company is of a kind referred to in Class Order 98/0100, issued by the Australian Securities and Investments Commission, relating to the “rounding off” of amounts in the financial report. Amounts in the financial report have been rounded off in accordance with that Class Order to the nearest thousand dollars, or in certain cases, the nearest dollar.
(ad) New accounting standards and AASB interpretationsCertain new accounting standards and interpretations have been published that are not mandatory for the 30 June 2009 reporting period. The Group’s assessment of the impact of these new standards and interpretations is set out below. All of the accounting standards and interpretations listed below are applicable to annual reporting periods on or after 1 January 2009, and none have been early adopted by the Group. The Group will apply the revised standards from 1 July 2009.
(i) Revised AASB 3 Business Combinations, AASB 127 Consolidated and Separate Financial Statements and AASB 2008-3 Amendments to Australian Accounting Standards arising from AASB 3 and AASB 127The revised AASB 3 and AASB 127 change the application of acquisition accounting for business combinations and the accounting for non-controlling interests. Key changes include the immediate expensing of all transaction costs; measurement of contingent consideration at acquisition date with subsequent changes through the income statements, measurement of minority interests at full fair value or the proportionate share of fair value of the underlying net assets and the inclusion of combinations by contract alone. These changes will be applied prospectively to all business combinations and transactions with non-controlling interests from 1 July 2009.
For
per
sona
l use
onl
y
54 | Tatts Group Limited Annual Report 2009
Note 1 Summary of significant accounting policies (continued)(ii) AASB 2008-7 Amendments to Australian Accounting Standards – Cost of an Investment in a Subsidiary, Jointly controlled entity or AssociateThe revised AASB 127 Consolidated and Separate Financial Statements will mean all dividends received from investments in subsidiaries, jointly controlled entities or associates will be recognised as revenue, even if they are paid out of pre-acquisition profits. However the investments may need to be tested for impairment as a result of the dividend payment. This is not expected to have a material impact on the Group’s financial statements
(iii) AASB 8 Operating Segments and AASB 2007-3 Amendments to Australian Accounting Standards arising from AASB 8AASB 8 and AASB 2007-3 will result in a change in the approach to segment reporting, as it requires adoption of a ‘management approach’ to reporting on financial performance. The information reported will be based on what the key decision makers of the Group use internally for evaluating segment performance and allocating resources to operating segments. Application of the standard will not affect any of the amounts recognised in the financial statements. Disclosures in the segment note as currently presented are not expected to change significantly under the new approach.
(iv) Revised AASB 123 Borrowing Costs and AASB 2007-6 Amendments to Australian Accounting Standards arising from AASB 123The revised AASB 123 has removed the option to expense all borrowing costs and, when adopted, will require the capitalisation of all borrowing costs directly attributable to the acquisition, construction or production of a qualifying asset. There will be no impact on the financial report of the Group, as the Group already capitalises borrowing costs relating to qualifying assets.
(v) Revised AASB 101 Presentation of Financial Statements and AASB 2007-8 Amendments to Australian Accounting Standards arising from AASB 101A revised AASB 101 requires the presentation of a statement of comprehensive income and makes changes to the statement of changes in equity. The standard does not change the recognition, measurement or disclosure of transactions or events required by other standards. If the Group has made a prior period adjustment or has reclassified items in the financial statements, it will need to disclose a third balance sheet at the beginning of the comparative period.
(vi) AASB 2008-1 Amendments to Australian Accounting Standards – Share-based Payments: Vesting Conditions and CancellationsAASB 2008-1 clarifies that vesting conditions are service conditions and performance conditions only and that other features of a share-based payment are not vesting conditions. It also specifies that all cancellations, whether by the entity or by other parties, should receive the same accounting treatment. This is not expected to affect the accounting for the Group’s share-based payments.
(vii) AASB Interpretation 16 Hedges of a Net Investment in a Foreign OperationAASB-I 16 clarifies which foreign currency risks qualify as hedged risk in the hedge of a net investment in a foreign operation and that hedging instruments may be held by any entity or entities within the Group. It also provides guidance on how an entity should determine the amounts to be reclassified from equity to profit and loss for both the hedging instrument and hedged item. There will be no changes to the existing accounting for hedging of a foreign operation as a result of these changes.
Note 2 Financial risk managementFinancial risk management is carried out by a central treasury function (Group Treasury) under policies approved by the Board of Directors. Group Treasury identifies, monitors and manages financial risks in co-operation with the Group’s operating units. The Treasury and Investment Committee internally co-ordinate this process, and the Audit, Risk and Compliance Committee oversees the management and implementation of the risk management framework and policies.
The Group’s activities expose it to a variety of financial risks: market risk (including foreign exchange risk and price risk), credit risk, liquidity risk and fair value interest rate risk. The Group’s overall risk management program focuses on the unpredictability of financial markets and seeks to minimise potential adverse effects on the financial performance of the Group. The Group uses various risk management approaches, including where appropriate derivative financial instruments such as foreign exchange contracts and interest rate swaps, to hedge certain risk exposures. Derivatives, when utilised, are exclusively for hedging purposes, i.e. not for trading or other speculative purposes. The Group uses a variety of methods to measure the extent of different types of risk to which it is exposed, including market or fair value or face value as appropriate.
The operation of this treasury activity is managed through segregation of duties, reporting requirements and structured authority levels, and is subject to ongoing internal and external audit review.
(a) Market risk(i) Foreign exchange riskThe Group operates internationally and is exposed to foreign exchange risk arising predominately from currency exposures to the British Pound, South African Rand, Swedish Kroner, and various other currencies from time to time.
Foreign exchange risk arises when future commercial transactions and recognised assets and liabilities are denominated in a currency that is not the entity’s functional currency, and from net investments in foreign operations. Management of foreign exchange risk is focused on minimising the volatility of Group financial results to adverse exchange rate movements by protecting the cash flows of the business and reducing large investment exposures to such exchange rate movements. This is achieved through a combination of risk management approaches including forward foreign exchange contracts, holding foreign currency cash balances against exposures, and minimising offshore net asset holdings through foreign currency denominated debt.
Notes to the Financial Statements for the year ended 30 June 2009 (continued)
For
per
sona
l use
onl
y

55
www.tattsgroup.com
Note 2 Financial risk management (continued)The Group and parent entity’s material exposure to foreign currency risk at the reporting dates was as follows:
30 June 2009 30 June 2008GBP ’000
GBP ’000
Interest bearing liabilities 111,170 61,170Derivative financial liability 3,746 –Forward exchange contracts - buy foreign currency (cash flow hedge) 4,850 –
119,766 61,170
The following relevant exchange rates applied during the year:
Average rate Spot rate – 30 JuneCurrency 2009 2008 2009 2008British Pound (GBP) 0.46259 0.44990 0.489609 0.480498South African Rand (ZAR) 6.51005 6.61339 6.234707 7.467829Swedish Kroner (SEK) 5.63730 5.69657 6.228967 5.762224
Sensitivity analysisBased on the financial instruments held at 30 June 2009, had the Australian dollar weakened/strengthened by 10% (2008: 10%) against the British Pound with all other variables held constant, the Group’s post tax profit for the year would have been the same as that reported in the income statement, while equity would have been $11,977,000 higher/lower (2008: $6,117,000 higher/lower) than that reported in the balance sheet.
In the parent entity, based on the financial instruments held at 30 June 2009, had the Australian dollar weakened/strengthened by 10% (2008: 10%) against the British Pound with all other variables held constant, the Company’s post tax profit for the year would have been the same as that reported in the income statement, while equity would have been $11,977,000 higher/lower (2008: $6,117,000 higher/lower) than that reported in the balance sheet.
The Group’s and Company’s exposure to other foreign exchange movements is not material.
(ii) Price riskThe Group is exposed to equity securities price risk. This arises from investments held by the Group and classified on the balance sheet as available-for-sale financial assets (refer Note 13 for further information). Neither the Group nor the parent entity is directly exposed to commodity price risk.
Such equity investments are not part of the usual business operations or strategies of the Group and do not represent a material exposure to the Group. As at 30 June 2009, the amount held is $29,241,000 (2008: $28,444,000).
Based on the equity securities held at 30 June 2009, had the share price increased/decreased by 10% (2008: 10%) with all other variables held constant, the Group’s post tax profit for the year would have been unaffected while equity would have been $2,921,000 higher/lower (2008: $2,845,000 higher/lower).
(iii) Cash flow and fair value interest rate riskRefer to (d) below.
(b) Credit riskCredit risk is the risk that the Group will suffer a financial loss due to the inability of a counterparty to meet its financial and/or contractual obligations. In relation to treasury activities, credit risk arises primarily from investments, and from the use of risk management derivative instruments. Business and trade related credit risk is managed through procurement policies in place for the Group. Treasury related credit risk is managed by ensuring all counterparties satisfy credit rating level requirements of a minimum investment grade of BBB+ or greater. As at 30 June 2009, all current counterparties have an investment grade that exceeds this requirement. Through spreading transactions across a range of such counterparties to limit the amount of credit exposure to any one financial institution, the Group thereby avoids any significant concentration of credit risk.
(c) Liquidity riskLiquidity risk is the risk that monies needed to fund the Group may not be available in sufficient quantities at some future date. Prudent liquidity risk management implies maintaining sufficient cash and marketable securities, the availability of funding through an adequate amount of committed credit facilities, and the ability to close-out market positions. Group Treasury manages liquidity risk by continuously monitoring forecast and actual cash flows, matching the maturity profiles of financial assets and liabilities, and maintaining appropriate committed funding lines in anticipation of future requirements. The Group has a policy that ensures any surplus cash is invested using approved investment instruments with approved financial institutions on maturities that ensure short term liquidity availability. Due to the dynamic nature of the underlying businesses, Group Treasury aims at maintaining flexibility in funding by keeping committed credit lines available and ensuring compliance with borrowing facility covenants and undertakings. This approach is supported through the maintenance of good banking relationships with the Group’s core banks.
For
per
sona
l use
onl
y

56 | Tatts Group Limited Annual Report 2009
Note 2 Financial risk management (continued)Maturity of financial assetsThe financial assets of the Group, with the exception of available-for-sale financial assets disclosed in Note 13, have maturity periods ranging from 2 to 120 days. Weekly agents and venue sweeps receivables are generally on a 2 to 7 day cash cycle.
Maturities of financial liabilitiesThe table below analyses the financial liabilities into relevant maturity groupings based on the remaining period at reporting date to the contractual maturity date. The amounts disclosed are undiscounted cash flows.
ConsolidatedLess than 6 months
6 to 12 months
1 to 2 years
2 to 5 years
More than 5 years
Total contractual cash flows
Carrying value
$’000 $’000 $’000 $’000 $’000 $’000 $’0002009
Trade and other payablesNon-interest
bearing 378,822 84,165 29,900 8,626 8,816 510,329 506,471Bank overdraft Floating 751 – – – – 751 751Bank loans Floating 14,497 16,594 39,770 936,959 – 1,007,820 906,529Lease liabilities Fixed 448 – – – – 448 448Financial liabilities 394,518 100,759 69,670 945,585 8,816 1,519,348 1,414,1992008
Trade and other payablesNon-interest
bearing 311,592 3,651 30,047 12,951 10,310 368,551 361,684Bank overdraft Floating 1,169 – – – – 1,169 1,169Bank loans Floating 13,035 260,704 56,064 726,644 – 1,056,447 877,713Lease liabilities Fixed 481 – 481 – – 962 902Financial liabilities 326,277 264,355 86,592 739,595 10,310 1,427,129 1,241,468
Parent entity Less than 6 months
6 to 12 months
1 to 2 years
2 to 5 years
Total contractual cash flows
Carrying value
$’000 $’000 $’000 $’000 $’000 $’0002009
Trade and other payablesNon-interest
bearing 12,189 – – – 12,189 12,189Bank loans Floating 12,447 12,857 33,539 773,252 832,095 748,776Financial liabilities 24,636 12,857 33,539 773,252 844,284 760,9652008
Trade and other payablesNon-interest
bearing 8,414 – – – 8,414 8,414Bank loans Floating 27,668 247,668 36,241 470,526 782,103 647,911Financial liabilities 36,082 247,668 36,241 470,526 790,517 656,325
Financing arrangementsUp to 5 June 2008, the Company together with Tattersall’s Holdings Pty Ltd, Tattersall’s Gaming Pty Ltd, Tattersall’s Sweeps Pty Ltd, Tattersall’s Club Keno Pty Ltd, Tattersall’s Australia Pty Ltd, George Adams Pty Ltd, Bytecraft Systems Pty Ltd, Bytecraft Systems NSW Pty Ltd, UNiTAB Limited, Broadcasting Station 4IP Pty Ltd, Maxgaming Holdings Pty Ltd, Maxgaming NSW Pty Ltd, Maxgaming QLD Pty Ltd, TAB Queensland Pty Ltd, NT TAB Pty Ltd, SA TAB Pty Ltd and Golden Casket Lottery Corporation Limited were a party to a multi-option facility agreement of $225,000,000 and a bridge facility agreement of $530,000,000. In addition, on 3 January 2008 these parties plus European Gaming Ltd (EGL) entered into a British pound denominated bridge facility of GBP 110,000,000 that refinanced the non-recourse debt of EGL in place prior to the full acquisition of the European Gaming Group by Tatts Group Limited.
On 5 June 2008, these facilities were fully repaid and replaced by a syndicated multi-currency revolving facility of the Company together with Tattersall’s Holdings Pty Ltd, Tattersall’s Gaming Pty Ltd, Tattersall’s Sweeps Pty Ltd, UNiTAB Limited, Maxgaming NSW Pty Ltd, Maxgaming QLD Pty Ltd, Golden Casket Lottery Corporation Limited, European Gaming Ltd and Talarius Limited of $1,100,000,000 that has maturities of 2 to 4 years (2008: 1 to 5 years). In December 2008 the 1 year facility in existence at 30 June 2008 was extended by a further 2 years.
Notes to the Financial Statements for the year ended 30 June 2009 (continued)
For
per
sona
l use
onl
y
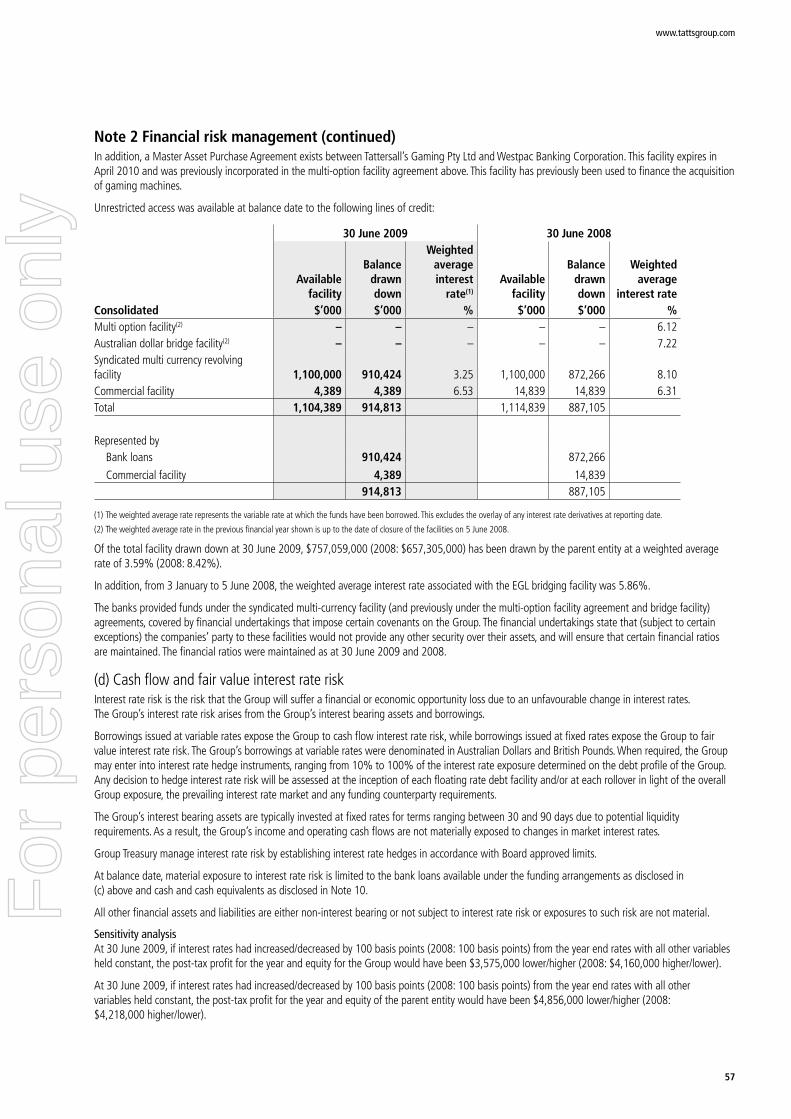
57
www.tattsgroup.com
Note 2 Financial risk management (continued)In addition, a Master Asset Purchase Agreement exists between Tattersall’s Gaming Pty Ltd and Westpac Banking Corporation. This facility expires in April 2010 and was previously incorporated in the multi-option facility agreement above. This facility has previously been used to finance the acquisition of gaming machines.
Unrestricted access was available at balance date to the following lines of credit:
30 June 2009 30 June 2008
Available facility
Balance drawn down
Weighted average interest
rate(1)
Available facility
Balance drawn down
Weighted average
interest rateConsolidated $’000 $’000 % $’000 $’000 %Multi option facility(2) – – – – – 6.12Australian dollar bridge facility(2) – – – – – 7.22Syndicated multi currency revolving facility 1,100,000 910,424 3.25 1,100,000 872,266 8.10Commercial facility 4,389 4,389 6.53 14,839 14,839 6.31Total 1,104,389 914,813 1,114,839 887,105
Represented by Bank loans 910,424 872,266
Commercial facility 4,389 14,839914,813 887,105
(1) The weighted average rate represents the variable rate at which the funds have been borrowed. This excludes the overlay of any interest rate derivatives at reporting date.
(2) The weighted average rate in the previous financial year shown is up to the date of closure of the facilities on 5 June 2008.
Of the total facility drawn down at 30 June 2009, $757,059,000 (2008: $657,305,000) has been drawn by the parent entity at a weighted average rate of 3.59% (2008: 8.42%).
In addition, from 3 January to 5 June 2008, the weighted average interest rate associated with the EGL bridging facility was 5.86%.
The banks provided funds under the syndicated multi-currency facility (and previously under the multi-option facility agreement and bridge facility) agreements, covered by financial undertakings that impose certain covenants on the Group. The financial undertakings state that (subject to certain exceptions) the companies’ party to these facilities would not provide any other security over their assets, and will ensure that certain financial ratios are maintained. The financial ratios were maintained as at 30 June 2009 and 2008.
(d) Cash flow and fair value interest rate riskInterest rate risk is the risk that the Group will suffer a financial or economic opportunity loss due to an unfavourable change in interest rates. The Group’s interest rate risk arises from the Group’s interest bearing assets and borrowings.
Borrowings issued at variable rates expose the Group to cash flow interest rate risk, while borrowings issued at fixed rates expose the Group to fair value interest rate risk. The Group’s borrowings at variable rates were denominated in Australian Dollars and British Pounds. When required, the Group may enter into interest rate hedge instruments, ranging from 10% to 100% of the interest rate exposure determined on the debt profile of the Group. Any decision to hedge interest rate risk will be assessed at the inception of each floating rate debt facility and/or at each rollover in light of the overall Group exposure, the prevailing interest rate market and any funding counterparty requirements.
The Group’s interest bearing assets are typically invested at fixed rates for terms ranging between 30 and 90 days due to potential liquidity requirements. As a result, the Group’s income and operating cash flows are not materially exposed to changes in market interest rates.
Group Treasury manage interest rate risk by establishing interest rate hedges in accordance with Board approved limits.
At balance date, material exposure to interest rate risk is limited to the bank loans available under the funding arrangements as disclosed in (c) above and cash and cash equivalents as disclosed in Note 10.
All other financial assets and liabilities are either non-interest bearing or not subject to interest rate risk or exposures to such risk are not material.
Sensitivity analysisAt 30 June 2009, if interest rates had increased/decreased by 100 basis points (2008: 100 basis points) from the year end rates with all other variables held constant, the post-tax profit for the year and equity for the Group would have been $3,575,000 lower/higher (2008: $4,160,000 higher/lower).
At 30 June 2009, if interest rates had increased/decreased by 100 basis points (2008: 100 basis points) from the year end rates with all other variables held constant, the post-tax profit for the year and equity of the parent entity would have been $4,856,000 lower/higher (2008: $4,218,000 higher/lower).
For
per
sona
l use
onl
y

58 | Tatts Group Limited Annual Report 2009
Note 2 Financial risk management (continued)(e) Fair value of financial assets and liabilitiesOther than those classes of financial assets and liabilities denoted as “listed” (refer Note 13), none of the classes of financial assets and liabilities are readily traded on organised markets in standardised form. The net fair value of financial assets and liabilities is exclusive of costs which would be incurred on realisation of an asset, and inclusive of costs which would be incurred on settlement of liability. The fair values of financial assets and liabilities of the Group and Company are approximately the same as the carrying amount shown in the balance sheet.
(i) On-balance sheetThe fair value of cash and cash equivalents, and non-interest bearing monetary financial assets and financial liabilities of the consolidated entity approximates their carrying amounts.
The fair value of other monetary financial assets and financial liabilities is based upon market prices where a market exists or by discounting the expected future cash flows by the current interest rates for assets and liabilities with similar risk profiles.
Equity investments traded in active markets have been valued by reference to market prices prevailing at balance sheet date. For non-traded equity investments, the fair value is an assessment by management based on the underlying net assets, future maintainable earnings and any special circumstances pertaining to a particular investment.
(ii) Off-balance sheetThe Company and certain controlled entities have potential financial liabilities which may arise from certain contingencies disclosed in Note 30. No material losses are anticipated in respect of any of those contingencies.
(iii) Derivative financial instrumentsFor forward foreign exchange contracts, the fair value is taken to be the unrealised gain or loss at balance sheet date calculated by reference to the current forward rates for contracts with similar maturity profiles.
(f) Capital risk managementThe Group’s policy is to maintain a capital structure for the business which ensures sufficient liquidity and support for business operations, maintains shareholder and market confidence, provides strong stakeholder returns, and positions the business for future growth.
The ongoing maintenance and pursuit of this policy is characterised by:
Maintaining a gearing ratio that ensures the investment grade positioning of the Group.•
A dividend policy aimed at dividend payout ratios of over 90% on a fully franked basis.•
Investment criteria that consider earnings accretion and risk adjusted rate of return requirements based on the Group’s weighted average •cost of capital.
Ongoing cash flow forecast analysis and detailed budgeting processes which, combined with continual development of banking relationships, •is directed at providing a sound financial positioning for the Group’s operations and financial management activities.
The gearing ratios that management monitor as key metrics for capital management are calculated as net debt divided by total capital (balance sheet gearing ratio), and net debt divided by EBITDA (earnings gearing ratio). Net debt is calculated as total borrowings (interest bearing liabilities as shown in the balance sheet, plus derivative financial liabilities and bank guarantees) less cash and cash equivalents (less prize reserves and other committed cash amounts). Total capital is calculated as ‘equity’ as shown in the balance sheet (including minority interest) plus net debt. EBITDA (adjusted) is the earnings before interest, tax, depreciation and amortisation as shown in the income statement, adjusted to reflect full year outcomes of continuing operations and with the addition of interest income. Two measures are used for gearing to provide both a balance sheet and earnings/cash flow perspective of the gearing of the business.
Consolidated2009 $’000
2008 $’000
EBITDA (adjusted) 571,285 528,575
Interest bearing liabilities 927,202 890,986Less: cash and cash equivalents (excluding prize reserves, etc) (239,790) (153,362)Net debt 687,412 737,624Equity 2,595,426 2,577,859Total Capital 3,282,838 3,315,483
Balance sheet gearing ratio 20.94% 22.25%Earnings gearing ratio 1.20:1 1.40:1
Notes to the Financial Statements for the year ended 30 June 2009 (continued)
For
per
sona
l use
onl
y
59
www.tattsgroup.com
Note 2 Financial risk management (continued)The Board and management continually assess the relative merits of the potential for higher returns from increased gearing and the advantages that flow to markets and operational stability and strategic flexibility from a strong capital base.
There were no changes in the Group’s approach to capital management during the year.
Neither the Company nor any of its subsidiaries are subject to externally imposed capital requirements, other than normal banking requirements.
Note 3 Critical accounting estimates and judgementsEstimates and judgements are continually evaluated and are based on historical experience and other factors, including expectations of future events that may have a financial impact on the entity and that are believed to be reasonable under the circumstances.
Critical accounting estimates and assumptionsThe Group makes estimates and assumptions concerning the future. The resulting accounting estimates will, by definition, seldom equal the related actual results. The estimates and assumptions that have a significant risk of causing a material adjustment to the carrying amounts of assets and liabilities within the next financial year are discussed below.
(a) Estimated impairment of goodwill, licences and brandsThe Group tests six monthly whether goodwill, licences and brands have suffered any impairment, in accordance with the accounting policy stated in Note 1(s). The recoverable amounts of cash generating units have been determined based on value-in-use calculations. These calculations require the use of assumptions. Refer to Note 17 for details of these assumptions.
(b) Non-amortisation of brand and licence in parent entityIn the prior year the Company had intangible assets comprising the Tattersall’s brand and the Victorian gaming licence. The brand and licence were carried at cost and were not amortised by the Company (refer Note 1(s)). The carrying amounts were reviewed annually for impairment in accordance with Note 1(j). The brand and licence were fully impaired in the previous financial year (refer Note 17).
(c) Depreciation of Victorian Lotteries and Tatts Pokies fixed assetsDuring the previous financial year the Group reassessed the useful lives of assets in relation to the Victorian lotteries licence. Following the awarding of a 10 year licence effective from 1 July 2008, the useful lives of the assets were extended. Previously the assets were depreciated to the term of the previous licence which expired on 30 June 2008.
The estimated useful lives of the existing Tatts Pokies assets were extended following the Victorian Government’s announcement on 10 April 2008 on the gambling licence arrangements that will apply after the end of the current licence in 2012.
The impact of both of these on the financial statements in the previous financial year was a reduction in the depreciation charge of $17,000,000.
(d) Income taxesThe Group is subject to income taxes in Australia and jurisdictions where it has foreign operations. Significant judgement is required in determining the provision for income taxes. There are many transactions and calculations for which the ultimate tax determination is uncertain during the ordinary course of business. Where the final tax outcome of these matters is different from the amounts that were initially recorded, such difference will impact the current and deferred tax provision in the period in which such determination is made.
For
per
sona
l use
onl
y

60 | Tatts Group Limited Annual Report 2009
Note 4 Segment informationBusiness segmentsThe Group is organised on a global basis into the following divisions by product and service type.
Tatts PokiesThe operation of gaming machines and Club Keno in Victoria.
Tatts LotteriesThe operation of lottery licences within Victoria, Tasmania, ACT, and the Northern Territory and the operation of a Lottery Operator Agreement in Queensland.
UNiTAB WageringTotalisator and fixed odds betting on thoroughbred, harness, greyhounds and other sporting events pursuant to licences in Queensland, South Australia and the Northern Territory.
MaxgamingGaming machine monitoring and value added services in Queensland, New South Wales and the Northern Territory.
Bytecraft SystemsWarehousing, installation, relocation, repair and maintenance of gaming machines, lottery and wagering terminals and other transaction devices in Australia.
International/Business DevelopmentGaming operations in South Africa, and in the United Kingdom from 3 January 2008 (previously included as a joint venture from 1 February 2007 to 2 January 2008).
OtherThis segment includes Shared Services, investment property and donations made by Tattersall’s Foundation Limited. None of these activities constitutes a separately reportable business segment.
Geographical segmentsAlthough the consolidated entity’s divisions are managed on a global basis they operate in three main geographical areas: Australia, South Africa and the United Kingdom. The results of operations and net assets of South Africa and the United Kingdom as discussed above are included within the International Business segment. Separate geographic segments are not disclosed as they represent less than 10% of revenue, profits and assets.
(a) Accounting policiesSegment information is prepared in conformity with the accounting policies of the Group disclosed in Note 1(d) and accounting standard AASB 114 Segment Reporting.
Segment revenues, expenses, assets and liabilities are those that are directly attributable to a segment and the relevant portion that can be allocated to the segment on a reasonable basis. Segment assets include all assets used by a segment and consist primarily of operating cash, receivables, inventories, property, plant and equipment and goodwill and other intangible assets, net of related provisions. While most of these assets can be directly attributable to individual segments, the carrying amounts of certain assets used jointly by segments are allocated based on reasonable estimates of usage. Segment liabilities consist primarily of trade and other creditors and employee entitlements. Segment assets and liabilities do not include income taxes.
(b) Inter-segment transfersSegment revenues, expenses and results include transfers between segments. Such transfers are priced on an “arm’s-length” basis and are eliminated on consolidation.
Notes to the Financial Statements for the year ended 30 June 2009 (continued)
For
per
sona
l use
onl
y
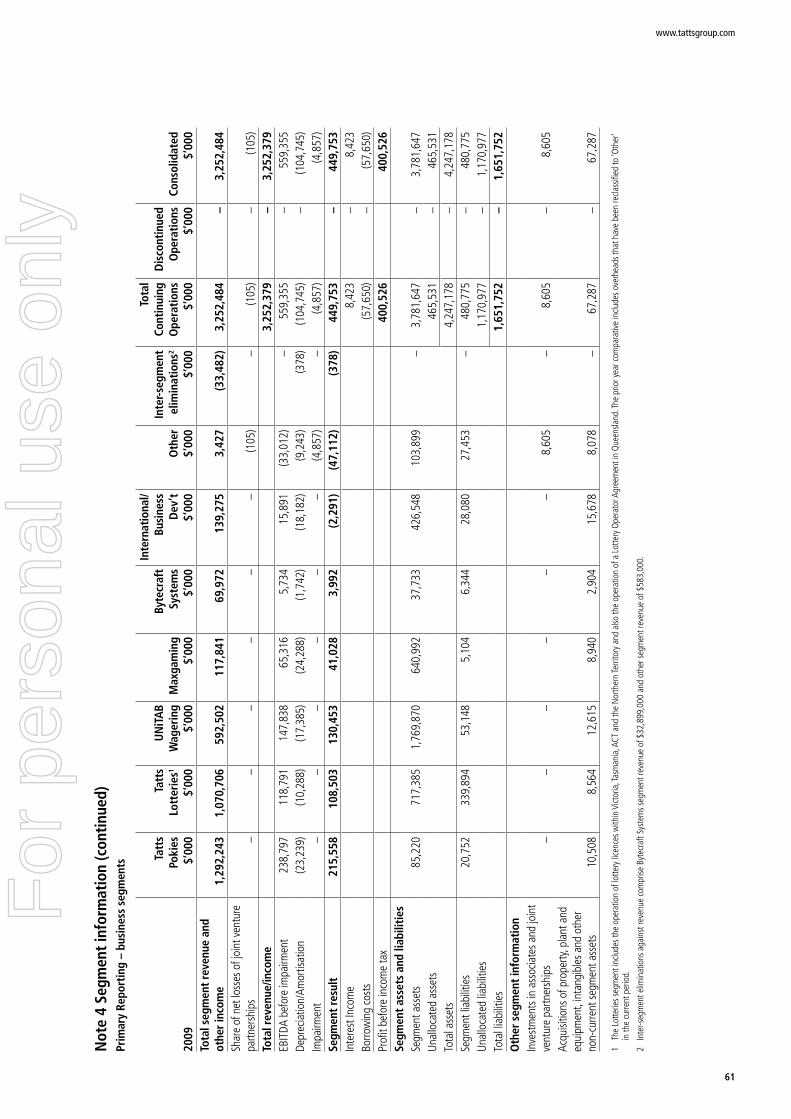
61
www.tattsgroup.com
Not
e 4
Segm
ent i
nfor
mat
ion
(con
tinue
d)Pr
imar
y Re
port
ing
– bu
sine
ss s
egm
ents
2009
Tatt
s Po
kies
$’
000
Tatt
s Lo
tter
ies1
$’00
0
UN
iTA
B W
ager
ing
$’00
0M
axga
min
g $’
000
Byte
craf
t Sy
stem
s $’
000
Inte
rnat
iona
l/ Bu
sine
ss
Dev
’t
$’00
0O
ther
$’
000
Inte
r-seg
men
t el
imin
atio
ns2
$’00
0
Tota
l Co
ntin
uing
O
pera
tions
$’
000
Dis
cont
inue
d O
pera
tions
$’
000
Cons
olid
ated
$’
000
Tota
l seg
men
t rev
enue
and
ot
her i
ncom
e1,
292,
243
1,07
0,70
659
2,50
211
7,84
169
,972
139,
275
3,42
7(3
3,48
2)3,
252,
484
–3,
252,
484
Shar
e of
net
loss
es o
f joi
nt v
entu
re
partn
ersh
ips
––
––
––
(105
)–
(105
)–
(105
)To
tal r
even
ue/in
com
e3,
252,
379
–3,
252,
379
EBIT
DA b
efor
e im
pairm
ent
238,
797
118,
791
147,
838
65,3
165,
734
15,8
91(3
3,01
2)–
559,
355
–55
9,35
5De
prec
iatio
n/Am
ortis
atio
n(2
3,23
9)(1
0,28
8)(1
7,38
5)(2
4,28
8)(1
,742
)(1
8,18
2)(9
,243
)(3
78)
(104
,745
)–
(104
,745
)Im
pairm
ent
––
––
––
(4,8
57)
–(4
,857
)(4
,857
)Se
gmen
t res
ult
215,
558
108,
503
130,
453
41,0
283,
992
(2,2
91)
(47,
112)
(378
)44
9,75
3–
449,
753
Inte
rest
Inco
me
8,42
3–
8,42
3Bo
rrow
ing
cost
s (5
7,65
0)–
(57,
650)
Profi
t bef
ore
inco
me
tax
400,
526
400,
526
Segm
ent a
sset
s an
d lia
bilit
ies
Segm
ent a
sset
s85
,220
717,
385
1,76
9,87
064
0,99
237
,733
426,
548
103,
899
–3,
781,
647
–3,
781,
647
Unal
loca
ted
asse
ts46
5,53
1–
465,
531
Tota
l ass
ets
4,24
7,17
8–
4,24
7,17
8Se
gmen
t lia
bilit
ies
20,7
5233
9,89
453
,148
5,10
46,
344
28,0
8027
,453
–48
0,77
5–
480,
775
Unal
loca
ted
liabi
litie
s1,
170,
977
–1,
170,
977
Tota
l lia
bilit
ies
1,65
1,75
2–
1,65
1,75
2O
ther
seg
men
t inf
orm
atio
nIn
vest
men
ts in
ass
ocia
tes a
nd jo
int
vent
ure
partn
ersh
ips
––
––
––
8,60
5–
8,60
5–
8,60
5Ac
quisi
tions
of p
rope
rty, p
lant
and
eq
uipm
ent,
inta
ngib
les a
nd o
ther
no
n-cu
rrent
segm
ent a
sset
s10
,508
8,56
412
,615
8,94
02,
904
15,6
788,
078
–67
,287
–67
,287
1 T
he L
otte
ries s
egm
ent i
nclu
des t
he o
pera
tion
of lo
ttery
lice
nces
with
in V
ictor
ia, T
asm
ania
, ACT
and
the
Nor
ther
n Te
rrito
ry a
nd a
lso th
e op
erat
ion
of a
Lot
tery
Ope
rato
r Agr
eem
ent i
n Q
ueen
sland
. The
prio
r yea
r com
para
tive
inclu
des o
verh
eads
that
hav
e be
en re
class
ified
to ‘O
ther
’ in
the
curre
nt p
erio
d.
2 I
nter
-seg
men
t elim
inat
ions
aga
inst
reve
nue
com
prise
Byt
ecra
ft Sy
stem
s seg
men
t rev
enue
of $
32,8
99,0
00 a
nd o
ther
segm
ent r
even
ue o
f $58
3,00
0.
For
per
sona
l use
onl
y

62 | Tatts Group Limited Annual Report 2009
Not
e 4
Segm
ent i
nfor
mat
ion
(con
tinue
d)Pr
imar
y Re
port
ing
– bu
sine
ss s
egm
ents
2008
Tatt
s Po
kies
$’
000
Tatt
s Lo
tter
ies
$’00
0
UN
iTA
B W
ager
ing
$’00
0M
axga
min
g $’
000
Byte
craf
t Sy
stem
s $’
000
Inte
rnat
iona
l/Bu
sine
ss
Dev
’t
$’00
0O
ther
$’
000
Inte
r-seg
men
t el
imin
atio
ns1
$’00
0
Tota
l Co
ntin
uing
O
pera
tions
$’
000
Dis
cont
inue
d O
pera
tions
2 $’
000
Cons
olid
ated
$’
000
Tota
l seg
men
t rev
enue
and
ot
her i
ncom
e1,
268,
867
1,04
6,47
154
1,23
511
3,37
674
,331
81,2
797,
152
(38,
547)
3,09
4,16
46,
383
3,10
0,54
7Sh
are
of n
et lo
sses
of a
ssoc
iate
s an
d jo
int v
entu
re p
artn
ersh
ips
––
––
–(4
,133
)–
–(4
,133
)–
(4,1
33)
Tota
l rev
enue
/inco
me
3,09
0,03
16,
383
3,09
6,41
4EB
ITDA
226,
080
105,
414
130,
731
64,2
588,
151
6,31
2(2
9,25
9)–
511,
687
1,87
751
3,56
4De
prec
iatio
n/Am
ortis
atio
n(3
0,92
0)(1
1,72
8)(1
6,92
8)(2
4,24
3)(1
,752
)(7
,901
)(4
,730
)(5
37)
(98,
739)
(140
)(9
8,87
9)Se
gmen
t res
ult
195,
160
93,6
8611
3,80
340
,015
6,39
9(1
,589
)(3
3,98
9)(5
37)
412,
948
1,73
741
4,68
5In
tere
st In
com
e9,
587
–9,
587
Borro
win
g co
sts
(53,
625)
–(5
3,62
5)Pr
ofit b
efor
e in
com
e ta
x36
8,91
01,
737
370,
647
Segm
ent a
sset
s an
d lia
bilit
ies
Segm
ent a
sset
s10
9,91
960
0,91
61,
778,
023
656,
426
40,7
3639
5,63
488
,433
–3,
670,
087
–3,
670,
087
Unal
loca
ted
asse
ts36
5,52
4–
365,
524
Tota
l ass
ets
4,03
5,61
1–
4,03
5,61
1Se
gmen
t lia
bilit
ies
32,7
9521
8,05
444
,548
5,33
76,
658
23,3
2320
,264
–35
0,97
9–
350,
979
Unal
loca
ted
liabi
litie
s1,
106,
773
–1,
106,
773
Tota
l lia
bilit
ies
1,45
7,75
2–
1,45
7,75
2O
ther
seg
men
t inf
orm
atio
nIn
vest
men
ts in
ass
ocia
tes a
nd jo
int
vent
ure
partn
ersh
ips
––
––
––
7,91
7–
7,91
7–
7,91
7Ac
quisi
tions
of p
rope
rty, p
lant
and
eq
uipm
ent,
inta
ngib
les a
nd o
ther
no
n-cu
rrent
segm
ent a
sset
s36
,858
29,2
4511
,623
9,77
51,
370
21,2
785,
314
–11
5,46
3–
115,
463
1 In
ter-s
egm
ent e
limin
atio
ns a
gain
st re
venu
e co
mpr
ise B
ytec
raft
Syst
ems s
egm
ent r
even
ue o
f $37
,873
,000
and
oth
er se
gmen
t rev
enue
of $
674,
000
2 Di
scon
tinue
d op
erat
ions
rela
te to
Bou
nty
Limite
d fo
r the
six
mon
th p
erio
d to
31
Dece
mbe
r 200
7 (re
fer N
ote
9)
Notes to the Financial Statements for the year ended 30 June 2009 (continued)
For
per
sona
l use
onl
y

63
www.tattsgroup.com
Note 5 Revenue
Consolidated Parent entity2009 $’000
2008 $’000
2009 $’000
2008 $’000
(a) From continuing operations Sales RevenueEntertainment products and services 3,132,444 2,978,327 – –Rendering of services 105,501 93,244 – –
3,237,945 3,071,571 – –Other RevenueRents and sub-lease rentals 2,964 1,857 216 216Licence and management fees – – 200 109,903Interest on unpaid prizes and prize reserves 5,460 8,532 – –Dividends and distributions 1,746 1,266 420,751 25,000Other revenue 2,685 2,339 20 –
3,250,800 3,085,565 421,187 135,119
(b) From discontinued operations (Note 9)Rendering of services – 6,383 – –
Note 6 Other incomeConsolidated Parent entity2009 $’000
2008 $’000
2009 $’000
2008 $’000
Net gain on disposal of property, plant and equipment – 3,549 – 88Gain on disposal of shares in other related parties 436 – – –Gain on foreign currency derivatives qualifying as hedges – – 4,994 19,216Loss on foreign currency derivatives qualifying as hedges – – (4,994) (19,216)Net foreign exchange gains 1,248 – – –Other – 5,050 – –
1,684 8,599 – 88
For
per
sona
l use
onl
y

64 | Tatts Group Limited Annual Report 2009
Note 7 ExpensesConsolidated Parent entity2009 $’000
2008 $’000
2009 $’000
2008 $’000
(a) Net gains and expensesProfit from ordinary activities before income tax expense includes the following specific net gains and expenses:ExpensesDepreciation Buildings 4,576 1,514 39 92 Plant and equipment 61,468 69,605 4 4 Leasehold improvements 3,624 1,405 – – Freehold improvements 1,816 1,660 3 4 Investment properties 277 166 – –Total depreciation 71,761 74,350 46 100Amortisation Deferred expenditure 666 286 – – Licences 7,911 5,599 – – Brand 225 125 – – Computer Software 21,151 15,333 – – Other 3,031 3,046 – –Total amortisation 32,984 24,389 – –Finance costs Interest and finance charges paid/payable 60,016 53,265 48,607 9,333 Gain on realisation of interest rate swap (2,366) – – –Finance costs expensed 57,650 53,625 48,607 9,333Other items: Minimum lease payments expense relating to operating leases 22,829 27,515 3 – Net foreign exchange losses – 1,127 40 4 Net loss on disposal of property, plant and equipment 993 – – – Defined contribution superannuation expense 8,944 7,276 – 263
(b) Significant revenue and expensesThe following material expense items are relevant in explaining the financial performance:Restructuring costs 2,472 4,237 359 –Impairment losses on assets Available-for-sale financial assets 4,857 – – – Licences – – – 373,024 Brand – – – 402,886Total impairment losses on assets 4,857 – – 775,910
Notes to the Financial Statements for the year ended 30 June 2009 (continued)
For
per
sona
l use
onl
y

65
www.tattsgroup.com
Note 8 Income tax expense
Consolidated Parent entity
2009 $’000
2008 $’000
2009 $’000
2008 $’000
(a) Income tax expense/(benefit)Current tax 121,158 104,856 (10,684) 25,705Deferred tax 2,857 8,792 3,400 3,805(Over)/under provision in prior years (1,537) (1,038) 645 (921)
122,478 112,610 (6,639) 28,589Income tax expense/(benefit) is attributable to: Profit/(loss) from continuing operations 122,478 112,070 (6,639) 28,589 Profit from discontinued operations (Note 9) – 540 – –Aggregate income tax expense/(benefit) 122,478 112,610 (6,639) 28,589Deferred income tax expense included in income tax expense/(benefit) comprises: (Increase)/decrease in deferred tax assets (Note 18) (2,785) (466) 2,627 3,044 Increase in deferred tax liabilities (Note 23) 5,642 9,258 773 761
2,857 8,792 3,400 3,805
(b) Numerical reconciliation of income tax expense/(benefit) to prima facie tax payableProfit/(loss) from continuing operations before income tax expense 400,526 368,910 394,602 (652,550)Profit from discontinuing operations before income tax expense – 1,737 – –
400,526 370,647 394,602 (652,550)Tax at the Australian tax rate of 30% (2008 – 30%) 120,158 111,194 118,381 (195,765)Tax effect of amounts which are not deductible (taxable) in calculating taxable income: Depreciation and amortisation 953 203 – 2 Non-assessable income (166) (4) – – Non deductible items – impairment of intangible assets – – – 232,773 Non deductible items 736 708 561 1
Non taxable dividends (50) – (126,225) (7,500) Share of net loss of associate – 1,240 – – Unrecognised tax losses 1,910 – – – Sundry items 1 287 (1) (1)
123,542 113,628 (7,284) 29,510Difference in overseas tax rates 473 20 – –(Over)/under provision in prior years (1,537) (1,038) 645 (921)Income tax expense/(benefit) 122,478 112,610 (6,639) 28,589
(c) Amounts recognised directly in equityAggregate current and deferred tax arising during the year and not recognised in net profit or loss but directly debited or credited to equity Net deferred tax – (credited)/debited directly to equity (Note 18 and Note 23) (1,264) 1,048 – –
(1,264) 1,048 – –
(d) Tax lossesUnused tax losses for which no deferred tax asset has been recognised 40,318 28,443 – – Potential tax benefit @ 28% 11,289 7,964 – –
All unused tax losses were incurred by overseas entities that are not part of the tax consolidated group.
For
per
sona
l use
onl
y

66 | Tatts Group Limited Annual Report 2009
Note 8 Income tax expense (continued)Consolidated Parent entity2009 $’000
2008 $’000
2009 $’000
2008 $’000
(e) Unrecognised timing differencesTemporary differences relating to investments in foreign subsidiaries for which deferred tax liabilities have not been recognised – undistributed retained earnings 13,708 14,087 – –
13,708 14,087 – –
Tattersall’s Investments (South Africa) (Pty) Limited has undistributed earnings of $13,708,000 (2008: $14,087,000) which if it paid out as dividends, would be subject to tax in the hands of the recipient. An assessable temporary difference exists, however no deferred tax liability has been recognised as the parent entity is able to control the timing of the distributions from the subsidiary and is not expected to distribute profits in the foreseeable future.
Carentan Investments (Pty) Limited has losses at present. Although it expects to make profits in the future, it has not recognised a deferred tax asset on the basis that these profits are not sufficiently probable.
Tax consolidation legislationTatts Group Limited and its wholly owned Australian controlled subsidiaries have adopted the tax consolidation legislation. The accounting policy in relation to this legislation is set out in Note 1(g).
On adoption of the tax consolidation legislation, the entities in the tax consolidated group entered into a tax sharing agreement which, in the opinion of the Directors, limits the joint and several liability of the wholly owned subsidiaries in the case of a default by the head entity, Tatts Group Limited.
The entities have also entered into a tax funding agreement under which the wholly owned Australian subsidiaries fully compensate Tatts Group Limited for any current tax payable assumed and are compensated by Tatts Group Limited for any current tax receivable and deferred tax assets relating to unused losses or unused tax credits that are transferred to Tatts Group Limited under the tax consolidation legislation. The funding amounts are determined by reference to the amounts recognised in the wholly owned Australian subsidiaries financial statements.
The amounts receivable/payable under the tax funding agreement are due upon receipt of the funding advice from the head entity, which is issued as soon as practicable after the end of each financial year. The funding amounts are recognised as current intercompany receivables or payables.
Notes to the Financial Statements for the year ended 30 June 2009 (continued)
For
per
sona
l use
onl
y

67
www.tattsgroup.com
Note 9 Discontinued operations
(a) DescriptionOn 8 January 2008, Golden Casket Lottery Corporation Limited, a controlled entity, sold its shareholding in Bounty Limited (a wholly owned subsidiary) and its controlled entities.
(b) Financial performance and cash flow informationThe financial performance and cash flow information presented are for the period from 1 July 2007 to 8 January 2008 for Bounty Limited and its controlled entities in the previous financial year.
Consolidated Parent entity2009 $’000
2008 $’000
2009 $’000
2008 $’000
Revenue (Note 5) – 6,383 – –Expenses – (4,646) – –Profit before income tax – 1,737 – –Income tax expense (Note 8(a)) – (540) – –Profit from discontinued operations – 1,197 – –Gain on the sale before income tax – – – –Income tax expense – – – –Gain on the sale after income tax – – – –Profit from discontinued operations – 1,197 – –
Net cash inflow from operating activities – 2,817 – –Net cash outflow from investing activities – (16) – –Net cash outflow from financing activities – – – –Net increase/(decrease) in cash generated by the division – 2,801 – –
(c) Details of the sale of controlled entitiesConsolidated Parent entity2009 $’000
2008 $’000
2009 $’000
2008 $’000
Consideration receivedCash – 3,250 – –Total disposal consideration – 3,250 – –Carrying amounts of net assets sold – (1,867) – –Transaction costs – (143) – –Goodwill – (1,240) – –Gain/(loss) on sale before income tax – – – –Income tax expense – – – –Gain/(loss) on sale after income tax – – – –
For
per
sona
l use
onl
y

68 | Tatts Group Limited Annual Report 2009
Note 10 Cash and cash equivalentsConsolidated Parent entity2009 $’000
2008 $’000
2009 $’000
2008 $’000
Cash at bank and in hand 63,951 69,056 261 3,633Deposits at call 88,898 58,814 9,267 22,048Fixed interest securities 220,912 124,069 54,839 19,678
373,761 251,939 64,367 45,359Reconciliation to cash at the end of the yearThe above figures are reconciled to cash at the end of the financial year as shown in the statements of cash flows as follows:Balances as above 373,761 251,939 64,367 45,359Bank overdrafts (Note 21) (751) (1,169) – –Balances per cash flow statement 373,010 250,770 64,367 45,359
Interest rate risk exposure
(i) Cash at bank and in handCash at bank is bearing floating interest rates between zero and 7.30% (2008: zero and 7.60%).
(ii) Deposits at callThe deposits are bearing floating interest rates between 2.95% and 7.20% (2008: 6.20% and 10.95%) and have a maturity of between 7 and 14 days.
(iii) Fixed interest securitiesFixed interest securities are bearing fixed interest rates with a weighted average of 4.17% (2008: 7.06%) and have maturities between one and three months.
Note 11 Trade and other receivablesConsolidated Parent entity2009 $’000
2008 $’000
2009 $’000
2008 $’000
CurrentTrade receivables Weekly sweeps (1) 109,725 26,936 – – Trade debtors 13,148 12,233 – –Less: Provision for impairment (451) (366) – –
122,422 38,803 – –Other receivables 22,393 17,854 18 44Amounts receivable from: Wholly owned subsidiaries (Note 32(e)) – – 752,327 604,817 Joint venture entities (Note 32(e)) 7,475 2,875 – –
7,475 2,875 752,327 604,817Prepayments 5,848 8,837 306 –
158,138 68,369 752,651 604,861Non-currentPrepayments 89 38 – –
(1) Balances with venues, agencies and outlets are swept on recurring cycles of between 2 and 7 days.
Impaired trade and other receivablesThe Group has recognised losses of $440,000 (2008: loss of $392,000) in respect of bad and doubtful trade receivables during the year ended 30 June 2009.
At 30 June 2009, there were no material receivables either past due which have not been impaired or individual balances specifically impaired. Collateral is not normally obtained for balances owing.
Notes to the Financial Statements for the year ended 30 June 2009 (continued)
For
per
sona
l use
onl
y

69
www.tattsgroup.com
Note 11 Trade and other receivables (continued)Other receivablesThese amounts generally arise from transactions outside the usual operating activities of the consolidated entity. Where interest is charged, this is on commercial terms. Collateral is not normally obtained.
Foreign exchange and interest rate riskInformation concerning exposure to foreign currency and interest rate risk in relation to trade and other receivables is set out in Note 2.
Fair value and credit riskDue to the short term nature of trade and other receivables, their carrying amount is assumed to approximate their fair value. Information concerning the credit risk of receivables is set out in Note 2.
Note 12 Inventories
Consolidated Parent entity2009 $’000
2008 $’000
2009 $’000
2008 $’000
Spare parts – at cost 12,035 10,474 – –Less: accumulated depreciation of spare parts inventory (6,219) (3,729) – –
5,816 6,745 – –Finished goods – at cost 1,185 1,231 – –Total inventory 7,001 7,976 – –
Depreciation represents the write down of spare parts inventory. The write down for the year ended 30 June 2009 is $2,632,000 (2008: $1,925,000) and has been included in operating fees and direct costs in the income statement.
Note 13 Available-for-sale financial assetsConsolidated Parent entity2009 $’000
2008 $’000
2009 $’000
2008 $’000
Available-for-sale financial assets comprise:Listed securities Equity securities – at fair value 5,355 5,644 – –Unlisted investments Managed fund investment – at fair value 23,886 22,800 – –Total available-for-sale financial assets 29,241 28,444 – –
Impairment and price risk exposureInformation concerning exposure to price and credit risk is set out in Note 2.
The Group has recognised an impairment loss of $4,857,000 (2008: nil) on its available-for-sale financial assets during the year ended 30 June 2009.
Note 14 Derivative financial instrumentsConsolidated Parent entity2009 $’000
2008 $’000
2009 $’000
2008 $’000
Non-current assets Cash flow hedge - Interest rate swap contracts – 2,066 – –Current liabilities Cash flow hedges - Forward foreign exchange contracts 594 – 594 –Non-current liabilities Cash flow hedge - Interest rate swap contracts 8,733 – 8,733 –F
or p
erso
nal u
se o
nly
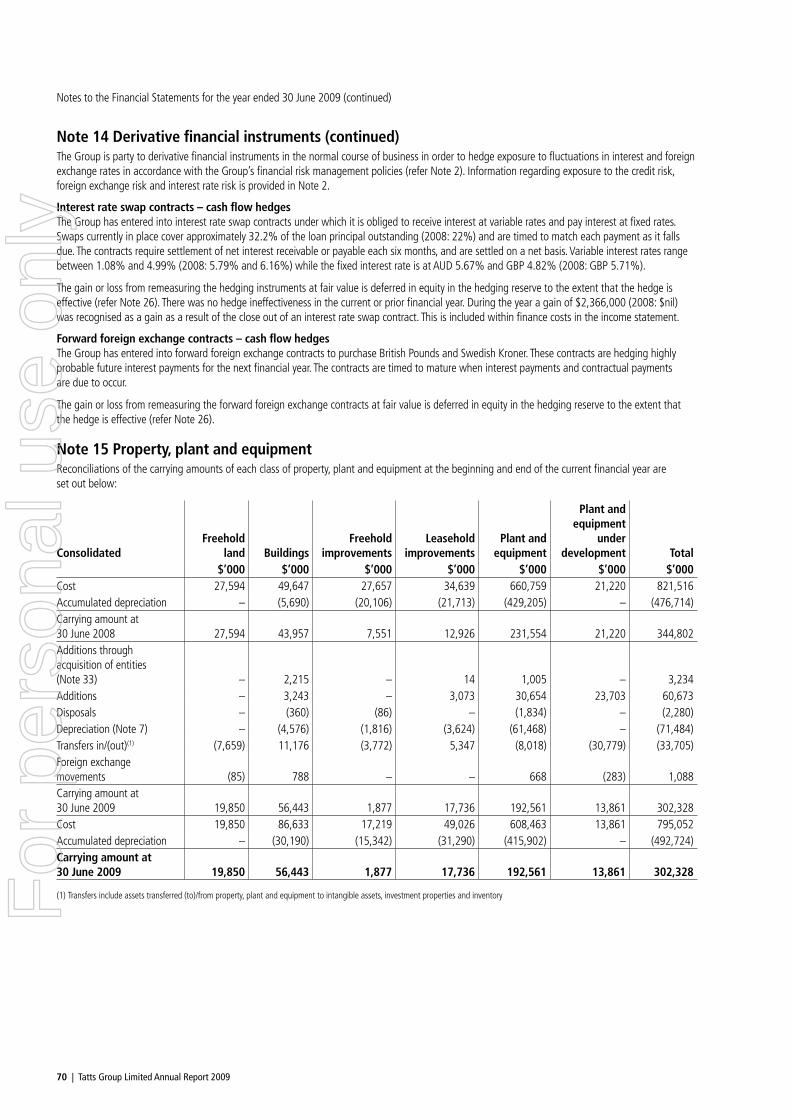
70 | Tatts Group Limited Annual Report 2009
Note 14 Derivative financial instruments (continued)The Group is party to derivative financial instruments in the normal course of business in order to hedge exposure to fluctuations in interest and foreign exchange rates in accordance with the Group’s financial risk management policies (refer Note 2). Information regarding exposure to the credit risk, foreign exchange risk and interest rate risk is provided in Note 2.
Interest rate swap contracts – cash flow hedgesThe Group has entered into interest rate swap contracts under which it is obliged to receive interest at variable rates and pay interest at fixed rates. Swaps currently in place cover approximately 32.2% of the loan principal outstanding (2008: 22%) and are timed to match each payment as it falls due. The contracts require settlement of net interest receivable or payable each six months, and are settled on a net basis. Variable interest rates range between 1.08% and 4.99% (2008: 5.79% and 6.16%) while the fixed interest rate is at AUD 5.67% and GBP 4.82% (2008: GBP 5.71%).
The gain or loss from remeasuring the hedging instruments at fair value is deferred in equity in the hedging reserve to the extent that the hedge is effective (refer Note 26). There was no hedge ineffectiveness in the current or prior financial year. During the year a gain of $2,366,000 (2008: $nil) was recognised as a gain as a result of the close out of an interest rate swap contract. This is included within finance costs in the income statement.
Forward foreign exchange contracts – cash flow hedgesThe Group has entered into forward foreign exchange contracts to purchase British Pounds and Swedish Kroner. These contracts are hedging highly probable future interest payments for the next financial year. The contracts are timed to mature when interest payments and contractual payments are due to occur.
The gain or loss from remeasuring the forward foreign exchange contracts at fair value is deferred in equity in the hedging reserve to the extent that the hedge is effective (refer Note 26).
Note 15 Property, plant and equipment Reconciliations of the carrying amounts of each class of property, plant and equipment at the beginning and end of the current financial year are set out below:
ConsolidatedFreehold
land BuildingsFreehold
improvementsLeasehold
improvementsPlant and
equipment
Plant and equipment
under development Total
$’000 $’000 $’000 $’000 $’000 $’000 $’000Cost 27,594 49,647 27,657 34,639 660,759 21,220 821,516Accumulated depreciation – (5,690) (20,106) (21,713) (429,205) – (476,714)Carrying amount at 30 June 2008 27,594 43,957 7,551 12,926 231,554 21,220 344,802Additions through acquisition of entities (Note 33) – 2,215 – 14 1,005 – 3,234Additions – 3,243 – 3,073 30,654 23,703 60,673Disposals – (360) (86) – (1,834) – (2,280)Depreciation (Note 7) – (4,576) (1,816) (3,624) (61,468) – (71,484)Transfers in/(out)(1) (7,659) 11,176 (3,772) 5,347 (8,018) (30,779) (33,705)Foreign exchange movements (85) 788 – – 668 (283) 1,088Carrying amount at 30 June 2009 19,850 56,443 1,877 17,736 192,561 13,861 302,328Cost 19,850 86,633 17,219 49,026 608,463 13,861 795,052Accumulated depreciation – (30,190) (15,342) (31,290) (415,902) – (492,724)Carrying amount at 30 June 2009 19,850 56,443 1,877 17,736 192,561 13,861 302,328
(1) Transfers include assets transferred (to)/from property, plant and equipment to intangible assets, investment properties and inventory
Notes to the Financial Statements for the year ended 30 June 2009 (continued)
For
per
sona
l use
onl
y

71
www.tattsgroup.com
Note 15 Property, plant and equipment (continued)
ConsolidatedFreehold
land BuildingsFreehold
improvementsLeasehold
improvementsPlant and
equipment
Plant and equipment
under development Total
$’000 $’000 $’000 $’000 $’000 $’000 $’000Cost 17,847 40,084 4,096 13,548 443,410 16,126 535,111Accumulated depreciation – (1,378) (610) (2,986) (240,190) – (245,164)Carrying amount at 1 July 2007 17,847 38,706 3,486 10,562 203,220 16,126 289,947Fair value adjustments on acquisition of a subsidiary 1,808 6,477 – – – – 8,285Additions through acquisition of entities 12,539 – – 7,645 25,195 – 45,379Additions 69 – 692 402 66,925 17,199 85,287Assets included in disposal of discontinued operations – – – – (194) (8) (202)Disposals (3,644) – (152) (40) (1,765) – (5,601)Depreciation (Note 7) – (1,514) (1,660) (1,405) (69,605) – (74,184)Depreciation charge for assets used in year by discontinued operations – – – – (18) – (18)Transfers in/(out) – 288 5,185 (3,574) 10,198 (12,097) –Foreign exchange movements (1,025) – – (664) (2,402) – (4,091)Carrying amount at 30 June 2008 27,594 43,957 7,551 12,926 231,554 21,220 344,802Cost 27,594 49,647 27,657 34,639 660,759 21,220 821,516Accumulated depreciation – (5,690) (20,106) (21,713) (429,205) – (476,714)Carrying amount at 30 June 2008 27,594 43,957 7,551 12,926 231,554 21,220 344,802
Parent entity Freehold land BuildingsFreehold
improvementsPlant and
equipment Total$’000 $’000 $’000 $’000 $’000
Cost 4,758 3,271 134 29 8,192Accumulated depreciation – (272) (1) (8) (281)Carrying amount at 1 July 2007 4,758 2,999 133 21 7,911Depreciation expense (Note 7) – (92) (4) (4) (100)Carrying amount at 30 June 2008 4,758 2,907 129 17 7,811Cost 4,758 3,271 134 29 8,192Accumulated depreciation – (364) (5) (12) (381)Carrying amount at 30 June 2008 4,758 2,907 129 17 7,811Depreciation expense (Note 7) – (39) (3) (4) (46)Carrying amount at 30 June 2009 4,758 2,868 126 13 7,765Cost 4,758 3,271 134 29 8,192Accumulated depreciation – (403) (8) (16) (427)Carrying amount at 30 June 2009 4,758 2,868 126 13 7,765
Valuations of land and buildings
The basis of valuation of land and buildings is at cost less subsequent depreciation for buildings. For
per
sona
l use
onl
y

72 | Tatts Group Limited Annual Report 2009
Note 16 Investment propertiesConsolidated Parent entity2009 $’000
2008 $’000
2009 $’000
2008 $’000
At carrying amountOpening balance at 1 July 8,745 8,911 – –Additions 140 – – –Transfers from property, plant and equipment 6,331 – – –Depreciation (Note 7) (277) (166) – –Closing balance at 30 June 14,939 8,745 – –Amounts recognised in profit and loss for investment propertyRental income 995 663 – –Cost recoveries 95 80 – –Direct operating expenses from property that generated rental income (44) (33) – –
1,046 710 – –
Valuation basisThe basis of the valuation of investment properties is at cost less subsequent depreciation. During the financial year the properties have been assessed by independent valuers, and these assessments were greater than the carrying value.
Contractual obligationsRefer to Note 31 for disclosure of any contractual obligations to purchase, construct or develop investment property or for repairs, maintenance or enhancements.
Leasing arrangementsThe investment properties are leased to tenants under long-term operating leases with rentals payable monthly. Minimum lease payments receivable on leases of investment properties are as follows:
Consolidated Parent entity2009 $’000
2008 $’000
2009 $’000
2008 $’000
Minimum lease payments under non-cancellable operating leases of investment properties not recognised in the financial statements are receivable as follows:Within one year 721 683 – –Later than one year but not later than 5 years 3,105 2,943 – –Later than 5 years 5,902 6,066 – –
9,728 9,692 – –
Notes to the Financial Statements for the year ended 30 June 2009 (continued)
For
per
sona
l use
onl
y

73
www.tattsgroup.com
Note 17 Intangible assetsConsolidated Goodwill Licences Brands(1) Software(2) Other Total
$’000 $’000 $’000 $’000 $’000 $’000At 1 July 2007Cost 2,331,337 275,249 105,417 112,163 135,854 2,960,020Accumulated amortisation – (7,215) (94) (8,131) (97) (15,537)Net book amount 2,331,337 268,034 105,323 104,032 135,757 2,944,483Additions – 22,215 – 7,961 – 30,176Fair value adjustments on acquisition of a subsidiary 19,762 – – – – 19,762Additions through acquisitions of subsidiaries 332,169 – – 600 – 332,769Disposals – – – (41) – (41)Disposals – discontinued operation (1,240) – – (650) – (1,890)Amortisation charge (Note 7) – (5,599) (125) (15,333) (3,046) (24,103)Foreign exchange movements (27,077) – – – – (27,077)Closing net book amount 2,654,951 284,650 105,198 96,569 132,711 3,274,079At 30 June 2008Cost 2,654,951 297,464 105,417 118,914 135,854 3,312,600Accumulated amortisation – (12,814) (219) (22,345) (3,143) (38,521)Net book amount 2,654,951 284,650 105,198 96,569 132,711 3,274,079Additions through acquisitions of subsidiaries (Note 33) 41,258 – – 934 – 42,192Additions – 1,661 – 4,953 – 6,614Transfers in/(out)(3) – (827) – 27,915 – 27,088Amortisation charge (Note 7) – (7,911) (225) (21,151) (3,031) (32,318)Foreign exchange movements (6,725) 44 – (10) – (6,691)Closing net book amount 2,689,484 277,617 104,973 109,210 129,680 3,310,964At 30 June 2009Cost 2,689,484 298,296 105,417 181,690 135,854 3,410,741Accumulated amortisation – (20,679) (444) (72,480) (6,174) (99,777)Net book amount 2,689,484 277,617 104,973 109,210 129,680 3,310,964
(1) Brands include $53,400,000 of assets with an indefinite life, which are included in the Wagering and Maxgaming segments.
(2) Software includes capitalised development costs being an internally generated intangible asset.
(3) Transfers includes assets transferred (to)/from property, plant and equipment and deferred expenditure
For
per
sona
l use
onl
y

74 | Tatts Group Limited Annual Report 2009
Note 17 Intangible assets (continued)Parent entity Licences Brands Total
$’000 $’000 $’000At 30 June 2007Cost 373,024 402,886 775,910Accumulated amortisation – – –Net book amount 373,024 402,886 775,910Impairment charges (373,024) (402,886) (775,910)
– – –At 30 June 2008Cost 373,024 402,886 775,910Accumulated impairment losses (373,024) (402,886) (775,910)Net book amount – – –At 30 June 2009Cost 373,024 402,886 775,910Accumulated impairment losses (373,024) (402,886) (775,910)Net book amount – – –
(a) Impairment tests for goodwillThe accounting policy for impairment of assets is set out in Note 1(j).
Goodwill is allocated to the Group’s cash-generating units (CGUs) expected to benefit from the synergies of those business combinations.
A segment-level summary of the goodwill allocation is presented below:
2009 $’000
2008 $’000
Tatts Pokies 15,552 15,552Lotteries 460,213 460,213Wagering1 1,368,091 1,364,870Maxgaming 500,000 500,000International/Business Development1 335,337 304,025Bytecraft Systems2 10,291 10,291Total 2,689,484 2,654,951
1 Refer to Note 33 for details of acquisitions during the financial year
2 The acquisition of an additional 30% of EGM Tech Pty Ltd on 4 July 2007 for $1,625,000 brings the total shareholding to 100% and has resulted in an increase in goodwill of $1,064,000.
The recoverable amount of a CGU is determined based on value-in-use calculation. These calculations use cash flow projections based on the budget approved by the Board for the next financial year and management’s forecasts covering a five year period. Cash flows beyond the five year period are extrapolated using a growth rate not exceeding the long-term average growth rate for the business in which the CGU operates.
Intangible assets with indefinite lives in the Company were the brand and licence that were acquired on the purchase of the Estate of the Late George Adams (ELGA) assets. Although these intangible assets were eliminated on consolidation, and were therefore not recognised in the Group balance sheet, they formed part of the Tatts Pokies/Lotteries CGU within the Group impairment testing model in previous years. These assets were fully impaired in the previous financial year (refer (c)).
Notes to the Financial Statements for the year ended 30 June 2009 (continued)
For
per
sona
l use
onl
y

75
www.tattsgroup.com
Note 17 Intangible assets (continued)
(b) Key assumptions used for value-in-use calculationsThe following describes each key assumption on which management has based its cash flow projections to undertake impairment testing of goodwill and other non-current assets:
(i) Cash flow forecastsCash flow forecasts are based on the 2010 financial year budget approved by the Board and management’s five year forecasts.
(ii) Terminal valueTerminal value is calculated using a perpetuity growth rate based on the cash flow forecast for year 5, pre-tax weighted average cost of capital and forecast growth rates.
(iii) Forecast growth ratesForecast growth rates are principally based on management’s expectations for future performance in each business segment. These growth rates take into account historical growth rates for each CGU. These rates are not disclosed as they are commercially sensitive.
(iv) Discount ratesDiscount rates used are based on the Group’s pre-tax weighted average cost of capital and reflect specific risks relating to the relevant segments and the countries in which they operate. The pre-tax discount rates used range from 9.8% to 14.0% (2008: 11.1% to 16.2%).
(c) Impairment chargeIn the previous financial year an impairment charge arose in the Company to the brand and licence intangible assets following the announcement by the Victorian Government on 10 April 2008 on the gambling licence arrangements that will apply beyond 2012. The impairment of these gambling licence arrangements post 2012 on the business of the Group, and the Government’s statements on the licence expiry payment, have led to the brand and licence intangible assets in the Company being fully impaired.
The accounting treatment adopted here for the gaming licence is in accordance with Australian Accounting Standards. It does not reflect any assessment by the Company of its entitlement to the licence expiry payment or other rights following on from the Government’s statements.
Note 18 Deferred tax assets
Consolidated Parent entity2009 $’000
2008 $’000
2009 $’000
2008 $’000
The balance comprises temporary differences attributable to:Employee benefits 6,849 6,337 403 299Depreciation 24,772 22,251 2,537 4,341Provisions 1,646 1,448 1,482 1,320Float costs 574 1,650 574 1,650Listed securities 1,565 1,143 – –Tax losses 2,238 1,311 – –Other 2,761 4,195 81 94Total deferred tax asset 40,405 38,335 5,077 7,704Deferred tax assets to be settled within 12 months 10,200 6,283 1,949 3,694Deferred tax assets to be settled after more than 12 months 30,205 32,052 3,128 4,010
40,405 38,335 5,077 7,704
For
per
sona
l use
onl
y

76 | Tatts Group Limited Annual Report 2009
Note 18 Deferred tax assets (continued)
Movements - ConsolidatedEmployee
Benefits Depreciation Provisions Float Costs Tax lossesListed
securities Other Total$’000 $’000 $’000 $’000 $’000 $’000 $’000 $’000
Opening balance at 1 July 2007 5,947 21,480 8,948 2,723 295 – 3,022 42,415Credited/(charged) to the income statement (Note 8(a)) 390 (1,220) 424 (1,073)
1,016
– 929 466
Charged to equity (Note 8(c)) – – – – – 1,143 – 1,143Acquisition of subsidiary – 3,098 – – – – – 3,098Fair value adjustments on acquisition of subsidiary – (1,107) (7,924) –
–
– 244 (8,787)
Closing balance at 30 June 2008 6,337 22,251 1,448 1,650 1,311 1,143 4,195 38,335Credited/(charged) to the income statement (Note 8(a)) 512 2,521 198 (1,076) 927 1,380 (1,677) 2,785Charged to equity (Note 8(c)) – – – – – (958) – (958)Acquisition of subsidiary (Note 33) – – – – – – 206 206Foreign exchange movements – – – – – – 37 37Closing balance at 30 June 2009 6,849 24,772 1,646 574 2,238 1,565 2,761 40,405
Movements - Parent entity Employee
Benefits Depreciation Provisions Float Costs Other Total$’000 $’000 $’000 $’000 $’000 $’000
Opening balance at 1 July 2007 596 6,146 1,200 2,723 83 10,748Credited/(charged) to the income statement (Note 8(a)) (297) (1,805) 120 (1,073) 11 (3,044)Closing balance at 30 June 2008 299 4,341 1,320 1,650 94 7,704Credited/(charged) to the income statement (Note 8(a)) 104 (1,804) 162 (1,076) (13) (2,627)Closing balance at 30 June 2009 403 2,537 1,482 574 81 5,077
Note 19 Other non-current assets
Consolidated Parent entity2009 $’000
2008 $’000
2009 $’000
2008 $’000
Non-currentUnlisted investments: Shares in subsidiaries – – 2,777,539 2,676,481 Units in unit trusts 350 350 – – Shares in other related parties 561 1,112 – – Shares in other unlisted investments 10 10 – –Redeemable preference shares 200 200 – –Deferred expenditure 586 1,229 – –
1,707 2,901 2,777,539 2,676,481
Unlisted investmentsUnlisted investments are not traded in active markets.
Redeemable preference sharesThe redeemable preference shares are unsecured and interest is payable monthly at the rate equivalent to the 11am market interest rate and an additional 1.25% (2008:1.25%) per annum.
Notes to the Financial Statements for the year ended 30 June 2009 (continued)
For
per
sona
l use
onl
y

77
www.tattsgroup.com
Note 20 Trade and other payables
Consolidated Parent entity2009 $’000
2008 $’000
2009 $’000
2008 $’000
CurrentTrade payables 391,686 245,592 6,277 3,293Other payables and accruals 68,760 65,594 5,912 5,121
460,446 311,186 12,189 8,414Amounts payable to related entities (Note 32(e)) 2,541 2,032 – –
462,987 313,218 12,189 8,414Non-currentTrade payables 43,484 48,466 – –
43,484 48,466 – –
Foreign exchange and interest rate riskInformation concerning exposure to foreign currency and interest rate risk in relation to trade and other payables is set out in Note 2.
Fair value and maturity analysis disclosuresDetails of the fair value and the maturity analysis are set out in Note 2.
Note 21 Interest bearing liabilitiesConsolidated Parent entity2009 $’000
2008 $’000
2009 $’000
2008 $’000
CurrentSecuredLease liabilities (Note 31(d)) 448 451 – –UnsecuredBank overdrafts (Note 10) 751 1,169 – –Bank loans 2,274 228,507 – 218,056
3,025 229,676 – 218,056Total current interest bearing liabilities 3,473 230,127 – 218,056Non-currentSecuredLease liabilities (Note 31(d)) – 451 – –UnsecuredBank loans 904,255 649,206 748,776 429,855Total non-current interest bearing liabilities 904,255 649,657 748,776 429,855
All interest bearing liabilities are unsecured with the exception of the lease liabilities which are secured on the leased assets.
Foreign currency and interest rate risk exposuresInformation concerning exposure to foreign currency and interest rate risk in relation to interest bearing liabilities is set out in Note 2.
Fair value and maturity analysis disclosuresDetails of the fair value borrowings for the Group and the maturity analysis are set out in Note 2.
For
per
sona
l use
onl
y

78 | Tatts Group Limited Annual Report 2009
Note 22 Provisions
Consolidated Parent entity2009 $’000
2008 $’000
2009 $’000
2008 $’000
CurrentEmployee benefits 12,401 9,552 549 471Onerous leases 1,062 – – –Dilapidations 4,742 – – –
18,205 9,552 549 471Non-currentEmployee benefits 1,958 3,812 54 19Onerous leases 2,096 5,980 – –Dilapidations – 803 – –
4,054 10,595 54 19
Reconciliation of provision movements
Onerous leases $’000
Dilapidations $’000
Total $’000
Opening balance at 1 July 2008 5,980 803 6,783Additions through acquisitions of entities (Note 33) – 4,324 4,324Utilisation of the provision (2,869) – (2,869)Credited to the income statement – (138) (138)Foreign exchange movements 47 (247) (200)Closing balance at 30 June 2009 3,158 4,742 7,900
Onerous leasesA provision for onerous leases is recognised for venues in the United Kingdom which have closed but are contracted to future payments under an operating lease.
DilapidationsA provision for dilapidations is recognised for leasehold properties in the United Kingdom requiring remedial dilapidations work at the expiry of the lease arrangement.
Note 23 Deferred tax liabilities
Consolidated Parent entity2009 $’000
2008 $’000
2009 $’000
2008 $’000
The balance comprises temporary differences attributable to:Depreciation 4,692 8,056 – 16Intangibles 162,714 152,848 – –Unclaimed dividends 3,315 2,806 – –Interest receivable 69 312 5 30Accrued revenue 1,163 1,109 – –Non-consolidated group members 343 942 – –Other 4,422 5,256 2,525 1,711Total deferred tax liabilities 176,718 171,329 2,530 1,757Deferred tax liabilities to be settled within 12 months 5,175 6,284 5 815Deferred tax liabilities to be settled after more than 12 months 171,543 165,045 2,525 942
176,718 171,329 2,530 1,757
Notes to the Financial Statements for the year ended 30 June 2009 (continued)
For
per
sona
l use
onl
y

79
www.tattsgroup.com
Note 23 Deferred tax liabilities (continued)
Movements (Consolidated) Depreciation Intangibles Unclaimed dividends
Interest Receivable
Accrued revenue
Non- consol group
member Other Total$’000 $’000 $’000 $’000 $’000 $’000 $’000 $’000
Closing balance at 1 July 2007 12,099 127,401 200 669 1,594 1,819 3,238 147,020Charged/(credited) to the income statement (Note 8(a)) (5,139) 8,975 2,606 61 (485) (877) 4,117 9,258Charged/(credited) to equity (Note 8(c)) – – – – – – 95 95Fair value adjustments on acquisition of subsidiary
1,096 16,472 – (418) – – (2,194) 14,956
Closing balance at 30 June 2008 8,056 152,848 2,806 312 1,109 942 5,256 171,329Charged/(credited) to the income statement (Note 8(a)) (3,364) 9,866 509 (243) 54 (599) (581) 5,642Credited to equity (Note 8(c)) – – – – – – (306) (306)Foreign exchange movements – – – – – – 53 53Closing balance at 30 June 2009 4,692 162,714 3,315 69 1,163 343 4,422 176,718
Movements (Parent entity) DepreciationInterest
Receivable Other Total$’000 $’000 $’000 $’000
Opening balance at 1 July 2007 895 19 82 996Charged/(credited) to the income statement (Note 8(a)) (879) 11 1,629 761Closing balance at 30 June 2008 16 30 1,711 1,757Charged/(credited) to the income statement (Note 8(a)) (16) (25) 814 773Closing balance at 30 June 2009 – 5 2,525 2,530
Note 24 Retirement benefit obligationsAll employees of the Group are entitled to benefits from one of the Group’s superannuation plans on retirement, disability or death.
Defined benefit superannuation plan – UNiTAB Limited and controlled entitiesFollowing the Group’s acquisition of UNiTAB Limited and its controlled entities on 12 October 2006, the Group had consolidated the net asset relating to the UNiTAB defined benefit plan. On 30 May 2008 the defined benefit plan was closed with all assets/obligations being converted into assets/entitlements within either the Group accumulation plan or another suitable plan nominated by the former members. At this date the fair value of the plan assets less obligations was $4,060,000.
Relevant disclosures below are for the previous financial year in respect of this plan from 1 July 1007 to 30 May 2008. There was no Defined Benefit Superannuation Scheme asset or liability or plan assets at 30 June 2008.
For
per
sona
l use
onl
y

80 | Tatts Group Limited Annual Report 2009
Note 24 Retirement benefit obligations (continued)(i) Reconciliations of movements
Consolidated2009 $’000
2008 $’000
Reconciliation of the present value of the defined benefit obligation, which is fully funded:Balance at 1 July – 24,454Current service cost – 1,766Interest cost – 1,189Contributions by plan participants – 659Actuarial losses/(gains) – 782Benefits paid – (2,878)Past service costs – 4,113Settlements – (30,085)Balance at the end of the year – –Reconciliation of the fair value of defined benefit assets:Balance at 1 July – 31,925Expected return on plan assets – 1,885Actuarial (losses)/gains – (3,411)Contributions by Group companies – 1,905Contributions by plan participants – 659Benefits paid – (2,878)Settlements – (30,085)Balance at the end of the year – –
(ii) Amounts recognised in income statementThe amounts recognised in the income statement are as follows:
Consolidated2009 $’000
2008 $’000
Current service cost – 1,766Interest cost – 1,189Expected return on plan assets – (1,887)Past service costs – 4,113Net expense recognised in the income statement – 5,181Actual return on plan assets – (1,526)
(iii) Amounts recognised in statements of recognised income and expense
Consolidated2009 $’000
2008 $’000
Actuarial (loss)/gain recognised in the year – gross of tax – (4,873)
(iv) Principal actuarial assumptionsThe principal actuarial assumptions used (expressed as weighted averages) were as follows:
Consolidated2009 2008
Discount rate – 5.40%Expected return on plan assets – 6.50%Salary inflation rate – long term – 4.75%
The expected return on assets was based on historical and future expectations of returns for each of the major categories of asset classes as well as expected and actual allocation of plan assets to these major categories.
(v) Employer contributionsEmployer contributions to the defined benefit section of the plan were based on recommendations by the plan’s actuary. For the period from 1 July 2007 to 30 May 2008, UNiTAB Limited paid 12.25% of defined benefit members’ salaries.
Notes to the Financial Statements for the year ended 30 June 2009 (continued)
For
per
sona
l use
onl
y

81
www.tattsgroup.com
Note 25 Contributed equity
(a) Share capital2009
Shares2008
Shares2009 $’000
2008 $’000
For the Group:Ordinary Shares – fully paid 1,270,070,761 1,265,355,056 2,333,193 2,321,082For the Parent entity:Ordinary Shares – fully paid 1,270,070,761 1,265,355,056 3,432,660 3,420,549
(b) Movements in ordinary share capital:
Dates
DetailsNumber of
sharesAscribed Value
$Consolidated
$’000Parent entity
$’0001 July 2007 Opening balance 1,265,355,056 2,321,082 3,420,54930 June 2008 Closing balance 1,265,355,056 2,321,082 3,420,5492 March 2009 Performance rights issue 48,533 1.80 87 873 March 2009 Performance rights issue 4,534 1.80 8 811 March 2009 Performance rights issue 12,580 1.80 23 233 April 2009 Dividend Reinvestment Plan issues 4,644,921 2.58 11,984 11,9846 April 2009 Performance rights issue 5,137 1.80 9 9
1,270,070,761 2,333,193 3,432,660
Ordinary SharesOrdinary shares entitle the holder to participate in dividends and the proceeds on winding up of the Company in proportion to the number of and amounts paid on the shares held.
On a show of hands every holder of ordinary shares present at a meeting in person or by proxy, is entitled to one vote, and upon a poll each share is entitled to one vote. Voting power may be subject to certain restrictions arising from a combination of the Tatts Group Limited Constitution, statute, the ASX listing rules and other general law. Subject to certain exceptions, a person’s voting power in Tatts Group Limited must not exceed 10%.
Dividend Reinvestment Plan (DRP)The Company has a DRP in operation under which holders of ordinary shares may elect to have all or part of their dividend entitlements satisfied by the provision of ordinary shares rather than being paid in cash. No discount is applicable to shares acquired under the DRP.
Options and right issuesRefer to Note 39 regarding options and rights issued as share based payments.
For
per
sona
l use
onl
y

82 | Tatts Group Limited Annual Report 2009
Note 26 Reserves and retained profitsConsolidated Parent entity2009 $’000
2008 $’000
2009 $’000
2008 $’000
(a) ReservesAvailable-for-sale financial assets revaluation reserve (941) (3,467) – –Foreign currency translation reserve (20,660) (24,115) – –Hedge reserve 14,834 28,127 (9,326) –Share based payments reserve 3,938 2,200 3,938 2,200
(2,829) 2,745 (5,388) 2,200MovementsAvailable-for-sale financial assets revaluation reserve Balance 1 July (3,467) 146 – – Impairment, net of deferred tax 3,400 – – – Revaluation, net of deferred tax (874) (3,613) – – Balance 30 June (941) (3,467) – –Foreign currency translation reserve Balance 1 July (24,115) (11,025) – – Transferred to retained earnings (Note 33(b)) 6,846 – – – Currency translation differences arising during the year (3,391) (13,090) – – Balance 30 June (20,660) (24,115) – –Hedge reserve – cash flow hedges Balance 1 July 28,127 5,890 – – Foreign currency interest rate swap movement, net of deferred tax (15,278) 8,912 (8,732) – Gain on realisation of interest rate swap, net of deferred tax (2,366) – – – Forward exchange contracts movements, net of deferred tax (594) – (594) – Foreign currency net investment hedge movements 4,945 13,325 – – Balance 30 June 14,834 28,127 (9,326) –Share-based payments reserve Balance 1 July 2,200 849 2,200 849 Performance options and rights expense 1,865 1,351 1,865 1,351 Rights exercised (127) – (127) – Balance 30 June 3,938 2,200 3,938 2,200
(b) Retained profitsMovements in retained profits were as follows: Balance 1 July 254,553 297,737 (763,222) 215,276 Net profit/(loss) for the year 277,441 257,586 401,241 (681,139) Dividends (Note 27) (259,404) (297,359) (259,404) (297,359) Actuarial losses on retirement benefit asset, net of tax – (3,411) – – Transfer from foreign currency translation reserve attributable to acquisition of the European Gaming Group (Note 33(b)) (6,846) – – – Balance 30 June 265,744 254,553 (621,385) (763,222)
Notes to the Financial Statements for the year ended 30 June 2009 (continued)
For
per
sona
l use
onl
y

83
www.tattsgroup.com
Note 26 Reserves and retained profits (continued)
(c) Nature and purpose of reserves(i) Available-for-sale financial assets revaluation reserveChanges in the fair value and exchange differences arising on translation of investments, such as equities, classified as available-for-sale financial assets, are taken to the available-for-sale investments revaluation reserve, as described in Note 1(o). Amounts are recognised in the income statement when the associated assets are sold or impaired.
(ii) Foreign currency translation reserveExchange differences arising on translation of foreign controlled entities are taken to the foreign currency translation reserve, as described in Note 1(e). The reserve is recognised in the income statement upon disposal of the net investment.
(iii) Hedge reserveThe hedge reserve is used to recognise the portion of the gain or loss on a hedging instrument in a net investment or cash flow hedge that is determined to be an effective hedge.
(iv) Share-based payments reserveThe share-based payments reserve is used to recognise the fair value at grant date of performance options and performance rights issued but not exercised.
Note 27 Dividends
(a) Ordinary shares
Parent entity2009 $’000
2008 $’000
Final dividend for the year ended 30 June 2007 of 10.0 cents per fully paid share paid on 5 October 2007 Fully franked based on tax paid @ 30% – 126,536Special dividend for year ended 30 June 2008 of 10.5 cents (2008 - 4.0 cents on 5 October 2007) per fully paid share paid on 3 October 2008 Fully franked based on tax paid @ 30% 132,862 50,614Interim dividend for year ended 30 June 2009 of 10.0 cents (2008– 9.5 cents on 30 March 2008) per fully paid share paid on 3 April 2009 Fully franked based on tax paid @ 30% 126,542 120,209
(b) Dividends not recognised at year endIn addition to the above dividends, since the balance sheet date the Directors have determined the payment of a final dividend of 11.0 cents (2008: 10.5 cents) per fully paid ordinary share, fully franked based on tax paid at 30%. The aggregate amount of the proposed dividend to be paid on 2 October 2009 out of retained profits, but not recognised as a liability at year end, is $139,707,784 (2008: $132,862,281).
(c) Franked dividendsThe franked portions of the final dividend determined after 30 June 2009 will be franked out of existing franking credits or out of franking credits arising from the payment of income tax in the year ended 30 June 2010.
Consolidated Parent entity2009 $’000
2008 $’000
2009 $’000
2008 $’000
Franking credits available for subsequent financial years based on a tax rate of 30% (2008 – 30%) 147,501 131,716 147,501 131,716
The above amounts represent the balance of the franking account as at the end of the financial year, adjusted as necessary for:
(i) franking credits that will arise from the payment of the amount of the provision for income tax;
(ii) franking debits that will arise from the payment of dividends recognised as a liability at the reporting date; and
(iii) franking credits that will arise from the receipt of dividends recognised as receivables at the reporting date.
The consolidated amounts include franking credits that would be available to the Company if distributable profits of subsidiaries were paid as dividends.
The impact on the franking account of the dividend determined by the Directors since year end, but not recognised as a liability at year end, will be a reduction in the franking account of $59,874,764 (2008: $56,940,977).
For
per
sona
l use
onl
y
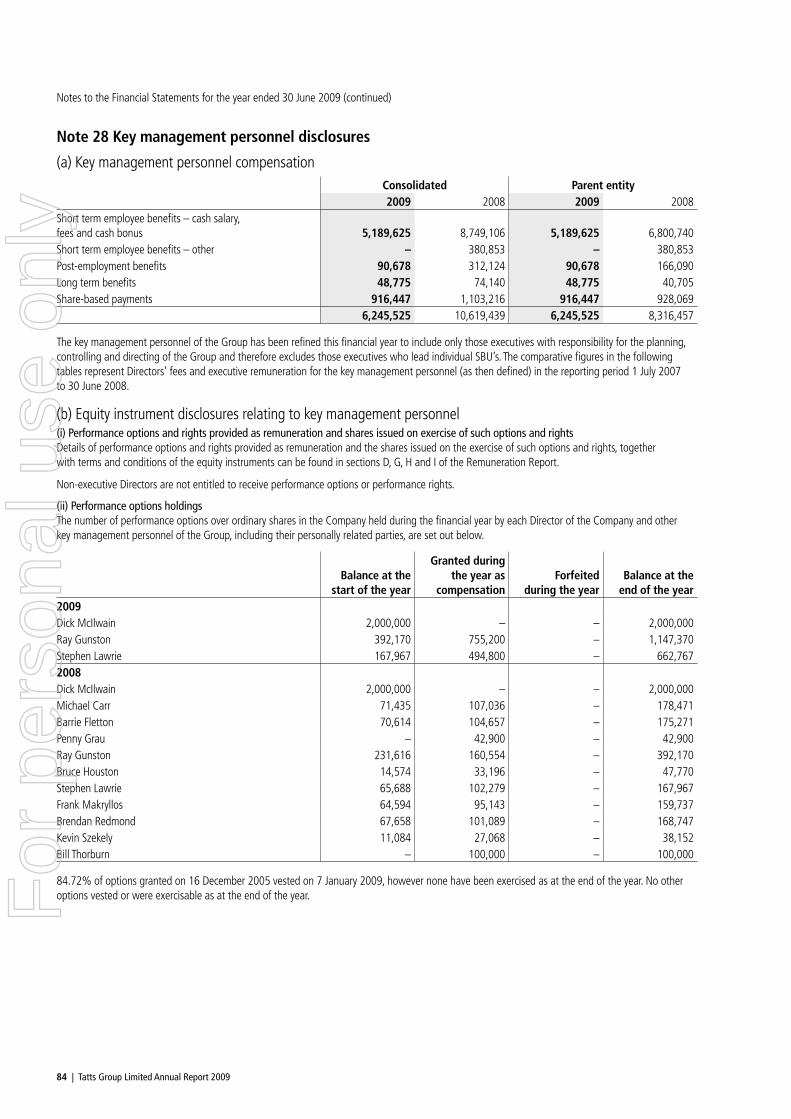
84 | Tatts Group Limited Annual Report 2009
Note 28 Key management personnel disclosures
(a) Key management personnel compensationConsolidated Parent entity2009 2008 2009 2008
Short term employee benefits – cash salary, fees and cash bonus 5,189,625 8,749,106 5,189,625 6,800,740Short term employee benefits – other – 380,853 – 380,853Post-employment benefits 90,678 312,124 90,678 166,090Long term benefits 48,775 74,140 48,775 40,705Share-based payments 916,447 1,103,216 916,447 928,069
6,245,525 10,619,439 6,245,525 8,316,457
The key management personnel of the Group has been refined this financial year to include only those executives with responsibility for the planning, controlling and directing of the Group and therefore excludes those executives who lead individual SBU’s. The comparative figures in the following tables represent Directors’ fees and executive remuneration for the key management personnel (as then defined) in the reporting period 1 July 2007 to 30 June 2008.
(b) Equity instrument disclosures relating to key management personnel(i) Performance options and rights provided as remuneration and shares issued on exercise of such options and rightsDetails of performance options and rights provided as remuneration and the shares issued on the exercise of such options and rights, together with terms and conditions of the equity instruments can be found in sections D, G, H and I of the Remuneration Report.
Non-executive Directors are not entitled to receive performance options or performance rights.
(ii) Performance options holdingsThe number of performance options over ordinary shares in the Company held during the financial year by each Director of the Company and other key management personnel of the Group, including their personally related parties, are set out below.
Balance at the start of the year
Granted during the year as
compensationForfeited
during the yearBalance at the
end of the year2009Dick McIlwain 2,000,000 – – 2,000,000Ray Gunston 392,170 755,200 – 1,147,370Stephen Lawrie 167,967 494,800 – 662,7672008Dick McIlwain 2,000,000 – – 2,000,000Michael Carr 71,435 107,036 – 178,471Barrie Fletton 70,614 104,657 – 175,271Penny Grau – 42,900 – 42,900Ray Gunston 231,616 160,554 – 392,170Bruce Houston 14,574 33,196 – 47,770Stephen Lawrie 65,688 102,279 – 167,967Frank Makryllos 64,594 95,143 – 159,737Brendan Redmond 67,658 101,089 – 168,747Kevin Szekely 11,084 27,068 – 38,152Bill Thorburn – 100,000 – 100,000
84.72% of options granted on 16 December 2005 vested on 7 January 2009, however none have been exercised as at the end of the year. No other options vested or were exercisable as at the end of the year.
Notes to the Financial Statements for the year ended 30 June 2009 (continued)
For
per
sona
l use
onl
y
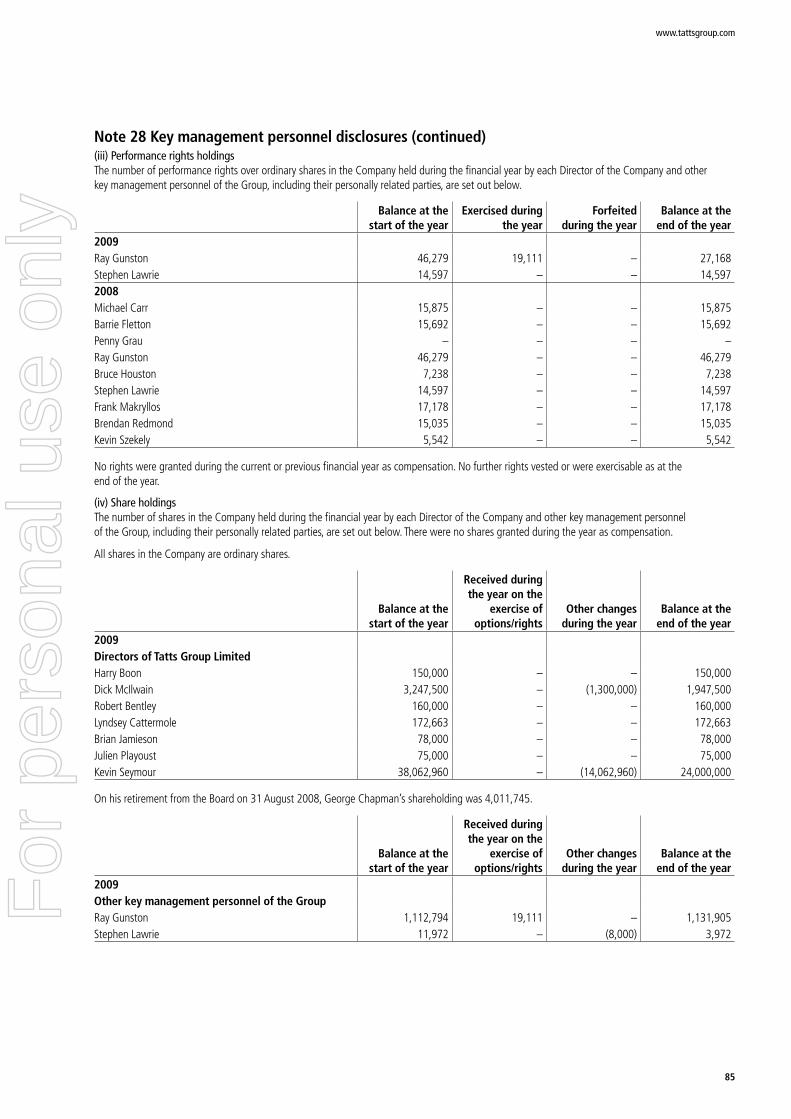
85
www.tattsgroup.com
Note 28 Key management personnel disclosures (continued)(iii) Performance rights holdingsThe number of performance rights over ordinary shares in the Company held during the financial year by each Director of the Company and other key management personnel of the Group, including their personally related parties, are set out below.
Balance at the start of the year
Exercised during the year
Forfeited during the year
Balance at the end of the year
2009Ray Gunston 46,279 19,111 – 27,168Stephen Lawrie 14,597 – – 14,5972008Michael Carr 15,875 – – 15,875Barrie Fletton 15,692 – – 15,692Penny Grau – – – –Ray Gunston 46,279 – – 46,279Bruce Houston 7,238 – – 7,238Stephen Lawrie 14,597 – – 14,597Frank Makryllos 17,178 – – 17,178Brendan Redmond 15,035 – – 15,035Kevin Szekely 5,542 – – 5,542
No rights were granted during the current or previous financial year as compensation. No further rights vested or were exercisable as at the end of the year.
(iv) Share holdingsThe number of shares in the Company held during the financial year by each Director of the Company and other key management personnel of the Group, including their personally related parties, are set out below. There were no shares granted during the year as compensation.
All shares in the Company are ordinary shares.
Balance at the start of the year
Received during the year on the
exercise of options/rights
Other changes during the year
Balance at the end of the year
2009Directors of Tatts Group LimitedHarry Boon 150,000 – – 150,000Dick McIlwain 3,247,500 – (1,300,000) 1,947,500Robert Bentley 160,000 – – 160,000Lyndsey Cattermole 172,663 – – 172,663Brian Jamieson 78,000 – – 78,000Julien Playoust 75,000 – – 75,000Kevin Seymour 38,062,960 – (14,062,960) 24,000,000
On his retirement from the Board on 31 August 2008, George Chapman’s shareholding was 4,011,745.
Balance at the start of the year
Received during the year on the
exercise of options/rights
Other changes during the year
Balance at the end of the year
2009Other key management personnel of the GroupRay Gunston 1,112,794 19,111 – 1,131,905Stephen Lawrie 11,972 – (8,000) 3,972
For
per
sona
l use
onl
y

86 | Tatts Group Limited Annual Report 2009
Note 28 Key management personnel disclosures (continued)
Balance at the start of the year
Received during the year on the
exercise of options/rights
Other changes during the year
Balance at the end of the year
2008Directors of Tatts Group LimitedHarry Boon 150,000 – – 150,000Dick McIlwain 3,247,500 – – 3,247,500Robert Bentley 140,000 – 20,000 160,000Lyndsey Cattermole 172,663 – – 172,663George Chapman 4,011,745 – – 4,011,745Brian Jamieson 78,000 – – 78,000Julien Playoust 50,000 – 25,000 75,000Kevin Seymour 42,060,665 – (3,997,705) 38,062,9602008Other key management personnel of the GroupMichael Carr 11,878 – – 11,878Barrie Fletton 66,104 – – 66,104Penny Grau – – – –Ray Gunston 1,112,794 – – 1,112,794Bruce Houston 141,757 – – 141,757Stephen Lawrie 11,972 – – 11,972Frank Makryllos 323,087 – (30,000) 293,087Brendan Redmond 195,169 – – 195,169Kevin Szekely 137,232 – – 137,232Bill Thorburn – – – –
(c) Loans to Directors and key management personnelNo loans are made to Directors or key management personnel.
(d) Other transactions with Directors and key management personnelA Non-executive Director, Mr Robert Bentley, is the Chairman of Queensland Racing Limited, which controls Queensland Race Product Co Ltd. Payments for the year to 30 June 2009 totalling $124,925,000 (2008: $125,465,000) were made to Queensland Race Product Co Ltd pursuant to the Product and Program Agreement dated 9 June 1999 for the provision of certain racing information. This contract is based on normal commercial terms and conditions.
Notes to the Financial Statements for the year ended 30 June 2009 (continued)
For
per
sona
l use
onl
y

87
www.tattsgroup.com
Note 29 Remuneration of AuditorsDuring the year the following fees were paid or payable to PricewaterhouseCoopers for services provided by the auditor of the Company and its related practices and non-related audit firms:
Consolidated Parent entity2009
$2008
$2009
$2008
$Audit servicesFees paid to PricewaterhouseCoopers Australian firm: Audit and review of financial reports and other audit work under the Corporations Act 2001 929,425 954,450 317,454 295,000Fees paid to related practices of PricewaterhouseCoopers Australian firm 318,711 378,573 – –Total remuneration for audit services 1,248,136 1,333,023 317,454 295,000 Non-audit services(a) Assurance servicesFees paid to PricewaterhouseCoopers Australian firm: Audit of regulatory returns 51,335 40,935 – – Due diligence services 30,000 – – –Total remuneration for assurance services 81,335 40,935 – –(b) Taxation servicesFees paid to PricewaterhouseCoopers Australian firm: Tax compliance services, including review of company tax returns 26,643 7,477 – 7,477Total remuneration for taxation services 26,643 7,477 – 7,477Total remuneration for non-audit services 107,978 48,412 – 7,477
Subject to maintaining their independence it is the Group’s policy to employ PricewaterhouseCoopers on assignments additional to their statutory audit duties where PricewaterhouseCoopers’ expertise and experience with the Group are important. These assignments are principally tax advice and due diligence reporting on acquisitions.
Note 30 Contingent liabilities Contingent liabilitiesThe parent and consolidated entity had contingent liabilities at 30 June 2009 in respect of:
Guarantees in respect of bank facilities drawn down but not included in the Company accounts of the Group are $1,864,000 (2008: $1,809,000).
Note 31 Commitments for expenditure
(a) Capital commitmentsCapital expenditure contracted for at the reporting date but not recognised as liabilities is as follows:
Consolidated Parent entity2009 $’000
2008 $’000
2009 $’000
2008 $’000
Property, plant and equipment – Payable:Within one year 4,033 9,033 – –Later than one year but not later than five years 100 – – –
4,133 9,033 – –
For
per
sona
l use
onl
y

88 | Tatts Group Limited Annual Report 2009
Note 31 Commitments for expenditure (continued)
(b) Operating lease commitmentsThe Group leases motor vehicles and various buildings under non-cancellable operating leases. The leases have varying terms and renewal rights. On renewal, the terms of the leases are to be negotiated.
Consolidated Parent entity2009 $’000
2008 $’000
2009 $’000
2008 $’000
Commitments for minimum lease payments in relation to non-cancellable operating leases are payable as follows:Within one year 18,501 16,236 – –Later than one year but not later than five years 42,080 52,384 – –Later than five years 20,262 14,519 – –Commitments not recognised in the financial statements 80,843 83,139 – –
(c) Operating commitmentsOperating commitments, being supply, marketing and sponsorship contracted for at the reporting date but not recognised as liabilities are as follows:
Consolidated Parent entity2009 $’000
2008 $’000
2009 $’000
2008 $’000
Commitments in relation to non-cancellable operating activities are payable as follows:Within one year 32,753 30,288 – –Later than one year but not later than five years 40,531 63,653 – –Later than five years 3,894 75 – –
77,178 94,016 – –
(d) Finance leasesThe Group leases various plant and equipment with a carrying amount of $863,000 (2008: $1,150,000).
Consolidated Parent entity2009 $’000
2008 $’000
2009 $’000
2008 $’000
Commitments in relation to finance leases are payable as follows:Within one year 481 481 – –Later than one year but not later than five years – 481 – –Minimum lease payments 481 962 – –Future finance charges (33) (60) – –Recognised as a liability 448 902 – –Representing lease liabilities:Current (Note 21) 448 451 – –Non-current (Note 21) – 451 – –
448 902 – –
(e) Employee remuneration commitmentsConsolidated Parent entity2009 $’000
2008 $’000
2009 $’000
2008 $’000
Commitments under non-cancellable employment contracts not provided for in the financial statements and payable:Within one year 6,404 4,046 4,635 3,385Later than one year but not later than five years – 549 – –
6,404 4,595 4,635 3,385
Notes to the Financial Statements for the year ended 30 June 2009 (continued)
For
per
sona
l use
onl
y

89
www.tattsgroup.com
Note 32 Related party transactions
(a) Parent entitiesThe ultimate parent entity within the Group is Tatts Group Limited.
(b) Controlled entitiesInvestments in controlled entities are set out in Note 34.
(c) Directors and key management personnelDisclosures relating to Directors and specified executives are set out in Note 28.
(d) Transactions with related partiesConsolidated Parent entity2009 $’000
2008 $’000
2009 $’000
2008 $’000
Other revenue: Licence fee revenue from subsidiaries – – – 109,703 Rental income from subsidiaries – – 216 216 Management and service fees from subsidiaries – – 200 200Dividend revenue: Controlled entities – – 420,751 25,000Superannuation contributions: Contributions to superannuation funds on behalf of employees 13,339 10,965 727 849Tax consolidation legislation: Current tax payable assumed from wholly owned tax consolidated entities – – 126,474 78,689
(e) Outstanding balancesThe following balances are outstanding at the reporting date in relation to transactions with related parties:
Consolidated Parent entity2009 $’000
2008 $’000
2009 $’000
2008 $’000
Current receivables Tax funding agreement - wholly owned tax consolidated entities – – 126,475 78,689 Loans to wholly owned subsidiaries – – 625,852 526,128 Total amounts receivable from wholly owned subsidiaries – – 752,327 604,817 Loans to Joint Venture entities 7,475 2,875 – –Current payables Loans from related entities 2,541 2,032 – –
For
per
sona
l use
onl
y

90 | Tatts Group Limited Annual Report 2009
Note 32 Related party transactions (continued)
(f) Reconciliation of loans to/from related partiesConsolidated Parent entity2009 $’000
2008 $’000
2009 $’000
2008 $’000
Loans to controlled entities: Beginning of year – – 526,128 230,467 Loans advanced – – 567,200 627,155 Loan repayments received – – (498,361) (326,146) Interest charged – – 30,885 5,648 Interest received – – – (10,996) End of year – – 625,852 526,128Loans to joint venture entities: Beginning of year 2,875 – – – Loans advanced 4,600 2,875 – – End of year 7,475 2,875 – –Loans from related entities: Beginning of year 2,032 418 – – Loans advanced 102 1,916 – – Exchange movements 407 (302) – – End of year 2,541 2,032 – –
No provisions for doubtful debts have been raised in relation to any outstanding balances, and no expense has been recognised in respect of bad or doubtful debts from related parties.
(g) Terms and conditionsTransactions relating to dividends were on the same terms and conditions that applied to other shareholders.
All other transactions were made on normal commercial terms and conditions and at market rates, except that there are no fixed terms for the repayment of principal on loans advanced by the Company. The average interest rate on loans during the year was 5.23% (2008: 6.75%).
Outstanding balances are unsecured and are repayable in cash.
Note 33 Business combinations
(a) Current year(i) Winners Amusements Limited
Summary of acquisitionOn 2 October 2008, Talarius Limited, a wholly owned subsidiary of the Group, acquired 100% of Winners Amusements Limited and its controlled entity. The acquired entities’ principal activities at the date of acquisition were the operation of gaming venues in the United Kingdom. Details of the preliminary fair value assessment of the assets and liabilities acquired and goodwill are as follows:
$’000Purchase consideration Cash 5,740 Repayment of debt 4,198Total purchase consideration 9,938Direct costs relating to the acquisition 378Add fair value of net identifiable liabilities acquired 833Goodwill 11,149
The goodwill is attributable to the expected future cashflows of the business with the expansion of gaming venues in the United Kingdom and the synergies expected to be achieved as a result of the full integration of the business into the European Gaming Group.
Notes to the Financial Statements for the year ended 30 June 2009 (continued)
For
per
sona
l use
onl
y

91
www.tattsgroup.com
Note 33 Business combinations (continued)Assets and liabilities acquired at 2 October 2008
Acquiree’s carrying amount
Preliminary Fair Value
$’000 $’000Cash 329 329Trade receivables 390 334Property, plant and equipment 1,998 546Intangible assets – software 1,959 –Deferred tax asset 30 30Trade and other payables (1,004) (1,004)Interest bearing liabilities (4,198) –Provision for dilapidations – (962)Employee provisions – (106)Net liabilities (496) (833)
The acquired business contributed revenues of $4,242,000 and a net profit of $494,000 to the Group for the period from 2 October to 30 June 2009. If the acquisition had occurred on 1 July 2008, consolidated revenue and consolidated profit for the year ended 30 June 2009 would have been $3,251,808,000 and $277,482,000 respectively.
(ii) CentreRacing
Summary of acquisitionOn 1 December 2008, NT TAB Pty Ltd, a wholly owned subsidiary of the Group, acquired the business of CentreRacing and the software of Wagering and Gaming Software Pty Ltd. The acquired business’s principal activities at the date of acquisition were the operation of internet and telephone wagering services for domestic and international racing activities. Details of the preliminary fair value assessment of the assets and liabilities acquired and goodwill are as follows:
$’000Purchase consideration Cash 3,121Total purchase consideration 3,121Direct costs relating to the acquisition 199Less fair value of net identifiable assets acquired (99)Goodwill 3,221
The goodwill is attributable to the expected future cashflows of the business. This goodwill has been allocated to the Wagering segment in Note 17.
Assets and liabilities acquired at 1 December 2008
Acquiree’s carrying amount
Preliminary Fair Value
$’000 $’000Trade receivables 8 8Property, plant and equipment 56 56Intangible assets – software 405 934Deferred tax asset 14 14Trade and other payables (865) (865)Employee provisions (48) (48)Net assets (liabilities) (430) 99
The acquired business contributed revenues of $370,000 and a net loss of $619,000 to the Group for the period from 1 December to 30 June 2009. If the acquisition had occurred on 1 July 2008, consolidated revenue and consolidated profit for the year ended 30 June 2009 would have been $3,251,239,000 and $277,180,000 respectively.F
or p
erso
nal u
se o
nly

92 | Tatts Group Limited Annual Report 2009
Note 33 Business combinations (continued)(iii) National Leisure Limited
Summary of acquisitionOn 9 June 2009, Talarius Limited acquired 100% of National Leisure Limited together with the assets of two further gaming venues operated by that entity. The acquired entity’s principal activity at the date of acquisition was the operation of gaming venues in the United Kingdom. Details of the preliminary fair value assessment of the assets and liabilities acquired and goodwill are as follows:
$’000Purchase consideration Cash 27,166Total purchase consideration 27,166Direct costs relating to the acquisition 509Less fair value of net identifiable assets acquired (787)Goodwill 26,888
The goodwill is attributable to the expected future cashflows of the business with the expansion of gaming venues in the United Kingdom and the synergies expected to be achieved as a result of the full integration of the business into the European Gaming Group.
Assets and liabilities acquired at 9 June 2009
Acquiree’s carrying amount
Preliminary Fair Value
$’000 $’000Cash 5,374 5,374Trade receivables 56 56Inventory 95 95Property, plant and equipment 4,074 2,632Deferred tax asset 162 162Trade and other payables (3,844) (3,844)Provision for dilapidations – (3,362)Employee provisions – (326)Net assets 5,917 787
The acquired business contributed revenues and net profit of $nil to the Group for the period from 9 June to 30 June 2009. If the acquisition had occurred on 1 July 2008, consolidated revenue and consolidated profit for the year ended 30 June 2009 would have been $3,263,000,000 and $280,074,000 respectively.
(b) Previous corresponding yearSummary of acquisitionThe Group established a joint venture group of companies with Macquarie Investments Pty Ltd that on 1 February 2007, pursuant to a shareholder and court approved Scheme of Arrangement, acquired 100% of the shares of Talarius Limited, a UK based gaming company. Around that date the Group contributed GBP 46,850,000 in equity for its interest in the European Gaming Group of companies, which with other equity and non-recourse debt in the European Gaming Group, was used to fund the acquisition of Talarius Limited.
On 3 January 2008, Tatts Group Limited completed the acquisition of Macquarie Investments Pty Ltd’s 50% share of the European Gaming Group for GBP 28,000,000, resulting in Tatts Group Limited now owning 100% of the European Gaming Group.
Details of the preliminary fair values of the assets and liabilities acquired and the goodwill arising are disclosed in the 30 June 2008 financial statements. Upon finalisation of the fair value of the assets and liabilities, net liabilities acquired have decreased by $271,000 from $89,256,000 to $88,985,000. As a result of the finalisation of the fair values of the net assets and liabilities and the acquisition accounting, there has been no change to goodwill, however there has been a reallocation from the foreign currency translation reserve to retained earnings. This related to the treatment of the derivative financial liability acquired, which was subsequently realised during the current financial year.
For the period from 1 February 2007 to 3 January 2008 the Group’s 50% share of the European Gaming Group has been equity accounted. The operating results and assets and liabilities of the European Gaming Group are consolidated from 4 January 2008.
If the 100% acquisition of European Gaming Group had occurred on 1 July 2007, consolidated revenue and consolidated profit for the year ended 30 June 2008 would have been $3,146,966,000 and $250,371,000 respectively.
Notes to the Financial Statements for the year ended 30 June 2009 (continued)
For
per
sona
l use
onl
y

93
www.tattsgroup.com
Note 34 Investments in controlled entities
Name of entityCountry of
incorporation
Equity holding 2009
%
Equity holding 2008
%Controlled entities of Tatts Group Limited (formerly Tattersall’s Limited):UNiTAB Limited* Australia 100 100 NT TAB Pty Ltd* Australia 100 100 Broadcasting Station 4IP Pty Ltd Australia 100 100 SA TAB Pty Ltd* Australia 100 100 TAB Queensland Pty Ltd Australia 100 100Maxgaming Holdings Pty Ltd*(1) Australia 100 100 Maxgaming NSW Pty Ltd* Australia 100 100 Maxgaming QLD Pty Ltd* Australia 100 100 Maxgaming Vic Pty Ltd(2) Australia 100 –Bytecraft Systems Pty Ltd* Australia (3) (3)
Bytecraft Systems NSW Pty Ltd Australia 100 100 Bytecraft Systems (NZ) Limited New Zealand 100 100 EGM Tech Pty Ltd Australia 100 100Reaftin Pty Ltd* Australia 100 100 Bytecraft Systems Pty Ltd* Australia (3) (3)
Tattersall’s Holdings Pty Ltd* Australia 100 100 Tattersall’s Sweeps Pty Ltd* Australia 100 100 Tattersall’s Gaming Pty Ltd* Australia 100 100 Tattersall’s Club Keno Pty Ltd Australia 100 100 Footy Consortium Pty Ltd Australia – (4)
tatts.com Pty Ltd Australia 100 100 Tattersall’s Gaming Systems Pty Ltd Australia 100 100 George Adams Pty Ltd Australia 100 100 Tattersall’s Australia Pty Ltd Australia 100 100 TattsNet Limited United Kingdom 100 100 George Adams Holdings Limited United Kingdom 100 100 tatts.com UK Limited United Kingdom 100 100 Golden Casket Lottery Corporation Limited* Australia 100 100 Interactive Gold Pty Ltd Australia – (4)
Tattersall’s Investments (South Africa) (Pty) Limited South Africa 100 100 Wintech Investments Pty Ltd* Australia 100 100 Tattersall’s Gaming Systems NSW Pty Ltd Australia 100 100 Carentan Investments (Pty) Limited South Africa 100 100 Thuo Gaming South Africa (Pty) Limited South Africa 90 90 Thuo Gaming Western Cape (Pty) Limited South Africa 70 70 Thuo Gaming KwaZulu-Natal (Pty) Limited South Africa 70 70 Thuo Gaming North West (Pty) Limited South Africa 100 100 Thuo Gaming Mpumalanga (Pty) Limited(5) South Africa 100 100 Thuo Gaming Gauteng (Pty) Limited South Africa 100 100 Thuo Gaming Free State (Pty) Limited South Africa 100 100Victorian Licence Bid Co Pty Ltd(2) Australia 100 –European Investments (Guernsey) Limited(6) Guernsey – 100 European Investments Holdings (Guernsey) Limited(6) Guernsey – 100 European Gaming (Luxembourg) S.a.r.l.(6) Luxembourg – 100
For
per
sona
l use
onl
y

94 | Tatts Group Limited Annual Report 2009
Name of entityCountry of
incorporation
Equity holding 2009
%
Equity holding 2008
%European Gaming (Finance) Limited United Kingdom 100 100 European Gaming Limited United Kingdom 100 100 Talarius Limited United Kingdom 100 100 Edinburgh Dungeon Limited United Kingdom 100 100 In-To-Save Limited United Kingdom 100 100 Blackheath Leisure (Carousel) Limited United Kingdom 100 100 RAL Services Limited United Kingdom 100 100 RAL Limited United Kingdom 100 100 RAL Machines Limited United Kingdom 100 100 RAL (S&G) Limited Alderney 100 100 RAL (Channel Islands) Limited United Kingdom 100 100 RAL Holdings Limited United Kingdom 100 100 RAL Employee Benefit Trustees Limited United Kingdom 100 100 RAL Investments Limited United Kingdom 100 100 RAL Interactive Limited United Kingdom 100 100 CZ Trading Limited United Kingdom 100 100 Cyberslotz Services SRL Romania 100 100 CZ Holdings Limited Malta 100 100 Cyberslotz Services Malta Limited Malta 100 100 CZ Back Office Limited Malta 100 100 CZ Trading Limited Malta 100 100 Leisure Promotions Limited United Kingdom 100 100 Leisurama Holdings Limited United Kingdom 100 100 Leisurama Entertainment Limited United Kingdom 100 100 Displaymatics Holdings Limited United Kingdom 100 100 Winners Amusements Limited United Kingdom 100 – Palma Leisure Limited United Kingdom 100 – National Leisure Limited United Kingdom 100 –Tattersall’s Long Service Leave Fund Australia (7) (7)
Tattersall’s Foundation Limited Australia (8) (8)
On 30 November 2007 Tattersall’s Limited changed its registered company name to Tatts Group Limited.
Share holdings in all controlled entities are classed as ordinary.
(*) These subsidiaries have been granted relief from the necessity to prepare financial reports in accordance with Class Order 98/1418 issued by the Australian Securities and Investments Commission. Refer to Note 35 for further information.
(1) On 1 May 2009 ownership of Maxgaming Holdings Pty Ltd was transferred from UNiTAB Limited to Tatts Group Limited.
(2) Entities incorporated during the current financial year.
(3) Owned 50% by Tatts Group Limited and 50% by Reaftin Pty Ltd. 100% equity holding within the Group.
(4) These entities applied for and during the current financial year obtained voluntary deregistration.
(5) On 2 June 2008 Thuo Gaming Limpopo (Pty) Limited changed its name to Thuo Gaming Mpumalanga (Pty) Limited.
(6) During the year these companies were liquidated, and the shares held by Tatts Group Limited in European Investments (Guernsey) Limited transferred to European Gaming (Finance) Limited.
(7) Not incorporated. The trustees of the entity are employees of Tatts Group Limited, therefore in accordance with AIFRS, the Group controls the Fund and the Fund is consolidated.
(8) Not incorporated. The majority of the Directors of the trustee company Tattersall’s Foundation Limited are Directors of Tatts Group Limited, therefore in accordance with AIFRS the Group controls the Foundation and the company is consolidated.
Note 34 Investments in controlled entities (continued)
Notes to the Financial Statements for the year ended 30 June 2009 (continued)
For
per
sona
l use
onl
y

95
www.tattsgroup.com
Note 35 Deed of Cross Guarantee Tatts Group Limited, Tattersall’s Holdings Pty Ltd, Tattersall’s Gaming Pty Ltd, Tattersall’s Sweeps Pty Ltd, Reaftin Pty Ltd, Wintech Investments Pty Ltd, Bytecraft Systems Pty Ltd, UNiTAB Limited, SA TAB Pty Ltd, NT TAB Pty Ltd, Maxgaming Holdings Pty Ltd, Maxgaming NSW Pty Ltd, Maxgaming Qld Pty Ltd and Golden Casket Lottery Corporation Limited are parties to a Deed of Cross Guarantee (Deed) dated I May 2009 under which each company guarantees the debts of the others in the event of the winding up of any of those companies in the circumstances contained in the Deed. This Deed supersedes the previous Deed dated 25 June 2007 which granted relief pursuant to an Individual Order dated 18 June 2007 issued by the Australian Securities and Investments Commission (ASIC), which ceased to apply for the financial year ended 30 June 2009.
By entering into the current Deed, the wholly owned entities have been relieved under ASIC Class Order 98/1418 from certain requirements including preparing and lodging a financial report and Directors’ report.
(a) Consolidated income statement and a summary of movements in consolidated retained profitsThe above parties represent a ‘Closed Group’ for the purposes of the Class Order and they also represent the ‘Extended Closed Group’. Set out below is a condensed income statement and a summary of movements in consolidated retained profits of the Closed Group consisting of the companies listed above.
2009 $’000
2008 $’000
Condensed Income statementProfit from continuing operations before income tax 415,299 362,714Income tax expense (121,898) (108,013)Profit from continuing operations after income tax 293,401 254,701Loss from discontinuing operations – (3,972)Profit for the year 293,401 250,729
Movement in retained profitsBalance at 1 July 227,317 281,812 Net profit for the year 293,401 250,729 Dividends (Note 27) (259,404) (297,359) Transfer of retained earnings from entities outside the closed group 798 – Actuarial losses on retirement benefit asset, net of tax – (3,411) Reversal of retained earnings previously recognised as part of the closed group – (4,454)Balance 30 June 262,112 227,317
For
per
sona
l use
onl
y

96 | Tatts Group Limited Annual Report 2009
Note 35 Deed of Cross Guarantee (continued)
(b) Balance SheetSet out below is a consolidated balance sheet of the Closed Group consisting of the companies listed above.
2009 $’000
2008 $’000
ASSETSCurrent assetsCash and cash equivalents 338,524 214,128Trade and other receivables 200,323 105,959Inventories 6,554 7,659Total current assets 545,401 327,746Non-current assetsTrade and other receivables 7,652 3,381Financial assets 301,126 170,147Property, plant and equipment 234,945 272,760Intangible assets 2,970,835 2,965,618Deferred tax assets 28,871 37,220Other non-current assets 1,505 506Total non-current assets 3,544,934 3,449,632Total assets 4,090,335 3,777,378LIABILITIESCurrent liabilitiesTrade and other payables 454,200 310,632Interest bearing liabilities 3,473 230,127Derivative financial instruments 594 –Current tax liabilities 26,532 17,462Provisions 10,130 7,106Total current liabilities 494,929 565,327Non-current liabilitiesTrade and other payables 43,484 48,466Interest bearing liabilities 750,890 434,694Derivative financial instruments 8,733 –Provisions 1,741 3,592Deferred tax liabilities 177,106 184,129Total non-current liabilities 981,954 670,881Total liabilities 1,476,883 1,236,208Net assets 2,613,452 2,541,170EQUITYContributed equity 2,333,193 2,321,081Reserves 18,147 (7,228)Retained profits 262,112 227,317Total equity 2,613,452 2,541,170
Notes to the Financial Statements for the year ended 30 June 2009 (continued)
For
per
sona
l use
onl
y
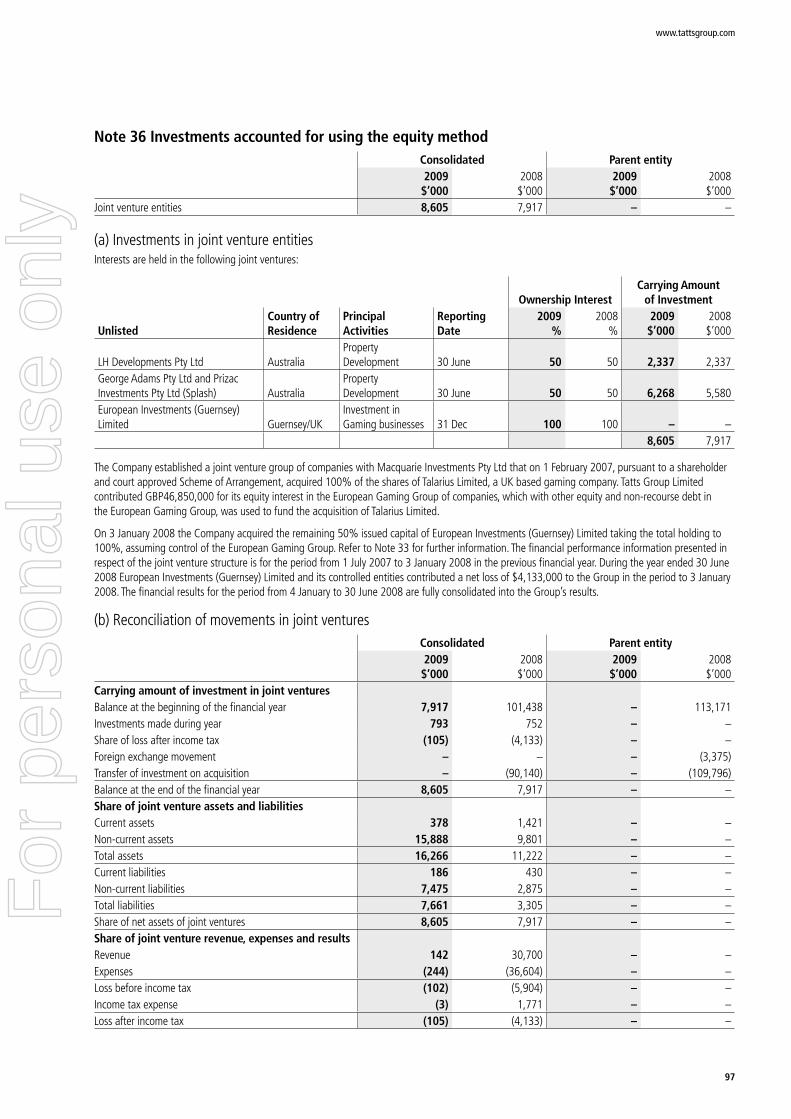
97
www.tattsgroup.com
Note 36 Investments accounted for using the equity methodConsolidated Parent entity2009 $’000
2008 $’000
2009 $’000
2008 $’000
Joint venture entities 8,605 7,917 – –
(a) Investments in joint venture entitiesInterests are held in the following joint ventures:
Ownership InterestCarrying Amount
of Investment
UnlistedCountry of Residence
Principal Activities
Reporting Date
2009%
2008%
2009$’000
2008$’000
LH Developments Pty Ltd AustraliaProperty Development 30 June 50 50 2,337 2,337
George Adams Pty Ltd and Prizac Investments Pty Ltd (Splash) Australia
Property Development 30 June 50 50 6,268 5,580
European Investments (Guernsey) Limited Guernsey/UK
Investment in Gaming businesses 31 Dec 100 100 – –
8,605 7,917
The Company established a joint venture group of companies with Macquarie Investments Pty Ltd that on 1 February 2007, pursuant to a shareholder and court approved Scheme of Arrangement, acquired 100% of the shares of Talarius Limited, a UK based gaming company. Tatts Group Limited contributed GBP46,850,000 for its equity interest in the European Gaming Group of companies, which with other equity and non-recourse debt in the European Gaming Group, was used to fund the acquisition of Talarius Limited.
On 3 January 2008 the Company acquired the remaining 50% issued capital of European Investments (Guernsey) Limited taking the total holding to 100%, assuming control of the European Gaming Group. Refer to Note 33 for further information. The financial performance information presented in respect of the joint venture structure is for the period from 1 July 2007 to 3 January 2008 in the previous financial year. During the year ended 30 June 2008 European Investments (Guernsey) Limited and its controlled entities contributed a net loss of $4,133,000 to the Group in the period to 3 January 2008. The financial results for the period from 4 January to 30 June 2008 are fully consolidated into the Group’s results.
(b) Reconciliation of movements in joint venturesConsolidated Parent entity2009 $’000
2008 $’000
2009 $’000
2008 $’000
Carrying amount of investment in joint venturesBalance at the beginning of the financial year 7,917 101,438 – 113,171Investments made during year 793 752 – –Share of loss after income tax (105) (4,133) – –Foreign exchange movement – – – (3,375)Transfer of investment on acquisition – (90,140) – (109,796)Balance at the end of the financial year 8,605 7,917 – –Share of joint venture assets and liabilitiesCurrent assets 378 1,421 – –Non-current assets 15,888 9,801 – –Total assets 16,266 11,222 – –Current liabilities 186 430 – –Non-current liabilities 7,475 2,875 – –Total liabilities 7,661 3,305 – –Share of net assets of joint ventures 8,605 7,917 – –Share of joint venture revenue, expenses and resultsRevenue 142 30,700 – –Expenses (244) (36,604) – –Loss before income tax (102) (5,904) – –Income tax expense (3) 1,771 – –Loss after income tax (105) (4,133) – –
For
per
sona
l use
onl
y

98 | Tatts Group Limited Annual Report 2009
Note 36 Investments accounted for using the equity method (continued)
(c) Contingent liabilities and commitments relating to joint venturesEach party to the joint venture is jointly and severally liable for the debts of the entity. The assets of the entities exceed their debts. At 30 June 2009 contingent liabilities are $nil (2008: $nil). The share of capital commitments which have not been recognised as a liability at 30 June 2009 are $12,498,000 (2008: $nil).
Note 37 Reconciliation of profit from ordinary activities after income tax to net cash inflow from operating activities
Consolidated Parent entity2009 $’000
2008 $’000
2009 $’000
2008 $’000
Profit/(loss) for the year 278,048 258,037 401,241 (681,139)Non cash flows in operating profit Depreciation and amortisation 104,745 98,739 46 100 Amortisation of borrowing costs 2,174 (121) 2,174 162 Loss/(profit) on sale of fixed assets 993 (3,549) – (88) Impairment of assets 4,857 – – 775,910 Employee share options 1,865 1,350 1,865 1,350 Bad and doubtful debts 440 341 – 120 Dividend revenue – – (420,751) (25,000) Interest revenue – – (30,885) – Dividends/distributions reinvested (1,715) (1,266) – – Gain on realisation of interest rate swap (2,366) – – – Share of joint venture loss 105 4,133 – – Foreign exchange gain on liquidation of investment in related parties (251) – – –Change in operating assets and liabilities, net of effects from purchase of controlled entities (Increase)/decrease in trade and other receivables (85,975) 10,461 (2,864) – Decrease/(increase) in inventories 1,603 (815) – – Decrease/(increase) in deferred tax assets 5,500 (9,543) 2,627 3,044 Decrease/(increase) in other operating assets 1,489 26,026 (280) (30) Increase in trade and other payables 144,414 979 2,122 – Increase in other operating liabilities 439 8,898 – 1,107 Increase/(decrease) in provision for current tax liabilities 3,478 (28,873) 3,970 (18,202) Increase/(decrease) in deferred tax liabilities (5,293) 22,539 773 761 Increase/(decrease) in other provisions (1,291) 15 113 285Net cash inflow/(outflow) from operating activities 453,259 387,351 (39,849) 58,380
Non-cash financing activitiesDividends satisfied by the issue of shares under a dividend reinvestment plan are shown in Note 25(b). Options and rights issued to employees under the Group’s long term incentive plan are shown in Note 39.
Notes to the Financial Statements for the year ended 30 June 2009 (continued)
For
per
sona
l use
onl
y

99
www.tattsgroup.com
Note 38 Earnings per share
Consolidated2009 Cents
2008 Cents
(a) Basic earnings per shareFrom continuing operations attributable to the ordinary equity shareholders of the Company 21.9 20.3From discontinued operations – 0.1Total basic earnings per share attributable to the ordinary equity shareholders of the Company 21.9 20.4
(b) Diluted earnings per shareFrom continuing operations attributable to the ordinary equity shareholders of the Company 21.9 20.3From discontinued operations – 0.1Profit attributable to the ordinary equity shareholders of the Company 21.9 20.4
Consolidated2009 $’000
2008 $’000
(c) Reconciliation of earnings used in calculating earnings per share:Basic and diluted earnings per share Profit from continuing operations 278,048 256,840 Profit from continuing operations attributable to minority interests (607) (451) Profit from continuing operations attributable to the ordinary equity shareholders of the Company used in calculating basic and diluted earnings per share 277,441 256,389 Profit from discontinued operations – 1,197 Profit attributable to the ordinary equity shareholders of the Company used in calculating basic and diluted earnings per share 277,441 257,586
2009 Number
2008 Number
(d) Weighted average number of shares used as the denominatorWeighted average number of ordinary shares used as the denominator in calculating basic earnings per share 1,266,497,384 1,265,355,056Adjustments for calculation of diluted earnings per share: Performance options and performance rights 385,539 688,723Weighted average number of ordinary shares and potential ordinary shares used as the denominator in calculating diluted earnings per share 1,266,882,923 1,266,043,779
For
per
sona
l use
onl
y
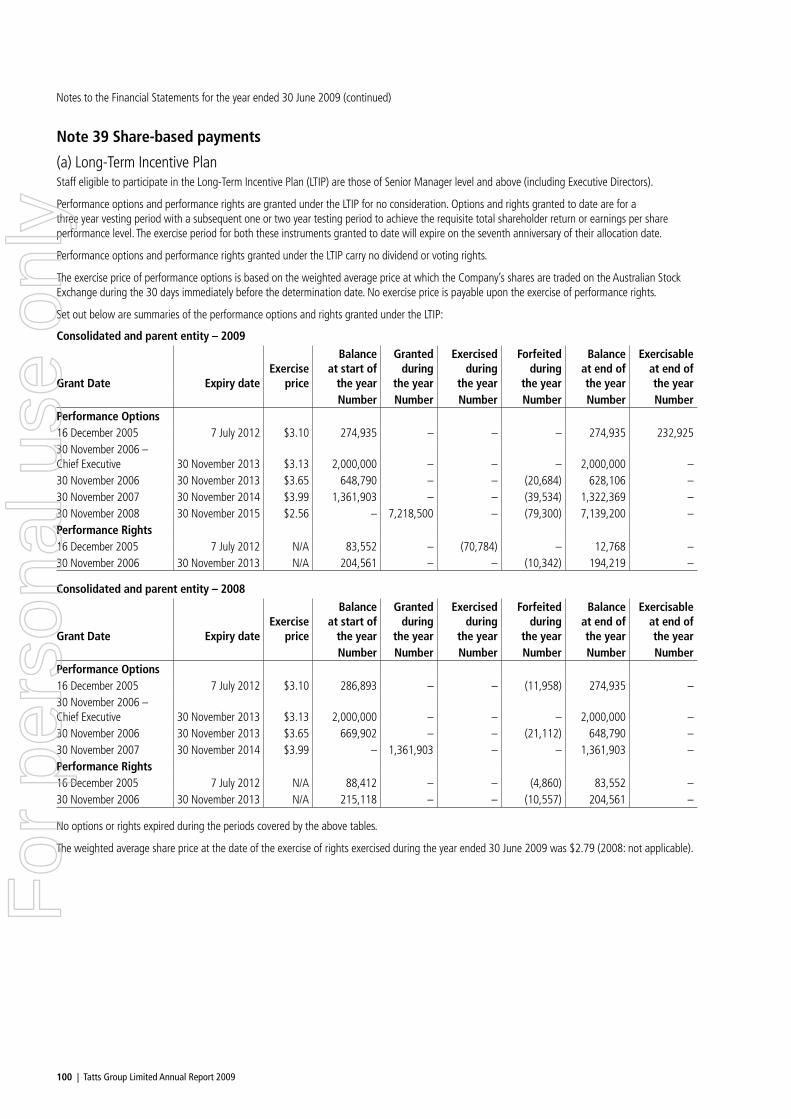
100 | Tatts Group Limited Annual Report 2009
Note 39 Share-based payments
(a) Long-Term Incentive PlanStaff eligible to participate in the Long-Term Incentive Plan (LTIP) are those of Senior Manager level and above (including Executive Directors).
Performance options and performance rights are granted under the LTIP for no consideration. Options and rights granted to date are for a three year vesting period with a subsequent one or two year testing period to achieve the requisite total shareholder return or earnings per share performance level. The exercise period for both these instruments granted to date will expire on the seventh anniversary of their allocation date.
Performance options and performance rights granted under the LTIP carry no dividend or voting rights.
The exercise price of performance options is based on the weighted average price at which the Company’s shares are traded on the Australian Stock Exchange during the 30 days immediately before the determination date. No exercise price is payable upon the exercise of performance rights.
Set out below are summaries of the performance options and rights granted under the LTIP:
Consolidated and parent entity – 2009
Grant Date Expiry dateExercise
price
Balance at start of
the year
Granted during
the year
Exercised during
the year
Forfeited during
the year
Balance at end of the year
Exercisable at end of the year
Number Number Number Number Number NumberPerformance Options16 December 2005 7 July 2012 $3.10 274,935 – – – 274,935 232,92530 November 2006 – Chief Executive 30 November 2013 $3.13 2,000,000 – – – 2,000,000 –30 November 2006 30 November 2013 $3.65 648,790 – – (20,684) 628,106 –30 November 2007 30 November 2014 $3.99 1,361,903 – – (39,534) 1,322,369 –30 November 2008 30 November 2015 $2.56 – 7,218,500 – (79,300) 7,139,200 –Performance Rights16 December 2005 7 July 2012 N/A 83,552 – (70,784) – 12,768 –30 November 2006 30 November 2013 N/A 204,561 – – (10,342) 194,219 –
Consolidated and parent entity – 2008
Grant Date Expiry dateExercise
price
Balance at start of
the year
Granted during
the year
Exercised during
the year
Forfeited during
the year
Balance at end of the year
Exercisable at end of the year
Number Number Number Number Number NumberPerformance Options16 December 2005 7 July 2012 $3.10 286,893 – – (11,958) 274,935 –30 November 2006 – Chief Executive 30 November 2013 $3.13 2,000,000 – – – 2,000,000 –30 November 2006 30 November 2013 $3.65 669,902 – – (21,112) 648,790 –30 November 2007 30 November 2014 $3.99 – 1,361,903 – – 1,361,903 –Performance Rights16 December 2005 7 July 2012 N/A 88,412 – – (4,860) 83,552 –30 November 2006 30 November 2013 N/A 215,118 – – (10,557) 204,561 –
No options or rights expired during the periods covered by the above tables.
The weighted average share price at the date of the exercise of rights exercised during the year ended 30 June 2009 was $2.79 (2008: not applicable).
Notes to the Financial Statements for the year ended 30 June 2009 (continued)
For
per
sona
l use
onl
y

101
www.tattsgroup.com
Note 39 Share-based payments (continued)Fair value of options and rights grantedThe model inputs for options granted during the year ended 30 June 2009 included:
Performance Options
Performance Options
Performance conditionsTSR –
Market basedEPS –
Non-market basedGrant date 30 November 2008 30 November 2008Exercise price $2.56 $2.56Expiry date 30 November 2015 30 November 2015Share price at grant date $2.52 $2.52Expected life 5.1 years 5.0 yearsVesting period 3 year 3 yearVolatility 29% 29%Risk free interest rate 4.01% 4.01%Dividend yield 8.9% 8.9%Fair value $0.31 $0.33
The model inputs for options granted during the year ended 30 June 2008 included:
Performance Options
Grant date 30 November 2007Exercise price $3.99Expiry date 30 November 2014Share price at grant date $4.00Expected life 7 yearsVesting period 3 yearVolatility 28%Risk free interest rate 6.32%Employee exit rate 5%Exercise multiple 3.0Fair value $1.02
(b) Expenses arising from share-based payment transactionsTotal expenses arising from share-based payment transactions recognised during the period as part of employee benefit expense were as follows:
Consolidated Parent entity2009 $’000
2008 $’000
2009 $’000
2008 $’000
Performance rights issued under LTIP 170 198 170 198Performance options issued under LTIP 1,695 1,152 1,695 1,152
1,865 1,350 1,865 1,350
Note 40 Events occurring after reporting dateIn the opinion of the Directors, there have been no material matters or circumstances which have arisen between 30 June 2009 and the date of this report that have significantly affected or may significantly affect the operations of the Group, the results of those operations and the state of affairs of the Group in subsequent financial periods.F
or p
erso
nal u
se o
nly

102 | Tatts Group Limited Annual Report 2009
In the Directors’ opinion:
(a) the financial statements and notes set out on pages 39 to 101 are in accordance with the Corporations Act 2001, including:
(i) complying with Accounting Standards, the Corporations Regulations 2001 and other mandatory professional reporting requirements; and
(ii) giving a true and fair view of the Company’s and consolidated entity’s financial position as at 30 June 2009 and of their performance for the financial year ended on that date; and
(b) there are reasonable grounds to believe that the Company will be able to pay its debts as and when they become due and payable; and
(c) at the date of this declaration, there are reasonable grounds to believe that the members of the Closed Group identified in Note 35 will be able to meet any obligations or liabilities to which they are, or may become, subject by virtue of the deed of cross guarantee described in Note 35.
The Directors have been given the declarations by the Chief Executive and Chief Financial Officer required by section 295A of the Corporations Act 2001.
This declaration is made in accordance with a resolution of the Directors.
Harry Boon Dick McIlwain Chairman Managing Director/Chief Executive
Melbourne 27 August 2009
Directors’ Declaration
For
per
sona
l use
onl
y

103
www.tattsgroup.com
Report on the financial reportWe have audited the accompanying financial report of Tatts Group Limited (the company), which comprises the balance sheet as at 30 June 2009, and the income statement, statement of recognised income and expense and cash flow statement for the year ended on that date, a summary of significant accounting policies, other explanatory notes and the directors’ declaration for both Tatts Group Limited and the Tatts Group Limited Group (the consolidated entity). The consolidated entity comprises the company and the entities it controlled at the year’s end or from time to time during the financial year.
Directors’ responsibility for the financial reportThe directors of the company are responsible for the preparation and fair presentation of the financial report in accordance with Australian Accounting Standards (including the Australian Accounting Interpretations) and the Corporations Act 2001. This responsibility includes establishing and maintaining internal controls relevant to the preparation and fair presentation of the financial report that is free from material misstatement, whether due to fraud or error; selecting and applying appropriate accounting policies; and making accounting estimates that are reasonable in the circumstances. In Note 1, the directors also state, in accordance with Accounting Standard AASB 101 Presentation of Financial Statements, that compliance with the Australian equivalents to International Financial Reporting Standards ensures that the financial report, comprising the financial statements and notes, complies with International Financial Reporting Standards.
Auditor’s responsibilityOur responsibility is to express an opinion on the financial report based on our audit. We conducted our audit in accordance with Australian Auditing Standards. These Auditing Standards require that we comply with relevant ethical requirements relating to audit engagements and plan and perform the audit to obtain reasonable assurance whether the financial report is free from material misstatement.
An audit involves performing procedures to obtain audit evidence about the amounts and disclosures in the financial report. The procedures selected depend on the auditor’s judgement, including the assessment of the risks of material misstatement of the financial report, whether due to fraud or error. In making those risk assessments, the auditor considers internal control relevant to the entity’s preparation and fair presentation of the financial report in order to design audit procedures that are appropriate in the circumstances, but not for the purpose of expressing an opinion on the effectiveness of the entity’s internal control. An audit also includes evaluating the appropriateness of accounting policies used and the reasonableness of accounting estimates made by the directors, as well as evaluating the overall presentation of the financial report.
Our procedures include reading the other information in the Annual Report to determine whether it contains any material inconsistencies with the financial report.
Our audit did not involve an analysis of the prudence of business decisions made by directors or management.
Independent Auditor’s ReportTo the members of Tatts Group Limited
PricewaterhouseCoopers ABN 52 780 433 757
Freshwater Place 2 Southbank Boulevard SOUTHBANK VIC 3006 GPO Box 1331 MELBOURNE VIC 3001 DX 77 Telephone 61 3 8603 1000 Facsimile 61 3 8603 1999
Liability limited by a scheme approved under Professional Standards Legislation
For
per
sona
l use
onl
y
104 | Tatts Group Limited Annual Report 2009
Independent Auditor’s Report To the members of Tatts Group Limited (continued)
We believe that the audit evidence we have obtained is sufficient and appropriate to provide a basis for our audit opinions.
IndependenceIn conducting our audit, we have complied with the independence requirements of the Corporations Act 2001.
Auditor’s opinionIn our opinion:
(a) the financial report of Tatts Group Limited is in accordance with the Corporations Act 2001, including:
(i) giving a true and fair view of the company’s and consolidated entity’s financial position as at 30 June 2009 and of their performance for the year ended on that date; and
(ii) complying with Australian Accounting Standards (including the Australian Accounting Interpretations) and the Corporations Regulations 2001; and
(b) the consolidated financial statements and notes also comply with International Financial Reporting Standards as disclosed in Note 1.
Report on the Remuneration ReportWe have audited the Remuneration Report included in pages 24 to 35 of the directors’ report for the year ended 30 June 2009. The directors of the company are responsible for the preparation and presentation of the Remuneration Report in accordance with section 300A of the Corporations Act 2001. Our responsibility is to express an opinion on the Remuneration Report, based on our audit conducted in accordance with Australian Auditing Standards.
Auditor’s opinionIn our opinion, the Remuneration Report of Tatts Group Limited for the year ended 30 June 2009, complies with section 300A of the Corporations Act 2001.
PricewaterhouseCoopers
Con Grapsas Partner
Melbourne 27 August 2009
Independent auditor’s report to the members ofTatts Group Limited (continued)
90
We believe that the audit evidence we have obtained is sufficient and appropriate to provide abasis for our audit opinions.
Independence
In conducting our audit, we have complied with the independence requirements of the CorporationsAct 2001.
Auditor’s opinion
In our opinion:
(a) the financial report of Tatts Group Limited is in accordance with the Corporations Act 2001,including:
(i) giving a true and fair view of the company’s and consolidated entity’s financialposition as at 30 June 2009 and of their performance for the year ended on thatdate; and
(ii) complying with Australian Accounting Standards (including the AustralianAccounting Interpretations) and the Corporations Regulations 2001; and
(b) the consolidated financial statements and notes also comply with International FinancialReporting Standards as disclosed in Note 1.
Report on the Remuneration Report
We have audited the Remuneration Report included in pages 8 to 19 of the directors’ report for theyear ended 30 June 2009. The directors of the company are responsible for the preparation andpresentation of the Remuneration Report in accordance with section 300A of the Corporations Act2001. Our responsibility is to express an opinion on the Remuneration Report, based on our auditconducted in accordance with Australian Auditing Standards.
Auditor’s opinion
In our opinion, the Remuneration Report of Tatts Group Limited for the year ended 30 June 2009,complies with section 300A of the Corporations Act 2001.
PricewaterhouseCoopers
Con Grapsas MelbournePartner 27 August 2009
For
per
sona
l use
onl
y

105
www.tattsgroup.com
Shareholder InformationThe shareholder information set out below was applicable as at 7 September 2009 based on the details recorded on the Tatts Group Limited share register.
A Distribution of shareholdersAnalysis of number of ordinary shareholders by size of holding:
Ordinary sharesRange Number
of HoldersNumber of
shares Held 1 – 1,000 15,653 9,060,8331,001 – 5,000 58,867 149,062,8675,001 – 10,000 8,797 66,551,03310,001 – 100,000 6,949 157,031,551100,001 and over 455 888,364,477Total 90,721 1,270,070,761
There were 1,319 holders of less than a marketable parcel of ordinary shares.
B Twenty largest shareholdersThe names of the twenty largest quoted equity security holders as they appeared on the Tatts Group Limited share register are listed below:
Ordinary sharesName Number
of SharesPercentage of issued shares
JP Morgan Nominees Australia Limited 195,604,610 15.40%HSBC Custody Nominees (Australia) Limited 142,167,897 11.19%National Nominees Limited 102,063,121 8.04%UBS Wealth Management Australia Nominees Pty Ltd 30,003,137 2.36%Citicorp Nominees Pty Limited 25,075,702 1.97%ANZ Nominees Limited <Cash Income a/c> 19,021,653 1.50%Tassyd Pty Ltd <Estate Thomas Lyons a/c> 18,834,719 1.48%Cogent Nominees Pty Limited 18,520,033 1.46%Australian Reward Investment Alliance 11,925,075 0.94%Queensland Investment Corporation 11,771,383 0.93%AMP Life Limited 11,717,431 0.92%Robin Edward Davey <Estate Alexander Hubbard a/c> 9,568,668 0.75%Vermont Park Holdings Pty Ltd 8,961,135 0.71%Citicorp Nominees Pty Limited <CFS WSLE 452 Aust Share a/c> 8,640,918 0.68%UBS Nominees Pty Ltd 8,150,712 0.64%Wentworth Investments Pty Ltd 7,176,501 0.57%Sank Pty Ltd <SJF Discretionary a/c> 6,769,231 0.53%Next Trading Pty Limited <Stephen Grant Family a/c> 5,422,245 0.43%Citicorp Nominees Pty Limited <CFS WSLE Geared Share Fund a/c> 4,829,597 0.38%HSBC Custody Nominees (Australia) Limited – a/c 2 4,578,592 0.36%Total 650,802,360 51.24%
For
per
sona
l use
onl
y

106 | Tatts Group Limited Annual Report 2009
C Domicile of Ordinary Shareholders
DomicileNumber
of HoldersPercentage of Holders
Number of Securities
Percentage of Securities
Australian Capital Territory 907 1.0% 2,982,287 0.2%New South Wales 10,663 11.8% 564,851,783 44.5%Northern Territory 269 0.3% 1,253,080 0.1%Queensland 50,025 55.1% 237,939,298 18.7%South Australia 2,236 2.5% 16,228,222 1.3%Tasmania 1,316 1.5% 71,083,834 5.6%Victoria 22,521 24.8% 350,515,086 27.6%Western Australia 2,382 2.6% 16,571,227 1.3%Overseas 402 0.4% 8,645,944 0.7%Total 90,721 100.0% 1,270,070,761 100.0%
D Unquoted Equity SecuritiesNumber on Issue
Number of Holders
Performance options in respect of ordinary shares issued under the Tatts Group Long-Term Incentive Plan
11,364,610
44
Performance rights in respect of ordinary shares issued under the Tatts Group Long-Term Incentive Plan
206,987
29
E Substantial ShareholdersAs at 7 September 2009 there were no substantial shareholders in Tatts Group Limited that had provided substantial shareholder notices.
F Voting rightsThe voting rights attaching to each class of equity securities are set out below:
(a) Ordinary sharesOn a show of hands every member present at a meeting in person or by proxy shall have one vote and upon a poll each share shall have one vote.
(b) Performance Options and RightsNo voting rights.
G On Market Buy-backThere is no current on-market buy-back in respect of the Tatts Group ordinary shares.
Shareholder information (continued)
For
per
sona
l use
onl
y

107
www.tattsgroup.com
Corporate DirectoryRegistered and Principal Administrative Office in AustraliaTatts Group Limited 615 St Kilda Road Melbourne VIC 3004 Telephone: + 61 3 8517 7777 ABN: 19 108 686 040
Website Addresswww.tattsgroup.com
Australian Securities Exchange (ASX) ListingTatts Group Limited shares are listed on the ASX under the code TTS.
DirectorsRefer to profiles on pages 18 to 21.
Senior ExecutivesMichael Carr Chief Executive Maxgaming
Barrie Fletton Chief Executive UNiTAB Wagering
Penny Grau General Counsel & Company Secretary
Raymond Gunston Chief Financial Officer
Bruce Houston Executive General Manager Media, Government and Community Relations
Stephen Lawrie Chief Information Officer
Frank Makryllos Chief Executive Tatts Pokies
Maree Patane Chief Auditor
Brendan Redmond Executive General Manager International
Kevin Szekely Chief Executive Bytecraft
Bill Thorburn Chief Executive Lotteries
Investor RelationsGary Woodford E-mail: [email protected]
MediaMichael Mangos E-mail: [email protected]
AuditorPricewaterhouseCoopers Freshwater Place Level 19, 2 Southbank Boulevard Southbank VIC 3006
SolicitorsClayton Utz 333 Collins Street Melbourne VIC 3000
Herbert Geer 385 Bourke Street Melbourne VIC 3000
Share Registry Computershare Investor Services Pty Limited Yarra Falls, 452 Johnston Street Abbotsford VIC 3067 Email: [email protected] Telephone within Australia: 1300 367 346 Telephone outside Australia: + 61 3 9415 4199 Fax: + 61 3 9473 2500
To maintain or update your details online and enjoy full access to all your holdings and other valuable information, simply visit www.investorcentre.com.
For
per
sona
l use
onl
y

108 | Tatts Group Limited Annual Report 2009
Dividend HistoryDate Paid Type Cents Per Share5 April 2006 2006 Interim 8.7526 September 2006 2006 Final 7.530 March 2007 2007 Interim 8.05 October 2007 2007 Final 10.05 October 2007 2007 Special 4.04 April 2008 2008 Interim 9.53 October 2008 2008 Special# 10.53 April 2009 2009 Interim 10.02 October 2009 2009 Final 11.0
All dividend payments are fully franked unless otherwise stated. # Paid in place of a 2008 Final Dividend – refer to ASX Releases dated 23 June and 28 August 2008.
Shareholder Calendar
2010 Calendar of Events Date
Interim Results announcement 25 February 2010 Ex Dividend 2 March 2010Record Date 9 March 2010Dividend Payment 6 April 2010Full year Results announcement 26 August 2010 Ex Dividend 1 September 2010Record Date 7 September 2010Dividend Payment 1 October 2010Annual General Meeting 29 October 2010Dates may be subject to change
Major Announcements1 July 2008 George Chapman to retire as a Director effective 31 August 200828 August 2008 2008 full year results and dividend details released19 November 2008 2008 Annual General Meeting19 December 2008 Dividend Reinvestment Plan introduced12 February 2009 Announcement of Bushfire Relief Lottery draw26 February 2009 2009 half year results and dividend details released27 March 2009 Contract Extension – Managing Director extends contract for 3 years27 July 2009 ASX release regarding the TOTE Tasmania sale process18 August 2009 ASX release announcing Tatts Group decision not to lodge a final and binding
bid for TOTE Tasmania27 August 2009 2009 full year results and dividend details released
Corporate Directory (continued)
For
per
sona
l use
onl
y

Group Brand Structure
For
per
sona
l use
onl
y

www.tattsgroup.com
For
per
sona
l use
onl
y