asx release - we’re a creative transformation company
TRANSCRIPT

ASX Release 25 February 2021 Market Announcements Office ASX Limited 20 Bridge Street Sydney NSW 2000 Dear Sir/Madam
WPP AUNZ LIMITED - Appendix 4E and Annual Report In accordance with ASX Listing Rule 4.3A, I attach the Appendix 4E and Annual Report for WPP AUNZ Limited’s 2020 reporting period. Yours faithfully,
Linda Gough General Counsel & Company Secretary WPP AUNZ Limited 1 Kent Street NSW 2000 +61 414 164 060

ASX APPENDIX 4E PRELIMINARY FINAL REPORT
FOR THE YEAR ENDED 31 DECEMBER 2020
WPP AUNZ LIMITED ABN 84 001 657 370

2
APPENDIX 4E WPP AUNZ LIMITED
Name of entity
WPP AUNZ Limited ABN or equivalent company reference Year ended (‘current period’) Year ended (‘previous period’)
84 001 657 370 31 December 2020 31 December 2019
Results for announcement to the market In A$’000’s (unless otherwise noted)
Revenues from continuing operations down 13.20% to $726,175 Revenues from discontinued operations down 100.00% to $Nil Loss from continuing operations after tax attributable to members – Reported
down
19.47%
to
($152,550)
Loss from discontinued operations after tax attributable to members – Reported
down
100.00%
to
$Nil
Net loss for the year attributable to members – Reported down 32.96% to ($152,550) Earnings per share – Basic – continuing operations up 19.50% to (17.9)¢ Earnings per share – Basic up 32.97% to (17.9)¢ Earnings per share – Diluted – continuing operations up 19.50% to (17.9)¢ Earnings per share – Diluted up 32.97% to (17.9)¢ Headline results – continuing operations Net profit for the year attributable to members - Headline down 31.89% to $34,863 Earnings per share – Headline profit down 31.89% to 4.1¢
Dividends Amount per security
Franked amount per security at 30%
Current Year: Final dividend declared subsequent to 31 December 2020 Special dividend declared subsequent to 31 December 2020
2.9¢ 1.5¢
2.9¢ 1.5¢
Interim dividend declared - - Previous Year: Final dividend determined subsequent to 31 December 2019 Special dividend determined subsequent to 31 December 2019
2.9¢ 1.5¢
2.9¢ 1.5¢
(These dividends were subsequently not paid as a result of cash preservation measures due to COVID-19)
Interim dividend declared (paid 3 October 2019) 2.3¢ 2.3¢ Record date for determining entitlements to the dividend 31 March 2021 Date dividend is payable if declared 7 April 2021 A dividend reinvestment plan (“DRP”) will not apply to the final dividend. Consolidated Entity 2020* 2019* Net tangible asset backing per ordinary share (21.4)¢ (25.0)¢ *Excludes the impact of “AASB 16 Leases”. Brief explanation of any of the figures reported above or other items of importance not previously released to the market:
Refer to the 2020 Annual Report lodged with this document. Further analysis provided in the Management Presentation and Media Release lodged with the ASX.
Discussion and Analysis of the results for the year ended 31 December 2020: Refer to the 2020 Annual Report lodged with this document. Further analysis provided in the Management
Presentation and Media Release lodged with the ASX.

ANNUAL REPORT 2020


4 THE BOARD OF DIRECTORS7 DIRECTORS’ REPORT 10 OPERATING AND FINANCIAL REVIEW 17 AUDITOR’S INDEPENDENCE DECLARATION 19 OUR REMUNERATION CHAIR’S LETTER40 FINANCIAL STATEMENTS 104 DIRECTORS’ DECLARATION 105 INDEPENDENT AUDITOR’S REPORT111 CORPORATE DIRECTORY
CONTENTS

THE BOARD OF DIRECTORS
Jens is an experienced digital leader and entrepreneur with a global track record for growth by driving digital transformation, platform economy and strategy across a range of businesses and industries. Prior to being appointed Chief Executive Officer and Managing Director of WPP AUNZ in October 2019, Jens was Chief Digital Officer and Senior Vice President Digital Strategy at BMW Group, headquartered in Munich, where he defined and implemented a digital transformation program that reshaped the BMW Group from an auto manufacturer into a data-driven, mobility tech company.
Jens has held a range of senior executive positions with global companies, including Global Chief Executive Officer, Digital Marketing at Arvato AG (part of the Bertelsmann Group), Global Innovation Manager for the BMW Group and Global Brand Manager for MINI and several roles with Google where he was Director of Branding for Automotive, Retail, FMCG and Health Care as well as Industry Leader Automotive. His start-up experience, as well as his brand, product and marketing knowhow, includes roles at Mondelēz, Colgate-Palmolive and Schwarzkopf & Henkel. Jens holds advisory and board seats with the international digital and ecommerce start-up Azoya, Nunatek Transformation Strategy Consulting, Advertising Council Australia and Design AI.
Kim was appointed as a Director of WPP AUNZ in November 2010.
Kim is a Non-Executive Director of carsales.com Limited (from 2010), Marley Spoon (from 2018) and Infomedia Limited (from 2020) and The Sax Institute (from 2017). A former Fellow of the University of Sydney Senate, Kim has more than 25 years’ experience in various media executive and Chief Executive Officer positions in both Australia and the US, including Southern Star Entertainment Pty Ltd, Publishing and Broadcasting Limited, ninemsn, Harper Collins, and Reading Room Inc.
Kim is Chair of the WPP AUNZ People and Culture Committee.
Robert was appointed as a Director of WPP AUNZ in December 2006 and Chairman with effect from 1 July 2008.
Robert is a consultant to the investment banking division of UBS AG in Australia, a role he has held since June 2007. He has extensive investment banking experience in Australia, having previously worked for Citigroup, E.L. & C. Baillieu and Ord Minnett Securities (now JP Morgan) between 1990 and 2006. During this time he was primarily focused on the media, technology and entertainment and private equity sectors and initial public offerings generally. Prior to these roles, he worked with KPMG from 1986 to 1990 during which time he qualified as a Chartered Accountant.
Robert is also currently the Non-executive Chairman of ASX listed ALE Property Group (from November 2016) and was a Non-executive Director of NASDAQ listed Melco Resorts and Entertainment from December 2006 to January 2017.
Robert is a member of the WPP AUNZ Audit and Risk Committee.
KIM ANDERSON
BA, GRAD DIP INF SC Independent Non-Executive Director
JENS MONSEES
MBA Bus Admin Chief Executive Officer and Managing Director of WPP AUNZ
ROBERT MACTIER
B. Ec. Independent Non-Executive Chairman
Graham was appointed as a Director of WPP AUNZ in May 2008. He was a Senior Executive with Consolidated Press Holdings ("CPH") from 1990 until September 2005, including holding the position of Chief Financial Officer for 13 years.
Prior to joining CPH, Graham held senior finance positions with a number of major financial companies including Capita Finance Group and Ford Motor Company. He has over 20 years’ experience as a director and audit committee member of public companies in Australia and the US. Graham is a Director of Bell Financial Group Limited (from 2007), White Energy Company Limited (from 2010) and McPherson’s Limited (from 2010). He was appointed Chairman of McPherson’s Limited in July 2015.
Graham is Chairman of the WPP AUNZ Audit and Risk Committee and a member of the People and Culture Committee.
GRAHAM CUBBIN
BECON (HONS) Independent Non-Executive Director
WPP AUNZ
4

Geoff was appointed as a Director of WPP AUNZ in April 2016.
Geoff was the Chairman and Country Manager of WPP plc in Australia and New Zealand from 1998 until the merger of STW Group and WPP in 2016. He was with Clemenger BBDO until 1990 as Deputy Chairman, a member of the BBDO Worldwide Board and Chairman of BBDO Asia Pacific, when he retired from the advertising industry for a period, following which he was appointed as Chairman of the New South Wales Tourism Commission and a Vice-President of the Sydney 2000 Olympics Bid Company. Geoff has been Chairman of the Advertising Federation of Australia and Chairman of the Australian Advertising Industry Council. He was a Director of oOh!media Limited from 2007 until May 2019 and is a Fellow of the Australian Institute of Company Directors, the Advertising Institute (by examination) and the Royal Society of Arts.
Geoff was made a Member of the Order of Australia in the Queen’s Birthday Honour List in 2000.
He was a Director of Ibisworld Pty Ltd from 1990 until June 2020 when he retired to become an Advisory Board Member of Ruthven Institute Pty Ltd. He has been a Director of Arab Bank Australia Limited since 1995 and Chairman since 2011.
Geoff is a member of the WPP AUNZ People and Culture Committee.
Diane was appointed as a Director of WPP AUNZ in early March 2020.
Diane is the Global Chief Financial Officer of Wunderman Thompson a global creative, consulting and technology network and one of WPP's largest agencies, home to more than 20,000 employees across 95 countries. With a 20+ year career spanning roles in Los Angeles, New York and London, Diane currently leads Wunderman Thompson's financial and operational management.
Previous roles honed her skillset across all facets of financial planning, M&A, joint ventures and strategic partnerships. Diane has built her career by passionately supporting talent and creativity while also delivering strong strategic leadership for clients and colleagues. She excels in tackling business disruption to drive optimal performance.
Los Angeles based, Diane also serves on the board of Stone Barns Center for Food and Agriculture, a non-profit organisation with a mission to create a healthy and sustainable food system, where she is on the finance committee. Previously, Diane served on the board of Step Up for over 10 years, a non-profit organisation that mentors teen girls from under-resourced communities.
Diane is a member of the WPP AUNZ Audit and Risk Committee.
Ranjana was appointed as a Director of WPP AUNZ in April 2016.
Ranjana is a Botany Honours graduate from Delhi University, with a postgraduate diploma in Advertising and PR from the Indian Institute of Mass Communications, Delhi.
She started her career in media at JWT India (Hindustan Thompson Associates). In March 1993, she moved to JWT Indonesia to stabilise and grow its media function. Subsequently, she moved to client servicing and became the General Manager in 1998.
Ranjana joined the newly launched Mindshare in 2000. As Managing Director and then Chief Executive Officer, she built GroupM to be the leading media agency. Ranjana currently serves as the WPP plc Chairperson for Indonesia and Vietnam. She sits on the advisory board for the Asia Pacific Media Forum and the McKinsey YLI Young Leaders Indonesia initiative.
GEOFF WILD AM
FAICD, FAI (DIP), FRSA Non-Executive Director
DIANE HOLLAND
BA Urban Studies & Planning Non-Executive Director
RANJANA SINGH
Honours (Botany), POST GRAD DIP (ADV & PR) Non-Executive Director
ANNUAL REPORT 2020
5

FINANCIAL PERFORMANCE

ANNUAL REPORT 2020
7
DIRECTORS' REPORT
Your Directors present their report on the Consolidated Entity consisting of WPP AUNZ Limited (“Company”, "WPP AUNZ" or “Parent Entity”) and the entities it controlled at the end of, or during, the year ended 31 December 2020 (collectively “WPP AUNZ Group”, “Group” or “Consolidated Entity”).
DIRECTORSThe following persons were Directors of the Company during the whole of the year and up to the date of this report, unless otherwise stated:
Robert Mactier, Independent Non-executive Chairman Jens Monsees, Chief Executive Officer and Managing Director Paul Richardson, Non-executive Director (resigned 7 May 2020) Graham Cubbin, Independent Non-executive Director Kim Anderson, Independent Non-executive Director Ranjana Singh, Non-executive Director John Steedman, Executive Director and Chief Operating Officer (retired 12 October 2020) Geoffrey Wild AM, Non-executive Director Diane Holland, Non-executive Director (appointed 2 March 2020).
Particulars of Directors’ qualifications, experience and directorships in other listed entities are set out on pages 4 and 5 in this Annual Report.
PRINCIPAL ACTIVITIESThe principal activities of WPP AUNZ Group during the year were the provision of marketing, content and communications services. WPP AUNZ Group comprises leading companies in all the following disciplines: Advertising; Media Investment Management; Large Format Production; Public Relations and Public Affairs; Branding and Identity; Digital; e-commerce and Shopper Marketing; Production and Specialist Communications.
There have been no significant changes in the WPP AUNZ Group's principal activities during the year.
REVIEW OF OPERATIONSInformation on the operations and financial position of the Company and its business strategies and prospects are outlined on pages 10 to 16 and form part of this Directors’ Report.
Directors Audit and Risk Committee People and Culture Committee
Table 1: Director meetings Attended Held* Attended Held* Attended Held*
Robert Mactier 10 10 4 4 — —
Kim Anderson 10 10 — — 5 5
Graham Cubbin 10 10 4 4 5 5
Jens Monsees 10 10 — — — —
Paul Richardson 3 3 — — 1 2
Diane Holland 9 9 3 3 — —
Ranjana Singh 10 10 — — — —
John Steedman 6 6 — — — —
Geoffrey Wild AM 10 10 1 1 3 3
* Reflects the number of meetings the Director was eligible to attend during the time the Director held office during the 2020 year.
SIGNIFICANT EVENTS AFTER THE BALANCE DATEOther than the significant items outlined in Note 39 to the financial statements, there has not arisen, in the interval between the end of the financial period and the date of signing of this Directors’ Report, any item, transaction or event of a material or unusual nature which, in the opinion of the Directors, has significantly affected, or may significantly affect, the operations of the Group, the results of those operations, or the state of affairs of the Group, in future periods.
DIRECTOR MEETINGSThe number of meetings of Directors (including meetings of Committees of Directors) held during the year ended 31 December 2020 and the number of meetings attended by each Director are set out below in Table 1: Director meetings.

WPP AUNZ
8
Table 2: Director interest in ordinary shares
Balance as at
1-Jan-20 Acquisitions
Exercised vested awards Disposals
Balance as at
31-Dec-20
Post year-end
acquisitions
Post year-end disposals
Post year-end balance
Robert Mactier 577,964 422,036 — — 1,000,000 — — 1,000,000
Jens Monsees — 600,000 923,191 — 1,523,191 — — 1,523,191
Paul Richardson — — — — — — — —
Graham Cubbin 100,000 150,000 — — 250,000 — — 250,000
Kim Anderson 50,000 100,000 — — 150,000 — — 150,000
Ranjana Singh — — — — — — — —
John Steedman 382,408 — 28,226 (320,000) 90,634 — — 90,634
Geoffrey Wild AM — — — — — — — —
Diane Holland — — — — — — — —
COMMITTEE MEMBERSHIPAs at the date of this report, the Company had an Audit and Risk Committee and a People and Culture Committee. Members acting on the Committees of the Board during the year and at the date of this report were:
AUDIT AND RISK COMMITTEEGraham Cubbin (Chair) Robert MactierGeoffrey Wild AM (resigned 7 May 2020) Diane Holland (appointed 7 May 2020)
PEOPLE AND CULTURE COMMITTEEKim Anderson (Chair) Graham Cubbin Paul Richardson (resigned 7 May 2020) Geoffrey Wild AM (appointed 7 May 2020)
COMPANY SECRETARYLinda Gough is the General Counsel and Company Secretary of WPP AUNZ. She is a senior corporate/commercial lawyer with 20 years post-qualification experience. She has a Bachelor of Commerce (University of Alberta), a Diploma in Journalism & Communications (Concordia University), a Bachelor of Laws (University of Toronto) and a Masters of Law (University of New South Wales). She is a graduate of the Australian Institute of Company Directors and a member of the Law Society of New South Wales, the Governance Institute and the Association of Corporate Counsel, Australia.
LIKELY DEVELOPMENTS AND EXPECTED RESULTSRefer to the Operating and Financial Review section on page 10.
ENVIRONMENTAL REGULATION AND PERFORMANCEThe Consolidated Entity’s operations are subject to environmental regulation under Commonwealth and State legislation. These regulations do not have a significant impact on the Consolidated Entity’s operations. The Board believes that the Consolidated Entity has adequate systems in place for the management of its environmental requirements and is not aware of any significant breach of those environmental requirements as they apply to the Consolidated Entity.
INDEMNIFICATION AND INSURANCE OF OFFICERS AND AUDITORSThe Directors of the Company and such other officers as the Directors determine, are entitled to receive the benefit of an indemnity contained in the Constitution of the Company to the extent allowed by the Corporations Act 2001, including against liabilities incurred by them in their respective capacities in successfully defending proceedings against them.
During or since the end of the financial year, the Company has paid premiums under contracts insuring the Directors and officers of the Company and its controlled entities against liability incurred in that capacity to the extent allowed by the Corporations Act 2001. The officers to which these insurance contracts relate are any past, present or future director, secretary, executive officer or employee of the Group.
The terms of the policies prohibit disclosure of the details of the liability and the premium paid.
Each Director has entered into a Deed of Access, Disclosure, Insurance and Indemnity which provides for indemnity by the Company against liability as a Director to the extent allowed by the law.
There have been no indemnities given or insurance premiums paid during or since the end of the financial year for any current or former auditor.
PERFORMANCE RIGHTS AND OPTIONSAs at 31 December 2020, 14,336,085 (2019: 15,327,048) performance rights and 4,560,108 (2019: Nil) options have been granted to participants in WPP AUNZ employee share plans. These performance rights and options will vest and be exercised and settled in equity or cash subject to the achievement of specific performance and service conditions relating to each grant. The total amount of the performance rights and options represents the equity grants awarded to the eligible employees during 2020, as well as the prior years' grants which are not yet vested or exercised as at 31 December 2020.
SHARESThe number of ordinary shares in which each Director has a relevant interest as at the date of this report is set out in Table 2: Director interest in ordinary shares.
DIRECTORS' REPORT (CONTINUED)

ANNUAL REPORT 2020
9
AUDITOR INDEPENDENCEThe Directors have received a declaration of independence from Sandeep Chadha on behalf of Deloitte Touche Tohmatsu, the auditor of WPP AUNZ Limited, as reproduced on page 17.
AUDIT PARTNER EXTENSIONOn 14 December 2020, following the recommendation of the Audit and Risk Committee, the Board resolved that Mr. Chadha's appointment as the Company's lead auditor be extended for a period of two years. The Company has filed ASIC Form 397.
NO OFFICERS ARE FORMER AUDITORSNo officer of the Consolidated Entity has been a partner of an audit firm or a director of an audit company that was the auditor of the Company and the Consolidated Entity for the financial year.
CORPORATE GOVERNANCEIn recognising the need for the highest standards of corporate behaviour and accountability, the Directors of WPP AUNZ Limited support and have adhered to the principles of corporate governance.
A copy of the Company's full 2020 Corporate Governance Statement, which provides detailed information about governance, and a copy of the Company's Appendix 4G which sets out the Company’s compliance with the recommendations in the fourth edition of the ASX Corporate Governance Council’s Principles and Recommendations ("ASX Principles") will be available on the corporate governance section of the Company’s website at www.wppaunz.com.
The Board believes that the governance policies and practices adopted by the Company during 2020 are in accordance with the recommendations contained in the ASX Principles. The Company embedded the ASX Principles into its internal governance framework for the entire 2020 reporting period. This will be detailed in the 2020 Corporate Governance Statement.
RISK MANAGEMENTThe Group takes a proactive approach to risk management. The Board has established a risk management policy for the oversight and management of risk and has delegated responsibility for reviewing risk, compliance and internal control to the Audit and Risk Committee. Management is ultimately responsible to the Board for the system of internal controls and risk management within the business units. Details of risk mechanisms in place are set out in the 2019 Corporate Governance Statement on the Company’s website at www.wppaunz.com, and will be updated in the 2020 Corporate Governance Statement.
NON-AUDIT SERVICESThe Company may decide to employ the auditor on assignments additional to their statutory audit duties where the auditor’s expertise and experience with the Company and/or the Group are important.
Details of the amounts paid or payable to the auditor for non-audit services provided during the year by the auditor are outlined in Note 38 to the financial statements.
The Directors are of the opinion that the services as disclosed in Note 38 to the financial statements do not compromise the external auditor’s independence, based on advice received from the Audit and Risk Committee, for the following reason:
— none of the services undermines the general principles relating to auditor independence as set out in Code of Conduct APES 110 Code of Ethics for Professional Accountants issued by the Accounting Professional & Ethical Standards Board, including reviewing or auditing the auditor’s own work, acting in a management or decision-making capacity for the Company, acting as advocate for the Company or jointly sharing economic risks and rewards.
ROUNDINGThe Company is of a kind referred to in ASIC Corporations Instrument 2016/191, dated 24 March 2016, and in accordance with that legislative instrument, amounts in the Directors' Report and the financial report are rounded to the nearest thousand dollars, unless otherwise indicated.
REMUNERATION REPORTThe Remuneration Report outlined on pages 18 to 39 forms part of this Directors’ Report.
Signed on behalf of the Directors in accordance with a resolution of the Directors:
Robert Mactier Jens Monsees Chairman Chief Executive Officer Sydney, 25 February 2021 and Managing Director

WPP AUNZ
10
OPERATING AND FINANCIAL REVIEW
FINANCIAL OVERVIEWThis Operating and Financial Review forms part of the Directors' Report beginning on page 7.
This financial overview presents the results of the Group as outlined in the financial statements.
Net sales (revenue less cost of sale of goods and services rendered) from continuing operations for the year ended 31 December 2020 were $612.3 million, down 14.1% on the prior period (2019: $712.8 million).
The loss from continuing operations for the year ended 31 December 2020 was $149.4 million compared to a loss in 2019 of $184.1 million. The losses in 2020 is mainly driven by $184.0 million of impairment expenses recognised for continuing operations during the year.
The net loss attributable to members of WPP AUNZ for the year ended 31 December 2020 was $152.6 million for continuing and discontinued operations compared to a net loss in 2019 of $227.5 million.
A summary of the Group's results is below:
2020 ($M)
2019 ($M)
Revenue 726.2 836.6
Cost of sale of goods and services rendered (113.9) (123.8)
Net sales 612.3 712.8
Share of net profits from joint venture and associates
5.7 5.6
Other income/(expenses) 22.0 (2.6)
Operating expenses (541.9) (602.0)
EBITDA 98.1 113.8
Depreciation, amortisation and impairment (233.0) (295.2)
EBIT (134.9) (181.4)
Net finance costs (8.9) (14.2)
Loss before tax (143.8) (195.6)
Income tax (expense)/benefit (5.6) 11.5
Loss from continuing operations (149.4) (184.1)
Loss from discontinued operations — (37.8)
Loss for the period (149.4) (221.9)
Non-controlling interests 3.2 5.6
Net loss attributable to members of WPP AUNZ
(152.6) (227.5)
Cents Cents
Earnings per share ("EPS") for loss from continuing operations
(17.9) (22.2)
EPS (17.9) (26.7)
A reconciliation of the Group's statutory and headline profit and an analysis of the significant items (after tax and non-controlling interests) impacting the Group's results are set out below:
2020 ($M)
2019 ($M)
Net loss attributable to members of WPP AUNZ (152.6) (227.5)
Significant items, net of tax
1. Impairment, amortisation of acquired intangibles and other non-cash items 185.4 281.3
2. Business close down and other one-off costs 2.1 9.1
Total significant items, net of tax 187.5 290.4
Headline profit attributable to members of WPP AUNZ:
34.9 62.9
From continuing operations 34.9 51.2
From discontinued operations — 11.7
After adjusting for significant items, the headline profit from continuing operations for the year ended 31 December 2020 was $34.9 million, down 31.9% on the prior period (2019: $51.2 million).
SIGNIFICANT AND NON-CASH ITEMS
The Company incurred the following significant and other non-cash items in 2020:
1. Impairment, amortisation of acquired intangibles and other non-cash items – The balance in 2020 relates to the impairment of goodwill, equity accounted investments, right-of-use assets and acquired intangibles such as brand names and customer relationships in relation to entities within Global Integrated Agencies, Public Relations & Public Affairs and Specialist cash generating units ("CGUs"). It also includes the amortisation of acquired intangible assets, loss on fair value adjustment of earnouts as well as the loss on disposal of a non-material controlled entity during the year.
The balance in 2019 relates to the impairment of goodwill and acquired intangibles such as brand names and customer relationships predominantly in relation to entities within the Global Integrated Agencies and Data Investment Management CGUs. It also includes the amortisation of acquired intangible assets, gain on fair value adjustment of earnouts as well as the gain/loss on disposal of controlled entities and associates which includes Kantar and Ogilvy New Zealand (discontinued operations) and other non-material disposals during the year.
2. Business close down and other one-off costs – These relate to restructure costs associated with closing down and merging selected businesses as well as one-off US Base Erosion and Anti-abuse Tax incurred in 2020.
Further details relating to significant items are included in Note 5(C) to the financial statements.

ANNUAL REPORT 2020
11
STRATEGY FOR GROWTH – TRANSFORM, STRENGTHEN, GROW
WPP AUNZ announced a transformation strategy in February 2020 to return its business to strong, profitable and sustainable growth. The strategy is being implemented in three phases: transform, strengthen and grow, over a three-year period to the end of 2022.
The strategy enhances our core creative capabilities and brings together the collective talent, resources and skills to provide an integrated offer of communications, experience, commerce and technology to our clients.
— Communications creates powerful ideas based on deep insights to connect brands’ messaging with audiences in meaningful ways and channels at meaningful moments.
— Experience builds seamless experiences to make brands part of people’s lives – creating more memorable engagement and driving better business results.
— Commerce makes it easy for our clients to sell within the complex ecosystem of where and how their customers want to buy.
— Technology leverages our global technology partnerships and unique scaled platforms and capabilities to build technology and data solutions that fit our clients’ needs.
Our transformation will be delivered in six key areas and during 2020 we made significant progress in each of these key areas:
1. Operating model – Restructure our operating model to bring fewer, stronger brands to our clients and make it easier for them to navigate our services;
2. Clients – Improve the organisation of our capabilities across brands around client needs through dedicated client leads and sector practice areas;
3. Talent – Establish a new leadership model, roll out a new incentive scheme, and invest in specific talent to support our digital technology capabilities;
4. Platform – Support our strong brands and manage costs by implementing a shared services structure of HR, IT, finance, legal, marketing, and communications;
5. Solutions – Bolster our capabilities in e-commerce, experience, and technology through partnerships with platforms, scalable solutions and selective strategic M&A;
6. Geographies – Leverage our current presence in large and growing markets of South East Asia by growing our capabilities in those locations to support our businesses in Australia and New Zealand. In Australia and New Zealand, we expedited our campus approach with the goal of bringing brands together in one location in most of our major cities.
SIGNIFICANT PROGRESS ACHIEVED IN 2020
Our strategic transformation remains ahead of our strategy roadmap. The events of 2020 accelerated the structural change in our industry and as a result we accelerated our transformation. During 2020, we observed heightened levels of consumption of media and a rapid expansion of e-commerce activity. As a result, we expect future demand for our experience, commerce and technology services to be very strong. We have made significant progress in positioning WPP AUNZ to support clients looking to adapt rapidly to permanent changes in consumer behaviour. Key achievements in 2020 included:
— Launched a centralised tech hub, the Centre of Excellence, with partnerships with Adobe, Microsoft, Salesforce and Sitecore. This consolidates the technology and data consulting operations of the Group;
— Added additional capabilities in technology through the acquisition of Dominion in New Zealand and Meerkats in Australia;
— Formalised 10 top client leaders to better serve our top clients across the WPP AUNZ brands and capabilities;
— Introduced performance driven key performance indicators ("KPI") and remuneration schemes for all leaders;
— Successfully restructured the New Zealand operations and materially improved profitability;
— Announced a global partnership between AKQA and WhiteGREY, enhancing technology and creative assets of the Group; and
— Announced a global merger between VMLY&R and Geometry to create VMLY&R Commerce, bolstering our service offering in commerce and retail.
The Company will move into the ‘strengthen’ phase of its strategy in 2021. This phase includes initiatives to drive client engagement, top line growth, and expansion in growing areas of the market. It will concentrate on investing in technology (Martech, data), commerce and experience solutions, while maintaining best-in-class, technology-driven services and solutions in communications (media, creative, PR).

WPP AUNZ
12
OPERATING AND FINANCIAL REVIEW (CONTINUED)
FINANCIALS – PERFORMANCE OF CONTINUING OPERATIONS
The financial results of the continuing operations are presented excluding the impact of significant and non-cash items, and excluding the results of the major units disposed in 2019 - Kantar Australia and NZ, and Ogilvy NZ:
Key measures - Continuing operations2020 ($M)
2019 ($M)
Change (%)
Headline net sales 612.3 712.5 (14.1)
Headline earnings before interest and tax 61.9 91.8 (32.6)
Headline profit before tax 53.0 77.8 (31.9)
Headline margin 10.1% 12.9% (2.8)
Headline net profit after tax and minorities 34.9 51.2 (31.9)
EPS - headline profit 4.1 cents 6.0 cents (31.9)
Total dividends for the year (fully franked) 4.4 cents 2.3 cents
Leverage ratio (net debt/headline EBITDA) 0.2x 1.1x
The continuing operations contributed net sales of $612.3 million converting to earnings before interest and tax of $61.9 million at a margin of 10.1%. Continuing operations headline EPS was 4.1 cents which was a decline of 31.9% on prior year.
The Group's financial performance has been impacted by the unprecedented economic, logistical and market challenges we face dealing with the COVID-19 pandemic. The market in the first two months of 2020 progressed in line with expectations, before the impact of COVID-19 began to be widely felt from March onwards. The immediate impact of COVID-19 was on our net sales, with clients reducing their marketing and communications expenditure as part of their own remediation actions. This was most prevalent in media spend.
NET SALES BY QUARTER
The table below outline net sales by quarter compared to the prior year corresponding period:
Key measures - Continuing operationsQ1
Jan-MarQ2
Apr-JunQ3
Jul-SepQ4
Oct-Dec Full year
Headline net sales 151.9 144.1 153.6 162.7 612.3
% change vs prior year period (6.1%) (21.5%) (14.3%) (13.5%) (14.1%)
Overall, net sales in 2020 were down 14.1% against the prior corresponding period. There was a material impact on net sales in Q2, which was down 21.5% on 2019 driven by COVID-19 related client cancellations and deferrals. While economic conditions and business confidence improved in the second half of the year, we experienced improving net sales results in Q3 and Q4, albeit net sales remained weak and down 13.9% in the second half of the year.
The Company has seen an improvement in revenue off the lows earlier in the year and December remained the largest revenue contributor for the Group in the 2020 year. The improving economic environment and current client engagement and momentum provide a platform for revenue growth going into 2021.
The media agency market spend, as measured by the Standard Media Index ("SMI"), reached a low point for the year in May 2020 and has improved considerably since that time with November data showing a return to growth after 26 months. Interim SMI data for November showed the market up 0.1% compared to November 2019.

ANNUAL REPORT 2020
13
RESPONSE TO COVID-19
The financial response to COVID-19 centred around the health and wellbeing of our staff, ensuring our clients continue to receive excellent service to support them through their own challenges, and delivering financial stability. The actions undertaken by the business were to: implement remote working; accelerate our transformation strategy; tighten cost management; and strengthen the balance sheet through close working capital management and access to debt facilities.
During the year, we implemented a program to reduce our operating costs, in alignment with our transformation strategy in response to the COVID-19 related net sales declines. In 2020, operating costs were reduced by $71 million compared to 2019. This cost reduction includes a benefit of $13.6 million in relation to government aid to support jobs.
The cost actions undertaken included voluntary reductions in salaries and working hours, freezing new hires, reducing leave balances, reviewing freelance expenditure, stopping discretionary costs, including travel and entertainment and the costs of award shows, and postponing planned salary increases for 2020. In addition, members of the WPP AUNZ Board committed to taking a 20% reduction in their salaries or fees for an initial period of three months.
Further actions taken included actively reducing our property footprint through subletting tenancies in Sydney, Melbourne and New Zealand, under our campus consolidation strategy and deferral of planned office fitouts and IT related computer renewals.
As a result of these actions, we commence 2021 with a materially reduced cost base. The sustainable cost saving measures, on an annualised basis, are expected to provide a benefit of approximately $65 million in 2021.
RESULTS BY SEGMENT
The table below outline the results by operating segment of the Group.
Headline net sales Headline EBIT Headline margin %
($M) 2020 Change $ Change % 2020 Change $ Change % 2020 Change
Global Integrated Agencies 425.8 (49.6) (10.4%) 47.6 (12.1) (20.3%) 11.2% (1.4%)
Large Format Production 11.3 (7.7) (40.7%) (4.9) 1.6 25.0% (43.2%) (9.0%)
Specialist Communications 130.7 (31.0) (19.2%) 12.4 (14.7) (54.3%) 9.5% (7.3%)
Public Relations & Public Affairs 44.5 (11.9) (21.0%) 6.8 (4.7) (40.6%) 15.3% (5.1%)
Continuing operations 612.3 (100.2) (14.1%) 61.9 (29.9) (32.6%) 10.1% (2.8%)
The Global Integrated Agencies is our largest segment and comprise our brands providing media and creative services. Overall net sales were down 10.4% for the year. The segment was immediately impacted by a decline in net sales as a result of COVID-19 related slowdown as clients reduced or deferred media spend and agency productions. In the second half of the year, there was an improvement in net sales as a result of renewed client confidence, easing of government imposed restrictions on people’s movements and enhanced economic activity.
The overall performance of the Public Relations & Public Affairs segment declined in 2020 driven by client losses and deferral and cancellation of projects. Overall, this segment contains a number of strong brands and their operating margins are the highest in the Group. The outlook for the segment remains positive, with the expectation it will return to growth as clients seek advice on how to engage with their own stakeholders.
The Specialist Communications segment comprises digitally focused businesses along with brands delivering branding and experience, training and events. We expect future demand for our experience, commerce and technology services to be very strong, with clients looking to adapt rapidly to permanent changes in consumer behaviour. The digital businesses contained within the Specialist Communications segment are delivering a strong margin and are well positioned for further growth, both locally and in South East Asia. On the other hand, we have seen pressure on some project-based work in branding and identity as clients look to cut costs. Further, our brands delivering specialist services in training and events have faced restrictions on face-to-face gatherings and have pivoted to digital means of reaching their clients and target audience.
Progress has been made in restructuring the Large Format Production segment. The improvement is reflected in the earnings, which is primarily driven by a strong second half performance and is a result of restructure actions delivering cost and operational efficiencies. The largest of these savings was generated through property consolidation and improvement in the overall supply chain. The benefit of the initiatives is an improvement in the quality of its operations and enhanced customer experience, that will drive client retention and growth in the future.

WPP AUNZ
14
OPERATING AND FINANCIAL REVIEW (CONTINUED)
RENEWAL AND EXTENSION OF DEBT FACILITIES
In order to strengthen our financial stability and flexibility, we proactively renewed and extended our debt facilities.
The renewed and extended facilities, as announced on 17 August 2020, are:
— $270 million three year revolving term facility maturity extended from June 2021 to August 2023; and
— $150 million rolling annual working capital facility extended from June 2021 to August 2021.
The unchanged banking covenants require a leverage ratio of less than 3x and an interest cover ratio (EBITDA to net interest expense) not less than 4x. The leverage ratio is calculated as net debt including earnouts divided by headline EBITDA. The Group leverage ratio sits comfortably under both covenant limits.
NET DEBT - TIGHTENED WORKING CAPITAL MANAGEMENT AND STRENGTHENED CASH COLLECTIONS
A key focus during the year has been on the financial strength and sustainability of our business. We have looked to strengthen the cash and liquidity position through improved cash collections and extending our debt facilities.
Net debt at 31 December 2020 is $17.2 million (2019: $121.4 million). This reduction in net debt at year end has been achieved through strong cash collections, along with early collection of media payments. We expect the benefit of early collection of media payments to partially unwind in Q1 2021.
2020 ($M)
2019 ($M)
Change ($M)
Cash 63.5 74.8 (11.3)
Bank debt (75.0) (192.0) 117.0
Earnout liabilities (5.7) (4.2) (1.5)
Net debt (17.2) (121.4) 104.2
To illustrate the impact of these cash collections, the average daily net debt for three months ended 31 December 2020 was $108 million, compared to $147.5 million for the same corresponding period in 2019. Using the average daily net debt, the balance sheet leverage ratio is 0.2x (2019: 1.1x). This is below the targeted leverage range of 1.5x to 2.0x, measured as net debt plus earnouts/headline EBITDA.
EARNOUT LIABILITIES
The Company structures certain acquisitions by making an upfront payment to the vendor and agreeing to make future earnout payments based on the financial performance of the acquired company. The Company sees this as an effective way to structure acquisitions as it incentivises the vendors to drive the future performance of the acquired company. As at 31 December 2020, the Company’s estimated earnout liability was $5.7 million (2019: $4.2 million).
2020 ($M)
2019 ($M)
Opening balance 4.2 17.1
New earnout liabilities during the year 5.8 —
Payments made during the year (3.7) (13.2)
Net revisions to earnout liability estimates (0.6) 0.3
Closing balance 5.7 4.2
Over the next few years earnout liabilities are expected to decrease as future payouts are made with the largest expected in 2022.
Expected maturity profile
($M)
2021 1.1
2022 3.4
2023+ 1.2
Total 5.7

ANNUAL REPORT 2020
15
CASH FLOWSThe Group's cash decreased by $11.3 million to $63.5 million at 31 December 2020. A breakdown of the cash flows for the year ended 31 December 2020 is below:
2020($M)
2019($M)
Cash flows from operating activities 148.5 90.0
Cash flows (used in)/from investing activities (12.9) 129.4
Cash flows used in financing activities (148.2) (207.7)
Net cash (outflow)/inflow (12.6) 11.7
Opening cash 74.8 63.5
Effect of foreign exchange movements 1.3 (0.4)
Closing balance 63.5 74.8
OPERATING ACTIVITIES Cash inflows for the 2020 year derived from operating activities were $148.5 million (2019: $90.0 million). For the 2020 year, 130.5% of statutory EBITDA for continuing and discontinued operations, adjusted for the impact of significant non-cash items, was converted to operating cash flows (2019: 91%). This exceeds the Company's cash conversion target of between 85% and 100% of EBITDA.
INVESTING ACTIVITIESCash outflows for the 2020 year used in investing activities were $12.9 million (2019: inflows of $129.4 million). The cash inflow was higher in 2019 primarily due to net amounts received for disposal of controlled entities of $163.5 million. The cash outflows for the 2020 year mainly resulted from $1.0 million (2019: $5.5 million) payment for acquisition of non-controlling interests, $3.3 million (2019: $14.1 million) payment for plant and equipment mainly relating to leasehold improvements, $3.7 million (2019: $13.2 million) in earnout payments and $1.9 million (2019: $Nil) payments for purchase of newly controlled entities (net of cash acquired).
FINANCING ACTIVITIESCash outflows for the 2020 year used in financing activities were $148.2 million (2019: $207.7 million). The Company repaid net borrowings of $117.0 million during 2020 (2019: net repayment of $123.0 million). In addition to these debt repayments, $2.9 million (2019: $7.0 million) was paid in dividends to minority shareholders.
IMPAIRMENT OF INTANGIBLE ASSETS IN THE FIRST HALF OF 2020
As announced as part of the half year results, the Group recorded an after-tax impairment charge of $172.1 million relating to intangible assets. The impairment charge relates to acquired intangible assets including brand names, customer relationships and goodwill. It is non-cash in nature and has no impact on the Company’s debt facilities and compliance with bank covenants.
The impairment of goodwill and brand names has been driven by a reassessment of future cash flows and growth rates, to reflect current performance and future earnings outlook. The impairment of customer relationships reflects the reassessment of the length of customer engagements.
PAYMENT OF FINAL DIVIDEND
On 24 March 2020, we announced the cancellation of the 2019 final dividend of 2.9 cents per share, along with a special dividend of 1.5 cents per share relating to the proceeds from the sale of the Kantar business. At the time, given the high level of uncertainty as to the impact and duration of the pandemic, the Board’s view was that preserving liquidity and maintaining lower leverage were the key financial priorities.
Since then, the Board has continued to review the impact of COVID-19 on operational performance and liquidity, as well as the medium-term outlook for the broader economy. Given the improving economic environment, stronger second half earnings, expectation of better trading conditions in 2021 and a stronger financial position with reduced net debt, WPP AUNZ expects to continue to pay dividends, including the restoration of previously announced special dividends.
The Directors have declared a total dividend of 4.4 cents, fully franked relating to the 2020 year. This comprises an ordinary dividend of 2.9 cents per share and a special dividend of 1.5 cents per share relating to the proceeds from the sale of Kantar. The dividend payment has a record date of 31 March 2021 and will be paid on 7 April 2021.

WPP AUNZ
16
OPERATING AND FINANCIAL REVIEW (CONTINUED)
SUMMARY AND OUTLOOK
The Company is budgeting a material improvement in profitability in the 2021 financial year, as the economic environment strengthens leading to improved client spend, particularly in WPP AUNZ’s media investment management and creative businesses.
WPP AUNZ’s GroupM business predicts a bounce back in media market demand in 2021, with total market demand expected to increase by 15%, returning to 2019 levels of activity at the end of 2021.
Additionally, this growth outlook is expected to be enhanced by the ongoing benefits from the transformation strategy which seeks to drive revenue growth in the areas of communications, experience, commerce and technology.
Net sales are expected to be between $630 million and $650 million, representing a 4% to 6% increase on 2020. This net sales increase, combined with a starting cost base which is approximately $65 million lower in 2021, leads to a budgeted improvement in headline EBIT which is expected to be between $85 million and $95 million.
The 2021 outlook is based on WPP AUNZ’s internal budget which was developed as part of its normal budgeting process and has been approved by the WPP AUNZ Board of Directors; however, we note that actual results may vary from the budget. The 2021 budget metrics are towards the upper end of the ranges presented. The 2021 outlook statement is predicated on the assumption that the economy continues its recovery and there are no new material COVID-19 related economic impacts and restrictions.
WPP PLC OFFER
On 30 November 2020, WPP AUNZ announced the receipt of an unsolicited proposal from its majority shareholder WPP plc to acquire all of the ordinary shares in WPP AUNZ that it does not already own at a price of $0.55 per share in cash.
Subsequent to further discussions with WPP plc, the Independent Board Committee ("IBC") received a revised proposal from WPP plc to acquire all of the ordinary shares in WPP AUNZ that it does not already own at a price of $0.70 per share in cash ("Revised Proposal").
The Revised Proposal of $0.70 per share values WPP AUNZ at an implied enterprise value of $717 million and compares to the undisturbed share price of $0.41 per share.
The IBC has entered into a binding Scheme Implementation Deed in relation to the Revised Proposal and subject to an independent expert affirming that the transaction is in the best interests of minority shareholders and in the absence of any superior proposal being received, a scheme meeting is expected to be held in late April 2021 to vote on the Scheme.
The Revised Proposal price of $0.70 per share will be reduced by the cash amount per share of any ordinary dividend or special dividend declared prior to the completion of the transaction.
WPP plc has agreed to WPP AUNZ declaring and paying total ordinary and special dividends of up to $0.15 per share prior to completion – subject to WPP AUNZ Board determination, tax and accounting considerations, an Australian Tax Office ruling and bank consent.
Total dividends up to $0.15 per share comprised of a mix of ordinary and special dividends would have the effect of delivering shareholders up to $0.06 per share of additional value beyond the cash value of the dividend depending on their ability to utilise any franking credits attached to these dividends.
There is no certainty that these dividends will be paid, and declaration will be subject to further tax advice and the outlook at the time of declaring dividends.

Member of Deloitte Asia Pacific Limited and the Deloitte organisation.
Liability limited by a scheme approved under Professional Standards Legislation.
17
Deloitte Touche Tohmatsu A.B.N. 74 490 121 060 Grosvenor Place 225 George Street Sydney NSW 2000 PO Box N250 Grosvenor Place Sydney NSW 1220 Australia DX 10307SSE Tel: +61 (0) 2 9322 7000 Fax: +61 (0) 2 9322 7001 www.deloitte.com.au
25 February 2021
Dear Directors
Auditor’s Independence Declaration to WPP AUNZ Limited
In accordance with section 307C of the Corporations Act 2001, I am pleased to provide the
following declaration of independence to those charged with governance of WPP AUNZ
Limited.
As lead audit partner for the audit of the financial report of WPP AUNZ Limited for the year
ended 31 December 2020, I declare that to the best of my knowledge and belief, there have been no contraventions of:
(i) the auditor independence requirements of the Corporations Act 2001 in relation to the audit; and
(ii) any applicable code of professional conduct in relation to the audit.
Yours faithfully
DELOITTE TOUCHE TOHMATSU
Sandeep Chadha
Partner Chartered Accountants
The Board of Directors
WPP AUNZ Limited
1 Kent Street Millers Point, NSW 2000

REMUNERATIONREPORT

ANNUAL REPORT 2020
19
Dear Shareholder,
On behalf of WPP AUNZ, I am pleased to present the Remuneration Report for the year ended 31 December 2020.
2020 has been a challenging year for our Company and our people as a result of the global pandemic. I’d like to take this opportunity on behalf of the People & Culture Committee to thank all our staff, our senior leaders and KMP for responding so quickly to the pandemic to ensure the Company remained viable throughout this turbulent period. We are extremely grateful to all the staff that contributed to this effort by taking voluntary salary cuts, using outstanding leave balances and reducing work hours.
The health and well-being of our people is of paramount importance and this year in particular as we adapt to new ways of working. With employees required to work from home, many faced the unenviable task of juggling work, while home schooling and providing child-care for their young families. Others were isolated, unable to visit friends or family, and many were required to observe strict lockdowns for long periods of time, particularly in Melbourne.
While working remotely has some benefits, it is not an ideal environment to foster teamwork and innovation, particularly as we rolled out our five-year transformation program. Our HR leaders and executive team worked hard to ensure the health and well-being of our employees, and to foster a sense of purpose under difficult conditions.
In 2020 as a result of these extraordinary conditions we elected not to pay the STI to our senior executives but instead reward individuals in the Company for outstanding performance. A small pool of equity service rights was allocated to the best performing leaders and employees across our brands. This pool has been used to recognise the people who delivered superior performance for our clients in a difficult year and to invest in key talent for the future. The decision also included to offer a full reimbursement to all staff on salaries of under $200k who took a voluntary pay cut during 2020, those opting instead to take time off were offered extra annual leave days.
Regardless of the impact of the global pandemic, we remain focused on ensuring our remuneration practices continue to reward for performance and continue to align with the Company’s strategy; to incentivise and motivate our leaders and our staff. Our remuneration principles remain unchanged: accountability, transparency and consistency, as well as, simple, motivating and fair.
In this report we continue to voluntarily disclose the actual cash remuneration received by Senior Executives, in addition to the statutory reporting obligations.
The People & Culture Committee believes that WPP AUNZ’s remuneration framework is fully aligned with and supports the Group’s financial and strategic goals.
As always, we welcome your feedback on our Remuneration Report.
Yours sincerely
Kim AndersonChair, People & Culture Committee
OUR REMUNERATION CHAIR'S LETTER
REMUNERATIONREPORT

WPP AUNZ
20
REMUNERATION REPORT
The Directors of WPP AUNZ Limited present this Remuneration Report for the year ended 31 December 2020. This Remuneration Report outlines our remuneration framework, strategy and practices that apply to key management personnel (“KMP”), and explains how the Group’s 2020 performance has driven their individual remuneration outcomes.
The information in this Report has been prepared and audited as required by the Corporations Act 2001 and forms part of the Directors' Report.
WPP AUNZ’s KMP are assessed each year and comprise the Directors of the Company and Senior Executives. The term “Senior Executives” refers to the Chief Executive Officer and those other executives with authority and responsibility for planning, directing and controlling the activities of the Company and the Group, directly or indirectly.
WPP AUNZ’s KMP for 2020 are outlined in the table below:
Non-executive Directors
Robert Mactier, Non-executive Chairman
Kim Anderson, Non-executive Director
Graham Cubbin, Non-executive Director
Ranjana Singh, Non-executive Director
Geoffrey Wild AM, Non-executive Director
Diane Holland, Non-executive Director - appointed 2 March 2020
Paul Richardson, Non-executive Director - resigned 7 May 2020
Executive Directors
Jens Monsees, Chief Executive Officer and Managing Director ("CEO")
John Steedman, Executive Director and Chief Operating Officer ("COO") - retired 12 October 2020
Other Senior Executive
Chris Rollinson, Chief Financial Officer ("CFO")
John Steedman retired as Executive Director and from his role as COO with effect from 12 October 2020. John Steedman is a KMP in relation to the year ended 31 December 2020.
There were no other changes to the above KMP during the reporting period, or since the end of the reporting period and up to the signing of this report.
The contents of the Remuneration Report are as follows:
Section 1 – Remuneration Strategy and 2020 Remuneration SummarySection 2 – Senior Executives' Remuneration Structure and OutcomesSection 3 – Remuneration of the Chief Executive OfficerSection 4 – Senior Executives' Contract DetailsSection 5 – Senior Executives' Remuneration - Statutory DisclosureSection 6 – Non-executive Directors' RemunerationSection 7 – KMP Holdings of Equity Instruments.
SECTION 1 – REMUNERATION STRATEGY AND 2020 REMUNERATION SUMMARY
1.1 REMUNERATION GOVERNANCEThe Board has established the People and Culture Committee. The People and Culture Committee is primarily responsible for making recommendations to the Board on:
— the over-arching executive remuneration framework;
— operation of the incentive plans which apply to Senior Executives, including the performance conditions, hurdles, and key performance indicators;
— remuneration levels of Senior Executives; and
— Non-executive Director fees.
The Committee's objective is to ensure that remuneration policies and structures are fair, competitive and aligned with the long-term interests of the Group. The Corporate Governance Statement (available in the corporate governance section of the Company’s website at www.wppaunz.com), provides further information on the role of this Committee.
INVOLVEMENT OF INDEPENDENT ADVISORSThe People and Culture Committee operates independently of Senior Executives and engages directly with remuneration advisors. The requirements for external advisors’ services are assessed annually in the context of remuneration matters that the Committee needs to address and external advisors’ recommendations are used as a guide.
The following external advisors were engaged during 2020 to inform the People and Culture Committee’s recommendations and decisions:
Advice and service provided in 2020 External advisor
2020 remuneration framework and incentive programs review assistancePreparation of a new Executive Share Plan ("ESP") grant documentation
Ernst & Young
Independent valuation for 2020 Long-Term Incentive ("LTI") grants
Mercer Consulting (Australia)
For the purpose of the Corporations Amendment (Improving Accountability on Director and Executive Remuneration) Act 2011, no remuneration recommendations in relation to KMP as defined by Division 1 of Part 1.2 of Chapter 1 of the Corporations Act 2001 were provided during 2020.

ANNUAL REPORT 2020
21
1.2 2020 REMUNERATION SUMMARY – KEY DECISIONS AND OUTCOMESThe Company's 2020 financial performance was impacted by the unprecedented challenges presented by the COVID-19 pandemic.
WPP AUNZ's first priority was to ensure the safety and wellbeing of its people and to continue supporting its clients.
The Company has also taken a range of remuneration related decisions to contribute to the business's cost saving program, including the reduction in Senior Executives’ fixed remuneration and Non-executive Directors’ fees, offering a voluntary salary reductions program for the leaders and employees, freezing the annual salary review, and materially reducing the 2020 variable remuneration pool.
Key remuneration decisions and outcomes for the year ended 31 December 2020 are outlined below:
Fixed remuneration — No fixed remuneration increases were applied for the Executive KMPs during the year ended 31 December 2020.
— A company-wide salary freeze was in place during 2020. — Executive KMPs elected to take 20% salary reduction for up to four months to contribute to
the business's cost savings in response to COVID-19. — The senior leaders and other employees elected to take up to 10%-20% salary reduction for
up to four months, with the voluntary salary reductions program ending in July 2020. Short-term incentives ("STI")
— The Board determined that no STI awards would be awarded to the Executive KMPs for the year ended 31 December 2020 under the originally established Short-Term Incentive Plan ("STIP") performance conditions. The decision is in alignment with the Company’s financial results.
— Total Group 2020 STI pool was materially reduced in light of the Company’s financial performance thresholds not being achieved and to ensure the continued viability of the business in the uncertain external environment.
— A small pool of equity service rights was allocated to the best performing leaders and employees across our brands during the year ended 31 December 2020. This pool has been used to recognise the people who delivered superior performance for our clients in a difficult year and also to invest in key talent for the future.
LTI — The 2019 LTIP grant was tested as at 31 December 2020. The two years’ net sales and earnings per share ("EPS") performance thresholds were not achieved, resulting in the forfeiture of all 2019 LTIP awards. This demonstrates strong alignment of Senior Executives’ realised remuneration with shareholders’ outcomes.
— No changes were applied to the 2020 LTIP structure and performance targets established at the beginning of the year (as further outlined in the Section 2.4).
Non-executive Directors' remuneration
— Independent Non-executive Directors elected to reduce their fees by 20% for up to four months starting from April 2020.
1.3 EXECUTIVE REMUNERATION STRATEGY AND FRAMEWORKThe Company’s remuneration objective is to attract, motivate and retain employees to ensure delivery of the business strategy.
The executive remuneration strategy is designed to incentivise and reward executives for improving the financial performance of the Company, increasing shareholder value and achieving a mix of financial and strategic targets that are aligned to the delivery of the Company's long-term strategy. The 2020 executive remuneration strategy also takes into account the transformational goals of the Company over the next three to five years.
The executive remuneration framework has three main components:
— fixed remuneration;
— STI; and
— LTI.
The Board undertook a comprehensive review of the Company’s LTIP and introduced a new plan effective from 1 January 2020. The 2020 LTIP is comprised of the Financial Measures (75%) allocated in Options, and Strategic Measures (25%) allocated in Performance Rights for the achievement of strategic objectives, which recognises there are important projects the Company is undertaking to transform the business and promote future growth. The Board believes that a mix of Options and Performance Rights offered under the 2020 LTIP is an appropriate vehicle for the Company during a period of significant transformation and aligns with the execution of the five-year strategic plan.
The Company aims to provide a level of remuneration which is appropriate to the executive’s position and is competitive to the market. Remuneration levels for all Senior Executives are considered annually through a remuneration review that takes into account market practices and the performance of the Company and the individual.
In structuring the executive remuneration mix for each KMP role, the Board aims to find the balance between fixed and at risk remuneration and to recognise the extent to which each executive influences short and long-term performance outcomes.

WPP AUNZ
22
SECTION 1 – REMUNERATION STRATEGY AND 2020 REMUNERATION SUMMARY (CONTINUED) 1.3 EXECUTIVE REMUNERATION STRATEGY AND FRAMEWORK (CONTINUED)The diagram below outlines the current total remuneration mix for Senior Executives. Values reflect the full year fixed remuneration, STI and LTI target opportunity.
CEO REMUNERATION MIX COO REMUNERATION MIX CFO REMUNERATION MIX
50%
25%
12.5%
12.5%
Fixed STI – Cash STI – Deferred in Share Rights LTI face value at grant – LTIP
48%
25%
13.5%
13.5%
50%
25%
12.5%
12.5%
The table below outlines the executive remuneration elements and how each element of remuneration has been structured to support WPP AUNZ’s business and transformation objectives:
Remuneration component Strategic purpose
Fixed remuneration
Cash — Base salary and statutory superannuation. — Attracts and retains the right talent with required capabilities and experience.
— Provides remuneration in recognition of day-to-day work and responsibilities.
— Established at a market competitive level in relation to the scope, complexity, capabilities and individual performance in the role.
At risk remuneration
STI - Cash and Deferred Share Rights
— Total STI outcomes determined based on: - year-on-year growth in operating profit and net
sales (75% total weighting); and - company-wide strategic, people and culture, and
individual objectives (25% weighting). — 50% of the Senior Executives' STI outcome is paid in
cash and the remaining 50% is deferred in share rights for a period of two years.
— All deferred STI awards are subject to malus and forfeiture provisions.
— The details of the 2020 STIP are further outlined in Section 2.3.
— Aligns remuneration with the annual goals of the Company which support shareholder value and contribute to the execution of the Company's long-term strategy each year.
— Provides appropriate reward for superior Group and individual performance.
— The 50% of the STI award deferred into equity aligns Senior Executives’ remuneration with WPP AUNZ’s future operating performance which in turn drives the share price and assists with retention.
LTIP - Performance Rights and Options
— The LTIP performance is measured over a three-year period.
— 75% of the LTIP is delivered in the form of premium price options. The right to exercise the Options depends on the Company’s share price performance tested at the end of the performance period.
— 25% of the LTIP is based on the award of Performance Rights, with vesting subject to the achievement of Strategic Objectives determined by the Board, including strategic projects in technology, people and culture. Vesting outcomes to be determined in the context of the strategic projects being delivered on time and on budget, and with contribution to the Company’s operating margin improvement.
— At the end of the three-year period Senior Executives have the opportunity to double the number of originally granted Base Options if certain conditions are met, namely if the share price exceeds $1.00 and the Executive remained continuously employed during the additional two-year service period.
— All LTIP awards are subject to clawback and forfeiture provisions.
— The details of the 2020 LTIP are further outlined in Section 2.4.
— Aligns Senior Executives’ interests with those of shareholders.
— Aligns Senior Executives' remuneration with the long-term financial performance of the Group.
— Recognises the importance of the projects the Company is undertaking to transform the business and promote future growth.
— Assists in attracting and retaining key executive talent.
REMUNERATION REPORT (CONTINUED)

ANNUAL REPORT 2020
23
SECTION 2 – SENIOR EXECUTIVES’ REMUNERATION STRUCTURE AND OUTCOMES2.1 REALISED REMUNERATION OF SENIOR EXECUTIVES - VOLUNTARY DISCLOSUREThe following table has been prepared to supplement the statutory requirements in Section 5. The purpose of this table is to provide shareholders with an outline of total remuneration which has been received by Senior Executives during 2020, and to show remuneration received during 2019 for comparative purposes.
The table includes:
— fixed remuneration, reflecting a 20% salary reduction the Senior Executives elected to take for up to four months to contribute to the business's cost savings in response to COVID-19;
— value of cash incentives earned in respect of 2020 and 2019; and
— at risk equity-based remuneration granted to Senior Executives in prior years that vested during 2020 and 2019. The value of the vested equity awards (if any) has been determined using the closing share price on the vesting date.
This is a non-statutory disclosure and does not include termination benefits. Please refer to Section 5 for the statutory remuneration table prepared on accounting treatment basis.
Senior Executives Year
Annual fixed remuneration
(full package)1 $
Fixed remuneration actually paid2
$
Other benefits3
$
Cash STI payable4
$
Deferred STI realised5
$
Vested LTI value6
$
Total remuneration
$
Jens Monsees 2020 1,500,000 1,400,000 392,723 — — 646,234 2,438,957
CEO 2019 1,500,000 375,000 62,500 250,000 — 507,755 1,195,255
John Steedman 2020 950,000 739,238 — — 111,617 49,956 900,811COO 2019 950,000 950,000 — 75,000 15,524 — 1,040,524
Chris Rollinson 2020 420,000 399,000 — — — — 399,000CFO 2019 420,000 420,000 — 52,500 — — 472,500
1. Senior Executives’ 2020 full year contractual fixed remuneration (including base salary, salary sacrificed benefits and where applicable, superannuation).
2. Fixed remuneration received by the Senior Executives during 2020 (including base salary, salary sacrificed benefits and where applicable, superannuation). The actual fixed remuneration amounts reflect the salary reductions as agreed with each Senior Executive.
- John Steedman retired on 12 October 2020 and his actual fixed remuneration amount (i) has been pro-rated; and (ii) factors in the 20% salary reduction for the months of April to July 2020.
3. Other benefits amount represents the total of Jens Monsees’ contractual allowance and his benefits and expenses paid annually by the Company.
- Under the contractual allowance, the Company has set aside a quantum of $250,000 per annum for Mr Monsees’ children’s education expenses and one home trip per year for his family under a 482 Visa. The tax cost (if any) to the Company of providing these benefits will be met from this pool of funds. Any unutilised balance will become payable to Mr Monsees as taxable remuneration; and
- The remaining other benefits amount paid by the Company during 2020 includes the comprehensive health insurance costs for the CEO and his family, the expenses relating to their relocation to Australia and a return business class airfare.
4. Cash STI payable is the non-deferred portion of STI paid in respect of the current performance period and represents 50% of the total achieved STI:
- No STI was payable to John Steedman for the year ended 31 December 2020 as he was not eligible to receive an award according to the terms of the 2020 STIP; and
- No STI award was payable to the eligible Senior Executives for the year ended 31 December 2020.
5. The amounts represent the value of John Steedman’s deferred STI awarded in previous years in respect of his prior performance that vested during 2020 and 2019:
- 2020 value for John Steedman represents the total of 259,574 STIP performance shares vested on 12 October 2020 at a market share price of $0.43. The Board determined that 122,962 performance shares relating to the deferred portion of John Steedman’s 2018 STI and 136,612 performance shares relating to the deferred portion of his 2019 STI vest on the date of John Steedman’s retirement to acknowledge his outstanding contribution to the Company. It is anticipated that the shares would be released to John Steedman during the first trading window in 2021.
6. This amount represents the LTI awards that vested during 2020 and 2019:
- 2020 value for Jens Monsees pursuant to the 923,191 rights (Tranche 2 of the one-time grant) he received on commencement. The rights vested on 31 December 2020 at a share price of $0.70. It is anticipated that the shares in respect of the vested rights would be released to Jens Monsees during the first trading window in 2021;
- 2020 value for John Steedman is based on the total of 116,177 rights vested on 12 October 2020 at a market share price of $0.43. The Board determined that 64,816 rights relating to his 2018 share ownership grant and 51,361 rights relating to 2019 grant vested on the date of John Steedman’s retirement to recognise his contribution to the Group and his leadership through the transformation. The rights were contingent on continued service. It is anticipated that the shares in respect of the vested rights would be released to John Steedman during the first trading window in 2021; and
- Performance hurdles under the 2019 LTIP were not achieved on the basis of the 31 December 2020 performance test and all performance rights relating to the 2019 LTIP grants were forfeited as further outlined in the Section 2.4.

WPP AUNZ
24
SECTION 2 – SENIOR EXECUTIVES’ REMUNERATION STRUCTURE AND OUTCOMES (CONTINUED)2.2 FIXED REMUNERATIONSenior Executives receive fixed remuneration and benefits structured as a total employment cost package which may be delivered as a combination of cash and prescribed non-financial benefits. There is no guaranteed base pay increase included in any Senior Executive's contract.
Fixed remuneration reflects the role scope and the individual’s skills and experience. It is reviewed annually in line with the remuneration policy, and individual and Group performance, taking into consideration market competitiveness and other business and talent-critical factors.
The 2020 annual review resulted in no fixed remuneration increases for the Senior Executives.
Actual Senior Executives’ fixed remuneration for the year ended 31 December 2020 was adjusted to reflect the 20% voluntary salary reductions taken by Senior Executives for a period of up to four months.
2.3 SHORT-TERM INCENTIVESSTI is an annual at risk incentive delivered in the form of cash and deferred equity awards. Senior Executives’ STI outcomes are based on total Group and individual performance.
The purpose of STI is to incentivise Senior Executives to deliver or exceed year-on-year business growth and to reward strong, sustainable performance as assessed against a balanced scorecard established under the WPP AUNZ STIP.
The Board believes that the contribution of the financial and non-performance measures established under the STIP are effective to ensure alignment with the interests of the shareholders and the long-term growth of the Company.
Key features of the 2020 STIP are outlined below:
STI opportunity At the beginning of the year, the People and Culture Committee determines the target STI opportunity for each Senior Executive. Target STI is determined as a percentage of annual fixed remuneration.The minimum STI outcome is zero and the maximum STI outcome is awarded only if WPP AUNZ delivered stretch performance targets against the annual financial, strategic, and people and culture targets and the Senior Executive made significant contribution to these results and delivered outstanding performance on individual strategic objectives.The following 2020 STI target and maximum opportunity was determined for the Senior Executives:
Target STI Maximum STI (cap)
Senior Executives % fixed remuneration $ % fixed remuneration $
CEO 50% 750,000 150% 2,250,000
COO1 58% 550,000 87% 825,000
CFO 50% 210,000 75% 315,000
1. The Board determined that no STI will be payable to John Steedman for the year ended 31 December 2020 as he retired as an executive of the Group on 12 October 2020 and was not eligible to receive STI awards according to the STIP terms.
Performance period 1 January - 31 December 2020
STI award delivery STI cash component - subject to the Board approval, 50% of the achieved 2020 STI award for eligible Senior Executives to be paid in cash shortly after the date of announcement of the full year results for the year ended 31 December 2020.STI deferred equity component - subject to a Board approval, the remaining 50% of the achieved 2020 STI award to be delivered in the form of the share rights (“STIP Performance Rights”) and deferred for a two-year period.The number of 2020 STIP Performance Rights is to be determined on the face value method, based on the volume weighted average price ("VWAP") over the 30 days immediately prior to the release of the Company's financial results for the year ended 31 December 2020. STIP Performance Rights will vest on 31 December 2022 subject to continuous service until this date, after which they will be allocated as shares to the Senior Executives in the first available trading window in February 2023.Under the Share Ownership Plan Rules which govern the STI, the Board maintains discretion to settle STI Performance Rights in cash.STIP Performance Rights do not carry any voting rights and Senior Executives are not eligible to the dividends before the rights vest and shares are allocated.
REMUNERATION REPORT (CONTINUED)

ANNUAL REPORT 2020
25
Performance conditions The total 2020 STI outcomes for the eligible Senior Executives are subject to achieving the set of financial (75%) and non-financial (25%) performance conditions. This provides a balance between rewarding the achievement of Group financial and strategic objectives that drive the execution of the Group transformation plan.STIP peformance conditions are recommended by the People and Culture Committee and approved by the Board and are the key measures linked to WPP AUNZ long-term strategy and value creation for the shareholders. The table below outlines the STIP performance conditions, measures, and their weighting relating to the 2020 STI outcomes:
Performance category STIP measuresWeighting
%
Financial Net Sales 37.5%
Operating Profit 37.5%
Non-financial Strategic, people and culture, and individual objectives 25%
Each 2020 STIP measure is assessed independently.The Board retains discretion to adjust the STIP Performance Conditions and how they are measured, to ensure that executives are neither advantaged nor disadvantaged by matters that affect the STIP Performance Conditions (e.g. by excluding one-off items or the impact of significant changes to the business, acquisitions or disposals).
Financial performance measures – 75%
Financial performance measures relating to 75% of the total 2020 STI outcome are based on WPP AUNZ achieving the requirements under two equally weighted measures: Net sales and Operating Profit. The Board established specific performance requirements for each financial measure at Threshold, Target and Stretch (Maximum) levels. No STI will be awarded in respect of the financial performance component unless WPP AUNZ achieves the minimum financial performance requirements (Threshold) established by the Board. The table below outlines the indicative 2020 STIP outcomes relating to financial component for the eligible Senior Executives at Threshold, Target and Stretch levels:
Senior Executives STI measuresWeighting
% Threshold TargetStretch/Maximum
Jens Monsees Net Sales ($million) vs 2019 50% $70,313 $281,250 $843,750
CEO Operating Profit ($million) vs 2019 50% $70,313 $281,250 $843,750
Total $140,626 $562,500 $1,687,500
Chris Rollinson Net Sales ($million) vs 2019 50% $19,687 $78,750 $118,125
CFO Operating Profit ($million) vs 2019 50% $19,687 $78,750 $118,125
Total $39,374 $157,500 $236,250
A straight-line scale will apply to determine the 2020 STI outcome from Threshold performance through to Target performance and up to each Senior Executive's Maximum STI for overperformance in respect of the 75% financial component.
Non-financial strategic performance measures - 25%
The non-financial strategic performance relating to 25% of the total 2020 STI outcome is based on company-wide strategic people and culture, and individual objectives determined by the Board.
The measures within the 25% STIP component recognise the importance of the Company strategic priorities, employee engagement and diversity initiatives in achieving the Company transformation plan.
The individual objectives set by the Board are to ensure they are role-specific, aligned to Company strategy and sufficiently challenging for each Senior Executive.
The table below outlines the indicative 2020 STIP outcomes relating to the non-financial component for the eligible Senior Executives at Target and Stretch levels:
Senior Executives STI measures TargetStretch/Maximum
Jens Monsees CEO Strategic, people and culture, and individual objectives $187,500 $562,500
Chris Rollinson CFO Strategic, people and culture, and individual objectives $52,500 $78,750

WPP AUNZ
26
Specific performance requirements
Specific performance requirements are based upon business strategic priorities and determined annually. Specific financial performance objectives under the 75% financial component of STIP at Threshold, Target, and Stretch are established with reference to the prior year performance results and current year budget.Company financial performance, strategic, and Senior Executives' individual strategic objectives under the STIP are commercially sensitive, considering WPP AUNZ's position within the industry and disclosing the precise details of the objectives would potentially put the Group at a competitive disadvantage.
Performance assessment under STIP
Performance outcomes against WPP AUNZ financial, strategic, people and culture and Senior Executives' individual objectives under the STIP is assessed by the People and Culture Committee and STI award recommendations are made to the Board for approval.The Board retains discretion in determining the overall outcome of the STI awards to ensure it is consistent with the performance of the Group and of the individual Senior Executive. The 2020 STI outcomes for the Senior Executives are further presented in this section.Under the Share Ownership Plan Rules which govern the STI, the Board maintains discretion to settle STI Performance Rights in cash.
STI treatment on employment cessation
To be eligible to receive an STI award under the 2020 STIP, the Senior Executive must be employed on the award payment date and not be in a period of termination notice, unless the Board determines otherwise.The treatment of the unvested deferred portion of an STI award will depend on the circumstances of the cessation. If the Senior Executive ceases employment due to resignation or termination for cause, all unvested STIP Performance Rights will automatically lapse.The Board has discretion to determine whether the Senior Executive retains any unvested STIP Performance Rights relating to the prior years’ STI performance outcomes if the Senior Executive leaves for reasons that do not result in automatic forfeiture. The retained STIP Performance Rights upon cessation of employment generally remain the subject to the original deferral period. The Board retains the ultimate discretion to determine that a different treatment applies to the unvested deferred STI in special circumstances (e.g. retirement) and giving regard to the Senior Executive's past performance.
Malus provision – deferred STI
The Board has discretion to forfeit part or all of any unvested deferred STI prior to vesting where it transpires that the award would provide an executive with an unfair benefit (e.g. in circumstances where there has been a material misstatement, employee misconduct, executive breach of obligations in relation to confidentiality and restrictive covenants, or fraud).
2020 STI performance against financial objectives (75% of the award)The Board determined that the Group did not achieve the financial performance threshold under the 2020 STIP in relation to both Operating Profit and Net Sales performance. This resulted in no STI award being available under the 75% financial component of the STIP for eligible Senior Executives.
2020 STI performance against strategic, people and culture, and individual objectives (25% of the award)The Board determined that no STI would be payable to the eligible Senior Executives for the year ended 31 December 2020 under the originally established non-financial strategic objectives component of the 2020 STIP. The decision was made as a result of the impact of COVID-19 on the Company’s performance to ensure continued viability of the business.
2020 STI outcomes Based on the outcomes set out above, actual STI awards for the year ended 31 December 2020 for each Senior Executive were:
Senior Executives YearTarget STI
$
Actual STI achieved
$
Actual STI as %
of target
Actual STI as % of
maximum
% of maximum STI
forfeited¹
Actual STI payable in cash
$
Actual STI deferred face
value $
Jens MonseesCEO
2020 750,000 — 0% 0% 100% — —
John Steedman2
COO2020 550,000 — 0% 0% 100% — —
Chris RollinsonCFO
2020 210,000 — 0% 0% 100% — —
1. Where the STI payment is less than the maximum opportunity, the difference is forfeited and is not payable in the subsequent year. The minimum STI is $Nil if no performance conditions are met.
2. John Steedman was not eligible for the STI payment for the year ended 31 December 2020 under the terms of the 2020 STIP.
REMUNERATION REPORT (CONTINUED)
SECTION 2 – SENIOR EXECUTIVES’ REMUNERATION STRUCTURE AND OUTCOMES (CONTINUED)2.3 SHORT-TERM INCENTIVES (CONTINUED)

ANNUAL REPORT 2020
27
WPP AUNZ performance and the link to STI outcomes The table below shows WPP AUNZ performance over the past five years and correlation between Senior Executives’ STI outcomes:
WPP AUNZ performance 2020 2019 2018 2017 2016
Headline net profit after tax ("NPAT") ($million)¹ 34.9 62.9 71.5 83.6 81.1
Headline NPAT growth (%) (44.5) (12.0) (14.5) 3.1 104.8
Headline EPS (cents)¹ 4.1 7.4 8.4 9.8 9.5
TSR (% per annum)2 28.4 4.7 (31.2) (18.7) (58.7)
Proportion of maximum STI achieved - CEO (%) — — — 10.0 25.0
Proportion of maximum STI achieved - other Senior Executives (%) — 17.5 21.0 13.5 25.0
1. A reconciliation of the Group's statutory and headline profit is disclosed in the Operating and Financial Review section of the Annual Report. The 2020 headline NPAT includes the impact of AASB 16 Leases.
2. Total shareholder return ("TSR") is calculated as the movement in the share price and dividends received assuming reinvestment of dividends.
2.4 LONG-TERM INCENTIVES The LTIP provides eligible employees an opportunity to receive fully paid ordinary shares in WPP AUNZ on vesting/exercise (as applicable) of the LTIP Options and LTIP Performance Rights, subject to specific pre-determined Group performance measures being met over a three-year period and continuous service until the vesting date.
The 2020 LTIP Options include the grant of Base Options and an opportunity to participate in an additional grant of options ("Transformation Award"), subject to the Company achieving a pre-determined share price performance and an additional two years' continuous service requirement.
Key features of the 2020 LTIP are outlined below:
LTI opportunity At the beginning of each year, the Board, advised by the People and Culture Committee, establishes the face value of the LTIP target and maximum opportunity for each eligible Senior Executive. The LTI opportunity reflects accountabilities and influence over the Company's long-term performance within each role and established in a context of a total remuneration mix. The following 2020 LTI target and maximum opportunity was determined for the Senior Executives:
Senior Executives Target LTI opportunity – face value $ Maximum LTI opportunity – face value $
CEO 750,000 1,500,000
COO 500,000 1,000,000
CFO 210,000 367,500
Performance period LTIP performance is measured over the three-year period, commencing on 1 January 2020 and ending 31 December 2022.
LTI delivery 75% of the LTIP is delivered in the form of LTIP Options with vesting subject to the Company share performance and continuous service. The LTIP Options comprise:
Base Options Granted to the participants during the year ended 31 December 2020; and
Transformation Award An opportunity to receive the additional grant of options equal in quantum to the number of Base Options in or around March 2023, provided the Company share price on the Base Options Vesting Date is equal to or exceeds $1.00 ("Transformation Hurdle") and the participant remains with the Company until this date.
25% of the LTIP delivered in the form of Performance Rights for the achievement of Strategic Objectives and continuous service. The Strategic Objectives represent key initiatives the Company as a group is undertaking to transform to future sustainability and growth.

WPP AUNZ
28
SECTION 2 – SENIOR EXECUTIVES’ REMUNERATION STRUCTURE AND OUTCOMES (CONTINUED)2.4 LONG-TERM INCENTIVES - EXECUTIVE SHARE PLAN (CONTINUED)
Allocation approach The number of LTIP Performance Rights and LTIP Options for eligible participants was determined on the basis of a face value allocation methodology:
LTIP Performance Rights
Allocated with reference to the VWAP of the Company's shares for the 30 days leading up to 31 December 2019 ($0.57).
LTIP Options Allocated with reference to a 20% premium to the VWAP of the Company's shares for the 90 days leading up to 31 December 2019 ($0.61).
The shareholders approved at the 2020 Annual General Meeting the allocation of 2020 LTIP Options and Performance Rights for the CEO and COO determined on the basis of their maximum 2020 LTI opportunity.The allocation of 2020 LTIP Base Options and Performance Rights for other eligible participants was determined on the basis of their 2020 target LTI opportunity. All LTIP participants qualify for the additional options equal in quantum to the granted Base Options subject to the service requirements and Transformation Hurdle being met.The details of the LTI granted to the Senior Executives during 2020 is further included in this section.
Expiry date The expiry date of the LTIP awards is the five year anniversary after the close of the trading window following the Base Option Vesting Date.
2020 LTIP OPTIONS (75%) – KEY TERMSExercise price The exercise price for LTIP Options will be $0.61, being a 20% premium to the VWAP of the Company's shares
for the 90 days leading up to 31 December 2019.This exercise price applies to both the Base Options and the Transformation Award.
Performance conditions The LTIP Options are subject to the Company share price performance measured at the end of the LTIP Performance Period and continuous service until the Vesting Date:
Base Options Provided the participant satisfied continuous service requirement, the opportunity to exercise the Base Options will arise on the first day of the first available trading window after the Vesting Date if the Company share price is equal to or exceeds the exercise price ($0.61).
Transformation Award The Transformation Hurdle must be met (Company share price is equal to or exceeds $1.00) at the LTIP Base Options Vesting Date to qualify for the additional grant of options.Provided the participant satisfied two additional years of continuous service, the opportunity to exercise the additional grant of options will arise on the first day of the first available trading window in 2025.
Performance testing The Company share price performance will be tested shortly after the end of the LTIP Performance Period. The share price will be tested based on the VWAP of the Company's shares for the 90 days leading up to 31 December 2022.Based on the testing results, the number of Base Options that will be eligible to vest (if any) and the number of additional options that will be granted (if any), will be determined by the Board. Any Base Options that do not vest will lapse immediately, and no Transformation Award will be granted with respect to these Base Options.The Board reserves the right to adjust vesting outcomes if a material event occurs between the end of the Performance Period and the Vesting Date.
Vesting date The LTIP Options Vesting Date are as follows:
Base Options The date of announcement of the Company's full year results for the year ending 31 December 2022, which will be in or around February 2023.
Transformation Award The date of announcement of the Company's full year results for the year ending 31 December 2024, which will be in or around February 2025.
Cashless exercise The Company may provide an arrangement whereby the vested LTIP Options entitlement for each participant can be exercised and the resulting shares can be sold in one transaction with the sale proceeds provided in cash. The sale proceeds will consist of the difference between the exercise price and the market price of the share, less broker's fees, taxes and relevant deductions.
REMUNERATION REPORT (CONTINUED)
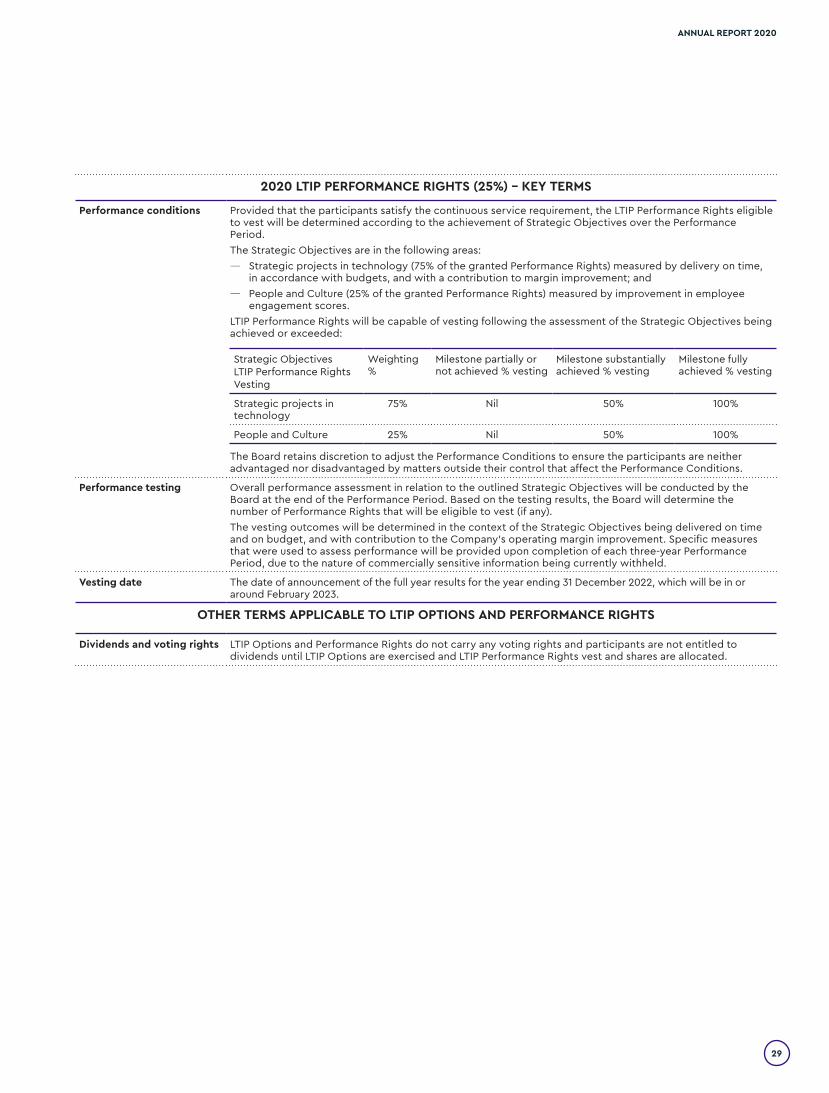
ANNUAL REPORT 2020
29
2020 LTIP PERFORMANCE RIGHTS (25%) – KEY TERMS
Performance conditions Provided that the participants satisfy the continuous service requirement, the LTIP Performance Rights eligible to vest will be determined according to the achievement of Strategic Objectives over the Performance Period.The Strategic Objectives are in the following areas:
— Strategic projects in technology (75% of the granted Performance Rights) measured by delivery on time, in accordance with budgets, and with a contribution to margin improvement; and
— People and Culture (25% of the granted Performance Rights) measured by improvement in employee engagement scores.
LTIP Performance Rights will be capable of vesting following the assessment of the Strategic Objectives being achieved or exceeded:
Strategic Objectives LTIP Performance Rights Vesting
Weighting %
Milestone partially or not achieved % vesting
Milestone substantially achieved % vesting
Milestone fully achieved % vesting
Strategic projects in technology
75% Nil 50% 100%
People and Culture 25% Nil 50% 100%
The Board retains discretion to adjust the Performance Conditions to ensure the participants are neither advantaged nor disadvantaged by matters outside their control that affect the Performance Conditions.
Performance testing Overall performance assessment in relation to the outlined Strategic Objectives will be conducted by the Board at the end of the Performance Period. Based on the testing results, the Board will determine the number of Performance Rights that will be eligible to vest (if any).The vesting outcomes will be determined in the context of the Strategic Objectives being delivered on time and on budget, and with contribution to the Company's operating margin improvement. Specific measures that were used to assess performance will be provided upon completion of each three-year Performance Period, due to the nature of commercially sensitive information being currently withheld.
Vesting date The date of announcement of the full year results for the year ending 31 December 2022, which will be in or around February 2023.
OTHER TERMS APPLICABLE TO LTIP OPTIONS AND PERFORMANCE RIGHTS
Dividends and voting rights LTIP Options and Performance Rights do not carry any voting rights and participants are not entitled to dividends until LTIP Options are exercised and LTIP Performance Rights vest and shares are allocated.

WPP AUNZ
30
Treatment on employment cessation
Unvested LTIP awards:The treatment of the unvested LTIP Base Options and Performance Rights will depend on the circumstances of the cessation outlined below:
Participant ceases employment prior to the Vesting Date due to resignation or termination for cause
All unvested LTIP Base Options and Performance Rights will automatically lapse.
Participant ceases employment for any other reason
Unvested LTIP Base Options and Performance Rights will be pro-rated based on the proportion of the three-year performance period which has elapsed at the date of cessation. The pro-rated number of LTIP Base Options and Performance Rights will stay on foot until the Vesting Date subject to the original Performance Conditions being satisfied.
All unvested Transformation Options will automatically lapse if the participant ceases employment prior to the Vesting Date for any reason. The treatment of unexercised vested LTIP awards are outlined below:
Participant ceases employment prior to exercising vested LTIP awards due to termination for cause
All of the vested, but not exercised LTIP Options, and/or Performance Rights will automatically lapse.
Participant ceases employment for any other reason
All vested LTIP Options and Performance Rights are required to be exercised within 90 days following the cessation of employment, unless the Board determines otherwise.In the event that the 90-day period falls outside of one of the Company's trading windows, this 90-day period will commence at the start of the next trading window.
The Board has discretion to determine whether a different treatment should apply to unvested and unexercised LTIP Options and Performance Rights upon cessation of employment.
Clawback provisions The Board may (as defined in the LTIP Rules), in its absolute discretion, and subject to applicable laws, determine that some or all of the options and rights granted under the LTIP will lapse in certain circumstances and that within three years following vesting, deem all or any shares allocated following vesting (or exercise, as applicable) to have forfeited, where they believe an unfair benefit may be obtained due to fraud, gross misconduct or material misstatement or failure to comply with restrictions on transfer and hedging of rights, and executive breach of obligations in relation to confidentiality and restrictive covenants. In addition, within the three years following vesting where shares that have been allocated to LTIP participant have been subsequently sold, the Board retains full discretion to require that the participants repay the net proceeds of such a sale.
Change of control Under the LTIP Rules, the Board has discretion to determine the treatment of vested and unvested LTIP Options and Performance Rights, as well as the timing of such treatment if a change of control event occurs (as defined in the LTIP Rules).
Cash settlement The Board retains discretion to settle the vested LTIP Options and Performance Rights entitlement for each participant in a cash equivalent value less exercise price net of applicable tax withholdings and statutory superannuation (where applicable) in lieu of an allocation of the shares. The Cash Equivalent Value will be calculated with reference to the VWAP of the Company's shares for the five days up to and including the date of exercise.
Hedging The terms and conditions surrounding the LTIP do not allow participants to hedge against future performance by entering into any separate equity or other arrangements.
REMUNERATION REPORT (CONTINUED)
SECTION 2 – SENIOR EXECUTIVES’ REMUNERATION STRUCTURE AND OUTCOMES (CONTINUED)2.4 LONG-TERM INCENTIVES - EXECUTIVE SHARE PLAN (CONTINUED)

ANNUAL REPORT 2020
31
LTI granted in 2020
The details of LTIP Performance Rights granted to the Senior Executives during 2020 under the LTIP are set out below:
Senior Executives
Allocation Price
$
Performance Rights
granted
Maximum fair value at grant1
$ Grant date Vesting date Expiry date
Performance Rights held
at the end of the year
Maximum fair value at the end of the
year1
$
Jens Monsees CEO 0.57 657,895 178,947 21-Sep-20 Feb-23 Feb-28 657,895 178,947
John Steedman COO 0.57 438,596 119,298 21-Sep-20 Feb-23 Feb-28 121,832 33,138
Chris Rollinson CFO 0.57 92,105 25,053 21-Sep-20 Feb-23 Feb-28 92,105 25,053
The details of LTIP Base Options granted to the Senior Executives during 2020 under the LTIP are set out below:
Senior Executives
Allocation Price
$
Base Options granted
Exercise price
$
Maximum fair value at
grant1
$ Grant dateVesting
date Expiry date
Base Options
held at the end of the
year
Maximum fair value at the end of the year1
$
Jens Monsees CEO 0.61 922,131 0.61 39,652 21-Sep-20 Feb-23 Feb-28 922,131 39,652
John Steedman COO 0.61 614,754 0.61 26,434 21-Sep-20 Feb-23 Feb-28 170,765 7,343
Chris Rollinson CFO 0.61 258,197 0.61 11,102 21-Sep-20 Feb-23 Feb-28 258,197 11,102
1. Maximum fair value assumes that performance conditions are fully achieved. The minimum value of the grant, if the applicable vesting conditions are not met, is $Nil in all cases. The fair value of performance options and rights was determined at the time of grant in accordance with AASB 2 Share-Base Payment principles and applies for accounting purposes only. Further details on the calculation of the fair value can be found in Note 29 to the financial statements.
The Board determined that LTIP Base Options and Performance Rights for John Steedman were pro-rated at the date of his retirement in accordance with the terms of the 2020 LTIP and applicable Plan Rules. The pro-rated awards will stay on foot subject to the post-employment vesting at the original vesting date and the applicable performance conditions being met.
Transformation Award under 2020 LTIPJens Monsees and Chris Rollinson are eligible to participate in the additional grant of options equal to the number of the originally granted Base Options, provided the Transformation Hurdle and applicable service requirements are met.
2019 LTIP tested in 2020As at 31 December 2020, the performance hurdles were tested for the 2019 LTIP. WPP AUNZ did not achieve threshold performance under the 2019 LTIP for the two-year compound annual growth rate ("CAGR") growth in normalised organic revenue ("NOR")/Net Sales and EPS. No performance rights pursuant to the 2019 LTIP were determined eligible for vesting and all were forfeited. LTIP outcomes under the 2019 LTIP were determined based on the following minimum performance thresholds:
EPS NOR/Net Sales
— The EPS performance threshold was achieving a minimum of 2.5% or above CAGR growth over two years over the baseline.
— The EPS baseline used was 8.4 cents.
— The NOR/Net Sales performance threshold was achieving the minimum of flat or above CAGR growth over two years over the baseline.
— The NOR/Net Sales baseline used was $857.3 million.
The above minimum performance thresholds needed to be achieved under both the EPS and NOR/Net Sales hurdles to qualify for any vesting under the 2019 LTIP.
WPP AUNZ performance and the link to LTI outcomes A summary of performance rights vesting under the LTIP for the last four years is outlined in the following table:
Grant year LTIPPerformance
test dateEPS growth – minimum
performance hurdle
NOR/Net Sales growth – minimum performance hurdle
TSR – minimum performance hurdle
Vested¹%
Forfeited%
2016 2016 - 2018 31-Dec-18 Not achieved n/a Not achieved — 100%
2017 2017 - 2019 31-Dec-18 Not achieved Not achieved n/a — 100%
2018 2018 - 2021 31-Dec-19 Not achieved Not achieved n/a — 100%
2019 2019 - 2022 31-Dec-20 Not achieved Not achieved n/a — 100%
1. All LTIP participants had the same vesting and forfeiture outcome.

WPP AUNZ
32
SECTION 3 – REMUNERATION OF THE CHIEF EXECUTIVE OFFICER
Jens Monsees was CEO and Executive Director of WPP AUNZ during 2020.
Total remuneration level and remuneration structure for the CEO was recommended by the People and Culture Committee and approved by the Board.
Total remuneration level for the CEO was established with the consideration of the benchmarks against comparable international roles and in a context of the complexity of the portfolio of diverse WPP AUNZ brands and segments, Company’s revenue and employee base, and highly sought after digital and transformation capabilities being essential for this role.
Jens Monsees’ 2020 remuneration structure is outlined below.
3.1 FIXED REMUNERATIONMr Monsees’ annual fixed contractual remuneration for the year ended 31 December 2020 was $1,500,000 (2019: $1,500,000).
Mr Monsees’ actual fixed remuneration for the year ended 31 December 2020 was adjusted to $1,400,000. The adjusted fixed remuneration is reflective of the 20% salary reduction the CEO elected to take during the months of April to July 2020 to contribute to the business's cost savings in response to COVID-19.
3.2 SHORT-TERM INCENTIVESMr Monsees was eligible to participate in WPP AUNZ’s 2020 STIP.
For the year ended 31 December 2020, Mr Monsees had the opportunity to earn $750,000 STI for on-target performance and a maximum STI potential of $2,250,000. The target opportunity and a maximum potential under the STIP were contractually determined at the time of the CEO’s commencement, representing 50% and 150% of his fixed annual remuneration respectively.
In the beginning of the year, the Board established that 75% of the CEO’s 2020 STI opportunity was dependent on the achievement of the Company’s 2020 financial performance objectives (Net Sales and Operating Profit improvement) and 25% of the STI opportunity was dependent on the achievement of the strategic, people and culture, and his individual objectives. 50% of the achieved 2020 STI award would be payable to the CEO in cash and the remaining 50% would be deferred in the form of the share rights for two years.
No STI award was paid to the CEO for the year ended 31 December 2020 under the structure and performance conditions outlined above.
3.3 LONG-TERM INCENTIVES - EXECUTIVE SHARE PLANThe 2020 LTI opportunity for the CEO was determined at the time of his commencement. The CEO’s 2020 target LTI was $750,000 and the maximum LTI opportunity was $1,500,000.
During the year ended 31 December 2020, Mr Monsees received the grant of 657,895 LTIP Performance Rights and 922,131 LTIP Base Options under the terms of the 2020 LTIP (as outlined in Section 2.4).
In addition, the CEO would be eligible to participate in the additional grant of options, equal in quantum to the originally granted Base Options (922,131), provided the Transformation Hurdle and continuous service requirement are met.
The outlined above LTIP grants represent the CEO’s 2020 maximum LTI opportunity and were approved the shareholders at the 2020 Annual General Meeting.
3.4 ONE-TIME SHARE OWNERSHIP GRANT OF RIGHTSIn recognition of bonus and related entitlements that were forfeited as a result of accepting the role with WPP AUNZ, Mr Monsees was provided with a one-time grant of rights on commencement in October 2019 with a grant value of $1,500,000 of WPP AUNZ shares.
The number of rights granted to Jens Monsees was determined, based on the VWAP of WPP AUNZ shares over the 10 trading days immediately preceding 27 May 2019 (the date his appointment was announced on the ASX), resulting in three equal tranches of 923,191 rights.
WPP AUNZ will source the shares on market in order to satisfy the vested rights.
923,191 Tranche 1 Rights vested on 31 December 2019 and the shares were released to Mr Monsees during the year ended 31 December 2020. Tranche 1 shares will remain the subject to the trading restrictions until the first trading window, following 31 December 2020.
In respect to Tranches 2 and 3 Rights, if Mr Monsees’ employment terminates for reasons other than dismissal, unsatisfactory performance or resignation:
— between 1 January 2020 and 31 December 2020, the second tranche will vest and remaining unvested rights will lapse; and
— between 1 January 2021 and 31 December 2021, the third tranche will vest.
REMUNERATION REPORT (CONTINUED)

ANNUAL REPORT 2020
33
The summary of the Tranche 2 and Tranche 3 rights are outlined below:
One-time SOP grant Grant date
Face value at grant
$VWAP
$Rights
grantedVesting
date
Fair value of rights1
$
Minimum fair value of grant2
$
Maximum fair value of
grant2
$
Tranche 2 01-Oct-19 500,000 0.5416 923,191 Dec-20 0.46 — 424,668
Tranche 3 01-Oct-19 500,000 0.5416 923,191 Dec-21 0.43 — 396,972
1. The fair value of rights was determined at the time of grant and applied for accounting purposes only at the time of grant.
2. Maximum fair value assumes that performance conditions are fully achieved. The minimum value of the grant, if the applicable vesting conditions are not met, is $Nil in all cases.
923,191 Tranche 2 Rights vested on 31 December 2020 and the shares in respect of the vested rights will be released to Mr Monsees during the first trading window, following the release of the Company’s financial results for the year ended 31 December 2020.
3.5 OTHER BENEFITSThe Company has set aside an amount of $250,000 per annum in total, for Mr Monsees’ children’s education expenses and one home trip per year for his family under a 482 Visa. The tax cost (if any) to the Company of providing these benefits will be met from this pool of funds. Any unutilised balance will become payable to Mr Monsees as taxable remuneration.Costs for comprehensive health insurance for Mr Monsees and his family, as well as two return business class airfares for business purposes for Mr Monsees and his spouse, are also paid annually by the Company. Reasonable relocation and repatriation costs for Mr Monsees and his family will be paid by the Company. The total CEO’s contractual benefits and expenses paid by the Company for the year ended 31 December 2020 amounted to $392,723.
SECTION 4 – SENIOR EXECUTIVES’ CONTRACT DETAILSTerms of employment for Senior Executives are contained in written employment agreements. These employment agreements are unlimited in term, but may be terminated by written notice by either party. They may also be terminated with cause, as set out below:
— termination of employment without notice and without payment in lieu of notice: the Company may terminate the employment of the Senior Executive without notice and without payment in lieu of notice in some circumstances. Generally, this includes in the event of any act which detrimentally affects the Company such as dishonesty, fraud or serious or willful misconduct; or
— termination of employment with notice and with payment in lieu of notice: the Company may terminate the employment of the Senior Executive at any time by giving them notice of termination and may provide the amount of notice required from the Company in these circumstances as set out in the below table. WPP AUNZ may alternatively give payment in lieu of notice.
Senior Executive Jens Monsees John Steedman1 Chris Rollinson
Role CEO COO CFO
Contract expiry date Ongoing n/a Ongoing
Fixed remuneration (full year contractual salary) 2020 - $1,500,0002019 - $1,500,000
2020 - $950,0002019 - $950,000
2020 - $420,0002019 - $420,000
Termination benefit (Company initiated) 12 months’ notice 6 months’ notice 6 months’ notice (from 1 January 2021 onwards)2
Termination benefit (employee initiated) 12 months’ notice 6 months’ notice 6 months’ notice (from 1 January 2021 onwards)2
Non-solicitation of personnel and clients 12 months 12 months 12 months
Non-compete 12 months 12 months 12 months
1. John Steedman ceased his employment with the Group as COO and Executive Director on 12 October 2020.
2. The notice periods for Chris Rollinson were reviewed during 2020 (with effect from 1 January 2021) under his 2020 employment contractual terms. The notice periods from 1 January to 31 December 2020 under his 2020 contractual terms represented 12 months relating to the Company-initiated termination and three months relating to the employee-initiated termination.

WPP AUNZ
34
SECTION 5 – SENIOR EXECUTIVES' REMUNERATION – STATUTORY DISCLOSUREThe following table outlines total remuneration for Senior Executives for the year ended 31 December 2020, as well as comparative figures for the year ended 31 December 2019, as required under the Corporations Act 2001 and has been prepared in accordance with Accounting Standards.
The LTI values in the table below represent the amortised accounting expense of all unvested grants during the year and accordingly, are not reflective of the actual value delivered to Senior Executives that has been voluntarily disclosed in the "Realised Remuneration" table in Section 2.1.
Short-term employee benefits
Post-employment
Share-based payments
Other long-term benefits4
Base salary1
Cash STI2
Superannuation contributions
Deferred STI LTI3
Long service
leaveTermination
benefit5Other
benefits6Total
remunerationTotal
at riskTotal in LTI
Senior Executives Year $ $ $ $ $ $ $ $ $ % %
Jens Monsees 2020 1,400,000 — — — 500,854 26,548 — 392,723 2,320,125 22% 22%
CEO 2019 375,000 250,000 — — 461,596 6,601 — 62,500 1,155,697 62% 40%
John Steedman 2020 710,658 — 28,580 — 47,490 12,805 642,673 — 1,442,206 3% 3%
COO (retired 12 October 2020) 2019 929,233 75,000 20,767 75,000 20,941 16,378 — — 1,137,319 15% 2%
Chris Rollinson 2020 377,652 — 21,348 — 28,039 6,884 — — 433,923 6% 6%
CFO 2019 399,233 52,500 20,767 — 13,552 6,914 — — 492,966 13% 3%
Total 2020 2,488,310 — 49,928 — 576,383 46,237 642,673 392,723 4,196,254 14% 14%
2019 1,703,466 377,500 41,534 75,000 496,089 29,893 — 62,500 2,785,982 34% 18%
1. Base salary includes any salary sacrifice benefits and accrued annual leave paid out as part of salary and represents executives’ actual earnings during the year ended 31 December 2020 and the comparative figures for 2019. The 2020 amounts reflect 20% base salary reductions each Senior Executive elected to take for up to four months to contribute to the business's cost savings in response to COVID-19.
- John Steedman ceased to be a KMP on 12 October 2020 and his actual 2020 base salary is a pro-rata amount, also inclusive of the 20% salary reduction over the months of April to July 2020. The annual leave balance for John Steedman was paid out on termination in accordance with the legislative requirement; and
- 2019 base salary for Jens Monsees represents a pro-rata amount, according to his start date in October 2019. His full year contractual fixed remuneration ($1,500,000) has been consistent in both 2020 and 2019. Under the terms of Jens Monsees’ 482 Visa and in accordance with p.11 of the Superannuation Guarantee (Administration) Regulations 2018, there is no requirement for the employer to contribute statutory superannuation. Therefore, the full fixed remuneration is paid to Jens Monsees as base salary.
2. The information represents actual STI outcomes for the year ended 31 December 2020 and the STI awards achieved for the year ended 31 December 2019.
- No STI was payable to John Steedman for the year ended 31 December 2020 as he retired as an executive of WPP AUNZ during 2020 and was not eligible to receive an award according to the terms of the 2020 STIP; and
- No STI was payable to the eligible Senior Executives for the year ended 31 December 2020.
3. LTI values are based on accounting treatment. The fair value of rights and options at grant is determined as set out in Note 29 to the financial statements and amortised accordingly in line with the performance conditions and vesting period of each plan. Details of the KMPs’ rights and options are further included in Section 7.2.
4. Other long-term benefits represent the movement in the Senior Executives' long service leave balance between the respective reporting periods. The long service leave balance for John Steedman was paid on termination in accordance with the legislative requirement.
5. The termination benefit amount for John Steedman includes the payment in lieu of notice ($428,449) and a 12 weeks' ex-gratia payment ($214,224) in accordance with his contractual entitlement and retirement terms. Statutory superannuation was paid in respect of this entitlement ($10,847) and is included in the total superannuation contributions’ amount in the above table.
6. Other benefits amount represents the total of Jens Monsees’ contractual allowance and his benefits and expenses paid annually by the Company.
- Under the contractual allowance, the Company has set aside a quantum of $250,000 per annum for Mr Monsees’ children’s education expenses and one home trip per year for his family under a 482 Visa. The tax cost (if any) to the Company of providing these benefits will be met from this pool of funds. Any unutilised balance will become payable to Mr Monsees as taxable remuneration; and
- The remaining other benefits amount paid by the Company during 2020 includes the comprehensive health insurance costs for the CEO and his family, the expenses relating to their relocation to Australia and a return business class airfare.
REMUNERATION REPORT (CONTINUED)

ANNUAL REPORT 2020
35
SECTION 6 – NON-EXECUTIVE DIRECTORS' REMUNERATIONNon-executive Directors receive fees to recognise their contribution to the work of the Board and the associated Committees that they serve on. Fees are inclusive of superannuation contributions required by Superannuation Guarantee legislation.
Non-executive Directors do not receive any performance related remuneration.
6.1 DIRECTOR FEE FRAMEWORKUnder the current framework, Non-executive Directors are remunerated by way of an annual base fee, with additional fees paid to the Chairman and members of Committees. The Board periodically reviews the Directors' fee framework. There was no review to the overall quantum of the Non-executive Director or Committee fees during 2020.
The following table outlines the structure of the 2020 Non-executive Directors' annual fees for the Board and Committees:
Board Audit and Risk Committee People and Culture Committee
Chairman $230,000 $25,000 $20,000
Member $90,000 $5,000 $5,000
In response to the impact of the COVID-19 pandemic on the Company's performance, the Independent Non-executive Directors elected to reduce their total actual 2020 remuneration by 20% for up to four months as further outlined in Section 6.5.
6.2 WPP PLC ALIGNED DIRECTORSThe following WPP plc aligned Directors are not remunerated as a Board member of the Company and do not receive any other financial or non-financial benefit as a member of WPP AUNZ’s Board: Diane Holland, Ranjana Singh, Geoffrey Wild and Paul Richardson (resigned 7 May 2020).
The Board is pleased to have access to the specialist skills and knowledge of these individuals. It is the Board’s view that the non-payment to WPP plc aligned Directors does not detract or diminish from the discharging of their responsibilities and obligations to all shareholders of the Company.
According to the Governance Deed Poll, up to two WPP plc nominated Directors are entitled to be paid Directors’ fees or other remuneration in respect of his or her appointment as a Director.
6.3 DIRECTORS' FEE POOLThe maximum annual aggregate remuneration of Non-executive Directors is determined from time to time by a general meeting. The latest determination approved by shareholders has been included in a current WPP AUNZ Constitution as an aggregate remuneration of $1,000,000 per year.
The total remuneration paid to Non-executive Directors for the year ended 31 December 2020 amounted to $436,000 (2019: $465,000).
6.4 MINIMUM SHAREHOLDING REQUIREMENTIn 2015, the Company introduced a Minimum Shareholding Policy requiring Directors and the CEO to hold shares in the Company valued at a minimum of 100% of one year’s fixed pre-tax remuneration. Other nominated Senior Executives must hold shares in the Company valued at a minimum of 50% of one year’s fixed pre-tax remuneration.
The minimum shareholding must be achieved within five years from the adoption of the policy or five years from the date of the Director's appointment.

WPP AUNZ
36
6.5 REMUNERATION OF NON-EXECUTIVE DIRECTORSThe following table shows the total actual remuneration for Non-executive Directors for the year ended 31 December 2020, as well as comparative fees paid to the Directors for the year ended 31 December 2019.
Actual 2020 remuneration is reflective of the Non-executives Directors’ fees reduction they elected to take during the months of April to July 2020 to contribute to the business's cost savings in response to COVID-19.
Short-term employee benefits Post-employment
Total remuneration for Non-executive Directors1 Year2
Base salary $
Superannuation contributions $
Total$
Robert Mactier 2020 200,304 19,029 219,333
2019 214,612 20,388 235,000
Graham Cubbin 2020 104,110 9,890 114,0002019 109,589 10,411 120,000
Kim Anderson 2020 93,760 8,907 102,6672019 100,457 9,543 110,000
Paul Richardson 2020 — — —(resigned 7 May 2020) 2019 — — —
Geoffrey Wild 2020 — — —2019 — — —
Ranjana Singh 2020 — — —2019 — — —
Diane Holland 2020 — — —(appointed 2 March 2020) 2019 — — —
Total2 2020 398,174 37,826 436,0002019 424,658 40,342 465,000
1. Includes fees paid for the contribution to the Audit and Risk Committee and People and Culture Committee.
2. The total fees for 2019 reflect the prior year remuneration for the 2019 reported Non-executive Directors.
REMUNERATION REPORT (CONTINUED)

ANNUAL REPORT 2020
37
SECTION 7 – KMP HOLDINGS OF EQUITY INSTRUMENTS7.1 SHARESThe number of ordinary shares in WPP AUNZ Limited held during the year by each KMP, including their personally related parties, is shown in the table below:
Non-executive DirectorsBalance at the
beginning of the yearVested and exercised
during the yearPurchased on
market Sold on marketBalance at the end of the year
Robert Mactier 577,964 — 422,036 — 1,000,000
Graham Cubbin 100,000 — 150,000 — 250,000
Kim Anderson 50,000 — 100,000 — 150,000
Paul Richardson (resigned 7 May 2020) — — — — —
Geoffrey Wild — — — — —
Ranjana Singh — — — — —
Diane Holland (appointed 2 March 2020) — — — — —
Executive Directors and other Senior Executive
Balance at the beginning of the year
Exercised vested awards during the year1 Purchased on market Sold on market
Balance at the end of the year
Jens Monsees — 923,191 600,000 — 1,523,191
John Steedman2 382,408 28,226 — (320,000) 90,634
Chris Rollinson 30,625 — — — 30,625
1. Vested executive awards exercised during the year represent:
- 923,191 shares were released to Jens Monsees in respect of the vested Tranche 1 rights he received under the one-time grant on commencement. The shares will remain restricted for sale until the first trading window, following 31 December 2020; and
- 28,226 shares were released to John Steedman during 2020 in respect of the vested deferred portion of his 2017 STI.
2. In addition to the ordinary shares held by John Steedman, at the time of his retirement he held:
- 122,962 performance shares relating to the deferred portion of his 2018 STI. The shares vested at the date of his retirement and the anticipated release of the shares is during the first trading window, following the release of the Company’s financial results for the year ended 31 December 2020; and
- 136,612 performance shares relating to the deferred portion of his 2019 STI. The shares vested at the date of his retirement and the anticipated release of the shares is during the first trading window, following the release of the Company’s financial results for the year ended 31 December 2020.

WPP AUNZ
38
SECTION 7 – KMP HOLDINGS OF EQUITY INSTRUMENTS (CONTINUED)7.2 SENIOR EXECUTIVES' LTI MOVEMENTS DURING THE YEAR - RIGHTS AND OPTIONSThe LTI grants held by the Senior Executives are in the form of Rights or Options.
Performance Rights and Options are issued to the Senior Executives under the LTIP and once issued, are subject to the pre-determined performance conditions being met by the Company, in addition to the continued service requirement.
Senior Executives also hold the Service Rights awarded in previous years under the SOP. Once issued, the Service Rights are subject to the relevant Senior Executive's continued employment with WPP AUNZ until the vesting date.
7.2.1 SERVICE RIGHTS - SOP GRANTSThe table below shows the movement details in the number of service rights granted under the SOP operating in prior years:
Senior Executives PlanGrant date
Fair value $1
Rights granted
Total fair value
$Vesting
date
Rights vested during the
year
Unvested Rights
- balance at the end of the year
Vested Rights exercisable post
year end
Jens Monsees2 One-time Tranche 2 Oct-19 0.46 923,191 424,668 Dec-20 923,191 — 923,191CEO One-time Tranche 3 Oct-19 0.43 923,191 396,972 Dec-21 — 923,191 —
John Steedman3 2018 SOP May-18 0.76 64,816 49,260 Mar-21 64,816 — 64,816COO 2019 SOP May-19 0.40 51,361 20,544 Mar-22 51,361 — 51,361
Chris Rollinson 2018 SOP May-18 0.76 32,408 24,630 Mar-21 — 32,408 —CFO 2019 SOP May-19 0.40 51,361 20,544 Mar-22 — 51,361 —
1. The fair value of the rights was determined at the time of grant in accordance with the AASB 2 Share-Based Payment principles. Total fair value assumes that the applicable vesting conditions were fully achieved. The details on the calculation of the fair value can be found in Note 29 to the 2018 and 2019 financial statements.
2. Vested SOP rights for Jens Monsees represent the Tranche 2 of the one-time grant he received on commencement. The anticipated release of the shares in respect of the vested rights is during the first trading window, following the release of the Company’s financial results for the year ended 31 December 2020.
3. SOP rights for John Steedman vested on the date of his retirement. The shares in respect of the vested rights will be released in the first trading window, following the release of the Company’s financial results for the year ended 31 December 2020.
7.2.2 PERFORMANCE RIGHTS - HURDLED LTIP GRANTSThe table below shows the movement details in the number of performance rights granted for the Senior Executives under the LTIP:
Senior Executives Plan
Grant date
Fair value $1
Performance Rights
granted2
Total fair value
$Vesting
datePerformance
test
Performance Rights vested
during the year
Performance Rights forfeited during the year
Balance at the end of the year - yet to vest or
lapse
Jens MonseesCEO
2020 LTIP
Sep-20 0.272 657,895 178,947 Feb-23 31-Dec-22 — — 657,895
John Steedman3
2020 LTIP
Sep-20 0.272 438,596 119,298 Feb-23 31-Dec-22 — (316,764) 121,832
COO 2019 LTIP
May-19 0.47 1,720,282 808,533 Dec-22 31-Dec-20 — (1,720,282) —
Chris Rollinson
2020 LTIP
Sep-20 0.272 92,105 25,053 Feb-23 31-Dec-22 — — 92,105
CFO 2019 LTIP
May-19 0.47 344,056 161,706 Dec-22 31-Dec-20 — (344,056) —
1. The fair value of the performance rights was determined at the time of grant in accordance with the AASB 2 Share-Based Payment principles. Total value in the
above table represents the fair value of LTI awards, assuming all performance conditions pursuant to each LTI grant are met. Details of the assumptions underlying the valuations are set out in Note 29 to the financial statements. The minimum value of the grant, if the applicable vesting conditions are not met, is $Nil in all cases.
2. All performance rights granted to the executives under 2019 LTIP were forfeited, following 31 December 2020 performance testing as outlined in Section 2.4.
3. 2020 LTIP performance rights for John Steedman were pro-rated at the date of his retirement. The pro-rated 121,832 performance rights will stay on foot in accordance with the terms of 2020 LTIP and applicable Plan Rules and will be subject to the post-employement vesting at the original vesting date and the applicable performance conditions being met.
REMUNERATION REPORT (CONTINUED)

ANNUAL REPORT 2020
39
7.2.3 OPTIONSThe table below shows the movement details in the number of Base Options granted for the Senior Executives under the 2020 LTIP:
Senior Executives Plan
Grant date
Fair value $1
Base Options granted
Total fair value
$Vesting
date
Exercise price
$Expiry date
Base Options vested during
the year
Base Options forfeited during
the year
Base Options balance at the end of the year
Jens MonseesCEO
2020 LTIP Sep-20 0.043 922,131 39,652 Feb-23 0.61 Feb-28 — — 922,131
John Steedman2
COO2020 LTIP Sep-20 0.043 614,754 26,434 Feb-23 0.61 Feb-28 — (443,989) 170,765
Chris RollinsonCFO
2020 LTIP Sep-20 0.043 258,197 11,102 Feb-23 0.61 Feb-28 — — 258,197
1. The fair value of the Base Options was determined at the time of grant in accordance with the AASB 2 Share-Based Payment principles. Details of the
assumptions underlying the valuations are set out in Note 29 to the financial statements.
2. LTIP Base Options for John Steedman were pro-rated at the date of his retirement. The pro-rated 170,765 options will stay on foot in accordance with the terms of the 2020 LTIP and applicable Plan Rules and will be subject to the post-employement vesting at the original vesting date and the applicable share price performance condition being met.
7.3 SENIOR EXECUTIVES' LTI BALANCE - RIGHTS AND OPTIONSThe below table represents the balance summary of the number of rights and options issued over the ordinary shares in WPP AUNZ Limited held by each Senior Executive, including their personally related parties during the year ended 31 December 2020:
Senior Executives Vehicle/Class
Balance at the start of the year
Granted during the year
Vested during the year
Forfeited during the year
Balance at the end of the year
Exercisable post year end
Jens Monsees SOP Service Rights 1,846,382 — (923,191) — 923,191 923,191
CEO LTIP Performance Rights
— 657,895 — — 657,895 —
LTIP Base Options — 922,131 — — 922,131 —
John Steedman SOP Service Rights 116,177 — (116,177) — — 116,177
COO LTIP Performance Rights
1,720,282 438,596 — (2,037,046) 121,832 —
LTIP Base Options — 614,754 — (443,989) 170,765 —
Chris Rollinson SOP Service Rights 83,769 — — — 83,769 —
CFO LTIP Performance Rights
344,056 92,105 — (344,056) 92,105 —
LTIP Base Options — 258,197 — — 258,197 —

WPP AUNZ
40
CONSOLIDATED STATEMENT OF PROFIT OR LOSS AND OTHER COMPREHENSIVE INCOME FOR THE YEAR ENDED 31 DECEMBER 2020
Consolidated Entity
Notes2020
$'0002019
$'000
Revenue 726,175 836,576
Cost of sale of goods and services rendered (113,892) (123,789)
Net sales 4(B) 612,283 712,787
Other income/(expense) 4(B) 22,249 (1,925)
Share of net profits of joint venture and associates accounted for using the equity method 4(B) 5,667 5,626
640,199 716,488
Employee benefits expense (441,840) (484,545)
Occupancy costs (14,248) (15,870)
Depreciation expense 5(A) (39,379) (36,110)
Amortisation expense 5(A) (9,631) (17,832)
Travel, training and other personnel costs (10,063) (26,790)
Research, new business and other commercial costs (20,832) (23,868)
Office and administration costs (29,469) (22,997)
Compliance, audit and listing costs (14,441) (15,727)
Finance costs 5(B) (9,135) (14,919)
Service fees to WPP plc 30(C) (10,971) (12,191)
Loss on fair value adjustment of earnouts (29) —
Impairment expense (183,961) (241,256)
Loss before income tax (143,800) (195,617)
Income tax (expense)/benefit 6 (5,556) 11,456
Loss from continuing operations (149,356) (184,161)
Loss from discontinued operations* 32 — (37,785)
Loss for the period (149,356) (221,946)
Net profit/(loss) attributable to:
– Non-controlling interests 3,194 5,625
– Members of the Company (152,550) (227,571)
Cents Cents
Earnings per share for loss from continuing operations:
Basic earnings per share 7 (17.9) (22.2)
Diluted earnings per share 7 (17.9) (22.2)
Earnings per share for net loss attributable to the members of the Company:
Basic earnings per share 7 (17.9) (26.7)
Diluted earnings per share 7 (17.9) (26.7)
The above consolidated statement of profit or loss should be read in conjunction with the accompanying notes.* The discontinued operations relate to the sale of Kantar Australian and New Zealand businesses and Ogilvy New Zealand in 2019. Other non-material disposals
have not been included as discontinued operations in 2020 and 2019. Refer to Note 32 for further details.

ANNUAL REPORT 2020
41
Consolidated Entity
2020 $'000
2019 $'000
Loss for the period (149,356) (221,946)
Other comprehensive income
Items that may be reclassified subsequently to the consolidated statement of profit or loss
Exchange (loss)/gain arising on translation of foreign operations (13,440) 2,965
Total comprehensive loss (162,796) (218,981)
Total comprehensive income/(loss) attributable to:
– Non-controlling interests 2,752 5,802
– Members of the Company (165,548) (224,783)
Total comprehensive loss attributable to the members of the Company from:
– Continuing operations (165,548) (186,122)
– Discontinued operations* — (38,661)
(165,548) (224,783)
The above consolidated statement of profit or loss and other comprehensive income should be read in conjunction with the accompanying notes.* The discontinued operations relate to the sale of Kantar Australian and New Zealand businesses and Ogilvy New Zealand in 2019. Other non-material disposals
have not been included as discontinued operations in 2020 and 2019. Refer to Note 32 for further details.

WPP AUNZ
42
CONSOLIDATED STATEMENT OF FINANCIAL POSITION AS AT 31 DECEMBER 2020
Consolidated Entity
Notes2020
$’0002019
$’000
Current assets
Cash and cash equivalents 9 63,472 74,812
Trade and other receivables 10 336,179 389,690
Inventories 11 1,422 2,873
Other current assets 12 70,986 83,236
Total current assets 472,059 550,611
Non-current assets
Other receivables 13 3,902 —
Investments accounted for using the equity method 14 21,646 19,877
Right-of-use assets 15 52,876 91,667
Plant and equipment 16 29,948 41,231
Deferred tax assets 17 29,432 25,905
Intangible assets 18 538,459 721,839
Other non-current assets 19 3,337 2,145
Total non-current assets 679,600 902,664
Total assets 1,151,659 1,453,275
Current liabilities
Trade and other payables 20 612,197 589,330
Current tax liabilities 6(B) 1,072 12,993
Borrowings 21 — 10,000
Lease liabilities 15 29,286 28,480
Provisions 22 19,852 22,628
Total current liabilities 662,407 663,431
Non-current liabilities
Other payables 23 6,963 2,752
Borrowings 24 75,000 182,000
Lease liabilities 15 49,659 77,887
Deferred tax liabilities 25 23,683 28,744
Provisions 26 4,153 4,242
Total non-current liabilities 159,458 295,625
Total liabilities 821,865 959,056
Net assets 329,794 494,219
Equity
Issued capital 27 737,737 737,149
Reserves 23,956 29,356
Accumulated losses (437,536) (284,986)
Equity attributable to members of the Parent Entity 324,157 481,519
Non-controlling interests 5,637 12,700
Total equity 329,794 494,219
The above consolidated statement of financial position should be read in conjunction with the accompanying notes.

ANNUAL REPORT 2020
43
Attributable to members of the Parent Entity ($'000)
Consolidated Entity NotesIssued capital
Equity settled
share-based payment reserve*
Transactions with non-
controlling interests reserve*
Treasury reserve*
Equity reserve
Foreign currency
translation reserve*
Retained earnings/
(accumulated losses) Total
Non-controlling
interests Total
equity
At 1 January 2019 737,149 1,365 (12,528) — 16,275 18,359 531 761,151 15,605 776,756
Adoption of AASB 16 Leases (net of tax)
— — — — — — (4,300) (4,300) (49) (4,349)
At 1 January 2019 (restated)
737,149 1,365 (12,528) — 16,275 18,359 (3,769) 756,851 15,556 772,407
Net (loss)/profit — — — — — — (227,571) (227,571) 5,625 (221,946)
Other comprehensive income
— — — — — 2,788 — 2,788 177 2,965
Total comprehensive income/(loss)
— — — — — 2,788 (227,571) (224,783) 5,802 (218,981)
Buy-out of non-controlling interests
33 — — 1,510 — — — — 1,510 (343) 1,167
Cost of share-based payments
— 1,587 — — — — — 1,587 — 1,587
Equity dividends provided for or paid
8 — — — — — — (53,646) (53,646) (8,315) (61,961)
At 31 December 2019 737,149 2,952 (11,018) — 16,275 21,147 (284,986) 481,519 12,700 494,219
Net (loss)/profit — — — — — — (152,550) (152,550) 3,194 (149,356)
Other comprehensive loss
— — — — — (12,998) — (12,998) (442) (13,440)
Total comprehensive (loss)/income
— — — — — (12,998) (152,550) (165,548) 2,752 (162,796)
Buy-out of non-controlling interests
33 — — 6,385 — — — — 6,385 (6,877) (492)
Issue of Executive Share Plan shares
588 (588) — — — — — — — —
Cost of share-based payments
— 2,110 — — — — — 2,110 — 2,110
Treasury share additions
— — — (451) — — — (451) — (451)
Treasury share allocations
— (424) — 424 — — — — — —
Transfers into equity settled share-based payment reserve
— 159 — — — — — 159 — 159
Share-based payments settled in cash
— (17) — — — — — (17) — (17)
Equity dividends provided for or paid
8 — — — — — — — — (2,938) (2,938)
At 31 December 2020 737,737 4,192 (4,633) (27) 16,275 8,149 (437,536) 324,157 5,637 329,794
The above consolidated statement of changes in equity should be read in conjunction with the accompanying notes.
* Nature and purpose of reserves.The equity settled share-based payment reserve is used to record the amortised cost of share rights granted to executives, the value of which has not been transferred to the relevant executives. The transactions with non-controlling interests reserve relates to transactions with non-controlling interests that do not result in a loss of control.The treasury reserve is used to record previously outstanding shares that have been reacquired and held by the Company.The foreign currency translation reserve is used to record exchange differences arising from the translation of the financial statements of foreign controlled entities.
CONSOLIDATED STATEMENT OF CHANGES IN EQUITY FOR THE YEAR ENDED 31 DECEMBER 2020

WPP AUNZ
44
Consolidated Entity
Notes2020
$’0002019
$’000
Cash flows from operating activities
Receipts from customers 2,709,225 3,506,795
Payments to suppliers and employees (2,540,625) (3,382,275)
Net cash flows from operations 168,600 124,520
Interest received 146 895
Interest and other costs of finance paid (9,634) (16,424)
Dividends and trust distributions received from joint venture and associates 14 2,681 5,950
Government aid for COVID-19 13,401 —
Income taxes paid (26,744) (24,912)
Net cash flows from operating activities 9 148,450 90,029
Cash flows from investing activities
Payments for purchase of newly controlled entities, net of cash acquired 31 (1,938) —
Payments for acquisition of non-controlling interests 33 (1,025) (5,540)
Payments for purchase of plant and equipment 16 (3,298) (14,062)
(Outflow)/proceeds on disposal of controlled entities, net of cash disposed (87) 163,519
Proceeds on disposal of equity accounted investments — 53
Earnout payments and intangible assets acquired (6,569) (15,142)
Receipts from related parties 81 523
Net cash flows (used in)/from investing activities (12,836) 129,351
Cash flows from financing activities
Proceeds from borrowings 1,577,000 1,660,000
Repayments of borrowings (1,694,000) (1,783,001)
Payments of lease liabilities (27,839) (24,046)
Purchase of treasury shares (451) —
Dividends paid to equity holders 8 — (53,646)
Dividends paid to non-controlling interests (2,938) (7,022)
Net cash flows used in financing activities (148,228) (207,715)
Net (decrease)/increase in cash held (12,614) 11,665
Effects of exchange rate changes on cash and cash equivalents 1,274 (377)
Cash and cash equivalents at the beginning of the year 74,812 63,524
Cash and cash equivalents at the end of the year 9 63,472 74,812
The above consolidated statement of cash flows should be read in conjunction with the accompanying notes.
CONSOLIDATED STATEMENT OF CASH FLOWS FOR THE YEAR ENDED 31 DECEMBER 2020

ANNUAL REPORT 2020
45
CONTENTS – NOTES TO THE FINANCIAL STATEMENTS FOR THE YEAR ENDED 31 DECEMBER 2020
NOTE PAGE
1 Summary of significant accounting policies 46
2 Critical accounting estimates and judgements 55
3 Segment information 56
4 Revenue 58
5 Expenses 59
6 Income tax 61
7 Earnings per share 62
8 Dividends paid and proposed 63
9 Current assets - cash and cash equivalents 64
10 Current assets - trade and other receivables 65
11 Current assets - inventories 67
12 Current assets - other current assets 67
13 Non-current assets - other receivables 67
14 Non-current assets - investments accounted for using the equity method
68
15 Leases 68
16 Non-current assets - plant and equipment 70
17 Non-current assets - deferred tax assets 71
18 Non-current assets - intangible assets 71
19 Non-current assets - other non-current assets 77
20 Current liabilities - trade and other payables 77
NOTE PAGE
21 Current liabilities - borrowings 77
22 Current liabilities - provisions 78
23 Non-current liabilities - other payables 78
24 Non-current liabilities - borrowings 78
25 Non-current liabilities - deferred tax liabilities 80
26 Non-current liabilities - provisions 80
27 Issued capital 81
28 Financial risk management 82
29 Share-based payments 88
30 Related party disclosures 89
31 Business combinations 90
32 Discontinued operations 92
33 Transactions with non-controlling interests 94
34 Expenditure commitments 94
35 Contingent liabilities 95
36 Subsidiaries 96
37 Deed of cross guarantee 100
38 Auditors' remuneration 102
39 Events occurring after the reporting period 102
40 Parent Entity financial information 103

WPP AUNZ
46
NOTES TO THE FINANCIAL STATEMENTS FOR THE YEAR ENDED 31 DECEMBER 2020
NOTE 1. SUMMARY OF SIGNIFICANT ACCOUNTING POLICIESThe financial report of WPP AUNZ Limited for the year ended 31 December 2020 was authorised for issue in accordance with a resolution of the Directors, dated 25 February 2021.
WPP AUNZ Limited is a company limited by shares incorporated in Australia whose shares are publicly traded on the Australian Securities Exchange. The Company's registered office is at 1 Kent Street, Millers Point NSW 2000 Australia.
(A) BASIS OF PREPARATIONThe financial report is a general purpose financial report, which has been prepared in accordance with the requirements of the Corporations Act 2001, Australian Accounting Standards ("AAS") and Australian Accounting Interpretations and complies with other requirements of the law. The financial report has also been prepared on a historical cost basis, except for the revaluation of certain financial instruments. Where necessary, comparatives have been reclassified and repositioned for consistency with current period disclosures. For reporting purposes, the Group is considered a for profit entity.
AMENDMENTS TO ACCOUNTING STANDARDS THAT ARE MANDATORILY EFFECTIVE FOR THE CURRENT REPORTING PERIODThe following amended standards and intepretations became effective from 1 January 2020 and do not have a material impact on the Group's consolidated financial statements:
— amendments to References to Conceptual Framework in IFRS Standards;
— definition of a Business (Amendments to AASB 3);
— definition of Material (Amendments to AASB 101 and AASB 108); and
— amendments to Disclosure of the Effect of New IFRS Standards Not Yet Issued in Australia.
(B) STATEMENT OF COMPLIANCE
(i) STANDARDS AND INTERPRETATIONSThe financial report complies with AAS. Compliance with AAS ensures that the consolidated financial report, comprising the consolidated financial statements and notes thereto, complies with International Financial Reporting Standards.
In the current period, the Consolidated Entity has adopted all of the new and revised standards and interpretations issued by the Australian Accounting Standards Board ("AASB") that are relevant to its operations.
(ii) NET WORKING CAPITAL AND GOING CONCERN
As at 31 December 2020, the consolidated statement of financial position shows current liabilities in excess of current assets by $190.3 million (2019: $112.8 million). At 31 December 2020, the Company has a secured debt facility totalling $420.0 million, of which $75.0 million was drawn. The Company had $345.0 million in undrawn facility at 31 December 2020 (2019: $228.0 million) to meet net working capital and other operational requirements (Refer to Note 28 Financial risk management).
This facility has been renewed on 17 August 2020 with $270.0 million of the debt facility (31 December 2020 drawdown: $75.0 million) expiring on 18 August 2023 and $150.0 million of the debt facility (31 December 2020 drawdown: $Nil) used to support intra-month working
capital movements expiring on 18 August 2021. The renewal provides confidence that the Group would be able to operate with appropriate liquidity and within its banking covenants.
Despite the significant impact of COVID-19 on the Group’s operations, the Group has positive net cash flows from operating activities of $148.5 million for the year ended 31 December 2020 (2019: $90.0 million). This has largely been driven by strong cash collections, COVID-19 related government aid and reduction in tax payments during the period. Furthermore, as a consequence of the COVID-19 pandemic, in considering going concern and liquidity risk, the Directors have reviewed the Group’s future cash requirements and earnings projections for the next 12 months and have also stress tested the impact of a range of assumptions to trading performance including the potential decline in net sales and earnings.
Also taking into consideration the bank covenant and liquidity headroom, the Directors consider it appropriate that the Group continues to adopt the going concern assumption in this financial report.
(iii) EXPECTED CREDIT LOSSES ("ECL")
The COVID-19 pandemic has led to the need for additional judgements in determining the ECL for trade receivables, including the segmentation of the debtors based on size, industry and the degree of the impact of COVID-19. Probability weighted scenarios were assessed using best, mid and worst-case scenarios. Accordingly, additional impairment of trade receivables reflects a higher level of risk than in prior reporting periods, resulting in increased provisions. As the impact of the pandemic remains uncertain, additional provisioning would be performed in the future if deemed necessary.
(C) BASIS OF CONSOLIDATION (i) CONTROLLED ENTITIESThe consolidated financial statements incorporate the assets and liabilities of all controlled entities of the Company as at 31 December 2020 and the results of all controlled entities for the year then ended.
Control is achieved when the Company:
— has power over the investee;
— is exposed, or has rights, to variable returns from its involvement with the investee; and
— has the ability to use its power to affect its returns.
The Company reassesses whether or not it controls an investee if facts and circumstances indicate that there are changes to one or more of the three elements of control listed above.
Controlled entities are fully consolidated from the date on which control is transferred to the Group. They are deconsolidated from the date that control ceases. The acquisition method of accounting is used to account for the acquisition of controlled entities by the Group (refer to Note 1(H)).
Inter-entity transactions, balances and unrealised gains on transactions between Group entities are eliminated. Unrealised losses are also eliminated unless the transaction provides evidence of impairment of the asset transferred. Accounting policies of controlled entities have been changed where necessary to ensure consistency with the policies adopted by the Group.

ANNUAL REPORT 2020
47
Where the Group has an interest in a controlled entity, and both vendor and purchaser hold put and call option agreements whereby the Group’s interest in the target entity will increase at a future date, it is the Group’s policy to assess the facts and circumstances for each agreement and where applicable, consolidate the controlled entity's target earnings and statement of financial position based on the ultimate future ownership. This is notwithstanding that the Group's ownership interest in the target entity is less than the ultimate future ownership at year end. An estimate is made of the likely future capital payment to be made upon exercise of the put or call option. Additionally, an estimate is made of likely future distribution payments to be made to the non-controlling interests in their capacity as equity holders in the target entity. These amounts (at their present value as disclosed in Note 1(H)) are disclosed as either a current or non-current liability titled "Earnouts" as shown in Notes 20 and 23. Any distribution payments made to non-controlling interests during the period are treated as a reduction of this contingent consideration liability. In all other circumstances, non-controlling interests in the results and equity of controlled entities are shown separately in the consolidated statement of profit or loss ("profit or loss"), consolidated statement of profit or loss and other comprehensive income ("statement of comprehensive income") and consolidated statement of financial position ("balance sheet"), respectively.
(ii) JOINT VENTURES A joint venture is a joint arrangement whereby the parties that have joint control of the arrangement have rights to the net assets of the arrangement. Joint control involves the contractually agreed sharing of control over an arrangement where decisions about the relevant activities require the unanimous consent of the parties sharing control. Investments in joint ventures are accounted for in the parent entity financial statements using the cost method and in the consolidated financial statements using the equity method of accounting, after initially being recognised at cost.
(iii) ASSOCIATES An associate is an entity over which the Group has significant influence and that is neither a subsidiary nor an interest in a joint venture. Significant influence is the power to participate in the financial and operating policy decisions of the investee but is not in control or joint control over those policies. Investments in associates are accounted for in the parent entity financial statements using the cost method and in the consolidated financial statements using the equity method of accounting, after initially being recognised at cost. Impairment losses are charged to profit or loss and any reversals are credited to profit or loss.
The Group’s share of its associates’ post-acquisition profits or losses is recognised in profit or loss, and its share of post-acquisition movements in reserves is recognised in reserves. The cumulative post-acquisition movements are adjusted against the carrying amount of the investment. Dividends or trust distributions receivable from associates are recognised in the parent entity’s profit or loss, while in the consolidated financial statements they reduce the carrying amount of the investment.
When the Group’s share of losses in an associate equals or exceeds its interest in the associate, including any other unsecured receivables, the Group does not recognise further losses, unless it has incurred obligations or made payments on behalf of the associate.
Unrealised gains on transactions between the Group and its associates are eliminated to the extent of the Group’s interest in the associates. Unrealised losses are also eliminated unless the transaction provides evidence of impairment of the asset transferred. Accounting policies of associates have been changed where necessary to ensure consistency with the policies adopted by the Group.
(iv) CHANGES IN OWNERSHIP INTERESTSThe Group treats transactions with non-controlling interests that do not result in a loss of control as transactions with equity owners of the Group.
A change in ownership interest results in an adjustment between the carrying amount of the controlling and non-controlling interests to reflect their relative interests in the subsidiary. Any difference between the amount of the adjustment to non-controlling interests and any consideration paid or received is recognised in a separate reserve within equity attributable to owners of the Company.
(D) ROUNDING OF AMOUNTS TO THE NEAREST THOUSAND DOLLARS The Company is a company of the kind referred to in ASIC Corporations (Rounding in Financial/Directors’ Reports) Instrument 2016/191, dated 24 March 2016, and in accordance with that legislative instrument amounts in the Directors' Report and the financial statements have been rounded to the nearest thousand dollars, unless otherwise indicated.
(E) FOREIGN CURRENCY TRANSLATION (i) FUNCTIONAL AND PRESENTATION CURRENCY Items included in the financial statements of each of the Group’s entities are measured using the currency of the primary economic environment in which the entity operates (“functional currency”). The consolidated financial statements are presented in Australian dollars, which is WPP AUNZ Limited’s functional and presentation currency.
(ii) TRANSACTIONS AND BALANCES Foreign currency transactions are translated into the functional currency using the exchange rates prevailing at the dates of the transactions. Foreign exchange gains and losses resulting from the settlement of such transactions and from the translation at the year-end exchange rates of monetary assets and liabilities denominated in foreign currencies are recognised in profit or loss and statement of comprehensive income.
(iii) GROUP ENTITIES The results and statement of financial position of all the Group entities (none of which has the currency of a hyperinflationary economy) that have a functional currency different from the presentation currency are translated into the presentation currency as follows:
— income and expenses for each statement of profit or loss are translated at average exchange rates (unless this is not a reasonable approximation of the cumulative effect of the rates prevailing on the transaction dates, in which case income and expenses are translated at the dates of the transactions);
— assets and liabilities for each statement of financial position are translated at the closing rate at the date of that statement of financial position; and

WPP AUNZ
48
NOTE 1. SUMMARY OF SIGNIFICANT ACCOUNTING POLICIES (CONTINUED)(E) FOREIGN CURRENCY TRANSLATION (CONTINUED)(iii) GROUP ENTITIES (CONTINUED)
— all resulting exchange differences are recognised in the foreign currency translation reserve, as a separate component of equity.
On consolidation, exchange differences arising from the translation of any net investment in foreign entities and of borrowings, are taken to equity. When a foreign operation is sold or borrowings repaid, a proportionate share of such exchange differences is recognised in profit or loss and statement of comprehensive income as part of the gain or loss on sale.
Goodwill and fair value adjustments arising on the acquisition of a foreign entity are treated as assets and liabilities of the foreign entity and translated at the closing rate.
(F) REVENUE RECOGNITIONThe Group is a leading communications services organisation offering national and multinational clients a comprehensive range of communications services across the Group’s different agencies and specialisms. Contracts often involve multiple agencies offering different services. As such, the terms of contracts can vary to meet client needs and regulatory requirements.
Consistent with the industry, contracts typically are short term in nature and tend to be cancellable by either party with 90 days’ notice. The Group is generally entitled to payment for work performed to date.
The Group is generally paid in arrears for its services. Invoices are typically payable within 30 to 60 days; hence, the Group has determined that no significant financing component exists in relation to the Group's revenue streams. Revenue comprises commissions and fees earned in respect of amounts billed and is stated exclusive of goods and services tax ("GST"). Pass-through costs comprise fees paid to external suppliers when they are engaged to perform part or all of a specific project and are charged directly to clients. Costs to obtain a contract are typically expensed as incurred as the contracts are generally short term in nature.
In most instances, promised services in a contract are not considered distinct or represent a series of services that are substantially the same with the same pattern of transfer to the customer and, as such are accounted for as a single performance obligation. However, where there are contracts with services that are capable of being distinct, are distinct within the context of the contract, and are accounted for as separate performance obligations, revenue is allocated to each of the performance obligations based on relative standalone selling prices.
Revenue is recognised when a performance obligation is satisfied, in accordance with the terms of the contractual arrangement. Typically, performance obligations are satisfied over time as services are rendered. Revenue recognised over time is based on the proportion of the level of service performed. Either an input method or an output method, depending on the particular arrangement, is used to measure progress for each performance obligation. For most fee arrangements, costs incurred are used as an objective input measure of performance. The primary input of substantially all work performed under these arrangements is labour. There is normally a direct relationship between costs incurred and the proportion of the contract performed to date. In other circumstances, relevant output measures such as the achievement of any project milestones stipulated in the contract are used to assess proportional performance.
For retainer arrangements, there is a stand ready obligation to perform services on an ongoing basis over the life of the contract. The scope of these arrangements is broad and generally not reconcilable to another input or output criteria. In these instances, revenue is recognised using a time-based method resulting in straight-line revenue recognition.
The amount of revenue recognised depends on whether the Group acts as an agent or as a principal. Certain arrangements with the Group's clients are such that the responsibility is to arrange for a third party to provide a specified good or service to the client. In these cases, the Group is acting as an agent and the Group typically does not control the relevant good or service before it is transferred to the client. When the Group acts as an agent, the revenue recorded is the net amount retained. Costs incurred with external suppliers (such as production costs and media suppliers) are excluded from revenue and recorded as work in progress until billed.
The Group acts as principal when the Group controls the specified good or service prior to transfer. When the Group acts as principal (such as for in-house production services, events and branding), the revenue recorded is the gross amount billed. Out-of-pocket costs such as travel are also recognised at the gross amount billed, with a corresponding amount recorded as an expense.
Further details on revenue recognition are detailed by sector below:
(i) GLOBAL INTEGRATED AGENCIES (FORMERLY ADVERTISING AND MEDIA INVESTMENT MANAGEMENT)Revenue is typically derived from media placements and advertising services. Revenue may consist of various arrangements involving commissions, fees, incentive-based revenue or a combination of the three, as agreed upon with each client. Revenue for commissions on purchased media is typically recognised at the point in time the media is run and fee revenue is recognised over time as services are performed. Variable incentive-based revenue typically comprises both quantitative and qualitative elements. Incentive compensation is estimated using the most likely amount and is included in revenue up to the amount that is highly probable not to result in a significant reversal of cumulative revenue recognised. The Group recognises incentive revenue as the related performance obligation is satisfied.
(ii) DATA INVESTMENT MANAGEMENT (DISPOSED ON 6 DECEMBER 2019)Revenue for market research services is typically recognised over time based on input measures. For certain performance obligations, output measures such as the percentage of interviews completed, percentage of reports delivered to a client and the achievement of any project milestones stipulated in the contract are used to measure progress.
While most of the studies provided in connection with the Group’s market research contracts are undertaken in response to an individual client’s or group of clients’ specifications, in certain instances a study may be developed as an off-the-shelf product offering sold to a broad client base. For these transactions, revenue is recognised when the product is delivered. Where the terms of the transaction provide for licensing the right to access a product on a subscription basis, revenue is recognised over the subscription period typically on a straight-line basis.
NOTES TO THE FINANCIAL STATEMENTS FOR THE YEAR ENDED 31 DECEMBER 2020 (CONTINUED)

ANNUAL REPORT 2020
49
(iii) LARGE FORMAT PRODUCTIONRevenue is derived from sale of goods. Revenue under these arrangements is earned at the point in time when the control of the goods is transferred to the customer upon delivery.
(iv) PUBLIC RELATIONS & PUBLIC AFFAIRS AND SPECIALIST COMMUNICATIONSRevenue is typically derived from retainer fees and fees for services to be performed subject to specific agreement. Most revenue under these arrangements is earned over time, in accordance with the terms of the contractual arrangement.
(v) NET SALESThe Group has disclosed its net sales for the year, being revenue less cost of sale of goods and services rendered. Cost of sale of goods and services rendered includes the manufacturing cost of sale of goods and the direct costs incurred in the provision of services when acting as principal. Net sales is a key performance indicator reviewed by management to evaluate the performance of the Group.
(vi) DISAGGREGATION OF REVENUEThe Group has disaggregated revenue into four reportable segments as disclosed in Note 3. The Group considers this consistent with how revenue is presented in other communications, how information is regularly reviewed by management to evaluate the financial performance of operating segments and how other information is used by the entity, or users of the financial statements, to evaluate financial performance or make resource allocation decisions.
(vii) OTHER INCOMEInterest
Interest income is recognised on a time proportional basis, taking into account the effective interest rates applicable to the financial assets.
(viii) SHARE OF NET PROFITS OF JOINT VENTURE AND ASSOCIATES ACCOUNTED FOR USING THE EQUITY METHODFor the Consolidated Entity, the share of the profits or losses of the joint venture and associates is determined on the basis of the Group's proportionate ownership interest in accordance with the equity method of accounting.
(G) TAXES (i) INCOME TAX The income tax expense or benefit for the period is the tax payable or tax refund on the current period’s taxable income based on the income tax rate for each jurisdiction, adjusted by changes in deferred tax assets and liabilities attributable to temporary differences between the tax bases of assets and liabilities and their carrying amounts in the financial statements and to unused tax losses.
Deferred tax assets and liabilities are recognised for temporary differences at the tax rates expected to apply when the assets are recovered or liabilities are settled, based on those tax rates which are enacted or substantively enacted for each jurisdiction. The relevant tax rates are applied to the cumulative amounts of deductible and taxable temporary differences to measure the deferred tax asset or liability. An exception is made for certain temporary differences arising from the initial recognition of an asset or a liability. No deferred tax asset or liability is recognised in relation to these temporary differences if they arose in a transaction, other than a business combination, that at the time of the transaction did not affect either accounting profit or taxable profit or loss.
Deferred tax assets are recognised for deductible temporary differences and unused tax losses only if it is probable that future taxable amounts will be available to utilise those temporary differences and losses.
Current and deferred tax balances attributable to amounts recognised directly in equity are also recognised directly in equity.
(ii) GOODS AND SERVICES TAX Revenues, expenses and assets are recognised net of the amount of GST except:
— where the GST incurred on a purchase of goods and services is not recoverable from the taxation authority, in which case the GST is recognised as part of the cost of the acquisition of the asset or as part of the expense item as applicable; and
— trade and other receivables and trade and other payables are stated with the amount of GST included.
The net amount of GST recoverable from, or payable to, the taxation authority is included as part of receivables or payables in the balance sheet.
Cash flows are included in the consolidated statement of cash flows on a gross basis and the GST component of cash flows arising from investing and financing activities, which is recoverable from or payable to the taxation authority, is classified as operating cash flows.
Commitments and contingencies are disclosed net of the amount of GST recoverable from, or payable to, the taxation authority.
(iii) TAX CONSOLIDATIONThe Company and all its wholly-owned Australian resident entities are part of a tax-consolidated group under Australian taxation law. WPP AUNZ Limited is the head entity in the tax-consolidated group. Tax expense/income, deferred tax liabilities and deferred tax assets arising from temporary differences of the members of the tax-consolidated group are recognised in the separate financial statements of the members of the tax-consolidated group using the ‘separate taxpayer within group’ approach by reference to the carrying amounts in the separate financial statements of each entity and the tax values applying under tax consolidation. Current tax liabilities and assets and deferred tax assets arising from unused tax losses and relevant tax credits of members of the tax-consolidated group are recognised by the Company (as head entity in the tax-consolidated group).
Due to the existence of a tax funding arrangement between the entities in the tax-consolidated group, amounts are recognised as payable to or receivable by the Company and each other member of the tax- consolidated group in relation to the tax contribution amounts paid or payable between the head entity and the other members of the tax-consolidated group in accordance with the arrangement.
(H) BUSINESS COMBINATIONS The acquisition method of accounting is used to account for all business combinations, regardless of whether equity instruments or other assets are acquired. The consideration transferred for the acquisition of a subsidiary comprises the fair values of the assets transferred, the liabilities incurred and the equity interests issued by the Group. The consideration transferred also includes the fair value of any asset or liability resulting from an earnout arrangement and the fair value of any pre-existing equity interest in the subsidiary. Acquisition related costs are expensed as incurred.

WPP AUNZ
50
NOTE 1. SUMMARY OF SIGNIFICANT ACCOUNTING POLICIES (CONTINUED)(H) BUSINESS COMBINATIONS (CONTINUED)Identifiable assets acquired and liabilities and contingent liabilities assumed in a business combination are, with limited exceptions, measured initially at their fair values at the acquisition date. On an acquisition-by-acquisition basis, the Group recognises any non-controlling interest in the acquiree either at fair value or at the non-controlling interest’s proportionate share of the acquiree’s net identifiable assets.
The excess of the consideration transferred, the amount of any non-controlling interest in the acquiree and the acquisition-date fair value of any previous equity interest in the acquiree over the fair value of the Group’s share of the net identifiable assets acquired is recorded as goodwill. If those amounts are less than the fair value of the net identifiable assets of the subsidiary acquired and the measurement of all amounts has been reviewed, the difference is recognised directly in profit or loss as a bargain purchase.
Where settlement of any part of cash consideration is contingent, the amounts payable in the future are discounted to their present value as at the date of exchange. The discount rate used is the entity’s incremental borrowing rate, being the rate at which a similar borrowing could be obtained from an independent financier under comparable terms and conditions.
Contingent consideration is classified either as equity or a financial liability. Amounts classified as a financial liability are subsequently remeasured to fair value with changes in fair value recognised in profit or loss.
If the contingent consideration (earnouts) relates to a put and call option arrangement, its fair value is recorded in other reserves on initial recognition and any subsequent remeasurements to fair value are recognised in profit or loss.
Business combinations that took place prior to 1 July 2009 were accounted for in accordance with the previous version of AASB 3 Business Combinations.
Prior to control being obtained, the investment is accounted for under AASB 128 Investments in Associates and Joint Ventures, AASB 11 Joint Arrangements and AASB 9 Financial Instruments. On the date that control is obtained, the fair values of the acquired entity’s assets and liabilities, including goodwill, are measured. Any resulting adjustments to previously recognised assets and liabilities are recognised in profit or loss thus, attaining control triggers remeasurement.
(I) IMPAIRMENT OF NON-FINANCIAL ASSETS Goodwill and other intangible assets that have an indefinite useful life are not subject to amortisation and are tested annually for impairment. Assets that are subject to amortisation are reviewed for impairment whenever events or changes in circumstances indicate that the carrying amount may not be recoverable. An impairment loss is recognised for the amount by which the asset’s carrying amount exceeds its recoverable amount. The recoverable amount is the higher of an asset’s fair value less costs to sell, and its value in use. Value in use is based on future cash flows attributable to the asset or assets, and these cash flows are discounted using a weighted average cost of capital. For the purpose of assessing impairment, assets are grouped at the lowest levels for which there are separately identifiable cash flows (CGUs).
For assets other than goodwill, where an impairment loss subsequently reverses, the carrying value of the asset is increased to the revised estimate of its recoverable amount to the extent that the increased carrying amount does not exceed the amount that would have been determined had no impairment loss been recognised.
(J) CASH AND CASH EQUIVALENTS
Cash and cash equivalents include cash on hand, deposits at call with financial institutions, and other short-term, highly liquid investments with original maturities of three months or less, that are readily convertible to known amounts of cash, and that are subject to an insignificant risk of changes in value.
(K) TRADE AND OTHER RECEIVABLESTrade and other receivables are recognised initially at fair value and subsequently measured at amortised cost, less any loss allowance/ECL. Trade receivables are due for settlement no more than 30 days from the date of recognition.
Collectability of trade and other receivables is reviewed on an ongoing basis. Debts which are known to be uncollectible are written off by reducing the carrying amount directly. An allowance account (loss allowance/ECL of trade receivables) is raised when some doubt as to collection by the Group of all amounts due according to the original terms of receivables exists. The amount of the loss allowance/ECL is the difference between the asset’s carrying amount and the present value of estimated future cash flows, discounted at the effective interest rate.
The amount of the loss allowance/ECL is recognised in profit or loss.
(L) INVENTORIESInventories are stated at the lower of cost and net realisable value. Cost comprises direct materials, direct labour and an appropriate proportion of variable and fixed overhead expenditure, the latter being allocated on the basis of normal operating capacity. Costs are assigned to individual items of inventory on the basis of weighted average costs. Costs of purchased inventory are determined after deducting rebates and discounts. Net realisable value is the estimated selling price in the ordinary course of business less the estimated costs of completion and the estimated costs necessary to make the sale.
(M) INVESTMENTS AND OTHER FINANCIAL ASSETSThe Group classifies its investments as amortised cost and fair value through profit or loss ("FVTPL"). The classification depends on the purpose for which the investments were acquired. Management determines the classification of the investments at initial recognition and re-evaluates this designation at each reporting date.
(i) AMORTISED COST ASSETS AND EFFECTIVE INTEREST METHODAmortised cost assets are non-derivative financial assets with fixed or determinable payments that are not quoted in an active market. They arise when the Group provides money, goods or services directly to a debtor with no intention of selling the receivable. They are included in current assets, except for those with maturities greater than 12 months after the balance date which are classified as non-current assets. Amortised cost assets are included in trade and other receivables in the balance sheet.
The effective interest method is a method of calculating the amortised cost of a financial asset and of allocating interest income over the relevant period. The effective interest rate is the rate that exactly
NOTES TO THE FINANCIAL STATEMENTS FOR THE YEAR ENDED 31 DECEMBER 2020 (CONTINUED)

ANNUAL REPORT 2020
51
discounts estimated future cash receipts including all fees and points paid or received that form an integral part of the effective interest rate, transaction costs and other premiums or discounts through the expected life of the financial asset, or, where appropriate, a shorter period.
(ii) FINANCIAL ASSETS AT FVTPL This includes investments in equity instruments unless the Group designates an equity investment arising from a business combination as at fair value through other comprehensive income on initial recognition. The Group has not made this election and will continue to account for its investments in equity instruments at FVTPL.
The fair values of quoted investments are based on current bid prices. If the market for a financial asset is not active (and for unlisted securities), the Group establishes fair value by using valuation techniques. These include reference to the fair values of recent arm’s length transactions, involving the same instruments or other instruments that are substantially the same, discounted cash flow analysis, and option pricing models refined to reflect the issuer’s specific circumstances.
(N) IMPAIRMENT OF FINANCIAL ASSETSThe Group recognises a loss allowance for ECL on investments in financial assets held at amortised cost. The amount of ECL is updated at each reporting date to reflect changes in credit risk since initial recognition of the respective financial instrument.
The Group always recognises lifetime ECL for trade receivables. Lifetime ECL represents the ECL that will result from all possible default events over the expected life of a financial instrument. The ECL on these financial assets is estimated using a provision matrix based on the Group’s historical credit loss experience, adjusted for factors that are specific to the debtors, general economic conditions and an assessment of both the current as well as the forecast direction of conditions at the reporting date, including time value of money where appropriate.
For all other financial instruments, the Group recognises lifetime ECL when there has been a significant increase in credit risk since initial recognition.
(i) SIGNIFICANT INCREASE IN CREDIT RISKIn assessing whether the credit risk on a financial asset has increased significantly since initial recognition, the Group compares the risk of a default occurring on the financial asset at the reporting date with the risk of a default occurring on the financial asset at the date of initial recognition. In making this assessment, the Group considers both quantitative and qualitative information that is reasonable and supportable, including historical experience and forward‑looking information that is available without undue cost or effort. Forward‑looking information considered includes the future prospects of the industries in which the Group’s debtors operate, obtained from economic expert reports, financial analysts, governmental bodies, relevant think‑tanks and other similar organisations, as well as consideration of various external sources of actual and forecast economic information that relate to the Group’s core operations.
In particular, information such as the actual or significant deterioration in the financial instrument’s external (if available) or internal credit rating and external market indicators, existing or forecast adverse changes in business, financial or economic conditions and an actual or expected significant deterioration in the operating results of the debtor is taken
into account when assessing whether credit risk has increased significantly since initial recognition.
Despite the foregoing, the Group assumes that the credit risk on a financial asset has not increased significantly since initial recognition if the financial asset is determined to have low credit risk at the reporting date. A financial asset is determined to have low credit risk if the financial instrument has a low risk of default, the debtor has a strong capacity to meet its contractual cash flow obligations in the near term, and adverse changes in economic and business conditions in the longer term may, but will not necessarily, reduce the ability of the borrower to fulfil its contractual cash flow obligations.
The Group regularly monitors the effectiveness of the criteria used to identify whether there has been a significant increase in credit risk and revises them as appropriate to ensure that the criteria are capable of identifying significant increase in credit risk before the amount becomes past due.
(ii) DEFINITION OF DEFAULTThe Group considers the following as indicators of an event of default for internal credit risk management purposes as historical experience indicates that financial assets that meet either of the following criteria are generally not recoverable:
— when there is a breach of financial covenants by the debtor; or
— information developed internally or obtained from external sources indicates that the debtor is unlikely to pay its creditors, including the Group, in full (without taking into account any collateral held by the Group).
Irrespective of the above analysis, the Group considers that default has occurred when a financial asset is more than 60 days past due unless the Group has reasonable and supportable information to demonstrate that a more lagging default criterion is more appropriate or there are other facts that indicate the financial asset is recoverable.
(iii) CREDIT IMPAIRED FINANCIAL ASSETSA financial asset is credit‑impaired when one or more events that have a detrimental impact on the estimated future cash flows of that financial asset have occurred. Evidence that a financial asset is credit‑impaired includes observable data about events such as the events noted in (I) and (II) above.
(iv) WRITE-OFF POLICYThe Group writes off a financial asset when there is information indicating that the debtor is in severe financial difficulty and there is no realistic prospect of recovery e.g. when the debtor has been placed in liquidation or has entered into bankruptcy proceedings, or the amounts are significantly past due.
(v) MEASUREMENT AND RECOGNITION OF ECL The measurement of ECL is a function of the probability of default, loss given default (i.e. the magnitude of the loss if there is a default) and the exposure at default. The assessment of the probability of default and loss given default is based on historical data adjusted by forward‑looking information as described above. As for the exposure at default, for financial assets this is represented by the assets’ gross carrying amount at the reporting date.
For financial assets, the ECL is estimated as the difference between all contractual cash flows that are due to the Group in accordance with the contract and all the cash flows that the Group expects to receive.

WPP AUNZ
52
NOTE 1. SUMMARY OF SIGNIFICANT ACCOUNTING POLICIES (CONTINUED)(N) IMPAIRMENT OF FINANCIAL ASSETS (CONTINUED)(v) MEASUREMENT AND RECOGNITION OF ECL (CONTINUED)The Group recognises an impairment gain or loss in profit or loss for all financial instruments, with a corresponding adjustment to their carrying amount through a loss allowance account.
(O) DERECOGNITION OF FINANCIAL ASSETSThe Group derecognises a financial asset only when the contractual rights to the cash flows from the asset expire, or when it transfers the financial asset and substantially all the risks and rewards of ownership of the asset to another entity. On derecognition of a financial asset measured at amortised cost, the difference between the asset’s carrying amount and the sum of the consideration received and receivable is recognised in profit or loss.
(P) FINANCIAL LIABILITIESThe Group has the following financial liabilities:
(i) FINANCIAL LIABILITIES AT FVTPL Financial liabilities are classified as at FVTPL when the financial liability is contingent consideration of an acquirer in a business combination. Financial liabilities at FVTPL are measured at fair value, with any gains or losses arising on changes in fair value recognised in profit or loss to the extent that they are not part of a designated hedging relationship. The net gain or loss recognised in profit or loss incorporates any interest paid on the financial liability and is included in the ‘gain or loss on fair value adjustment of earnouts' in profit or loss.
(ii) FINANCIAL LIABILITIES MEASURED SUBSEQUENTLY AT AMORTISED COST
Financial liabilities that are not contingent consideration of an acquirer in a business combination, are measured subsequently at amortised cost using the effective interest method. The effective interest method is a method of calculating the amortised cost of a financial liability and of allocating interest expense over the relevant period. The effective interest rate is the rate that exactly discounts estimated future cash payments including all fees and points paid or received that form an integral part of the effective interest rate, transaction costs and other premiums or discounts through the expected life of the financial liability, or where appropriate a shorter period, to the amortised cost of a financial liability.
(Q) DERECOGNITION OF FINANCIAL LIABILITIESThe Group derecognises financial liabilities when, and only when, the Group’s obligations are discharged or cancelled or have expired. The difference between the carrying amount of the financial liability derecognised and the consideration paid and payable is recognised in profit or loss. When the Group exchanges with the existing lender one debt instrument into another one with substantially different terms, such exchange is accounted for as an extinguishment of the original financial liability and the recognition of a new financial liability. Similarly, the Group accounts for substantial modification of terms of an existing liability or part of it as an extinguishment of the original financial liability and the recognition of a new liability. It is assumed that the terms are substantially different if the discounted present value of the cash flows under the new terms, including any fees paid net of any fees received and discounted using the original effective rate, is at least 10% different from the discounted present value of the remaining cash flows of the
original financial liability. If the modification is not substantial, the difference between the carrying amount of the liability before the modification, and the present value of the cash flows after modification, should be recognised in profit or loss as the modification gain or loss.
(R) FAIR VALUE ESTIMATIONThe fair value of financial assets and financial liabilities must be estimated for recognition and measurement or for disclosure purposes. The fair value of financial instruments that are not traded in an active market is determined using valuation techniques. The Group uses a variety of methods and makes assumptions that are based on market conditions existing at each balance date.
Quoted market prices or dealer quotes for similar instruments are used for long-term debt instruments held. Other techniques, such as estimated discounted cash flows, are used to determine fair value for the remaining financial instruments.
The nominal value less estimated credit adjustments of receivables and payables are assumed to approximate their fair values. The fair value of financial liabilities for disclosure purposes is estimated by discounting the future contractual cash flows at the current market interest rate that is available to the Group for similar financial instruments.
(S) PLANT AND EQUIPMENT Plant and equipment are stated at historical cost less accumulated depreciation and impairment. Historical cost includes expenditure that is directly attributable to the acquisition of the items.
Subsequent costs are included in the asset’s carrying amount or recognised as a separate asset, as appropriate, only when it is probable that future economic benefits associated with the item will flow to the Group and the cost of the item can be measured reliably. All other repairs and maintenance are charged to profit or loss during the financial period in which they are incurred.
Depreciation on plant and equipment is calculated using a straight-line method to allocate their cost, net of their residual values, over their estimated useful lives to the Consolidated Entity as follows: plant and equipment: 12% to 40% per annum.
Where items of plant and equipment have separately identifiable components which are subject to regular replacement, those components are assigned useful lives distinct from the item of plant and equipment to which they relate.
The assets’ residual values and useful lives are reviewed, and adjusted if appropriate, at each balance date. An asset’s carrying amount is written down immediately to its recoverable amount if the asset’s carrying amount is greater than its estimated recoverable amount (refer to Note 1(I)).
Gains and losses on disposals are determined by comparing proceeds with carrying amount. These are included in profit or loss. When revalued assets are sold, the amounts included in other reserves in respect of those assets are transferred to retained earnings.
(T) LEASESThe Group leases most of its offices in cities where the Group operates; other lease contracts include office equipment and motor vehicles. At inception of a contract, the Group assesses whether a contract is, or contains, a lease based on whether the contract conveys the right to control the use of an identified asset for a period of time in exchange for consideration.
NOTES TO THE FINANCIAL STATEMENTS FOR THE YEAR ENDED 31 DECEMBER 2020 (CONTINUED)

ANNUAL REPORT 2020
53
The Group recognises a right-of-use asset and a lease liability at the lease commencement date. The right-of-use asset is initially measured based on the initial amount of the lease liability adjusted for any lease payments made at or before the commencement date, plus any initial direct costs incurred and an estimate of costs to dismantle and remove the underlying asset or to restore the underlying asset or the site on which it is located, less any lease incentives received. The assets are depreciated over the term of the lease using the straight-line method.
The lease term includes periods covered by an option to extend if the Group is reasonably certain to exercise that option.
The lease liability is initially measured at the present value of the lease payments that are not paid at the commencement date, discounted using the interest rate implicit in the lease or, if that rate cannot be readily determined, the Group’s incremental borrowing rate for the same term as the underlying lease. Lease payments included in the measurement of lease liabilities comprise fixed payments less any lease incentives receivable and variable lease payments that depend on an index or a rate as at the commencement date. Lease modifications result in remeasurement of the lease liability.
Depreciation is recognised in depreciation expense and interest expense is recognised under financial cost in the consolidated statement of profit or loss.
The Group has elected to use the exemption not to recognise right-of-use assets and lease liabilities for short-term leases that have a lease term of 12 months or less and leases of low-value assets. The payments associated with these leases are recognised as occupancy costs and office and administration costs on a straight-line basis over the lease term.
(U) INTANGIBLE ASSETS(i) GOODWILLGoodwill represents the excess of the cost of an acquisition over the fair value of the Group’s share of the net identifiable assets of the acquired controlled entity or associate at the date of acquisition. Goodwill on acquisitions of controlled entities is included in intangible assets. Goodwill on acquisitions of associates is included in investments in associates. Goodwill acquired in business combinations is not amortised. Instead, goodwill is tested for impairment annually, or more frequently if events or changes in circumstances indicate that it might be impaired, and is carried at cost less accumulated impairment losses.
For the purpose of impairment testing, goodwill is allocated to each of the Group's CGUs that is expected to benefit from the synergies of the combination.
An impairment loss recognised for goodwill is recognised immediately in profit or loss and is not reversed in a subsequent period.
On disposal of the relevant CGU, the attributable amount of goodwill is included in the determination of profit or loss on disposal.
(ii) BRAND NAMESBrand names are acquired as part of business combinations and recognised separately from goodwill. Brand names have a finite useful life and are carried at historic cost (being initial fair value at acquisition) less accumulated amortisation and impairment losses. Amortisation is calculated using the straight-line method.
The value of brand names at initial recognition is determined using the
relief from royalty method. This entails an estimate of the comparable royalty payments that would need to be made by the Group to license the use of the brand name. The valuation is the present value of these future payments discounted at the weighted average cost of capital.
(iii) INTELLECTUAL PROPERTYIntellectual property has a finite useful life and is carried at cost less accumulated amortisation and impairment losses. Development costs that are directly attributable to the design and testing of identifiable and unique intellectual property controlled by the Group are recognised as intangible assets when the criteria of AASB 138 Intangible Assets is met. Directly attributable costs that are capitalised as part of the Intellectual property include employee costs and relevant third party costs. Amortisation is calculated using the straight-line method to allocate the cost of intellectual property over its estimated useful life, which is 5 to 20 years.
(iv) RESEARCH AND DEVELOPMENT
Expenditure on research activities, undertaken with the prospect of obtaining new technical knowledge and understanding, is recognised in profit or loss as an expense when it is incurred.
Expenditure on development activities, being the application of research findings or other knowledge to a plan or design for the production of new or substantially improved products or services before the start of commercial production or use, is capitalised if the product or service is technically and commercially feasible and adequate resources are available to complete development. The expenditure capitalised comprises all directly attributable costs, including costs of materials, services and direct labour. Other development expenditure is recognised in profit or loss as an expense as incurred.
Capitalised development expenditure is stated at cost less accumulated amortisation. Amortisation is calculated using the straight-line method to allocate the cost over the period of the expected benefit, which varies from 3 to 5 years.
(v) CUSTOMER RELATIONSHIPSCustomer relationships are acquired as part of business combinations and recognised separately from goodwill. Customer relationships have a finite useful life and are carried at fair value less accumulated amortisation and impairment losses. Amortisation is calculated using the straight-line method.
(V) TRADE AND OTHER PAYABLES Trade and other payables are recognised initially at their fair value, which is the amount expected to be paid, and subsequently at amortised cost. These amounts represent liabilities for goods and services provided to the Group prior to the end of financial year which are unpaid. The amounts are unsecured and are usually paid within 60 days of recognition.
(W) BORROWINGS Borrowings are initially recognised at fair value, net of transaction costs incurred. Any difference between the proceeds (net of transaction costs) and the redemption amount is recognised in profit or loss over the period of the borrowings using the effective interest method. Borrowings are subsequently measured at amortised cost. Borrowings are classified as current liabilities unless the Group has an unconditional right to defer settlement of the liability for at least 12 months after the balance date.

WPP AUNZ
54
NOTE 1. SUMMARY OF SIGNIFICANT ACCOUNTING POLICIES (CONTINUED)(X) FINANCE COSTS Finance costs are recognised as an expense in the period in which they are incurred. Finance costs include interest, amortisation of discounts or premiums, amortisation of ancillary costs incurred in connection with borrowings, and interest expense on lease liabilities.
(Y) PROVISIONS Provisions are recognised when: the Group has a present obligation as a result of past events; it is more likely than not that an outflow of resources will be required to settle the obligation; and the amount has been reliably estimated. Provisions are not recognised for future operating losses.
Where there are a number of similar obligations, the likelihood that an outflow will be required in settlement is determined by considering the class of obligations as a whole. A provision is recognised even if the likelihood of an outflow with respect to any one item included in the same class of obligations may be small.
Present obligations arising under onerous contracts are recognised and measured as a provision. An onerous contract is considered to exist where the Group has a contract under which the unavoidable costs of meeting the obligations under the contract exceed the economic benefits expected to be received under it.
(Z) EMPLOYEE BENEFITS
(i) SHORT-TERM EMPLOYEE BENEFIT OBLIGATIONSLiabilities for wages and salaries, including non-monetary benefits and accumulating sick leave, expected to be settled within 12 months after the end of the period in which the employees render the related services are recognised in respect of employees' services up to the end of the reporting period and are measured at the amounts expected to be paid when the liabilities are settled. All other short-term employee benefit obligations are presented as payables.
(ii) LONG-TERM EMPLOYEE BENEFIT OBLIGATIONSThe liability for long service leave and long-term annual leave which is not expected to be settled within 12 months after the end of the period in which the employees render the related service is recognised in the provision for employee benefits and measured as the present value of expected future payments to be made in respect of services provided by employees up to the reporting date using the projected unit credit method. Consideration is given to expected future wage and salary levels, experience of employee departures and periods of service. Expected future payments are discounted using market yields at the end of the reporting period on national government bonds with terms to maturity and currency that match, as closely as possible, the estimated future cash outflows.
The obligations are presented as current liabilities in the balance sheet if the entity does not have an unconditional right to defer settlement for at least 12 months after the reporting date, regardless of when the actual settlement is expected to occur.
(iii) SHARE-BASED PAYMENTS Share-based compensation benefits are provided to eligible employees.
The fair value of shares granted is recognised as an employee benefits expense, with a corresponding increase in equity. The fair value is measured at grant date and recognised over the period during which the employees become unconditionally entitled to the shares. Details of 2020 share-based payments are outlined in Note 29 Share-based payments on page 88 to 89.
The fair value at grant date is independently determined using a Black- Scholes pricing model for options and a discounted cash flow model for rights that takes into account the exercise price, the term of the right, the vesting and performance criteria, the impact of dilution, the non-tradeable nature, the share price at grant date and expected price volatility of the underlying share, the expected dividend yield and the risk-free interest rate for the term of the right.
The fair value of the shares granted excludes the impact of any non- market vesting conditions. Non-market vesting conditions are included in assumptions about the number of shares that are expected to vest. At each balance date, the entity revises its estimate of the number of shares that are expected to vest. The employee benefits expense recognised each period takes into account the most recent estimate.
(AA) ISSUED CAPITALOrdinary shares are classified as equity. Incremental costs directly attributable to the issue of new shares are shown in equity as a deduction, net of tax, from the proceeds. Incremental costs directly attributable to the issue of new shares or options for the acquisition of a business, are not included in the cost of the acquisition as part of the purchase consideration, but are shown in equity as a deduction, net of tax, from the gross proceeds.
(AB) DIVIDENDSProvision is made for the amount of any dividend declared before or at the end of the year but not distributed at balance date.
(AC) EARNINGS PER SHARE (i) BASIC EARNINGS PER SHAREBasic earnings per share is calculated by dividing net (loss)/profit after income tax attributable to equity holders of the Company, excluding any costs of servicing equity other than ordinary shares, by the weighted average number of ordinary shares outstanding during the year, adjusted for bonus elements in ordinary shares, if any, issued during the year.
(ii) DILUTED EARNINGS PER SHARE Diluted earnings per share adjusts the figures used in the determination of basic earnings per share to take into account the after tax effect of interest and other financing costs associated with dilutive potential ordinary shares and the weighted average number of shares assumed to have been issued for no consideration in relation to dilutive potential ordinary shares.
NOTES TO THE FINANCIAL STATEMENTS FOR THE YEAR ENDED 31 DECEMBER 2020 (CONTINUED)

ANNUAL REPORT 2020
55
NOTE 2. CRITICAL ACCOUNTING ESTIMATES AND JUDGEMENTS
The carrying amounts of certain assets and liabilities are often determined based on estimates and assumptions of future events. The key estimates and assumptions that have a significant risk of causing a material adjustment to the carrying amounts of certain assets and liabilities within the next annual reporting period are:
(A) IMPAIRMENT OF GOODWILL, OTHER INTANGIBLE ASSETS WITH INDEFINITE USEFUL LIVES AND INVESTMENTSThe Group determines on at least an annual basis (and at such other times when indicators of impairment arise) whether goodwill, other intangible assets with indefinite useful lives and investments are impaired. The assumptions used in this estimation of recoverable amount and the carrying amount of goodwill are discussed in Notes 1(U) and 18(D).
(B) EARNOUTSThe Group measures the cost of investments with reference to forecast results of the acquired entity. These forecast results are reassessed at least annually with reference to management accounts and projections. The treatment of earnout liabilities is detailed further in Notes 1(C), 20 and 23.
(C) SHARE-BASED PAYMENT TRANSACTIONSThe Group measures the cost of equity settled transactions with employees by reference to the fair value of the equity instruments at the date at which they are granted. The employee benefits expense is then determined with reference to a model which includes estimates of the probability factors of an employee meeting employment duration targets and the Group achieving certain performance targets as set annually by the People and Culture Committee as detailed in Note 29 Share-based payments on pages 88 to 89.
(D) VALUATION OF IDENTIFIABLE INTANGIBLE ASSETS AND ALLOCATION OF GOODWILLSignificant judgement was required in valuing the identifiable intangible assets (brand names, intellectual property and customer relationships) and allocation of goodwill with respect to the 2016 merger with WPP plc. The Company engaged an independent external expert to assist in the valuation of identifiable intangible assets.
(E) TAXThe calculation of the Group’s income tax expense and related tax balances involves a degree of estimation and judgement in respect of certain items whose tax treatment cannot be finally determined until resolution has been reached with the relevant tax authority and the finalisation of tax returns. The amounts recognised in the consolidated financial statements in respect of tax balances, specifically tax expense and tax provisions (current and deferred tax liabilities) are derived from the Group’s best estimation and judgement. However, the inherent uncertainty regarding the outcome of these items means the eventual resolution could differ from the tax provision and in such event the Group would be required to make an adjustment in a subsequent period which could have a material impact on the profit or loss and/or the cash position.
The Group is subject to income tax legislation in Australia and in jurisdictions where the Group has foreign operations. Judgement is required in determining the Group's worldwide provisions for income taxes and in assessing whether deferred tax balances are to be
recognised in the consolidated statement of financial position. Changes in tax legislation in the countries the Group operates in may affect the amount of provision for income taxes and deferred tax balances recognised.
(F) DISCONTINUED OPERATIONSRefer to Note 32 for further details.

WPP AUNZ
56
NOTE 3. SEGMENT INFORMATION(A) IDENTIFICATION OF REPORTABLE SEGMENTSThe Company has identified its operating segments based on the internal reports that are reviewed and used by the Board (the chief operating decision-maker) in assessing performance and in determining the allocation of resources. The operating segments are identified by the Board based on reporting lines and the nature of goods and services provided. Discrete financial information about each of these operating segments is reported to the Board on a monthly basis. The Company operates predominantly in Australia.
The reportable segments are the four operating segments.
(B) OPERATING SEGMENTSThe Company is organised into four reportable segments:
— Global Integrated Agencies (formerly Advertising and Media Investment Management);
— Large Format Production;
— Public Relations & Public Affairs; and
— Specialist Communications.
A detailed list of all products and services provided by the Company is not disclosed due to the cost of extracting the information.
(C) ACCOUNTING POLICIESSegment revenues and expenses and the relevant head office costs have been allocated to the segments. The accounting policies of the reportable segments are the same as the Group’s accounting policies described in Note 1.
(D) INTERSEGMENT TRANSFERSSales between segments are carried out at arm’s length and are eliminated on consolidation. As intersegment revenues are considered immaterial, no further disclosure of these is made in this note.
(E) BUSINESS SEGMENTS FOR CONTINUING OPERATIONSThe following table presents revenue and (loss)/profit information regarding reportable segments and a reconciliation between statutory and headline EBITDA including the impact of significant items for the years ended 31 December 2020 and 31 December 2019. Refer to Note 5(C) for further details in relation to significant items and other non-cash items.
NOTES TO THE FINANCIAL STATEMENTS FOR THE YEAR ENDED 31 DECEMBER 2020 (CONTINUED)

ANNUAL REPORT 2020
57
Significant items
31 December 2020 ($'000) Net sales*
Share of net profits of joint
venture and associates
HeadlineEBITDA
Other non-cash
items
Business close down and
other one-off costs
Statutory EBITDA
Global Integrated Agencies 425,833 3,409 70,114 (74) 405 70,445
Large Format Production 11,257 124 800 (1) (1,330) (531)
Public Relations & Public Affairs 44,515 414 9,111 (2) 193 9,302
Specialist Communications 130,678 1,720 20,011 (7) (1,108) 18,896
Total 612,283 5,667 100,036 (84) (1,840) 98,112
Depreciation, amortisation and impairment expense (232,971)
Net interest expense (8,941)
Loss before income tax (143,800)
Income tax expense (5,556)
Loss from continuing operations (149,356)
Loss from discontinued operations —
Loss for the period (149,356)
Net profit/(loss) attributable to:
– Non-controlling interests 3,194
– Members of the Parent Entity (152,550)
Significant items
31 December 2019 ($'000) Net sales*
Share of net profits of joint
venture and associates
HeadlineEBITDA
Other non-cash
items
Business close down and
other one-off costs
Statutory EBITDA
Global Integrated Agencies 481,910 3,322 73,937 (1,018) (4,166) 68,753
Large Format Production 19,110 271 (815) (59) (2,788) (3,662)
Public Relations & Public Affairs 56,372 492 14,731 (174) (391) 14,166
Specialist Communications 155,395 1,541 37,469 (849) (2,079) 34,541
Total 712,787 5,626 125,322 (2,100) (9,424) 113,798
Depreciation, amortisation and impairment expense (295,198)
Net interest expense (14,217)
Loss before income tax (195,617)
Income tax benefit 11,456
Loss from continuing operations (184,161)
Loss from discontinued operations** (37,785)
Loss for the period (221,946)
Net profit/(loss) attributable to:
– Non-controlling interests 5,625
– Members of the Parent Entity (227,571)
* Net sales is calculated as revenue less cost of sale of goods and services rendered. Refer to Note 1(F).
** The discontinued operations relate to the sale of Kantar Australian and New Zealand businesses and Ogilvy New Zealand in 2019. Refer to Note 32 for further details.

WPP AUNZ
58
NOTE 4. REVENUE(A) CONTRACT BALANCESThe following table provides information about receivables, accrued revenue and deferred income from contracts with customers:
Consolidated Entity
2020 $’000
2019 $’000
Receivables, which are included in 'Trade and other receivables' 316,449 372,503
Accrued revenue, which is included in 'Other current assets' 64,831 72,393
Deferred income, which is included in 'Trade and other payables' 81,221 85,658
Accrued revenue is recognised when a performance obligation has been satisfied but has not yet been billed. Accrued revenue is transferred to receivables when the right to consideration is unconditional and billed per the terms of the contractual agreement. Impairment losses on accrued revenue were immaterial for the periods presented. In certain cases, payments are received from customers prior to satisfaction of performance obligations and recognised as deferred income on the balance sheet. These balances are typically related to prepayments for third party expenses that are incurred shortly after billing.
The Group has applied the practical expedient permitted by AASB 15 Revenue from Contracts with Customers to not disclose the transaction price allocated to performance obligations unsatisfied (or partially unsatisfied) as at the end of the reporting period. This is due to contracts typically having an original expected duration of a year or less resulting in amounts that comprise the accrued revenue and deferred income balances at 31 December 2019 being recognised in net sales during the year and not forming part of the accrued revenue and deferred income balances at 31 December 2020.
(B) REVENUE BREAKDOWN
Consolidated Entity
2020 $’000
2019 $’000
REVENUE
Net sales 612,283 712,787
OTHER INCOME/(EXPENSE)
Interest income 194 702
Gain on fair value adjustment of earnouts — 965
Government aid related to COVID-19 13,569 —
Other income/(expense) 8,486 (3,592)
Total other income/(expense) 22,249 (1,925)
SHARE OF NET PROFITS OF JOINT VENTURE AND ASSOCIATES ACCOUNTED FOR USING THE EQUITY METHOD
Equity share of joint venture and associates' net profits 5,667 5,626
NOTES TO THE FINANCIAL STATEMENTS FOR THE YEAR ENDED 31 DECEMBER 2020 (CONTINUED)

ANNUAL REPORT 2020
59
NOTE 5. EXPENSES
Consolidated Entity
2020 $’000
2019 $’000
Loss before income tax for continuing operations includes the following specific expenses:
(A) DEPRECIATION AND AMORTISATION EXPENSE
Depreciation of non-current assets:
Plant and equipment 14,158 13,951
Right-of-use assets 25,221 22,159
Total depreciation expense 39,379 36,110
Amortisation of non-current assets:
Intangible assets 9,631 17,832
Total depreciation and amortisation expense 49,010 53,942
(B) FINANCE COSTS
Interest expense – earnouts 61 278
Interest expense – lease liabilities 2,910 3,102
Interest expense – other parties 6,164 11,539
Total finance costs 9,135 14,919

WPP AUNZ
60
NOTE 5. EXPENSES (CONTINUED)(C) SIGNIFICANT ITEMS AND OTHER NON-CASH ITEMSThe loss after tax for both continuing and discontinued operations includes the following items whose disclosure is relevant in explaining the financial performance of the Consolidated Entity:
Consolidated Entity
2020 $’000
2019 $’000
(I) IMPAIRMENT, AMORTISATION OF ACQUIRED INTANGIBLES AND OTHER NON-CASH ITEMS1
Amortisation expense 8,307 20,670
Impairment expense 183,987 298,678
Loss/(gain) on disposal of controlled entities 55 (7,745)
Loss on disposal of associates — 625
Loss/(gain) on fair value adjustment of earnouts (net of interest expense) 90 (717)
Significant items before income tax 192,439 311,511
Income tax benefit (7,073) (30,153)
Significant items net of income tax 185,366 281,358
Non-controlling interests — —
Net amount attributable to members of the Parent Entity 185,366 281,358
(II) BUSINESS CLOSE DOWN AND OTHER ONE-OFF COSTS2
Business restructuring costs 1,326 4,098
Loss on closed and merged businesses 514 1,619
Legal and professional fees relating to Kantar disposal — 805
Other one-off costs — 4,325
Significant items before income tax 1,840 10,847
Income tax expense/(benefit) 305 (1,738)
Significant items net of income tax 2,145 9,109
Non-controlling interests — —
Net amount attributable to members of the Parent Entity 2,145 9,109
1. Impairment, amortisation of acquired intangibles and other non-cash items – The balance in 2020 relates to the impairment of goodwill, equity accounted investments, right-of-use assets and acquired intangibles such as brand names and customer relationships in relation to entities within Global Integrated Agencies, Public Relations & Public Affairs and Specialist cash generating units ("CGUs"). It also includes the amortisation of acquired intangible assets, loss on fair value adjustment of earnouts as well as the loss on disposal of non-material controlled entities during the year. The balance in 2019 relates to the impairment of goodwill and acquired intangibles such as brand names and customer relationships predominantly in relation to entities within the Global Integrated Agencies and Data Investment Management CGUs. It also includes the amortisation of acquired intangible assets, the gain on fair value adjustment of earnouts as well as the gain/loss on disposal of controlled entities and associates which includes Kantar and Ogilvy New Zealand (discontinued operations) and other non-material disposals during the year.
2. Business close down and other one-off costs – These relate to costs associated with closing down, merging and restructuring selected businesses as well as one-off US Base Erosion and Anti-abuse Tax incurred in 2020.
NOTES TO THE FINANCIAL STATEMENTS FOR THE YEAR ENDED 31 DECEMBER 2020 (CONTINUED)

ANNUAL REPORT 2020
61
NOTE 6. INCOME TAX
Consolidated Entity
2020 $’000
2019 $’000
(A) INCOME TAX EXPENSE/(BENEFIT) FOR CONTINUING OPERATIONS
Current tax 15,302 46,739
Deferred tax (9,346) (56,981)
Adjustments for current tax of prior periods (400) (1,214)
Income tax expense/(benefit) reported in profit or loss 5,556 (11,456)
(B) CURRENT TAX LIABILITIES INCLUDED IN THE FINANCIAL STATEMENTS
Current tax liabilities (1,072) (12,993)
(C) NUMERICAL RECONCILIATION OF INCOME TAX EXPENSE/(BENEFIT) TO PRIMA FACIE TAX PAYABLE FOR CONTINUING OPERATIONS
Loss from continuing operations before income tax expense (143,800) (195,617)
Tax at the Australian tax rate of 30% (2019: 30%) (43,140) (58,685)
Adjustments for current tax of prior periods (400) (1,214)
Tax adjustments resulting from equity accounting (1,700) (1,697)
Foreign tax rate adjustment (1,502) (1,601)
Gain on disposal of non-current assets 17 923
Loss/(gain) on fair value adjustment of earnouts 28 (206)
Other items not allowable for income tax purposes 990 2,274
Tax adjustments from impairment of non-current assets 50,461 45,116
Deferred taxation write-off 802 3,651
Other gains not assessable for income tax — (17)
Income tax expense/(benefit) reported in profit or loss for continuing operations 5,556 (11,456)
(D) TAX LOSSESThe Group's tax losses on revenue account after adjusting for the tax rate are $0.6 million (2019: $0.4 million). The Group's tax losses on capital account after adjusting for the tax rate are $9.6 million (2019: $9.3 million).
The revenue and capital losses are available indefinitely for offset against future taxable profits of the companies in which those losses arose.
Tax losses on revenue account and capital account are recognised as a deferred tax asset if it is probable that future taxable amounts will be available to utilise those losses.
(E) UNRECOGNISED TEMPORARY DIFFERENCESA deferred tax liability has not been recognised in respect of temporary differences arising as a result of the translation of the financial statements of the Group’s foreign subsidiaries. The deferred tax liability will only arise in the event of disposal of the subsidiaries, and no such disposal is expected in the foreseeable future.
At 31 December 2020, there is no recognised or unrecognised deferred income tax liability (2019: $Nil) for taxes that would be payable on the unremitted earnings of certain Group subsidiaries, joint venture and associates as the Group has no liability for additional taxation should such amounts be remitted.

WPP AUNZ
62
NOTE 6. INCOME TAX (CONTINUED)(F) TAX CONSOLIDATION LEGISLATIONWPP AUNZ Limited and its wholly-owned subsidiaries are a tax-consolidated group. The accounting policy in relation to this legislation is set out in Note 1(G)(iii).
On adoption of the tax consolidation legislation, the entities in the tax-consolidated group entered into a tax sharing agreement, which, in the opinion of the Directors, limits the joint and several liability of the wholly-owned entities in the case of a default by the head entity, WPP AUNZ Limited.
The entities have also entered into a tax funding agreement under which the wholly-owned entities fully compensate WPP AUNZ Limited for any current tax payable assumed and are compensated by WPP AUNZ Limited for any current tax receivable and deferred tax assets relating to unused tax losses or unused tax credits that are transferred to WPP AUNZ Limited under the tax consolidation legislation. The funding amounts are determined by reference to the amounts recognised in the wholly-owned entities’ financial statements.
The amounts receivable/payable under the tax funding agreement are due upon receipt of the funding advice from the head entity, which is issued as soon as practicable after the end of each financial year. The head entity may also require payment of interim funding amounts to assist with its obligations to pay tax instalments. The funding amounts are recognised as current intercompany receivables or payables.
NOTE 7. EARNINGS PER SHAREThe calculation of basic and diluted earnings per share has been described in Notes 1(AC)(i) and 1(AC)(ii), respectively. There is no dilution to EPS due to the overall net loss attributable to the members of the Company.
The following reflects the income and share data used in the total operations’ basic and diluted earnings per share computations:
Consolidated Entity
Continuing operations2020
$’0002019
$’000
Net loss attributable to members of the Company from continuing operations for basic EPS (152,550) (189,442)
Effect of dilution
Dilutive adjustments to net loss — —
Net loss attributable to members of the Company from continuing operations for diluted EPS (152,550) (189,442)
Discontinued operations
Net loss attributable to members of the Company from discontinued operations for basic EPS — (38,129)
Effect of dilution
Dilutive adjustments to net loss — —
Net loss attributable to members of the Company from discontinued operations for diluted EPS — (38,129)
Number Number
Weighted average number of ordinary shares for basic earnings per share 851,873,313 851,548,729
Weighted average number of ordinary shares for diluted earnings per share 851,873,313 851,548,729
EPS for net loss from continuing operations attributable to members of the Company Cents Cents
Basic EPS (17.9) (22.2)
Diluted EPS (17.9) (22.2)
EPS for net loss from discontinued operations attributable to members of the Company
Basic EPS — (4.5)
Diluted EPS — (4.5)
NOTES TO THE FINANCIAL STATEMENTS FOR THE YEAR ENDED 31 DECEMBER 2020 (CONTINUED)

ANNUAL REPORT 2020
63
EPS is calculated by dividing net loss for the year attributable to ordinary equity holders of the Company by the weighted average number of ordinary shares outstanding during the year. The weighted average number of shares makes allowances for shares reserved for employee share plans.
Performance rights of 14,336,085 (2019: 15,327,048) and options of 4,560,108 (2019: Nil) are considered to be contingently issuable and have not been allowed for in the diluted EPS calculation. There have been no transactions involving ordinary shares between the reporting date and the date of completion of this financial report.
NOTE 8. DIVIDENDS PAID AND PROPOSED
Consolidated Entity
2020 $’000
2019 $’000
Declared and paid during the year
Dividends on ordinary shares:
Final franked dividend for 2019, paid in 2020: $Nil (2018: 4.0 cents per share paid in 2019) — 34,062
Interim franked dividend for 2020: $Nil (2019: 2.3 cents per share) — 19,584
Dividends paid pursuant to the ESP — —
— 53,646
In addition to the above dividends, since the end of the year the Directors have declared the payment of a total dividend of 4.4 cents (2019: $Nil) per fully paid ordinary share, fully franked at 30%. This comprises an ordinary dividend of 2.9 cents per share and a special dividend of 1.5 cents per share relating to the proceeds from the sale of Kantar. The aggregate amount of the proposed final dividend payable on 7 April 2021 but not recognised as a liability, is:
37,495 —
Franking credits balanceThe franked portions of dividends recommended after 31 December 2020 will be franked out of existing franking credits or out of franking credits arising from the payment of income tax in the year ending 31 December 2021.
Franking credits available for subsequent years based upon a tax rate of 30%. 93,651 71,582
Impact on franking account balance of dividends declared but not recognised 16,069 —
Exempting credits balanceFranking credits held by a number of WPP Australia entities that joined the Group at the time of the merger in 2016 are classified as exempting credits.Any dividends to the extent they are accompanied by such exempting credits paid to:
— non-resident shareholders would be exempt from Australian dividend withholding tax; and
— resident shareholders would be included in their assessable income as unfranked dividends.
None of the dividends paid to shareholders by the Group were accompanied by these exempting credits.
76,203 76,203

WPP AUNZ
64
NOTE 9. CURRENT ASSETS – CASH AND CASH EQUIVALENTS
Consolidated Entity
Notes2020
$’0002019
$’000
Cash at bank and on hand 63,472 74,812
Reconciliation of net loss to net cash flows from operating activities
Loss from continuing operations (149,356) (184,161)
Loss from discontinued operations — (37,785)
Loss for the year (149,356) (221,946)
Share of joint venture and associates’ net profits, net of dividends and trust distributions received (2,986) 324
Depreciation and amortisation expense 49,010 61,535
Impairment expense 183,961 298,678
ESP expense non-cash 2,110 1,587
Interest expense – earnouts 5(B) 61 278
Loss/(gain) on disposal of controlled entities 5(C) 55 (7,745)
Loss on disposal of associates 5(C) — 625
Loss on disposal of plant and equipment 361 1,530
Loss/(gain) on fair value adjustment of earnouts 29 (995)
Gain on disposal of leased assets and liabilities (430) —
Other business close down gains (304) —
Changes in operating assets and liabilities, net of effects of purchase and disposal of controlled entities during the financial year:
Decrease in trade and other receivables 66,762 46,561
Decrease in inventories 1,452 10,069
Increase in other non-current receivables (1,287) (32)
Increase in deferred tax assets (3,537) (1,070)
Increase/(decrease) in trade and other payables 25,152 (66,369)
Decrease in current income tax liabilities (17,840) (33,293)
(Decrease)/increase in provisions (3,156) 2,876
Decrease in other liabilities (1,607) (2,584)
Net cash flows from operating activities 148,450 90,029
NOTES TO THE FINANCIAL STATEMENTS FOR THE YEAR ENDED 31 DECEMBER 2020 (CONTINUED)

ANNUAL REPORT 2020
65
NOTE 10. CURRENT ASSETS – TRADE AND OTHER RECEIVABLES
Consolidated Entity
2020 $’000
2019 $’000
Trade receivables 317,061 374,125
Loss allowance/ECL (612) (1,622)
316,449 372,503
Other receivables1 4,610 7,906
Amounts receivable from related parties 15,120 9,281
336,179 389,690
1. Other receivables includes net investment in subleases relating to Kantar business units executed in 2020. The Company has de-recognised the right-of-use asset (to the extent that it is subject to the subleases) and recognised the net investment in subleases. No other disclosures are deemed necessary as it is not material. Refer to Note 15 Leases for more information.
(A) TRADE AND OTHER RECEIVABLESTrade and other receivables are not interest bearing and are generally on 30-day to 60-day terms.
The Group measures the loss allowance for trade and other receivables at an amount equal to lifetime ECL. The ECL on trade receivables is estimated using a provision matrix by reference to past default experience of the debtor and an analysis of the debtor’s current financial position, adjusted for factors that are specific to the debtors, general economic conditions of the industry in which the debtors operate and an assessment of both the current as well as the forecast direction of conditions at the reporting date. The Group has recognised a loss allowance of 100% against all receivables over 60 days past due if there are no indicators that would affirm their recoverability.
There has been no change in the estimation techniques or significant assumptions made during the current reporting period.
(B) IMPAIRED TRADE RECEIVABLESAs at 31 December 2020, current trade receivables of the Group with a nominal value of $0.6 million (2019: $1.6 million) were impaired. All impaired trade receivables are over 60 days old. The individually impaired receivables mainly relate to customers, who are in an unexpectedly difficult economic situation.
Movements in the loss allowance/ECL of trade receivables are as follows:
Consolidated Entity
2020$’000
2019 $’000
Balance at the beginning of the year 1,622 1,230
Impairment losses recognised on receivables 646 1,902
Amounts written off as uncollectible (1,280) (1,092)
Impairment losses reversed (376) (418)
Balance at the end of the year 612 1,622
The creation and release of the loss allowance/ECL of trade receivables have been included in profit or loss expense category 'Research, new business and other commercial costs'.
Amounts charged to the allowance account are generally written off when there is no expectation of recovering additional cash.

WPP AUNZ
66
NOTE 10. CURRENT ASSETS – TRADE AND OTHER RECEIVABLES (CONTINUED)(C) PAST DUE BUT NO LOSS ALLOWANCE/ECLAs at 31 December 2020, trade receivables greater than 60 days of $12.4 million (2019: $32.8 million) were net of the allowance made as part of the ECL calculation. These relate to a number of independent customers for whom there is no recent history of default and have been deemed recoverable by management subsequent to the assessment of factors noted above. The past due status, although an indicator of ECL, is not an absolute measure of ECL and factors such as the existence of slow paying debtors would result in the existence of past due debtors with no credit risk or ECL.
The ageing analysis of trade receivables after loss allowance/ECL is as follows:
Consolidated Entity
2020 $’000
2019 $’000
1-30 days 227,833 244,937
31-60 days 76,237 94,815
Greater than 60 days 12,379 32,751
316,449 372,503
There are no trade receivables that have had renegotiated terms that would otherwise, without that renegotiation, have been past due or impaired.
The other classes within trade and other receivables do not contain impaired assets and the Group believes that these amounts will be fully recovered.
(D) FOREIGN EXCHANGE AND INTEREST RATE RISKInformation about the Group’s exposure to foreign exchange risk and interest rate risk in relation to trade and other receivables is provided in Note 28.
(E) FAIR VALUE AND CREDIT RISKDue to the short-term nature of trade receivables, their carrying amount is assumed to approximate their fair value. The maximum exposure to credit risk at the reporting date is the carrying amount of each class of receivables mentioned above. The Group does not hold any collateral as security. Refer to Note 28 for more information on the risk management policy of the Group and the credit quality of the Consolidated Entity’s trade receivables.
NOTES TO THE FINANCIAL STATEMENTS FOR THE YEAR ENDED 31 DECEMBER 2020 (CONTINUED)

ANNUAL REPORT 2020
67
NOTE 11. CURRENT ASSETS – INVENTORIES
Consolidated Entity
2020 $’000
2019 $’000
Raw materials and stores 794 703
Work in progress 547 528
Finished goods 125 69
Media time — 1,573
Provision for impairment (44) —
1,422 2,873
NOTE 12. CURRENT ASSETS – OTHER CURRENT ASSETS
Consolidated Entity
2020 $’000
2019 $’000
Prepayments 6,155 10,843
Accrued revenue 64,831 72,393
70,986 83,236
NOTE 13. NON-CURRENT ASSETS – OTHER RECEIVABLES
Consolidated Entity
2020 $’000
2019 $’000
Other receivables 3,902 —
Other receivables relate to net investment in subleases relating to Kantar business units executed in 2020. The Company has de-recognised the right-of-use asset (to the extent that it is subject to the subleases) and recognised the net investment in subleases. No other disclosures are deemed necessary as it is not material. Refer to Note 15 Leases for more information.
(A) RELATED PARTY RECEIVABLESFor terms and conditions relating to related party receivables, refer to Note 30.
The Consolidated Entity and its joint venture and associates maintain loan accounts, which can fluctuate throughout the year. There are no fixed terms of repayment on these amounts.
(B) FAIR VALUE The carrying amounts of receivables are approximate to their fair value due to their short-term nature.
(C) RISK EXPOSUREInformation about the Group’s exposure to foreign exchange risk, interest rate risk and credit risk is provided in Note 28.

WPP AUNZ
68
NOTE 14. NON-CURRENT ASSETS – INVESTMENTS ACCOUNTED FOR USING THE EQUITY METHOD
Consolidated Entity
2020 $’000
2019 $’000
Investments in joint venture and associates 21,646 19,877
Name Principal activity
Ownership interestCountry of
incorporation2020 2019
AFI Branding Solutions Pty Limited Promotional signage printing 50% 50% Australia
Astus APAC Australia Pty Limited Media investment management 50% 50% Australia
Beyond Analysis Australia Pty Limited Data analytics 49% 49% Australia
CPR Vision Pte Limited Digital marketing 40% 40% Singapore
Fusion Enterprises Pty Limited Digital marketing 49% 49% Australia
Ikon Perth Pty Limited (i) Media planning — 45% Australia
Lakewood Holdings Pty Limited Dormant 50% 50% Australia
PT Home Tester (Indonesia) Advertising 50% 50% Indonesia
Purple Communications Australia Pty Limited Public relations 49% 49% Australia
Rapid Media Services Pty Limited Media planning 30% 30% Australia
Spinach Advertising Pty Limited Advertising 20% 20% Australia
TaguchiMarketing Pty Limited E-mail marketing 20% 20% Australia
(i) The entity was deregistered during the year.
(A) REPORTING DATESAll joint venture and associates have provided their results as at 31 December 2020 for the purpose of preparing the consolidated financial statements. As such, there is no difference in the reporting dates or periods between the investor and the investees.
(B) PUBLISHED FAIR VALUESThe joint venture and associates are not listed on any public exchange and therefore, there are no published quotation prices for the fair values of the investments.
(C) DIVIDENDS AND TRUST DISTRIBUTIONS RECEIVEDDuring the year, the Consolidated Entity received dividends and trust distributions of $2.7 million (2019: $6.0 million) from its joint venture and associates.
(D) COMMITMENTSThe Consolidated Entity’s share of the joint venture and associates’ commitments is disclosed in Note 34.
NOTE 15. LEASES The movements for the 12 months ended 31 December 2020 were as follows:
Right-of-use assetsProperty
$'000Fixtures, fittings and equipment
$'000Computer hardware
$'000Vehicle
$'000Total
$'000
As at 1 January 2020 91,123 326 186 32 91,667
Additions 4,550 — — — 4,550
Transfers to net investment in subleases1 (6,576) — — — (6,576)
Depreciation expense (24,887) (254) (60) (20) (25,221)
Net exchange differences (106) — (1) — (107)
Disposals (3,647) — — — (3,647)
Impairment (7,790) — — — (7,790)
As at 31 December 2020 52,667 72 125 12 52,876
NOTES TO THE FINANCIAL STATEMENTS FOR THE YEAR ENDED 31 DECEMBER 2020 (CONTINUED)
1. The sublease of certain office space is classified as a finance lease and relates to Kantar business units. The Company has de-recognised the right-of-use asset (to the extent that it is subject to the subleases) and recognised the net investment in subleases, which is included within trade and other receivables and non-current other receivables. No other disclosures are deemed necessary as it is not material.

ANNUAL REPORT 2020
69
Lease liabilitiesProperty
$'000
Fixtures, fittings and equipment
$'000
Computer hardware
$'000Vehicle
$'000Total
$'000
As at 1 January 2020 105,809 342 183 33 106,367
Additions 4,550 — — — 4,550
Repayment of lease liabilities (30,394) (270) (64) (21) (30,749)
Interest expense related to lease liabilities 2,899 6 4 1 2,910
Net exchange differences (106) — — — (106)
Disposals (4,027) — — — (4,027)
As at 31 December 2020 78,731 78 123 13 78,945
The following table shows the breakdown of lease expense in the profit or loss for the 12 months ended 31 December 2020:
$'000
Depreciation of right-of-use assets 25,221
Short-term lease expenses 2,955
Low-value lease expenses 178
Variable lease payment expenses (49)
Interest expense related to lease liabilities 2,910
Total 31,215
The total cash outflow for leases including short-term leases and low-value assets for the 12 months ended 31 December 2020 was $33.8 million (2019: $37.7 million).
The maturity of lease liabilities at 31 December 2020 was as follows:
$'000
2021 31,266
2022 28,209
2023+ 22,944
Total undiscounted cash flows 82,419
Effect of discounting (3,474)
78,945
Lease liabilities as at 31 December 2020
Current lease liabilities 29,286
Non-current lease liabilities 49,659
78,945

WPP AUNZ
70
NOTE 16. NON-CURRENT ASSETS – PLANT AND EQUIPMENT
Consolidated Entity
2020 $’000
2019 $’000
At cost 149,875 147,000
Accumulated depreciation (119,927) (105,769)
Total plant and equipment 29,948 41,231
RECONCILIATIONSReconciliations of the carrying amount of plant and equipment during the year are set out below:
Year ended 31 December 2019 $'000
Balance at the beginning of the year 49,963
Additions 14,062
Transfer to intangible assets (1,153)
Disposals (1,530)
Disposal of controlled entity (4,522)
Depreciation expense (15,593)
Net exchange differences 4
Balance at the end of the year 41,231
At 31 December 2019
At cost 147,000
Accumulated depreciation (105,769)
Net carrying amount 41,231
Year ended 31 December 2020
Balance at the beginning of the year 41,231
Additions 3,298
Acquisition of subsidiaries (refer to Note 31) 110
Disposals (416)
Reclassification 562
Depreciation expense (14,158)
Impairment expense (523)
Net exchange differences (156)
Balance at the end of the year 29,948
At 31 December 2020
At cost 150,398
Accumulated depreciation and impairment (120,450)
Net carrying amount 29,948
NOTES TO THE FINANCIAL STATEMENTS FOR THE YEAR ENDED 31 DECEMBER 2020 (CONTINUED)

ANNUAL REPORT 2020
71
NOTE 17. NON-CURRENT ASSETS – DEFERRED TAX ASSETS
Consolidated Entity
2020 $’000
2019 $’000
Provisions 6,736 7,503
Doubtful debts 175 478
Accruals 5,743 5,973
Tax losses carried forward 564 394
Leases 5,880 4,341
Plant and equipment 8,450 5,234
Other 1,884 1,982
Gross deferred tax assets 29,432 25,905
Movements
Opening balance 25,905 27,574
Credited to profit or loss 3,537 3,349
Disposal of controlled entities (10) (5,018)
Closing balance 29,432 25,905
Movements – consolidatedProvisions
$’000
Doubtful debts$’000
Accruals$’000
Tax losses carried
forward$’000
Leases $'000
Plant and equipment
$'000Other$’000
Total$’000
At 1 January 2019 9,742 482 6,756 3,970 1,765 4,471 388 27,574
Credited/(charged) to the profit or loss 27 15 1,026 (3,576) 2,800 1,414 1,643 3,349
Disposal of controlled entities (2,266) (19) (1,809) — (224) (651) (49) (5,018)
At 31 December 2019 7,503 478 5,973 394 4,341 5,234 1,982 25,905
(Charged)/credited to the profit or loss (767) (303) (230) 170 1,539 3,216 (88) 3,537
Disposal of controlled entities — — — — — — (10) (10)
At 31 December 2020 6,736 175 5,743 564 5,880 8,450 1,884 29,432
NOTE 18. NON-CURRENT ASSETS – INTANGIBLE ASSETS
Consolidated Entity
2020 $’000
2019 $’000
Goodwill 461,754 632,262
Brand names 41,450 47,258
Intellectual property 11,509 11,021
Customer relationships 23,746 31,298
Total intangible assets 538,459 721,839

WPP AUNZ
72
NOTE 18. NON-CURRENT ASSETS – INTANGIBLE ASSETS (CONTINUED)
RECONCILIATIONSReconciliations of the carrying amount of each class of intangible asset at the beginning and end of each year are set out below:
At 1 January 2019Goodwill
$’000
Brand names $’000
Intellectual property
$’000
Customer relationships
$’000Total
$’000
At cost 971,239 158,368 25,216 156,038 1,310,861
Accumulated amortisation and impairment (51,846) (14,964) (11,570) (44,948) (123,328)
Net carrying amount 919,393 143,404 13,646 111,090 1,187,533
Year ended 31 December 2019
Balance at the beginning of the year 919,393 143,404 13,646 111,090 1,187,533
Additions 63 — 1,885 — 1,948
Net exchange differences 2,187 — 5 — 2,192
Transfer between intangibles 440 — (440) — —
Transfer from plant and equipment — — 1,153 — 1,153
Disposal of controlled entities (105,141) (19,175) (466) (25,256) (150,038)
Amortisation expense — (8,328) (3,662) (10,281) (22,271)
Impairment expense (184,680) (68,643) (1,100) (44,255) (298,678)
Balance at the end of the year 632,262 47,258 11,021 31,298 721,839
At 31 December 2019
At cost 868,788 139,193 27,353 130,782 1,166,116
Accumulated amortisation and impairment (236,526) (91,935) (16,332) (99,484) (444,277)
Net book value 632,262 47,258 11,021 31,298 721,839
Year ended 31 December 2020
Balance at the beginning of the year 632,262 47,258 11,021 31,298 721,839
Additions — — 2,826 — 2,826
Net exchange differences (8,955) — (522) — (9,477)
Acquisition of subsidiaries (refer to Note 31) 5,928 — — 2,551 8,479
Transfer to plant and equipment — — (492) — (492)
Disposal of controlled entity (450) (106) — (18) (574)
Amortisation expense — (4,132) (1,324) (4,175) (9,631)
Impairment expense (167,031) (1,570) — (5,910) (174,511)
Balance at the end of the year 461,754 41,450 11,509 23,746 538,459
At 31 December 2020
At cost 865,311 139,087 29,165 133,315 1,166,878
Accumulated amortisation and impairment (403,557) (97,637) (17,656) (109,569) (628,419)
Net book value 461,754 41,450 11,509 23,746 538,459
NOTES TO THE FINANCIAL STATEMENTS FOR THE YEAR ENDED 31 DECEMBER 2020 (CONTINUED)

ANNUAL REPORT 2020
73
Reconciliation of the carrying amount of intangible asset by CGUs at the beginning and end of the year is set out below:
At 31 December 2020
GlobalIntegrated
Agencies$’000
Large Format Production
$'000
Public Relations and Public Affairs
$’000
Specialist Communications
$’000
Total $’000
Balance at the beginning of the year 452,226 1,756 95,026 172,831 721,839
Additions 1,069 1,757 — — 2,826
Net exchange differences (6,493) — — (2,984) (9,477)
Acquisition of subsidiaries (refer to Note 31) 4,068 — — 4,411 8,479
Transfers from/(to) plant and equipment 179 (671) — — (492)
Disposal of controlled entity (574) — — — (574)
Amortisation expense (7,148) (357) (1,214) (912) (9,631)
Impairment expense (112,892) — (26,553) (35,066) (174,511)
Balance at the end of the year 330,435 2,485 67,259 138,280 538,459
(A) AMORTISATION CHARGEThe amortisation charge of $9.6 million (2019: $17.8 million from continuing operations) has been recognised in the amortisation expense in profit or loss. The decrease in amortisation was largely driven by reduction in the cost of brand names and customer relationships due to the impairment of $113.0 million recognised in 2019.
(B) IMPAIRMENT OF GOODWILL AND OTHER INTANGIBLE ASSETSDuring the year ended 31 December 2020, the Group has experienced challenging market conditions when compared with prior periods across all parts of the business. This has been primarily driven by the significant deterioration of trading conditions due to the impacts of the COVID-19 pandemic.
Given there are indicators of impairment, an impairment test was conducted in quarter four of 2020 using latest management forecasts. The Group has carried out a review of the recoverable amount of its brand names and customer relationships, and an assessment of the recoverable amount of its goodwill to determine whether the recoverable amount of the assets exceeds its carrying amount. The recoverable amount is determined to be the higher of its fair value less costs to sell, or its value in use.
The information below summarises the key assumptions and methodologies that have been used to determine the recoverable amount of intangible assets. Each of the factors below is subject to significant judgement about future economic conditions as noted above and the ongoing structure of the marketing and communications industry. The Directors have applied their judgement in determining the best estimates of each of these variables, which is subject to estimation uncertainty due to unpredictable macroeconomic conditions, but cannot warrant their outcome. To assess the impact of this significant uncertainty, and the range of possible outcomes, sensitivity analysis is disclosed below.
Assumptions that have been applied to all classes of intangible assets are set out below, followed by specific assumptions applied to individual classes of intangible assets.
Discount rate
The discount rate is an estimate of the post-tax rate that reflects the current market assessment of the time value of money and the risks specific to the assets. The post-tax discount rate applied to the cash flow projections was decreased to 10.0% (2019: 10.5%). This decrease has been driven primarily by the inclusion of AASB 16 Leases related balances which has changed the mix of debt and equity financing and decreased the average cost of capital.
Base year cash flowsThe base year cash flows are based upon the latest twelve month management forecasts approved by the Directors that were available when the impairment test was performed and are derived from a combination of historical trading performance and expectations of the assets’ future performance based on market and life cycle factors. The cash flows have been sensitised to account for the historical accuracy of forecasting and the significant negative impact of COVID-19. Given the discount rate has been risk-adjusted, no further risks were reflected in the cash flows.
WPP AUNZ
74
NOTE 18. NON-CURRENT ASSETS – INTANGIBLE ASSETS (CONTINUED)
(C) IMPAIRMENT OF INTANGIBLE ASSETS INCLUDING BRAND NAMES AND CUSTOMER RELATIONSHIPSDue to impairment indicators identified in the year ended 31 December 2020, the Group performed impairment tests on its brand name and customer relationship intangible assets. Following this, these intangible assets were included, at their adjusted carrying amounts, into the CGUs to which goodwill is allocated for impairment testing. Refer to Note 18(D) Impairment of goodwill, below.
Brand namesThe recoverable amount of brand names is determined using a fair value approach using the relief from royalty method. This entails an estimate of the comparable royalty payment that would need to be made by the Group to license the use of the brand names discounted at the weighted average cost of capital.
There have been impairment charges of $1.6 million during the period ended 31 December 2020 (2019: $65.3 million in relation to continuing operations).
Details of the key assumptions used in the relief from royalty calculations during the period ended 31 December 2020 are included below.
Cash flows over remaining useful lifeThe cash flows are forecast using Year 1 as a base and a growth rate applied to future years over the useful life of the asset. The rate of growth takes into account management’s best estimate of the likely results in these future periods and recent industry forecasts/outlook. The changes in the growth rates from the prior period is due to the impact of COVID-19 which has significantly reduced the Year 1 cash flows, and as a result, management expects higher growth rates for Years 2 and 3, which reflects management’s best estimate of stronger post COVID-19 recovery. The following revenue growth rates are applied to the brands within the following segments:
— Year 1: Latest Board approved twelve month management forecasts available at the time of impairment assessment adjusted for historical forecast accuracy;
— Year 2: Global Integrated Agencies: 5.0% (2019: 0.5%); Public Relations & Public Affairs: 6.0% (2019: 2.5%); and Specialist Communications: 10.0% (2019: 4.0%);
— Year 3: Global Integrated Agencies: 1.5% (2019: 0.5%); Public Relations & Public Affairs: 3.0% (2019: 2.5%); and Specialist Communications: 8.0% (2019: 4.0%);
— Year 4: Global Integrated Agencies: 0.5% (2019: 0.5%); Public Relations & Public Affairs: 2.5% (2019: 2.5%); and Specialist Communications: 4.0% (2019: 4.0%);
— Year 5: Global Integrated Agencies: 0.5% (2019: 0.5%); Public Relations & Public Affairs: 2.5% (2019: 2.5%); and Specialist Communications: 4.0% (2019: 4.0%); and
— remaining useful life: Global Integrated Agencies: 0.5% (2019: 0.5%); Public Relations & Public Affairs: 2.5% (2019: 2.5%); and Specialist Communications: 4.0% (2019: 4.0%).
Royalty ratesThe royalty rates are selected for each brand based on its strength and margins as well as qualitative factors. Furthermore, when the royalty rates were selected, consideration was given to comparable licence agreements conducted in the marketplace. The following royalty rates are applied to the brands within the following segments: Global Integrated Agencies: 3% to 4% (2019: 2% to 4%); Public Relations & Public Affairs: 1% to 4% (2019: 1% to 4%); and Specialist Communications: 1% to 3% (2019: 1% to 3%.).
Customer relationshipsThe customer relationships were valued at fair value using the multi-period excess earnings method which estimates revenues and cash flows derived from the intangible asset and deducts portions of the cash flows that can be attributed to supporting assets.
There have been impairment charges of $5.9 million during the period ended 31 December 2020 (2019: $40.3 million in relation to continuing operations).
Details of the key assumptions used in the multi-period excess earnings valuation during the period ended 31 December 2020 are included below.
MarginThe margin reflects the profit generated from the services provided to clients. Changes in this variable could impact the recoverable amount of customer relationships.
Attrition rateAn attrition factor is applied to the revenue attributable to the customer relationships to represent the chance of the customers leaving. It has been estimated that the attrition rate for customer relationships ranges between 7% and 38% (2019: 5% and 45%).
NOTES TO THE FINANCIAL STATEMENTS FOR THE YEAR ENDED 31 DECEMBER 2020 (CONTINUED)

ANNUAL REPORT 2020
75
(D) IMPAIRMENT OF GOODWILL To assess the impairment of goodwill across the CGUs, the Group used a value in use assessment which is detailed below. The following table reconciles the movement in goodwill by CGU, which is the lowest level at which goodwill is monitored:
RECONCILIATION OF GOODWILL MOVEMENT WITHIN CGUS AS AT 31 DECEMBER 2020
At 31 December 2020
Global Integrated Agencies
$’000
Public Relations & Public Affairs
$’000
Specialist Communications
$’000
Total $’000
Balance at the beginning of the year 381,397 83,434 167,431 632,262
Net exchange differences (5,971) — (2,984) (8,955)
Acquisition of subsidiaries (refer to Note 31) 4,068 — 1,860 5,928
Disposal of controlled entity (450) — — (450)
Impairment expense (106,659) (26,099) (34,273) (167,031)
Balance at the end of the year 272,385 57,335 132,034 461,754
For the Global Integrated Agencies, Public Relations & Public Affairs and Specialist Communications CGUs, a value in use assessment has been performed. In calculating value in use, the cash flows include projections of cash inflows and outflows from continuing use of the group of assets making up the CGU and of cash flows associated with disposal of any of these assets. The cash flows are estimated for the assets of the CGU in their current condition and discounted to their present value using a post-tax discount rate of 10.0% (2019: 10.5%) that reflects the current market assessment of the risks specific to the CGU. The Group uses a five-year discounted cash flow model based on Board approved forecasts with a terminal growth rate for years beyond the five-year forecast period.
Impairment charges of $167.0 million have been recognised during the period ended 31 December 2020 (2019: $147.7 million in relation to continuing operations). Of this, $106.6 million (2019: $147.7 million) relates to the Global Integrated Agencies CGU, $26.1 million (2019: $Nil) relates to the Public Relations & Public Affairs CGU and $34.3 million (2019: $Nil) relates to the Specialist Communications CGU.
Details of the key assumptions used in the value in use calculations at 31 December 2020 are included below.
Cash flows subsequent to base yearThe cash flows are forecast using Year 1 as a base and a growth rate applied to Years 2 to 5. The rate of growth takes into account management’s best estimate of the likely results in these periods, industry forecasts and historical actual rates. The changes in the growth rates from the prior period are due to the impact of COVID-19 which has significantly reduced the Year 1 cash flows, and as a result, management expects higher growth rates for Years 2 and 3, which reflects management’s best estimate of the stronger post COVID-19 recovery. The following revenue growth rates are applied to the CGUs:
— Year 1: Latest Board approved 12 month management forecasts available at the time of impairment assessment adjusted for historical forecast accuracy;
— Year 2: Global Integrated Agencies: 5.0% (2019: 0.5%); Public Relations & Public Affairs: 6.0% (2019: 2.5%); and Specialist Communications: 10.0% (2019: 4.0%);
— Year 3: Global Integrated Agencies: 1.5% (2019: 0.5%); Public Relations & Public Affairs: 3.0% (2019: 2.5%); and Specialist Communications: 8.0% (2019: 4.0%);
— Year 4: Global Integrated Agencies: 0.5% (2019: 0.5%); Public Relations & Public Affairs: 2.5% (2019: 2.5%); and Specialist Communications: 4.0% (2019: 4.0%);
— Year 5: Global Integrated Agencies: 0.5% (2019: 0.5%); Public Relations & Public Affairs: 2.5% (2019: 2.5%); and Specialist Communications: 4.0% (2019: 4.0%).
Terminal growth factor
A terminal growth factor that estimates the long-term average growth for that CGU is applied to the Year 5 cash flows into perpetuity. The terminal growth factor is derived from management’s best estimate of the likely long-term trading performance with reference to external industry reports. The following terminal growth rates are applied to the CGUs: Global Integrated Agencies: 0.5% (2019: 0.5%); Public Relations & Public Affairs: 2.0% (2019: 2.0%); and Specialist Communications: 2.5% (2019: 2.5%). Given the terminal value projects into perpetuity and is not a short-term measure, the rates continue to be consistent with the prior period.

WPP AUNZ
76
NOTE 18. NON-CURRENT ASSETS – INTANGIBLE ASSETS (CONTINUED)
(D) IMPAIRMENT OF GOODWILL (CONTINUED)
Impact of possible change in key assumptions Changes in the assumptions used in the value in use model, when considered in isolation, will result in the following impairment impact on profit or loss:
Impairment ($'000)
Sensitivity VariableGlobal Integrated
AgenciesPublic Relations & Public Affairs
Specialist Communications
Years 1-5 revenue growth rate -1.0 — — —
Discount rate +1.0 — — —
Terminal growth factor -1.0 — — —
It must be noted that each of the sensitivities above assumes that a specific assumption moves in isolation, while all other assumptions are held constant. In reality, a change in one of the aforementioned assumptions could be accompanied by a change in another assumption, which may increase or decrease the net impact.
Impact of changes to discount rateManagement notes that the post-tax discount rate would have to increase to 20.4% for Global Integrated Agencies; 14.1% for Public Relations & Public Affairs; and 12.1% for Specialist Communications for the recoverable amount of the CGUs to fall below their carrying value, all other assumptions being equal.
Impact of changes to terminal growth factorManagement notes that the terminal growth factor would have to decrease to (23.0%) for Global Integrated Agencies; (4.3%) for Public Relations & Public Affairs and (0.4%) for Specialist Communications for the recoverable amount of the CGUs to fall below their carrying value, all other assumptions being equal.
Loss of a major customerThe assumption around the loss of a major customer is important because as well as using historical trends management expects the Group’s market share of each business segment to be stable over future periods. The loss of a significant customer in any business segment will impact the ability of that CGU to maintain expected earnings and cash flows. The loss of any major customer would have a different impact on earnings and cash flows, so it is not practicable to include sensitivities for such a scenario.
NOTES TO THE FINANCIAL STATEMENTS FOR THE YEAR ENDED 31 DECEMBER 2020 (CONTINUED)

ANNUAL REPORT 2020
77
NOTE 19. NON-CURRENT ASSETS – OTHER NON-CURRENT ASSETS
Consolidated Entity
2020 $’000
2019 $’000
Prepayments 3,337 2,145
NOTE 20. CURRENT LIABILITIES – TRADE AND OTHER PAYABLESConsolidated Entity
2020 $’000
2019 $’000
Trade payables 440,926 410,126
Amounts payable to related parties 23,180 27,096
Earnouts 1,076 3,375
Deferred income 81,221 85,658
Sundry and other payables 65,794 63,075
612,197 589,330
(A) TRADE, SUNDRY AND OTHER PAYABLESTrade payables are not interest bearing and are normally settled on 60-day terms. Sundry and other payables are also not interest bearing and have an average term of 60 days.
(B) RELATED PARTY PAYABLESFor terms and conditions relating to related party payables, refer to Note 30.
(C) NET GST PAYABLESThe GST payables and receivables are netted. Net GST payables are remitted to the appropriate taxation authority as required.
NOTE 21. CURRENT LIABILITIES – BORROWINGS
Consolidated Entity
2020 $’000
2019 $’000
Bank loans — 10,000
(A) FAIR VALUE DISCLOSURESThe fair value of each of the borrowings is provided in Note 28.
(B) RISK EXPOSUREDetails of the Group’s exposure to risks arising from current and non-current borrowings are set out in Note 28.

WPP AUNZ
78
NOTE 22. CURRENT LIABILITIES – PROVISIONS
Consolidated Entity
2020 $’000
2019 $’000
Employee benefits 19,852 22,628
NOTE 23. NON-CURRENT LIABILITIES – OTHER PAYABLESConsolidated Entity
2020 $’000
2019 $’000
Earnouts 4,575 821
Sundry and other payables 2,388 1,931
6,963 2,752
(A) SUNDRY AND OTHER PAYABLESSundry and other payables are not interest bearing.
(B) RELATED PARTY PAYABLESFor terms and conditions relating to related party payables, refer to Note 30.
NOTE 24. NON-CURRENT LIABILITIES – BORROWINGS
Consolidated Entity
2020$’000
2019 $’000
Bank loans 75,000 182,000
Financing facilities available
At reporting date, the following financing facilities had been negotiated and were available:
Available at balance date
Total facilities – bank loans 420,000 420,000
Used at balance date
Facilities used at balance date – bank loans 75,000 192,000
Unused at balance date
Facilities unused at balance date – bank loans 345,000 228,000
(A) SECURED LOANS(I) AUSTRALIAN CORE BANKING FACILITIESThe Company's syndicated facility agreement is split between a debt facility of $420.0 million and a guarantee facility of $29.9 million. The $420.0 million debt facility and the $29.9 million guarantee facility have been renewed on 17 August 2020 with $270.0 million of the debt facility (31 December 2020 drawdown: $75.0 million) expiring on 18 August 2023, $150.0 million of the debt facility (31 December 2020 drawdown: $Nil) used to support intra-month working capital movements expiring on 18 August 2021 and the $29.9 million guarantee facility expiring on 18 August 2023.
NOTES TO THE FINANCIAL STATEMENTS FOR THE YEAR ENDED 31 DECEMBER 2020 (CONTINUED)

ANNUAL REPORT 2020
79
The bank loan facility totalling $420.0 million is secured by:
— registrations on the Personal Property Securities Register in Australia and New Zealand under the Personal Property Securities Act 2009 (Cth) and Personal Property Securities Act 1999 (New Zealand) for WPP AUNZ Limited and certain subsidiaries; and
— guarantee and indemnity between WPP AUNZ Limited and certain subsidiaries.
(II) CLASSIFICATIONThe loans have been classified as either current or non-current based on the expiry date of the loan facility agreements.
(B) INDEMNITY GUARANTEE FACILITYThe indemnity guarantee facility is in place to support financial guarantees. Specific guarantee amounts are $24.3 million (2019: 24.6 million) supporting property rental and other obligations.
(C) ASSETS PLEDGED AS SECURITY
The carrying amount of assets pledged as security for existing Australian core banking facilities is as follows:
Consolidated Entity
2020 $’000
2019 $’000
Current assets
Cash and cash equivalents 32,778 42,377
Trade and other receivables 315,847 367,212
Inventories 1,421 2,873
Other current assets 58,709 73,970
Total current assets 408,755 486,432
Non-current assets
Other receivables 3,902 —
Investments accounted for using the equity method 19,936 17,647
Other financial assets 192,882 271,913
Plant and equipment 28,048 38,208
Deferred tax assets 23,111 29,507
Other non-current assets 3,180 1,890
Total non-current assets 271,059 359,165
Total assets 679,814 845,597
(D) RISK EXPOSUREInformation about the Group's exposure to foreign currency and interest rate changes is provided in Note 28.
(E) RECONCILIATION OF LIABILITIES ARISING FROM FINANCING ACTIVITIESThe table below details changes in the Group's liabilities arising from financing activities, including both cash and non-cash changes. Liabilities arising from financing activities are those for which cash flows were, or future cash flows will be, classified in the consolidated statement of cash flows as cash flows from financing activities.
NotesAt 31 December 2019
$'000Financing cash flows
$'000
Fair value changes(non-cash)
$'000At 31 December 2020
$'000
Bank loans 21 and 24 192,000 (117,000) — 75,000
Lease liabilities 15 106,367 (30,749) 3,327 78,945

WPP AUNZ
80
NOTE 25. NON-CURRENT LIABILITIES – DEFERRED TAX LIABILITIES
Consolidated Entity
2020 $’000
2019 $’000
Accrued revenue 2,848 3,650
Prepayments 99 175
Intangible assets 19,558 23,617
Other 1,178 1,302
Gross deferred tax liabilities 23,683 28,744
Movements
Opening balance 28,744 86,804
Credited to profit or loss (5,810) (44,713)
Acquisition of subsidiaries 765 —
Disposal of controlled entities (16) (13,347)
Closing balance 23,683 28,744
Movements – consolidated
Accrued revenue
$’000
Pre-payments
$’000
Intangible assets $'000
Other$'000
Total$’000
At 1 January 2019 10,270 187 76,347 — 86,804
(Credited)/charged to profit or loss (6,620) 2 (39,401) 1,306 (44,713)
Disposal of controlled entities — (14) (13,329) (4) (13,347)
At 31 December 2019 3,650 175 23,617 1,302 28,744
Credited to profit or loss (802) (76) (4,824) (108) (5,810)
Acquisition of subsidiaries — — 765 — 765
Disposal of controlled entity — — — (16) (16)
At 31 December 2020 2,848 99 19,558 1,178 23,683
NOTE 26. NON-CURRENT LIABILITIES – PROVISIONS
Consolidated Entity
2020 $’000
2019 $’000
Employee benefits 4,153 4,242
NOTES TO THE FINANCIAL STATEMENTS FOR THE YEAR ENDED 31 DECEMBER 2020 (CONTINUED)

ANNUAL REPORT 2020
81
NOTE 27. ISSUED CAPITAL
2020 Number
of shares
2019 Number
of shares2020
$'0002019
$'000
Total issued capital* 852,151,870 851,548,729 737,737 737,149
* The total issued capital at period end is inclusive of 114,943 treasury shares that have been reacquired and held by the Company.
(A) MOVEMENTS IN TOTAL ISSUED CAPITAL
2020Number
of shares2020
$'000
2019Number
of shares2019
$'000
At 1 January 851,548,729 737,149 851,548,729 737,149
Shares issued under the ESP 603,141 588 — —
At 31 December 852,151,870 737,737 851,548,729 737,149
(I) TERMS AND CONDITIONS OF ORDINARY SHARESThe Company’s shares have no par value. Ordinary shares have the right to receive dividends as declared and, in the event of the winding up of the Company, to participate in the proceeds from the sale of all surplus assets in proportion to the number of and amounts paid up on shares held. Ordinary shares entitle their holder to one vote, either in person or by proxy, at a meeting of the Company.
(B) CAPITAL RISK MANAGEMENTThe Company manages its capital to ensure that entities in the Group will be able to continue as going concerns while maximising the return to shareholders through the optimisation of net debt and total equity balances.
In order to maintain or adjust the capital structure, the Company may adjust the amount of dividends paid to shareholders, return capital to shareholders, issue new shares or sell assets to reduce debt.
The capital structure of the Company is monitored using net debt to headline EBITDA from continuing operations ratio. Net debt is calculated as total interest-bearing liabilities, plus earnouts, less cash and cash equivalents. Headline EBITDA is defined as headline consolidated earnings before interest, tax, depreciation and amortisation from continuing operations and is adjusted for significant items.
The net debt to headline EBITDA from continuing operations ratio for the Group at 31 December 2020 and 31 December 2019 was as follows:
Consolidated Entity
2020 $’000
2019 $’000
Total borrowings 75,000 192,000
Add: earnouts 5,651 4,196
Less: cash and cash equivalents (63,472) (74,812)
Net debt 17,179 121,384
Headline EBITDA from continuing operations 100,036 106,500
Net debt to headline EBITDA ratio 0.2x 1.1x

WPP AUNZ
82
NOTE 28. FINANCIAL RISK MANAGEMENTA financial instrument is any contract that gives rise to both a financial asset of one entity and a financial liability or equity instrument of another entity. The Group’s activities expose it to a variety of financial risks: market risk (including foreign exchange risk and interest rate risk), credit risk and liquidity risk. There has been no significant change in the Group’s risk profile from that of the prior year. The Group manages these risks using various financial instruments, governed by a set of policies approved by the Board.
The Group uses different methods to measure different types of risk to which it is exposed. These methods include sensitivity analysis in the case of foreign exchange and interest rate risks, and ageing analysis for credit risk. Risk management is carried out in accordance with ageing policies approved by the Board.
(A) MARKET RISKMarket risk is the risk that the fair value and/or future cash flows from a financial instrument will fluctuate as a result of changes in market factors. The Group has exposure to market risk in the following areas: foreign exchange risk (due to fluctuations in foreign exchange rates) and interest rate risk (due to fluctuations in interest rates).
(I) FOREIGN EXCHANGE RISKForeign exchange risk refers to the risk that the value or the cash flows arising from a financial commitment, or recognised asset or liability, will fluctuate due to changes in foreign currency rates. The Group's foreign exchange risk arises primarily from:
— sales and purchases denominated in foreign currency;
— borrowings denominated in foreign currency; and
— firm commitments and/or highly probable forecast transactions for receipts and payments settled in foreign currencies and prices dependent on foreign currencies, respectively.
The Group is exposed to foreign exchange risk from various currency exposures. All borrowings are in the functional currency of the borrowing entity. The carrying amount of the Group's foreign currency denominated monetary assets and monetary liabilities at the end of the reporting period were as follows:
Financial assets (i) Financial liabilities (i)
2020 $’000
2019 $’000
2020 $’000
2019 $’000
Canadian dollar (CAD) 5,402 506 1,592 928
Great British Pound (GBP) 2,136 868 1,430 477
Indonesian Rupiah (IDR) 2,301 3,137 942 1,173
Malaysian Ringgit (MYR) 2,342 1,982 660 719
New Zealand dollar (NZD) 45,212 52,584 43,028 41,071
Singaporean dollar (SGD) 8,360 12,379 2,995 4,215
United States dollar (USD) 1,375 4,997 231 925
Others 186 1,086 15 444
67,314 77,539 50,893 49,952
(i) The above table shows foreign currency financial assets and liabilities in Australian dollars.
NOTES TO THE FINANCIAL STATEMENTS FOR THE YEAR ENDED 31 DECEMBER 2020 (CONTINUED)

ANNUAL REPORT 2020
83
SensitivityThe Group is mainly exposed to the New Zealand dollar and Singaporean dollar. The analysis below shows the impact on profit or loss and equity of a movement in foreign currency exchange rates against the Australian dollar on the Group's major currencies using the net exposure at the balance date. A sensitivity of 10% has been chosen as this is a reasonable measurement given the level of exchange rates and the volatility observed on a historic basis. A positive number below indicates an increase in the profit or equity where the exchange rate strengthens by 10% against the relevant currency. For a 10% weakening of the relevant currency, there would be a comparable impact on profit or equity, and the balances below would be negative.
The impact on profit or loss and equity is post tax at a rate of 30%.
Impact to post-tax profit 2020
AUD '000
Impact to post-tax profit 2019
AUD '000
Canadian dollar (CAD) 9 (48)
Great British Pound (GBP) (12) (3)
Indonesian Rupiah (IDR) 7 (7)
Malaysian Ringgit (MYR) (10) 39
New Zealand dollar (NZD) (253) (281)
Singaporean dollar (SGD) (52) 1
United States dollar (USD) 6 125
(305) (174)
(II) INTEREST RATE RISK Interest rate risk refers to the risk that the fair value or future cash flows of a financial instrument will fluctuate because of changes in market interest rates.
The Group did not hold any derivative financial instruments as at 31 December 2020 and 31 December 2019.
(B) CREDIT RISKCredit risk refers to the risk that a counterparty will default on its contractual obligations, resulting in a financial loss to the Group. Credit risk arises from cash and cash equivalents and receivables due from customers.
The Group has adopted a policy of only dealing with creditworthy counterparties and obtaining sufficient collateral where appropriate, as a means of mitigating the risk of financial loss from defaults. Customers that do not meet minimum credit criteria are required to pay upfront. Customers who fail to meet their account terms are reviewed for continuing creditworthiness.
Trade receivables consist of a large number of clients, spread across diverse industries and geographical areas. Ongoing credit evaluation is performed on the financial condition of trade receivables, and other receivables balances are monitored on an ongoing basis, with the result that the Group’s exposure to bad debts is not significant. A relatively small number of clients contribute to a significant percentage of the Group’s revenue. For certain customers, the Group purchases credit insurance to protect itself against collection risks.
The maximum exposure to credit risk at the reporting date is the carrying amount of the financial assets as summarised in Note 10. For trade and other receivables, the Group does not hold any credit derivatives or collateral to offset its credit exposure. Due to the short-term nature of these receivables, their carrying amount is assumed to approximate their fair value. The Group does not consider that there is any significant concentration of credit risk.

WPP AUNZ
84
NOTE 28. FINANCIAL RISK MANAGEMENT (CONTINUED)(C) LIQUIDITY RISKLiquidity risk is the risk that an entity will encounter difficulty in meeting obligations associated with financial liabilities. The Group manages liquidity risk by targeting a minimum liquidity level, ensuring long-term commitments are managed with respect to forecast available cash inflows, maintaining access to a variety of funding sources including loan facilities, and managing maturity profiles.
Maturities of financial liabilitiesThe table below provides management’s expectation of the maturity analysis of financial liabilities for the Group. The maturity presented for the secured bank loans is on the basis of the term of the committed bank facility notwithstanding that the outstanding amount is subject to period roll overs. The amounts disclosed in the table are the contractual undiscounted cash flows.
Maturity
Contractual maturities of financial liabilitiesAs at 31 December 2020
≤6 months
$’000
6-12 months
$’000
1-2 years $’000
2-5 years $’000
Over 5 years
$’000
Total contractual cash flows
$’000
Carrying amount
$’000
Trade and other payables (excluding earnouts and deferred income)
529,900 — 2,388 — — 532,288 532,288
Earnouts — 1,095 3,514 1,253 — 5,862 5,651
Lease liabilities 15,656 15,610 28,209 22,944 — 82,419 78,945
Bank loans — — 77,348 — — 77,348 75,000
Total financial liabilities 545,556 16,705 111,459 24,197 — 697,917 691,884
Maturity
Contractual maturities of financial liabilitiesAs at 31 December 2019
≤6 months
$’000
6-12 months
$’000
1-2 years $’000
2-5 years $’000
Over 5 years
$’000
Total contractual cash flows
$’000
Carrying amount
$’000
Trade and other payables (excluding earnouts and deferred income)
500,297 — 1,931 — — 502,228 502,228
Earnouts 3,390 — 761 91 — 4,242 4,196
Lease liabilities 15,423 16,009 31,208 49,648 553 112,841 106,367
Bank loans — 10,101 189,309 — — 199,410 192,000
Total financial liabilities 519,110 26,110 223,209 49,739 553 818,721 804,791
NOTES TO THE FINANCIAL STATEMENTS FOR THE YEAR ENDED 31 DECEMBER 2020 (CONTINUED)

ANNUAL REPORT 2020
85
(D) FAIR VALUE MEASUREMENTSThe fair value of financial assets and financial liabilities must be estimated for recognition and measurement and for disclosure purposes.
The fair value of cash, cash equivalents, and non-interest-bearing financial assets and liabilities approximates their carrying value due to their short maturity.
The fair value of trade receivables less loss allowance/ECL and of trade payables is assumed to approximate the carrying value due to their short-term nature.
The fair value of assets and liabilities traded in active markets (such as publicly traded shares) is based on quoted market prices at the reporting date.
The quoted market price used for financial assets held by the Group is the current bid price.
The fair value of financial assets and liabilities that are not traded in an active market is determined by valuing them at the present value of future contracted cash flows. Cash flows are discounted using standard valuation techniques at the applicable market yield, having regard to timing of cash flows.
The Group holds the following financial instruments:
Consolidated Entity Carrying amount
Consolidated Entity Fair value
2020 $’000
2019 $’000
2020 $’000
2019 $’000
Financial assets
Cash and cash equivalents 63,472 74,812 63,472 74,812
Trade and other receivables 340,081 389,690 340,081 389,690
403,553 464,502 403,553 464,502
Financial liabilities
Trade and other payables (excluding earnouts and deferred income) 532,288 502,228 532,288 502,228
Earnouts 5,651 4,196 5,651 4,196
Lease liabilities 78,945 106,367 78,945 106,367
Bank loans 75,000 192,000 75,000 192,000
691,884 804,791 691,884 804,791
(I) FAIR VALUE HIERARCHY AND VALUATION TECHNIQUESThe Group’s financial assets and liabilities measured and recognised at fair value at 31 December 2020 were based on the following fair value measurement hierarchy:
Level 1 - not applicable There were no level 1 financial assets or liabilities as at 31 December 2020 and 31 December 2019;
Level 2 - not applicable There were no level 2 financial assets or liabilities as at 31 December 2020 and 31 December 2019; and
Level 3 - earnouts The fair value of earnouts is calculated as the present value of estimated future payments based on a discount rate which approximates the Group’s cost of borrowing. Expected cash inflows are estimated on the terms of the sale contract and the entity’s knowledge of the business and how the current economic environment is likely to impact it.

WPP AUNZ
86
NOTE 28. FINANCIAL RISK MANAGEMENT (CONTINUED)(D) FAIR VALUE MEASUREMENTS (CONTINUED)(II) RECOGNISED FAIR VALUE MEASUREMENTSThe following table presents the Group’s liabilities measured and recognised at fair value at 31 December 2020 and 31 December 2019:
As at 31 December 2020Level 1 $’000
Level 2$’000
Level 3$’000
Total $’000
Consolidated Entity
Liabilities
Earnouts — — (5,651) (5,651)
Total liabilities — — (5,651) (5,651)
As at 31 December 2019Level 1 $’000
Level 2$’000
Level 3$’000
Total $’000
Consolidated Entity
Liabilities
Earnouts — — (4,196) (4,196)
Total liabilities — — (4,196) (4,196)
There were no transfers between levels 1, 2 or 3 for fair value measurements during the year.
The Group’s policy is to recognise transfers into and transfers out of fair value hierarchy levels as at the end of the reporting period.
The Group did not measure any financial assets or financial liabilities at fair value on a non-recurring basis as at 31 December 2020.
NOTES TO THE FINANCIAL STATEMENTS FOR THE YEAR ENDED 31 DECEMBER 2020 (CONTINUED)

ANNUAL REPORT 2020
87
(III) FAIR VALUE MEASUREMENTS USING SIGNIFICANT UNOBSERVABLE INPUTS (LEVEL 3)The following table presents the changes in level 3 instruments for the years ended 31 December 2020 and 31 December 2019:
Earnouts$'000
Opening balance at 1 January 2020 (4,196)
Earnout payments made 3,743
Loss on fair value adjustment of earnouts recognised in expenses (29)
Fair value adjustment of earnouts recognised in intangible assets (5,654)
Fair value adjustment of earnouts recognised in other reserves (215)
Interest expense – earnouts (61)
Other 761
Closing balance at 31 December 2020 (5,651)
Opening balance at 1 January 2019 (17,120)
Earnout payments made 13,198
Gain on fair value adjustment of earnouts recognised in other income/(expense) 995
Fair value adjustment of earnouts recognised in other reserves (889)
Interest expense – earnouts (278)
Other (102)
Closing balance at 31 December 2019 (4,196)
(IV) VALUATION INPUTS AND RELATIONSHIPS TO FAIR VALUEThe following table summarises the quantitative information about the significant unobservable inputs used in level 3 fair value measurements:
DescriptionFair value at 31-Dec-20$'000 Unobservable inputs
Significant unobservable input
Relationship of unobservable inputs to fair value
Earnouts 5,651 Risk-adjusted discount rate
Discount rate which reflects the weighted average interest rate of secured bank loans
An increase in the discount rate by 100 basis points would decrease the fair value by $97,914 (2019: $15,957). A decrease in the discount rate by 100 basis points would increase the fair value by $100,885 (2019: $16,298).
Expected cash inflows
Profit before tax If expected cash flows were 5% higher, the fair value would increase by $144,479 (2019: $1,237,010).If expected cash flows were 5% lower, the fair value would decrease by $158,423 (2019: $237,410).
(E) CAPITAL RISKThe Group’s objectives when managing capital are to safeguard the Group’s ability to continue as a going concern in order to provide returns for shareholders and benefits for other stakeholders and to maintain an optimal capital structure to reduce the cost of capital. This is achieved by maintaining a flexible financing structure to be able to fund capital expenditure, new acquisitions and additional amounts payable in respect of past acquisitions and to pay dividends. This policy is balanced against the desire to ensure efficiency in the debt/equity structure of the balance sheet in the longer term through proactive capital management programs.
Borrowing facilities are maintained with the Group’s bankers that are sufficient to meet contractual cash obligations arising in the ordinary course of business, details of which are set out in Note 21 and 24 and this note. The existing borrowing facilities are subject to various debt covenants.

WPP AUNZ
88
NOTE 29. SHARE–BASED PAYMENTSThe following share schemes were adopted by the Company during the year ended 31 December 2020:
— Long-Term incentive Plan ("LTIP") - Performance Rights and Options; and
— Share Ownership Plan ("SOP") - service rights.
(A) LTIP - PERFORMANCE RIGHTS AND OPTIONSThe LTIP provides eligible participants an opportunity to receive fully paid ordinary shares of the Company on vesting/exercise. The plan consists of LTIP Options (75% - financial measures) and Performance Rights (25% - strategic measures). LTIP Options include the grant of Base Options and an opportunity to participate in the future grant of additional options (“Transformation Award”), equal in quantum to their original grant of Base Options and with the same exercise price and expiry date, considering the transformation hurdle achieved and on the basis they must remain continuously employed over another two years after the vesting of Base Options.
Performance Rights and Base Options were allocated to all eligible LTIP participants on a face value basis and granted to them at no cost as part of their long-term remuneration 2,333,333 Performance Rights were granted during the year to the eligible participants under the 2020 LTIP. 5,004,098 Base Options were granted during the year to the eligible participants under the 2020 LTIP with an exercise price of $0.61.
The key terms of the grants under 2020 LTIP and the fair values are summarised below:
Base Options Transformation Award Performance Rights
Performance Period 1 January 2020 - 31 December 2022
Grant Date 21 September 2020 March 2023 provided the Transformation Hurdle is achieved
21 September 2020
Vesting Date February 2023 February 2025 February 2023
Fair Value (1 award) $0.043 $0.018 $0.272
Vesting Conditions — Company's share price is at least equal to or exceeds the exercise price.
— Continued service until vesting date.
— Transformation Hurdle achieved - Company's share price is equal to or exceeds $1.00.
— Continued service until vesting date.
— Strategic objectives delivered on time and on budget, and with contribution to Company margin improvement.
— Continued service until vesting date.
Valuation Date 21 September 2020
Performance Test The Company share price performance will be tested based on the VWAP of the Company's shares for the 90 days leading up to 31 December 2022.
To be conducted by the Board at the end of the Performance Period.
Exercise Price $0.61 Not applicable
Expiry Date Five years after the close of the trading window following the Base Options' vesting date.
Dividends No dividends prior to vesting and exercise of the options.
No dividends prior to vesting.
The Board retains discretion to adjust performance conditions to ensure that senior executives are neither advantaged nor disadvantaged by matters outside the senior executives’ control that affect performance (e.g. by excluding one-off items or the impact of significant acquisitions or disposals).
(B) SOP - SERVICE RIGHTSDuring the year ended 31 December 2020, the rights were granted under the SOP to leaders and employees in recognition of their contribution to the long-term success of the Group and to enable the retention of the high performing leaders in the critical roles. All rights under the SOP were granted to the participants at no cost and are subject to the continuous service conditions until the respective vesting dates determined by the grant terms.
NOTES TO THE FINANCIAL STATEMENTS FOR THE YEAR ENDED 31 DECEMBER 2020 (CONTINUED)

ANNUAL REPORT 2020
89
The total of 145,012 rights were granted under the SOP in September 2020. The key terms of the grant of rights are outlined below:
Number of rights Grant date Vesting dateDividends payable before vesting Fair value (1 award)
20,716 21 September 2020 9 March 2021 Not applicable $0.318
41,432 21 September 2020 9 March 2022 Not applicable $0.294
41,432 21 September 2020 9 March 2023 Not applicable $0.271
41,432 21 September 2020 9 March 2024 Not applicable $0.250
The total of 4,116,968 rights were granted under the SOP to the qualifying participants in December 2020. The key terms of the grant of rights are outlined below:
Number of rights Grant date Vesting dateDividends payable before vesting Fair value (1 award)
3,415,179 18 December 2020 1 March 2021 Not applicable $0.684
506,328 18 December 2020 1 March 2022 Not applicable $0.631
63,291 18 December 2020 1 March 2023 Not applicable $0.583
132,170 18 December 2020 12 October 2022 Not applicable $0.601
(C) FAIR VALUE The fair value of share-based payments is calculated at grant date as the fair value of each share granted multiplied by the number of shares expected to eventually vest. The fair value of each share is based on the market price of the share that includes expected volatility estimation, and dividend entitlements (if any) pursuant to each plan.
The fair value of LTIP Options was determined on the basis of the Black-Scholes methodology to produce a Monte Carlo simulation model in order to incorporate the performance hurdles that must be met before the options vest in the holder. The fair value assumptions included the Company share price at grant, exercise price of the option, share price volatility, risk-free rate, dividend yield, and post-vesting withdrawal. The fair value of LTIP Performance Rights and service rights granted under the SOP was determined on the basis of discounted cash flow method. The fair value assumptions included the Company share price at a respective grant date, vesting date, and dividend yield.
The fair value of the share does not consider non-market vesting conditions. Non-market vesting conditions (i.e achievement of specific Strategic Objectives targets and continuous service conditions) are instead taken into account in the determination of the number of shares expected to eventually vest. This is performed through adjusting the number of shares for the probability of non-vesting due to non-market vesting conditions not being achieved.
For the year ended 31 December 2020, the Company has recognised $2.1 million share-based payment expense in the consolidated statement of profit or loss (2019: $1.8 million). This includes an amortised expense for the 2020 grants and for the grants awarded under the prior period plans.
NOTE 30. RELATED PARTY DISCLOSURES(A) ULTIMATE PARENT ENTITYThe ultimate Australian parent entity within the Group is WPP AUNZ Limited and the ultimate parent entity of the Group is WPP plc, incorporated in Jersey.
(B) SUBSIDIARIESThe consolidated financial statements include the financial statements of the Company and the controlled entities as listed in Note 36. The Company is the parent entity of the Consolidated Entity.
Transactions between the Company and other entities in the wholly-owned group during the years ended 31 December 2020 and 31 December 2019 consisted of:
— loans advanced by/repaid to the Company;
— loans advanced to/repaid by the Company;
— the payment of dividends and trust distributions to the Company; and
— the provision of accounting and administrative assistance.
With the exception of interest-free loans provided by the Company, all other transactions were on commercial terms and conditions.

WPP AUNZ
90
NOTE 30. RELATED PARTY DISCLOSURES (CONTINUED)
(B) SUBSIDIARIES (CONTINUED)Balances and transactions between the Company and its subsidiaries, which are related parties of the Company, have been eliminated on consolidation and are not disclosed in this note. Details of transactions between the Group and other related parties are disclosed below:
(C) TRANSACTIONS WITH RELATED PARTIESTransactions between the Group and WPP plc related parties, joint venture and associates during the year ended 31 December 2020 consisted of ($'000):
— sale of goods and services to related parties: $20,382 (2019: $22,187);
— purchase of goods and services from related parties: $77,100 (2019: $87,189);
— dividends received from joint venture and associates: $2,681 (2019: $5,950);
— net trade receivables from related parties: $2,546 (2019: net trade payables $7,290);
— loans owing from related parties: $Nil (2019: $295);
— loans owing to related parties: $10,605 (2019: $10,819);
— service fee to WPP plc for continuing operations: $10,971 (2019: $12,191);
— IBM recharges for continuing operations: $1,696 (2019: $1,412); and
— IT, finance and administration services provided to Kantar entities (WPP plc associates) per the Transitional Services Agreement: $8,320 (2019: $543)
The Management Fee Framework Agreement sets an aggregate fee that will be paid by WPP AUNZ Limited for services provided by WPP plc to members of the Group during each financial year ("service fee"). The service fee payable for continuing operations for 2020 is 2.28% of net sales of the global brand network businesses. This rate could fluctuate marginally each year based on the changing structure of the business.
NOTE 31. BUSINESS COMBINATIONS
(A) SUMMARY OF ACQUISITIONSDuring the year ended 31 December 2020: On 3 January 2020, AKQA Limited in New Zealand executed an agreement to purchase 100% of Dominion Software Developers Limited ("Dominion") for a cash consideration of $1.5 million (net of cash acquired) and additional contingent consideration which is estimated to be $2.2 million at the reporting date. Intangibles relating to goodwill of $1.9 million and customer relationships of $2.5 million were recognised. Dominion is a digital consulting agency which operates out of Auckland.
On 31 July 2020, Wunderman Thompson Pty Ltd in Australia executed an agreement to purchase the business and the business assets of Meerkats The Brand Leadership Company Pty Limited ("Meerkats") for a cash consideration of $0.4 million (net of cash acquired) and additional contingent consideration which is estimated to be $3.4 million at the reporting date. Intangibles relating to goodwill of $4.1 million were recognised. Meerkats is a branding communications agency which operates out of Perth.
The initial accounting for the acquisitions during the year was provisionally determined at the end of the reporting period at 31 December 2020.
During the year ended 31 December 2019: There were no business acquisitions during the year ended 31 December 2019.
(B) GOODWILLDetails of the provisional fair value of the assets and liabilities acquired and goodwill are as follows:
NotesDominion
$'000Meerkats
$'000Total
$’000
Purchase consideration
Cash paid in the current period 31(D) 1,561 431 1,992
Deferred contingent consideration 2,244 3,410 5,654
Total purchase consideration 3,805 3,841 7,646
Less: fair value of net identifiable (assets)/liabilities acquired 31(C) (1,945) 227 (1,718)
Goodwill acquired 1,860 4,068 5,928
NOTES TO THE FINANCIAL STATEMENTS FOR THE YEAR ENDED 31 DECEMBER 2020 (CONTINUED)

ANNUAL REPORT 2020
91
(C) ASSETS AND LIABILITIES ACQUIREDThe provisional fair value of assets and liabilities arising from the acquisitions for the year ended 31 December 2020 are as follows:
Dominion$'000
Meerkats$'000
Total $'000
Current assets
Cash and cash equivalents 54 — 54
Trade and other receivables 300 255 555
Other current assets 4 — 4
Non-current assets
Plant and equipment 6 104 110
Customer relationships 2,551 — 2,551
Current liabilities
Trade and other payables (119) (255) (374)
Current tax liabilities (86) — (86)
Provisions — (283) (283)
Non-current liabilities
Deferred tax liabilities (765) — (765)
Provisions — (48) (48)
Net assets/(liabilities) 1,945 (227) 1,718
Non-controlling interests in net assets acquired — — —
Net identified assets/(liabilities) acquired 1,945 (227) 1,718
(D) PURCHASE CONSIDERATION
Dominion$'000
Meerkats$'000
Total $’000
Outflow of cash from acquisitions of controlled entities
Cash consideration paid 1,561 431 1,992
Cash balance acquired (54) — (54)
Outflow of cash 1,507 431 1,938

WPP AUNZ
92
NOTE 32. DISCONTINUED OPERATIONS(A) DISPOSALS IN 2020On 31 December 2020, the Company disposed of its interest in Graffiti Group Pty Limited for a total cash consideration of $0.5 million. Given the immaterial nature of the transaction, the disposal has not been disclosed as discontinued operations for the year ended 31 December 2020.
(B) DISPOSALS IN 2019 (I) DISPOSAL OF KANTAR AUSTRALIAN AND NEW ZEALAND BUSINESSES (“KANTAR”) IN 2019On 12 July 2019, WPP plc (WPP AUNZ's majority shareholder) entered into an agreement to sell 60% of Kantar, its global data, research, consulting and analytics business, to Bain Capital Private Equity.
On 6 December 2019, WPP AUNZ sold 100% of its Kantar business in Australia and New Zealand, which forms the Data Investment Management segment, to WPP plc on financial and commercial terms that are in line with the WPP plc global transaction for a total cash consideration of $158.8 million.
(II) IMPAIRMENT LOSSES RELATING TO KANTAR
Impairment losses of $44.3 million were recognised in relation to the Data Investment Management CGU for the half year ended 30 June 2019 which consisted of goodwill impairment of $37.0 million, brand names impairment of $3.4 million and customer relationships impairment of $3.9 million. Further details of the impairment charges made to the Data Investment Management CGU are disclosed in Note 18. No further impairment losses were recognised prior to the date of disposal.
(III) PROFIT FROM DISCONTINUED OPERATIONS IN RELATION TO KANTARThe Kantar results, which have been included in the loss from discontinued operations, were as follows:
2019* $’000
Revenue 154,232
Cost of sale of goods and services rendered (58,270)
Net sales 95,962
Other income 258
96,220
Employee benefits expense (54,835)
Occupancy costs (4,121)
Depreciation expense (2,368)
Amortisation expense (4,426)
Travel, training and other personnel costs (2,144)
Research, new business and other commercial costs (1,065)
Office and administration costs (6,378)
Compliance, audit and listing costs (1,402)
Finance costs (920)
Service fees to WPP plc (7,733)
Impairment expense (44,298)
Loss before income tax (33,470)
Income tax expense (238)
Loss profit from discontinued operations (33,708)
* 2019 results relate to 11 months of trading prior to the disposal on 6 December 2019.
NOTES TO THE FINANCIAL STATEMENTS FOR THE YEAR ENDED 31 DECEMBER 2020 (CONTINUED)

ANNUAL REPORT 2020
93
(IV) NET GAIN ON KANTAR DISPOSALDetails of the net gain on disposal of Kantar are as follows:
2019 $’000
Cash received in the current period 158,776
Less: net assets disposed (48,201)
Less: goodwill disposed (100,108)
Gain on disposal of Kantar 10,467
Income tax expense (5,600)
Net gain on disposal of Kantar 4,867
(V) NET CASH FLOWS OF DISCONTINUED OPERATIONS IN RELATION TO KANTARNet cash flows attributable to Kantar’s operating, investing and financing activities are outlined below:
2019* $’000
Net cash flows from operating activities 8,666
Net cash flows from investing activities 2,073
Net cash flows used in financing activities (27,685)
Net outflow in cash and cash equivalents in relation to Kantar (16,946)
* 2019 results relate to 11 months of trading prior to the disposal on 6 December 2019.
(VI) OGILVY NEW ZEALANDOn 9 August 2019, WPP AUNZ disposed of its 85% interest in Ogilvy New Zealand Limited ("Ogilvy NZ") for NZ$8.3 million.
For the year ended 31 December 2019, the Ogilvy NZ business derived approximately $11.0 million in net sales from its local clients (2018: $20.3 million). Net loss for the period from discontinued operations in relation to Ogilvy NZ is $8.7 million (2018: net profit of $2.3 million). Net loss of $0.3 million was recognised on the disposal of Ogilvy NZ.
As a result of the sale of Kantar and Ogilvy NZ, revenue and expenses relating to the discontinuation of these businesses have been eliminated from the profit or loss from the Group’s continuing operations and are shown as discontinued operations in the consolidated statement of profit or loss and other comprehensive income. Prior year comparatives have been restated accordingly.
(VII) RECONCILIATION OF NET (LOSS)/PROFIT FROM DISCONTINUED OPERATIONS IN 2019
2019 $’000
Loss after tax from discontinued operations (33,708)
Gain on sale (net of tax) 4,867
Kantar loss from discontinued operations (28,841)
Loss after tax from discontinued operations (8,656)
Loss on sale (net of tax) (288)
Ogilvy New Zealand loss from discontinued operations (8,944)
Total loss from discontinued operations (37,785)

WPP AUNZ
94
NOTE 33. TRANSACTIONS WITH NON-CONTROLLING INTERESTSSUMMARY OF TRANSACTIONS WITH NON-CONTROLLING INTERESTSDuring the year ended 31 December 2020:The Company had various buy-outs of non-controlling interests to increase its ownership, with the following acquisitions being material:
On 31 January 2020, STW Media Services Pty Ltd acquired non-controlling interest of 3% in The Brand Agency Pty Ltd ("TBA") increasing its ownership to 87%. TBA is a full service, integrated communications agency based in Perth, Melbourne and Auckland.
On 4 March 2020, WPP Holdings (New Zealand) Limited acquired non-controlling interest of 16.5% in Wunderman Thompson NZ Limited ("WT NZ") increasing its ownership to 100%. WT NZ is a creative, data and technology agency based in Auckland.
On 8 September 2020, STW Media Services Pty Ltd acquired non-controlling interest of 30.0% in STW Geometry Holdings Pty Ltd ("Geometry") increasing its ownership to 100%. Geometry is a creative commerce agency based in Sydney.
During the year ended 31 December 2019: The Company had various buy-outs of non-controlling interests increasing its ownership to 100%, with the following acquisitions being material:
On 1 March 2019, the Company acquired the non-controlling interest of 27.5% in Mayko Trading Pty Ltd (“Mayko”). Mayko is a digital marketing and analytics consultancy based in Sydney.
On 31 May 2019, the Company acquired the non-controlling interest of 25.8% in Union Digital Limited (“Union”). Union is an interactive design and digital marketing agency based in Auckland.
Consolidated Entity
2020 $’000
2019 $’000
Carrying amount of non-controlling interests 7,410 7,050
Consideration paid to non-controlling interests (1,025) (5,540)
Excess of consideration paid for the acquisition of non-controlling interests 6,385 1,510
NOTE 34. EXPENDITURE COMMITMENTS(A) CAPITAL EXPENDITURE COMMITMENTSAs at 31 December 2020, the Group had no commitments for capital expenditure (2019: $Nil).
(B) COMMITMENTSThe Group leases IT and office equipment as well as vehicles with typical lease periods of up to five years and renewal terms included in the contracts. Renewals are at the option of the specific entity that holds the leases. Due to the short-term or low-value of these leases, the Group has elected to classify these as short-term leases and/or leases of low-value items under AASB 16. Subsequently there are no right-of-use assets or lease liabilities for these leases. There are no contingent rentals payable.
Future minimum rentals payable under non-cancellable leases as at 31 December 2020 were as follow:
Consolidated Entity
2020 $’000
2019 $’000
Within one year 636 531
Later than one year and not later than five years 128 581
764 1,112
Share of joint venture and associates' operating lease commitments 35 463
NOTES TO THE FINANCIAL STATEMENTS FOR THE YEAR ENDED 31 DECEMBER 2020 (CONTINUED)

ANNUAL REPORT 2020
95
NOTE 35. CONTINGENT LIABILITIES
The Consolidated Entity had contingent liabilities in respect of:
Consolidated Entity
2020 $’000
2019 $’000
Bank guarantees 24,265 24,576
(A) LEGAL AND REGULATORY PROCEEDINGSThe Group has been involved from time to time in various claims and proceedings arising from the conduct of its business. There are currently no claims or proceedings, either individually or in aggregate, which are likely to have a material effect on the Group’s financial position. The Group maintains insurance cover to minimise the potential effects of such claims, and where appropriate provisions have been made.
(B) GUARANTEESThe Company has provided various bank guarantees totalling $24.3 million (2019: $24.6 million) on behalf of various controlled entities, joint venture and associates. These guarantees will give rise to a liability for the Consolidated Entity if the various controlled entities, joint venture and associates do not meet their obligations under the terms of the lease agreements.
The bank loan facility totalling $420.0 million (2019: $420.0 million) is secured by:
— registrations on the Personal Property Securities Register in Australia and New Zealand under the Personal Property Securities Act 2009 (Cth) and Personal Property Securities Act 1999 (New Zealand) for WPP AUNZ Limited and certain subsidiaries; and
— guarantee and indemnity between WPP AUNZ Limited and certain subsidiaries.

WPP AUNZ
96
NOTES TO THE FINANCIAL STATEMENTS FOR THE YEAR ENDED 31 DECEMBER 2020 (CONTINUED)
NOTE 36. SUBSIDIARIES
LIST OF SUBSIDIARIESThe consolidated financial statements include the financial statements of WPP AUNZ Limited and its controlled entities listed in the following table:
Type of
share/unit
Ownership interest Country of incorporation/
formation2020 2019
WPP AUNZ Analytics Pty Ltd* Ordinary 100% 100% Australia
STW Media Services Pty Limited* Ordinary 100% 100% Australia
— Active Sites Alive Pty Limited* Ordinary 100% 100% Australia
– Active Display Group (Asia) Limited Ordinary 100% 100% Hong Kong
– Boxlink Pty Limited* Ordinary 100% 100% Australia
— AKQA Media Pty Ltd (formerly Switched On Media Pty Ltd)* Ordinary 100% 100% Australia
— Alpha Salmon Pty Limited (i) Ordinary — 100% Australia
— Badjar Ogilvy Pty Limited* Ordinary 100% 100% Australia
— Blaze Advertising Pty Limited* Ordinary 100% 100% Australia
— Buchanan Advertising (Australia) Pty Limited* Ordinary 100% 100% Australia
— Burson Cohne & Wolfe Pty Limited (formerly Burson-Marsteller Pty Ltd)* Ordinary 100% 100% Australia
— Cannings Advisory Services Pty Limited* Ordinary 100% 100% Australia
— Cohn & Wolfe Australia Pty Ltd (i) Ordinary — 100% Australia
— Cornwell Design Pty Limited* Ordinary 100% 100% Australia
— AKQA Pty Limited (formerly DT Digital Pty Limited)* Ordinary 100% 100% Australia
– DT Millipede Pty Limited* Ordinary 100% 100% Australia
— Essence Global Australia Pty Limited Ordinary 100% 100% Australia
— Finance Plus Australia Pty Limited* Ordinary 100% 100% Australia
— Graffiti Group Pty Ltd (ii) Ordinary — 55% Australia
— GroupM Communications Pty Ltd* Ordinary 100% 100% Australia
— GTB Australia Pty Limited (formerly Blue Hive Australia Pty Limited)* Ordinary 100% 100% Australia
— Hill and Knowlton Australia Pty. Limited* Ordinary 100% 100% Australia
— Human Communications Pty Limited* Ordinary 100% 100% Australia
— Ikon Communications Pty Limited* Ordinary 100% 100% Australia
— Ikon Communications (Melbourne) Pty Limited* Ordinary 100% 100% Australia
— I.M Advertising Pty Limited Ordinary 70% 70% Australia
— L'Atelier Media Pty Ltd (formerly Mediacompete Pty Ltd)* Ordinary 100% 100% Australia
— Landor Associates Pty Limited* Ordinary 100% 100% Australia
— Marketing Communications Holdings Australia Pty Limited and its controlled entities*
Ordinary 100% 100% Australia
– Mirum Pty Ltd (formerly Webling Pty Ltd)* Ordinary 100% 100% Australia
— Markitforce Pty Ltd* Ordinary 100% 100% Australia
– Markitforce (Melbourne) Pty Ltd* Ordinary 100% 100% Australia
— Mayko Trading Pty Ltd Ordinary 100% 100% Australia
– Wunderman Pty Limited Ordinary 100% 100% Australia
— Mediacom Australia Pty Limited* Ordinary 100% 100% Australia
— M Media Group Pty Ltd* Ordinary 100% 100% Australia
– Motivator Media Pty Ltd* Ordinary 100% 100% Australia
— New Dialogue Pty Limited Ordinary 100% 100% Australia
— Ogilvy Health Pty Ltd (formerly Ogilvy Commonhealth Pty Ltd)* Ordinary 100% 100% Australia

ANNUAL REPORT 2020
97
Type of
share/unit
Ownership interest Country of incorporation/
formation2020 2019
STW Media Services Pty Limited and its controlled entities (continued)
— OPR Agency Pty Ltd (formerly Ogilvy Public Relations Worldwide Pty Limited)* Ordinary 100% 100% Australia
- Howorth Communications Pty. Limited* Ordinary 100% 100% Australia
- Pulse Communications Pty Limited* Ordinary 100% 100% Australia
- Life Agency Pty Ltd* Ordinary 100% 100% Australia
- O2 Agency Pty Ltd* Ordinary 100% 100% Australia
- OPR Employee Experience Pty Ltd (formerly Impact Employee Communications Pty Limited)*
Ordinary 100% 100% Australia
- OPR Health Pty Limited (formerly Ogilvy PR Health Pty Ltd)* Ordinary 100% 100% Australia
- Parker & Partners Pty Ltd* Ordinary 100% 100% Australia
— Origami Pty Ltd* Ordinary 100% 100% Australia
— Outrider Australia Pty Ltd* Ordinary 100% 100% Australia
— Oxygen Learning Pty Limited (trading as Phuel)* Ordinary 100% 100% Australia
— Picnic Software Pty Limited* Ordinary 100% 100% Australia
— Play Communications Pty Ltd Ordinary 75% 75% Australia
— Prism Team Australia Pty Ltd* Ordinary 100% 100% Australia
— Professional Public Relations Pty Ltd Ordinary 100% 100% Australia
- Professional Public Relations NZ Holdings Limited Ordinary 100% 100% New Zealand
— Research International Australia Pty Ltd* Ordinary 100% 100% Australia
— Sibling Agency Pty Ltd (formerly Moon Communications Pty Limited)* Ordinary 100% 100% Australia
- WPP AUNZ Solutions Pty Ltd* Ordinary 100% 100% Australia
— Singleton Ogilvy & Mather (Holdings) Pty Limited and its controlled entities* Ordinary 100% 100% Australia
- Barton Deakin Pty Limited* Ordinary 100% 100% Australia
- Hawker Britton Group Pty Limited* Ordinary 100% 100% Australia
- WPP AUNZ GR Pty Ltd* Ordinary 100% 100% Australia
- Hogarth Australia Pty Ltd* Ordinary 100% 100% Australia
- Neo Media Australia Pty Limited* Ordinary 100% 100% Australia
- Ogilvy Australia Pty Limited (formerly Ogilvy & Mather (Sydney) Pty Limited)* Ordinary 100% 100% Australia
- Bullseye (Asia Pacific) Pty Limited Ordinary 100% 100% Australia
- Bullseye Digital (New Zealand) Limited (i) Ordinary — 100% New Zealand
- Ethnic Communications Pty Limited* Ordinary 100% 100% Australia
- PT Bullseye Ordinary 100% 100% Indonesia
- Senior Minds Pty Limited* Ordinary 100% 100% Australia
- OgilvyAction Pty Limited* Ordinary 100% 100% Australia
- Red Tape Commercials Pty Limited* Ordinary 100% 100% Australia
- Singleton Ogilvy & Mather (NZ) Limited (i) Ordinary — 100% New Zealand
— STW Group Asia Holdings Pte Limited Ordinary 100% 100% Singapore
- Aleph Pte Limited and its controlled entities Ordinary 75% 75% Singapore
- Buchanan Group Holdings Pte Limited Ordinary 100% 100% Singapore
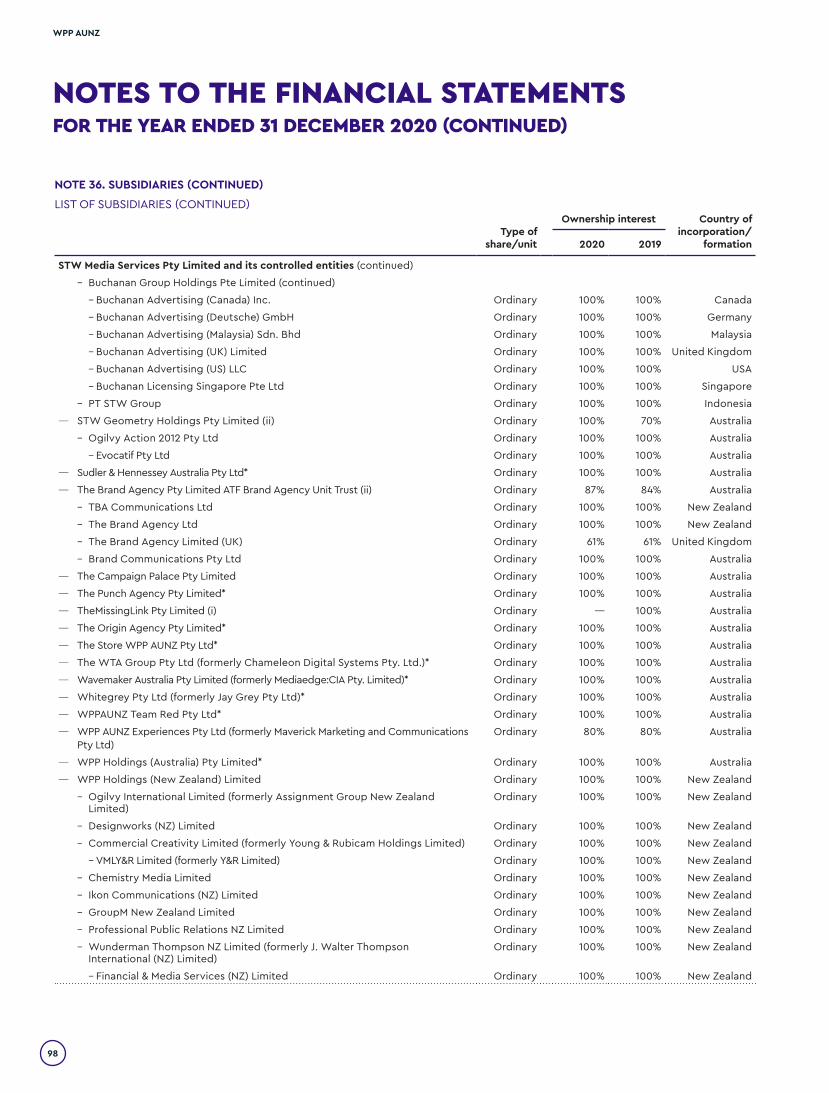
WPP AUNZ
98
NOTE 36. SUBSIDIARIES (CONTINUED)
LIST OF SUBSIDIARIES (CONTINUED)
Type of share/unit
Ownership interest Country of incorporation/
formation2020 2019
STW Media Services Pty Limited and its controlled entities (continued)
- Buchanan Group Holdings Pte Limited (continued)
- Buchanan Advertising (Canada) Inc. Ordinary 100% 100% Canada
- Buchanan Advertising (Deutsche) GmbH Ordinary 100% 100% Germany
- Buchanan Advertising (Malaysia) Sdn. Bhd Ordinary 100% 100% Malaysia
- Buchanan Advertising (UK) Limited Ordinary 100% 100% United Kingdom
- Buchanan Advertising (US) LLC Ordinary 100% 100% USA
- Buchanan Licensing Singapore Pte Ltd Ordinary 100% 100% Singapore
- PT STW Group Ordinary 100% 100% Indonesia
— STW Geometry Holdings Pty Limited (ii) Ordinary 100% 70% Australia
- Ogilvy Action 2012 Pty Ltd Ordinary 100% 100% Australia
- Evocatif Pty Ltd Ordinary 100% 100% Australia
— Sudler & Hennessey Australia Pty Ltd* Ordinary 100% 100% Australia
— The Brand Agency Pty Limited ATF Brand Agency Unit Trust (ii) Ordinary 87% 84% Australia
- TBA Communications Ltd Ordinary 100% 100% New Zealand
- The Brand Agency Ltd Ordinary 100% 100% New Zealand
- The Brand Agency Limited (UK) Ordinary 61% 61% United Kingdom
- Brand Communications Pty Ltd Ordinary 100% 100% Australia
— The Campaign Palace Pty Limited Ordinary 100% 100% Australia
— The Punch Agency Pty Limited* Ordinary 100% 100% Australia
— TheMissingLink Pty Limited (i) Ordinary — 100% Australia
— The Origin Agency Pty Limited* Ordinary 100% 100% Australia
— The Store WPP AUNZ Pty Ltd* Ordinary 100% 100% Australia
— The WTA Group Pty Ltd (formerly Chameleon Digital Systems Pty. Ltd.)* Ordinary 100% 100% Australia
— Wavemaker Australia Pty Limited (formerly Mediaedge:CIA Pty. Limited)* Ordinary 100% 100% Australia
— Whitegrey Pty Ltd (formerly Jay Grey Pty Ltd)* Ordinary 100% 100% Australia
— WPPAUNZ Team Red Pty Ltd* Ordinary 100% 100% Australia
— WPP AUNZ Experiences Pty Ltd (formerly Maverick Marketing and Communications Pty Ltd)
Ordinary 80% 80% Australia
— WPP Holdings (Australia) Pty Limited* Ordinary 100% 100% Australia
— WPP Holdings (New Zealand) Limited Ordinary 100% 100% New Zealand
- Ogilvy International Limited (formerly Assignment Group New Zealand Limited)
Ordinary 100% 100% New Zealand
- Designworks (NZ) Limited Ordinary 100% 100% New Zealand
- Commercial Creativity Limited (formerly Young & Rubicam Holdings Limited) Ordinary 100% 100% New Zealand
- VMLY&R Limited (formerly Y&R Limited) Ordinary 100% 100% New Zealand
- Chemistry Media Limited Ordinary 100% 100% New Zealand
- Ikon Communications (NZ) Limited Ordinary 100% 100% New Zealand
- GroupM New Zealand Limited Ordinary 100% 100% New Zealand
- Professional Public Relations NZ Limited Ordinary 100% 100% New Zealand
- Wunderman Thompson NZ Limited (formerly J. Walter Thompson International (NZ) Limited)
Ordinary 100% 100% New Zealand
- Financial & Media Services (NZ) Limited Ordinary 100% 100% New Zealand
NOTES TO THE FINANCIAL STATEMENTS FOR THE YEAR ENDED 31 DECEMBER 2020 (CONTINUED)

ANNUAL REPORT 2020
99
Type of
share/unit
Ownership interest Country of incorporation/
formation2020 2019
STW Media Services Pty Limited and its controlled entities (continued)
- Heyday Limited (i) Ordinary — 83.5% New Zealand
- Mindshare NZ Limited Ordinary 100% 100% New Zealand
- STW Group (NZ) Limited (i) Ordinary — 100% New Zealand
- AKQA Limited (formerly Union Digital Limited) Ordinary 100% 100% New Zealand
- Dominion Software Developers Limited (ii) Ordinary 100% — New Zealand
- Wavemaker NZ Limited Ordinary 100% 100% New Zealand
— Wunderman Thompson Pty Ltd (formerly J. Walter Thompson Australia Pty. Limited)*
Ordinary 100% 100% Australia
— Young & Rubicam Group Pty Limited* Ordinary 100% 100% Australia
- ABKP Ideaworks Pty Ltd* Ordinary 100% 100% Australia
- VML Digital Pty Limited* Ordinary 100% 100% Australia
- VMLY&R Pty Limited (formerly George Patterson Y & R Pty Limited)* Ordinary 100% 100% Australia
- George Patterson Partners Pty Limited* Ordinary 100% 100% Australia
- Y&R Group Pty Limited* Ordinary 100% 100% Australia
(i) The entity was deregistered during the year.
(ii) During the year, the Company purchased/disposed some or all of its interests in these entities.
* These subsidiaries have been granted relief from the necessity to prepare a financial report in accordance with ASIC Corporations (Wholly-owned Companies) Instrument 2016/785 issued by the Australian Securities and Investments Commission.

WPP AUNZ
100
NOTE 37. DEED OF CROSS GUARANTEEWPP AUNZ Limited and certain of its Australian wholly-owned entities are parties to a deed of cross guarantee under which each company guarantees the debts of the others. By entering into the deed, the wholly-owned entities have been relieved from the requirement to prepare a financial report and directors’ report under ASIC Corporations (Wholly-owned Companies) Instrument 2016/785 issued by the Australian Securities and Investments Commission.
CONSOLIDATED STATEMENT OF PROFIT OR LOSS, CONSOLIDATED STATEMENT OF PROFIT OR LOSS AND OTHER COMPREHENSIVE INCOME AND CONSOLIDATED STATEMENT OF FINANCIAL POSITIONThe above companies represent a closed group for the purpose of the Instrument, and as there are no other parties to the deed of cross guarantee that are controlled by WPP AUNZ Limited, they also represent the extended closed group.
Set out below is a consolidated statement of profit or loss, a consolidated statement of profit or loss and other comprehensive income and a consolidated statement of financial position as relevant for the year ended, or as at 31 December 2020 of the closed group consisting of WPP AUNZ Limited and its relevant controlled entities:
2020$’000
2019$’000
Consolidated statement of profit or loss
Loss before income tax (167,593) (280,559)
Income tax (expense)/benefit (2,402) 17,897
Net loss (169,995) (262,662)
Consolidated statement of profit or loss and other comprehensive income
Net loss (169,995) (262,662)
Other comprehensive income
Items that may be reclassified subsequently to the consolidated statement of profit or loss
Exchange gain/(loss) arising on translation of foreign operations 3,995 (48)
Total comprehensive loss (166,000) (262,710)
NOTES TO THE FINANCIAL STATEMENTS FOR THE YEAR ENDED 31 DECEMBER 2020 (CONTINUED)

ANNUAL REPORT 2020
101
Consolidated statement of financial position2020
$’0002019
$’000
Current assets
Cash and cash equivalents 36,394 34,358
Trade and other receivables 268,082 323,917
Inventories 1,422 2,873
Other current assets 55,449 73,164
Total current assets 361,347 434,312
Non-current assets
Other receivables 3,902 —
Investments accounted for using the equity method 19,936 17,647
Other financial assets 218,675 245,269
Plant and equipment 26,755 36,832
Deferred tax assets 22,488 29,111
Right-of-use assets 45,629 81,283
Intangible assets 333,256 488,683
Other non-current assets 3,052 1,890
Total non-current assets 673,693 900,715
Total assets 1,035,040 1,335,027
Current liabilities
Trade and other payables 550,978 535,686
Current tax liabilities 7,028 5,055
Borrowings — 10,000
Lease liabilities 23,021 24,510
Provisions 17,234 18,916
Total current liabilities 598,261 594,167
Non-current liabilities
Other payables 4,747 2,201
Borrowings 75,000 182,041
Lease liabilities 48,091 70,707
Deferred tax liabilities 16,504 39,962
Provisions 3,596 4,147
Total non-current liabilities 147,938 299,058
Total liabilities 746,199 893,225
Net assets 288,841 441,802
Equity
Issued capital 737,737 737,149
Reserves 37,212 27,549
Retained earnings (486,108) (322,896)
Equity attributable to members of the Parent Entity 288,841 441,802
Non-controlling interests — —
Total equity 288,841 441,802

WPP AUNZ
102
NOTES TO THE FINANCIAL STATEMENTS FOR THE YEAR ENDED 31 DECEMBER 2020 (CONTINUED)
NOTE 38. AUDITORS’ REMUNERATION
Consolidated Entity
2020 $
2019 $
Amounts received or due and receivable by Deloitte Touche Tohmatsu for:
— an audit of the financial report of the entity and any other entity in the Consolidated Entity 1,885,000 2,289,500
— other audit services 30,000 64,200
Amounts received or due and receivable by Deloitte International Associates - services provided to international subsidiaries
— an audit or review of the financial report of the New Zealand subsidiaries 140,000 160,000
2,055,000 2,513,700
NOTE 39. EVENTS OCCURRING AFTER THE REPORTING PERIODSubsequent to the end of the year, the following event occured:
The Directors have declared a total dividend of 4.4 cents, fully franked relating to the 2020 year. This comprises an ordinary dividend of 2.9 cents per share and a special dividend of 1.5 cents per share relating to the proceeds from the sale of Kantar. The dividend payment has a record date of 31 March 2021 and will be paid on 7 April 2021.
Apart from the item disclosed above, there has not arisen, in the interval between the end of the financial period and the date of signing of this financial report, any item, transaction or event of a material or unusual nature which, in the opinion of the Directors, has significantly affected, or may significantly affect, the operations of the Group, the results of those operations, or the state of affairs of the Group, in future periods.
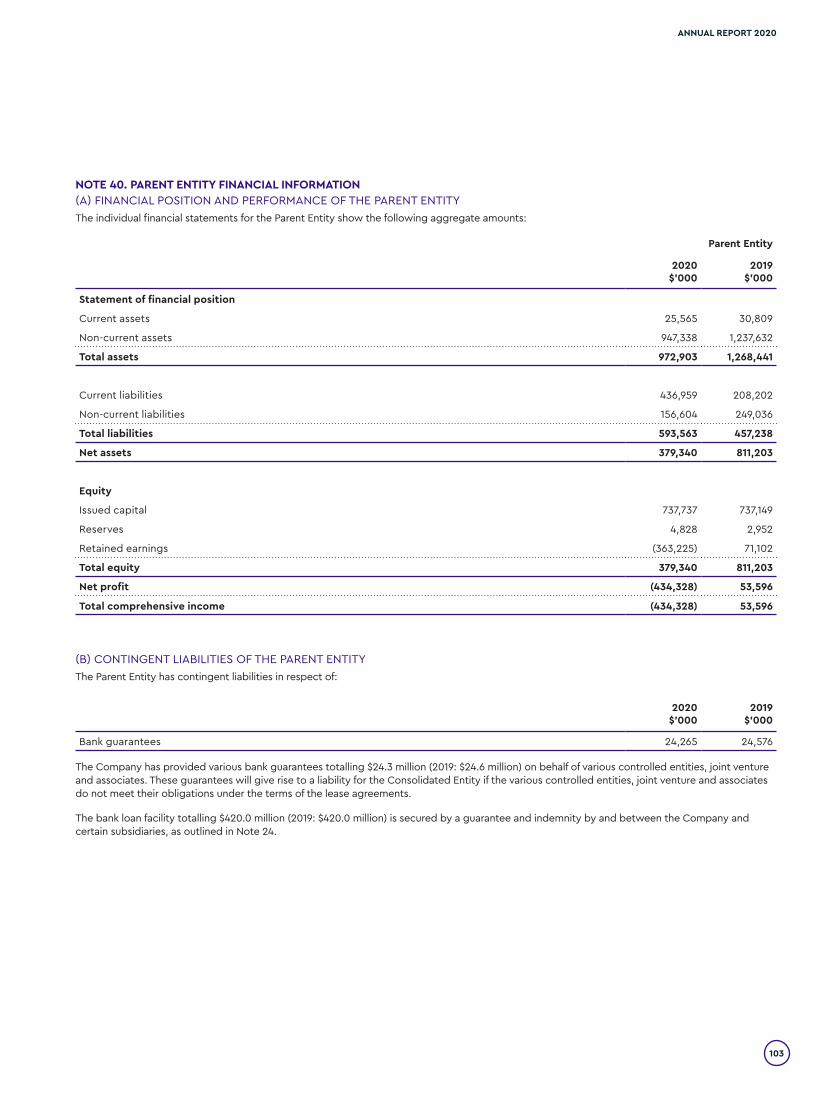
ANNUAL REPORT 2020
103
NOTE 40. PARENT ENTITY FINANCIAL INFORMATION(A) FINANCIAL POSITION AND PERFORMANCE OF THE PARENT ENTITYThe individual financial statements for the Parent Entity show the following aggregate amounts:
Parent Entity
2020 $’000
2019 $’000
Statement of financial position
Current assets 25,565 30,809
Non-current assets 947,338 1,237,632
Total assets 972,903 1,268,441
Current liabilities 436,959 208,202
Non-current liabilities 156,604 249,036
Total liabilities 593,563 457,238
Net assets 379,340 811,203
Equity
Issued capital 737,737 737,149
Reserves 4,828 2,952
Retained earnings (363,225) 71,102
Total equity 379,340 811,203
Net profit (434,328) 53,596
Total comprehensive income (434,328) 53,596
(B) CONTINGENT LIABILITIES OF THE PARENT ENTITYThe Parent Entity has contingent liabilities in respect of:
2020$’000
2019$’000
Bank guarantees 24,265 24,576
The Company has provided various bank guarantees totalling $24.3 million (2019: $24.6 million) on behalf of various controlled entities, joint venture and associates. These guarantees will give rise to a liability for the Consolidated Entity if the various controlled entities, joint venture and associates do not meet their obligations under the terms of the lease agreements.
The bank loan facility totalling $420.0 million (2019: $420.0 million) is secured by a guarantee and indemnity by and between the Company and certain subsidiaries, as outlined in Note 24.

WPP AUNZ
104
DIRECTORS’ DECLARATION
The Directors of WPP AUNZ Limited declare that:
(a) in the Directors’ opinion, there are reasonable grounds to believe that the Company will be able to pay its debts as and when they become dueand payable;
(b) in the Directors’ opinion, the accompanying financial statements are in compliance with International Financial Reporting Standards, as stated inNote 1 to the financial statements;
(c) in the Directors’ opinion, the accompanying financial statements and notes thereto are in accordance with the Corporations Act 2001, includingcompliance with accounting standards and giving a true and fair view of the financial position at 31 December 2020 and performance for theyear ended 31 December 2020 of the Company and the Consolidated Entity; and
(d) the Directors have been given the declarations required by section 295A of the Corporations Act 2001.
At the date of this declaration, the Company is within the class of companies affected by ASIC Corporations (Wholly-owned Companies) Instrument 2016/785 issued by the Australian Securities and Investments Commission. The nature of the deed of cross guarantee is such that each company which is party to the deed, guarantees to each creditor payment in full of any debt in accordance with the deed of cross guarantee.
In the Directors’ opinion, there are reasonable grounds to believe that the members of the extended closed group identified in Note 37 will be able to meet any obligations or liabilities to which they are, or may become, subject by virtue of the deed of cross guarantee described in Note 37.
Signed in accordance with a resolution of the Directors made pursuant to section 295(5) of the Corporations Act 2001:
ROBERT MACTIER JENS MONSEES Chairman Chief Executive Officer and Managing Director
Sydney, 25 February 2021

Member of Deloitte Asia Pacific Limited and the Deloitte organisation.
Liability limited by a scheme approved under Professional Standards Legislation.
105
Deloitte Touche Tohmatsu A.B.N. 74 490 121 060 Grosvenor Place 225 George Street Sydney NSW 2000 PO Box N250 Grosvenor Place Sydney NSW 1220 Australia DX 10307SSE Tel: +61 (0) 2 9322 7000 Fax: +61 (0) 2 9322 7001 www.deloitte.com.au
Independent Auditor’s Report to the members of
WPP AUNZ Limited
Report on the Audit of the Financial Report
Opinion
We have audited the financial report of WPP AUNZ Limited (the “Company”) and its
subsidiaries (the “Group”) which comprises the consolidated statement of financial position
as at 31 December 2020, the consolidated statement of profit or loss and other
comprehensive income, the consolidated statement of changes in equity and the
consolidated statement of cash flows for the year then ended, and notes to the financial
statements, including a summary of significant accounting policies, and the directors’
declaration.
In our opinion, the accompanying financial report of the Group is in accordance with the
Corporations Act 2001, including:
(i) giving a true and fair view of the Group’s financial position as at 31 December 2020
and of its financial performance for the year then ended; and
(ii) complying with Australian Accounting Standards and the Corporations Regulations
2001.
Basis for Opinion
We conducted our audit in accordance with Australian Auditing Standards. Our
responsibilities under those standards are further described in the Auditor’s
Responsibilities for the Audit of the Financial Report section of our report. We are
independent of the Group in accordance with the auditor independence requirements of
the Corporations Act 2001 and the ethical requirements of the Accounting Professional &
Ethical Standards Board’s APES 110 Code of Ethics for Professional Accountants (including
Independence Standards) (the Code) that are relevant to our audit of the financial report
in Australia. We have also fulfilled our other ethical responsibilities in accordance with the
Code.
We confirm that the independence declaration required by the Corporations Act 2001,
which has been given to the directors of the Company, would be in the same terms if given
to the directors as at the time of this auditor’s report.
We believe that the audit evidence we have obtained is sufficient and appropriate to
provide a basis for our opinion.
106
Key Audit Matters
Key audit matters are those matters that, in our professional judgement, were of most
significance in our audit of the financial report for the current period. These matters were
addressed in the context of our audit of the financial report as a whole, and in forming our
opinion thereon, and we do not provide a separate opinion on these matters.
Key Audit Matter How the scope of our audit responded to
the Key Audit Matter Carrying value of goodwill and intangible assets Goodwill and intangible assets of $538.5 million have been recognised in the
consolidated statement of financial position as a result of acquisitions in past periods, as disclosed in note 18. Management conducts impairment tests annually (or more frequently if impairment indicators exist) to assess the recoverability
of the carrying value of goodwill and indefinite useful life intangible assets. This is performed through discounted cash flow models, to determine the higher of value-in-use and fair value less costs to sell.
An impairment charge of $174.5 million was recorded during the year, of which $174.3
million was recognised at 30 June 2020 (‘Half Year’). The impairment charge comprised $112.9 million in the Global Integrated Agencies
CGU, $26.5 million in the Public Relations and Public Affairs CGU and $35.1 million in the Specialist Communications CGU. Of this total impairment charge of $174.5m, $167.0 million was recorded against goodwill, $1.6 million was recorded against
specifically identified brand names and $5.9 million against customer relationships.
As disclosed in note 18 there are a number of key estimates made by management requiring significant judgement in
determining the inputs into these models including:
• future cashflows;
• terminal growth rates; and
• discount rates applied to the projected future cash flows.
Our procedures performed in conjunction with our valuation specialists included, but were not limited to:
• understanding and assessing
management’s process and key controls over identifying and testing individual intangible assets for impairment;
• understanding the process and key controls that management have undertaken to identify CGUs and perform
the impairment assessment;
• assessing and challenging: o management’s assessment of
forecasting accuracy which compares actual results to historic
budgeted results; o management’s FY21 budget
approved by the Board by comparing to actual results;
o the assumptions used for the growth rate by comparing to the relevant industry forecast growth
rate and assumptions for forecast EBIT margins through inspection of supporting evidence of future cost savings;
o the key assumptions for terminal growth rate in the forecast cash flows by comparing them to
historical results and industry forecasts; and
o the discount rate applied by
comparing the WACC to a WACC independently calculated by our valuation specialists.
• testing the mathematical accuracy of the
cash flow models;
• performing sensitivity analyses in relation to key assumptions including discount rate, growth rate and terminal value; and
• assessing the appropriateness of the
disclosures including sensitivities in the assumptions used, included in notes 1(U), 2(A) and 18 to the consolidated financial
statements.

107
Revenue recognition Revenue of $726.2 million has been
recognised in the consolidated statement of profit or loss and other comprehensive income. As disclosed in notes 1(F), the Group recognises revenue when a performance
obligation is satisfied in accordance with the terms of its contractual arrangements. Usually, performance obligations are satisfied over time as services are rendered. Revenue recognised over time is based on the proportion of the service performed,
using either an input method or an output
method, depending on the particular arrangement to measure progress for each performance obligation. For contracts where revenue is recognised using the input method, a number of objective input measures are considered in determining the proportion of performance, including but not
limited to employee time and third-party costs incurred and time elapsed. We identified the cut–off of revenue recognition on contracts, open at 31 December 2020 with respect to creative
agencies as significant risk due to the
judgements necessary to estimate future costs to completion for these contracts.
Our procedures related to the cut-off of revenue recognised for open contracts at year-end with respect to creative agencies included, but were not
limited to:
• understanding and assessing management’s process and key controls over revenue recognition for contracts accounted using either an input or an
output method of measuring the proportion of service performed;
• evaluating management’s ability to accurately forecast costs to project completion by performing retrospective
reviews of project cost estimates as
compared to actual results;
• inquiring of the Group’s project managers to corroborate management’s estimates of anticipated total costs to completion within their forecasting models;
• agreeing actual costs incurred to-date to supporting schedules on a sample basis;
• assessing evidence of service delivery, where an output method is used and determining whether the deliverable is
reflective of the proportion of services
performed;
• evaluating deferred and accrued income balances based on the contract terms, costs incurred to date and remaining cost estimates to conclude on the
appropriateness of the revenue recognised during the year; and
• assessing the appropriateness of the disclosure in note 1(F) to the consolidated financial statements.
Other Information
The directors are responsible for the other information. The other information comprises
the “Directors’ Report” and “Our Remuneration Chair’s letter”, which we obtained prior to
the date of this auditor’s report, and also includes the following information which will be
included in the Group’s annual report (but does not include the financial report and our
auditor’s report thereon): “The Board of Directors”, “Chairman’s Address”, and “Additional
ASX Disclosures”, which is expected to be made available to us after that date.
Our opinion on the financial report does not cover the other information and we do not
and will not express any form of assurance conclusion thereon.

108
In connection with our audit of the financial report, our responsibility is to read the other
information identified above and, in doing so, consider whether the other information is
materially inconsistent with the financial report or our knowledge obtained in the audit, or
otherwise appears to be materially misstated. If, based on the work we have performed
on the other information that we obtained prior to the date of this auditor’s report, we
conclude that there is a material misstatement of this other information, we are required
to report that fact. We have nothing to report in this regard.
When we read the “The Board of Directors”, “Chairman’s Address”, and “Additional ASX
Disclosures”, if we conclude that there is a material misstatement therein, we are required
to communicate the matter to the directors and use our professional judgement to
determine the appropriate action.
Responsibilities of the Directors for the Financial Report
The directors of the Company are responsible for the preparation of the financial report
that gives a true and fair view in accordance with Australian Accounting Standards and the
Corporations Act 2001 and for such internal control as the directors determine is necessary
to enable the preparation of the financial report that gives a true and fair view and is free
from material misstatement, whether due to fraud or error.
In preparing the financial report, the directors are responsible for assessing the ability of
the Group to continue as a going concern, disclosing, as applicable, matters related to
going concern and using the going concern basis of accounting unless the directors either
intend to liquidate the Group or to cease operations, or has no realistic alternative but to
do so.
Auditor’s Responsibilities for the Audit of the Financial Report
Our objectives are to obtain reasonable assurance about whether the financial report as a
whole is free from material misstatement, whether due to fraud or error, and to issue an
auditor’s report that includes our opinion. Reasonable assurance is a high level of
assurance, but is not a guarantee that an audit conducted in accordance with the
Australian Auditing Standards will always detect a material misstatement when it exists.
Misstatements can arise from fraud or error and are considered material if, individually or
in the aggregate, they could reasonably be expected to influence the economic decisions
of users taken on the basis of this financial report.
As part of an audit in accordance with the Australian Auditing Standards, we exercise
professional judgement and maintain professional scepticism throughout the audit. We
also:
• Identify and assess the risks of material misstatement of the financial report,
whether due to fraud or error, design and perform audit procedures responsive to
those risks, and obtain audit evidence that is sufficient and appropriate to provide
a basis for our opinion. The risk of not detecting a material misstatement resulting
from fraud is higher than for one resulting from error, as fraud may involve
collusion, forgery, intentional omissions, misrepresentations, or the override of
internal control.
• Obtain an understanding of internal control relevant to the audit in order to design
audit procedures that are appropriate in the circumstances, but not for the purpose
of expressing an opinion on the effectiveness of the Group’s internal control.
• Evaluate the appropriateness of accounting policies used and the reasonableness
of accounting estimates and related disclosures made by the directors.

109
• Conclude on the appropriateness of the directors’ use of the going concern basis of
accounting and, based on the audit evidence obtained, whether a material
uncertainty exists related to events or conditions that may cast significant doubt
on the Group’s ability to continue as a going concern. If we conclude that a material
uncertainty exists, we are required to draw attention in our auditor’s report to the
related disclosures in the financial report or, if such disclosures are inadequate, to
modify our opinion. Our conclusions are based on the audit evidence obtained up
to the date of our auditor’s report. However, future events or conditions may cause
the Group to cease to continue as a going concern.
• Evaluate the overall presentation, structure and content of the financial report,
including the disclosures, and whether the financial report represents the
underlying transactions and events in a manner that achieves fair presentation.
• Obtain sufficient appropriate audit evidence regarding the financial information of
the entities or business activities within the Group to express an opinion on the
financial report. We are responsible for the direction, supervision and performance
of the Group’s audit. We remain solely responsible for our audit opinion.
We communicate with the directors regarding, among other matters, the planned scope
and timing of the audit and significant audit findings, including any significant deficiencies
in internal control that we identify during our audit.
We also provide the directors with a statement that we have complied with relevant ethical
requirements regarding independence, and to communicate with them all relationships
and other matters that may reasonably be thought to bear on our independence, and
where applicable, actions taken to eliminate threats or safeguards applied.
From the matters communicated with the directors, we determine those matters that were
of most significance in the audit of the financial report of the current period and are
therefore the key audit matters. We describe these matters in our auditor’s report unless
law or regulation precludes public disclosure about the matter or when, in extremely rare
circumstances, we determine that a matter should not be communicated in our report
because the adverse consequences of doing so would reasonably be expected to outweigh
the public interest benefits of such communication.
Report on the Remuneration Report
Opinion on the Remuneration Report
We have audited the Remuneration Report included in pages 20 to 39 of the Directors’
Report for the year ended 31 December 2020.
In our opinion, the Remuneration Report of WPP AUNZ Limited, for the year ended
31 December 2020, complies with section 300A of the Corporations Act 2001.

110
Responsibilities
The directors of the Company are responsible for the preparation and presentation of the
Remuneration Report in accordance with section 300A of the Corporations Act 2001. Our
responsibility is to express an opinion on the Remuneration Report, based on our audit
conducted in accordance with Australian Auditing Standards.
DELOITTE TOUCHE TOHMATSU
Sandeep Chadha
Partner
Chartered Accountants
Sydney, 25 February 2021

ANNUAL REPORT 2020
111
CORPORATE DIRECTORY
DIRECTORS
Robert Mactier (Chairman) Jens Monsees (Managing Director) Graham Cubbin Kim Anderson Ranjana Singh Geoffrey Wild AMDiane Holland
CHIEF EXECUTIVE OFFICERJens Monsees
CHIEF FINANCIAL OFFICERChris Rollinson
AUDITORDeloitte Touche Tohmatsu
REGISTERED OFFICE1 Kent Street Millers Point NSW 2000 Telephone: (02) 9290 7500
SHARE REGISTRYComputershare Investor Services Pty Limited
Level 3 60 Carrington Street Sydney NSW 2000 Telephone: (02) 8234 5000
WEBSITE ADDRESSwww.wppaunz.com
ABN 84 001 657 370

WPP AUNZ 1 Kent St Millers Point NSW 2000
+61 2 9290 7500 WPPAUNZ.COM