asymmetric coding of categorical spatial relations in both language and vision
TRANSCRIPT
In#Press,#Frontiers#in#Cognition#
Asymmetric coding of categorical spatial relations in both language and vision. Roth, J. C. & Franconeri, S. L. Northwestern University Please address correspondence to: Steve Franconeri Northwestern University 2029 Sheridan Rd, Evanston, IL 60208 Phone: 847-467-1259 Fax: 847-491-7859 [email protected] RUNNING HEAD: Asymmetric spatial relationship coding WORD COUNT: 6349
Asymmetric*spatial*relationship*representations** * * * * 2*
Abstract
Describing certain types of spatial relationships between a pair of objects requires that the objects
are assigned different ‘roles’ in the relation, e.g. ‘A is above B’ is different than ‘B is above A’. This
asymmetric representation places one object in the ‘target’ or ‘figure’ role and the other in the
‘reference’ or ‘ground’ role. Here we provide evidence that this asymmetry may be present not just in
spatial language, but also in perceptual representations. More specifically, we describe a model of
visual spatial relationship judgment where the designation of the target object within such a spatial
relationship is guided by the location of the ‘spotlight’ of attention. To demonstrate the existence of
this perceptual asymmetry, we cued attention to one object within a pair by briefly previewing it, and
showed that participants were faster to verify the depicted relation when that object was the linguistic
target. Experiment 1 demonstrated this effect for left-right relations, and Experiment 2 for above-
below relations. These results join several other types of demonstrations in suggesting that perceptual
representations of some spatial relations may be asymmetrically coded, and further suggest that the
location of selective attention may serve as the mechanism that guides this asymmetry.
[211 words]
Keywords: spatial relationships, spatial language, relation perception, binding
Roth*&*Franconeri* * * * * * * * * * 3**
Throughout cognition, absolute values are less important than relative values. At the earliest
levels of perception, our visual system translates local luminance into contrast (Peli, 1990). At the
highest levels of cognition, we make decisions about values (e.g., whether a particular gas station's
prices are 'cheap') based on other values serving as a baseline (even when those baseline values are
irrelevant; Tversky & Kahneman, 1974). Here we explore an intermediate case – our perceptual
system's representation of the relative spatial positions of objects, e.g., 'A is above B'.
The class of relations that we address is the categorical spatial relation. Categorical denotes
relations where exact metric information is less relevant than the abstracted relational prototypes that
objects might fit, such as 'left of', or 'above'. For example, a stapler can still be to the left of the
keyboard, whether it is 2 inches or 2 feet away (Chabris & Kosslyn, 1998; Kosslyn, 1987). Ratings
for how well a pair of objects match a given relational category are subject to their fit within a rough
prototype of ideal spatial arrangements, e.g., within an ideal 'above' relation, two objects are vertically
but not horizontally offset (Carlson & Logan, 2005; Hayward & Tarr, 1995; Logan & Sadler, 1996;
Regier & Carlson, 2001).
This class of relations logically requires that objects within the pair are assigned different ‘roles’
in the relation, such that ‘A is above B’ is different than ‘B is above A’ (Miller & Johnson-Laird,
1976). This asymmetry property can be expressed within spatial language by the assignment of one
object as the ‘target’ or ‘figure’, and the other as the ‘reference’ or ‘ground’ (e.g., 'the target is to the
left of the reference'). There are several properties of objects that can guide the assignment of target
and reference status (Carlson-Radvansky & Radvansky, 1996, Taylor & Tversky, 1996). As an
example, small and movable objects tend to be chosen as targets, in reference to large immobile
objects (e.g., Clark & Chase, 1974). It sounds natural to say that “The bike is to the left of the
building,” but odd to say that “The building is to the right of the bike” (Talmy, 1983) 1.
Here we argue that perceptual representations of categorical spatial relations share this property
of asymmetry. We first describe an account where visual spatial relations are extracted by monitoring
the direction of shifts of the attentional 'spotlight' over time. We then suggest that the current location
of the attentional spotlight marks one object within a relation being 'special', and this marker may be
similar to the asymmetric representation of one object as the 'target' within spatial language. To test *************************************************************1 Though we focus on this particular type of spatial language, we also note that such asymmetries are not constrained to this class of spatial language, or even spatial language in general - they can apply to a large set of linguistic predicates, depending on syntactic, semantic, and contextual factors (see Gleitman, Gleitman, Miller, & Ostrin, 1996).
Asymmetric*spatial*relationship*representations** * * * * 4*
this possibility, we manipulate attention by cueing one object within a pair. We find that people are
faster to verify the relation when this cued object is the 'target' within a verbal description, consistent
with the idea that the attentional spotlight plays a role in creating a similar asymmetry in the
perceptual representation.
The attentional 'spotlight': A potential mechanism for marking the asymmetry of a relation
We briefly describe a model of visual spatial relationship judgment where the designation of the
target object within such a spatial relationship is guided by the location of the ‘spotlight’ of attention
(Franconeri et al., 2012). A primary component of a relation between two objects would be networks
that represent single objects within the ventral visual stream. This stream is hierarchically organized,
such that at lower levels of the stream, networks process incoming visual information in relatively
simple ways (e.g., processing local orientation or brightness), while at higher levels, the processing
becomes progressively more complex (e.g., shape, curvature) (see Grill-Spector & Malach, 2004 for
review). At the most complex levels these networks do allow recognition of objects in a way that
might be used to encode spatial relations, such as networks that respond to spatial arrangements of
facial features, the orientation of a hand, or the presence of a dark blob above a light blob (Tanaka,
2003). However, these representations would not suffice for flexible recognition of relations without
such existing representations of a particular pair of objects in a particular arrangement.
Importantly, the ventral stream does not always precisely represent where objects are in the visual
field. Earlier levels of this stream do focus on local areas of the visual field, and therefore represent
location precisely. But later levels represent information from progressively broader areas of the
visual field, as large as entire visual hemifields (Desimone & Ungerleider, 1989). Thus, we may know
that a cup is present, but we may not know precisely where it is. A proposed solution to this problem
is to relatively isolate processing to specific locations in the visual field, so that any features or
objects present must be confined to that location in the visual field, amplifying signals from that
location while relatively inhibiting signals from other areas (Treisman & Gelade, 1980). Thus,
localizing a given object may require that we selectively process its location with the ‘spotlight’ of
attention. Evidence for this idea comes from studies where participants are prohibited from focusing
their spotlight, resulting in localization errors (Treisman & Schmidt, 1982). In addition, recent studies
using an electrophysiological technique that tracks this spotlight have shown that merely identifying
objects does not necessarily require selectively processing its location, but localizing even the
simplest object does appear to require that we select its location (Hyun et al., 2009; Luck & Ford,
1998). This selection process appears to be controlled by parietal structures in the dorsal visual
Roth*&*Franconeri* * * * * * * * * * 5**
stream, which is argued to contain a spatiotopic map of the visual field that represents the location(s)
selected by the attentional spotlight (Gottlieb, 2007; Serences & Yantis, 2007).
Thus, the ventral stream can represent what objects are present in the visual field, but localizing
any individual object appears to require selection of an object’s location. If so, then how might we
compare the relative spatial relationship between two objects? Intuitively, we feel as if the relation is
revealed when we spread our spotlight of attention across both objects at once. In contrast, the
evidence above suggests that we must select objects one at a time in order to localize them (as well as
to surmount other processing constraints related to object recognition, see Franconeri, et al., 2012).
We have recently argued for this latter possibility, where spatial relationships are judged with a
process that isolates at least one of the objects with selective attention (Franconeri, et al., 2012). For
example, imagine judging the left/right relation between a red and a green ball. Attending to both
objects initially, the ventral stream could represent the fact that a red and a green ball were present in
the visual field, and even that they were horizontally arranged (because a blurred version of the
objects would contain a horizontal stripe). But this representation does not contain explicit
information about the relation between these objects.
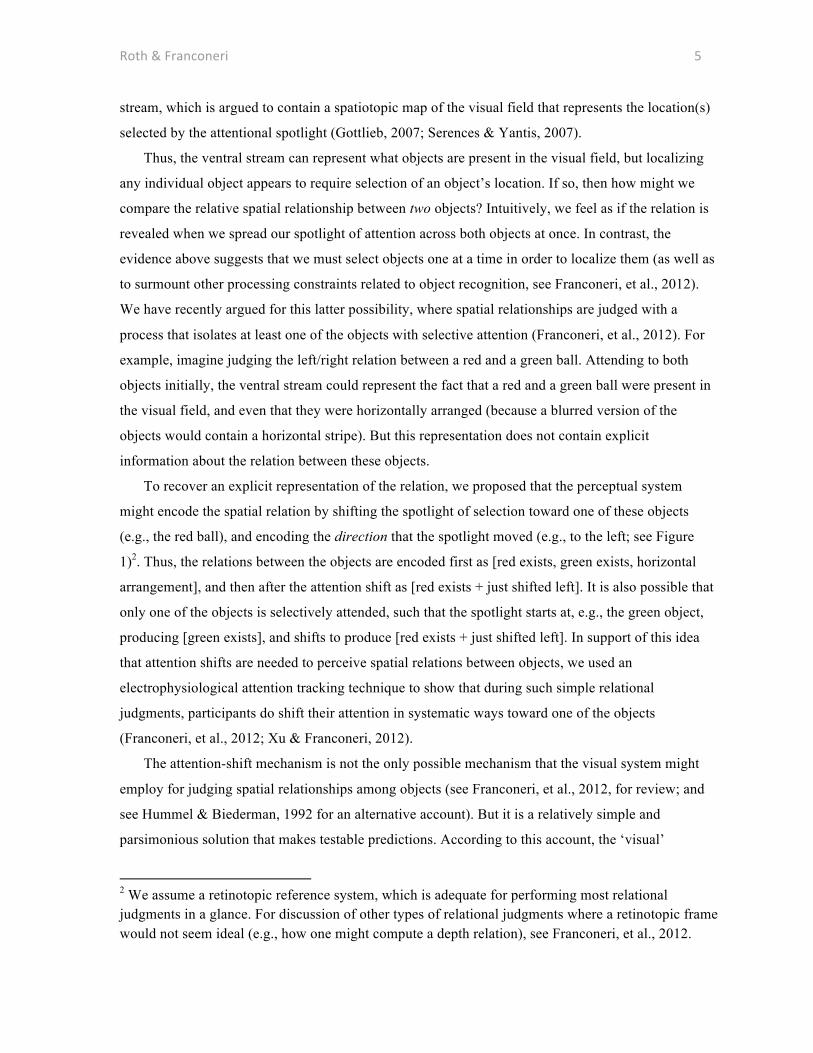
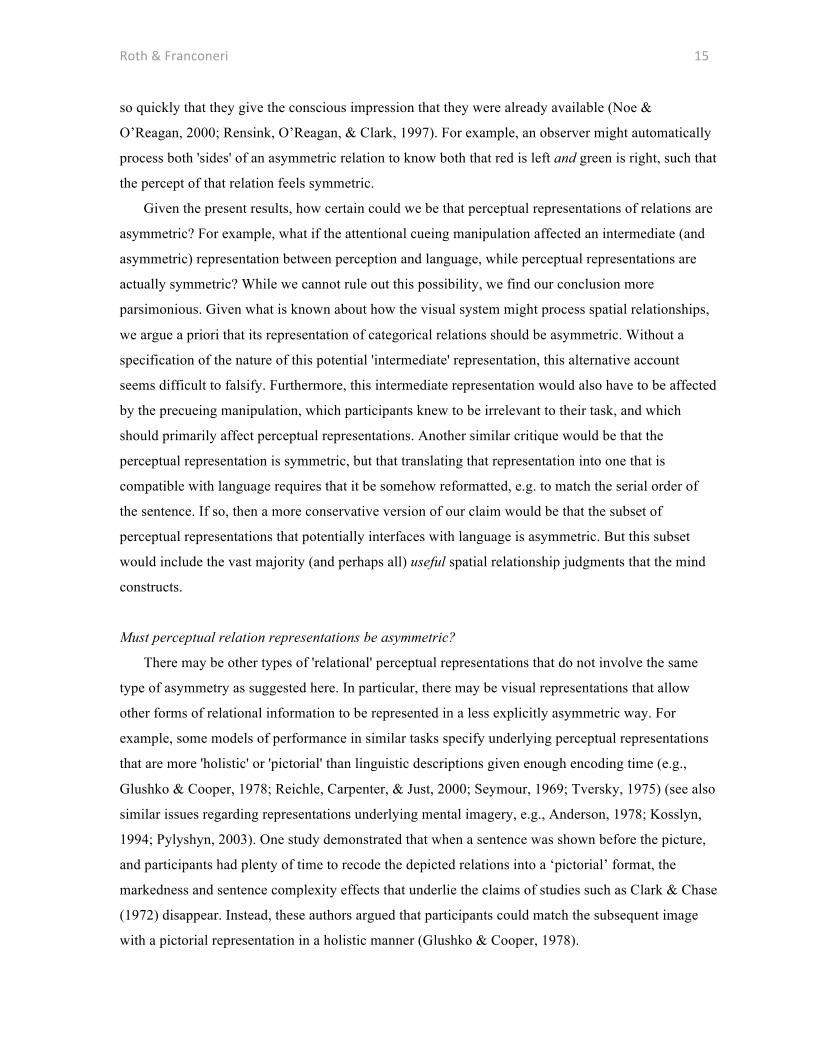
To recover an explicit representation of the relation, we proposed that the perceptual system
might encode the spatial relation by shifting the spotlight of selection toward one of these objects
(e.g., the red ball), and encoding the direction that the spotlight moved (e.g., to the left; see Figure
1)2. Thus, the relations between the objects are encoded first as [red exists, green exists, horizontal
arrangement], and then after the attention shift as [red exists + just shifted left]. It is also possible that
only one of the objects is selectively attended, such that the spotlight starts at, e.g., the green object,
producing [green exists], and shifts to produce [red exists + just shifted left]. In support of this idea
that attention shifts are needed to perceive spatial relations between objects, we used an
electrophysiological attention tracking technique to show that during such simple relational
judgments, participants do shift their attention in systematic ways toward one of the objects
(Franconeri, et al., 2012; Xu & Franconeri, 2012).
The attention-shift mechanism is not the only possible mechanism that the visual system might
employ for judging spatial relationships among objects (see Franconeri, et al., 2012, for review; and
see Hummel & Biederman, 1992 for an alternative account). But it is a relatively simple and
parsimonious solution that makes testable predictions. According to this account, the ‘visual’
*************************************************************2 We assume a retinotopic reference system, which is adequate for performing most relational judgments in a glance. For discussion of other types of relational judgments where a retinotopic frame would not seem ideal (e.g., how one might compute a depth relation), see Franconeri, et al., 2012.

Asymmetric*spatial*relationship*representations** * * * * 6*
representation first contains information about what objects are present and how they are arranged
(e.g., horizontally vs. vertically), and then at a different time point this visual representation contains
the information that the red object is on the left of whatever region of the visual field was previously
attended. Therefore, the representation and understanding of more complex relations (e.g., knowing
what the most recent object was left of, or understanding relations among even greater numbers of
objects) would require broader cognitive systems to guide the selection sequence and store the results
of that sequence.
In summary, this model predicts that the location of the spotlight of attention marks one object
within a relation as being 'special', and this mark may be similar to asymmetric representation of one
object as the 'target' within spatial language.
Linking linguistic and perceptual representations of spatial relations
One source of support for the idea that both linguistic and perceptual representations are
asymmetric comes from demonstrations of compatibility effects between the two representation
types. For example, Clark & Chase (1972) used 'sentence-picture verification' tasks where they asked
participants to verify whether statements such as “star is above plus” or “plus is below star” were true
of an image (see also Carpenter & Just, 1975; Just & Carpenter, 1976). In a critical experiment, when
participants were first shown the image, subsequent verification of statements involving the word
“above” were faster than those involving the word “below”. This suggested that the “above” framing,
which marked the top object as special, was more consistent with the visual encoding of the picture,
implying that the picture’s encoding represented the top object as special. In support of this idea,
when participants were asked to focus on the top object in the initial image, this effect remained, but
when asked to focus on the bottom object, the effect partially reversed, suggesting that the asymmetry
within the visual representation could be changed, and that this change was somehow related to
attention.
The sentence-picture verification task offers the advantage that it tests for compatibility between
linguistic and perceptual representations. Other tasks can show influences of one representation on
the other, though it is not always as clear whether those influences reflect biases as opposed to
mandatory interactions. For example, some studies show that linguistic representations can influence
perceptual processes as indexed by eye movements. In a visual search task (e.g., finding a red vertical
target among red horizontal and green vertical distractors), patterns of response time data suggested
that participants were able to make use of fragments of a description of a search target (“Is there a red
vertical?”) such that hearing only (“Is there a red…”) allowed them to isolate their search to those
objects. This suggests a ‘fluid interaction’ where language could guide attentional allocation (Spivey,

Roth*&*Franconeri* * * * * * * * * * 7**
Tyler, Eberhard, & Tanenhaus, 2001). In another experiment, preparing to produce different
descriptions of a scene affected the ways that the eyes move across that scene (Papafragou, Hulbert,
& Trueswell, 2008). Yet another set of tasks showed that when observers were about to describe an
object in a scene, they looked to the object's position before naming it (Altmann & Kamide, 1999).
Other studies show that perceptual manipulations can affect the way that scenes are described.
One study showed a series of fish swimming toward each other, with one always eating the other. If
the predator fish (e.g., the red fish) were cued with an arrow, observers were more likely to describe
the scene actively (e.g., "The red fish ate the green fish"), whereas if the prey fish (e.g., the green
fish) were cued with an arrow, the description was more likely passive (e.g., "The green fish was
eaten by the red fish”; Tomlin, 1997). Similarly, another study showed that subtler attentional cues
added just before the appearance of a scene could influence descriptions of that scene (Gleitman,
January, Nappa, & Trueswell, 2007). In a scene containing a man and a dog, cueing the future
location of a dog was more likely to produce descriptions such as "The dog chases the man", while
cueing the future location of the man was more likely to produce "The man flees the dog" 3.
While these paradigms and results support important conclusions about the strength and
timecourse of interactions between language and perception, we used a sentence-picture verification
task because it is uniquely suited for seeking compatibility between the representations underlying the
comprehension of the picture and the sentence. Also, in contrast with other studies that use several or
even dozens of objects within the depicted scenes (e.g., Altmann & Kamide, 1999; Spivey, Tyler,
Eberhard, & Tanenhaus, 2001), we used scenes containing only 2 objects, which is well within any
estimate of the processing or memory capacity of the visual system (e.g., Franconeri et al., 2007;
Luck & Vogel, 1997). Thus, any effects of attention within such simple scenes should be all the more
surprising.
*************************************************************3*But see Griffin & Bock, 2000 for an argument for weaker interactions between early stages of scene perception and the construction of linguistic descriptions of scenes, and Gleitman et al., 2007 for detailed discussion of the differing conclusions.*
Asymmetric*spatial*relationship*representations** * * * * 8*
Experiments
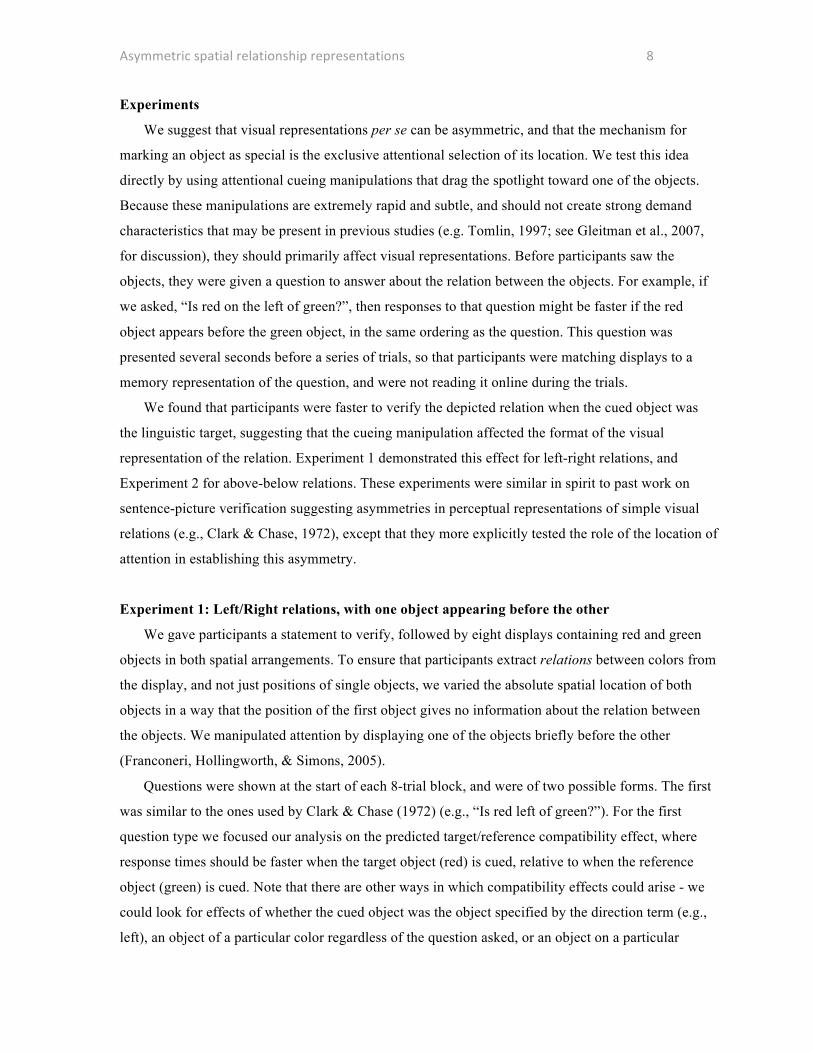
We suggest that visual representations per se can be asymmetric, and that the mechanism for
marking an object as special is the exclusive attentional selection of its location. We test this idea
directly by using attentional cueing manipulations that drag the spotlight toward one of the objects.
Because these manipulations are extremely rapid and subtle, and should not create strong demand
characteristics that may be present in previous studies (e.g. Tomlin, 1997; see Gleitman et al., 2007,
for discussion), they should primarily affect visual representations. Before participants saw the
objects, they were given a question to answer about the relation between the objects. For example, if
we asked, “Is red on the left of green?”, then responses to that question might be faster if the red
object appears before the green object, in the same ordering as the question. This question was
presented several seconds before a series of trials, so that participants were matching displays to a
memory representation of the question, and were not reading it online during the trials.
We found that participants were faster to verify the depicted relation when the cued object was
the linguistic target, suggesting that the cueing manipulation affected the format of the visual
representation of the relation. Experiment 1 demonstrated this effect for left-right relations, and
Experiment 2 for above-below relations. These experiments were similar in spirit to past work on
sentence-picture verification suggesting asymmetries in perceptual representations of simple visual
relations (e.g., Clark & Chase, 1972), except that they more explicitly tested the role of the location of
attention in establishing this asymmetry.
Experiment 1: Left/Right relations, with one object appearing before the other
We gave participants a statement to verify, followed by eight displays containing red and green
objects in both spatial arrangements. To ensure that participants extract relations between colors from
the display, and not just positions of single objects, we varied the absolute spatial location of both
objects in a way that the position of the first object gives no information about the relation between
the objects. We manipulated attention by displaying one of the objects briefly before the other
(Franconeri, Hollingworth, & Simons, 2005).
Questions were shown at the start of each 8-trial block, and were of two possible forms. The first
was similar to the ones used by Clark & Chase (1972) (e.g., “Is red left of green?”). For the first
question type we focused our analysis on the predicted target/reference compatibility effect, where
response times should be faster when the target object (red) is cued, relative to when the reference
object (green) is cued. Note that there are other ways in which compatibility effects could arise - we
could look for effects of whether the cued object was the object specified by the direction term (e.g.,
left), an object of a particular color regardless of the question asked, or an object on a particular
Roth*&*Franconeri* * * * * * * * * * 9**
relative spatial location (e.g. left or top) regardless of the question asked (Jahn, Knauff, & Johnson-
Laird, 2007; Maas, & Russo, 2003; Tversky, Kugelmass, & Winter, 1991). We did not have strong a
priori predictions for these other potential types of compatibility, and there were no robust effects
among them. While we focus on the target/reference effects here, analyses and graphs for these other
types of compatibility effects in supplemental materials. The second type of question was of the form,
“Which color is left?". Here we sought a spatial compatibility effect, but were not sure of its direction
- one might expect that precueing the left object would lead to better performance, but then again
precueing the right object would lead to 'leftward motion' of the objects when the left object appeared
second. We found only weak evidence for the former possibility, and we also note additional
problems with the interpretation of this effect in the General Discussion. We therefore focus instead
on the target/reference effects from the first question type.
Manipulations of attention with transient cues can be sensitive to timing. As pilot data for future
studies, we included several levels of asynchrony between the precue display and the full display
containing both objects (33-233ms). However, because there was insufficient power to confidently
distinguish among these levels and their varied interactions with different types of compatibility
effects, we collapse across these timing differences in the present description, but provide the
analyses and graphs in the supplemental materials.
Methods
Participants
Thirty-one undergraduate students at Northwestern University participated in the 25-minute
session in exchange for course credit.
Apparatus and stimuli
The experiment was controlled by a Dell Precision M65 laptop computer running SR-Research
Experiment Builder. Although head position was not restrained, the display subtended 32.6° x 24.4°
at an approximate viewing distance of 56cm, with a 1024x768 pixel resolution, 33.6 pixels per
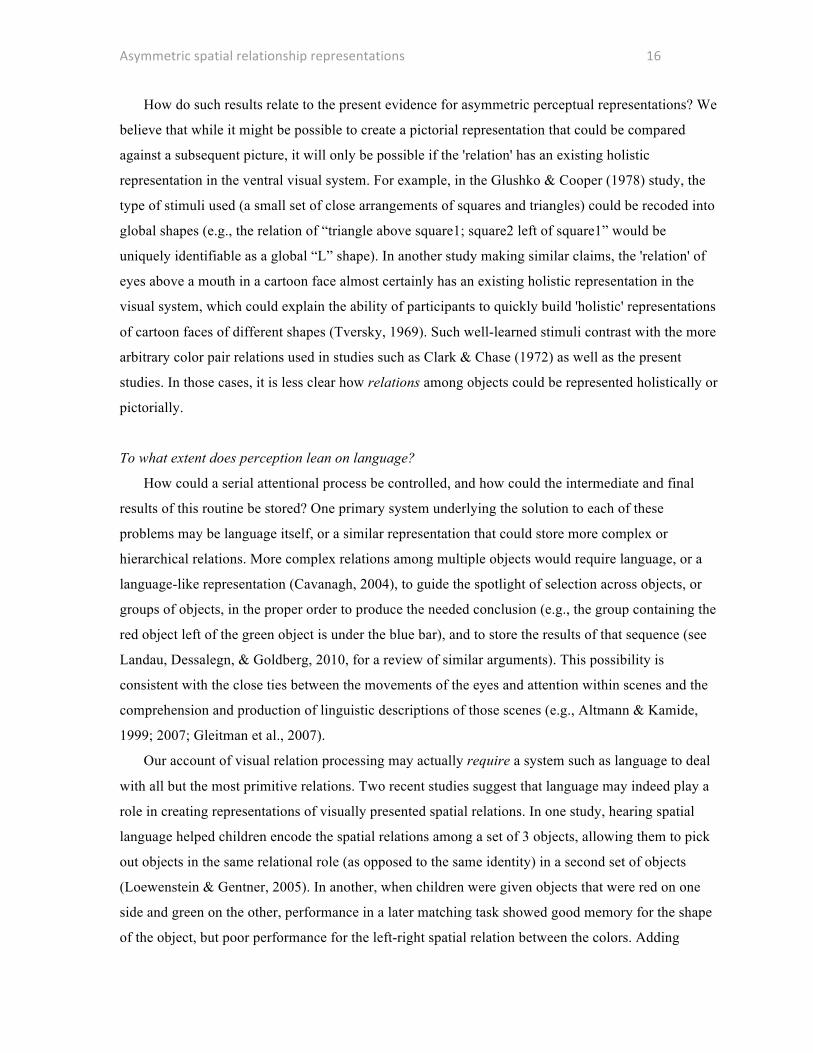
degree. A display with one of six questions was shown, followed by 8 trials. Figure 2 depicts
examples of questions and test displays. Questions were presented vertically as symbolic letter
abbreviations to reduce directional biasing from reading order. The display background was gray
(14.2 cd/m2). Each trial consisted of the display of two circular targets, each at one of four locations
spaced equally in the horizontal direction on the display. A black (1.1 cd/m2) circular fixation point
with a diameter of 11 pixels was present between the two innermost targets at a distance of 50 pixels
to the left or right and 36 pixels above the targets. Each target was 33 pixels in diameter. One circle
Asymmetric*spatial*relationship*representations** * * * * 10*
was always red (19 cd/m2) and the other circle was always green (24 cd/m2), values that are
approximately perceptually equiluminant (see Franconeri, et al., 2012).
Procedure
There were 288 experimental trials in blocks of 8 trials with each trial repeated twice for a total of
576 trials per subject. At the beginning of each block of 8 trials, participants were either instructed to
indicate whether the relation was correct or incorrect or which target color was on the specified side.
These 8 trials consisted of the combination of two starting locations, two starting object color
possibilities, times two possible locations for the second object. The order within and among these 8-
trial blocks was randomized. Participants were instructed to maintain strict fixation through each trial,
even if it this hurt their performance. At the beginning of each trial, a blank display was presented for
800ms, followed by a fixation point presented for 1200-1600ms. To minimize timing effects related
to pre-trial alerting, participants were then alerted by an auditory signal 200ms prior to the appearance
of the first object. One object was displayed, and then the second object appeared either 0
(simultaneously), 33, 83, 133, 183, or 233ms later. Instructions were in two different forms (see
Figure 2). The first was, "is X (Direction) of Y?", where X and Y were "r" for red and "g" for green
and (Direction) was "L" for left and "R" for right. Questions were displayed as “X(Direction)Y?”.
Participants responded with yes or no using the Y and N keys on the keyboard. The second form of
instructions was, "Which is (Direction)?" In this question type, (Direction) was "L" for left and "R"
for right. Questions were displayed as “w(Direction)?”. For these trial types, participants responded
with red or green using the R and F keys on the keyboard. The F key was used instead of the G key
for green so that the vertical arrangement of the keys on the keyboard could reduce potential
directional biasing. The F key was labeled with a letter G to avoid confusion.
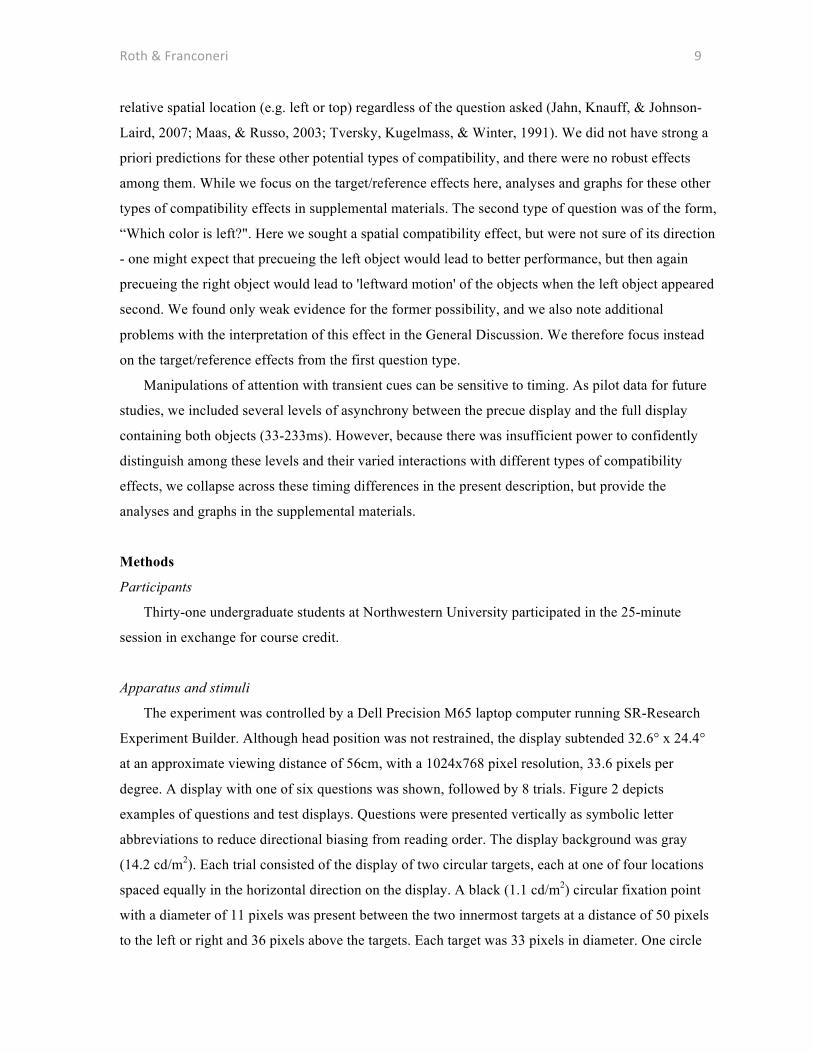
Results & Discussion
Three subjects were omitted from the analysis due to a failure to complete the experiment. One
subject was omitted due to particularly low accuracy (85%), and one was omitted due to an average
response time more than 2 standard deviations above the mean. Twenty-six subjects remained in the
analysis. Accuracy rates were 96% (SD=1.94%) and average response time was 755ms (SD=129ms).
Trials with incorrect responses or responses of over 1500ms were removed from the analysis. Figure
3 depicts the main effects within the data collapsed over the timing manipulations. Note that the
figure does not depict ‘baseline’ RTs, only differences in RT between different conditions. Analysis
of variance below will include baseline RT as a factor, and significant changes in RT across timings
are described in the supplemental materials.
Roth*&*Franconeri* * * * * * * * * * 11**
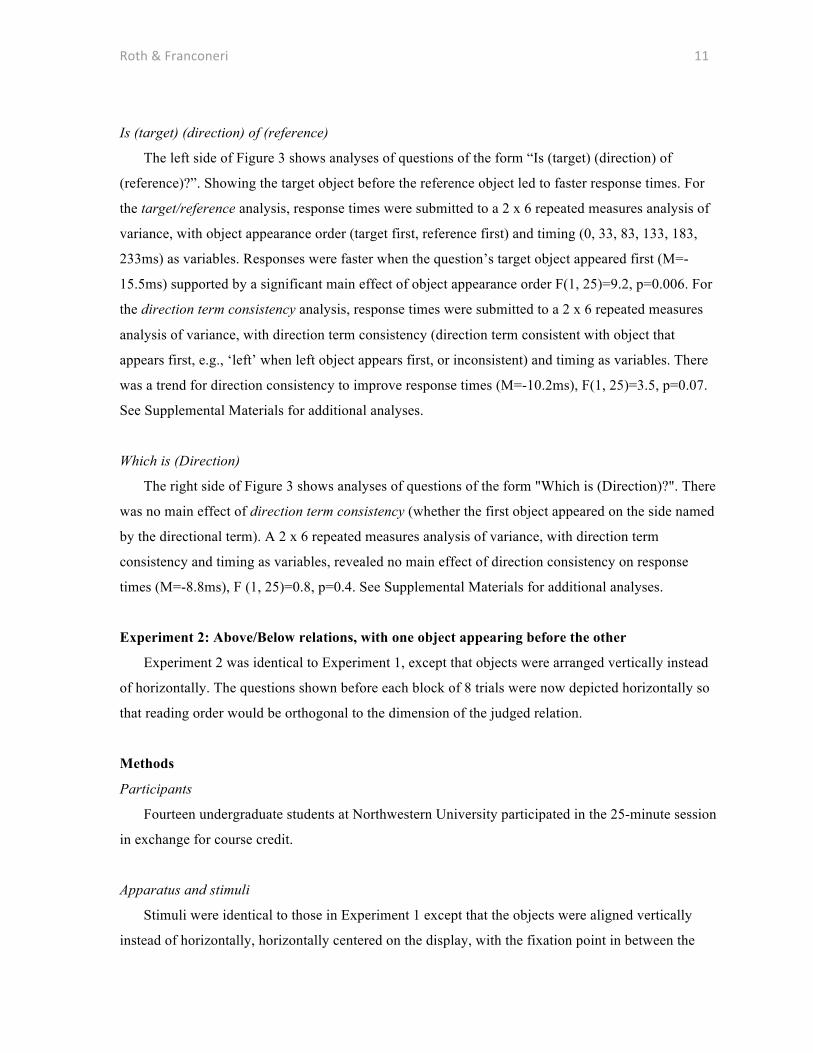
Is (target) (direction) of (reference)
The left side of Figure 3 shows analyses of questions of the form “Is (target) (direction) of
(reference)?”. Showing the target object before the reference object led to faster response times. For
the target/reference analysis, response times were submitted to a 2 x 6 repeated measures analysis of
variance, with object appearance order (target first, reference first) and timing (0, 33, 83, 133, 183,
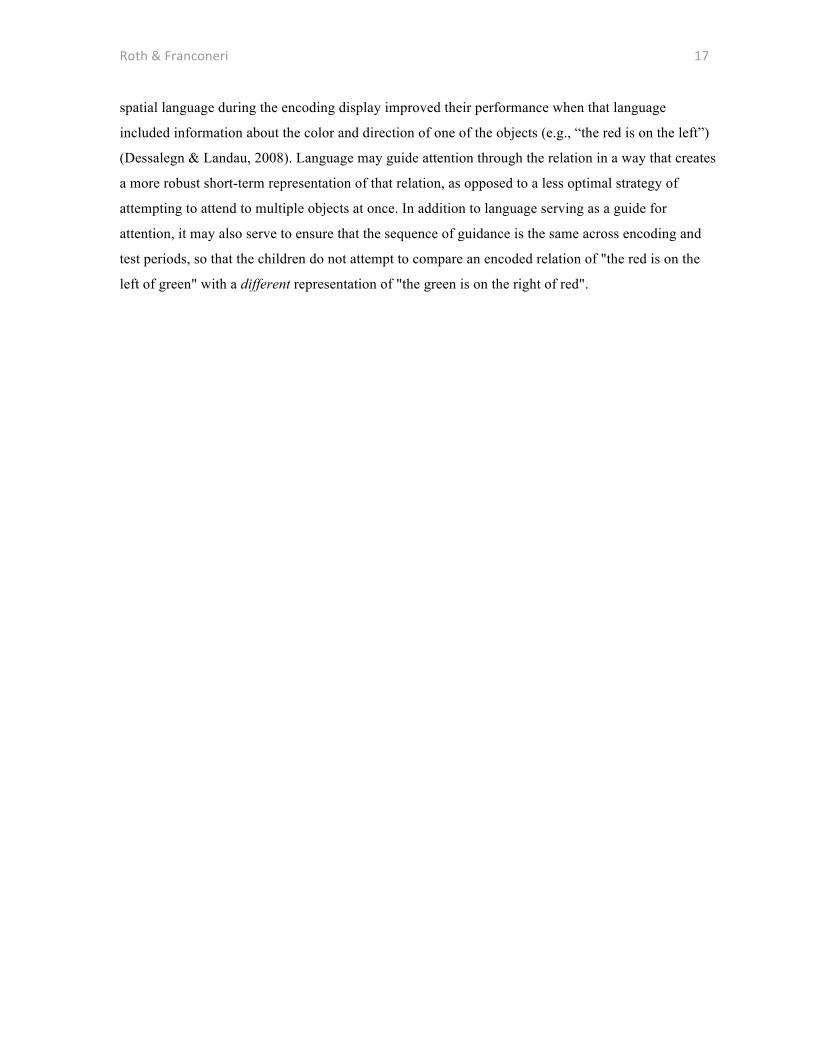
233ms) as variables. Responses were faster when the question’s target object appeared first (M=-
15.5ms) supported by a significant main effect of object appearance order F(1, 25)=9.2, p=0.006. For
the direction term consistency analysis, response times were submitted to a 2 x 6 repeated measures
analysis of variance, with direction term consistency (direction term consistent with object that
appears first, e.g., ‘left’ when left object appears first, or inconsistent) and timing as variables. There
was a trend for direction consistency to improve response times (M=-10.2ms), F(1, 25)=3.5, p=0.07.
See Supplemental Materials for additional analyses.
Which is (Direction)
The right side of Figure 3 shows analyses of questions of the form "Which is (Direction)?". There
was no main effect of direction term consistency (whether the first object appeared on the side named
by the directional term). A 2 x 6 repeated measures analysis of variance, with direction term
consistency and timing as variables, revealed no main effect of direction consistency on response
times (M=-8.8ms), F (1, 25)=0.8, p=0.4. See Supplemental Materials for additional analyses.
Experiment 2: Above/Below relations, with one object appearing before the other
Experiment 2 was identical to Experiment 1, except that objects were arranged vertically instead
of horizontally. The questions shown before each block of 8 trials were now depicted horizontally so
that reading order would be orthogonal to the dimension of the judged relation.
Methods
Participants
Fourteen undergraduate students at Northwestern University participated in the 25-minute session
in exchange for course credit.
Apparatus and stimuli
Stimuli were identical to those in Experiment 1 except that the objects were aligned vertically
instead of horizontally, horizontally centered on the display, with the fixation point in between the
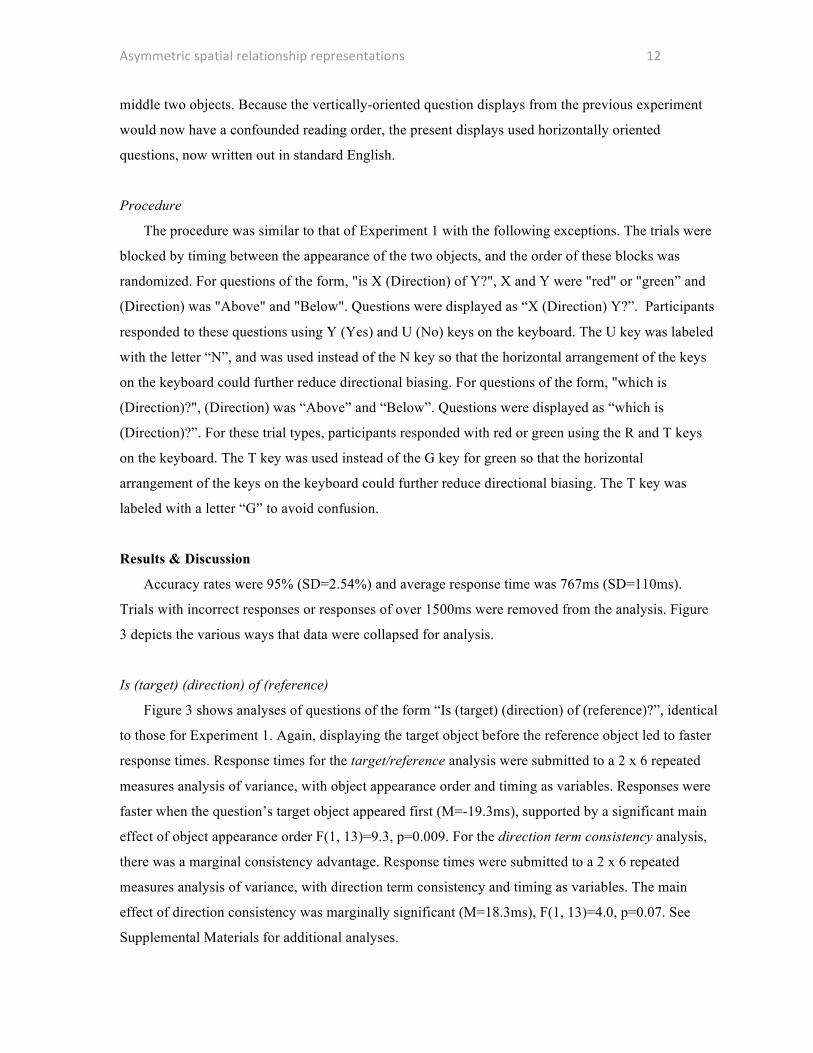
Asymmetric*spatial*relationship*representations** * * * * 12*
middle two objects. Because the vertically-oriented question displays from the previous experiment
would now have a confounded reading order, the present displays used horizontally oriented
questions, now written out in standard English.
Procedure
The procedure was similar to that of Experiment 1 with the following exceptions. The trials were
blocked by timing between the appearance of the two objects, and the order of these blocks was
randomized. For questions of the form, "is X (Direction) of Y?", X and Y were "red" or "green” and
(Direction) was "Above" and "Below". Questions were displayed as “X (Direction) Y?”. Participants
responded to these questions using Y (Yes) and U (No) keys on the keyboard. The U key was labeled
with the letter “N”, and was used instead of the N key so that the horizontal arrangement of the keys
on the keyboard could further reduce directional biasing. For questions of the form, "which is
(Direction)?", (Direction) was “Above” and “Below”. Questions were displayed as “which is
(Direction)?”. For these trial types, participants responded with red or green using the R and T keys
on the keyboard. The T key was used instead of the G key for green so that the horizontal
arrangement of the keys on the keyboard could further reduce directional biasing. The T key was
labeled with a letter “G” to avoid confusion.
Results & Discussion
Accuracy rates were 95% (SD=2.54%) and average response time was 767ms (SD=110ms).
Trials with incorrect responses or responses of over 1500ms were removed from the analysis. Figure
3 depicts the various ways that data were collapsed for analysis.
Is (target) (direction) of (reference)
Figure 3 shows analyses of questions of the form “Is (target) (direction) of (reference)?”, identical
to those for Experiment 1. Again, displaying the target object before the reference object led to faster
response times. Response times for the target/reference analysis were submitted to a 2 x 6 repeated
measures analysis of variance, with object appearance order and timing as variables. Responses were
faster when the question’s target object appeared first (M=-19.3ms), supported by a significant main
effect of object appearance order F(1, 13)=9.3, p=0.009. For the direction term consistency analysis,
there was a marginal consistency advantage. Response times were submitted to a 2 x 6 repeated
measures analysis of variance, with direction term consistency and timing as variables. The main
effect of direction consistency was marginally significant (M=18.3ms), F(1, 13)=4.0, p=0.07. See
Supplemental Materials for additional analyses.
Roth*&*Franconeri* * * * * * * * * * 13**
Which is (Direction)
The right sides of Figure 3 shows analyses of questions of the form "Which is (Direction)?", and
here there was a main effect of direction consistency such that responses were faster when the first
object appeared on the side named by the directional term. Response times for the direction term
consistency analysis were submitted to a 2 x 6 repeated measures analysis of variance, with direction
term consistency and timing as variables. There was a main effect of direction consistency on
response times (M=-31.4ms), F(1, 12)=5.4, p=0.04, reflecting an advantage when objects appeared in
a direction consistent with the term used in the question. See Supplemental Materials for additional
analyses.
General Discussion
We tested whether the position of the attentional spotlight affects visual representations of
relations by determining the direction of asymmetry within that relation. Experiment 1 tested
left/right relations, while Experiment 2 tested above/below relations. We manipulated attention by
precueing one object within the pair, and this precue affected compatibility with the linguistic framing
of the question that participants were asked to verify. The most robust example was the type of
compatibility for which we had a strong a priori prediction - target/reference designations for
questions of the form, “Is (target) (direction) of (reference)?”. In both experiments, participant
responses were faster when the ‘target’ object appeared before the ‘reference’ object, an order that
follows the ordering within the question.
For these questions, there were no robust effects suggesting response time advantages when the
direction term in the question was consistent with appearance order. For questions of the form
“Which is (Direction)?”, both experiments show some response time advantages when the first object
appears on the side named by the direction term (e.g., for “Which is left”, responses are faster when
the left object appears first). This effect was weak in Experiment 1 (specific to one timing value, see
supplemental materials), and was a main effect for Experiment 2. However, the direction consistency
benefits from these simpler questions are more difficult to interpret. If the results had shown the
opposite effect, such that response times were faster when the second object appeared on the side
named by the directional term, it could have indicated an advantage for trials where the attentional
‘spotlight’ traveled in that direction. For example, when asking, “Which is left”, some versions of the
attentional shift account would predict better performance after a leftward shift, which should
simultaneously produce the representation of the shift direction (left) plus the color of the object on
that side of the relation. But because the results suggest that the identity of the first object matters, we
Asymmetric*spatial*relationship*representations** * * * * 14*
cannot rule out the possibility that the preview of the first object primed the response to that object’s
color identity, regardless of any effects of that preview on relational processing. Thus, given the
current results we cannot draw any firm conclusions from these directional questions.
In summary, the most diagnostic results stem from the target/reference analysis across the “Is
(target) (direction) of (reference)?” questions, which show that previewing the linguistic target object
slightly before the reference object (the same temporal ordering as the question) speeds response
times for both left/right and above/below judgments. Attentional manipulations do affect the
compatibility of visual representations with asymmetric linguistic representations, providing evidence
that visual representations of relations may be similarly asymmetric.
Note that following the order prescribed by the sentence reveals an interesting potential property
of the perceptual representation: following that order produces the ‘wrong’ relational term within the
attention shift model. For example, given an image of (red green) and the question “Is red left of
green?”, according to our account, following the order of the question would produce [red] and then
[rightward+green]. For this representation to be compatible with the surface form of the linguistic
representation, the visual mechanism would have to ‘flip’ the directional term (changing ‘right’ to
‘left’). This flip is counterintuitive, but certainly not computationally difficult.
A deeper understanding of how these asymmetries interact will require additional converging
evidence for how attention moves within such simple displays of relations, as well as new data using
other types of cueing methods (e.g., transient events that occur near or on two existing objects,
instead of having one object appear at a different time point). Ongoing work in our laboratory does
show that using other measures besides attentional cueing (eyetracking and electrophysiological
attention-tracking techniques), we find that the eyes and attention are controlled in the same ways as
suggested here. That is, when engaged in a sentence-picture matching task, the eyes (and attention)
shift toward the relational 'target' object (Franconeri, et al., in prep). Note that, by themselves, such
tracking results could not show a causal effect of attentional allocation in the way that the present
studies do.
The idea that visual relation representations are asymmetric is consistent with our account of
visual relation processing (Franconeri, et al., 2012), which predicts that the visual system provides a
serial stream of information about the relations between objects in a scene, one relation at a time. If
visual relations are processed in such a serial fashion, why do we feel as if we have a more detailed
percept of the relations around us? One possibility is that other visual information about the objects
within the relation supports this percept of detail, such as how many are present (Franconeri, Bemis,
& Alvarez, 2009), the global shape of their arrangement (Sanocki & Sulman, 2009), and statistical
information about their identities (Ariely, 2001). Individual relations may be produced ‘on demand’
Roth*&*Franconeri* * * * * * * * * * 15**
so quickly that they give the conscious impression that they were already available (Noe &
O’Reagan, 2000; Rensink, O’Reagan, & Clark, 1997). For example, an observer might automatically
process both 'sides' of an asymmetric relation to know both that red is left and green is right, such that
the percept of that relation feels symmetric.
Given the present results, how certain could we be that perceptual representations of relations are
asymmetric? For example, what if the attentional cueing manipulation affected an intermediate (and
asymmetric) representation between perception and language, while perceptual representations are
actually symmetric? While we cannot rule out this possibility, we find our conclusion more
parsimonious. Given what is known about how the visual system might process spatial relationships,
we argue a priori that its representation of categorical relations should be asymmetric. Without a
specification of the nature of this potential 'intermediate' representation, this alternative account
seems difficult to falsify. Furthermore, this intermediate representation would also have to be affected
by the precueing manipulation, which participants knew to be irrelevant to their task, and which
should primarily affect perceptual representations. Another similar critique would be that the
perceptual representation is symmetric, but that translating that representation into one that is
compatible with language requires that it be somehow reformatted, e.g. to match the serial order of
the sentence. If so, then a more conservative version of our claim would be that the subset of
perceptual representations that potentially interfaces with language is asymmetric. But this subset
would include the vast majority (and perhaps all) useful spatial relationship judgments that the mind
constructs.
Must perceptual relation representations be asymmetric?
There may be other types of 'relational' perceptual representations that do not involve the same
type of asymmetry as suggested here. In particular, there may be visual representations that allow
other forms of relational information to be represented in a less explicitly asymmetric way. For
example, some models of performance in similar tasks specify underlying perceptual representations
that are more 'holistic' or 'pictorial' than linguistic descriptions given enough encoding time (e.g.,
Glushko & Cooper, 1978; Reichle, Carpenter, & Just, 2000; Seymour, 1969; Tversky, 1975) (see also
similar issues regarding representations underlying mental imagery, e.g., Anderson, 1978; Kosslyn,
1994; Pylyshyn, 2003). One study demonstrated that when a sentence was shown before the picture,
and participants had plenty of time to recode the depicted relations into a ‘pictorial’ format, the
markedness and sentence complexity effects that underlie the claims of studies such as Clark & Chase
(1972) disappear. Instead, these authors argued that participants could match the subsequent image
with a pictorial representation in a holistic manner (Glushko & Cooper, 1978).
Asymmetric*spatial*relationship*representations** * * * * 16*
How do such results relate to the present evidence for asymmetric perceptual representations? We
believe that while it might be possible to create a pictorial representation that could be compared
against a subsequent picture, it will only be possible if the 'relation' has an existing holistic
representation in the ventral visual system. For example, in the Glushko & Cooper (1978) study, the
type of stimuli used (a small set of close arrangements of squares and triangles) could be recoded into
global shapes (e.g., the relation of “triangle above square1; square2 left of square1” would be
uniquely identifiable as a global “L” shape). In another study making similar claims, the 'relation' of
eyes above a mouth in a cartoon face almost certainly has an existing holistic representation in the
visual system, which could explain the ability of participants to quickly build 'holistic' representations
of cartoon faces of different shapes (Tversky, 1969). Such well-learned stimuli contrast with the more
arbitrary color pair relations used in studies such as Clark & Chase (1972) as well as the present
studies. In those cases, it is less clear how relations among objects could be represented holistically or
pictorially.
To what extent does perception lean on language?
How could a serial attentional process be controlled, and how could the intermediate and final
results of this routine be stored? One primary system underlying the solution to each of these
problems may be language itself, or a similar representation that could store more complex or
hierarchical relations. More complex relations among multiple objects would require language, or a
language-like representation (Cavanagh, 2004), to guide the spotlight of selection across objects, or
groups of objects, in the proper order to produce the needed conclusion (e.g., the group containing the
red object left of the green object is under the blue bar), and to store the results of that sequence (see
Landau, Dessalegn, & Goldberg, 2010, for a review of similar arguments). This possibility is
consistent with the close ties between the movements of the eyes and attention within scenes and the
comprehension and production of linguistic descriptions of those scenes (e.g., Altmann & Kamide,
1999; 2007; Gleitman et al., 2007).
Our account of visual relation processing may actually require a system such as language to deal
with all but the most primitive relations. Two recent studies suggest that language may indeed play a
role in creating representations of visually presented spatial relations. In one study, hearing spatial
language helped children encode the spatial relations among a set of 3 objects, allowing them to pick
out objects in the same relational role (as opposed to the same identity) in a second set of objects
(Loewenstein & Gentner, 2005). In another, when children were given objects that were red on one
side and green on the other, performance in a later matching task showed good memory for the shape
of the object, but poor performance for the left-right spatial relation between the colors. Adding
Roth*&*Franconeri* * * * * * * * * * 17**
spatial language during the encoding display improved their performance when that language
included information about the color and direction of one of the objects (e.g., “the red is on the left”)
(Dessalegn & Landau, 2008). Language may guide attention through the relation in a way that creates
a more robust short-term representation of that relation, as opposed to a less optimal strategy of
attempting to attend to multiple objects at once. In addition to language serving as a guide for
attention, it may also serve to ensure that the sequence of guidance is the same across encoding and
test periods, so that the children do not attempt to compare an encoded relation of "the red is on the
left of green" with a different representation of "the green is on the right of red".

Asymmetric*spatial*relationship*representations** * * * * 18*
Acknowledgements
This work was supported by an NSF CAREER grant (S.F.) BCS-1056730 and NSF SLC Grant
SBE-0541957/ SBE-1041707, the Spatial Intelligence and Learning Center (SILC). We are grateful to
Banchiamlack Dessalegn and the manuscript's reviewers for their most helpful feedback.
Roth*&*Franconeri* * * * * * * * * * 19**
Figures
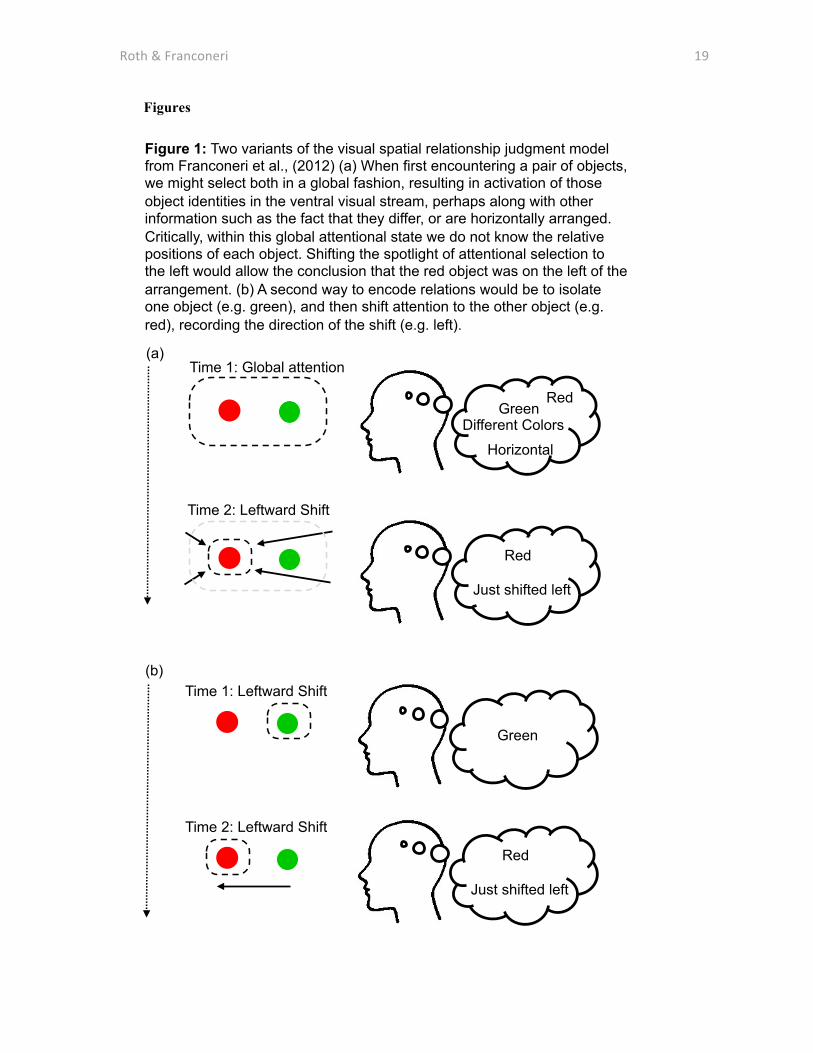
Figure 1: Two variants of the visual spatial relationship judgment model from Franconeri et al., (2012) (a) When first encountering a pair of objects, we might select both in a global fashion, resulting in activation of those object identities in the ventral visual stream, perhaps along with other information such as the fact that they differ, or are horizontally arranged. Critically, within this global attentional state we do not know the relative positions of each object. Shifting the spotlight of attentional selection to the left would allow the conclusion that the red object was on the left of the arrangement. (b) A second way to encode relations would be to isolate one object (e.g. green), and then shift attention to the other object (e.g. red), recording the direction of the shift (e.g. left).
Green
(b) Time 1: Leftward Shift
Red
Just shifted left
Time 2: Leftward Shift
Red
Just shifted left
Red Green
Horizontal
Different Colors
Time 2: Leftward Shift
Time 1: Global attention (a)
Asymmetric*spatial*relationship*representations** * * * * 20*
g L r ?
r L g ?
g R r ?
r R g ?
w L ?
w R ?
Y or N
Y or N
Y or N
Y or N
R or G
R or G
0-233 ms
1200-1600ms (Random)
Until Response
(a)
(b)
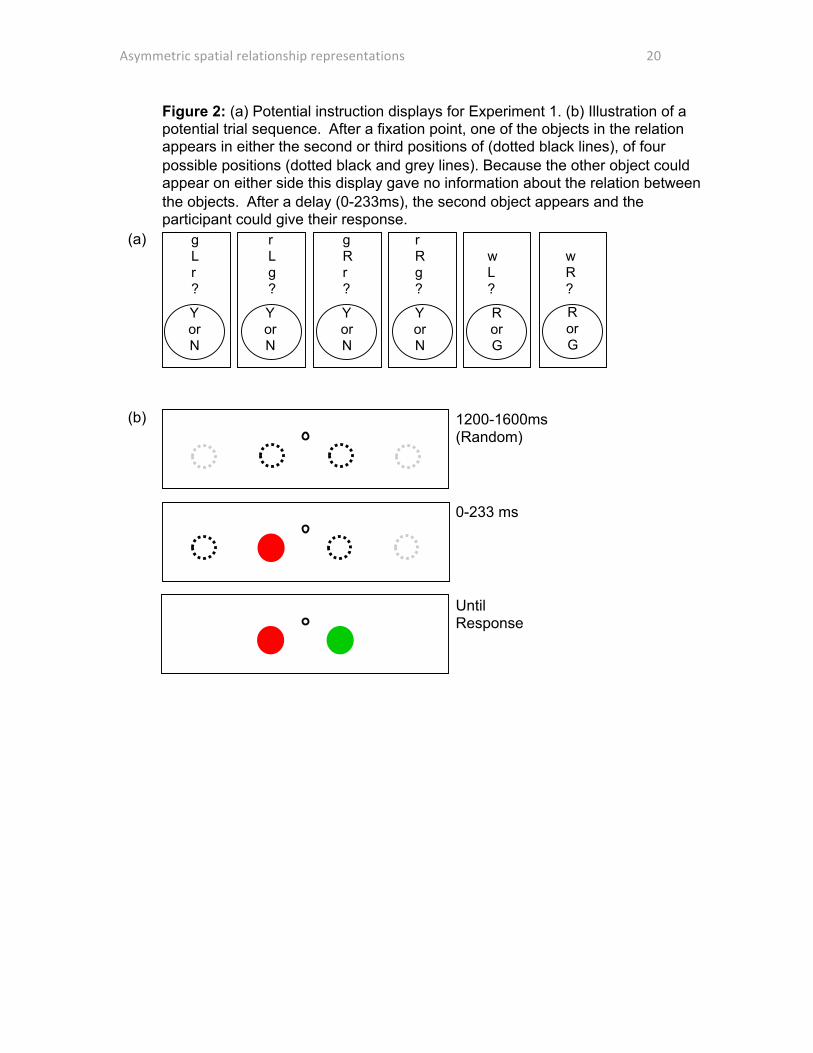
Figure 2: (a) Potential instruction displays for Experiment 1. (b) Illustration of a potential trial sequence. After a fixation point, one of the objects in the relation appears in either the second or third positions of (dotted black lines), of four possible positions (dotted black and grey lines). Because the other object could appear on either side this display gave no information about the relation between the objects. After a delay (0-233ms), the second object appears and the participant could give their response.
Roth*&*Franconeri* * * * * * * * * * 21**
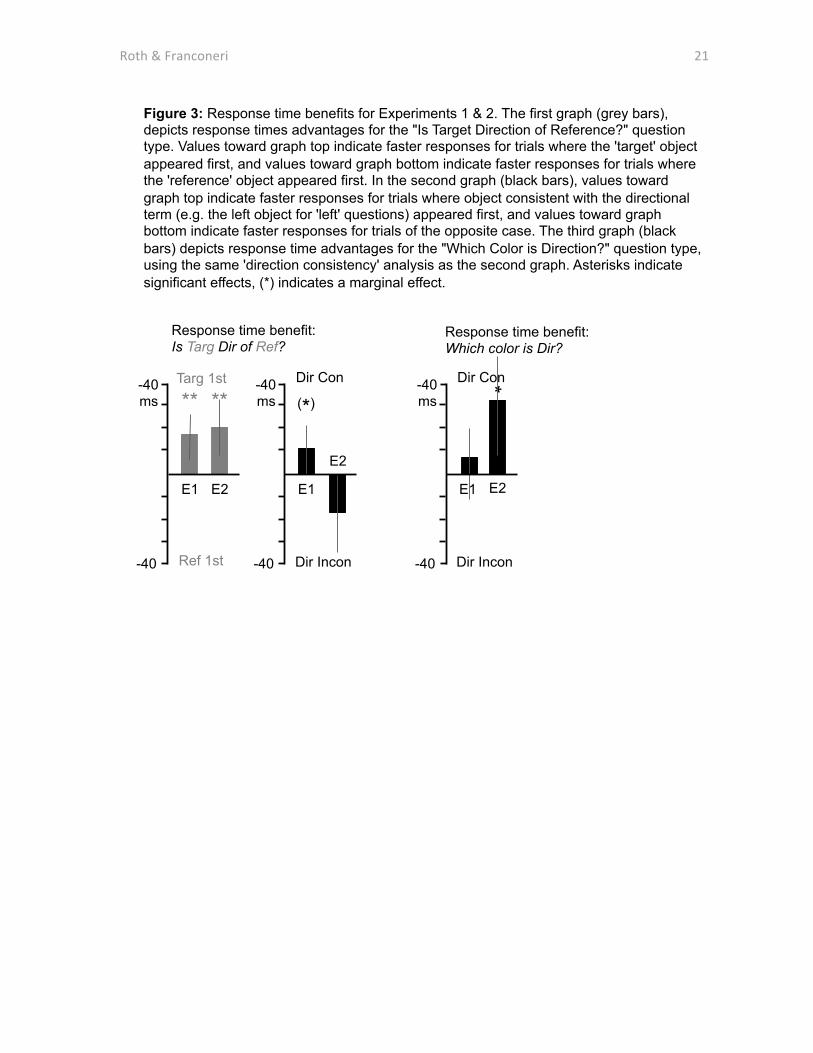
Figure 3: Response time benefits for Experiments 1 & 2. The first graph (grey bars), depicts response times advantages for the "Is Target Direction of Reference?" question type. Values toward graph top indicate faster responses for trials where the 'target' object appeared first, and values toward graph bottom indicate faster responses for trials where the 'reference' object appeared first. In the second graph (black bars), values toward graph top indicate faster responses for trials where object consistent with the directional term (e.g. the left object for 'left' questions) appeared first, and values toward graph bottom indicate faster responses for trials of the opposite case. The third graph (black bars) depicts response time advantages for the "Which Color is Direction?" question type, using the same 'direction consistency' analysis as the second graph. Asterisks indicate significant effects, (*) indicates a marginal effect.
Response time benefit: Which color is Dir?
Response time benefit: Is Targ Dir of Ref?
*
(*) -40 ms **
Targ 1st Dir Con
Ref 1st Dir Incon
E1
-40
**
E2 E1
E2
-40 ms
-40
Dir Con
Dir Incon
E1 E2
-40 ms
-40
Asymmetric*spatial*relationship*representations** * * * * 22*
References
Altmann, G. T. & Kamide, Y. (2007). The real-time mediation of visual attention by language and world
knowledge: Linking anticipatory (and other) eve movements to linguistic processing. Journal of
Memory and Language, 57(4), 502-518.
Anderson, J. R. (1978). Arguments concerning representations for mental imagery. Psychological
Review, 85, 249-277.
Ariely, D. (2001). Seeing sets: representation by statistical properties. Psychological Science, 12(2), 157-
162.
Biederman, I. (1987) Recognition-by-components: a theory of human image understanding.
Psychological Review, 94(2), 115-147.
Carlson, L. A. & Logan, G. D. (2005). Attention and spatial language. In L. Itti, G. Rees, & J. Tsotsos
(Eds.). Neurobiology of attention (pp. 330-336). San Diego, CA: Elsevier.
Carlson-Radvansky, L. A. & Radvansky, G. A. (1996). The influence of functional relations on spatial
term selection. Psychological Science, 7, 56-60.
Carpenter, P. A. & Just, M. A. (1975). Sentence comprehension: A psycholinguistic processing model of
verification. Psychological Review, 82, 45-73.
Cavanagh, P. (2004). Attention routines and the architecture of selection. In Michael. Posner (Ed.).
Cognitive neuroscience of attention (pp. 13–28). New York, NY: Guilford Press.
Chabris, C. F. & Kosslyn, S. M. (1998). How do the cerebral hemispheres contribute to encoding spatial
relations? Current Directions in Psychological Science, 7(1), 8-14.
Clark, H. H. & Chase, W. G. (1974). Perceptual coding strategies in the formation and verification of
descriptions. Memory and Cognition, 2, 101-111.

Roth*&*Franconeri* * * * * * * * * * 23**
Clark, H. H. & Chase, W. G. (1975). On the process of comparing sentences against pictures. Cognitive
Psychology, 3, 472-517.
Crawford, L. E., Regier, T., & Huttenlocher, J. (2000). Linguistic and non-linguistic spatial
categorization. Cognition, 75, 209-235.
Desimone R. & Ungerleider L. G. (1989). Neural mechanisms of visual processing in monkeys. In F.
Boller & J. Grafman (Eds.). Handbook of Neuropsychology (pp. 267-299). Amsterdam: Elsevier.
Dessalegn, B & Landau, B. (2008). More than meets the eye: The role of language in binding and
maintaining feature conjunctions. Psychological Science, 19(2), 189-195.
Egeth, H. & Smith, E. E. (1967). Perceptual selectivity in a visual recognition task. Journal of
Experimental Psychology, 74(4), 543-549.
Franconeri, S. L., Alvarez, G. A., & Enns, J. T. (2007). How many locations can you select? Journal of
Experimental Psychology: Human Perception & Performance, 33(5), 1003-1012.
Franconeri, S. L., Bemis, D. K., & Alvarez, G. A. (2009). Number estimation relies on a set of
segmented objects. Cognition, 113, 1-13.
Franconeri, S. L., Hollingworth, A., & Simons, D. J. (2005). Do new objects capture attention?
Psychological Science, 16(4), 275-281.
Franconeri, S. L., Roth, J. C., Kahn, L., Scimeca, J. M., & Helseth, S. A. (in preparation). Language
guides vision during the simplest perceptual routines.
Franconeri, S. L., Scimeca, J. M., Roth, J. C., Helseth, S. A., & Kahn, L. (2012). Flexible visual
processing of spatial relationships. Cognition, 112, 210-222.
Gleitman, L. R., Gleitman, H., Miller, C., & Ostrin, R. (1996). Similar, and similar concepts. Cognition,
58, 321-376.
Asymmetric*spatial*relationship*representations** * * * * 24*
Gleitman, L. R., January, D., Nappa, R., & Trueswell, J. C. (2007). On the give and take between event
apprehension and utterance formulation. Journal of Memory and Language, 57, 544-569.
Glushko, R. J. & Cooper, L. A. (1978). Spatial comprehension and comparison processes in verification
tasks. Cognitive Psychology, 10, 391-421.
Gottlieb, J. (2007). From thought to action: the parietal cortex as a bridge between perception, action,
and cognition. Neuron, 53, 9–16.
Griffin, Z. M. & Bock, K (2000). What the eyes say about speaking. Psychological Science, 11, 274-279.
Grill-Spector, K. & Malach, R. (2004). The Human Visual Cortex. Annual Reviews Neuroscience, 27,
649-677.
Hayward, W. G. & Tarr, M. J. (1995). Spatial language and spatial representation. Cognition, 55, 39-84.
Hummel, J. E. & Biederman, I. (1992). Dynamic binding in a neural network for shape recognition.
Psychological Review, 99, 480-517.
Hyun, J-S., Woodman, G. F., & Luck, S. J. (2009). The role of attention in the binding of surface
features to locations. Visual Cognition, 17, 10-24.
Jahn, G., Knauff, M., & Johnson-Laird, P. N. (2007). Preferred mental models in reasoning about spatial
relations. Memory & Cognition, 35, 2075-2087.
Just M. A. & Carpenter, P. A. (1976). Eye fixations and cognitive processes. Cognitive Psychology, 8,
441-480.
Kosslyn, S. M. (1987). Seeing and imagining in the cerebral hemispheres: A computational approach.
Psychological Review, 94, 148–175.
Kosslyn, S.M. (1994). Image and Brain: The Resolution of the Imagery Debate. Cambridge, MA: MIT
Press.
Roth*&*Franconeri* * * * * * * * * * 25**
Landau, B., Dessalegn, B., & Goldberg, A.M. (2010) Language and space: Momentary interactions. In P.
Chilton and V. Evans (Eds.), Language, cognition and space: The state of the art and new directions.
Advances in Cognitive Linguistics Series (Ed, V. Evans, B. Bergen, J. Zinken). London: Equinox
Publishing.
Loewenstein J. & Gentner D. (2005). Relational language and the development of relational mapping.
Cognitive Psychology, 50, 315-353.
Logan G. D. & Sadler D. D. (1996). A computational analysis of the apprehension of spatial relations. In
P. Bloom & M. A. Peterson (Eds.). Language and space (pp. 493-530). Cambridge, MA: MIT Press.
Luck, S. J. & Ford, M. A. (1998). On the role of selective attention in visual perception. Proceedings of
the National Academy of Sciences, 95, 825-30.
Maas, A. & Russo, A. (2003). Directional bias in the mental representation of spatial events: nature or
culture? Psychological Science, 14(4), 296.
Miller, G. A. & Johnson-Laird, P. N. (1976). Language and perception. Cambridge, MA: Harvard
University Press.
Noe, A. & O’Regan, J. K. (2000). Perception, attention and the grand illusion. Psyche, 6, No pagination
specified.
Papafragou, A., Hulbert, J., & Trueswell, J. (2008). Does language guide event perception? Evidence
from eye movements. Cognition, 108(1), 155-184.
Peli, E. (1990). Contrast in complex images. Journal of the Optical Society of America, 7(10), 2032-
2040.
Posner, M. I., Nissen, M. J., & Ogden, W. C. (1978). Attended and unattended processing modes: The
role of set for spatial location. In H. Pick & E. Saltzman (Eds.). Modes of perceiving and processing
information (pp. 137-157). Hillsdale, NJ: Erlbaum.
Asymmetric*spatial*relationship*representations** * * * * 26*
Pylyshyn, Z. W. (2003). Return of the mental image: are there really pictures in the brain? Trends in
Cognitive Sciences, 7(3), 113-118.
Regier, T. & Carlson L. A. (2001). Grounding spatial language in perception: an empirical and
computational investigation. Journal of Experimental Psychology: General, 130, 273-298.
Reichle, E. D., Carpenter, P. A., & Just, M. A. (2000). The neural bases of strategy and skill in sentence-
picture verification. Cognitive Psychology, 40, 261-295.
Rensink, R. A., O’Regan, J. K., & Clark, J. J. (1997). To see or not to see: The need for attention to
perceive changes in scenes. Psychological Science, 8, 368-373.
Sanocki, T. & Sulman, N. (2009). Priming of simple and complex scene layout: Rapid function from the
intermediate level. Journal of Experimental Psychology: Human Perception and Performance, 35(3),
735-749.
Serences, J. T. & Yantis, S. (2007). Representation of attentional priority in human occipital, parietal,
and frontal cortex. Cerebral Cortex, 17, 284-293.
Seymour, P. H. K. (1969). Response latencies in judgments of spatial location. British Journal of
Psychology, 60, 31-39.
Smith, L. B, Jones, S. S., & Landau, B. (1996). Naming in young children: a dumb attentional
mechanism? Cognition, 60, 143-171.
Spivey, M. J., Tyler, M. J., Eberhard, K. M., & Tanenhaus, M. K. (2001). Linguistically mediated visual
search. Psychological Science, 12(4), 282-286.
Talmy, L. (1983). How language structures space. In H. L. Pick & L. P. Acredolo (Eds.). Spatial
orientation: Theory, research, and application (pp. 225-282). New York: Plenum.
Tanaka K. (2003). Columns for complex visual object features in the inferotemporal cortex: clustering of
cells with similar but slightly different stimulus selectivities. Cerebral Cortex, 13, 90–99.
Roth*&*Franconeri* * * * * * * * * * 27**
Taylor, H. A. & Tversky, B. (1996). Perspective in spatial descriptions. Journal of Memory and
Language, 35, 371-391.
Tomlin, R. (1997). Mapping conceptual representations into linguistic representations: the role of
attention in grammar. In J. Nuyts & E. Pederson (Eds.). Language and conceptualization (pp. 162–
189). Cambridge: Cambridge University Press.
Treisman, A. & Gelade, G. (1980). A feature-integration theory of attention. Cognitive Psychology, 12,
97-136.
Treisman, A. & Schmidt, H. (1982). Illusory conjunctions in the perception of objects. Cognitive
Psychology, 14, 107–141.
Tversky, B. (1969). Pictorial and verbal encoding in a short-term memory task. Perception &
Psychophysics, 6, 225-233.
Tversky, B. (1975). Pictorial encoding of sentences in sentence-picture comparison. Quarterly Jounral of
Experimental Psychology, 27, 405-410.
Tversky, A. & Kahneman, D. (1974). Judgment under uncertainty: Heuristics and biases. Science, 185,
1124-1130.
Tversky, B., Kugelmass, S., & Winter, A. (1991). Cross-cultural and developmental trends in graphic
productions. Cognitive Psychology, 23, 515–557.
Xu, L. & Franconeri, S. L. (2012). The head of the table: The location of the spotlight of attention may
determine the 'front' of ambiguous objects. Journal of Neuroscience, 32(4), 1408-1412.
Asymmetric*spatial*relationship*representations** * * * * 28*
Supplemental Materials: Alternative compatibility analyses and precue timing analyses
Timing analyses: Methods
Manipulations of attention with transient cues can be sensitive to timing. The cues take some time
to have an effect (typically at least 150ms), and fade quickly (after around 300ms), and can even
result in an inhibitory effect after even more time has passed (Klein, 2000; Nakayama & Mackeben,
1989). Therefore, in addition to manipulating which object appeared first (was cued), we also
systematically manipulated the timing of this event. We added this manipulation for exploratory
purposes, and had no a priori expectations about how they might affect the patterns of response times.
While much is known about how these timing manipulations affect processes such as object
identification, it is difficult to predict how they might affect more complex processing of spatial
relationships, and the integration of those representations with linguistic descriptions. A detailed look
at interactions involving timing will lead to lower power because our design produces seven ways of
examining potential asymmetries that might be present in the visual representation (four for the “Is
red left of green?” style questions: target vs. reference, directional term consistency, absolute color
preference, absolute direction preference; three for the “Which color is left?” style questions: same as
above but without target vs. reference). These seven asymmetry types times the six timings produce
42 condition averages for each of the two experiments, and therefore a high likelihood of type I (false
positive) errors. We therefore include this manipulation for exploratory purposes for future work, and
focus primarily on the main effect of which object is cued instead of the timing of that cue. All timing
interactions are reported with a conservative Bonferroni correction.
Experiment 1: Full data analysis
Three subjects were omitted from the analysis due to a failure to complete the experiment. One
subject was omitted due to particularly low accuracy (85%), and one was omitted due to an average
response time more than 2 standard deviations above the mean. Twenty-six subjects remained in the
analysis. Accuracy rates were 96% (SD=1.94%) and average response time was 755ms (SD=129ms).
Trials with incorrect responses or responses of over 1500ms were removed from the analysis. Figure
3 and Supplementary Figure 4 depict the main effects within the data collapsed over the timing
manipulations. Supplementary Figure 4 depicts main effects for analyses discussed below, but not in
the manuscript. Note that these figures do not depict ‘baseline’ RTs, only differences in RT between
different conditions. ANOVA analysis below will include baseline RT as a factor, and significant
changes in RT across timings are described in the text. In Figure 5a, the average left/right position of
Roth*&*Franconeri* * * * * * * * * * 29**
a line collapsed across the y-axis of timing reflects the main effect of the factors described on the x-
axis. The shape of the line reflects the interaction between that factor and timing.
Is (target) (direction) of (reference)
The left side of Figure 3 shows analyses of questions of the form “Is (target) (direction) of
(reference)?” The upper left graph focuses on the compatibility between the question structure and the
appearance order of the objects. The analysis was collapsed according to whether the question’s target
or reference object appeared first (the grey lines), and according to whether the direction term queried
(left or right) was consistent with the relative position of the object that appeared first (the black
lines). Both of these analyses collapse across the other aspect of the question, as well as the absolute
left/right order of animation, and the absolute red/green color of the object. Note that these potential
cues for selecting one object are orthogonal to each other, and therefore compete. We predicted that
for these question types, one of the cues would be likely to dominate the other.
Data for the target/reference analysis (grey line in upper left graph of Supplementary Figure 3)
were submitted to a 2 x 6 repeated measures analysis of variance, with object appearance order (target
first, reference first) and timing (0, 33, 83, 133, 183, 233ms) as variables. Responses were faster when
the question’s target object appeared first (M=-15.5ms) supported by a significant main effect of
object appearance order F(1, 25)=9.2, p=0.006. There were also differences in RT (not visible in the
graph) across timings, revealed by a main effect of timing F(5, 125)=8.4, p<0.001. This main effect of
timing is similar for the remaining analyses and will be omitted below. These differences were driven
by faster response times for longer animation timings (e.g., 233ms), in a roughly linear trend. There
was also an interaction between object appearance order and timing (visible in the variability of the
grey line in the upper left graph of Supplementary Figure 5a), F(5,125)=3.4, p=0.007, reflecting a
larger advantage when the target appeared first at the 83ms (t(25)=2.8, p=0.009) and 133ms
(t(25)=3.8, p<0.001) timing, with both values passing the Bonferroni correction. Data for the
direction term consistency analysis (black line in upper left graph of Supplementary Figure 5a) were
submitted to a 2 x 6 repeated measures analysis of variance, with direction term consistency
(direction term consistent with object that appears first, e.g., ‘left’ when left object appears first, or
inconsistent) and timing as variables. There was a trend for direction consistency to improve response
times (M=-10.2ms), F(1, 25)=3.5, p=0.07. There was no interaction between direction term
consistency and timing, F(5, 125)=1.6, p=0.2.
The analyses of the bottom left graph of Supplementary Figure 5a ignore the structure of the
question, and instead focus on which color appeared first within the display (red or green), which
would reveal a processing priority for a given color, or which side the first object appeared on, which
Asymmetric*spatial*relationship*representations** * * * * 30*
would reveal a processing priority for a given side of appearance. Both of these analyses collapse
across the other aspect of the display. Data for the color priority analysis (grey line in lower left graph
of Supplementary Figure 5a) were submitted to a 2 x 6 repeated measures analysis of variance, with
color appearance order (red first, green first) and timing as variables. There was no main effect
revealing an advantage for a given color across timings (M=2.0ms), F(1, 25)=0.08, p=0.8. The
interaction between object appearance order and timing was significant, F(5, 125)=2.5, p=0.03,
reflecting faster RTs for trials where red appeared 1st at the 133ms timing (t(25)=2.3, p=0.03) and
where green appeared 1st at the 83ms timing (t(25)=2.6, p=0.02).
Data for the direction priority analysis. (black line in lower left graph of Supplementary Figure
5a) were submitted to a 2 x 6 repeated measures analysis of variance, with direction appearance order
(left first, right first) and timing as variables. There was no main effect of direction appearance order
(M=5.3ms), F(1, 25)=0.7, p=0.4. The interaction between object appearance order and timing was
significant, F(5, 125)=3.4, p=0.007, reflecting faster RTs for trials where the object on the right
appeared 1st at the 233ms (t(25)=3.0, p=0.006) and 133ms (t(25)=2.6, p=0.01) timings, and faster RTs
for trials where the object on the left appeared 1st at the 183ms timing (t(25)=2.0, p=0.06). Only the
233ms timing difference passed the Bonferroni correction.
In summary, for the questions of the form “Is (target) (direction) of (reference)?”, showing the
target object before the reference object led to faster response times. While we examine differences
within appearance order timings with caution, these differences seem to be driven by the 83ms and
133ms timings. When collapsing across these questions, there were no main effects of the color or
relative position of the first object. While there were hints of interactions among these factors with
timing, none of these effects reached a sufficiently high significance threshold except for an
advantage for displays where the right object appeared 233ms before the left object.
Which is (Direction)
The right side of Supplementary Figure 5a shows analyses of questions of the form "Which is
(Direction)?" For the graphs at the upper right of Supplementary Figure 5a, the analysis is identical to
the one for the black line in the graph at the upper left of Supplementary Figure 5a, except that the
target/reference analysis (grey line in the upper left graph of Supplementary Figure 5a) is omitted. For
the graph at the lower right of Supplementary Figure 5a, analysis is identical to the graph at the lower
left of Supplementary Figure 5a.
Data for the direction term consistency analysis (black line in upper right graph of Supplementary
Figure 5a) were submitted to a 2 x 6 repeated measures analysis of variance, with direction term
consistency and timing as variables. There was no main effect of direction consistency on response

Roth*&*Franconeri* * * * * * * * * * 31**
times (M=-8.8ms), F (1, 25)=0.8, p=0.4. There were baseline RT differences across timings (not
visible in graph), F(3.6, 88.8)=4.5, p=0.004 (Greenhouse Geisser correction). These differences were
driven by RTs that were significantly higher than average (M=664ms) for the 0ms timing (t(25)=3.5,
p=0.002), as well as RTs that were significantly less than the average for the 233ms timing
(t(25)=2.5, p=0.02). There was also an interaction between direction term consistency and timing,
F(3.4, 85.3)=4.0, p=0.008 (Greenhouse Geisser correction), reflecting faster RTs for trials with
direction consistency at the 183ms (t(25)=2.9, p=0.008), 33ms (t(25)=2.2, p=0.04) and 0ms
(t(25)=2.6, p=0.02) timings. The significance of this last test demonstrates why we examine any
condition x timing interactions in an exploratory and speculative fashion. This test suggests a
difference between two conditions that we know to be identical, and is therefore a false positive (to be
expected given the 42 such potential tests in each experiment). Thus, in the discussion section below,
we discuss only the interaction found for the 183ms timing, which was significant according to a
more conservative Bonferroni-corrected threshold (p=0.008).
Data for the color priority analysis (grey line in lower right graph of Supplementary Figure 5a)
were submitted to a 2 x 6 repeated measures analysis of variance, with color appearance order (red
first, green first) and timing as variables. There was no main effect revealing an advantage for a given
color across timings (M=3.2ms), F (1, 25)=0.4, p=0.5. The interaction between object appearance
order and timing was not significant, F(5, 125)=0.8, p=0.6. Data for the direction priority analysis
(black line in lower right graph of Supplementary Figure 4a) were submitted to a 2 x 6 repeated
measures analysis of variance, with direction appearance order (left first, right first) and timing as
variables. There was no main effect of direction appearance order (M=-18.0ms), F(1, 25)=2.8, p=0.1.
There was a significant interaction between object appearance order and timing, F(5, 125)=3.0,
p=0.01, reflecting faster RTs for trials where the object on the left appeared 1st at the 233ms timing
(t(25)=3.7, p=0.001).
In summary, for the simpler questions of the form “Which is (Direction)?”, there was no main
effect of direction consistency (whether the first object appeared on the side named by the directional
term), but there was a direction consistency x timing interaction driven by a significant consistency
advantage at the 183ms timing. For the analyses that collapse across question, there were no main
effects of the color or relative position of the first object, though there was a relative advantage when
the left object appeared 233ms before the right object.

Asymmetric*spatial*relationship*representations** * * * * 32*
Experiment 2: Full data analysis
Accuracy rates were 95% (SD=2.54%) and average response time was 767ms (SD=110ms).
Trials with incorrect responses or responses of over 1500ms were removed from the analysis. Figure
4 depicts the various ways that data were collapsed for analysis.
Is (target) (direction) of (reference)
The left side of Supplementary Figure 5b shows analyses of questions of the form “Is (target)
(direction) of (reference)?”, identical to those for Experiment 1. Data for the target/reference analysis
(grey line in upper left graph of Supplementary Figure 5b) were submitted to a 2 x 6 repeated
measures analysis of variance, with object appearance order and timing as variables. Responses were
faster when the question’s target object appeared first (M=-19.3ms), supported by a significant main
effect of object appearance order F(1, 13)=9.3, p=0.009. There were also differences in RT across
timings, revealed by a main effect of timing F(5, 65)=2.9, p=0.02. These differences were driven by
RTs that were greater than the average (M=695ms) for the 0ms timing (t(13)=3.2, p=0.008), as well
as RTs that were less than the average for the 183ms timing (t(13)=2.2, p=0.05). There was also an
interaction between object appearance order and timing, F(5,65)=2.4, p=0.05, reflecting a lack of
target consistency advantage when the target appeared first at the 0ms timing. Data for the direction
term consistency analysis (black line in upper left graph of Supplementary Figure 5b) were submitted
to a 2 x 6 repeated measures analysis of variance, with direction term consistency and timing as
variables. There was no main effect of direction consistency (M=18.3ms), F(1, 13)=4.0, p=0.07.
There was no interaction between direction term consistency and timing, F(5, 65)=1.9, p=0.1.
Data for the color priority analysis (grey line in lower left graph of Supplementary Figure 5b)
were submitted to a 2x6 repeated measures analysis of variance, with color appearance order and
timing as variables. There was no main effect revealing an advantage for a given color across timings
(M=-11.4ms), F(1, 13)=1.7, p=0.2. The interaction between object appearance order and timing was
not significant, F(5, 65)=0.5, p=0.8. Data for the direction priority analysis (black line in lower left
graph of Supplementary Figure 5b) were submitted to a 2 x 6 repeated measures analysis of variance,
with direction appearance order and timing as variables. There was a trend for a main effect of
direction appearance order (M=17.4ms), F(1, 13)=4.4, p=0.06, reflecting faster RTs when the object
on the bottom appeared 1st. The interaction between object appearance order and timing was
significant, F(5, 65)=2.7, p=0.03, reflecting faster RTs for trials where the object on the bottom
appeared 1st at the 233ms (t(13)=6.2, p<0.0001) and 183ms (t(13)=2.2, p=0.05) timings.
In summary, for the questions of the form “Is (target) (direction) of (reference)?”, displaying the
target object before the reference object led to faster response times. When collapsing across these
Roth*&*Franconeri* * * * * * * * * * 33**
questions, there were no main effects of the color of the first object, but there were effects involving
the position of this object. Specifically, response times were faster when the bottom object appeared
first, and this advantage was driven by the longest timings, most robustly the trials were there was a
233ms preview of the bottom object.
Which is (Direction)
The right side of Supplementary Figure 5b shows analyses of questions of the form "Which is
(Direction)?" Data for the direction term consistency analysis (black line in upper right graph of
Supplementary Figure 5b) were submitted to a 2 x 6 repeated measures analysis of variance, with
direction term consistency and timing as variables. There was a main effect of direction consistency
on response times (M=-31.4ms), F(1, 12)=5.4, p=0.04, reflecting an advantage when objects appeared
in a direction consistent with the term used in the question. There were no baseline RT differences
across timings, F(5, 60)=0.3, p=0.9. There was no interaction between direction term consistency and
timing, F(5, 60)=1.6, p=0.2.
Data for the color priority analysis (grey line in lower right graph of Supplementary Figure 5b)
were submitted to a 2x6 repeated measures analysis of variance, with color appearance and timing as
variables. There was no main effect revealing an advantage for a given color across timings (M=-
9.4ms), F(1, 13)=1.3, p=0.3. The interaction between object appearance order and timing was not
significant, F(5, 65)=0.8, p=0.5. Data for the direction priority analysis (black line in lower right
graph of Supplementary Figure 5b) were submitted to a 2 x 6 repeated measures analysis of variance,
with direction appearance order and timing as variables. There was no main effect of direction
appearance order (M=-14.0ms), F(1, 13)=1.1, p=0.3. There was no significant interaction between
object appearance order and timing, F(5, 65)=1.7, p=0.1.
In summary, for the simpler questions of the form “Which is (Direction)?”, there was a main
effect of direction consistency such that responses were faster when the first object appeared on the
side named by the directional term.
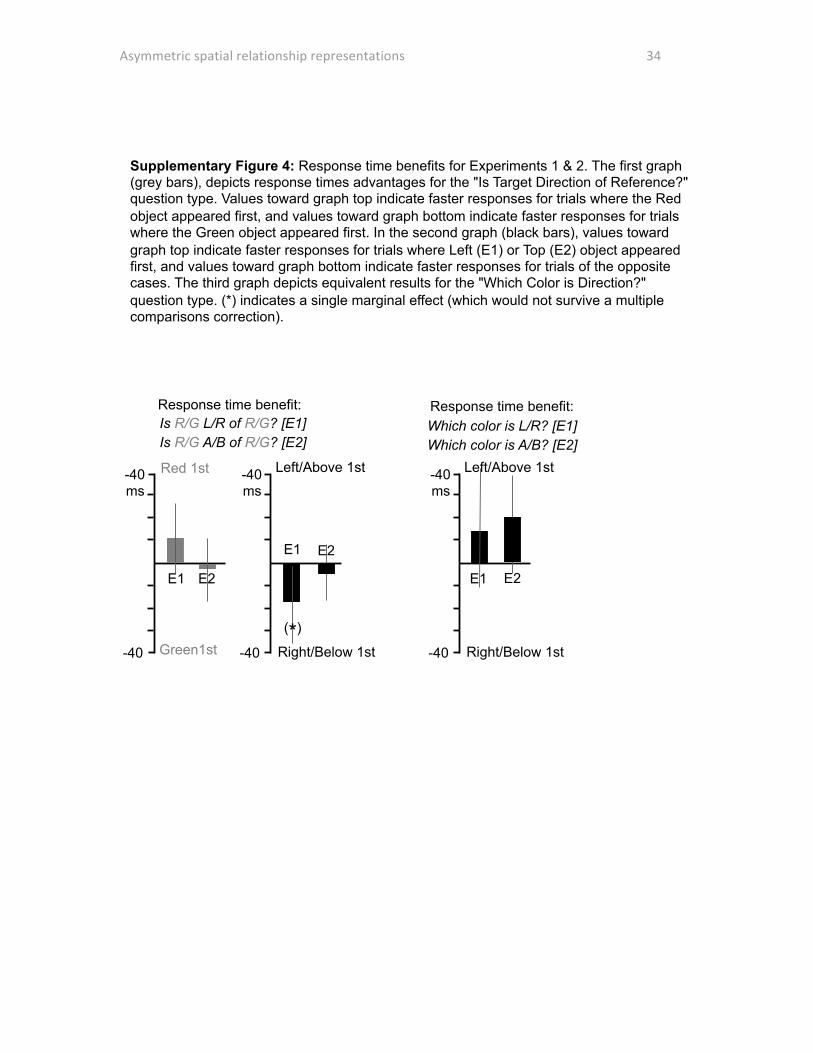
Asymmetric*spatial*relationship*representations** * * * * 34*
Supplementary Figure 4: Response time benefits for Experiments 1 & 2. The first graph (grey bars), depicts response times advantages for the "Is Target Direction of Reference?" question type. Values toward graph top indicate faster responses for trials where the Red object appeared first, and values toward graph bottom indicate faster responses for trials where the Green object appeared first. In the second graph (black bars), values toward graph top indicate faster responses for trials where Left (E1) or Top (E2) object appeared first, and values toward graph bottom indicate faster responses for trials of the opposite cases. The third graph depicts equivalent results for the "Which Color is Direction?" question type. (*) indicates a single marginal effect (which would not survive a multiple comparisons correction).
Response time benefit: Response time benefit:
-40 ms
Red 1st Left/Above 1st
Green1st Right/Below 1st
E1
-40
E2
E1 E2
-40 ms
-40
Which color is L/R? [E1] Is R/G L/R of R/G? [E1]
Left/Above 1st
Right/Below 1st
E1 E2
-40 ms
-40
(*)
Which color is A/B? [E2] Is R/G A/B of R/G? [E2]

Roth*&*Franconeri* * * * * * * * * * 35**
Response time benefit: Direction questions Which color is Dir?
33
83
133
183
233
Targ 1st Dir Con
Ref 1st Dir Incon
Object preview
time (m
s)
Response time benefit: Color questions Is Targ Dir of Ref?
-60 60ms
33
83
133
183
233
Object preview
time (m
s)
-60 60ms
Which color is L/R?
33
83
133
183
233
Red 1st Left 1st
Green 1st Right 1st
Object preview
time (m
s)
Is R/G L/R of R/G?
-60 60ms
33
83
133
183
233
Left 1st Right 1st
Object preview
time (m
s)
-60 60ms
Red 1st Green 1st
Dir Con Dir Incon
Supplementary Figure 5a: Response time results for Experiment 1 (Left/Right relations). ** indicates an effect passing Bonferroni correction p<.008 (*), indicates .008<p<.05.
**
**
(*)
(*)
**
(*)
**
(*)
(*)
**
(*)
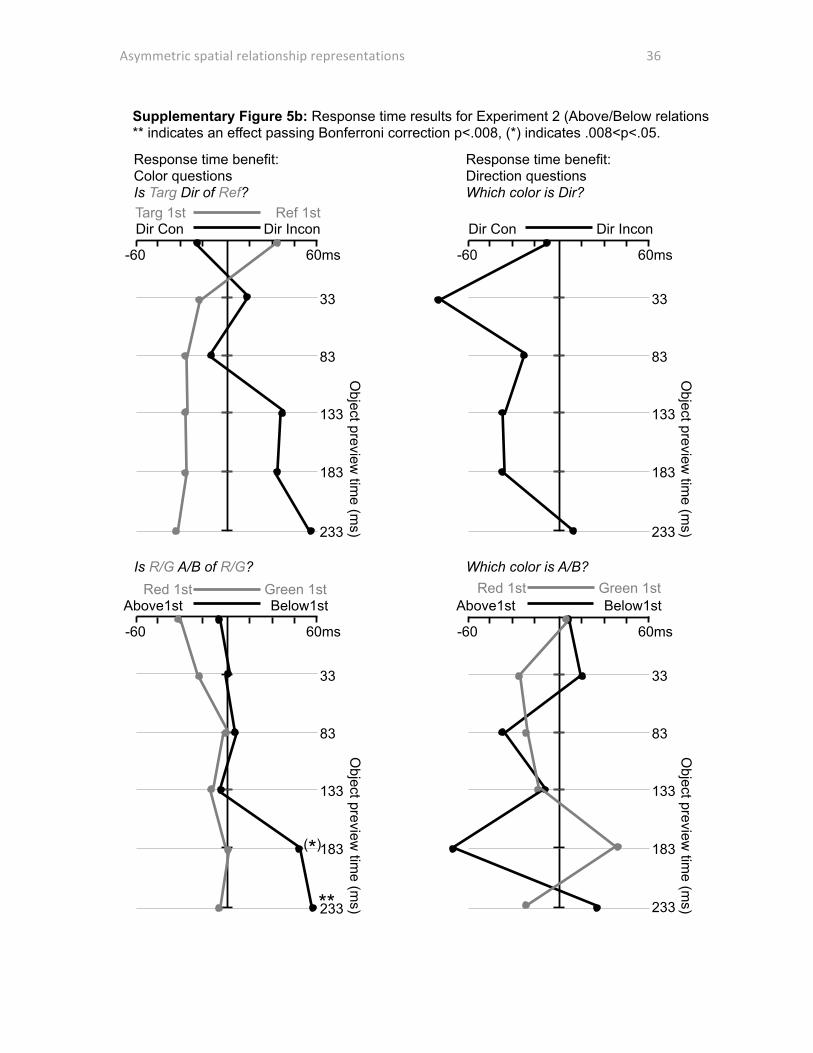
Asymmetric*spatial*relationship*representations** * * * * 36*
Response time benefit: Direction questions Which color is Dir?
33
83
133
183
233
Targ 1st Dir Con
Ref 1st Dir Incon
Object preview
time (m
s)
Response time benefit: Color questions Is Targ Dir of Ref?
-60 60ms
33
83
133
183
233
Dir Con Dir Incon
Object preview
time (m
s)
-60 60ms
Which color is A/B?
33
83
133
183
233
Red 1st Above1st
Green 1st Below1st
Object preview
time (m
s)
Is R/G A/B of R/G?
-60 60ms
33
83
133
183
233
Above1st Below1st
Object preview
time (m
s)
-60 60ms
Red 1st Green 1st
Supplementary Figure 5b: Response time results for Experiment 2 (Above/Below relations). ** indicates an effect passing Bonferroni correction p<.008, (*) indicates .008<p<.05.
(*)
**

Roth*&*Franconeri* * * * * * * * * * 37**
References
Klein, R. M. (2000). Inhibition of return. Trends in Cognitive Sciences, 4, 138-147.
Nakayama, K. & Mackeben, M. (1989). Sustained and transient components of focal visual attention.
Vision Research, 29, 1631-1647.