at a cost: the real effects of transfer pricing … a cost: the real e ects of transfer pricing...
TRANSCRIPT

At a cost: the Real Effects of Transfer Pricing Regulations
WP 18/03
The paper is circulated for discussion purposes only, contents should be considered preliminary and are not to be quoted or reproduced without the author’s permission.
January 2018
Ruud de Mooij International Monetary Fund Li Liu International Monetary Fund and Oxford University Centre for Business Taxation
Working paper series | 2018

At A Cost: the Real Effects of Transfer Pricing
Regulations
Ruud De Mooij Li Liu∗
9th January 2018
Abstract
Unilateral adoption of transfer pricing regulations may have a negative impact onreal investment by multinational corporations (MNCs). This paper uses a quasi-experimental research design, exploiting unique panel data on domestic and multina-tional companies in 27 countries during 2006-2014, to find that MNC affiliates reducetheir investment by over 11 percent following the introduction of transfer pricing reg-ulations. There is no significant reduction in total investment by the MNC group,suggesting that these investments are most likely shifted to affiliates in other countries.The impact of transfer pricing regulations corresponds to an increase in the “TPR-adjusted” corporate tax rate by almost one quarter.
Keywords: profit shifting, foreign direct investment, corporate tax policy, multina-tional firmsJEL Classification: H25, H87, F23
∗De Mooij: International Monetary Fund ([email protected]). Liu: International Monetary Fund andOxford University Centre for Business Taxation ([email protected]). The views expressed are the authors’ and donot necessarily represent the views of the IMF, its Executive Board, or IMF management. We thank MichaelDevereux, Dhammika Dharmapala, Mihir Desai, Vitor Gaspar, Harry Grubert†, Shafik Hebous, Jim Hines,Niels Johannesen, Michael Keen, Laura Jaramillo Mayor, Juan Carlos Serrato, Nicholas Sly, and conferenceand seminar participants at the IMF, Oxford University Centre for Business Taxation 2017 Symposium,National Tax Association 2017 Conference and AEA 2018 Annual Meeting for helpful comments. We aregrateful to Devan Mescall for providing the dataset on transfer pricing regulations and to John RussellDamstra for providing excellent research assistance. Any remaining errors are our own.
1

1 Introduction
Tax-motivated profit shifting within multinational corporations (MNCs) has been on top of
the international tax policy agenda since the global financial crisis – most notably due to
the G20/OECD initiative on base erosion and profit shifting (OECD 2015). Profit shifting
means that MNCs shift income from affiliates in high-tax jurisdictions to those in low-
tax jurisdictions to reduce their overall tax liability. There is ample empirical evidence
demonstrating that extensive profit shifting is taking place. For example, it is found that
German affiliates of MNCs have paid on average 27 percent less in taxes than comparable
domestic German firms (Finke, 2013). In the UK, taxable profits as a share of total assets
reported by subsidiaries of foreign MNCs are on average 12.8 percentage points lower than
those of comparable domestic standalone companies (Habu, 2017).1
A common way for MNCs to shift profits is through the manipulation of transfer prices,
that is, the prices charged for transactions between related parties. These transfer prices
are necessary to determine the allocation of profits between affiliates of a MNC group. Tax
laws generally prescribe that these prices should be arm’s length, reflecting market prices
that unrelated parties would have used for similar transactions. However, due to information
asymmetries vis-a-vis the tax administration, MNCs can often charge artificially low or high
prices for sales between related parties in high-tax and low-tax jurisdictions, thereby shifting
profits and reducing their overall tax liabilities.
Many governments limit the extent of transfer mispricing by implementing transfer pri-
cing regulations (TPRs). These generally describe the methods allowed to determine arm’s-
length prices, prescribe documentation requirements, set penalties in case of non-compliance,
and determine the probability of a transfer price adjustment. TPRs can raise the effective tax
burden on MNCs, thus protecting domestic revenue and leveling the playing field vis-a-vis
domestic companies (OECD, 2013; Fuest et al., 2013).2
1Dharmapala (2014) and Hines (2014) comprehensively discuss the extent of profit shifting by multination-als. Heckemeyer and Overesch (2013) provide a quantitative review of 25 empirical studies on profit-shiftingbehavior of multinationals. A more recent survey article by Beer et al. (2018) finds a consensus semi-elasticityof reported profitability by MNCs with respect to the international tax differentials of around -1.2. Regard-ing the scale of revenue loss from international tax avoidance, recent estimates suggest an annual loss ingovernment revenue by between $100 and 650 billion globally, with disproportionately larger losses found fordeveloping countries (UNCTAD, 2015; OECD, 2015; Crivelli et al., 2016).
2From the perspective of the MNC, TPR may also increase tax uncertainty (Mescall and Klassen, 2014;
2

TPR may have unintended consequences on MNC investment. If MNC investment would
decline in response to the introduction or strengthening of TPR, this could offset its benefits,
especially if multinational investments yield positive productivity spillovers to local firms
(Andrews et al., 2015). The exact relationship between TPR and investment, however, has
received little attention in the literature, both in theoretical and empirical research. Indeed,
there is currently no direct empirical evidence regarding the investment effect of TPR.3
To fill this gap in the literature, this paper explores the effect of TPR on multinational
investment. First, we develop a simple model to infer the likely impact of TPR on the scale
of multinational investment. The key channel in the model is that TPR makes it costlier for
the MNC to manipulate transfer prices and, thereby, to shift profits into the low-tax country.
This reduces the optimal supply of intermediate inputs and, thereby also reduces the return
on its investment in the foreign affiliate. Indeed, TPR increases the cost of capital so that
fewer investments in the foreign affiliate are undertaken.
Guided by this theory, the paper then empirically explores the impact of TPR on MNC
investment. We employ a micro-level dataset containing rich information on both MNC and
purely domestic affiliates. The main dataset comprises 27 countries during 2006-2014. This
is combined with information on the introduction date of TPRs and an indicator of their
strictness. Our main analysis employs a standard difference-in-difference (DD) approach,
where the identifying variation comes from the differential change in investment by a MNC
affiliate relative to investment by a purely domestic affiliate in response to the introduction
of TPR in the local economy. In addition, we run panel regressions, similar to the estimation
approach used in Overesch (2009), Lohse and Riedel (2013) and Buettner and Wamser (2013),
to estimate changes in the tax sensitivity of multinational investment due to TPRs.
The results from the DD regressions point to a strong negative impact of TPR on MNC
investment: investment in foreign affiliates is, on average, around 11 percent lower following
the introduction of TPR, compared to investment in similar firms that are wholly domestic.
IMF and OECD, 2017). This is discussed in Section 2.3Recent studies have assessed the impact of TPR on reported profitability by MNC affiliates and provide
mixed evidence: some find that they lead to an increase in the MNCs’ reported operating profits, while othersfind no significant effect (Lohse and Riedel, 2013; Saunders-Scott, 2013). Some studies have also looked atthe effect of thin capitalization rules – another form of anti-avoidance policy – on investment (Buettner andWamser, 2013).
3

The panel regression suggest, moreover, that the “TPR-adjusted” corporate tax rate is 23
percent larger, i.e. MNC investment responses to tax rates are almost one quarter larger if
TPRs are in place.
Deeper analysis further suggests that the investment response to TPR varies in several
dimensions. For instance, the effect size rises in the strictness of the TPR but decreases in
the share of intangible assets of firms; and the effect is more robust at the intensive than at
the extensive margin of investment. Effects are also found to be larger if the tax differential
grows, but this relationship is not monotonous and responses actually become smaller at
very large tax differences. Finally, the effect is larger and more robust in countries that
also employ thin-capitalization rules. Using a different dataset of consolidated accounts, we
find further that lower investment in MNC affiliates does not lead to a similar reduction
in total investment by the MNC group. We interpret this as evidence of relocation: the
multinationals divert their investment away from countries that introduce TPR toward other
countries.
This paper contributes to a growing literature that exploits cross-sectional variation to
study the effects of anti-avoidance legislations on key aspects of firm behavior, including
reported profits (Saunders-Scott, 2013, 2015; Beer and Loeprick, 2015; Marques and Pinho,
2016; Nicolay et al., 2016), transfer prices (Clausing, 2003; Bernard et al., 2006; Davies et al.,
2018; Vicard, 2015; Cristea and Nguyen, 2016; Flaaen, 2016; Liu et al., 2017), and capital
structure (Buettner et al., 2012; Buettner and Wamser, 2013; Blouin et al., 2014; Merlo and
Wamser, 2015; De Mooij and Hebous, 2017). Our analysis complements these studies by
looking at the impact of anti-avoidance legislation on MNC investment, which to date has
been explored only in the context of thin capitalization rules (Buettner et al., 2014). Our
paper also directly relates to studies of profit-shifting opportunities on MNC investment
(Hines and Rice, 1994; Grubert and Slemrod, 1998; Desai et al., 2006; Overesch, 2009), and
the larger literature on taxation and business investment (Cummins et al., 1994; Caballero
et al., 1995; House and Shapiro, 2008; Bond and Xing, 2015; Yagan, 2015; Zwick and Mahon,
2017), by offering a new perspective on the investment effect of TPRs.
The results in the paper are important for the current policy debate on international
taxation. For instance, the negative investment effects from TPRs can make governments
4
reluctant to introduce them unilaterally or encourage them to adopt more lenient regula-
tions in order to mitigate adverse effects on investment. Binding global coordination can
prevent this. Restricting the opportunities for countries to set their own anti-avoidance reg-
ulations can, however, reinforce tax competition among countries in the use of corporate
tax rates (Keen, 2001; Janeba and Smart, 2003; Bucovetsky and Haufler, 2007). The res-
ults imply further that coordination should also cover other anti-avoidance rules (such as
thin-capitalization rules) as otherwise TPRs might cause substitution into other avoidance
channels.
The rest of the paper is structured as follows. Section 2 provides an overview of TPR
across countries. Section 3 develops a simple model to illustrate how TPR can affect MNC
investment into an affiliate. Section 4 describes the data and sample selection used for the
empirical analysis. Section 5 explains the research designs and Section 6 reports the main
results. Section 7 elaborates on the results for total investment by the MNC group, based
on consolidated accounts. Finally, Section 8 concludes.
2 Transfer Pricing Regulation
The current system of international taxation is largely based on separate accounting. This
means that the unconsolidated account of a multinational affiliate terminates at the border.
To determine the income in each affiliate, the multinational must use transfer prices for
transactions between related parties. In principle, the setting of transfer prices should follow
the arm’s-length principle, meaning that prices of goods and services sold between related
parties mimic prices that would be used in transactions between unrelated parties.4 Given the
nature of related-party transactions, there can exist a wide range of arm’s-length prices for
the same transaction, especially when a comparable transaction does not exist for unrelated
parties. Also, it can be costly for tax authorities to verify whether a transfer price used by
a MNC is indeed arm’s-length. Consequently, MNCs have some discretion to under-price
4The arm’s length principle is established in Article 9 of the OECD and the UN Model Tax Conventions,and is the framework for the extensive network of bilateral income tax treaties between countries. TheOECD and UN also have developed Transfer Pricing Guidelines, to support countries’ implementation ofthe principle.
5

exports sold from an affiliate a high tax country to an affiliate in a low tax country (or
over-price imports), thereby shifting profits and reducing their global tax burden.
There is ample empirical evidence for the presence of tax-motivated transfer mispricing.
Most of these studies estimate how the price wedge between the arm’s-length price observed
for unrelated transactions and the transfer price used for related party transactions varies
with the statutory CIT rates in the destination country relative to the origin country. Studies
for the US, UK and France find evidence for significant responses of the price wedge to the
tax rate differential, as supportive evidence for tax-motivated transfer mispricing by MNCs
(Clausing, 2003; Bernard et al., 2006; Davies et al., 2018; Vicard, 2015; Cristea and Nguyen,
2016; Flaaen, 2016; Liu et al., 2017).
To limit transfer mispricing, several countries have introduced transfer pricing regulations
(TPRs). These offer guidance in the implementation of the arm’s length principle and often
include various specific requirements. For instance, they limit the methods that can be used
by a MNC for establishing an arm’s length price; specify requirements for the documentation
needed to support the transfer price used by a MNC; and set transfer-pricing specific penalties
if mispricing is detected or adequate documentation not provided. The scope and design of
these regulations vary between countries and across time. Stricter regulations could increase
the cost of transfer mispricing and, indeed, are found to be effective in curbing the extent of
profit shifting in advanced economies. For example, Lohse and Riedel (2013) show that the
introduction and tightening of TPRs raises (lowers) reported operating profits of high-tax
(low-tax) affiliates and reduces the sensitivity of affiliates’ pre-tax profits to corporate tax
rates.
Our empirical analysis focuses on the impact of TPRs on investment. It uses two policy
variables to capture TPRs. First, we use a discrete variable TPRkt to reflect the introduction
of transfer pricing regulation. This dummy variable takes the value of 1 in the years after
country k introduced some TPR in year t to capture the effect of TPR implementation, and is
zero otherwise. This information is derived from Deloitte’s annual Transfer Pricing Strategic
Matrix and is summarized in Mescall and Klassen (2014). Panel A in Figure 1 provides an
overview of the number of countries with TPR between 1928 and 2015. Sweden was the first
country that introduced some form of TPR in 1928. A more modern version of TPR was
6

first implemented in the early 1980s in Australia. Since then it has been gradually adopted
in other countries across the world. Today, almost 70 countries have TPRs in place. Since
1995, many OECD countries base their TPR on the OECD Transfer Pricing Guidelines. Our
analysis exploits countries that have introduced TPR between 2006 and 2014 among the 27
countries in our sample. These include: Bosnia and Herzegovina (year of TPR introduction:
2008), Finland (2007), Greece (2008), Luxembourg (2011), Norway (2008), and Slovenia
(2007).
TPRs can vary in several dimensions. This can determine their overall strictness and,
therefore, their implications for the behavior of MNCs. To capture the strictness of TPR, we
use a second variable, namely an index of TPR strictness developed by Mescall and Klassen
(2014). The index is based on 15 detailed features in the regulation and its enforcement (see
also Saunders-Scott (2013)).5 Mescall and Klassen (2014) use these features to explain the
variation in the perception of 76 transfer pricing experts regarding the transfer pricing risk in
33 countries, as revealed in a survey conducted in 2010.6 From the regression equation, one
can simulate the systematic impact of each TPR feature on the perceived transfer pricing
risk, including for countries not captured in the Mescall and Klassen study and for years
before and after 2010. Thus, a panel has been constructed of a transfer-pricing risk variable,
labeled tprisk. This variable measures the overall strictness of the transfer pricing rule
and ranges between 1.26 and 5.17 in our sample countries, with higher values reflecting
5These detailed TPR features include 12 regulatory variables on whether: (1) the government allowsadvance pricing agreements, (2) benchmark data are available to taxpayers, (3) the government requirescontemporaneous documentation, (4) cost-contribution arrangement is allowed, (5) commissionaire arrange-ment is allowed, (6) foreign comparables are allowed to estimate transfer prices, (7) related party setoffs(bundling of transactions) are allowed, (8) the taxpayer is required to pay the tax assessment before goingto competent authority, (9) the government identifies an order of transfer pricing methods to use, (10) thegovernment requires disclosure on the tax return concerning related party transactions, (11) the governmentallows a self-initiated adjustment, (12) transfer pricing documentation is required. It also contains 3 en-forcement variables on: (13) whether the government has discretion over penalty reduction, (14) whetherthe government uses proprietary tax data to calculate a “revised” transfer price, and (15) the assessed de-gree of transfer pricing enforcement as a percentage based on transfer pricing experts’ 1 to 5 assessment ofenforcement strictness, where a score of 1.0 (5 out of 5) is most strict and 0.2 (1 out of 5) is least strict.
6Specifically, the perceived transfer pricing risk depends on these TPR features in the followingway: tprisk = 1.27∗∗∗ + 0.262∗∗SecretComparables − 0.437∗∗∗APA + 0.614∗∗∗NoForeignComps +0.102NoSetoffs + 0.319∗∗NoCCA + 0.062PayTaxFirst − 0.326∗∗∗BenchmarkData +0.008SelfInitiatedAdj + 0.321∗∗NoCommissionaire + 0.075RelatedParty + 0.39∗∗∗ContemporaryDoc +0.035TPDoc+0.296Priority+0.533∗∗∗PenaltyUncertainty+2.46∗∗∗TPEnforceSvy+0.011∗∗∗AgeofRules,where ***,**,* denote significance level at the 1%, 5%, and 10%, respectively.
7

more stringent TPR.7 Alternatively, the tprisk variable can be interpreted as a measure of
tax uncertainty, induced by TPR – an interpretation that more closely resembles that of
Mescall and Klassen. Hence, this variable can also shed light on the impact of increased
tax uncertainty on MNC investment.8 Panel B of Figure 1 shows the variation in tprisk
both across countries and over time in our dataset, reflected by the median, the 25th and
75th percentiles, and the minimum and maximum value. We see that the dispersion across
countries has become smaller in recent years, while the median has remained at a similar
level.
3 Theory
This section develops a simple model to illustrate the impact of TPR on multinational
investment in a foreign subsidiary. Assume that a multinational parent resides in home
country h. It decides on how much capital (k) to invest in its foreign subsidiary in country
s. For simplicity, it is assumed that the investment is financed by equity at a cost r, which
is exogenously determined on the world capital market. Next to capital, the parent also
supplies the subsidiary with intermediate inputs (x) used in production –which can also be
thought of as firm-specific knowledge. The subsidiary generates output through production
technology f(k, x), which features decreasing returns in each of the two inputs, capital and
intermediates (i.e. fk, fx > 0, fkk, fxx < 0). Marginal factor productivity of each factor rises
in the other input (fkx > 0).
The parent can buy the intermediate input at the local market at price p (or, alternatively,
produce it and then sell at a fixed price p). However, when it supplies x to its subsidiary, the
parent can charge a transfer price (pT ) that deviates from the arm’s-length market price. The
firm can shift profit between the parent and the subsidiary. Indeed, if the tax rate charged
by the country where the subsidiary is located (τ s) is lower than the tax rate charged by the
country of the parent (τh) and the repatriation of income is exempt in the parent country,
7The tprisk measure is available for countries whose country-specific detailed TPR characteristics aredocumented in Deloitte’s Global Transfer Pricing Country Guide. Among the 27 countries in our sample(Table 1), only Bosnia & Herzegovina is not included in the Global Transfer Pricing Country Guide.
8For a discussion of the relationship between tax certainty and investment, see IMF and OECD (2017).
8

it will be attractive to shift income from the parent to subsidiary. In deviating the transfer
price from the market price, however, the parent faces an expected cost (c), e.g. due to a
penalty when caught or because of costs associated with a transfer pricing dispute. The
expected cost per unit of intermediate input traded is assumed to rise quadratically in the
price deviation, i.e. c = β(pT − p)2. The parameter β can be influenced by the government
through TPR. For instance, TPR determines the probability of an adjustment in the transfer
price or the penalty in case of detected mispricing. Hence, stricter the TPR rules are reflected
in a higher β.
Based on these assumptions, the subsidiary earns the following income:
(1− τ s)[f(k, x)− pTx], (1)
which is taxed in the host country of the subsidiary. The income is assumed to be exempt
in the parent country when distributed. The earnings of the parent company are as follows:
(1− τh)(pT − p)x+ (1− τ s)[f(k, x)− pTx]− rk − β[pT − p]2x, (2)
i.e. it earns direct income from the sale of the intermediate input, which is taxable at rate
τh, receives the profit from the subsidiary, which is taxable at rate τ s, and incurs the cost of
financing k and the expected cost of deviating the transfer price from its arm’s-length price.
The parent maximizes its profits with respect to three choice variables: k, x and pT . The
first-order conditions of this maximization problem read as follows:
(1− τ s)fk = r, (3)
fx = p+(τh − τ s)(pT − p) + β(pT − p)2
(1− τ s), (4)
pT = p− (τh − τ s)2β
, (5)
Eq. (3) shows the usual optimality condition for investment, indicating that a higher
tax rate in the host country of the subsidiary will increase the cost of capital and, therefore,
require a higher marginal product for investment to be undertaken. Under decreasing returns,
this will reduce investment. Eq. (4) shows that the parent will supply intermediate inputs
9

to the subsidiary up to the point where its marginal product equals the marginal cost. If the
tax rates in the parent and subsidiary countries are the same, or if the parent charges the
arm’s-length market price for the intermediate inputs, then Eq. (4) shows that the marginal
cost exactly equals p. Otherwise, the marginal costs of using intermediate inputs in the
subsidiary may differ from p, depending on the tax differential and the cost of shifting. Eq.
(5) determines the optimal transfer price. If the tax rate in the subsidiary country is lower
than the tax rate in the parent country, Eq. (5) shows that the optimal transfer price used
by the parent will be lower than the arm’s-length price. This is because the lower transfer
price will increase the income earned by the subsidiary and decrease direct income earned by
the parent. This reduces the overall tax liability of the multinational. The extent to which
the transfer price is reduced depends on the parameter β, i.e. the cost parameter that can
be influenced by TPR.
Combining Eq. (4) and (5), we obtain an expression of the optimal supply of intermediate
inputs:
fx = p− (τh − τ s)2
4β(1− τ s), (6)
Hence, Eq. (6) suggests that any tax rate differential between the parent and the subsidiary
will lead to a lower required marginal return to x, i.e. ∂fx/∂(τh − τ s) < 0. Only if the tax
difference is zero will fx be independent of tax parameters. Due to decreasing returns, this
implies a higher supply of intermediate inputs i.e. ∂x/∂(τh − τ s) > 0; and since fkx > 0, it
will also imply a higher marginal product of capital and, therefore, an increase in investment
(∂k/∂(τh − τ s) > 0.
As long as tax rates differ (τh 6= τ s), Eq. (6) also shows that TPR will influence the
supply of intermediate inputs. This is reflected by the impact of a change in β, i.e. ∂fx/∂β =
(τh − τ s)2/(4(1 − τ s)β2) > 0 so that ∂x/∂β < 0, i.e. stricter TPR will reduce the supply
of intermediate inputs to the subsidiary. Since fkx > 0, this implies that stricter TPR also
reduces the marginal product of capital fk and, therefore, investment ∂k/∂β < 0. Intuitively,
stricter TPR will require a higher marginal return to capital to break even, and therefore,
increases the cost of capital. This effect will only occur if the subsidiary is located in a
different country than the parent and the tax rates in these countries differs. Indeed, the
10

size of the effect rises in the tax differential between the two countries. If the parent and
the subsidiary reside in the same country (or if tax rates between countries are the same),
Eq. (6) shows that an increase in β will have no implications for the optimal supply of x
and, therefore, for optimal investment k. We use this difference in our empirical strategy
to identify the effect of TPR on multinational investments, using wholly domestic firms
as a control group. This constitutes our main hypothesis in this paper: stricter TPR will
reduce investment by multinational parents in their foreign subsidiaries, but not by purely
single-national parents in their domestic subsidiaries.
4 Data
The primary dataset for the empirical analysis is an unbalanced panel of 101,079 unique
companies in 27 countries for the years 2006 to 2014. It is constructed using unconsolidated
financial statements of affiliates that are part of a multinational or purely national company
group in the ORBIS database provided by Bureau van Dijk. A company is defined as a
MNC affiliate if its ultimate parent company is in a different country and owns at least 50%
of its shares. A company is defined as a domestic affiliate if (1) its ultimate parent company
(owning at least 50% of its shares) is in the same country and (2) all other affiliates of
the company group are in the same country of the parent company. The comparison is
thus between MNC affiliates and affiliates of purely domestic company groups, excluding all
independent, stand-alone companies that may be less comparable to MNCs. Figure 2 shows
the distribution of multinational and domestic affiliates across industry sectors in the main
dataset.
The main sample for regression analysis includes all non-financial, non-utility affiliates
with non-missing (and non-zero) sales, total assets and fixed asset values. We discard any
companies with missing industry information, with less than three consecutive observations,
and in countries with less than 1,000 observations. We further eliminate MNC affiliates that
locate in the same country as their parent company. Table 1 shows the country distribution
of affiliates in the main regression sample, distinguished by MNC affiliates and domestic
affiliates.
11

Firm-level Data The main variables for the analysis are investment in fixed capital assets,
sales, cash flow, and earnings before interest and tax (EBIT). We compute investment
spending (It) as the change in fixed tangible assets plus depreciation, i.e. It = Kt−Kt−1 +
depreciation, where capital stock (Kt) is the reported book value of fixed tangible asset
in year t. Investment rate (It/Kt−1), is defined as the ratio between current-year gross
investment spending and beginning-of-year capital stock. In some regressions we conduct
separate analyses for intensive and extensive margin responses. The intensive margin variable
is the logarithm of investment spending. The extensive margin variable is an indicator for
positive investment. Sales equal operating revenue. Sales growth rate equals the ratio
between current-year and previous-year operating revenue minus 1. Cash flow rate is
current-year cash flow divided by lagged capital stock. Profit margin is calculated as
EBIT divided by sales. All ratio variables are winsorized at top and bottom 1 percentile to
minimize influence of outliers.
Country-level Variables As discussed in Section 2, our main variables of interest are the
discrete binary indicator on the existence of some transfer pricing regulation (TPR), and
the measure of the overall transfer-pricing strictness (tprisk). These two policy variables
are constructed based on information provided in Mescall and Klassen (2014), which are
available between the years 2006 and 2013. We expand their coverage for one more year to
2014 by using country-specific detailed TPR characteristics in Deloitte’s Transfer Pricing
Strategic Matrix, 2014. Information about the presence of thin capitalization rules (TCRs)
is obtained from De Mooij and Hebous (2017). Data on country-level macroeconomic char-
acteristics, including GDP per capita, the growth rate of GDP per capita, population, and
unemployment rate, that capture the aggregate market size and demand characteristics in
the host country are from the IMF’s World Economic Outlook database. The user cost of
capital is computed as rreal + 1−A1−CIT , where rreal is the real interest rate and the second
term reflects varying tax rules and corporate income tax (CIT) rates in different countries
and over time. Data on the statutory CIT rates and the net present value of depreciation
allowances (A) are provided by the Oxford University Centre for Business Taxation.9 The
9The calculation assumes a common real interest rate of 7.5 percent for all countries throughout thesample period.
12

tax differential, which proxies for the net tax savings from transfer mispricing, is the absolute
difference between the host country and parent country statutory CIT rate. Table 2 presents
the summary statistics of the key variables that are used in the regression analysis.
Alternative regression sample In addition to the main regression sample that includes
both multinational and domestic affiliates, we use alternative data in some of the analysis.
First, the analysis on the tax sensitivity of FDI in Section 6.4 uses a smaller dataset that
excludes domestic affiliates from the sample to focus on the tax sensitivity of multinational
investment. Second, the analysis on the potential spillover effect of TPRs in Section 7 uses a
sample of consolidated accounts in ORBIS. It includes companies that are parent of multina-
tional or domestic company group to eliminate double counting, as regional headquarters are
also required to file consolidated accounts. The sample for this analysis includes 17,638 ob-
servations corresponding to about 2,024 distinct non-financial, non-utility parent companies
in more than 60 countries in the period from 2006 to 2014. Investment in the consolidated
accounts reflect total investment of the company group. Finally, Section 6.2 uses a matched
sample of multinational and domestic affiliates based on their average turnover, turnover
growth rate, number of workers, and total assets during the sample period.
5 Empirical Specifications
This section describes two empirical strategies we use to identify the effect of TPRs on
multinational investment: a difference-in-difference (DD) approach and a more traditional
panel regression. The DD approach estimates the differential changes in investment by MNCs
compared to that by domestic affiliates. The panel regression estimates the difference in the
tax sensitivity of multinational investment before and after the introduction of TPR.
5.1 Difference-in-Difference
Our main empirical strategy is the standard DD approach. Intuitively, if the adoption of
TPR raises the effective cost of capital only for multinationals, we would expect a subsequent
reduction in their investment relative to the investment by otherwise similar affiliates that
13

are part of purely domestic company groups. Formally, we test the investment response
using the following specification:
Investmentikt = ai + dt + βTPRMNCi × TPRkt + βxxikt + βzzkt + εikt, (7)
where i indexes firms, k indexes the host country, and t indexes time. We control explicitly
in this specification for changes in investment due to other non-tax factors by using a control
group of affiliates from purely domestic companies in the same host country. The latter
are exposed to the same aggregate shocks as those experienced by the multinationals. The
dependent variable Investmentikt denotes current-year investment spending It divided by
lagged capital stock Kt−1. The key variable of interest is the interaction term between two
dummy variables: an indicator that takes the value of 1 if firm i is part of a multinational
group and zero otherwise (MNCi); and an indicator that takes the value of 1 for all the
years following the introduction of TPR in country k, and zero otherwise (TPRkt). The
coefficient βTPR represents the DD estimate of the effect of TPR on investment by MNC
affiliates, and is expected to be negative following our theoretical prediction of Section 3.10
Throughout the various specifications based on Eq. (7), a full set of firm fixed effects
(ai) is always included to control for unobserved heterogeneity in firm-level productivity and
parent-company characteristics. Firm fixed effects subsume host-country fixed effects (given
that affiliates do not change their location), controlling for time-invariant differences across
host countries that may affect the location choice of multinationals. These considerations
could include, for example, perceived average quality of governance during the sample period,
common language and/or former colonial ties with the home country, and geographical
distance between the home and host country. We also include a full set of time dummies (dt)
to capture the effect of aggregate macroeconomic shocks, including the effect of the great
recession, that are common to both multinational and domestic companies. Xikt denotes a
vector of firm-level non-tax determinants of investment, including proxies for firm size, its
growth prospect, the degree of financial constraints and profitability. Finally, εikt is the error
10Note that this approach assumes away any general equilibrium effects. For instance, if a reductionof multinational investment leads to an immediate expansion of domestic investment, then βTPR wouldunderestimate the effect of the TPR on multinational investment. It is difficult, however, to determine theoverall sign and size of these possible general equilibrium effects.
14

term.
We include in most DD specifications the statutory corporate tax rate in the host country
(or alternatively, a set of country-year fixed effects), to control for potential confounding
effects of concurrent tax reforms on business investment. We also include a set of time-varying
country characteristics (Zkt) in the host countries, including GDP per capita, population,
and unemployment rate to capture the effect of time-varying local productivity, market size
and demand characteristics on investment. Our preferred specification includes a full set
of industry-year fixed effects, country-year fixed effects, and country-industry fixed effects.
Taking the full set of fixed effects is crucial for insulating the causal effect of TPR on
investment. Specifically, the two-way industry-year fixed effects control for the average
investment in a given industry-year across all countries, taking out all the industry-specific
shocks to business investments in each year. This fixed effect is important to control for
any difference in the industry composition of MNCs compared to domestic companies. The
second fixed effect, for country-year pairs, controls for macroeconomic shocks to investment
that are common to all firms in each country-year pair. Finally, country-industry fixed effects
control for all shocks to the supply or demand of fixed capital that are industry and country
specific throughout the sample period. The coefficient of interest βTPR hence insulates the
effect of TPR on MNC investment from all of the industry and country specific factors that
could potentially confound the investment effects of the policy change.
Identification Our DD strategy rests critically on the assumption that, prior to the in-
troduction of TPRs, there are no differential changes in investment by MNCs relative to
domestic companies, conditional on changes in non-TPR factors that are already empirically
controlled for. We perform placebo tests to check the validity of the identification assump-
tion by examining whether there was a differential change in MNC investment in any of the
pre-legislation years. Specifically, we estimate the model:
Investmentikt = ai + dt +−1∑l=−5
βlMNCi × TPRkt × Pre− TPRl
+∑
Post−TPRn
βnMNCi × TPRkt × Post− TPRn + βxxikt + βzzkt + εikt,
(8)
15

where Pre− TPRl is a dummy variable that takes the value of 1 for the lth year before the
introduction of the TPR, and zero otherwise, and Post − TPRn is a dummy variable that
takes the value of 1 for the nth year after the introduction of the TPR, and zero otherwise.
Without loss of generality for our test, we normalize β0 = 0. In this specification, the
assumption of parallel trends between the treated and control group corresponds to the
hypothesis that all pre-TPR βls are equal to each other, i.e. there is no significant change
in the difference between investment by multinational and domestic affiliates in any of the
pre-TPR years, even if the investment levels between the two groups could be different.
Table 3 presents the full set of regression results.11 We test the null hypothesis that there
is no difference in the pre-TPR effects, that is, all pre-reform βl coefficients are equal to
each other. The p−value of 0.23 does not reject the null hypothesis; our parallel trends
assumption therefore passes the placebo test.
5.2 Panel Regression
Our second regression follows a more structural approach to identify the impact of the
introduction of TPR on MNC investment. One interpretation of the theoretical results of
Section 3 is that a tightening of TPR increases the cost of capital on MNC investment. In
principle, the model should allow us to quantify the effect of TPR on the cost of capital,
by comparing the magnitude of cost of capital with and without TPR. Unfortunately, this
exercise is infeasible since we cannot measure the exact magnitude of the change in β in Eq.
(2) which would reflect the impact of TPR. We can, however, infer this impact indirectly by
estimating the tax-sensitivity of MNC investment with and without TPR. This can be done
either by using a direct measure for the cost of capital, or by using the statutory CIT rate
as a proxy for the tax impact on investment.
To illustrate this idea, suppose that βtax is the semi-elasticity of MNC investment with
respect to the corporate tax rate in the absence of TPR (i.e. βtax ≡ ∂lnInvestment∂CIT
). After
11The coefficients on the MNCi × TPRkt × Post − TPRn variables also shed lights on the dynamics ofthe investment effect. The results indicate that TPR has a large negative effect on investment in the firstyear after its adoption. This is consistent with that investment decisions are forward-looking. The size of itseffect is smaller but remains significant in later years, indicating that TPRs have lasting permanent effecton MNC investment.
16

the introduction of TPR, the semi-elasticity changes into γtax = βtax + βTPRtax , where βTPRtax
measures the change in the semi-elasticity as a result of the introduction of TPR. Using our
sample, we can directly estimate βtax and βTPRtax from the following regression:
ln(Investmentikt) = ai + dt + βtaxCITkt + βTPRtax × CITkt × TPRkt + βxxikt + εikt. (9)
Since lnInvestment = βtax × (1 +βTPRtax
βtax)×CITt, a change in the semi-elasticity can also
be interpreted as (assuming a constant βtax) a change in the effective rate of CIT, namely
TPR increases the tax rate in proportion to the fractionβTPRtax
βtax. Each percentage point change
in the CIT rate in the absence of TPR (i.e. βTPRtax = 0) will thus have an equivalent effect
in the presence of TPR of (1 +βTPRtax
βtax) × CITt. We can call the latter the “TPR-adjusted”
corporate tax rate. A similar exercise can be performed, using the cost of capital instead of
the statutory CIT rate, which we can call the “TPR-adjusted” cost of capital. The empirical
analysis below will measure these adjustments to infer the corresponding tax adjustment due
to the introduction of TPR.
6 Results
This section first provides direct evidence on the reduction in MNC investment in response to
the introduction of TPR, based on the DD regression approach. It then presents robustness
checks and discusses heterogeneity in responses. Finally, we estimate the “TPR-adjusted”
semi-elasticity of multinational investment.
6.1 Baseline
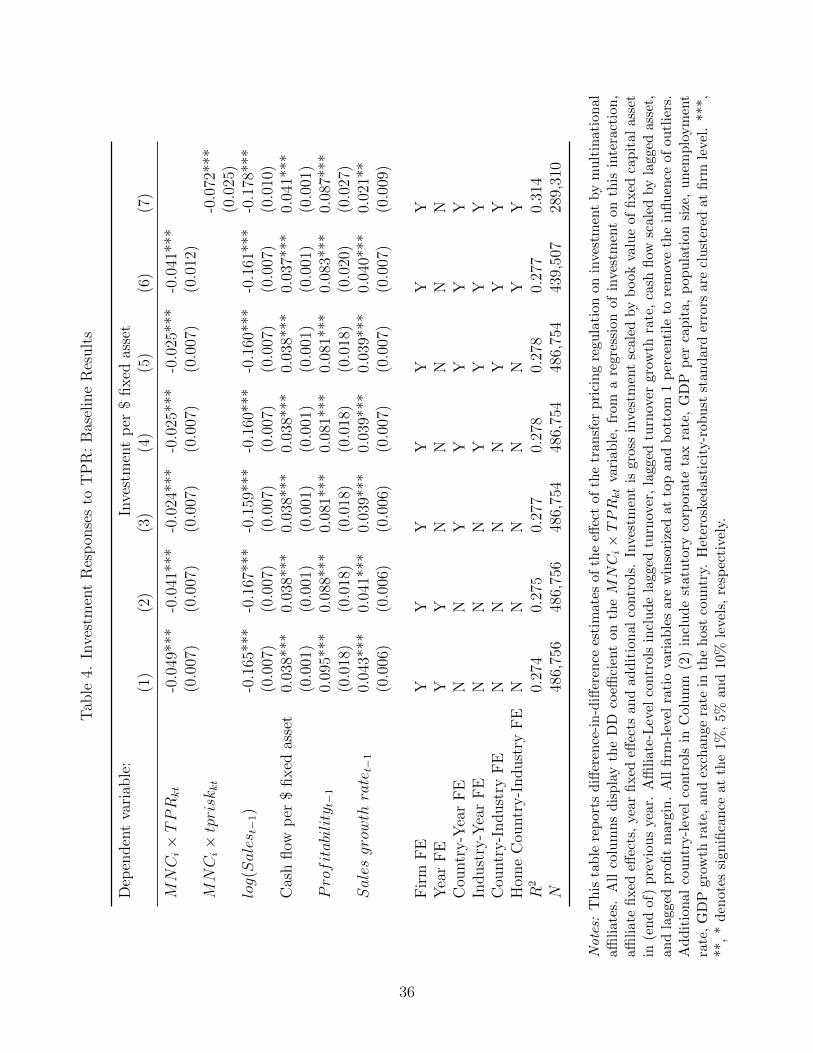
Table 4 presents the main DD regression results based on Eq. (7). Each regression in Table
4 includes a full set of firm fixed effects and year fixed effects. We report standard errors
clustered at the firm level. Column (1) leaves out any country-level control variables. The
DD coefficient is -0.049 and significant at the 1 percent level, indicating that, on average,
the introduction of TPR dampens MNC investment. The coefficient estimates on firm-level
non-tax determinants of investment have the expected signs and are highly significant. For
17

example, the negative coefficients on cash flow and profitability suggest that firms that are
less financially constrained invest more in fixed capital assets. The positive coefficient on
sales growth implies a positive link between firm-level investment and its growth prospect.
Column (2) of Table 4 checks the robustness of the baseline finding by including the host
country-level statutory CIT rate, population, unemployment rate, exchange rate, real GDP
per capita, and GDP growth rate. This is to ensure that the DD estimate is not confounded
with contemporaneous macroeconomic changes in the host country that may affect MNC
investment. Inclusion of these country-level characteristics slightly reduces the magnitude
of the DD coefficient from -0.049 to -0.041.
The next four columns of Table 4 check the robustness of the baseline finding by sub-
sequently adding two-way country-year fixed effects in Column (3), two-way industry-year
fixed effects in Column (4), two-way country-industry fixed effects in Column (5), and two-
way home country-industry fixed effects in Column (6). In our preferred specification in
Column (6), the DD estimate is -0.041 and significant at the 1 percent level. It suggests
that, on average, the implementation of TPR reduces the investment rate (i.e. investment
as a percentage of the fixed assets) by multinationals by 4.1 percentage point. Given that
the average gross investment per dollar of fixed asset is 35.9 cents for multinational affiliates
in the sample, this corresponds to 11.4 percent reduction in their investment.
Finally, Column (7) of Table 4 includes an interaction term between MNCi and the
tpriskkt variable that measures the strictness of TPR. Intuitively, stricter TPR would increase
the effective cost of capital faced by multinationals, thereby dampening their investment by
more. The negative coefficient estimate on the interaction term suggests that this is indeed
the case, with a coefficient of -0.072 that is significant at the 1 percent level.12 For a country
with a relatively lenient TPR regime (index of 3.0), the reduction in MNC investment would
thus be 0.216 percentage points; for a country with the strictest regime (index of 5.17), this
would be a 0.36 percentage points.
12The tprisk measure is not available for countries without TPRs, hence the regression in Column (7)explores variation in the strictness of TPR for countries with TPRs.
18

6.2 Robustness
Table 5 presents regressions from alternative specifications and samples to test the robustness
of the findings in Table 4. Column (1) excludes affiliates with a parent residing in country
that has a worldwide tax system, which could mute the incentive for profit shifting compared
to territorial taxation. Column (2) clusters the standard errors at the host country level to
address the concern that in tax reform studies, the standard errors can be understated by
assuming independence across firms within the same tax jurisdiction (Bertrand et al., 2004).
In both columns, the result on the TPR variable remains unchanged.
Column (3) uses an investment rate winsorized at the top and bottom 2.5 percentile as
the dependent variable, to ensure that the identified effect of TPR is not driven by any
outliers in investment. The DD estimate is smaller at around 0.018, but remains statistically
significant at the 1 percent level. Moreover, it is not statistically different from the DD
estimate reported in Column (6) of Table 4 that uses the investment rate winsorized at the
top and bottom 1 percentile as the dependent variable.
Column (4) implements a matching DD strategy (Heckman et al. (1997)) to address the
concern that companies in the treated and control groups may not have similar observable
characteristics, and that these differences may explain different trends in investment over
time. The regression in Column (4) replicates the DD analysis on a subsample of matched
firms from a Mahalanobis distance matching procedure based on average firm-level turnover,
turnover growth, employment and total assets. The resulting estimate remains positive and
significant at the 1 percent level for the matched sample, and the size of the coefficient
remains similar.
6.3 Heterogeneous Responses
Table 6 explores heterogeneity in investment responses across firms. First, it looks at intens-
ive and extensive margins. Second, it looks at the variation in the size of tax differentials.
Third, it explores variation in the intensity of intangible assets. Finally, it examines separ-
ately the investment effect of TPR in countries with and without thin-capitalization rules.
19

Extensive vs. Intensive Margin. The first two columns of Table 6 explore the difference
between intensive and extensive margin investment responses. Column (1) uses a discrete
dummy indicator for positive investment as the dependent variable. The linear probability
regression captures the extensive margin investment responses to TPRs. The coefficient is
small and insignificant, suggesting that TPRs have negligible impacts on firm’s likelihood to
invest in years after their introduction. Column (2) examines the intensive margin response
using the logarithm of investment as the dependent variable, thus excluding observations
with negative investment. The DD coefficient is positive and highly significant. Hence,
investment reductions due to TPR are most likely due to lower investment by MNCs with
positive investment prior to the policy change.
The size of tax differential. Eq. (6) suggests that the tax differential matters for the
impact of TPRs on investment, with the impact becoming larger if the tax differential in-
creases.13 To explore this, we divide the sample into quartiles based on the tax differential,
and then interact the main policy term in Eq. (7) with the quartile indicators:
Investmentikt = ai+dt+4∑j=1
βjMNCi×TPRkt×{I|TaxDiff ∈ Quartilej}+βxxikt+ εikt, (10)
Column (3) of Table 6 presents the coefficients obtained from this regression. The results
suggest that the tax differential indeed matters. At the bottom quartile of tax differential,
the response to TPR is negative but insignificant. This may be due to fixed costs associated
with changing investment, or because MNCs shift very little profit if tax differentials are
small due to the fixed cost of shifting. The investment effect is larger and highly significant
in the 2nd quartile of the tax differential, consistent with the theory. However, the impact
does not increase monotonically in the tax differential. In fact, the coefficient becomes
smaller and less significant in the 3rd and 4th quartile, although it remains negative and
significant at 10 percent.
13This tax differential variable thus captures the tax incentive for profit shifting between affiliates andparent companies. Parent companies are typically large relative to the size of the group and have beenshown to play a prominent role in the profit shifting strategies of multinational firms (Lohse and Riedel,2013).
20

The intensity of intangible assets. For firms investing heavily in intangible assets, it
can be difficult to find comparable prices to comply with the arm’s length principle. For
them, the impact of TPR on investment can be quite different. On the one hand, it might be
that TPR offers little guidance as to how transfer prices should be determined. In that case,
we might expect that the impact of TPR declines in the share of intangibles. On the other
hand, it might also be that TPR is more important for them as it provides tax authorities
with greater power to adjust transfer prices. The regression can show which of these is more
likely. We test the effect of intangible asset intensity on the relationship between TPR and
investment in the following specification:
Investmentikt = ai+dt+βTPRMNCi×TPRkt+βIntangMNCi×TPRkt×IntangSharei+βxxikt+εikt,
(11)
where IntangSharei is the average level of intangible fixed assets relative to total assets for
firm i during the sample period. In this specification, βTPR captures the impact of transfer
pricing regulation on investment for firms with no intangible assets, whereas βIntang captures
the changing impact of transfer pricing regulation on investment across firms of different
intangible asset intensity.
Table 6 Column (4) reports a negative coefficient estimate on the main interaction term
MNCi × TPRkt. The coefficient on the three-way interaction term with the share of intan-
gibles is small but positive and highly significant. Hence, the negative effect of TPR on mul-
tinational investment decreases in the firm’s intensity of intangible assets. Note that the size
of this effect is small: the difference between a firm with no intangibles (IntangShare = 0)
and a firm with only intangibles (IntangShare = 1) is only 0.2 percentage points, i.e. the
investment effect drop from -3.2 percentage points to -3.0 percentage points.
Interaction between TPRs and TCRs. MNCs can shift profits through different chan-
nels. For instance, apart from the manipulation of transfer prices, they can use intra-company
loans to enjoy interest deductions in high-tax affiliates and have the interest taxed in low-
tax affiliates.14 Hence, it might be that MNCs will respond to the introduction of TPR
14Beer et al. (2018) reviews existing empirical evidence on six main channels of international tax avoidance,including on transfer mispricing, strategic location of intellectual property (IP), international debt shifting,treaty shopping, corporate inversion/headquarter location, and tax deferral.
21

by substituting away from abusive transfer pricing toward debt shifting through the use of
intra-company loans (Saunders-Scott, 2015).15 Hence, TPRs might be less effective in re-
stricting the overall profit shifting by MNCs if there are no TCRs in place due to unlimited
substitution. In that case, the introduction of TPR might have little impact on the effective
cost of capital for multinationals and we may expect a smaller effect on investment, relative
to the case where a TCR is in place.
To examine the interaction between TPRs and TCRs, we divide the host countries in our
sample into one group without any TCR, and a group with some TCR during the sample
period. We then estimate separately the effect of TPR on multinational investment in each
country group, using the DD regression based on Eq. 7. Columns (5) and (6) of Table 6
report these results. Interestingly and consistent with our prediction, the DD coefficient for
countries without TCR is -0.013 and insignificant (Column (5)), while the DD coefficient
for countries with TCR is almost three times larger and significant at 1 percent (Column
(6)). Hence transfer mispricing and debt shifting are likely to be substitutes in MNC profit
shifting. The effectiveness of one measure against tax avoidance thus depends critically on
other measures. At the same time, the more effective these packages become in limiting
profit shifting, the more likely it becomes that they reduce MNC investment.
6.4 TPR-adjusted tax elasticity
Table 7 summaries the regression results based on Eq. (9) using a smaller sample that in-
cludes only multinational affiliates. Column (1) suggests that without TPR, a one percentage
point lower statutory CIT rate in the host country increases investment (as a share of total
assets) by multinationals by 0.83 percentage point. In the presence of TPR, the sensitivity
of investment to CIT increases by 0.36 percent point to 1.19 (in absolute term). This finding
persists when replacing the CIT variable with a measure of the cost of capital (COC) in
Column (2), although the COC coefficient is estimated with imprecision in the absence of
TPR.
15Saunders-Scott (2015) examines changes in the reported EBIT following a tightening of thin-capitalization rules for multinational affiliates, using the ORBIS database. The findings suggest that MNCsuse transfer mispricing and intra-company debt shifting as substitutes.
22

To directly measure the semi-elasticity of multinational investment, Column (3) uses
the logarithm of fixed tangible assets as the dependent variable. In this specification, the
coefficient on CIT can be directly interpreted as the semi-elasticity of MNC investment. The
regression controls for output (proxied by log Sales) and employment (proxied by log Number
of workers). The results suggest that the estimated semi-elasticity of fixed capital assets is
slightly larger than one in the absence of TPR and highly significant. Hence, a 1 percentage-
point increase in the CIT rate will reduce MNC investment by approximately 1 percent.
The tax effect increases by 0.24 in the presence of TPR to an overall semi-elasticity of 1.26.
Hence, after TPR introduction, corporate tax rates matter about one quarter more for MNC
investment than before TPR. The reason is that, as MNCs find it more costly to avoid high
tax rates through profit shifting, they become more responsive in their investment to those
taxes. Following our interpretation in Section 5.2, the introduction of TPR corresponds to a
“TPR-adjusted” CIT rate that is 23 percent larger than without TPR. Column (4) replaces
the CIT rate with a measure of the cost of capital. The results are qualitatively the same and
imply that the “TPR-adjusted” cost of capital is 15 percent larger than the cost of capital
without TPR.
7 Effect on Total MNC Investment
The reduction in fixed capital investment by MNC affiliates identified in Section 6 may
have two alternative interpretations: it could reflect (i) a reduction in total investment
due to a higher cost of capital for the entire MNC company group; or (ii) a relocation of
investment to other affiliates of the same MNC group. Both investment responses reduce
output in the host country in similar ways. However, they have very different economic
implications for the rest of the world. Indeed, lower investment by the MNC group would
unambiguously reduce global output, while a reallocation of investments across countries
would imply a shift of production toward countries that enjoy an inflow of investment.
Global output might still decline due to production inefficiency, but is smaller under the
second scenario. Of course, cross-country spillovers of this kind can intensify tax competition
among national governments and ultimately lead to too lenient TPR in all countries, if there
23

is no international cooperation.
To identify the impact of TPR on total investment of the MNC group, we use a similar
DD strategy based on Eq. (7). All the key variables are as previously defined but are now
based on consolidated accounts of the parent company. In particular, Investmentikt now
reflects the amount of worldwide investment by the MNC group with parent company i in
country k. TPRkt is a discrete dummy variable that takes the value of one if there is some
transfer pricing regulation in the parent country k, and zero otherwise. It is important to
note that the TPRkt variable defined in this way only captures the effect of TPR in the
parent country, ignoring the effect of TPRs in any other countries where affiliates of the
same MNC group operate. This implies that there can be measurement error in the TPRkt
variable to determine the impact of TPRs on the multinational group’s investment, leading
to attenuation bias.
Table 8 summarizes the results, where the DD coefficient captures the impact of parent-
country TPR on total investment by the MNC group. Column (1) reports the baseline re-
gression results based on Eq. (7) with no country-level controls. Contrary to our expectation,
the DD coefficient is positive and significant at the 1 percent level, and remains significant
with inclusion of country-level characteristics in Column (2). However, the DD coefficient
becomes insignificant when including country-year fixed effects in Column (3), suggesting
that the significance of the DD coefficient may reflect other country-specific common trends
in MNC investment that are unrelated to the introduction of TPR. The DD coefficient re-
mains insignificant when adding industry-year fixed effects and industry-country fixed effects
in Column (4). Column (5) interacts the discrete interaction term with the top statutory
CIT rate in the parent country, and the basic finding remains unchanged.16 Overall, the
absence of a clear effect of TPR on MNC consolidated investment suggests that the negative
effect of TPRs on investment in foreign affiliates might indeed be due to a relocation effect
of investment.
16The basic finding also remains unchanged when interacting the discrete interaction term with the tpriskvariable.
24

8 Conclusions
Despite increased global interest in transfer pricing regulations to mitigate tax avoidance
by multinational companies–most notably due to the G20/OECD project on base erosion
and profit shifting–there is no empirical evidence on their implications for investment. This
paper fills this gap. It uses a quasi-experimental research design, exploiting a large micro
data set of unconsolidated accounts of both multinational affiliates and affiliates of purely
national corporations. Guided by a simple theoretical model, it is argued that transfer pricing
regulation should only affect the cost of capital of the multinational affiliates. The affiliates of
purely national corporations can thus be used as a control group to identify the causal impact
on multinational investment. Our data comprises the period between 2006 and 2014, during
which seven of the 27 countries in the sample introduced transfer pricing regulations. The
estimates suggest that, on average, the introduction of transfer pricing regulations reduced
investment in multinational affiliates by more than 11 percent. The reduction in investment
is larger if transfer pricing regulation become stricter; and it is also larger for firms that
are less intensive in the use of intangible assets. The investment response becomes smaller
if the tax differential with other countries becomes very small or in countries that have no
thin capitalization rules in place. Regressions based on consolidated statements indicate that
aggregate multinational investment is not affected by transfer pricing regulations, suggesting
that multinational firms relocate investment toward affiliates in other countries rather than
cut global investment. Thus, transfer pricing regulations induce spillover effects to other
countries.
Our results have important policy implications. For example, unilateral introduction
of transfer pricing regulation will distort the international allocation of capital; and the
negative investment effect can make countries reluctant to adopt them or make them more
lenient. Binding international coordination can prevent this, but might not be beneficial
for all countries. Also, broad coverage of different anti-avoidance measures is important, as
avoidance channels may be substitutes: restricting only one channel will therefore cause a
substitution toward other channels of profit shifting.
More research is needed to understand these real effects of other anti-avoidance regula-
25

tions, including rules that restrict interest deductibility, provisions against treaty abuse, and
more general anti-avoidance rules. Also the interaction between these anti-tax avoidance
rules and other tax policy parameters, such as corporate tax rates, is important. These
issues are left for further research.
26

References
Andrews, D., C. Criscuolo, and P. Gal, Frontier Firms, Technology Diffusion andPublic Policy, OECD Publishing, 2015.
Beer, Sebastian and Jan Loeprick, “Profit shifting: drivers of transfer (mis)pricing andthe potential of countermeasures,” International Tax and Public Finance, 2015, 22 (3),426–451.
, Ruud A. De Mooij, and Li Liu, “International Corporate Tax Avoidance: A reviewof the channels, effect sizes and blindspots,” IMF Working Paper 2018/xx, InternationalMonetary Fund 2018.
Bernard, Andrew B., J. Bradford Jensen, and Peter K. Schott, “Transfer Pricingby U.S.-Based Multinational Firms,” Working Paper 12493, National Bureau of EconomicResearch August 2006.
Bertrand, Marianne, Esther Duflo, and Sendhil Mullainathan, “How Much ShouldWe Trust Differences-In-Differences Estimates?,” The Quarterly Journal of Economics,2004, 119 (1), 249–275.
Blouin, Jennifer, Harry Huizinga, Luc Laeven, and Gaetan J.A. Nicodeme, “ThinCapitalization Rules and Multinational Firm Capital Structure,” CESifo Working PaperSeries 4695, CESifo Group Munich 2014.
Bond, Stephen and Jing Xing, “Corporate Taxation and Capital Accumulation: Evid-ence from sectoral panel data for 14 OECD countries,” Journal of Public Economics, 2015,130, 15 – 31.
Bucovetsky, Sam and Andreas Haufler, “Preferential Tax Regimes With AsymmetricCountries,” National Tax Journal, December 2007, 60 (4), 789–795.
Buettner, Thiess and Georg Wamser, “Internal Debt and Multinational Profit Shifting:Empirical Evidence From Firm-Level Panel Data,” National Tax Journal, March 2013, 66(1), 63–95.
, Michael Overesch, and Georg Wamser, “Anti Profit-Shifting Rules and ForeignDirect Investment,” Working Paper, CESifo Group Munich 2014.
, , Ulrich Schreiber, and Georg Wamser, “The Impact of Thin-CapitalizationRules on the Capital Structure of Multinational Firms,” Journal of Public Economics,2012, 96 (11 - 12), 930 – 938.
Caballero, Ricardo J., Eduardo M. R. A. Engel, and John C. Haltiwanger, “Plant-Level Adjustment and Aggregate Investment Dynamics,” Brookings Papers on EconomicActivity, 1995, 26 (2), 1–54.
Clausing, Kimberly A., “Tax-Motivated Transfer Pricing and US intrafirm trade prices,”Journal of Public Economics, September 2003, 87 (9-10), 2207–2223.
27

Cristea, Anca D. and Daniel X. Nguyen, “Transfer Pricing by Multinational Firms:New Evidence from Foreign Firm Ownerships,” American Economic Journal: EconomicPolicy, August 2016, 8 (3), 170–202.
Crivelli, Ernesto, Ruud de Mooij, and Michael Keen, “Base Erosion, Profit Shiftingand Developing Countries,” FinanzArchiv: Public Finance Analysis, 2016, 72 (3), 268–301.
Cummins, Jason G., Kevin A. Hassett, R. Glenn Hubbard, Robert E. Hall, andRicardo J. Caballero, “A Reconsideration of Investment Behavior Using Tax Reformsas Natural Experiments,” Brookings Papers on Economic Activity, 1994, 1994 (2), pp.1–74.
Davies, Ronald B., Julien Martin, Mathieu Parenti, and Farid Toubal, “Knockingon Tax Haven’s Door: Multinational Firms and Transfer Pricing,” Review of Economicsand Statistics, forthcoming, 2018.
De Mooij, Ruud A. and Shafik Hebous, “Curbing Corporate Debt Bias: Do Limitationsto Interest Deductibility Work?,” IMF Working Paper 2017/22, International MonetaryFund 2017.
Desai, Mihir A., C. Fritz Foley, and James R. Hines, “The demand for tax havenoperations,” Journal of Public Economics, 2006, 90 (3), 513 – 531.
Dharmapala, Dhammika, “What Do We Know about Base Erosion and Profit Shifting?A Review of the Empirical Literature,” Fiscal Studies, 2014, 35 (4), 421–48.
Finke, Katharina, “Tax Avoidance of German Multinationals And Implications for TaxRevenue,” memo, ZEW - Center for European Economic Research 2013.
Flaaen, Aaron, “The Role of Transfer Prices in Prot-Shifting by U.S. Multinational Firms:Evidence from the 2004 Homeland Investment Act,” mimeo, Federal Reserve Board. 2016.
Fuest, Clemens, Christoph Spengel, Katharina Finke, Jost Heckemeyer, andHannah Nusser, “Profit shifting and ’aggressive’ tax planning by multinational firms: Is-sues and options for reform,” ZEW Discussion Papers 13-044, ZEW - Center for EuropeanEconomic Research 2013.
Grubert, Harry and Joel Slemrod, “The Effect Of Taxes On Investment And IncomeShifting To Puerto Rico,” The Review of Economics and Statistics, 1998, 80 (3), 365–373.
Habu, Katarzyna, “How aggressive are foreign multinational companies in avoiding cor-poration tax?,” Working Paper 1713, Oxford University Centre for Business Taxation2017.
Heckemeyer, Jost and Michael Overesch, “Multinationals’ profit response to tax differ-entials: Effect size and shifting channels,” ZEW Discussion Papers 13-045, ZEW - Centerfor European Economic Research 2013.
28

Heckman, James J, Hidehiko Ichimura, and Petra E Todd, “Matching as an Eco-nometric Evaluation Estimator: Evidence from Evaluating a Job Training Programme,”Review of Economic Studies, October 1997, 64 (4), 605–54.
Hines, James and Eric M. Rice, “Fiscal Paradise: Foreign Tax Havens and AmericanBusiness,” The Quarterly Journal of Economics, 1994, 109 (1), 149–182.
Hines, James R., “How Serious is the Problem of Base Erosion and Profit Shifting?,”Canadian Tax Journal, 2014, 62 (2), 443–53.
House, Christopher L. and Matthew D. Shapiro, “Temporary Investment Tax Incent-ives: Theory with Evidence from Bonus Depreciation,” American Economic Review, June2008, 98 (3), 737–68.
IMF and OECD, Tax Certainty - IMF/OECD Report for the G20 Finance Ministers, IMF,2017.
Janeba, Eckhard and Michael Smart, “Is Targeted Tax Competition Less Harmful ThanIts Remedies?,” International Tax and Public Finance, May 2003, 10 (3), 259–280.
Keen, Michael, “Preferential Regimes Can Make Tax Competition Less Harmful,” NationalTax Journal, 2001, 54 (4), 757–762.
Liu, Li, Tim Schmidt-Eisenlohr, and Dongxian Guo, “Transfer Pricing and TaxAvoidance: Evidence from Linked Tax-Trade Statistics in the UK,” Working Paper 1715,Oxford University Centre for Business Taxation 2017.
Lohse, Theresa and Nadine Riedel, “Do Transfer Pricing Laws Limit InternationalIncome Shifting? Evidence from European Multinationals,” CESifo Working Paper Series4404, CESifo Group Munich 2013.
Marques, Mario and Carlos Pinho, “Is transfer pricing strictness deterring profit shift-ing within multinationals? Empirical evidence from Europe,” Accounting and BusinessResearch, 2016, 46 (7), 703–730.
Merlo, Valeria and Georg Wamser, “Debt Shifting and Thin-capitalization Rules,”CESifo DICE Report, 01 2015, 12 (4), 27–31.
Mescall, Devan and Kenneth J. Klassen, “How do tax and accounting policies af-fect cross-border mergers and acquisitions?,” Working Paper Series, University of Saskat-chewan 2014.
Nicolay, Katharina, Hannah Nusser, and Olena Pfeiffer, “On the Interdependencyof Profit-shifting Channels and the Effectiveness of Anti-Avoidance Legislation,” AnnualDoctoral Conference Paper 2016, Oxford University Centre for Business Taxation 2016.
OECD, Action Plan on Base Erosion and Profit Shifting, OECD Publishing, 2013.
, Measuring and Monitoring BEPS, Action 11 - 2015 Final Report, OECD Publishing,2015.
29

Overesch, Michael, “The Effects of Multinationals’ Profit Shifting Activities on Real In-vestments,” National Tax Journal, 2009, 62 (1), 5–23.
Saunders-Scott, Molly J., “How does transfer-pricing enforcement affect reportedprofits?,” Technical Report, University of Michigan 2013.
, “Substitution Across Methods of Profit Shifting,” National Tax Journal, December 2015,68 (4), 1099–1120.
UNCTAD, Reforming International Investment Governance, World Investment Report,United Nations Publications, 2015.
Vicard, Vincent, “Profit Shifting Through Transfer Pricing: Evidence from French FirmLevel Trade Data,” Working Paper 555, Banque de France 2015.
Yagan, Danny, “Capital Tax Reform and the Real Economy: The Effects of the 2003Dividend Tax Cut,” American Economic Review, 2015, 105 (12), 3531–63.
Zwick, Eric and James Mahon, “Tax Policy and Heterogeneous Investment Behavior,”American Economic Review, January 2017, 107 (1), 217–48.
30

Figure 1. Transfer Pricing Regulations (TPRs)
A. Number of Countries with TPRs
B. Variation in the Strictness of TPRs
Notes : Panel A plots the number of countries with newly-introduced TPRs (top green bar)and the number of countries with existing TPRs (bottom red bar) during 1928-2011. Panel Bexhibits cross-sectional variation in the overall strictness of the TPRs (tprisk) during 2006-2014, showing the median, the 25th and 75th percentiles, and the minimum and maximumvalue of tprisk in a box plot. The dots denote the minimum value of tprisk in later years.
31

Figure 2. Industry Distribution
Notes: This figure shows the distribution of industries by ownership types for companies inthe main estimation sample in the time period 2006 to 2014.
32

Table 1. Country Statistics
Number of Companies in: Total MNC Domestic Company Group
Austria 5,643 4,565 1,078Belgium 37,417 25,695 11,722Bosnia & Herzegovina 2,035 1,678 357Bulgaria 13,391 3,740 9,651Czech Republic 29,200 18,661 10,539Denmark 3,497 2,596 901Estonia 5,898 3,902 1,996Finland 19,545 8,533 11,012France 144,662 70,158 74,504Germany 27,752 19,588 8,164Greece 8,189 4,890 3,299Hungary 15,798 15,446 352Japan 2,637 2,351 286Korea, Republic of 14,320 10,354 3,966Luxembourg 854 639 215Netherlands 1,727 1,168 559New Zealand 982 941 41Norway 37,711 11,452 26,259Poland 30,565 20,696 9,869Portugal 29,993 14,020 15,973Romania 17,922 13,489 4,433Slovak Republic 10,991 8,475 2,516Slovenia 4,949 3,964 985Spain 100,403 39,720 60,683Sweden 91,067 20,446 70,621Ukraine 2,249 654 1,595United Kingdom 63,053 44,894 18,159
Notes: This table lists the number of companies by ownership types in the main estimationsample between 2006 and 2014.
33

Table 2. Summary Statistics
Variables: Mean Std Dev Median P10 P90
Firm-level variables:Investment spending ($1,000) 1,725 30,589 70.73 -47 2,266Fixed asset ($1,000) 11,528 133,200 689.49 27 14,167Investment rate (It/Kt−1) 0.45 1.07 0.15 -0.06 1.06
Operating revenue ($1,000) 54,055 440,600 6,812 681 83,028Cash flow rate 2.12 7.08 0.39 -0.25 5.23Profitability 0.08 0.16 0.06 -0.03 0.23Sales Growth Rate 0.06 0.30 0.03 -0.26 0.41
Country-level variables:CIT rate (%) 27.34 5.79 28.00 19.00 33.33Tax differential (in absolute %) 4.79 6.22 1.67 0 14.50Cost of Capital 0.07 0.01 0.07 0.06 0.08Population (million) 35.01 25.98 38.14 5.40 63.38Unemployment rate (%) 9.34 4.88 8.10 5.33 16.18Exchange rate (rel to USD) 29.21 154.93 0.75 0.68 7.65GDP per capita (constant USD) 40,579 20,855 42,249 12,977 60,944GDP growth rate (%) 1.02 2.92 1.26 -2.94 4.18
Notes: this table provides the summary statistics of the key variables in the main estimationsample for regression analysis.
34

Table 3. Test of Common Trends between Treated and Control Groups
Year β Std. Error
Pre TPR Year 5 0.147 0.199Pre TPR Year 4 0.191 0.142Pre TPR Year 3 0.145 0.129Pre TPR Year 2 -0.044 0.034Pre TPR Year 1 0.008 0.026Post TPR Year 1 -0.049** 0.023Post TPR Year 2 0.001 0.015Post TPR Year 3 -0.036*** 0.013Post TPR Year 4 and more -0.015** 0.006Joint test with H0 that all pre-reform βl coefficients are equal to each other:p−value = 0.228
Notes: this table presents regression results of a common trend test between treated andcontrol groups in the pre-TPR years. We estimate the equation: Investmentikt = ai +dt +
∑−1l=−5 βlMNCi × TPRkt × PreTPRl +
∑PostTPRn
βnMNCi × TPRkt × PostTPRn +βxxikt + βzzkt + εikt, where PreTPRl is a dummy variable that takes the value of 1 for thelth year before the introduction of the TPR, and zero otherwise, and PostTPRn is a dummyvariable that takes the value of 1 for the nth year post the introduction of the TPR, andzero otherwise. We normalize β0 = 0 in the year of TPR introduction. In this estimation,the null hypothesis that there is no difference in pre-reform trends is equivalent to the nullhypothesis that all pre-reform βl coefficients are equal to each other. The last row reportsthe p−value for this joint test.
35
Tab
le4.
Inve
stm
ent
Res
pon
ses
toT
PR
:B
asel
ine
Res
ult
s
Dep
enden
tva
riab
le:
Inve
stm
ent
per
$fixed
asse
t(1
)(2
)(3
)(4
)(5
)(6
)(7
)
MNCi×TPRkt
-0.0
49**
*-0
.041
***
-0.0
24**
*-0
.025
***
-0.0
25**
*-0
.041
***
(0.0
07)
(0.0
07)
(0.0
07)
(0.0
07)
(0.0
07)
(0.0
12)
MNCi×tprisk
kt
-0.0
72**
*(0
.025
)log(Sales t
−1)
-0.1
65**
*-0
.167
***
-0.1
59**
*-0
.160
***
-0.1
60**
*-0
.161
***
-0.1
78**
*(0
.007
)(0
.007
)(0
.007
)(0
.007
)(0
.007
)(0
.007
)(0
.010
)C
ash
flow
per
$fixed
asse
t0.
038*
**0.
038*
**0.
038*
**0.
038*
**0.
038*
**0.
037*
**0.
041*
**(0
.001
)(0
.001
)(0
.001
)(0
.001
)(0
.001
)(0
.001
)(0
.001
)Profitabilityt−
10.
095*
**0.
088*
**0.
081*
**0.
081*
**0.
081*
**0.
083*
**0.
087*
**(0
.018
)(0
.018
)(0
.018
)(0
.018
)(0
.018
)(0
.020
)(0
.027
)Salesgrowthratet−
10.
043*
**0.
041*
**0.
039*
**0.
039*
**0.
039*
**0.
040*
**0.
021*
*(0
.006
)(0
.006
)(0
.006
)(0
.007
)(0
.007
)(0
.007
)(0
.009
)
Fir
mF
EY
YY
YY
YY
Yea
rF
EY
YN
NN
NN
Cou
ntr
y-Y
ear
FE
NN
YY
YY
YIn
dust
ry-Y
ear
FE
NN
NY
YY
YC
ountr
y-I
ndust
ryF
EN
NN
NY
YY
Hom
eC
ountr
y-I
ndust
ryF
EN
NN
NN
YY
R2
0.27
40.
275
0.27
70.
278
0.27
80.
277
0.31
4N
486,
756
486,
756
486,
754
486,
754
486,
754
439,
507
289,
310
Notes:
Th
ista
ble
rep
ort
sd
iffer
ence
-in
-diff
eren
cees
tim
ates
ofth
eeff
ect
ofth
etr
ansf
erp
rici
ng
regu
lati
onon
inve
stm
ent
by
mu
ltin
atio
nal
affi
liate
s.A
llco
lum
ns
dis
pla
yth
eD
Dco
effici
ent
onth
eMNCi×TPRkt
vari
able
,fr
oma
regr
essi
onof
inve
stm
ent
onth
isin
tera
ctio
n,
affili
ate
fixed
effec
ts,
year
fixed
effec
tsan
dadd
itio
nal
contr
ols.
Inve
stm
ent
isgr
oss
inve
stm
ent
scal
edby
book
valu
eof
fixed
cap
ital
asse
tin
(en
dof)
pre
vio
us
year
.A
ffili
ate
-Lev
elco
ntr
ols
incl
ud
ela
gged
turn
over
,la
gged
turn
over
grow
thra
te,
cash
flow
scal
edby
lagg
edas
set,
and
lagge
dp
rofi
tm
arg
in.
All
firm
-lev
elra
tio
vari
able
sar
ew
inso
rize
dat
top
and
bot
tom
1p
erce
nti
leto
rem
ove
the
infl
uen
ceof
outl
iers
.A
dd
itio
nal
cou
ntr
y-l
evel
contr
ols
inC
olu
mn
(2)
incl
ud
est
atu
tory
corp
orat
eta
xra
te,
GD
Pp
erca
pit
a,p
opu
lati
onsi
ze,
unem
plo
ym
ent
rate
,G
DP
gro
wth
rate
,an
dex
chan
ge
rate
inth
eh
ost
cou
ntr
y.H
eter
oske
das
tici
ty-r
obu
stst
and
ard
erro
rsar
ecl
ust
ered
atfi
rmle
vel.
***,
**,
*d
enote
ssi
gn
ifica
nce
atth
e1%
,5%
an
d10
%le
vel
s,re
spec
tive
ly.
36

Tab
le5.
Inve
stm
ent
Res
pon
ses
toT
PR
:R
obust
nes
s
Dep
end
ent
vari
able
:In
vest
men
tp
er$
fixed
asse
t,P
99th
P97.5th
P99th
Sam
ple
Ch
ara
cter
isti
c:ex
cl.
wor
ldw
ide
std
err.
clsu
teri
ng
mat
ched
par
ent
cou
ntr
yby
hos
tco
untr
ysa
mp
le(1
)(2
)(3
)(4
)
MNCi×TPRkt
-0.0
41**
*-0
.041
***
-0.0
18**
*-0
.036
***
(0.0
12)
(0.0
10)
(0.0
06)
(0.0
13)
log(Sales t
−1)
-0.1
62**
*-0
.161
***
-0.0
92**
*-0
.188
***
(0.0
07)
(0.0
25)
(0.0
03)
(0.0
09)
Cas
hfl
owp
er$
fixed
asse
t0.
037*
**0.
037*
**0.
018*
**0.
035*
**(0
.001
)(0
.002
)(0
.000
)(0
.001
)Profitabilityt−
10.
083*
**0.
083*
0.07
8***
0.10
9***
(0.0
20)
(0.0
42)
(0.0
09)
(0.0
26)
Salesgrowthratet−
10.
039*
**0.
040*
**0.
024*
**0.
047*
**(0
.007
)(0
.006
)(0
.003
)(0
.008
)
Fir
mF
EY
YY
YY
ear
FE
YY
YY
Cou
ntr
y-Y
ear
FE
YY
YY
Ind
ust
ry-Y
ear
FE
YY
YY
Cou
ntr
y-I
nd
ust
ryF
EY
YY
YH
ome
Cou
ntr
y-I
ndu
stry
FE
YY
YY
R2
0.28
0.28
0.32
0.28
2N
438,
035
439,
507
439,
507
308,
152
Not
es:
this
table
rep
orts
diff
eren
ce-i
n-d
iffer
ence
esti
mat
esof
the
effec
tof
the
tran
sfer
pri
cing
regu
lati
onon
inve
stm
ent
by
mult
inat
ional
affiliat
es.
All
colu
mns
dis
pla
yth
eD
Dco
effici
ent
onth
eMNCi×TPRkt
vari
able
,fr
oma
regr
essi
onof
inve
stm
ent
onth
isin
tera
ctio
n,
affiliat
efixed
effec
ts,
year
fixed
effec
tsan
dad
dit
ional
contr
ols.
The
dep
enden
tva
riab
leis
gros
sin
vest
men
tsc
aled
by
book
valu
eof
fixed
capit
alas
set
in(e
nd
of)
pre
vio
us
year
.A
ffiliat
e-L
evel
contr
ols
incl
ude
lagg
edtu
rnov
er,
lagg
edtu
rnov
ergr
owth
rate
,ca
shflow
scal
edby
lagg
edas
set,
and
lagg
edpro
fit
mar
gin.
All
other
vari
able
sar
eas
pre
vio
usl
ydefi
ned
.H
eter
oske
das
tici
ty-r
obust
stan
dar
der
rors
are
clust
ered
atfirm
leve
l.**
*,**
,*
den
otes
sign
ifica
nce
atth
e1%
,5%
and
10%
leve
ls,
resp
ecti
vely
.
37

Tab
le6.
Het
erog
eneo
us
Res
pon
ses
Fir
m/C
ountr
yC
hara
cter
isti
c:In
vest
men
tR
esp
onse
Mar
gin
Tax
Sh
are
ofH
ost
Cou
ntr
ies
wit
hI>
0logI
Diff
eren
tial
Inta
ngi
ble
Ass
ets
No
TC
RT
CR
Dep
tV
ar:
Inve
stm
ent
per
$fi
xed
ass
et(1
)(2
)(3
)(4
)(5
)(6
)
MNCi×TPRkt×Quartile T
axDiff,1
-0.0
22(0
.021
)MNCi×TPRkt×Quartile T
axDiff,2
-0.0
52**
*(0
.015
)MNCi×TPRkt×Quartile T
axDiff,3
-0.0
15*
(0.0
09)
MNCi×TPRkt×Quartile T
axDiff,4
-0.0
15*
(0.0
09)
MNCi×TPRkt
0.00
2-0
.037
**-0
.032
***
-0.0
13-0
.036
***
(0.0
04)
(0.0
16)
(0.0
08)
(0.0
11)
(0.0
10)
MNCi×TPRkt×IntangSharei
0.00
2***
(0.0
00)
log(Sales t
−1)
-0.0
55**
*0.
164*
**-0
.160
***
-0.1
60**
*-0
.134
***
-0.2
07**
*(0
.002
)(0
.011
)(0
.007
)(0
.007
)(0
.008
)(0
.011
)C
ash
flow
per
$fi
xed
asse
t0.
005*
**0.
005*
**0.
038*
**0.
038*
**0.
037*
**0.
039*
**(0
.000
)(0
.001
)(0
.001
)(0
.001
)(0
.001
)(0
.001
)Profitabilityt−
10.
104*
**0.
159*
**0.
081*
**0.
082*
**0.
012
0.21
2***
(0.0
07)
(0.0
31)
(0.0
18)
(0.0
18)
(0.0
22)
(0.0
33)
Salesgrowthratet−
1-0
.020
***
0.04
0***
0.03
9***
0.03
9***
0.04
7***
0.02
9***
(0.0
03)
(0.0
10)
(0.0
07)
(0.0
07)
(0.0
09)
(0.0
10)
Fir
mF
EY
YY
YY
YC
ountr
y-Y
ear
FE
YY
YY
YY
Ind
ust
ry-Y
ear
FE
YY
YY
YY
Cou
ntr
y-I
nd
ust
ryF
EY
YY
YY
YR
20.
354
0.82
70.
278
0.27
80.
278
0.27
7N
4395
0733
7110
486,
754
486,
754
251,
430
235,
324
Not
es:
This
table
pre
sents
regr
essi
onre
sult
son
the
het
erog
eneo
us
effec
tof
TP
Ron
inve
stm
ent.
The
dep
enden
tva
riab
lein
Col
um
n(1
)is
adum
my
indic
ator
that
take
sth
eva
lue
of1
for
pos
itiv
ein
vest
men
t,an
d0
other
wis
e.T
he
dep
enden
tva
riab
lein
Col
um
n(2
)is
the
leve
lof
inve
stm
ent
inlo
gari
thm
.C
olum
n(3
)re
por
tsth
eeff
ect
ofT
PR
acro
ssth
eta
xdiff
eren
tial
quar
tile
s.T
he
dum
my
vari
ableQuartile T
axDiff,j
take
sth
eva
lue
of1
ifth
eab
solu
tediff
eren
ceb
etw
een
the
hom
ean
dpar
ent
countr
yta
xra
telies
inth
ejth
quar
tile
,an
dze
root
her
wis
e.C
olum
n(4
)re
por
tsth
eeff
ect
ofT
PR
acro
ssva
ryin
gsh
ares
ofin
tangi
ble
asse
ts.
The
inta
ngi
ble
asse
tsh
are
vari
able
isca
lcula
ted
for
each
firm
the
aver
age
inta
ngi
ble
fixed
asse
tsre
lati
veto
its
tota
las
sets
over
the
sam
ple
per
iod.
Col
um
ns
(5)
and
(6)
rep
ort
the
effec
tof
TP
Rin
countr
ies
wit
hou
tan
dw
ith
thin
-cap
ital
izat
ion
rule
s,re
spec
tive
ly.
***,
**,
*den
otes
sign
ifica
nce
at1%
,5%
,an
d10
%le
vel,
resp
ecti
vely
.
38

Tab
le7.
Est
imat
edE
ffec
tsof
TP
Rs
onth
eT
axE
last
icit
yof
FD
I
Dep
enden
tva
riab
le:
Inve
stm
ent
per
$fixed
asse
tlo
g(F
ixed
Tan
gible
Ass
ets)
(1)
(2)
(3)
(4)
CITkt
-0.8
34**
*-1
.023
***
(0.1
98)
(0.1
41)
CITkt×TPRkt
-0.3
56**
*-0
.238
***
(0.0
73)
(0.0
60)
COCkt
-0.4
62-8
.594
***
(1.4
12)
(1.2
11)
COCkt×TPRkt
-1.7
36**
*-1
.260
***
(0.4
25)
(0.3
06)
Sal
es(i
nlo
gs)
-0.1
98**
*-0
.196
***
0.14
1***
0.13
8***
(0.0
09)
(0.0
10)
(0.0
08)
(0.0
08)
Num
ber
ofw
orke
rs(i
nlo
gs)
0.53
2***
0.53
9***
(0.0
12)
(0.0
13)
Cas
hflow
per
$fixed
asse
t0.
032*
**0.
032*
**(0
.001
)(0
.001
)Profitabilityt−
10.
135*
**0.
134*
**(0
.028
)(0
.028
)Salesgrowthratet−
10.
051*
**0.
051*
**(0
.009
)(0
.009
)
Addit
ional
Hos
tC
ountr
yC
ontr
ols
YY
YY
Fir
mF
EY
YY
YIn
dust
ry-Y
ear
FE
YY
YY
Cou
ntr
y-I
ndust
ryF
EY
YY
YR
20.
284
0.28
50.
958
0.95
8N
248,
008
243,
709
252,
295
247,
586
Not
es:
This
table
rep
orts
the
effec
tof
taxes
,in
cludin
gC
ITra
tean
dth
eco
stof
capit
al,
onm
ult
inat
ional
inve
stm
ent
wit
han
dw
ithou
tT
PR
.A
llco
lum
ns
dis
pla
yth
ees
tim
ated
coeffi
cien
ton
the
tax
vari
able
,fr
oma
regr
essi
onof
inve
stm
ent
onth
eta
xva
riab
le,
firm
fixed
effec
ts,
year
fixed
effec
tsan
dad
dit
ional
contr
ols.
Inve
stm
ent
isgr
oss
inve
stm
ent
scal
edby
book
valu
eof
fixed
capit
alas
set
in(e
nd
of)
pre
vio
us
year
inC
olum
ns
(1)-
(2),
and
loga
rith
mof
tangi
ble
fixed
asse
tin
Col
um
ns
(3)-
(4).
Affi
liat
e-L
evel
contr
ols
incl
ude
lagg
edtu
rnov
er,
lagg
edtu
rnov
ergr
owth
rate
,ca
shflow
scal
edby
lagg
edas
set,
and
lagg
edpro
fit
mar
gin
inC
olum
ns
(1)-
(2),
and
loga
rith
ms
oftu
rnov
eran
dnum
ber
ofem
plo
yees
inC
olum
ns
(3)-
(4).
All
firm
-lev
elra
tio
vari
able
sar
ew
inso
rize
dat
top
and
bot
tom
1p
erce
nti
leto
rem
ove
the
influen
ceof
outl
iers
.H
ost
countr
y-l
evel
contr
ols
incl
ude
GD
Pp
erca
pit
aan
dG
DP
grow
thra
te.
Het
eros
kedas
tici
ty-r
obust
stan
dar
der
rors
are
clust
ered
atfirm
leve
l.**
*,**
,*
den
otes
sign
ifica
nce
atth
e1%
,5%
and
10%
leve
ls,
resp
ecti
vely
.
39

Table 8. Total Investment Responses to Transfer-Pricing Regulations
Dependent variable:Investment per $ fixed asset (1) (2) (3) (4) (5)
MNCi × TPRkt 0.056*** 0.049** 0.029 0.031(0.019) (0.019) (0.024) (0.024)
MNCi × TPRkt × CITkt 0.125(0.095)
log(Salest−1) -0.070*** -0.085*** -0.065*** -0.065*** -0.083***(0.019) (0.021) (0.020) (0.020) (0.021)
Cash flow per $ fixed asset -0.006 0.010 -0.008 -0.009 0.009(0.015) (0.016) (0.015) (0.015) (0.017)
Profitabilityt−1 0.002 0.005 0.001 0.002 0.006(0.006) (0.006) (0.006) (0.006) (0.006)
Sales growth ratet−1 -0.012 -0.017 -0.010 -0.010 -0.013(0.021) (0.021) (0.022) (0.022) (0.023)
Firm FE Y Y Y Y YYear FE Y Y N N NCountry-Year FE N N Y Y YIndustry-Year FE N N N Y YCountry-Industry FE N N N Y YR2 0.211 0.220 0.240 0.246 0.255N 12,899 12,023 12,748 12,748 11,991
Notes: This table reports difference-in-difference estimates of the effect of the transfer pricingregulation on worldwide investment by MNC group. All columns display the DD coefficienton the MNCi × TPRkt variable, from a regression of investment on this interaction, MNCgroup fixed effects, year fixed effects and additional controls. Investment is gross investmentscaled by book value of fixed capital asset in (end of) previous year. Affiliate-Level controlsinclude lagged turnover, lagged turnover growth rate, cash flow scaled by lagged asset, andlagged profit margin. All firm-level ratio variables are winsorized at top and bottom 1percentile to remove the influence of outliers. Additional country-level controls in Column(2) include statutory corporate tax rate, GDP per capita, population size, unemploymentrate, GDP growth rate, and exchange rate in the parent country. Heteroskedasticity-robuststandard errors are clustered at firm level. ***, **, * denotes significance at the 1%, 5% and10% levels, respectively.
40

Oxford University Centre for Business TaxationWorking Paper series recent papers
WP18/02 Rita de la Feria Tax fraud and the rule of law
WP18/01 Eddy Hiu Fung Tam Behavioural response to time notches in transaction tax:Evidence from stamp duty in Hong Kong and Singapore
WP17/19 Michael P. Devereux, Giorgia Maffini and Jing Xing Corporate tax incentives &capital structure: New evidence from UK firm-level tax returns
WP17/18 Sarah Clifford Taxing Multinationals beyond borders: financial and locationalresponses to CFC rules
WP17/17 Dominik von Hagen and Axel Prettl Controlled foreign corporation rules and cross-border M&A activity
WP17/16 Marie Lamensch Destination based taxation of corporate profits - preliminaryfindings regarding tax collection in cross-border situations
WP17/15 Li Liu Tim Schmidt-Eisenlohr and Dongxian Guo International transfer pricing and taxavoidance: Evidence from linked trade-tax statistics in the UK.
WP17/14 Katarzyna Habu How much tax do companies pay in the UK?
WP17/13 Katarzyna Habu How aggressive are foreign multinational companies in reducing
their corporation tax liability?
WP17/12 Edward D. Kleinbard The right tax at the right time
WP17/11 Aaron Flaaen The role of transfer prices in profit-shifting by U.S. multinational
firms: Evidence from the 2004 Homeland Investment Act
WP17/10 Ruud de Mooij and Li Liu At a cost: The real effect of transfer pricing regulations
on multinational investments
WP17/09 Wei Cui Taxation without information: The institutional foundations of modern tax
collection
WP17/08 John Brooks The definitions of income
WP17/07 Michael P. Devereux and John Vella Implications of Digitalization for International
Corporation Tax Reform
WP17/06 Richard Collier and Michael P. Devereux The Destination–Based Cash Flow Tax and
the Double Tax Treaties

WP17/05 Li Liu Where does multinational investment go with Territorial Taxation
WP17/04 Wiji Arulampalam, Michael P Devereux and Federica Liberini Taxes and Locationof Targets
WP17/03 Johannes Becker and Joachim Englisch A European Perspective on the US plans fora Destination based cash flow tax
WP17/02 Andreas Haufler, Mohammed Mardan and Dirk Schindler Double taxdiscrimination to attract FDI and fight profit shifting: The role of CFC rules
WP17/01 Alan Auerbach, Michael P. Devereux, Michael Keen and John Vella Destination-based cash flow taxation
WP16/14 Anzhela Cédelle The EU Anti-Tax Avoidance Directive: A UK Perspective
WP16/13 Michael Devereux Measuring corporation tax uncertainty across countries:Evidence from a cross-country survey
WP16/12 Andreas Haufler and Ulf Maier Regulatory competition in capital standards withselection effects among banks
WP16/11 Katarzyna Habu Are financing constraints binding for investment? Evidence fromnatural experiment
WP 16/10 Li Liu and Ben Lockwood VAT notches, voluntary registration and bunching:Theory and UK evidence
WP 16/09 Harry Grubert and Roseanne Altshuler Shifting the burden of taxation from thecorporate to the personal level and getting the corporate tax rate down to 15 percent
WP 16/08 Margaret K McKeehan and George R Zodrow Balancing act: weighing the factorsaffecting the taxation of capital income in a small open economy
WP 16/07 Michael P Devereux and Li Liu Stimulating investment through incorporation
WP16/05 Tobias Böhm, Nadine Riedel and Martin Simmler Large and influential: firm sizeand governments’ corporate tax rate choice?
WP16/04 Dhammika Dharmapala The economics of corporate and business tax reform
WP 16/03 Rita de la Feria EU VAT principles as interpretative aids to EU VAT rules: theinherent paradox
WP 16/02 Irem Guceri Will the real R&D employees please stand up? Effects of tax breaks onfirm level outcomes

WP 16/01 Giorgia Maffini, Jing Xing and Michael P Devereux The impact of investmentincentives: evidence from UK corporation tax returns
WP 15/33 Anzhela Cédelle Enhanced co-operation: a way forward for tax harmonisation inthe EU?
WP 15/32 James Mahon and Eric Zwick Do experts help firms optimise?
WP 15/31 Robin Boadway, Motohiro Sato and Jean-François Tremblay Cash-flow businesstaxation revisited: bankruptcy, risk aversion and asymmetric information
WP 15/30 Martin Simmler Do multinational firms invest more? On the impact of internaldebt financing and transfer pricing on capital accumulation
WP 15/29 Daniel Shaviro The crossroads versus the seesaw: getting a 'fix' on recentinternational tax policy developments
WP 15/28 Zhonglan Dai, Douglas A Shackelford, Yue (Layla) Ying and Harold H Zhang Docompanies invest more after shareholder tax cuts?
WP 15/27 Martin Ruf and Julia Schmider Who bears the cost of taxing the rich? Anempirical study on CEO pay
WP 15/26 Eric Orhn The corporate investment response to the domestic productionactivities deduction
WP 15/25 Li Liu International taxation and MNE investment: evidence from the UK changeto territoriality
WP 15/24 Edward D Kleinbard Reimagining capital income taxation
WP 15/23 James R Hines Jr, Niklas Potrafke, Marina Riem and Christoph Schinke Inter vivostransfers of ownership in family firms
WP 15/22 Céline Azémar and Dhammika Dharmapala Tax sparing agreements, territorial taxreforms, and foreign direct investment
WP 15/21 Wei Cui A critical review of proposals for destination-based cash-flow corporatetaxation as an international tax reform option
WP 15/20 Andrew Bird and Stephen A Karolyi Governance and taxes: evidence fromregression discontinuity
WP 15/19 Reuven Avi-Yonah Reinventing the wheel: what we can learn from the Tax ReformAct of 1986

WP 15/18 Annette Alstadsæter, Salvador Barrios, Gaetan Nicodeme, Agnieszka MariaSkonieczna and Antonio Vezzani Patent boxes design, patents, location and local R&D
WP 15/17 Laurent Bach Do better entrepreneurs avoid more taxes?
WP 15/16 Nadja Dwenger, Frank M Fossen and Martin Simmler From financial to realeconomic crisis: evidence from individual firm–bank relationships in Germany
WP 15/15 Giorgia Maffini and John Vella Evidence-based policy-making? The Commission'sproposal for an FTT
WP 15/14 Clemens Fuest and Jing Xing How can a country 'graduate' from procyclical fiscalpolicy? Evidence from China?
WP 15/13 Richard Collier and Giorgia Maffini The UK international tax agenda for businessand the impact of the OECD BEPS project
WP 15/12 Irem Guceri and Li Liu Effectiveness of fiscal incentives for R&D: quasi-experimental evidence
WP 15/11 Irem Guceri Tax incentives and R&D: an evaluation of the 2002 UK reform usingmicro data
WP 15/10 Rita de la Feria and Parintira Tanawong Surcharges and penalties in UK tax law
WP 15/09 Ernesto Crivelli, Ruud de Mooij, Michael Keen Base erosion, profit-shifting anddeveloping countries
WP 15/08 Judith Freedman Managing tax complexity: the institutional framework for taxpolicy-making and oversight
WP 15/07 Michael P Devereux, Giorgia Maffini and Jing Xing Corporate tax incentives andcapital structure: empirical evidence from UK tax returns
WP 15/06 Li Liu and Ben Lockwood VAT notches
WP 15/05 Clemens Fuest and Li Liu Does ownership affect the impact of taxes on firmbehaviour? Evidence from China.
WP 15/04 Michael P Devereux, Clemens Fuest and Ben Lockwood The taxation of foreignprofits: a unified view
WP 15/03 Jitao Tang and Rosanne Altshuler The spillover effects of outward foreign directinvestment on home countries: evidence from the United States
WP 15/02 Juan Carlos Suarez Serrato and Owen Zidar Who benefits from state corporate taxcuts? A local labour markets approach with heterogeneous firms

WP 15/01 Ronald B Davies, Julien Martin, Mathieu Parenti and Farid Toubal Knocking on TaxHaven’s Door: multinational firms and transfer pricing