at a glance - bureau of infrastructure, transport and … · · 2016-09-20at a glance this fourth...
TRANSCRIPT

4
Freightline 4 – Australian coal freight transport
1
At a glance This fourth issue of the BITRE’s Freightline series focusses on the transport supply chains for coal in Australia in 2014–15.1
• Coal is Australia’s second largest export commodity, accounting for 14.8 per cent of exports by value ($37.4 billion) and approximately 30 per cent by mass (390.6 million tonnes) in 2015. Australia’s coal exports are almost entirely sourced from Queensland and New South Wales, with a small amount from Western Australia.
• At the end of 2015 there were 98 operating coal mines in Australia, down from 114 in 2011–12, operated by 33 companies which produced an estimated 516 million tonnes of coal nation-wide, an increase of around 85 million tonnes since 2011–12. The largest companies, by production volume (mass), were Glencore, BHP Billiton (including its BHP Billiton Mitsubishi Alliance and BHP Billiton Mitsui Coal) and Rio Tinto. Together, these three companies’ mines2 produced 236 million tonnes of coal, or 45.7 per cent of total Australian coal production in 2014–15.
• Approximately 124.1 million tonnes of coal (black and brown coal) was used domestically in 2014–15, with 121 million tonnes used to supply energy and/or coking inputs to 25 power stations, 5 integrated cement plants and 2 domestic steel manufacturers. It is estimated that the majority of coal for domestic use was transported by conveyor (101.4 million tonnes, the majority brown coal in Victoria), followed by rail (21.4 million tonnes) and by road (2.2 million tonnes).
• The total inland coal transport task is estimated to be approximately 88.9 billion tonne kilometres (tkm) in 2014–15. Rail accounted for 85.2 billion tkm (95.9%), domestic shipping 2.3 billion tkm (2.5%), road 1.1 billion tkm (1.2%) and conveyor, which mostly transport coal directly from mines to nearby coal-fired power stations, 0.3 billion tkm (0.4%).
• Coal was exported from seven ports across Australia in 2014–15. The top three export ports by volume were Newcastle, Hay Point and Gladstone. Together these three ports accounted for 87.5 per cent (342 million tonnes) of coal exports in 2014–15. Coal exported through these ports was supplied via the Hunter Valley, Goonyella Rail and Blackwater Rail Systems, respectively.
• Total capacity and capacity utilisation rate for the larger coal export supply chains in 2014–15 were: o Hunter Valley Rail System – Port of Newcastle:
Rail capacity and utilisation: 194 million tonnes per annum (Mt/a) and 81 per cent usage; Port capacity and utilisation: 211 million tonnes per annum and 75 per cent usage
o Goonyella Rail System – Port of Hay Point: Rail capacity and utilisation: 140 million tonnes per annum and 82 per cent usage;
1. This issue is based on 2014–15 financial year information where available, but in parts are based on calendar year 2014 or 2015 data,
whichever is most recently available publicly. 2. Glencore, BHP Billiton and Rio Tinto operate several mines in joint venture with other partners. Based on ownership share, these companies’
share of total coal production was 208 million tonnes (40 per cent) in 2014–15.
4
2
Port capacity and utilisation: 140 million tonnes per annum and 82 per cent usage o Blackwater Rail System – Port of Gladstone:
Rail capacity and utilisation:120 million tonnes per annum and 57 per cent usage; Port capacity and utilisation: 100 million tonnes per annum and 68 per cent usage
• Planning and development of infrastructure to increase the capacity of several coal supply chains is proceeding. For example, The Port of Gladstone recently completed building a new coal terminal, Wiggins Island Coal Export, which has increased port capacity by 27 million tonnes per annum to over 100 million tonnes per annum. Aurizon, which operates coal rail systems in Queensland, has in place options to increase its coal rail capacity by between 57 and 92 per cent across the Goonyella and Blackwater Rail Systems between 2015 and 2024, generally through infrastructure expansion and longer trains.
Introduction The Freightline publication series aims to provide enhanced up-to-date analysis and estimates of freight movements for major Australian commodities, filling a significant and widely-acknowledged gap in transport data.
This issue focuses on where and how Australia’s coal production is transported from mines to ports for export, as well as from mines to major domestic users, which include coal-fired power stations, steel manufacturers and cement plants across the country. The issue includes estimates of interregional coal freight movements for 2014–15, derived by modelling movements of thermal and metallurgical coal from mines to ports for export, and from mines to major domestic users from publicly-available, location-specific production and usage information.
A note on the estimates There is currently no single authoritative, nation-wide source of data on coal production and domestic coal usage in Australia at the mine/processing facility level. The estimates presented here have been derived from a wide range of publicly-available sources, which include:
• Mining company annual reports and operating statistics;
• State and Territory government mining industry statistics;
• Industry organisations (e.g. Mineral Councils of Australia);
• Commonwealth Government agencies—in particular, the Department of Industry, Innovation and Science’s Office of the Chief Economist (OCE; formerly the Bureau of Resource and Energy Economics (BREE)), and Geoscience Australia (GA);
• US Energy Information Administration;
• Ports Australia, and individual port authority annual reports; and
• Domestic coal-fired power station, steel manufacturer, and cement plant operator annual reports.
Estimates presented here are on an Australian financial year basis unless otherwise stated. Differences in reporting periods used by different companies—e.g. financial versus calendar year—and unspecified differences in how production volumes are reported across companies may account for any differences between the aggregate estimates presented here and official Australian Government production and export statistics (DIIS 2016a and earlier issues). Mine sites are based on Geoscience Australia’s (2016) Mines Atlas, and expanded to separately enumerate mines that may be jointly reported as part of the same cluster or complex, using company reports. For example, Anglo American’s Capcoal Complex includes the Central, Southern, German Creek, Lake Lindsay, Bundoora, Grasstree, Aquila, and Oak Park mines. Only facilities that were operational through the greater part of 2014–15 are included. Mines, power stations, and cement works which ceased production prior to November 2014 were excluded. Examples include Angus Place, Integra, Isaac Plains, Newstan, and Pine Dale mines.
4
3
Australian coal production, exports and use
Production and reserves Based on various government agency reports and mining company annual reports, BITRE estimates that Australia produced approximately 516 million tonnes of useable coal in 2014–15, comprising approximately 258 million tonnes black thermal coal, 190 million tonnes black metallurgical coal and 68 million tonnes of brown coal, produced only in Victoria and South Australia. This compares with 432 million tonnes of useable coal production in 2011–12, comprising approximately 214 million tonnes black thermal coal, 147 million tonnes black metallurgical coal and 69 million tonnes of brown coal.
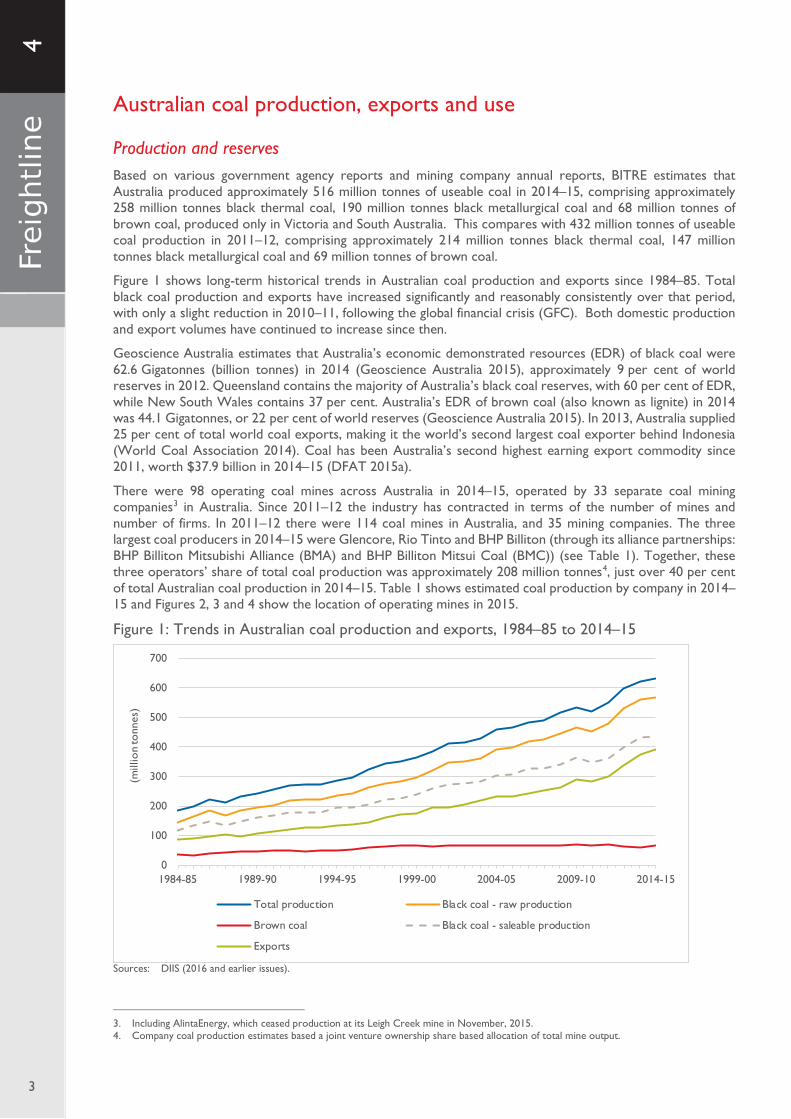
Figure 1 shows long-term historical trends in Australian coal production and exports since 1984–85. Total black coal production and exports have increased significantly and reasonably consistently over that period, with only a slight reduction in 2010–11, following the global financial crisis (GFC). Both domestic production and export volumes have continued to increase since then.
Geoscience Australia estimates that Australia’s economic demonstrated resources (EDR) of black coal were 62.6 Gigatonnes (billion tonnes) in 2014 (Geoscience Australia 2015), approximately 9 per cent of world reserves in 2012. Queensland contains the majority of Australia’s black coal reserves, with 60 per cent of EDR, while New South Wales contains 37 per cent. Australia’s EDR of brown coal (also known as lignite) in 2014 was 44.1 Gigatonnes, or 22 per cent of world reserves (Geoscience Australia 2015). In 2013, Australia supplied 25 per cent of total world coal exports, making it the world’s second largest coal exporter behind Indonesia (World Coal Association 2014). Coal has been Australia’s second highest earning export commodity since 2011, worth $37.9 billion in 2014–15 (DFAT 2015a).
There were 98 operating coal mines across Australia in 2014–15, operated by 33 separate coal mining companies3 in Australia. Since 2011–12 the industry has contracted in terms of the number of mines and number of firms. In 2011–12 there were 114 coal mines in Australia, and 35 mining companies. The three largest coal producers in 2014–15 were Glencore, Rio Tinto and BHP Billiton (through its alliance partnerships: BHP Billiton Mitsubishi Alliance (BMA) and BHP Billiton Mitsui Coal (BMC)) (see Table 1). Together, these three operators’ share of total coal production was approximately 208 million tonnes4, just over 40 per cent of total Australian coal production in 2014–15. Table 1 shows estimated coal production by company in 2014–15 and Figures 2, 3 and 4 show the location of operating mines in 2015.
Figure 1: Trends in Australian coal production and exports, 1984–85 to 2014–15
Sources: DIIS (2016 and earlier issues).
3. Including AlintaEnergy, which ceased production at its Leigh Creek mine in November, 2015. 4. Company coal production estimates based a joint venture ownership share based allocation of total mine output.
0
100
200
300
400
500
600
700
1984-85 1989-90 1994-95 1999-00 2004-05 2009-10 2014-15
(mill
ion
tonn
es)
Total production Black coal - raw production
Brown coal Black coal - saleable production
Exports

4
4
Table 1: Coal production by company in Australia, 2011–12 and 2014–15
Company Operating state(s)
Production
2011–12a 2014–15b (million tonnes)
AGL Victoria 30 30 Alcoa Victoria 1.1 1.1 AlintaEnergy South Australia 2.6 2.5 Anglo American Queensland and New South Wales 28.4 38.7 BHP Billiton New South Wales 24.2 19.3 BHP Billiton Mitsubishi Alliance Queensland 34.1 67.0 BHP Billiton Mitsui Coal Queensland 6.7 8.6 Bloomfield Group New South Wales 1.7 2.2 Boral New South Wales 0.2 .. Caledon Resources Queensland 0.5 0.6 Cement Australia Tasmania 0.4 0.2 Centennial Coal Co Ltd New South Wales 17.4 15.1 Coalpac New South Wales 0.7 .. Cockatoo Coal Queensland .. 0.8 CS Energy Queensland 2 2.7 Energy Australia Victoria and New South Wales 18.3 18 Engie (formerly GDF Suez) Victoria 18 16.5 Ensham Resources (now subsidiary of Idemitsu Resources Australia) Queensland 3.8 .. Glencore (formerly Glencore Xstrata) New South Wales and Queensland 77 95.3 Griffin Coal (subsidiary of Lanco Resources Australia) Western Australia 3.5 2.4 Idemitsu Resources Australia New South Wales 4.2 10.7 InterGen Queensland 2.9 3.5 Jellinbah Group Queensland 8.4 12.9 LDO Coal New South Wales 0.6 1.4 Linc Energy Queensland 2.5 .. New Hope Group Queensland 6.4 5.8 Peabody Energy Queensland and New South Wales 33.5 41.4 QCoal Group Queensland 3.5 4.2 Rio Tinto New South Wales and Queensland 43.7 45.7 Sojitz Coal Mining Pty Ltd Queensland 2.8 2.4 South32 (formerly BHP Billiton) New South Wales .. 8.1 Stanwell Queensland 4.6 3.4 Vale Australia Queensland and New South Wales 6 4.0 Wesfarmers Queensland 10.1 12.2 Whitehaven Coal New South Wales 3.2 19 Wollongong Coal (formerly Gujarata NRE) New South Wales 1.4 0.9
Yancoal Australia New South Wales, Queensland and Western Australia 27.8 19.6
Total 432 516
.. not applicable Note: Figures may not add to total due to rounding. a. Source: Alinta Energy (2013), Anglo American (2012), Xstrata Coal (2012), BHP Billiton (2012a, 2012b), Bloomfield Group (2012), Boral
(2013), Centennial Coal (2010), Centennial Coal (2012a, 2012b, 2012c, 2012d, 2012e, 2012f, 2012g, 2012h, 2012i, 2012j, 2012k), CoalPac (2014), Energy Australia (2012a, 2012b, 2013), GA (2012), Gujarat NRE (2012), Hansen Bailey (2012), Idemitsu Boggabri Coal (2012), LakeCoal (2012), Peabody Energy (2012), Peabody Energy (2013a, 2013b), Rio Tinto (2014a, 2014b, 2014c), Tarrawonga Coal (2011), Vale (2013), Whitehaven Coal (2012), Xstrata (2013), YanCoal (2012a, 2012b, 2012c, 2012d, 2012e) and BITRE estimates.
b. Source: ABC News 2014, AGL (2015a), Alinta Energy (2015), Alcoa (2016a, 2016b), Anglo American (2016), BHP Billiton (2015), Bloomfield Group (2015, 2016), Cement Australia 2016a, Centennial Coal (2015a, 2015b, 2015c, 2015d, 2015e, 2015f, 2015g), CIF (2016), Cockatoo Coal (2015a), DNRM (2016a), DNRM (2016b), Energy Australia (2016), Hazelwood Mine Fire Inquiry (2015), Idemitsu (2014, 2015a, 2015b, 2015c, 2016a, 2016b), Jellinbah Group (2016), LakeCoal (2015), Lanco (2015), New Hope Group (2015, 2016), Peabody Energy (2015, 2016), Rio Tinto (2016), South32 (2016), Vale (2014), Wesfarmers (2015), Yancoal (2016a, 2016b, 2016c, 2016d, 2016e), Yanzhou Coal Mining (2015), and BITRE estimates.

4
5
Figure 2: Distribution of Australian collieries and coal export ports5, 2014–15
Source: GA (2016) and Sources for Table 1 and Table 2.
Figure 3: Coal mines and coal export ports in New South Wales in 2014–15
Source: GA (2016) and Sources for Table 1 and Table 2.
5. Whyalla was a coal receiving port in 2014-15.

4
6
Figure 4: Coal mines and coal export ports in Queensland in 2014–15
Source: GA (2016) and Sources for Table 1 and Table 2.
Exports The majority of thermal and metallurgical coal produced in Australia was exported in 2014–15. Trade statistics from Australia’s coal export port authorities record 390.6 million tonnes of black coal shipped through Australia’s ports in 2014–15 (Port of Newcastle 2015; North Queensland Bulk Ports Corporation 2015a; 2015b; Gladstone Ports Corporation 2015a; Glen Humphries 2015; Port of Brisbane 2015). This included approximately 1 million tonnes of coking coal shipped domestically to Arrium’s Whyalla port from Port Kembla, the Port of Newcastle, and the Port of Gladstone (BITRE 2016).
Australia’s coal exports are mostly sourced from mines in Queensland and New South Wales, with a small amount from Western Australia. The majority of Queensland coal exports are metallurgical coal, approximately 73 per cent 2014–15, while thermal coal exports make up the remainder (DNRM 2016b). Conversely, 86 per cent of New South Wales exports were thermal coal (Department of Industry 2015a).
Coal was exported from seven ports6 across Australia in 2012–15; these are listed in Table 2. The top three ports, by volume, were Newcastle, Hay Point and Gladstone. Together these three ports accounted for about 87 per cent (342 million tonnes) of coal exports in 2014–15. Port Kembla, Abbot Point and Brisbane ports each accounted for between 7 and 29 million tonnes in 2014–15.
6. Bell Bay port authority in Tasmania also reported exporting small volumes of coal and coal-based products, but these have been excluded
from the analysis.
4
7
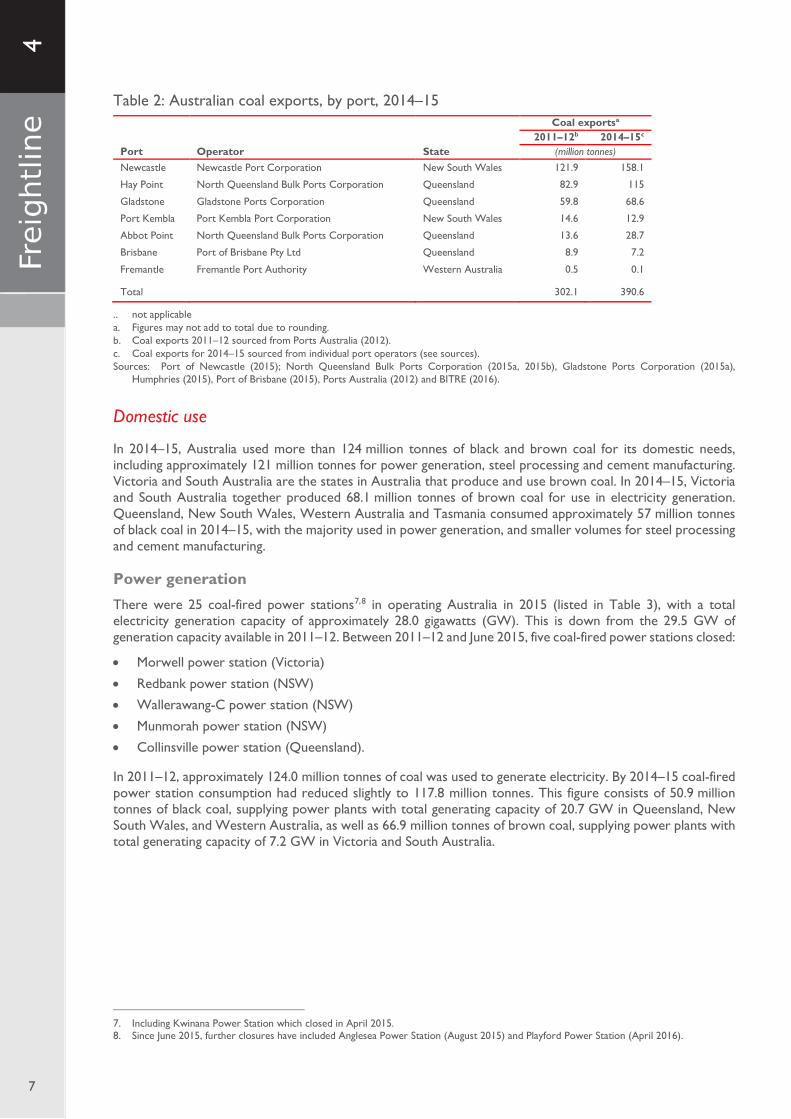
Table 2: Australian coal exports, by port, 2014–15
Port Operator State
Coal exportsa 2011–12b 2014–15c
(million tonnes) Newcastle Newcastle Port Corporation New South Wales 121.9 158.1
Hay Point North Queensland Bulk Ports Corporation Queensland 82.9 115
Gladstone Gladstone Ports Corporation Queensland 59.8 68.6
Port Kembla Port Kembla Port Corporation New South Wales 14.6 12.9
Abbot Point North Queensland Bulk Ports Corporation Queensland 13.6 28.7
Brisbane Port of Brisbane Pty Ltd Queensland 8.9 7.2
Fremantle Fremantle Port Authority Western Australia 0.5 0.1 Total 302.1 390.6
.. not applicable a. Figures may not add to total due to rounding. b. Coal exports 2011–12 sourced from Ports Australia (2012). c. Coal exports for 2014–15 sourced from individual port operators (see sources). Sources: Port of Newcastle (2015); North Queensland Bulk Ports Corporation (2015a, 2015b), Gladstone Ports Corporation (2015a),
Humphries (2015), Port of Brisbane (2015), Ports Australia (2012) and BITRE (2016).
Domestic use
In 2014–15, Australia used more than 124 million tonnes of black and brown coal for its domestic needs, including approximately 121 million tonnes for power generation, steel processing and cement manufacturing. Victoria and South Australia are the states in Australia that produce and use brown coal. In 2014–15, Victoria and South Australia together produced 68.1 million tonnes of brown coal for use in electricity generation. Queensland, New South Wales, Western Australia and Tasmania consumed approximately 57 million tonnes of black coal in 2014–15, with the majority used in power generation, and smaller volumes for steel processing and cement manufacturing.
Power generation There were 25 coal-fired power stations7,8 in operating Australia in 2015 (listed in Table 3), with a total electricity generation capacity of approximately 28.0 gigawatts (GW). This is down from the 29.5 GW of generation capacity available in 2011–12. Between 2011–12 and June 2015, five coal-fired power stations closed:
• Morwell power station (Victoria)
• Redbank power station (NSW)
• Wallerawang-C power station (NSW)
• Munmorah power station (NSW)
• Collinsville power station (Queensland).
In 2011–12, approximately 124.0 million tonnes of coal was used to generate electricity. By 2014–15 coal-fired power station consumption had reduced slightly to 117.8 million tonnes. This figure consists of 50.9 million tonnes of black coal, supplying power plants with total generating capacity of 20.7 GW in Queensland, New South Wales, and Western Australia, as well as 66.9 million tonnes of brown coal, supplying power plants with total generating capacity of 7.2 GW in Victoria and South Australia.
7. Including Kwinana Power Station which closed in April 2015. 8. Since June 2015, further closures have included Anglesea Power Station (August 2015) and Playford Power Station (April 2016).

4
8
Table 3: Coal-fired power generators in Australia, 2011–12 and 2014–15
Power Station State
Generating capacitya
Coal use
2014–15 2011–12b 2014–15c
(Megawatts) (million tonnes)
Bayswater Power Station New South Wales 2 640 7.5 7.8
Liddell Power Station New South Wales 2 000 4.3 3
Eraring Power Station New South Wales 2 880 5 5
Redbank Power Station New South Wales closed 0.6 ..
Mount Piper Power Station New South Wales 1 400 3.8 3
Vales Point B Power Station New South Wales 1 320 2.5 2.9
Wallerawang-C Power Station New South Wales closed 2.4 ..
Munmorah New South Wales closed 1.3 ..
Callide B Power Station Queensland 700 2.1 2.6
Callide C Power Station Queensland 900 2.7 3.4
Millmerran Power Station Queensland 852 3.6 3.6
Kogan Creek Power Station Queensland 744 2.1 2.6
Tarong Power Station Queensland 1 400 3.4 2.6
Tarong North Power Station Queensland 450 1.1 0.9
Gladstone Power Station Queensland 1 680 4 4
Stanwell Power Station Queensland 1 460 2.6 3.1
Collinsville Power Station Queensland closed 0.8 ..
Northern Power Station South Australia 546 1.7 1.7
Thomas Playford B Power Station South Australia 240 0.8 0.8
Anglesea Power Station Victoria 150 1.1 1.1
Loy Yang A Power Station Victoria 2 180 20.6 20.6
Loy Yang B Power Station Victoria 1 000 9.4 9.4
Hazelwood Power Station Victoria 1 600 18 15.3
Yallourn West Power Station Victoria 1 480 13.7 18
Energy Brix (Morwell) Power Station Victoria closed 2 ..
Muja Power Station Western Australia 1 028 3 2.5
Collie Power Station Western Australia 318 1.2 1.2
Bluewaters Coal Power Station Western Australia 434 1.5 1.5
Kwinana ABC Mixed Power Station Western Australia 451 0.2 0.2
Worsley Coal Cogen Power Station Western Australia 114 1 1 Total 27 967 124.0 117.8
.. not applicable Note: Figures may not add to total due to rounding. a. Source: AEMO (2016a, 2016b). b. Source: AGL (2013), Alcoa (2013), Alinta Energy (2013), Bligh and Jones (2011), CS Energy (2012), Department of Industry (2015b), Energy
Australia (2012b), EPA WA (2005), GDF Suez (2010, 2013), Macquarie Generation (2012), NRG Gladstone (2013), Origin Energy (2014), Premier Coal (2013), Lawson (2010), Stanwell (2012), Verve Energy (2008, 2012), and BITRE estimate.
c. Source: AGL (2014, 2015a, 2015b, 2016), Alcoa (2016a, 2016b), Alinta Energy (2015), CLP (2015), CS Energy (2014), CS Energy (2015), Delta Electricity (2011), Delta Electricity (2012), Energy Australia (2016), EPA WA (2005), GDF Suez (2016), NRG (2016), Origin Energy (2014), Power Technology (2016), Premier Coal (2016a, 2016b), Lawson (2010), Stanwell (2015), and BITRE estimates.
Steel production and processing There were two operating steel production plants in Australia in 2014–15: Port Kembla, operated by BlueScope Steel, and Whyalla, operated by Arrium (previously OneSteel) (Energetics 2012). In 2014–15, Port Kembla produced approximately 2.3 million tonnes of finished steel products and used approximately 1.66 million tonnes of coal supplied from coal mines in New South Wales (BlueScope Steel 2015a, 2015b). Whyalla produced approximately 1.07 million tonnes of steel in 2014–15, for which it used approximately 0.77 million tonnes of coal, transported via ship from Port Kembla, the Port of Newcastle, and the Port of Gladstone (Arrium 2015; BITRE 2016; BITRE Estimates). Both steelworks have reduced their output since 2011–12.

4
9
Table 4: Steel processors in Australia in 2011–12 and 2014–15
Steelworks Owner State
Steel production Coal use
2011–12 2014–15 2011–12 2014–15
(million tonnes) (million tonnes)
Port Kembla BlueScope Steel NSW 3.5 2.3 2.5 1.66
Whyalla Arrium SA 1.1 1.07 0.8 0.77 Total 4.6 3.37 3.3 2.43
Sources: Arrium (2012 and 2015), BlueScope (2012, 2013, 2015a and 2015b) and DMITRE (2013b).
Cement (clinker) manufacturers There were five integrated cement (clinker) manufacturing plants operating in 2015, down from eight in 2011–12, which together produced approximately 5.65 million tonnes of clinker in 2014–15 (CIF 2016). Inputs to production included approximately 0.96 million tonnes of coal in 2014–15.9
Table 5: Cement (clinker) manufacturers in Australia in 2011–12 and 2014–15
Cement works Owner State
Clinker production Coal use
2011–12 2014–15 2011–12 2014–15
(million tonnes) (million tonnes)
Berrima Boral NSW 1 1.1 0.22 0.22
Waurn Ponds Boral Vic. 0.5 .. 0.11 ..
Maldon Boral NSW 0.2 .. 0.04 ..
Railton Cement Australia Tas. 1 1.1 0.22 0.22
Gladstone Cement Australia Qld 1.5 1.7 0.32 0.33
Angaston Adelaide Brighton SA 0.3 0.3 0.06 0.07
Birkenhead Adelaide Brighton SA 1.3 1.4 0.11 0.12
Munster Adelaide Brighton WA 1.1 .. 0.24 .. Total 6.9 5.7 1.32 0.96
.. not applicable Sources: Adelaide Brighton (2012a, 2012b), Boral (2012, 2016), Cement Australia (2011, 2013), CIF (2011, 2016) and WCA (2013b).
9. The World Coal Association states that 200 kilograms of coal is needed to produce 1 tonne of cement, though Adelaide Brighton’s cement
plant in Birkenhead reported sourcing only 40 per cent of its energy from coal, i.e. less than 200 kg of coal per tonne of cement (Adelaide Brighton (2012a), Adelaide Brighton (2012b), WCA (2013b)).

4
10
Figure 5: Major Australian coal user locations, 2014–15
Sources: See sources for Table 3, Table 4, and Table 5.
Coal supply chains and transport infrastructure
Coal supply chains Australian coal mines are generally located well inland and in many cases involve a significant freight task to transport coal from mine to port and/or domestic facility.
In 2014–15, Australia exported more than 390 million tonnes of black coal, nearly all from Queensland and New South Wales—a small volume (0.1 million tonnes) was exported from Western Australia through the Port of Fremantle in 2014–15. Annual coal exports from Australian ports have increased by more than 30 per cent since 2011–12, driven mainly by increased volumes through the Port of Newcastle and the Port of Hay Point, both of which exported over 30 million tonnes more in 2014–15 than in 2011–12. Almost all of Queensland and New South Wales’ export coal in 2014–15 was transported direct from mine to port by rail, primarily by Aurizon (formerly QR National) and Pacific National (Aurizon 2016a; Pacific National 2016). However, road and conveyors were also used to transport coal from a small number of mines to nearby rail heads, for onward transport by rail to nearby export ports.
The largest domestic use of coal in 2014–15 was power generation. In 2014–15, there were 25 operating power stations across Australia that used coal to generate either part or all of their total power output. Of these, 17 power stations across Queensland, New South Wales and Western Australia, Victoria and South Australia sourced their coal needs (approximately 99.7 million tonnes) via conveyor systems only from co-located or nearby mines. Coal supplied to the other 8 power stations (18 million tonnes in 2014–15) was transported by either one or a combination of road and rail from surrounding coal mines.

4
11
In addition to these major coal supply chains, there is also a much smaller coal transport task (<1 per cent of total coal production in 2014–15) that supplies coal to industries other than electricity generation, steel making, or cement manufacturing—such as, for example, production of coal briquettes for home use—but these are not included in the analysis presented in this publication.
Coal transport infrastructure
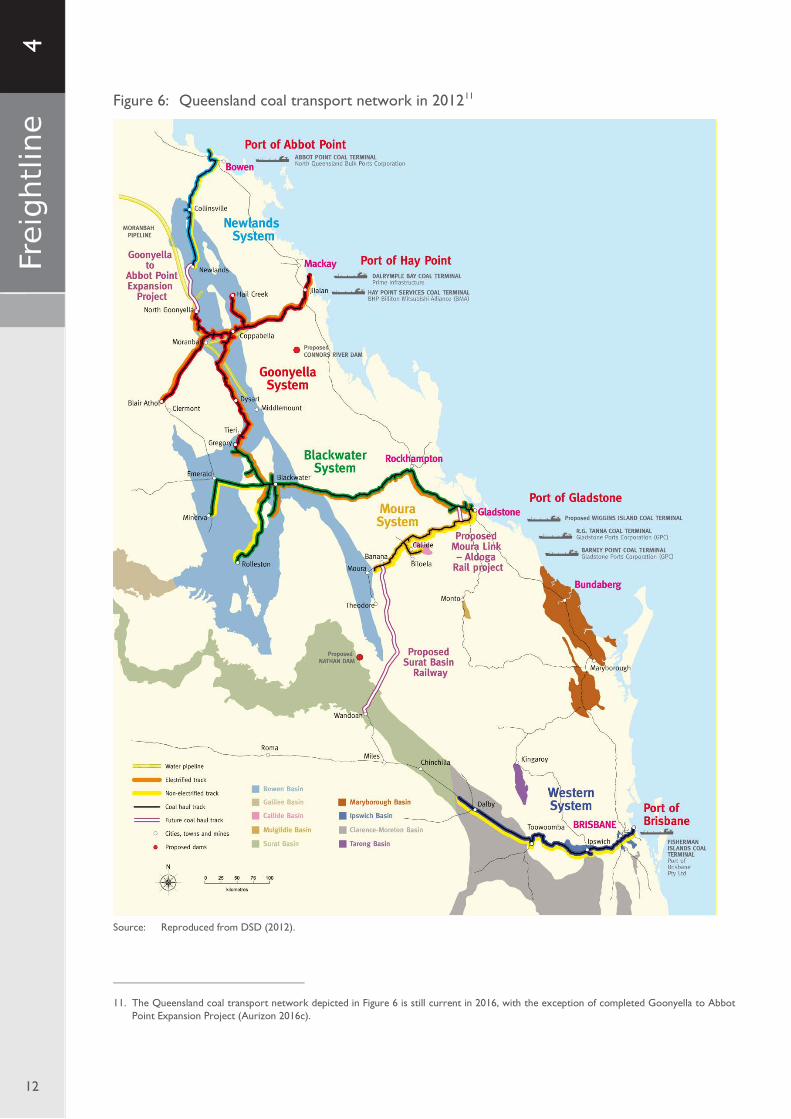
Queensland coal transport infrastructure Queensland’s export coal is transported by rail to ports from mines or intermodal nodes (Aurizon 2016a). Ownership of coal-carrying rail network infrastructure is split between Aurizon (formerly QR National), and QueenslandRail. Aurizon’s 2670-kilometre network comprises four separate rail systems: Newlands, Goonyella, Blackwater and Moura (Aurizon 2016b). QueenslandRail’s infrastructure delivers coal to the Port of Brisbane on its West Moreton rail system (also known as the Western System) (Queensland Rail 2016a, 2016b). The Queensland coal transport network, as well as the principal export ports, is shown in Figure 6.
Aurizon’s combined coal-carrying capacity across its four rail systems was approximately 310 million tonnes per annum as of 2015 (Aurizon 2015a). As a comparison, Aurizon’s coal transport task was 225.7 million tonnes in 2014–15, up from 166.7 million tonnes in 2011–12. Approximately 264.9 million tonnes per annum of capacity on Aurizon’s network was contracted in 2014–15 by coal mining companies to accommodate future production expansion (Aurizon 2015a), which leaves uncommitted capacity of approximately 45 million tonnes per annum across the network.
It is worth noting that overall coal export capacity depends on both coal rail network capacity and port coal export capacity. The following section provides further information about infrastructure and infrastructure capacity across each of the Queensland coal transport systems.
Newlands Rail System and Port of Abbot Point
The Newlands Rail System spans approximately 255 kilometres (including balloon loops) of single line, 1067 mm gauge railway connecting the North Goonyella Junction in the Bowen Basin with the Port of Abbot Point (Aurizon 2016d). Four mines are directly served by the Newlands System rail line: Newlands, Collinsville, Sonoma, and Drake. Total supply chain capacity is currently limited to 50 million tonnes per annum, in order to limit the impact on community amenity at Collinsville, through which the rail line passes (Aurizon 2013, Aurizon 2015a). The system is not electrified; all trains operating on the Newlands System are diesel powered. Newlands can accommodate train rakes up to 82 wagons long with a maximum allowable axle load of 26.5 tonnes per axle (or 106 tonnes per wagon), and a maximum speed of 80 kilometres per hour (Aurizon 2013). While coal exports through the Port of Abbot Point (from coal transport using Newlands Rail System) in 2014–15 was under 29 million tonnes, Aurizon has already identified capacity expansion options for Newlands Rail System to 170 million tonnes per annum in 2027. This is performed by a combination of rail extension and passing loops construction, rail duplication, as well longer trains with new locomotives capable of carrying more wagons (Aurizon 2015a).
In 2014–15, about 28.7 million tonnes of coal was delivered via the Newlands rail line to Abbott Point, double the 2011–12 figure of 13.6 million tonnes (Ports Australia 2012; NQBPC 2015b). Abbot Point has one operating coal loading terminal, the Adani Abbot Point Terminal10, which has a current coal-loading capacity of 50 million tonnes per annum, matching the capacity of the Newlands Rail System (NQBPC 2016). This implies that there is sufficient capacity to accommodate increases of up to 20 million tonnes per annum in coal production in the Newlands System and Abbot Point. Nonetheless, the Adani Group has plans to build a second terminal with a capacity of 70 million tonnes per annum to support the development of its Carmichael Coal Project in the Galilee Basin, as well as facilitating additional exports by other prospective producers in the region (DSD 2016a). GVK Hancock also has approval to build a 60 million tonnes per annum terminal, but the project has not yet progressed beyond approval stage (GVK Hancock 2016).
10. On 1 June 2011, the Queensland Government entered into a 99-year lease of the Abbot Point Coal Terminal 1 to Mundra Port Pty Ltd. The
terminal is now known as the Adani Abbot Point Terminal (AAPT) under the company name Adani Abbot Point Terminal Pty Ltd (AAPTPL) (NQBP 2012).
4
12
Figure 6: Queensland coal transport network in 201211
Source: Reproduced from DSD (2012).
11. The Queensland coal transport network depicted in Figure 6 is still current in 2016, with the exception of completed Goonyella to Abbot
Point Expansion Project (Aurizon 2016c).
4
13
Goonyella Rail System and Port of Hay Point
The electrified Goonyella Rail System spans more than 635 kilometres (including balloon loops) of 1067 mm gauge (generally 60 kg/m rail with concrete sleepers) railways on the main trunk route from Hay Point to North Goonyella, connecting more than 20 mines ranging from Clermont in the West, North Goonyella and Hail Creek in the North, as well as Gregory Joint Venture in the South, with the Port of Hay Point (Aurizon 2016e). The system has a coal carrying capacity of 140 million tonnes per annum, up from 129 million tonnes per annum prior to the completion of a new feeder station at Watonga and track sectioning cabins at Carborough Downs and Grosvenor in mid-2015 (Aurizon 2015b). The Goonyella system can accommodate train rakes of up to 124 wagons with a maximum allowable axle load of 26.5 tonnes per axle (106 tonnes per wagon), and has a maximum speed limit of 80 kilometres per hour on the main line, with some balloon loops restricted to speeds as low as 25 kilometres per hour (Aurizon 2015a and 2016e). Aurizon’s 2015 Network Development Plan envisages increasing the capacity of the Goonyella System by 57 per cent, to 220 million tonnes per annum by 2024, via a combination of infrastructure expansion and longer trains.
The Port of Hay Point has a combined capacity of 140 million tonnes across the existing two coal loading terminals: Dalrymple Bay Coal Terminal (DBCT) and Hay Point Coal Terminal (HPCT) (NQBPC 2015a). DBCT, leased to Brookfield Asset Management Ltd, is a multi-user terminal with nominal capacity of 85 million tonnes per annum (NQBPC 2015a, DBCT 2016). HPCT, on the other hand, is a single user terminal, owned and managed by BHP Billiton Mitsubishi Alliance (BMA), with 55 million tonnes per annum of capacity. Upgrades to HPCT were completed in late 2015, expanding capacity from 44 million tonnes per annum with the addition of a new berth (NQBPC 2015a, BHP Billiton 2015b). In 2014–15, both terminals at the Port of Hay Point (pre-HPCT upgrade) handled a combined 115 million tonnes of coal transported via Goonyella Rail System to the Port of Hay Point, implying an average capacity utilisation of around 89 per cent. This is a significant increase from 2011–12, when the port handled 82.9 million tonnes of coal, and had a 64 per cent utilisation rate (Ports Australia 2012). A further two coal export terminals planned for Dudgeon Point were cancelled in 2014 (DSD 2016b).
Blackwater Rail System, Moura Rail System, and Port of Gladstone
The Blackwater rail system spans approximately 697 kilometres (including balloon loops) of 1067 mm gauge railways (generally 60 kg/m), connecting mines at Emerald in the West, Minerva in the South West, Gregory in the North, as well as Rolleston in the South, with the Port of Gladstone (Aurizon 2016f). The Blackwater and Moura system’s current coal-carrying capacity is 120 million tonnes per annum (Aurizon 2015a). The maximum allowable train rake size across the system is 100 wagons with a maximum axle load of 26.5 tonnes per axle (106 tonnes per wagon), and a maximum allowable speed of 80 km/h on the main line for 26.5 tonnes axle load (100km/h for 20 tonnes axle load), down to a minimum 25 kilometres per hour on some branch lines (Aurizon 2015a, Aurizon 2016f). In 2014–15, the Blackwater and Moura system supplied about 68.6 million tonnes of coal to the Port of Gladstone (Gladstone Ports Corporation 2015a), implying a capacity utilisation rate of 57 per cent across the Blackwater and Moura Rail Systems. Aurizon has explored possible options to increase rail capacity on the Blackwater and Moura systems to a combined 230 million tonnes per annum via a combination of infrastructure expansion and longer trains (Aurizon 2015a).
The Moura System spans more than 235 kilometres of 1067 mm gauge railways (generally 60 kg/m), connecting mines at Moura and Callide in the west with the Port of Gladstone (Aurizon 2016g). The maximum allowable train rake across the system is currently 100 wagons per train for this diesel operation only rail network, allowable axle loads vary between 15.75 and 26.5 tonnes per axle (between 63 and 106 tonnes per wagon), and the maximum allowable speed of 80 kilometres per hour, limited to as low as 50 kilometres per hour in certain sections (such as between Graham to Taragoola). In 2014–15, approximately 11.6 million tonnes of coal was delivered via the Moura rail system to the Port of Gladstone (BITRE estimates).
The Port of Gladstone currently has two operational coal terminals: RG Tanna Coal Terminal (RGTCT) and recently completed Wiggins Island Coal Export Terminal (WICET).12 These two terminals currently have a combined coal-loading capacity of over 100 million tonnes per annum and are multi-user terminal facilities operated by Gladstone Ports Corporation, with RGTCT owned by Gladstone Ports Corporation and WICET owned by the consortium of WICET (Gladstone Ports Corporation 2015b, Matthew Stevens 2015, WICET 2016a). In 2014–15, the Port of Gladstone handled a combined 68.6 million tonnes of coal (Gladstone Ports Corporation 2015b), implying an 86 per cent capacity utilisation rate without WICET (which only opens in
12. Coal export operations at the Barney Point Terminal, within the Port of Gladstone, ceased in May 2016 (Gladstone Ports Corporation 2016).
4
14
April 2015), or 69 per cent with WICET (Gladstone Ports Corporation 2011, Gladstone Ports Corporation 2015b). As a comparison, in 2011–12, Port of Gladstone handled 59.8 million tonnes (Ports Australia 2012).
West Moreton Rail System and Port of Brisbane
The West Moreton system spans 314.4 kilometres connecting Miles, west of Brisbane, with Rosewood (Queensland Rail 2016b). The system serves three mines: Jeebropilly, New Acland, and Cameby Downs. (There are other coal mines near the West Moreton Rail System, but they mostly supply nearby coal power stations). From Rosewood, trains transport coal to the Port of Brisbane via the Metropolitan Rail System. The West Moreton system has capacity to deliver up to 10.8 million tonnes of coal to the Port of Brisbane per annum (Queensland Rail 2009, Queensland Rail 2013). In 2015, 6.9 million tonnes of coal was delivered to the port (Port of Brisbane 2015), implying a capacity utilisation of 64 per cent. The system is uniquely challenged among Queensland’s coal rail systems due to the need for freight to share rail capacity with the Brisbane Metropolitan Rail System; freight movement along the metropolitan system are subject to passenger priority rules (Queensland Rail 2006). In the absence of additional major infrastructure, including expansion of the Port of Brisbane, the West Morton system is likely to remain capacity constrained.
The Port of Brisbane has one coal terminal, owned and operated by Queensland Bulk Handling Pty Ltd (wholly-owned by the New Hope Group), with a coal-loading capacity of 10 million tonnes per annum (Port of Brisbane 2016, QBH 2016). In 2015, the Port of Brisbane handled 7.2 Mt of coal, supplied by the West Morton Rail System. There are presently no plans to expand capacity at the port. Future production from the Surat Basin is expected to be railed to the Port of Gladstone on a proposed 210km Surat Basin Railway, rather than to the Port of Brisbane (DTMR 2016).
New South Wales coal transport infrastructure New South Wales’s two main coal export ports are the Port of Newcastle and Port Kembla. Newcastle Port had 211 million tonnes per annum of coal loading capacity in 2014–15, and Port Kembla a capacity of 18 million tonnes per annum (BITRE 2016; Department of Industry 2015b; Port of Newcastle 2016; NCIG 2015; PWCS 2016a and 2016b; PKCT 2015). New South Wales’ coal exports were predominantly transported by rail directly from coal mines to ports for export (NSW Minerals Council 2016), with a relatively small amount transported by a combination of road and rail. The New South Wales coal transport network is illustrated in Figure 7.
Hunter Valley Coal Network and Port of Newcastle
The Hunter Valley Coal Network (HVCN) spans approximately 450 kilometres, connecting approximately 32 operating mines, across the Hunter Valley and Gunnedah Basins to the Port of Newcastle (HVCCC 2012). The network is primarily operated by the Australian Rail Track Corporation (ARTC), which operates the vast majority of the network under a 60-year lease from Transport for NSW (TfNSW), with Sydney Trains operating the small part of the HVCN that serves the Mandalong and West Wallsend mines, as well as the Vales Point and Eraring power stations (ARTC 2015, TfNSW 2013). Most of the HVCN has a maximum allowable load of 30 tonnes per axle (120 tonnes per wagon) and maximum allowable speeds of 60 km/h for loaded trains. The network capacity (based on contracted export coal volume in 2017) is at least 194 million tonnes per annum, achievable subject to adequate management of variability, and is forecast to remain steady or decline slightly in the next ten years (ARTC 2015).
There are four above-rail operators on the HVCN. Pacific National and Aurizon together account for the majority of rail coal haulage in New South Wales, while Glencore operates in joint venture with Freightliner to service its mines, as does Centennial Coal with Southern Shorthaul Railroad (ARTC 2015).
The Port of Newcastle handled 158.9 million tonnes of export coal in 2014–15 (92 per cent of New South Wales’ total coal exports) through three coal export terminals: Carrington and Kooragang Coal Terminals, owned by Port Waratah Coal Services (PWCS), and the Newcastle Coal Infrastructure Group’s (NCIG) terminal (Port of Newcastle 2015).
• The PWCS Carrington Coal Terminal has a ship-loading capacity of 25 million tonnes per annum (unchanged from 2011–12 while Kooragang Island Coal Terminal has a ship-loading capacity of 120 million tonnes per annum, an increase of 15 million tonnes per annum over 2011–12 capacity (PWCS 2016a and 2016b).

4
15
• The Newcastle Coal Infrastructure Group’s terminal began operations in 2010 and has a coal-loading capacity of 66 million tonnes per annum. Expansion of NCIG’s Kooragang Island facility was completed in mid-2013, which increased capacity from 53 million tonnes per annum to its current level (NCIG 2013b).
Figure 7: New South Wales’ coal transport network in 201513
Source: Reproduced from New South Wales Coal Industry Profile 2008.
13. NSW Coal Transport network remains the same in 2015 (Department of Industry 2015c).
Hunter Valley Region
Southern NSW Region
4
16
Southern New South Wales coal rail system
The Southern New South Wales coal rail system spans approximately 400 kilometres, connecting Charbon in the North West with Sydney, Newcastle and Wollongong (including Illawarra line), as well as the rail line connecting Moss Vale with Unanderra (ACIL Tasman 2009, TfNSW 2013). The Southern New South Wales coal rail system served 13 mines in 2014–15, from which most coal produced was transported to Port Kembla via the Illawarra line, which is part of the Metropolitan Rail Network (Sydney Trains). Some mines are also served by the ARTC’s North-South Corridor between Macarthur and Moss Vale, and Moss Vale and Unanderra. Freight capacity on the Southern New South Wales coal rail system is estimated at 12.5 million tonnes per annum and Moss Vale – Unanderra is estimated at 6.5 million tonnes per annum (ACIL Tasman 2011). It is worth noting that the Illawarra line is intensively used for both passengers and freight services, where practically the freight service is limited to 8 hours a day (ACIL Tasman 2011).
The Port Kembla Coal Terminal (PKCT) exported 12.9 million tonnes of coal in 2014–15 (BITRE 2016), slightly below the 14.6 million tonnes of coal recorded in 2011–12 (Ports Australia 2012). More than half of the coal received by PKCT in 2014–15 is transported by road (6.9 million tonnes), although about one third of this is transported via private road (PKCT 2015). The terminal has a maximum coal-loading capacity of 17 million tonnes per annum (Port Kembla 2013). PKCT is privately managed by South32 (demerged from BHP Billiton) on behalf of the Port Kembla Coal Terminal Limited consortium (consisting six coal mining companies: Glencore, South32, Centennial Coal, Wollongong Coal, Tahmoor Coal and Peabody) (PKCT 2016). PKCT was reportedly undertaking development work of approximately $250-$300 million to increase terminal capacity to 22.5 million tonnes per annum by 2015 (Port Kembla 2013), but as of the time of writing no relevant party had announced the completion of such a project.
Coal freight movements 2014–15
Inland coal freight movements Figure 8 shows estimated coal freight volumes in 2014–15 across road, rail, coastal shipping, and conveyor networks. The estimates have been derived by modelling flows between mines, export ports and domestic steel and clinker production facilities, taking into account transport costs and infrastructure capacity.
The estimates imply that approximately 406.6 million tonnes of coal was transported by rail in 2014–15, 100.4 million tonnes by conveyor, 44.3 million tonnes by road (including to intermodal nodes), and about 1 million tonnes by ship between domestic ports.14 In transport task terms, the total rail coal freight task was estimated to be 85.2 billion tonne kilometres (billion tkm), the road freight task approximately 1.1 billion tkm, the coastal shipping coal freight task approximately 2.3 billion tkm and the conveyor freight task 0.3 billion tkm in 2014–15.
BITRE estimates the rail freight transport tasks for export coal, by system, 2014–15, were:
• Newlands Rail System: 5.8 billion tkm
• Goonyella Rail System: 24.6 billion tkm
• Blackwater Rail System: 20.9 billion tkm
• Moura Rail System: 2.2 billion tkm
• Western Rail System: 1.8 billion tkm
• Hunter Valley Rail System: 27.3 billion tkm
• Southern New South Wales: 1.5 billion tkm
Figures 9 and 10 provide more detailed snapshots of 2014–15 coal freight movements in New South Wales and Queensland, respectively.
14. Figures here include multiple uplift of coal volumes using multiple transport modes.

4
17
Figure 8: Estimated coal freight movements, 2014–15
Source: BITRE estimates.
Figure 9: Estimated coal freight movements, New South Wales, 2014–15
Source: BITRE estimates.
4
18
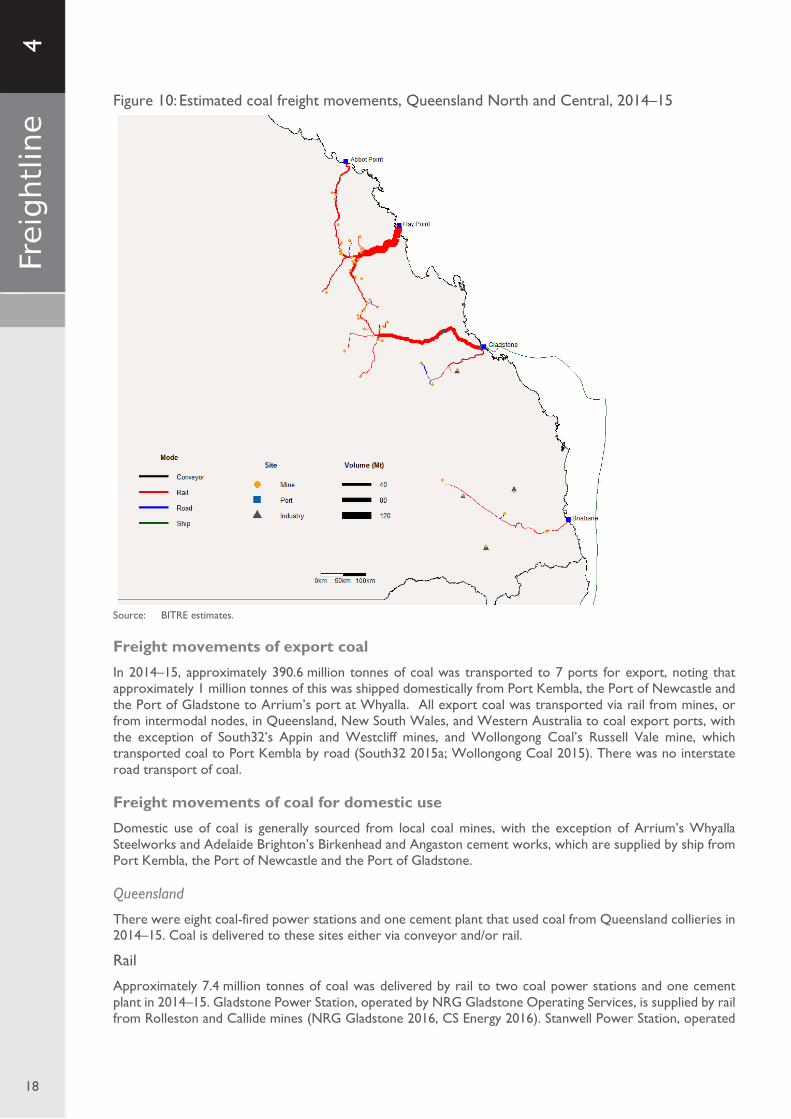
Figure 10: Estimated coal freight movements, Queensland North and Central, 2014–15
Source: BITRE estimates.
Freight movements of export coal In 2014–15, approximately 390.6 million tonnes of coal was transported to 7 ports for export, noting that approximately 1 million tonnes of this was shipped domestically from Port Kembla, the Port of Newcastle and the Port of Gladstone to Arrium’s port at Whyalla. All export coal was transported via rail from mines, or from intermodal nodes, in Queensland, New South Wales, and Western Australia to coal export ports, with the exception of South32’s Appin and Westcliff mines, and Wollongong Coal’s Russell Vale mine, which transported coal to Port Kembla by road (South32 2015a; Wollongong Coal 2015). There was no interstate road transport of coal.
Freight movements of coal for domestic use Domestic use of coal is generally sourced from local coal mines, with the exception of Arrium’s Whyalla Steelworks and Adelaide Brighton’s Birkenhead and Angaston cement works, which are supplied by ship from Port Kembla, the Port of Newcastle and the Port of Gladstone.
Queensland
There were eight coal-fired power stations and one cement plant that used coal from Queensland collieries in 2014–15. Coal is delivered to these sites either via conveyor and/or rail.
Rail
Approximately 7.4 million tonnes of coal was delivered by rail to two coal power stations and one cement plant in 2014–15. Gladstone Power Station, operated by NRG Gladstone Operating Services, is supplied by rail from Rolleston and Callide mines (NRG Gladstone 2016, CS Energy 2016). Stanwell Power Station, operated

4
19
by Stanwell, is supplied from the Curragh mine (Stanwell 2015b). Gladstone Cement Plant, operated by Cement Australia is supplied via the Moura Rail System (Aurizon 2014).
Conveyor
Six coal-fired power stations operating in Queensland in 2014–15 are located adjacent to their supplying coal mine, using a total of 15.6 million tonnes of coal delivered by short conveyer. These were Callide B, Callide C, Kogan Creek, Millmerran, Tarong and Tarong North power stations (Anglo American 2013, CS Energy 2012, Stanwell 2015c, Daelim Energy 2015). Coal transported by conveyor to these power stations comprised the largest domestic use of coal in Queensland.
New South Wales
There were five coal power stations, one steelworks and two cement plants that used coal from New South Wales collieries in 2014–15. Coal is delivered to these sites via either conveyor, rail and road.
Rail
In 2014–15, approximately 6.9 million tonnes of coal was delivered by rail to BlueScope’s steelworks at Port Kembla and Boral’s Berrima cement works, as well as Erraring Power Station (Bluescope 2015c, Boral 2016, Origin Energy 2014). BITRE estimates that up to 3 million tonnes of coal was delivered by rail for other uses through the New South Wales Southern coal network.
Road
Vales Point power station was the only domestic facility in NSW to receive coal by road in 2014–15, with approximately 1.1 million tonnes being hauled to Vales Point power station from Chain Valley colliery by private road (LakeCoal 2015).
Conveyor
Approximately 15.6 million tonnes of coal was delivered by conveyor to four power stations in 2014–15. These were the Bayswater, Liddell, Eraring, and Mount Piper power stations (AGL 2014, Centennial Coal 2012j).
Other Australian states and interstate (except NT and ACT)
Victoria is one of only two states to produce brown coal (lignite), the lowest grade of coal with half the energy content of thermal black coal used in electricity generation in Queensland and NSW (DIIS 2016a). In 2014–15, the state produced approximately 65.6 Mt of brown coal (down from estimated 67.2 million tonnes in 2011–12), which was mostly moved by conveyor from nearby mines to Victoria’s four power stations: Loy Yang A, Loy Yang B, Hazelwood, Yallourn, and by truck from Anglesea mine to Anglesea power station (AGL 2016, Alcoa 2016b, Energy Australia 2016, GDF Suez 2016). 15
South Australia produced 2.5 million tonnes of brown coal in 2014–15, most of which was transported by rail from Alinta Energy’s Leigh Creek mine approximately 260 km to the energy company’s two power stations in Port Augusta: Northern and Playford (Alinta Energy 2013, 2015, 2016). It is estimated that Angaston and Birkenhead cement (clinker) plants in Adelaide used a combined 0.18 million tonnes of coal in 2014–15, transported by rail from Arrium’s port at Whyalla, which received about 1 million tonnes of coal from domestic shipping (BITRE 2016). The rail freight task for coal in South Australia is estimated to be 0.7 billion tkm, with the majority comprising coal transported from Leigh Creek to AlintaEnergy’s power stations via the Stirling North Telford Railway line. Note that the South Australian coal transport task effectively ended in the November 2015 with closure of Leigh Creek coal mine (Whiting 2016), ahead of the shutdown of the Playford power station (May 2016) (Dulaney and Reid 2016).
Western Australia produced around 6.5 million tonnes of coal from its two mines in the Collie basin in 2014–15 (Lanco 2015; Yanzhou Coal Mining 2015a). Approximately 6.4 million tonnes of coal was used to supply five power stations: Collie, Muja, Bluewaters, Worsley and Kwinana, with about 0.1 million tonnes of coal railed to the Port of Fremantle for export in 2014–15. Coal was supplied to the Collie, Muja and Bluewaters power stations by conveyor (about 5.2 million tonnes), and to the Worsley and Kwinana power stations by rail (about 1.2 million tonnes) (Premier Coal 2016a; Premier Coal 2016b; EPA 2005). The Kwinana power station closed in April 2015 (Pickles 2014).
15. The Morwell Energy Brix Power Station closed in August 2014 (Witson 2014).

4
20
In Tasmania, approximately 0.2 million tonnes of coal in 2014–15 was moved by rail from the Cullenswood and Duncan mines, in the east of the state, to Cement Australia’s Railton cement works (ABC News 2014, Cement Australia 2016a, Cement Australia 2016b, WCA 2013b).
Table 6: Estimated coal freight transport flows, by jurisdiction and transport modea,b
Jurisdiction Road Rail Conveyor Total Road Rail Conveyor Totalc
(billion tkm) (million tonnes) b
NSW 0.51 28.97 0.12 29.60 25.7 175.5 15.6 216.9
Victoria 0.00 0.00 0.13 0.13 1.1 0 63.3 64.4
Queensland 0.57 55.39 0.06 56.02 17.4 226.9 15.6 259.9
WA 0.00 0.10 0.03 0.13 0 1.3 5.2 6.5
SA 0.00 0.70 0.00 0.70 0 2.6 0.8 3.4
Tasmania 0.00 0.04 0.00 0.04 0 0.2 0 0.2
Total 1.09 85.20 0.33 86.63 44.3 406.6 100.4 551.3
na not applicable a. Excludes coastal shipping movements of coal from Port Kembla, Gladstone and Newcastle to Whyalla, which were estimated
to total 1 million tonnes, or 2.3 billion tonne kilometres, in 2014–15. b. Total tonnage presented on uplift/discharge basis (non-exclusive multi-modal). Source: BITRE estimates.
Interstate coastal shipping coal freight movements
In 2014–15, approximately 1 million tonne of coal was transported to Arrium’s Whyalla port via coastal shipping, comprising of 0.26 million tonnes shipped from the Port of Gladstone, 0.56 million tonnes from Port Kembla, and 0.13 million tonnes from the Port of Newcastle (BITRE 2016). This is estimated to account for 2.3 billion tkm of the domestic coastal coal freight task.
Concluding remarks This Freightline issue has outlined the size and scope of the coal freight task in Australia, and provided estimates of domestic coal freight volumes in 2011–12 and in 2014–15. The estimates presented in the paper are based on modelled movements of coal from mines to ports for export and from mines to domestic users—primarily power stations, steel producers and cement manufacturers—based on assumptions about transport costs and infrastructure availability. Consequently, the flows are indicative estimates only and may not reflect the actual pattern and volume of coal movements in either time period. The model developed to estimate coal freight movements also has broader application, for example, consideration of future infrastructure requirements or the potential implications of network outages and/or supply disruptions.
4
21
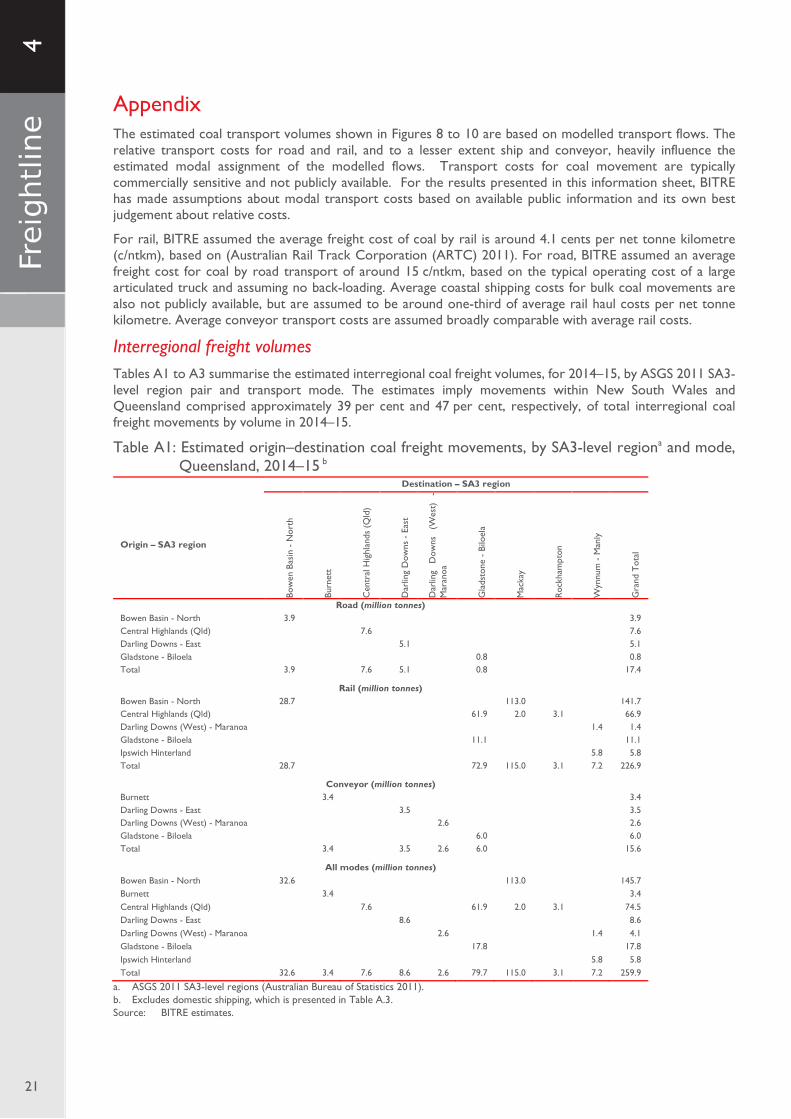
Appendix The estimated coal transport volumes shown in Figures 8 to 10 are based on modelled transport flows. The relative transport costs for road and rail, and to a lesser extent ship and conveyor, heavily influence the estimated modal assignment of the modelled flows. Transport costs for coal movement are typically commercially sensitive and not publicly available. For the results presented in this information sheet, BITRE has made assumptions about modal transport costs based on available public information and its own best judgement about relative costs.
For rail, BITRE assumed the average freight cost of coal by rail is around 4.1 cents per net tonne kilometre (c/ntkm), based on (Australian Rail Track Corporation (ARTC) 2011). For road, BITRE assumed an average freight cost for coal by road transport of around 15 c/ntkm, based on the typical operating cost of a large articulated truck and assuming no back-loading. Average coastal shipping costs for bulk coal movements are also not publicly available, but are assumed to be around one-third of average rail haul costs per net tonne kilometre. Average conveyor transport costs are assumed broadly comparable with average rail costs.
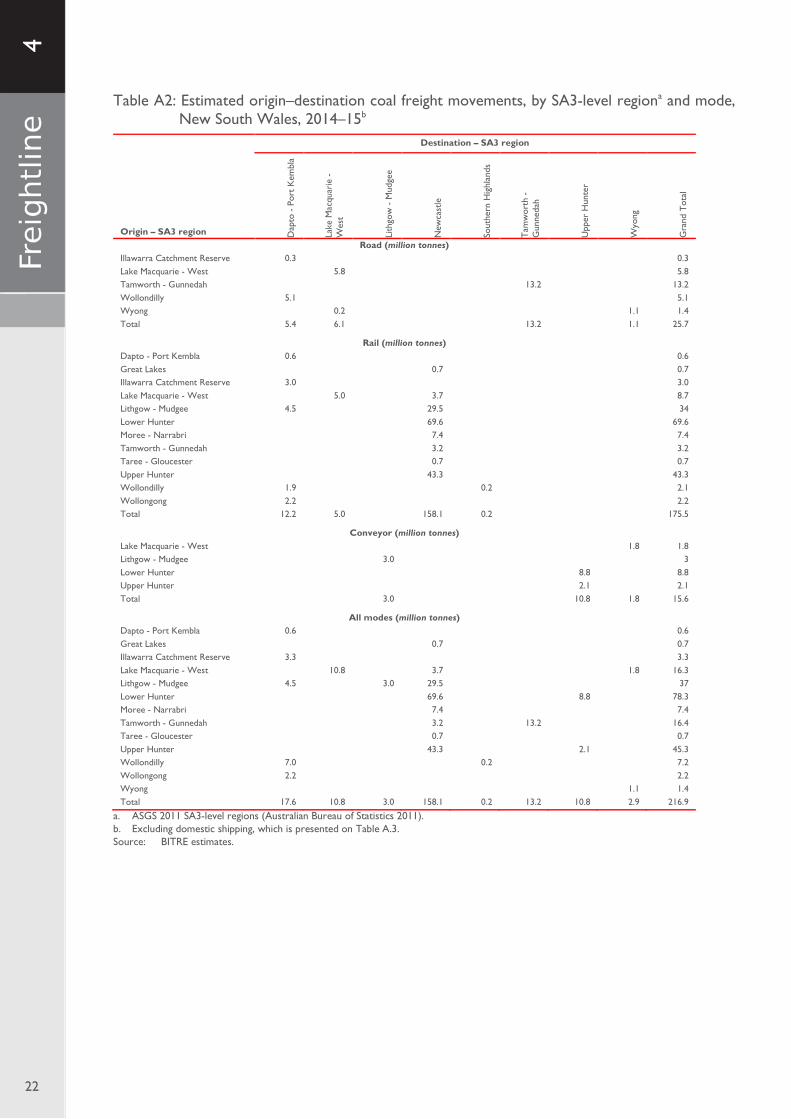
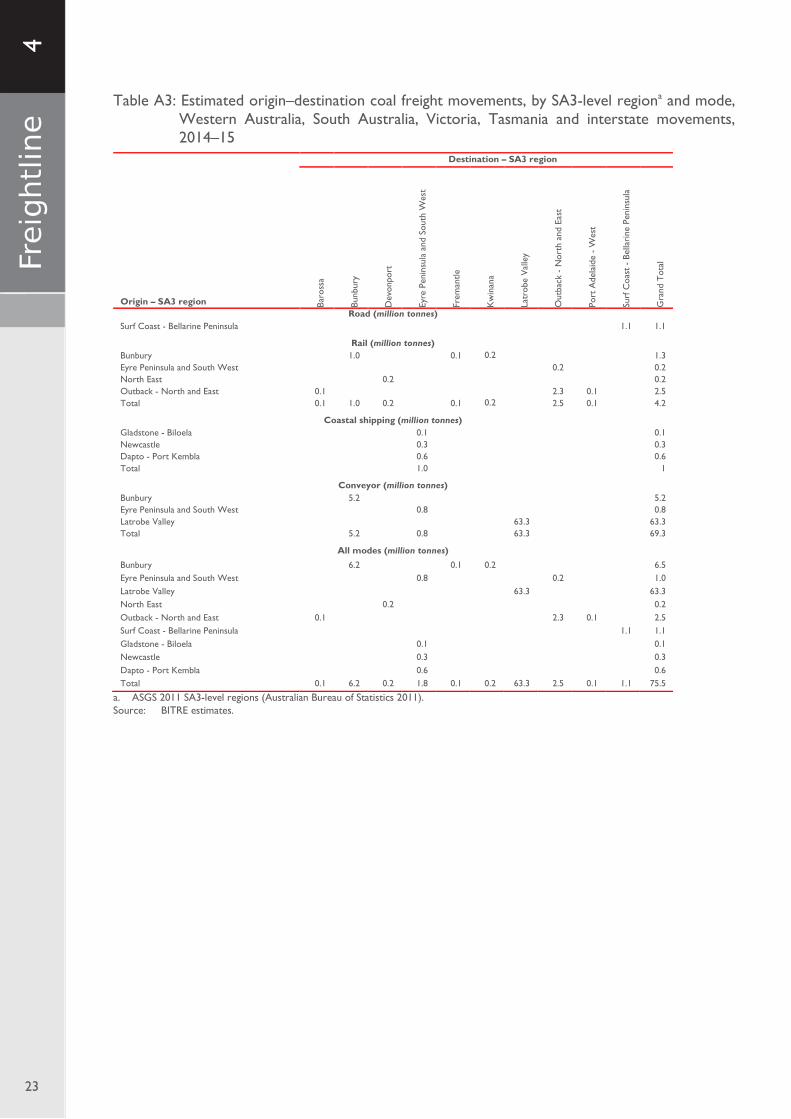
Interregional freight volumes Tables A1 to A3 summarise the estimated interregional coal freight volumes, for 2014–15, by ASGS 2011 SA3-level region pair and transport mode. The estimates imply movements within New South Wales and Queensland comprised approximately 39 per cent and 47 per cent, respectively, of total interregional coal freight movements by volume in 2014–15.
Table A1: Estimated origin–destination coal freight movements, by SA3-level regiona and mode, Queensland, 2014–15 b
Destination – SA3 region
Origin – SA3 region
Bow
en B
asin
- N
orth
Burn
ett
Cen
tral
Hig
hlan
ds (
Qld
)
Dar
ling
Dow
ns -
Eas
t
Dar
ling
Dow
ns
(Wes
t)
- M
aran
oa
Gla
dsto
ne -
Bilo
ela
Mac
kay
Roc
kham
pton
Wyn
num
- M
anly
Gra
nd T
otal
Road (million tonnes) Bowen Basin - North 3.9 3.9 Central Highlands (Qld) 7.6 7.6 Darling Downs - East 5.1 5.1 Gladstone - Biloela 0.8 0.8 Total 3.9 7.6 5.1 0.8 17.4
Rail (million tonnes)
Bowen Basin - North 28.7 113.0 141.7 Central Highlands (Qld) 61.9 2.0 3.1 66.9 Darling Downs (West) - Maranoa 1.4 1.4 Gladstone - Biloela 11.1 11.1 Ipswich Hinterland 5.8 5.8 Total 28.7 72.9 115.0 3.1 7.2 226.9
Conveyor (million tonnes)
Burnett 3.4 3.4 Darling Downs - East 3.5 3.5 Darling Downs (West) - Maranoa 2.6 2.6 Gladstone - Biloela 6.0 6.0 Total 3.4 3.5 2.6 6.0 15.6
All modes (million tonnes)
Bowen Basin - North 32.6 113.0 145.7 Burnett 3.4 3.4 Central Highlands (Qld) 7.6 61.9 2.0 3.1 74.5 Darling Downs - East 8.6 8.6 Darling Downs (West) - Maranoa 2.6 1.4 4.1 Gladstone - Biloela 17.8 17.8 Ipswich Hinterland 5.8 5.8 Total 32.6 3.4 7.6 8.6 2.6 79.7 115.0 3.1 7.2 259.9
a. ASGS 2011 SA3-level regions (Australian Bureau of Statistics 2011). b. Excludes domestic shipping, which is presented in Table A.3. Source: BITRE estimates.
4
22
Table A2: Estimated origin–destination coal freight movements, by SA3-level regiona and mode, New South Wales, 2014–15b
Destination – SA3 region
Origin – SA3 region Dap
to -
Por
t K
embl
a
Lake
Mac
quar
ie -
W
est
Lith
gow
- M
udge
e
New
cast
le
Sout
hern
Hig
hlan
ds
Tam
wor
th -
G
unne
dah
Upp
er H
unte
r
Wyo
ng
Gra
nd T
otal
Road (million tonnes) Illawarra Catchment Reserve 0.3 0.3 Lake Macquarie - West 5.8 5.8 Tamworth - Gunnedah 13.2 13.2 Wollondilly 5.1 5.1 Wyong 0.2 1.1 1.4 Total 5.4 6.1 13.2 1.1 25.7
Rail (million tonnes) Dapto - Port Kembla 0.6 0.6 Great Lakes 0.7 0.7 Illawarra Catchment Reserve 3.0 3.0 Lake Macquarie - West 5.0 3.7 8.7 Lithgow - Mudgee 4.5 29.5 34 Lower Hunter 69.6 69.6 Moree - Narrabri 7.4 7.4 Tamworth - Gunnedah 3.2 3.2 Taree - Gloucester 0.7 0.7 Upper Hunter 43.3 43.3 Wollondilly 1.9 0.2 2.1 Wollongong 2.2 2.2 Total 12.2 5.0 158.1 0.2 175.5
Conveyor (million tonnes) Lake Macquarie - West 1.8 1.8 Lithgow - Mudgee 3.0 3 Lower Hunter 8.8 8.8 Upper Hunter 2.1 2.1 Total 3.0 10.8 1.8 15.6
All modes (million tonnes) Dapto - Port Kembla 0.6 0.6 Great Lakes 0.7 0.7 Illawarra Catchment Reserve 3.3 3.3 Lake Macquarie - West 10.8 3.7 1.8 16.3 Lithgow - Mudgee 4.5 3.0 29.5 37 Lower Hunter 69.6 8.8 78.3 Moree - Narrabri 7.4 7.4 Tamworth - Gunnedah 3.2 13.2 16.4 Taree - Gloucester 0.7 0.7 Upper Hunter 43.3 2.1 45.3 Wollondilly 7.0 0.2 7.2 Wollongong 2.2 2.2 Wyong 1.1 1.4 Total 17.6 10.8 3.0 158.1 0.2 13.2 10.8 2.9 216.9
a. ASGS 2011 SA3-level regions (Australian Bureau of Statistics 2011). b. Excluding domestic shipping, which is presented on Table A.3. Source: BITRE estimates.
4
23
Table A3: Estimated origin–destination coal freight movements, by SA3-level regiona and mode, Western Australia, South Australia, Victoria, Tasmania and interstate movements, 2014–15
Destination – SA3 region
Origin – SA3 region Baro
ssa
Bunb
ury
Dev
onpo
rt
Eyre
Pen
insu
la a
nd S
outh
Wes
t
Frem
antle
Kw
inan
a
Latr
obe
Val
ley
Out
back
- N
orth
and
Eas
t
Port
Ade
laid
e -
Wes
t
Surf
Coa
st -
Bel
lari
ne P
enin
sula
Gra
nd T
otal
Road (million tonnes) Surf Coast - Bellarine Peninsula 1.1 1.1
Rail (million tonnes)
Bunbury 1.0 0.1 0.2 1.3 Eyre Peninsula and South West 0.2 0.2 North East 0.2 0.2 Outback - North and East 0.1 2.3 0.1 2.5 Total 0.1 1.0 0.2 0.1 0.2 2.5 0.1 4.2
Coastal shipping (million tonnes)
Gladstone - Biloela 0.1 0.1 Newcastle 0.3 0.3 Dapto - Port Kembla 0.6 0.6 Total 1.0 1
Conveyor (million tonnes)
Bunbury 5.2 5.2 Eyre Peninsula and South West 0.8 0.8 Latrobe Valley 63.3 63.3 Total 5.2 0.8 63.3 69.3
All modes (million tonnes)
Bunbury 6.2 0.1 0.2 6.5 Eyre Peninsula and South West 0.8 0.2 1.0 Latrobe Valley 63.3 63.3 North East 0.2 0.2 Outback - North and East 0.1 2.3 0.1 2.5 Surf Coast - Bellarine Peninsula 1.1 1.1 Gladstone - Biloela 0.1 0.1 Newcastle 0.3 0.3 Dapto - Port Kembla 0.6 0.6 Total 0.1 6.2 0.2 1.8 0.1 0.2 63.3 2.5 0.1 1.1 75.5
a. ASGS 2011 SA3-level regions (Australian Bureau of Statistics 2011). Source: BITRE estimates.

4
24
Abbreviations ABARES Australian Bureau of Agricultural and Resource Economics and Sciences ABS Australian Bureau of Statistics AEMO Australian Energy Markets Operator ARA Australasian Railway Association ARTC Australian Rail Track Corporation BMA BHP Billiton Mitsubishi Alliance BMC BHP Billiton Mitsui Coal BITRE Bureau of Infrastructure, Transport and Regional Economics BREE Bureau of Resources and Energy Economics BSL BlueScope Steel CIF Cement Industry Federation DFAT Department of Foreign Affairs and Trade DIER Department of Infrastructure Energy and Resources DIIS Department of Industry, Innovation and Science DSIRD Department of Industry, Skills and Regional Development DMITRE Department of Manufacturing Innovation Trade Resources and Energy DMP Department of Mines and Petroleum DNRM Department of Natural Resources and Mines DoF Department of Finance (Western Australia) DPI Department of Primary Industries DSD Department of State Development DSDBI Department of State Development, Business and Innovation DSDIP Department of State Development, Infrastructure and Planning DTMR Department of Transport and Main Roads EIA Energy Information Administration FMG Fortescue Metals Group GA Geoscience Australia HVCCC Hunter Valley Coal Chain Coordinator HVCN Hunter Valley Coal Network MCA Minerals Council of Australia Mt/a Million tonnes per annum NCIG Newcastle Coal Infrastructure Group NPC Newcastle Port Corporation NQBP North Queensland Bulk Port NSW MC New South Wales Minerals Council OCE Office of the Chief Economist PKCT Port Kembla Coal Terminal PKPC Port Kembla Port Corporation PWCS Port Waratah Coal Services QBH Queensland Bulk Handling SCOTI Standing Committee on Transport and Infrastructure TfNSW Transport for New South Wales WCA World Coal Association
4
25
References ABC News 2014, Cornwall Coal mine in Fingal to cut one third of workforce, union says, ABC News, Canberra.
URL: www.abc.net.au/news/2014-11-14/cornwall-coalmine-in-fingal-to-cut-one-third-of-its-workfoce/5891678.
ACIL Tasman 2009, Vision 2020 Project: The Australian Minerals Industry’s Infrastructure Path to Prosperity, ACIL Tasman, Melbourne.
ACIL Tasman 2011, Maldon-Dombarton Rail Link Feasibility Study: Working Paper 2, ACIL Tasman, Melbourne.
Adelaide Brighton 2012a, Analyst / Investor Tour: Perth 27 September 2012 and Adelaide 28 September 2012, Adelaide Brighton, Adelaide.
Adelaide Brighton 2012b, Annual Report 2012, Adelaide Brighton, Adelaide.
AGL 2013, AGL Loy Yang, AGL, Sydney. URL: www.agl.com.au/about-agl/how-we-source-energy/thermal-energy/agl-loy-yang. Accessed: December 2013.
AGL 2014, Macquarie Generation Acquisition, AGL, Sydney.
AGL 2015a, AGL Annual Report 2015, AGL, Sydney.
AGL 2015b, FY 2015 Full Year Results, AGL, Sydney.
AGL 2015c, FY 2015 Interim Results, AGL, Sydney.
AGL 2016, AGL Loy Yang, AGL, Sydney. URL: www.agl.com.au/about-agl/how-we-source-energy/thermal-energy/agl-loy-yang.
Alcoa 2013, About Alcoa Anglesea, Alcoa, Melbourne. URL: www.alcoa.com/australia/en/info_page/anglesea_overview.asp. Accessed: December 2013.
Alcoa 2016a, About Alcoa Anglesea, Alcoa, Melbourne. URL: www.alcoa.com/australia/en/info_page/anglesea_overview.asp.
Alcoa 2016b, Coal Mining, Alcoa, Melbourne. URL: www.alcoa.com/australia/en/info_page/anglesea_coal.asp
Alinta Energy 2013, Leigh Creek Coal Mine and Township, Alinta Energy, Sydney. URL: alintaenergy.com.au/everything-alinta-energy/power-generation/leigh-creek. Accessed: November 2013.
Alinta Energy 2015, Alinta Energy Sustainability Report 2014/15, Alinta Energy, Sydney. URL: salintaenergy.com.au/Alinta/media/ecpdfs/Sustainability-Report-2014–15-V6-web.pdf.
Alinta Energy 2016, Power Generation: Flinders, Alinta Energy, Sydney. URL: alintaenergy.com.au/everything-alinta-energy/power-generation/flinders.
Anglo American (Drayton Management) 2012, Independent Environmental Compliance Audit - Drayton Coal - Project Approval 06_0202 and Development Application 106-04-00, Anglo American, Brisbane.
Anglo American 2013, ‘CS Energy Limited and Ors – Application for Authorisation A91378’ (a letter sent by email to ACCC on 18 July 2013), Anglo American, Brisbane.
Anglo American 2016, Anglo American plc Production Report for the fourth quarter ended 31 December 2015, Anglo American, Brisbane. URL: www.angloamerican.com/~/media/Files/A/Anglo-American-PLC-V2/press-release/releases/2016pr/q4-2015-production-report.pdf
Bligh A. and Jones K. 2011, Joint Statement on Millmerran Coal mine recognised in Premier’s ClimateSmart Sustainability Awards, Queensland Government, Brisbane. URL: statements.qld.gov.au/Statement/Id/75175.
Arrium 2012, Annual Report 2012, Arrium Limited, Sydney.
Arrium 2015, FY15 Results Presentation, Arrium Limited, Sydney. URL: www.arrium.com/~/media/Arrium%20Mining%20and%20Materials/Files/Presentations/FYEnd2015/Arrium%20Limited%20-%20Full%20Year%202015%20Results%20Presentation.pdf.
Aurizon 2013, Network Development Plan 2013, Aurizon, Brisbane.
Aurizon 2014, Moura System, Aurizon, Brisbane.
4
26
Aurizon 2015a, Network Development Plan 2015, Aurizon, Brisbane. URL: www.aurizon.com.au/~/media/aurizon/files/what%20we%20do/network/planning%20and%20development/ndp/2015%20network%20development%20plan.ashx.
Aurizon 2015b, Hay Point (Goonyella) Rail Expansion, Aurizon, Brisbane. URL: www.aurizon.com.au/what-we-do/projects/goonyella-rail-expansion-project.
Aurizon 2016a, What we deliver: Coal, Aurizon, Brisbane. URL: swww.aurizon.com.au/what-we-deliver/coal.
Aurizon 2016b, Our Network, Aurizon, Brisbane. URL: www.aurizon.com.au/what-we-deliver/network.
Aurizon 2016c, Goonyella to Abbot Point Expansion Project, Brisbane. URL: www.aurizon.com.au/what-we-deliver/projects/goonyella-to-abbot-point-expansion-project
Aurizon 2016d, Newlands System Information Pack (version 5.8), Aurizon, Brisbane.
Aurizon 2016e, Goonyella System Information Pack (version 6.6), Aurizon, Brisbane.
Aurizon 2016f, Blackwater System Information Pack (version 5.8), Aurizon, Brisbane.
Aurizon 2016g, Moura System Information Pack (version 6.2), Aurizon, Brisbane.
Australian Energy Markets Operator 2016a, Generation Information, AEMO, Sydney: URL: www.aemo.com.au/Electricity/Planning/Related-Information/Generation-Information.
Australian Energy Markets Operator 2016b, Facilities, AEMO, Perth. URL: data.wa.aemo.com.au/#facilities.
Australian Government Department of Foreign Affairs and Trade 2015a, Country and TRIEC Pivot Table 2014–15, DFAT, Canberra.
Australian Government Department of Industry Innovation and Science 2016a, Resources and Energy Quarterly: Historical data June 2016, DIIS, Canberra.
Australian Rail Track Corporation 2015, 2015-2024 Hunter Valley Corridor Capacity Strategy, ARTC, Adelaide.
BHP Billiton 2012a, Form 20-F: Annual Report Pursuant to Section 13 or 15 (d) of The Securities Exchange Act of 1934 for the Fiscal Year Ended 30 June 2012, BHP Billiton, Washington.
BHP Billiton 2012b, Annual Report Financial Year 2012, BHP Billiton, Melbourne.
BHP Billiton 2015a, BHP Billiton Annual Report 2015, BHP Billiton, Melbourne.
BHP Billiton 2015b, BMA’s Hay Point Expansion project celebrates docking milestone, BHP Billiton, Melbourne. URL: www.bhpbilliton.com/investors/news/bmas-hay-point-expansion-project-celebrates-docking-milestone.
Bloomfield Group 2012, Bloomfield Colliery Annual Environmental Management Report 2011-2012, Bloomfield Group.
Bloomfield Group 2015, Rix Creek Mine – Continuation of Mining Project: Environmental Impact Statement, Bloomfield Group, Ashtonfield. URL: smajorprojects.affinitylive.com/public/eef8fb95aacd5aa75c72f5ae1b3d50c8/01.%20Rix's%20Creek%20EIS_Main%20Report_Part%20A.pdf.
Bloomfield Group 2016, Bloomfield Colliery Annual Environmental Management Report 2015, Bloomfield Group, Ashtonfield. URL: www.bloomcoll.com.au/Portals/5/Files/Bloomfield%20AEMR%202015.pdf.
BlueScope Steel 2012, Annual Report 2011-2012, BlueScope Limited, Melbourne.
BlueScope Steel 2013, FY2013 Financial Results Report, BlueScope Limited, Melbourne.
BlueScope Steel 2015a, FY2015 Financial Results Presentation, BlueScope Limited, Melbourne. URL: ss3-ap-southeast-2.amazonaws.com/bluescope-corporate-umbraco-media/media/1923/fy2015-investor-presentation_240815.pdf.
BlueScope Steel 2015b, BlueScope Annual Report 2014/15, BlueScope Limited, Melbourne. URL: ss3-ap-southeast-2.amazonaws.com/bluescope-corporate-umbraco-media/media/1905/bluescope-annual-report.pdf.
BlueScope Steel 2015c, BlueScope Stakeholder Submission – 2016 ARTC Hunter Valley Coal Network Access Undertaking Development Class, BlueScope Limited, Melbourne.
4
27
Boral 2012, Cement Manufacturing at Berrima (Fact Sheet/Brochure), Boral, Sydney.
Boral 2013, Boral Construction Materials & Cement: Investor Strategy Day and Site Tour, Boral Ltd, Sydney.
Boral 2016, Boral Berrima Cement Works and (Medway) Colliery, Boral, Sydney. URL: www.boral.com.au/article/berrima_cement_operations.asp.
Bureau of Infrastructure, Transport and Regional Economics 2016, International cargo statistics (unpublished data), ABS, Canberra.
Cement Australia 2011, Public EEO Report 2011, Cement Australia, Darra.
Cement Australia 2013, Manufacturing: Railton, TAS, Cement Australia, Darra. URL: www.cementaustralia.com.au/wps/wcm/connect/website/cement/home/about-us/manufacturing/man-railton/. Accessed: November 2013.
Cement Australia 2016a, Railton, TAS, Cement Australia, Darra. URL: www.cementaustralia.com.au/wps/wcm/connect/website/cement/home/people-careers/our-locations-pc/railton/.
Cement Australia 2016b, Cornwall Coal, Cement Australia, Darra. URL: www.cementaustralia.com.au/wps/wcm/connect/website/cement/home/about-us/subsidiaries/cornwall-coal.html
Cement Industry Federation 2011, Sustainability Report 2011, CIF, Canberra.
Cement Industry Federation 2016, Australian Cement Industry Statistics 2015, CIF, Canberra.
Centennial Coal 2010, Maldon to Dombarton Rail Link Feasibility Study Submission, Centennial Coal, Sydney.
Centennial Coal 2012a, Centennial Coal Operations: Airly, Centennial Coal, Sydney. URL: www.centennialcoal.com.au/Operations/OperationsList/Airly.aspx, Accessed: November 2013.
Centennial Coal 2012b, Centennial Coal Operations: Angus Place, Centennial Coal, Sydney. URL: www.centennialcoal.com.au/Operations/OperationsList/Angus-Place.aspx, Accessed: November 2013.
Centennial Coal 2012c, Centennial Coal Operations: Charbon, Centennial Coal, Sydney. URL: www.centennialcoal.com.au/Operations/OperationsList/Charbon.aspx, Accessed: November 2013.
Centennial Coal 2012d, Centennial Coal Operations: Clarence, Centennial Coal, Sydney. URL: www.centennialcoal.com.au/Operations/OperationsList/Clarence.aspx, Accessed: November 2013.
Centennial Coal 2012e, Centennial Coal Operations: Ivanhoe, Centennial Coal, Sydney. URL: www.centennialcoal.com.au/Operations/OperationsList/Ivanhoe.aspx, Accessed: November 2013.
Centennial Coal 2012f, Centennial Coal Operations: Mandalong, Centennial Coal, Sydney. URL: www.centennialcoal.com.au/Operations/OperationsList/Mandalong.aspx, Accessed: November 2013.
Centennial Coal 2012g, Centennial Coal Operations: Mannering, Centennial Coal, Sydney. URL: www.centennialcoal.com.au/Operations/OperationsList/Mannering.aspx, Accessed: November 2013.
Centennial Coal 2012h, Centennial Coal Operations: Myuna, Centennial Coal, Sydney. URL: www.centennialcoal.com.au/Operations/OperationsList/Myuna.aspx, Accessed: November 2013.
Centennial Coal 2012i, Centennial Coal Operations: Newstan, Centennial Coal, Sydney. URL: www.centennialcoal.com.au/Operations/OperationsList/Newstan.aspx, Accessed: November 2013.
Centennial Coal 2012j, Centennial Coal Operations: Springvale, Centennial Coal, Sydney. URL: www.centennialcoal.com.au/Operations/OperationsList/Springvale.aspx, Accessed: November 2013.
Centennial Coal 2012k, Newstan Colliery (Mod 5) Environmental Assessment, Centennial Coal, Sydney.
Centennial Coal 2015a, Annual Environmental Management Report 2014 Centennial Mandalong Mine, Centennial Coal, Sydney. URL: data.centennialcoal.com.au/domino/centennialcoal/cc205.nsf/0/C6B7479933A7E706CA257E75001B849F/$file/AEMR%20DPE%20Version%202%202014%20Final.pdf.
4
28
Centennial Coal 2015b, Annual Environmental Management Report 2014 Myuna Mine, Centennial Coal, Sydney. URL: data.centennialcoal.com.au/domino/centennialcoal/cc205.nsf/0/0598E6612646F31DCA257E2D000DFA57/$file/AEMR%202014%20and%20Plans.pdf.
Centennial Coal 2015c, Operations: Newstan, Centennial Coal, Sydney. URL: www.centennialcoal.com.au/Operations/OperationsList/Newstan.aspx.
Centennial Coal 2015d, Annual Environmental Management Report 2014 Springvale Colliery, Centennial Coal, Sydney. URL: data.centennialcoal.com.au/domino/centennialcoal/cc205.nsf/0/56FA4A05F4077CDDCA257F1B00113FFB/$file/AEMR%202014.pdf.
Centennial Coal 2015e, Airly Mine Annual Environmental Management Report 2014, Centennial Coal, Sydney. URL: data.centennialcoal.com.au/domino/centennialcoal/cc205.nsf/0/7D80B05125595BD2CA257E1900095D90/$file/Airly%20Mine%202014%20Annual%20Review.pdf.
Centennial Coal 2015f, Annual Environmental Management Report 2014 Charbon Colliery, Centennial Coal, Sydney. URL: data.centennialcoal.com.au/domino/centennialcoal/cc205.nsf/0/429741631D7C45DFCA257E3C00131CD1/$file/2014%20CHARBON%20AEMR%20-%20Final%20%20and%20apprendices.pdf.
Centennial Coal 2015g, Annual Environmental Management Report 2014 Clarence Colliery, Centennial Coal, Sydney. URL: data.centennialcoal.com.au/domino/centennialcoal/cc205.nsf/0/6BE9FAEC7524EB93CA257E7D001ECBF7/$file/CLARENCE%202014%20ANNUAL%20ENVIRONMENTAL%20MANAGEMENT%20REPORT.pdf.
CLP 2015, Annual Report 2015, CLP, Hong Kong.
CoalPac 2014, Operations: Cullen Valley, CoalPac, Cullen Bullen. URL: cetresources.com/operations/cullen-valley-mine
Cockatoo Coal 2015, Annual Report 2015, Cockatoo Coal, Brisbane. URL: www.cockatoocoal.com.au/cok/assets/File/AnnualReports/2015/27_10_15%20Annual%20Report%20NOM%20and%20proxy%20for%20release%20.pdf.
CS Energy 2012, CS Energy Annual Report 2011–12, CS Energy, Fortitude Valley.
CS Energy 2014, Electricity Generation at Callide Power Station, CS Energy, Fortitude Valley. URL: www.csenergy.com.au/userfiles/file/CSE_GENERATION_CALLIDE_A4_310714.pdf
CS Energy 2015, CS Energy Annual Report 2014–15, CS Energy, Fortitude Valley.
CS Energy 2016, Gladstone Power Station, CS Energy, Fortitude Valley. URL: www.csenergy.com.au/content-(172)-gladstone%20.htm.
Daelim Energy 2015, Millmerran Power Station, Daelim Energy, Seoul. URL: www.daelimenergy.com/workingAssets/millmerranPowerStation.html.
Dalrymple Bay Coal Terminal 2016, About Us, DBCT, Hay Point. URL: www.dbct.com.au/about-us.
Delta Electricity 2011, Sustainability Report 2010-11, Delta Electricity, Sydney.
Delta Electricity 2012, Sustainability Report 2011–12, Delta Electricity, Sydney.
Department of Industry (New South Wales Government) 2015a, New South Wales Coal Investment Profile 2014, Department of Industry, Sydney. URL: www.resourcesandenergy.nsw.gov.au/investors/investment-opportunities/coal/coal.
Department of Industry (New South Wales Government) 2015b, NSW Coal Industry Profile 2014, Department of Industry, Sydney.
Department of Manufacturing Innovation Trade Resources and Energy (South Australian Government) 2013a, South Australian Mineral Explorers Guide, DMITRE, Adelaide.
Department of Manufacturing Innovation Trade Resources and Energy (South Australian Government) 2013b, South Australian Mineral Resource Production Statistics for the six month ended 30th June 2012, DMITRE, Adelaide.

4
29
Department of Natural Resources and Mines (Queensland Government) 2016a, Coal Industry Review Statistics: Production by individual mines, DNRM, Brisbane. URL: sdata.qld.gov.au/dataset/coal-industry-review-statistical-tables/resource/9c3c1aaf-0afa-4e58-b67c-75c0d3574abd.
Department of Natural Resources and Mines (Queensland Government) 2016b, Coal Industry Review Statistics: Total coal exports by coal type, DNRM, Brisbane. URL: sdata.qld.gov.au/dataset/coal-industry-review-statistical-tables/resource/6a4b92fc-b277-40d2-af6c-26ea14cad6f6.
Department of State Development (Queensland Government) 2012, Coal Infrastructure Network, DSD, Brisbane. URL: www.statedevelopment.qld.gov.au/infrastructure-planning/coal-infrastructure-network.html
Department of State Development (Queensland Government) 2016a, Environmental Impact Statement Volume 2: Abbott Point Growth Gateway Project, DSD, Brisbane. URL: www.statedevelopment.qld.gov.au/major-projects/abbot-point-growth-gateway-project.html.
Department of State Development (Queensland Government) 2016b, Dudgeon Point Coal Terminals Project, DSD, Brisbane. URL: www.statedevelopment.qld.gov.au/assessments-and-approvals/dudgeon-point-coal-terminals-project.html.
Department of Transport and Main Roads (Queensland Government) 2016, Coal transport infrastructure development, DTMR, Brisbane. URL: www.tmr.qld.gov.au/business-industry/Transport-sectors/Coal-transport-infrastructure-development.
Dulaney M. and Reid K. 2016, End of an era: final day of coal-fired power generation in Port Augusta, ABC News, Canberra. URL: www.abc.net.au/news/2016-05-09/port-augusta-power-plant-closure-alinta/7391362.
Energetics 2012, Australian Steel Chain Footprint Project, Energetics, Sydney.
Energy Australia 2012a, Pine Dale Mine, Energy Australia, Melbourne.
Energy Australia 2012b, Yallourn Social and Environmental Performance Summary 2012, Energy Australia, Melbourne.
Energy Australia 2013, Yallourn Power Station: Generation and Assets, Energy Australia, Melbourne.
Energy Australia 2016, Yallourn Power Station, Energy Australia, Melbourne. URL: www.energyaustralia.com.au/about-us/what-we-do/generation-assets/yallourn-power-station.
Environmental Protection Authority (Western Australia) 2005, Bluewaters Power Station: Report and recommendations of the Environmental Protection Authority, EPA Western Australia, Perth.
GDF Suez 2010, Hazelwood (Factsheet), GDF Suez, Paris.
GDF Suez 2013, Hazelwood Power Station and Mine, GDF Suez, Paris.
GDF Suez 2016, Hazelwood Power Station and Mine, GDF Suez, Paris. URL: www.gdfsuezau.com/about-us/asset/Hazelwood-Power-Station-and-Mine.
Geoscience Australia 2012, Operating Mines dataset, Geoscience Australia, Canberra.
Geoscience Australia 2015, Australia’s Identified Mineral Resources 2015, Geoscience Australia, Canberra.
Geoscience Australia 2016, Operating Mines dataset, Geoscience Australia, Canberra. URL: www.australianminesatlas.gov.au/mapping/downloads.html.
Gladstone Ports Corporation 2011, Port of Gladstone Information Handbook 2011, Gladstone Ports Corporation, Gladstone.
Gladstone Ports Corporation 2015a, Trade Statistics, Gladstone Ports Corporation, Gladstone. URL: www.gpcl.com.au/Pages/Trade-Statistics.aspx.
Gladstone Ports Corporation 2015b, Annual Report 2014/15, Gladstone Ports Corporation, Gladstone.
Gladstone Ports Corporation 2015c, Gladstone Coal Port, Gladstone Ports Corporation, Gladstone.
Gladstone Ports Corporation 2016, Barney Point Terminal Closure of Coal Operations, Gladstone Ports Corporation, Gladstone. URL: gpcl.com.au/Pages/BPT-Coal-Closure.aspx.
Gujarat NRE Coking Coal 2012, Quarterly Report April-June 2012, Gujarat NRE, Kolkata.
GVK Hancock 2016, Our Assets, GVK Hancock, Brisbane. URL: gvkhancockcoal.com/our-assets/rail-port.
4
30
Hansen Bailey 2012, Regulatory Compliance Audit Report: Muswellbrook Coal Mine, prepared for Muswellbrook Coal, Muswellbrook.
Hazelwood Mine Fire Inquiry 2015, Hazelwood Mine Fire Inquiry Report 2015/2016 Volume I – Anglesea Mine, Victorian Government, Melbourne. URL: www.parliament.vic.gov.au/file_uploads/10529B_HAZ_Inquiry_Report-Anglesea-LR_hnkT5rBX.pdf.
Humphries G. 2015, Increase in Port Kembla Coal Exports, Illawarra Mercury, Wollongong. URL: www.illawarramercury.com.au/story/3311265/increase-in-port-kembla-coal-exports/.
Hunter Valley Coal Chain Coordinator 2012, Map of Operations, HVCCC, Broadmeadow. URL: swww.hvccc.com.au/AboutUs/Pages/MapOfOperationsV3.aspx.
Idemitsu 2014, Annual Environmental Management Report 2013-2014, Idemitsu Australia Resources, Brisbane. URL: sidemitsu.com.au/uploads/files/Mccenviro/Env_Reports/2013_14_AEMR_FINAL.pdf.
Idemitsu 2015a, Boggabri Coal Mine 2014 Annual Environmental Management Report, Idemitsu Australia Resources, Brisbane. URL: sidemitsu.com.au/wp-content/uploads/2014-AEMR.pdf.
Idemitsu 2015b, Presentation on Results for FY 2014, Idemitsu Kosan Co. Ltd, Tokyo. URL: v4.eir-parts.net/v4Contents/View.aspx?template=ir_material&sid=39084&code=5019.
Idemitsu 2015c, Annual Environmental Management Report July 2014 – December 2014, Idemitsu Australia Resources, Brisbane. URL: sidemitsu.com.au/uploads/files/Mccenviro/Env_Reports/Jul_14_Dec_14_AEMR_Document.pdf.
Idemitsu 2016a, Boggabri Coal Expansion Project, Idemitsu Australia Resources, Brisbane. URL: sidemitsu.com.au/projects/boggabri-coal-expansion-project/.
Idemitsu 2016b, Ensham Resources, Idemitsu Australia Resources, Brisbane. URL: swww.idemitsu.com.au/operations/ensham-resources/.
Idemitsu Boggabri Coal 2012, Annual Environmental Management Report Boggabri Coal, Idemitsu Boggabri Coal, Brisbane.
Jellinbah Group 2016, Jellinbah Group, Jellinbah Group, Brisbane. URL: www.jellinbah.com.au/.
LakeCoal 2012, Chain Valley Colliery Annual Review 2011-2012, LakeCoal, Rutherford.
LakeCoal 2015, Chain Valley Colliery Annual Review 2014, LDO Coal, Rutherford. URL: www.chainvalleymine.com.au/wp-content/uploads/2012/04/RPT-D-19251-Annual-Review-2014.pdf.
Lanco 2015, Annual Report 2014–15, Lanco Infratech Ltd, Hyderabad.
Lawson R. 2010, Griffin’s Worsley contract in doubt, Business News Western Australia, Perth. URL: swww.businessnews.com.au/article/Griffins-Worsley-contract-in-doubt.
Macquarie Generation 2012, Annual Report 2012, Macquarie Generation, Lambton.
Newcastle Coal Infrastructure Group 2015, History, NCIG, Newcastle. URL: www.ncig.com.au/Home/History/tabid/89/Default.aspx.
New Hope Group 2015, 2015 Annual Report, New Hope Group, Brookwater, URL: www.newhopegroup.com.au/files/files/Annual%20Report%202015.pdf.
New Hope Group 2016, Financial Results Release Half Year Ended 31 January 2016, New Hope Group, Brookwater, URL: www.newhopegroup.com.au/files/files/Half%20Yearly%20Presentation.pdf.
New South Wales Minerals Council 2016, Coal Train Dust Management – Hunter Valley Coal Industry, NSW Minerals Council, Sydney.
North Queensland Bulk Ports Corporation 2012, Port of Abbott Point Port Handbook, NQBPC, Brisbane.
North Queensland Bulk Ports Corporation 2015a, Port of Hay Point Port Handbook, NQBPC, Brisbane. URL: www.nqbp.com.au/wp-content/uploads/2016/01/Port-of-Hay-Point-Port-Handbook-11.01.16.pdf.
North Queensland Bulk Ports Corporation 2015b, Port of Abbott Point Port Handbook, NQBPC, Brisbane. URL: www.nqbp.com.au/wp-content/uploads/2016/01/Port-of-Abbot-Point-Port-Handbook-11.01.16.pdf.
4
31
North Queensland Bulk Ports Corporation 2016, The Port of Abbott Point, NQBPC, Brisbane. URL: www.nqbp.com.au/wp-content/uploads/2016/04/Port-of-Abbot-Point-Factsheet.pdf.
NRG Gladstone Power Station 2013, About Us: The Process, NRG Gladstone, Gladstone.
NRG Gladstone Power Station 2016, About Us: The Process, NRG Gladstone, Gladstone. URL: www.nrggos.com.au/page/About_Us/The_Process/.
Origin Energy 2014, Origin Energy Submission on the ARTC Final Indicative Service Variation, Origin Energy, Sydney.
Pacific National 2016, Pacific National Coal, Asciano Limited, Sydney. URL: asciano.com.au/pacific-national/coal.
Peabody Energy 2012, Metropolitan Coal (Factsheet), Peabody Energy, St Louis.
Peabody Energy 2013a, Operations: Australia Mining – Wilpinjong, Peabody Energy, St Louis. URL: www.peabodyenergy.com/content/405/Australia-Mining-New/New-South-Wales/Wilpinjong-Mine. Accessed: November 2013.
Peabody Energy 2013b, Wambo Coal (Factsheet), Peabody Energy, St Louis.
Peabody Energy 2015, 2014 Annual Report and 10-K (Calendar Year), Peabody Energy, St. Louis.
Peabody Energy 2016, 2015 Sales, Peabody Energy, St. Louis, URL: www.peabodyenergy.com/content/2622/sales-and-trading/2015-sales.
Pickles S. 2014, New power stations in WA as Kwinana closes, Business News, Perth, URL: www.businessnews.com.au/article/New-power-stations-in-WA-as-Kwinana-closes.
Port Kembla Port Corporation 2013, M202 Rail Access Regime Submission, Port Kembla Port Corporation, Wollongong. URL: www.transport.nsw.gov.au/sites/default/files/b2b/freight/rail-access-review-port-kembla-port-corp.pdf.
Port Kembla Coal Terminal 2015, Annual Environmental Management Report 2014–15, PKCT, Wollongong. URL: www.pkct.com.au/uploads/735/1415-aemr_pkct_final.pdf.
Port Kembla Coal Terminal 2016, Shareholders, PKCT, Wollongong. URL: www.pkct.com.au/shareholders/
Port of Brisbane 2015, June 2015 Monthly Trade Report, Port of Brisbane Pty Ltd, Brisbane. URL: swww.portbris.com.au/PortBris/media/General-Files/MTR/2015/June-2015-Monthly-Trade-Report.pdf.
Port of Brisbane 2016, Shipping Handbook 2015/2016, Port of Brisbane Pty Ltd, Brisbane.
Ports Australia 2012, Ports Australia Statistics: Coal Exports (mass tonnes) for 2011/2012, Ports Australia, Sydney. URL: www.portsaustralia.com.au/tradestats/?id=9&period=12.
Port of Newcastle 2015, Newcastle Trade Report 2015, Port of Newcastle, Newcastle.
Port of Newcastle 2016, Berths and Facilities, Port of Newcastle, Newcastle. URL: www.portofnewcastle.com.au/Shipping--Operations/Berths--Facilities/.
Port Waratah Coal Services 2016a, ‘Carrington Coal Terminal’, PWCS, Kooragang Island. URL: pwcs.com.au/what-we-do/carrington-coal-terminal/.
Port Waratah Coal Services 2016b, ‘Kooragang Coal Terminal’, PWCS, Newcastle. URL: pwcs.com.au/what-we-do/kooragang-coal-terminal/.
Power Technology 2016, Milmerran Coal, Australia, Power Technology, London.
Premier Coal 2013, Our Customers, Premier Coal, Collie.
Premier Coal 2016a, Our Customers, Premier Coal, Collie. URL: www.premiercoal.com.au/Operations/our-customers.aspx.
Premier Coal 2016b, Coal Processing and Delivery, Premier Coal, Collie. URL: www.premiercoal.com.au/Operations/Coal_Processing_and_Delivery.aspx.
Queensland Bulk Handling 2016, About, QBH, Brisbane. URL: www.qbh.com.au/content/about.
4
32
Queensland Rail 2006, Western System Information Pack, Queensland Rail, Brisbane. URL: swww.queenslandrail.com.au/business/RegulatoryFramework/Documents/Maps/Western%20System%20Information%20Pack%20-%20Issue%202%20-%20March%2006.pdf.
Queensland Rail 2009, 2009 Coal Rail Infrastructure Master Plan, Queensland Rail, Brisbane.
Queensland Rail 2013, AU1 West Moreton Reference Tariff Reset Overall Submission, Queensland Rail, Brisbane.
Queensland Rail 2016a, The regional network, Queensland Rail, Brisbane. URL: swww.queenslandrail.com.au/forbusiness/the-regional-network.
Queensland Rail 2016b, West Moreton system, Queensland Rail, Brisbane. URL: swww.queenslandrail.com.au/forbusiness/the-regional-network/west-moreton-system.
Rio Tinto Coal Australia 2014a, Our Operations: Bengalla, Rio Tinto Coal Australia, Melbourne.
Rio Tinto Coal Australia 2014b, Our Operations: Hunter Valley, Rio Tinto Coal Australia, Melbourne.
Rio Tinto Coal Australia 2014c, Our Operations: Mt Thorley Warkworth, Rio Tinto Coal Australia, Melbourne.
Rio Tinto 2016, Rio Tinto Fourth Quarter Operations Review, Rio Tinto Limited, Melbourne. URL: www.riotinto.com/documents/160119_Rio%20Tinto%20releases%20solid%20fourth%20quarter%20production%20results.pdf.
South32 2016, Illawarra Metallurgical Coal, South32, Perth. URL: swww.south32.net/our-operations/australia/illawarra-coal.
Stevens M. 2015, Aurizon stunned by WICET fee grab, Australian Financial Review, Melbourne. URL: www.afr.com/business/mining/coal/aurizon-stunned-by-wicet-fee-grab-20151005-gk1plp.
Stanwell 2012, Stanwell Annual Report 2011–12, Stanwell, Brisbane.
Stanwell 2015a, Stanwell Annual Report 2014–15, Stanwell, Brisbane.
Stanwell 2015b, Stanwell Power Station (Fact Sheet), Stanwell, Brisbane.
Synergy 2015, Annual Report 2015, Synergy, Perth.
Stanwell 2015c, Tarong Power Stations (Fact Sheet), Stanwell, Brisbane.
Tarrawonga Coal 2011, Tarrawonga Coal Project: Project Application and Preliminary Environmental Assessment, Tarrawonga Coal.
Transport for New South Wales 2013, NSW Freight and Ports Strategy, TfNSW, Sydney. URL: freight.transport.nsw.gov.au/documents/tfnsw-freight-and-ports-strategy-high-res.pdf.
Vale (Integra Coal Operations Ltd) 2013, Annual Review: Integra Mine Complex, Vale, Brisbane.
Vale Australia 2014, Factsheet: Carborough Downs, Vale SA, Brisbane. URL: www.vale.com/australia/en/aboutvale/publications/factsheets/factsheet%20-%20carborough%20downs.pdf.
Verve Energy 2008, Kwinana Power Station: Coal Burning Environmental Improvement Plan 2008/2009, Verve Energy, Perth.
Verve Energy 2012, Muja Power Station (Fact Sheet), Verve Energy, Perth.
Wesfarmers 2015, 2015 Full-Year Results Supplementary Information, Wesfarmers Limited, Perth. URL: swww.wesfarmers.com.au/document/investors/asx-announcements/2015/1434-2015-full-year-results-supplementary-information.html
Whitehaven Coal 2012, Quarterly Report to 31 March 2012, Whitehaven Coal, Sydney.
Whiting N. 2016, Leigh Creek for sale after Alinta Energy closes SA coal mine, ABC News, Canberra. URL: www.abc.net.au/news/2016-01-22/sa-outback-town-leigh-creek-for-sale/7107922.
Wiggins Island Coal Export Terminal 2016a, Construction and Commissioning, WICET, Gladstone. www.wicet.com.au/irm/content/construction-and-commissioning.aspx?RID=322.
Wiggins Island Coal Export Terminal 2016b, WICET Corporate Brochure, WICET, Gladstone. URL: wicet.live.irmau.com/irm/content/pdf/WICET%20Corporate%20Brochure.pdf.

4
33
Witson R. 2014, Coal-fired power station to close in Latrobe Valley, despite $50 million federal bailout, ABC News, Canberra. URL: www.abc.net.au/news/2014-07-29/vic-coal-power-station-to-close2c-despite-bail-out/5633580.
World Coal Association 2013a, Coal Facts 2013, WCA, London.
World Coal Association 2013b, Uses of Coal: Coal & Cement, WCA, London. URL: www.worldcoal.org/coal/uses-of-coal/coal-cement/.
World Coal Association 2014, Coal Facts 2014, WCA, London.
Xstrata Coal 2012, Baal Bone Community Newsletter March 2012, Xstrata Coal, Baal Bone.
Xstrata Coal 2013, Annual Report 2012, Xstrata, Sydney.
Yancoal 2012a, Ashton Coal Mine Fact Sheet, Yancoal, Sydney.
Yancoal 2012b, Austar Coal Mine Fact Sheet, Yancoal, Sydney.
Yancoal 2012c, Donaldson Coal Mine Fact Sheet, Yancoal, Sydney.
Yancoal 2012d, Duralie and Stratford Coal Mines Fact Sheet, Yancoal, Sydney.
Yancoal 2012e, Moolarben Coal Mine Fact Sheet, Yancoal, Sydney.
Yancoal 2016a, All Mine Sites: Ashton, Yancoal, Sydney. URL: www.yancoal.com.au/page/assets/mine-sites/ashton/
Yancoal 2016a, All Mine Sites: Moolarben, Yancoal, Sydney. URL: www.yancoal.com.au/page/assets/mine-sites/moolarben/
Yancoal 2016b, All Mine Sites: Austar, Yancoal, Sydney. URL: www.yancoal.com.au/page/assets/mine-sites/austar/
Yancoal 2016c, All Mine Sites: Donaldson, Yancoal, Sydney. URL: www.yancoal.com.au/page/assets/mine-sites/donaldson/
Yancoal 2016d, All Mine Sites: Stratford Duralie, Yancoal, Sydney. URL: www.yancoal.com.au/page/assets/mine-sites/stratford-duralie/
Yanzhou Coal Mining 2015, 2015 Annual Report, Yanzhou Coal Mining Company Limited, Zoucheng. URL: www.yanzhoucoal.com.cn/en/announcement/img/site8/20160418/100ba9c2c880187ecad303.pdf.
4
34
© Commonwealth of Australia 2016
ISSN 1440-9593
ISBN 978-1-925401-90-5
September 2016 / INFRA 3033
This information sheet was produced by Teddy Kurniawan, James Wilson and David Mitchell of BITRE’s Infrastructure and Corridor Analysis Section. For further information on this publication please phone (02) 6274 7818 or email [email protected].
Creative Commons Attribution 3. Australia Licence is a standard form licence agreement that allows you to copy, communicate and adapt this publication provided that you attribute the work to the Commonwealth and abide by the other licence terms. A summary of the licence terms is available from http://creativecommons.org/licenses/by/3./au/deed.en. The full licence terms are available from http://creativecommons.org/licenses/by/3./au/legalcode.
This publication should be attributed in the following way: Bureau of Infrastructure, Transport and Regional Economics (BITRE) 2016, Freightline 4 – Australian coal freight transport, BITRE, Canberra.
Use of the Coat of Arms The Department of the Prime Minister and Cabinet sets the terms under which the Coat of Arms is used. Please refer to the Department’s Commonwealth Coat of Arms and Government Branding web page http://www.dpmc.gov.au/guidelines/index.cfm#brand and in particular, the Guidelines on the use of the Commonwealth Coat of Arms publication.
Contact us This publication is available in PDF format. All other rights are reserved, including in relation to any Departmental logos or trademarks which may exist. For enquiries regarding the licence and any use of this publication, please contact:
Department of Infrastructure and Regional Development Bureau of Infrastructure, Transport and Regional Economics (BITRE) GPO Box 501, Canberra ACT 2601, Australia
Phone: (international) +61 2 6274 7210 Fax: (international) +61 2 6274 6855 Email: [email protected] Website: www.bitre.gov.au