at village: kathi devaliya, tal: khambalia, …dist: jamnagar, gujarat draft environmental impact...
TRANSCRIPT
AT VILLAGE: KATHI DEVALIYA, TAL: KHAMBALIA,
DIST: JAMNAGAR, GUJARAT
DRAFT ENVIRONMENTAL IMPACT AND RISK ASSESSMENT REPORT FOR PROPOSED 600 (4X150) MW PET COKE/IMPORTED COAL BASED THERMAL
POWER PLANT
M/S. ESSAR POWER SALAYA LTD. M/S. ESSAR POWER SALAYA LTD.
PREPARED BY: ANAND CONSULTANTSANAND CONSULTANTS
(ISO 9001:2008 CERTIFIED)NABET/QCI ACCRIDITED (S. N. - 3 OF PA LIST)
16, Everest Tower, Naranpura, Ahmedabad - 380 013Tel.: 079 2748481, Fax: 079 27480116
Email:[email protected]
November 2011November 2011

CONTENTS
List of Chapters List of Tables List of Figures List of Annexure Executive Summary (English & Gujarati) Sr. No.
Title Page no.
Chapter 1: Introduction 1.1 Promoters and their Background 1-1 1.2 Need and Justification of the Project 1-1 1.3 Project Proposal 1-2 1.4 Project cost 1-2 1.5 Project Implementation Schedule 1-2 1.5.1 Pre construction activities 1-2 1.5.2 Construction activities 1-2 1.6 Statutory Requirements 1-2 1.7 Terms of Reference (ToR) for EIA study 1-3 1.8 Objectives of EIA 1-3 1.9 Methodology of EIA 1-3 1.9.1 Base Line Environmental Condition 1-3 1.9.2 Ambient Air Environment 1-3 1.9.3 Ground and Surface Water Environment 1-4 1.9.4 Noise Environment 1-4 1.9.5 Soil Environment 1-4 1.9.6 Biological Environment 1-4 1.9.7 Socio-economic Environment 1-4 1.9.8 Identification of Pollution Source 1-4 1.9.9 Evaluation of Pollution Control and Environmental
Management Systems 1-4
1.9.10 Evaluation of Impact 1-5 1.9.11 Preparation of Environmental Management Plan 1-5 1.10 Structure of Report 1-5 1.11 Compliance to the TOR conditions 1-6 Chapter 2: Project Description and Infrastructural Facilities 2.1 Project Setting 2-1 2.1.1 Location 2-1 2.1.2 Salient Features of the Project 2-1 2.1.3 Site Selection 2-1 2.2 Project Cost 2-4 2.3 Main Phases of the Project 2-4
2.3.1 Pre construction activities 2-4 2.3.2 Construction Activities 2-4 2.3.3 Project Description 2-4 2.4 Power Evacuation 2-16 2.5 Raw Material Consumption, Storage, Handling &
Transportation 2-16
2.5.1 Coal Handling System 2-18 2.5.2 Fuel Oil Requirement and Mode of Transport of Fuel Oil to Site 2-18 2.6 Infrastructure Facilities 2-16 2.6.1 Land 2-19 2.6.2 Water and Wastewater 2-20 Chapter 3: Baseline Environmental Status 3.1 Baseline Environmental Status 3-1 3.2 Micro-Meteorology of The Area 3-1 3.2.1 Secondary Data 3-1 3.2.2 Primary data 3-3 3.2.3 Mixing Height 3-6 3.3 Air Environment 3-6 3.3.1 Design of Network for Ambient Air Quality Monitoring
Locations 3-6
3.3.2 Methodology for Ambient Air Quality monitoring 3-6 3.3.3 Interpretation of Result 3-13 3.4 Noise Environment 3-16 3.4.1 Interpretation of Results 3-18 3.5 Water Environment 3-20 3.5.1 Drainage & Water Resource 3-20 3.5.2 Surface And Ground Water Quality 3-22 3.5.3 Surface Water Quality 3-23 3.5.4 Ground Water Quality 3-24 3.6 Land Environment 3-25 3.6.1 Geology 3-25 3.6.2 Regional Soil Characteristics 3-26 3.6.3 Soil Monitoring 3-29 3.6.4 Land Use Pattern 3-31 3.7 Biological Environment 3-34 3.7.1 Terrestrial Ecosystem 3-34 3.7.2 Aquatic Ecosystem 3-40 3.7.3 Marine National Park And Marine Sanctuary (MNP/MS) 3-41 3.7.4 Agricultural Diversity 3-42 3.7.5 Livestock 3-42 3.8 Socio-Economic & Ethnicity 3-43 3.8.1 Overview 3-43 3.8.2 Population 3-43 3.8.3 Population Growth 3-44
3.8.4 Population Density 3-44 3.8.5 Sex Ratio 3-45 3.8.6 Indigenous Population 3-45 3.8.7 Literacy Profile 3-46 3.8.8 Employment Pattern 3-48 3.8.9 Infrastructure 3-51 Chapter 4: Environmental Impacts 4.1 Impacts and Mitigation Measures during Construction Activity 4-1 4.1.1 Impact on Land 4-2 4.1.2 Impact on Surface Drainage 4-2 4.1.3 Impact on Air Quality 4-2 4.1.4 Impact on Water Resources 4-3 4.1.5 Impact on Noise levels 4-3 4.1.6 Impact on Ecology 4-4 4.1.7 Impact on Public Health 4-4 4.1.8 Impact on Demography & Socio-economics 4-5 4.2 Impacts and Mitigation Measures during Operation 4-5 4.2.1 Impact on Land 4-5 4.2.2 Impact on Air Quality 4-7 4.2.3 Impact on Water Resources 4-19 4.2.4 Impact on Noise levels 4-21 4.2.5 Impact on Ecology 4-22 4.2.6 Impact on Public Health 4-22 4.2.7 Impact on Traffic 4-23 4.2.8 Impact on Demography and Socio-economic 4-23 4.3 Overall Impact 4-24 Chapter 5: Environmental Management Plan 5.1 Mitigation Measures 5-1 5.1.1 Land Environment 5-1 5.1.2 Air Environment 5-1 5.1.3 Water Environment 5-2 5.1.4 Noise Environment 5-3 5.1.5 Flora and Fauna 5-3 5.1.6 Socio - Economic Impact 5-4 5.2 Summary of Anticipated Environmental Impacts and Mitigation 5-5 5.3 Environment Management Plan and Recommendations 5-8 5.3.1 Management during Construction Phase 5-8 5.3.2 Management during the Operation Phase 5-8 5.4 Environmental Monitoring 5-12 5.5 Monitoring and Reporting Procedure 5-13 5.6 Administration of Environmental Management 5-15 5.7 Capital and O&M Cost for Environmental Management
5-16
Chapter 6: Analysis of Alternatives Technology and Sites 6.1 Analysis for Alternative Technology 6-1 6.1.1 Fuel Alternatives 6-1 6.2 Site Alternatives 6-2 6.2.1 Site Selection Criteria 6-2 6.3 Alternative Sites Identified 6-4 6.3.1 Site Near Jhakhar Patia (close to state highway) 6-4 6.3.2 Site within EOL: Adjacent to Pet-coke Storage 6-7 6.3.3 Site within EOL; Adjacent to Captive Power Plan 6-9 6.4 Relative Assessment of Alternate Sites Identified 6-11 Chapter – 7: Additional Studies 7.1 Hydro-geological study of the project area 7-1 7.1.2 Hydrology 7-1 7.1.3 Climate 7-2 7.1.4 Quality of surface water 7-3 7.1.5 Hydrogeology 7-5 7.1.6 Ground Water Recharge 7-8 7.1.7 Ground Water Discharge 7-11 7.1.8 Present Status of Ground Water Development 7-11 7.1.9 Impact of power plant and ash pond on the surface drainage 7-12 7.1.10 Conclusions 7-12 7.2 Disaster Management Plan 7-13 7.2.1 Disasters 7-13 7.2.2 Objectives of Disaster Management Plan [DMP] 7-13 7.2.3 Emergencies 7-14 7.2.4 Emergency Organization 7-14 7.2.5 Emergency Responsibilities 7-15 7.2.6 Emergency Facilities 7-18 7.2.7 Emergency Actions 7-20 7.2.8 General 7-20 7.3 Offsite Emergency Preparedness Plan 7-21 7.3.1 Introduction 7-21 7.3.2 Aspects Proposed to be considered in the Offsite Emergency
Plan 7-23
7.3.3 Role of the Emergency Co-ordinating Officer 7-24 7.3.4 Role of the Local Authority 7-24 7.3.5 Role of Police 7-24 7.3.6 Role of Fire Authorities 7-24 7.3.7 Role of Health Authorities 7-24 7.3.8 Role of Government Safety Authority 7-25 7.4 Occupational Health and Safety 7-28 7.4.1 Occupational Health 7-28 7.4.2 Safety Plan 7-30 7.4.3 Safety Organization 7-31

7.4.4 Safety Circle 7-31 7.4.5 Safety Training 7-31 7.4.6 Health and Safety Monitoring Plan 7-32 7.5 Risk Assessment 7-32 7.5.1 Introduction 7-32 7.5.2 Approach to the Study 7-32 7.5.3 Hazard Identification 7-32 7.5.4 Hazard Assessment and Evaluation 7-33 7.5.5 Maximum Credible Accident Analysis (MCAA) 7-34 7.5.6 Coal Handling – Dust Explosion 7-38 7.5.7 Risk Assessment Summary 7-38 7.5.8 Risk Reduction Opportunities 7-38 Chapter – 8: Project Benefits 8.0 Improvements in The Physical Infrastructure 8-1 8.1 Improvement in The Social Infrastructure 8-1 8.2 Employment Potential 8-2 8.3 Corporate Social Responsibility 8-3 Chapter – 9: Consultant Engaged 9.1 Preface 9-1 9.2 Introduction 9-1 9.3 Areas of Interest 9-2 9.4 List of Technical Experts 9-5
LIST OF TABLES SR. NO.
TITLE PAGE NO
1.1 TOR Compliance 1-7 2.1 Performance Data for 4x150 MW Unit 2-6 2.2 Analysis of Coal Ash 2-12 2.3 Ash Generation Data 2-13 2.4 Storage Quantity of Raw Material 2-17 2.5 Analysis of Pet Coke 2-17 2.6 Analysis of Imported Coal 2-17 2.7 Storage Quantity of Raw Material 2-19 2.8 Analysis of Fuel Oil and LDO 2-19 2.9 Plant Water Requirements for 4X150 MW TPP 2-20 2.10 Sea Water Analysis 2-20 2.11 Effluent Generation and Disposal 2-21 3.1 Summary of Primary Meteorological Data 3-3 3.2 Mean Mixing Heights in The Study Area 3-6 3.3 Ambient Air Quality Monitoring Location 3-7 3.4 Ambient Air Quality in the Study Area (winter – 2009) 3-9 3.5 Ambient Air Quality of the Study Area (2010) 3-10 3.6 Ambient Noise Monitoring Location 3-16 3.7 Ambient Noise Level 3-17 3.8 Details of Surface Water Monitoring Locations 3-23 3.9 Details of Ground Water Monitoring Locations 3-23 3.10 Surface Water Quality 3-23 3.11 Ground Water Quality in The Study Area 3-24 3.12 Soil Sampling Location 3-29 3.13 Soil Quality in The Study Area 3-30 3.14 Landuse of The Study Area 3-31 3.15 Checklist of Terrestrial Flora in The Study Area 3-35 3.16 Local Distribution of Plant Species 3-37 3.17 Checklist of Mammalian Species in The Study Area 3-38 3.18 Checklist of Birds 3-38 3.19 Checklist of Reptilian Species in The Study Area 3-40 3.20 Demographic Profile in The Study Area 3-43 3.21 Population Distribution in The Study Area 3-45 3.22 Literacy Profile in The Study Area 3-47 3.23 Workforce Participation in The Study Area 3-48 3.24 Female Workforce Participation in The Study Area 3-50 3.25 Basic amenities in the study area 3-52 4.1 Typical Noise Levels Of Construction Equipment 4-4 4.2 Expected Solid Waste from Power Plant 4-6

4.3 Stack Parameters for 4 x 150 MW Pet coke and imported coal based power plant
4-7
4.4 Summary of ISCST3 Model Output For PM, SO2 and NOx 4-12 4.5 Details of Stack Emission From 483 Multi-Fuel Based Thermal
Power Plant 4-13
4.6 Summary of ISCST3 Model Output For PM, SO2 and NOx 4-18 4.7 Superimposed GLC values on monitored baseline values, µg/m3 4-18 4.8 Types of Wastewater Generation and Quantity 4-19 4.9 Major Noise Generating Sources 4-21 5.1 Anticipated Adverse Environmental Impacts And Mitigation 5-6 5.2 Waste Management at Proposed CCPP 5-9 5.3 Monitoring Schedule for Environmental Parameters 5-14 6.1 Relative Assessment of Sites Considered for Setting-Up 4 X 150
MW Power Plant of EPSL 6-12
7.1 Meteorological data as recorded at Jamnagar 7-5 7.2 Regional geology of the area 7-5 7.3 Offsite action plan 7-27 7.4 Major Hazardous Chemicals To Be Stored/Transported/Handled 7-33 7.5 Fuel Storage Tanks 7-33 7.6 Preliminary Hazard Analysis for Fuel Storage Area 7-33 7.7 Preliminary Hazard Analysis For Whole Plant In General 7-33 7.8 Damage Due to Incident Radiation Intensities 7-34 7.9 Radiation Exposure And Lethality 7-34 7.10 Scenarios Considered 7-35 7.11 Occurrence Of Various Radiation Intensities – Pool Fire 7-35
LIST OF FIGURES SR. NO.
TITLE PAGE NO
2.1 Location of The Project Site 2-2 2.2 Study Area for The Proposed Project 2-2 2.3 Layout Map of Plant 2-3 2.4 Coal Handling System Flow Diagram 2-18 3.1 Monthly Temperature (°C) Variation 3-2 3.2 Monthly Variation In Relative Humidity (%) 3-2 3.3 Monthly Variation In Rainfall 3-3 3.4 Wind-Rose Diagram For Study Period (January 21 To April 20)
2009 3-4
3.5 Cloud cover in the study area 3-5 3.6 Ambient air quality monitoring locations 3-8 3.7 Ambient levels of SPM 3-13 3.8 Ambient RSPM level in the study area (µg/m3) 3-14 3.9 Ambient SOX levels 3-14 3.10 Ambient levels of NOX 3-15 3.11 Location map of noise monitoring stations 3-17 3.12 Noise levels in the industrial area 3-18 3.13 Noise levels in the residential area 3-19 3.14 Noise levels in the commercial area 3-19 3.15 Drainage map of the study area 3-21 3.16 Surface water & ground water quality monitoring station map 3-22 3.17 Geological feature of the study area 3-27 3.18 Regional soil characteristics map in the study area 3-28 3.19 Soil monitoring location 3-29 3.20 Land use map of the study area 3-33 3.21 Vegetation in the study area 3-34 3.22 Sihan river with Prosopis scrub 3-40 3.23 Agricultural crops-jowar and groundnut cultivation 3-42 3.24 Population growth in the study area (1991-2001) 3-44 3.25 Population density in the study area 3-45 3.26 Indigenous population in the study area 3-46 3.27 Literacy profile in the study area 3-48 3.28 Work participation in the study area 3-49 3.29 Female workforce participation 3-51 4.1 Isopleths for PM, SO2 And NOX (4 ×150 MW TPP) 4-9 to 4-11 4.2 Isopleths for PM, SO2 And NOX (Cumulative Impact) 4-15 to 4-17 5.1 Organizational Structure of Environment Management 5-16 6.1 Google image of alternative sites assessed for proposed EPSL
power plant 6-4
6.2 Google image showing the proposed site 6.6.1 6-5 6.3 A typical view of the Site 6.6.1 6-6

6.4 Another typical view of the Site 6.6.1 6-6 6.5 Google image showing the proposed Site 6.6.2 6-8 6.6 A typical view of the Site 6.6.2 6-9 6.7 Another typical view of the Site 6.6.2 6-9 6.8 Google image showing the proposed Site 6.6.3 6-10 6.9 A typical view of the Site 6.6.3 6-10 6.10 Another typical view of the Site 6.6.3 6-11 7.1 Onsite Emergency Organization Chart 7-22 7.2 Offsite Emergency Plan 7-26 7.3 Risk Contour of LDO storage 7-36 7.4 Risk Contour of HFO storage 7-37
LIST OF ANNEXURES ANNEXURE
NO. TITLE
1. National ambient air quality standards 2. Damage risk criteria for hearing loss Occupational Safety & Health Administration
(OSHA) 3. CPCB recommendations for community noise exposure 4. CPCB standards classification of inland surface water 5. Indian standards specifications for drinking water 6. Indian standards for industrial and sewage effluents discharge 7. Primary Meteorological Data at Project Site 8. Corporate Social Responsibility (CSR) of Essar 9. HSE Management System 10. Essar Vision document 11. Management Plan (Marine National Park & Sanctuary, Gulf of Kutch, Jamnagar) 12. Traffic Monitoring Data 13. Copy of application submitted to SC of NBWL 14. Copy of application submitted to CWLW for authenticated map 15. Toposheet of the study area 16. Green belt development plan of Essar Vadinar Complex 17. Copy of Terms of Reference issued by MoEF, New Delhi 18. Copy of email communication for MOU 19. Water Balance Diagram 20. Item wise break-up of Land requirement 21. NABET/QCI Accreditation Certificate 22. Ambient air quality monitoring of additional parameters as per NAAQS, 2009

CHAPTER - 1
INTRODUCTION

1-1
M/s. Essar Power Salaya Limited (EPSL), an Essar Group company is setting up a Pet coke and imported coal based thermal Power Plant of 600 (4 x 150) MW capacity, at Kathi Devaliya village of Khambalia Taluka in Jamnagar District of Gujarat. 1.1 Promoters and their Background
The Essar Group is one of the leading business houses of India. It is actively involved in six-principle business areas of national importance such as steel, shipping, oil & gas, power, telecommunication & construction. The company has an asset base of over US $ 4.5 billion. Essar group’s steel complex at Hazira is a first fully integrated steel production facility for flat products in Western India which operates a 4.0 million tons per annum (MTPA) direct reduction iron plant and 4.5 MTPA hot rolled coil mill with requisite support facilities like captive port, lime & oxygen plant, power and other utilities.
Essar group also holds India’s first independent power company in private sector ‘Essar Power Ltd. (EPoL)’ to complete and operate on clean fuels (NG/NGL/LNG/Naphtha) with 1500 10 % MW Combine Cycle Power Plant (CCPP) at Hazira in Gujarat State.
Essar group has a refinery complex at Jamnagar with crude refining capacity of 14 MMTPA and the supporting facilities of product evacuation jetty, SPM, etc. It also operates a 4 MTPA pellet plant at Vizag, India. Essar has emerged as one of the largest exporter of flat products from India with a total export aggregating over US $ 1 billion for the last six years. PT Essar Dhananjaya operates a 0.4 MTPA cold rolling mill and 0.5 MTPA galvanizing plant near Jakarta in Indonesia.
1.2 Need and Justification of the Project
Power being an important requirement for sustained economic growth has always been a priority. With the advent of industrialization there has been a steady increase in the electricity. In view of above, it is essential to set up power generation plants to meet the planned power generation of the 11th Plan. For the Western Zone of India that covers large areas of high population and high industrial development, demand is much more. As against the State’s projected demand of 17000 MW, Gujarat has only 8000 MW. The documents such as 11th National Electricity Plan and review by Gujarat Urja Vikas Nigam Ltd (GUVNL) indicate substantial shortfall in the energy demand of the State. Furthermore, the demand is slated to grow at an annual rate of 10 %. The proposed power project is likely to reduce the peak power deficit of 9000 MW, to some extent. The entire western grid inclusive of Gujarat, Goa, Maharashtra and Madhya Pradesh, has an annual peak load growth of 8.75 % and the situation is likely to continue up to year 2020, indicating need for generating electricity for bridging the gap between the demand and supply. Government of India too, has formulated a policy to encourage participation by private sector (Indian or Foreign) in the electricity generation, supply and distribution field.
The present project proposes to utilize petroleum coke, which is usually disposed off without any benefits, for generating power and assumes significance in the wake of current power scenario.
1-2
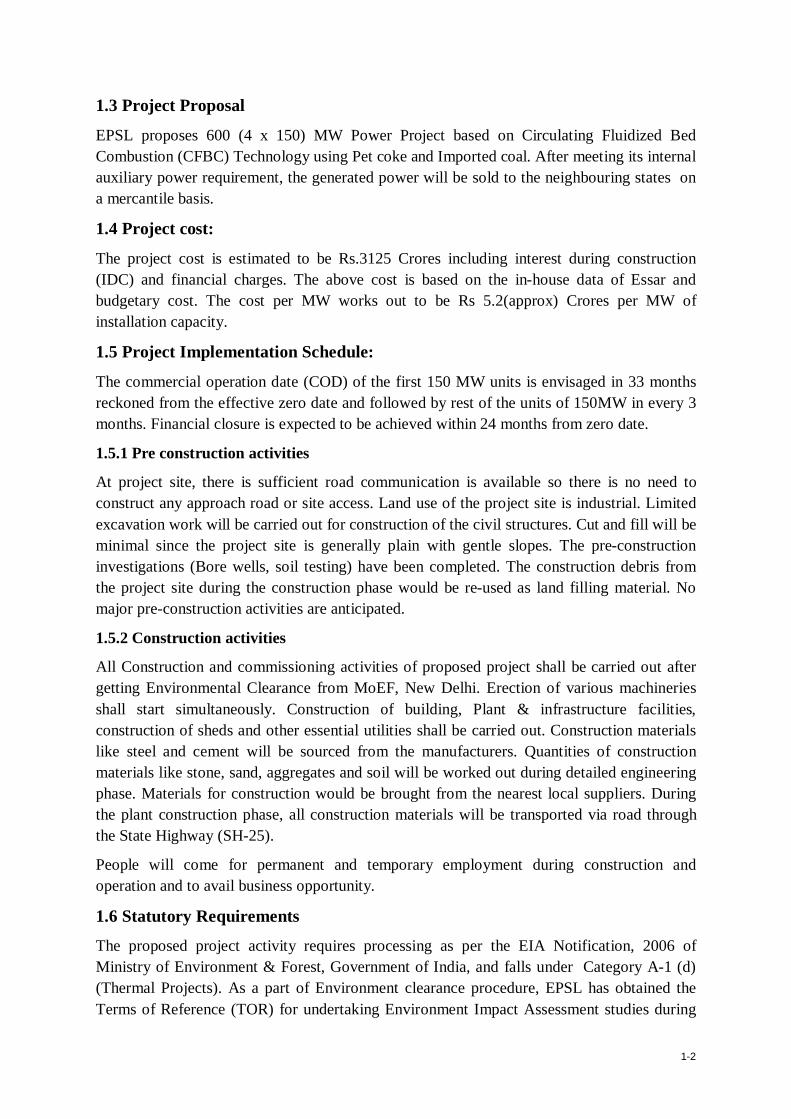
1.3 Project Proposal
EPSL proposes 600 (4 x 150) MW Power Project based on Circulating Fluidized Bed Combustion (CFBC) Technology using Pet coke and Imported coal. After meeting its internal auxiliary power requirement, the generated power will be sold to the neighbouring states on a mercantile basis.
1.4 Project cost:
The project cost is estimated to be Rs.3125 Crores including interest during construction (IDC) and financial charges. The above cost is based on the in-house data of Essar and budgetary cost. The cost per MW works out to be Rs 5.2(approx) Crores per MW of installation capacity.
1.5 Project Implementation Schedule:
The commercial operation date (COD) of the first 150 MW units is envisaged in 33 months reckoned from the effective zero date and followed by rest of the units of 150MW in every 3 months. Financial closure is expected to be achieved within 24 months from zero date.
1.5.1 Pre construction activities
At project site, there is sufficient road communication is available so there is no need to construct any approach road or site access. Land use of the project site is industrial. Limited excavation work will be carried out for construction of the civil structures. Cut and fill will be minimal since the project site is generally plain with gentle slopes. The pre-construction investigations (Bore wells, soil testing) have been completed. The construction debris from the project site during the construction phase would be re-used as land filling material. No major pre-construction activities are anticipated.
1.5.2 Construction activities
All Construction and commissioning activities of proposed project shall be carried out after getting Environmental Clearance from MoEF, New Delhi. Erection of various machineries shall start simultaneously. Construction of building, Plant & infrastructure facilities, construction of sheds and other essential utilities shall be carried out. Construction materials like steel and cement will be sourced from the manufacturers. Quantities of construction materials like stone, sand, aggregates and soil will be worked out during detailed engineering phase. Materials for construction would be brought from the nearest local suppliers. During the plant construction phase, all construction materials will be transported via road through the State Highway (SH-25).
People will come for permanent and temporary employment during construction and operation and to avail business opportunity.
1.6 Statutory Requirements
The proposed project activity requires processing as per the EIA Notification, 2006 of Ministry of Environment & Forest, Government of India, and falls under Category A-1 (d) (Thermal Projects). As a part of Environment clearance procedure, EPSL has obtained the Terms of Reference (TOR) for undertaking Environment Impact Assessment studies during
1-3
the 30th meeting held on August 8-9, 2011. Essar has engaged M/s. Anand Consultants, Ahmedabad, a QCI qualified consultant for undertaking EIA Studies as per the received TOR and preparation of Environment Management Plan, within the framework of the prevailing rules and regulations.
1.7 Terms of Reference (ToR) for EIA study
Terms of Reference for conducting EIA has been approved by the Ministry of Environment & Forests, Government of India vide their letter J-13012/21/2010-IA.II (T) dated 28th September, 2011. The ToR is attached as Annexure-17 and ToR compliance is given in Section-1.11, Table-1.1.
The EIA report is as per the EIA Notification 2006, incorporating all points given in the approved TOR.
1.8 Objectives of EIA
The overall objectives of the EIA study are as follows:
Establish the prevailing baseline environmental and socioeconomic condition of the project site and its surroundings,
Assess environmental and socioeconomic impacts arising out of the operation of proposed 600 MW Petcoke and Coal based power plant and its associated activities like transportation of coal and evacuation of power and fly ash;
Recommend appropriate preventive and mitigation measures to minimize pollution as well as environmental and social disturbances,
Identify and propose alternative actions in terms of technology and practices that may help in abating impacts due to the project;
Identify residual and cumulative impacts that may arise from the project and suggest suitable measures to minimize them, and
To prepare a comprehensive Environment and Disaster Management Plan.
1.9 Methodology of EIA
An area of 10 km radius from the boundary of the proposed project site was selected as study area for undertaking baseline studies.
1.9.1 Base Line Environmental Condition
The samples of ambient air, ground & surface water and soil were collected and analyzed as per the standard methods for establishing the baseline data and to determine the likely impact of the proposed activity on the surrounding environment.
1.9.2 Ambient Air Environment
The air environment around the plant was monitored by setting up thirteen locations within the study area of 10 Km radius from the project site. The site specific meteorological data was collected i.e. wind speed and direction, humidity, rainfall and ambient temperature. Design of network for ambient air quality monitoring location was based on guidelines

1-4
provided by MoEF. The ambient air samples were collected and analyzed for SPM, PM2.5, PM10, SO2, NOx, Hg, O3, Pb, CO, NH3, C6H6, Benzo (a) Pyrene (BaP) particulate phase only, As, as Ni, HC and VOCs for identification, prediction, evaluation and assessment of potential impact on ambient air environment.
1.9.3 Ground and Surface Water Environment
To assess the baseline physico-chemical quality of the water, surface water samples and ground water samples were collected and analyzed for various parameters viz., pH, TDS, Turbidity, BOD, COD, Chlorides, Sulphates, Nitrates, Hardness, Alkalinity, Iron, Oil & Grease etc and some trace heavy metals.
1.9.4 Noise Environment
Noise level survey was conducted in the study zone for evaluating baseline status. Hourly equivalent sound levels (Leq) were recorded for calculating day and night noise levels in the surrounding villages. Noise levels were recorded at the surrounding villages for evaluating general scenario. The anticipated noise sources include automobiles, which are likely to be increased due to the proposed activity.
1.9.5 Soil Environment
Soil sampling and analysis was carried out to assess physico-chemical characteristics of the soils and delineate existing cropping pattern, existing land use and topography, within the study area. Identification of potential utilities of effluent in land application and subsequent impacts were also assessed.
1.9.6 Biological Environment
Keeping in view, the importance of biological component in environment assessment, biological characterization of the terrestrial and aquatic environments was undertaken and likely impacts on the flora and fauna were delineated.
1.9.7 Socio-economic Environment
Socio-economic information was collected mainly from the Census handbook and likely impact of the proposed project on the socio-economic status of the population in the study area was carried out. This included, assessment of impact on important historical, cultural, and archaeological sites/places in the area and economic and employment benefit arisen out from the project is given special attention.
1.9.8 Identification of Pollution Source
The power generation process to be executed along with input and output of materials, water & wastewater as well as infrastructure facilities was detailed and possible adverse impacts were identified.
1.9.9 Evaluation of Pollution Control and Environmental Management Systems
The qualitative and quantitative analysis of various pollution sources as well as the evaluation of proposed pollution control system is carried out.

1-5
1.9.10 Evaluation of Impact
A comprehensive evaluation of environmental impact with reference to proposed activities is carried out.
1.9.11 Preparation of Environmental Management Plan
Based on the impacts identified a comprehensive Environmental Management Plan (EMP) has been prepared covering all the aspects of pollution prevention measures such as Air and Water Pollution Control measures, Hazardous Waste Management, Environmental Monitoring and Environmental Management Systems.
The present report is based upon baseline information generated during January to April, 2009. The baseline environmental condition was established through field monitoring and literature surveys. The contents of EIA report, details of data collection and source of secondary data are presented in Figure 1.4.
1.10 Structure of Report
The objectives of the EIA study is preparation of Environment Impact and Risk Assessment (EIA) report based on the approved Terms of Reference by the Ministry of Environment and Forests (MoEF). The report has been divided into the Following chapters.
Executive Summary:
Chapter-1: Introduction
This chapter provides introduction of proposed activity, background of promoters, need and justification of the project, project cost, project implementation schedule, statutory requirements, terms of reference for the study, objectives of EIA, methodologies of EIA, and structure of the report.
Chapter-2: Project Description and Infrastructural Facilities
This chapter includes Project Description and Infrastructure facilities delineating all industrial and environmental aspect of M/s. EPSL, construction and operation phase activities, process and the project cycle. This chapter also provides information on raw material storage and handling, water and wastewater details, air pollution and control system, storage facility, utilities, greenbelt and safety measures for proposed project activity.
Chapter-3: Baseline Environmental Status
This chapter provides baseline environmental status delineating meteorological details and identification of base line status of Environmental components (primary data) of surrounding area including the land use pattern, biological environment and Socio-economic environment.
Chapter-4: Identification, and assessment of Impacts
This chapter includes identification and prediction of Impacts, and quantification of significant impacts of the proposed activities on various environmental components.
1-6
Chapter-5: Environmental Management Plan
This chapter includes delineation of Environment Management Plan (EMP) to be adopted for mitigating anticipated adverse impacts if any, and to ensure desirable impacts. It includes mitigation measures, management plan, monitoring plan, administrative set-up and cost towards the EMP.
Chapter-6: Analysis of Alternative technology and sites
This chapter provides insights into the alternatives examined prior to arriving at the present configuration and site.
Chapter -7: Additional Studies
This chapter provides details on the additional studies undertaken such as hydro-geological studies, rainwater harvesting plan, Risk Analysis and Disaster Management Plan and onsite and offsite emergency action plan with the proposed safety measures. The Risk and consequence analysis includes consideration towards storage and handling of various hazardous raw materials, intermediates and product as well as manufacturing process. Also the on-site and off-site emergency preparedness plan includes the eventuality arising of natural calamities such as earthquakes, cyclones, tsunami, etc.
Chapter -8: Project benefits
This chapter provides details on the additional studies undertaken such as hydro-geological studies, rainwater harvesting plan, Risk Analysis and Disaster Management Plan and onsite and offsite emergency action plan with the proposed safety measures. The Risk and consequence analysis includes consideration towards storage and handling of various hazardous raw materials, intermediates and product as well as manufacturing process. Also the on-site and off-site emergency preparedness plan includes the eventuality arising of natural calamities such as earthquakes, cyclones, tsunami, etc.
Chapter -9: Summary and conclusions
This chapter includes justification for implementation of the project, summary of anticipated environmental impacts and mitigation measures, environmental management plan and conclusion.
Chapter -10: Disclosure of consultant
This chapter includes disclosure of M/s. Anand Consultants, Ahmedabad, a QCI qualified consultant who was engaged by ESSAR for undertaking EIA Studies as per the received TOR.
1.11 Compliance to the TOR conditions
The point wise compliance to the ToR conditions as prescribed by MoEF is described in Table 1.1.
1-7
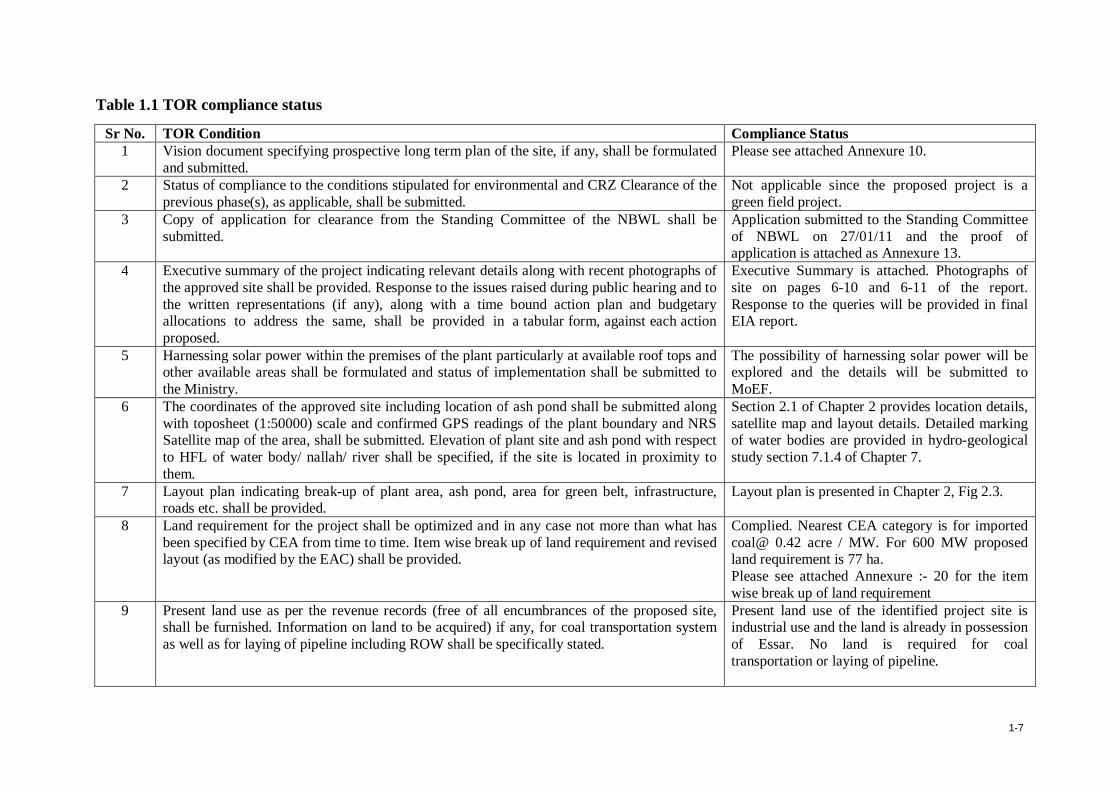
Table 1.1 TOR compliance status
Sr No. TOR Condition Compliance Status 1 Vision document specifying prospective long term plan of the site, if any, shall be formulated
and submitted. Please see attached Annexure 10.
2 Status of compliance to the conditions stipulated for environmental and CRZ Clearance of the previous phase(s), as applicable, shall be submitted.
Not applicable since the proposed project is a green field project.
3 Copy of application for clearance from the Standing Committee of the NBWL shall be submitted.
Application submitted to the Standing Committee of NBWL on 27/01/11 and the proof of application is attached as Annexure 13.
4 Executive summary of the project indicating relevant details along with recent photographs of the approved site shall be provided. Response to the issues raised during public hearing and to the written representations (if any), along with a time bound action plan and budgetary allocations to address the same, shall be provided in a tabular form, against each action proposed.
Executive Summary is attached. Photographs of site on pages 6-10 and 6-11 of the report. Response to the queries will be provided in final EIA report.
5 Harnessing solar power within the premises of the plant particularly at available roof tops and other available areas shall be formulated and status of implementation shall be submitted to the Ministry.
The possibility of harnessing solar power will be explored and the details will be submitted to MoEF.
6 The coordinates of the approved site including location of ash pond shall be submitted along with toposheet (1:50000) scale and confirmed GPS readings of the plant boundary and NRS Satellite map of the area, shall be submitted. Elevation of plant site and ash pond with respect to HFL of water body/ nallah/ river shall be specified, if the site is located in proximity to them.
Section 2.1 of Chapter 2 provides location details, satellite map and layout details. Detailed marking of water bodies are provided in hydro-geological study section 7.1.4 of Chapter 7.
7 Layout plan indicating break-up of plant area, ash pond, area for green belt, infrastructure, roads etc. shall be provided.
Layout plan is presented in Chapter 2, Fig 2.3.
8 Land requirement for the project shall be optimized and in any case not more than what has been specified by CEA from time to time. Item wise break up of land requirement and revised layout (as modified by the EAC) shall be provided.
Complied. Nearest CEA category is for imported coal@ 0.42 acre / MW. For 600 MW proposed land requirement is 77 ha. Please see attached Annexure :- 20 for the item wise break up of land requirement
9 Present land use as per the revenue records (free of all encumbrances of the proposed site, shall be furnished. Information on land to be acquired) if any, for coal transportation system as well as for laying of pipeline including ROW shall be specifically stated.
Present land use of the identified project site is industrial use and the land is already in possession of Essar. No land is required for coal transportation or laying of pipeline.

1-8
10 The issues relating to land acquisition and R and R scheme with a time bound action plan should be formulated and clearly spelt out in the EIA report.
Not applicable. The land is in possession of Essar.
11 Copy of marine ecology and wildlife conservation plan vetted by the Office of the concerned Chief Wildlife Warden shall be submitted.
Copy of existing wild life conservation plan vetted by the Chief Wildlife Warden for MNP/MS is attached as Annexure 11. We will support the same.
12 Satellite imagery or authenticated topo sheet indicating drainage, cropping pattern, water bodies (wetland, river system, stream, nallahs, ponds etc.), location of nearest villages, creeks, mangroves, rivers, reservoirs etc. in the study area shall be provided.
Toposheet is attached as Annexure 15.
13 Location of any National Park, Sanctuary, Elephant / Tiger Reserve (existing as well as proposed), migratory routes / wildlife corridor, if any, within 10 km of the project site shall be specified and marked on the map duly authenticated by the Office of the Chief Wildlife Warden of the area concerned.
Application is made to the Chief Wildlife Warden for the authenticated map on 15/09/11. Copy of Application is attached as Annexure 14.
14 Topography of the study area supported by toposheet on 1:50,000 scale of Survey of India, along with a large scale map preferably of 1:25,000 scale and the specific information whether the site requires any filling shall be provided. In that case, details of filling, quantity of fill material required, its source, transportation etc. shall be submitted
Toposheet is attached as Annexure 15. Land is flat & leveled.
15 A detailed study on the landuse pattern of the study area shall be carried out including identification of common property resources (such as grazing and community land, water resources etc) available and action plan for its protection and management shall be formulated. If acquisition of grazing land is involved, it shall be ensured that an equal area of grazing land to be acquired is developed alternatively and detailed plan shall be submitted.
Detailed landuse study is provided in Section 3.6.4 of Chapter 3.
16 A mineralogical map of the proposed site (including soil type) and information (if available) that the site is not located on economically feasible mineable mineral deposit shall be submitted.
Details are provided in Section 3.6, Fig. 3.17 and 3.18 of Chapter 3.
17 Details of 100% fly ash utilization plan as per latest fly ash Utilization Notification of GOI along with firm agreements / MoU with contracting parties including other usages etc. shall be submitted. The plan shall also include disposal method / mechanism of bottom ash.
Fly ash utilization plan is discussed in Section 4.2.1 of Chapter 4. Please also see Annexure-18.
18 Water requirement, calculated as per norms stipulated by CEA from time to time shall be submitted, along with water balance diagram. Details of water balance calculated shall take into account reuse and recirculation of effluents which shall be explicitly specified.
Details are provided in section 2.6.2 of Chapter 2 and Annexure - 19 for water balance diagram.
19 Waterbody / nallah (if any) passing across the site should not be disturbed as far as possible. In case any nallah/ drain has to be diverted, it shall be ensured that diversion does not disturb the natural drainage pattern of the area. Details of diversion required to be furnished which shall be duly approved by the concerned department.
Not applicable as no water body passes through the site.

1-9
20 If shall be ensured that a minimum of 500 m distance of the plant boundary is kept from the HFL of river system/ streams, etc.
Not applicable as there is no river system/stream nearby to the project site.
21 Hydro-geological study of the area shall be carried out through an institute/ organization of repute to assess the impact on ground and surface water regimes. Specific mitigation measures shall be spelt out and time bound action plan for its implementation shall be submitted.
Hydro-geological study is carried out and the details are provided in Section 7.1 of Chapter 7.
22 Detailed studies on impacts of the ecology including fisheries of the river/estuary/sea due to the proposed withdrawal of water / discharge of treated wastewater into the river, creek/.sea shall be carried out and submitted alongwith EIA report. In case of requirement of marine impact assessment study, the location of intake and outfall shall be clearly specified along with depth of water drawl and discharge into open sea.
Details are provided under Section 4.2.5 of Chapter 4.
23 Source of water and its sustainability even in lean season shall be provided along with details of the ecological impacts arising out of withdrawal of water taking into account interstate shares (if any). Information on other competing sources downstream of the proposed project. Commitment regarding availability of requisite quantity of water from the competent authority shall be provided along with letter / document stating firm allocation of water.
Details are provided in Section 2.6.2 of Chapter 2.
24 Detailed plan for carrying out rainwater harvesting and its proposed utilization in the plant shall be furnished
Details are provided in Section 7.1 of Chapter 7.
25 Feasibility of zero discharge concept shall be critically examined and its details submitted Feasibility of Zero discharge will be explored during the detailed engineering.
26 Optimization of COC along with other water conservation measures in the project shall be specified
Since Sea water will be used for cooling purposes a COC of 1.3 will be maintained. Details are provided in Section 5.1.3 of Chapter 5
27 Plan for recirculation of ash pond water and its implementation shall be submitted. Not applicable since High Concentration Slurry Disposal method is proposed.
28 Detailed plan for conducting monitoring of water quality regularly with proper maintenance of records shall be formulated. Detail of methodology and identification of monitoring points (between the plant and drainage in the direction of flow of surface / ground water) shall be submitted. It shall be ensured that parameter to be monitored also include heavy metals
Details provided in Chapter 5, Table 5.3.
29 Socio-economic study of the study area comprising of 10 km from the plant site shall be carried out by a reputed institute / agency which shall consist of detail assessment of the impact on livelihood of local communities.
Socio-economic details of the study area are provided in Section 3.8 of Chapter 3.
30 Action plan for identification of local employable youth for training in skills, relevant to the project, for eventual employment in the project itself shall be formulated and numbers specified during construction & operation phases of the Project.
Detailed employment policy is provided as Section 5.1.6.1of Chapter 5.

1-10
31 If the area has tribal population it shall be ensured that the rights of tribals are well protected. The project proponent shall accordingly identify tribal issues under various provisions of the law of the land.
Not applicable.
32 A detailed CSR plan along with activities wise break up of financial commitment shall be prepared. CSR component shall be identified considering need based assessment study. Sustainable income generating measures which can help in upliftment of poor section of society, which is consistent with the traditional skills of the people shall be identified. Separate budget for community development activities and income generating programmes shall be specified.
CSR plan is attached as Annexure 8.
33 While formulating CSR schemes it shall be ensured that an in-built monitoring mechanism for the schemes identified are in place and mechanism for conducting annual social audit from the nearest government institute of repute in the region shall be prepared. The project proponent shall also provide action plan for the status of implementation of the scheme from time to time and dovetail the same with any Govt. scheme(s). CSR details done in the past should be clearly spelt out in case of expansion projects.
CSR plan for the present project is attached as Annexure 8.
34 R and R plan as applicable, shall be formulated wherein mechanisms for protecting the rights and livelihood of the local people in the region who are likely to be impacted, is taken into consideration. R and R plan shall be formulated after a detailed census of population based on socioeconomic surveys who were dependent on land falling in the project, as well as, population who were dependent on land not owned by them
Not applicable. Since the land is owned by Essar no R and R issues are involved.
35 Assessment of occupational health as endemic diseases of environmental origin shall be carried out and action plan to mitigate the same shall be discussed.
We have already conducted the detail study reg. the said matter however we haven’t found any kind of endemic diseases.
36 Occupational health and safety measures for the workers including identification of work related health hazards shall be formulated. The company shall engage full time qualified doctors who are trained in occupational health. Health monitoring of the workers shall be conducted at periodic intervals and health records maintained. Awareness program for workers due to likely adverse impact on their health due to working in non-conducive environment shall be carried out and precautionary measures like use of personal equipments etc. shall be provided. Review of impact of various health measures undertaken at intervals of two years shall be conducted with an excellent follow up plan of action wherever required.
Refer Annexure 9 on occupational health of the employees. Also refer section 5.1.6.3 of Chapter 5 on Public health. Essar group has got existing facility in the same area and OHS measures are followed as per the establish HSE procedure of the group and shall be applicable for the proposed project.
37 One complete season site specific meteorological and AAQ data (except monsoon season) as per MoEF Notification dated 16.11.2009 shall be collected and the dates of monitoring recorded. The parameters to be covered for AAQ shall include SPM, RSPM (PM10, PM2.5), SO2, NOx, Hg and O3 (ground level). The location of the monitoring stations should be so
As presented during the ToR presentation to MoEF, baseline data of January to March 2009 supplemented with data collected from March to May 2010 has been used and the details are
1-11
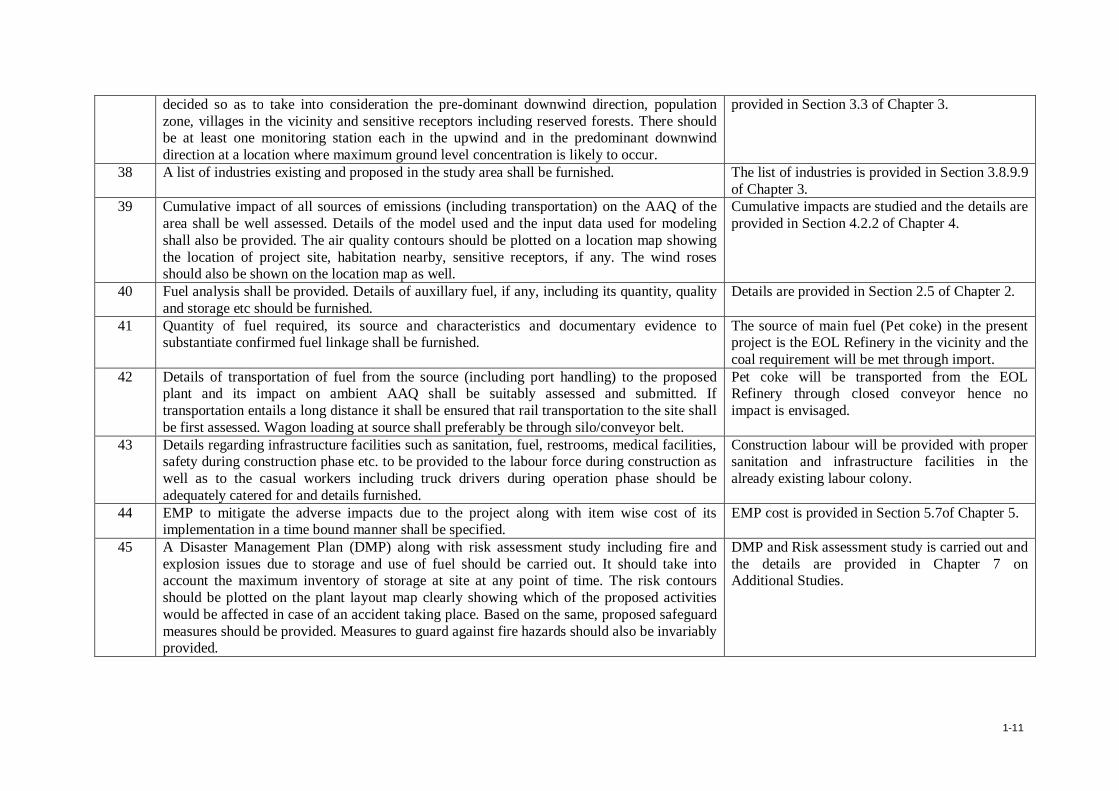
decided so as to take into consideration the pre-dominant downwind direction, population zone, villages in the vicinity and sensitive receptors including reserved forests. There should be at least one monitoring station each in the upwind and in the predominant downwind direction at a location where maximum ground level concentration is likely to occur.
provided in Section 3.3 of Chapter 3.
38 A list of industries existing and proposed in the study area shall be furnished. The list of industries is provided in Section 3.8.9.9 of Chapter 3.
39 Cumulative impact of all sources of emissions (including transportation) on the AAQ of the area shall be well assessed. Details of the model used and the input data used for modeling shall also be provided. The air quality contours should be plotted on a location map showing the location of project site, habitation nearby, sensitive receptors, if any. The wind roses should also be shown on the location map as well.
Cumulative impacts are studied and the details are provided in Section 4.2.2 of Chapter 4.
40 Fuel analysis shall be provided. Details of auxillary fuel, if any, including its quantity, quality and storage etc should be furnished.
Details are provided in Section 2.5 of Chapter 2.
41 Quantity of fuel required, its source and characteristics and documentary evidence to substantiate confirmed fuel linkage shall be furnished.
The source of main fuel (Pet coke) in the present project is the EOL Refinery in the vicinity and the coal requirement will be met through import.
42 Details of transportation of fuel from the source (including port handling) to the proposed plant and its impact on ambient AAQ shall be suitably assessed and submitted. If transportation entails a long distance it shall be ensured that rail transportation to the site shall be first assessed. Wagon loading at source shall preferably be through silo/conveyor belt.
Pet coke will be transported from the EOL Refinery through closed conveyor hence no impact is envisaged.
43 Details regarding infrastructure facilities such as sanitation, fuel, restrooms, medical facilities, safety during construction phase etc. to be provided to the labour force during construction as well as to the casual workers including truck drivers during operation phase should be adequately catered for and details furnished.
Construction labour will be provided with proper sanitation and infrastructure facilities in the already existing labour colony.
44 EMP to mitigate the adverse impacts due to the project along with item wise cost of its implementation in a time bound manner shall be specified.
EMP cost is provided in Section 5.7of Chapter 5.
45 A Disaster Management Plan (DMP) along with risk assessment study including fire and explosion issues due to storage and use of fuel should be carried out. It should take into account the maximum inventory of storage at site at any point of time. The risk contours should be plotted on the plant layout map clearly showing which of the proposed activities would be affected in case of an accident taking place. Based on the same, proposed safeguard measures should be provided. Measures to guard against fire hazards should also be invariably provided.
DMP and Risk assessment study is carried out and the details are provided in Chapter 7 on Additional Studies.

1-12
46 The DMP so formulated shall include measures against likely Tsunami/ Cyclones/Storm Surges/Earthquakes etc, as applicable It shall be ensured that DMP consists of both on-site and off-site plan, complete with details of containing likely disaster and shall specifically mention personnel identified for the task. Smaller version of the plan shall be prepared both in English and local languages.
On site and Off site disaster management plan for the entire EOL complex is available.
47 Detailed plan for raising green belt of native species of appropriate width (50 to 100 m) and consisting of at least 3 tiers around plant boundary (except in areas not possible) with tree density of 2000 to 2500 trees per ha with a good survival rate of about 80% shall be submitted. Photographic evidence must be created and submitted periodically including NRSA reports.
Essar Vadinar Complex is developing a Green Belt around the entire complex in an area of 1028 acres, the Green belt development plan of the complex is attached as Annexure 16. The present project falls within the complex. Detailed plan will be prepared specific to the project & shall be submitted to MoEF.
48 Over and above the green belt, as carbon sink, additional plantation shall be carried out in identified blocks of degraded forests, in close consultation with the District Forests Department. In pursuance to this the project proponent shall formulate time bound action plans along with financial allocation and shall submit status of implementation to the Ministry every six months.
We have noted the same and we would pursue the direction given by the Ministry in closed consultation of Forest Department.
49 Corporate Environment Policy a) The company to have a well laid down Environment Policy approved by its Board of Directors. b) The Environment Policy must prescribe for standard operating process / procedures to bring into focus any infringement / deviation / violation of the environmental or forest norms / conditions. c) The hierarchical system or Administrative Order of the company to deal with the environmental issues and for ensuring compliance with the environmental clearance conditions must be furnished. d) To have proper checks and balances the company should have a well laid out system of reporting of non compliances / violations of environmental norms to the Board of Directors of the company and / or shareholders or stakeholders at large. All the above details should be adequately brought out in the EIA report and in the presentation to the Committee.
Please refer Annexure 9.
50 Details of the litigation pending or otherwise with respect to project in any court, tribunal etc., shall be furnished.
No litigation pending.

1-13
4. General Points
a. All documents to be properly referenced with index, page numbers and continuous page numbering.
All the chapters and annexures of EIA/EMP report has properly numbered and indexed. Being complied.
b. Where data is presented in report especially in table, the period in which the data was collected and the source should be invariably be indicated.
Being complied.
c. Where the documents provided are in a language other than English, an English translation should be provided.
Noted.
d. The Questionnaire for environmental appraisal of thermal power projects as devised earlier by the Ministry shall also be filed and submitted.
We will be submitted the questionnaire at a time of environmental clearance presentation to EAC, New Delhi.
e. The consultants involved in the preparation of EIA/EMP report after accreditation with Quality Council of India (QCI)/ National Accreditation Board of Education and Training (NABET) would need to include a certificate in this regard in the EIA/EMP reports prepared by them and data provided by other organization/Laboratories including their status of approval etc. In this regards circular no. J-11013/77/2004-IA II (I) dated 2nd December, 2009 posted on the Ministry’s website http://www.moef.nic.in may be referred.
Please refer Chapter-9 and Annexure:- 21 for the details.
Additional Information
1. Is project intended to have CDM-intent? (i) if not, then why? (ii) if yes, then a. Has PIN (Project Idea Note) {or PCN (Project Concept Note)} submitted to the? NCA
(National CDM Authority) in the MoEF? b. If not, then by when is that expected? c. Has PDD (Project Design Documents) been prepared? d. What is the Carbon intensity? from your electricity generation projected (i.e. CO2
Ton/MWH or Kg /KWH) e. Amount of CO2 in Tons/year expected to be reduced from the baseline data available
on the CEA?s website (www.cea.nic.in)
NA
2. Notwithstanding 1(i) above, data on (d) & (e) above shall be worked out and reported. NA 5. The Environmental Clearance shall be applied only after firm fuel and water linkages are
obtained. Please refer Section-2.5, 2.6.2 and Table-2.9, Chapter-2.

CHAPTER - 2
PROJECT DESCRIPTION

2-1
M/s. Essar Power Salaya Limited (EPSL) is setting up a 600 (4 x 150) MW Pet Coke and Imported coal based Thermal Power Plant (TPP) near Kathi Devaliya village of Khambalia taluka, of Jamnagar District of Gujarat. Various utilities i.e. power house, boiler, cooling tower, brine plant, chilling Plant, RO water plant, air compressor, DM water plant, DG set, etc. will be installed to meet the requirements of the power plant. 2.1 Project Setting
2.1.1 Location
EPSL is proposed in close proximity to the Essar Refinery and is at a distance of about 45 km by road from Jamnagar city of Gujarat, India. The plant site is at a distance of about 7.5 km from the Gulf of Kutch. The four corner coordinates of the proposed power plant are given in the table below.
No. Latitude Longitude 1 22o 19.7' N 69o 44.0' E 2 22o 19.5' N 69o 43.7' E 3 22o 19.1' N 69o 44.0' E 4 22o 19.2' N 69o 44.2' E
The Project location is shown in Figure 2.1 and 2.2 while the detailed layout map is shown in Figure 1.3.
2.1.2 Salient Features of the Project
1. Minimum distances:
a. City : Jamnagar (45 km)
b. Railway : Khambalia (13.8 km)
c. Highway : SH-25 Jamnagar - Okha (1.5 km)
d. Industry : Essar Refinery (Within the premises)
e. River : Sinhan River (5 km)
f. Eco-sensitive area : Marine National Park/Marine Sanctuary (7.5 km)
2. Use of forest land : None
3. Use of prime agricultural land : None
4. Displacement of population : None
2.1.3 Site Selection
The details of the alternative examined are provided in Chapter 6 of this report.

2-2
Figure - 2.1: Location of the Project Site
Figure-2.2: Study Area for the Proposed Project
2-3
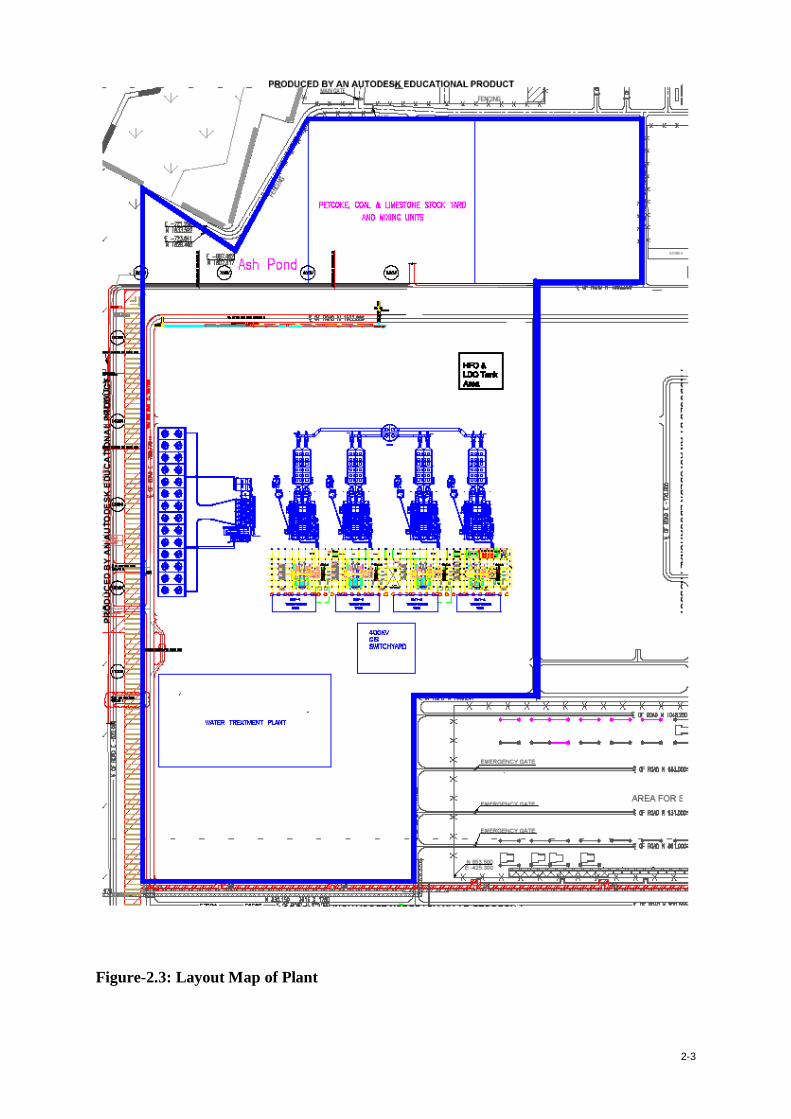
Figure-2.3: Layout Map of Plant

2-4
2.2 Project Cost
The project cost is estimated to be Rs. 3125 Crores including interest during construction (IDC) and financial charges. The above cost is based on the in-house data of Essar and budgetary cost. The cost per mw works out to be Rs 5.2 Crores (approx) per MW of installed capacity. Break up of proposed investment is shown in Table-2.1.
2.3 Main Phases of the Project
2.3.1 Pre construction activities
The project site is well connected by roads and there is no need to construct any approach road for site access. Land use of the project site is industrial. Limited excavation work will be carried out for construction of the civil structures. Cut and fill will be minimal since the project site is generally plain and partially developed. The pre-construction investigations (bore wells, soil testing) have been completed. The construction debris from the project site would be re-used as land filling material to level the site. No major pre-construction activities are anticipated.
2.3.2 Construction Activities
All Construction and commissioning activities of proposed project shall be carried out after getting Environmental Clearance from MoEF, New Delhi and Consent to Establish (CTE) from the Gujarat Pollution Control Board (GPCB). Erection of various machineries shall start simultaneously.
Construction materials like steel and cement will be sourced from the local manufacturers. Quantities of construction materials like stone, sand, aggregates and soil will be worked out during detailed engineering phase. Materials for construction would be brought from the nearest local suppliers. During the plant construction phase, all construction materials will be transported via road through the State Highway (SH 25).
People will come for permanent and temporary employment during construction and operation of the power plant and also to avail the business opportunity. Local people will be given preference in employment during the construction activities.
2.3.3 Project Description
2.3.3.1 Plant Lay Out
The layout of the 600 (4x150) MW main plant is shown in Figure-2.3. In laying out various facilities consideration has been given to the following general principles:
Least disturbance to existing habitation and vegetation, if any.
Flexibility with particular reference to the switch yard and main plant,
Predominant wind directions as gathered from the wind rose to minimize pollution, fire risk, etc.,
Power evacuation corridor,
Approach road to the power plant from the main highway, and
2-5
Availability of adequate space for fabrication / construction equipment.
All facilities of the plant are laid out in close proximity to each other to the extent practicable so as to minimize the extent of land required. The layout also facilitates communication of men and movement of materials between the various facilities both during initial construction and also during subsequent operation and maintenance.
2.3.3.2 Civil Engineering Aspects
Site Topography and Grade Level
Site terrain is almost flat without significant undulations. The main plant, auxiliary buildings, etc. would be located at suitably higher level than the general grade level.
Station Building: General Arrangement
The steam turbine generator and auxiliary equipment would be located in a concrete building having 37.0 m span. Total length of station building for all four units would be 325 m which includes two unloading / maintenance bays each of 10.5 m wide at the end of the station building. The heaters are accommodated in the heater bay having a span of 7.0 m. The control room / electrical building is located on the side of the station building to accommodate switch gear, electronic panels and control room in a space of 63.0 m x 46.0 m. The turbine - generator bay would be serviced by three floors - ground floor at 0.0 M level, mezzanine floor at +4.5 M level and operating floor at +8 M level. Localised O&M platforms at required levels would be provided. The deaerator would be located at EL+ 16 M in the heater bay. Road access would be provided to the unloading and maintenance bays for unloading Turbine Generator (TG) components and auxiliary equipment. The superstructure will be of structural steel framing with brick cladding and RCC floor slabs, supported on structural steel framing. The roof of the TG bay would consist of pre-cast concrete panels supported on steel trusses. The turbine-generator pedestal would be of reinforced concrete and would be isolated from the building foundations and super-structure. All structures would be designed to cater to applicable wind/seismic forces in the area as per relevant Indian Standards.
Bunker Bay
The bunker bay would be of structural steel-framed construction, supporting the steel bunkers. The 10 m wide bay would have blower room at ground level and floors for the feeders and for the bunker feeding conveyors provided with trippers. The bunker bay will be located at the front side between the furnace in the steam-generator area and the station building. Concrete paving would be provided in the steam-generator area with necessary drains and trenches. Pipes and cables in this area would, in general, be routed on overhead pipe/ cable racks.
Chimney
It is proposed to construct a single chimney with multi flue-can of 275 m height. The reinforced concrete chimney shall be housed inside with four steel flues for each of the proposed 4x150 MW units.

2-6
2.3.3.3 Main Plant Equipment and Systems
Plant Capacity
The proposed 4 x 150 MW power generating units will be of sub critical steam parameters with Circulating Fluidised Bed Combustion (CFBC) technology. Accordingly, all the plant facilities / equipment / systems would be designed and selected. The plant would be using petroleum coke that shall be sourced from the refinery complex by conveyors and imported coal from the existing port facilities at Bedi Port /Own port. The coal will be unloaded from the ships and transported by road to the stockpile area. Sea water is proposed for the condenser cooling tower and will be sourced from the refinery. Fresh water for the plant usage will be generated by a desalination plant which will be located within the common facilities area of the proposed 600 MW TPP.
Selection of unit sizes
The plant will consist of four units of 150 MW each, totaling to 600 MW. The performance data for the 4 x 150 MW unit is given in the below Table-2.1.
Table 2.1: Performance Data for 4x150 MW Unit Sl. No. Particulars Units 600 MW
1 Operating availability % 92 2 Plant load factors (PLF) % 90 3 Auxiliary power consumption % 8.0 4 Planned outages % 5 5 Forced outages % 3
Steam Generator and Accessories
The steam generator (SG) would be designed for 80:20 Pet coke and imported coal mix firing and will be of CFBC type. The CFB combustor, cyclones, fluidised bed heat exchangers (if required) and seal pots, constitute the main components of the CFBC system. The CFBC steam generators would be natural circulation single drum type. The SG would be of re-circulating fluidised bed design, radiant, single reheat, and balanced draft, semi-outdoor type, rated to deliver 495 t/hr of superheated steam at 136 kg/cm2 (a), 540 + 50 oC when supplied with feed water at a temperature of 256 oC at the economiser inlet. The reheat steam temperature would also be 540 +50 oC.
The steam generator would be provided with fuel system with gravimetric feeders and pet coke and coal bunkers of 16 hours storage capacity. Sampling arrangement at bunker outlet would be provided for the purpose of establishing an average gross calorific value of fuel as well as fineness. The SG would be designed to handle and burn Heavy Fuel Oil (HFO) /Light Diesel Oil (LDO) for start-up and to raise the combustor bed temperature to the required level before admitting the main fuel, pet coke and coal. The required fuel oil pressurizing units and fuel oil heating equipment would be provided. The fuel oil start-up burners are lighted-up by means of HEA igniters.

2-7
The steam generator would consist of water cooled refractory lined combustor furnace, radiant and convection superheaters, reheaters, attemperators, economiser, refractory lined hot cyclones, fluidised bed heat exchangers (if required), seal pots, etc. Soot blowers would be provided at strategic locations and would be designed for sequential fully automatic operation from the unit control room.
The plant draft system would comprise of secondary air fans, induced draft fans, primary air fans, seal pot blowers, FBHE blowers, seal / purge air blowers, air preheaters, wind boxes, bottom ash removal system consisting of ash coolers with cooler blowers and cooling system to cool the ash to about 120 oC. All wind box grate drains would be connected to bed ash system. Electrostatic precipitator (ESP) and fly ash hoppers would be provided for the collection of fly ash. The ESP will be designed to achieve an outlet dust concentration of 50 mg/Nm3 as per the World Bank Guidelines.
Limestone injection system consisting of milling plant and limestone powder conveying system would be provided to reduce the SOx emissions. Limestone milling plant would comprise of crushed limestone hopper feeder, air swept ball mill, grid separator cyclone, bag filter, mill exhaust system, screen / rotary feeders, etc. Powdered limestone conveying system would include dense phase pressurised system. Limestone storage bunkers of 24 hrs storage capacities with limestone air lock feeders of gravimetric type would be provided at steam generator end.
Steam Turbine Generator and Accessories
The Steam Turbine Generators (STGs) would be rated for 150 MW maximum continuous output at the generator terminals, with throttle steam conditions of 132 kg/cm2 (a) and 537 oC steam temperature. The steam turbine would be a two/ three cylinder tandem compound, reheat, extraction type and condensing type.
The turbine-generator would be complete with all accessories such as protection system, Lube and control oil systems, jacking oil system, seal steam system, turbine drain system, 60% SG MCR HP / LP bypass system, electro-hydraulic control system, automatic turbine run-up system, on-line automatic turbine test system and turbine supervisory instrumentation. The STG system also includes all piping, fitting, valves and specialties, hangers and supports, thermal insulation, etc. All pumps and coolers will be 2x100 % or 3x50 % capacity. The turbine-generator would also have all necessary indicating and control devices to permit the unit to be placed on turning gear, rolled, accelerated and synchronized automatically from the control room. Other accessories of the turbine-generator would include an oil purification unit with transfer pumps and clean and dirty oil storage tanks.
Plant Cycle
The condensing plant would comprise a surface type condenser of single shell construction and divided water box and hot well together with all accessories. Condenser will be designed to receive and condense the whole of the exhaust steam from the turbine including HP/LP bypass system and other drains and vents under all mode of operation. The condenser will be suitable for use of sea water for condenser cooling. The condenser would have titanium tubes that are best suited for corrosive water such as sea water. 2x100% capacity vacuum pumps
2-8
would be provided to create vacuum in the condenser to remove non-condensable gases liberated during operation.
The turbine oil system comprises of main oil tank of adequate capacity, 2x100% AC motor driven auxiliary oil pumps (AOP), DC motor driven emergency oil pump (EOP), 1x100% AC motor driven jacking oil pump and 1x100% DC motor driven jacking oil pump with all piping, fitting, valves, etc. The AOP, EOP and JOP will be of centrifugal type mounted on the main oil tank. The pumps will be rated for 100% duty, sufficient to supply all oil requirements for TG bearings lubricating under all load conditions.
The main oil tank will be of welded construction of high quality carbon steel plate and its capacity will be such as to provide an adequate residence time under normal operating condition. Two 100% duty AC motor driven oil vapor extractors will vent the oil tank.
The auxiliary cooling water system will comprise pumps, piping and valves, etc. to supply cooling water to various auxiliaries requiring cooling water.
Auxiliary steam system will comprise of piping, valves, fittings and also pressure reducing and de-superheating station. Auxiliary steam will be supplied to turbine gland sealing, Boiler start-up burner oil atomization. Auxiliary steam headers of both the units will be interconnected to cater the requirements of either of the unit on the start up of the other.
The regenerative cycle would consist of three low-pressure heaters, a deaerator, two high pressure heaters, one drain cooler and one gland steam condenser.
The condensate from the condenser hot well would be pumped by 2 x 100 % capacity condensate extraction pumps (one working and one standby) to the deaerator, through the gland steam condenser, drain cooler and low pressure heaters. Feed water would be pumped from the deaerator to the steam generator through the high pressure heaters by means of 3x50% capacity boiler feed pumps (two working and one standby).
Under normal operating conditions, drains from the high-pressure heaters would be cascaded to the next lower pressure heater and finally to the deaerator. Drains from low-pressure heaters would be cascaded successively to the next lower pressure heater and finally to the condenser hot well. Heaters would be provided with drain level controls to maintain the drain level automatically throughout the range of operation of the heaters. The system would consist of split-range control valves to take the drain to a lower pressure heater or to the condenser through a flash box.
The unit would be provided with a 60% of SG MCR HP / LP bypass system:
a) To prevent a steam-generator trip in the event of a full export load throw-off and to maintain the unit in operation at house load,
b) To prevent a steam-generator trip following a turbine trip and enable quick restart of the turbine generator set,
c) To minimize warm restart duration of the unit after a trip,
d) To conserve condensate during start-up, and

2-9
f) To facilitate quick load changes in both directions without affecting the steam generator operation during start-ups.
2.3.3.4 Feed Cycle Equipment
Condensate Pumps
2x100% capacity condensate pumps, one working and one standby, would be provided. The pumps would be vertical, canister type, and multistage centrifugal pumps driven by AC motors.
Boiler Feed Pumps
3x50% capacity boiler feed pumps would be provided to pump the feed water from the deaerator to the steam generator through the high-pressure heaters. The boiler feed pumps would be horizontal, multistage, AC motor driven centrifugal pumps.
Low Pressure Heaters
The low-pressure heaters would be of shell and tube type with U-shaped stainless steel tubes, with their ends rolled in carbon steel tube sheets.
Deaerator
The de-aerating feed water heater would be a direct contact, spray-tray type or spray type of de-aeration arrangement. The feed water storage tank would have a storage capacity adequate to feed the steam-generator for 10 minutes when operating at TG VWO conditions.
High Pressure Heaters
The high-pressure heaters would be of shell and tube type with stainless steel U-tubes welded into stainless steel clad carbon steel tube sheets. The HP heaters would be provided with a desuperheating zone and a drain-cooling zone in addition to the condensing zone.
Gland Steam Condenser
A surface type gland steam condenser would be used to condense the gland steam exhausted from the turbine glands. The gland steam condenser would be of single-pass type with the main condensate flowing through the tubes to condense the steam. Exhausters would be provided to evacuate the air from the shell side and maintain the shell at the required negative pressure.
Turbine Lube Oil Purification System
In the lubrication cycle for the turbine-generator, the lube oil comes in contact with water, air and metal particles, which cause deterioration of the lube oil. In order to prolong the life of the lubricating oil and the parts served by the lube oil, suitable purification equipment is required to be provided to remove the contamination and restore the oil to acceptable conditions.
The continuous bypass method of lube oil purification is proposed to be adopted. In this method, about 20% of the total oil in the turbine oil system is circulated continuously through the lube oil purifier. Since the condition of a portion of the oil is being restored continuously,
2-10
impurities are controlled to within permissible values. The lube oil purification system would comprise the following major equipment:
a) Centrifuge-type or static-type lube oil purifier.
b) One clean lube oil storage tank and one dirty lube oil storage tank.
c) One clean lube oil transfer pump and one dirty lube oil transfer pump.
Each lube oil purifier would be capable of purifying lube oil at the rate of 20% of the total charge per hour.
The clean lube oil transfer pump would be used to transfer oil from the clean oil tank to the turbine lube oil tank. The capacity of the clean oil pump would be such as to fill the fresh charge of oil into the turbine lube oil tank in one hour. The dirty lube oil transfer pump would be used to transfer oil from the dirty oil tank to the oil purifier before the oil is stored in the clean oil tank. The capacity of the dirty oil transfer pump would, therefore, match that of the lube oil purifier.
Steam Turbine Supervisory System
The Steam Turbine Supervisory System would indicate and record the behavior of the Steam Turbine under varying conditions and provide adequate warning of the development of potentially dangerous Steam Turbine conditions such as bearing shaft vibrations, shaft eccentricity, differential expansion, axial shift, overall expansion, etc.
Automatic Turbine Run up System (ATRS)
The ATRS is envisaged to run-up the turbine automatically to synchronize and load the unit as required in case of a cold, warm (or) hot start up. ATRS would also suitably co-ordinate with the steam generator, generator and HP/LP Bypass system. ATRS would also be capable of automatic controlled shut down of the plant.
Automatic Turbine Testing System (ATTS)
The ATTS is envisaged to test automatically all the control and protective devices provided for the steam turbine, to avoid any unintentional shut downs (or) damages to the system.
Fuel Oil System (FO System)
The fuel oil system would be designed for the use of LDO & HFO for start up and to raise the combustion bed temperature to the recommended level before admitting the main fuel, Petcoke and imported coal.
The fuel oil for the power station is expected to be supplied from the nearest Refinery terminal. Based on statistical average oil consumption of 2 ml per KWh for Normal operation & 4.5 ml per KWh during stabilization period at a PLF of 80 %, the quantity of HFO and LDO required per year is 8409 m3 and 2100 m3 respectively. Seven (7) days of oil storage is considered adequate during trial operation. The fuel oil tanks (HFO) are fitted with electric tracing system for initial heating and to supply fuel oil at the required temperature to the inlet of the pumping and heating units. 2 x 100% HFO and LDO pressurizing pumps for catering
2-11
the requirement of both units would be provided to pump the oil to the SGs taking suction from the storage tanks. All HFO lines will be heat traced and insulated.
Fuel oil (HFO & LDO) would be transported to site by road tankers. A fuel oil decanting system comprising of three (3) nos for HFO and LDO each (2 working + 1 standby) 20 m3/hr pumps to decanting header with five (5) nos. tap points will be used for unloading of fuel oil.
Chemical Dosing System
Phosphate dosing system would be provided to ensure chemical conditioning of the steam generator drum water so as to prevent scale formation. In addition, hydrazine / ammonia dosing system would be provided to ensure chemical conditioning of the feed water by removing the dissolved oxygen and carbon dioxide present in the feed water. The phosphate solution will be added directly into the steam-generator drum. The hydrazine / ammonia solution will be injected into the feed water at the feed water pumps suction (continuous basis) and at the condensate extraction pumps discharge (only when required).
Both, the high pressure phosphate dosing system and the low pressure hydrazine / ammonia dosing system, would comprise solution preparation-cum-metering tanks with motorized agitators, three positive displacement type dosing pumps (common for both the units), piping, valves, instruments and local control panel. Each dosing pump would be sized to cater to the 100% dosing requirements of one 150 MW unit. Hence, the third dosing pump would function as standby to the operating pumps.
2.3.3.5 Distributed Microprocessor Based Control and Monitoring System
Microprocessor based distributed control system with state of art Human - Machine Interface (HMI) is proposed to provide a comprehensive integrated instrumentation and control system including the functions of Data Acquisition System (DAS) to operate, control and monitor the steam generator and auxiliaries, steam turbine generator and auxiliaries and the balance of plant systems with a hierarchically distributed structure.
The Distributed control system (DCS) would use the state of the art technique of functional distribution of control and monitoring to reduce the risks associated with failure of any single controlling unit. The DCS has complete control capabilities that include closed loop control, open loop control, computation and interfacing for data acquisition, graphic displays, logging, annunciation, data storage, retrieval, performance calculations and management information system. The system allows for CRT operation from the control desk. The communication from the control desk operators’ interface to the electronic hardware is over a data highway. The system is provided with redundancy at various levels thereby ensuring reliability of the system.
The distributed microprocessor based system proposed is proposed to be geographically centralized. In the geographically centralized microprocessor based system, electronic cubicles would be located in a centralized location with centralized operation from the control room. However, remote I/O modules are envisaged for acquiring switchyard signals in the main control room.
2-12
The DCS envisaged is independent for each of the proposed unit except at Management Information System (MIS) level and at the shift charge engineer’s level which is common for all the four units.
2.3.3.6 Handling System
Limestone Handling System
Limestone is received at site by dumpers and stacked and spread in the stockyard using the tractor dozers and same is reclaimed using the stacker cum reclaimer. The conveyor carrying the lime stone is then directed to the crusher house for further crushing the lime stone to the required size. The screen will separate (-) 25 mm size. Oversize limestone will be conveyed to the crusher to crush it to (-) 25 mm size. Crushed limestone from the crusher and undersize from the screen will be fed onto the Conveyor, which in turn feeds the Bunker Conveyor. Bunker Conveyor will fill the limestone bunker through pneumatically operated discharge plough.
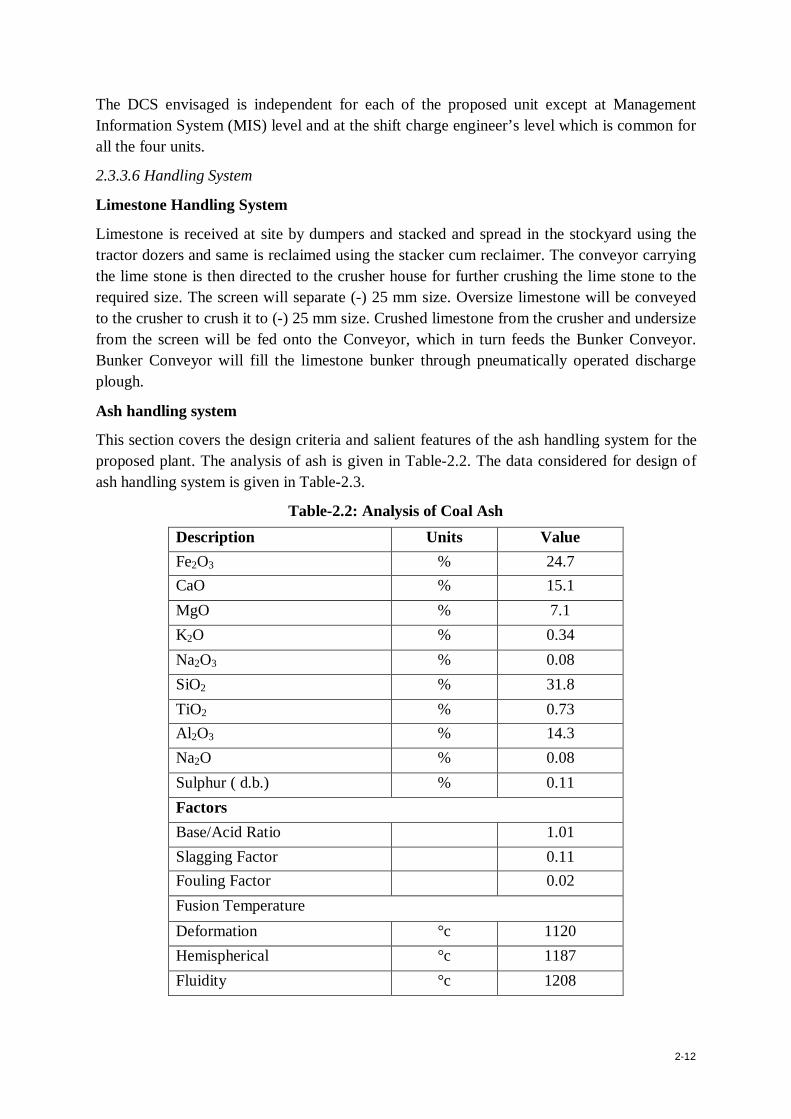
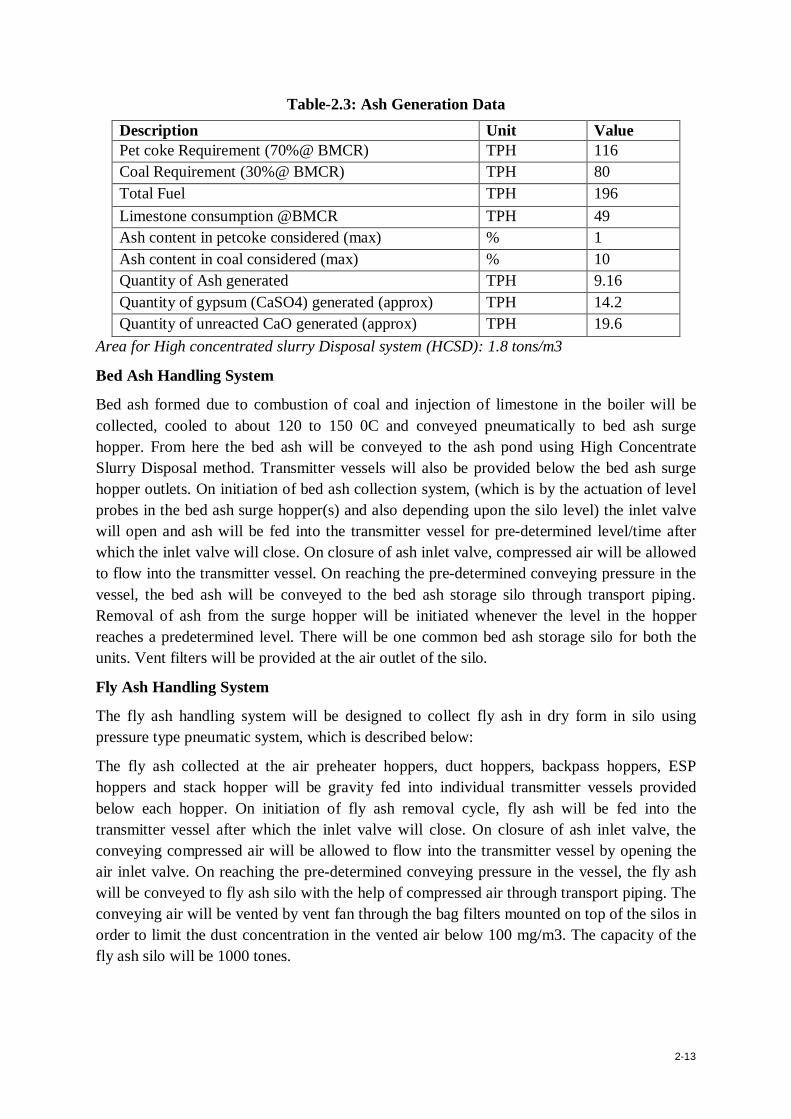
Ash handling system
This section covers the design criteria and salient features of the ash handling system for the proposed plant. The analysis of ash is given in Table-2.2. The data considered for design of ash handling system is given in Table-2.3.
Table-2.2: Analysis of Coal Ash Description Units Value Fe2O3 % 24.7 CaO % 15.1 MgO % 7.1 K2O % 0.34 Na2O3 % 0.08 SiO2 % 31.8 TiO2 % 0.73 Al2O3 % 14.3 Na2O % 0.08 Sulphur ( d.b.) % 0.11 Factors Base/Acid Ratio 1.01 Slagging Factor 0.11 Fouling Factor 0.02 Fusion Temperature Deformation °c 1120 Hemispherical °c 1187 Fluidity °c 1208
2-13
Table-2.3: Ash Generation Data Description Unit Value Pet coke Requirement (70%@ BMCR) TPH 116 Coal Requirement (30%@ BMCR) TPH 80 Total Fuel TPH 196 Limestone consumption @BMCR TPH 49 Ash content in petcoke considered (max) % 1 Ash content in coal considered (max) % 10 Quantity of Ash generated TPH 9.16 Quantity of gypsum (CaSO4) generated (approx) TPH 14.2 Quantity of unreacted CaO generated (approx) TPH 19.6
Area for High concentrated slurry Disposal system (HCSD): 1.8 tons/m3
Bed Ash Handling System
Bed ash formed due to combustion of coal and injection of limestone in the boiler will be collected, cooled to about 120 to 150 0C and conveyed pneumatically to bed ash surge hopper. From here the bed ash will be conveyed to the ash pond using High Concentrate Slurry Disposal method. Transmitter vessels will also be provided below the bed ash surge hopper outlets. On initiation of bed ash collection system, (which is by the actuation of level probes in the bed ash surge hopper(s) and also depending upon the silo level) the inlet valve will open and ash will be fed into the transmitter vessel for pre-determined level/time after which the inlet valve will close. On closure of ash inlet valve, compressed air will be allowed to flow into the transmitter vessel. On reaching the pre-determined conveying pressure in the vessel, the bed ash will be conveyed to the bed ash storage silo through transport piping. Removal of ash from the surge hopper will be initiated whenever the level in the hopper reaches a predetermined level. There will be one common bed ash storage silo for both the units. Vent filters will be provided at the air outlet of the silo.
Fly Ash Handling System
The fly ash handling system will be designed to collect fly ash in dry form in silo using pressure type pneumatic system, which is described below:
The fly ash collected at the air preheater hoppers, duct hoppers, backpass hoppers, ESP hoppers and stack hopper will be gravity fed into individual transmitter vessels provided below each hopper. On initiation of fly ash removal cycle, fly ash will be fed into the transmitter vessel after which the inlet valve will close. On closure of ash inlet valve, the conveying compressed air will be allowed to flow into the transmitter vessel by opening the air inlet valve. On reaching the pre-determined conveying pressure in the vessel, the fly ash will be conveyed to fly ash silo with the help of compressed air through transport piping. The conveying air will be vented by vent fan through the bag filters mounted on top of the silos in order to limit the dust concentration in the vented air below 100 mg/m3. The capacity of the fly ash silo will be 1000 tones.
2-14
Disposal of ash from silos
Bottom ash will be disposed in slurry pond using high concentrate slurry disposal mechanism while the dry fly ash collected in the silos will be utilized for manufacturing of Portland cement by local cement manufacturing units. Large quantity of gypsum will also be generated due to the injection of lime in the boiler. Gypsum will also be sent to local cement manufacturers for mixing it with Portland cement.
2.3.3.7 Miscellaneous Systems
Compressed Air System
Three (3) screw compressors (2 working and 1 stand by), each having a capacity of 2,500 Nm3/hr and a discharge pressure of 8.5 kg/cm2 (g) would be provided for a set of two units. Thus, there would be six (6) air compressors for the plant. The centrifugal compressors proposed would meet the instrument and service air requirements of the plant. The requirement of the compressed air for the fly ash conveying would be met through separate dedicated compressors. The compressed air system would include accessories such as moisture separators and air receivers. The discharge lines of all the three compressors would be connected to a common header. Two air driers (one operating and the other stand by) for each unit of suitable capacity would be provided.
Air Conditioning System
It is proposed to air-condition the unit control room, electronic cubicle room, shift charge Engineer’s room, printer room, maintenance Engineer’s room, UPS room, switchyard control room and ESP control room. Inside design conditions of 24.5 +1.5 0C dry bulb temperature and relative humidity not exceeding 60 % would be maintained in all air-conditioned areas. A centralised chilled water system envisaged for air-conditioning the above areas. This system would consist of three No.s (two working and one standby) water-chilling units of capacity each of about 550 TR. This system also consists of 3 x 50 % capacity chilled water pumps, 3 x 50 % capacity condenser cooling water pumps, 3 x 50 % capacity induced draft FRP cooling towers, adequate number of air handling units for circulating the conditioned air through air distribution system to the room. PLC based controls is envisaged for AC and Ventilation system. Independent package air conditioners are envisaged for air-conditioning of Coal handling, Ash Handling control room, SWAS panel room, ESP Control room and switchyard control room.
Ventilation System
For the ventilation of the station building, evaporative cooling system (Air washer) is envisaged to maintain inside temperature not exceeding 400 oC dry bulb temperature. This system consists of Two numbers of Air washer units (one each for one 150 MW unit). Air washer unit comprises of supply air fans, air washer circulating water pumps and air distribution system for distributing the supply air inside the station building. The exhaust of hot air out of the station building would be achieved by provision of roof extractors and wall mounted exhaust fans. For ventilation of other buildings, supply air fans, exhaust air fans, roof extractors or a suitable combination of these would be provided.
2-15
Cranes and Hoists
It is proposed to provide two nos. 80/25 tons capacity overhead, cabin-operated EOT crane in the turbine hall of the station building for maintenance of various equipments of the proposed units. The list of major equipment in the station building to be handled by the station building EOT crane is furnished below:
Generator rotor
HP / IP outer casing – upper half
IP turbine rotor
HP / IP inner casing
LP outer casing lower half
LP outer casing upper half
LP turbine rotor
HP heaters / LP heaters
BFP / CEP modules.
Miscellaneous Lifting Tackles / Hoists
For the equipment which weighs above 1000 kg, electrically operated type of hoists and trolleys would be provided. For the equipment weighing less than 1000 kg, manually operated hoists and trolleys would be provided. The areas / equipment for which the lifting tackles are proposed to be provided are ware house, all equipment in the station building which are not accessible to station building EOT crane, steam generator area (all fans, gear boxes, mill components etc.), DM plant (to load the chemicals in to the tanks), coal handling junction towers and crusher / screen house, ash handling building, cooling tower area, ESPs, clarified water pump house, chlorine cylinder area, etc.
2.3.3.8 Workshop Equipment
It is proposed to install the work shop equipment in the power plant. Also, maintenance and measuring tools are proposed to be procured for the proposed units.
2.3.3.9 Electrical Systems
Generators
The generators will be rated to deliver 150 MW at 15 KV, 50 Hz, 0.85 power factor, at 3000 rpm. The generator winding will be star connected with the phase and neutral terminals brought out to an accessible point. The generator will deliver rated MVA output under +5% variation in voltage and +5% variation in frequency. The star point of the generator will be connected to earth through an earthing transformer, the secondary of which will be loaded by a resistance. The generators will have air-cooled stator and rotor windings. The generators will be provided with either brushless or static excitation system. Suitable fast acting non-dead band type continuous acting digital programmable voltage regulator will be provided.
2-16
The generators will be provided with Class–F insulation and the temperature rise will be limited to that of Class–B.
Generator Circuit Breaker
It is proposed to provide generator circuit breaker for steam turbine generators to derive startup power for station from 400 KV grid through generator transformers. The GCB will be provided between the generator and generator transformer. The start-up transformer will be connected between the GCB and generator transformer. When the GCB is in open position, the start-up power required for STG auxiliaries will be derived through generator transformer and start-up transformer. The voltage, current and short circuit ratings of the GCB will be same as that of associated bus duct rating. The STG units will be synchronized with the grid through the GCB.
Generator Bus Duct
The terminals of the generator will be connected to the generator transformer through Isolated Phase Bus Duct (IPBD) of adequate short circuit withstand capability with suitably rated tapoffs to the unit transformers. The bus duct will be natural air-cooled and will run partly indoor and partly outdoor. The bus duct installation will be complete with generator line side and neutral side current transformers and line side voltage transformers required for protection, metering, voltage regulation and automatic turbine run-up system. Surge protection equipment consisting of lightning arresters with suitable discharge characteristics to suit the generator basic insulation level will be provided.
2.4 Power Evacuation
As per the new Open access policy, EPSL needs to apply for connectivity to M/s Power Grid Corporation Ltd (PGCIL). The system study will be done by PGCIL for total quantum of power evacuation of 600 MW unit. The power off take will be from power plant bus bar.
2.5 Raw Material Consumption, Storage, Handling & Transportation
Major raw materials for the proposed power plant are Pet Coke and Imported Coal. The source of Pet coke is the Essar Refinery which is located adjacent to the proposed power plant. The Pet coke shall be transported through conveyors directly to the bunkers from the stock yard located in the Essar Refinery. Imported Coal will be brought to the site via road from the nearest port (Bedi) or the upcoming Essar jetty to the plant site. The Pet Coke consumption of the proposed power plant is about 1.1 MMTPA and that of the imported coal is 0.4 MMTPA.
For the proposed units, space provision has been made in the stockyard to store about 15 days requirement of petcoke and 30 days for coal for four units. The storage capacity of Petcoke for 15 days would be about 49,500 MT and coal for 30 days would be about 17,000 MT respectively. To enable stacking and reclaiming of coal, two (2) no. unidirectional stacker-cum-reclaimers are considered. The height of the stockpile would be about 8.75 M. The cross section of the stockpile would be trapezoidal.
Two (2) stockpiles, along the length of the stacker-cum-reclaimers would be provided with a total storage capacity of about 49,500 MT tons of petcoke and a stock pile of coal across the

2-17
stacker of capacity 17,000 MT are envisaged. The stacker on the trunk conveyor would stack coal on both sides of the track. The rated capacity of the stacker would be 2,500 TPH and the peak reclaiming capacity would be 2,500 TPH. The bucket wheel on the boom conveyor of the stacker-cum-reclaimers would reclaim the Petcoke/coal from the stockyard and feed on to the trunk conveyor for onward conveying to bunkers through a series of conveyors and traveling trippers. During emergency Petcoke/coal would be reclaimed from the stockpile by dozing it into the under-ground emergency reclaim hopper. The Storage quantity is given in Table-2.4.
Table 2.4: Storage Quantity of Raw Material Sr. No. Storage Material Quantity duration (days) 1 Pet Coke ~49,500 MT 15 2 Imported Coal ~17,000 MT 30
The Pet coke and imported coal analysis is provided in Table-2.5 & Table-2.6. Pet coke and coal shall be fired in the boiler directly which would be having a maximum of 1% & 10 % ash content and a gross calorific value (GVC) of about 8,622 Kcal/Kg & 5,155 kCal/kg respectively.
Table-2.5: Analysis of Pet Coke Sr No. Description Unit Value
Proximate Analysis 1 FC % 89.8 2 Moisture % 8~15 3 Ash % 1 4 GCV Kcal/kg 8561~8622 5 Volatile Matter % 8~10
Ultimate Analysis 1 Carbon % 89.9 2 Hydrogen % 3.6 3 Nitrogen % 0.83 4 Sulphur % 8 5 Moisture % 15 6 Ash % 1
Table-2.6: Analysis of Imported Coal Description Unit Design Coal Proximate Analysis Moisture % 24 Ash % 8-10 Volatile Matter % 40-42 Fixed Carbon % 26-27 Net Calorific Value kcal/kg 4800-6000 Sulphur % <1.0 HGI 45 Ultimate Analysis Moisture % 24 Mineral Matter % 8
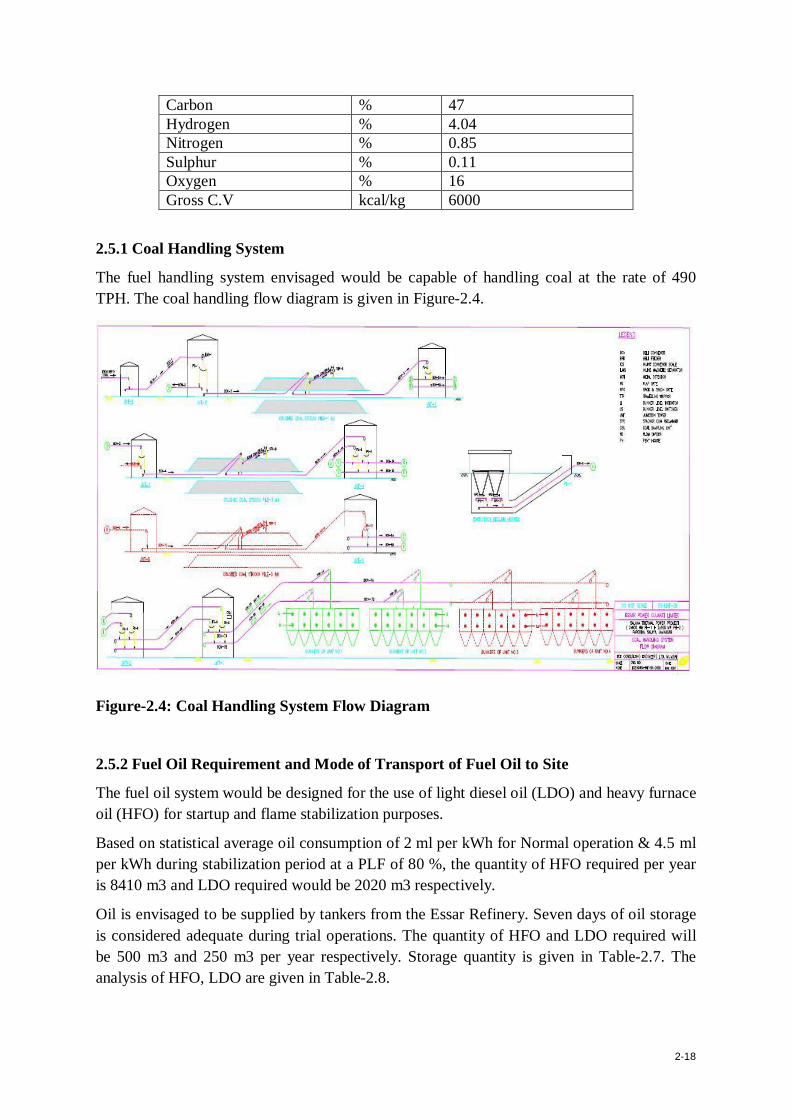
2-18
Carbon % 47 Hydrogen % 4.04 Nitrogen % 0.85 Sulphur % 0.11 Oxygen % 16 Gross C.V kcal/kg 6000
2.5.1 Coal Handling System
The fuel handling system envisaged would be capable of handling coal at the rate of 490 TPH. The coal handling flow diagram is given in Figure-2.4.
Figure-2.4: Coal Handling System Flow Diagram
2.5.2 Fuel Oil Requirement and Mode of Transport of Fuel Oil to Site
The fuel oil system would be designed for the use of light diesel oil (LDO) and heavy furnace oil (HFO) for startup and flame stabilization purposes.
Based on statistical average oil consumption of 2 ml per kWh for Normal operation & 4.5 ml per kWh during stabilization period at a PLF of 80 %, the quantity of HFO required per year is 8410 m3 and LDO required would be 2020 m3 respectively.
Oil is envisaged to be supplied by tankers from the Essar Refinery. Seven days of oil storage is considered adequate during trial operations. The quantity of HFO and LDO required will be 500 m3 and 250 m3 per year respectively. Storage quantity is given in Table-2.7. The analysis of HFO, LDO are given in Table-2.8.
2-19
Table - 2.7: Storage Quantity of Raw Material Sr. No. Storage Material Quantity 1 LDO ~250 m3 2 HFO ~500 m3
Table - 2.8: Analysis of Fuel Oil and LDO Heavy Furnace Oil (HFO)Analysis Grade MV2 (IS:1593) Sr. No. Particulars Unit Value
1 Flash Point Deg. C min 66 2 Viscosity @ 15°C (max) cSt 180 3 Pour Point °C 21 4 Ash Content By Weight % max. 01 5 Free Water Content By Volume % max. 1.0 6 Sediments By Weight % max. 0.25 7 Total Sulphur By Weight % max. 4.0 8 Calcium ppm 30.5 9 Sodium ppm 10
10 Lead ppm 0.2 11 Vanadium ppm 40.50 12 Carbon Residue (Rams Bottom) %wt 7.74 13 Approximate Gross Calorific
Value kcal/kg 10,000
14 SP Gravity At 15°C (max) 0.933
Light Diesel Oil (LDO)Analysis As Per IS 1460, 1995 Sr No. Particulars Unit Value
1 Flash Point Deg. C min 66
2 Pour Point Deg. C min 12 for Winter, 21 for Summer
3 Density at 15°C Kg/m3 850-870
4 Viscosity cSt 2.5-15.7 at 40°C
5 Ash Content by Weight %Max. 0.02 6 Water Content by Volume %Max. 0.25 7 Sediments by Weight %Max. 0.1 8 Total Sulphur by Weight %Max. 1.8 9 Approximate Gross Calorific Value Kcal/kg 10,000
2.6 Infrastructure Facilities
2.6.1 Land
The total land area required for the power plant is about 77 Ha which is in possession of Essar. EPSL will obtain the land on lease from the parent company for construction and operation of the proposed power plant. There is no resettlement and rehabilitation (R&R) involved in this project activity.

2-20
Provisions are made for administra tive building, laboratory, plant area, power house, raw material storage area, hazardous waste storage area, water storage area, ash pond, effluent treatment plant, environment analysis lab, utilities area, security area, vehicle parking, etc. The proposed project activities will take place in the company premises.
2.6.2 Water and Wastewater
The total water requirement for the power plant is around 6000 m3/hr. A large part of the water requirement is used for cooling purposes in the power plant. Sea water is proposed to be used as the cooling water. The sea water will be sourced from the existing Essar Refinery which is a Essar Group company. The refinery has a sea water drawl facility from the nearby Arabian Sea (Gulf of Kutch) which it uses to meet its own water requirement. The same facilities will be extended to the proposed power plant. A Desalination plant will also be set up to meet the fresh water requirement of other services such as DM plant (for SG make-up), coal handling/ash handling system, potable water for plant, air conditioning system makeup and plant service water. The plant water requirement for is summarised in below Table-2.9. The sea water analysis is given in Table-2.10.
Table-2.9: Plant Water Requirements for 4x150 MW TPP Sl. No Description Estimated quantity for
4x150MW Quality
m3/hr m3/day 1 Cooling Tower blow down 4003 96084 Sea Water 2 Evaporation & Drift Loss 1201 28825 3 Cooling water makeup for
condenser and SG & STG auxiliaries
5205 124909 Sea Water
4 Water requirement for production of desalination water
721 17302 Sea Water
5 Water requirement for coal and ash handling system
- 1344 Desalinated water
6 HVAC makeup, Misc. Requirements
- 4812 Desalinated water
Total Sea water requirement for 4x150 MW units
5925 1,43,436 Sea Water
Table-2.10: Sea Water Analysis Sr. No. Characteristic Test Method
IS:3205 Unit Test Result
1 pH P:11 - 7.6 2 Conductivity P:14 µs/cm 55000 3 Salinity in Parts Per
Thousand (PPT) as KCl B:2520 % 36.8
4 Turbidity P:10 NTU 1.3 5 BOD3 P:44 mg/L 23
2-21
6 Phenol D-1783 mg/L <0.1 7 Sulphide IS-3025,Sr No-46 mg/L <0.1 8 Hydrocarbon P:39 mg/L <5
2.6.2.1 Sub Systems of the Total Plant Water System
Plant water system consists of various sub systems as listed below:
Seawater intake system
Cooling water (CW) system
Auxiliary cooling water (ACW) system
Fresh water system
De-mineralized water (DM) system
Service water system
Potable water system
Fire protection system
Effluent disposal system
Effluent: The sources of effluent from the power plant are given in Tale-2.11.
Table-2.11: Effluent Generation and Disposal Effluent Rate (m3/hr) Disposal CT blow down 4003 Back to EOL after treatment
for safe disposal. Boiler blow down 79 Guard Pond and reused for
gardening DM plant Regeneration
10 Neutralization pit/Guard Pond
Storm water shall be collected through a dedicated storm water drainage network and disposed outside the plant without mixing with effluent or any other wastes.
CHAPTER – 3
BASELINE ENVIRONMENTAL
STATUS

3-1
3.1 Baseline Environmental Status
The baseline status of environmental quality in the vicinity of project site serves as the basis for identification, prediction and evaluation of impacts. This chapter describes existing environmental baseline data of the study area pertaining to the proposed project activity near Kathi Devaliya village of Khambalia taluka of the Jamnagar District of Gujarat.
The baseline environmental quality is assessed through field studies within the impact zone for various components of the environment viz. air, noise, water, land, biological environment and socio-economic environment with specific reference to environmental aspects, which may have a bearing on the impacts of the proposed Power project. The baseline environmental quality was assessed during Post Monsoon and Winter of, 2009 in a study area covering 10 km radial distance from the project site. The main purpose of describing the environmental settings of the study area is:
To understand the project need and environmental characteristics of the area.
To assess the existing environmental quality and
To identify environmentally significant factors or sensitive geographical locations.
3.2 Micro-Meteorology of the Area
3.2.1. Secondary Data
The general climate of the Khambalia Taluka has been classified as semi-arid. It is characterized by frequent drought and extreme temperature. The region gets most of the rainfall from South West Monsoon. However, monsoon is very erratic both in the extent and in duration. The weak monsoon rains and high rate of evaporation makes the area arid. The region is relatively deficient in fresh water resources.
Secondary data collected from Jamnagar IMD for 1951-1980 revealed that,
The annual atmospheric temperature shows significant seasonal variations
Temperatures are very high during the dry summer months (March to mid May) and reaches to a maximum of 41. 2oC in May
Temperature decreases with the onset of Southwest monsoon.
Mid November to February is the winter season, and December is coldest month with average minimum temperature of 5.4 oC.
Relative humidity was observed to be highest in August (87%)
Rainy season extends from June to September with average annual rainfall of about 578.9 mm. The average rainy days per year are 24.
The maximum recorded wind speed is 6.44 kmph in August, while the prevailing wind direction at site is from NW and NNW during summer.

3-2
6872
76 7775
77
8487
84
76
64 65
37 3640
47
56
64
7274
69
48
40 40
0
10
20
30
40
50
60
70
80
90
100
Jan Feb Mar Apr May Jun Jul Aug Sep Oct Nov Dec
8.30 Hrs 5.30 Hrs
26.3
29
33
35.436.4 35.9
3331.5
32.2
34.5
31.8
27.9
10.7
12.8
17.4
21.4
24.9
26.725.7
24.823.5
21.2
16.7
12.4
0
5
10
15
20
25
30
35
40
Jan Feb Mar Apr May Jun Jul Aug Sep Oct Nov Dec
Daily Max Daily Min
Data on monthly temperature, humidity and rainfall are summarized in the Fig 3.1, 3.2 and 3.3.
Figure-3.1: Monthly Temperature (°C) Variation [Source: IMD, Jamnagar]
Figure-3.2: Monthly Variation in Relative Humidity (%) [Source: IMD, Jamnagar]
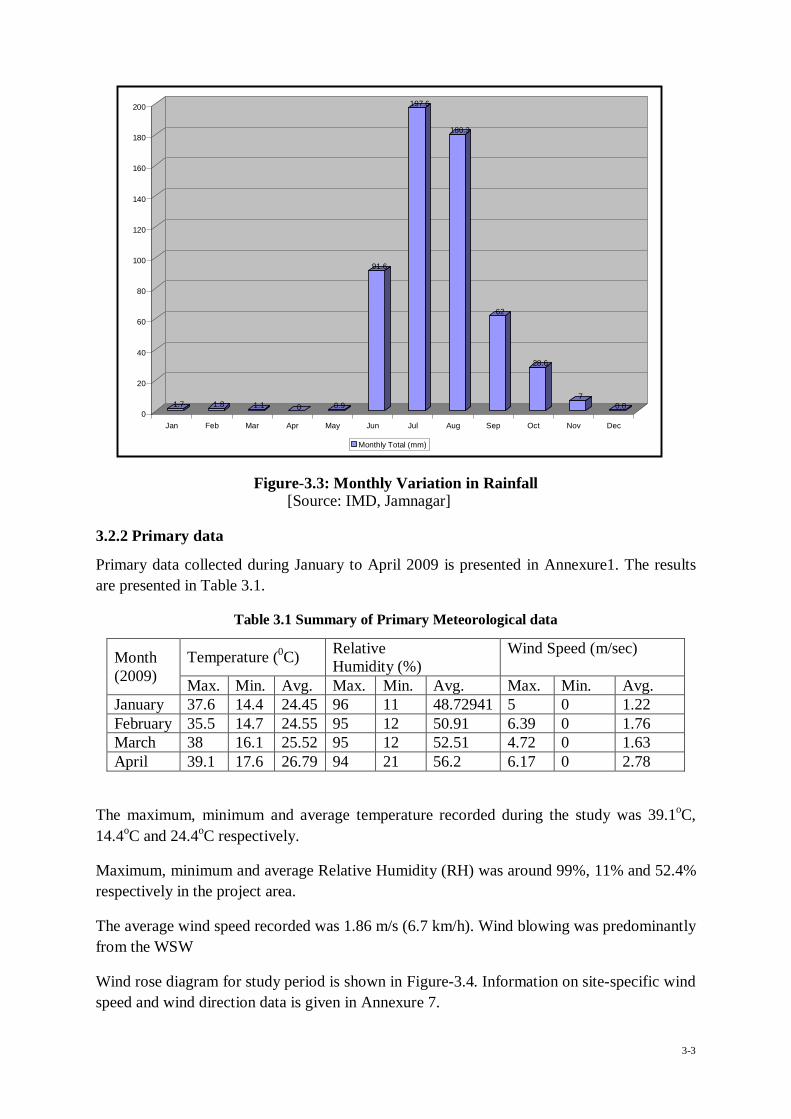
3-3
1.7 1.8 1.1 0 0.9
91.6
197.6
180.3
62
28.6
70.8
0
20
40
60
80
100
120
140
160
180
200
Jan Feb Mar Apr May Jun Jul Aug Sep Oct Nov Dec
Monthly Total (mm)
Figure-3.3: Monthly Variation in Rainfall [Source: IMD, Jamnagar]
3.2.2 Primary data
Primary data collected during January to April 2009 is presented in Annexure1. The results are presented in Table 3.1.
Table 3.1 Summary of Primary Meteorological data
Month (2009)
Temperature (0C) Relative Humidity (%)
Wind Speed (m/sec)
Max. Min. Avg. Max. Min. Avg. Max. Min. Avg. January 37.6 14.4 24.45 96 11 48.72941 5 0 1.22 February 35.5 14.7 24.55 95 12 50.91 6.39 0 1.76 March 38 16.1 25.52 95 12 52.51 4.72 0 1.63 April 39.1 17.6 26.79 94 21 56.2 6.17 0 2.78
The maximum, minimum and average temperature recorded during the study was 39.1oC, 14.4oC and 24.4oC respectively.
Maximum, minimum and average Relative Humidity (RH) was around 99%, 11% and 52.4% respectively in the project area.
The average wind speed recorded was 1.86 m/s (6.7 km/h). Wind blowing was predominantly from the WSW
Wind rose diagram for study period is shown in Figure-3.4. Information on site-specific wind speed and wind direction data is given in Annexure 7.
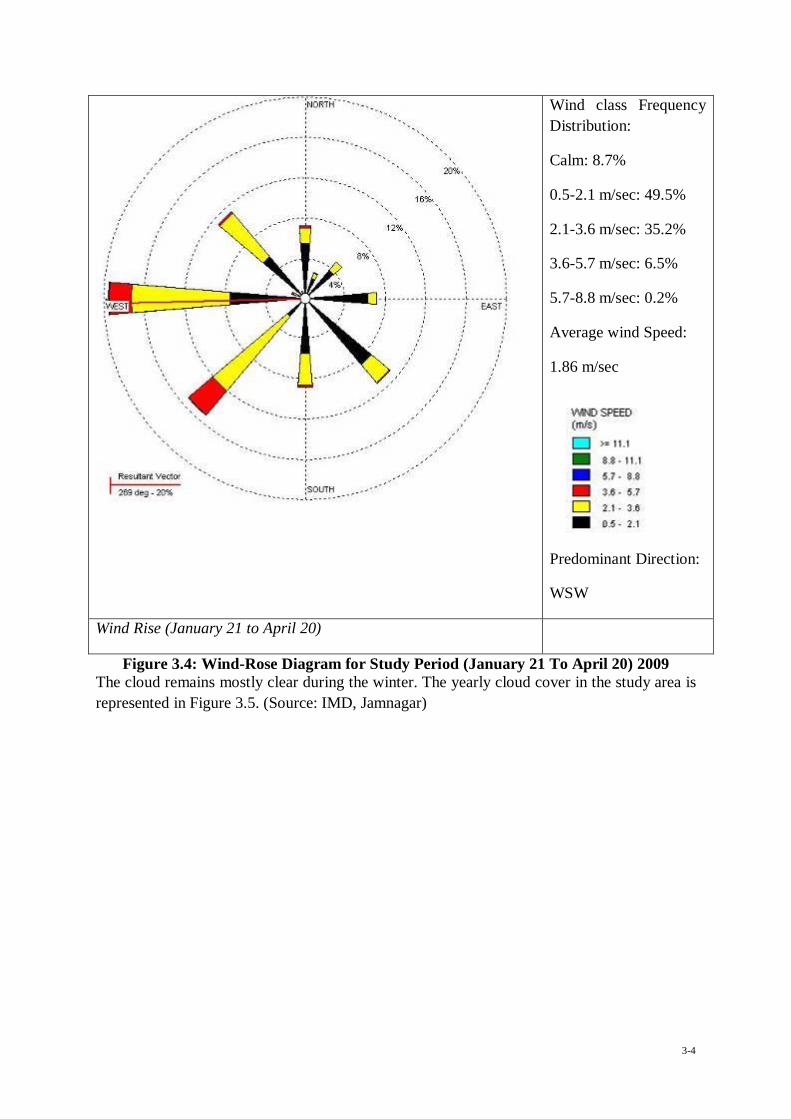
3-4
Wind class Frequency Distribution:
Calm: 8.7%
0.5-2.1 m/sec: 49.5%
2.1-3.6 m/sec: 35.2%
3.6-5.7 m/sec: 6.5%
5.7-8.8 m/sec: 0.2%
Average wind Speed:
1.86 m/sec
Predominant Direction:
WSW
Wind Rise (January 21 to April 20)
Figure 3.4: Wind-Rose Diagram for Study Period (January 21 To April 20) 2009 The cloud remains mostly clear during the winter. The yearly cloud cover in the study area is represented in Figure 3.5. (Source: IMD, Jamnagar)

3-5
49%
14%
8% 0%
29%
Winter Season
9.0
7.3
10.7
3.3 0.3
Summer Season
0.25 4.5
9.512
4.25
Monsoon Season
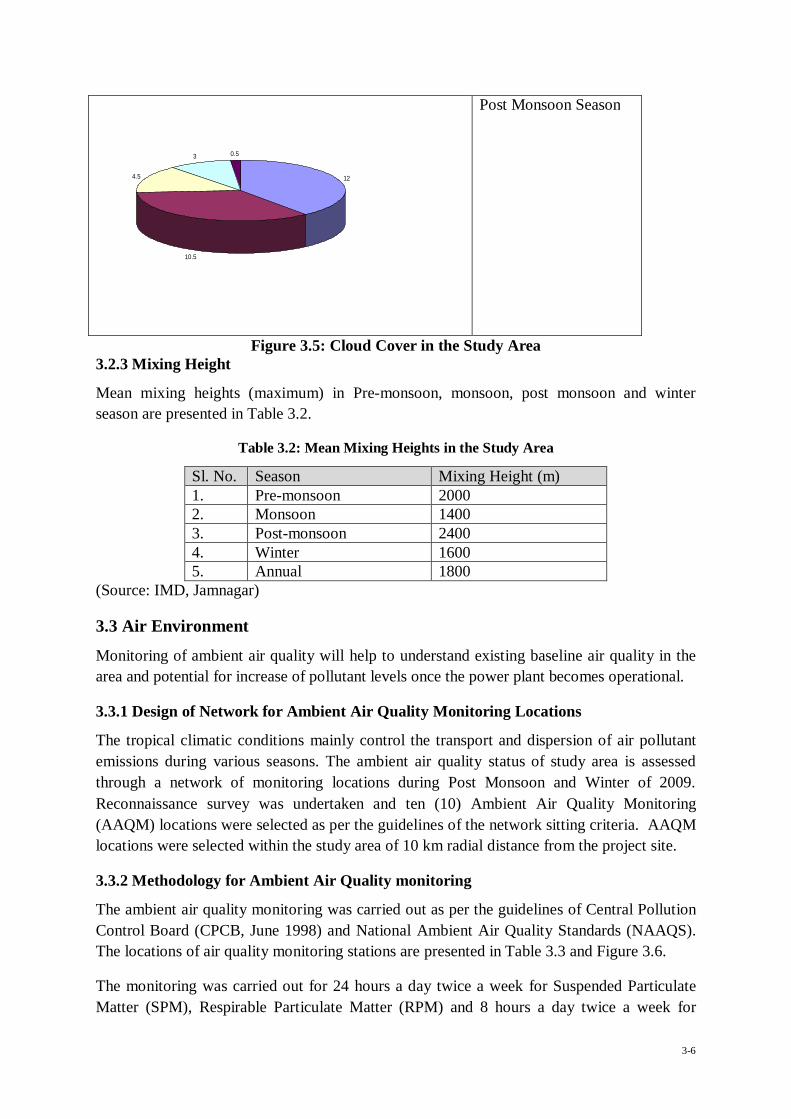
3-6
12
10.5
4.5
3 0.5
Post Monsoon Season
Figure 3.5: Cloud Cover in the Study Area 3.2.3 Mixing Height
Mean mixing heights (maximum) in Pre-monsoon, monsoon, post monsoon and winter season are presented in Table 3.2.
Table 3.2: Mean Mixing Heights in the Study Area
Sl. No. Season Mixing Height (m) 1. Pre-monsoon 2000 2. Monsoon 1400 3. Post-monsoon 2400 4. Winter 1600 5. Annual 1800
(Source: IMD, Jamnagar)
3.3 Air Environment
Monitoring of ambient air quality will help to understand existing baseline air quality in the area and potential for increase of pollutant levels once the power plant becomes operational.
3.3.1 Design of Network for Ambient Air Quality Monitoring Locations
The tropical climatic conditions mainly control the transport and dispersion of air pollutant emissions during various seasons. The ambient air quality status of study area is assessed through a network of monitoring locations during Post Monsoon and Winter of 2009. Reconnaissance survey was undertaken and ten (10) Ambient Air Quality Monitoring (AAQM) locations were selected as per the guidelines of the network sitting criteria. AAQM locations were selected within the study area of 10 km radial distance from the project site.
3.3.2 Methodology for Ambient Air Quality monitoring
The ambient air quality monitoring was carried out as per the guidelines of Central Pollution Control Board (CPCB, June 1998) and National Ambient Air Quality Standards (NAAQS). The locations of air quality monitoring stations are presented in Table 3.3 and Figure 3.6.
The monitoring was carried out for 24 hours a day twice a week for Suspended Particulate Matter (SPM), Respirable Particulate Matter (RPM) and 8 hours a day twice a week for

3-7
Sulphur Dioxide (SO2), Oxides of Nitrogen (NOx), Carbon Monoxide (CO) and Hydrocarbon (HC).
Twenty four hourly sample for four days for Lead (Pb), Mercury (Hg) and Hourly samples for four days for Ozone (O3) were obtained and analysed.
The concentrations of various pollutants for all the monitoring locations were processed for different statistical parameters like arithmetic mean, minimum concentration, maximum concentration and percentile values. The summary of ambient air quality results are presented in Table-3.4.
Table 3.3: Ambient Air Quality Monitoring Location
Station Code
Station Site Coordinates
Distance (km) and direction with respect to project area
Selection Criteria
AQ-1 Plant Site 22° 17' 56.71" 69° 43' 9.34"
0.0; Within the project site
Baseline data, prediction of GLCs at coal handling point
AQ-2 Nana Mandha
22° 19' 58.02" 69° 39' 41.78"
6.2; North West
Baseline data, upwind direction and prediction of impacts due to coal stockyard/conveyor
AQ-3 Khajurda Patia (W)
22° 17' 42.89" 69° 42' 8.50"
1.8; South-West
Baseline data, prediction of impacts arising of TPP at receptor point @ 1.8 km in downwind direction
AQ-4 Mithoi 22° 18' 17.71" 69° 45' 20.53"
4.3;South East
Baseline data, and prediction of impacts arising of TPP at receptor point @ 4.3 km in downwind direction
AQ-5 Sihari 22° 14' 33.17" 69° 45' 45.52"
8.5; South Baseline data, prediction of impacts arising of TPP at receptor point @ 8.5 km in downwind direction.
AQ-6 Danta 22° 16' 55.58" 69° 40' 17.19"
6.7; South-West
Baseline data and prediction of impacts arising of TPP at receptor point @ 6.7 km in downwind location.
AQ-7 Khambaliya 22° 12' 31.91" 69° 39' 18.47"
12.4;North-West
Baseline data, prediction of impacts arising of TPP at receptor point @ 12.4 km in downwind direction
AQ-8 Visotry 22° 16' 39.17" 69° 36' 44.77"
10.9; West Baseline data, prediction of impacts arising of TPP at receptor point @ 10.9 km in downwind direction
AQ-9 Khajurda Patia (N)
22° 20' 15.42" 69° 42' 57.00"
3.4; North Baseline data @ upwind direction
AQ-10 Salaya 22° 20' 7.98" 69° 37' 10.16"
10.3; North-West
Baseline data, prediction of impacts on coastal areas

3-8
Figure 3.6: Ambient Air Quality Monitoring Locations
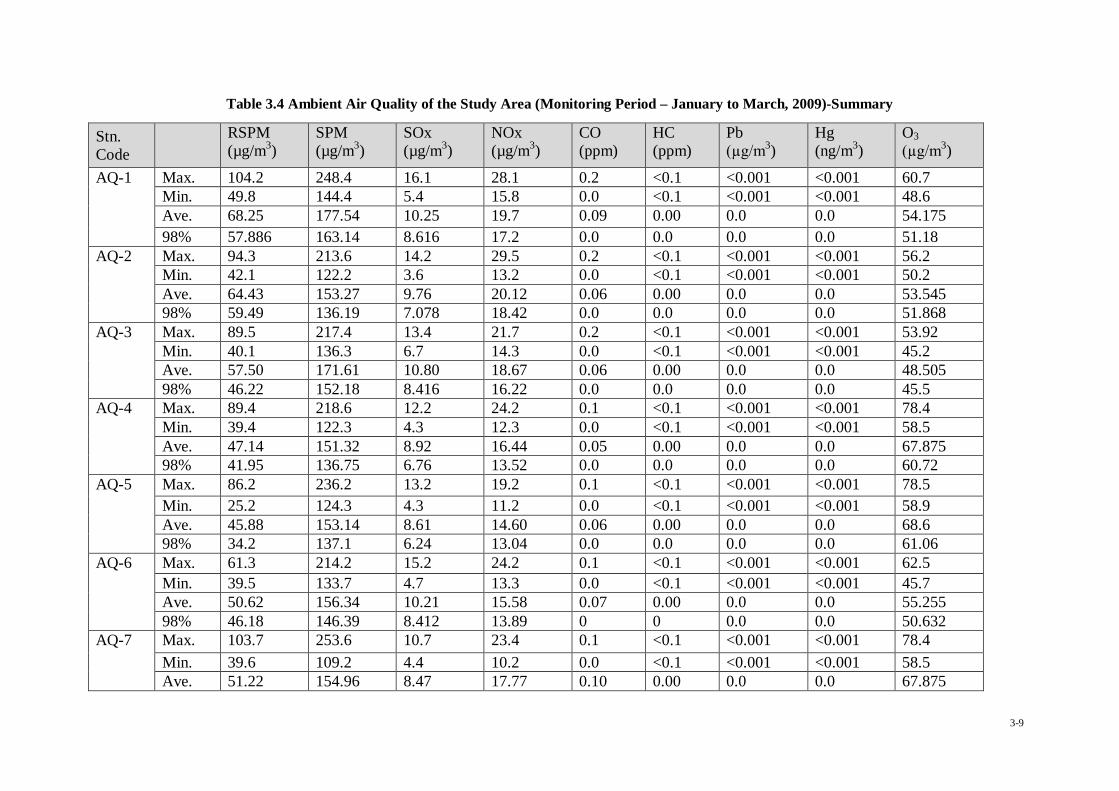
3-9
Table 3.4 Ambient Air Quality of the Study Area (Monitoring Period – January to March, 2009)-Summary
Stn. Code
RSPM (µg/m3)
SPM (µg/m3)
SOx (µg/m3)
NOx (µg/m3)
CO (ppm)
HC (ppm)
Pb (µg/m3)
Hg (ng/m3)
O3 (µg/m3)
AQ-1 Max. 104.2 248.4 16.1 28.1 0.2 <0.1 <0.001 <0.001 60.7 Min. 49.8 144.4 5.4 15.8 0.0 <0.1 <0.001 <0.001 48.6 Ave. 68.25 177.54 10.25 19.7 0.09 0.00 0.0 0.0 54.175 98% 57.886 163.14 8.616 17.2 0.0 0.0 0.0 0.0 51.18
AQ-2 Max. 94.3 213.6 14.2 29.5 0.2 <0.1 <0.001 <0.001 56.2 Min. 42.1 122.2 3.6 13.2 0.0 <0.1 <0.001 <0.001 50.2 Ave. 64.43 153.27 9.76 20.12 0.06 0.00 0.0 0.0 53.545 98% 59.49 136.19 7.078 18.42 0.0 0.0 0.0 0.0 51.868
AQ-3 Max. 89.5 217.4 13.4 21.7 0.2 <0.1 <0.001 <0.001 53.92 Min. 40.1 136.3 6.7 14.3 0.0 <0.1 <0.001 <0.001 45.2 Ave. 57.50 171.61 10.80 18.67 0.06 0.00 0.0 0.0 48.505 98% 46.22 152.18 8.416 16.22 0.0 0.0 0.0 0.0 45.5
AQ-4 Max. 89.4 218.6 12.2 24.2 0.1 <0.1 <0.001 <0.001 78.4 Min. 39.4 122.3 4.3 12.3 0.0 <0.1 <0.001 <0.001 58.5 Ave. 47.14 151.32 8.92 16.44 0.05 0.00 0.0 0.0 67.875 98% 41.95 136.75 6.76 13.52 0.0 0.0 0.0 0.0 60.72
AQ-5 Max. 86.2 236.2 13.2 19.2 0.1 <0.1 <0.001 <0.001 78.5 Min. 25.2 124.3 4.3 11.2 0.0 <0.1 <0.001 <0.001 58.9 Ave. 45.88 153.14 8.61 14.60 0.06 0.00 0.0 0.0 68.6 98% 34.2 137.1 6.24 13.04 0.0 0.0 0.0 0.0 61.06
AQ-6 Max. 61.3 214.2 15.2 24.2 0.1 <0.1 <0.001 <0.001 62.5 Min. 39.5 133.7 4.7 13.3 0.0 <0.1 <0.001 <0.001 45.7 Ave. 50.62 156.34 10.21 15.58 0.07 0.00 0.0 0.0 55.255 98% 46.18 146.39 8.412 13.89 0 0 0.0 0.0 50.632
AQ-7 Max. 103.7 253.6 10.7 23.4 0.1 <0.1 <0.001 <0.001 78.4 Min. 39.6 109.2 4.4 10.2 0.0 <0.1 <0.001 <0.001 58.5 Ave. 51.22 154.96 8.47 17.77 0.10 0.00 0.0 0.0 67.875
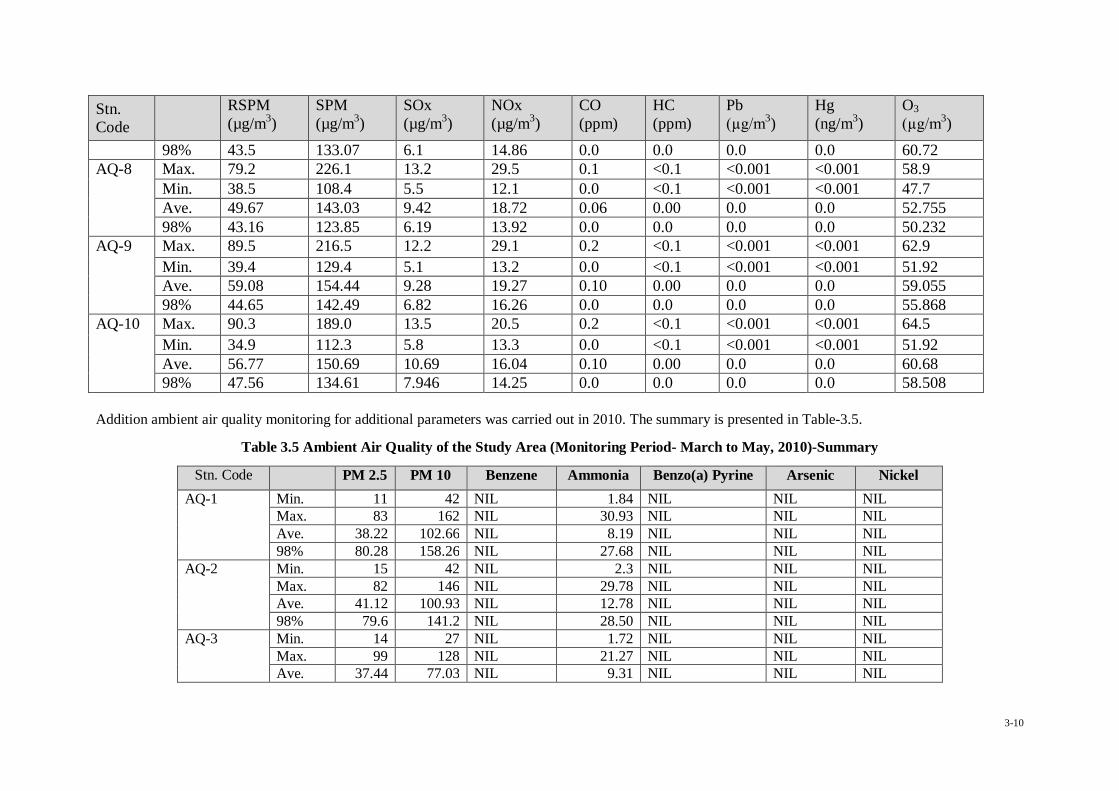
3-10
Stn. Code
RSPM (µg/m3)
SPM (µg/m3)
SOx (µg/m3)
NOx (µg/m3)
CO (ppm)
HC (ppm)
Pb (µg/m3)
Hg (ng/m3)
O3 (µg/m3)
98% 43.5 133.07 6.1 14.86 0.0 0.0 0.0 0.0 60.72 AQ-8 Max. 79.2 226.1 13.2 29.5 0.1 <0.1 <0.001 <0.001 58.9
Min. 38.5 108.4 5.5 12.1 0.0 <0.1 <0.001 <0.001 47.7 Ave. 49.67 143.03 9.42 18.72 0.06 0.00 0.0 0.0 52.755 98% 43.16 123.85 6.19 13.92 0.0 0.0 0.0 0.0 50.232
AQ-9 Max. 89.5 216.5 12.2 29.1 0.2 <0.1 <0.001 <0.001 62.9 Min. 39.4 129.4 5.1 13.2 0.0 <0.1 <0.001 <0.001 51.92 Ave. 59.08 154.44 9.28 19.27 0.10 0.00 0.0 0.0 59.055 98% 44.65 142.49 6.82 16.26 0.0 0.0 0.0 0.0 55.868
AQ-10 Max. 90.3 189.0 13.5 20.5 0.2 <0.1 <0.001 <0.001 64.5 Min. 34.9 112.3 5.8 13.3 0.0 <0.1 <0.001 <0.001 51.92 Ave. 56.77 150.69 10.69 16.04 0.10 0.00 0.0 0.0 60.68 98% 47.56 134.61 7.946 14.25 0.0 0.0 0.0 0.0 58.508
Addition ambient air quality monitoring for additional parameters was carried out in 2010. The summary is presented in Table-3.5.
Table 3.5 Ambient Air Quality of the Study Area (Monitoring Period- March to May, 2010)-Summary
Stn. Code PM 2.5 PM 10 Benzene Ammonia Benzo(a) Pyrine Arsenic Nickel AQ-1 Min. 11 42 NIL 1.84 NIL NIL NIL
Max. 83 162 NIL 30.93 NIL NIL NIL Ave. 38.22 102.66 NIL 8.19 NIL NIL NIL 98% 80.28 158.26 NIL 27.68 NIL NIL NIL
AQ-2 Min. 15 42 NIL 2.3 NIL NIL NIL Max. 82 146 NIL 29.78 NIL NIL NIL Ave. 41.12 100.93 NIL 12.78 NIL NIL NIL 98% 79.6 141.2 NIL 28.50 NIL NIL NIL
AQ-3 Min. 14 27 NIL 1.72 NIL NIL NIL Max. 99 128 NIL 21.27 NIL NIL NIL Ave. 37.44 77.03 NIL 9.31 NIL NIL NIL

3-11
Stn. Code PM 2.5 PM 10 Benzene Ammonia Benzo(a) Pyrine Arsenic Nickel 98% 90 126.8 NIL 20.78 NIL NIL NIL
AQ-4 Min. 10 65 NIL 1.22 NIL NIL NIL Max. 83 161 NIL 41.96 NIL NIL NIL Ave. 43.63 110.05 NIL 14.62 NIL NIL NIL 98% 78.32 158.12 NIL 41.00 NIL NIL NIL
AQ-5 Min. 22 61 NIL 5.06 NIL NIL NIL Max. 94 196 NIL 41.16 NIL NIL NIL Ave. 52.25 118.56 NIL 18.00 NIL NIL NIL 98% 91 191.8 NIL 40.22 NIL NIL NIL
AQ-6 Min. 10 32 NIL 1.84 NIL NIL NIL Max. 93 137 NIL 52.77 NIL NIL NIL Ave. 37.16 94.38 NIL 13.39 NIL NIL NIL 98% 89.6 134.62 NIL 49.52 NIL NIL NIL
AQ-7 Min. 17 38 NIL 1.38 NIL NIL NIL Max. 90 126 NIL 23.11 NIL NIL NIL Ave. 44.84 76.23 NIL 11.26 NIL NIL NIL 98% 84.72 124.32 NIL 22.85 NIL NIL NIL
AQ-8 Min. 16 54 NIL 1.5 NIL NIL NIL Max. 87 183 NIL 61.16 NIL NIL NIL Ave. 50.26 122.86 NIL 14.97 NIL NIL NIL 98% 87 180.48 NIL 51.14 NIL NIL NIL
AQ-9 Min. 24 51 NIL 2.3 NIL NIL NIL Max. 82 158 NIL 35.18 NIL NIL NIL Ave. 43.33 92.86 NIL 16.24 NIL NIL NIL 98% 73.32 34.98 NIL 14.23 NIL NIL NIL
AQ-10 Min. 11 72 NIL 1.03 NIL NIL NIL Max. 78 150 NIL 28.39 NIL NIL NIL Ave. 47.47 102.47 NIL 10.43 NIL NIL NIL 98% 76.4 148.72 NIL 26.42 NIL NIL NIL
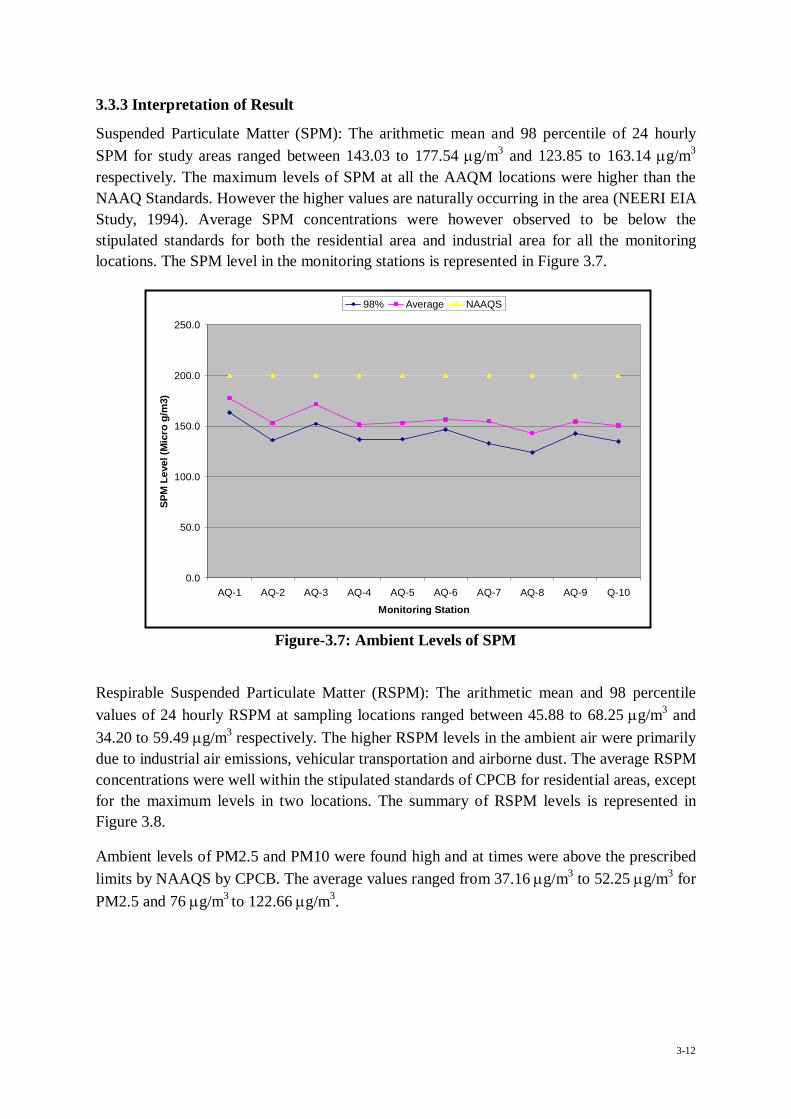
3-12
0.0
50.0
100.0
150.0
200.0
250.0
AQ-1 AQ-2 AQ-3 AQ-4 AQ-5 AQ-6 AQ-7 AQ-8 AQ-9 Q-10
Monitoring Station
SPM
Lev
el (M
icro
g/m
3)
98% Average NAAQS
3.3.3 Interpretation of Result
Suspended Particulate Matter (SPM): The arithmetic mean and 98 percentile of 24 hourly SPM for study areas ranged between 143.03 to 177.54 g/m3 and 123.85 to 163.14 g/m3 respectively. The maximum levels of SPM at all the AAQM locations were higher than the NAAQ Standards. However the higher values are naturally occurring in the area (NEERI EIA Study, 1994). Average SPM concentrations were however observed to be below the stipulated standards for both the residential area and industrial area for all the monitoring locations. The SPM level in the monitoring stations is represented in Figure 3.7.
Figure-3.7: Ambient Levels of SPM
Respirable Suspended Particulate Matter (RSPM): The arithmetic mean and 98 percentile values of 24 hourly RSPM at sampling locations ranged between 45.88 to 68.25 g/m3 and 34.20 to 59.49 g/m3 respectively. The higher RSPM levels in the ambient air were primarily due to industrial air emissions, vehicular transportation and airborne dust. The average RSPM concentrations were well within the stipulated standards of CPCB for residential areas, except for the maximum levels in two locations. The summary of RSPM levels is represented in Figure 3.8.
Ambient levels of PM2.5 and PM10 were found high and at times were above the prescribed limits by NAAQS by CPCB. The average values ranged from 37.16 g/m3 to 52.25 g/m3 for PM2.5 and 76 g/m3 to 122.66 g/m3.

3-13
0.0
10.0
20.0
30.0
40.0
50.0
60.0
70.0
80.0
90.0
AQ-1 AQ-2 AQ-3 AQ-4 AQ-5 AQ-6 AQ-7 AQ-8 AQ-9 Q-10
Monitoring Station
SOx
Leve
l (M
icro
g/m
3)
98% Average NAAQS
0.0
20.0
40.0
60.0
80.0
100.0
120.0
AQ-1 AQ-2 AQ-3 AQ-4 AQ-5 AQ-6 AQ-7 AQ-8 AQ-9 Q-10
Monitoring Station
RSP
M L
evel
(mic
ro g
/m3)
98% Average NAAQS
Figure 3.8: Ambient RSPM Level in the Study Area (mg/m3)
Oxides of Sulphur (SOX): The arithmetic mean and 98 percentile values of SOx at different AAQM locations ranged between 8.47 to 10.80 g/m3 and 6.10 to 8.6 g/m3 respectively. At all the air quality monitoring locations, the 98th percentile values of SOx were observed to be within the ambient air quality standards of CPCB for residential and industrial area. The SOx levels are represented in Figure 3.9.
Figure-3.9: Ambient SOx Levels
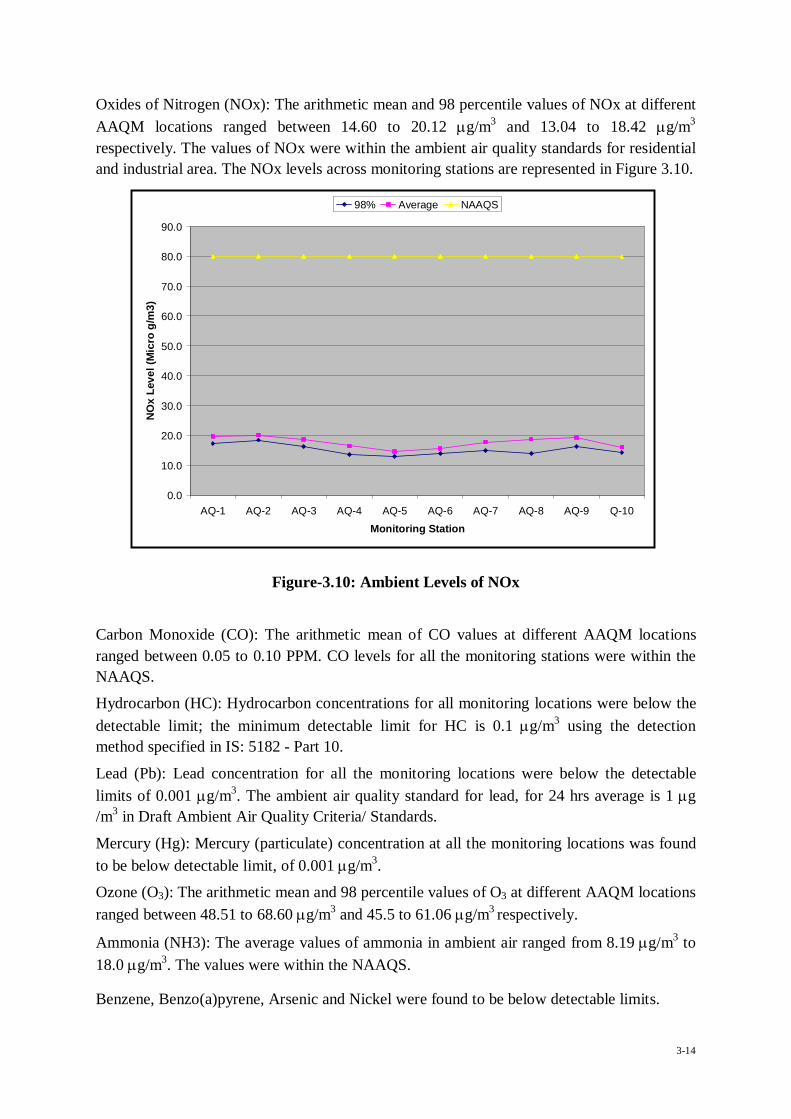
3-14
0.0
10.0
20.0
30.0
40.0
50.0
60.0
70.0
80.0
90.0
AQ-1 AQ-2 AQ-3 AQ-4 AQ-5 AQ-6 AQ-7 AQ-8 AQ-9 Q-10
Monitoring Station
NO
x Le
vel (
Mic
ro g
/m3)
98% Average NAAQS
Oxides of Nitrogen (NOx): The arithmetic mean and 98 percentile values of NOx at different AAQM locations ranged between 14.60 to 20.12 g/m3 and 13.04 to 18.42 g/m3 respectively. The values of NOx were within the ambient air quality standards for residential and industrial area. The NOx levels across monitoring stations are represented in Figure 3.10.
Figure-3.10: Ambient Levels of NOx
Carbon Monoxide (CO): The arithmetic mean of CO values at different AAQM locations ranged between 0.05 to 0.10 PPM. CO levels for all the monitoring stations were within the NAAQS.
Hydrocarbon (HC): Hydrocarbon concentrations for all monitoring locations were below the detectable limit; the minimum detectable limit for HC is 0.1 g/m3 using the detection method specified in IS: 5182 - Part 10.
Lead (Pb): Lead concentration for all the monitoring locations were below the detectable limits of 0.001 g/m3. The ambient air quality standard for lead, for 24 hrs average is 1 g /m3 in Draft Ambient Air Quality Criteria/ Standards.
Mercury (Hg): Mercury (particulate) concentration at all the monitoring locations was found to be below detectable limit, of 0.001 g/m3.
Ozone (O3): The arithmetic mean and 98 percentile values of O3 at different AAQM locations ranged between 48.51 to 68.60 g/m3 and 45.5 to 61.06 g/m3 respectively.
Ammonia (NH3): The average values of ammonia in ambient air ranged from 8.19 g/m3 to 18.0 g/m3. The values were within the NAAQS.
Benzene, Benzo(a)pyrene, Arsenic and Nickel were found to be below detectable limits.
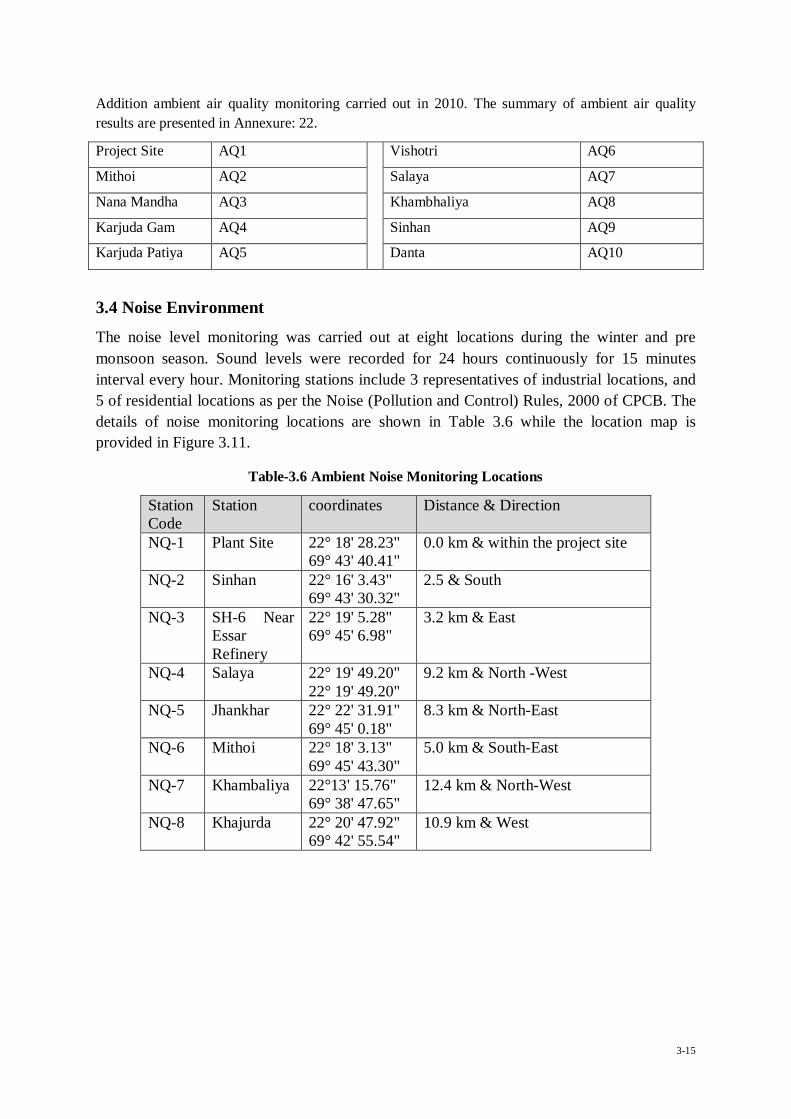
3-15
Addition ambient air quality monitoring carried out in 2010. The summary of ambient air quality results are presented in Annexure: 22.
Project Site AQ1 Vishotri AQ6
Mithoi AQ2 Salaya AQ7
Nana Mandha AQ3 Khambhaliya AQ8
Karjuda Gam AQ4 Sinhan AQ9
Karjuda Patiya AQ5 Danta AQ10
3.4 Noise Environment
The noise level monitoring was carried out at eight locations during the winter and pre monsoon season. Sound levels were recorded for 24 hours continuously for 15 minutes interval every hour. Monitoring stations include 3 representatives of industrial locations, and 5 of residential locations as per the Noise (Pollution and Control) Rules, 2000 of CPCB. The details of noise monitoring locations are shown in Table 3.6 while the location map is provided in Figure 3.11.
Table-3.6 Ambient Noise Monitoring Locations
Station Code
Station coordinates Distance & Direction
NQ-1 Plant Site 22° 18' 28.23" 69° 43' 40.41"
0.0 km & within the project site
NQ-2 Sinhan 22° 16' 3.43" 69° 43' 30.32"
2.5 & South
NQ-3 SH-6 Near Essar Refinery
22° 19' 5.28" 69° 45' 6.98"
3.2 km & East
NQ-4 Salaya 22° 19' 49.20" 22° 19' 49.20"
9.2 km & North -West
NQ-5 Jhankhar 22° 22' 31.91" 69° 45' 0.18"
8.3 km & North-East
NQ-6 Mithoi 22° 18' 3.13" 69° 45' 43.30"
5.0 km & South-East
NQ-7 Khambaliya 22°13' 15.76" 69° 38' 47.65"
12.4 km & North-West
NQ-8 Khajurda 22° 20' 47.92" 69° 42' 55.54"
10.9 km & West
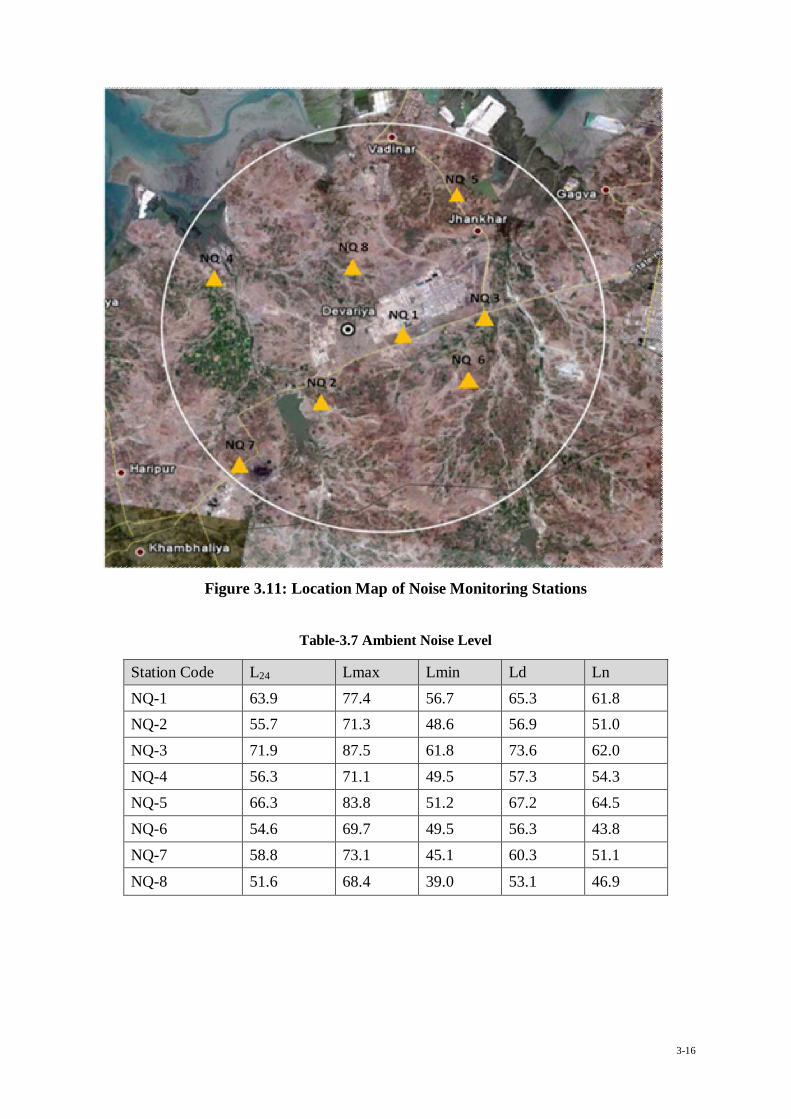
3-16
Figure 3.11: Location Map of Noise Monitoring Stations
Table-3.7 Ambient Noise Level
Station Code L24 Lmax Lmin Ld Ln NQ-1 63.9 77.4 56.7 65.3 61.8 NQ-2 55.7 71.3 48.6 56.9 51.0 NQ-3 71.9 87.5 61.8 73.6 62.0 NQ-4 56.3 71.1 49.5 57.3 54.3 NQ-5 66.3 83.8 51.2 67.2 64.5 NQ-6 54.6 69.7 49.5 56.3 43.8 NQ-7 58.8 73.1 45.1 60.3 51.1
NQ-8 51.6 68.4 39.0 53.1 46.9
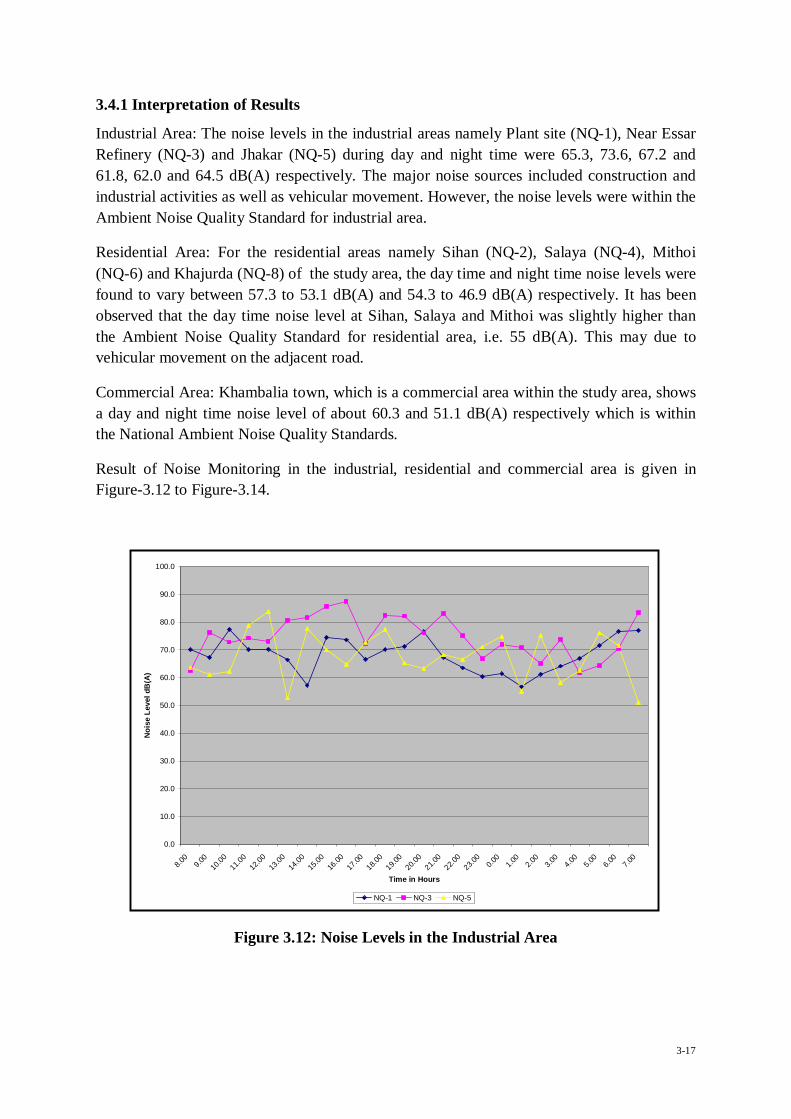
3-17
0.0
10.0
20.0
30.0
40.0
50.0
60.0
70.0
80.0
90.0
100.0
8.00
9.00
10.00
11.00
12.00
13.00
14.00
15.00
16.00
17.00
18.00
19.00
20.00
21.00
22.00
23.00
0.00
1.00
2.00
3.00
4.00
5.00
6.00
7.00
Time in Hours
Noi
se L
evel
dB
(A)
NQ-1 NQ-3 NQ-5
3.4.1 Interpretation of Results
Industrial Area: The noise levels in the industrial areas namely Plant site (NQ-1), Near Essar Refinery (NQ-3) and Jhakar (NQ-5) during day and night time were 65.3, 73.6, 67.2 and 61.8, 62.0 and 64.5 dB(A) respectively. The major noise sources included construction and industrial activities as well as vehicular movement. However, the noise levels were within the Ambient Noise Quality Standard for industrial area.
Residential Area: For the residential areas namely Sihan (NQ-2), Salaya (NQ-4), Mithoi (NQ-6) and Khajurda (NQ-8) of the study area, the day time and night time noise levels were found to vary between 57.3 to 53.1 dB(A) and 54.3 to 46.9 dB(A) respectively. It has been observed that the day time noise level at Sihan, Salaya and Mithoi was slightly higher than the Ambient Noise Quality Standard for residential area, i.e. 55 dB(A). This may due to vehicular movement on the adjacent road.
Commercial Area: Khambalia town, which is a commercial area within the study area, shows a day and night time noise level of about 60.3 and 51.1 dB(A) respectively which is within the National Ambient Noise Quality Standards.
Result of Noise Monitoring in the industrial, residential and commercial area is given in Figure-3.12 to Figure-3.14.
Figure 3.12: Noise Levels in the Industrial Area

3-18
0
10
20
30
40
50
60
70
80
8.00
9.00
10.00
11.00
12.00
13.00
14.00
15.00
16.00
17.00
18.00
19.00
20.00
21.00
22.00
23.00 0.0
01.0
02.0
03.0
04.0
05.0
06.0
07.0
0
Time in Hours
Noi
se L
evel
dB
(A)
NQ-2 NQ-4 NQ-6 NQ-8
0
10
20
30
40
50
60
70
80
8.00
9.00
10.00
11.00
12.00
13.00
14.00
15.00
16.00
17.00
18.00
19.00
20.00
21.00
22.00
23.00 0.0
01.0
02.0
03.0
04.0
05.0
06.0
07.0
0
Time in Hours
Noi
se L
evel
dB
(A)
NQ-7
Figure 3.13: Noise Levels in the Residential Area
Figure 3.14: Noise Levels in the Commercial Area

3-19
3.5 Water Environment
3.5.1 Drainage & Water Resource
Compared to the Gujarat State average, project area receives lower rainfall (average 500 to 700 mm per annum). There is no perennial river in the study area. However, seasonal rivers namely Sihan river, Ghi river and Muljhar river are located in the study area. The Sihan river is located on the western side of the proposed project site. Sinhan flows from south to north, which is approximately 3.75 km from the site. The Muljhar river is located on the eastern side of the proposed project site and also flows from south to north, at a distance of 9.6 km from the project site. The Ghi river is located on the western side of the proposed project site and flows at a distance of 10.5 km from the site. All these rivers flow into the Gulf of Kutch and general slope of the area is towards Gulf. Project site drains into the Sihan river and finally discharges into the Gulf of Kutch. The Sihan reservoir exists on the upstream of the river at Sihan village. The reservoir caters drinking and irrigation needs of the local people. The location, extent, alignment and flow direction of the surface water bodies is provided in the Drainage Map of the area presented in Figure-3.15.
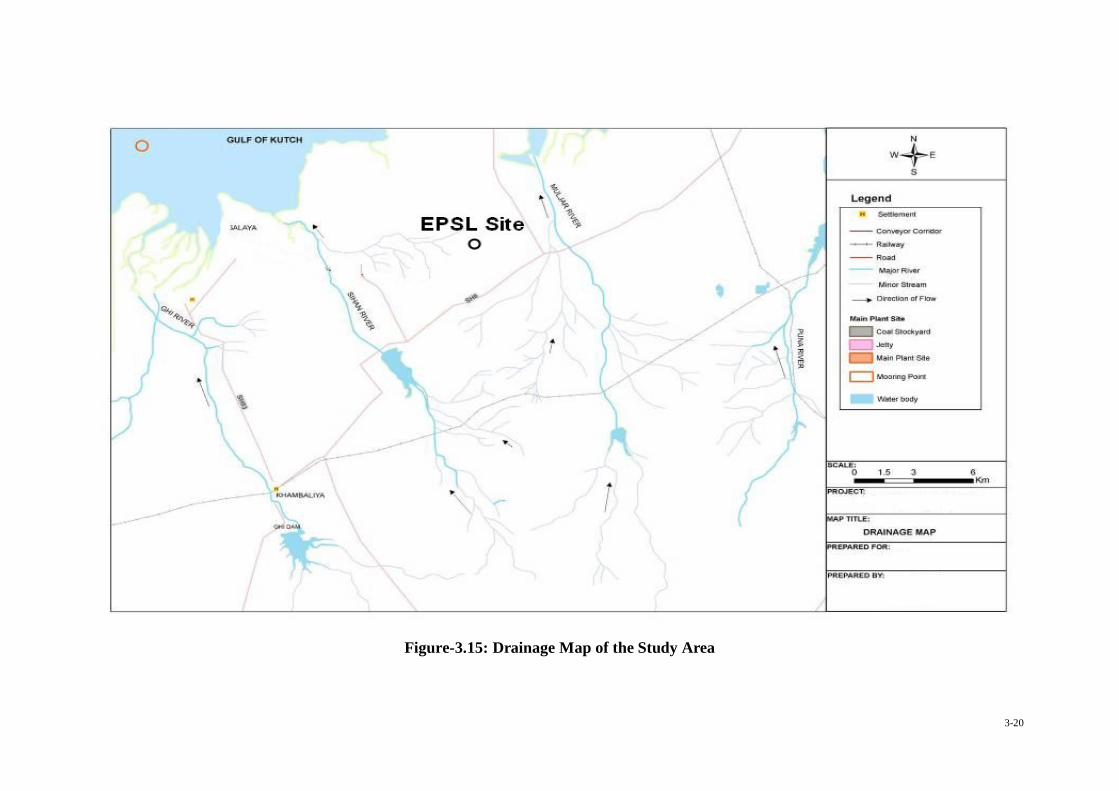
3-20
Figure-3.15: Drainage Map of the Study Area

3-21
The baseline water quality status in the region is established by analyzing surface water and ground water quality. The results have been summarized in the following sections.
3.5.2 Surface and Ground Water Quality
The baseline water quality status in the region has been established by analyzing surface water from Sihan river and Salaya creek and by ground water samples were collected from tube wells and dug wells from habitations within the study area. Details are presented in Table-3.8, Table-3.9, Table 3.10 and Figure-3.16.
Figure-3.16: Surface Water & Ground Water Quality Monitoring Station Map
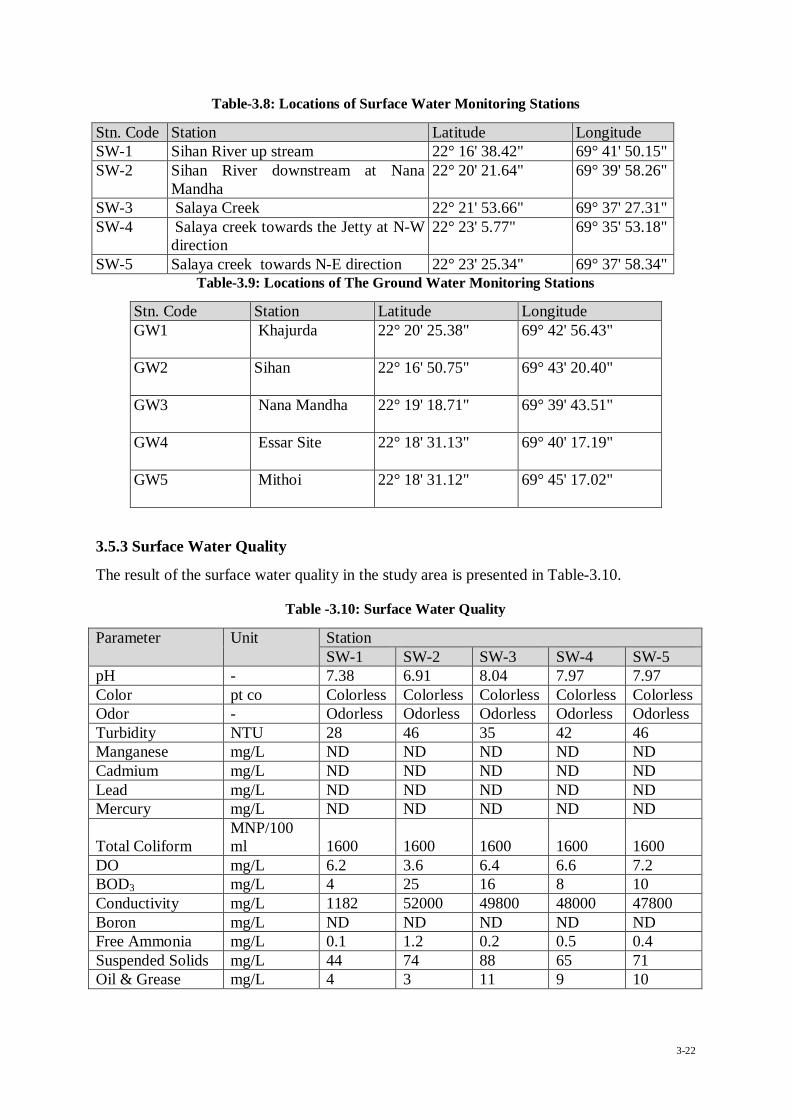
3-22
Table-3.8: Locations of Surface Water Monitoring Stations
Stn. Code Station Latitude Longitude SW-1 Sihan River up stream 22° 16' 38.42" 69° 41' 50.15" SW-2 Sihan River downstream at Nana
Mandha 22° 20' 21.64" 69° 39' 58.26"
SW-3 Salaya Creek 22° 21' 53.66" 69° 37' 27.31" SW-4 Salaya creek towards the Jetty at N-W
direction 22° 23' 5.77" 69° 35' 53.18"
SW-5 Salaya creek towards N-E direction 22° 23' 25.34" 69° 37' 58.34" Table-3.9: Locations of The Ground Water Monitoring Stations
Stn. Code Station Latitude Longitude GW1 Khajurda 22° 20' 25.38"
69° 42' 56.43"
GW2 Sihan 22° 16' 50.75"
69° 43' 20.40"
GW3 Nana Mandha 22° 19' 18.71"
69° 39' 43.51"
GW4 Essar Site 22° 18' 31.13"
69° 40' 17.19"
GW5 Mithoi 22° 18' 31.12"
69° 45' 17.02"
3.5.3 Surface Water Quality
The result of the surface water quality in the study area is presented in Table-3.10.
Table -3.10: Surface Water Quality
Parameter Unit Station SW-1 SW-2 SW-3 SW-4 SW-5
pH - 7.38 6.91 8.04 7.97 7.97 Color pt co Colorless Colorless Colorless Colorless Colorless Odor - Odorless Odorless Odorless Odorless Odorless Turbidity NTU 28 46 35 42 46 Manganese mg/L ND ND ND ND ND Cadmium mg/L ND ND ND ND ND Lead mg/L ND ND ND ND ND Mercury mg/L ND ND ND ND ND
Total Coliform MNP/100 ml 1600 1600 1600 1600 1600
DO mg/L 6.2 3.6 6.4 6.6 7.2 BOD3 mg/L 4 25 16 8 10 Conductivity mg/L 1182 52000 49800 48000 47800 Boron mg/L ND ND ND ND ND Free Ammonia mg/L 0.1 1.2 0.2 0.5 0.4 Suspended Solids mg/L 44 74 88 65 71 Oil & Grease mg/L 4 3 11 9 10

3-23
3.5.3.1 Interpretation of Surface Water Quality
The pH varied in the range of 6.91 – 8.04 which indicates that the water is neutral in nature. The DO level in the Sinhan reservoir was 6.2 mg/L and BOD3 level was 4.0 mg/L indicate the sufficiently good quality water with low organic load. The total coliforms count was 1600 MNP/100 ml indicating some the contamination from domestic sewage into the reservoir. The reservoir water may be categorized under Class C category water, i.e. drinking water source after conventional treatment and disinfection. The parameters also confirm the suitability for this purpose.
Water downstream of Sinhan river was almost stagnant and only limited tidal influx was noticed during the sampling period. The DO level was 3.6 mg/L and BOD level 25 mg/L, indicates presence of organic load.
The assigned category of Salaya creak as per CPCB is SW II, i.e. for commercial fishing and recreation. The water of the Salaya creek with respect to pH (7.97 to 8.04), Dissolved Oxygen (6.4 to 7.2 mg/L), colour and odour satisfies the designated use under the category SW II. However BOD3 (8 t0 16 mg/L), Turbidity (35 to 46 NTU) and Total Coliform (1600 MNP/100 ml) was observed to be higher which may be due to the discharge of sewage water from nearby residential and industrial areas.
3.5.4 Ground Water Quality
The ground water quality was assessed from collecting samples from hand pumps or dug wells at 5 locations. The result of ground water quality is presented in Table-3.11.
Table-3.11: Ground Water Quality In The Study Area
Parameter Unit Station GW-1 GW-2 GW-3 GW-4 GW-5
pH - 7.29 7.4 7.74 7.31 7.53 Color pt co Colorless Colorless Colorless Colorless Colorless Odor - Odorless Odorless Odorless Odorless Odorless
Taste - Un Objectionable
Un Objectionable
Un Objectionable
Un Objectionable
Un Objectionable
Turbidity NTU 3 2 4 3 4 Total Hardness mg/L 790 610 260 910 380 Calcium Hardness mg/L 450 370 140 490 240 Iron mg/L 0.11 0.055 0.22 0.55 0.275 Chlorides mg/L 523 218 65.6 391.8 104.6 TDS mg/L 2850 1280 425 2110 676 Alkalinity mg/L 410 330 300 340 360 Residual Chlorine mg/L ND ND ND ND ND Manganese mg/L ND ND ND ND ND Sulfates mg/L 122.05 94.24 35.56 113.84 31.46

3-24
Parameter Unit Station GW-1 GW-2 GW-3 GW-4 GW-5
Nitrates mg/L 0.065 0.065 0.085 0.092 0.1 Fluorides mg/L 0.6 0.5 0.5 0.64 0.54 Copper mg/L ND ND ND ND ND Selenium mg/L ND ND ND ND ND Cadmium mg/L ND ND ND ND ND Chromium Hex. mg/L ND ND ND ND ND Lead mg/L ND ND ND ND ND Zinc mg/L 0.004 0.005 0.012 0.004 0.001 Mercury mg/L ND ND ND ND ND Arsenic mg/Lt ND ND ND ND ND Phenolic Compounds mg/L ND ND ND 0.06 0.1 Cyanide mg/L ND ND ND ND ND Total Coliform
mpn/ 100 ml 70 <2.2 16 16 16
DO mg/L 6.3 6.2 6.4 6.3 6.1 BOD3 mg/L ND ND ND ND ND Conductivity µs/cm 3100 1600 558 2300 852
3.5.4.1 Interpretation of Ground Water Quality
The pH, colour and odour values in all the ground water samples were within the BIS standard IS 10500 for drinking water. Turbidity was within the limit for drinking water in absence of alternate source. The total hardness varied in range 260 mg/L to 910 mg/L and all samples were above the acceptable limits of 200. . Total Dissolved Solids (TDS) except for Nana Mandha were above the drinking water standards of 500mg/l. Chlorides (Cl) too were above the prescribed limits of 250 mg/l Nitrates and Sulfates level varied from 0.065 to 0.1 mg/L and 31.46 to 122.05 mg/L respectively. The Nitrates and Sulfates level was observed within the BIS drinking water standards of 45 mg/l and 200 mg/l. Iron level in the samples was ranges from 0.055 to 0.275 mg/L and was observed within the BIS drinking water standards of 3mg/l. Heavy metals (Arsenic, Mercury, Cadmium, Selenium, Chromium, Cyanide and Lead) were reported below detectable limit in all the ground water samples. Zinc was reported (0.001 to 0.012 mg/L) in the ground water samples but it was within the permissible limit of 5 mg/L. Total coliforms were reported in all the water samples (> 2 to 70 MNP/100 ml) and requires disinfection before its use for drinking purpose.
3.6 Land Environment
3.6.1 Geology
The project site comprises basaltic flows of Upper Cretaceous to Eocene age. In the present area the basaltic flows are cut across by N-S and WSW-E-NE trending basaltic and dolerite dykes. Structurally the flows are traversed by both N-S and WNW-ESE trending lineaments. The coastal area of the study area comprises of undifferentiated alluvium sand dunes, Rann

3-25
clay, mud and coral reef of recent period. The geological feature of the study area is given in Figure-3.17
3.6.2 Regional Soil Characteristics
The study area primarily comprises of clayey soils of the piedmont plain and coastal plain. The calcareous character in the soils is because of the accumulation of calcium and magnesium carbonates in varying proportion throughout the soil profile. Lack of precipitation typical of semi arid regions like this leads to insufficient leaching, thus, leading to accumulation of calcium and magnesium salts. The regional soil characteristic of the study area is given in Figure-3.18 (Source: District Resource Map- Jamnagar District).

3-26
Figure-3.17: Geological Feature of the Study Area

3-27
Figure-3.18: Regional Soil Characteristics Map in the Study Area
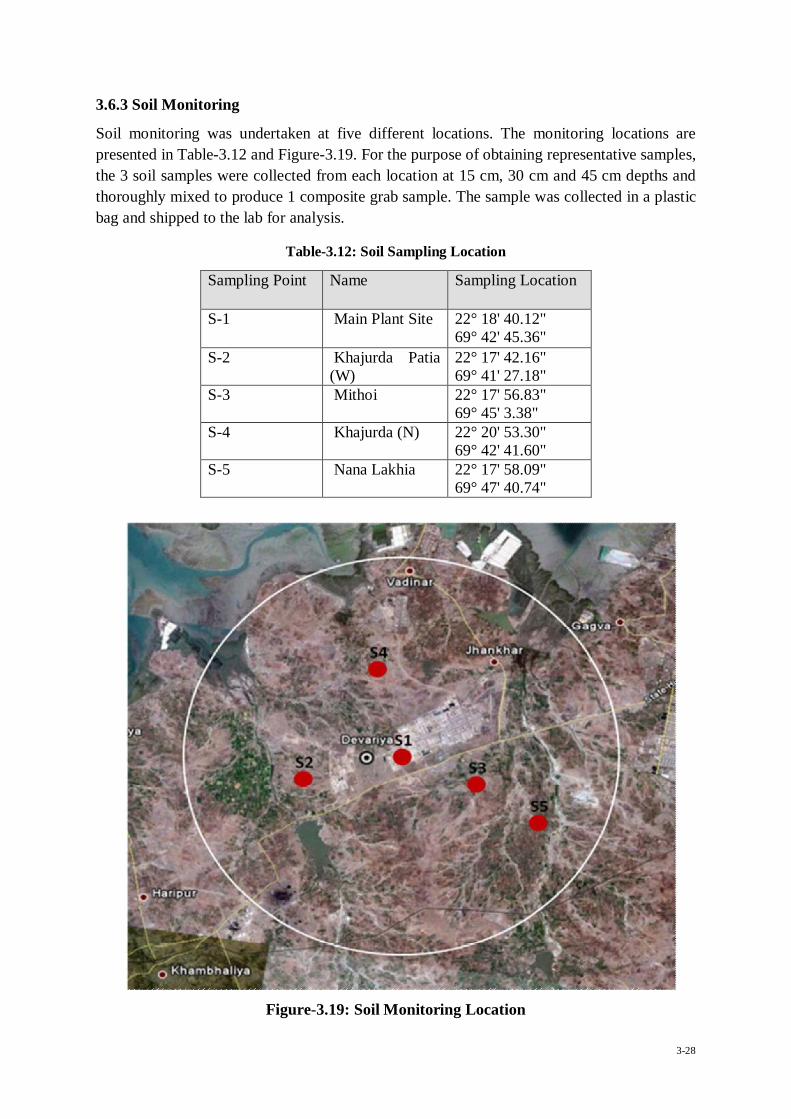
3-28
3.6.3 Soil Monitoring
Soil monitoring was undertaken at five different locations. The monitoring locations are presented in Table-3.12 and Figure-3.19. For the purpose of obtaining representative samples, the 3 soil samples were collected from each location at 15 cm, 30 cm and 45 cm depths and thoroughly mixed to produce 1 composite grab sample. The sample was collected in a plastic bag and shipped to the lab for analysis.
Table-3.12: Soil Sampling Location
Sampling Point Name Sampling Location
S-1 Main Plant Site 22° 18' 40.12" 69° 42' 45.36"
S-2 Khajurda Patia (W)
22° 17' 42.16" 69° 41' 27.18"
S-3 Mithoi 22° 17' 56.83" 69° 45' 3.38"
S-4 Khajurda (N) 22° 20' 53.30" 69° 42' 41.60"
S-5 Nana Lakhia 22° 17' 58.09" 69° 47' 40.74"
Figure-3.19: Soil Monitoring Location
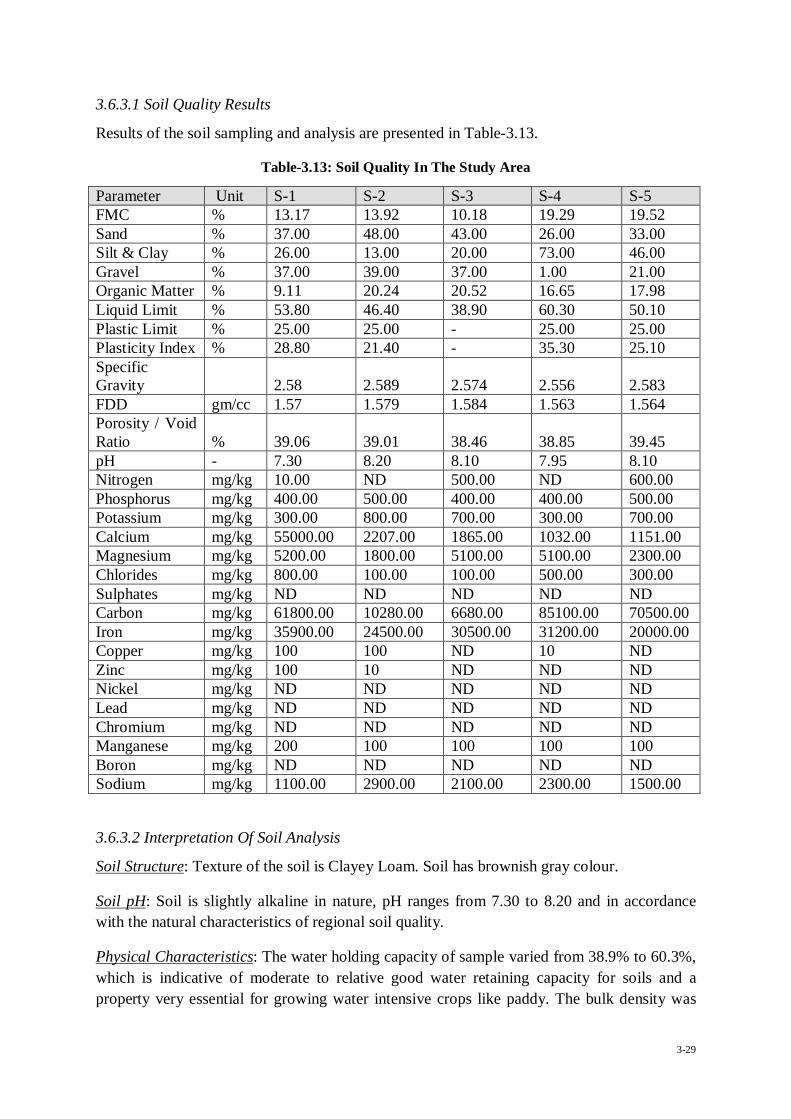
3-29
3.6.3.1 Soil Quality Results
Results of the soil sampling and analysis are presented in Table-3.13.
Table-3.13: Soil Quality In The Study Area
Parameter Unit S-1 S-2 S-3 S-4 S-5 FMC % 13.17 13.92 10.18 19.29 19.52 Sand % 37.00 48.00 43.00 26.00 33.00 Silt & Clay % 26.00 13.00 20.00 73.00 46.00 Gravel % 37.00 39.00 37.00 1.00 21.00 Organic Matter % 9.11 20.24 20.52 16.65 17.98 Liquid Limit % 53.80 46.40 38.90 60.30 50.10 Plastic Limit % 25.00 25.00 - 25.00 25.00 Plasticity Index % 28.80 21.40 - 35.30 25.10 Specific Gravity 2.58 2.589 2.574 2.556 2.583 FDD gm/cc 1.57 1.579 1.584 1.563 1.564 Porosity / Void Ratio % 39.06 39.01 38.46 38.85 39.45 pH - 7.30 8.20 8.10 7.95 8.10 Nitrogen mg/kg 10.00 ND 500.00 ND 600.00 Phosphorus mg/kg 400.00 500.00 400.00 400.00 500.00 Potassium mg/kg 300.00 800.00 700.00 300.00 700.00 Calcium mg/kg 55000.00 2207.00 1865.00 1032.00 1151.00 Magnesium mg/kg 5200.00 1800.00 5100.00 5100.00 2300.00 Chlorides mg/kg 800.00 100.00 100.00 500.00 300.00 Sulphates mg/kg ND ND ND ND ND Carbon mg/kg 61800.00 10280.00 6680.00 85100.00 70500.00 Iron mg/kg 35900.00 24500.00 30500.00 31200.00 20000.00 Copper mg/kg 100 100 ND 10 ND Zinc mg/kg 100 10 ND ND ND Nickel mg/kg ND ND ND ND ND Lead mg/kg ND ND ND ND ND Chromium mg/kg ND ND ND ND ND Manganese mg/kg 200 100 100 100 100 Boron mg/kg ND ND ND ND ND Sodium mg/kg 1100.00 2900.00 2100.00 2300.00 1500.00
3.6.3.2 Interpretation Of Soil Analysis
Soil Structure: Texture of the soil is Clayey Loam. Soil has brownish gray colour.
Soil pH: Soil is slightly alkaline in nature, pH ranges from 7.30 to 8.20 and in accordance with the natural characteristics of regional soil quality.
Physical Characteristics: The water holding capacity of sample varied from 38.9% to 60.3%, which is indicative of moderate to relative good water retaining capacity for soils and a property very essential for growing water intensive crops like paddy. The bulk density was

3-30
observed to vary between of 2.556 to 2.589 g/cm3 thereby indicating medium porosity of the soil.
Soil Fertility: In terms of soil fertility, the organic matter content was observed to vary between 9.11% to 20.52% and thus exhibiting poor to moderate fertility characteristics. This is supported by measured values for Nitrogen, Phosphorus, and Potassium (NPK) contents of the soil which were vary between 10 to 600 mg/kg, 400 to 500 mg/kg and 300 to 800 mg/kg respectively.
The average concentrations of Calcium (1032 to 55000 mg/kg), Magnesium (1800 to 5200 mg/kg) and Sodium (0.11 to 0.29 mg/kg) are in the range of natural composition of soil and their relative concentrations also agree very closely with those expected for uncontaminated soil. The concentration of Iron and Manganese was varied between 20000 to 35900 mg/kg and 100 to 200 mg/kg respectively however is moderate in nature.
Soil Contamination: The concentrations of heavy metals Copper, Zinc, Nickel, Lead, Chromium do not indicate any extraordinary or abnormal enrichment of the metals or contamination from any external sources and the concentrations are in the range of general natural composition of soils.
3.6.4 Land Use Pattern
The land-use and land-cover of the study area including the project site was interpreted using satellite data (IRS P6 LISS III, March 08, 2008), toposheet of the area, and subsequent ground truthing during the field surveys. The land use of the study area is represented in the Table 3.14.
3.6.4.1 Area under Different Landuses
The land use / land cover classification up to 10 km radius around the project site indicates 27.73% waste land, 27.56% fallow land, 16.66% agricultural land, 12.73% water body (sea, reservoir, river), 5.10% vegetation-Juliflora, 3.93% industry and 1.34% mangrove vegetation, etc. The land use details are given in Table-3.14 and Figure 3.20.
Table – 3.14: Landuse of the Study Area
Sl. No. Land Use Category Area (Sq. km) Percentage 1. Agricultural Land 58.24 16.66 2. Fallow land 96.33 27.56 3. Mangrove vegetation 4.68 1.34 4. Industrial use 13.74 3.93 5. Mud Flat 6.11 1.75 6. Salt Pan 0.32 0.09 7. Sand Flat 2.92 0.84 8. Settlements 7.95 2.27 9. Vegetation-Juliflora 17.81 5.10 10. Wasteland 96.91 27.73 11. Water body 44.49 12.73 Total 349.52 100.00

3-31
Agricultural land in the study area is mostly put to use for mono-crop rain-fed cultivation. Among the cereals, Bajra and Jowar are major crops in the study area. Other crops include wheat, pulses (Mung), and Erand (oil seed). In the study area major industrial setup is Essar Refinery. In the project site is an industrial land ,and in possession Essar. In the coastal area, some degraded mangrove forest exists. The existing land use of the proposed project site, main plant site and coal stock yard is an industrial land.

3-32
Figure-3.20: Land Use Map of the Study Area

3-33
3.7 Biological Environment
The tropical hot and humid climate with scanty rains, normally supports scrub vegetation constituting thorny species. The primary objectives to study the biological environment are to:
Assess the major habitats in the study area,
Identify common flora and fauna in the study area,
Find out rare and endangered floral and faunal species if any,
Evaluate habitat of the protected species in the study area, and
Evaluate any likely impact of the proposed project on wildlife habitat and impact on protected species.
3.7.1 Terrestrial Ecosystem
3.7.1.1 Vegetation Type:
Vegetation type of the study area can be classified as Desert Thorn Forest. This is dominated by open scrub vegetation, mainly thorny, stout species of Prosopis juliflora, Acacia spp., Euphorbia spp. and Cassia spp. A costal part of the study area has a small patch of mangrove forest and sand dunes. The proposed project site is an industrial area and has no forest land. What we found around the project site was agricultural areas and degraded vegetation.
Figure-3.21: Vegetation in the Study Area 3.7.1.2 Flora
This detailed ecological investigation indicated that the area mainly has scrub vegetation. Trees and shrubs of Prosopis and Acacia are predominantly occurring in the non-cultivated lands. Also members of Euphorbiaceae namely E. nivula and E. tirucalli were very commonly observed. Aloe vera was also observed at few places. The profusely grown Ficus benghlensis were observed near the village road and water courses. Neem (Azadirachta indica) is also observed commonly in the study area. In shrubs- Cassia auriculata, locally
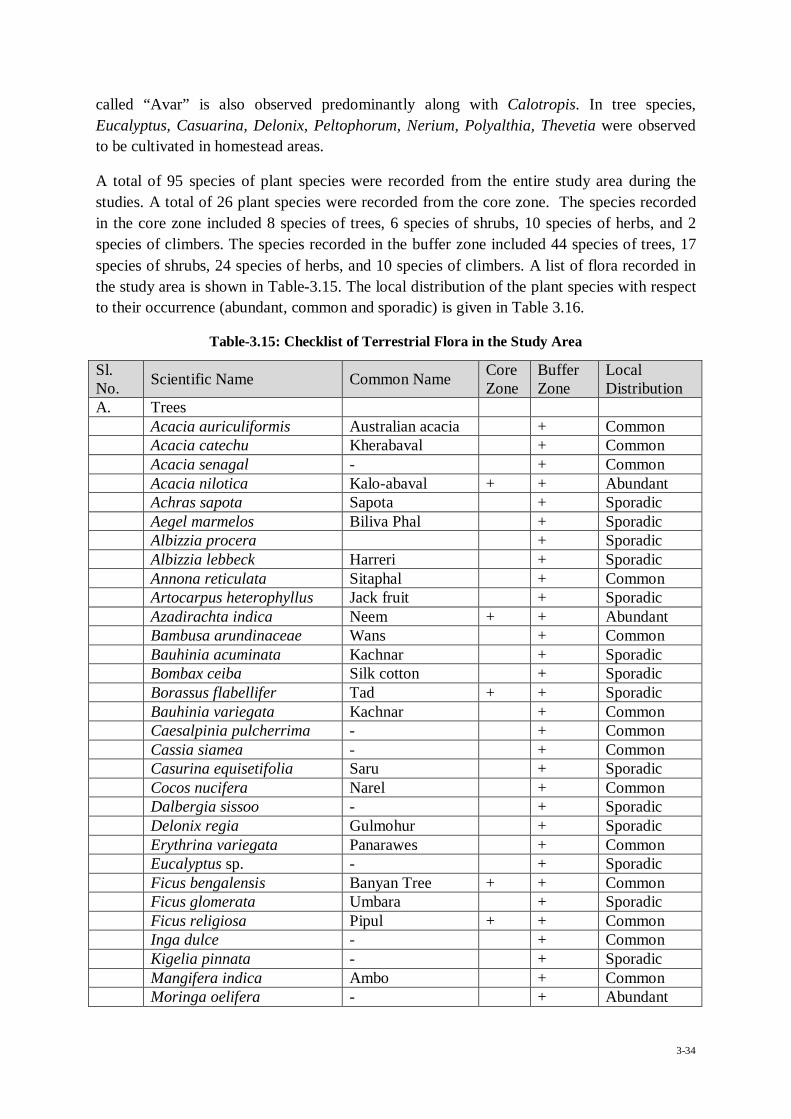
3-34
called “Avar” is also observed predominantly along with Calotropis. In tree species, Eucalyptus, Casuarina, Delonix, Peltophorum, Nerium, Polyalthia, Thevetia were observed to be cultivated in homestead areas.
A total of 95 species of plant species were recorded from the entire study area during the studies. A total of 26 plant species were recorded from the core zone. The species recorded in the core zone included 8 species of trees, 6 species of shrubs, 10 species of herbs, and 2 species of climbers. The species recorded in the buffer zone included 44 species of trees, 17 species of shrubs, 24 species of herbs, and 10 species of climbers. A list of flora recorded in the study area is shown in Table-3.15. The local distribution of the plant species with respect to their occurrence (abundant, common and sporadic) is given in Table 3.16.
Table-3.15: Checklist of Terrestrial Flora in the Study Area
Sl. No. Scientific Name Common Name Core
Zone Buffer Zone
Local Distribution
A. Trees Acacia auriculiformis Australian acacia + Common Acacia catechu Kherabaval + Common Acacia senagal - + Common Acacia nilotica Kalo-abaval + + Abundant Achras sapota Sapota + Sporadic Aegel marmelos Biliva Phal + Sporadic Albizzia procera + Sporadic Albizzia lebbeck Harreri + Sporadic Annona reticulata Sitaphal + Common Artocarpus heterophyllus Jack fruit + Sporadic Azadirachta indica Neem + + Abundant Bambusa arundinaceae Wans + Common Bauhinia acuminata Kachnar + Sporadic Bombax ceiba Silk cotton + Sporadic Borassus flabellifer Tad + + Sporadic Bauhinia variegata Kachnar + Common Caesalpinia pulcherrima - + Common Cassia siamea - + Common Casurina equisetifolia Saru + Sporadic Cocos nucifera Narel + Common Dalbergia sissoo - + Sporadic Delonix regia Gulmohur + Sporadic Erythrina variegata Panarawes + Common Eucalyptus sp. - + Sporadic Ficus bengalensis Banyan Tree + + Common Ficus glomerata Umbara + Sporadic Ficus religiosa Pipul + + Common Inga dulce - + Common Kigelia pinnata - + Sporadic Mangifera indica Ambo + Common Moringa oelifera - + Abundant
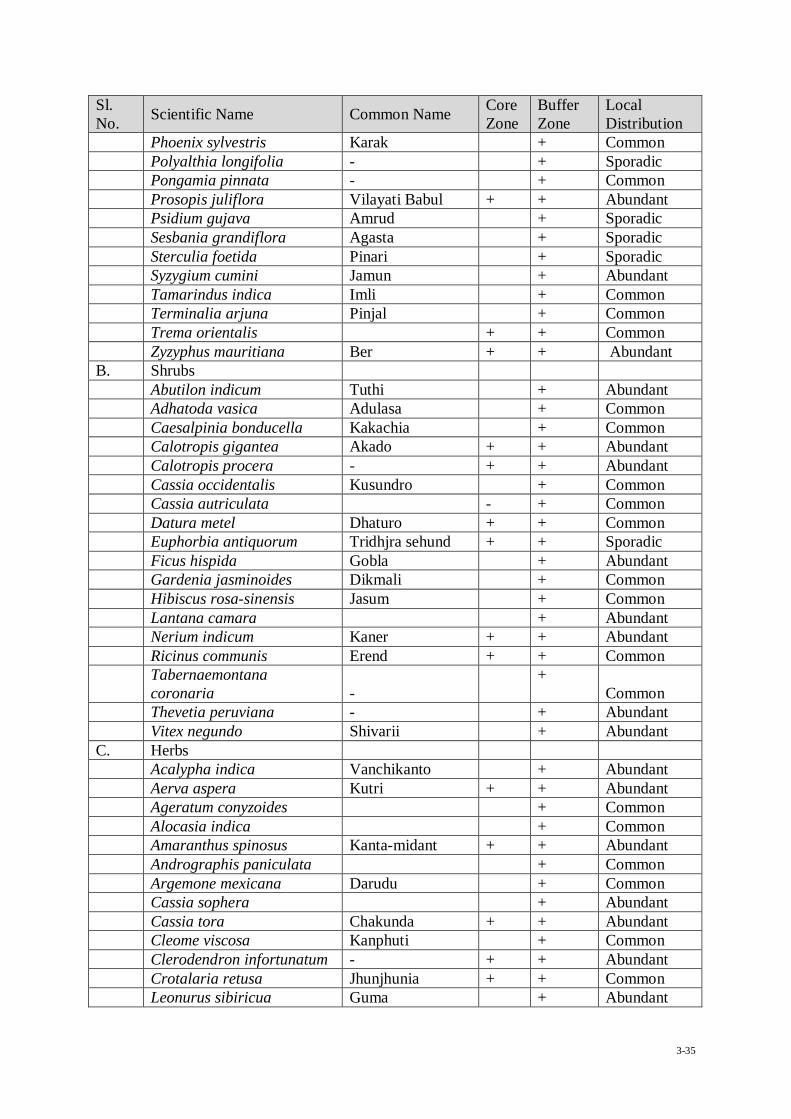
3-35
Sl. No. Scientific Name Common Name Core
Zone Buffer Zone
Local Distribution
Phoenix sylvestris Karak + Common Polyalthia longifolia - + Sporadic Pongamia pinnata - + Common Prosopis juliflora Vilayati Babul + + Abundant Psidium gujava Amrud + Sporadic Sesbania grandiflora Agasta + Sporadic Sterculia foetida Pinari + Sporadic Syzygium cumini Jamun + Abundant Tamarindus indica Imli + Common Terminalia arjuna Pinjal + Common Trema orientalis + + Common Zyzyphus mauritiana Ber + + Abundant B. Shrubs Abutilon indicum Tuthi + Abundant Adhatoda vasica Adulasa + Common Caesalpinia bonducella Kakachia + Common Calotropis gigantea Akado + + Abundant Calotropis procera - + + Abundant Cassia occidentalis Kusundro + Common Cassia autriculata - + Common Datura metel Dhaturo + + Common Euphorbia antiquorum Tridhjra sehund + + Sporadic Ficus hispida Gobla + Abundant Gardenia jasminoides Dikmali + Common Hibiscus rosa-sinensis Jasum + Common Lantana camara + Abundant Nerium indicum Kaner + + Abundant Ricinus communis Erend + + Common Tabernaemontana
coronaria - +
Common Thevetia peruviana - + Abundant Vitex negundo Shivarii + Abundant C. Herbs Acalypha indica Vanchikanto + Abundant Aerva aspera Kutri + + Abundant Ageratum conyzoides + Common Alocasia indica + Common Amaranthus spinosus Kanta-midant + + Abundant Andrographis paniculata + Common Argemone mexicana Darudu + Common Cassia sophera + Abundant Cassia tora Chakunda + + Abundant Cleome viscosa Kanphuti + Common Clerodendron infortunatum - + + Abundant Crotalaria retusa Jhunjhunia + + Common Leonurus sibiricua Guma + Abundant
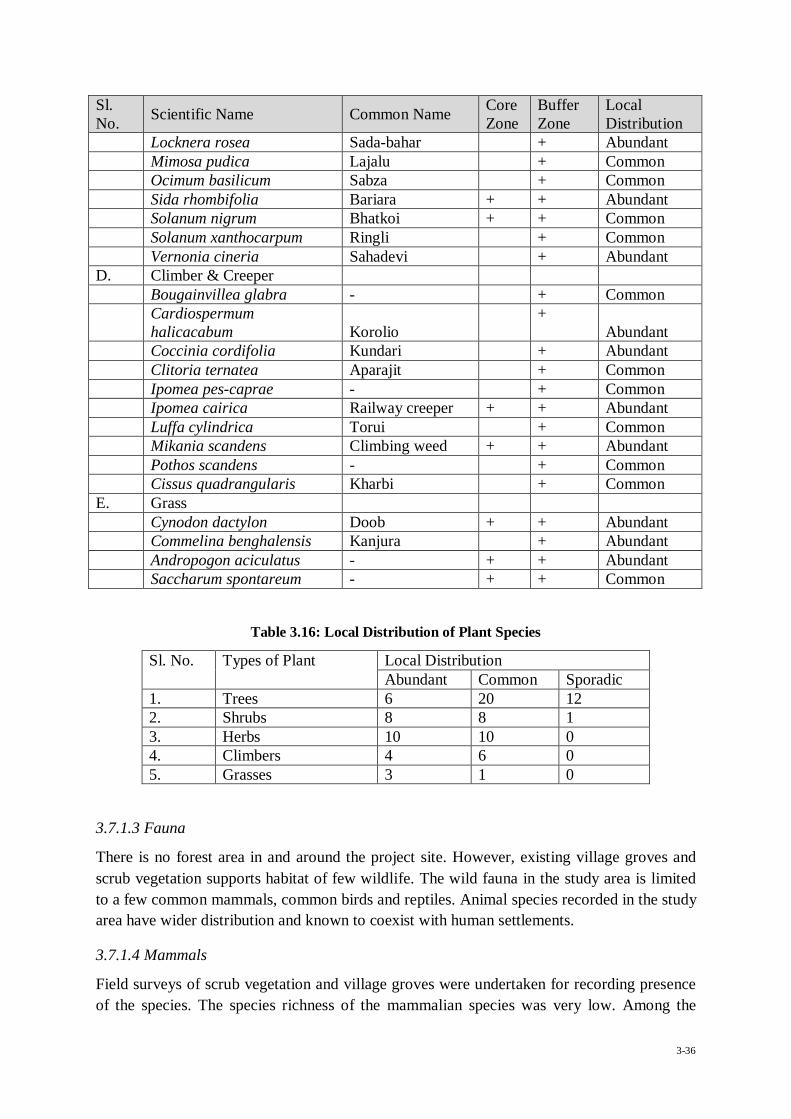
3-36
Sl. No. Scientific Name Common Name Core
Zone Buffer Zone
Local Distribution
Locknera rosea Sada-bahar + Abundant Mimosa pudica Lajalu + Common Ocimum basilicum Sabza + Common Sida rhombifolia Bariara + + Abundant Solanum nigrum Bhatkoi + + Common Solanum xanthocarpum Ringli + Common Vernonia cineria Sahadevi + Abundant D. Climber & Creeper Bougainvillea glabra - + Common Cardiospermum
halicacabum Korolio +
Abundant Coccinia cordifolia Kundari + Abundant Clitoria ternatea Aparajit + Common Ipomea pes-caprae - + Common Ipomea cairica Railway creeper + + Abundant Luffa cylindrica Torui + Common Mikania scandens Climbing weed + + Abundant Pothos scandens - + Common Cissus quadrangularis Kharbi + Common E. Grass Cynodon dactylon Doob + + Abundant Commelina benghalensis Kanjura + Abundant Andropogon aciculatus - + + Abundant Saccharum spontareum - + + Common
Table 3.16: Local Distribution of Plant Species
Sl. No. Types of Plant Local Distribution Abundant Common Sporadic
1. Trees 6 20 12 2. Shrubs 8 8 1 3. Herbs 10 10 0 4. Climbers 4 6 0 5. Grasses 3 1 0
3.7.1.3 Fauna
There is no forest area in and around the project site. However, existing village groves and scrub vegetation supports habitat of few wildlife. The wild fauna in the study area is limited to a few common mammals, common birds and reptiles. Animal species recorded in the study area have wider distribution and known to coexist with human settlements.
3.7.1.4 Mammals
Field surveys of scrub vegetation and village groves were undertaken for recording presence of the species. The species richness of the mammalian species was very low. Among the
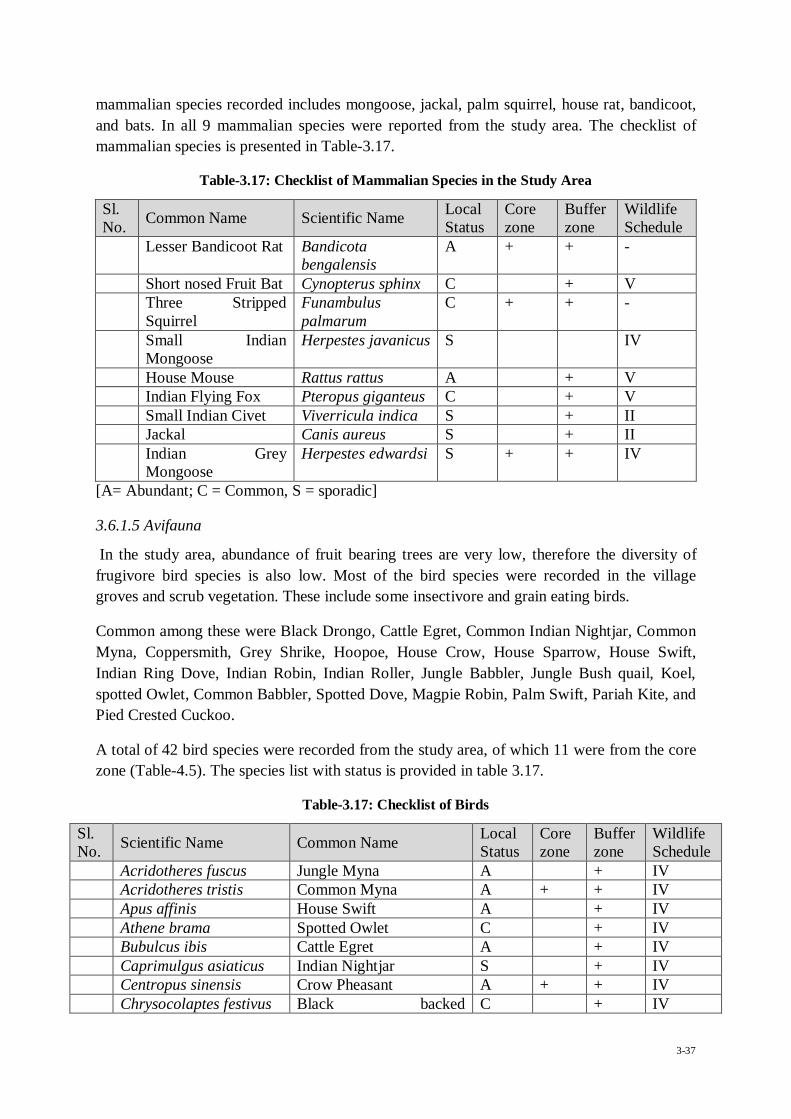
3-37
mammalian species recorded includes mongoose, jackal, palm squirrel, house rat, bandicoot, and bats. In all 9 mammalian species were reported from the study area. The checklist of mammalian species is presented in Table-3.17.
Table-3.17: Checklist of Mammalian Species in the Study Area
Sl. No. Common Name Scientific Name Local
Status Core zone
Buffer zone
Wildlife Schedule
Lesser Bandicoot Rat Bandicota bengalensis
A + + -
Short nosed Fruit Bat Cynopterus sphinx C + V Three Stripped
Squirrel Funambulus palmarum
C + + -
Small Indian Mongoose
Herpestes javanicus S IV
House Mouse Rattus rattus A + V Indian Flying Fox Pteropus giganteus C + V Small Indian Civet Viverricula indica S + II Jackal Canis aureus S + II Indian Grey
Mongoose Herpestes edwardsi S + + IV
[A= Abundant; C = Common, S = sporadic]
3.6.1.5 Avifauna
In the study area, abundance of fruit bearing trees are very low, therefore the diversity of frugivore bird species is also low. Most of the bird species were recorded in the village groves and scrub vegetation. These include some insectivore and grain eating birds.
Common among these were Black Drongo, Cattle Egret, Common Indian Nightjar, Common Myna, Coppersmith, Grey Shrike, Hoopoe, House Crow, House Sparrow, House Swift, Indian Ring Dove, Indian Robin, Indian Roller, Jungle Babbler, Jungle Bush quail, Koel, spotted Owlet, Common Babbler, Spotted Dove, Magpie Robin, Palm Swift, Pariah Kite, and Pied Crested Cuckoo.
A total of 42 bird species were recorded from the study area, of which 11 were from the core zone (Table-4.5). The species list with status is provided in table 3.17.
Table-3.17: Checklist of Birds
Sl. No. Scientific Name Common Name Local
Status Core zone
Buffer zone
Wildlife Schedule
Acridotheres fuscus Jungle Myna A + IV Acridotheres tristis Common Myna A + + IV Apus affinis House Swift A + IV Athene brama Spotted Owlet C + IV Bubulcus ibis Cattle Egret A + IV Caprimulgus asiaticus Indian Nightjar S + IV Centropus sinensis Crow Pheasant A + + IV Chrysocolaptes festivus Black backed C + IV
3-38
Sl. No. Scientific Name Common Name Local
Status Core zone
Buffer zone
Wildlife Schedule
Woodpecker Clamator facobinus Pied Crested Cuckoo C + IV Columba livia Blue Rock Pigeon A + + IV Copsychus saularis Magpie Robin C + IV Coracias benghalensis Indian Roller C + IV Corvus macrorhynchos Jungle Crow A + IV Corvus splendens House Crow A + + V Cuculus canorus Cuckoo A + IV Cuculus varius Common Hawk Cuckoo C + IV Culicicapa ceylonensis Blue throated Flycatcher C + IV Cutornix cutornix Quail C + IV Cypsiurus parvus Palm Swift C + IV Dendrocitta vagabunda Tree Pie A + + IV Dicrurous adsimilis Drongo A + + IV Eudynamys scolopacea Koel A + IV Lanius cristatus Brown Shrike C + IV Megalaima
haemacephala Coppersmith A + IV
Megalaima viridis Small Green Bee Eater A + + IV Milvus migrans Pariah Kite A + IV Muscicapa parva Red-breasted Flycatcher A + IV Nectarinia asiatica Purple Sunbird A + IV Oriolus xanthornus Black headed Oriole A + IV Orthotomus sutorius Tailor bird A + + IV Passer domesticus House Sparrow A + IV Pernis ptilorhyncus Honey Buzzard C + IV Ploceus phillipinus Baya C Psittacula krameri Roseringed Parakeet A + IV Pycnonotus cafer Red vented Bulbul A + + IV Streptopelia chinensis Spotted Dove C + + IV Streptopelia decaocto Ring Dove C + IV Sturnus contra Pied Myna A + + IV Tephrodornis
pondicerianus Common Wood Shrike S + IV
Turdoides striatus Jungle Babbler A + IV Tyto alba Barn Owl C + IV Upupa epops Hoopoe C + IV
[A= Abundant C = Common, S = Sporadic]
3.7.1.6 Reptiles
A total of 8 reptilian species were recorded from the study area (Table-3.18). Out of the 8 species, 2 species are abundant, 3 species are common and 5 species are sporadic in local distribution.
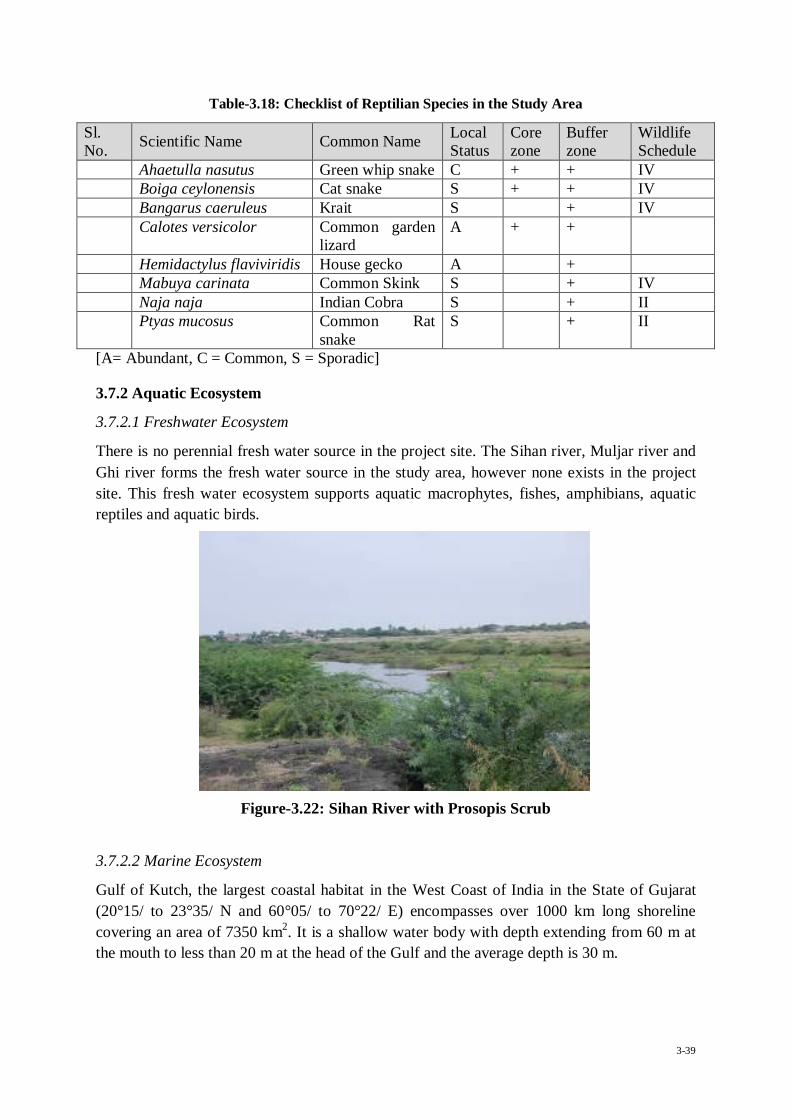
3-39
Table-3.18: Checklist of Reptilian Species in the Study Area
Sl. No. Scientific Name Common Name Local
Status Core zone
Buffer zone
Wildlife Schedule
Ahaetulla nasutus Green whip snake C + + IV Boiga ceylonensis Cat snake S + + IV Bangarus caeruleus Krait S + IV Calotes versicolor Common garden
lizard A + +
Hemidactylus flaviviridis House gecko A + Mabuya carinata Common Skink S + IV Naja naja Indian Cobra S + II Ptyas mucosus Common Rat
snake S + II
[A= Abundant, C = Common, S = Sporadic]
3.7.2 Aquatic Ecosystem
3.7.2.1 Freshwater Ecosystem
There is no perennial fresh water source in the project site. The Sihan river, Muljar river and Ghi river forms the fresh water source in the study area, however none exists in the project site. This fresh water ecosystem supports aquatic macrophytes, fishes, amphibians, aquatic reptiles and aquatic birds.
Figure-3.22: Sihan River with Prosopis Scrub
3.7.2.2 Marine Ecosystem
Gulf of Kutch, the largest coastal habitat in the West Coast of India in the State of Gujarat (20°15/ to 23°35/ N and 60°05/ to 70°22/ E) encompasses over 1000 km long shoreline covering an area of 7350 km2. It is a shallow water body with depth extending from 60 m at the mouth to less than 20 m at the head of the Gulf and the average depth is 30 m.
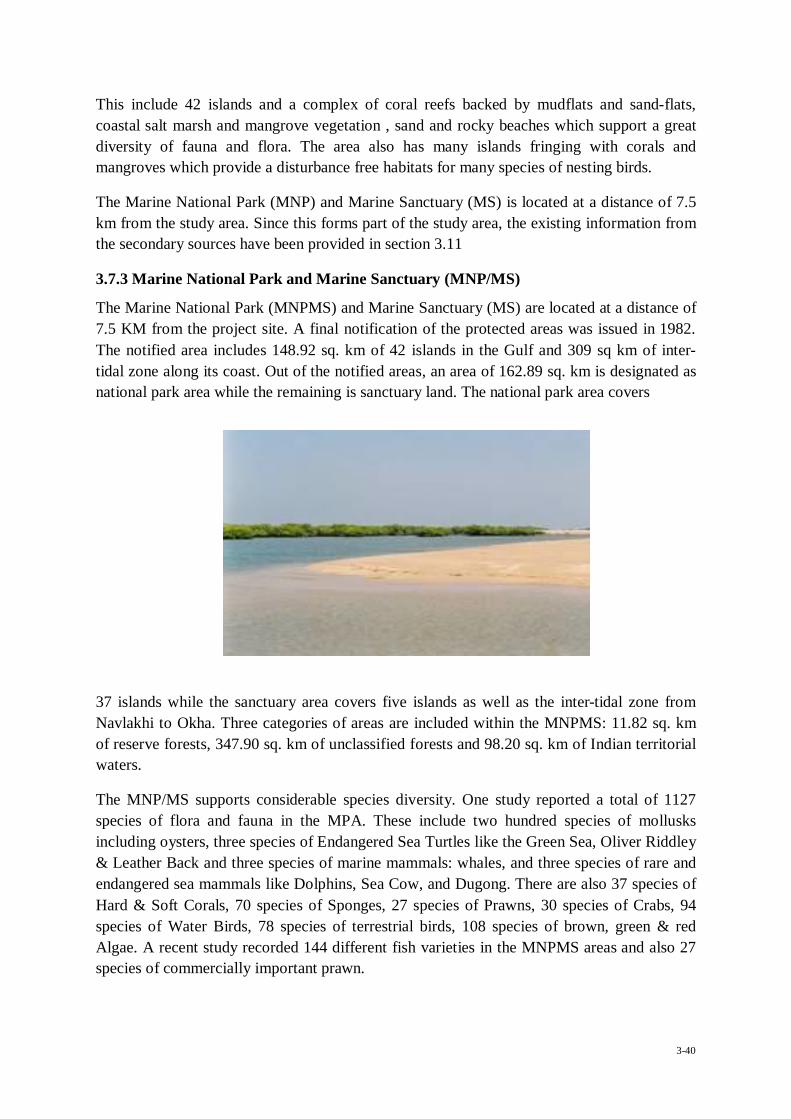
3-40
This include 42 islands and a complex of coral reefs backed by mudflats and sand-flats, coastal salt marsh and mangrove vegetation , sand and rocky beaches which support a great diversity of fauna and flora. The area also has many islands fringing with corals and mangroves which provide a disturbance free habitats for many species of nesting birds.
The Marine National Park (MNP) and Marine Sanctuary (MS) is located at a distance of 7.5 km from the study area. Since this forms part of the study area, the existing information from the secondary sources have been provided in section 3.11
3.7.3 Marine National Park and Marine Sanctuary (MNP/MS)
The Marine National Park (MNPMS) and Marine Sanctuary (MS) are located at a distance of 7.5 KM from the project site. A final notification of the protected areas was issued in 1982. The notified area includes 148.92 sq. km of 42 islands in the Gulf and 309 sq km of inter-tidal zone along its coast. Out of the notified areas, an area of 162.89 sq. km is designated as national park area while the remaining is sanctuary land. The national park area covers
37 islands while the sanctuary area covers five islands as well as the inter-tidal zone from Navlakhi to Okha. Three categories of areas are included within the MNPMS: 11.82 sq. km of reserve forests, 347.90 sq. km of unclassified forests and 98.20 sq. km of Indian territorial waters.
The MNP/MS supports considerable species diversity. One study reported a total of 1127 species of flora and fauna in the MPA. These include two hundred species of mollusks including oysters, three species of Endangered Sea Turtles like the Green Sea, Oliver Riddley & Leather Back and three species of marine mammals: whales, and three species of rare and endangered sea mammals like Dolphins, Sea Cow, and Dugong. There are also 37 species of Hard & Soft Corals, 70 species of Sponges, 27 species of Prawns, 30 species of Crabs, 94 species of Water Birds, 78 species of terrestrial birds, 108 species of brown, green & red Algae. A recent study recorded 144 different fish varieties in the MNPMS areas and also 27 species of commercially important prawn.
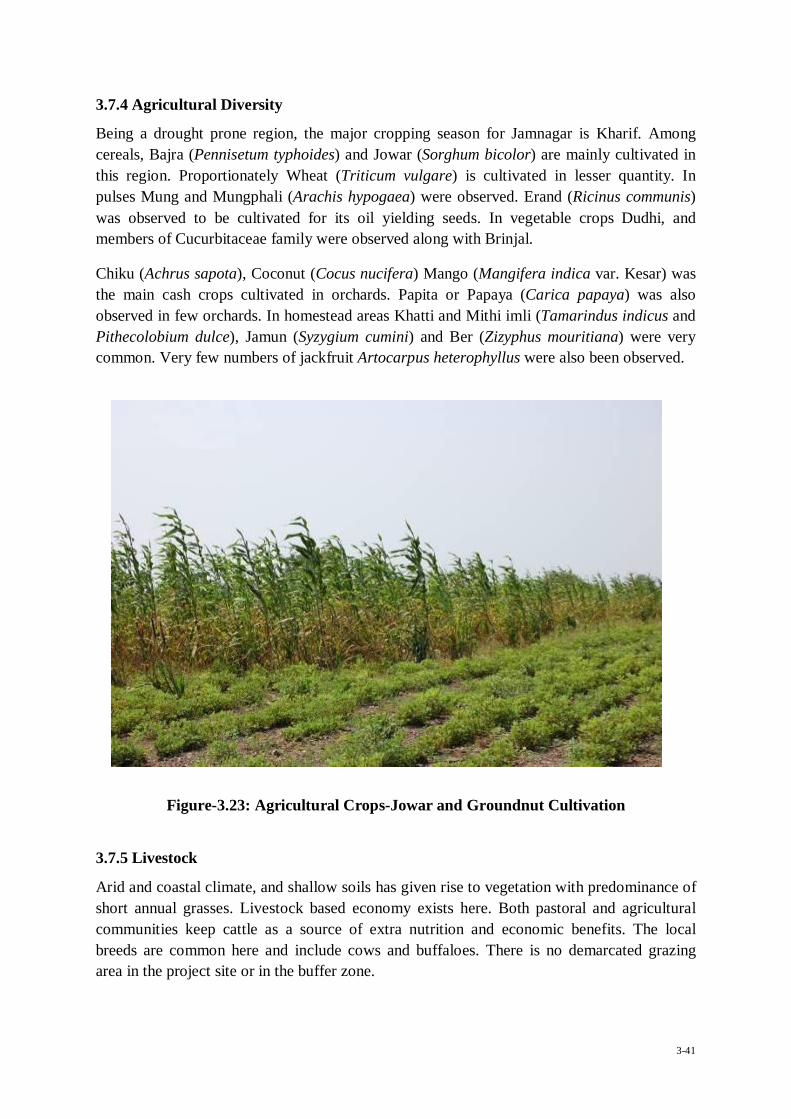
3-41
3.7.4 Agricultural Diversity
Being a drought prone region, the major cropping season for Jamnagar is Kharif. Among cereals, Bajra (Pennisetum typhoides) and Jowar (Sorghum bicolor) are mainly cultivated in this region. Proportionately Wheat (Triticum vulgare) is cultivated in lesser quantity. In pulses Mung and Mungphali (Arachis hypogaea) were observed. Erand (Ricinus communis) was observed to be cultivated for its oil yielding seeds. In vegetable crops Dudhi, and members of Cucurbitaceae family were observed along with Brinjal.
Chiku (Achrus sapota), Coconut (Cocus nucifera) Mango (Mangifera indica var. Kesar) was the main cash crops cultivated in orchards. Papita or Papaya (Carica papaya) was also observed in few orchards. In homestead areas Khatti and Mithi imli (Tamarindus indicus and Pithecolobium dulce), Jamun (Syzygium cumini) and Ber (Zizyphus mouritiana) were very common. Very few numbers of jackfruit Artocarpus heterophyllus were also been observed.
Figure-3.23: Agricultural Crops-Jowar and Groundnut Cultivation
3.7.5 Livestock
Arid and coastal climate, and shallow soils has given rise to vegetation with predominance of short annual grasses. Livestock based economy exists here. Both pastoral and agricultural communities keep cattle as a source of extra nutrition and economic benefits. The local breeds are common here and include cows and buffaloes. There is no demarcated grazing area in the project site or in the buffer zone.
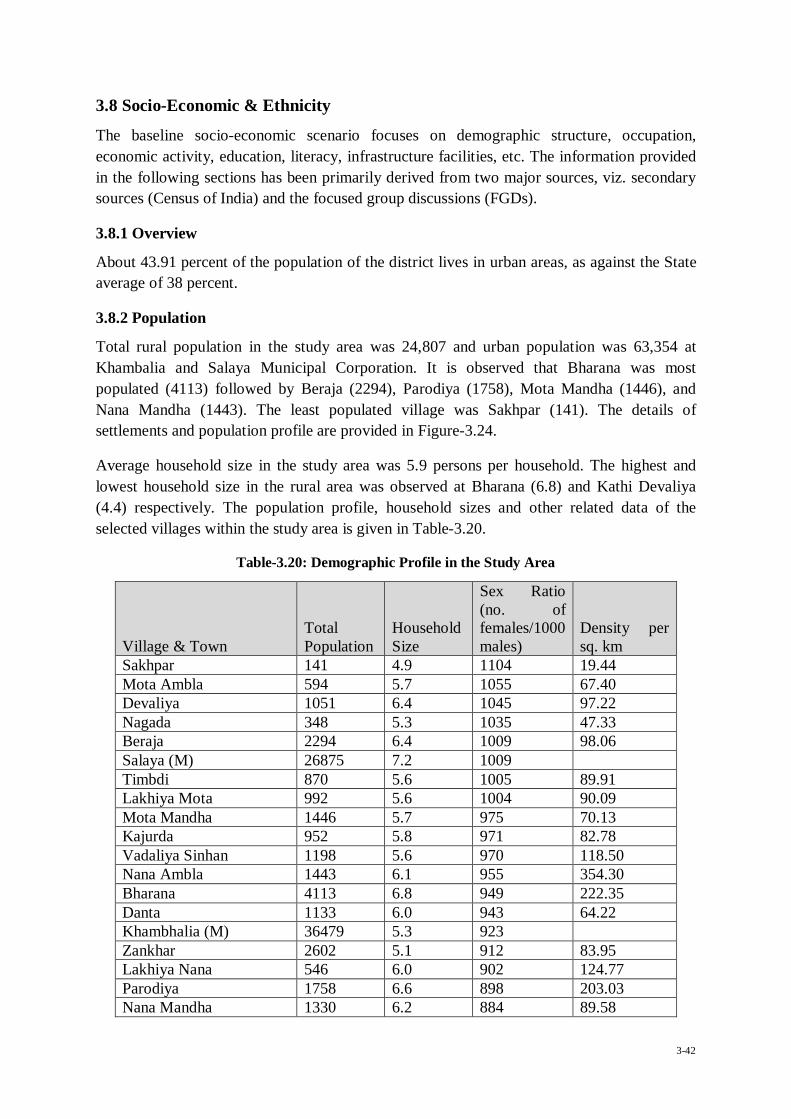
3-42
3.8 Socio-Economic & Ethnicity
The baseline socio-economic scenario focuses on demographic structure, occupation, economic activity, education, literacy, infrastructure facilities, etc. The information provided in the following sections has been primarily derived from two major sources, viz. secondary sources (Census of India) and the focused group discussions (FGDs).
3.8.1 Overview
About 43.91 percent of the population of the district lives in urban areas, as against the State average of 38 percent.
3.8.2 Population
Total rural population in the study area was 24,807 and urban population was 63,354 at Khambalia and Salaya Municipal Corporation. It is observed that Bharana was most populated (4113) followed by Beraja (2294), Parodiya (1758), Mota Mandha (1446), and Nana Mandha (1443). The least populated village was Sakhpar (141). The details of settlements and population profile are provided in Figure-3.24.
Average household size in the study area was 5.9 persons per household. The highest and lowest household size in the rural area was observed at Bharana (6.8) and Kathi Devaliya (4.4) respectively. The population profile, household sizes and other related data of the selected villages within the study area is given in Table-3.20.
Table-3.20: Demographic Profile in the Study Area
Village & Town Total Population
Household Size
Sex Ratio (no. of females/1000 males)
Density per sq. km
Sakhpar 141 4.9 1104 19.44 Mota Ambla 594 5.7 1055 67.40 Devaliya 1051 6.4 1045 97.22 Nagada 348 5.3 1035 47.33 Beraja 2294 6.4 1009 98.06 Salaya (M) 26875 7.2 1009 Timbdi 870 5.6 1005 89.91 Lakhiya Mota 992 5.6 1004 90.09 Mota Mandha 1446 5.7 975 70.13 Kajurda 952 5.8 971 82.78 Vadaliya Sinhan 1198 5.6 970 118.50 Nana Ambla 1443 6.1 955 354.30 Bharana 4113 6.8 949 222.35 Danta 1133 6.0 943 64.22 Khambhalia (M) 36479 5.3 923 Zankhar 2602 5.1 912 83.95 Lakhiya Nana 546 6.0 902 124.77 Parodiya 1758 6.6 898 203.03 Nana Mandha 1330 6.2 884 89.58
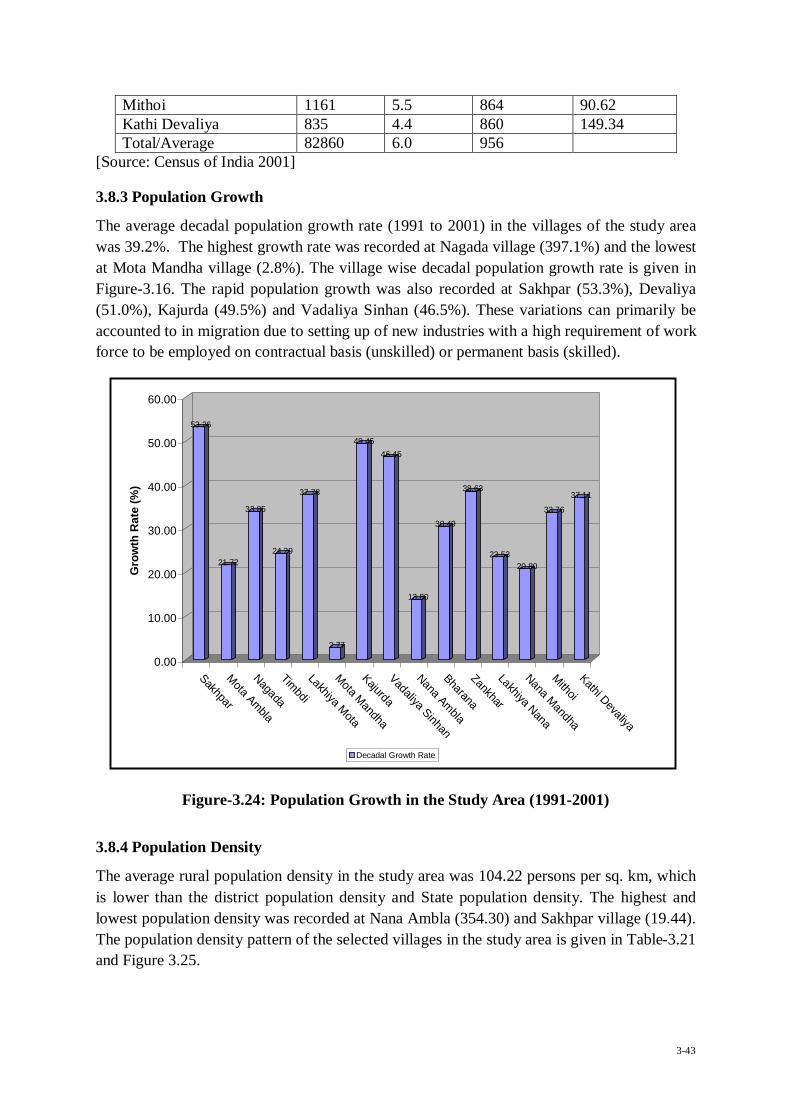
3-43
53.26
21.72
33.85
24.29
37.78
2.77
49.4546.45
13.80
30.49
38.63
23.5320.80
33.76
37.11
0.00
10.00
20.00
30.00
40.00
50.00
60.00
Gro
wth
Rat
e (%
)
SakhparMota AmblaNagadaTimbdiLakhiya MotaMota MandhaKajurdaVadaliya Sinhan
Nana AmblaBharanaZankharLakhiya NanaNana MandhaMithoiKathi Devaliya
Decadal Growth Rate
Mithoi 1161 5.5 864 90.62 Kathi Devaliya 835 4.4 860 149.34 Total/Average 82860 6.0 956
[Source: Census of India 2001]
3.8.3 Population Growth
The average decadal population growth rate (1991 to 2001) in the villages of the study area was 39.2%. The highest growth rate was recorded at Nagada village (397.1%) and the lowest at Mota Mandha village (2.8%). The village wise decadal population growth rate is given in Figure-3.16. The rapid population growth was also recorded at Sakhpar (53.3%), Devaliya (51.0%), Kajurda (49.5%) and Vadaliya Sinhan (46.5%). These variations can primarily be accounted to in migration due to setting up of new industries with a high requirement of work force to be employed on contractual basis (unskilled) or permanent basis (skilled).
Figure-3.24: Population Growth in the Study Area (1991-2001)
3.8.4 Population Density
The average rural population density in the study area was 104.22 persons per sq. km, which is lower than the district population density and State population density. The highest and lowest population density was recorded at Nana Ambla (354.30) and Sakhpar village (19.44). The population density pattern of the selected villages in the study area is given in Table-3.21 and Figure 3.25.
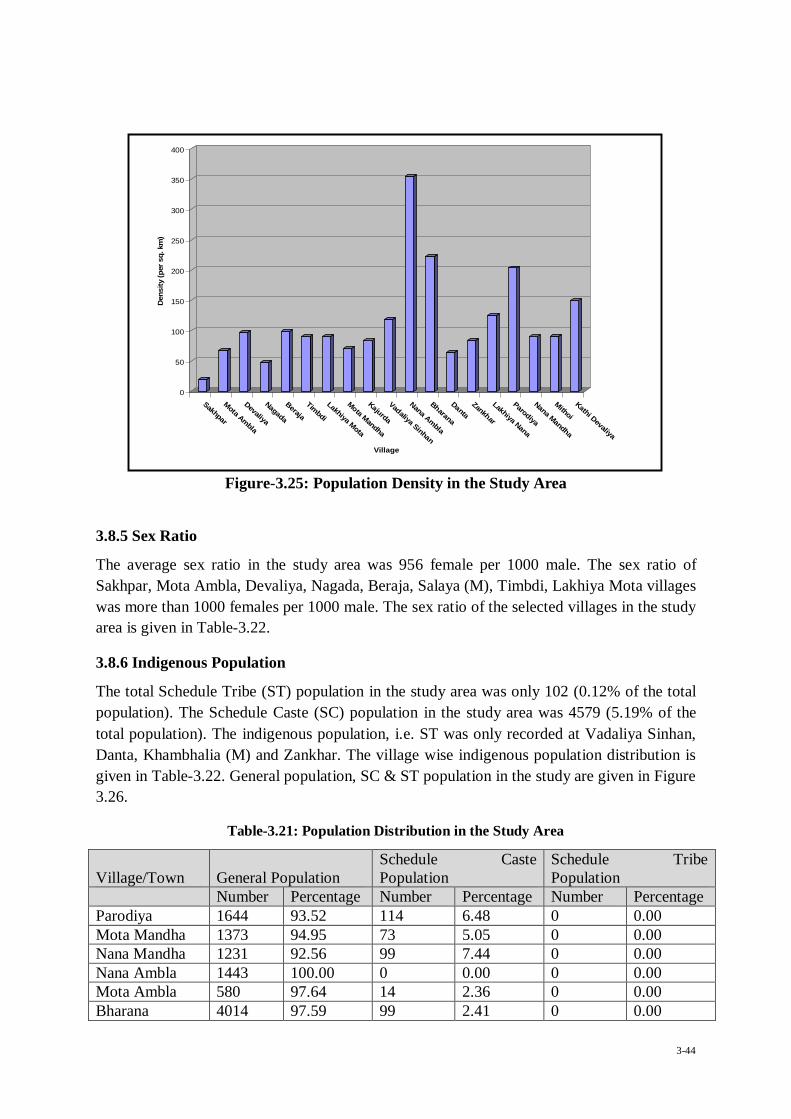
3-44
0
50
100
150
200
250
300
350
400D
ensi
ty (p
er s
q. k
m)
Sakhpar
Mota Ambla
Devaliya
Nagada
Beraja
Timbdi
Lakhiya Mota
Mota Mandha
Kajurda
Vadaliya Sinhan
Nana Ambla
Bharana
DantaZankhar
Lakhiya Nana
Parodiya
Nana Mandha
Mithoi
Kathi Devaliya
Village
Figure-3.25: Population Density in the Study Area
3.8.5 Sex Ratio
The average sex ratio in the study area was 956 female per 1000 male. The sex ratio of Sakhpar, Mota Ambla, Devaliya, Nagada, Beraja, Salaya (M), Timbdi, Lakhiya Mota villages was more than 1000 females per 1000 male. The sex ratio of the selected villages in the study area is given in Table-3.22.
3.8.6 Indigenous Population
The total Schedule Tribe (ST) population in the study area was only 102 (0.12% of the total population). The Schedule Caste (SC) population in the study area was 4579 (5.19% of the total population). The indigenous population, i.e. ST was only recorded at Vadaliya Sinhan, Danta, Khambhalia (M) and Zankhar. The village wise indigenous population distribution is given in Table-3.22. General population, SC & ST population in the study are given in Figure 3.26.
Table-3.21: Population Distribution in the Study Area
Village/Town General Population Schedule Caste Population
Schedule Tribe Population
Number Percentage Number Percentage Number Percentage Parodiya 1644 93.52 114 6.48 0 0.00 Mota Mandha 1373 94.95 73 5.05 0 0.00 Nana Mandha 1231 92.56 99 7.44 0 0.00 Nana Ambla 1443 100.00 0 0.00 0 0.00 Mota Ambla 580 97.64 14 2.36 0 0.00 Bharana 4014 97.59 99 2.41 0 0.00
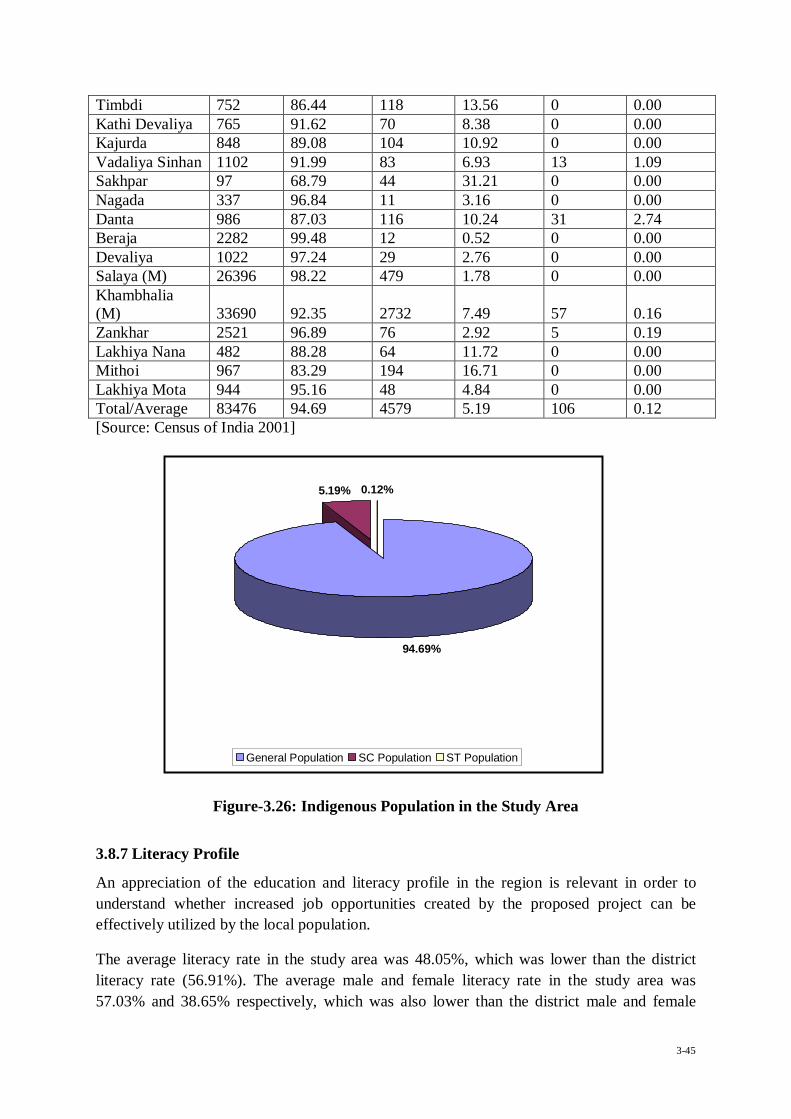
3-45
94.69%
5.19% 0.12%
General Population SC Population ST Population
Timbdi 752 86.44 118 13.56 0 0.00 Kathi Devaliya 765 91.62 70 8.38 0 0.00 Kajurda 848 89.08 104 10.92 0 0.00 Vadaliya Sinhan 1102 91.99 83 6.93 13 1.09 Sakhpar 97 68.79 44 31.21 0 0.00 Nagada 337 96.84 11 3.16 0 0.00 Danta 986 87.03 116 10.24 31 2.74 Beraja 2282 99.48 12 0.52 0 0.00 Devaliya 1022 97.24 29 2.76 0 0.00 Salaya (M) 26396 98.22 479 1.78 0 0.00 Khambhalia (M) 33690 92.35 2732 7.49 57 0.16 Zankhar 2521 96.89 76 2.92 5 0.19 Lakhiya Nana 482 88.28 64 11.72 0 0.00 Mithoi 967 83.29 194 16.71 0 0.00 Lakhiya Mota 944 95.16 48 4.84 0 0.00 Total/Average 83476 94.69 4579 5.19 106 0.12 [Source: Census of India 2001]
Figure-3.26: Indigenous Population in the Study Area
3.8.7 Literacy Profile
An appreciation of the education and literacy profile in the region is relevant in order to understand whether increased job opportunities created by the proposed project can be effectively utilized by the local population.
The average literacy rate in the study area was 48.05%, which was lower than the district literacy rate (56.91%). The average male and female literacy rate in the study area was 57.03% and 38.65% respectively, which was also lower than the district male and female
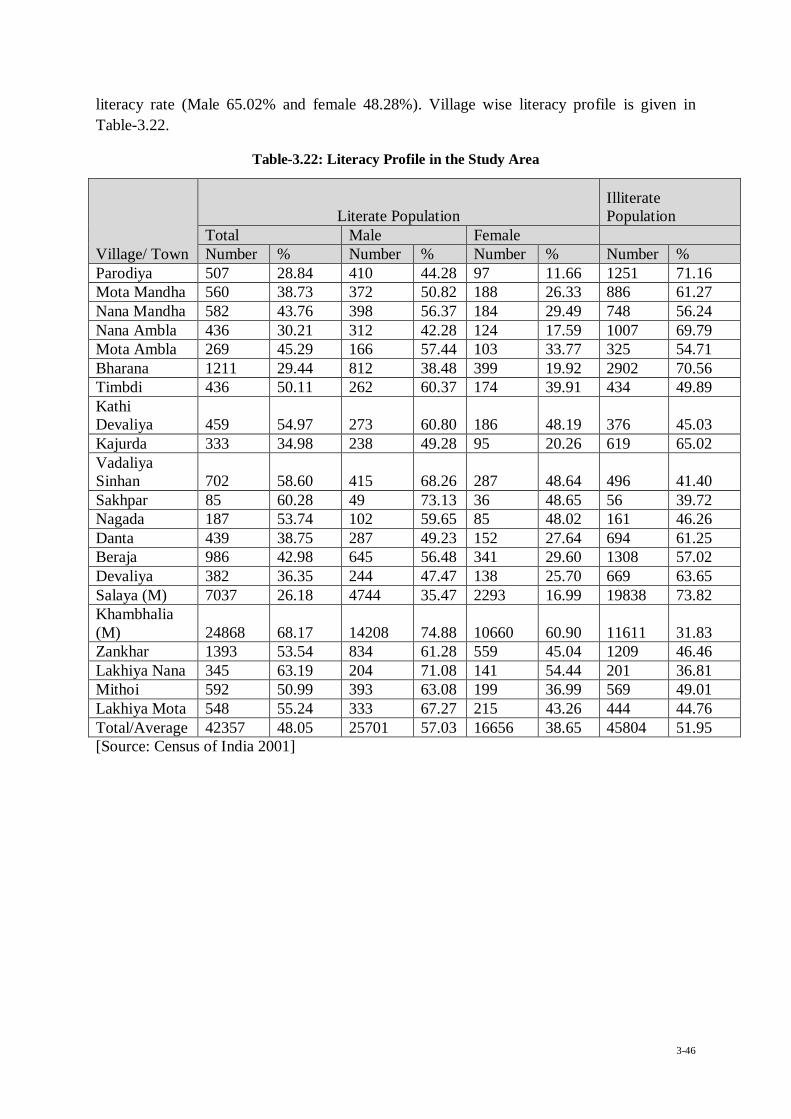
3-46
literacy rate (Male 65.02% and female 48.28%). Village wise literacy profile is given in Table-3.22.
Table-3.22: Literacy Profile in the Study Area
Village/ Town
Literate Population Illiterate Population
Total Male Female Number % Number % Number % Number %
Parodiya 507 28.84 410 44.28 97 11.66 1251 71.16 Mota Mandha 560 38.73 372 50.82 188 26.33 886 61.27 Nana Mandha 582 43.76 398 56.37 184 29.49 748 56.24 Nana Ambla 436 30.21 312 42.28 124 17.59 1007 69.79 Mota Ambla 269 45.29 166 57.44 103 33.77 325 54.71 Bharana 1211 29.44 812 38.48 399 19.92 2902 70.56 Timbdi 436 50.11 262 60.37 174 39.91 434 49.89 Kathi Devaliya 459 54.97 273 60.80 186 48.19 376 45.03 Kajurda 333 34.98 238 49.28 95 20.26 619 65.02 Vadaliya Sinhan 702 58.60 415 68.26 287 48.64 496 41.40 Sakhpar 85 60.28 49 73.13 36 48.65 56 39.72 Nagada 187 53.74 102 59.65 85 48.02 161 46.26 Danta 439 38.75 287 49.23 152 27.64 694 61.25 Beraja 986 42.98 645 56.48 341 29.60 1308 57.02 Devaliya 382 36.35 244 47.47 138 25.70 669 63.65 Salaya (M) 7037 26.18 4744 35.47 2293 16.99 19838 73.82 Khambhalia (M) 24868 68.17 14208 74.88 10660 60.90 11611 31.83 Zankhar 1393 53.54 834 61.28 559 45.04 1209 46.46 Lakhiya Nana 345 63.19 204 71.08 141 54.44 201 36.81 Mithoi 592 50.99 393 63.08 199 36.99 569 49.01 Lakhiya Mota 548 55.24 333 67.27 215 43.26 444 44.76 Total/Average 42357 48.05 25701 57.03 16656 38.65 45804 51.95 [Source: Census of India 2001]

3-47
48.05%51.95%
57.03%
38.65%
0.00%
10.00%
20.00%
30.00%
40.00%
50.00%
60.00%
Lite
racy
Rat
e (%
)
Literate Illiterate Literate Male Literate FemaleCategory
Figure-3.27: Literacy Profile in the Study Area
3.8.8 Employment Pattern
The total working population in the study area was 27,521, i.e. 31.22% of the total population, which is lower than district work participation rate (38.56%). The main workers were 27.28% and marginal workers were 3.93% of the total population. The employment pattern in the rural area shows that 48.08 % working population are cultivator, 21.01% agricultural labour, 29.75% other worker and 1.16% household industries. Whereas in the urban area 73.23% are other worker, 16.86% cultivator, 7.59% agricultural labour and 2.31% household industries.
Most of the villagers in the area are engaged in the agricultural sector. However, the agricultural activity in this region is mostly monoculture. There are number of industries in the area and about 29.75% rural working populations are engaged in the industrial sector and daily labour. Number of villages in the study area mostly dependent on other sector (industry and daily labourer), these are Sakhpar (69.84%), Bharana (69.47%), Nana Ambla (50.74%), Parodiya (42.35%), Danta (37.17%), Mithoi (36.30%) and Kajurda (31.86%). The village wise detail is given in Table-3.23. In the urban area, about 96.04% of the working population is engaged in the other sectors, which is mostly industries, services, etc. Work participation in the rural area and urban area is given in Figure-3.28.
Table-3.23: Workforce Participation in the Study Area
Village/ Town
Working Population
Main Workers (%)
Marginal Workers (%)
Cultivator (%)
Agricultural labour (%)
Household Industries (%)
Other Workers (%) No. %
Parodiya 739 42.04 32.42 9.61 49.8 7.04 0.81 42.35 Mota Mandha 590 40.80 28.91 11.89 61.69 18.31 1.86 18.14 Nana Mandha 369 27.74 18.57 9.17 35.23 35.23 2.98 26.56 Nana Ambla 678 46.99 27.93 19.06 45.43 3.83 0 50.74
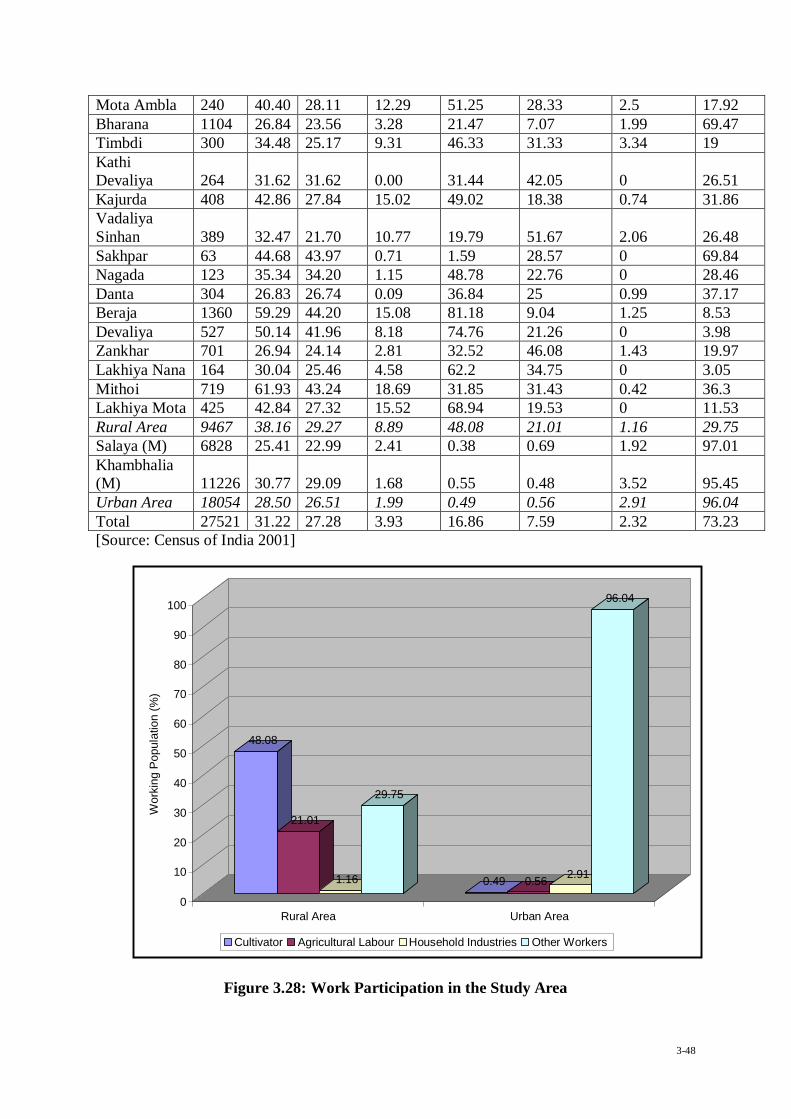
3-48
48.08
21.01
1.16
29.75
0.49 0.56 2.91
96.04
0
10
20
30
40
50
60
70
80
90
100
Wor
king
Pop
ulat
ion
(%)
Rural Area Urban Area
Cultivator Agricultural Labour Household Industries Other Workers
Mota Ambla 240 40.40 28.11 12.29 51.25 28.33 2.5 17.92 Bharana 1104 26.84 23.56 3.28 21.47 7.07 1.99 69.47 Timbdi 300 34.48 25.17 9.31 46.33 31.33 3.34 19 Kathi Devaliya 264 31.62 31.62 0.00 31.44 42.05 0 26.51 Kajurda 408 42.86 27.84 15.02 49.02 18.38 0.74 31.86 Vadaliya Sinhan 389 32.47 21.70 10.77 19.79 51.67 2.06 26.48 Sakhpar 63 44.68 43.97 0.71 1.59 28.57 0 69.84 Nagada 123 35.34 34.20 1.15 48.78 22.76 0 28.46 Danta 304 26.83 26.74 0.09 36.84 25 0.99 37.17 Beraja 1360 59.29 44.20 15.08 81.18 9.04 1.25 8.53 Devaliya 527 50.14 41.96 8.18 74.76 21.26 0 3.98 Zankhar 701 26.94 24.14 2.81 32.52 46.08 1.43 19.97 Lakhiya Nana 164 30.04 25.46 4.58 62.2 34.75 0 3.05 Mithoi 719 61.93 43.24 18.69 31.85 31.43 0.42 36.3 Lakhiya Mota 425 42.84 27.32 15.52 68.94 19.53 0 11.53 Rural Area 9467 38.16 29.27 8.89 48.08 21.01 1.16 29.75 Salaya (M) 6828 25.41 22.99 2.41 0.38 0.69 1.92 97.01 Khambhalia (M) 11226 30.77 29.09 1.68 0.55 0.48 3.52 95.45 Urban Area 18054 28.50 26.51 1.99 0.49 0.56 2.91 96.04 Total 27521 31.22 27.28 3.93 16.86 7.59 2.32 73.23 [Source: Census of India 2001]
Figure 3.28: Work Participation in the Study Area
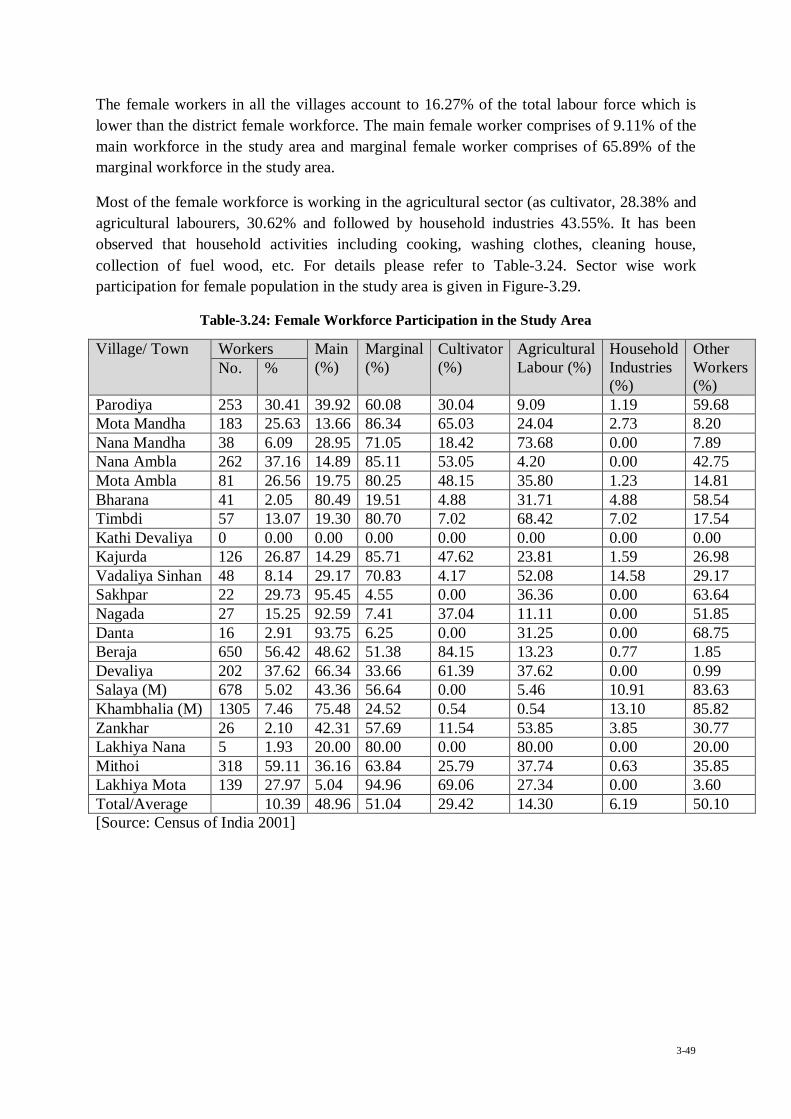
3-49
The female workers in all the villages account to 16.27% of the total labour force which is lower than the district female workforce. The main female worker comprises of 9.11% of the main workforce in the study area and marginal female worker comprises of 65.89% of the marginal workforce in the study area.
Most of the female workforce is working in the agricultural sector (as cultivator, 28.38% and agricultural labourers, 30.62% and followed by household industries 43.55%. It has been observed that household activities including cooking, washing clothes, cleaning house, collection of fuel wood, etc. For details please refer to Table-3.24. Sector wise work participation for female population in the study area is given in Figure-3.29.
Table-3.24: Female Workforce Participation in the Study Area
Village/ Town Workers Main (%)
Marginal (%)
Cultivator (%)
Agricultural Labour (%)
Household Industries (%)
Other Workers (%)
No. %
Parodiya 253 30.41 39.92 60.08 30.04 9.09 1.19 59.68 Mota Mandha 183 25.63 13.66 86.34 65.03 24.04 2.73 8.20 Nana Mandha 38 6.09 28.95 71.05 18.42 73.68 0.00 7.89 Nana Ambla 262 37.16 14.89 85.11 53.05 4.20 0.00 42.75 Mota Ambla 81 26.56 19.75 80.25 48.15 35.80 1.23 14.81 Bharana 41 2.05 80.49 19.51 4.88 31.71 4.88 58.54 Timbdi 57 13.07 19.30 80.70 7.02 68.42 7.02 17.54 Kathi Devaliya 0 0.00 0.00 0.00 0.00 0.00 0.00 0.00 Kajurda 126 26.87 14.29 85.71 47.62 23.81 1.59 26.98 Vadaliya Sinhan 48 8.14 29.17 70.83 4.17 52.08 14.58 29.17 Sakhpar 22 29.73 95.45 4.55 0.00 36.36 0.00 63.64 Nagada 27 15.25 92.59 7.41 37.04 11.11 0.00 51.85 Danta 16 2.91 93.75 6.25 0.00 31.25 0.00 68.75 Beraja 650 56.42 48.62 51.38 84.15 13.23 0.77 1.85 Devaliya 202 37.62 66.34 33.66 61.39 37.62 0.00 0.99 Salaya (M) 678 5.02 43.36 56.64 0.00 5.46 10.91 83.63 Khambhalia (M) 1305 7.46 75.48 24.52 0.54 0.54 13.10 85.82 Zankhar 26 2.10 42.31 57.69 11.54 53.85 3.85 30.77 Lakhiya Nana 5 1.93 20.00 80.00 0.00 80.00 0.00 20.00 Mithoi 318 59.11 36.16 63.84 25.79 37.74 0.63 35.85 Lakhiya Mota 139 27.97 5.04 94.96 69.06 27.34 0.00 3.60 Total/Average 10.39 48.96 51.04 29.42 14.30 6.19 50.10 [Source: Census of India 2001]
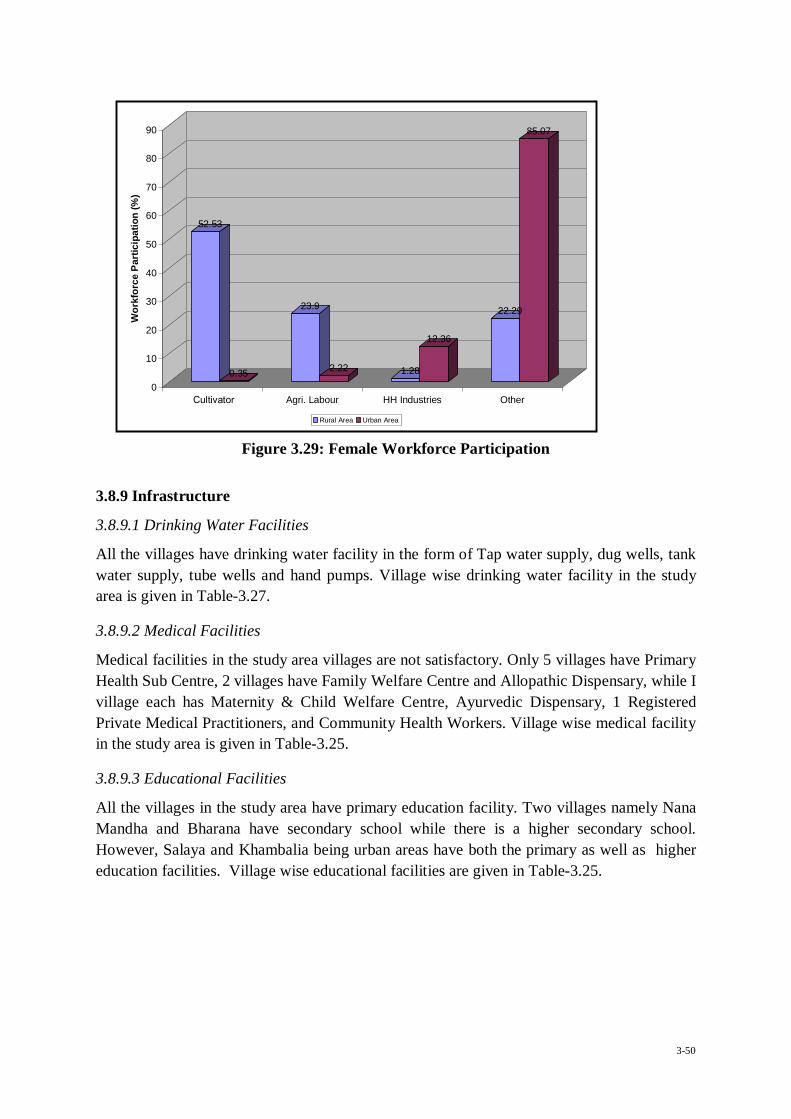
3-50
52.53
0.35
23.9
2.22 1.28
12.36
22.29
85.07
0
10
20
30
40
50
60
70
80
90W
orkf
orce
Par
ticip
atio
n (%
)
Cultivator Agri. Labour HH Industries Other
Rural Area Urban Area
Figure 3.29: Female Workforce Participation
3.8.9 Infrastructure
3.8.9.1 Drinking Water Facilities
All the villages have drinking water facility in the form of Tap water supply, dug wells, tank water supply, tube wells and hand pumps. Village wise drinking water facility in the study area is given in Table-3.27.
3.8.9.2 Medical Facilities
Medical facilities in the study area villages are not satisfactory. Only 5 villages have Primary Health Sub Centre, 2 villages have Family Welfare Centre and Allopathic Dispensary, while I village each has Maternity & Child Welfare Centre, Ayurvedic Dispensary, 1 Registered Private Medical Practitioners, and Community Health Workers. Village wise medical facility in the study area is given in Table-3.25.
3.8.9.3 Educational Facilities
All the villages in the study area have primary education facility. Two villages namely Nana Mandha and Bharana have secondary school while there is a higher secondary school. However, Salaya and Khambalia being urban areas have both the primary as well as higher education facilities. Village wise educational facilities are given in Table-3.25.
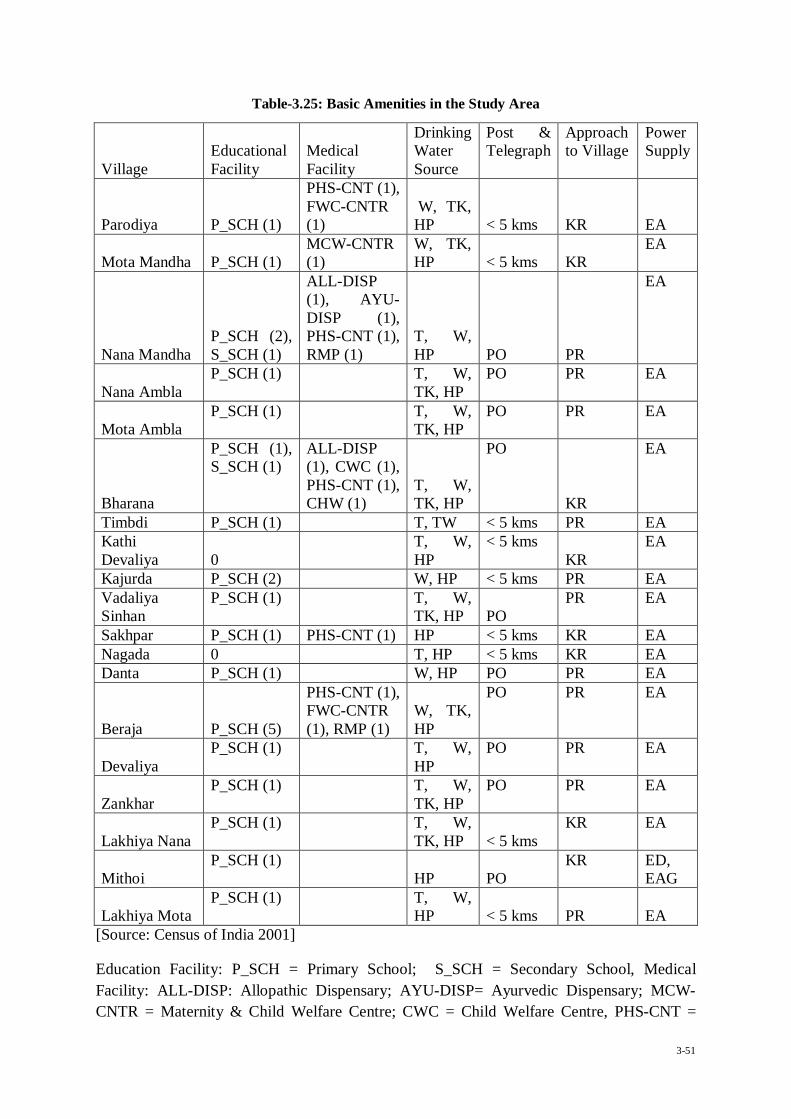
3-51
Table-3.25: Basic Amenities in the Study Area
Village Educational Facility
Medical Facility
Drinking Water Source
Post & Telegraph
Approach to Village
Power Supply
Parodiya P_SCH (1)
PHS-CNT (1), FWC-CNTR (1)
W, TK, HP < 5 kms KR EA
Mota Mandha P_SCH (1) MCW-CNTR (1)
W, TK, HP < 5 kms KR
EA
Nana Mandha P_SCH (2), S_SCH (1)
ALL-DISP (1), AYU-DISP (1), PHS-CNT (1), RMP (1)
T, W, HP PO PR
EA
Nana Ambla P_SCH (1)
T, W, TK, HP
PO PR EA
Mota Ambla P_SCH (1)
T, W, TK, HP
PO PR EA
Bharana
P_SCH (1), S_SCH (1)
ALL-DISP (1), CWC (1), PHS-CNT (1), CHW (1)
T, W, TK, HP
PO
KR
EA
Timbdi P_SCH (1) T, TW < 5 kms PR EA Kathi Devaliya 0
T, W, HP
< 5 kms KR
EA
Kajurda P_SCH (2) W, HP < 5 kms PR EA Vadaliya Sinhan
P_SCH (1)
T, W, TK, HP PO
PR EA
Sakhpar P_SCH (1) PHS-CNT (1) HP < 5 kms KR EA Nagada 0 T, HP < 5 kms KR EA Danta P_SCH (1) W, HP PO PR EA
Beraja P_SCH (5)
PHS-CNT (1), FWC-CNTR (1), RMP (1)
W, TK, HP
PO PR EA
Devaliya P_SCH (1)
T, W, HP
PO PR EA
Zankhar P_SCH (1)
T, W, TK, HP
PO PR EA
Lakhiya Nana P_SCH (1)
T, W, TK, HP < 5 kms
KR EA
Mithoi P_SCH (1)
HP PO KR ED,
EAG
Lakhiya Mota P_SCH (1)
T, W, HP < 5 kms PR EA
[Source: Census of India 2001]
Education Facility: P_SCH = Primary School; S_SCH = Secondary School, Medical Facility: ALL-DISP: Allopathic Dispensary; AYU-DISP= Ayurvedic Dispensary; MCW-CNTR = Maternity & Child Welfare Centre; CWC = Child Welfare Centre, PHS-CNT =

3-52
Primary Health Sub Centre; FWC-CNTR = Family Welfare Centre, RMP = Registered Private Medical Practitioners; CHW = Community Health Workers, Drinking Water Facility: T = TAP; W = WELL; TK = TANK; TW= TUBEWELL; HP = HANDPUMP, Post &Telegraph :PO = Post Office, Approach Road to Village: PR = Paved Road. KR= Kutcha Road, Power Supply: EA = Electricity of all purposes, Ed = Electricity for domestic use, EAG= Electricity for Agriculture use.
3.8.9.4 Transport & Communication
There are four State Highways SH-6, SH-27 (Jamnagar), SH-28 & SH-93 (Khambalia) passing through the study area. The nearest railway station is Khambalia (12km). A broad gauge rail network is also operational connecting Jamnagar with the National rail network. The nearest airport is Jamnagar, which is about 42 km from the site. All the villages are well connected with SH.
The normal means of transport is by bus, two -wheelers, bullock carts and camel carts. “Chhakada”, a indigenous three wheeler vehicle (combination of motorcycle and cart) that transports more than six people at a time, forms a basic mean of transportation. In addition, all the villages in the study area have bus services.
3.8.9.5 Power Supply
Most of the villages in the study area are electrified having stable 220V electricity supply which is adequate for domestic, agricultural and other purposes. However, Mithoi village do not have any power connections. The power is supplied by the Gujarat State Electricity Board.
3.8.9.6 Post & Telecommunication
Post & telegraph facility in the study area is satisfactory. About 53 percent villages have post office. However mobile phone facilities are common in the study area.
3.8.9.7 Irrigation Facility
There is no surface water based irrigation facility, like tank irrigation, river irrigation, lake irrigation, etc. on the study area. However, ground water based irrigation facilities are available in most the villages. The irrigation status of the study area villages is given in Figure-3.31.
3.8.9.8 Heritage Site
Jamnagar is also often referred as Mini Kashi or Banares for innumerable Hindu and Jain temples that dot this place. The most prominent of all is DwarkadheeshTemple, dedicated to Hindu Lord Krishna. This place also houses a Muslim Dargah. Jamnagar has centuries old temples. However, there is no heritage site in the study area or in the proposed project site.
3.8.9.9 Industries in the Proximity
The industries in the close proximity of the proposed power plant are:

3-53
1) Essar Oil Refinery, 2) Reliance Oil Refinery 3) Gujarat Sidhee cement 4) Gujarat State Fertilizer Corporation 5) GEB power plant, 6) Gujarat NRE Coke Limited, 7) Sri Digvijay Cement
CHAPTER 4
ENVIRONMENTAL IMPACTS
4-1
Prediction is a way of mapping the environmental consequences of the actions. Significant action depicts direct adverse changes caused by the action and its effect on health of biota including flora, fauna and man, socio-economic conditions, landforms and resources, physical and cultural heritage properties and quality of bio-physical surroundings. In most cases the predictions consists of indicating merely whether there will be degradation, no change, or enhancement of environmental quality. An impact indicator is a parameter that provides a measure (in at least some qualitative or numerical sense) of the significance and magnitude of the impact. In India, indicators are available in the form of primary and biological water quality criteria, and national ambient standards for noise and air.
Predictions of biological environmental components are often uncertain, because their response to environmental stress cannot be predicted in absolute terms. The impacts of the proposed project on the environment have been considered based on the information provided by the proponents and data collected at the site. Primary impacts are those, which are attributed directly by the project while secondary impacts are those, which are indirectly induced and typically include the associated investments and changed pattern of social and economic activities by the proposed action. The construction and operation phase of the proposed project comprises various activities each of which have been considered to assess the impact on one or another environmental parameters. The environmental impacts have been categorized as positive (beneficial impact) or negative (adverse impact), long or short term and reversible or irreversible.
4.1 Impacts and Mitigation Measures during Construction Activity
During the construction phase the following activities are likely to create environmental impacts.
Site preparation
Excavation for foundation
Road construction
Piling
Raw Mix Concrete Plant and Hot Mix Plant
Transportation of material & traffic management
The impacts of the proposed power plant on the various environmental parameters are discussed serially as under.

4-2
4.1.1 Impact on Land
The total land requirement for the project is 77 ha, which is in possession of Essar and within the premises of Essar Oil (EOL) Refinery. The area identified for the project has no forest. It is almost barren with no settlements over it. The construction of the power plant on this land will not change the land use of the area as it is already a developed land within the premises of the EOL refinery. The top soil of the construction site will be excavated and stored for use in green belt development. Grass will be grown on the top soil to prevent it from getting washed away during monsoon and also by wind action. Top soil management will be practiced to prevent the loss of this precious resource.
4.1.2 Impact on Surface Drainage
The land proposed for acquisition of the power plant is mostly flat land without any undulations. No topographical changes are anticipated during the site development. Adequate measures will be taken during the construction, particularly for storm water runoff so that the nearby natural nallahs are not silted and the sediments are not transported to the Gulf and Marine National Park and Marine Sanctuary (MNP/MS). There is no stream or nalla flowing through the identified site and hence there is no proposed diversion of any water stream. The water regime in the study area has been studied by M/s Hydro–Geo Survey Consultants Private limited, Jodhpur. The hydro-geological study report is discussed in chapter 7.
4.1.3 Impact on Air Quality
During the short period of site preparation, mechanical shovels and earth movers will be used for site clearance, cut and fill and other site leveling activities. These activities will generate dust, which become airborne due to wind, and affect the ambient air quality. However, these activities will be only temporary and reversible in nature. Such impacts on ambient air quality would be only in areas in close proximity to the project site. Water sprinkling tankers will be deployed (2-3 Nos.) at the project site, which will help in suppressing the dust generation. The major roads in the construction site will be black topped to prevent fugitive dust emission. The vehicles used for carrying construction material to and from the site will be periodically checked for pollution under control certificates to ensure that the emissions are always within the prescribed norms.
The power for construction purpose will be made available from grid / refinery CPP, hence DG sets will not be used on regular basis. However DG sets may be used in the times of emergency. When DG sets are used they will comply with the emission standards for the DG sets as prescribed by CPCB. Well planned roads developed inside the construction site would ease the traffic movement and also reduce dust generation. Regular water sprinkling will be done to suppress fugitive dust generated from construction material storage and haulage operations (sand, aggregate, stone powder, etc). Raw mix concrete (RMC) plant and Hot mix plant will be provided with necessary pollution control measures like Bag Filters, Screens, Stacks, to

4-3
minimize dust generation. The emissions are again of temporary nature and it will be ensured that the AAQ will remain within the prescribed standards.
4.1.4 Impact on Water Resources
During construction phase, water will be required for the following activities:
Fill material compaction and stabilization during embankment construction
In-situ cement concrete preparation for RCC and PCC requirements
Drinking water needs of construction workers
Equipment washing and cleaning, especially those involved in fill material compaction and stabilization
Dust suppression
Water requirement during the construction period is estimated to be 100 m3/day. Water will be made available from existing EOL refinery from treated wastewater and desalination plant which is suitable for construction purposes. Potable water will also be sourced from the water treatment facility in EOL refinery, however if required, potable water can also be sourced from the local suppliers by means of tankers. The employment of the local people for the unskilled and semi-skilled jobs will ensure minimal temporary construction camp facilities thereby minimizing the requirement of water. EPSL is committed for not taking any groundwater for use during the construction or operation stage of the project.
The construction workers will be provided with proper sanitation facilities to avoid open defecation. The wastewater generated from the toilets will be treated by septic tank followed by soak pits. Such domestic wastewater treatment will ensure that the surface water bodies are not polluted. The storm water runoff site will be stored in a pit and reused for dust suppression purpose. It will be ensured that before monsoon, boundary wall construction is complete, all excavated materials are stabilized and spoils removed so that during rainfall event these materials do not get washed out of the plant premises.
4.1.5 Impact on Noise levels
Noise will be generated during the construction activities by the use of heavy equipment and vehicular movement. Noise levels due to construction equipment may result into impacts due to operation of several earth moving equipment / machines simultaneously. The main noise generating equipment / machines are the transport vehicles and construction equipment (payloaders, dumpers, cranes, etc). Noise levels due to construction equipment and transportation vehicles are predicted to increase at most 4-5 dB(A) at project boundary using random distribution of the equipments in the project area. There will be short term and localised
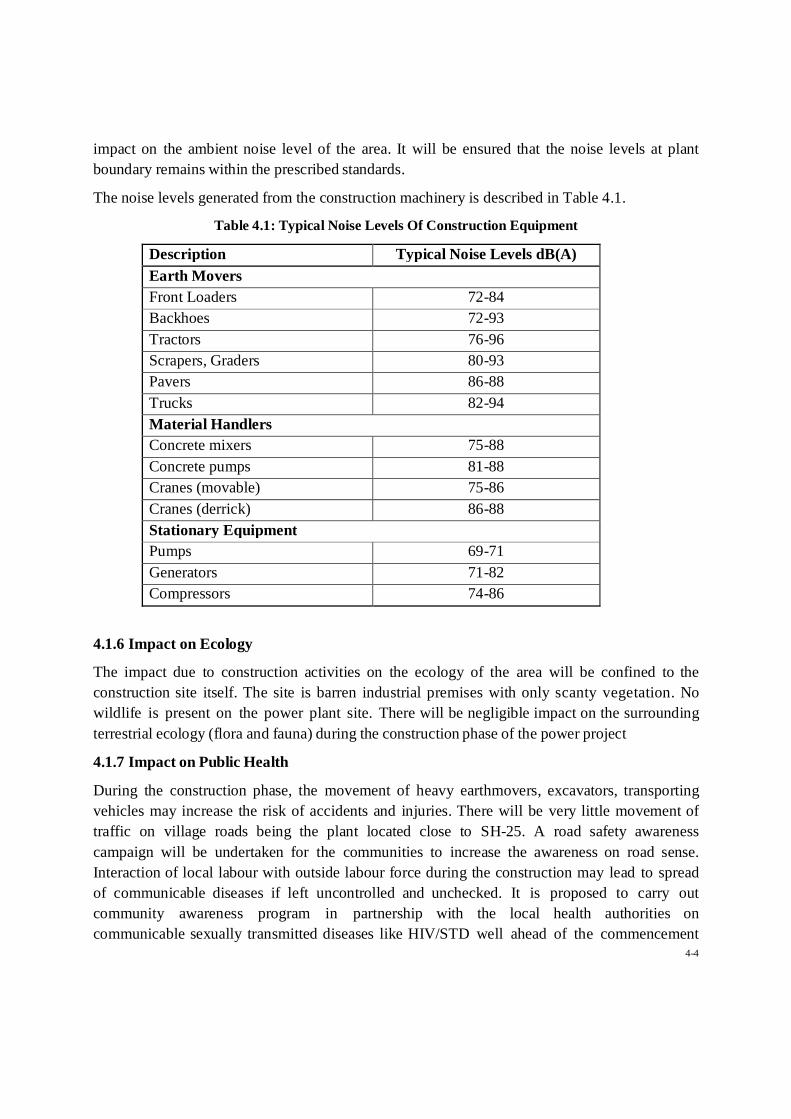
4-4
impact on the ambient noise level of the area. It will be ensured that the noise levels at plant boundary remains within the prescribed standards.
The noise levels generated from the construction machinery is described in Table 4.1.
Table 4.1: Typical Noise Levels Of Construction Equipment
Description Typical Noise Levels dB(A) Earth Movers Front Loaders 72-84 Backhoes 72-93 Tractors 76-96 Scrapers, Graders 80-93 Pavers 86-88 Trucks 82-94 Material Handlers Concrete mixers 75-88 Concrete pumps 81-88 Cranes (movable) 75-86 Cranes (derrick) 86-88 Stationary Equipment Pumps 69-71 Generators 71-82 Compressors 74-86
4.1.6 Impact on Ecology
The impact due to construction activities on the ecology of the area will be confined to the construction site itself. The site is barren industrial premises with only scanty vegetation. No wildlife is present on the power plant site. There will be negligible impact on the surrounding terrestrial ecology (flora and fauna) during the construction phase of the power project
4.1.7 Impact on Public Health
During the construction phase, the movement of heavy earthmovers, excavators, transporting vehicles may increase the risk of accidents and injuries. There will be very little movement of traffic on village roads being the plant located close to SH-25. A road safety awareness campaign will be undertaken for the communities to increase the awareness on road sense. Interaction of local labour with outside labour force during the construction may lead to spread of communicable diseases if left uncontrolled and unchecked. It is proposed to carry out community awareness program in partnership with the local health authorities on communicable sexually transmitted diseases like HIV/STD well ahead of the commencement
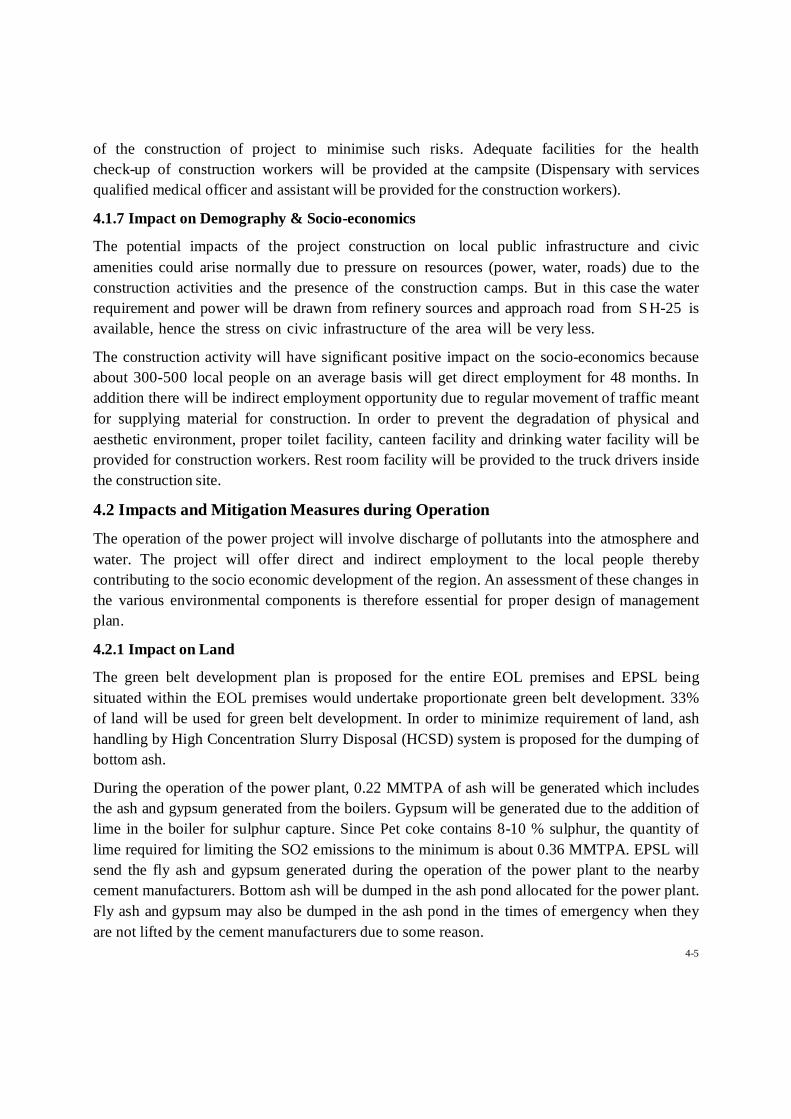
4-5
of the construction of project to minimise such risks. Adequate facilities for the health check-up of construction workers will be provided at the campsite (Dispensary with services qualified medical officer and assistant will be provided for the construction workers).
4.1.7 Impact on Demography & Socio-economics
The potential impacts of the project construction on local public infrastructure and civic amenities could arise normally due to pressure on resources (power, water, roads) due to the construction activities and the presence of the construction camps. But in this case the water requirement and power will be drawn from refinery sources and approach road from SH-25 is available, hence the stress on civic infrastructure of the area will be very less.
The construction activity will have significant positive impact on the socio-economics because about 300-500 local people on an average basis will get direct employment for 48 months. In addition there will be indirect employment opportunity due to regular movement of traffic meant for supplying material for construction. In order to prevent the degradation of physical and aesthetic environment, proper toilet facility, canteen facility and drinking water facility will be provided for construction workers. Rest room facility will be provided to the truck drivers inside the construction site.
4.2 Impacts and Mitigation Measures during Operation
The operation of the power project will involve discharge of pollutants into the atmosphere and water. The project will offer direct and indirect employment to the local people thereby contributing to the socio economic development of the region. An assessment of these changes in the various environmental components is therefore essential for proper design of management plan.
4.2.1 Impact on Land
The green belt development plan is proposed for the entire EOL premises and EPSL being situated within the EOL premises would undertake proportionate green belt development. 33% of land will be used for green belt development. In order to minimize requirement of land, ash handling by High Concentration Slurry Disposal (HCSD) system is proposed for the dumping of bottom ash.
During the operation of the power plant, 0.22 MMTPA of ash will be generated which includes the ash and gypsum generated from the boilers. Gypsum will be generated due to the addition of lime in the boiler for sulphur capture. Since Pet coke contains 8-10 % sulphur, the quantity of lime required for limiting the SO2 emissions to the minimum is about 0.36 MMTPA. EPSL will send the fly ash and gypsum generated during the operation of the power plant to the nearby cement manufacturers. Bottom ash will be dumped in the ash pond allocated for the power plant. Fly ash and gypsum may also be dumped in the ash pond in the times of emergency when they are not lifted by the cement manufacturers due to some reason.
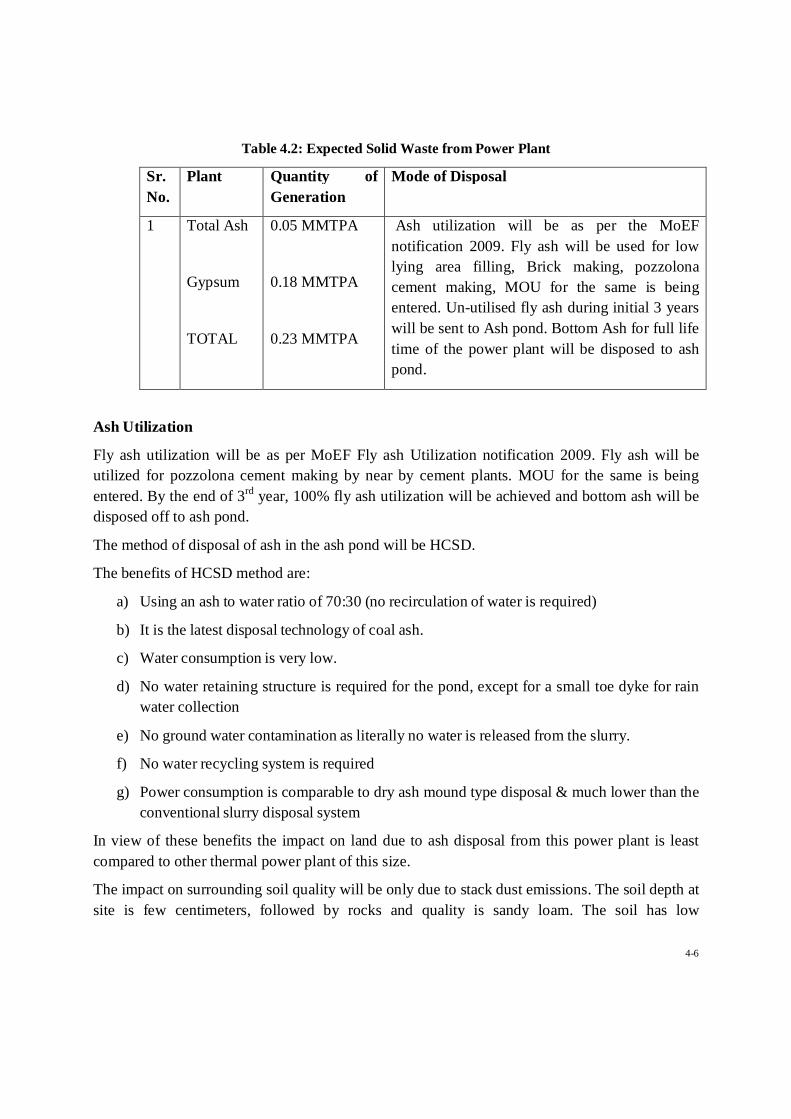
4-6
Table 4.2: Expected Solid Waste from Power Plant
Sr. No.
Plant Quantity of Generation
Mode of Disposal
1 Total Ash
Gypsum
TOTAL
0.05 MMTPA
0.18 MMTPA
0.23 MMTPA
Ash utilization will be as per the MoEF notification 2009. Fly ash will be used for low lying area filling, Brick making, pozzolona cement making, MOU for the same is being entered. Un-utilised fly ash during initial 3 years will be sent to Ash pond. Bottom Ash for full life time of the power plant will be disposed to ash pond.
Ash Utilization
Fly ash utilization will be as per MoEF Fly ash Utilization notification 2009. Fly ash will be utilized for pozzolona cement making by near by cement plants. MOU for the same is being entered. By the end of 3rd year, 100% fly ash utilization will be achieved and bottom ash will be disposed off to ash pond.
The method of disposal of ash in the ash pond will be HCSD.
The benefits of HCSD method are:
a) Using an ash to water ratio of 70:30 (no recirculation of water is required)
b) It is the latest disposal technology of coal ash.
c) Water consumption is very low.
d) No water retaining structure is required for the pond, except for a small toe dyke for rain water collection
e) No ground water contamination as literally no water is released from the slurry.
f) No water recycling system is required
g) Power consumption is comparable to dry ash mound type disposal & much lower than the conventional slurry disposal system
In view of these benefits the impact on land due to ash disposal from this power plant is least compared to other thermal power plant of this size.
The impact on surrounding soil quality will be only due to stack dust emissions. The soil depth at site is few centimeters, followed by rocks and quality is sandy loam. The soil has low
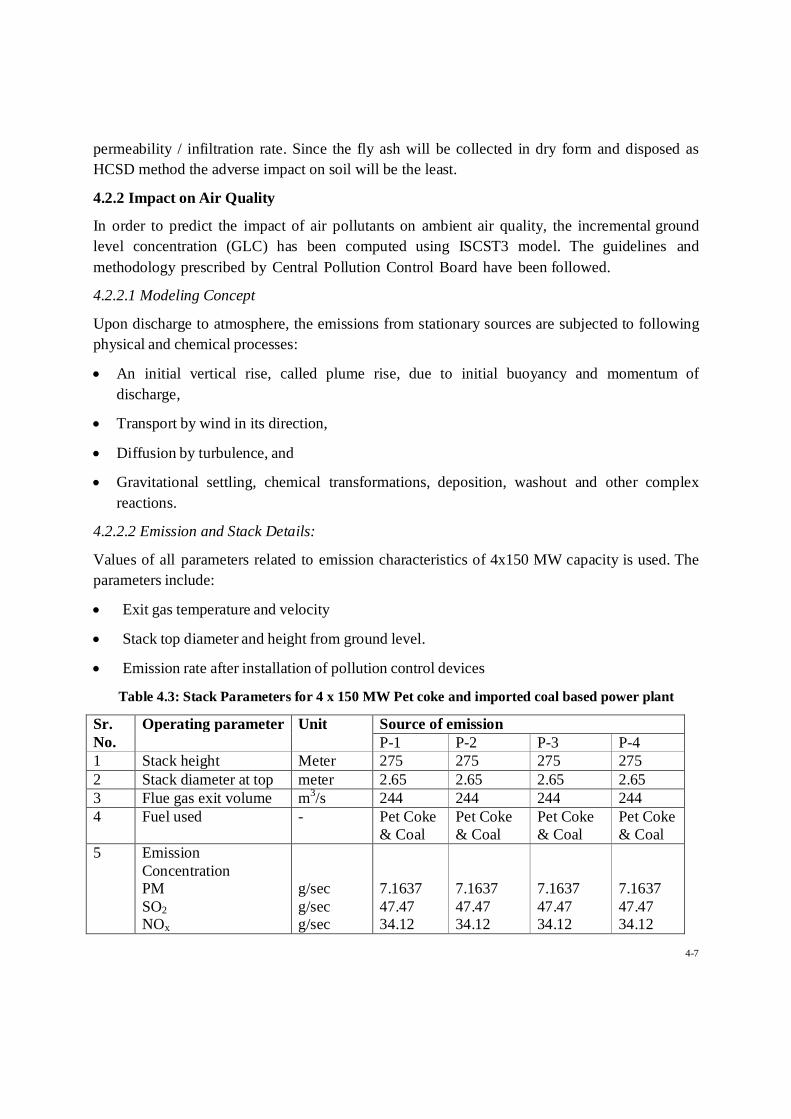
4-7
permeability / infiltration rate. Since the fly ash will be collected in dry form and disposed as HCSD method the adverse impact on soil will be the least.
4.2.2 Impact on Air Quality
In order to predict the impact of air pollutants on ambient air quality, the incremental ground level concentration (GLC) has been computed using ISCST3 model. The guidelines and methodology prescribed by Central Pollution Control Board have been followed.
4.2.2.1 Modeling Concept
Upon discharge to atmosphere, the emissions from stationary sources are subjected to following physical and chemical processes:
An initial vertical rise, called plume rise, due to initial buoyancy and momentum of discharge,
Transport by wind in its direction,
Diffusion by turbulence, and
Gravitational settling, chemical transformations, deposition, washout and other complex reactions.
4.2.2.2 Emission and Stack Details:
Values of all parameters related to emission characteristics of 4x150 MW capacity is used. The parameters include:
Exit gas temperature and velocity
Stack top diameter and height from ground level.
Emission rate after installation of pollution control devices
Table 4.3: Stack Parameters for 4 x 150 MW Pet coke and imported coal based power plant
Sr. No.
Operating parameter Unit Source of emission P-1 P-2 P-3 P-4
1 Stack height Meter 275 275 275 275 2 Stack diameter at top meter 2.65 2.65 2.65 2.65 3 Flue gas exit volume m3/s 244 244 244 244 4 Fuel used - Pet Coke
& Coal Pet Coke & Coal
Pet Coke & Coal
Pet Coke & Coal
5 Emission Concentration PM SO2 NOx
g/sec g/sec g/sec
7.1637 47.47 34.12
7.1637 47.47 34.12
7.1637 47.47 34.12
7.1637 47.47 34.12

4-8
6 Flue gas temp. 0K 406 406 406 40+6 7 Ambient temp. 0K 303 303 303 303 8 Wind Speed m/s 1.89 1.89 1.89 1.89 P-1: Stack attached to Unit-I, P-2: Stack attached to Unit-II, P-3: Stack attached to Unit-III, P-4: Stack attached to Unit-IV
The Isopleths for the PM, SO2 and NOx are plotted below to identify the spread of the air pollutants.

4-9
POST View - Lakes Environmental Software C:\Documents and Settings\Administrator\Desktop\SPM\SPM.IS\PE00GALL.PLT
PROJECT TITLE:
M/s. Essar Power Salaya Ltd., Jamnagar
PROJECT NO.:
MODELING OPTIONS:
CONC, RURAL, FLAT, FLGPOL, DFAULT, MULTYR
OUTPUT TYPE:
CONC
MAX:
0.58276
UNITS:
µg/m³
RECEPTORS:
450 0 4 km
COMMENTS:
Isopleths for PM
MODELER:
COMPANY NAME:
M/s. Essar Power Salaya Ltd., Jamnagar
0.06
0.06
0.06
0.06
0.06 0.06
0.06
0.06
0.06
0.06
0.06
0.06
0.06
0.06
0.06
0.13
0.13
0.13
0.13
0.13
0.13
0.13
0.13
0.13
0.19
0.19
0.19
0.19
0.19
0.26
0.26
0.260.32
0.32
-10000 0 10000
0
0.000 0.000 0.065 0.130 0.194 0.259 0.324 0.389 0.453 0.518 0.583
Figure 4.1: Isopleths for PM
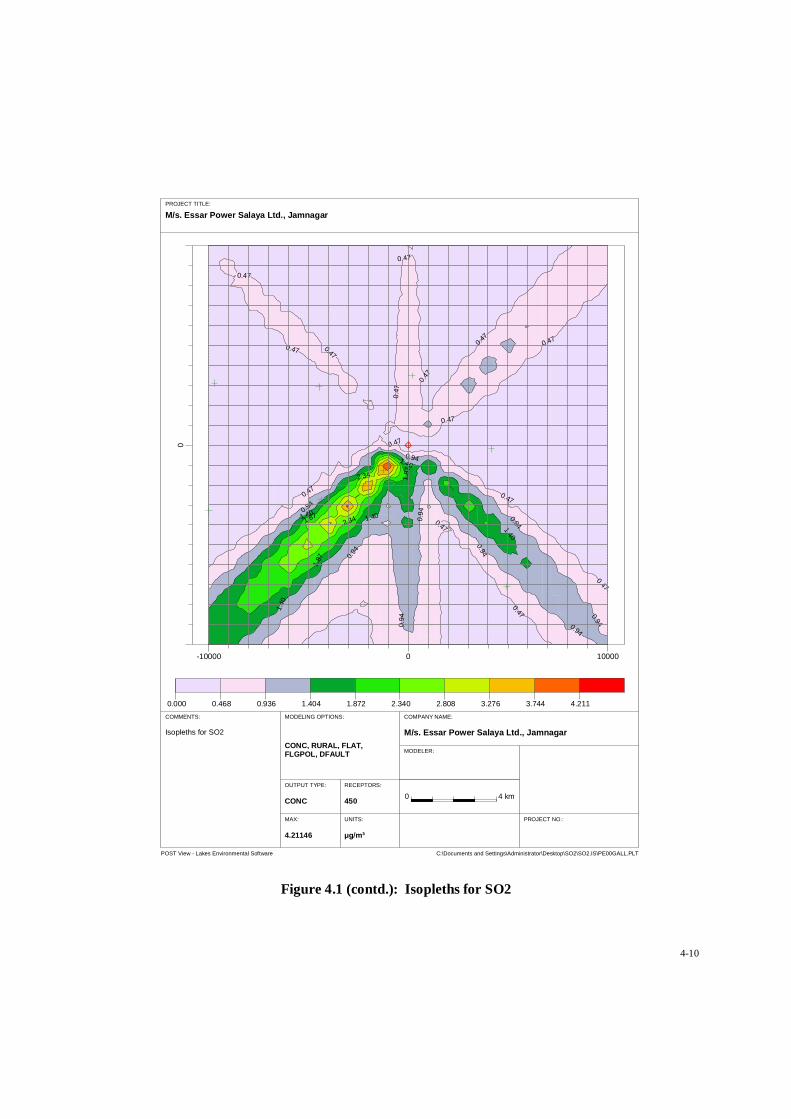
4-10
POST View - Lakes Environmental Software C:\Documents and Settings\Administrator\Desktop\SO2\SO2.IS\PE00GALL.PLT
PROJECT TITLE:
M/s. Essar Power Salaya Ltd., Jamnagar
PROJECT NO.:
MODELING OPTIONS:
CONC, RURAL, FLAT, FLGPOL, DFAULT
OUTPUT TYPE:
CONC
MAX:
4.21146
UNITS:
µg/m³
RECEPTORS:
450 0 4 km
COMMENTS:
Isopleths for SO2
MODELER:
COMPANY NAME:
M/s. Essar Power Salaya Ltd., Jamnagar
0.47
0.47
0.47
0.47
0.47 0.47
0.47
0.47
0.47
0.47
0.47
0.47
0.47
0.47
0.47
0.94
0.94
0.94
0.94
0.94
0.94
0.94
0.94
0.94
1.40
1.40
1.40
1.40
1.40
1.87
1.87
1.872.34
2.34
-10000 0 10000
0
0.000 0.468 0.936 1.404 1.872 2.340 2.808 3.276 3.744 4.211
Figure 4.1 (contd.): Isopleths for SO2
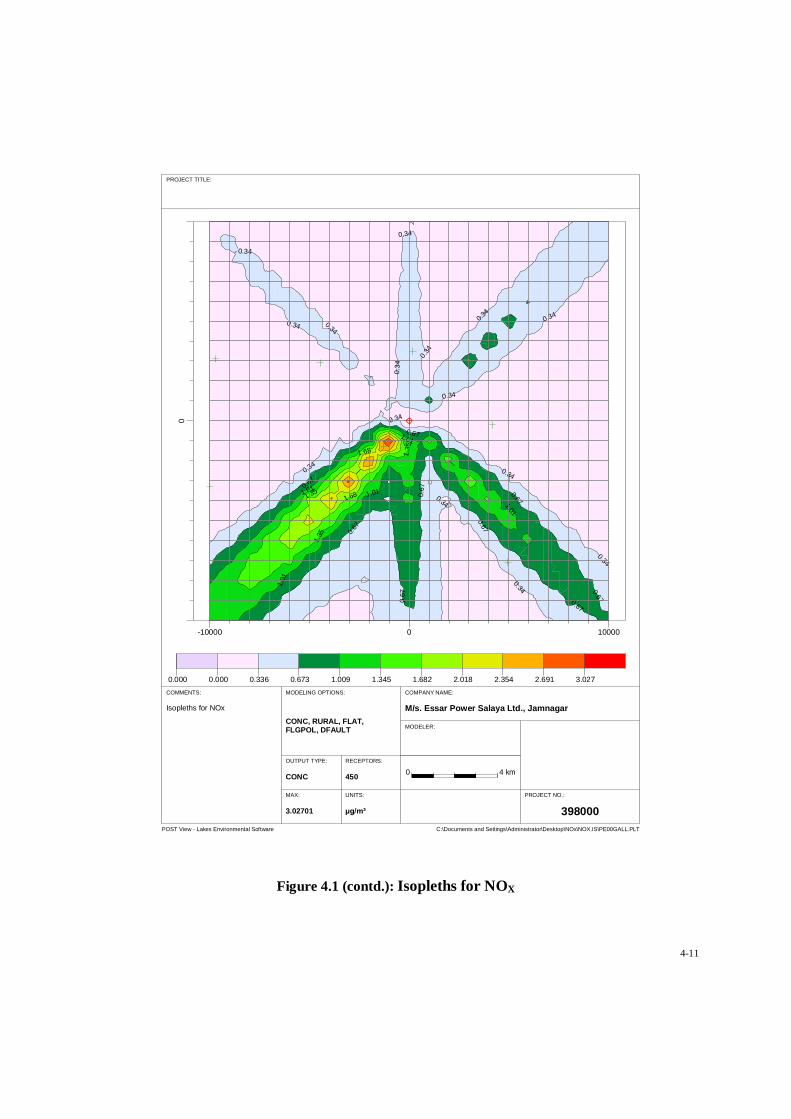
4-11
POST View - Lakes Environmental Software C:\Documents and Settings\Administrator\Desktop\NOx\NOX.IS\PE00GALL.PLT
PROJECT TITLE:
PROJECT NO.:
398000
MODELING OPTIONS:
CONC, RURAL, FLAT, FLGPOL, DFAULT
OUTPUT TYPE:
CONC
MAX:
3.02701
UNITS:
µg/m³
RECEPTORS:
450 0 4 km
COMMENTS:
Isopleths for NOx
MODELER:
COMPANY NAME:
M/s. Essar Power Salaya Ltd., Jamnagar
0.34
0.34
0.34
0.34
0.34 0.34
0.34
0.34
0.34
0.34
0.34
0.34
0.34
0.34
0.34
0.67
0.67
0.67
0.67
0.67
0.67
0.67
0.67
0.67
1.01
1.01
1.01
1.01
1.01
1.35
1.35
1.351.68
1.68
-10000 0 10000
0
0.000 0.000 0.336 0.673 1.009 1.345 1.682 2.018 2.354 2.691 3.027
Figure 4.1 (contd.): Isopleths for NOX
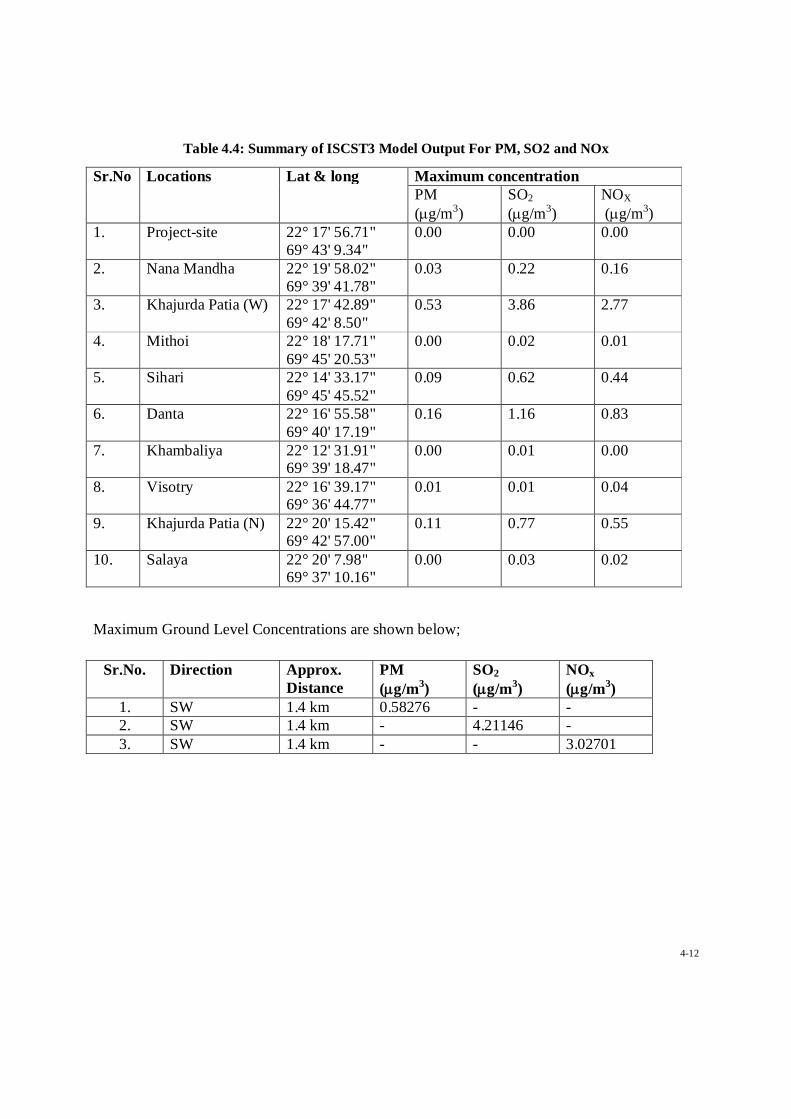
4-12
Table 4.4: Summary of ISCST3 Model Output For PM, SO2 and NOx
Sr.No Locations Lat & long Maximum concentration PM (g/m3)
SO2
(g/m3) NOX
(g/m3) 1. Project-site 22° 17' 56.71"
69° 43' 9.34" 0.00 0.00 0.00
2. Nana Mandha 22° 19' 58.02" 69° 39' 41.78"
0.03 0.22 0.16
3. Khajurda Patia (W) 22° 17' 42.89" 69° 42' 8.50"
0.53 3.86 2.77
4. Mithoi 22° 18' 17.71" 69° 45' 20.53"
0.00 0.02 0.01
5. Sihari 22° 14' 33.17" 69° 45' 45.52"
0.09 0.62 0.44
6. Danta 22° 16' 55.58" 69° 40' 17.19"
0.16 1.16 0.83
7. Khambaliya 22° 12' 31.91" 69° 39' 18.47"
0.00 0.01 0.00
8. Visotry 22° 16' 39.17" 69° 36' 44.77"
0.01 0.01 0.04
9. Khajurda Patia (N) 22° 20' 15.42" 69° 42' 57.00"
0.11 0.77 0.55
10. Salaya 22° 20' 7.98" 69° 37' 10.16"
0.00 0.03 0.02
Maximum Ground Level Concentrations are shown below;
Sr.No. Direction
Approx. Distance
PM (g/m3)
SO2
(g/m3) NOx
(g/m3) 1. SW 1.4 km 0.58276 - - 2. SW 1.4 km - 4.21146 - 3. SW 1.4 km - - 3.02701

4-13
It is important to assess the cumulative impact of all the upcoming facilities of Essar in Vadinar-Salaya region on the air quality. Two power plants of Essar are at different stages of construction and are situated within the 10 km radius of the proposed 600 MW Pet coke and coal based power plant. The two upcoming units are 1) a 1200 MW (2 x 600 MW) imported coal based thermal power plant which is located about 3.5 km from the proposed project and 2) A 483 MW multi fuel based power plant located adjacent to the present project.
Since the plume of 1200 MW Power plant does not interact with the proposed power plant, it was not considered for Cumulative modelling. The cumulative modelling therefore considers the emissions from the proposed 4x150 MW plus the 483 MW Power plant which is under construction. This will provide a realistic scenario of the air quality in the region. The stack details of the 483 multi fuel based power plant and 1200 MW power plant are as under:
Table – 4.5: Details of Stack Emission From 483 Multi-Fuel Based Thermal Power Plant
Sr. No.
Operating parameter
Unit Source of emission P-5 P-6 P-7
1 Stack height meter 220 220 220 2 Stack diameter
at top meter 4.7 4.7 4.7
3 Flue gas exit velocity
m/s 24.5 24.5 24.5
4 Fuel used - Coal Coal Coal 5 Emission
Concentration PM SO2 NOx
gm/s gm/s gm/s
15.5 397 204
15.5 397 204
15.5 397 204
6 Flue gas temp. 0K 408 408 408 7 Ambient temp. 0K 303 303 303 8 Wind Speed m/s 1.89 1.89 1.89
P-5: Stack attached to Unit-I, P-6: Stack attached to Unit-II, P-7: Stack attached to Unit-III
Table 4.5 (contd.): Details of Emission from Stacks (2×600 mw – 1200 mw power plant)
Sr. No. Operating parameter
Unit Source of emission P-8 P-9
1 Stack height meter 275 275 2 Stack
diameter at top
meter 3.0 3.0
3 Flue gas exit velocity
m/s 25 25
4 Fuel used - Coal Coal

4-14
5 Emission Concentration PM SO2 NOx
gm/s gm/s gm/s
13.4 1071 93.8
13.4 1071 93.8
6 Flue gas temp.
0K 393 393
7 Ambient temp.
0K 303 303
8 Wind Speed m/s. 1.89 1.89 P-7: Stack attached to Unit-I; P-8: Stack attached to Unit-II
The incremental GLC values of PM, SO2 and NOx (24-hour average) around the project site (10 km x 10 km area) are also presented as isopleths in the 4.2 respectively. The incremental ambient air quality scenario of the study area after the operation of power plant is shown in Figure 4.1
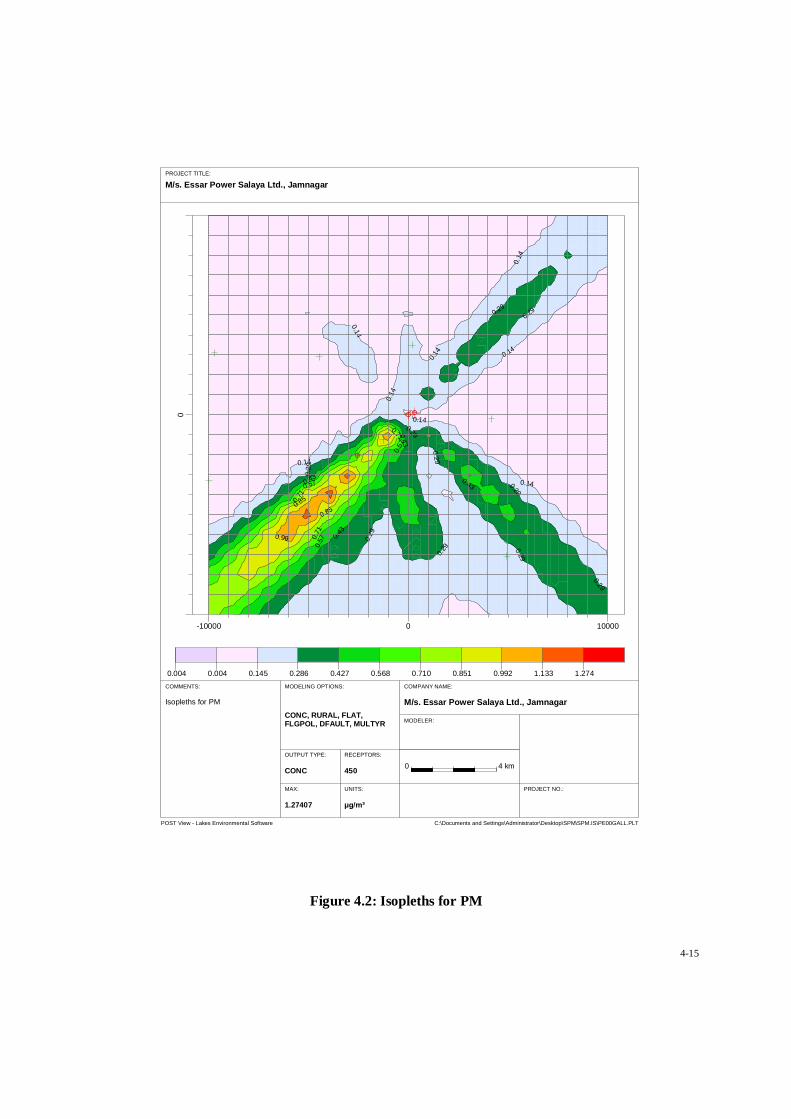
4-15
POST View - Lakes Environmental Software C:\Documents and Settings\Administrator\Desktop\SPM\SPM.IS\PE00GALL.PLT
PROJECT TITLE:
M/s. Essar Power Salaya Ltd., Jamnagar
PROJECT NO.:
MODELING OPTIONS:
CONC, RURAL, FLAT, FLGPOL, DFAULT, MULTYR
OUTPUT TYPE:
CONC
MAX:
1.27407
UNITS:
µg/m³
RECEPTORS:
450 0 4 km
COMMENTS:
Isopleths for PM
MODELER:
COMPANY NAME:
M/s. Essar Power Salaya Ltd., Jamnagar
0.14
0.14
0.14
0.14
0.14
0.14
0.14
0.14
0.29
0.29
0.29
0.29
0.29
0.29
0.29
0.29
0.290.29
0.43
0.43
0.43
0.430.57
0.57
0.57
0.71
0.71
0.71
0.850.85
0.99
-10000 0 10000
0
0.004 0.004 0.145 0.286 0.427 0.568 0.710 0.851 0.992 1.133 1.274
Figure 4.2: Isopleths for PM

4-16
POST View - Lakes Environmental Software C:\Documents and Settings\Administrator\Desktop\SO2\SO2.IS\PE00GALL.PLT
PROJECT TITLE:
M/s. Essar Power Salaya Ltd., Jamnagar
PROJECT NO.:
MODELING OPTIONS:
CONC, RURAL, FLAT, FLGPOL, DFAULT
OUTPUT TYPE:
CONC
MAX:
24.98391
UNITS:
µg/m³
RECEPTORS:
450 0 4 km
COMMENTS:
Isopleths for SO2
MODELER:
COMPANY NAME:
M/s. Essar Power Salaya Ltd., Jamnagar
2.88
2.88
2.88
2.88
2.88
2.88
2.88
2.88
5.64
5.64
5.64
5.64
5.64
5.64
5.64
5.64
5.64
8.40
8.40
8.40
8.40
11.17
11.1
7
13.93
13.9
316
.69
16.69
19.46
19.4622.22
-10000 0 10000
0
0.114 2.878 5.641 8.404 11.167 13.931 16.694 19.457 22.221 24.984
Figure - 4.2 (contd.): Isopleths for SO2

4-17
POST View - Lakes Environmental Software C:\Documents and Settings\Administrator\Desktop\NOx\NOX.IS\PE00GALL.PLT
PROJECT TITLE:
M/s. Essar Power Salaya Ltd., Jamnagar
PROJECT NO.:
398000
MODELING OPTIONS:
CONC, RURAL, FLAT, FLGPOL, DFAULT
OUTPUT TYPE:
CONC
MAX:
10.82682
UNITS:
µg/m³
RECEPTORS:
450 0 4 km
COMMENTS:
Isopleths for NOx
MODELER:
COMPANY NAME:
M/s. Essar Power Salaya Ltd., Jamnagar
1.23
1.23
1.23
1.23
1.23
1.23
1.23
1.23
1.23
2.43
2.43
2.43
2.43
2.43 2.43
2.43
2.43
2.43
2.43
3.63
3.63
3.63
3.63
4.83
4.83
4.83
6.03
6.03
6.03
7.23
7.23
8.43
-10000 0 10000
0
0.033 1.233 2.432 3.631 4.830 6.030 7.229 8.428 9.628 10.827
Figure 4.2 (contd.): Isopleths for NOx
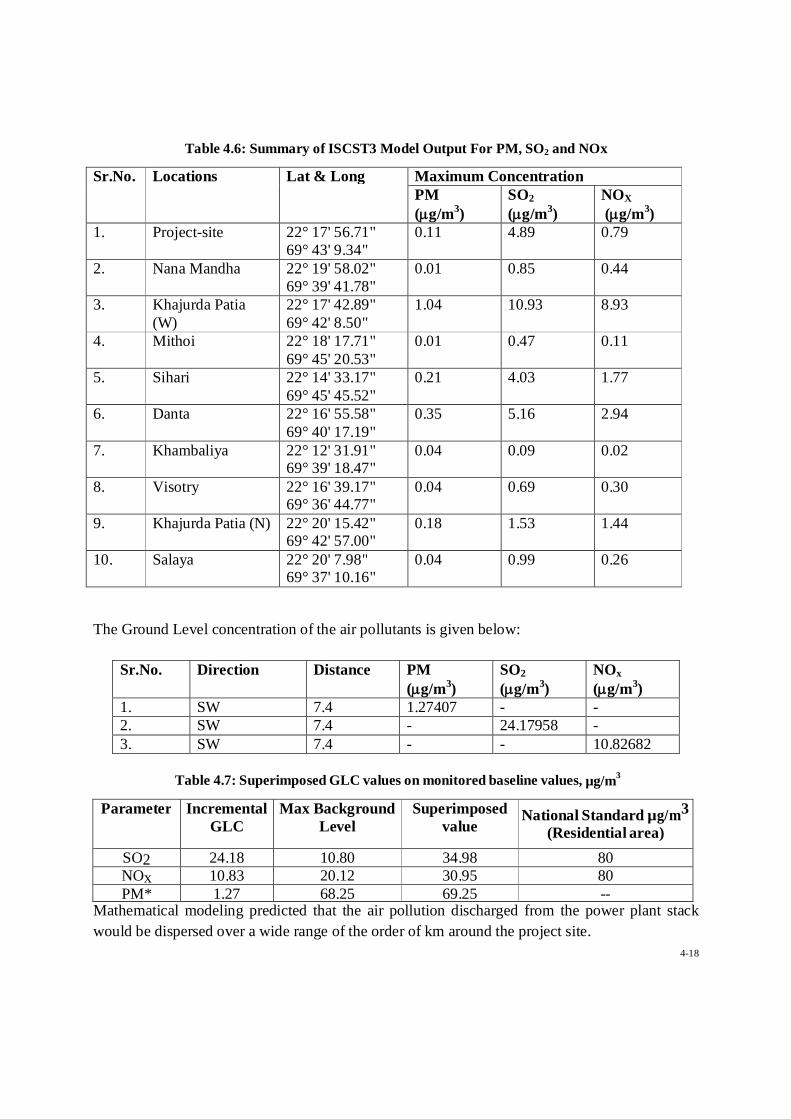
4-18
Table 4.6: Summary of ISCST3 Model Output For PM, SO2 and NOx
Sr.No. Locations Lat & Long Maximum Concentration PM (g/m3)
SO2
(g/m3) NOX
(g/m3) 1. Project-site 22° 17' 56.71"
69° 43' 9.34" 0.11 4.89 0.79
2. Nana Mandha 22° 19' 58.02" 69° 39' 41.78"
0.01 0.85 0.44
3. Khajurda Patia (W)
22° 17' 42.89" 69° 42' 8.50"
1.04 10.93 8.93
4. Mithoi 22° 18' 17.71" 69° 45' 20.53"
0.01 0.47 0.11
5. Sihari 22° 14' 33.17" 69° 45' 45.52"
0.21 4.03 1.77
6. Danta 22° 16' 55.58" 69° 40' 17.19"
0.35 5.16 2.94
7. Khambaliya 22° 12' 31.91" 69° 39' 18.47"
0.04 0.09 0.02
8. Visotry 22° 16' 39.17" 69° 36' 44.77"
0.04 0.69 0.30
9. Khajurda Patia (N) 22° 20' 15.42" 69° 42' 57.00"
0.18 1.53 1.44
10. Salaya 22° 20' 7.98" 69° 37' 10.16"
0.04 0.99 0.26
The Ground Level concentration of the air pollutants is given below:
Table 4.7: Superimposed GLC values on monitored baseline values, µg/m3
Parameter Incremental GLC
Max Background Level
Superimposed value
National Standard µg/m3 (Residential area)
SO2 24.18 10.80 34.98 80 NOx 10.83 20.12 30.95 80 PM* 1.27 68.25 69.25 --
Mathematical modeling predicted that the air pollution discharged from the power plant stack would be dispersed over a wide range of the order of km around the project site.
Sr.No. Direction Distance PM (g/m3)
SO2
(g/m3) NOx
(g/m3) 1. SW 7.4 1.27407 - - 2. SW 7.4 - 24.17958 - 3. SW 7.4 - - 10.82682

4-19
The stack height of 275 m is tall enough to pierce the lowest mixing height of the site. This eliminates the chances of ground based inversion of the plume / emitted stack gases and dust. Due to wide dispersion of air pollutants, lower GLC values are observed. The worst (average) incremental GLC value of PM, SO2 and NOx from the project at full operating load (MCR condition) will be 1.27 µg/m3, 24.18 µg/m3 and 10.83 µg/m3 respectively. The maximum GLC values would occur at 7.4 km area towards the south west direction with respect to the proposed plant site.
4.2.2.3 Impact on Air Quality of Marine National Park and Sanctuary
The MPN/MS is located towards West and North West direction at a distance of 7.5 km. There is no significant incremental GLC at that distance indicating no change in the baseline air quality of the area.
4.2.2.4 Conclusion
The modeling study proved that the air emissions (after ESP) from the proposed plant would not affect the ambient air quality of the region in any significant manner. This is because the proposed plant will have highly efficient air pollution control equipment to control emissions. The ambient air quality around the proposed project site will remain within the national ambient air quality standards (NAAQS) meant for residential area. The ambient air quality around the MNP/MS will also remain within the national ambient air quality standards (NAAQS) without any significant addition in the ambient levels. NAAQS are indicative air quality criteria that are adequate to protect the human health and vegetation.
4.2.3 Impact on Water Resources
The power plant will require 6000 m3/hour water, which will be sourced from the EOL Refinery by means of pipeline.
Wastewater sources, quantity and quality, generated are presented in Table 4.8.
Table 4.8: Types of Wastewater Generation and Quantity
(All values are given in m3/hour)
Units Effluent (m3/hr) Disposal Cooling tower blow down
4003 The cooling tower blow down will be discharged back to the sea after treatment. The remaining wastewater will be collected in a holding pond and treated to required standards. This water shall be used for dust suppression, ash conditioning, gardening and in cooling tower. The domestic waste water shall be
Boiler blow down 79 Waste water from DM plant
10
Total 4092

4-20
Units Effluent (m3/hr) Disposal discharged to septic tank followed by soak pit.
The water balance and wastewater generation details have been described in Chapter 2. The wastewater generated from the different sources will be collected in holding pond and treated to required standards. This treated water shall be used for dust suppression, ash conditioning, gardening and in cooling tower. Only during monsoon there will be discharge to surface waters. The domestic waste water shall be discharged to septic tank followed by soak pit.
Garland drains around the ash disposal site will be provided for the collection of run-off water during monsoon season and treat it before discharge by providing a check dam.
The storm water in the project area will be collected through storm water drains and collected in the storm water tank and diverted to raw water reservoir. In case the storm water tank starts overflowing, the same will be discharged into natural course.
The quality of return water shall meet the norms prescribed under Environment (Protection) Rules and by Gujarat Pollution Control Board. Additionally, the water requirement is optimized using sea-water re-circulation system comprising cooling towers with COC of 1.3. A part of the CT blowdown will be used for desalination and ash handling system equipment.
The ash and coal handling plant effluents, boiler blowdown, wash water from shop floor and auxiliary units will be collected in CMB. The wastewater collected in CMB will be tested for parameters like pH, conductivity, dissolved oxygen, alkalinity, suspended solids, oil, etc. This water may need correction for pH. This water from CMB will be used for ash sluicing / handling, dust suppression and greenbelt development / gardening.
The domestic wastewater from toilets, washrooms, kitchen, etc will be collected and conveyed to the Sewage Treatment Plant. The treated sewage will be reused for gardening after meeting the standards prescribed by GPCB. The STP sludge will be dried using filter press and reused as soil conditioning agent in green belt area.
The storm water drains will be separate from the wastewater drains to avoid any contamination of storm water. During monsoon time, the storm water will be drained out into nearby nalla. Due to huge dilution available in the streams during monsoon, discharge of storm water into the nearby nalla will not affect the quality in any significant manner.
The garland drains from coal storage area may carry suspended particles due to wash out from storage area. These need to be settled before taken up for reuse (sprinkling) or use it further for dust suppression. The wash out from ash mound during rains will be collected through garland drain, passed through sedimentation pit and then either reused or disposed along with storm water runoff during rainfall event. Since the ash disposal is proposed in the form of high
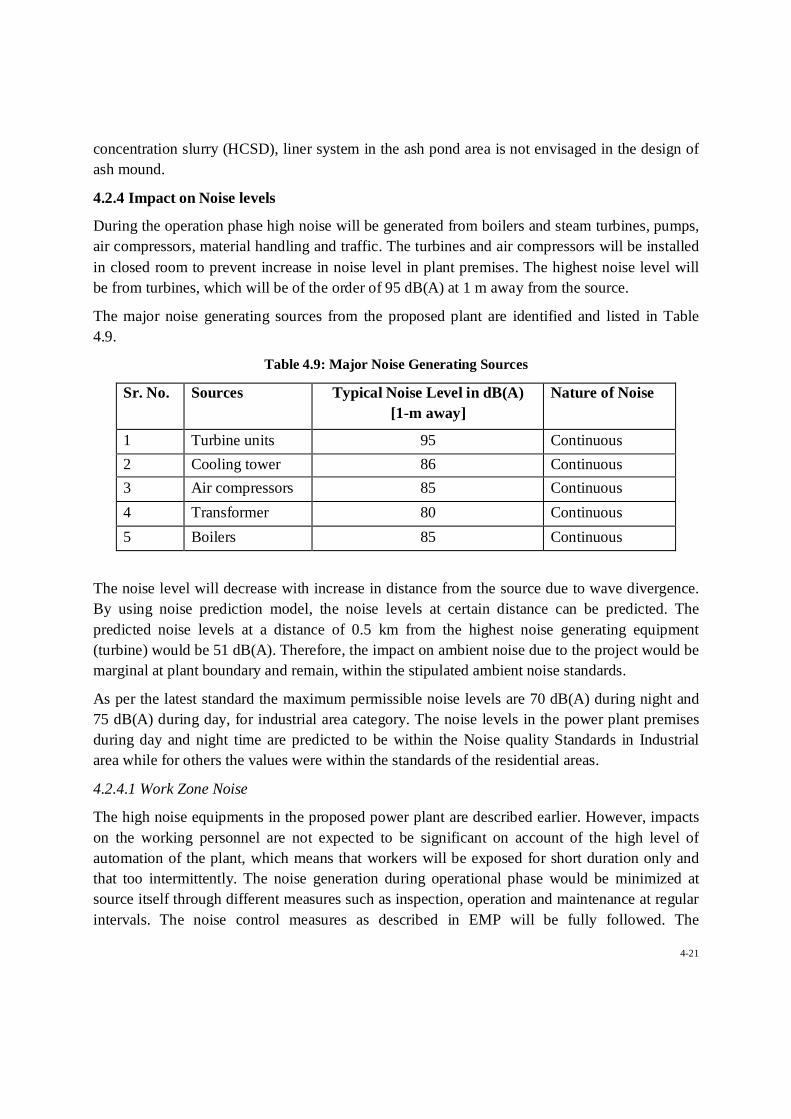
4-21
concentration slurry (HCSD), liner system in the ash pond area is not envisaged in the design of ash mound.
4.2.4 Impact on Noise levels
During the operation phase high noise will be generated from boilers and steam turbines, pumps, air compressors, material handling and traffic. The turbines and air compressors will be installed in closed room to prevent increase in noise level in plant premises. The highest noise level will be from turbines, which will be of the order of 95 dB(A) at 1 m away from the source.
The major noise generating sources from the proposed plant are identified and listed in Table 4.9.
Table 4.9: Major Noise Generating Sources
Sr. No. Sources Typical Noise Level in dB(A) [1-m away]
Nature of Noise
1 Turbine units 95 Continuous 2 Cooling tower 86 Continuous 3 Air compressors 85 Continuous 4 Transformer 80 Continuous 5 Boilers 85 Continuous
The noise level will decrease with increase in distance from the source due to wave divergence. By using noise prediction model, the noise levels at certain distance can be predicted. The predicted noise levels at a distance of 0.5 km from the highest noise generating equipment (turbine) would be 51 dB(A). Therefore, the impact on ambient noise due to the project would be marginal at plant boundary and remain, within the stipulated ambient noise standards.
As per the latest standard the maximum permissible noise levels are 70 dB(A) during night and 75 dB(A) during day, for industrial area category. The noise levels in the power plant premises during day and night time are predicted to be within the Noise quality Standards in Industrial area while for others the values were within the standards of the residential areas.
4.2.4.1 Work Zone Noise
The high noise equipments in the proposed power plant are described earlier. However, impacts on the working personnel are not expected to be significant on account of the high level of automation of the plant, which means that workers will be exposed for short duration only and that too intermittently. The noise generation during operational phase would be minimized at source itself through different measures such as inspection, operation and maintenance at regular intervals. The noise control measures as described in EMP will be fully followed. The

4-22
occupational noise exposure to the workers in the form of 8 hourly time weighted average will be maintained well within the prescribed OSHA standards (<90 dB (A)). Hence, the impact on occupational health of workers would be insignificant.
4.2.5 Impact on Ecology
There are no other eco-sensitive area with in 10 km radius of project site except the Marine National Park and Maine Sanctuary (MNP/MS). The distance of the MNP/MS from the proposed power plant is 7.5 km. Adverse impact on the MNP/MS is anticipated due to the discharge of air pollutants and wastewater in the surrounding atmosphere. The major air pollutants discharged into the atmosphere from the power plant are PM, SO2 and NOx. The predicted air quality of the study area indicates that the concentrations of PM, SO2 and NOx remain within the prescribed standards by CPCB. Hence no adverse impact on the ecology of the MNP/MS is anticipated due to discharge of such air pollutants from the power plant.
The major liquid effluent discharged into the surrounding from the power plant is the cooling tower blow down. The total quantity of CT blow down is estimated to be 4003 m3/hour. This water will be let out into the sea after proper treatment. To prevent any negative impact of the CT blow down discharge on the marine ecology of the area, adequate methods will be put in place. The EOL refinery has the required treatment and monitoring set up which will be utilised for the proposed power plant. The water will be sent to the EOL refinery where it will be treated before being let off. EOL refinery has well designed diffuser to enable mixing of the discharged water with the surrounding water. No untreated wastewater will be discharged to the sea. Even the discharge by EOL refinery will be outside the MNP/MS boundary. Hence no direct impact on MNP/MS is anticipated.
The impact on the terrestrial ecology due to the operation of the power plant may occur from the deposition of dust and gases. The emission of suspended particulate matter from the stack will be limited to 50 mg/Nm3 against the national standard of 150 mg/Nm3. The fugitive dust emissions will be controlled using suitable devices and water sprinkling of the open areas.
4.2.6 Impact on Public Health
The project is designed with air pollution control devices meeting the stringent national and international norms. The ambient air quality of surrounding area will remain well within the National Ambient Air Quality Standards (NAAQS). The national ambient air quality standard prescribes pollutant levels that will protect public health and other adverse effects due to air pollution. Air quality dispersion modeling predicted that the ambient air quality of the study area would remain well within the national standards. Therefore, there will be no impact on the public health of the people residing around the project site.

4-23
4.2.7 Impact on Traffic
The site boundary is about 1.5 km away from Jamnagar – Okha State Highway, and located within the EOL complex. It is located around 13.8 km from the Khambalia Railway station and around 45 km from Jamnagar city. Within the site, coal will be transported by means of closed conveyor system. Power will be transmitted to nearest substation using Transmission Towers (to be developed separately by GEB). Additional vehicular traffic will be mostly on account of movement of operational staff and occasional transportation of materials. The existing daily traffic has been obtained by undertaking traffic management study and detailed information is provided as an annexure 5 of this report. EPSL will interact with the Transport Authorities to ensure that effective traffic management measures to minimize any traffic congestion are implemented.
4.2.8 Impact on Demography and Socio-economics
Establishment of any industrial project leads to socio-economic changes. Large-scale influx of population leads to change in economic status of the community. Demographic profile of the area will undergo significant changes after this project. More and more people will come from other places in search for business and employment. There will be significant positive impact on the overall socio-economic pattern of the area during the construction and operation stage of the project. About 300 -500 people will get direct employment during the construction period of 48 months. About 500 people will get direct employment during the operation period of the project (including contract workers). More and more amenities like educational facility, health centres, recreation centres, etc. will come up in the area along with several other infrastructure facilities. Large beneficial impacts in terms of gross economic yield will accrue on account of the proposed project. The gross economic yield will increase through increase in high economic group and subsequent market multiplier effect. The benefits accrued will be obviously tremendous in local as well as in regional context.
Essar is very sensitive to the needs to weaker sections of the community and the Facilities at Labour colony for Labours working at different Essar site are listed below:
Accommodation Shared accommodation for bachelors Separate family accommodation Kerosene is used as domestic fuel
Water Purified drinking water round the clock Bathing/other use water round the clock Sewage treatment plant (STP)
Medical Facility Round the clock First aid centre
4-24
Daily doctor visit (3Hrs/Day) Medical store Periodic Medical awareness camps Periodic medical treatment camps Daily housekeeping School for kids Children’s park Recreation facilities having community hall, indoor/outdoor game facility,
playground, Daily newspaper & magazine and musical instruments Shopping area with grocery shop, tea/snack stall, STD/PCO booth etc Periodic Labour awareness camps Sports and cultural programs Gardening and tree plantation Labour transportation from camp to site
4.3 Overall Impact
Welfare of citizens and providing good quality of life is the main function of policy planning in each sector of the economy. However, the human concerns vary from place to place and from time to time. Overall impact of the proposed project is likely to be beneficial to the society at large. However, the positive impact will accrue only after implementation of the proposed environmental management plan. The peripheral; beneficial impacts are community welfare activities in the field of education, health, communication, transportation and infrastructure facilities. The positive economic output will improve the overall quality of life of people living in the region.

CHAPTER - 5
ENVIRONMENTAL MANAGEMENT
PLAN

5-1
The industrial development in the study area needs to be intertwined with judicious utilization of non-renewable resources of the study area and within the limits of its permissible assimilative capacity. The assimilative capacity of the study area is the maximum amount of pollution load that can be discharged in the environment without affecting the designated use and is governed by dilution, dispersion, and removal due to Physico-chemical and biological processes. The Environment Management Plan (EMP) is required to ensure sustainable development in the study area (10 km) of the proposed plant site, hence it needs to be an all encompassive plan for which the proposed industry, government, regulating agencies like Gujarat Pollution Control Board working in the region and more importantly the affected population of the study area need to extend their co-operation and contribution. The identification and quantification of impacts based on scientific and mathematical modeling has been presented in Chapter-4. At the industry level, pollution control measures include in-built process control measures and also external control measures at the end of the pipeline before the pollutants are discharged into the receiving bodies.
It has been evaluated that the study area has not been affected adversely with present industrialization and likely to get new economical fillip, not only for the study area but for the region as a whole. Mitigation measures at the source level and an overall Management Plan at the study area level are elicited so as to improve the supportive capacity of the study area and also to preserve the assimilative capacity of the receiving bodies.
The affected environmental attributes in the region are air quality, water quality, soil, land use, ecology and public health.
The Management Action Plan aims at controlling pollution at the source level to the possible extent with the available and affordable technology followed by treatment measures before they are discharged.
The following mitigation measures are recommended in order to synchronize the economic development of the study area with the environmental protection of the region.
5.1 Mitigation Measures
5.1.1 Land Environment
During construction phase, construction debris from the project site would be re-used as land filling material. The top soil excavated from the site will be used for green belt development.
During operation phase, the overall solid/hazardous waste disposal system would comprise of:
Spent oil: Collection, Storage, Transportation, Disposal by sale to registered Recyclers
Gypsum: Collection, Storage, Transportation, Disposal at TSDF site or sent to cement plants
Ash: Efforts will be made to utilize the ash as per the MoEF fly ash notification.
5.1.2 Air Environment
To prevent the impact on air environment, adequate measures will be taken to minimize discharge of air pollutants from processes by providing air pollution control equipment.
5-2
During construction phase suspended solids can be controlled by sprinkling of water and by employing enclosures to construction area to allow the particles to settle down, prior to discharge. Approach road to the construction site should be black topped to prevent fugitive dust generation.
During the operation phase, flue gases shall be discharged from stacks at adequate height (as per GPCB norms). Since the total power generation capacity of the proposed power plant is 600 MW, the stack height will be 275 m. High stacks ensure adequate dispersion of pollutants in the environment and reduce the ground level impact of the pollutant release. Lime will be injected into the boilers for trapping of sulphur oxides generated from the burning of Pet coke and imported coal. Low NOx burners to be employed for minimizing the generation of NOx. Electrostatic precipitators (ESP) of high efficiency (99.9%) to be provided for trapping the particulate matter generated in the boilers. The PM emission levels to be maintained to below 50 mg/Nm3.
5.1.3 Water Environment
To prevent the impact of project activities on water environment, mitigation measures that required be taken are discussed below.
Wastewater generated during construction phase from sprinkling or washing activities would contain excessive amounts of cement and other contaminants. This water will be settled and neutralized before discharge. During the construction phase the laborers will be provided with proper sanitation facilities to prevent open defecation. Wastewater generated from toilets will be treated through septic tank followed by soak pit system. Storm water drains will be constructed on site at the very beginning of construction activities to prevent mixing of surface water with other contaminants. So the overall impact on water environment during construction phase due to the proposed project will be of short term duration and insignificant.
During the operation phase, the overall effluent disposal system would comprise of:
Cooling Tower blow down will be returned to the Essar refinery which has the facility for proper treatment and disposal to the sea through a marine outfall.
Boiler blow down will be collected in guard pond and reused for gardening.
DM plant effluent to be neutralized in a pit/guard pond.
Effluents collected in guard pond will be utilized in plant washing and gardening and unutilized water will be disposed off along with cooling tower blow down.
Domestic wastewater generated from the plant will be led by closed drains to a septic tank followed by soak pit.
Storm water shall be collected through a dedicated storm water drainage network and disposed outside the plant without mixing with effluent or any other wastes.
Also a provision of rainwater harvesting will be made.
Since the water proposed to be used for cooling is sea water, the CT blow-down will be directed back to the sea. Effluent generated from the regeneration of DM plant will be collected

5-3
in Neutralization pit (NTP). The NTP will comprise of an Inlet Collection Tank, which will collect all the effluents and will facilitate the process of self-neutralization. These collection tanks will be located near the DM plant. This neutralized effluent will be used for green belt development and water sprinkling in coal storage areas and roads. Any excess water will be discharged to the sea along with the CT blow down. Effluent generated from the Cooling Tower is nothing but the blow-down water after fixed Cycles of Concentration. As water is used for cooling purposes, cooling tower effluent doesn’t require any treatment. However, at the discharge end, the pH shall be checked and corrected, if it exceeds the norms of 6.5 - 8.5, with the help of on-line acid dosing system to ensure no significant Impact on marine ecology due to discharge of wastewater form proposed plant in to the sea.
The effluents from the power plant would be treated so as to meet the regulatory requirements specified by CPCB / GPCB. As stated above, wastewater streams from the plant except cooling tower blow down will be collected in the guard pond and recycled for plant washing and gardening.
5.1.4 Noise Environment
To minimize the noise impact on nearby communities, construction schedules would be optimized to daytime working and the night activities will be scaled down. High noise generating equipments are not operated simultaneously and the operation of such equipment/activities shall be avoided during night time. Extensive earthmoving and movement of heavy equipments would be conducted only during the regular working hours in day time. Mobile Noise barriers will be placed at strategic locations in order to provide suitable barrier between the sensitive receptors. Noise and vibration impacts at construction sites will be minimized by:
• Using DG sets only at times of emergency and locating them as far as possible away from the working area.
• Fitting mufflers to road vehicles and construction equipments
• Adequate personal protective equipment like ear plugs and ear muffs shall be provided to the plant workers to reduce the effect of noise
5.1.5 Flora and Fauna
The mitigation measures in order to avoid negative impact of the proposed project activities on the flora and fauna includes suggested measures for the natural vegetation, cropping pattern, fisheries and marine life, forests and species diversity.
5.1.5.1 Natural Vegetation
The proposed project activity has green belt development plan, which is a combined green belt development plan for the entire Essar complex at Vadinar including the EOL refinery and the proposed power plant. There will not be any cutting of the trees at the site. Also there will not be any direct / untreated discharge into the natural land environment.

5-4
5.1.5.2 Crops
Since, the proposed project is on a non-agricultural land, it is not likely to alter the crop production of the area, either during the construction phase or the operation phase. Further, necessary environmental protection measures have been planned under EMP; e.g. air / water pollution control systems designed to take care of even emergency releases of the gaseous pollutants like PM, SO2, NOx and regular environmental surveillance, etc; so there shall not be any short-term or cumulative effect on the crops and the natural vegetation of the area.
5.1.5.3 Forest and species diversity
Sufficient EMP provisions will be made to restrict the emissions to a desirable level so as not to affect the biological environment of the area. Also, there is no cutting of the vegetation at and around the project site. Hence, the local floral and faunal species are not affected by the proposed project activities.
5.1.5.4 Fisheries and marine life
The treated effluent will be routed through the existing disposal mechanisms of the refinery, which is likely to cause some impact on the local biological environment of the river including fish production. However, as discussed earlier the treated effluent streams will have the effluent parameters within the prescribed norms. Hence, the fisheries and marine life will not be significantly affected.
5.1.5.5 Aesthetic Environment
The project site is a developed industrial land with good landscape. The landscaping will be further improved with the further enhancement in the green belt.
The liquid effluents shall be treated to permissible standards before discharging into the final receiving body, thereby no adverse impact in the visual water quality. During construction phase, the fugitive emissions, if controlled properly, would not create any aesthetic impact. Company has taken sufficient measures to control the fugitive emissions within the plant battery limits. Thus, impact could be nullified by the proposed project activity on the aesthetic environment if EMP measures are properly adopted.
5.1.6 Socio - Economic Impact
5.1.6.1 Employment Opportunities
During construction phase, skilled and unskilled manpower will be needed. This will temporarily increase the employment opportunity. Secondary jobs are also generated to provide day-to-day needs and services to the work force. This will also temporarily increase the demand for essential daily utilities in the local market.
The manpower requirement for proposed plant is expected to generate some permanent jobs and secondary jobs for the operation and maintenance of various project activities. This will increase the direct / indirect employment opportunities and also, the opportunities for the ancillary business development to some extent - for the local population, which is mainly dependent upon the industrial and agricultural revenue, at present.
5-5
This is expected to create a significant beneficial impact on the local socio-economic environment.
5.1.6.2 Industries
During construction of the project, the required raw material and the skilled and unskilled labor will be utilized to the fullest extent from the local area. The increasing industrial activity will boost the commercial and economical status of the locality, to some extent.
5.1.6.3 Public health
Construction labours will be provided with basic amenities like safe water supply, low cost sanitation facilities, first aid, etc. Otherwise, there could be an increase in diseases related to personal hygiene.
Emission, if uncontrolled from process and utility stacks may cause discomfort, burning of eyes to the recipients in the down wind direction. This may be caused due to the failure of control equipment / process. However, necessary precautions, which are already in place and will be utilised to take care of any such eventualities to protect the health of the people in the vicinity of the project. It is suggested to carry out continuous monitoring and surveillance program within the industry.
Hence, there will not be any significant change in the status of sanitation and the community health of the area, as sufficient measures have been detailed under the EMP.
5.1.6.4 Transportation and communication
Since, the project site is having proper linkage for the transport and communication, the development of this is not expected to cause any additional impact.
In brief, as a result of the project activities, there will be no adverse impact on sanitation, communication and community health, as sufficient measures have been proposed to be taken under the EMP. The proposed project activities are expected to make significant beneficial impact on the local socio-economic environment of the region.
5.2 Summary of Anticipated Environmental Impacts and Mitigation
The summary of anticipated adverse environmental impacts and mitigation measures are given in the Table- 5.1.

5-6
Table-5.1: Anticipated Adverse Environmental Impacts and Mitigation
Discipline Potential Negative Impacts
Probable Source Mitigative Measures Remarks
Construction Phase Water Quality Increase in suspended
solids due to soil run-off during heavy precipitation
Soil Erosion Temporary sedimentation Tank -Seasonal, temporary and low impacts owing to less rainfall in the study area, and porous soil.
Air Quality Increase in dust load and Nox concentration
Vehicular movement
Regular sprinkling of water in the construction area.
The impact will be low, as the main approach road will be tarred.
Noise Increase in noise level Construction equipment.
Equipment will be kept in good condition to keep the noise level.
Workers will be provided necessary protective equipment e.g. ear plug, earmuffs.
Terrestrial Ecology
Clearing of Vegetation -- Plantation will be further developed in the plant premises
Low impacts owing to industrial land and no rare species on the site.-
Socio-economics
No displacement of population
Land Acquisition
-- No impacts owing to the land already in possession of ESSAR.
Operation Phase Water Quality Deterioration of water
quality of surface water (Sea)
Discharge of cooling tower blow down
Adequate treatment facilities having on-line acid dosing system for auto pH correction for cooling tower blow-down will be provided so that the treated effluents confirm to the regulatory standards. Sewage effluent shall be treated in septic tank and the over flow is used in horticulture and water sprinkling.
Cooling tower effluent will be discharged into the sea only after treatment. Analysis of all relevant parameters in the effluent is included in the monitoring programme.
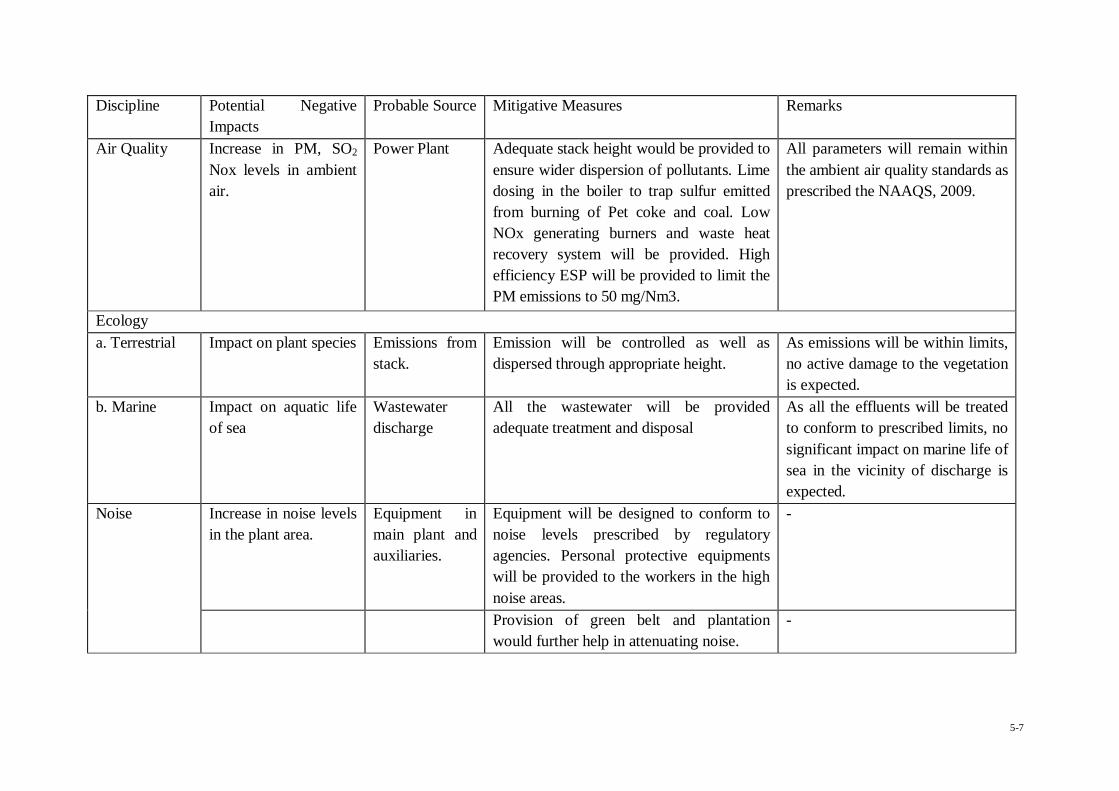
5-7
Discipline Potential Negative Impacts
Probable Source Mitigative Measures Remarks
Air Quality Increase in PM, SO2 Nox levels in ambient air.
Power Plant
Adequate stack height would be provided to ensure wider dispersion of pollutants. Lime dosing in the boiler to trap sulfur emitted from burning of Pet coke and coal. Low NOx generating burners and waste heat recovery system will be provided. High efficiency ESP will be provided to limit the PM emissions to 50 mg/Nm3.
All parameters will remain within the ambient air quality standards as prescribed the NAAQS, 2009.
Ecology a. Terrestrial Impact on plant species Emissions from
stack. Emission will be controlled as well as dispersed through appropriate height.
As emissions will be within limits, no active damage to the vegetation is expected.
b. Marine Impact on aquatic life of sea
Wastewater discharge
All the wastewater will be provided adequate treatment and disposal
As all the effluents will be treated to conform to prescribed limits, no significant impact on marine life of sea in the vicinity of discharge is expected.
Noise Increase in noise levels in the plant area.
Equipment in main plant and auxiliaries.
Equipment will be designed to conform to noise levels prescribed by regulatory agencies. Personal protective equipments will be provided to the workers in the high noise areas.
-
Provision of green belt and plantation would further help in attenuating noise.
-

5-8
5.3 Environment Management Plan and Recommendations
5.3.1 Management during Construction Phase
The impacts during the construction phase on the environment would be basically of transient nature and are expected to reduce gradually on completion of the construction activities. In order to mitigate them, following measures are proposed.
RECOMMENDATIONS
• Designation and demarcation of sites for construction camps and ensuring due provision of necessary infrastructure facilities.
• During excavation and transportation over unmated roads near the proposed plant site, there is a scope for local dust emissions. Frequent water sprinkling in the vicinity of the construction activity should be done.
• Since there is likelihood of fugitive emission from the construction activity, material handling and from the truck movement in the premises of the proposed plant, the industry should go for extensive tree plantation program along the boundaries of the proposed plant site.
• The construction site should be provided with sufficient and suitable toilet facilities for workers to allow proper standards of hygiene. These facilities would be connected to a septic tank and maintained to ensure minimum environmental impact.
• Though the noise effect on the nearest inhabitants due to construction activity will be negligible it is advisable that on site workers using high noise equipment adopt noise protection devices.
• It should be ensured that both gasoline and diesel powered construction vehicles are properly maintained to minimize smoke in the exhaust emissions. The vehicle maintenance area should be located in such a manner to prevent contamination of surface and ground water sources by accidental spillage of oil. Unauthorized dumping of waste oil should be prohibited.
• As soon as construction is over the surplus earth should be utilized to fill up low-lying areas, the rubbish should be cleared and all un-built surfaces reinstated. Appropriate vegetation should be planned and all such areas should be landscaped. Hazardous materials (e.g. acids, paints, explosives) should be stored in proper and designated areas.
5.3.2 Management during the Operation Phase
5.3.2.1 Water Pollution Management
The main sources of water pollution during operation of the project would be:
Boiler : Boiler blow-down
Cooling System : Cooling water blow-down

5-9
DM Plant : Regeneration effluent
The wastewater will be originating from Boiler, Cooling system, Plant service water system, Filter backwash, D.M. plant regeneration water and Sanitary effluents from Plant. Following effluent treatment and disposal systems are proposed to be installed:
• Minimize quantity of effluents through reuse to the extent possible;
• Treatment of DM plant waste through neutralization;
• Provision of on line acid dosing system to correct the pH of cooling water blow down.
The details of treatment to effluent from the proposed plant have been discussed in Chapter-2. The proposed waste management schemes are given in Table-5.2.
Table - 5.2 Waste Management at Proposed Power plant
Type of Waste Significant Parameters
Treatment Proposed
Cooling water Blow down
pH On-line acid dosing system to be provided to correct the pH and disposal in sea.
Demineralization Plant Waste
pH (4 to 10)
pH Neutralization to be provided by mixing with other effluents in the channel.
Filter Backwash Suspended Solids This will be routed to clarifier. The overflow after settling will be discharged to sea.
Domestic wastewater BOD TSS
Sewage effluent will be treated in the Septic tank – soak pit system and overflow from the same will be discharged to sea.
Effluent monitoring instruments namely pH meter, flow meter, etc., should be provided in the effluent discharge line. Flow integrators should be provided both at the plant intake and discharge point. Apart from the proposed treatment schemes, some additional measures are given hereunder:
RECOMMENDATIONS
• Minimize quantity of effluents through reuse to the maximum extent possible;
• Treatment schemes proposed should be constructed before the commissioning of the plant;
• Clarifier should be cleaned regularly in order to avoid clogging and sufficient time should be given for proper settling of solids;
• Treatment units should be operated regularly;

5-10
• Daily effluent samples should be collected, analyzed and recorded in logbook from the inlet and outlet of the treatment plants to ascertain the efficiency of the treatment plants and to meet the statutory requirements.
5.3.2.2 Air Pollution Management
SPM, NOx and SO2 is the main pollutant. Tall chimney of 275 m height will be provided. Low NOx burners and waste heat recovery system to be provided. The stack height shall be arrived at after taking into consideration of the guidelines of MoEF. The air pollution control measures proposed for the project are described below:
RECOMMENDATIONS:
• 275 m tall stacks should be provided to ensure wider dispersion of pollutants.
• Green belt development in and around the plant should be undertaken.
• Low Nox burners should be installed prior to commissioning of the plant.
• Waste heat recovery system should be installed to utilize the waste heat and improve the yield and also to reduce NOx concentration.
• Monitoring of stack emissions for PM, SO2 & NOx should be carried out twice in a month to meet the statutory requirements. Online Stack Analyzers should to be installed to monitor SO2 & NOx.
• All the internal roads should be asphalted to reduce the fugitive dust due to truck movement.
5.3.2.3 Solid Waste Management
The details of solid waste and hazardous waste generated from the proposed plant is given in Table -2.11.
5.3.2.5 Noise Level Management
The predominant noise levels will be confined to the work zones in the plant. The noise levels at all the sources will not exceed 75 dBA. The Leq for eight hours will be within the prescribed limits. Community noise levels are not likely to be affected because of the proposed vegetation and attenuation due to the physical barriers.
RECOMMENDATIONS:
• The use of damping materials such as thin rubber/lead sheet for wrapping the work places like turbine halls, compressor rooms, DG set, etc;
• Shock absorbing techniques should be adopted to reduce impact;
• Efficient flow techniques for noise associated with high fluid velocities and turbulence should be used like reduction in noise generated by control levels in both gas and liquid systems achieved by reducing system pressure to as low as possible;
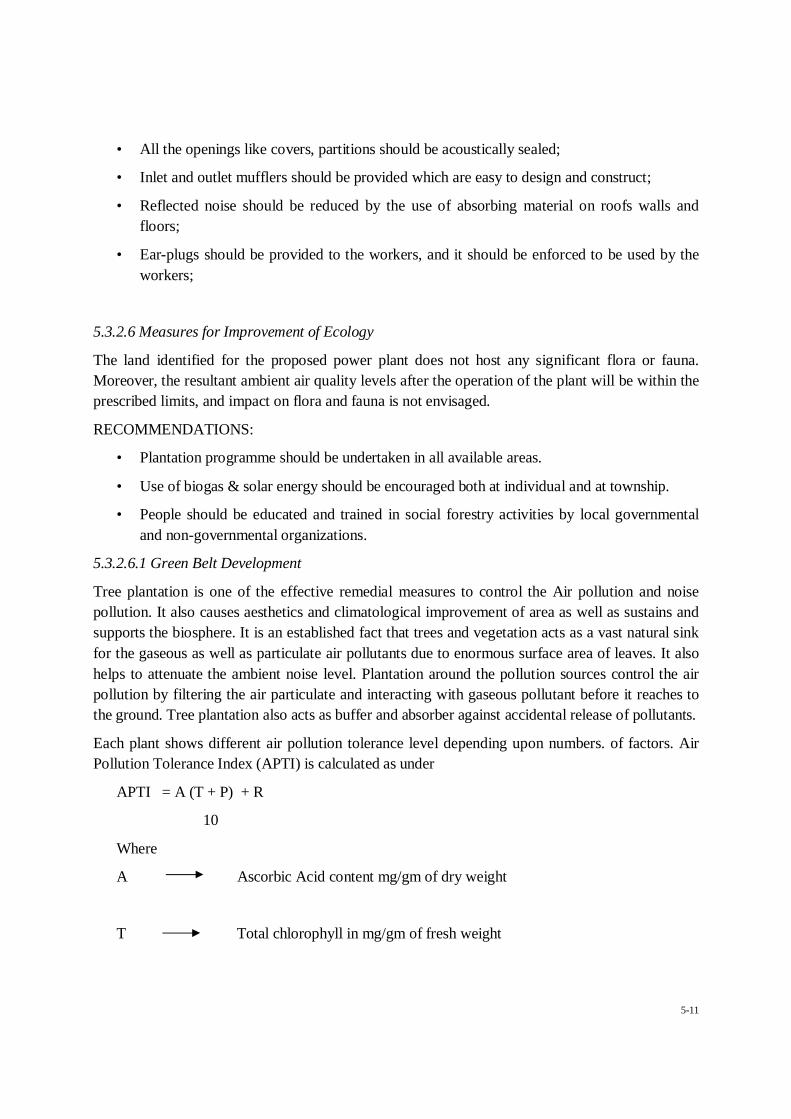
5-11
• All the openings like covers, partitions should be acoustically sealed;
• Inlet and outlet mufflers should be provided which are easy to design and construct;
• Reflected noise should be reduced by the use of absorbing material on roofs walls and floors;
• Ear-plugs should be provided to the workers, and it should be enforced to be used by the workers;
5.3.2.6 Measures for Improvement of Ecology
The land identified for the proposed power plant does not host any significant flora or fauna. Moreover, the resultant ambient air quality levels after the operation of the plant will be within the prescribed limits, and impact on flora and fauna is not envisaged.
RECOMMENDATIONS:
• Plantation programme should be undertaken in all available areas.
• Use of biogas & solar energy should be encouraged both at individual and at township.
• People should be educated and trained in social forestry activities by local governmental and non-governmental organizations.
5.3.2.6.1 Green Belt Development
Tree plantation is one of the effective remedial measures to control the Air pollution and noise pollution. It also causes aesthetics and climatological improvement of area as well as sustains and supports the biosphere. It is an established fact that trees and vegetation acts as a vast natural sink for the gaseous as well as particulate air pollutants due to enormous surface area of leaves. It also helps to attenuate the ambient noise level. Plantation around the pollution sources control the air pollution by filtering the air particulate and interacting with gaseous pollutant before it reaches to the ground. Tree plantation also acts as buffer and absorber against accidental release of pollutants.
Each plant shows different air pollution tolerance level depending upon numbers. of factors. Air Pollution Tolerance Index (APTI) is calculated as under
APTI = A (T + P) + R
10
Where
A Ascorbic Acid content mg/gm of dry weight
T Total chlorophyll in mg/gm of fresh weight
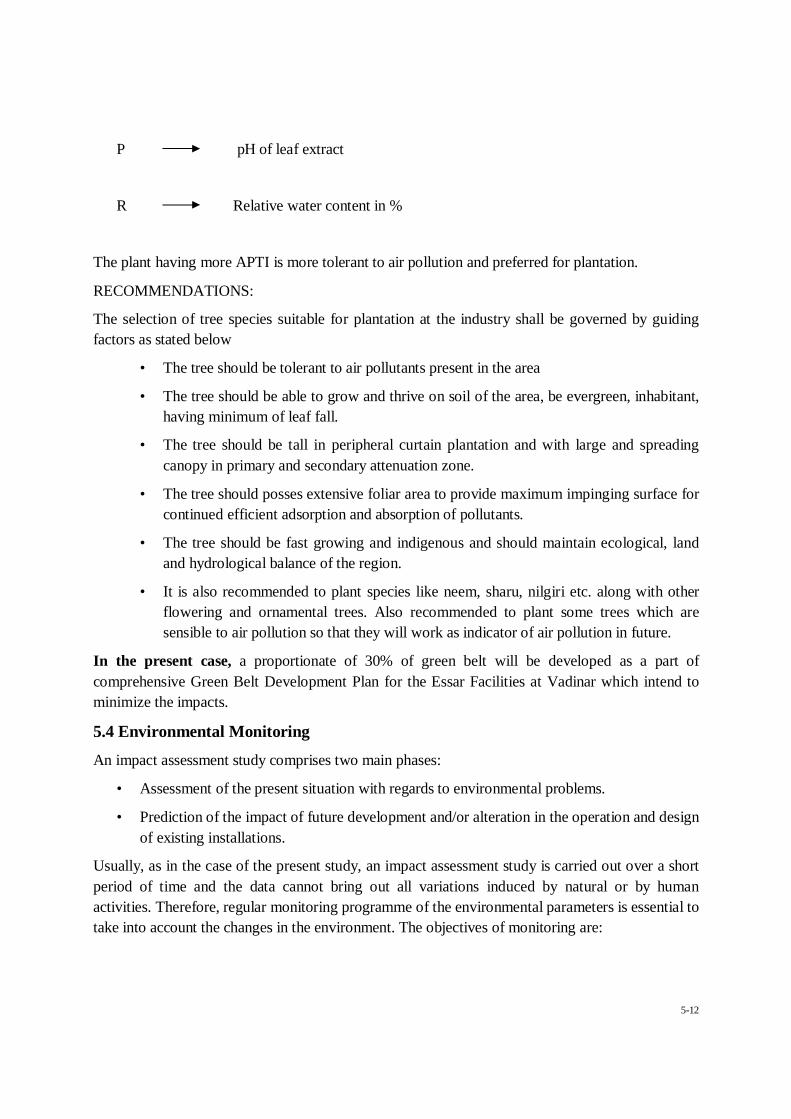
5-12
P pH of leaf extract
R Relative water content in %
The plant having more APTI is more tolerant to air pollution and preferred for plantation.
RECOMMENDATIONS:
The selection of tree species suitable for plantation at the industry shall be governed by guiding factors as stated below
• The tree should be tolerant to air pollutants present in the area
• The tree should be able to grow and thrive on soil of the area, be evergreen, inhabitant, having minimum of leaf fall.
• The tree should be tall in peripheral curtain plantation and with large and spreading canopy in primary and secondary attenuation zone.
• The tree should posses extensive foliar area to provide maximum impinging surface for continued efficient adsorption and absorption of pollutants.
• The tree should be fast growing and indigenous and should maintain ecological, land and hydrological balance of the region.
• It is also recommended to plant species like neem, sharu, nilgiri etc. along with other flowering and ornamental trees. Also recommended to plant some trees which are sensible to air pollution so that they will work as indicator of air pollution in future.
In the present case, a proportionate of 30% of green belt will be developed as a part of comprehensive Green Belt Development Plan for the Essar Facilities at Vadinar which intend to minimize the impacts.
5.4 Environmental Monitoring
An impact assessment study comprises two main phases:
• Assessment of the present situation with regards to environmental problems.
• Prediction of the impact of future development and/or alteration in the operation and design of existing installations.
Usually, as in the case of the present study, an impact assessment study is carried out over a short period of time and the data cannot bring out all variations induced by natural or by human activities. Therefore, regular monitoring programme of the environmental parameters is essential to take into account the changes in the environment. The objectives of monitoring are:

5-13
• To verify the results of the impact assessment study in particular with regards to new development.
• To follow the trend of parameters which have been identified as critical.
• To check or assess the efficiency of the controlling measures.
• To ensure that new parameters, other than those identified in the impact assessment study, do not become critical through the commissioning of new installations or through the modification in the operation of existing facilities.
• To check assumption made with regard to the development and to detect deviations in order to initiate necessary measures; and
• To establish a data base for future Impact Assessment Studies for new projects.
The attributes, which merit regular monitoring, are specified underneath:
1) Air quality
2) Water and waste water quality
3) Noise levels
4) Ecological preservation and afforestation
5) Socio-Economic aspects
The post project monitoring to be carried out at the industry level is discussed below.
5.5 Monitoring and Reporting Procedure
Regular monitoring of important and crucial environmental parameters is of immense importance to assess the status of environment during plant operation. With the knowledge of baseline conditions, the monitoring programme can serve as an indicator for any deterioration in environmental conditions due to operation of the plant and suitable mitigatory steps could be taken in time to safeguard the environment. Monitoring is as important as that of control of pollution since the efficacy of control measures can only be determined by monitoring. The following routine monitoring programme would therefore be implemented. A comprehensive monitoring programme is suggested underneath. Environmental attributes should be monitored as given below:
Air Pollution and Meteorological Aspects
Both ambient air quality and stack emissions would be monitored. Whereas it is proposed to undertake regular monitoring of SPM, SO2 & NOx emissions once in a week, the ambient air would be monitored once in a week [In line with the guidelines of Central Pollution Control Board]

5-14
Water and Wastewater Quality
All the effluents emanating from the plant should be monitored daily for physico-chemical characteristics. Heavy metals would be monitored on a quarterly basis. It is proposed to monitor the physical and chemical parameters in the effluents as per Table-5.3.
Noise Levels
Noise levels in the work zone environment Turbo generator and compressors shall be monitored once in three month in the work zone. Similarly, ambient noise levels at three locations will be monitored on a monthly basis. The environmental monitoring cell will co-ordinate all monitoring programmes at site and data, thus generated data shall be regularly furnished to the State regulatory agencies. Locations and frequency of monitoring are tabulated in Table-5.3.
Table-5.3 Monitoring Schedule for Environmental Parameters
Sr. No.
Particulars Monitoring Frequency
Duration of Sampling
Important Monitoring Parameters
1. Air Pollution & Meteorology Air Quality A Stack Monitoring 1 Stack attached to plants once in a
week 30 min. PM, SO2, NOx
B Ambient Air Quality Monitoring Locations specified by the
GPCB. once in a week
24 hours continuously
SPM, RSPM, SO2, NOx,
C Meteorology a Meteorological data to be
monitored at the proposed plant.
Daily Continuous Monitoring
Wind speed & direction, temperature, relative humidity, rainfall.
2. Water and Wastewater Quality a. Industrial/Domestic 1. Effluent Drain Daily Grab As per EPA
Rules b. Water quality in the study area: Surface water:
1) At the point of effluent discharge & other 5 locations identified by GPCB.
Once in a month and heavy metals which will be monitored quarterly
Grab
Parameters as per requirements
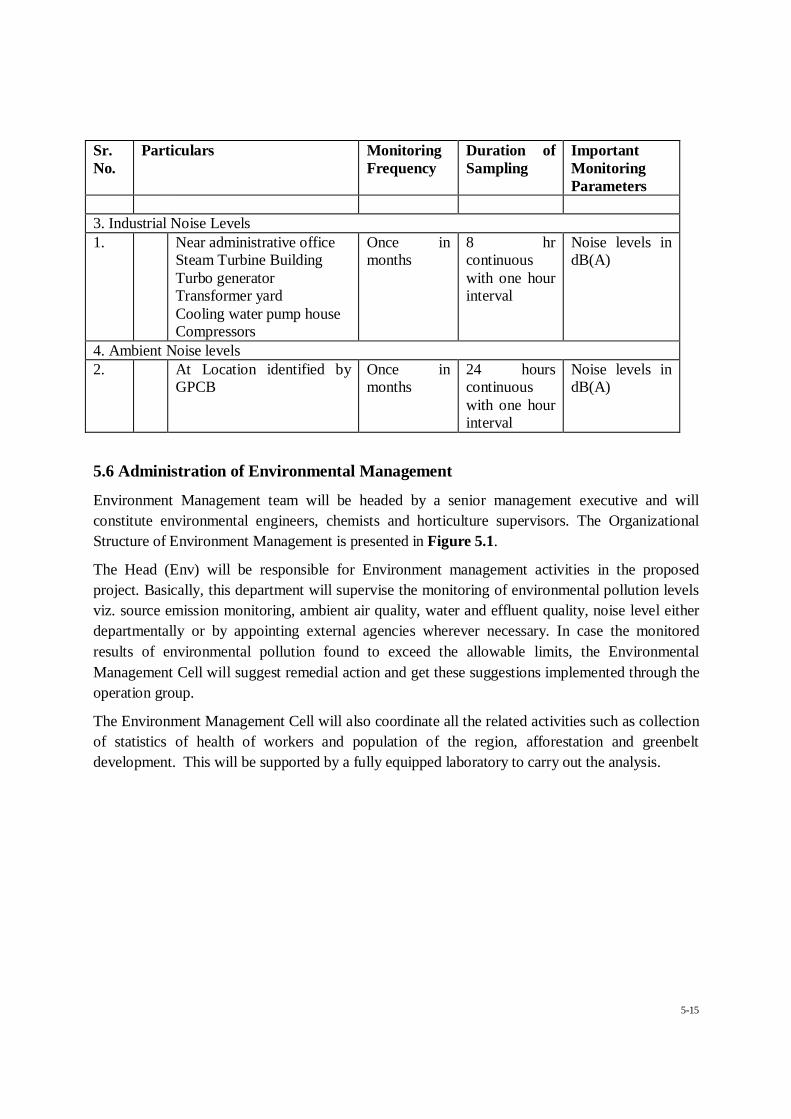
5-15
Sr. No.
Particulars Monitoring Frequency
Duration of Sampling
Important Monitoring Parameters
3. Industrial Noise Levels 1. Near administrative office
Steam Turbine Building Turbo generator Transformer yard Cooling water pump house Compressors
Once in months
8 hr continuous with one hour interval
Noise levels in dB(A)
4. Ambient Noise levels 2. At Location identified by
GPCB Once in months
24 hours continuous with one hour interval
Noise levels in dB(A)
5.6 Administration of Environmental Management
Environment Management team will be headed by a senior management executive and will constitute environmental engineers, chemists and horticulture supervisors. The Organizational Structure of Environment Management is presented in Figure 5.1.
The Head (Env) will be responsible for Environment management activities in the proposed project. Basically, this department will supervise the monitoring of environmental pollution levels viz. source emission monitoring, ambient air quality, water and effluent quality, noise level either departmentally or by appointing external agencies wherever necessary. In case the monitored results of environmental pollution found to exceed the allowable limits, the Environmental Management Cell will suggest remedial action and get these suggestions implemented through the operation group.
The Environment Management Cell will also coordinate all the related activities such as collection of statistics of health of workers and population of the region, afforestation and greenbelt development. This will be supported by a fully equipped laboratory to carry out the analysis.
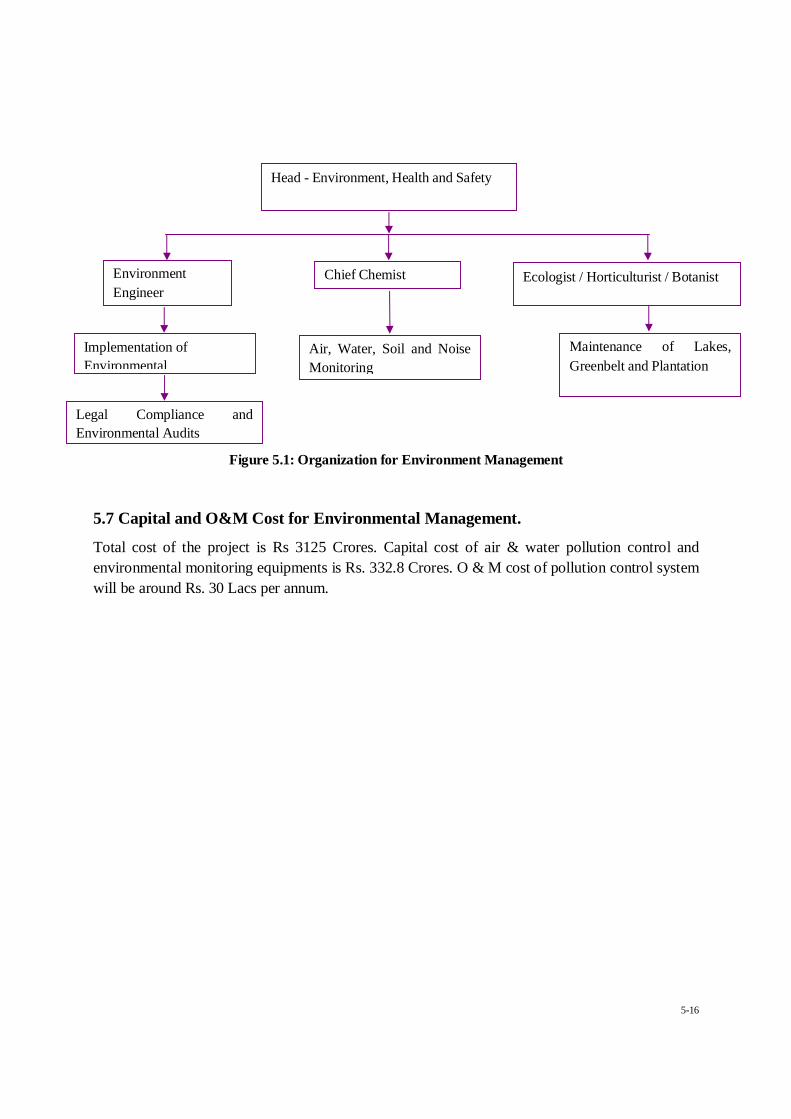
5-16
Figure 5.1: Organization for Environment Management
5.7 Capital and O&M Cost for Environmental Management.
Total cost of the project is Rs 3125 Crores. Capital cost of air & water pollution control and environmental monitoring equipments is Rs. 332.8 Crores. O & M cost of pollution control system will be around Rs. 30 Lacs per annum.
Head - Environment, Health and Safety
Chief Chemist Environment Engineer
Ecologist / Horticulturist / Botanist
Implementation of Environmental
Air, Water, Soil and Noise Monitoring
Maintenance of Lakes, Greenbelt and Plantation
Legal Compliance and Environmental Audits

CHAPTER - 6
ANALYSIS OF
ALTERNATIVES TECHNOLOGY & SITES

6-1
Setting up of a Pet Coke/coal based thermal power plant project involves project justification and techno-economic analysis of various alternatives available for distance from raw materials source, power generation & evacuation and pollution control measures. Therefore an attempt has been made to pick the techno-economically optimum option available for the inputs and power plant components. This section summarizes the study of analysis of various alternatives considered.
6.1 Analysis for Alternative Technology
The selection of equipment and systems for the plant has to be based on their suitability for the type of fuel proposed for the plant as well as on track records of these equipment /systems, etc. for the intended purpose. Selection of technology and equipment for proposed power project has been done with these considerations.
The proposed power generating units will be of sub critical steam parameters with Circulating Fluidised Bed Combustion (CFBC) technology.
Fluidized bed combustion is a “Clean Technology for a better tomorrow” where technology and economy have been interwoven harmoniously in quest of a better environment. The environmentally friendly perspectives of this technology are as follows:
At the low combustion temperature of 800°C / 850°C, no Nitrogen Oxides result from the nitrogen in the combustion air, with the end result of extremely low NOx emissions even with fuels rich in Nitrogen
Formation of SO2 is essentially prevented by the addition of limestone and / or selecting suitably to meet the CPCB norms. This is both mixed into the fuel and blown into the combustion chamber. Due to the favourable conditions in the fluidized bed, about 85% of the resulting Sulphur Oxides can be removed. Balance 15 % will be taken care of through suitable Stack height as per formula of Central Pollution Control Board. In the instant case Sulphur content being less i.e. within 0.5% in fuel, no lime stone feeding has been envisaged. About 100 % SO2 effect will be nullified by Stack height only.
Broad selection of primary fuel is possible; even combination of low gross calorific value (GCV) fuels can be used in adequate proportion so that minimum average GCV does not fall below 2500 Kcal / Kg.
Better Plant flexibility at partial loads of about 25% and quick load changes
Sectionalized bed of CFBC Boilers will render operational flexibility for output steam flow generation, thereby CFBC Boiler would be semi-outdoor type, natural circulation, balanced draft designed for firing different grades of coal.
6.1.1 Fuel Alternatives
The pet coke/coal was preferred for the proposed project because of the following reasons.
Petroleum coke that shall be sourced from the refinery complex by conveyors near to proposed project site.

6-2
Imported coal which will be unloaded from ships at the new jetty to be constructed on the Salaya creek, Jamnagar
Close proximity of other raw materials sources.
6.2 Site alternatives
During the Terms of Reference (TOR) meeting held on 7-8th March 2011 at New Delhi, the thermal power plant committee noted that the project proponent has not identified alternatives sites as required and they have come with only single site. It was therefore decided that other acceptable alternative sites shall be first identified and presented. Accordingly the proposal was deferred for re-consideration at a later stage. Based on the recommendations of the EAC – Thermal, the important criteria for selection of suitable alternate sites to set-up the proposed power project were identified and several perspective sites evaluated. This report provides details of the alternative sites examined before arriving at site within the EOL, of Essar Vadinar.
6.2.1 Site Selection Criteria
Selecting a proper site for a coal based (Pet-coke + imported coal) thermal power plant is vital for its long term efficiency, economic viability, optimum use of available resources etc. It may not be possible to have all desirable requirements at a single site but at least the location should contain an optimum mix of the requirements for setting up of a thermal power plant since the amount of generated energy, power plant’s productivity, cost of power generation and transmission (loss of energy), are closely linked with the required facilities that the perspective sites offer.
To set-up a green-field project of the size under consideration, the most important parameters for site selection are the following:
Land availability and topography.
Source of Pet-coke and limestone in the vicinity
Economical availability of imported coal
Source of cooling water and other requirements
Power evacuation
Based on the environmental and economic considerations, the perspective sites in the vicinity of the refinery of the Essar Oil Limited (EOL) are assessed in this report:
6.2.1.1 Environmental Considerations:
Reduction in air pollution and road congestion associated with extended road transport.
Use of available infrastructure for supply of cooling water thereby minimizing environmental impact associated with creation of new facilities.
Availability of less productive / waste land with minimum R & R issues and low vegetation cover.

6-3
6.2.1.2 Economic Considerations
Close to the source of supply of Pet-coke.
Availability of suitable port in the vicinity for the import of coal.
Availability of water for cooling from existing sources.
6.2.1.3 Land Availability and Topography:
The green-field site required for this project is estimated at 77 ha. The selected site should meet the requirements listed below:
Must be in the vicinity of the source of Pet-coke.
Must be in the close vicinity of the coast to enable transfer of coal imported via the sea route to the plant.
Suitable source of cooling water requirement, nearby.
As far as possible classified as waste land or less productive agricultural land with low vegetation cover.
Topography of the land should be flat as high elevation has a negative effect on production efficiency of turbines. In addition, changing of a slopping area into a flat terrain for the construction of power plant increases the project cost and environmental impacts.
Should be generally free from R&R issues.
Should be sufficiently away from urban centres.
Should have suitable access to transport plant equipment and construction machinery and materials with ease.
Should be at safe distance from permanent and seasonal rivers and flood ways.
6.2.1.4 Pet-coke and Limestone Sources
Pet-coke is the major fuel that will be required for the proposed power plant and its requirement is estimated at about 1.1 MMTPA. The Pet-coke will be sourced from the Essar Refinery that is located at Vadinar. For environmental as well as economic reasons it is appropriate to transfer Pet coke via conveyor or by short truck trips for which the proposed site should be in the vicinity of the Refinery.
Limestone estimated at 0.36 MMTPA will be required to reduce SOx emissions. Hence, source of limestone in the vicinity of the project site will be an added advantage.
6.2.1.5 Coal Import Facilities:
The annual requirement of imported coal is estimated at approximately 0.2 MMTPA. The coal can be imported at the nearest coal handling port such as Bedi & Sikka and transported via road or coal conveyor.
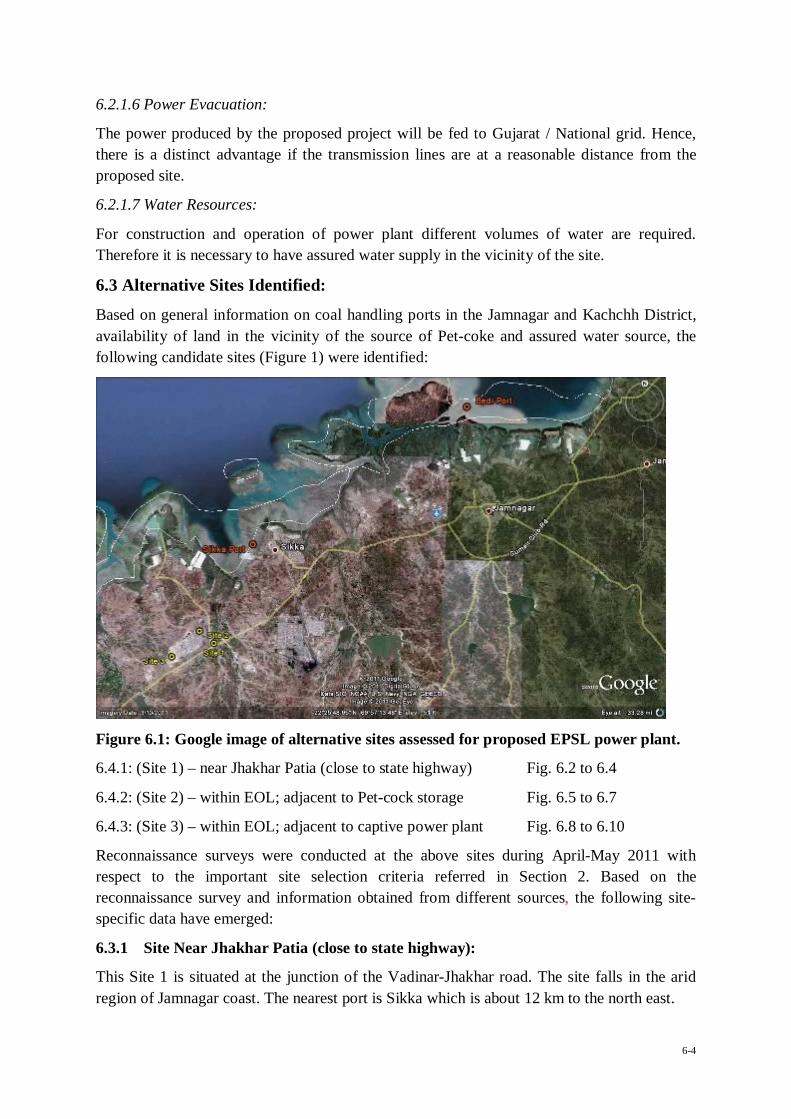
6-4
6.2.1.6 Power Evacuation:
The power produced by the proposed project will be fed to Gujarat / National grid. Hence, there is a distinct advantage if the transmission lines are at a reasonable distance from the proposed site.
6.2.1.7 Water Resources:
For construction and operation of power plant different volumes of water are required. Therefore it is necessary to have assured water supply in the vicinity of the site.
6.3 Alternative Sites Identified:
Based on general information on coal handling ports in the Jamnagar and Kachchh District, availability of land in the vicinity of the source of Pet-coke and assured water source, the following candidate sites (Figure 1) were identified:
Figure 6.1: Google image of alternative sites assessed for proposed EPSL power plant.
6.4.1: (Site 1) – near Jhakhar Patia (close to state highway) Fig. 6.2 to 6.4
6.4.2: (Site 2) – within EOL; adjacent to Pet-cock storage Fig. 6.5 to 6.7
6.4.3: (Site 3) – within EOL; adjacent to captive power plant Fig. 6.8 to 6.10
Reconnaissance surveys were conducted at the above sites during April-May 2011 with respect to the important site selection criteria referred in Section 2. Based on the reconnaissance survey and information obtained from different sources, the following site-specific data have emerged:
6.3.1 Site Near Jhakhar Patia (close to state highway):
This Site 1 is situated at the junction of the Vadinar-Jhakhar road. The site falls in the arid region of Jamnagar coast. The nearest port is Sikka which is about 12 km to the north east.
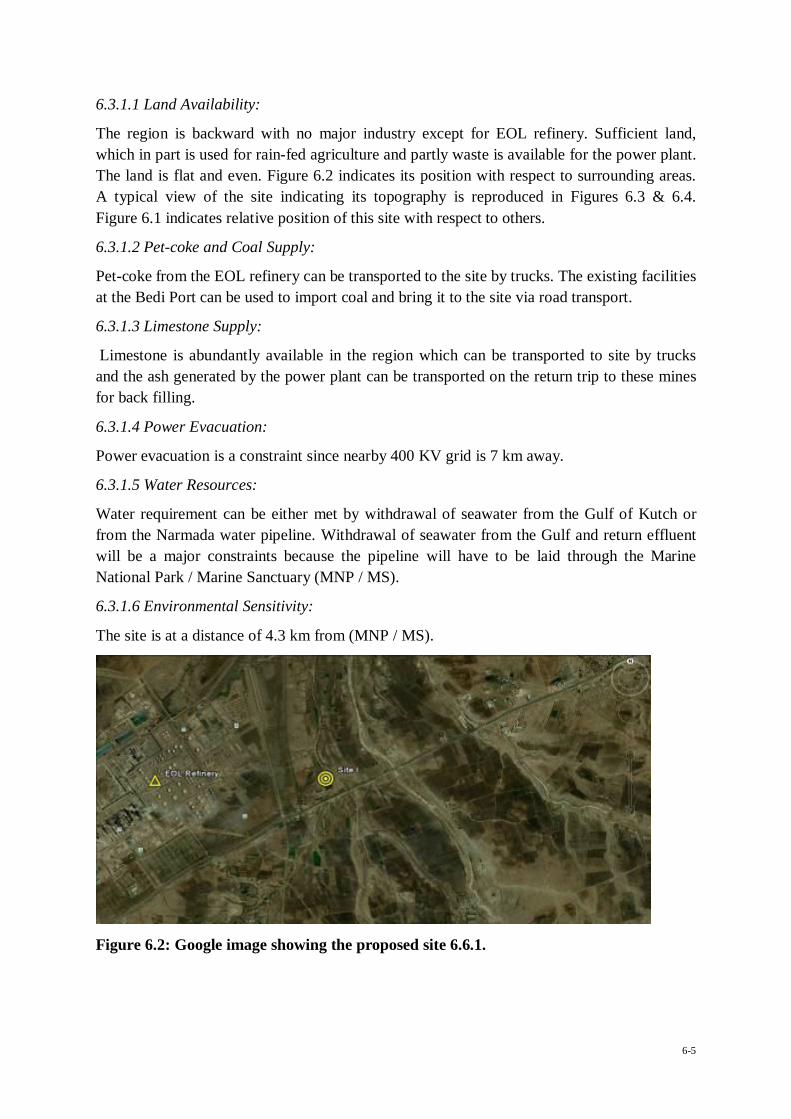
6-5
6.3.1.1 Land Availability:
The region is backward with no major industry except for EOL refinery. Sufficient land, which in part is used for rain-fed agriculture and partly waste is available for the power plant. The land is flat and even. Figure 6.2 indicates its position with respect to surrounding areas. A typical view of the site indicating its topography is reproduced in Figures 6.3 & 6.4. Figure 6.1 indicates relative position of this site with respect to others.
6.3.1.2 Pet-coke and Coal Supply:
Pet-coke from the EOL refinery can be transported to the site by trucks. The existing facilities at the Bedi Port can be used to import coal and bring it to the site via road transport.
6.3.1.3 Limestone Supply:
Limestone is abundantly available in the region which can be transported to site by trucks and the ash generated by the power plant can be transported on the return trip to these mines for back filling.
6.3.1.4 Power Evacuation:
Power evacuation is a constraint since nearby 400 KV grid is 7 km away.
6.3.1.5 Water Resources:
Water requirement can be either met by withdrawal of seawater from the Gulf of Kutch or from the Narmada water pipeline. Withdrawal of seawater from the Gulf and return effluent will be a major constraints because the pipeline will have to be laid through the Marine National Park / Marine Sanctuary (MNP / MS).
6.3.1.6 Environmental Sensitivity:
The site is at a distance of 4.3 km from (MNP / MS).
Figure 6.2: Google image showing the proposed site 6.6.1.
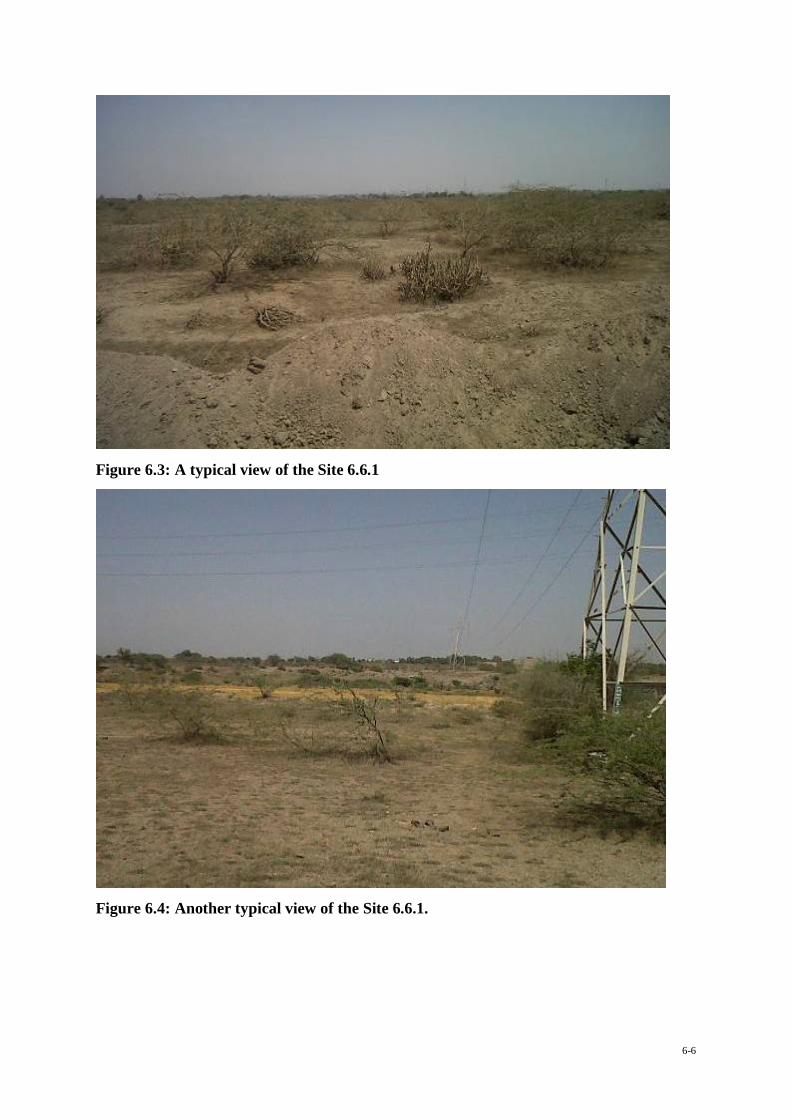
6-6
Figure 6.3: A typical view of the Site 6.6.1
Figure 6.4: Another typical view of the Site 6.6.1.
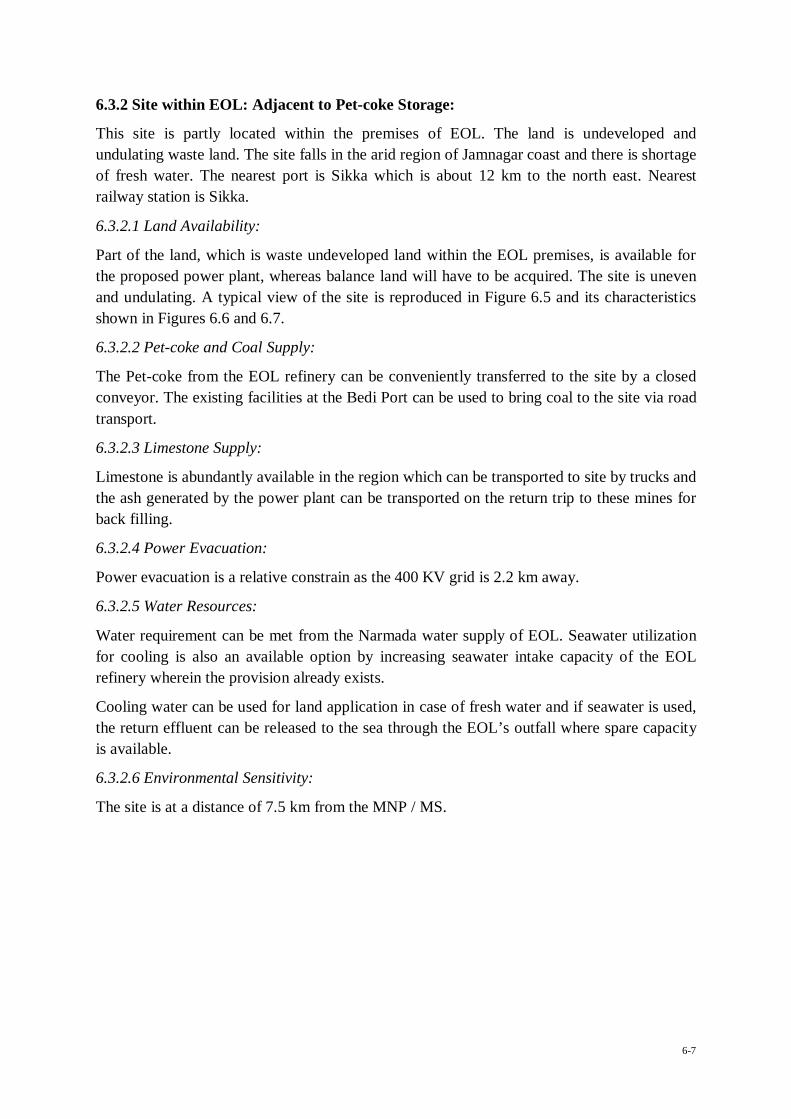
6-7
6.3.2 Site within EOL: Adjacent to Pet-coke Storage:
This site is partly located within the premises of EOL. The land is undeveloped and undulating waste land. The site falls in the arid region of Jamnagar coast and there is shortage of fresh water. The nearest port is Sikka which is about 12 km to the north east. Nearest railway station is Sikka.
6.3.2.1 Land Availability:
Part of the land, which is waste undeveloped land within the EOL premises, is available for the proposed power plant, whereas balance land will have to be acquired. The site is uneven and undulating. A typical view of the site is reproduced in Figure 6.5 and its characteristics shown in Figures 6.6 and 6.7.
6.3.2.2 Pet-coke and Coal Supply:
The Pet-coke from the EOL refinery can be conveniently transferred to the site by a closed conveyor. The existing facilities at the Bedi Port can be used to bring coal to the site via road transport.
6.3.2.3 Limestone Supply:
Limestone is abundantly available in the region which can be transported to site by trucks and the ash generated by the power plant can be transported on the return trip to these mines for back filling.
6.3.2.4 Power Evacuation:
Power evacuation is a relative constrain as the 400 KV grid is 2.2 km away.
6.3.2.5 Water Resources:
Water requirement can be met from the Narmada water supply of EOL. Seawater utilization for cooling is also an available option by increasing seawater intake capacity of the EOL refinery wherein the provision already exists.
Cooling water can be used for land application in case of fresh water and if seawater is used, the return effluent can be released to the sea through the EOL’s outfall where spare capacity is available.
6.3.2.6 Environmental Sensitivity:
The site is at a distance of 7.5 km from the MNP / MS.

6-8
Figure 6.5: Google image showing the proposed Site 6.6.2.
Figure 6.6: A typical view of the Site 6.6.2.
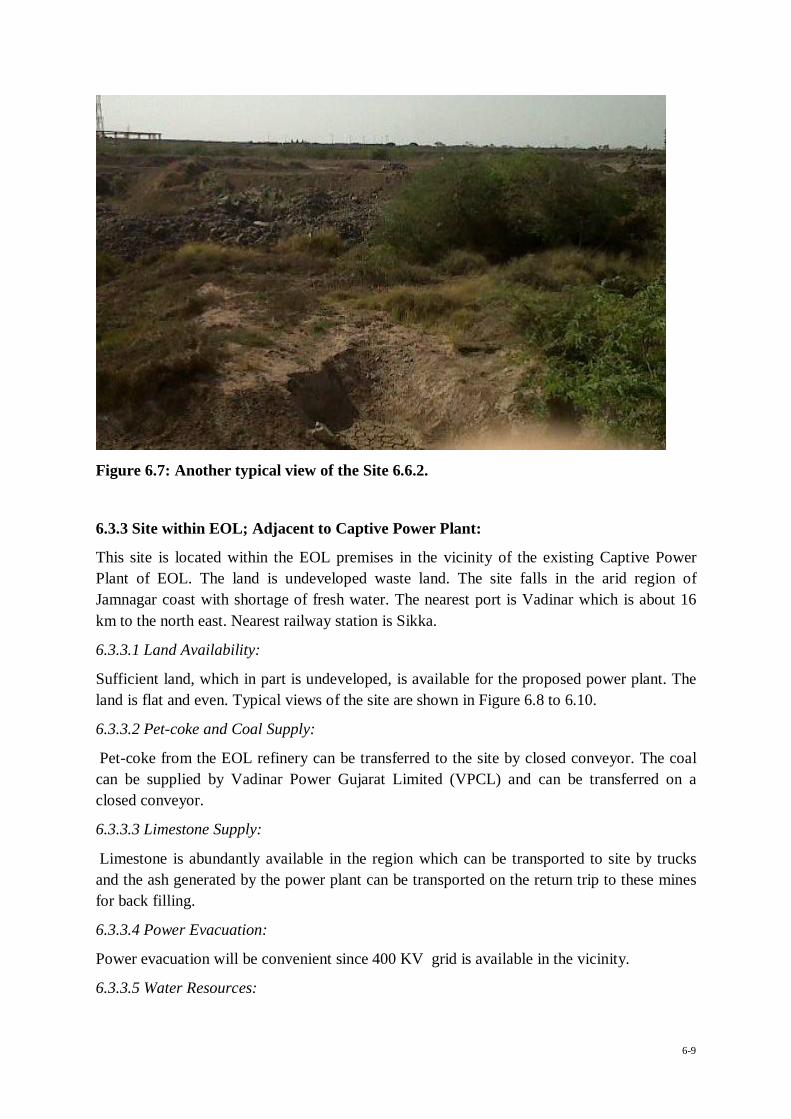
6-9
Figure 6.7: Another typical view of the Site 6.6.2.
6.3.3 Site within EOL; Adjacent to Captive Power Plant:
This site is located within the EOL premises in the vicinity of the existing Captive Power Plant of EOL. The land is undeveloped waste land. The site falls in the arid region of Jamnagar coast with shortage of fresh water. The nearest port is Vadinar which is about 16 km to the north east. Nearest railway station is Sikka.
6.3.3.1 Land Availability:
Sufficient land, which in part is undeveloped, is available for the proposed power plant. The land is flat and even. Typical views of the site are shown in Figure 6.8 to 6.10.
6.3.3.2 Pet-coke and Coal Supply:
Pet-coke from the EOL refinery can be transferred to the site by closed conveyor. The coal can be supplied by Vadinar Power Gujarat Limited (VPCL) and can be transferred on a closed conveyor.
6.3.3.3 Limestone Supply:
Limestone is abundantly available in the region which can be transported to site by trucks and the ash generated by the power plant can be transported on the return trip to these mines for back filling.
6.3.3.4 Power Evacuation:
Power evacuation will be convenient since 400 KV grid is available in the vicinity.
6.3.3.5 Water Resources:

6-10
Water requirement can be met from the Narmada water supply of EOL. Seawater utilization for cooling is also an available option by increasing seawater intake capacity of the EOL refinery.
Cooling water can be used for land application in case of fresh water and if seawater is used, the return effluent can be released through the EOL’s marine outfall where spare capacity is available.
6.3.3.6 Environmental Sensitivity:
The distance of this site from the MNP / MS is 7.5 km.
Figure 6.8: Google image showing the proposed Site 6.6.3.
Figure 6.9: A typical view of the Site 6.6.3.
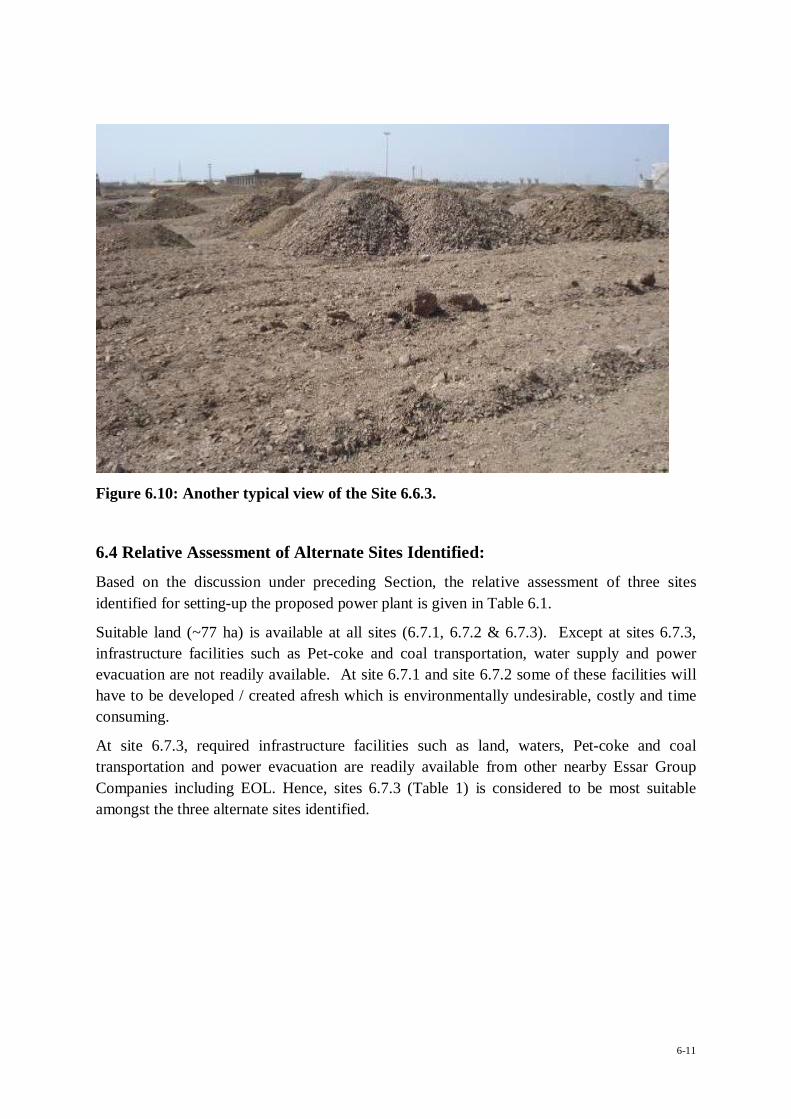
6-11
Figure 6.10: Another typical view of the Site 6.6.3.
6.4 Relative Assessment of Alternate Sites Identified:
Based on the discussion under preceding Section, the relative assessment of three sites identified for setting-up the proposed power plant is given in Table 6.1.
Suitable land (~77 ha) is available at all sites (6.7.1, 6.7.2 & 6.7.3). Except at sites 6.7.3, infrastructure facilities such as Pet-coke and coal transportation, water supply and power evacuation are not readily available. At site 6.7.1 and site 6.7.2 some of these facilities will have to be developed / created afresh which is environmentally undesirable, costly and time consuming.
At site 6.7.3, required infrastructure facilities such as land, waters, Pet-coke and coal transportation and power evacuation are readily available from other nearby Essar Group Companies including EOL. Hence, sites 6.7.3 (Table 1) is considered to be most suitable amongst the three alternate sites identified.
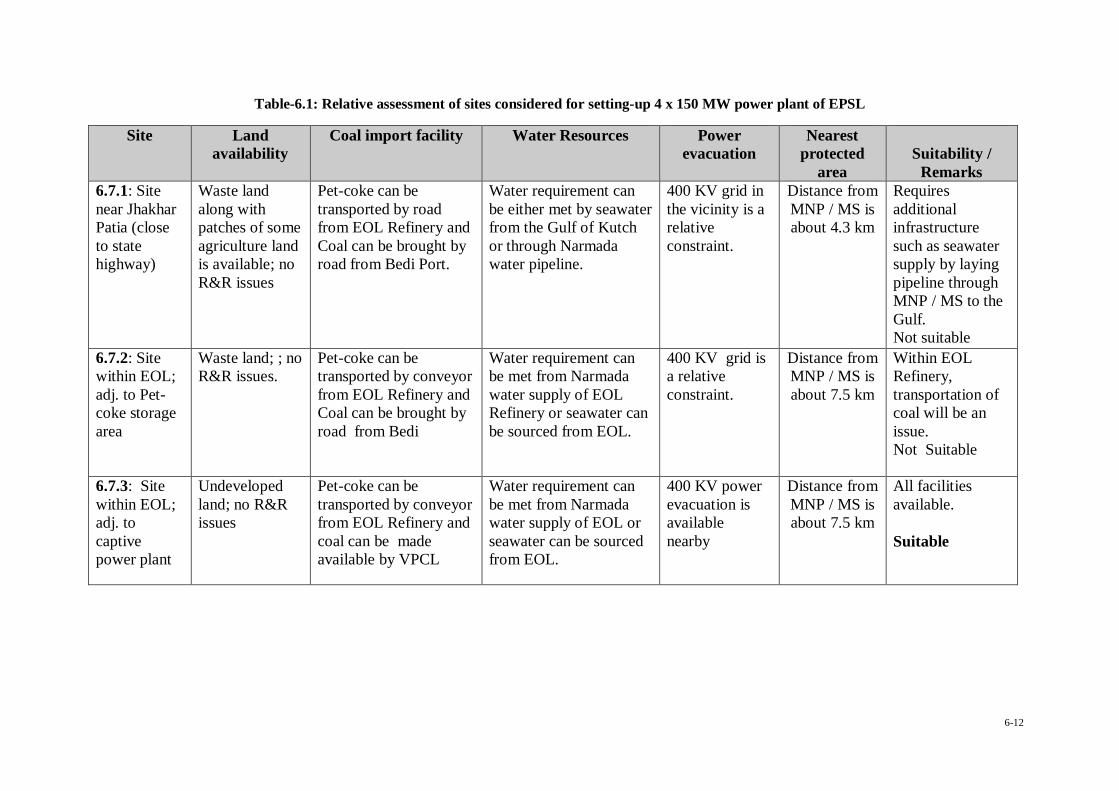
6-12
Table-6.1: Relative assessment of sites considered for setting-up 4 x 150 MW power plant of EPSL
Site
Land availability
Coal import facility Water Resources Power evacuation
Nearest protected
area
Suitability /
Remarks 6.7.1: Site near Jhakhar Patia (close to state highway)
Waste land along with patches of some agriculture land is available; no R&R issues
Pet-coke can be transported by road from EOL Refinery and Coal can be brought by road from Bedi Port.
Water requirement can be either met by seawater from the Gulf of Kutch or through Narmada water pipeline.
400 KV grid in the vicinity is a relative constraint.
Distance from MNP / MS is about 4.3 km
Requires additional infrastructure such as seawater supply by laying pipeline through MNP / MS to the Gulf. Not suitable 6.7.2: Site
within EOL; adj. to Pet-coke storage area
Waste land; ; no R&R issues.
Pet-coke can be transported by conveyor from EOL Refinery and Coal can be brought by road from Bedi
Water requirement can be met from Narmada water supply of EOL Refinery or seawater can be sourced from EOL.
400 KV grid is a relative constraint.
Distance from MNP / MS is about 7.5 km
Within EOL Refinery, transportation of coal will be an issue. Not Suitable
6.7.3: Site within EOL; adj. to captive power plant
Undeveloped land; no R&R issues
Pet-coke can be transported by conveyor from EOL Refinery and coal can be made available by VPCL
Water requirement can be met from Narmada water supply of EOL or seawater can be sourced from EOL.
400 KV power evacuation is available nearby
Distance from MNP / MS is about 7.5 km
All facilities available. Suitable

CHAPTER – 7
ADDITIONAL STUDIES
7-1
In order to support the environment impact assessment and environment management plan of the proposed 4x150 MW Petcoke and Imported coal based power plant, following additional studies have been included in the report.
Hydro-geological study of the project area
On site and off site emergency action plan
Disaster Management Plan and
Risk assessment
7.1. Hydro-geological study of the project area
Essar Power Salaya Limited (EPSL) is proposing to set up a 4x150 MW Petcoke and imported coal based power plant at by Vadinar Refinery Complex of Essar Oil Limited (EOL), Vadinar, Khambalia taluka, Jamnagar district, Gujarat. The water requirement of the proposed plant is sea water and will be sourced from EOL refinery, Vadinar.
As a part of Environmental Impact Assessment (EIA) / Environmental Management Plan (EMP) report, it is necessary to incorporate comprehensive hydrological and hydro-geological assessment studies of core (plant area) and buffer (10 km radius area) zones. EPSL has retained Hydro-Geosurvey Consultants Pvt. Ltd. (HCPL) for carrying out hydrological and hydro-geological studies of the area to be included in the EIA/EMP report to be submitted to the Ministry of Environment & Forests for getting environmental clearance. A draft report is prepared by HCPL and the same is attached here while the detailed study is underway.
HCPL conducted the hydrological investigations by delineating the different water sheds of the buffer zone, estimating its catchment areas, catchment yields and impact of the plant on the surface drainage. HCPL also collected the hydro-geological data of key wells by visiting them in the field, studying the present ground water conditions, estimating the long term ground water recharge, present ground water withdrawal and status of ground water development. The pre-monsoon and post-monsoon hydrological data from 31 key wells was collected for the year 2007. The fluctuation of water levels in the surrounding area of plant as recorded through monitoring of wells was interpreted in relation to ground water resources of the core and buffer zones.
The present report embodies the findings of detailed hydrological and hydro-geological studies carried out for core and buffer zones of 4x150 MW Petcoke and Coal based power plant and the impact of the plant on the water regime of the area.
7.1.2 Hydrology
7.1.2.1 Water sheds in the buffer zone
The buffer zone (10 km radius area from plant boundary) is covered by two water sheds. One water shed located in the western part of the buffer zone is composed of Sinhan river while there is one more water sheds occurring on the eastern. The eastern water shed is classified as Phuliaz river water shed. The runoff of all these water sheds meets Arabian sea except a part
7-2
of the catchment yield of Sinhan river has been harnessed as a dam known as Sinhan Talav (Figure-1).
7.1.2.2 Sinhan river water shed, its hydrology and physiography
This is small water shed covering total catchment area of 179.03 km2 in the buffer zone. Sinhan river originates near Khambhalia. The drainage pattern in the water shed is sub-dendritic to sub-parallel with low gradients. Of the total area of the water shed of 179.03 km2, Sinhan talav gets surface runoff of 36.62 km2. The total storage capacity of Talav is 4.52 million cubic metres (mm3) which is used for general purpose and for live stock consumption. The catcment yield of Sinhan Talav watershed, based on the storage of the Talav amounts to 7%. The over flow of this Talav joins the river and meets Arabian sea at distance of 7.5 km. in northern side. Sinhan river flows for 17 km in the buffer zone before joining the sea. The general elevation of catchment area ranges from 40 metres to sea level. The area is gently undulating with surface exposures of basaltic rocks with typical weathered basaltic topography.
7.1.2.3 Phuliaz river water shed, its hydrology and physiography
Phuliaz river water shed lies on the eastern side of Sinhan river water shed and covers an area of 157.10 km2 in the buffer zone. This water shed also has dendritic to parallel drainage pattern. Phuliaz river travels about 16 km in the buffer zone before joining sea near village Zankhar.
7.1.3 Climate
There is no IMD meteorological station near plant area and the nearest IMD station is at Jamnagar while nearest rain gauge station is at Khmabhalia about 13 km from the centre of the plant area in the south-west. The climatic conditions except rainfall, are not much different in plant area than recorded at Jamnagar. The climate in the region may be divided into four seasons. The period from December to February is the dry, comparatively cool season. The summer season is from March to May which is followed by the southwest monsoon season from July to September. October and November constitute the post monsoon or the retreating monsoon season.
7.1.3.1 Temperature
Temperature is the lowest at the beginning of January and increases thereafter gradually at first and rapidly after the middle of February or the beginning of March. The area falls in hot tropical region. The temperature in the area ranges from 10.6ºC to 36.1ºC.
7.1.3.2 Rainfall
Average annual rainfall based on rainfall data recorded at Khambhalia taluka headquarters, for last 11 years (1997 to 2007) has been observed as 575 mm (Source - Director of Relief, Revenue Department, Gandhinagar). Rains are received almost in all the months of the year but rains are minimum to nil during summer months. The annual rainfall as recorded at Khambhalia taluka headquarters for 2007 is 501 mm (Director of Relief, Revenue Department, Gandhinagar).

7-3
7.1.3.3 Humidity
High humidity of 76 to 72 per cent prevails in the morning over the region from July to October. The humidity is about 60 to 70 per cent in the morning and 32 to 54 per cent in the afternoon from February to May. February is the driest month when the relative humidity drops down to less than 32 per cent in the afternoon (Table 7.1).
7.1.3.4 Winds
Winds are generally light to moderate, except during the south west monsoon season, when these are moderate to strong. From May to September, winds blow mostly from direction from northwest to southwest. In the post monsoon and winter months, winds are mostly from direction lying between northeast and northwest. North is the prominent wind direction. Mean wind speed is highest in June (16.2 km/hour) and lowest in November (6.9 km/hour) with an average of 10.7 km/hr.
7.1.3.5 Cloudiness
Skies are generally moderately to heavily clouded during northeastern monsoon, being overcast on some days. During the rest of the year, the skies are normally clear to lightly clouded. During the months of July-August, the mean cloudiness (in Oktas) is usually more than 6.0, being generally higher in the evenings than the mornings.
7.1.4 Quality of surface water
The quality of surface water is good as the rocks are mostly hard volcanics having thin alluvial cover. The rainfall being moderate and the area having adequate drainage, the surface water remains free from salinity. Water sample collected from Sinhan Talav shows total dissolved salts around 300 mg/l and all constituents within permissible limits of drinking, industrial and irrigation purposes. Being surface water, it is however bacteriological contaminated.
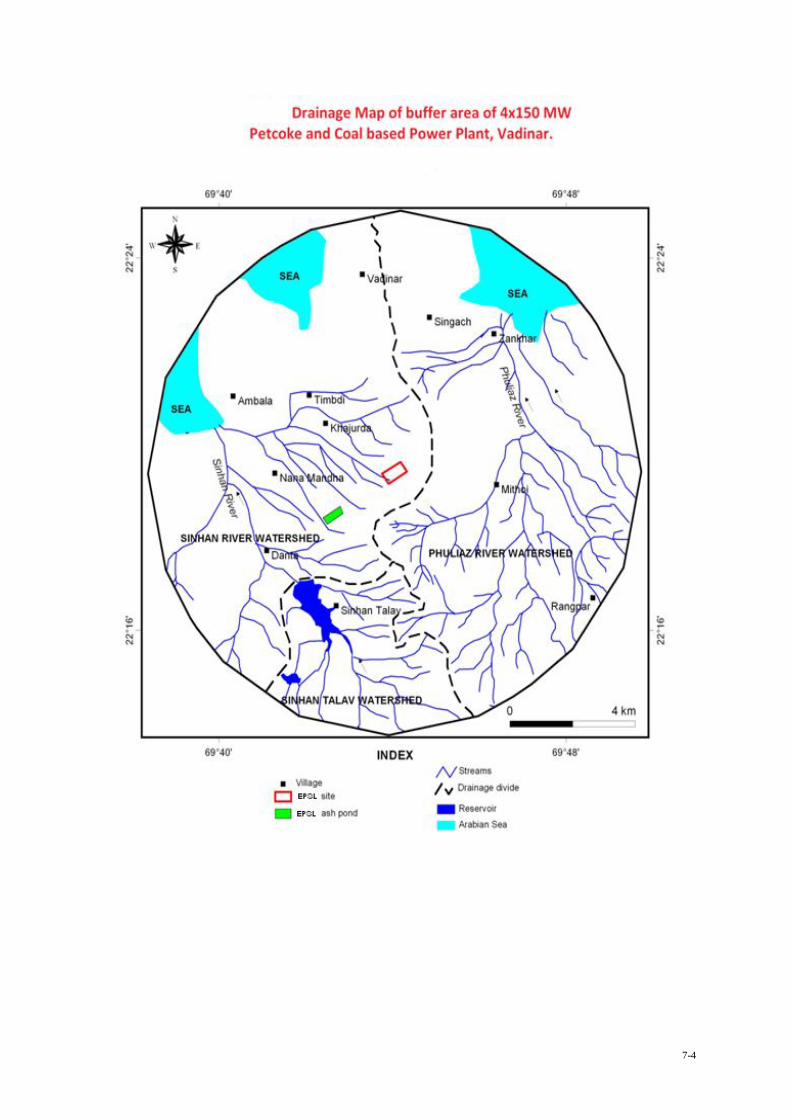
7-4
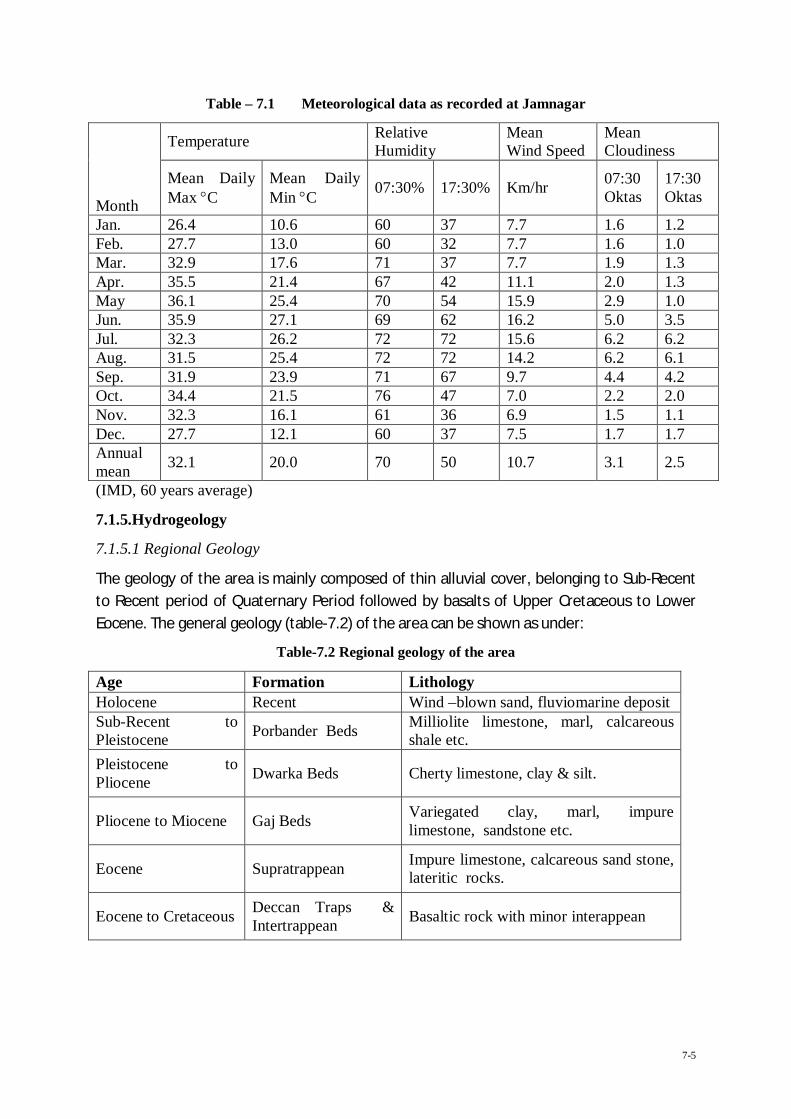
7-5
Table – 7.1 Meteorological data as recorded at Jamnagar
Month
Temperature Relative Humidity
Mean Wind Speed
Mean Cloudiness
Mean Daily Max C
Mean Daily Min C 07:30% 17:30% Km/hr 07:30
Oktas 17:30Oktas
Jan. 26.4 10.6 60 37 7.7 1.6 1.2 Feb. 27.7 13.0 60 32 7.7 1.6 1.0 Mar. 32.9 17.6 71 37 7.7 1.9 1.3 Apr. 35.5 21.4 67 42 11.1 2.0 1.3 May 36.1 25.4 70 54 15.9 2.9 1.0 Jun. 35.9 27.1 69 62 16.2 5.0 3.5 Jul. 32.3 26.2 72 72 15.6 6.2 6.2 Aug. 31.5 25.4 72 72 14.2 6.2 6.1 Sep. 31.9 23.9 71 67 9.7 4.4 4.2 Oct. 34.4 21.5 76 47 7.0 2.2 2.0 Nov. 32.3 16.1 61 36 6.9 1.5 1.1 Dec. 27.7 12.1 60 37 7.5 1.7 1.7 Annualmean 32.1 20.0 70 50 10.7 3.1 2.5
(IMD, 60 years average)
7.1.5.Hydrogeology
7.1.5.1 Regional Geology
The geology of the area is mainly composed of thin alluvial cover, belonging to Sub-Recent to Recent period of Quaternary Period followed by basalts of Upper Cretaceous to Lower Eocene. The general geology (table-7.2) of the area can be shown as under:
Table-7.2 Regional geology of the area
Age Formation Lithology Holocene Recent Wind –blown sand, fluviomarine deposit Sub-Recent to Pleistocene Porbander Beds Milliolite limestone, marl, calcareous
shale etc. Pleistocene to Pliocene Dwarka Beds Cherty limestone, clay & silt.
Pliocene to Miocene Gaj Beds Variegated clay, marl, impure limestone, sandstone etc.
Eocene Supratrappean Impure limestone, calcareous sand stone, lateritic rocks.
Eocene to Cretaceous Deccan Traps & Intertrappean Basaltic rock with minor interappean

7-6
Light to dark greenish Deccan traps are explosed in the study area. The traps are composed of basaltic lava flows constitute both massive and amygdaloidal basalts. Vertical columnar joints and sheet joints are predominantly present in these flows.
7.1.5.3 Hydrogeology of 10- km area (Buffer zone)
Both core and buffer zones have mainly basalt as aquifer zone. There are no major rivers in the buffer zone. There are small rivulets like Sinhan and Phuliaz, which are seasonal in nature and remain dry for most part of the year, except during monsoon season. The Arabian sea constitutes nearly 7% of the buffer zone and rest area is composed of basaltic rocks.
7-7
7.1.5.4 Nature of occurrence of ground water
Ground water occurs under water table conditions in Deccan traps, and is transmitted through fractures and vesicles of basalts. Basalts are impervious in nature and have developed secondary porosity or fracture porosity. The secondary porosity decreases with depth due to overlying weight of the rocks which reduces the secondary openings.
The depth to water table in plant area ranges from 9.5 to 15.5 metres below land surface during pre monsoon period and 3.50 to 7.50 metres during post-monsoon period. The depth to water in buffer zone ranges from 3 to 16 m b.g.l. during post-monsoon period while it is deeper ranging from 5.50 to 17.0 m b.g.l during pre-monsoon. However, the water levels are shallow near streams, ponds and low lying areas in buffer zone where it ranges from 0.5 to 3 metres.
7.1.5.5 Movement of ground water
Ground water movement is controlled mainly by the hydraulic conductivity of the aquifers and hydraulic gradient. The ground water movement in basalts is mainly through the fractures and vesicles.
A review of the topography and drainage pattern in the major part of the buffer zone reveals that the general slope of the area is towards north. The ground water flow in this part of the buffer zone is also towards north with low hydraulic gradient as 1.5 to 2.5 m/km. as calculated from the monitoring of wells of the area.
7.1.5.6 Nature of hydraulic conductivity
The principal aquifer of the area is composed of basalts which, being hard in character have low hydraulic conductivity mainly developed due to secondary openings like fractures and vesicles. The hydraulic conductivity of the basalt is low. General depth of wells ranges from 7 to 20 metres.
Although, there are large number of irrigation wells mostly dugwells driven by diesel engines in the area, pump tests to find out hydraulic conductivity had not been conducted. However, a pump test carried out in nearby area on a tubewell tapping basalt has indicated hydraulic conductivity (K) of 0.5 to 0.70 m/day which can be classified as very low.
7.1.5.7 Yield of wells
There are large number of tubewells and open dugwells in the buffer zone tapping basalt for irrigation and hand pumps mostly used for drinking purpose in villages. Hand pumps have been constructed by the govt. by deploying DTH rigs. The yield of such hand pumps is not much and is just sufficient to meet the drinking water requirement. The yield of such hand pumps range from 500-1,000 litres per hour of potable quality of water.
Open wells are generally 7-20 m deep and are operated mostly by electrically driven centrifugal pumps or by diesel engines and do not sustain pumping and go dry after few hours of pumping. Average yield of open wells with pump tapping basalt has been observed as 60-100 m3/day. Tubewells tapping basalt yield 15-25 m3/hr.
7-8
7.1.5.8 Quality of ground water
Quality of ground water in general is fresh and potable in basalt with total dissolved salts do not exceed 1500 mg/l in the core and buffer zones. The ground water therefore is suitable for drinking and irrigation purposes. All the constituents like chloride, sulphate, fluoride, nitrate etc. are within permissible limits of drinking water standards as per IS. 10500–1991 and ICMR 1975.
7.1.6 Ground Water Recharge
The main source of ground water recharge is by the rainfall by direct percolation to the zone of saturation. As already indicated, there is well developed drainage in the area due to moderate rainfall and loamy soils. A significant part of the rainfall is lost as runoff from the area while a limited percentage of rainfall therefore reaches zone of saturation and becomes the part of ground water storage after meeting the evaporation and evapo-transpiration losses. There is also ground water recharge from the return flow of irrigation water pumped from tubewells and dugwells operated by the cultivators. The ground water recharge from return flow of irrigation is normally taken as 20% of the total water applied for irrigation this percentage has been suggested by the Ground Water Estimation Committee for ground water assessment for this part of the state.
7.1.6.1 Ground water recharge of core zone (Power plant area)
The core zone covers 44 hectares area of thermal plant, mostly composed of basalt. At present, there are a no open wells/tubewells in the plant area.
7.1.6.2 Increment in ground water storage
The ground water recharge can be computed by multiplying the increment in ground water storage by measuring the water level fluctuation during pre and post monsoon periods with area of assessment and specific yield. The equation can expressed as under:
R = h x Sy x A
Where h is the rise of water level due to monsoon, Sy is the specific yield of the aquifer, and A is the area of computation of recharge, while R is ground water recharge.
Increment in the ground water storage in the core zone was determined by recording the water levels in the wells very close to the plant area during pre and post-monsoon periods of 2007. Average rise of water level in the basalt due to rainfall was found as 2.42 m. Taking the specific yield value of 1.5% for the basalt (same value as adopted by the CGWB), the ground water recharge is estimated as under:
0.44 ×1,000×1,000×0.015×2.42 = 0.016 mcm
Plant area x specific yield of basalt x Increment in groundwater storage = Recharge
This ground water recharge has taken place due to rainfall of 501 mm for the year 2007 but when normalized to average annual rainfall of 575 mm, it amounts to 0.017 mcm.

7-9
7.1.6.3 Rainfall infiltration
The Ground Water Resource Estimate Committee (1997), formed by Govt. of India has proposed rainfall infiltration factor to be used for estimation of ground water recharge for the areas where monitoring of wells can not be done or has not been done.
The recharge can be estimated by the following equation:
R = Rf x A x r
Where Rf is rainfall infiltration factor, A is area and r is annual rainfall while R is ground water recharge.
The committee has suggested 5% to 10% as the rainfall infiltration factor for volcanics having loamy soils. As the area has favorable recharge conditions with low rainfall, an infiltration factor of 7.5% is adopted for this area which appears to be reasonable looking to the hydrogeological and geomorphological settings. Although, there is no need to use this theoretical approach in this case which has been monitored on a comprehensive scale, an attempt can be made to find out if it matches with the ground water recharge as calculated by increment in the ground water storage and it is found that it matches very well. Taking the value of infiltration as 7.5%, the ground water recharge from rainfall for core zone has been estimated as 0.019 mcm.
0.44 ×1,000×1,000×0.075×0.575 = 0.019 mcm
This value of ground water recharge calculated from rainfall infiltration matches very well with the value calculated on the basis actual increment in ground water storage by rainfall.
7.1.6.4 Ground water recharge of buffer zone (10 km radius area)
Buffer zone has mainly basalt as water bearing formation. The total area of the buffer zone is 335.69 km2 {(336.13 – 0.44) km2 of the plant area} (Figure-2) in the district of Jamnagar including 24.16 km2 area of Arabian Sea. The area of buffer zone, after deducting the area occupied by sea amounts to 311.53 km2. There is no canal irrigation and major part of the cultivable area is dependent on rainfall while some area is irrigated by tubewells and open wells only.
The ground water fluctuation of water table during pre and post-monsoon periods were recorded for the year 2007 from the 31 key wells (Appendix-I) as per the guidelines of the Ministry of Environment & Forests and taking specific yield values of 1.5% for basalt, the ground water recharge by rain fall has been calculated as under:
7-10
Increment in ground water storage.
Ground water recharge from rainfall for the year 2007, which was almost the average rainfall year for the area, has been calculated by measuring the rise of water levels in the key wells of the 311.53 km2 area of buffer zone (Figure-2). The water levels were recorded during post-monsoon period and again during pre monsoon period of the year 2007. The rise of water level indicates the quantity of water percolated to zone of saturation due to recharge from rainfall.
The aerial rise of water has been computed by contour method for basaltic aquifer and rise was noted as 2.45 m in basalt. Such a high value of rise of water level is due to low fracture porosity of rocks. Taking specific yield value of 1.5% for basalt, the ground water recharge has been calculated for the area covered by basalt. The basalt covers an area of 311.53 km2.
311.53 ×1,000×1,000×0.015× 2.45 = 11.45 mcm
The total ground water recharge of the buffer zone has been calculated as 11.22 mcm against the rainfall of 501 mm recorded during the year 2007 which when normalized for average rainfall of 575 mm amounts to 13.14 mcm.
Rainfall infiltration
The Ground Water Resource Estimate Committee, formed by Govt. of India has proposed rainfall infiltration factor to be used for estimation of ground water recharge for the areas where monitoring of wells has not been done.
The committee has suggested 5% to 10% as the rainfall infiltration factor for volcanics having loamy soils with moderate rainfall and well developed drainage. An infiltration factor of 7.5% is adopted for basaltic terrain which appears to be reasonable looking to the hydrogeological and geomorphological settings. Although, there is no need to use this theoretical approach in this case which has been monitored on a comprehensive scale, an attempt can be made to find out if it matches with the ground water recharge as calculated by increment in the ground water storage and it is found that it matches very well.
311.53 ×1,000×1,000×0.075×0.575 = 13.43 mcm
The total ground water recharge by rainfall infiltration amounts to 13.43 mcm which matches very well with the ground water recharge calculated by actual increment in ground water storage.
Return flow of irrigation
The norms prescribed by the Estimate Committee for return seepage from the irrigation fields for loamy soils has been suggested as 20% of the total water applied for the irrigation. There are a number of open and tubewells in the buffer zone being operated for irrigation tapping
7-11
alluvium, limestone and basalt. Taking 20% as return flow to saturation zone, ground water recharge by seepage amounts to 0.30 mcm.
1.51×0.20 = 0.30 mcm
Ground water × return flow = recharge
The total ground water recharge therefore amounts to 13.44 mcm after including recharge from return flow of irrigation water.
7.1.7 Ground Water Discharge
7.1.7.1 Ground water discharge in core zone (plant area)
At present, there is no dug well or tube well in the thermal plant area. So, the total ground water discharge from core zone is nil.
7.1.7.2 Ground water discharge in buffer zone (10-km radius area)
The ground water discharge takes place mainly by evapo-transpiration and by withdrawal from tube wells and open dug wells operated mainly for irrigation.
There are 95 open wells with pumps in operation for irrigation tapping basalt along with 42 tube wells. Average yield of open wells with pump tapping basalt has been taken as 70 m3/day. Tube wells tapping basalt yield 120 m3/day. Taking these values the discharge from basaltic terrain is estimated as under.
95×70×120 = 0.91 mcm (Open wells with pumps tapping basalt)
No.of wells × average yield/day × Rabi irrigation = Withdrawal
42×120×120 = 0.60 mcm (Tubewells tapping basalt)
No. of T/w×average yield/day×Rabi irrigation = Withdrawal
In addition, the drinking and livestock water requirement of around 32 villages having a local population of about 30,144 is met by tube wells, open dug wells and hand pumps and is around 0.5 mcm considering 45/litre/capita/day consumption, i.e. therefore amounts to 2.01 mcm.
7.1.8 Present Status of Ground Water Development
The present study reveals that against the total ground water recharge of 13.44 mcm, including recharge from return flow of irrigation water, the ground water discharge is 2.01 mcm indicating the status of ground water development of buffer zone as 14.96%. The buffer zone therefore appears to be safe. Similarly, against nil ground water discharge, the core zone receives ground water recharge of 0.017 mcm indicating safe status of ground water development.
The state ground water organizations jointly with Central Ground Water Board (CGWB) determine the status of ground water development for each taluka every year and publish the findings once in four years after monitoring the key wells.
7-12
The findings of the CGWB have just been released in the report, August, 2005 for the year 2004 and it shows that the status of ground water development of Jamnagar district as a whole is 60% and therefore lies in safe category.
7.1.9 Impact of power plant and ash pond on the surface drainage
As the power plant is proposed to be constructed adjoining to existing refinery along the SH-25, in a small area hardly covering 44 hectares, no natural drainage will be disturbed. Drainage in the plant area will suitably channelized and would join the natural drainage of the area. Brine produced from the thermal desalination plant will be either released in Arabian sea by a pipe line or sold to private parties for producing salt. The quantity and quality of surface and ground water of core and buffer zones therefore would remain unaffected by the power plant.
Fly Ash and bottom ash generated from the power plant will be around 9.16 MTPA. Bottom ash will be disposed in slurry pond using high concentrate slurry disposal mechanism while the dry fly ash collected in the silos will be utilized for manufacturing of Portland cement by local cement manufacturing units. The environmental aspect of ash pond is being dealt separately under EIA study report. Its impact of surface water will be negligible as the area is not traversed by any first order stream. The bed rock comprising basalt, an impervious rock with hardly any fracture porosity and is exposed at the surface. The basalts therefore will not be a receptive rock to any contamination from the bottom ash.
7.1.10 Conclusions
The hydrological and hydrogeological studies carried out in the power plant area (core zone) and 10 km radius (buffer zone) have revealed that there are limited surface and ground water resources which are not being fully utilized for irrigation. The ground water development is within safe limits in core and buffer zones and will remain within safe limits as there is no program of tapping surface water or ground water resources for the power plant as well as by cultivators.
The quality of surface water is relatively better than the ground water but both are suitable for drinking and irrigation purposes as all the constituents are within prescribed limits. Nature of aquifer being hard rock and chemically resistant to weathering with thin alluvial cover, basalts will not contribute any pollutants to surface and ground water.
for Hydro-Geosurvey Consultants Pvt. Ltd.,
(Dr. V.B. Khilnani)
Managing Director
7-13
7.2 Disaster Management Plan
7.2.1 Disasters
A disaster is a catastrophic situation in which suddenly, people are plunged into helplessness and suffering and, as a result, need protection, clothing, shelter, medical and social care and other necessities of life.
Disasters can be divided into two main groups. In the first, are disasters resulting from natural phenomena like earthquakes, volcanic eruptions, storm surges, cyclones, tropical storms, floods, avalanches, landslides, forest fires. The second group includes disastrous events occasioned by man, or by man's impact upon the environment. Examples are armed conflict, industrial accidents, radiation accidents, factory fires, explosions and escape of toxic gases or chemical substances, river pollution, mining or other structural collapses, air, sea, rail and road transport accidents which can reach catastrophic dimensions in terms of human loss.
There can be no set criteria for assessing the gravity of a disaster in the abstract since this depends to a large extent on the physical, economic and social environment in which it occurs. What would be considered a major disaster in a developing country, ill equipped to cope with the problems involved, may not mean more than a temporary emergency elsewhere. However, all disasters bring in their wake similar consequences that call for immediate action, whether at the local, national or international level, for the rescue and relief of the victims. This includes the search for the dead and injured, medical and social care, removal of the debris, the provision of temporary shelter for the homeless, food, clothing and medical supplies, and the rapid reestablishment of essential services.
7.2.2 Objectives of Disaster Management Plan [DMP]
The Disaster Management Plan is aimed to ensure safety of life, protection of environment, protection of installation, restoration of production and salvage operations in this same order of priorities. For effective implementation of the Disaster Management Plan, it should be widely circulated and personnel trained through rehearsals/drills.
The Disaster Management Plan should reflect the probable consequential severalties of the undesired event due to deteriorating conditions or through 'Knock on' effects. Further the management should be able to demonstrate that their assessment of the consequences uses good supporting evidence and is based on currently available and reliable information, incident data from internal and external sources and if necessary the reports of outside agencies.
To tackle the consequences of a major emergency inside the plant or in the immediate vicinity of the plant, a Disaster Management Plan has to be formulated.
The objective of the Disaster Management Plan is to make use of the combined resources of the plant and the outside services to achieve the following:
Effect the rescue and medical treatment of casualties;
Safeguard other people;
Minimize damage to property and the environment;
7-14
Initially contain and ultimately bring the incident under control;
Identify any dead;
Provide for the needs of relatives;
Provide authoritative information to the news media;
Secure the safe rehabilitation of affected area; and
Preserve relevant records and equipment for the subsequent inquiry into the cause and circumstances of the Emergency.
In effect, it is to optimize operational efficiency to rescue, rehabilitate and render medical help and to restore normalcy.
7.2.3 Emergencies
7.2.3.1 General Industrial Emergencies
The emergencies that could be envisaged in the plant and fuel storage are as follows:
Fire at the HSD storage;
Slow isolated fires;
Fast spreading fires;
Structural failures;
Contamination of food/water; and
Sabotage/Social disorder.
7.2.3.2 Specific Emergencies Anticipated
Fire and Explosion
Fire consequences can be disastrous, since they involve huge quantities of fuel either stored or in dynamic inventory in pipelines or in nearby areas. Preliminary hazard analysis has provided a basis for consequence estimation. Estimation can be made by using various pool fire, and tank fire consequence calculations. During the study of Risk Assessment, the nature of damages is worked out and probability of occurrence of such hazards is also drawn up.
7.2.4 Emergency Organization
It is recommended to setup an Emergency Organization. A senior executive who has control over the affairs of the plant should lead the Emergency Organization. He shall be designated as Site Controller. General Manager [O & M] can be designated as the Incident Controller. In the case of stores, utilities, open areas, which are not under the control of the Production Heads, Senior Executive responsible for maintenance of utilities would be designated as Incident Controller. All the Incident Controllers would be reporting to the Site Controller.
Each Incident Controller, for himself, organizes a team responsible for controlling the incidence with the personnel under his control. Shift incharge would be the reporting officer, who would bring the incidence to the notice of the Incidence Controller and Site Controller.
7-15
Emergency Coordinators would be appointed who would undertake the responsibilities like firefighting, rescue, rehabilitation, transport and provide essential and support services. For this purposes, Security Incharge, Personnel Department, and Essential services personnel should be engaged. All these personnel would be designated as Key personnel.
In each shift, electrical supervisor, electrical fitters, pump house incharge, and other maintenance staff would be drafted for emergency operations. In the event of power or communication system failure, some of the staff members in the office/plant offices would be drafted and their services would be utilized as messengers for quick passing of communications. All these personnel would be declared as essential personnel.
7.2.4.1 Emergency Communication
Whoever notices an emergency situation such as fire, growth of fire, leakage etc should inform his immediate superior and Emergency Control Center. A place nearer to the Gate House Complex shall be identified as Emergency Control Center. The person on duty in the Emergency Control Center should appraise the Site Controller. Site Controller verifies the situation from the Incident Controller of that area or the Shift Incharge and takes a decision about an impending Onsite Emergency. This would be communicated to all the Incident Controllers, Emergency Co-ordinators. Simultaneously, the emergency warning system would be activated on the instructions of the Site Controller.
7.2.5 Emergency Responsibilities
The responsibilities of the key personnel are appended below:
7.2.5.1 Site Controller
On receiving information about emergency would rush to Emergency Control Center (ECC) and take charge of ECC and the situation. His responsibilities would be as indicated below:
Assesses the magnitude of the situation on the advice of Incident Controller and decides;
Whether the effected area needs to be evacuated;
Whether personnel who are at assembly points need to be evacuated;
Declares Emergency and orders for operation of emergency siren;
Organizes announcement by public address system about location of emergency;
Assesses which areas are likely to be affected, or need to be evacuated or are to be alerted;
Maintains a continuous review of possible development and assesses the situation in consultation with Incident Controller and other Key Personnel as to whether shutting down the plant or any section of the plant is required and if evacuation of persons is required;
Directs personnel for rescue, rehabilitation, transport, fire, brigade, medical and other designated mutual support systems locally available, for meeting emergencies;
7-16
Controls evacuation of affected areas, if the situation is likely to go out of control or effects are likely to go beyond the premises of the factory, informs the District Emergency Authority, Police, Hospital and seeks their intervention and help;
Informs Inspector of Factories, Deputy Chief Inspector of Factories, OPCB and other statutory authorities;
Gives a public statement, if necessary;
Keeps record of chronological events and prepares an investigation report and preserves evidence; and
On completion of Onsite Emergency and restoration of normalcy, declares all clear and orders for all clear warning.
7.2.5.2 Incident Controller
The responsibilities of the incident controller are:
Assembles the incident control team;
Directs operations within the affected areas with the priorities for safety to personnel minimize damage to the plant, property and environment and minimize the loss of materials;
Directs the shutting down and evacuation of plant and areas likely to be adversely affected by the emergency;
Ensures that key personnel help is sought;
Provides advice and information to the Fire and Security Officer and the Local Fire Services as and when they arrive;
Ensures that all nonessential workers/staff of the affected areas are evacuated to the appropriate assembly points, and the areas are searched for casualties;
Has regard to the need for preservation of evidence so as to facilitate any inquiry into the causes and circumstances, which caused or escalated the emergency;
Coordinates with emergency services at the site;
Provides tools and safety equipment to the team members;
Keeps in touch with the team and advices them regarding the method of control to be used; and
Keeps the Site Controller of Emergency informed of the progress being made.
7.2.5.3 Emergency Coordinator - Rescue, Fire Fighting
The responsibilities of the Emergency controller are:
On knowing about emergency, rushes to ECC;
Helps the Incident Controller in containment of the emergency;

7-17
Ensure fire pumps are in operating condition and instructs pump house operator to ready for any emergency with standby arrangement;
Guides the fire fighting crew i.e. firemen, trained plant personnel and security staff;
Organizes shifting the fire fighting facilities to the emergency site, if required;
Takes guidance of the Incident Controller for fire fighting as well as assesses the requirements of outside help;
Arranges to control the traffic at the gate and the incident area;
Directs the security staff to the incident site to take part in the emergency operations under his guidance and supervision;
Evacuates the people in the plant or in the nearby areas as advised by Site Controller;
Searches for casualties and arranges proper aid for them;
Assembles search and evacuation team;
Arranges for safety equipment for the members of this team;
Decides which paths the evacuated workers should follow; and
Maintains law and order in the area, and if necessary seeks the help of police.
7.2.5.4 Emergency Coordinator-Medical, Mutual Aid, Rehabilitation, Transport and Communication
In the event of failure of electric supply and thereby internal telephone, sets up communication point and establishes contact with the ECC;
Organizes medical treatment to the injured and if necessary will shift the injured to near by hospitals;
Mobilizes extra medical help from outside, if necessary;
Keeps a list of qualified first aid providers for the plant and seeks their assistance;
Maintains first aid and medical emergency requirements;
Makes sure that all safety equipment is made available to the emergency team;
Assists Site Controller with necessary data to coordinate the emergency activities;
Assists Site Controller in updating emergency plan, organizing mock drills, verification of inventory of emergency facilities and furnishing report to Site Controller;
Maintains liaison with Civil Administration;
Ensures availability of canteen facilities and maintenance of rehabilitation center.
Liaises with Site Controller/Incident Controller;
Ensures transportation facility;

7-18
Ensures availability of necessary cash for rescue/rehabilitation and emergency expenditure;
Controls rehabilitation of affected areas on discontinuation of emergency; and
Makes available diesel/petrol for transport vehicles engaged in emergency operation.
7.2.5.5 Emergency Coordinator - Essential Services
The coordinator for essential services will:
Assists Site Controller and Incident Controller;
Maintains essential services like Diesel Generator, Water, Fire Water, Compressed Air/Instrument Air, power supply for lighting;
Plans alternate facilities in the event of power failure, to maintain essential services such as lighting, etc;
Organizes separate electrical connections for all utilities and emergency services so that in the event of emergency or fires, essential services and utilities are not affected;
Gives necessary instructions regarding emergency electrical supply, isolation of certain sections etc. to shift incharge and electricians; and
Ensures availability of adequate quantities of protective equipment and other emergency materials, spares etc.
7.2.5.6 General Responsibilities of Employees during an Emergency
During an emergency, which becomes more enhanced and pronounced when an emergency warning is raised, the workers who are incharge of process equipment should adopt safe and emergency shut down and attend to any prescribed duty as essential employee. If no such responsibility is assigned, he should adopt a safe course to assembly point and await instructions. He should not resort to spreading panic. On the other hand, he must assist emergency personnel towards meeting the objectives of DMP.
7.2.6 Emergency Facilities
7.2.6.1 Emergency Control Center (ECC)
The following information and equipment are to be provided at the Emergency Control Center (ECC).
Intercom, telephone;
P and T telephone;
Self contained breathing apparatus;
Fire suit/gas tight goggles/gloves/helmets;
Hand tools, wind direction/velocities indications;

7-19
Public address megaphone, hand bell, telephone directories (internal, P and T)
Plant layout, site plan;
Emergency lamp/torch light/batteries;
Plan indicating locations of hazard inventories, plant control room, sources of safety equipment, work road plan, assembly points, rescue location vulnerable zones, escape routes;
Hazard chart;
Emergency shut down procedures;
Nominal roll of employees;
List of key personnel, list of essential employees, list of Emergency Coordinators;
Duties of key personnel;
Address with telephone numbers and key personnel, emergency coordinator, essential employees; and
Important address and telephone numbers including Government agencies, neighboring industries and sources of help, outside experts, fuel fact sheets and population details around the factory.
7.2.6.2 Assembly Point
The number of assembly points, depending upon the plant location, would be identified wherein employees who are not directly connected with the disaster management would be assembled for safety and rescue. Emergency breathing apparatus, minimum facilities like water etc would be organized.
In view of the size of plant, different locations would be ear marked as assembly points. Depending upon the location of hazard, the assembly points are to be used.
7.2.6.3 Fire Fighting Facilities
First Aid and Fire fighting equipment suitable for emergency should be maintained in each section in the plant. This would be as per statutory requirements. However, fire hydrant line covering major areas would be laid. It would be maintained as 6 kg/cm2 pressure. Fire alarms should be located in the bulk storage areas. Fire officer will be the commanding officer of fire fighting services.
7.2.6.4 Emergency Medical Facilities
Stretchers, gas masks and general first aid materials for dealing with chemical burns, fire burns etc would be maintained in the medical center as well as in the emergency control room. Medical superintendent of the medical center will be the head of the casualty services ward. Private medical practitioners help would also be sought. Government hospital would be approached for emergency help.

7-20
Apart from plant first aid facilities, external facilities would be augmented. Names of Medical Personnel, Medical facilities in the area would be prepared and updated. Necessary specific medicines for emergency treatment of Patient’s Burns would be maintained.
Breathing apparatus and other emergency medical equipment would be provided and maintained. Also, the help of nearby industries would be taken on mutual support basis.
7.2.6.5 Ambulance
Availability of an ambulance with driver in all the shifts would be ensured to transport injured or affected persons. Several persons would be trained in first aid so that, in every shift first aid personnel would be available.
7.2.7 Emergency Actions
7.2.7.1 Emergency Warning
The emergency would be communicated both to the personnel inside the plant and the people outside. An emergency warning system shall be established for this purpose.
7.2.7.2 Evacuation of Personnel
There could be a number of persons in the storage area and other areas in the vicinity. The area would have adequate number of exits, staircases. In the event of an emergency, unconnected personnel have to escape to assembly point. Operators have to take emergency shutdown procedure and escape. Time Office shall maintain a copy of deployment of employees in each shift at ECC. If necessary, persons can be evacuated by rescue teams.
7.2.7.3 All Clear Signal
Also, at the end of an emergency, after discussing with Incident Controllers and Emergency Coordinators, the Site Controller orders an all clear signal. When it becomes essential, the Site Controller communicates to the District Emergency Authority, Police, Fire Service personnel regarding help required or development of the situation into an Offsite Emergency. The onsite emergency organization chart for various emergencies is shown in Figure-7.3.
7.2.8 General
7.2.8.1 Employee Information
During an emergency, employees would be warned by raising siren in specific pattern. Employees would be given training of escape routes and taking shelter. Employees would be provided with information related to fire hazards, antidotes and first aid measures. Those who would be designated as key personnel and essential employees should be given training for emergency response.
7.2.8.2 Public Information and Warning
The industrial disaster effects related to this plant may mostly be confined to the plant area. The detailed risk analysis has indicated that the pool fire effects would not be felt outside. However, as an abundant precaution, the information related to fuels in use would be furnished to District Emergency Authority for necessary dissemination to general public and

7-21
for any use during an offsite emergency. Plants of this size and nature have been in existence in our country for a long time.
7.2.8.3 Coordination with Local Authorities
Keeping in view of the nature of emergency, two levels of coordination are proposed. In the case of an Onsite Emergency, resources within the organization would be mobilized and in the event of extreme emergency local authorities help would be sought.
In the event of an emergency developing into an offsite emergency, local authority and District Emergency Authority (normally the Collector) would be appraised and under his supervision, the Offsite Disaster Management Plan would be exercised. For this purpose, the facilities that are available locally, i.e. medical, transport, personnel, rescue accommodation, voluntary organizations etc would be mustered. Necessary rehearsals and training in the form of mock drills would be organized.
7.2.8.4 Mutual Aid
Mutual aid in the form of technical personnel, runners, helpers, special protective equipment, transport vehicles, communication facility etc would be sought from the neighboring industries.
7.2.8.5 Mock Drills
Emergency preparedness is an important part of planning in Industrial Disaster Management. Personnel would be trained suitably and prepared mentally and physically in emergency response through carefully planned, simulated procedures. Similarly, the key personnel and essential personnel would be trained in the operations.
7.2.8.6 Important Information
Once the plant goes on stream, important information such as names and addresses of key personnel, essential employees, medical personnel outside the plant, transporters address, address of those connected with Offsite Emergency such as Police, Local Authorities, Fire Services, District Emergency Authority would be prepared and maintained.
7.3 Offsite Emergency Preparedness Plan
The task of preparing the Offsite Emergency Plan lies with the District Collector; however the offsite plan will be prepared with the help of the local district authorities. The proposed plan will be based on the following guidelines.
7.3.1 Introduction
Offsite emergency plan would follow the onsite emergency plan. When the consequences of an emergency situation go beyond the plant boundaries, it becomes an offsite emergency. Offsite emergency is essentially the responsibility of the public administration. However, the plant management will provide the public administration with the technical information relating to the nature, quantum and probable consequences on the neighboring population.
The offsite plan in detail will be based on those events, which are most likely to occur, but other less likely events, which have severe consequence, will also be considered. Incidents
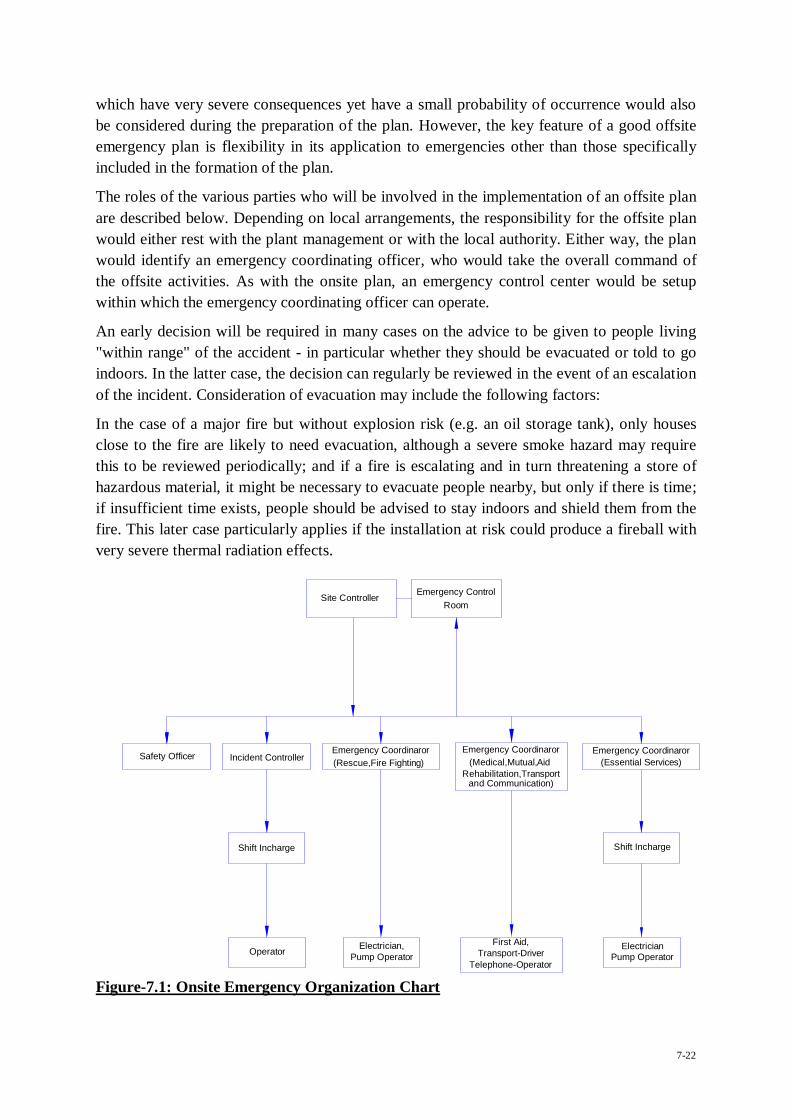
7-22
which have very severe consequences yet have a small probability of occurrence would also be considered during the preparation of the plan. However, the key feature of a good offsite emergency plan is flexibility in its application to emergencies other than those specifically included in the formation of the plan.
The roles of the various parties who will be involved in the implementation of an offsite plan are described below. Depending on local arrangements, the responsibility for the offsite plan would either rest with the plant management or with the local authority. Either way, the plan would identify an emergency coordinating officer, who would take the overall command of the offsite activities. As with the onsite plan, an emergency control center would be setup within which the emergency coordinating officer can operate.
An early decision will be required in many cases on the advice to be given to people living "within range" of the accident - in particular whether they should be evacuated or told to go indoors. In the latter case, the decision can regularly be reviewed in the event of an escalation of the incident. Consideration of evacuation may include the following factors:
In the case of a major fire but without explosion risk (e.g. an oil storage tank), only houses close to the fire are likely to need evacuation, although a severe smoke hazard may require this to be reviewed periodically; and if a fire is escalating and in turn threatening a store of hazardous material, it might be necessary to evacuate people nearby, but only if there is time; if insufficient time exists, people should be advised to stay indoors and shield them from the fire. This later case particularly applies if the installation at risk could produce a fireball with very severe thermal radiation effects.
Figure-7.1: Onsite Emergency Organization Chart
Operator
Shift Incharge
Safety Officer
Site ControllerRoom
Emergency Control
Emergency Coordinaror Emergency Coordinaror(Medical,Mutual,Aid
Rehabilitation,Transportand Communication)
(Rescue,Fire Fighting)
Electrician, First Aid,Transport-Driver
Telephone-Operator
ElectricianPump Operator
Emergency Coordinaror(Essential Services)
Pump Operator
Shift Incharge
Incident Controller

7-23
Although the plan will have sufficient flexibility built in to cover the consequences of the range of accidents identified for the onsite plan, it will cover in some detail the handling of the emergency to a particular distance from each major hazard works.
7.3.2 Aspects Proposed to be considered in the Offsite Emergency Plan
The main aspects, which should be included in the emergency plan are:
Organization
Detail of command structure, warning systems, implementation procedures, emergency control centers.
Names and appointments of incident controller, site main controller, their deputies and other key personnel.
Communications
Identification of personnel involved, communication center, call signs, network, list of telephone numbers.
Specialized Knowledge
Details of specialist bodies, firms and people upon whom it may be necessary to call e.g. those with specialized fuel knowledge, laboratories.
Voluntary Organizations
Details of organizers, telephone numbers, resources etc
Fuel Information
Details of the hazardous substances stored and a summary of the risk associated with them.
Meteorological Information
Arrangements for obtaining details of weather forecasts and weather conditions prevailing at that time
Humanitarian Arrangements
Transport, evacuation centers, emergency feeding, treatment of injured, first aid, ambulances and temporary mortuaries.
Public Information
Arrangements for (a) Dealing with the media press office; (b) Informing relatives, etc
Assessment of Emergency Plan
Arrangements for:
Collecting information on the causes of the emergency; and
Reviewing the efficiency and effectiveness of all aspects of the emergency plan.

7-24
7.3.3 Role of the Emergency Co-ordinating Officer
The various emergency services would be co-ordinated by an Emergency Coordinating Officer (ECO), who will be designated by the district collector. The ECO would liaison closely with the site main controller. Again depending on local arrangements, for very severe incidents with major or prolonged offsite consequences, the external control would be passed to a senior local authority administrator or even an administrator appointed by the central or state government. The ECO will be equipped with address and phone numbers of important agencies.
7.3.4 Role of the Local Authority
The duty to prepare the offsite plan lies with the local authorities. The emergency planning officer (EPO) appointed should carry out his duty in preparing for a whole range of different emergencies within the local authority area. The EPO should liaison with the plant, to obtain the information to provide the basis for the plan. This liaison should ensure that the plan is continually kept up to date.
It will be the responsibility of the EPO to ensure that all those organizations which will be involved offsite in handling the emergency, know of their role and are able to accept it by having for example, sufficient staff and appropriate equipment to cover their particular responsibilities. Rehearsals for offsite plans should be organized by the EPO.
7.3.5 Role of Police
Formal duties of the police during an emergency include protecting life and property and controlling traffic movements.
Their functions should include controlling bystanders, evacuating the public, identifying the dead and dealing with casualties, and informing relatives of death or injury.
7.3.6 Role of Fire Authorities
The control of a fire should be normally the responsibility of the senior fire brigade officer who would take over the handling of the fire from the site incident controller on arrival at the site. The senior fire brigade officer should also have a similar responsibility for other events, such as explosions. Fire authorities in the region should be appraised about the location of all stores of flammable materials, water and foam supply points, and fire fighting equipment. They should be involved in onsite emergency rehearsals both as participants and, on occasion, as observers of exercises involving only site personnel. The flow chart for offsite emergency plan is given in Figure-7.4.
7.3.7 Role of Health Authorities
Health authorities, including doctors, surgeons, hospitals, ambulances and so on, should have a vital part to play following a major accident, and they should form an integral part of the emergency plan.
For major fires, injuries should be the result of the effects of thermal radiation to a varying degree, and the knowledge and experience to handle this in all but extreme cases may be generally available in most hospitals.

7-25
Major off site incidents are likely to require medical equipment and facilities additional to those available locally, and a medical "mutual aid” scheme should exist to enable the assistance of neighboring authorities to be obtained in the event of an emergency.
7.3.8 Role of Government Safety Authority
This will be the factory inspectorate available in the region. Inspectors are likely to satisfy themselves that the organization responsible for producing the offsite plan has made adequate arrangements for handling emergencies of all types including major emergencies. They may wish to see well documented procedures and evidence of exercise undertaken to test the plan.
In the event of an accident, local arrangements regarding the role of the factory inspector will apply. These may vary from keeping a watch, to a close involvement in advising on operations. The action plan suggested for control of the offsite emergencies is given in Table-7.3.

7-26
Figure-7.2: Offsite Emergency Plan

7-27
Table-7.3: Offsite Action Plan
Sr. No.
Action Required to be taken to Mitigate Disaster by Aid giving agency
Responsible Agencies for taking action
Equipments/Material facilities required at site to mitigate Emergency
A 1 Arrangements for evacuation/ rescue of persons from zone of influence to predetermined camps
Police Department
Self Breathing apparatus with spare cylinder Chemical gas mask with spare canister Vehicle with PA system Transportation for evacuation of people
2 Caution to public by announcement
3 Traffic and Mob control by cordoning of the area
4 Law & order 5 Request to railway authority for
keeping the nearest railway gate open & to stop the trains at the nearest railway station
B Control of fire District Fire Brigade
Self breathing apparatus with spare cylinders Foam/water fire tenders Gas mask with spare canisters Lime water Neck to toe complete asbestos suit, PVC hand gloves, gumboots, safety goggles Mobile scrubbing system along with suction arrangement.
1 Scrubbing of the flashed off gas cloud with water curtain
2 To rescue trapped persons 3 If fire is big, keep surrounding
area cool by spraying water 4 Communication to State
Electricity Board to continue or cut off electric supply
5 Communication to water supply department for supplying water
C Medical facilities for affected persons (first aid and treatment)
Hospital and public health
Ambulance with onboard resuscitation unit, first aid, stretchers
D Identification of concentration of gas in zone of influence
Pollution Control Board
Gas detector
E Removal of debris and damaged structures
Municipal corporation
Provide bulldozers Provide cranes
F 1 Monitor the incoming and out going transports
Transport department
Provide traffic police at site Provide emergency shifting vehicles at site Provide stock of fuel for vehicles
2 Arrange emergency shifting of affected persons and non affected person to specified area
3 Arrange diesel/petrol for needed vehicles
G 1 Give all information related to meteorological aspects for safe handling of affected area for
Meteorological Department
Provide wind direction and velocity instruments with temperature measurements
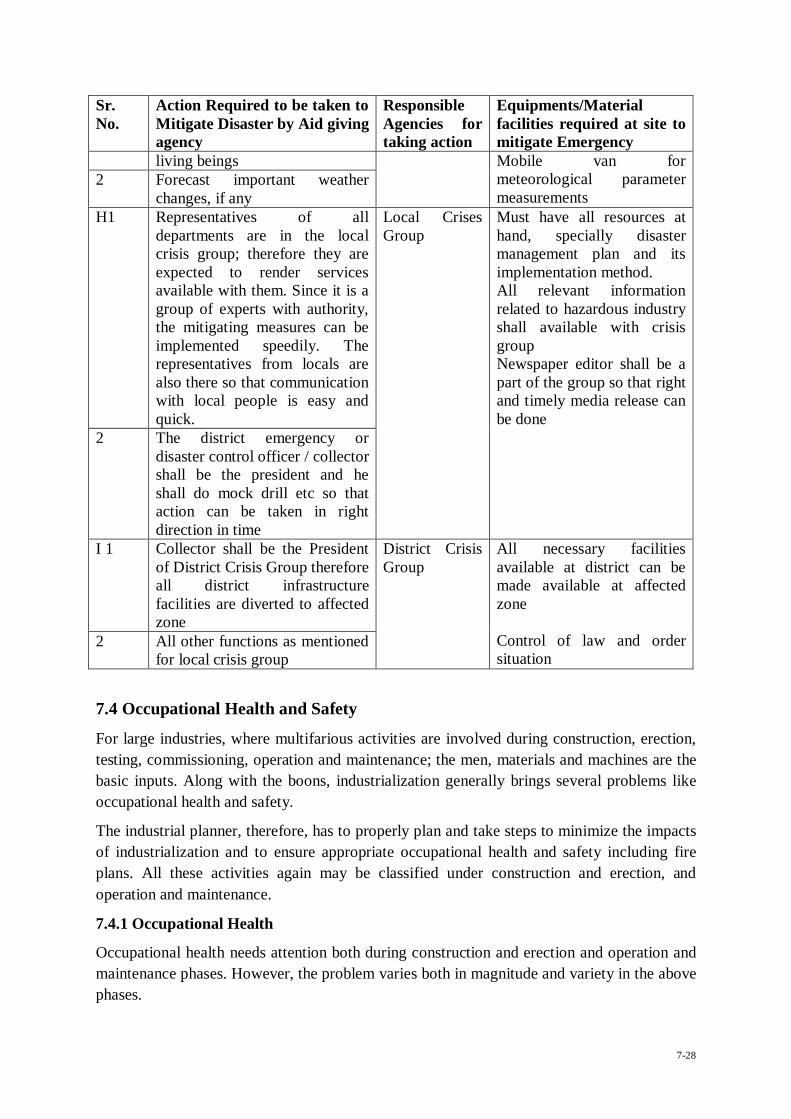
7-28
Sr. No.
Action Required to be taken to Mitigate Disaster by Aid giving agency
Responsible Agencies for taking action
Equipments/Material facilities required at site to mitigate Emergency
living beings Mobile van for meteorological parameter measurements
2 Forecast important weather changes, if any
H1 Representatives of all departments are in the local crisis group; therefore they are expected to render services available with them. Since it is a group of experts with authority, the mitigating measures can be implemented speedily. The representatives from locals are also there so that communication with local people is easy and quick.
Local Crises Group
Must have all resources at hand, specially disaster management plan and its implementation method. All relevant information related to hazardous industry shall available with crisis group Newspaper editor shall be a part of the group so that right and timely media release can be done
2 The district emergency or disaster control officer / collector shall be the president and he shall do mock drill etc so that action can be taken in right direction in time
I 1 Collector shall be the President of District Crisis Group therefore all district infrastructure facilities are diverted to affected zone
District Crisis Group
All necessary facilities available at district can be made available at affected zone Control of law and order situation
2 All other functions as mentioned for local crisis group
7.4 Occupational Health and Safety
For large industries, where multifarious activities are involved during construction, erection, testing, commissioning, operation and maintenance; the men, materials and machines are the basic inputs. Along with the boons, industrialization generally brings several problems like occupational health and safety.
The industrial planner, therefore, has to properly plan and take steps to minimize the impacts of industrialization and to ensure appropriate occupational health and safety including fire plans. All these activities again may be classified under construction and erection, and operation and maintenance.
7.4.1 Occupational Health
Occupational health needs attention both during construction and erection and operation and maintenance phases. However, the problem varies both in magnitude and variety in the above phases.
7-29
Construction and Erection
The occupational health problems envisaged at this stage can mainly be due to constructional accident and noise. To overcome these hazards, in addition to arrangements to reduce it within TLV's, necessary protective equipments shall be supplied to workers.
Operation and Maintenance
The problem of occupational health, in the operation and maintenance phase is primarily due to noise which could affect consultation. The necessary personal protective equipments will be given to all the workers. The working personnel shall be given the following appropriate personnel protective equipments.
Industrial Safety Helmet;
Crash Helmets;
Face shield with replacement acrylic vision;
Zero power plain goggles with cut type filters on both ends;
Zero power goggles with cut type filters on both sides and blue color glasses;
Welders equipment for eye and face protection;
Cylindrical type earplug;
Ear muffs;
Canister Gas mask;
Self contained breathing apparatus;
Leather apron;
Aluminized fiber glass fix proximity suit with hood and gloves;
Boiler suit;
Safety belt/line man's safety belt;
Leather hand gloves;
Asbestos hand gloves;
Acid/Alkali proof rubberized hand gloves;
Canvas cum leather hand gloves with leather palm;
Lead hand glove;
Electrically tested electrical resistance hand gloves; and
Industrial safety shoes with steel toe.
Full fledged hospital facilities shall be available round the clock for attending emergency arising out of accidents, if any. All working personnel shall be medically examined at least

7-30
once in every year and at the end of his term of employment. This is in addition to the pre employment medical examination.
7.4.2 Safety Plan
Safety of both men and materials during construction and operation phases is of concern. Safety plan shall be prepared and implemented in the proposed power plant. The preparedness of an industry for the occurrence of possible disasters is known as emergency plan. The disaster in the plant is possible due to collapse of structures and fire/explosion etc.
The power plant would formulate safety policy keeping in view the safety requirement during construction, operation, maintenance phases, with the following regulations:
To allocate sufficient resources to maintain safe and healthy conditions of work;
To take steps to ensure that all known safety factors are taken into account in the design, construction, operation and maintenance of plants, machinery and equipment;
To ensure that adequate safety instructions are given to all employees;
To provide wherever necessary protective equipment, safety appliances and clothing and to ensure their proper use;
To inform employees about materials, equipment or processes used in their work which are known to be potentially hazardous to health or safety;
To keep all operations and methods of work under regular review for making necessary changes from the point of view of safety in the light of experience and up to date knowledge;
To provide appropriate facilities for first aid and prompt treatment of injuries and illness at work;
To provide appropriate instruction, training, retraining and supervision to employees in health and safety, first aid and to ensure that adequate publicity is given to these matters;
To ensure proper implementation of fire prevention methods and an appropriate fire fighting service together with training facilities for personnel involved in this service;
To organize collection, analysis and presentation of data on accident, sickness and incident involving people injury or injury to health with a view to taking corrective, remedial and preventive action;
To promote through the established machinery, joint consultation in health and safety matters to ensure effective participation by all employees;
To publish/notify regulations, instructions and notices in the common language of employees;
To prepare separate safety rules for each type of occupation/processes involved in a plant; and

7-31
To ensure regular safety inspection by a competent person at suitable intervals of all buildings, equipments, work places and operations.
7.4.3 Safety Organization
Construction and Erection Phase
A qualified and experienced safety officer shall be appointed. The responsibilities of the safety officer include identification of the hazardous conditions and unsafe acts of workers and advice on corrective actions, conduct safety audit, organize training programs and provide professional expert advice on various issues related to occupational safety and health. He is also responsible to ensure compliance of Safety Rules/ Statutory Provisions.
Operation and Maintenance Phase
When the construction is completed the posting of safety officers shall be in accordance with the requirement of Factories Act and their duties and responsibilities shall be as defined there of.
7.4.4 Safety Circle
In order to fully develop the capabilities of the employees in identification of hazardous processes and improving safety and health, safety circles would be constituted in each area of work. The circle would consist of five to six employees from that area. The circle normally shall meet for about an hour every week.
7.4.5 Safety Training
Safety training shall be provided by the Safety Officers with the assistance of faculty members called from Professional Safety Institutions and Universities. In addition to regular employees, limited contractor labors shall also be provided safety training. To create safety awareness safety films shall be shown to workers and leaflets shall be distributed.
Some precautions and remedial measures proposed to be adopted to prevent fires are:
Compartmentalization of cable galleries, use of proper sealing techniques of cable passages and crevices in all directions would help in localizing and identifying the area of occurrence of fire as well as ensure effective automatic and manual fire fighting operations;
Spread of fire in horizontal direction would be checked by providing fire stops for cable shafts;
Reliable and dependable type of fire detection system with proper zoning and interlocks for alarms are effective protection methods for conveyor galleries;
Housekeeping of high standard helps in eliminating the causes of fire and regular fire watching system strengthens fire prevention and fire fighting; and
Proper fire watching by all concerned would be ensured.

7-32
7.4.6 Health and Safety Monitoring Plan
The health of all employees shall be periodically monitored for early detection of any ailment due to exposure to heat and noise.
7.5 Risk Assessment
7.5.1 Introduction
Hazard analysis involves the identification and quantification of the various hazards (unsafe conditions) that exist in the proposed TPP operations. On the other hand, risk analysis deals with recognition and computation of risks, the equipment in the plant and personnel are prone to, due to accidents resulting from the hazards present in the plant.
Risk analysis follows an extensive hazard analysis. It involves the identification and assessment of risks the neighboring populations are exposed to as a result of hazards present. This requires a thorough knowledge of failure probability, credible accident scenario, vulnerability of population etc. Much of this information is difficult to get or generate. Consequently, the risk analysis is often confined to maximum credible accident studies.
7.5.2 Approach to the Study
Risk involves the occurrence or potential occurrence of some accidents consisting of an event or sequence of events. The risk assessment study covers the following:
Identification of potential hazard area;
Identification of representative failure cases;
Visualization of the resulting scenarios in terms of fire and explosion;
Assess the overall damage potential of the identified hazardous events and the impact zones form the accidental scenarios;
Furnish the recommendations on the minimization of the worst accident possibilities
Preparation of Disaster Management Plan;
Emergency Plan, which includes Occupational and Health Safety Plan;
7.5.3 Hazard Identification
Identification of hazards in the proposed TPP is of primary significance of the analysis, and quantification. Hazard states the characteristics of system/plant/process that presents potential for an accident. All the components of a system/plant/process need to be thoroughly examined to assess their potential for initiating or propagating an unplanned event/sequence of events, which can be termed as an accident.
7.5.3.1 Major Hazardous Units
The major Hazardous chemicals to be stored, transported, handled and utilized within the plot area are summarized in the Table-7.4. The fuel storage details is given in Table 7.5

7-33
Table-7.4:Major Hazardous Chemicals To Be Stored/Transported/Handled
Materials Hazardous Properties LDO Dangerous Goods Class 3 – Flammable Liquid HFO Dangerous Goods Class 3 – Flammable Liquid
Table-7.5: Fuel Storage Tanks
Materials No. of Tanks Capacity (KL) Classification LDO 1 2100 Non-dangerous Petroleum HFO 1 2100 Non-dangerous Petroleum
7.5.4 Hazard Assessment and Evaluation
7.5.4.1 Methodology
An assessment is conducted for the purpose of identifying and examining hazards related to feed stock materials, major process components, utility and support systems, environmental factors, proposed operation, facilities and safe guards.
7.5.4.2 Preliminary Hazard Analysis (PHA)
A preliminary hazard analysis is carried out initially to identify the major hazards associated with storages and the processes of the plant. This is followed by consequence analysis to quantify hazards. The preliminary hazard analysis for fuel storage area and whole is given below Table-7.6 and Table-7.7.
Table-7.6: Preliminary Hazard Analysis for Fuel Storage Area
Materials No. of Tanks Capacity (KL) Hazard Identified LDO 1 250 Fire/Explosion HFO 1 500 Fire/Explosion
Table-7.7: Preliminary Hazard Analysis For Whole Plant In General
PHA
Category
Description of Plausible Hazard
Recommendation Provision
Environmental Factors
If there is any leakage and eventually of source of ignition.
- All electrical fittings and cables shall be provided as per the specified standards. All motor, starters are flame proof.
Environmental Factors
Highly inflammable nature of the liquid of fuels may cause fire hazard in the
A well designed fire protection including foam, dry powder, and CO2 extinguisher
Fire extinguisher of small size and big size shall be provided at all

7-34
storage facility should be provided potential fire hazard places.
7.5.5 Maximum Credible Accident Analysis (MCAA)
Hazardous substances may be released as a result of failures or catastrophes, causing possible damage to the surrounding area. Major hazards posed by flammable storage can be identified taking recourse to MCA analysis. MCA analysis is to identified the hazards and calculate the consequence effects in terms of damage distances of heat radiation, toxic releases, VCE etc. Depending upon the effective hazardous attributes and their impact on events, the maximum effect on the surrounding environment at the respective damage caused can be assessed.
The results of consequence analysis are useful for getting information about all known and unknown effects that are of importance when some failure scenario occurs in the plant and how deal with possible catastrophic events.
7.5.5.1 Damage Criteria
The fuel storage and unloading at the storage facility may lead to fire and explosion hazards. The damage criteria due to an accidental release of any hydrocarbon arise form fire and explosion. Tank fire would occur if the radiation intensity is high on the peripheral surface of the tank to increase in internal tank pressure. Pool fire would occur when fuels collected in the dye due to leakages gets ignited.
The damage effect on equipment and people due to thermal radiation intensity is given in Table-7.8. Similarly, the effect of incident radiation intensity and exposure time on lethality is given in Table-7.9.
Table-7.8: Damage Due to Incident Radiation Intensities
Sr. No. Incident Radiation (KW/m2)
Type of Damage Intensity Damage to Equipment Damage to People
1 37.5 Damage to process equipment 100 % lethality in 1 Min., 1% lethality in 10 sec.
2 12.5 Minimum energy required for piloted ignition of wood, melting plastic tubing
1% lethality in 1 min., First degree burns in 10 sec
3 4.0 - Causes pain if duration in longer than 20 sec., however blistering is un-likely (first degree burns)
Table-7.9: Radiation Exposure And Lethality
Radiation Intensity (KW/m2)
Exposure Time (sec.)
Lethality (%) Degree of Burns
4.0 20 0 1st

7-35
4.0 50 0 1st 12.5 20 <1 3rd 12.5 50 8 2nd 12.5 Inst. 10 3rd 37.5 Inst. 100 -
7.5.5.2 Consequence Analysis Calculations
The Consequence Analysis has been done for selected scenarios. This has been done for weather conditions having wind speed 1.89 m/s. In Consequence Analysis, geographical location of the source of potential release plays an important role. Consideration of a large number of scenarios in the same geographical location serves little purpose if the dominant scenario has been identified and duly considered.
Scenarios
Based on storage and consumption of various fuels the following failure scenarios for the proposed TPP have been identified.
Table -7.10: Scenarios Considered
Scenario MCL Scenario Quantity
Scenarios Considered
1 Failure of LDO Tank 250 KL Pool Fire 2 Failure of HFO Tank 500 KL Pool Fire
7.5.5.3 Results
The results are tabulated indicating the distances for various damages identified.
Table-7.11: Occurrence Of Various Radiation Intensities – Pool Fire
Radiation and Effect Radiation Intensities (KW/m2)/ Distances (m) 37.5 12.5 4.0
Failure of LDO Tank 6.37 12.1 19.87 Failure of HFO Tank 23.43 46.6 80.63
The damage contours for tank on fire of LDO tank and HFO tank is given in Figure-7.3 and 7.4 respectively.

7-36
Figure 7.3: Risk Contour for LDO Storage

7-37
Figure 7.4: Risk Contour for HFO Storage
37.5 KW/m2
12.5 KW/m2
4.0 KW/m2
7-38
7.5.6 Coal Handling – Dust Explosion
Coal dust when dispersed in air and ignited would explode. Crusher house and conveyor systems are susceptible to this hazard. Failure of dust extraction and suspension system may lead to abnormal conditions and may increase the concentration of coal dust to the explosive limits. Characteristics of dust explosions are that it sets off secondary explosions after the occurrence of initial dust explosion. Enough to destroy structures kill or injure to people and set dangerous fires.
Control Measures
The total quantity of coal shall be stored in separate stockpiles, with proper drains around to collect washouts during monsoon season. Water sprinkling system shall be installed on stocks of coal in required scales to prevent spontaneous combustion and consequent fire hazards. The stock geometry shall be adopted to maintain minimum exposure of stock pile areas. towards predominant wind direction.
7.5.7 Risk Assessment Summary
The assessment has been carried out for the proposed plant and associated facilities and the conclusions are as follows.
There will be no significant community impacts or environmental damage consequences;
The hazardous events scenarios and risks in general at this facility can be adequately managed to acceptable levels by performing the recommended safety studies as part of detailed design, control strategies and implementing a Safety Management System. The equipment shall be provided with enough protection system to fail safe.
7.5.8 Risk Reduction Opportunities
The following opportunities shall be considered as a potential means of reducing identified risks during the detailed design phase:
Buildings and plants structures shall be designed for cyclone floods and seismic events to prevent structural collapse and integrity of weather (water) proofing for storage of goods;
Provision for adequate water capacity to supply fire protection systems and critical process water;
Isolate people from load carrying/mechanical handling systems, vehicle traffic and storage and stacks locations;

CHAPTER - 8
PROJECT BENEFITS
8-1
Power being an important requirement for sustained economic growth has always been a priority. With the advent of industrialization there has been a steady increase in the electricity. In view of above, it is essential to set up power generation plants to meet the planned power generation of the 11th Plan. For the Western Zone of India that covers large areas of high population and high industrial development, demand is much more. As against the State’s projected demand of 17000 MW, Gujarat has only 8000 MW. The documents such as 11th National Electricity Plan and review by Gujarat Urja Vikas Nigam Ltd (GUVNL) indicate substantial shortfall in the energy demand of the State. Furthermore, the demand is slated to grow at an annual rate of 10 %. The proposed power project is likely to reduce the peak power deficit of 9000 MW, to some extent. The entire western grid inclusive of Gujarat, Goa, Maharashtra and Madhya Pradesh, has an annual peak load growth of 8.75 % and the situation is likely to continue up to year 2020, indicating need for generating electricity for bridging the gap between the demand and supply. Government of India too, has formulated a policy to encourage participation by private sector (Indian or Foreign) in the electricity generation, supply and distribution field for bring in additional resources in Power sector.
The present project proposes to utilize petroleum coke, which is usually disposed off without any benefits, for generating power and assumes significance in the wake of current power scenario.
The project will create direct and several indirect employment opportunity. About 300-500 workers will get employment during the construction period for 48 months. The bulk of labour force will be unskilled and semi-skilled who will be recruited from the surrounding villages. About 150 people will get direct employment in the plant. In addition there will be indirect employment to locals due to the enhanced income levels in the area. Many more are expected to get indirect employment from the project. The infrastructure facilities of the area will get developed and improved. The overall socio-economic condition of the area and quality of life of the residents will improve.
8.1 Improvements in the Physical Infrastructure
The beneficial impact of proposed power project on the civic amenities will be substantial after the commencement of project activities. The basic requirement of the community needs will be strengthened by extending healthcare, and educational facilities to the community, building/strengthening of existing roads in the area. Essar will initiate the above amenities either by providing or by improving the facilities in the area, which will help in uplifting the living standards of local communities.
8.2 Improvement in the Social Infrastructure
Generation of employment: The project will create opportunities for direct and indirect employment; Recruitment for the unskilled and semiskilled workers for the proposed project will be from the nearby villages;

8-2
Increase in purchasing power and improved standard of living of the area;
Further development of small and medium scale industries may be developed as consequence;
Increased revenue to the state by way of royalty, taxes and duties;
Overall growth of the neighboring area viz.:
Agriculture and animal husbandry;
Health and family welfare;
Sustainable livelihood and strengthening of village self help groups; and
Infrastructure development.
In addition to above, due to increase in purchasing power of local habitants:
There shall be significant change in the socio-economic scenario of the area;
The proposed project shall enhance the prospects of employment;
Recruitment for the unskilled and semiskilled workers for the proposed project will be from the nearby villages;
The basic amenities viz. roads, transportation, electricity, proper sanitation, educational institutions, medical facilities, entertainment etc will be developed as far as possible; and
Overall the proposed project will change living standards of the people and improve the socioeconomic conditions of the area.
8.3 Employment Potential
The impact of the project on the economic aspects can be clearly foreseen. The proposed project activities will provide employment to persons of different skills and trades. The local population will be given preference in employment. The employment potential will ameliorate economic conditions of these families directly and provide employment to many other families indirectly who are involved in business and service oriented activities.
The employment of local people in primary and secondary sectors of project shall upgrade the prosperity of the region. This in turn will improve the socio-economic conditions of the area.
During construction phase of the project, this project will provide temporary employment to many unskilled and semi skilled laborers in nearby villages. This

8-3
project will also help in generation of indirect employment to those people who render their services for the personnel directly working in the project; and
During operational phase, considerable number of people will be benefited by provision of services to the residents. Thus, there will be direct and indirect employment generation by this project.
The trend of out migration for employment, if any, is likely to be reduced due to better economic opportunities available in the area.
During the construction phase about 300 to 500 people on average per day will be employed.
8.4 Corporate Social Responsibility
EPSL along with EOL shall take up locally a number of CSR activities which shall include but not limited to:
Scholarship scheme for worthy students in the nearby villages;
Old age pension for aged and needy persons in the village;
Medical aid;
Extend facility of ambulance to the locals in case of emergency;
Organize medical camps and free distribution of medicines;
Supply of drinking water;

CHAPTER - 9
CONSULTANT ENGAGED

9-1
9.1 PREFACE
M/s. Essar Power Salaya Limited (EPSL), Jamnagar proposes 600 (4 x 150) MW Power Project based on Circulating Fluidized Bed Combustion (CFBC) Technology using Pet coke and Imported coal. Since this proposed project activity require Environmental Impact Assessment Studies and Environmental Clearance, the Company has entrusted M/s. Anand Consultants, Ahmedabad for carrying out the EIA Studies as per the prevailing rules and regulations.
The proposed project activity requires processing as per the EIA Notification, 2006 of Ministry of Environment & Forest, Government of India, and falls under Category A-1 (d) (Thermal Projects). As a part of Environment clearance procedure, EPSL has obtained the Terms of Reference (TOR) for undertaking Environment Impact Assessment studies during the 30th meeting held on August 8-9, 2011. Essar has engaged M/s. Anand Consultants, Ahmedabad, a QCI qualified consultant for undertaking EIA Studies as per the received TOR and preparation of Environment Management Plan, within the framework of the prevailing rules and regulations.
9.2 INTRODUCTION
ANAND CONSULTANTS (An ISO 9001: 2008 Certified Consultancy) is a group of young professionals dedicated to assignments in Pollution Control under the dynamic leadership of Mr. Rakesh Shah be it Air, Solid or Water related Pollution Control.
Since 1978 Anand Consultants have been working as Environmental Engineers in India as well as Bangladesh. During the said 30 years Anand Consultants have worked for different type of industries providing various services related to consultancy, laboratory, field studies, project execution as well as operation and maintenance. Turnkey assignments are undertaken by a sister concern. Anand Consultants happen to be Environmental Auditors appointed by the Gujarat Pollution Control Board as per the directives of the Honourable High Court of Gujarat.
Anand Consultants has already made application (S.N.-44) to NABET/QCI for the accreditation as EIA consultant organization. NABET/QCI has given provisional accreditation to our organization. The certificate of the same has been attached herewith as Annexure:- 21
Anand Consultants have the necessary manpower and expertise in various fields as also the required infrastructure facilities to carry out work related to environmental engineering.
9-2
Contact Information:
ANAND CONSULTANTS 16, Everest Tower, Naranpura, Ahmedabad – 380 013, Gujarat. Phone: 079-27484871 Fax: 079-27480116 e-mail: [email protected] [email protected]
9.3 AREAS OF INTEREST
A. Consultancy Services
Project report preparation. Treatability studies. Guidelines for site selection for industry. Design & modification of the Effluent Treatment Plants (ETP)/ Common Effluent
Treatment Plants (CETP)/Sewage Treatment Plants (STP). Design of pipeline systems. Supervision of civil/mechanical works for treatment plants. Preparation of operation and maintenance manuals of treatment plants. Selection and design of disposal sites for solid waste. Design of air pollution control equipment. Supervision of erection of air pollution control equipment. Development of environmental management systems. Assistance related to obtaining ISO 14000 Certification.

9-3
Water harvesting. Cleaner production assignments. Liaison with statutory authorities in technical matters.
B. Laboratory Services Analysis of raw-water and waste-water samples for various parameters such as pH,
Suspended Solids, Chemical Oxygen Demand, Biochemical Oxygen Demand, Oil & Grease, Dissolved Oxygen, Ammonical Nitrogen, Phenolic Compounds, Sulphates, Copper, Iron, MLSS, MLVSS and Bioassay studies.
Analysis of solid waste samples. Collection and analysis of source emissions from flue gas stacks and process vents. Monitoring and analysis of ambient air quality. Noise level monitoring. Laboratory scale treatability studies.
C. Operation & Maintenance Services
Operation and maintenance of effluent/sewage/common treatment plants. Operation & maintenance of air pollution control systems.
D. Manpower Training
Training of manpower for operation, maintenance and analytical aspects related to effluent/sewage/common treatment plants.
Education and training related to source emission/ambient air quality monitoring and
analysis. E. Field Studies & Surveys
Environmental Impact Assessment studies.

9-4
Water Audits. Risk Assessment studies. Feasibility studies. Collection and measurement of meteorological data.
F. Computer Application Studies
Source emission dispersion modeling for the prediction and assessment of post – project ambient air quality scenarios.
Plotting of Windroses from meteorological data.
G. Turnkey Services
Complete turnkey supply of water/wastewater treatment plants and air pollution/water pollution control equipment through a sister concern.
H. Pollution Control Chemicals Supply
Supply of chemicals such as coagulants, polyelectrolyte, Activated Carbon etc. through a sister concern.

9-5
9.4 LIST OF TECHNICAL EXPERTS
Name Designation Degree Years of Experience
Mr. Rakesh C. Shah (Sole Proprietor )
Environmental Engineer M.S (U.S.A.) B.Tech (IIT),
33
Mr. Vimal Chokhavatia (Empanelled expert)
Environmental Engineer M.S. (Env. Engineering) B.E. (Civil)
36
Dr. Gautam K. Trivedi (Empanelled Expert)
Environmental Scientist
Ph.D. M.Sc.
(Organic Chemistry)
34
Mr. Sureshchandra P. Vyas (Empanelled Expert)
Geo-hydrologist M.Sc. (Applied Geology)
B.Sc. (Geology)
42
Dr. Manoj Eledath (Empanelled Expert)
Environmental Scientist
Ph.D. M.Sc. (Biosciences)
19
Mr. Mukesh Suroliya (Empanelled Expert)
Geologist M.Sc. (Geology) B.Sc. (Chemistry)
5.5
Mr. M. M. Khatri (In-house Expert)
Chemist M.Sc. (Organic Chemistry)
B.Sc. (Chemistry)
22
Mrs. Purvi A. Patel (In-house Expert)
Environmental Scientist M.Sc. (Env. Science) B.Sc. (Microbiology)
5.0
Ms. Dipal H. Shah (In-house Expert)
Environmental Scientist M.Sc. (Env. Science) B.Sc. (Chemistry)
3.5
Mrs. Neel P. Patel Environmental Scientist M.S. (Env. Technology) B.Sc. (Chemistry)
2.5
Mr. Haresh L. Makwana Chemist B.Sc. (Chemistry)
2.5
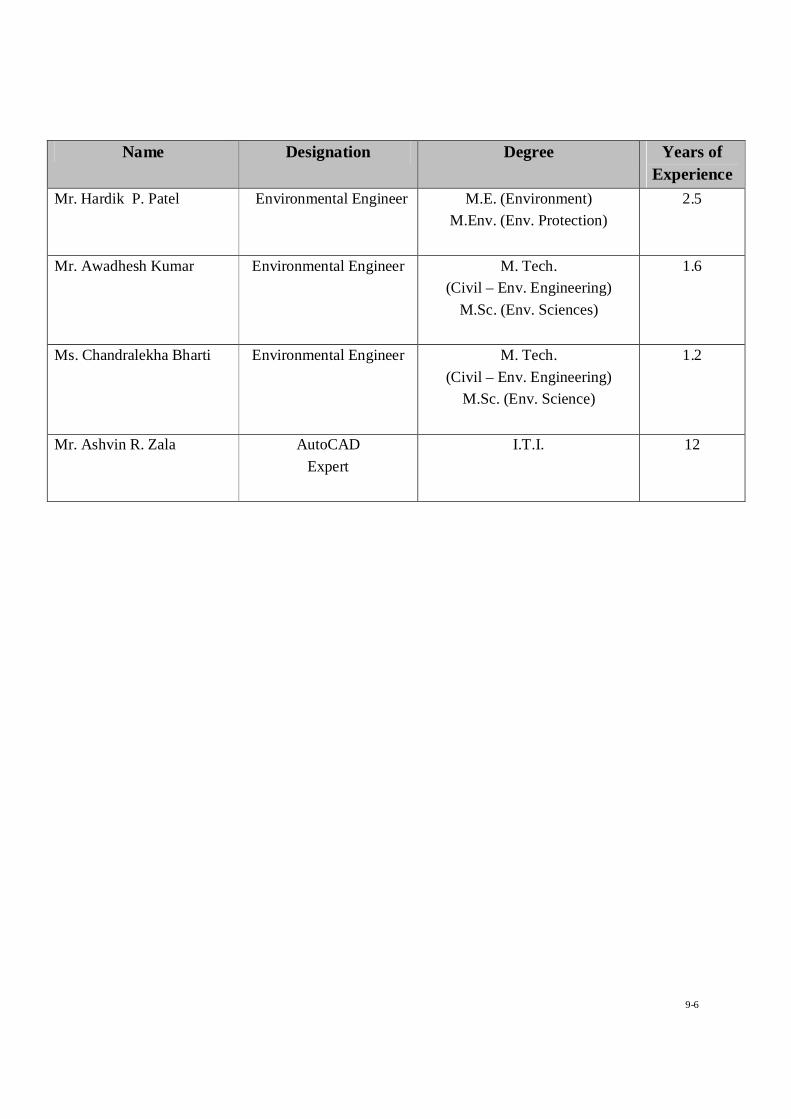
9-6
Name Designation Degree Years of Experience
Mr. Hardik P. Patel Environmental Engineer M.E. (Environment) M.Env. (Env. Protection)
2.5
Mr. Awadhesh Kumar Environmental Engineer M. Tech. (Civil – Env. Engineering)
M.Sc. (Env. Sciences)
1.6
Ms. Chandralekha Bharti Environmental Engineer M. Tech. (Civil – Env. Engineering)
M.Sc. (Env. Science)
1.2
Mr. Ashvin R. Zala AutoCAD Expert
I.T.I. 12