at your service! - · pdf filehindustan sanitaryware & industries ... the company was...
TRANSCRIPT

Hindustan Sanitaryware & Industries Limited Annual Report 2007-08
At your service!
3
Hindustan Sanitaryware & Industries LimitedHindustan Sanitaryware & Industries Limited
Customers are lost at the pointof sale than most would care toconcede. More customers are lostafter the sale than most wouldcare to recognise.
At Hindustan Sanitaryware, wehave enjoyed one of the largestshares of India’s sanitarywareand container glass segments fordecades.
Through a singular commitment.
Service!
Forward-looking statementIn this Annual Report we have disclosed
forward-looking information to enable
investors to comprehend our prospects and
take informed investment decisions. This
report and other statements - written and oral
- that we periodically make contain forward-
looking statements that set out anticipated
results based on the management’s plans and
assumptions. We have tried wherever possible
to identify such statements by using words
such as ‘anticipate’, ‘estimate’, ‘expects’,
‘projects’, ‘intends’, ‘plans’, ‘believes’, and
words of similar substance in connection with
any discussion of future performance.
We cannot guarantee that these forward-
looking statements will be realised, although
we believe we have been prudent in our
assumptions. The achievement of results is
subject to risks, uncertainties and even
inaccurate assumptions. Should known or
unknown risks or uncertainties materialise, or
should underlying assumptions prove
inaccurate, actual results could vary materially
from those anticipated, estimated or
projected. Readers should bear this in mind.
We undertake no obligation to publicly
update any forward-looking statements,
whether as a result of new information, future
events or otherwise.
ContentsCorporate identity 3 Corporate highlights 4 Statement from the Chairman and Managing Director 14Joint Managing Director’s review 16 Management’s Discussion and Analysis 20 Financial review 48Risk management 52 Board of Directors 56 Five-year financial summary 58 Ratio analysis 60Directors’ Report 62 Corporate Governance Report 70 Financial section 81
3
Hindustan Sanitaryware & Industries Limited
2
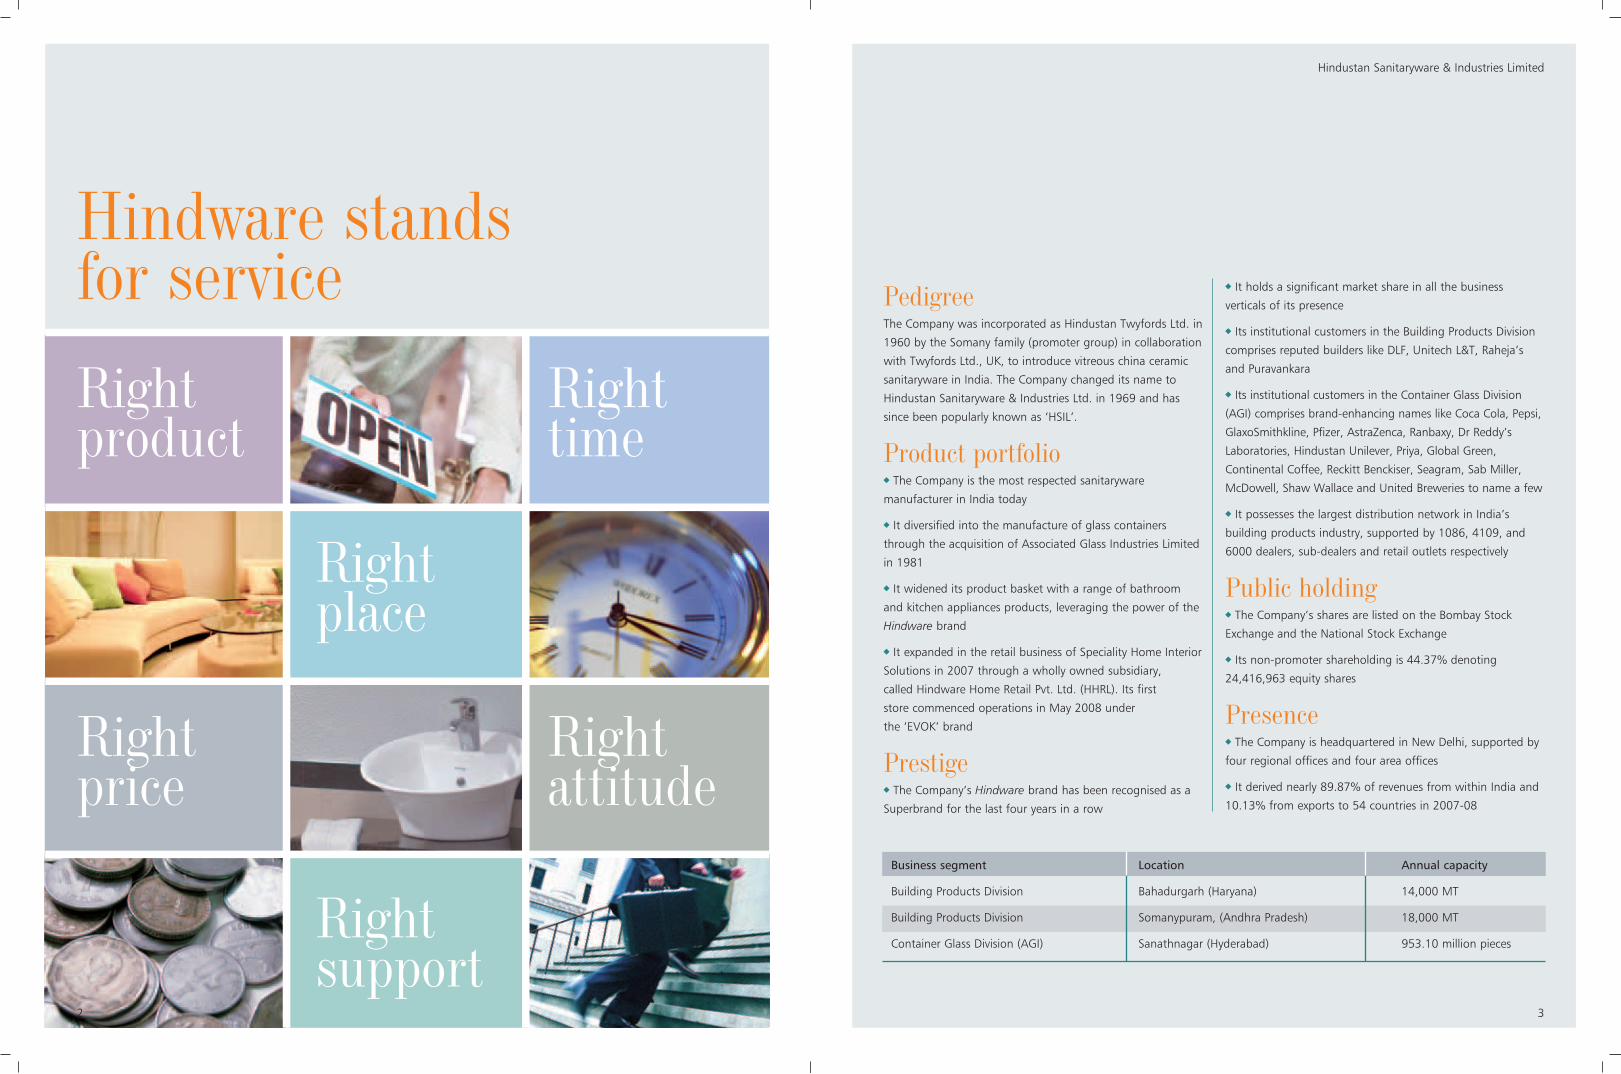
Hindware standsfor service
Rightproduct
Righttime
Rightprice
Rightplace
Rightsupport
Rightattitude
PedigreeThe Company was incorporated as Hindustan Twyfords Ltd. in
1960 by the Somany family (promoter group) in collaboration
with Twyfords Ltd., UK, to introduce vitreous china ceramic
sanitaryware in India. The Company changed its name to
Hindustan Sanitaryware & Industries Ltd. in 1969 and has
since been popularly known as ‘HSIL’.
Product portfolioThe Company is the most respected sanitaryware
manufacturer in India today
It diversified into the manufacture of glass containers
through the acquisition of Associated Glass Industries Limited
in 1981
It widened its product basket with a range of bathroom
and kitchen appliances products, leveraging the power of the
Hindware brand
It expanded in the retail business of Speciality Home Interior
Solutions in 2007 through a wholly owned subsidiary,
called Hindware Home Retail Pvt. Ltd. (HHRL). Its first
store commenced operations in May 2008 under
the ‘EVOK’ brand
Prestige The Company’s Hindware brand has been recognised as a
Superbrand for the last four years in a row
It holds a significant market share in all the business
verticals of its presence
Its institutional customers in the Building Products Division
comprises reputed builders like DLF, Unitech L&T, Raheja’s
and Puravankara
Its institutional customers in the Container Glass Division
(AGI) comprises brand-enhancing names like Coca Cola, Pepsi,
GlaxoSmithkline, Pfizer, AstraZenca, Ranbaxy, Dr Reddy’s
Laboratories, Hindustan Unilever, Priya, Global Green,
Continental Coffee, Reckitt Benckiser, Seagram, Sab Miller,
McDowell, Shaw Wallace and United Breweries to name a few
It possesses the largest distribution network in India’s
building products industry, supported by 1086, 4109, and
6000 dealers, sub-dealers and retail outlets respectively
Public holdingThe Company’s shares are listed on the Bombay Stock
Exchange and the National Stock Exchange
Its non-promoter shareholding is 44.37% denoting
24,416,963 equity shares
PresenceThe Company is headquartered in New Delhi, supported by
four regional offices and four area offices
It derived nearly 89.87% of revenues from within India and
10.13% from exports to 54 countries in 2007-08
Business segment Location Annual capacity
Building Products Division Bahadurgarh (Haryana) 14,000 MT
Building Products Division Somanypuram, (Andhra Pradesh) 18,000 MT
Container Glass Division (AGI) Sanathnagar (Hyderabad) 953.10 million pieces
5
Hindustan Sanitaryware & Industries Limited
4
This is what weachieved in2007-08Absolutes
9.58% increase in revenue from Rs. 5,329.74 million in
2006-07 to Rs. 5,840.38 million in 2007-08; a CAGR of
13.67% over the last five years
4.77% increase in EBIDTA from Rs. 846.92 million in
2006-07 to Rs. 887.33 million in 2007-08; a CAGR of
11.57% over the last five years
1.91% increase in cash profit from Rs. 539.37 million in
2006-07 to Rs. 549.65 million in 2007-08; a CAGR of
7.33% over the last five years
Marketing 13.10% increase in revenue from the Building Products
Division to Rs. 3,044.33 million
5.19% increase in revenue of the Container Glass
Division to Rs. 2,752.39 million
Introduced 28 new designs in the manufactured
sanitaryware products and added 138 new models in the
outsourced product range
Manufacturing Highest capacity utilisation of 107.10% at the Bahadurgarh
plant
Capacity utilisation of 89.28% at the Somanypuram plant
Sanitaryware plants witnessed a 8.55% increase in capacity
utilisation to 97.08%
AGI witnessed a 8.87% increase in plant capacity utilisation
to 89.65%
3.42% reduction in power consumption at Bahadurgarh
6.21% reduction in power consumption at Somanypuram
13.42% increase in people productivity at Bahadurgarh
10.39% increase in people productivity at Somanypuram
Recognition The Hindware brand was recognised through the
following in 2007-08:
Superbrand Consumer Validated
Business Superbrand Award
Reader’s Digest Trusted Brands Gold Award
4P’s India's 100 most Valuable Brands
4P’s Most Admired Companies Award
Mera Brand Award
Board room The Company approved the setting up of a 475 TPD
container glass manufacturing facility at Bhongir, 60 kms
from Hyderabad.
0 1000 2000 3000 4000 5000 6000
2007-08
2006-07
2005-06
2004-05
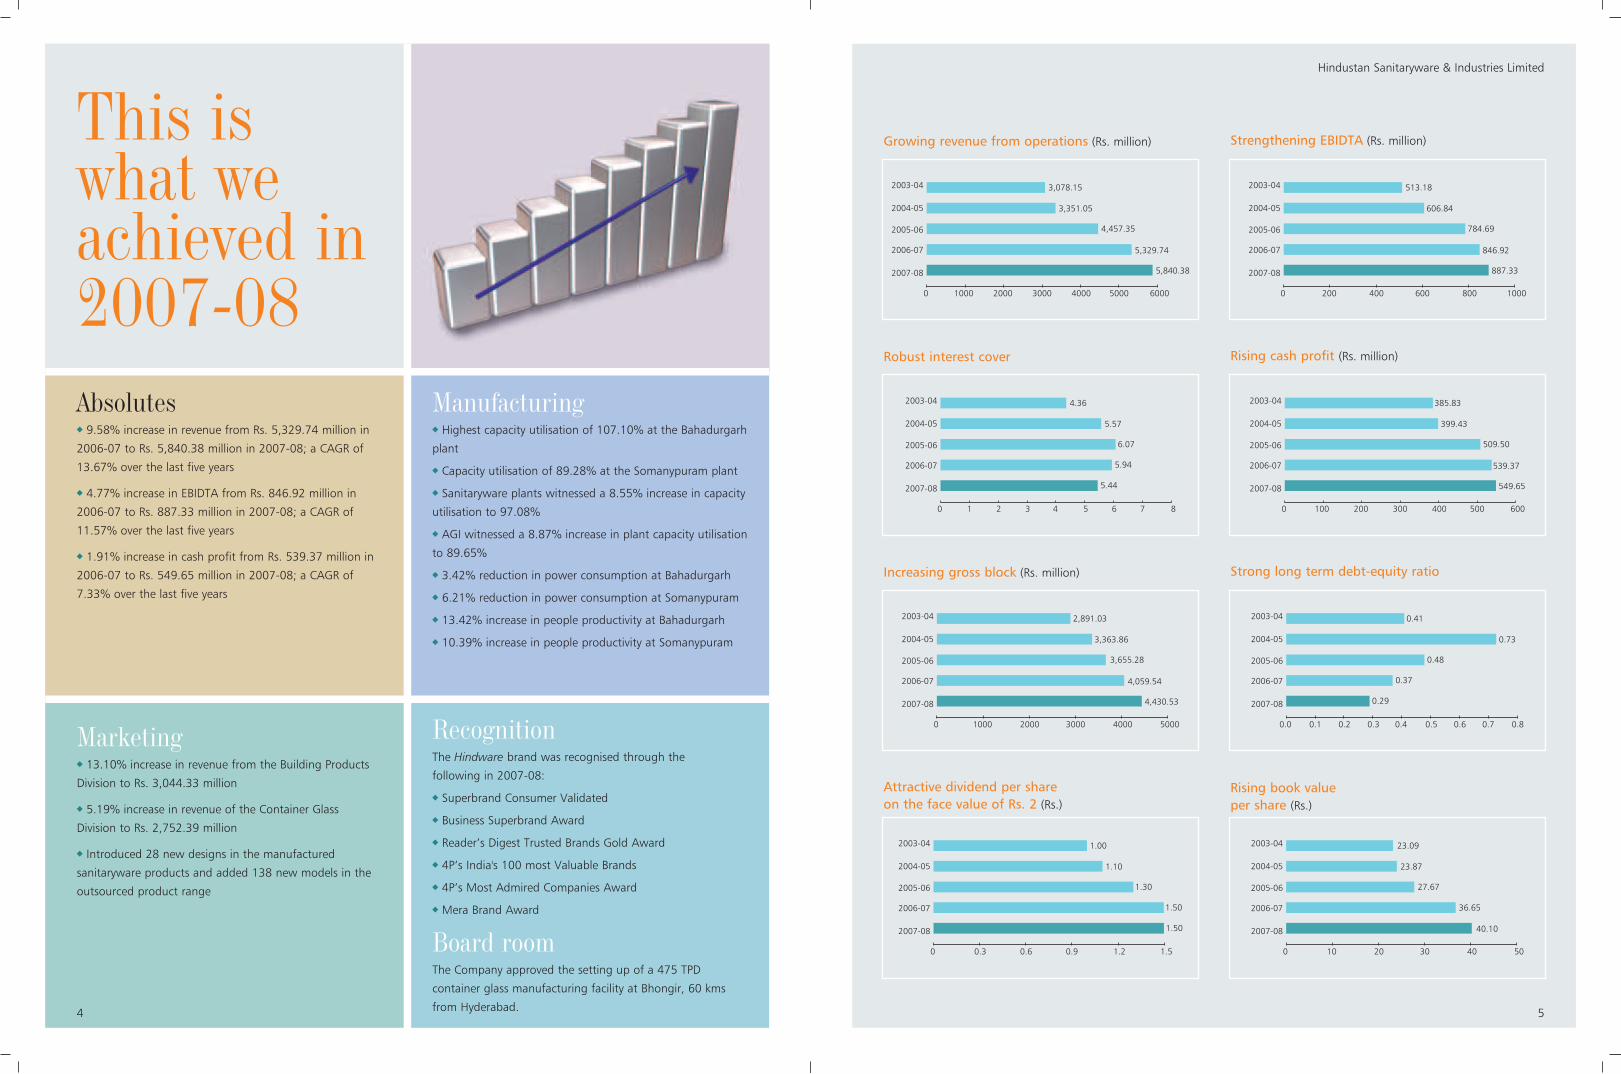
2003-04 3,078.15
3,351.05
4,457.35
5,329.74
5,840.38
0 200 400 600 800 1000
2007-08
2006-07
2005-06
2004-05
2003-04 513.18
606.84
784.69
846.92
887.33
Growing revenue from operations (Rs. million) Strengthening EBIDTA (Rs. million)
0 1 2 3 4 5 86 7
2007-08
2006-07
2005-06
2004-05
2003-04 4.36
5.57
6.07
5.94
5.44
0 100 200 300 400 500 600
2007-08
2006-07
2005-06
2004-05
2003-04 385.83
399.43
509.50
539.37
549.65
Robust interest cover Rising cash profit (Rs. million)
0 1000 2000 3000 4000 5000
2007-08
2006-07
2005-06
2004-05
2003-04 2,891.03
3,363.86
3,655.28
4,059.54
4,430.53
0.0 0.1 0.2 0.3 0.4 0.5 0.80.6 0.7
2007-08
2006-07
2005-06
2004-05
2003-04 0.41
0.73
0.48
0.37
0.29
Increasing gross block (Rs. million) Strong long term debt-equity ratio
0 0.3 0.6 0.9 1.2 1.5
2007-08
2006-07
2005-06
2004-05
2003-04 1.00
1.10
1.30
1.50
1.50
0 10 20 30 40 50
2007-08
2006-07
2005-06
2004-05
2003-04 23.09
23.87
27.67
36.65
40.10
Attractive dividend per share on the face value of Rs. 2 (Rs.)
Rising book value per share (Rs.)
7
Hindustan Sanitaryware & Industries Limited
6
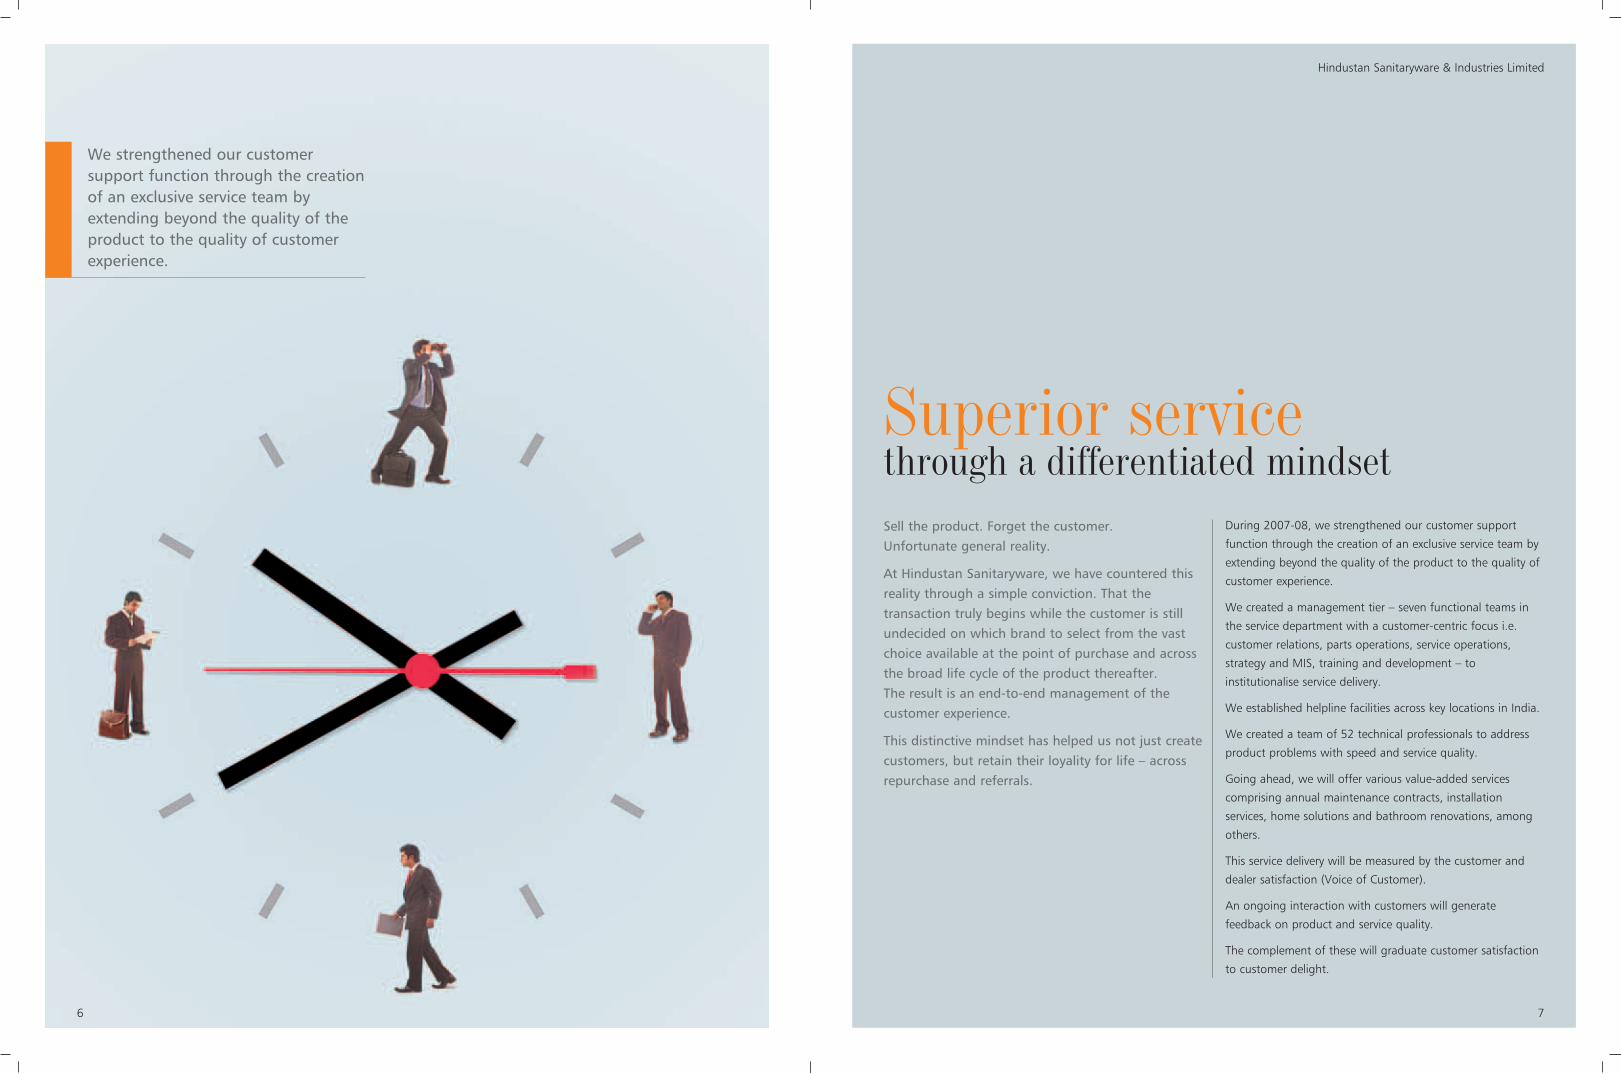
Superior servicethrough a differentiated mindset Sell the product. Forget the customer. Unfortunate general reality.
At Hindustan Sanitaryware, we have countered thisreality through a simple conviction. That thetransaction truly begins while the customer is stillundecided on which brand to select from the vastchoice available at the point of purchase and acrossthe broad life cycle of the product thereafter. The result is an end-to-end management of thecustomer experience.
This distinctive mindset has helped us not just createcustomers, but retain their loyality for life – acrossrepurchase and referrals.
During 2007-08, we strengthened our customer support
function through the creation of an exclusive service team by
extending beyond the quality of the product to the quality of
customer experience.
We created a management tier – seven functional teams in
the service department with a customer-centric focus i.e.
customer relations, parts operations, service operations,
strategy and MIS, training and development – to
institutionalise service delivery.
We established helpline facilities across key locations in India.
We created a team of 52 technical professionals to address
product problems with speed and service quality.
Going ahead, we will offer various value-added services
comprising annual maintenance contracts, installation
services, home solutions and bathroom renovations, among
others.
This service delivery will be measured by the customer and
dealer satisfaction (Voice of Customer).
An ongoing interaction with customers will generate
feedback on product and service quality.
The complement of these will graduate customer satisfaction
to customer delight.
We strengthened our customersupport function through the creationof an exclusive service team byextending beyond the quality of theproduct to the quality of customerexperience.
9
Hindustan Sanitaryware & Industries Limited
8
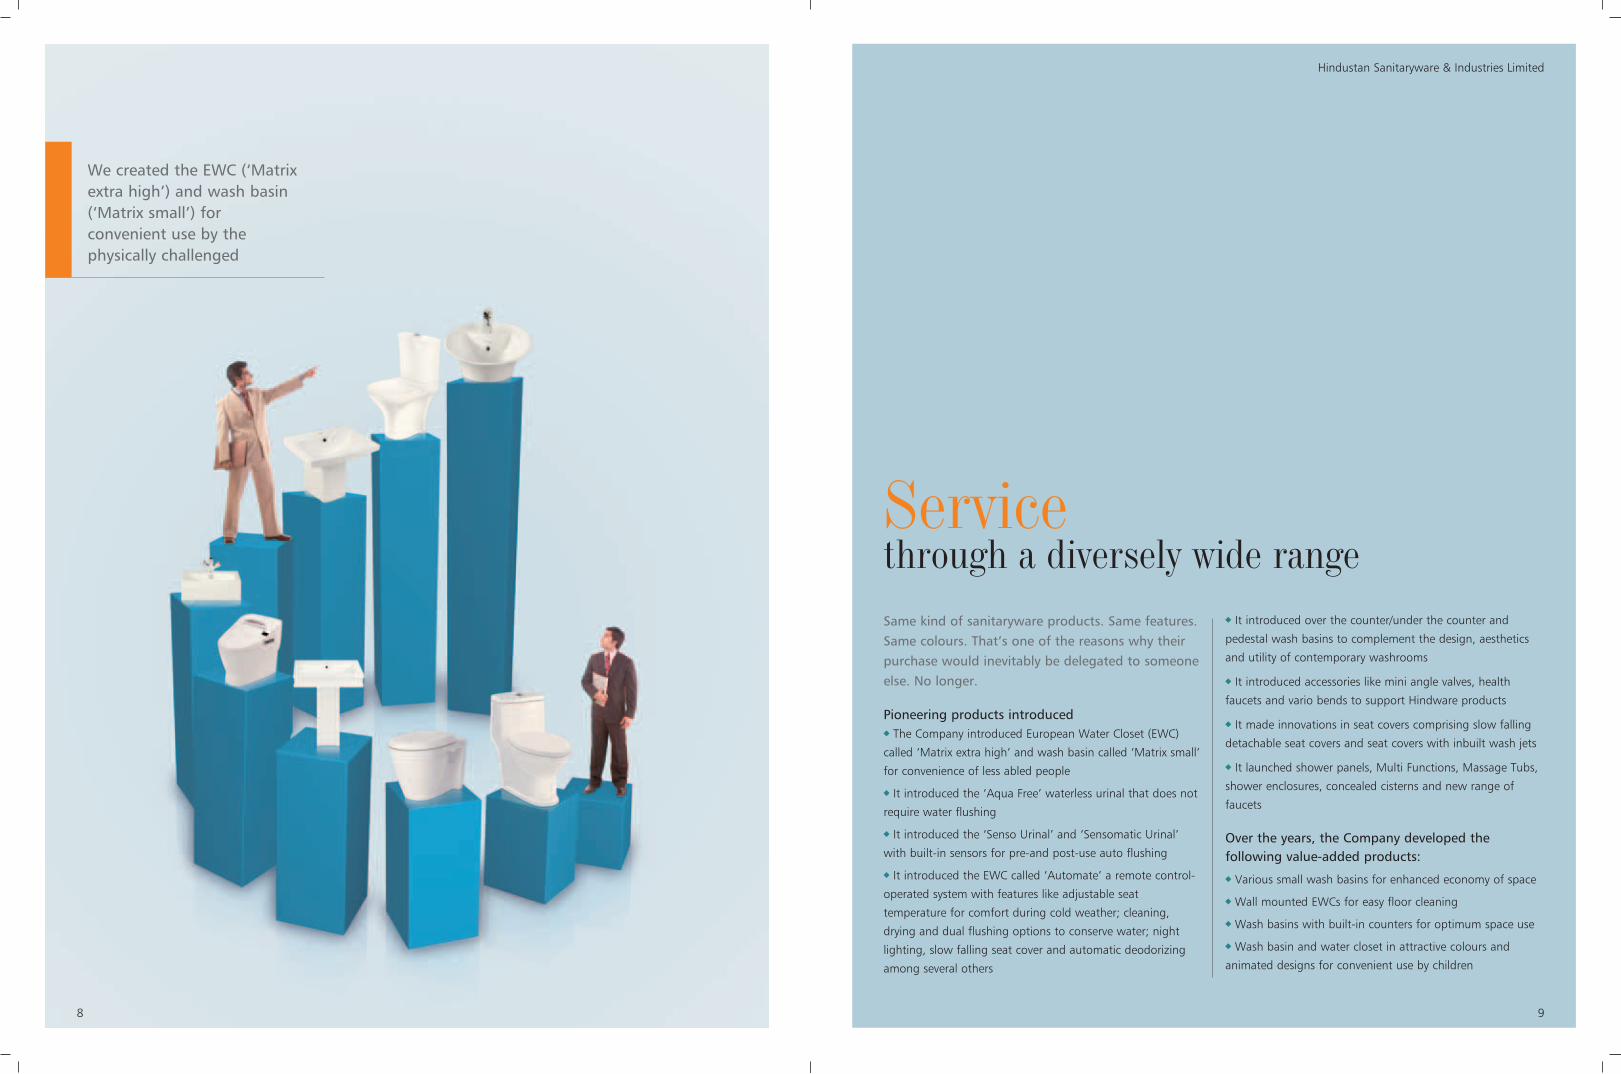
We created the EWC (‘Matrixextra high’) and wash basin(‘Matrix small’) forconvenient use by thephysically challenged
Servicethrough a diversely wide rangeSame kind of sanitaryware products. Same features.Same colours. That’s one of the reasons why theirpurchase would inevitably be delegated to someoneelse. No longer.
Pioneering products introducedThe Company introduced European Water Closet (EWC)
called ‘Matrix extra high’ and wash basin called ‘Matrix small’
for convenience of less abled people
It introduced the ‘Aqua Free’ waterless urinal that does not
require water flushing
It introduced the ‘Senso Urinal’ and ‘Sensomatic Urinal’
with built-in sensors for pre-and post-use auto flushing
It introduced the EWC called ‘Automate’ a remote control-
operated system with features like adjustable seat
temperature for comfort during cold weather; cleaning,
drying and dual flushing options to conserve water; night
lighting, slow falling seat cover and automatic deodorizing
among several others
It introduced over the counter/under the counter and
pedestal wash basins to complement the design, aesthetics
and utility of contemporary washrooms
It introduced accessories like mini angle valves, health
faucets and vario bends to support Hindware products
It made innovations in seat covers comprising slow falling
detachable seat covers and seat covers with inbuilt wash jets
It launched shower panels, Multi Functions, Massage Tubs,
shower enclosures, concealed cisterns and new range of
faucets
Over the years, the Company developed thefollowing value-added products:
Various small wash basins for enhanced economy of space
Wall mounted EWCs for easy floor cleaning
Wash basins with built-in counters for optimum space use
Wash basin and water closet in attractive colours and
animated designs for convenient use by children

11
Hindustan Sanitaryware & Industries Limited
10
Superior servicethrough convenienceDifferent products. Different places. Differentexperiences. That’s the way products have beenusually marketed.
At Hindustan Sanitaryware, we have countered thisreality through a simple belief. That more peoplewant to buy all their products and services from asingle location.
During 2007-08, this progressive realisation helpedus to strengthen our services portfolio bytransforming from a Company manufacturingproducts to a brand providing solutions andenriching the consumer experience.
InitiativesWe entered into the speciality home interior solutions
segment through brand ‘EVOK’ of our subsidiary Hindware
Home Retail Pvt. Ltd. Our ‘EVOK’ Home Fashion Mega Store
provides contemporary lifestyle concepts in living, kitchen and
bath domains
We developed a global sourcing base of best-in-class
suppliers across all product categories
We provided personalised interior design and visualisation
services through ‘Home Viz’ design studios integrated with
our retail formats. We extended our services portfolio
through EVOK Easy Finance consumer credit schemes,
warranty and installation services
We launched our first 25,000 sq.ft ‘EVOK’ – Home Fashion
Mega Store in May 2008 at Crown Interiorz Mall, Mathura
Road (Faridabad), near New Delhi. Going ahead, we plan to
open another three mega stores in the NCR in 2008-09
followed by 50 such pan-India stores with a retail footprint of
1.5 mn sq.ft within the next four-five years. Our objective is
to emerge as the first choice partner for customers, aspiring
for a value-rich single-window Home Interior Solutions.
We entered the speciality homeinterior solutions segmentthrough brand ‘EVOK’ of oursubsidiary Hindware HomeRetail Pvt. Ltd. EVOK HomeFashion Mega Stores providecontemporary lifestyle conceptsacross the living, kitchen andbath domains
13
Hindustan Sanitaryware & Industries Limited
12
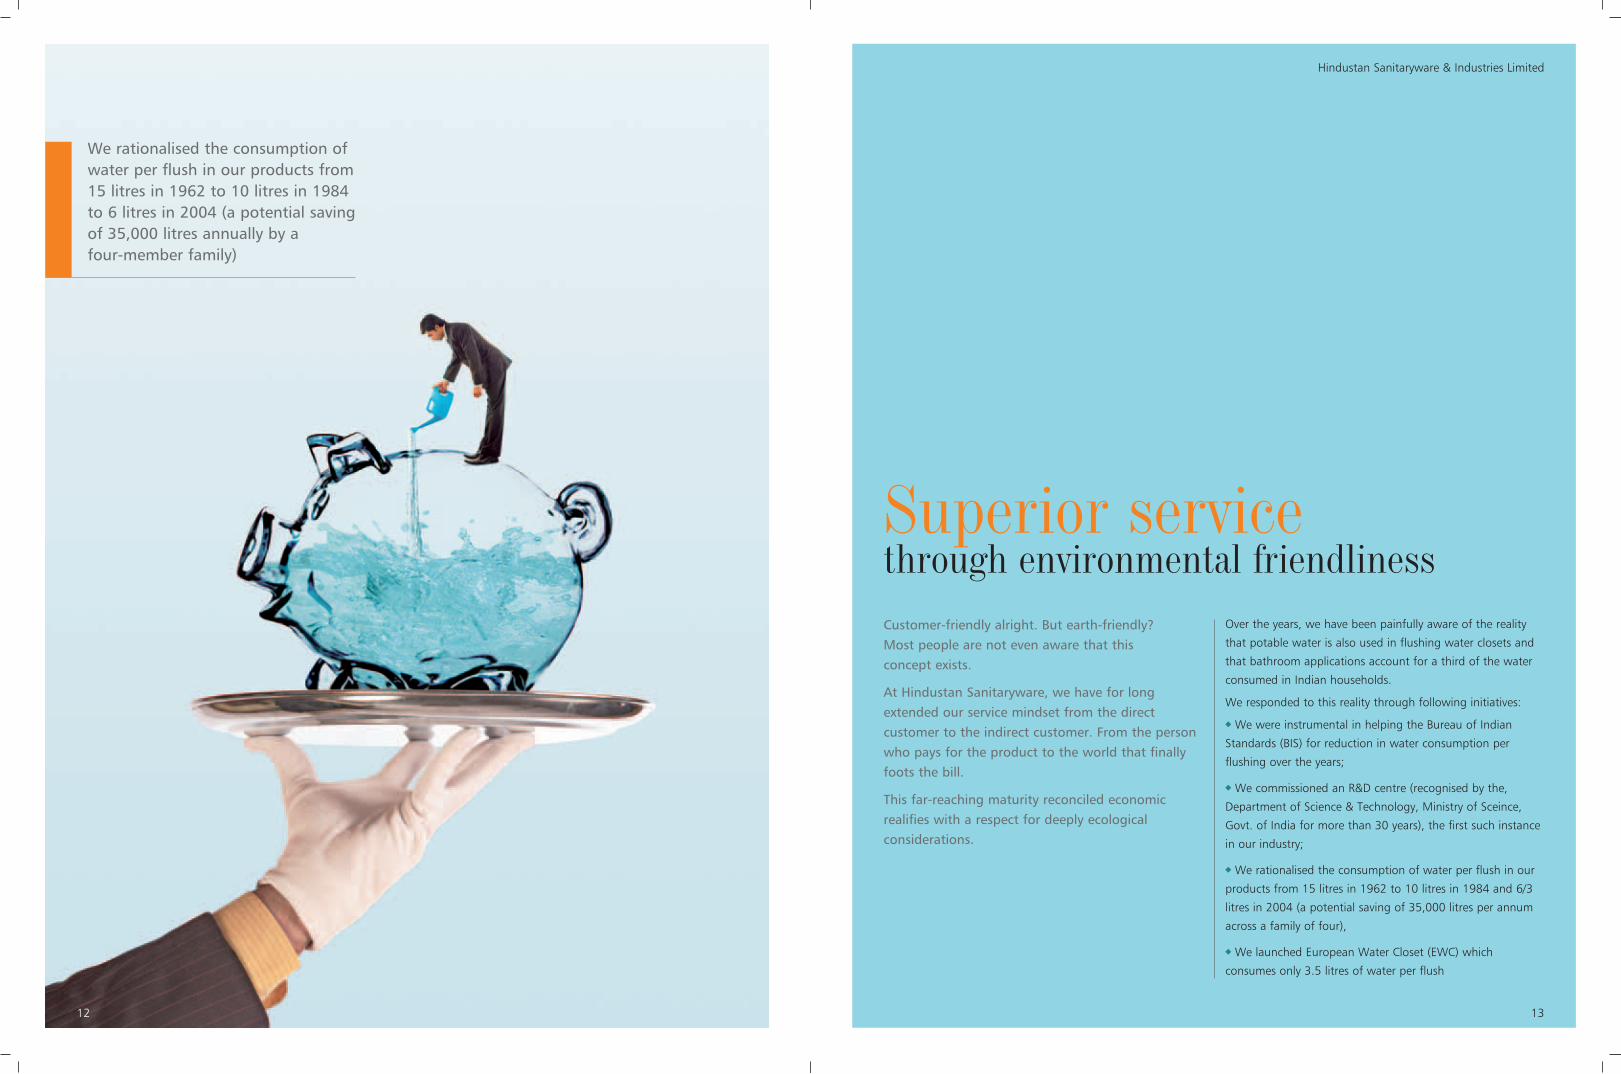
Superior servicethrough environmental friendlinessCustomer-friendly alright. But earth-friendly? Most people are not even aware that this concept exists.
At Hindustan Sanitaryware, we have for longextended our service mindset from the directcustomer to the indirect customer. From the personwho pays for the product to the world that finallyfoots the bill.
This far-reaching maturity reconciled economicrealifies with a respect for deeply ecologicalconsiderations.
Over the years, we have been painfully aware of the reality
that potable water is also used in flushing water closets and
that bathroom applications account for a third of the water
consumed in Indian households.
We responded to this reality through following initiatives:
We were instrumental in helping the Bureau of Indian
Standards (BIS) for reduction in water consumption per
flushing over the years;
We commissioned an R&D centre (recognised by the,
Department of Science & Technology, Ministry of Sceince,
Govt. of India for more than 30 years), the first such instance
in our industry;
We rationalised the consumption of water per flush in our
products from 15 litres in 1962 to 10 litres in 1984 and 6/3
litres in 2004 (a potential saving of 35,000 litres per annum
across a family of four),
We launched European Water Closet (EWC) which
consumes only 3.5 litres of water per flush
We rationalised the consumption ofwater per flush in our products from15 litres in 1962 to 10 litres in 1984to 6 litres in 2004 (a potential savingof 35,000 litres annually by a four-member family)
and sanitation will allow healthcare
agencies to save US$7 billion and
individuals US$340 million a year on
healthcare costs. Interestingly, this is
the implication:
Those aged 15-59 could gain 320
million productive working days
This would mean an extra 272 million
school attendance days a year
That would add 1.50 billion healthy
days for children under five years of
age
This would translate into productivity
gains of US$9.90 billion a year
The value of deaths averted, based on
future earnings, would amount to
US$3.60 billion a year
This would mean a total payback of
US$84 billion a year from the
US$11.73 billion annual investment
needed to meet the drinking water and
sanitation target of Millennium
Development Goal-7
ChallengesIndia is passing through one of its
highest inflation rates in years, marked
by rising land, fuel, cement, steel and
people costs. This has vast implications
for companies like ours, with high
energy intensity in both of our
businesses – Sanitaryware and
Container Glass manufacture. We need
to counter this reality through
enhanced operational efficiencies and
proactive price negotiations with
customers. By doing so, we expect to
rationalize the impact of rising costs,
although we are fully aware that we
may not be able to reduce the absolute
outgo.
In the Container Glass Division, the
availability of other substitutes for
packaging represents an area of great
concern. However, studies have shown
that harmful chemicals present in
plastic containers can have a damaging
impact on food contents, may lead to
health problems and are environment
unfriendly. With this awareness
gradually rising, we expect the trend to
soon reverse in favour of glass
packaging.
Increasing competition from foreign
brands in the Building Products Division
is another challenge. However, our
extensive pan-India presence
comprising the largest dealer network
in the industry, top-of-the-mind recall
of the Hindware brand and the largest
collection of designs are expected to
serve as an effective hedge. HSIL
possesses a dealer and sub-dealer
network nearly 25% larger than its
nearest competitor. The Hindware
brand has been recognised as a
Superbrand for the last four years. The
Company has been consistently adding
new design to its product mix. The
result: the total number of designs in
our product portfolio far exceeds the
other imported brands. In 2007-08, we
reinforced our service by creating a
dedicated wing to address the needs of
customers and in doing so expect to
emerge as the only sanitaryware brand
in India offering an end-to-end
solution.
Our social responsibilityOur service mindset is rooted from our
manufacturing operations. We are
committed to a hygienic and safe
working environment for employees.
Our plant sites are ISO
9002:14001:18001 certified,
showcasing our commitment in
meeting the highest operational health
and safety standards. All our sites are
equipped with effluent treatment
plants making zero discharge. The
treated water is used in green belt
development enhancing the aesthetics
of our factory environment.
OutlookAt HSIL, we expect that the interplay of
market bullishness and business
strengths will translate into superior
returns. While competitors attempt to
merely satisfy customers, we will
delight them through superior service.
In doing so, we expect the market
share for AGI to grow from 15% to
26% and our market share in the
Building Products Division to grow
substantially as well by 2010.
Rajendra K Somany
Chairman and Managing Director
There is a shortage of about 24.71 million housing units in India today
The share of construction as a proportion of the GDP has grown from 5.2% in 2003 to over 7% in 2007-08.
The hotel industry has a shortage of 150,000 rooms; demand is expected to exceed supply by at least100% over the next two years; rising room rates have created a demand for budget hotels
About 80% of the demand for office spaces in India is driven by the IT/ ITes sector. This sector is expectedto grow at a CAGR of 20-25% (NASSCOM estimate)
15
Hindustan Sanitaryware & Industries Limited
14
Mr. R.K. Somany, Chairman and Managing Director, outlines the basis of
his optimism across the foreseeable future.
“We expect tocapitalise on risingdisposable incomesand change in theconsumptionpattern towards‘lifestyle’ products.”
I must start on a point of humility: 2007-08 was not a superlative year for
us. We grew our revenues by 9.58% and EBIDTA by 4.77% over the
previous year.
And yet, I am optimistic and a happy man.
The short term aberration notwithstanding, I am convinced that the future
is bright for the following reasons:
There is a critical need for our business presence. One in every 10 diseases
and 6% of all deaths globally are caused by unsafe water and improper
hygiene. In India, 10.30 million people die annually and, of this, nearly
7.5% – 0.78 million deaths – is related to water, sanitation and hygiene.
The report 'Safer water for better health' – the first WHO report depicting
country-by-country estimates of the burden of disease due to water,
sanitation and hygiene – indicates that 9.1% of the global burden of
disease could be prevented simply by promoting cleanliness and sanitation.
The figure is even higher in the 32 worst-hit countries including India,
where 15% of the disease burden could be prevented by improving water,
sanitation and hygiene. The WHO report says investing in drinking water
17
Hindustan Sanitaryware & Industries Limited
16
Mr. Sandip Somany, Joint Managing Director, reviews the performance of
the Company in 2007-08 and outlines the Company’s growth strategy.
“We have beenoutperforming theindustry CAGR forthe last five years.We have now laidthe foundation toaccelerate thismomentum.”
Q: How would youassess theperformance of theCompany in 2007-08?We did moderately well during the year
under review. Our revenues increased
by 9.58% during the year and EBIDTA
rose by 4.77%. The Building Products
Division accounted for 52.13% and the
Container Glass Division contributed
47.13% during the year.
However, the reality is that our
performance was below our projections
for two reasons. One, we embarked on
a structural change in our interaction
with channel partners (dealers) that
improved the quality of our revenues
but moderated volumes marginally and
temporarily; two, our business was
affected by rising energy prices.
Q: Can youelaborate?We integrated our sales and
distribution functions with SAP during
the year. This gave us a precise
understanding of the amount of credit
within the distribution pipeline. It also
gave us an insight into how dealers
would over-order material from us
against an extended credit period,
giving us a misplaced confidence of
sales within the system. Besides, in
some cases, after ordering, the dealers
would be compelled to liquidate their
stocks at a discount or press on
returning back to us. From a brand
perspective, this was damaging and
needed to be corrected.
We responded with an increase in the
proportion of Cash/PDC (post-dated
cheque) transactions in the total sales
mix from 45% in 2005-06 to 82% in
2007-08. This translated into a decline
in receivables by 7% in terms of the
days of turnover equivalent. In other
words, we achieved a significant
improvement in the quality of our
revenues and also reallocated
organisational time from chasing
debtors to directly growing our
business.
Q: What about theincrease in fuelcosts? Nearly 24% of the total cost of
production in our Container Glass
Division comprised power and fuel.
The average cost of fuel, comprising
principally LPG and heavy oil, increased
by 17% over the previous year. We
looked inward to mitigate the impact
of this unprecedented increase.
Enhanced efficiencies helped maintain
the energy cost as a percentage of net
revenue at 21.07% in 2007-08
compared with 19.31% in
2006-07.
Q: What were someof the otherhighlights andchallenges for theyear?During the year under review, we
invested Rs. 103.98 million in an
aggressive sales promotion and
advertisement of building products in
the print and audio-visual media. This
depressed our profits proportionately
although the benifits of this will
transpire ovr the next few year.
We were also affected by the rupee
appreciation in our export
realisations.
19
Hindustan Sanitaryware & Industries Limited
18
Q: In what ways didthe managementstrengthen theCompany’sbusiness during2007-08?We strengthened the business through
a number of initiatives:
Retail foray: Our wholly owned
subsidiary, HHRL, launched a chain of
mega home improvement and solution
stores. We are convinced that the sales
pattern of the future will be completely
convenience-driven; an increasing
number of buyers will like to buy from
a central point rather than commute
from shop to shop. Our store will offer
end-to-end Home Interior Solutions
across various price points. Branded
under the name of ‘EVOK’, we will set
up 50 such stores across India in four
to five years.
Dedicated after-sales service: We
pioneered the concept of a dedicated
after-sales service unit in our industry.
This will enable customers to call our
helpline numbers anywhere in the
country for a better understanding of
features and maintenance procedure of
new products.
Ramp-up of operational efficiency in
the Building Product Division: We
recorded the highest capacity utilisation
of 107.10% at our Bahadurgarh plant
through effective de-bottlenecking,
which is the highest in India and at par
with the best international standards.
Greenfield expansion: In September
2007, our Board approved the setting
up of a greenfield container glass plant
in central Andhra Pradesh. This will
expand the AGI capacity by 86% to
1.80 billion pieces per annum. The
plant, machinery and designs will be
imported from Europe for the
manufacture of internationally
benchmarked products. The plant will
be located near natural gas source
enabling us to reduce fuel costs
through a substitution of heavy fuel
with economical natural gas. The
project – expected to be completed by
March 2009 – will sharpen our
competitive edge through economies
of scale and superior quality
manufacture.
Q: How will theCompany fund thisexpansion?The Company expects to fund this
Rs. 2,300 million Container Glass
Division expansion through a prudent
mix (80:20) of debt and accruals. The
skew will be more towards debt, which,
when you consider our overall gearing
(long-term debt to equity) of 0.29, is a
fair initiative in enhancing shareholder
value without endangering our
repayment capability or credit rating.
Q: How does theCompany expect tocapitalise onindustryopportunities?Building Products Division: We have
formulated aggressive plans for the
launch of new product designs in the
coming years to maintain the growth
momentum. We are strengthening our
competitive edge through improved
cost efficiency, superior service and the
addition of new distribution verticals
like ‘EVOK’.
Container Glass Division: Given the
buoyant economy and the consequent
demand for high-value food,
pharmaceuticals and beverages, our
customers are experiencing robust
growth. It will interest shareholders to
know that our capacity utilisation was
89.65% in 2007-08 with finished
goods stock levels declining year-on-
year. During the year under review, we
embarked on a greenfield Container
Glass project to address this
burgeoning demand.
Q: Going ahead,how does theCompany expect toenhanceshareholder value?We expect to do so through the
following:
The ‘next big leap’: We are looking at
acquisition opportunities within/outside
India for our Building Products Division,
leveraging our existing brand,
distribution and knowledge capitals.
AGI capacity expansion: We are
expanding our Container Glass capacity
in a phased manner at a new location,
which will result in a value-added
product portfolio on the one hand and
improved operational efficiencies on
the other. More importantly, this
decision will help us liberate precious
real estate in Hyderabad for more
profitable uses.
EVOK retail stores: We believe that a
diversification into this new business
vertical will offer us an early bird’s
advantage and help create significant
market share and value.
We expect that these strategies will
translate into a reasonable growth in
our topline and bottomline in 2008-09,
followed by accelarated momentum as
we go along over the foreseeable
future.
Other incomeThe Company presently possesses nearly 83.50 acres of unutilised land property in Isnapur, AndhraPradesh. It is in the process of employing services of renowned consultants to estimate the value of theasset. The estimation is being made on a standalone basis as well as in various developed forms, such asSEZ, residential and commercial housing complex, etc, providing direction on the best course of actionthat will unlock the maximum asset value.
In September 2007, our Boardapproved the setting up of agreenfield container glass plant incentral Andhra Pradesh. This willexpand the AGI capacity by 86%to 1.80 billion pieces.
products. However, I am pleased to
state that the proportion of Cash/PDC
transactions in the overall sales mix
increased from a mere 45% in 2005-06
to 82% in 2007-08, while receivables
(post implementation of SAP) declined
by Rs.93.60 million on higher turnover.
Outsourced products: We added 138
new products in the range of
outsourced products. This enhanced
their cumulative contribution by 22%
and the proportion of such products in
the revenues of the division increased
from 42.72% in 2006-07 to 43.94% in
2007-08.
Q: How would youreview themanufacturingperformance?Our performance was significantly
better than in the previous year for the
following reasons:
Production: We achieved the highest
ever production at our Bahadurgarh
plant in 2007-08. Capacity utilisation
stood at 107.10%, which increased by
3.47% over the previous year. This was
achieved through an improvement in
the input-output ratio through a
reduction in process losses, improved
raw material mix and the installation of
state-of-the-art balancing equipments,
leading to superior control of process
parameters.
Reduction in power and fuel
consumption: One of the biggest
challenges that we faced during the
year under review was an increase in
energy prices. However, enhanced
operational efficiencies enabled us to
reduce power and fuel consumption at
our Bahadurgarh and Somanypuram
plants. We enhanced energy efficiency
through the use of waste heat
recovered from the kilns in the drying
process, improved setting of the firing
curve that ensured faster movement of
ceramicware through the kilns and
improved kiln loading. As a result,
power consumption reduced by 3.42%
and 6.21% at our Bahadurgarh and
Somanypuram plants respectively.
People productivity: People
productivity increased by 12.10% over
2006-07 due to reduction in the rejects
rate, increased production of saleable
units and introduction of productivity-
linked wage agreement in 2007 at the
Bahadurgarh plant.
Q: What were someof the otherchallenges faced byyour divisionduring the year? The other challenges comprised the
following:
Introduction of a new dealer strategy
led to sales falling short of projections.
However, with the dealer network
reconciling itself to the new terms of
trade, we expect to register significant
sales growth in 2008-09
Implementation of SAP led to some
employee resistance as it requires a
strict adherence to pre-determined
processes. However, we countered this
by imparting training that familiarised
them with various features of the ERP
platform
Achieving a capacity utilisation of
107.10%, the highest in the Indian
sanitaryware ceramic industry, was a
challenge. We leveraged our R&D
insight to enhance operational
efficiency and process innovation
Q: What is theoutlook for thedivision in 2008-09and beyond?In view of the real estate projects
already under construction across the
country, we expect demand from this
sector to grow at a robust CAGR of 12-
15% over the near future. Aggressive
marketing and a referral focus through
the conduct of architect meets, builder
meets, plumber meets etc are expected
to reinforce the Hindware brand
demand. Besides, we expect to
strengthen our operational efficiency at
both our facilities.
Somanypuram plant: We expect to
replicate the successful capacity
utilisation story of Bahadurgarh at this
facility, coupled with improved
efficiency.
Bahadurgarh plant: We expect to scale
output in line with international
standards.
Having said that, we expect to register
a significant revenue growth in
2008-09, enhancing the profitability of
this division.
21
Hindustan Sanitaryware & Industries Limited
20
Management Discussionand Analysis
Q: How would youreview theperformance ofyour divisionduring 2007-08?The performance of the division can be
summarised as follows: a 13.10%
growth in revenue to Rs.3,044.33
million including a 22.04% growth in
revenues from outsourced products to
Rs.1,337.62 million and a 6% growth
in average realisations.
Q: What factorsresulted in thisperformance?Change in product portfolio: We
increased the contribution of premium
products in our sales mix from 27% to
37% in 2007-08. These products
enjoyed higher realisations over the
broad segment and were supported by
aggressive promotions. The Company
invested Rs.103.98 million to
undertake aggressive promotions and
advertisements of its range of products,
which was charged against the income
of the current year.
Stricter debtor control: The
implementation of the SAP, ERP system
integrated our operations across
locations, including two manufacturing
units and three trading divisions and 18
depots. This enabled us to get a precise
understanding of our debtors’ position
on a real-time basis. We responded
with speed: we insisted on cash or
post-dated cheques (PDC) and this
restructuring temporarily staggered
sales of manufactured and outsourced
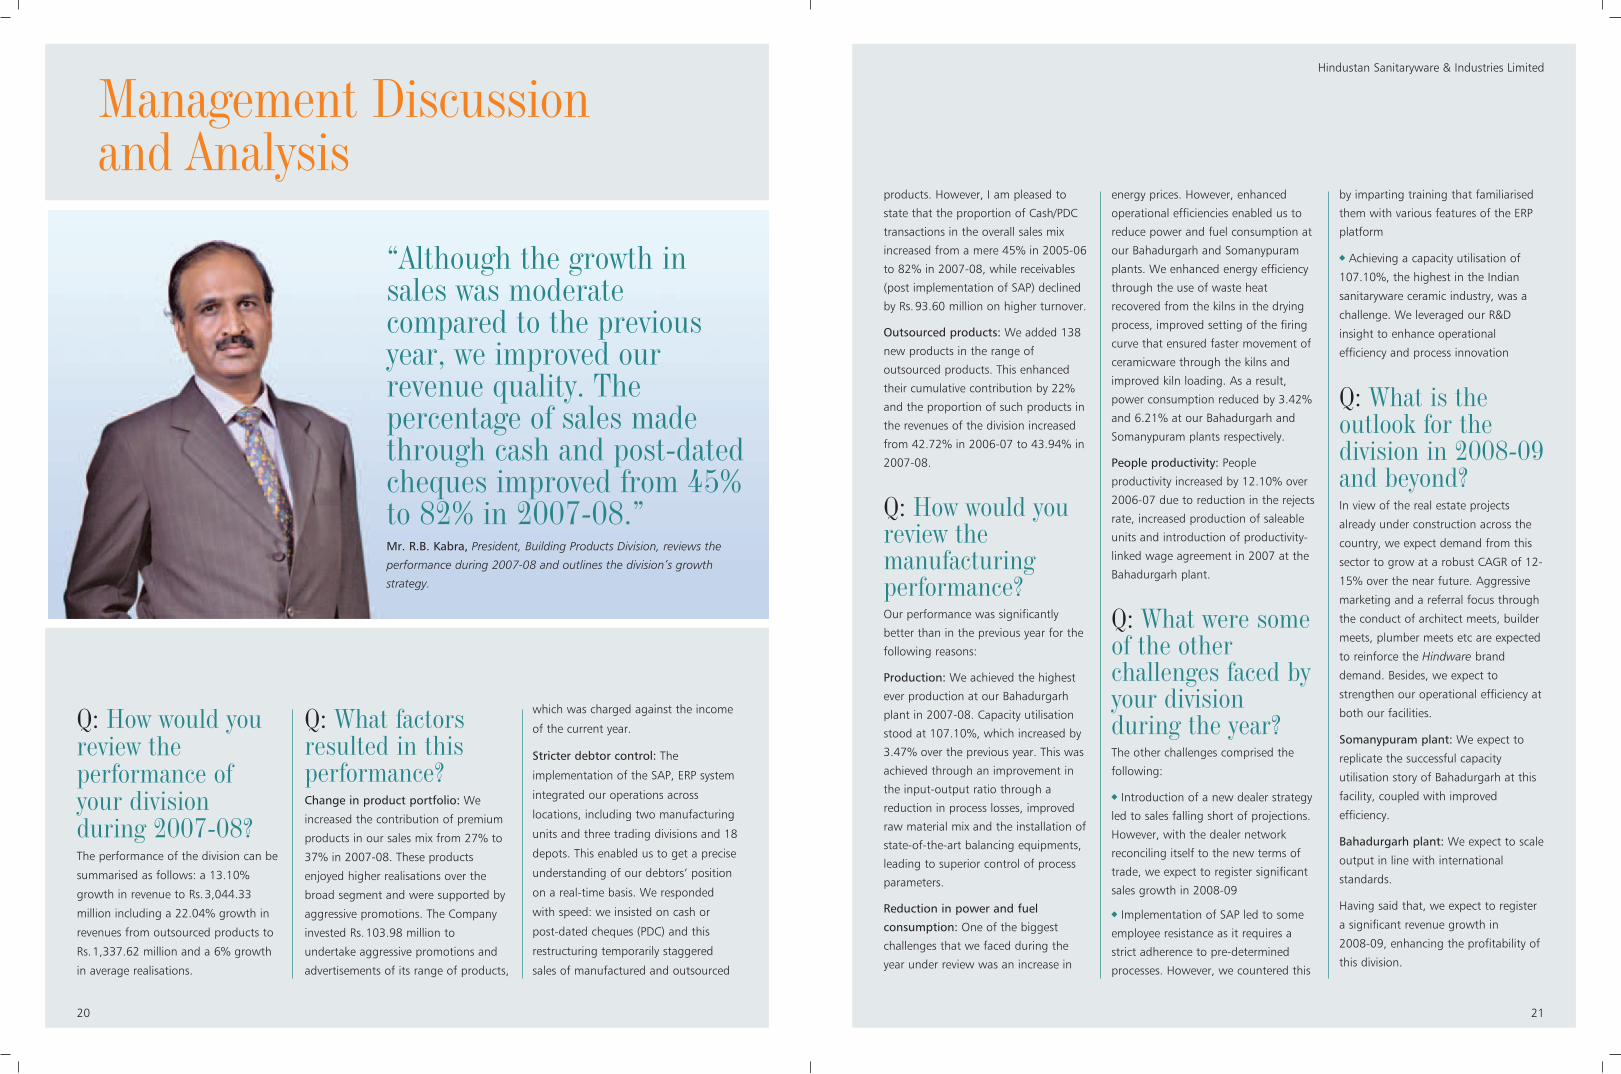
“Although the growth insales was moderatecompared to the previousyear, we improved ourrevenue quality. Thepercentage of sales madethrough cash and post-datedcheques improved from 45%to 82% in 2007-08.”Mr. R.B. Kabra, President, Building Products Division, reviews the
performance during 2007-08 and outlines the division’s growth
strategy.
23
Hindustan Sanitaryware & Industries Limited
22
Sanitaryware Industry
Overview The Indian Sanitaryware industry reflected an appreciable
growth in the last few years with leading players increasing
their production capacities. The demand for high value
Sanitaryware grew faster in percentage terms than the broad
market. The total demand for the organised manufacturers
was estimated at 9 million pieces and unorganised sector 13
million pieces growing at 12-15% annually. The super-
premium category was estimated at Rs.300 million, growing
at around 25% annually. The region-wise demand pattern
was estimated as follows
(in million pieces)
North South East West Total
5 9 4 4 22
Source: INCOSAMA
The organised manufacturers coupled aggressive
advertisement campaigns with stronger dealer networks. The
unorganised sector marketed their products in the domestic
market at prices around 70% cheaper than the organised
sector, targeting the lower-end of the market. The country’s
Sanitaryware was exported primarily to Middle East, West
Asia, Africa and Europe.
Industry break-up
Segment Amount (Rs. billion)
Floor and wall tiles 65
Sanitaryware 10
Faucets 14
Accessories 5
Production India accounted for 8% of the world’s sanitaryware
production. The market size is estimated to be Rs.10,500
million. The branded segment accounts for a larger share of
60% and is growing at a rate of 15-17%, whereas the market
share of the non-branded segment has shrunk to 40%,
growing at a lower pace of 8-9%. The organised sector,
comprising nine units, reported a production of 108,000 TPA
against a total capacity of 118,000 TPA; the 250 units in the
unorganised sector produced about 180,000 TPA against a
total capacity of 220,000 TPA.
Sanitaryware industry statistics
World production: 300 million pieces
India's share: 22 million pieces
Global industry growth rate: 5-7%
Growth rate (India’s domestic market): 12-15%
Organised sector:
% share of production: 60%
Number of units: 9
Production capacity: 118,000 TPA
Actual production: 108,000 TPA
Unorganised sector:
% share of production: 40%
Number of units: 250
Production capacity: 220,000 TPA
Actual production: 180,000 TPA
Source: INCOSAMA
25
Hindustan Sanitaryware & Industries Limited
24
The organised sector produces fully vitrified sanitaryware,
using latest technology and best ceramic raw materials
available in India. The unorganised sector has adapted
technologies to manufacture basic sanitaryware products.
Unorganised sanitaryware manufacturers come under the
small-scale category and enjoy the benefit of zero excise duty.
The cost of producing sanitaryware in India is substantially
low compared to the developed countries because of cheap
labour costs and the indigenous, abundant and economical
availability of most of raw materials.
Demand driversHousing: Research indicates an increased demand for
permanent, non-slum houses across India driven primarily by
the growth in population, urbanisation and income. The total
stock of housing in 2007 was estimated at 255 million units
and is expected to grow to 286 million units by 2011, adding
an average 7.75 million units annually.
Housing demand estimation (in million units)
2007 2011
Estimated housing stock 255.00 286.00
Estimated housing shortage 24.71 30.00
Source: INCOSAMA
A Planning Commision Survey Report indicates a shortage of
about 24.71 million houses in India. A home with hygienic
toilets has become a basic necessity, as people in India are
looking for improved sanitation. The concept of formal toilets
is fast growing even in villages, where toilets did not exist
even until two years ago. An increasing demand for housing,
government initiatives for the housing sector and sanitation
consciousness has led to a growing market for sanitaryware
in India over the last five years.
Commercial space: About 80% of the demand for office
space is driven by the IT/ITes sector. India has over 3,000 IT
service providers. The IT industry has grown by 21-24% in
2007-08. The IT-enabled services (ITes) sector grew by 28%
in 2007-08. It is expected that overall software and service
revenues will grow by 21-24% to touch US$50 billion by
2008-09. Growing office spaces with sophisticated interiors
will lead to an increased demand for high-end sanitaryware.
Organised retail: Organised retail segment is growing at a
rapid pace, increasing its share from 4% of total retail sales in
2006 to approximately 5% in 2007. This has increased the
demand for retail space. Mall space for example has increased
from a meagre 1 million sq.ft in 2002 to 40 million sq.ft by
2007 and is expected to reach 60 million sq.ft by 2008.
Estimates suggest that organised retail segment will account
for 12-15% of total retail sales by 2011 (Source: IBEF).
Hospitals: The size of India’s private healthcare sector is
expected to double from Rs. 690 billion to Rs.1560 billion by
2012 (National Commission on Macroeconomics and Health
estimates). Of the proposed Rs.1000-1500 billion investment
in healthcare, nearly 80% will come from the private sector,
driving the demand for high-end sanitaryware.
Hotels: Estimates suggest that the hotel industry can supply
110,000 rooms, with a 150,000 room deficit. Demand will
exceed supply by at least 100% over the next two years. The
government has applications for 300 hotel projects, nearly
half in the luxury range, leading to a growing demand for
premium sanitaryware products.
Increasing incomes: India’s per capita income grew nearly
12% from Rs. 29,642 in 2006-07 to Rs. 33,131 in 2007-08
(government estimates). Net national income at factor cost is
likely to stand at Rs. 2,760,325 million this fiscal, up 9.1%
over Rs. 2,530,495 million in 2006-07. With enhanced
incomes, more Indians are opting for hygienic living
conditions, enhancing the demand for sanitaryware products.
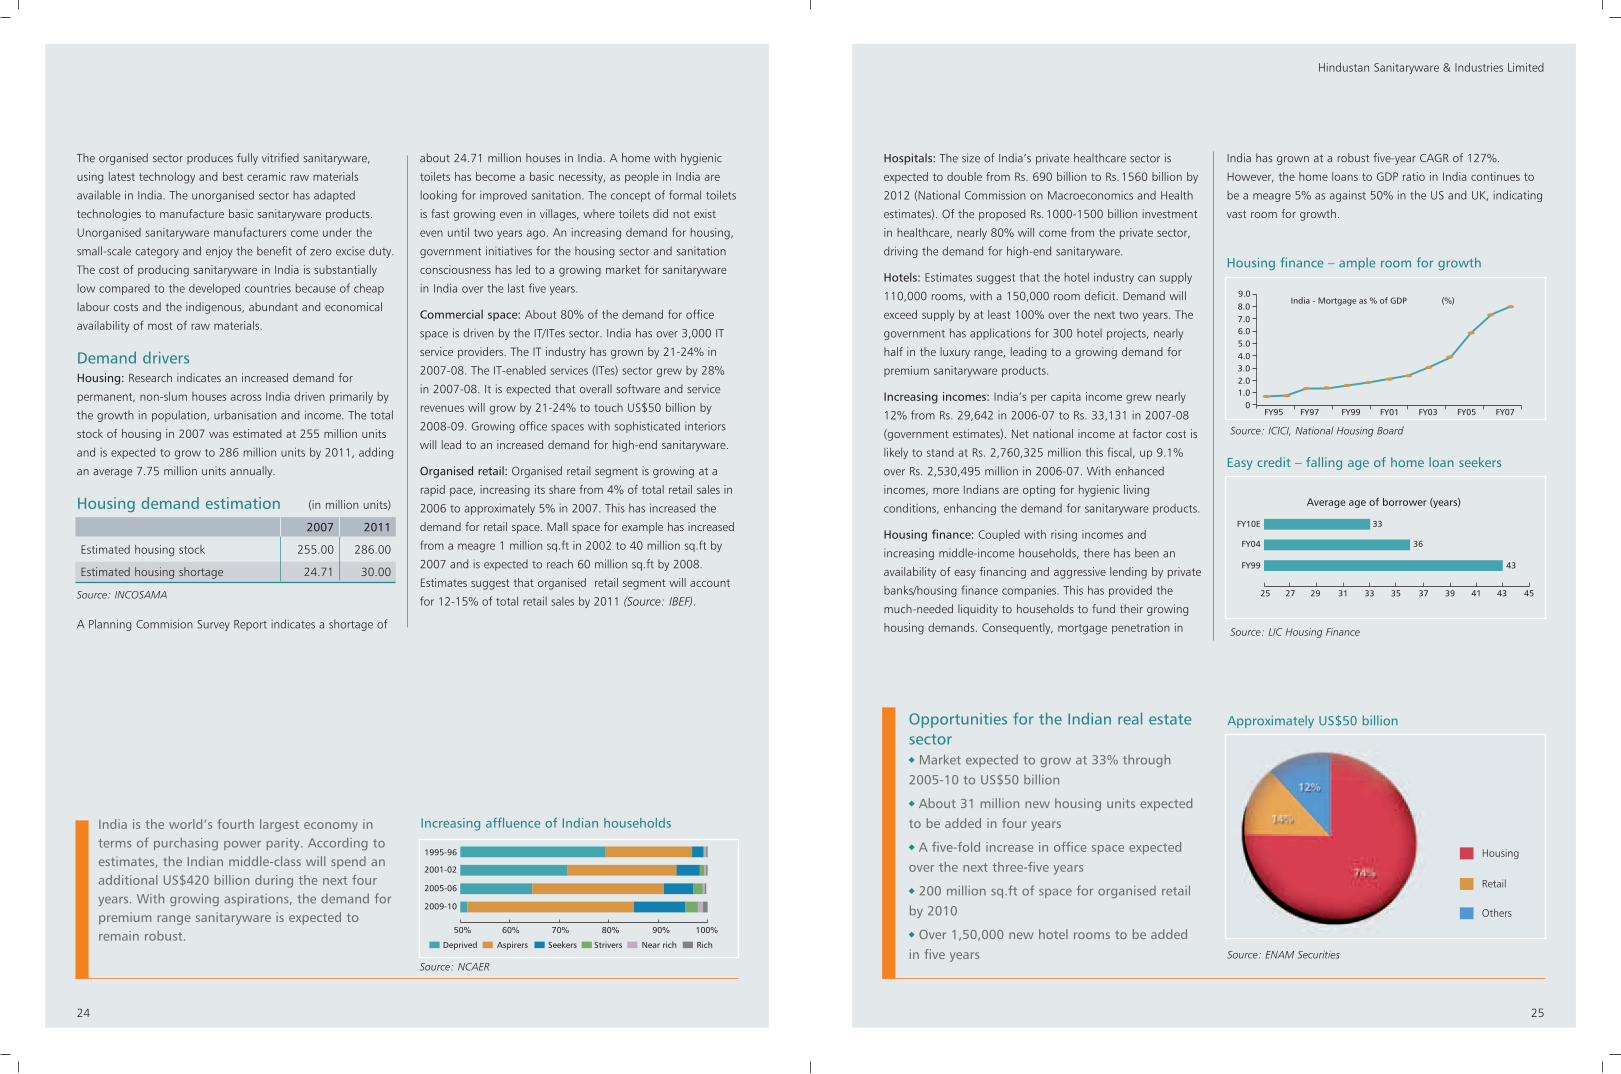
Housing finance: Coupled with rising incomes and
increasing middle-income households, there has been an
availability of easy financing and aggressive lending by private
banks/housing finance companies. This has provided the
much-needed liquidity to households to fund their growing
housing demands. Consequently, mortgage penetration in
India has grown at a robust five-year CAGR of 127%.
However, the home loans to GDP ratio in India continues to
be a meagre 5% as against 50% in the US and UK, indicating
vast room for growth.
1995-96
Deprived Aspirers Seekers Strivers Near rich Rich
100%90%80%70%60%50%
2001-02
2005-06
2009-10
FY99 43
FY04 36
FY10E 33
25 27 29 31 33 35 37 39 41 43 45
Average age of borrower (years)
FY95 FY97 FY99 FY01 FY03 FY05 FY070
1.02.03.04.05.06.07.08.09.0
India - Mortgage as % of GDP (%)
Increasing affluence of Indian households
Source: NCAER
Housing finance – ample room for growth
Easy credit – falling age of home loan seekers
Source: ICICI, National Housing Board
Source: LIC Housing Finance
Source: ENAM Securities
India is the world’s fourth largest economy interms of purchasing power parity. According toestimates, the Indian middle-class will spend anadditional US$420 billion during the next fouryears. With growing aspirations, the demand forpremium range sanitaryware is expected toremain robust.
Opportunities for the Indian real estatesector
Market expected to grow at 33% through2005-10 to US$50 billion
About 31 million new housing units expectedto be added in four years
A five-fold increase in office space expectedover the next three-five years
200 million sq.ft of space for organised retailby 2010
Over 1,50,000 new hotel rooms to be addedin five years
Approximately US$50 billion
Housing
Retail
Others

27
Hindustan Sanitaryware & Industries Limited
26
Growth in spending powerBy 2010, the top 50 Indian cities will enjoy a gross income exceeding US$20 billion, comparable withsome of the largest US cities today.
Ahmedabad
Denver
(US$bn)
125
110
0 30 60 90 120 150
850
950
Delhi
New York
(US$bn)
0 200 400 600 800 1,000
Amritsar 45
45Salt Lakecity
(US$bn)
0 20 40 60 80
Hyderabad
Atlanta
200
215
(US$bn)
0 10050 150 200 250 300
Home loan disbursements grew by 10% from Rs.1,021 billion in 2006-07 to Rs.1,119 billion in 2007-08, catalysed by a focus
on high-ticket financing. High-end housing projects are expected to strengthen the demand for premium sanitaryware, HSIL’s
principal business segment.
Disbursements moving towards higher loan slabs
2005-06 Below 5 lac 5-10 lacs 10-25 lacs 25-50 lacs Above 50 lacs
(%) 47 12 20 7 14
2007-08 Below 5 lac 5-10 lacs 10-25 lacs 25-50 lacs Above 50 lacs
(%) 38 8 25 11 18
Source: CRISIL Research
Tightening interest rates led to an increase in the floating rate
on home loans. A 100 bps hike in home loan rates translated
to about a 6.30% increase in monthly payouts for a 20-year
mortgage. However, despite rising interest rates, the
affordability of an average Indian to own a house remained
on the higher side. Besides, in view of the projects already
under construction, the demand for sanitaryware in the
country is expected to remain strong.
Government initiatives The Government of India sanctioned TSC projects in all
districts in 2006-07 to achieve full sanitation coverage by
2012. It planned to provide all rural schools and anganwadis
with safe drinking water and sanitation. Sanitation facilities
continued to elude India, even as the country played host to
the World Toilet Summit in New Delhi in October 2007. At
the Summit, the Indian government pledged to make the
country free of defecation in the open and meet relevant
international commitments.
The Company’s presence in theBuilding Products segment
Industry position: Largest manufacturer of sanitaryware products in India
Industry market share, 2007-08: 40%
Divisional revenues, 2007-08: Rs. 3,044.33 million
% contribution to total revenue: 52.13%
Product segments: Manufactured products (sanitaryware) and outsourced (bathroom products and kitchenappliances)
Product segments Range
Manufactured European water closets, wash basins, squatting pans, pedestals and bidets
Outsourced Bathroom segment Kitchen segment
PVC cisterns, fittings and seat covers, faucets, Sinks, chimneys and hobs
bath tubs, whirlpools, airpools, shower enclosures
and shower panels, MFMT, concealed cisterns, steam
cabins and pressure pumps and bath accessories
Sub segment: Building Products
Manufacturing Manufactured products (sanitaryware) contributed 56.06% to the division’s revenues in 2007-08. The mainstay of the division.
The plant sites were located at Bahadurgarh (Haryana) and Somanypuram (Andhra Pradesh), with a combined capacity of
32,000 TPA (equivalent to 2.8 million pieces)
Location Somanypuram Bahadurgarh
Capacity 18,000 TPA 14,000 TPA
Markets addressed South and West India North and East India
Source: Enam Securities
29
Hindustan Sanitaryware & Industries Limited
28
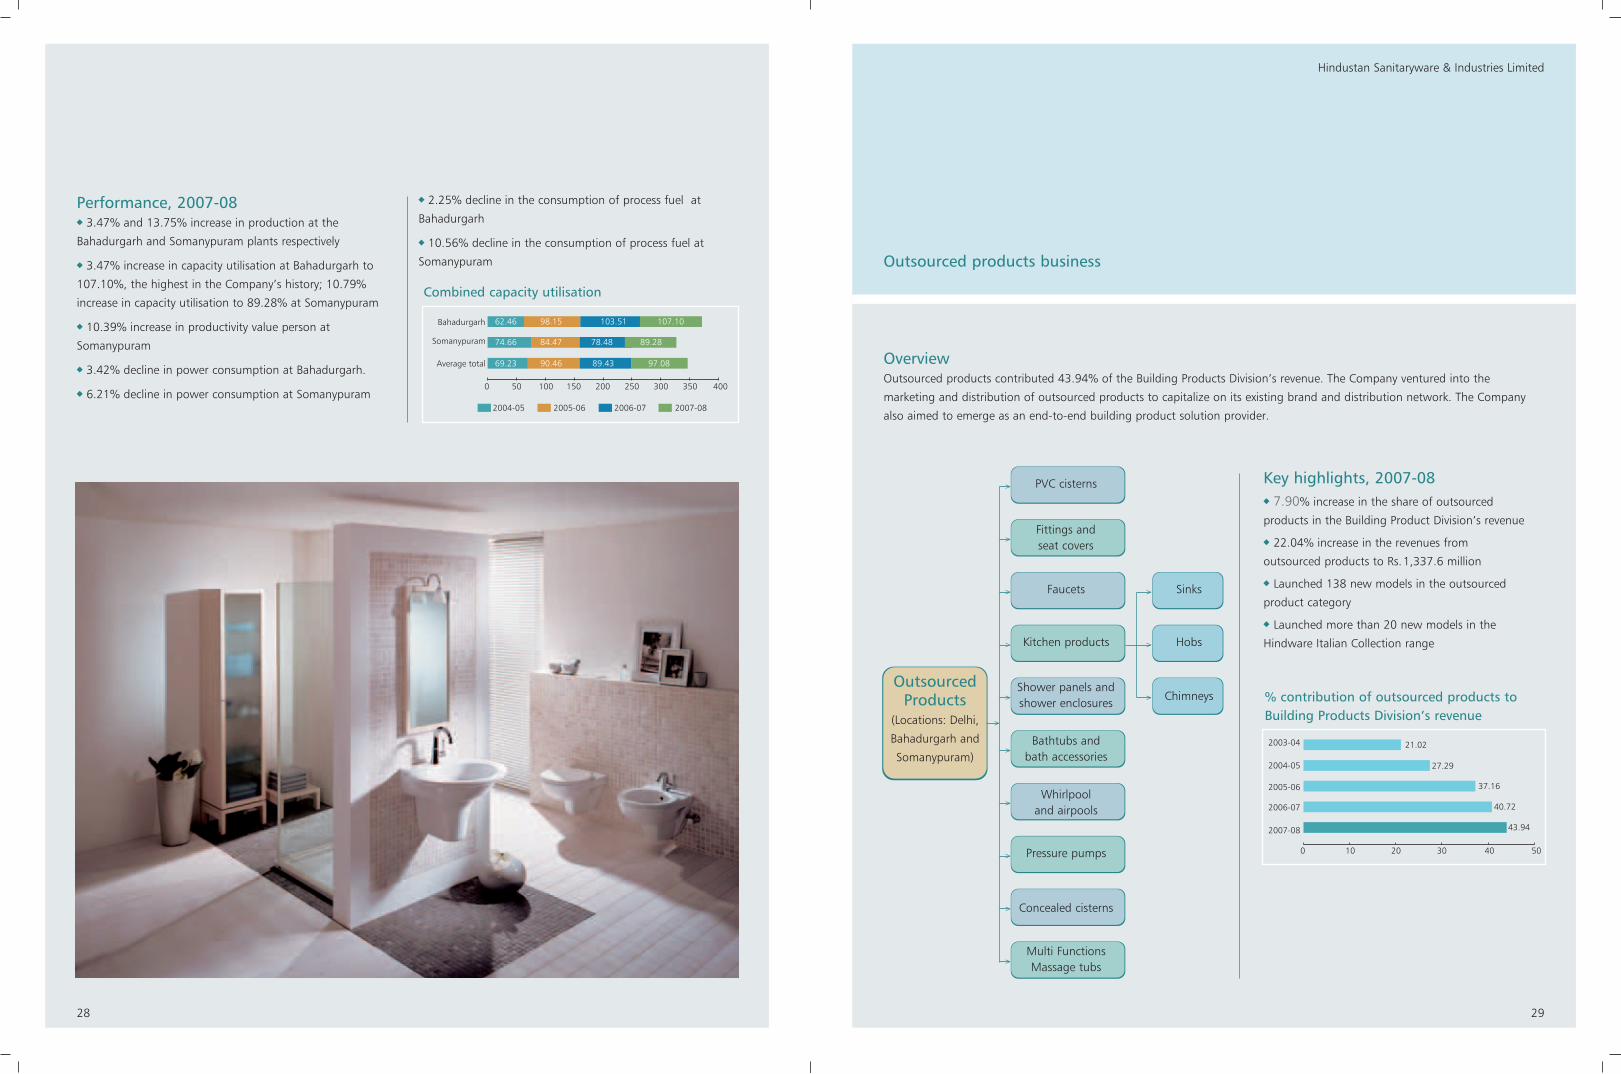
Performance, 2007-08 3.47% and 13.75% increase in production at the
Bahadurgarh and Somanypuram plants respectively
3.47% increase in capacity utilisation at Bahadurgarh to
107.10%, the highest in the Company’s history; 10.79%
increase in capacity utilisation to 89.28% at Somanypuram
10.39% increase in productivity value person at
Somanypuram
3.42% decline in power consumption at Bahadurgarh.
6.21% decline in power consumption at Somanypuram
2.25% decline in the consumption of process fuel at
Bahadurgarh
10.56% decline in the consumption of process fuel at
Somanypuram
0 20015010050 250 300 350 400
62.46 98.15 103.51 107.10
74.66 84.47 78.48 89.28
69.23 90.46 89.43 97.08
Bahadurgarh
Somanypuram
Average total
2004-05 2005-06 2006-07 2007-08
Combined capacity utilisation
Outsourced products business
Overview Outsourced products contributed 43.94% of the Building Products Division’s revenue. The Company ventured into the
marketing and distribution of outsourced products to capitalize on its existing brand and distribution network. The Company
also aimed to emerge as an end-to-end building product solution provider.
PVC cisterns
Fittings and seat covers
Faucets
Kitchen products
Shower panels andshower enclosures
Sinks
Hobs
Chimneys
Bathtubs and bath accessories
Whirlpool and airpools
Pressure pumps
Concealed cisterns
Multi Functions Massage tubs
OutsourcedProducts
(Locations: Delhi,
Bahadurgarh and
Somanypuram)
0 10 20 30 40 50
2007-08
2006-07
2005-06
2004-05
2003-04 21.02
27.29
37.16
40.72
43.94
% contribution of outsourced products toBuilding Products Division’s revenue
Key highlights, 2007-087.90% increase in the share of outsourced
products in the Building Product Division’s revenue
22.04% increase in the revenues from
outsourced products to Rs.1,337.6 million
Launched 138 new models in the outsourced
product category
Launched more than 20 new models in the
Hindware Italian Collection range
31
Hindustan Sanitaryware & Industries Limited
30
The Company has a fair record to present in this respect. It
marketed its products through the retail and institutional
channels, contributing 70% and 30% to the total sales,
respectively. While the former resulted in relatively higher
realisations and the spreading of the sales risk from
dependence on a few customers to a wider customer cross-
section, sales through the institutional channel helped the
Company generate a large sales volume leading to back-to-
back benefits in terms of economies of scale. In view of this,
both channels served distinctive roles within the Company’s
distribution system.
The Company’s retail distribution network comprised 1,086
authorised dealers, approximately 1,000 sub dealers and retail
outlets and 18 depots. Nearly 70% of the total dealer
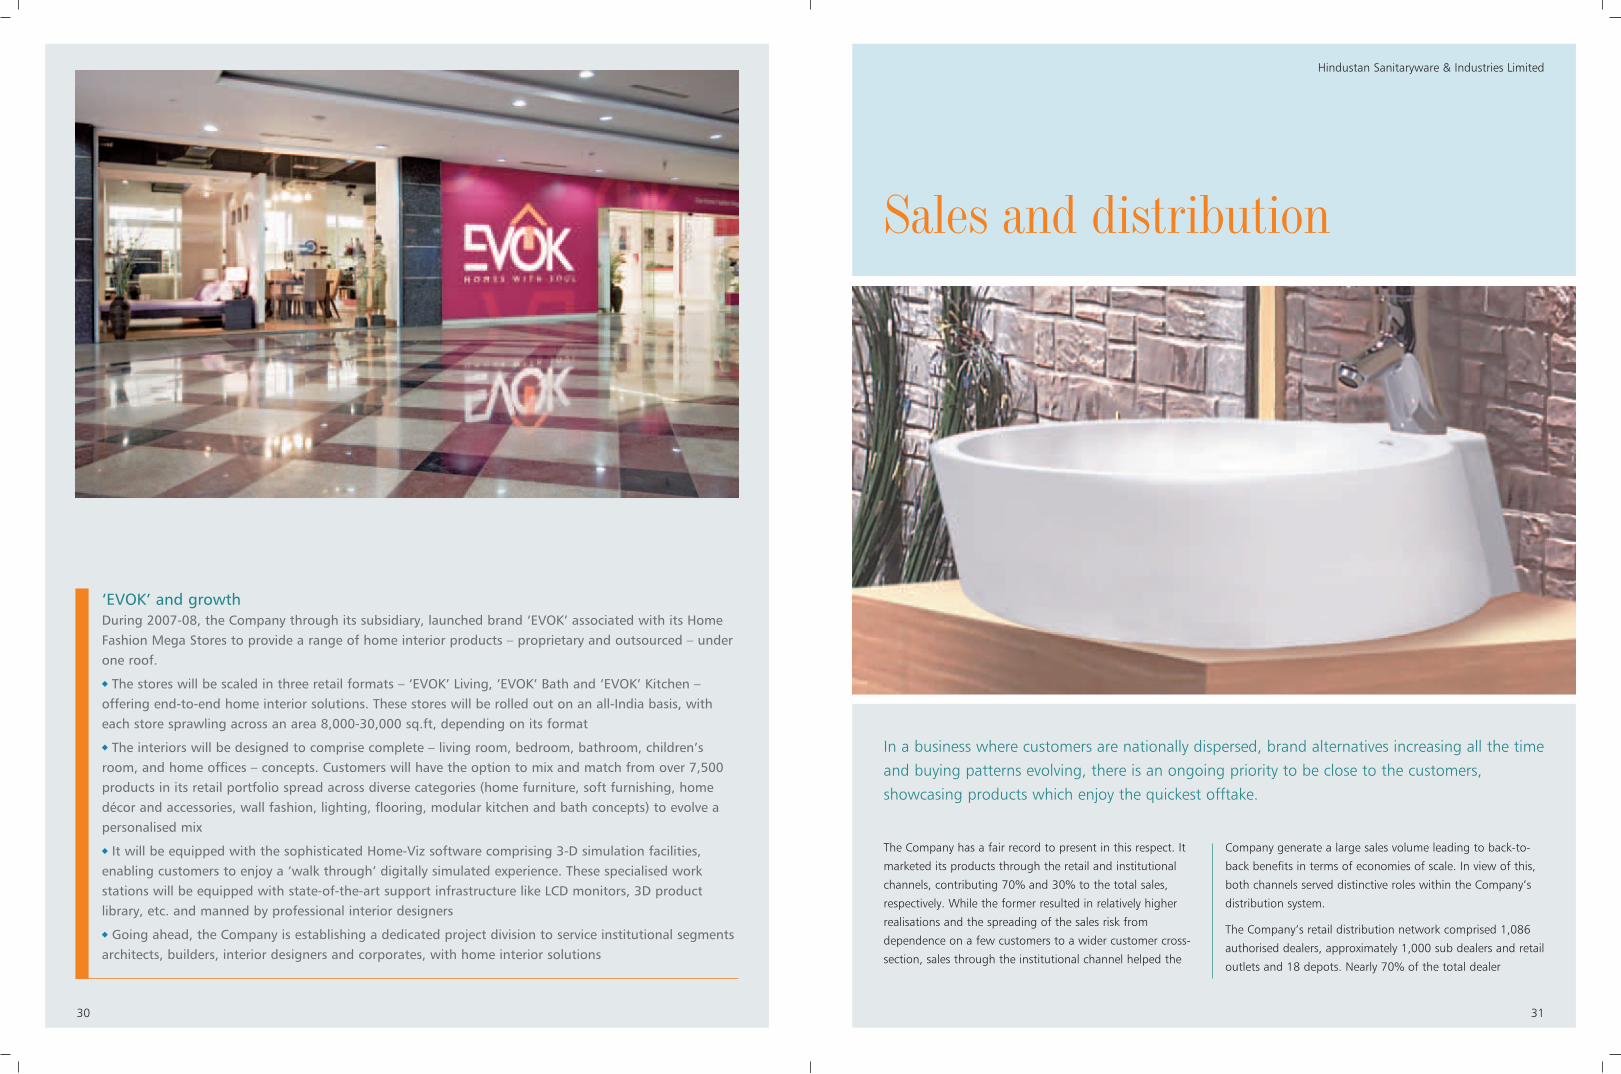
‘EVOK’ and growthDuring 2007-08, the Company through its subsidiary, launched brand ‘EVOK’ associated with its HomeFashion Mega Stores to provide a range of home interior products – proprietary and outsourced – underone roof.
The stores will be scaled in three retail formats – ‘EVOK’ Living, ‘EVOK’ Bath and ‘EVOK’ Kitchen –offering end-to-end home interior solutions. These stores will be rolled out on an all-India basis, witheach store sprawling across an area 8,000-30,000 sq.ft, depending on its format
The interiors will be designed to comprise complete – living room, bedroom, bathroom, children’sroom, and home offices – concepts. Customers will have the option to mix and match from over 7,500products in its retail portfolio spread across diverse categories (home furniture, soft furnishing, homedécor and accessories, wall fashion, lighting, flooring, modular kitchen and bath concepts) to evolve apersonalised mix
It will be equipped with the sophisticated Home-Viz software comprising 3-D simulation facilities,enabling customers to enjoy a ‘walk through’ digitally simulated experience. These specialised workstations will be equipped with state-of-the-art support infrastructure like LCD monitors, 3D productlibrary, etc. and manned by professional interior designers
Going ahead, the Company is establishing a dedicated project division to service institutional segmentsarchitects, builders, interior designers and corporates, with home interior solutions
Sales and distribution
In a business where customers are nationally dispersed, brand alternatives increasing all the time
and buying patterns evolving, there is an ongoing priority to be close to the customers,
showcasing products which enjoy the quickest offtake.

33
Hindustan Sanitaryware & Industries Limited
32
network was exclusive. The dealer and sub-dealer network,
nearly 20% and 30% higher than the closest competitor,
enjoyed the widest national presence extending to towns
with a population of 30,000; the Company’s products
enjoyed retail space that was nearly 20% higher than
competing brands. The Company assisted in commissioning
two Hindware Arcades (3,500 to 4,000 sq.ft each) and 30
Hindware Boutiques (1,000 to 1,500 sq.ft each) operated by
dealers through responsible cost sharing.
The Company marketed its products directly to institutional
clients like DLF, Unitech, Parshvnath, L&T, Raheja’s,
Puravankara, ATS Green, The Taj Hotels and ITC Hotels.
Highlights, 2007-086.87% increase in premium products as a proportion of
total sales to 21%
6.96% increase in revenue to Rs.1,706.71 million, from
products manufactured following the addition of new models
22.04% increase in revenues from traded and outsourced
products to Rs.1,337.62 million following the addition of
new models to the products portfolio
New initiativesThe Company added four new depots during the year to
cater to the distribution network. This was concurrent with its
new policy to encourage cash-and-carry sales, eliminating the
need for dealers to stock products for a longer period
It undertook new dealer development activities in under-
represented towns. The Company achieved this successfully
across 55 towns against a target of 50
It undertook market share rectification activities in 20
markets through branding, networking, non-performing
dealer replacement and internal goal-setting
It undertook network-building exercises in unrepresented
areas, peripherally located to the metro cities of Delhi,
Mumbai, Kolkata and Bangaluru
It ventured into the ‘shop-in-shop’ concept within retail
outlets, enhancing the aesthetics of Hindware products
display
It strengthened the high-end Keramag positioning to
counter competition from foreign brands
Outlook, 2008-09The Company expects to report a significant sales growth in
the manufactured and traded product segments
It expects to rejuvenate the kitchen segment, enhancing
revenues and value-addition from this segment
It expects to improve the quality of display of premium
products across retail units
The Company undertook newdealer development activities inunder-represented towns. Itachieved this successfully across55 towns against a target of 50.
Branding
In a business marked by competition, it is imperative to graduate to a distinctive recall. The
Company achieved this recall through a differentiated communication strategy for its various
customer segments. In the sanitaryware business, its Hindware Art and Hindware Italian
Collection brands were positioned to cater to these segregated customer groups. The result was
leadership in the premium segment, at least 15% ahead of the nearest competitor. The
Company’s Hindware Italian Collection possessed the largest range of products benchmarked
against international brands.
Highlights, 2007-08 The Building Products Division reported a CAGR of 17.07%
over five years, surpassing the industry growth rate of 12-15%
with the premium segment generating 21% of the revenues
The Company was recognised through the Superbrand
Consumer Validated, Business Superbrand, Reader’s Digest
Consumer Trusted Brands Gold Award, 4P’s India’s 100 most
Valuable Brands, 4P’s Most Admired Companies Award and
Mera Brand Award in 2007-08, vindicating its branding
strategy
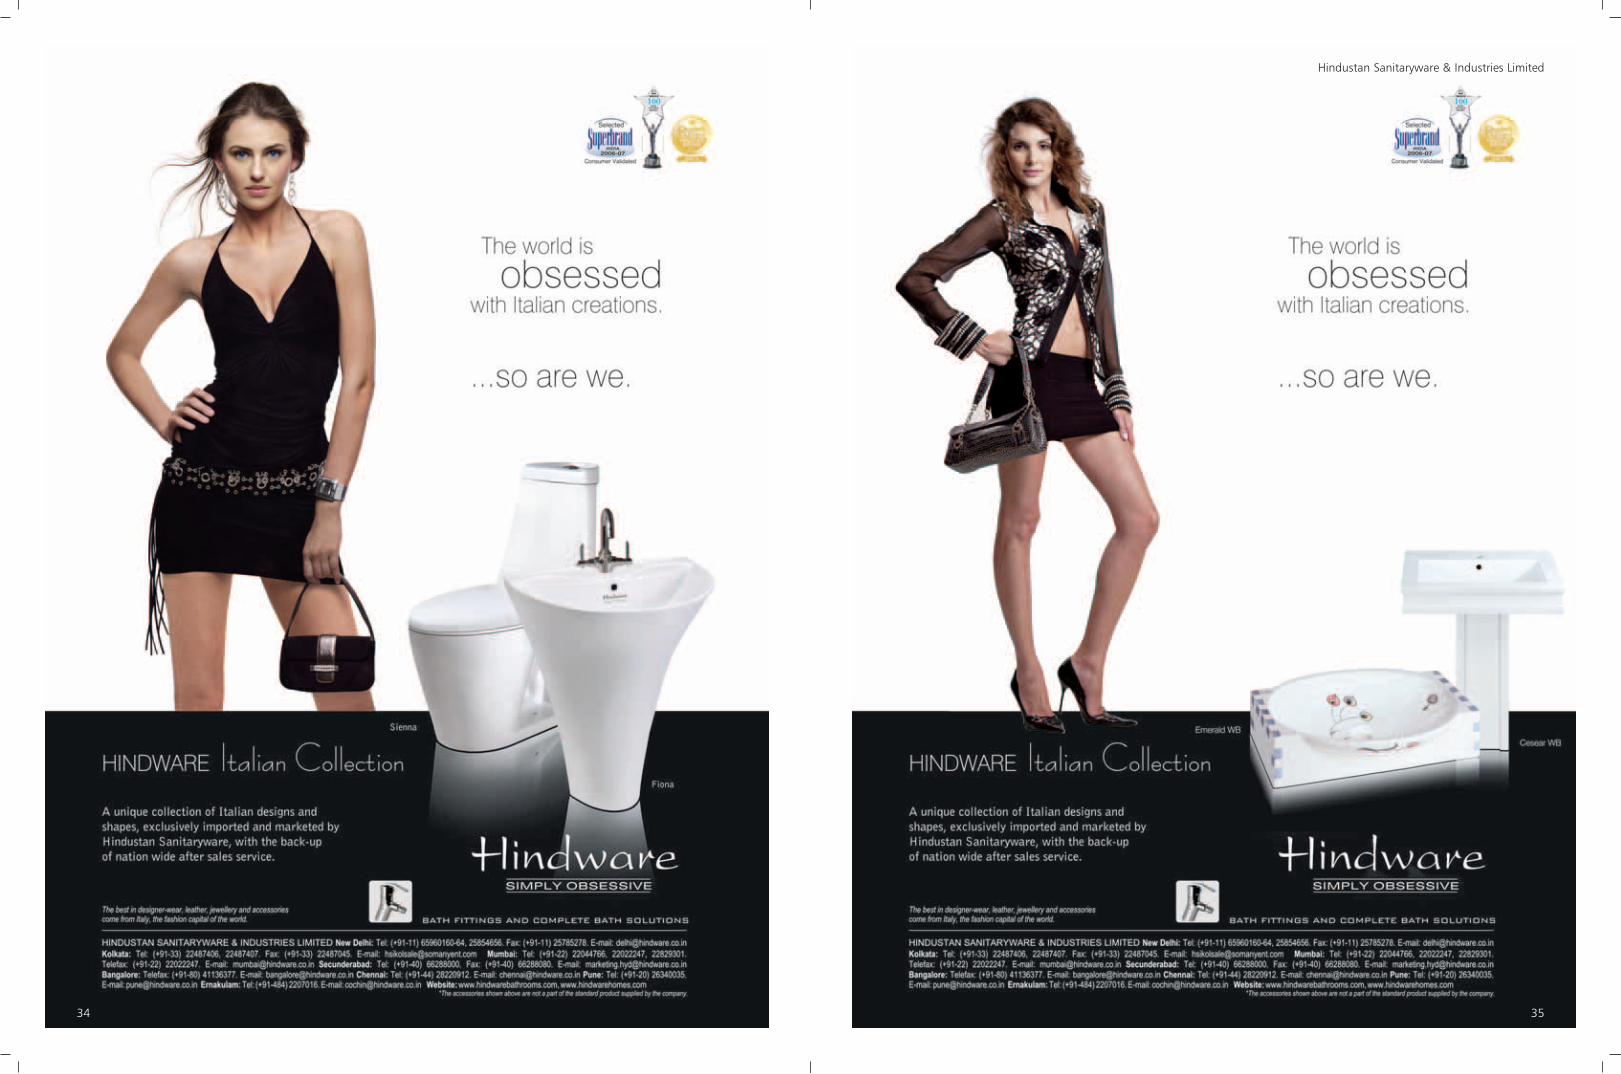
InitiativesThe Company repositioned its Hindware Italian brand by
focusing its communication strategy around international
appeal through marketing campaigns that made use of
Italian models, attire and fashion accessories. Aggressive
promotion was conducted in the print, audio-visual and
outdoor media
The Company increased its focus on institutional and
referral (architects, builders, developers, interior designers)
segments. It conducted architect meets across the country,
showcasing its product range
It partnered with channel partners in the distribution
network to enhance the quality of retail product display
Outlook, 2008-09Going ahead, the Company expects to grow its market share
through the following initiatives:
Addition of new designs to the Hindware Italian Collection
to compete with foreign brands
Enhanced focus on differentiating products from domestic
competitors on the basis of international appeal, enabling it
to cater to rising aspirations
Conduct of a larger number of architect and builder meets
to enhance product awareness in the referral segment
35
Hindustan Sanitaryware & Industries Limited
34
37
Hindustan Sanitaryware & Industries Limited
36
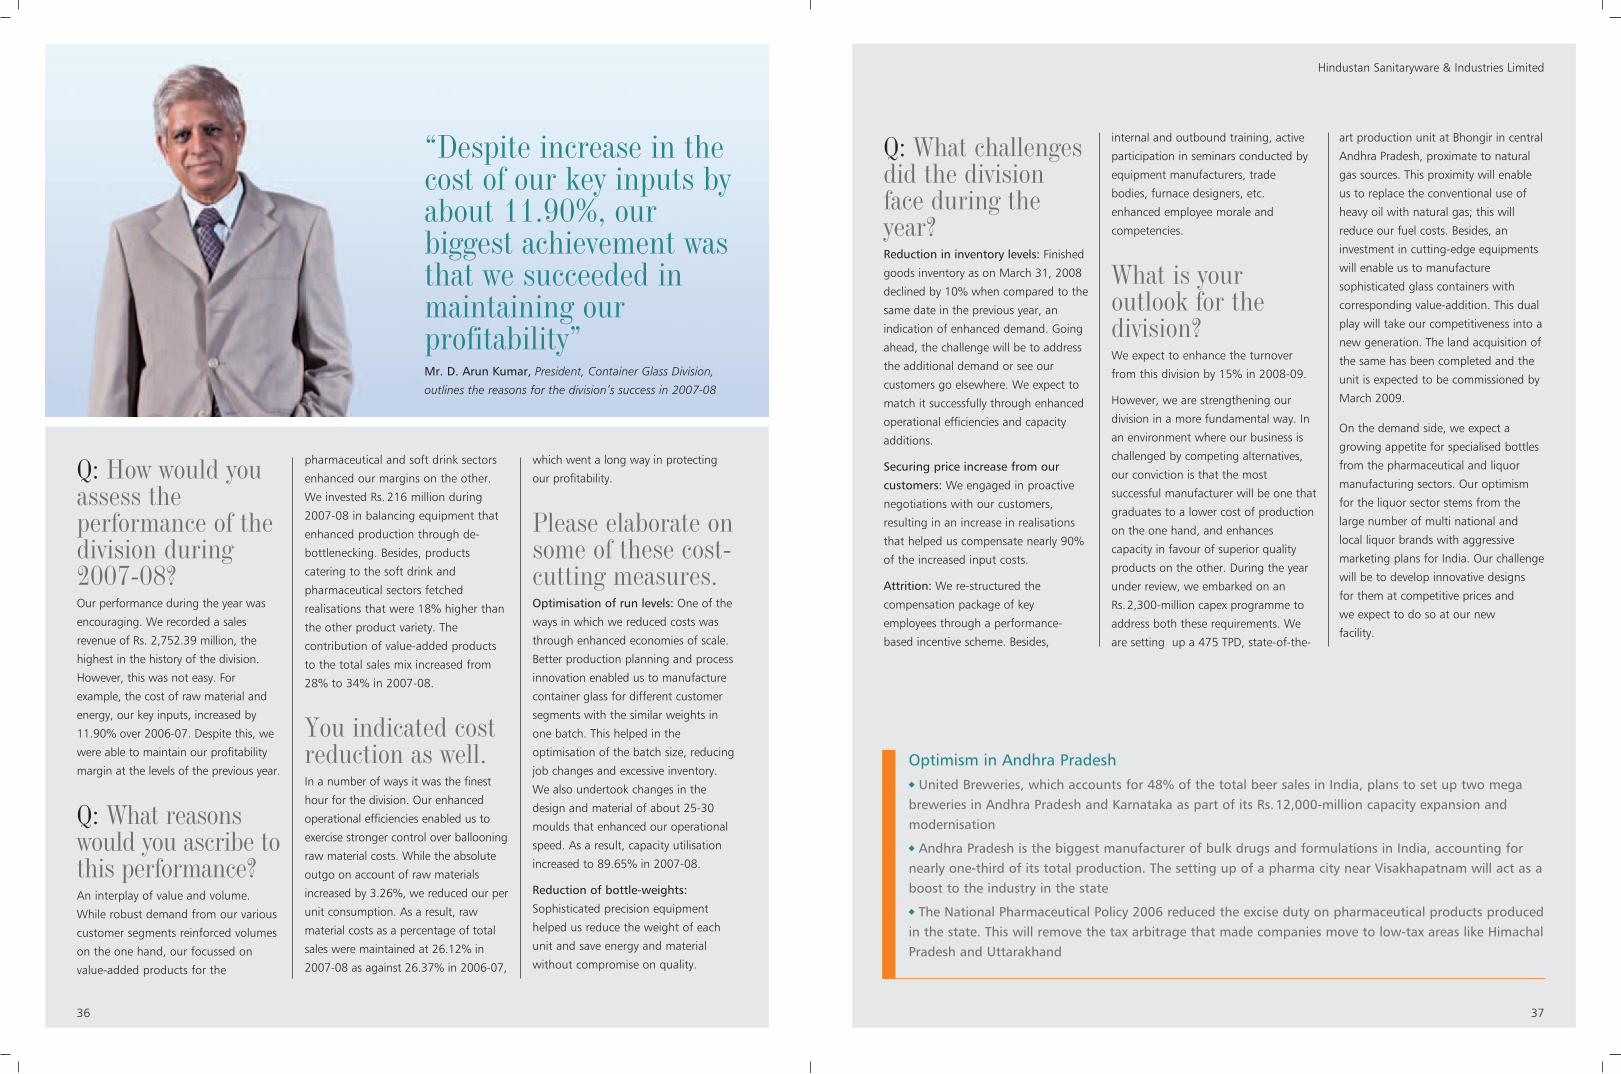
“Despite increase in thecost of our key inputs byabout 11.90%, ourbiggest achievement wasthat we succeeded inmaintaining ourprofitability”Mr. D. Arun Kumar, President, Container Glass Division,
outlines the reasons for the division’s success in 2007-08
Q: How would youassess theperformance of thedivision during2007-08?Our performance during the year was
encouraging. We recorded a sales
revenue of Rs. 2,752.39 million, the
highest in the history of the division.
However, this was not easy. For
example, the cost of raw material and
energy, our key inputs, increased by
11.90% over 2006-07. Despite this, we
were able to maintain our profitability
margin at the levels of the previous year.
Q: What reasonswould you ascribe tothis performance?An interplay of value and volume.
While robust demand from our various
customer segments reinforced volumes
on the one hand, our focussed on
value-added products for the
pharmaceutical and soft drink sectors
enhanced our margins on the other.
We invested Rs. 216 million during
2007-08 in balancing equipment that
enhanced production through de-
bottlenecking. Besides, products
catering to the soft drink and
pharmaceutical sectors fetched
realisations that were 18% higher than
the other product variety. The
contribution of value-added products
to the total sales mix increased from
28% to 34% in 2007-08.
You indicated costreduction as well.In a number of ways it was the finest
hour for the division. Our enhanced
operational efficiencies enabled us to
exercise stronger control over ballooning
raw material costs. While the absolute
outgo on account of raw materials
increased by 3.26%, we reduced our per
unit consumption. As a result, raw
material costs as a percentage of total
sales were maintained at 26.12% in
2007-08 as against 26.37% in 2006-07,
which went a long way in protecting
our profitability.
Please elaborate onsome of these cost-cutting measures. Optimisation of run levels: One of the
ways in which we reduced costs was
through enhanced economies of scale.
Better production planning and process
innovation enabled us to manufacture
container glass for different customer
segments with the similar weights in
one batch. This helped in the
optimisation of the batch size, reducing
job changes and excessive inventory.
We also undertook changes in the
design and material of about 25-30
moulds that enhanced our operational
speed. As a result, capacity utilisation
increased to 89.65% in 2007-08.
Reduction of bottle-weights:
Sophisticated precision equipment
helped us reduce the weight of each
unit and save energy and material
without compromise on quality.
Q: What challengesdid the divisionface during theyear?Reduction in inventory levels: Finished
goods inventory as on March 31, 2008
declined by 10% when compared to the
same date in the previous year, an
indication of enhanced demand. Going
ahead, the challenge will be to address
the additional demand or see our
customers go elsewhere. We expect to
match it successfully through enhanced
operational efficiencies and capacity
additions.
Securing price increase from our
customers: We engaged in proactive
negotiations with our customers,
resulting in an increase in realisations
that helped us compensate nearly 90%
of the increased input costs.
Attrition: We re-structured the
compensation package of key
employees through a performance-
based incentive scheme. Besides,
internal and outbound training, active
participation in seminars conducted by
equipment manufacturers, trade
bodies, furnace designers, etc.
enhanced employee morale and
competencies.
What is youroutlook for thedivision? We expect to enhance the turnover
from this division by 15% in 2008-09.
However, we are strengthening our
division in a more fundamental way. In
an environment where our business is
challenged by competing alternatives,
our conviction is that the most
successful manufacturer will be one that
graduates to a lower cost of production
on the one hand, and enhances
capacity in favour of superior quality
products on the other. During the year
under review, we embarked on an
Rs.2,300-million capex programme to
address both these requirements. We
are setting up a 475 TPD, state-of-the-
art production unit at Bhongir in central
Andhra Pradesh, proximate to natural
gas sources. This proximity will enable
us to replace the conventional use of
heavy oil with natural gas; this will
reduce our fuel costs. Besides, an
investment in cutting-edge equipments
will enable us to manufacture
sophisticated glass containers with
corresponding value-addition. This dual
play will take our competitiveness into a
new generation. The land acquisition of
the same has been completed and the
unit is expected to be commissioned by
March 2009.
On the demand side, we expect a
growing appetite for specialised bottles
from the pharmaceutical and liquor
manufacturing sectors. Our optimism
for the liquor sector stems from the
large number of multi national and
local liquor brands with aggressive
marketing plans for India. Our challenge
will be to develop innovative designs
for them at competitive prices and
we expect to do so at our new
facility.
Optimism in Andhra PradeshUnited Breweries, which accounts for 48% of the total beer sales in India, plans to set up two mega
breweries in Andhra Pradesh and Karnataka as part of its Rs.12,000-million capacity expansion andmodernisation
Andhra Pradesh is the biggest manufacturer of bulk drugs and formulations in India, accounting fornearly one-third of its total production. The setting up of a pharma city near Visakhapatnam will act as aboost to the industry in the state
The National Pharmaceutical Policy 2006 reduced the excise duty on pharmaceutical products producedin the state. This will remove the tax arbitrage that made companies move to low-tax areas like HimachalPradesh and Uttarakhand
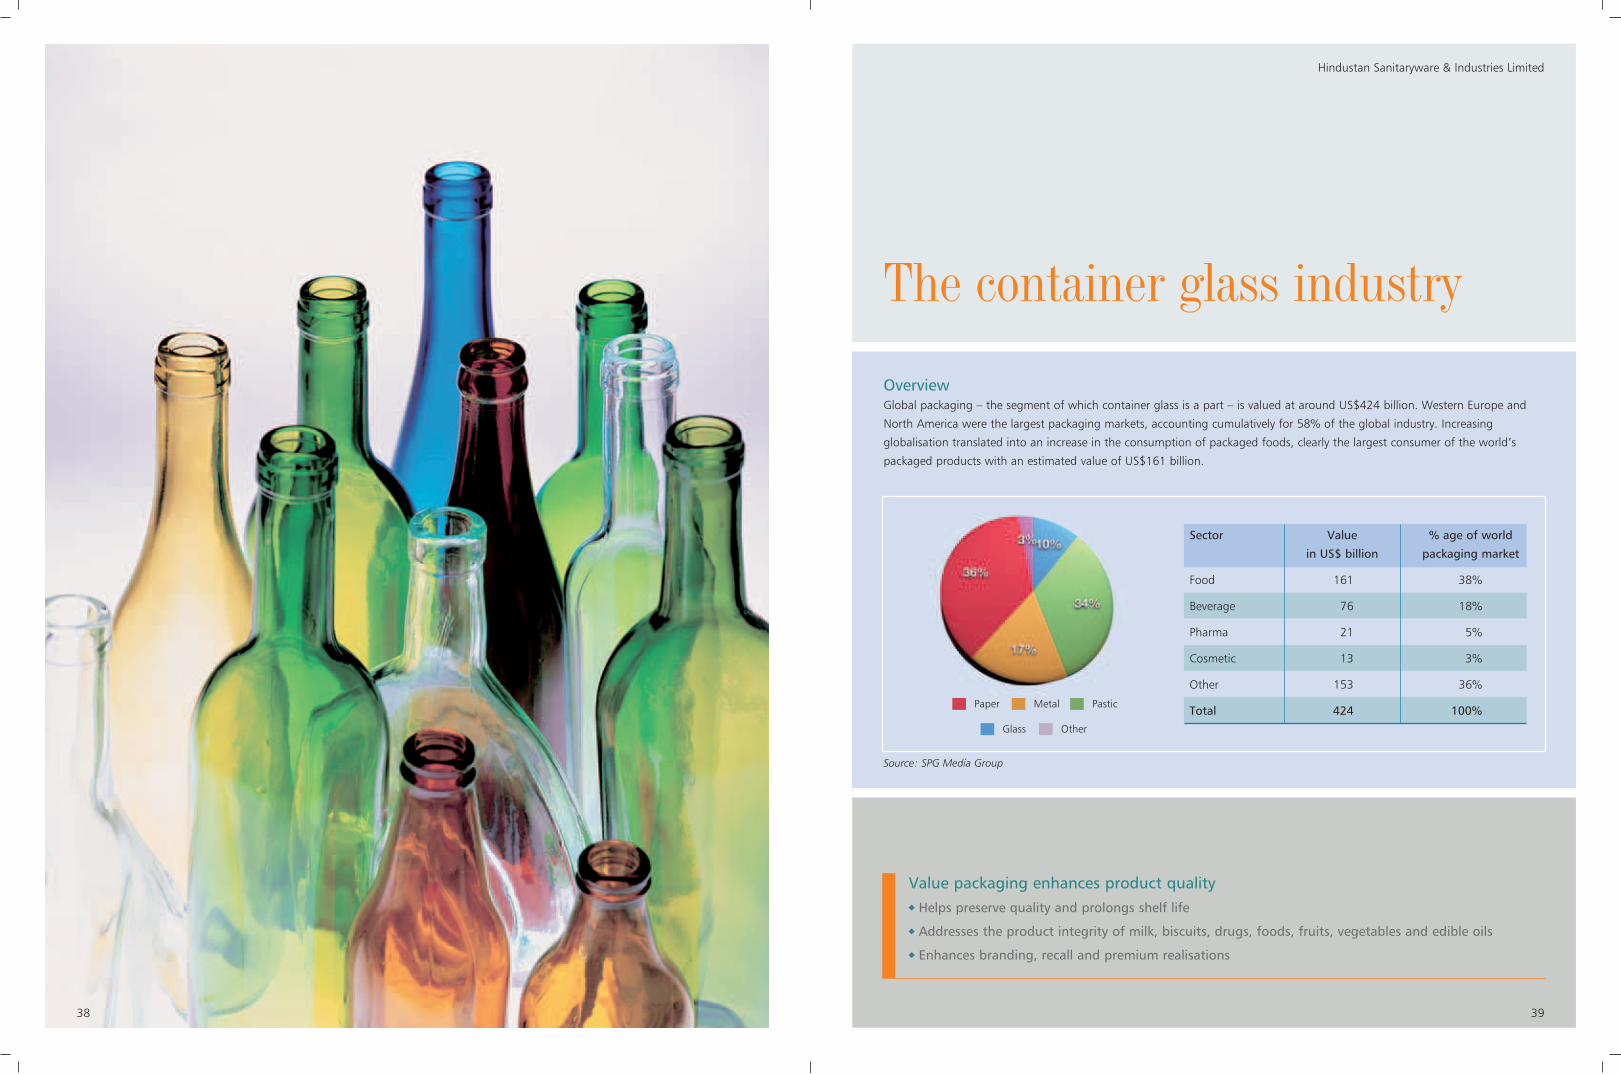
Overview Global packaging – the segment of which container glass is a part – is valued at around US$424 billion. Western Europe and
North America were the largest packaging markets, accounting cumulatively for 58% of the global industry. Increasing
globalisation translated into an increase in the consumption of packaged foods, clearly the largest consumer of the world’s
packaged products with an estimated value of US$161 billion.
39
Hindustan Sanitaryware & Industries Limited
38
The container glass industry
Sector Value % age of world
in US$ billion packaging market
Food 161 38%
Beverage 76 18%
Pharma 21 5%
Cosmetic 13 3%
Other 153 36%
Total 424 100%Paper Metal Pastic
Glass Other
Source: SPG Media Group
Value packaging enhances product qualityHelps preserve quality and prolongs shelf life
Addresses the product integrity of milk, biscuits, drugs, foods, fruits, vegetables and edible oils
Enhances branding, recall and premium realisations
41
Hindustan Sanitaryware & Industries Limited
40
options
Manufacturers need to be located proximate to
consumption points to reduce chances of breakage during
transportation
The segment is marked by an increase in fuel and raw
material costs
There is a growing need to partner with large institutional
buyers to provide customised products and just-in-time
delivery
Manufacturers need operational flexibility to adapt to the
seasonal demand of bottled carbonated beverages
Manufacturers need a wide product portfolio to cater to
the increasing demand for single-use and thin-walled glass
bottles
Container glass advantages Glass represents an effective barrier against oxygen; when
tinted it protects against light and ultra-violet rays – major
reasons for packaged food deterioration. On this count, the
product represents premium packaging material for alcoholic
drinks in Northern America and Europe
It is recyclable with the lowest cost (per cycle)
It is environment friendly when considering greenhouse
effect, acidification and purification
It is ideal for use in high-speed filling lines
It does not deteriorate, corrode, stain or fade on storage
It is microwavable – depending on the jar type
It is hygienic and odourless
It possesses proven qualities against the impact of
chemicals and solvents
It is the only packaging material to receive the US-FDA
approval
It is transparent with attractive product visibility implications
It can be labeled, coloured, silk-screened, enameled,
etched, sand-blasted or coated, leading to numerous
aesthetic applications
It enjoys almost a zero rate of transmission, with
established moisture resistance, contributing to product
strength, freshness and aroma
OutlookIndia's per capita packaging consumption is nearly a seventh
of the global average. With the Indian economy projected to
achieve a sustainable 8% GDP growth, the packaging industry
is expected to double its growth. With discretionary spending
also expected to rise, the annual growth of the packaging
industry is expected to double to around 20-25%. The
container glass industry, which grew at a CAGR of 8% over
five years, is expected to grow at 10%-plus over the
foreseeable future.
Demand driversPharmaceutical industry: Pharma packaging is one of the
fastest growing sectors. The worldwide demand for
packaging equipment for the pharmaceutical and personal
care products sector is growing at 5.4%, an all-time high. The
Indian industry is growing at 15% annually, which is double
the global packaging industry growth (Source: Indian
Institute of Packaging (IIP), Hyderabad). Despite this, only a
few companies in India have used the latest technology in
Indian packaging industry overviewThe Indian packaging industry is growing at more than
15% annualy
There are about 600-700 packaging machinery
manufacturers, 95% in the small and medium sector across
India
The government is keen to create world-class
manufacturing units and vocational institutes specifically
designed to train manpower for the packaging industry
The Indian packaging equipment imports were around
US$125 million. Major equipment suppliers included
Germany, Italy, Switzerland, Taiwan, Korea, China
and U.S.A
India's per capita packaging consumption was less than
US$15 against the global average of nearly US$100
A large growing middle-class, liberalisation and organised
retail sector were packaging sector catalysts; increased
demand from the food and pharmaceutical sectors drove the
industry’s growth
Indian packaging market (by value)
Flexible 22%
Rigid plastics 18%
Printed 17%
Glass 12%
Metal 8%
Cap 6%
Label 3%
Others 14%
Container glass market
North 48%
South 23%
West 19%
East 10%
Container glass industryContainer glass is a part of the rigid packaging segment, the
latter accounting for more than 80% of the total packaging
in India. The Indian market for container glass is estimated at
Rs. 22,000 million, accounting for around 12% of the
country’s packaging industry. The offtake in the container
glass industry is driven by a growth in downstream user
industries like processed foods (FMCG), beverages, beer,
liquor, pharma and retail.
End-user segments
Liquor 42%
Food 20%
Soft drinks 10%
Pharma 21%
Others 7%
Production (tons) 1,500,000
Industry challengesIncreasing awareness regarding hygiene and product
integrity has made it necessary for manufacturers to offer
more than a product – an integrated content preservation
solution
Manufacturers need to innovate in the area of packaging
India's per capita packagingconsumption is nearly a seventhof the global average. With theIndian economy projected toachieve a sustainable 8% GDPgrowth, the packaging industry isexpected to double its growth.
43
Hindustan Sanitaryware & Industries Limited
42
Country Per capita (L) Consumption Consumption Growth%
2005 volume 2005 volume 2010F Growth 2005-2010F
China 24 309.25 406.07 96.82 31
India 1 8.28 10.42 2.15 26
Vietnam 14 11.68 18.44 6.76 58
South Korea 35 16.66 16.48 (184.00) (1)
Cambodia 5 698.00 1.10 398.00 57
Laos 14 826.00 1.32 489.00 59
Hong kong 23 1.58 1.69 489.00 59
Malaysia 5 1.39 1.31 (81.00) (6)
Singapore 16 711.00 750.00 39.00 6
Sri lanka 2 496.00 520.00 24.00 5
Nepal 1 235.00 254.00 19.00 8
Total 351.82 458.36 106.54 30
Asia 13 462.44 578.32 115.88 25
World 24 1,572.21 1,779.23 207.02 13
Source : Express International
Comparative analysis with substitute productsPlastics: Difficult to dispose of, contaminates and degrades slowly. Nearly 10% of our rubbish consists ofdifferent types of plastics.
Aluminum: Requires a lot of mined resources (bauxite) and energy to make. It also requires compulsoryre-cycling.
Brick carton: Complex material, made up of several layers of plastic, paper and aluminium, hencedifficult to recycle.
Card board: Its use may prove to be unnecessary for products already packaged sufficiently.
Glass: Ideal for liquid foods. It is made of raw materials that are available in plenty. It is unalterable,strong and easy to recycle.
pharma packaging.
Food processing industry: According to the 'India Food
Report 2008', investments of around US$23.5 billion are likely
to be made in the food processing industry over three years.
The opportunity is huge compared to the fact that while a
mere 1.3% of food is processed in India, nearly 80% of food
is processed in the developed world. Processed food exports
increased from US$6.98 billion in 2002-03 to US$20.51
billion in 2006-07. To realise India's rich potential in this
segment, the Government has set an ambitious target to
double India's share in global food trade from 1.6% to 3% by
2015, increase the processing of perishable foods from 6% to
20% and achieve a value-addition from 20% to 35% (Source:
IBEF).
Retail growth: Organised retail accounts for only around 4%
of India’s total retail sales. The segment is expected to grow
at a CAGR of about 25% and increase its proportion of total
retail to around 15% by 2015, accelerating the offtake of
FMCG products and packaging demand.
Changing lifestyles: Increased globalisation will evolve
aesthetic and consumer aspirations, stimulating the
consumption of branded products and increase the use of
rigid packaging.
Increased alcohol consumption: The alcohol business in India
comprises beer (22%), IMFL (24%) and country liquor (54%).
A further breakup of the IMFL market is 1.2% vodka, 3.5% gin,
17.6% rum, 18.2% brandy and 59.5% whisky. The segmental
growth of the country’s alcohol industry is as follows:
Growth rate (%)
Strong beer 30 – 40
Light beer 10 – 15
Wine 35 – 40
Scotch whisky 35 – 40
Vodka 20 – 22
Rum 15 – 20
Overall 14 – 15
The country’s beer market is estimated to be 155 million
cases a year and is growing at 30% annually. According to
industry experts, the growth for 2008-09 is likely to be in line
with the growth of the preceding year. Most of the global
breweries like Anheuser Busch, Carlsberg, InBev and Sab
Miller have major expansion plans for the Indian market. Asia
has emerged as the strongest region in the global beer
market with an estimated volume growth pegged at 105
MHL (million hectalitre) during the 2005-10 period.
in ’000 HL
45
Hindustan Sanitaryware & Industries Limited
44
Manufacturing StrengthsCaptive mould-making capability: This enables the
Company to develop glass-making moulds in line with
customer requirements with speed and efficiency.
Flexibility: All the Company’s production lines possess the
flexibility to shift between different products in response to
changes in downstream demand, leading to low inventories
at the customer’s end.
Cutting-edge technology: Superior precision technology
facilitates the manufacture of light-weight bottles that
reduces the consumption of raw materials and energy on the
one hand and enhances revenues on the other.
Process innovations: Continuous process innovations have
facilitated the manufacture of products, catering to different
customer segments without weight changes. This has enabled
the Company to effectively service the increased demand
from downstream users, especially the carbonated beverages
sector.
Quality discipline: The Company’s three-stage quality control
system is audited by external agencies and customers. The
entire output is subject to thorough visual inspections and a
formalised process of quality clearance, prior to dispatch. The
quality department works closely with the marketing and
production teams, matching market needs with internal
availability. The introduction of software strengthened quality
control through a mechanised analysis of lapses identified
during visual inspection.
Highlights, 2007-085.14% increase in revenue from Rs. 2,617.93 million to
Rs. 2,752.39 million
8.87% increase in production from 784.90 to 854.50
million units through de-bottlenecking
7.30% increase in capacity utilisation from 82.35% to
89.65% through process innovation and reduction in bottle
weight
Introduction of 25 new designs, including light-weight
bottle varieties
MarketingDominant market share: The division serviced 15% of India’s
container glass demand and 50% of South India’s container
glass demand.
Price competitiveness: All the customers in South, West and
Central India are located within a radius of 800 km from the
plant site, reducing freight cost.
Diversified markets: The Company also catered to the
growing needs of customers in the Philippines, Yemen,
Nigeria, Bangladesh, Jordan, CIS countries and USA, among
others. Exports accounted for 18% of the total sales of the
division in 2007-08.
Diversified customer base: The Company possesses a
diversified 400-item product portfolio catering to various
downstream users like the food processing, pharmaceutical,
soft drinks and alcohol segments.
A brand-enhancing client base: The Company’s customers
comprise brand-enhancing names like Coca Cola, Pepsi,
GlaxoSmithkline, Pfizer, AstraZenca, Ranbaxy, Dr Reddy’s
Laboratories and Hindustan Unilever, among others.
Highlight, 2007-085.19% increase in turnover from Rs. 2,594.21 million to
Rs. 2,728.81 million
The Company’s presence in thecontainer glass industry
Industry position: Second largest manufacturer of container glass in India
Market shares: 15% and 50% share of the national and South Indian markets respectively
Location: Hyderabad
Divisional revenues: Rs. 2,752.39 million
Revenue increase over 2006-07: 5.14%
% contribution of total revenue: 47.13%
Brand: AGI
Installed capacity: 953.10 million pieces annually
Product portfolio: 400 varieties in three colours – flint, green and amber.
The Company catered to thegrowing needs of customers inthe Philippines, Yemen, Nigeria,Bangladesh, Jordan, CIS countriesand USA, among others. Exportsaccounted for 18% of the totalsales of the division in 2007-08.

47
Hindustan Sanitaryware & Industries Limited
46
Human resource management
In competitive businesses, people make the difference.
In view of this, the Company emphasises a performance-driven work culture with a human face.
Corporate targets are linked to individual goals segregated into several key result areas (KRAs)
across which individual performance is evaluated. To enable its key managerial employees to
excel in the desired competencies, the Company undertook several training sessions in 2007-08,
covering 89% of the managerial staff.
RecruitmentThe Company recruited graduate engineering trainees (GETs)
and diploma holders through campus placements from
reputed institutes like Engineering College of Ceramic etc.
from all over India and hired management trainees from
recognised institutes in the NCR region.
TrainingHSIL started a three-day induction training programme for
‘New Hire’ to enhance familiarity with the Company’s vision
and mission. This was followed by a 10-day product training
session to highlight product attributes and features
Continuous competence-based training was imparted in
communication skills, inter-personal skills and conflict
management
A special emphasis was laid on ISO and OHSAS trainings
across all divisions of HSIL. The Company also conducted
outbound training activities to encourage team and inter-
personal relation building
RetentionThe Company recognised the importance of retaining key
employees, accounting for about 20% of its total strength. It
groomed high performers to assume key positions created
through organisational re-structuring that included formation
of new divisions and new regions for the sales team. This
successfully served the purpose of talent retention and the
creation of a second line of command.
Initiatives The Company restructured its compensation package in line
with industry standards. It introduced several motivational
schemes to encourage employees. It introduced Operation
Vijay, a theme-based sales motivational exercise.
The Company undertook adventurous sporting activities with
compulsory participation for key managerial employees,
enhancing their decision-making capabilities.
OutlookThe Company introduced an employee satisfaction survey to
undertake corrective measures. It documented its newly
introduced mentoring process and induction training
programme to facilitate better record keeping. In view of all
these initiatives, the Company expects to retain its position as
a preferred employer in the country.
Our HR goal Lean, trim and flexible manning
Continuous skill enhancement leading to innovation
Optimal manpower utilisation
Greater leverage of information technology for enhanced efficiency
Active communication across tiers, departments and geographies for enhanced transparency
Better planning for management succession at all levels leading to organisational continuity
Career planning resulting in greater motivation
Benchmarking performance to international levels
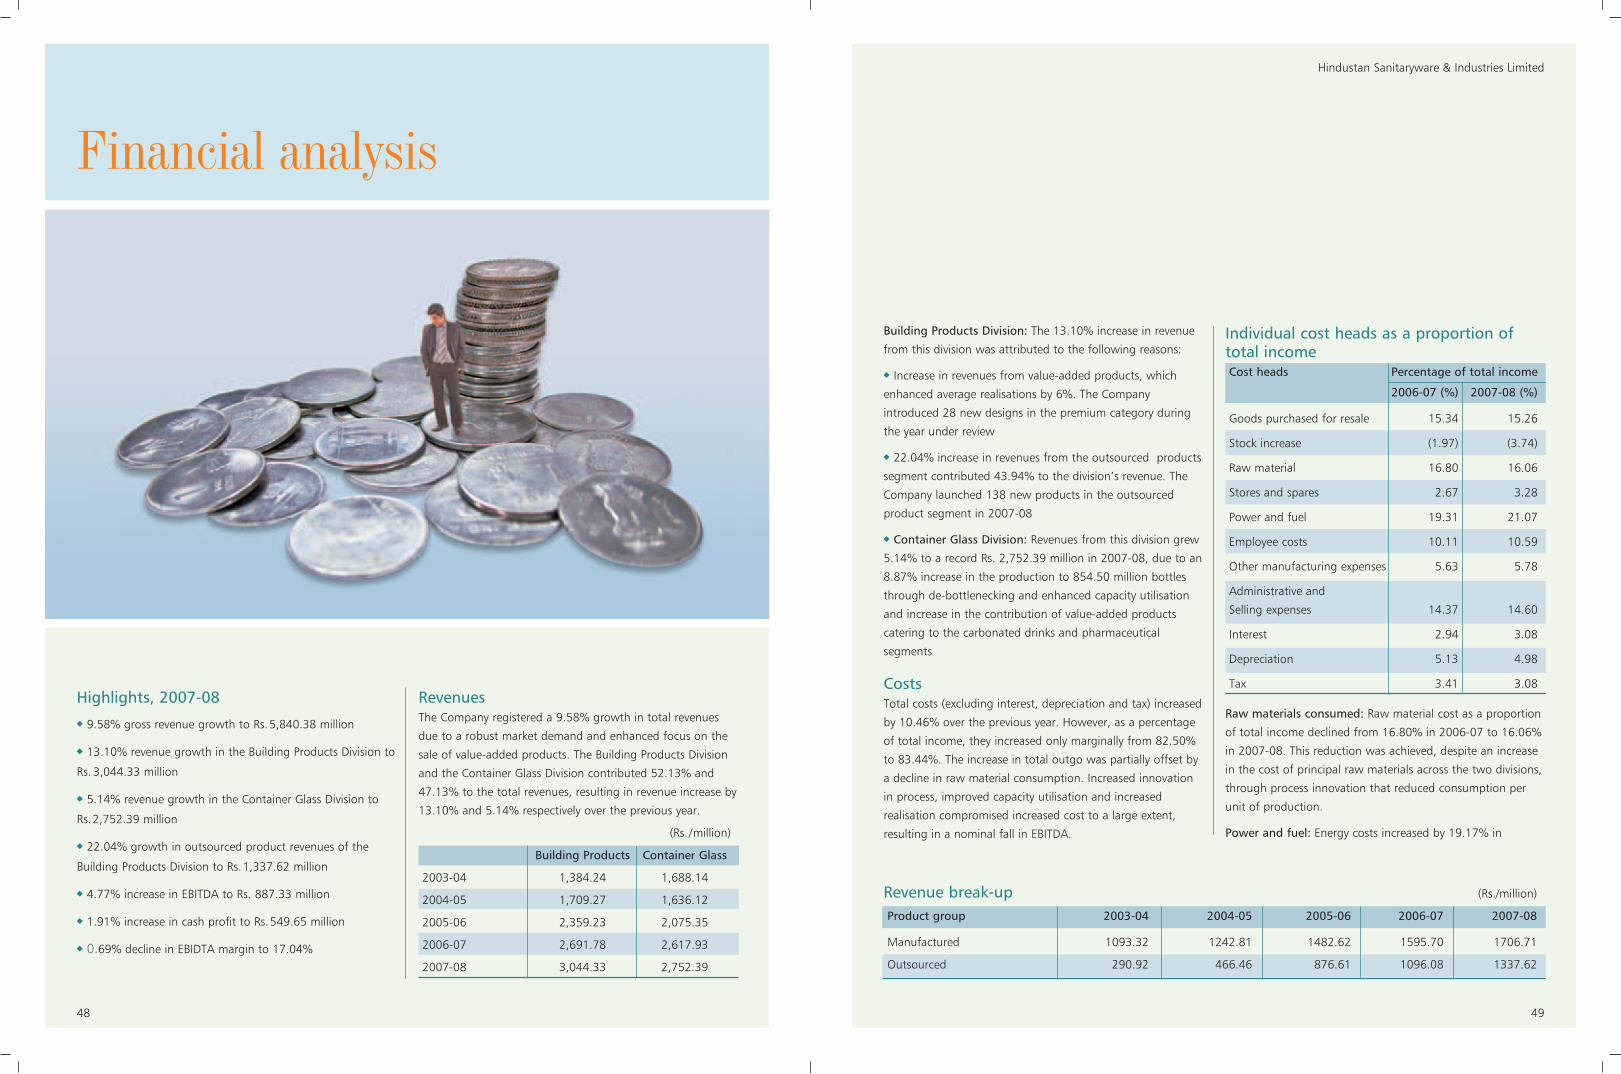
49
Hindustan Sanitaryware & Industries Limited
48
Financial analysis
Highlights, 2007-08
9.58% gross revenue growth to Rs.5,840.38 million
13.10% revenue growth in the Building Products Division to
Rs. 3,044.33 million
5.14% revenue growth in the Container Glass Division to
Rs.2,752.39 million
22.04% growth in outsourced product revenues of the
Building Products Division to Rs.1,337.62 million
4.77% increase in EBITDA to Rs. 887.33 million
1.91% increase in cash profit to Rs.549.65 million
0.69% decline in EBIDTA margin to 17.04%
RevenuesThe Company registered a 9.58% growth in total revenues
due to a robust market demand and enhanced focus on the
sale of value-added products. The Building Products Division
and the Container Glass Division contributed 52.13% and
47.13% to the total revenues, resulting in revenue increase by
13.10% and 5.14% respectively over the previous year.
(Rs. /million)
Building Products Container Glass
2003-04 1,384.24 1,688.14
2004-05 1,709.27 1,636.12
2005-06 2,359.23 2,075.35
2006-07 2,691.78 2,617.93
2007-08 3,044.33 2,752.39
Revenue break-up (Rs./million)
Product group 2003-04 2004-05 2005-06 2006-07 2007-08
Manufactured 1093.32 1242.81 1482.62 1595.70 1706.71
Outsourced 290.92 466.46 876.61 1096.08 1337.62
Building Products Division: The 13.10% increase in revenue
from this division was attributed to the following reasons:
Increase in revenues from value-added products, which
enhanced average realisations by 6%. The Company
introduced 28 new designs in the premium category during
the year under review
22.04% increase in revenues from the outsourced products
segment contributed 43.94% to the division’s revenue. The
Company launched 138 new products in the outsourced
product segment in 2007-08
Container Glass Division: Revenues from this division grew
5.14% to a record Rs. 2,752.39 million in 2007-08, due to an
8.87% increase in the production to 854.50 million bottles
through de-bottlenecking and enhanced capacity utilisation
and increase in the contribution of value-added products
catering to the carbonated drinks and pharmaceutical
segments
CostsTotal costs (excluding interest, depreciation and tax) increased
by 10.46% over the previous year. However, as a percentage
of total income, they increased only marginally from 82.50%
to 83.44%. The increase in total outgo was partially offset by
a decline in raw material consumption. Increased innovation
in process, improved capacity utilisation and increased
realisation compromised increased cost to a large extent,
resulting in a nominal fall in EBITDA.
Individual cost heads as a proportion oftotal incomeCost heads Percentage of total income
2006-07 (%) 2007-08 (%)
Goods purchased for resale 15.34 15.26
Stock increase (1.97) (3.74)
Raw material 16.80 16.06
Stores and spares 2.67 3.28
Power and fuel 19.31 21.07
Employee costs 10.11 10.59
Other manufacturing expenses 5.63 5.78
Administrative and
Selling expenses 14.37 14.60
Interest 2.94 3.08
Depreciation 5.13 4.98
Tax 3.41 3.08
Raw materials consumed: Raw material cost as a proportion
of total income declined from 16.80% in 2006-07 to 16.06%
in 2007-08. This reduction was achieved, despite an increase
in the cost of principal raw materials across the two divisions,
through process innovation that reduced consumption per
unit of production.
Power and fuel: Energy costs increased by 19.17% in
51
Hindustan Sanitaryware & Industries Limited
50
quantum terms in 2007-08. However, as a proportion of total
income, it increased only marginally from 19.31% to 21.07%
on account of the following power-saving measures:
Better production planning, reducing the number of batch
changes and the manufacture of lighter container varieties
helped rationalise energy consumption in the Container Glass
Division
Use of waste heat from kilns and optimisation of the firing
cycle helped rationalise energy consumption in the Building
Products Division
Employee costs: There was 14.42% increase in employee
cost during 2007-08 on account of enhanced recruitment
and a restructured compensation package. However, due to
increased productivity, employee cost as a proportion of
total income increased only by 0.48% over the previous
year.
MarginsThe Company was able to protect its EBITDA margin by
proactive management of power, fuel and raw material costs
and the EBITDA declined by only 0.69% from 17.73% in
2006-07 to 17.04% in 2007-08. Besides, the Company
responded through higher asset utilisation, improved product
mix, enhanced production, better productivity and higher
efficiency. The Company also undertook an aggressive
advertisement campaign of Rs.104.56 million to promote its
Hindware brand, the entire amount of which was charged
against income. The sales growth of the Building Products
Division was moderate and the growth could not be higher
without deterioration in the quality of credit and large
outstandings. We decided to convert a substantial part of its
sales to cash from credit and decided to serve the normal
market demand avoiding sales policies aimed at forcing this
demand, carrying out constant control and monitoring
measures on the credit exposure towards the dealers, which
led to improvement in credit and sales quality. This resulted in
reduced outstanding debtors despite sales growth.
FundsEquity capital: The Company’s equity capital was maintained
at Rs.110.05 million, with no equity dilution during 2007-08.
The equity capital consisted of 55,025,508 equity shares of
Rs.2 each.
Reserves: The Company’s reserves increased by Rs.1,906.81
million to Rs.2,096.74 million in 2007-08. The net addition
was on account of profits earned during the year in addition
to what was transferred from the previous year (net of
dividend paid and tax thereupon). The Company does not
have any revaluation reserve. Almost 99.23% of its total
reserves comprised free reserves. The Company’s book value
of shares strengthened from Rs.36.65 in 2006-07 to
Rs.40.10 in 2007-08.
Loan funds: The Company’s total debt increased by 4.63% to
Rs.2,018.62 million, mainly on account of loans taken for
meeting increased working capital requirements to match the
business growth. Despite an increase in loan funds, the
Company remained attractively geared with the ratio of total
long-term debt to total equity at 0.29:1. Besides, an interest
cover of 5.44 ensured adequate credit worthiness.
Long-term debt-equity ratio2003-04 2004-05 2005-06 2006-07 2007-08
0.41 0.73 0.48 0.37 0.29
Interest cover2003-04 2004-05 2005-06 2006-07 2007-08
4.36 5.57 6.07 5.94 5.44
Fixed assetsDuring 2007-08, the Company added Rs. 388.65 million to
its fixed assets. Addition to plant and machinery accounted
for Rs. 218.89 million (56.32% of the total addition). The
investment in plant and machinery was on account of
balancing equipment addition that enhanced production
through de-bottlenecking. The Company was able to sweat
its assets better, reflected in the strengthening of the fixed
assets-turnover ratio from 2.37 to 2.46.
Fixed asset gross turnover ratio2003-04 2004-05 2005-06 2006-07 2007-08
1.98 1.67 2.14 2.37 2.46
InvestmentsThe Company’s investments declined 27.69% as on March
31, 2008 (Rs. 350.10 million) compared to that on March 31,
2007 (Rs. 484.15 million), mainly on account of a liquidation
in short-term investments held in mutual funds.
Working capitalWorking capital at the end of the financial year increased
from Rs.1,368.15 million to Rs.1,596 million in 2007-08 for
the following factors:
Rise in the stock of finished goods in the Building Products
Division due to a change in the sales policy from credit to
cash. However, with partners in the distribution channel
gradually reconciling, the Company expects to reverse this
trend in 2008-09
Increase in debtors in the Container Glass Division
corresponding to record sales from this division in the history
of the Company. The Company’s debtors comprised reputable
institutional buyers from the pharmaceutical, FMCG and liquor
sectors with a negligible record of payment default
The working capital outlay as a proportion of total capital
employed increased from 31.86% in 2006-07 to 34.95% in
2007-08. The current and quick ratios were maintained at the
levels of the previous year, indicating stable short-term liquidity.
Liquidity ratios2007-08 2006-07
Current ratio 2.43 2.40
Quick ratio 1.14 1.15
InventoryThe inventory of the Company constituted approximately
53.03% of the current assets as at the year end. Total
inventory increased by 18.01% at the year end to
Rs.1,437.63 million. The inventory-turnover tenure increased
from 84 days to 91 days of turnover equivalent during the
year, attributable to:
Change in the sales policy in the Building Products Division
Maintaining a large inventory of finished goods to cater to
diverse requirements across geographies
Large number SKUs
Maintaining a large stock of raw materials and large
volumes of packaging material due to seasonal availability
Servicing an increased demand for outsourced products
DebtorsDebtors constituted approximately 33.55% of the current
assets at the end of the year. Debtors increased by 18.07% to
Rs. 909.58 million in 2007-08. The debtors’ cycle in the
Building Products Division improved from 45 days to 42 days
in 2007-08, due to a greater proportion of cash-and-carry
sales. However, Container Glass Division witnessed an
increase in the debtors cycle from 64 days in 2006-07 to 76
days in 2007-08.
CreditorsThe creditors (including creditors for services and expenses)
increased from Rs. 891.06 million in 2006-07 to Rs. 973.05
million in 2007-08 due to an increase in business activity. The
creditors’ cycle declined from 51 days of turnover in 2006-07
to 44 days in 2007-08 as the Company availed of attractive
discounts on quicker payments.
TaxTax liability (current, deferred and fringe benefit) decreased
from Rs.165.03 million in 2006-07 to Rs.162.80 million in
2007-08.
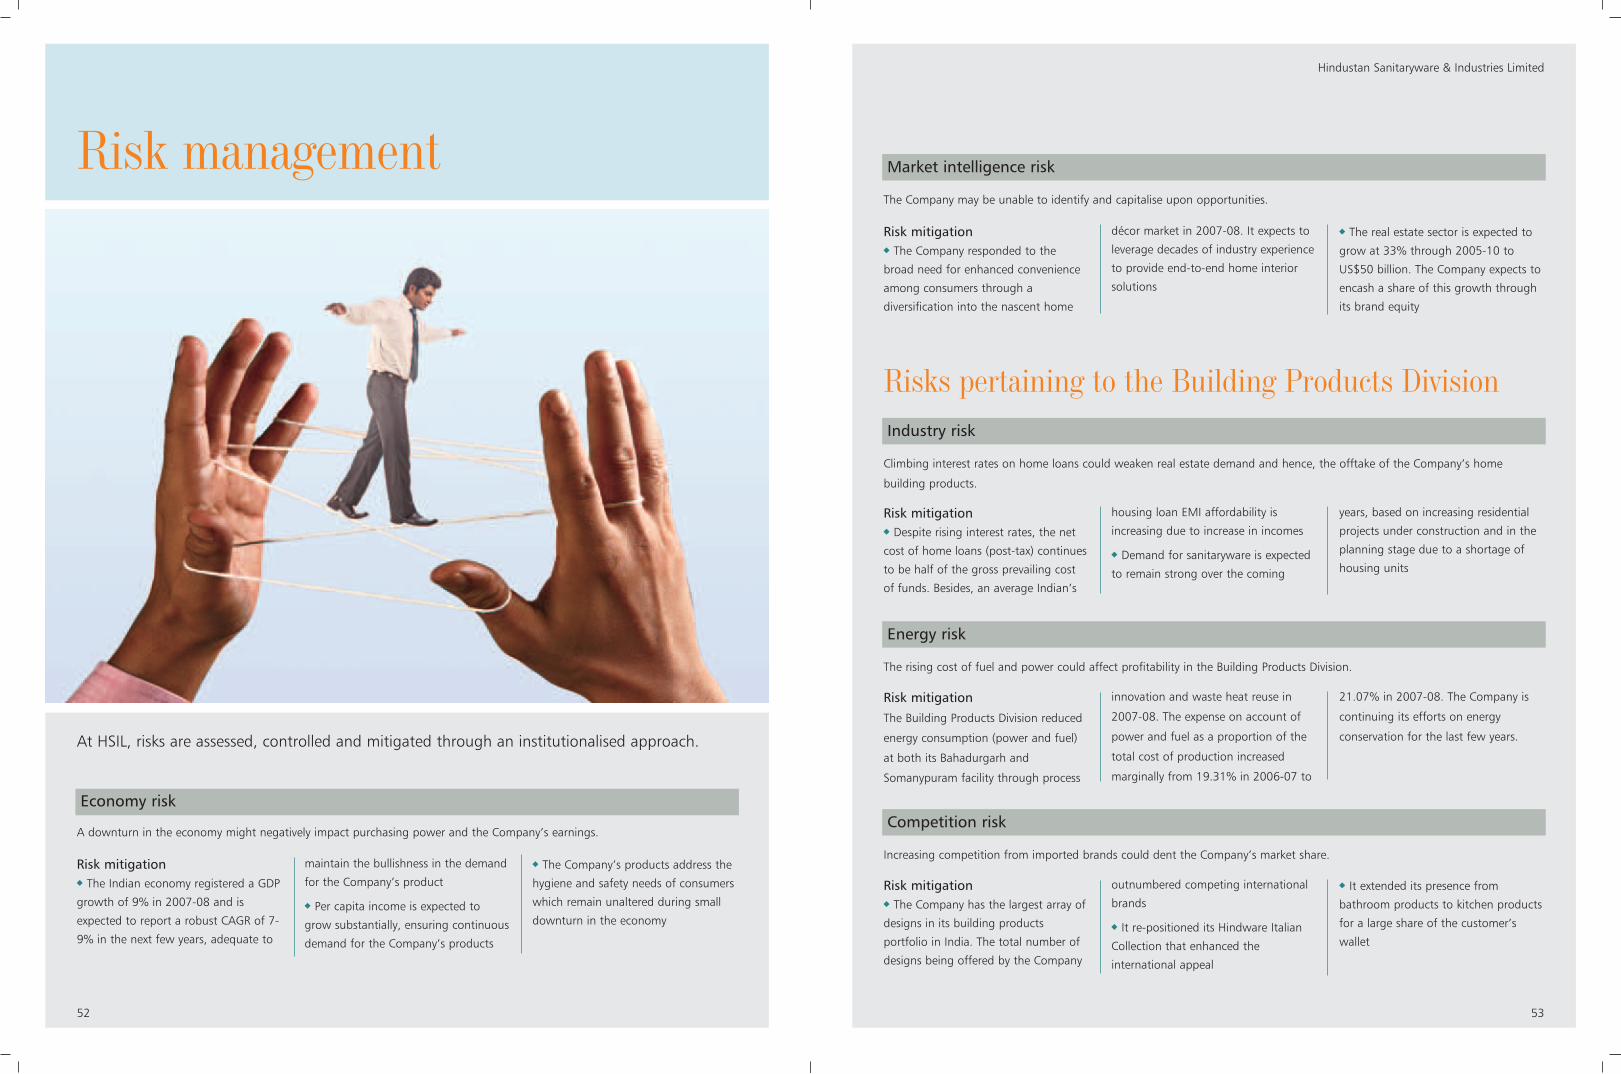
53
Hindustan Sanitaryware & Industries Limited
52
Risk management
Risks pertaining to the Building Products Division
A downturn in the economy might negatively impact purchasing power and the Company’s earnings.
Risk mitigationThe Indian economy registered a GDP
growth of 9% in 2007-08 and is
expected to report a robust CAGR of 7-
9% in the next few years, adequate to
maintain the bullishness in the demand
for the Company’s product
Per capita income is expected to
grow substantially, ensuring continuous
demand for the Company’s products
The Company’s products address the
hygiene and safety needs of consumers
which remain unaltered during small
downturn in the economy
At HSIL, risks are assessed, controlled and mitigated through an institutionalised approach.
Economy risk
The Company may be unable to identify and capitalise upon opportunities.
Risk mitigationThe Company responded to the
broad need for enhanced convenience
among consumers through a
diversification into the nascent home
décor market in 2007-08. It expects to
leverage decades of industry experience
to provide end-to-end home interior
solutions
The real estate sector is expected to
grow at 33% through 2005-10 to
US$50 billion. The Company expects to
encash a share of this growth through
its brand equity
Market intelligence risk
Climbing interest rates on home loans could weaken real estate demand and hence, the offtake of the Company’s home
building products.
Risk mitigationDespite rising interest rates, the net
cost of home loans (post-tax) continues
to be half of the gross prevailing cost
of funds. Besides, an average Indian’s
housing loan EMI affordability is
increasing due to increase in incomes
Demand for sanitaryware is expected
to remain strong over the coming
years, based on increasing residential
projects under construction and in the
planning stage due to a shortage of
housing units
Industry risk
The rising cost of fuel and power could affect profitability in the Building Products Division.
Risk mitigationThe Building Products Division reduced
energy consumption (power and fuel)
at both its Bahadurgarh and
Somanypuram facility through process
innovation and waste heat reuse in
2007-08. The expense on account of
power and fuel as a proportion of the
total cost of production increased
marginally from 19.31% in 2006-07 to
21.07% in 2007-08. The Company is
continuing its efforts on energy
conservation for the last few years.
Energy risk
Increasing competition from imported brands could dent the Company’s market share.
Risk mitigationThe Company has the largest array of
designs in its building products
portfolio in India. The total number of
designs being offered by the Company
outnumbered competing international
brands
It re-positioned its Hindware Italian
Collection that enhanced the
international appeal
It extended its presence from
bathroom products to kitchen products
for a large share of the customer’s
wallet
Competition risk
55
Hindustan Sanitaryware & Industries Limited
54
The Company may not be able to recover dues from dealers/distributors, resulting in losses arising out of bad debts.
Risk mitigationThe Company has increased its share
of cash sales from 45% to 82% in this
year. It will further increase its share of
cash sales
Although this temporarily depressed
sales, receivables (equivalent to days of
turnover) also declined by 7% (post
implementation of SAP)
Informed decision-making through
the implementation of SAP is expected
to shrink these receivables further
Debtors’ risk
An inability to provide the right product at the right time and place could lead to customer attrition.
Risk mitigationThe Company has the widest network
of dealers, sub-dealers and retail outlets
in the industry
Its products are available in all Indian
states and across most Indian towns
with a population of 30,000
It invested significantly in
strengthening its distribution network
in un-represented towns and ‘threat’
markets and in improving the quality of
retail display
The Number of depots have been
increased to ensure faster availability of
products to consumers
Product unavailability risk
The container glass manufactured by the Company could be progressively substituted with cheaper alternatives like PET bottles.
Risk mitigationGlass bottles score over PET for the
following reasons: they represent a
lower cost per use as they can be
recycled, provide a better barrier
against oxygen, prevent food
deterioration, can carry printed
advertisements and have been
conclusively proved to be hygienic and
non-carcinogenic with corresponding
approvals by the US-FDA, one of the
most demanding approving agencies in
the world
Alternative product risk
Inability to supply products in the right quantity and price may lead to client attrition and subsequent loss of market share.
Risk mitigationThe Company is setting up a new
state-of-the art Container Glass facility
in Bhongir (60 kms from Hyderabad),
proximate to natural gas sources. The
superior precision technology of this
plant will facilitate the manufacture of
light containers leading to material
savings and reduction of energy
consumption in a significant way
At its existing manufacturing facility,
increased production by batch size
optimisation, process innovation and
better production planning will address
any demand-supply mismatch
Client attrition risk
An excessive dependence on a particular container glass user industry could impact revenues in the event of an industry downturn.
Risk mitigationThe division’s diversified products
portfolio caters to the soft drink,
alcoholic beverage, food processing
and pharmaceutical sectors
Its plant has the production flexibility
to shift from one product category,
catering to different user industries,
depending on market conditions
User industry risk
The Company’s products are used in high-speed packaging lines at the customers’ end, prioritising the need for enhanced quality.
Risk mitigationA prudent mix of cutting-edge
technology, backward integration into
quartz crushing that enhances the
captive availability of quality sand and
the use of specialised quality control
equipment (electronic temperature
controls, motor devices and an
automatic inspection machine)
translated into enhanced product
standards
The Company’s container glass unit is
ISO:9001-certified, resulting in process
discipline and consistency
The Company’s quality commitment
is showcased in its brand-enhancing
customer profile: Coca Cola, Pepsi,
GlaxoSmithkline, Pfizer, AstraZenca,
Ranbaxy, Dr Reddy’s Laboratories,
Hindustan Unilever, Priya, Global
Green, Continental Coffee, Reckitt
Benckiser, Seagram, Sab Miller,
McDowell, Shaw Wallace and United
Breweries
Packaging quality risk
Risks pertaining to the Container Glass Division
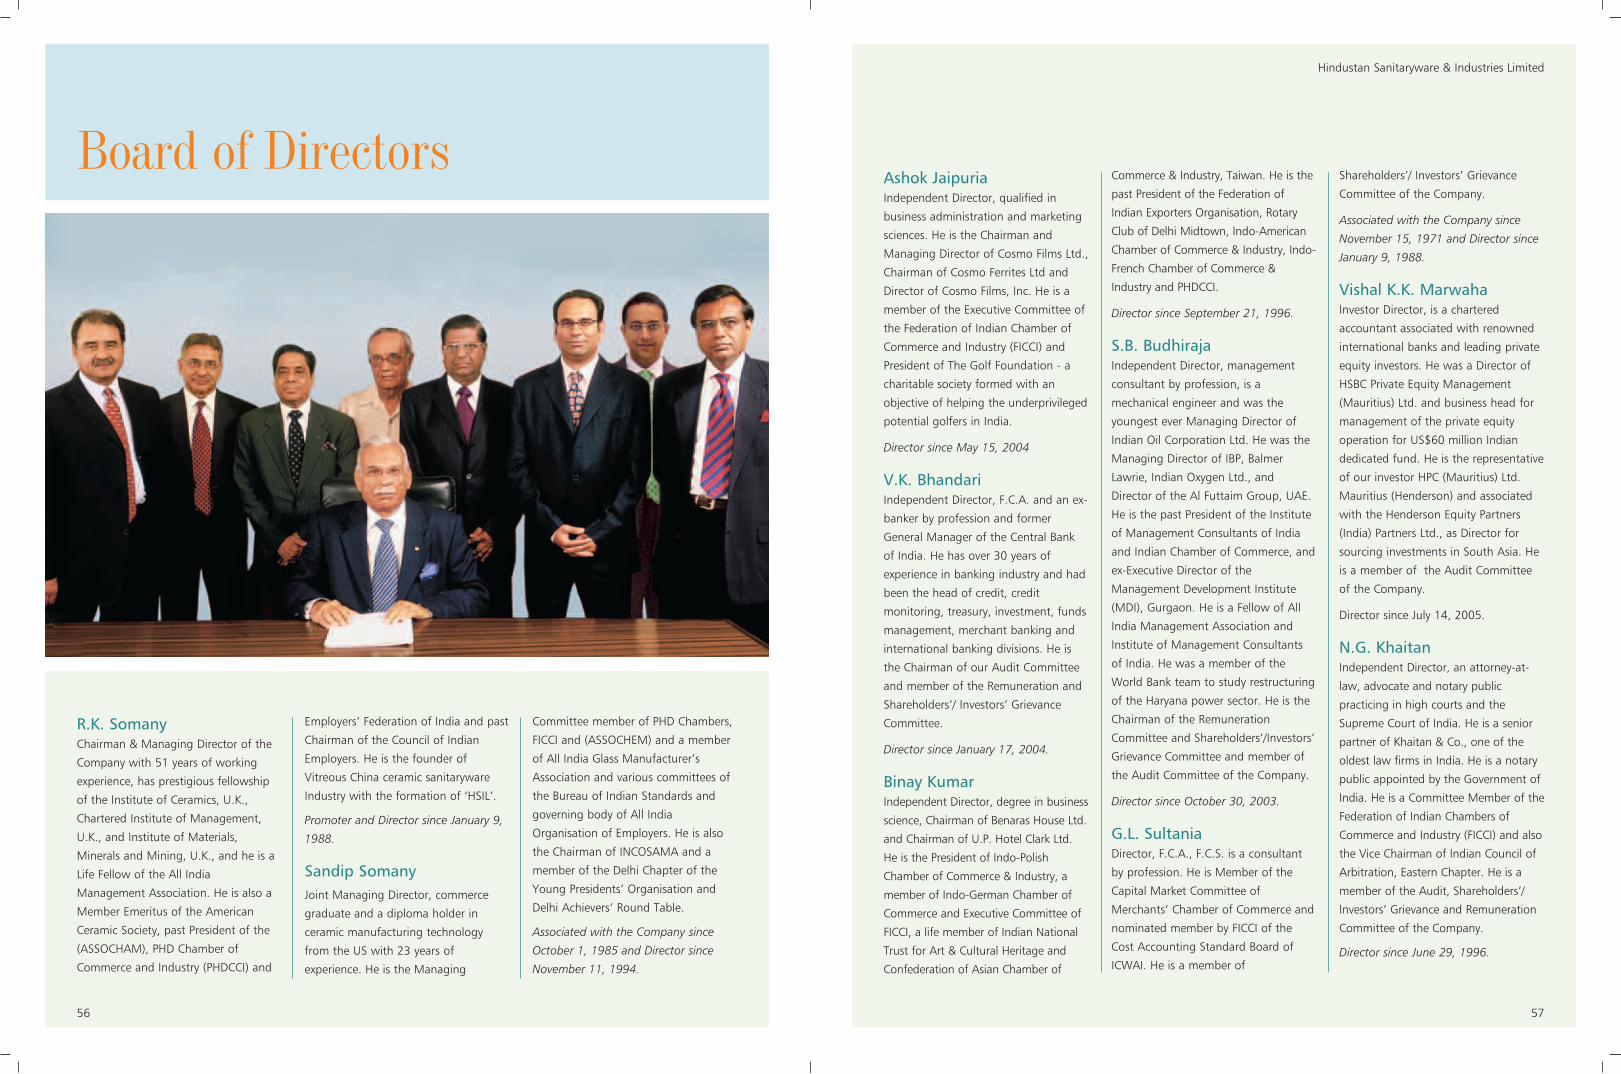
57
Hindustan Sanitaryware & Industries Limited
56
Board of Directors
R.K. SomanyChairman & Managing Director of the
Company with 51 years of working
experience, has prestigious fellowship
of the Institute of Ceramics, U.K.,
Chartered Institute of Management,
U.K., and Institute of Materials,
Minerals and Mining, U.K., and he is a
Life Fellow of the All India
Management Association. He is also a
Member Emeritus of the American
Ceramic Society, past President of the
(ASSOCHAM), PHD Chamber of
Commerce and Industry (PHDCCI) and
Employers’ Federation of India and past
Chairman of the Council of Indian
Employers. He is the founder of
Vitreous China ceramic sanitaryware
Industry with the formation of ‘HSIL’.
Promoter and Director since January 9,
1988.
Sandip SomanyJoint Managing Director, commerce
graduate and a diploma holder in
ceramic manufacturing technology
from the US with 23 years of
experience. He is the Managing
Committee member of PHD Chambers,
FICCI and (ASSOCHEM) and a member
of All India Glass Manufacturer’s
Association and various committees of
the Bureau of Indian Standards and
governing body of All India
Organisation of Employers. He is also
the Chairman of INCOSAMA and a
member of the Delhi Chapter of the
Young Presidents’ Organisation and
Delhi Achievers’ Round Table.
Associated with the Company since
October 1, 1985 and Director since
November 11, 1994.
Ashok JaipuriaIndependent Director, qualified in
business administration and marketing
sciences. He is the Chairman and
Managing Director of Cosmo Films Ltd.,
Chairman of Cosmo Ferrites Ltd and
Director of Cosmo Films, Inc. He is a
member of the Executive Committee of
the Federation of Indian Chamber of
Commerce and Industry (FICCI) and
President of The Golf Foundation - a
charitable society formed with an
objective of helping the underprivileged
potential golfers in India.
Director since May 15, 2004
V.K. BhandariIndependent Director, F.C.A. and an ex-
banker by profession and former
General Manager of the Central Bank
of India. He has over 30 years of
experience in banking industry and had
been the head of credit, credit
monitoring, treasury, investment, funds
management, merchant banking and
international banking divisions. He is
the Chairman of our Audit Committee
and member of the Remuneration and
Shareholders’/ Investors’ Grievance
Committee.
Director since January 17, 2004.
Binay KumarIndependent Director, degree in business
science, Chairman of Benaras House Ltd.
and Chairman of U.P. Hotel Clark Ltd.
He is the President of Indo-Polish
Chamber of Commerce & Industry, a
member of Indo-German Chamber of
Commerce and Executive Committee of
FICCI, a life member of Indian National
Trust for Art & Cultural Heritage and
Confederation of Asian Chamber of
Commerce & Industry, Taiwan. He is the
past President of the Federation of
Indian Exporters Organisation, Rotary
Club of Delhi Midtown, Indo-American
Chamber of Commerce & Industry, Indo-
French Chamber of Commerce &
Industry and PHDCCI.
Director since September 21, 1996.
S.B. BudhirajaIndependent Director, management
consultant by profession, is a
mechanical engineer and was the
youngest ever Managing Director of
Indian Oil Corporation Ltd. He was the
Managing Director of IBP, Balmer
Lawrie, Indian Oxygen Ltd., and
Director of the Al Futtaim Group, UAE.
He is the past President of the Institute
of Management Consultants of India
and Indian Chamber of Commerce, and
ex-Executive Director of the
Management Development Institute
(MDI), Gurgaon. He is a Fellow of All
India Management Association and
Institute of Management Consultants
of India. He was a member of the
World Bank team to study restructuring
of the Haryana power sector. He is the
Chairman of the Remuneration
Committee and Shareholders’/Investors’
Grievance Committee and member of
the Audit Committee of the Company.
Director since October 30, 2003.
G.L. SultaniaDirector, F.C.A., F.C.S. is a consultant
by profession. He is Member of the
Capital Market Committee of
Merchants’ Chamber of Commerce and
nominated member by FICCI of the
Cost Accounting Standard Board of
ICWAI. He is a member of
Shareholders’/ Investors’ Grievance
Committee of the Company.
Associated with the Company since
November 15, 1971 and Director since
January 9, 1988.
Vishal K.K. MarwahaInvestor Director, is a chartered
accountant associated with renowned
international banks and leading private
equity investors. He was a Director of
HSBC Private Equity Management
(Mauritius) Ltd. and business head for
management of the private equity
operation for US$60 million Indian
dedicated fund. He is the representative
of our investor HPC (Mauritius) Ltd.
Mauritius (Henderson) and associated
with the Henderson Equity Partners
(India) Partners Ltd., as Director for
sourcing investments in South Asia. He
is a member of the Audit Committee
of the Company.
Director since July 14, 2005.
N.G. KhaitanIndependent Director, an attorney-at-
law, advocate and notary public
practicing in high courts and the
Supreme Court of India. He is a senior
partner of Khaitan & Co., one of the
oldest law firms in India. He is a notary
public appointed by the Government of
India. He is a Committee Member of the
Federation of Indian Chambers of
Commerce and Industry (FICCI) and also
the Vice Chairman of Indian Council of
Arbitration, Eastern Chapter. He is a
member of the Audit, Shareholders’/
Investors’ Grievance and Remuneration
Committee of the Company.
Director since June 29, 1996.
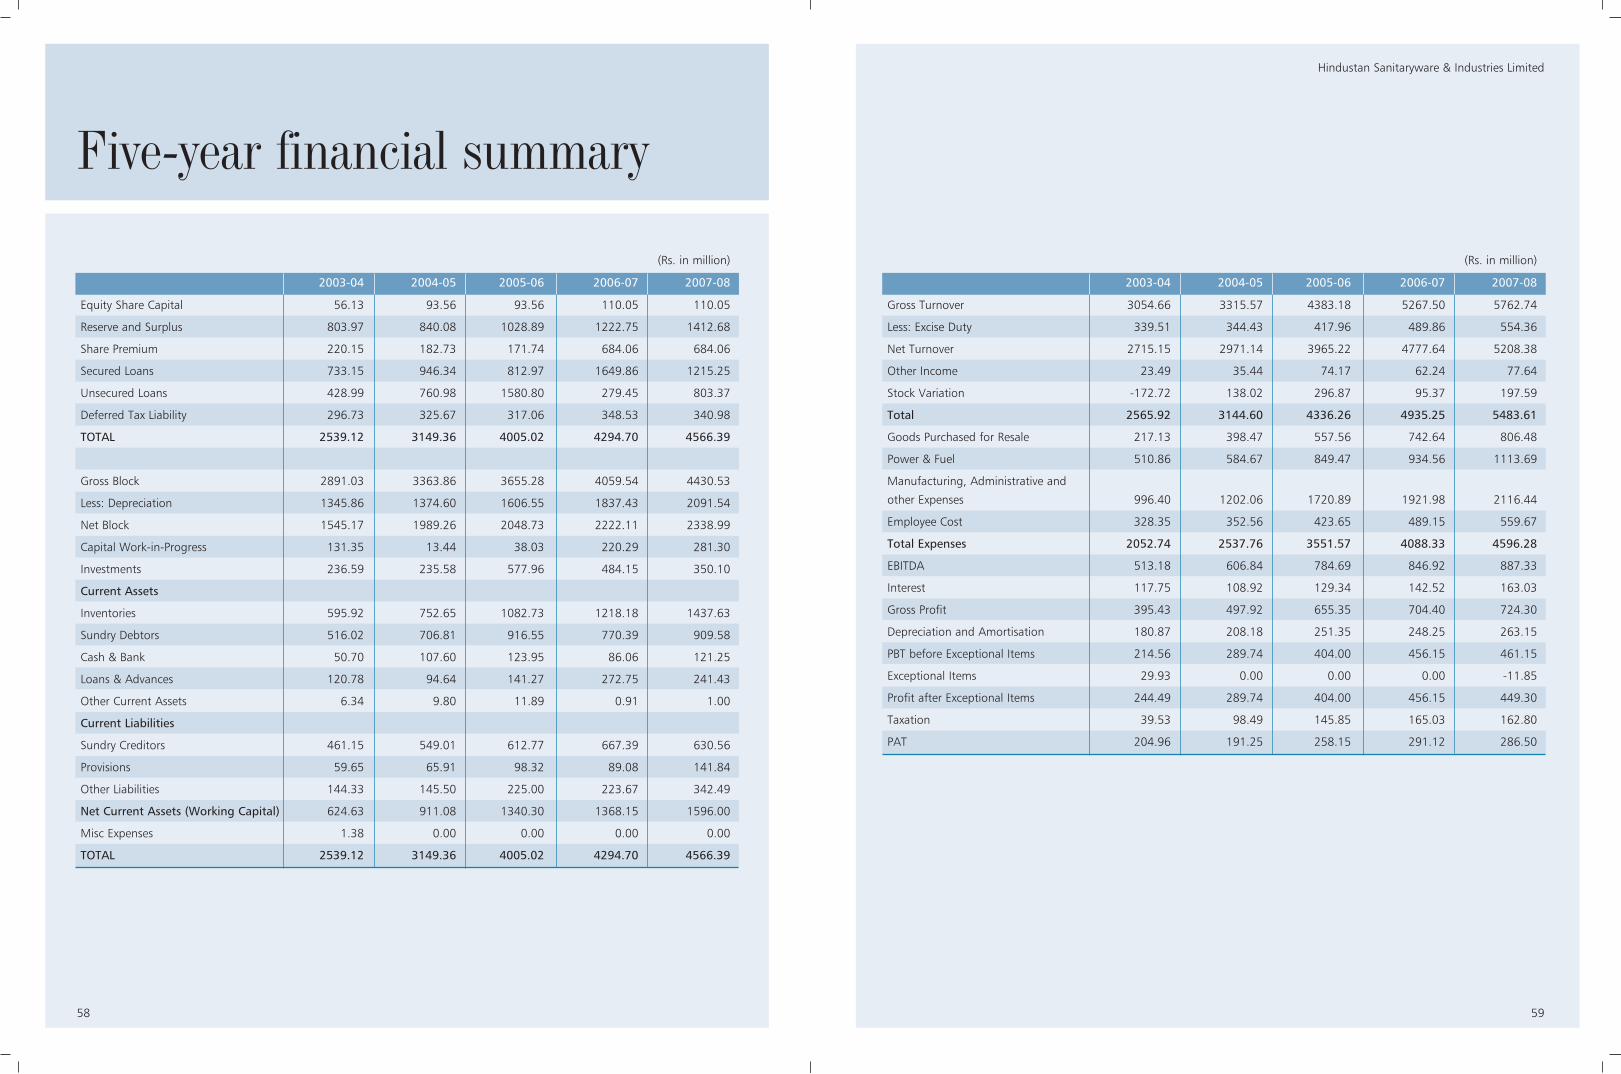
59
Hindustan Sanitaryware & Industries Limited
58
Five-year financial summary
(Rs. in million)
2003-04 2004-05 2005-06 2006-07 2007-08
Equity Share Capital 56.13 93.56 93.56 110.05 110.05
Reserve and Surplus 803.97 840.08 1028.89 1222.75 1412.68
Share Premium 220.15 182.73 171.74 684.06 684.06
Secured Loans 733.15 946.34 812.97 1649.86 1215.25
Unsecured Loans 428.99 760.98 1580.80 279.45 803.37
Deferred Tax Liability 296.73 325.67 317.06 348.53 340.98
TOTAL 2539.12 3149.36 4005.02 4294.70 4566.39
Gross Block 2891.03 3363.86 3655.28 4059.54 4430.53
Less: Depreciation 1345.86 1374.60 1606.55 1837.43 2091.54
Net Block 1545.17 1989.26 2048.73 2222.11 2338.99
Capital Work-in-Progress 131.35 13.44 38.03 220.29 281.30
Investments 236.59 235.58 577.96 484.15 350.10
Current Assets
Inventories 595.92 752.65 1082.73 1218.18 1437.63
Sundry Debtors 516.02 706.81 916.55 770.39 909.58
Cash & Bank 50.70 107.60 123.95 86.06 121.25
Loans & Advances 120.78 94.64 141.27 272.75 241.43
Other Current Assets 6.34 9.80 11.89 0.91 1.00
Current Liabilities
Sundry Creditors 461.15 549.01 612.77 667.39 630.56
Provisions 59.65 65.91 98.32 89.08 141.84
Other Liabilities 144.33 145.50 225.00 223.67 342.49
Net Current Assets (Working Capital) 624.63 911.08 1340.30 1368.15 1596.00
Misc Expenses 1.38 0.00 0.00 0.00 0.00
TOTAL 2539.12 3149.36 4005.02 4294.70 4566.39
(Rs. in million)
2003-04 2004-05 2005-06 2006-07 2007-08
Gross Turnover 3054.66 3315.57 4383.18 5267.50 5762.74
Less: Excise Duty 339.51 344.43 417.96 489.86 554.36
Net Turnover 2715.15 2971.14 3965.22 4777.64 5208.38
Other Income 23.49 35.44 74.17 62.24 77.64
Stock Variation -172.72 138.02 296.87 95.37 197.59
Total 2565.92 3144.60 4336.26 4935.25 5483.61
Goods Purchased for Resale 217.13 398.47 557.56 742.64 806.48
Power & Fuel 510.86 584.67 849.47 934.56 1113.69
Manufacturing, Administrative and
other Expenses 996.40 1202.06 1720.89 1921.98 2116.44
Employee Cost 328.35 352.56 423.65 489.15 559.67
Total Expenses 2052.74 2537.76 3551.57 4088.33 4596.28
EBITDA 513.18 606.84 784.69 846.92 887.33
Interest 117.75 108.92 129.34 142.52 163.03
Gross Profit 395.43 497.92 655.35 704.40 724.30
Depreciation and Amortisation 180.87 208.18 251.35 248.25 263.15
PBT before Exceptional Items 214.56 289.74 404.00 456.15 461.15
Exceptional Items 29.93 0.00 0.00 0.00 -11.85
Profit after Exceptional Items 244.49 289.74 404.00 456.15 449.30
Taxation 39.53 98.49 145.85 165.03 162.80
PAT 204.96 191.25 258.15 291.12 286.50
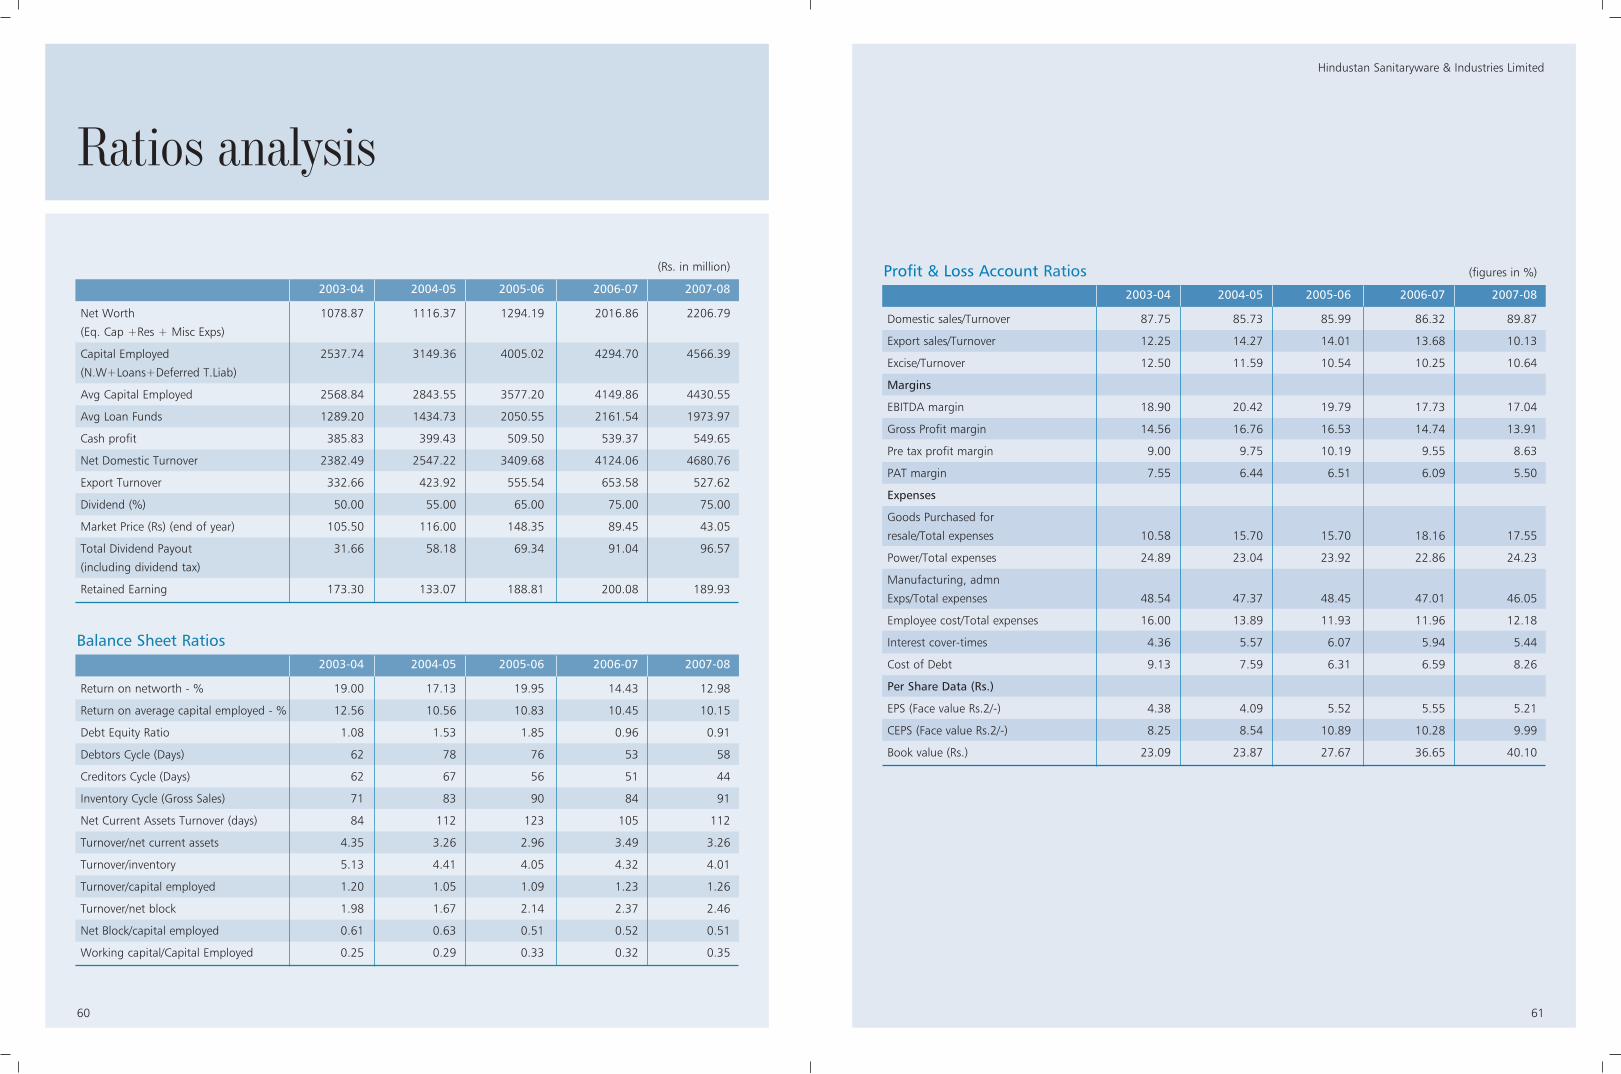
61
Hindustan Sanitaryware & Industries Limited
60
Ratios analysis
Profit & Loss Account Ratios (figures in %)
2003-04 2004-05 2005-06 2006-07 2007-08
Domestic sales/Turnover 87.75 85.73 85.99 86.32 89.87
Export sales/Turnover 12.25 14.27 14.01 13.68 10.13
Excise/Turnover 12.50 11.59 10.54 10.25 10.64
Margins
EBITDA margin 18.90 20.42 19.79 17.73 17.04
Gross Profit margin 14.56 16.76 16.53 14.74 13.91
Pre tax profit margin 9.00 9.75 10.19 9.55 8.63
PAT margin 7.55 6.44 6.51 6.09 5.50
Expenses
Goods Purchased for
resale/Total expenses 10.58 15.70 15.70 18.16 17.55
Power/Total expenses 24.89 23.04 23.92 22.86 24.23
Manufacturing, admn
Exps/Total expenses 48.54 47.37 48.45 47.01 46.05
Employee cost/Total expenses 16.00 13.89 11.93 11.96 12.18
Interest cover-times 4.36 5.57 6.07 5.94 5.44
Cost of Debt 9.13 7.59 6.31 6.59 8.26
Per Share Data (Rs.)
EPS (Face value Rs.2/-) 4.38 4.09 5.52 5.55 5.21
CEPS (Face value Rs.2/-) 8.25 8.54 10.89 10.28 9.99
Book value (Rs.) 23.09 23.87 27.67 36.65 40.10
(Rs. in million)
2003-04 2004-05 2005-06 2006-07 2007-08
Net Worth 1078.87 1116.37 1294.19 2016.86 2206.79
(Eq. Cap +Res + Misc Exps)
Capital Employed 2537.74 3149.36 4005.02 4294.70 4566.39
(N.W+Loans+Deferred T.Liab)
Avg Capital Employed 2568.84 2843.55 3577.20 4149.86 4430.55
Avg Loan Funds 1289.20 1434.73 2050.55 2161.54 1973.97
Cash profit 385.83 399.43 509.50 539.37 549.65
Net Domestic Turnover 2382.49 2547.22 3409.68 4124.06 4680.76
Export Turnover 332.66 423.92 555.54 653.58 527.62
Dividend (%) 50.00 55.00 65.00 75.00 75.00
Market Price (Rs) (end of year) 105.50 116.00 148.35 89.45 43.05
Total Dividend Payout 31.66 58.18 69.34 91.04 96.57
(including dividend tax)
Retained Earning 173.30 133.07 188.81 200.08 189.93
Balance Sheet Ratios2003-04 2004-05 2005-06 2006-07 2007-08
Return on networth - % 19.00 17.13 19.95 14.43 12.98
Return on average capital employed - % 12.56 10.56 10.83 10.45 10.15
Debt Equity Ratio 1.08 1.53 1.85 0.96 0.91
Debtors Cycle (Days) 62 78 76 53 58
Creditors Cycle (Days) 62 67 56 51 44
Inventory Cycle (Gross Sales) 71 83 90 84 91
Net Current Assets Turnover (days) 84 112 123 105 112
Turnover/net current assets 4.35 3.26 2.96 3.49 3.26
Turnover/inventory 5.13 4.41 4.05 4.32 4.01
Turnover/capital employed 1.20 1.05 1.09 1.23 1.26
Turnover/net block 1.98 1.67 2.14 2.37 2.46
Net Block/capital employed 0.61 0.63 0.51 0.52 0.51
Working capital/Capital Employed 0.25 0.29 0.33 0.32 0.35
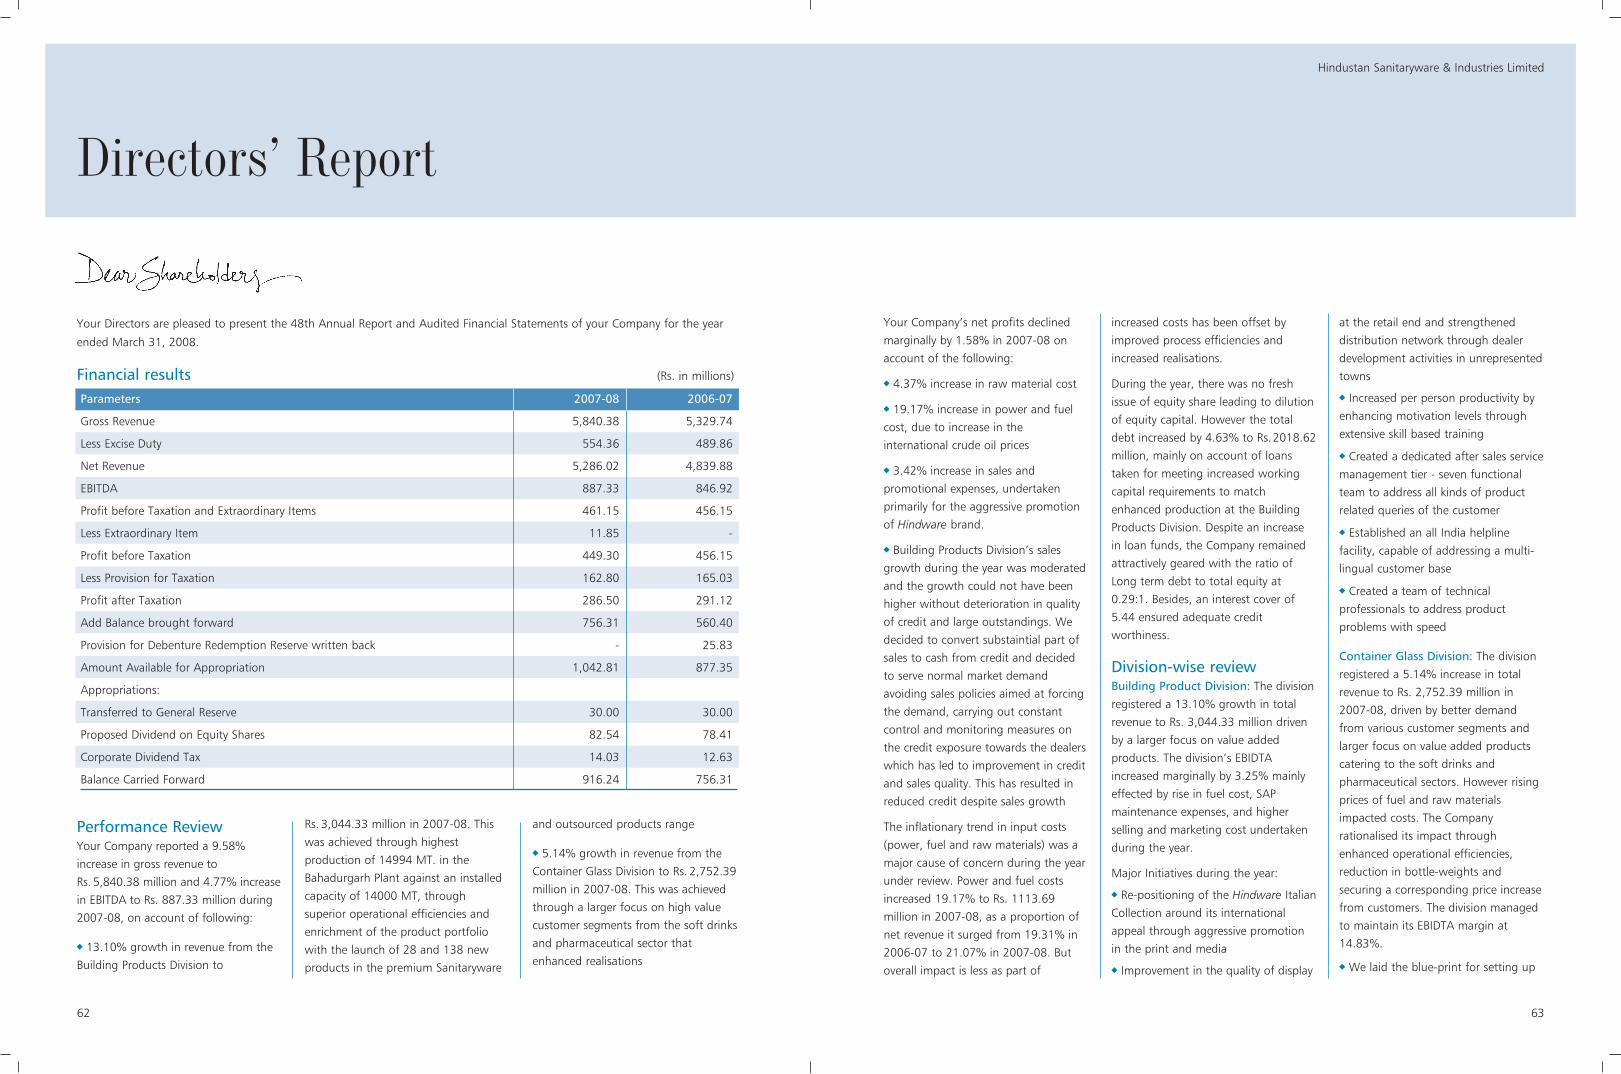
Your Company’s net profits declined
marginally by 1.58% in 2007-08 on
account of the following:
4.37% increase in raw material cost
19.17% increase in power and fuel
cost, due to increase in the
international crude oil prices
3.42% increase in sales and
promotional expenses, undertaken
primarily for the aggressive promotion
of Hindware brand.
Building Products Division’s sales
growth during the year was moderated
and the growth could not have been
higher without deterioration in quality
of credit and large outstandings. We
decided to convert substaintial part of
sales to cash from credit and decided
to serve normal market demand
avoiding sales policies aimed at forcing
the demand, carrying out constant
control and monitoring measures on
the credit exposure towards the dealers
which has led to improvement in credit
and sales quality. This has resulted in
reduced credit despite sales growth
The inflationary trend in input costs
(power, fuel and raw materials) was a
major cause of concern during the year
under review. Power and fuel costs
increased 19.17% to Rs. 1113.69
million in 2007-08, as a proportion of
net revenue it surged from 19.31% in
2006-07 to 21.07% in 2007-08. But
overall impact is less as part of
increased costs has been offset by
improved process efficiencies and
increased realisations.
During the year, there was no fresh
issue of equity share leading to dilution
of equity capital. However the total
debt increased by 4.63% to Rs.2018.62
million, mainly on account of loans
taken for meeting increased working
capital requirements to match
enhanced production at the Building
Products Division. Despite an increase
in loan funds, the Company remained
attractively geared with the ratio of
Long term debt to total equity at
0.29:1. Besides, an interest cover of
5.44 ensured adequate credit
worthiness.
Division-wise review Building Product Division: The division
registered a 13.10% growth in total
revenue to Rs. 3,044.33 million driven
by a larger focus on value added
products. The division’s EBIDTA
increased marginally by 3.25% mainly
effected by rise in fuel cost, SAP
maintenance expenses, and higher
selling and marketing cost undertaken
during the year.
Major Initiatives during the year:
Re-positioning of the Hindware Italian
Collection around its international
appeal through aggressive promotion
in the print and media
Improvement in the quality of display
at the retail end and strengthened
distribution network through dealer
development activities in unrepresented
towns
Increased per person productivity by
enhancing motivation levels through
extensive skill based training
Created a dedicated after sales service
management tier - seven functional
team to address all kinds of product
related queries of the customer
Established an all India helpline
facility, capable of addressing a multi-
lingual customer base
Created a team of technical
professionals to address product
problems with speed
Container Glass Division: The division
registered a 5.14% increase in total
revenue to Rs. 2,752.39 million in
2007-08, driven by better demand
from various customer segments and
larger focus on value added products
catering to the soft drinks and
pharmaceutical sectors. However rising
prices of fuel and raw materials
impacted costs. The Company
rationalised its impact through
enhanced operational efficiencies,
reduction in bottle-weights and
securing a corresponding price increase
from customers. The division managed
to maintain its EBIDTA margin at
14.83%.
We laid the blue-print for setting up
63
Hindustan Sanitaryware & Industries Limited
Performance ReviewYour Company reported a 9.58%
increase in gross revenue to
Rs. 5,840.38 million and 4.77% increase
in EBITDA to Rs. 887.33 million during
2007-08, on account of following:
13.10% growth in revenue from the
Building Products Division to
Rs. 3,044.33 million in 2007-08. This
was achieved through highest
production of 14994 MT. in the
Bahadurgarh Plant against an installed
capacity of 14000 MT, through
superior operational efficiencies and
enrichment of the product portfolio
with the launch of 28 and 138 new
products in the premium Sanitaryware
and outsourced products range
5.14% growth in revenue from the
Container Glass Division to Rs. 2,752.39
million in 2007-08. This was achieved
through a larger focus on high value
customer segments from the soft drinks
and pharmaceutical sector that
enhanced realisations
Your Directors are pleased to present the 48th Annual Report and Audited Financial Statements of your Company for the year
ended March 31, 2008.
Financial results (Rs. in millions)
62
Directors’ Report
Parameters 2007-08 2006-07
Gross Revenue 5,840.38 5,329.74
Less Excise Duty 554.36 489.86
Net Revenue 5,286.02 4,839.88
EBITDA 887.33 846.92
Profit before Taxation and Extraordinary Items 461.15 456.15
Less Extraordinary Item 11.85 -
Profit before Taxation 449.30 456.15
Less Provision for Taxation 162.80 165.03
Profit after Taxation 286.50 291.12
Add Balance brought forward 756.31 560.40
Provision for Debenture Redemption Reserve written back - 25.83
Amount Available for Appropriation 1,042.81 877.35
Appropriations:
Transferred to General Reserve 30.00 30.00
Proposed Dividend on Equity Shares 82.54 78.41
Corporate Dividend Tax 14.03 12.63
Balance Carried Forward 916.24 756.31

AGI Glasspack Limited and Hindware
Home Retail Private Limited, for the
year ended March 31, 2008, have been
attached to this report. Also statement
as required under Section 212(3) is
annexed with this report
Fixed deposit Your Company did not invite or accept
any fixed deposit pursuant to provisions
of Section 58A of the Companies Act,
1956, during the year.
Particulars of EmployeesInformation as required by Section
217(2A) of the Companies Act, 1956,
read with Companies (Particulars of
Employees) Rules, 1975, in respect of
the Company's employees, has been
given in an Annexure to this Report.
Awards & RecognitionThe Company was recognised through
the following:
Consumer Validated Superbrand
Business Superbrand Award
Reader Digest Trusted Brands Gold
Award
4P’s India's 100 most Valuable Brands
4P’s Most Admired Companies Award
Mera Brand Award
Directors’ ResponsibilityStatement pursuant toSection 217 (2AA) of theCompanies Act, 1956Your Directors hereby confirm that in
the preparation of annual accounts, the
applicable accounting standards were
followed.
Your Directors selected such accounting
policies and applied them consistently
and made judgments and estimates
that were reasonable and prudent so as
to give a true and fair view of the state
of affairs of your Company at the end
of the financial year and of the profit of
your Company for that period.
Your Directors took proper and
sufficient care for the maintenance of
adequate accounting records in
accordance with the provisions of this
Act for safeguarding the assets of your
Company and for preventing and
detecting fraud and other irregularities.
Your Directors prepared the annual
accounts on a going concern basis.
Conservation of Energy,Technology Absorption andForeign Exchange Earnings/out-goInformation required under Section
217(1) (e) of the Companies Act, 1956,
read with the Companies (Disclosure of
Particulars in Report of the Board of
Directors) Rules, 1988, is attached as
Annexure to this report.
AuditorsWalker, Chandiok & Company,
Chartered Accountants, Auditors of the
Company retire at the ensuing Annual
General Meeting and offer themselves
for re-appointment. They have
confirmed that their re-appointment, if
made, shall be within the limits laid
down in Section 224 (1B) of the
Companies Act, 1956.
The notes to the accounts referred to in
the Auditors' Report, are self explanatory
and, therefore, do not require any
further comments under Section 217 (3)
of the Companies Act, 1956.
Internal Control SystemThe Company has adequate system of
Internal Control to ensure compliance
with policies and procedures. Internal
Audit of all the units of the Company is
regularly carried out to review the
internal control systems. The Internal
Auditors independently evaluate the
adequacy of internal controls and
independence of the audit is ensured
by the direct reporting of internal audit
function to the Audit Committee of the
Board.
Management Discussionand Analysis ReportIn terms of Clause 49 of the Listing
Agreement with the Stock Exchanges
the Management and Discussion
Analysis Report is appended to and
form part of the Annual Report.
AcknowledgementYour Directors wish to place on record
their sincere appreciation for the
support and co-operation extended by
all dealers, financial institutions, banks,
customers, employees and all the
stakeholders of your Company and look
forward to their continued support in
the days ahead.
For and on behalf of the Board of
Directors
Rajendra K SomanyChairman and Managing Director
Place: New Delhi
Date: May 17, 2008
65
Hindustan Sanitaryware & Industries Limited
a Greenfield plant in central Andhra
Pradesh, ramping up our production
capacity to 1.8 billion pieces p.a. This
will cater to the buoyant demand from
downstream users manufacturing
packaged food, pharmaceuticals and
beverages. Being located in proximity
to natural gas sources, this facility will
also offer us superior cost advantage
Expanded market share in the
Container Glass Division by competently
catering to diverse needs of the existing
and upcoming players in the
pharmaceutical, soft-drinks and liquor
sectors
Management OutlookHSIL is a leading player in both Building
Products and Container Glass
businesses, catering to the continuously
growing demand across these
segments. The Company makes
constant effort to increase the capacity
utilisation of its plants to fulfill the
growing demand of its products.
The outlook of Indian industry is
becoming more service oriented and to
grow and sustain in the expanding
domestic/ international market, we
have to focus on the services provided
not only to the customer but
environment as a whole.
The Management focused towards
increase in People Productivity through
various motivational strategies.
Innovative practices introduced during
the year, will enhance their risk taking
appetite in undertaking strategic
decisions.
Your Company is undertaking activities
to provide value added services to
employees, customers and the
environment.
“EVOK” – Home FashionMega Store- Entry in RetailSectorYour Company has entered into the
organised retail sector with its Home
Interior Solutions business through
Hindware Home Retail Pvt. Ltd. (HHRL),
a wholly owned subsidiary. The first
pilot store is launched in May 2008
with the brand “EVOK” in NCR and
there are other three stores under
finalisation to be introduced shortly.
HSIL intends to leverage on its core
strengths in understanding diverse
Consumer and Trade behavior, Retail
Distribution network, Brand Equity,
Global Sourcing and effective supply
chain management. HHRL plans to
invest around Rs. 2500 million over
next four to five years to establish 45
large format stores across the country.
DividendYour Directors recommend a dividend
of Rs. 1.50 per share on equity shares
of face value of Rs. 2 each for the year
ended March 31, 2008, which will
result in an outflow of Rs. 96.57
million. (Inclusive of dividend tax)
AppropriationsIt is proposed to transfer Rs. 30 million
to the General Reserve while Rs. 916.24
million is proposed to be retained in
the Profit and Loss Account.
DirectorsDuring the year, Mr. Rahul Bhargava
who was appointed as Alternate
Director to Mr. Vishal K.K. Marwaha
resigned w.e.f. May 11, 2007.
Mr. S.B. Budhiraja, Mr. Vishal K.K.
Marwaha and Mr. N.G. Khaitan are
liable to retire by rotation, being
eligible, have offered themselves for re-
appointment.
Mr. R.K. Somany’s term as Chairman
and Managing Director will expire on
January 8, 2009 and a proposal for his
re-appointment for a period of three
years w.e.f January 9, 2009 shall be
placed before the Shareholders for
seeking their approval.
Changes in Share CapitalDuring the year under review, there is
no change in Share capital of the
Company.
ERP ProgramThe Company has implemented SAP on
the ERP platform, in association with
IBM, in Building Product Division and
its implementation in Glass division is
under progress. Capturing business
transactions on one platform allows
easy review of inventory, customer and
vendor activity. On the technical side, a
solution on a single platform will
enable easier maintenance and support
and reducing costs.
Corporate GovernanceThe Corporate Governance Report and
a Certificate from the Statutory
Auditors of the Company regarding
compliance of the conditions of
Corporate Governance, as stipulated
under Clause 49 of the Listing
Agreements with the Stock Exchanges,
are attached after this report and form
an integral part of the Report.
Wholly Owned SubsidiariesAs required under Section 212 of the
Companies Act, 1956, the Annual
Report of the Company’s subsidiaries,
64
Directors’ Report

67
Hindustan Sanitaryware & Industries Limited
A. Conservation of Energy1. Energy Conservation Measurestaken
Studies have been conducted tooptimize the use of LPG in Forehearthswith the help of experts from Europe.Operational and Maintenanceprocedures have been standardised tomonitor the same on regular basis andensure optimal use of LPG in theprocess
32 Bottles have been light weightedwhich has resulted in saving of energyper unit of output
Optimisation of batch sizes, by themanufacture of Container Glass fordifferent customer segments having thesimilar weight, helped reduce jobchanges and energy consumption
Changes in the design and materialof 25-30 mould jars enhancedoperational speed and enabled energy
savings
Institutionalised a system fordetection of compressed air leakageand pressure drops in the compressedair lines. The reduction in the wastageof compressed air has resulted inenergy saving
Replacement of old Motors withenergy efficient Motors as per scheduleis being implemented
Waste heat is utilised for POP moulddryers
Optimisation of kiln firing cycles andkiln loading density has helpedconserve R-LNG fuel
2. Additional investments andproposals
No additional investments andproposal being implemental forreduction of consumption of energy
Replacement of old motors with
energy efficient motors as per scheduleis being implemented
Old heating systems were replaced bydirect air heaters in casting floors
3. Impact of the above measureson Energy Conservation and Costof Production
Reduction in fuel consumption perunit.
Reduction in fuel consumption perunit.
Action taken on the cast floors andshop floor helped conserve powerconsumption per MT.
4. Total Energy Consumption andEnergy Consumption per Unit
Total Consumption and EnergyConsumption per unit of production inrespect of Container Glass Division asper Form 'A' is as under:
B. Technology Absorption1. Research and Development
a) Specific areas in which R&D wascarried out by the Company withbenifits derived from it are as below:
Ceramic Division – BahadurgarhDevelopmental work on improving
glaze texture & finish
Developmental work on applicationof nano coating for specialised surfaceproperties in progress
Ceramic Division – SomanypuramChanges in the material of Block and
Cases: From Plaster of Paris to Resinand rubber with in house R&Dactivities. The life of the Blocksincreased from 200 to 20,000-30,000.This is the latest state of art technologyfor Block making which we absorbedfrom the foreign consultants. The otheradvantage is the superior surface finishof the working moulds
New Water Savings Model: ThroughIn-house R&D measures we havedesigned and developed new WaterSaving high end products like Cornice,
Cornice Extended, Crystal ‘S’, Enigmaand Blamont
New Carousal Spraying System: Wehave developed Carousel Sprayingsystem, which operates on PLC controlprogrammer. This has resulted inimproved Surface finish of the finishedproducts due to controlled doublespraying system. The reclamation of theover sprayed waste glaze became moreeffective, resulting in reduction in glazeconsumption
Installation of fuel saving assetsresulting in fuel saving
Container Glass Division:Developed successfully UPS system for
installation on I.S. Machines to avoidstoppage of the machines due topower tripping and fluctuations forshort durations
Significant progress has beenachieved in the development of rawmaterials from alternate sources in theface of depletion of raw materials fromthe existing established sources
b) Future plan of actionProcess innovation for saving cost
Launch of new user friendly models
The above activities would becontinued on an ongoing basis
2. Technology Absorption,Adaptation & Innovation
Efforts Made Towards TechnologyAbsorption, Adaptation andInnovationProcess innovations with the objectiveof reduction in raw material and fuelcosts.
New Products introduced having betteraesthetics & utility.
Innovative Designs competing withinternational standards.
Benefits derived as a result of theabove effortsCost reduction, product developmentto satisfy consumer needs,
Product improvements in terms ofconvenience and environmental friendlyproduction.
Technology ImportNo technology has been importedduring last 5 years.
66
Annexure to
Directors’ Report
Form ‘A’Energy Consumption & Consumption per unit of Production
Parameters 2007-08 2006-07
A) POWER AND FUEL CONSUMPTION
1. a) Electricity (Purchased)
Units (KWH) 74,013,294 67,098,162
Total Amount 227,795,519 194,310,493
Rate / Unit 3.08 2.90
b) Own Generation
Units (KWH) 255,826 463,524
Units per LT of Fuel Oils 3.03 4.23
Rate / Unit 9.37 6.49
c) Total (A + B)
Units (KWH) 74,269,120 67,561,686
Total Amount 230,193,595 197,319,537
Rate Per Unit 3.10 2.92
Parameters 2007-08 2006-07
2. FUELS (COAL, HSD, LDO, LPG & LSHS)
Quantity in MT 24,056 23,579.16
Value 557,143,691 458,674,243
Rate / MT 23,160 19,453
B) CONSUMPTION PER MILLION UNIT OF PRODUCTION
Glass Bottles (Production in million pcs) 854.50 784.89
Electricity (KWH) 86915 86078
FUELS (COAL, HSD, LDO, LPG & LSHS) 28.15 30.04
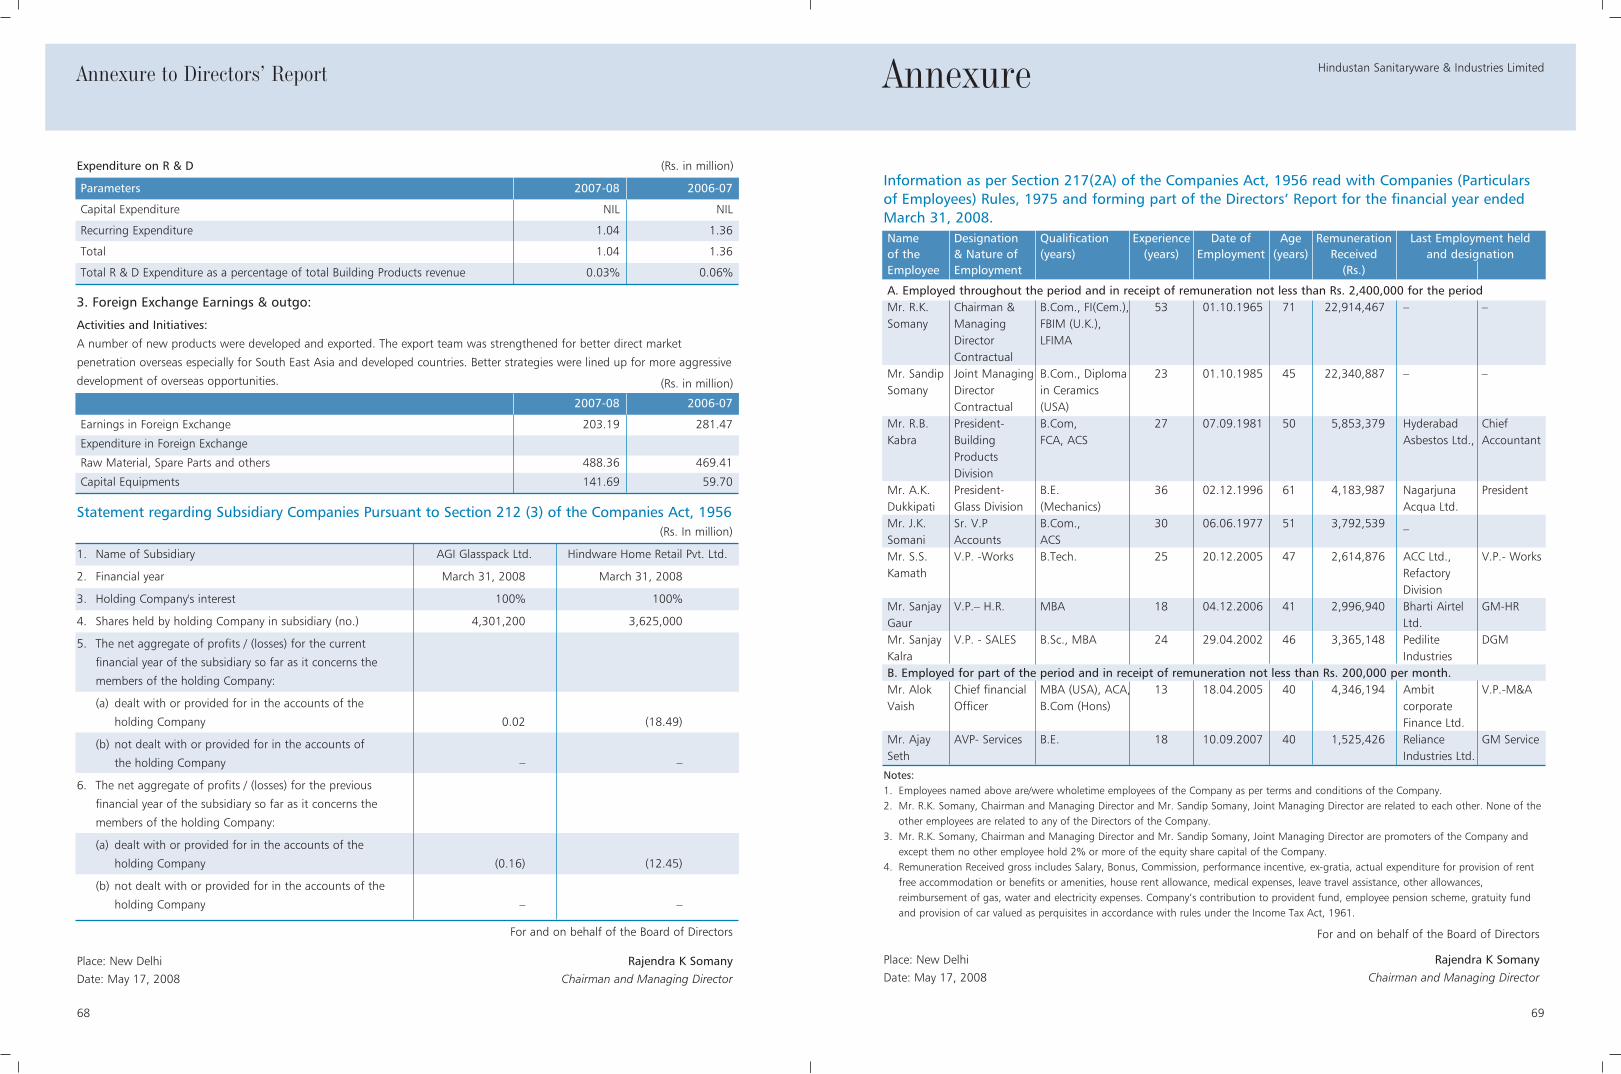
69
Hindustan Sanitaryware & Industries Limited
68
Annexure to Directors’ Report
3. Foreign Exchange Earnings & outgo:
Activities and Initiatives:
A number of new products were developed and exported. The export team was strengthened for better direct market
penetration overseas especially for South East Asia and developed countries. Better strategies were lined up for more aggressive
development of overseas opportunities. (Rs. in million)
2007-08 2006-07
Earnings in Foreign Exchange 203.19 281.47
Expenditure in Foreign Exchange
Raw Material, Spare Parts and others 488.36 469.41
Capital Equipments 141.69 59.70
Statement regarding Subsidiary Companies Pursuant to Section 212 (3) of the Companies Act, 1956(Rs. In million)
1. Name of Subsidiary AGI Glasspack Ltd. Hindware Home Retail Pvt. Ltd.
2. Financial year March 31, 2008 March 31, 2008
3. Holding Company's interest 100% 100%
4. Shares held by holding Company in subsidiary (no.) 4,301,200 3,625,000
5. The net aggregate of profits / (losses) for the current
financial year of the subsidiary so far as it concerns the
members of the holding Company:
(a) dealt with or provided for in the accounts of the
holding Company 0.02 (18.49)
(b) not dealt with or provided for in the accounts of
the holding Company – –
6. The net aggregate of profits / (losses) for the previous
financial year of the subsidiary so far as it concerns the
members of the holding Company:
(a) dealt with or provided for in the accounts of the
holding Company (0.16) (12.45)
(b) not dealt with or provided for in the accounts of the
holding Company – –
Annexure
Information as per Section 217(2A) of the Companies Act, 1956 read with Companies (Particularsof Employees) Rules, 1975 and forming part of the Directors’ Report for the financial year endedMarch 31, 2008.Name Designation Qualification Experience Date of Age Remuneration Last Employment heldof the & Nature of (years) (years) Employment (years) Received and designationEmployee Employment (Rs.)
A. Employed throughout the period and in receipt of remuneration not less than Rs. 2,400,000 for the periodMr. R.K. Chairman & B.Com., FI(Cem.), 53 01.10.1965 71 22,914,467 – –Somany Managing FBIM (U.K.),
Director LFIMAContractual
Mr. Sandip Joint Managing B.Com., Diploma 23 01.10.1985 45 22,340,887 – –Somany Director in Ceramics
Contractual (USA)Mr. R.B. President- B.Com, 27 07.09.1981 50 5,853,379 Hyderabad ChiefKabra Building FCA, ACS Asbestos Ltd., Accountant
ProductsDivision
Mr. A.K. President- B.E. 36 02.12.1996 61 4,183,987 Nagarjuna PresidentDukkipati Glass Division (Mechanics) Acqua Ltd.Mr. J.K. Sr. V.P B.Com., 30 06.06.1977 51 3,792,539 _Somani Accounts ACSMr. S.S. V.P. -Works B.Tech. 25 20.12.2005 47 2,614,876 ACC Ltd., V.P.- WorksKamath Refactory
DivisionMr. Sanjay V.P.– H.R. MBA 18 04.12.2006 41 2,996,940 Bharti Airtel GM-HRGaur Ltd.Mr. Sanjay V.P. - SALES B.Sc., MBA 24 29.04.2002 46 3,365,148 Pedilite DGMKalra Industries B. Employed for part of the period and in receipt of remuneration not less than Rs. 200,000 per month.Mr. Alok Chief financial MBA (USA), ACA, 13 18.04.2005 40 4,346,194 Ambit V.P.-M&AVaish Officer B.Com (Hons) corporate
Finance Ltd. Mr. Ajay AVP- Services B.E. 18 10.09.2007 40 1,525,426 Reliance GM ServiceSeth Industries Ltd.
Notes:1. Employees named above are/were wholetime employees of the Company as per terms and conditions of the Company.2. Mr. R.K. Somany, Chairman and Managing Director and Mr. Sandip Somany, Joint Managing Director are related to each other. None of the
other employees are related to any of the Directors of the Company.3. Mr. R.K. Somany, Chairman and Managing Director and Mr. Sandip Somany, Joint Managing Director are promoters of the Company and
except them no other employee hold 2% or more of the equity share capital of the Company. 4. Remuneration Received gross includes Salary, Bonus, Commission, performance incentive, ex-gratia, actual expenditure for provision of rent
free accommodation or benefits or amenities, house rent allowance, medical expenses, leave travel assistance, other allowances,reimbursement of gas, water and electricity expenses. Company’s contribution to provident fund, employee pension scheme, gratuity fundand provision of car valued as perquisites in accordance with rules under the Income Tax Act, 1961.
Expenditure on R & D (Rs. in million)
Parameters 2007-08 2006-07
Capital Expenditure NIL NIL
Recurring Expenditure 1.04 1.36
Total 1.04 1.36
Total R & D Expenditure as a percentage of total Building Products revenue 0.03% 0.06%
For and on behalf of the Board of Directors
Place: New Delhi Rajendra K SomanyDate: May 17, 2008 Chairman and Managing Director
For and on behalf of the Board of Directors
Place: New Delhi Rajendra K SomanyDate: May 17, 2008 Chairman and Managing Director

71
Hindustan Sanitaryware & Industries Limited
A. Our GovernancephilosophyHSIL has a tradition of adopting andimplementing the highest standards ofCorporate Governance principles andbest practices. The Company makesperiodical reviews of the guidelines toensure their continuing relevance,effectiveness and responsiveness to theneeds of all stakeholders.
The Company's philosophy onCorporate Governance envisages theattainment of the highest levels oftransparency, independent monitoringand equity, in all facets of itsoperations and interactions with itsstakeholders, including shareholders,the government, lenders and thesociety. The Company’s CorporateGovernance structure, systems andprocesses are based on the followingcore principles:
1. Executive Management must havethe freedom to drive the Companyforward without undue restraint
2. Freedom of Management is exercisedwithin the framework of appropriatecontrols
3. Ensuring timely disclosure of allinformation and matters of interest toour stakeholders
4. Demonstrating highest levels ofpersonal responsibility, reaffirming thatemployees are responsible for thepursuit of excellence
5. Following ethical codes of conductof the Company
Hence, the essence of CorporateGovernance lies in the phrase “Your
Company”. It is “Your” Companybecause it belongs to you, theshareholders. The Chairman andDirectors are “Your” fiduciaries andtrustees. The objective is to take thebusiness forward to maximize “Your”Shareholder’s value.
B. Board of DirectorsThe day-to-day business of theCompany is conducted by the Presidentsand Divisional heads under the directionof the Board led by the Chairman. TheCompany has a thoroughly professionalBoard with a majority of Non-Executiveand Independent Directors. Presently,the Company’s Board comprises nineDirectors, out of whom two areExecutive Director, five are Non-Executive Independent Directors, one isNon-Executive Non-IndependentDirector and one is Investor Director.
None of the Directors on the Company’sBoard is a Director in more than 15public limited companies, neither amember of more than ten committeesand Chairman of more than fivecommittees across all the public limitedcompanies in which he is a Director. Allthe Directors have made necessarydisclosures regarding their Directorshipsand Committeememberships/Chairmanships in othercompanies.
The Board holds five-to-six meetingsevery year to review and discuss theperformance of the Company, its futureplans, strategies and other pertinentissues relating to the Company.
Meetings are governed by a structuredagenda. The Board members in
consultation with the Chairman maybring up any matter for considerationof the Board. All major agenda itemsare backed by supportive information toenable the Board to take decisions.Agenda papers are generally circulatedseven working days prior to the Boardmeeting.
In addition to oversee the business andthe management the following are alsoperiodically reviewed by the Board:
Quarterly performance against plan,including business financials in respectof revenue, profits, cash flow, balancesheet, investment and capex
Review, monitor and approve majorfinancial and business strategies andcorporate actions
Assess critical business risks of theCompany – review options for theirmitigation
Internal audit findings and externalaudit management reports (throughthe Audit Committee)
Company’s managementdevelopment processes andcompensation of senior management
Status of safety, security and legalcompliances
Materially significant show cause,demand, prosecution and adjudicationnotices, if any
Long term borrowings made, bankguarantees issued and investmentsmade
Forex policy, as and when changestake place
Ensure that processes are in place formaintaining the integrity of theCompany with its relationships with allthe stakeholders
Delegation of appropriate authority to the senior executives of the Company for effective management of operations
During the year under review, five Board meetings were held on May 19, 2007, July 27, 2007, September 15, 2007, October27, 2007, and January 28, 2008 and the time-gap between any two consecutive meetings did not exceed four months.
70
Corporate Governance Report
The composition of the Board, attendance at Board meetings held during the financial year under review and at the last Annual
General Meeting (AGM), number of Directorships, memberships/Chairmanships in public companies (excluding the Company)
and their shareholding in the Company, are as follows:
Name Designation Category No. of Whether No. of No. of No. of Board attended other memberships equity
meetings the last Directorships* (Chairmanships) shares held attended AGM of Board in theduring Committees Company***
2007-08 of othercompanies**
1. Mr. R.K. Chairman & Executive 5 Yes 5 Nil 2,492,614
Somany Managing Director (Promoter)
2. Mr. Sandip Joint Managing Executive 4 No 5 Nil 2,736,528
Somany Director (Promoter)
3. Mr. V.K. Director Non-Executive 5 Yes 5 2(1) Nil
Bhandari & Independent
4. Mr. S.B. Director Non-Executive 4 No 3 2(1) 1,300
Budhiraja & Independent
5. Mr. Ashok Director Non-Executive 1 No 3 Nil 18,000
Jaipuria & Independent
6. Mr. N.G. Director Non-Executive 5 Yes 10 6(2) 832
Khaitan & Independent
7. Mr. Binay Director Non-Executive 5 Yes 7 Nil 32,474
Kumar & Independent
8. Mr. Vishal K.K. Director Non-Executive 3 No 1 Nil 25,000
Marwaha & Independent
9. Mr. G.L. Director Non-Executive & 5 Yes 11 7(3) 6,705
Sultania Non-Independent
10. Mr. Rahul Alternate Director Non-Executive & NIL – – – –
Bhargava# Independent
* Excludes Directorship in Indian private companies, foreign companies, membership of managing committees of chambers of
commerce/professional bodies and alternate Directorship
** For this purpose only Audit Committees and Investors’/Shareholders’ Grievance Committees of public companies, whether listed or not, are
considered
*** Equity shares of Rs. 2 each, as per last declaration made to the Company.
# Mr. Rahul Bhargava resigned as Alternate Director w.e.f. May 11, 2007
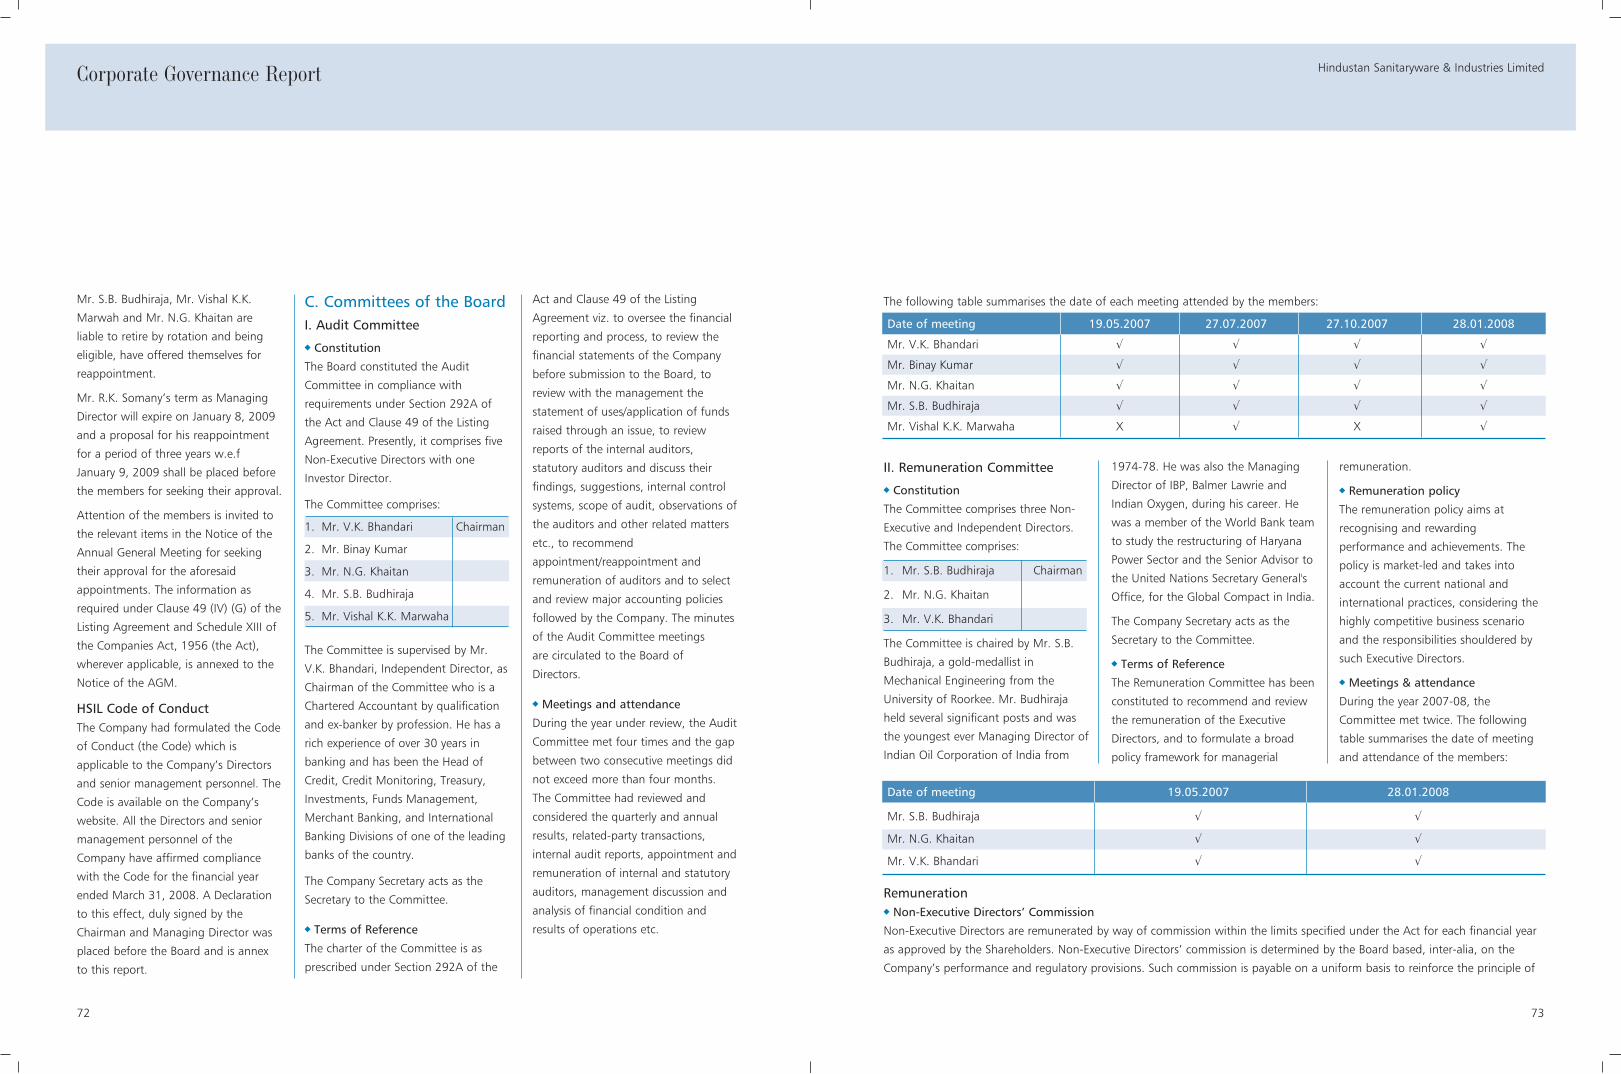
73
Hindustan Sanitaryware & Industries Limited
72
Corporate Governance Report
The following table summarises the date of each meeting attended by the members:
Date of meeting 19.05.2007 27.07.2007 27.10.2007 28.01.2008
Mr. V.K. Bhandari √ √ √ √
Mr. Binay Kumar √ √ √ √
Mr. N.G. Khaitan √ √ √ √
Mr. S.B. Budhiraja √ √ √ √
Mr. Vishal K.K. Marwaha X √ X √
Mr. S.B. Budhiraja, Mr. Vishal K.K.
Marwah and Mr. N.G. Khaitan are
liable to retire by rotation and being
eligible, have offered themselves for
reappointment.
Mr. R.K. Somany’s term as Managing
Director will expire on January 8, 2009
and a proposal for his reappointment
for a period of three years w.e.f
January 9, 2009 shall be placed before
the members for seeking their approval.
Attention of the members is invited to
the relevant items in the Notice of the
Annual General Meeting for seeking
their approval for the aforesaid
appointments. The information as
required under Clause 49 (IV) (G) of the
Listing Agreement and Schedule XIII of
the Companies Act, 1956 (the Act),
wherever applicable, is annexed to the
Notice of the AGM.
HSIL Code of ConductThe Company had formulated the Code
of Conduct (the Code) which is
applicable to the Company’s Directors
and senior management personnel. The
Code is available on the Company’s
website. All the Directors and senior
management personnel of the
Company have affirmed compliance
with the Code for the financial year
ended March 31, 2008. A Declaration
to this effect, duly signed by the
Chairman and Managing Director was
placed before the Board and is annex
to this report.
C. Committees of the BoardI. Audit Committee
Constitution
The Board constituted the Audit
Committee in compliance with
requirements under Section 292A of
the Act and Clause 49 of the Listing
Agreement. Presently, it comprises five
Non-Executive Directors with one
Investor Director.
The Committee comprises:
1. Mr. V.K. Bhandari Chairman
2. Mr. Binay Kumar
3. Mr. N.G. Khaitan
4. Mr. S.B. Budhiraja
5. Mr. Vishal K.K. Marwaha
The Committee is supervised by Mr.
V.K. Bhandari, Independent Director, as
Chairman of the Committee who is a
Chartered Accountant by qualification
and ex-banker by profession. He has a
rich experience of over 30 years in
banking and has been the Head of
Credit, Credit Monitoring, Treasury,
Investments, Funds Management,
Merchant Banking, and International
Banking Divisions of one of the leading
banks of the country.
The Company Secretary acts as the
Secretary to the Committee.
Terms of Reference
The charter of the Committee is as
prescribed under Section 292A of the
Act and Clause 49 of the Listing
Agreement viz. to oversee the financial
reporting and process, to review the
financial statements of the Company
before submission to the Board, to
review with the management the
statement of uses/application of funds
raised through an issue, to review
reports of the internal auditors,
statutory auditors and discuss their
findings, suggestions, internal control
systems, scope of audit, observations of
the auditors and other related matters
etc., to recommend
appointment/reappointment and
remuneration of auditors and to select
and review major accounting policies
followed by the Company. The minutes
of the Audit Committee meetings
are circulated to the Board of
Directors.
Meetings and attendance
During the year under review, the Audit
Committee met four times and the gap
between two consecutive meetings did
not exceed more than four months.
The Committee had reviewed and
considered the quarterly and annual
results, related-party transactions,
internal audit reports, appointment and
remuneration of internal and statutory
auditors, management discussion and
analysis of financial condition and
results of operations etc.
Date of meeting 19.05.2007 28.01.2008
Mr. S.B. Budhiraja √ √
Mr. N.G. Khaitan √ √
Mr. V.K. Bhandari √ √
Remuneration Non-Executive Directors’ Commission
Non-Executive Directors are remunerated by way of commission within the limits specified under the Act for each financial year
as approved by the Shareholders. Non-Executive Directors’ commission is determined by the Board based, inter-alia, on the
Company’s performance and regulatory provisions. Such commission is payable on a uniform basis to reinforce the principle of
II. Remuneration Committee
Constitution
The Committee comprises three Non-
Executive and Independent Directors.
The Committee comprises:
1. Mr. S.B. Budhiraja Chairman
2. Mr. N.G. Khaitan
3. Mr. V.K. Bhandari
The Committee is chaired by Mr. S.B.
Budhiraja, a gold-medallist in
Mechanical Engineering from the
University of Roorkee. Mr. Budhiraja
held several significant posts and was
the youngest ever Managing Director of
Indian Oil Corporation of India from
1974-78. He was also the Managing
Director of IBP, Balmer Lawrie and
Indian Oxygen, during his career. He
was a member of the World Bank team
to study the restructuring of Haryana
Power Sector and the Senior Advisor to
the United Nations Secretary General's
Office, for the Global Compact in India.
The Company Secretary acts as the
Secretary to the Committee.
Terms of Reference
The Remuneration Committee has been
constituted to recommend and review
the remuneration of the Executive
Directors, and to formulate a broad
policy framework for managerial
remuneration.
Remuneration policy
The remuneration policy aims at
recognising and rewarding
performance and achievements. The
policy is market-led and takes into
account the current national and
international practices, considering the
highly competitive business scenario
and the responsibilities shouldered by
such Executive Directors.
Meetings & attendance
During the year 2007-08, the
Committee met twice. The following
table summarises the date of meeting
and attendance of the members:

75
Hindustan Sanitaryware & Industries Limited
74
Corporate Governance Report
collective responsibilities. Non-Executive Directors are also entitled to sitting fee for attending the meetings of the Board and
committees thereof, within the guidelines notified by the Central Government.
Details of Remuneration of Directors:
The details of the remuneration paid to the directors, during the financial year 2007-08 are as follows:-
Name Basic Perquisites Commission Cont. to PF Sitting Stock Total
(for the year fees option
2006-07)
Mr. R. K. Somany 6,274,194 368,380 15,521,990 752,903 – – 22,917,467
Mr. Sandip Somany 4,680,000 1,577,297* 15,521,990 561,600 – – 22,340,887
Mr. V. K. Bhandari – – 739,142 – 22,500 – 761,642
Mr. S. B. Budhiraja – – 739,143 – 20,000 – 759,143
Mr. Ashok Jaipuria – – 739,142 – – – 739,142
Mr. N. G. Khaitan – – 739,142 – 22,500 – 761,642
Mr. Binay Kumar – – 739,143 – 16,500 – 755,643
Mr. Vishal K.K. Marwaha – – 739,142 – 9,500 – 748,642
Mr. G. L. Sultania – – 739,142 – 16,500 – 755,642
TOTAL 10,954,194 1,945,677 36,217,976 1,314,503 107,500 – 50,539,850
Note :
* Includes Rs.1,044,000 on account of encashment of accrued leave at the end of last tenure on November 30, 2007
The appointment of Mr. R.K. Somany, Chairman and Managing Director, is contractual for a period of three years with effect from January 9,
2006, a proposal for his reappointment for a period of three years w.e.f. January 9, 2009 shall be placed before the members for seeking their
approval
The services of Chairman and Managing Director and Joint Managing Director may be terminated by giving six months’ notice or alternatively
six months’ salary in lieu of six months’ notice
Mr. Ashok Jaipuria had relinquished his entitlement for sitting fee and he was only paid proportionate commission as Non-Executive Director
Meetings and attendance
During the year 2007-08, the committee met four times. The following table summarises the date of each meeting and
attendance of members:
III. Shareholders’/Investors’Grievance Committee
Constitution
The Shareholders’/Investors’ Grievance
Committee presently comprises four
Non-Executive Directors. The
constitution of the Committee is as
under:
1. Mr. S.B. Budhiraja Chairman
2. Mr. N.G. Khaitan
3. Mr. V.K. Bhandari
4. Mr. G.L. Sultania
Terms of reference
The Committee looks into redressing
investors’ complaints like delay in
transfer of shares, non-receipt of
dividends and non-receipt of Annual
Reports etc.
The Company Secretary is the Secretary
to the Committee. The Board has
designated the Company Secretary as
the Compliance Officer.
Date of meeting 19.05.2007 27.07.2007 27.10.2007 28.01.2008
Mr. S.B. Budhiraja √ √ √ √
Mr. N.G. Khaitan √ √ √ √
Mr. V.K. Bhandari √ √ √ √
Mr. G.L. Sultania √ √ √ √
During the year under review, the Company received 70 letters/enquiries/complaints from shareholders, which were mainly
enquiries about the split/sub-division of shares, split shares and non-receipt of dividend or Annual Report, which were
replied/resolved to the satisfaction of shareholders. As on the date of this report, no complaints were pending.
IV. Share Transfer Committee Constitution
The Committee presently comprises one
Non-Executive Director and two
Executives of the Company. The
Committee comprises:
1. Mr. G.L. Sultania Chairman
2. Mr. N. Goenka
(DGM – Finance)
3. Mr. S. Banerjee
(Investor Relations
Manager)
Terms of reference
The Company constituted the Share
Transfer Committee to consider and
process various requests for transfer of
shares, issue of duplicate shares,
split/consolidation of shares and
thereupon issue of fresh share
certificates, transmissions or
transposition of shares.
Meetings
During the year under review, the
committee met on 12 occasions for the
approval of transfer of shares lodged
with the Company and all the members
attended all the meetings. As on date
of this report, no requests for transfer
of shares are pending.
V. Corporate Affairs CommitteeThe primary role of the Corporate
Affairs Committee is making strategic
business decisions to ensure smooth
business operations of the Company
within the framework approved by the
Board. The Company also formed other
committees for some specific purposes
like Borrowing Committee, Investment
Committee and Finance Committee. All
powers of these committees are now
assigned to this committee for better
monitoring and control.
Composition
Corporate Affairs Committee comprised
two Executive and one Non-Executive
Director:
1. Mr. R.K. Somany Chairman
2. Mr. Sandip Somany
3. Mr. G.L. Sultania
Meetings and attendance
During the year 2007-08, there were
five meeting of the committee, which
were attended by all the members.
D. Subsidiary CompaniesYour Company does not have any
material non-listed Indian subsidiary
Company. The Audit Committee
reviews the financial statements and in
particular, the investments made by the
unlisted subsidiary companies. The
minutes of the Board meetings as well
as statements of all significant
transactions of the unlisted subsidiary
companies are placed before the Board
of Directors of the Company for their
review.
E. DisclosuresBasis of related party transactions:
Related-party transactions are given at
Note 13 of Schedule 21 of the Annual
Accounts.
Disclosure of Accounting Treatment
In preparation of financial statements,
the Company had consistently followed
the accounting standards.
Risk management
The Company’s risk management
strategies are continuously being
refined and redefined. Despite the
substantial increase in volume of

77
Hindustan Sanitaryware & Industries Limited
76
Corporate Governance Report
business over a period of years, risks
were effectively managed through risk
assessment framework and policies.
The internal control systems provide a
robust support for risk management for
the Company in operating its business.
The Company laid down a procedure to
inform Board of Directors about Risk
assessment and minimisation
procedures.
No non-compliances have taken place
nor have any penalties or strictures
been imposed on the Company by the
Stock Exchanges or SEBI or any
statutory authority on any matter
related to capital markets during the
last three years.
Proceeds from public issue, right
issues, preferential issues etc.
During the year under review, the
Company did not raise money from
public issue, right issues and
preferential issues, among others.
Management
i) The Management Discussion and
Analysis Report forms a part of the
Annual Report and is in accordance
with the requirements laid out in
Clause 49 of the Listing Agreement.
ii) No material transaction has been
entered into by the Company with the
Promoters, Directors or the
management, their subsidiaries or
relatives etc. that may have a potential
conflict with interests of the Company.
F. Report on CorporateGovernanceThis Corporate Governance Report
forms a part of the Annual Report. The
Company is fully compliant with all the
provisions of Clause 49 of the Listing
Agreement of the stock exchanges in
India.
G. ComplianceCertificate from the statutory auditors
confirming compliance with all the
conditions of Corporate Governance, as
stipulated in Clause 49 of the Listing
Agreement of the stock exchanges in
India, is annexed to the Directors’
Report and forms a part of the Annual
Report.
H. HSI Code of Conduct forprevention of insidertrading HSIL has a HSI Share Transaction Code
for prevention of insider trading in the
shares and securities of the Company.
The code, inter alia, prohibits
purchase/sale of shares of the Company
by employees/Directors while in
possession of unpublished price-
sensitive information in relation to the
Company.
I. General Body Meetings The last three general body meetings were held as under :
Financial year Date Time Venue
2006-07 September 15, 2007 11:00 a.m. Somany Conference Hall, Merchant’s Chamber of Commerce,
15B, Hemant Basu Sarani, Kolkata – 700 001.
2005-06 September 9, 2006 11:30 a.m. Same as above.
2004-05 August 24, 2005 11:30 a.m. Same as above.
Five special resolutions were passed in the Annual General Meetings held during last three financial years.
During the financial year 2007-08, no special resolution passed through Postal Ballot.
J. Means of Communication The quarterly and annual financial results of the Company are sent to the stock exchanges, immediately after they are
approved by the Board. The results are published in leading business newspapers of the country, general interest national
Monthly stock market data:
Month NSE BSE
High Low High Low
(Rs.) (Rs.) (Rs.) (Rs.)
April’07 96.00 85.20 96.00 85.00
May’07 102.90 88.35 108.00 88.65
June’07 89.95 78.10 90.00 77.60
July’07 89.00 71.60 89.00 72.00
August’07 80.00 55.35 73.95 60.05
September’07 89.45 70.10 88.80 70.10
October’07 88.00 66.00 89.00 69.30
November’07 81.90 60.00 83.00 63.00
December’07 96.90 68.20 94.80 68.10
January’08 106.40 58.20 108.85 57.10
February’08 74.05 56.20 74.00 57.30
March’08 59.60 31.55 59.10 37.00
April
’07
May
’07
June
’07
July
’07
Augu
st ’0
7Se
ptem
ber ’
07O
ctob
er ’0
7No
vem
ber ’
07De
cem
ber ’
07Ja
nuar
y ’0
8Fe
brua
ry ’0
8M
arch
’08
NSE High (Rs.)
BSE Low (Rs.)
BSE High (Rs.)
NSE Low (Rs.)
120
100
80
60
40
20
0
(vi) Market price data
Monthly stock market data of high-and-low prices of equity shares of the Company during the financial year 2007–08 and their
performance in comparison with the broad-based index comprise:
newspapers and the regional
newspapers.
The results are also posted on the
website of the Company at
http://www.hindwarebathrooms.com.
The results are also posted on the
official website of SEBI –
http://www.sebiedifar.nic.in.
K. Shareholders’ Information (i) The 48th Annual General Meeting is
proposed to be held on September 4,
2008, at 11.00 a.m. at Somany
Conference Hall of Merchant's Chamber
of Commerce, 15B, Hemant Basu
Sarani, Kolkata - 700 001.
(ii) Tentative financial calendar for
2008-09
First quarter Last week of
results July, 2008
Second quarter Last week of
results October, 2008
Third quarter Last week of
results January, 2009
Audited annual Last week of
results for the year May, 2009.
(iii) Date of Book Closure
August 25, 2008 to September 4, 2008
(both days inclusive).
(iv) Dividend payment date
Latest by October 4, 2008.
(v) Listing on Stock Exchanges
The names of the Stock Exchanges at
which the equity shares of the
Company are listed and the respective
stock codes comprise:
Name of the
Stock Exchange Stock Code
1. National Stock HINDSANIT
Exchange of
India Ltd. (NSE)
2. Bombay Stock 500187
Exchange Ltd. (BSE)
ISIN allotted for Company’s equity
shares of Rs. 2 each: INE 415A 01038.
Listing fees for the financial year 2008-
09 has been paid to the Stock
Exchanges.
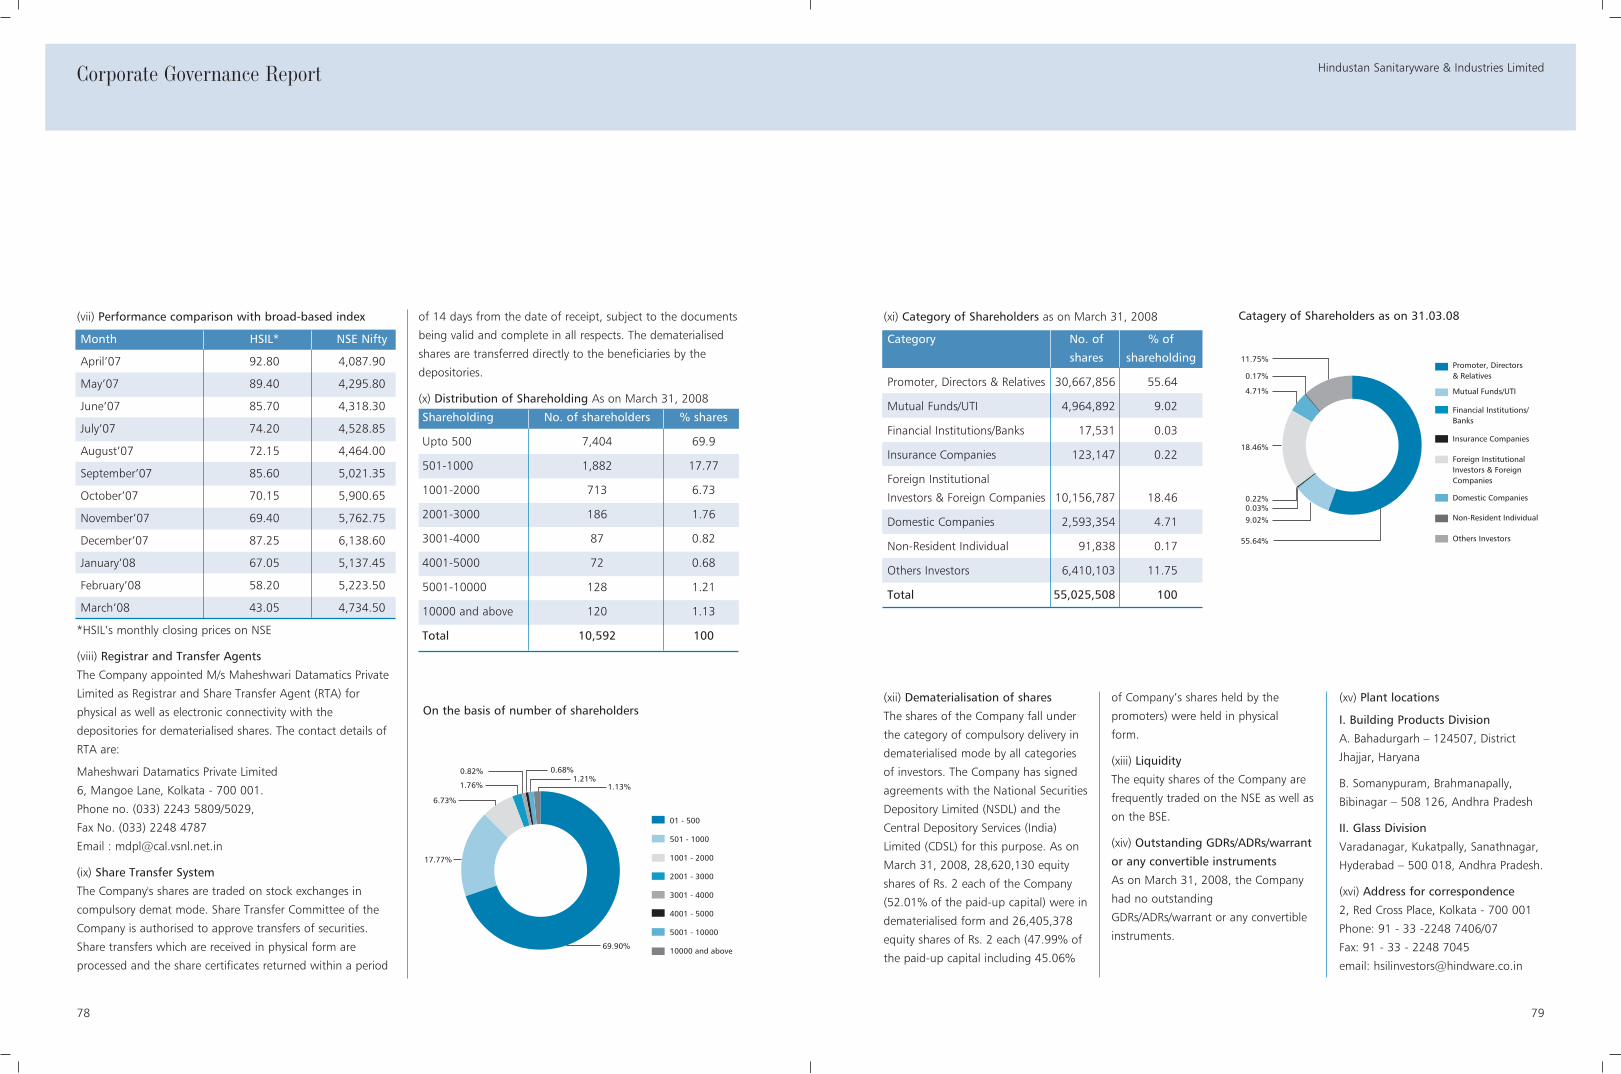
79
Hindustan Sanitaryware & Industries Limited
78
Corporate Governance Report
(xi) Category of Shareholders as on March 31, 2008
Category No. of % of
shares shareholding
Promoter, Directors & Relatives 30,667,856 55.64
Mutual Funds/UTI 4,964,892 9.02
Financial Institutions/Banks 17,531 0.03
Insurance Companies 123,147 0.22
Foreign Institutional
Investors & Foreign Companies 10,156,787 18.46
Domestic Companies 2,593,354 4.71
Non-Resident Individual 91,838 0.17
Others Investors 6,410,103 11.75
Total 55,025,508 100
(vii) Performance comparison with broad-based index
Month HSIL* NSE Nifty
April’07 92.80 4,087.90
May’07 89.40 4,295.80
June’07 85.70 4,318.30
July’07 74.20 4,528.85
August’07 72.15 4,464.00
September’07 85.60 5,021.35
October’07 70.15 5,900.65
November’07 69.40 5,762.75
December’07 87.25 6,138.60
January’08 67.05 5,137.45
February’08 58.20 5,223.50
March’08 43.05 4,734.50
*HSIL’s monthly closing prices on NSE
(viii) Registrar and Transfer Agents
The Company appointed M/s Maheshwari Datamatics Private
Limited as Registrar and Share Transfer Agent (RTA) for
physical as well as electronic connectivity with the
depositories for dematerialised shares. The contact details of
RTA are:
Maheshwari Datamatics Private Limited
6, Mangoe Lane, Kolkata - 700 001.
Phone no. (033) 2243 5809/5029,
Fax No. (033) 2248 4787
Email : [email protected]
(ix) Share Transfer System
The Company's shares are traded on stock exchanges in
compulsory demat mode. Share Transfer Committee of the
Company is authorised to approve transfers of securities.
Share transfers which are received in physical form are
processed and the share certificates returned within a period
of 14 days from the date of receipt, subject to the documents
being valid and complete in all respects. The dematerialised
shares are transferred directly to the beneficiaries by the
depositories.
(x) Distribution of Shareholding As on March 31, 2008
Shareholding No. of shareholders % shares
Upto 500 7,404 69.9
501-1000 1,882 17.77
1001-2000 713 6.73
2001-3000 186 1.76
3001-4000 87 0.82
4001-5000 72 0.68
5001-10000 128 1.21
10000 and above 120 1.13
Total 10,592 100
69.90%
17.77%
1.13%1.21%
0.68%
6.73%
1.76%
0.82%
01 - 500
501 - 1000
1001 - 2000
2001 - 3000
3001 - 4000
4001 - 5000
5001 - 10000
10000 and above
On the basis of number of shareholders
55.64%
9.02%0.03%0.22%
18.46%
4.71%
11.75%
0.17%Promoter, Directors& Relatives
Mutual Funds/UTI
Financial Institutions/Banks
Insurance Companies
Domestic Companies
Non-Resident Individual
Others Investors
Foreign Institutional Investors & Foreign Companies
Catagery of Shareholders as on 31.03.08
(xii) Dematerialisation of shares
The shares of the Company fall under
the category of compulsory delivery in
dematerialised mode by all categories
of investors. The Company has signed
agreements with the National Securities
Depository Limited (NSDL) and the
Central Depository Services (India)
Limited (CDSL) for this purpose. As on
March 31, 2008, 28,620,130 equity
shares of Rs. 2 each of the Company
(52.01% of the paid-up capital) were in
dematerialised form and 26,405,378
equity shares of Rs. 2 each (47.99% of
the paid-up capital including 45.06%
of Company’s shares held by the
promoters) were held in physical
form.
(xiii) Liquidity
The equity shares of the Company are
frequently traded on the NSE as well as
on the BSE.
(xiv) Outstanding GDRs/ADRs/warrant
or any convertible instruments
As on March 31, 2008, the Company
had no outstanding
GDRs/ADRs/warrant or any convertible
instruments.
(xv) Plant locations
I. Building Products Division
A. Bahadurgarh – 124507, District
Jhajjar, Haryana
B. Somanypuram, Brahmanapally,
Bibinagar – 508 126, Andhra Pradesh
II. Glass Division
Varadanagar, Kukatpally, Sanathnagar,
Hyderabad – 500 018, Andhra Pradesh.
(xvi) Address for correspondence
2, Red Cross Place, Kolkata - 700 001
Phone: 91 - 33 -2248 7406/07
Fax: 91 - 33 - 2248 7045
email: [email protected]
8180
1. We have audited the attached Balance Sheet of Hindustan
Sanitaryware & Industries Limited, (the ‘Company’) as at
31 March 2008, the Profit and Loss Account and also the
Cash Flow Statement for the year ended on that date
annexed thereto (collectively referred as the ‘financial
statements’). These financial statements are the
responsibility of the Company’s management. Our
responsibility is to express an opinion on these financial
statements based on our audit.
2. We conducted our audit in accordance with the auditing
standards generally accepted in India. Those standards
require that we plan and perform the audit to obtain
reasonable assurance about whether the financial
statements are free of material misstatement. An audit
includes examining, on a test basis, evidence supporting
the amounts and disclosures in the financial statements. An
audit also includes assessing the accounting principles used
and significant estimates made by management, as well as
evaluating the overall financial statement presentation. We
believe that our audit provides a reasonable basis for our
opinion.
3. As required by the Companies (Auditor’s Report) Order,
2003 (the ‘Order’) (as amended), issued by the Central
Government of India in terms of sub-section (4A) of Section
227 of the Companies Act, 1956 (the ‘Act’), we enclose in
the Annexure a statement on the matters specified in
paragraphs 4 and 5 of the Order.
4. Further to our comments in the Annexure referred to
above, we report that:
a. We have obtained all the information and explanations,
which to the best of our knowledge and belief were
necessary for the purposes of our audit;
b. In our opinion, proper books of account as required by
law have been kept by the Company so far as appears
from our examination of those books;
c. The financial statements dealt with by this report are in
agreement with the books of account;
d. On the basis of written representations received from
the directors, as on 31 March 2008 and taken on
record by the Board of Directors, we report that none
of the directors is disqualified as on 31 March 2008
from being appointed as a director in terms of clause
(g) of sub-section (1) of Section 274 of the Act;
e. In our opinion and to the best of our information and
according to the explanations given to us, the financial
statements dealt with by this report comply with the
accounting standards referred to in sub-section (3C) of
Section 211 of the Act and the Rules framed there
under and give the information required by the Act, in
the manner so required and give a true and fair view in
conformity with the accounting principles generally
accepted in India, in the case of:
i) the Balance Sheet, of the state of affairs of the
Company as at 31 March 2008;
ii) the Profit and Loss Account, of the profit for the
year ended on that date; and
iii) the Cash Flow Statement, of the cash flows for the
year ended on that date
For Walker, Chandiok & Co.
Chartered Accountants
Per B. P. Singh
Place : New Delhi Partner
Date : 17 May 2008 Membership No. 70116
To
The Members of
Hindustan Sanitaryware & Industries Limited
Auditors’ ReportDeclaration by Chairman & Managing Director under Clause 49 of the ListingAgreement regarding adherence to Code of ConductIn accordance with sub clause 1(D) of Clause 49 of the Listing Agreement with the Stock Exchanges, I hereby confirm that, all
the Directors and the Senior Management have affirmed compliance with their respective codes of conduct as applicable to
them, for the year ended on March 31, 2008.
Place: New Delhi Rajendra K. Somany
Date: May 17, 2008 Chairman and Managing Director
To the members of
Hindustan Sanitaryware and Industries Ltd.
We have examined the compliance of conditions of corporate governance by Hindustan Sanitaryware and Industries Ltd.(“the
Company) for the year ended on 31 March 2008, as stipulated in Clause 49 of the Listing Agreement of the Company with the
stock exchanges.
The compliance of conditions of corporate governance is the responsibility of the management. Our examination was limited to
procedures and implementation thereof, adopted by the Company, for ensuring the compliance of conditions of corporate
governance. It is neither an audit nor an expression of opinion on the financial statements oaf the Company.
In our opinion and to the best of our information and according to the explanations given to us, we certify that the Company
has complied with the conditions of corporate governance as stipulated in the above mentioned listing agreement.
We further state that such compliance is neither an assurance as to the future viability of the Company nor the efficiency or
effectiveness with which the management has conducted the affairs of the Company.
For Walker, Chandiok & Co.
Chartered Accountants
B.P.Singh
Place : New Delhi Partner
Date : May 17, 2008 Membership No.070116
Auditors’ Certificate on compliance with the conditions of CorporateGovernance under Clause 49 of the Listing agreement
CEO/ CFO CertificationAs required by Clause 49(V) of the Listing Agreement with the Stock Exchanges, we have certified to the Board that for the
financial year ended March 31, 2008 the Company has complied with the requirements of this sub clause.
Place: New Delhi Rajendra K. Somany V.K. Ajmera
Date: May 17, 2008 Chairman and Managing Director Sr. G.M. (Corporate Finance)
Corporate Governance Report
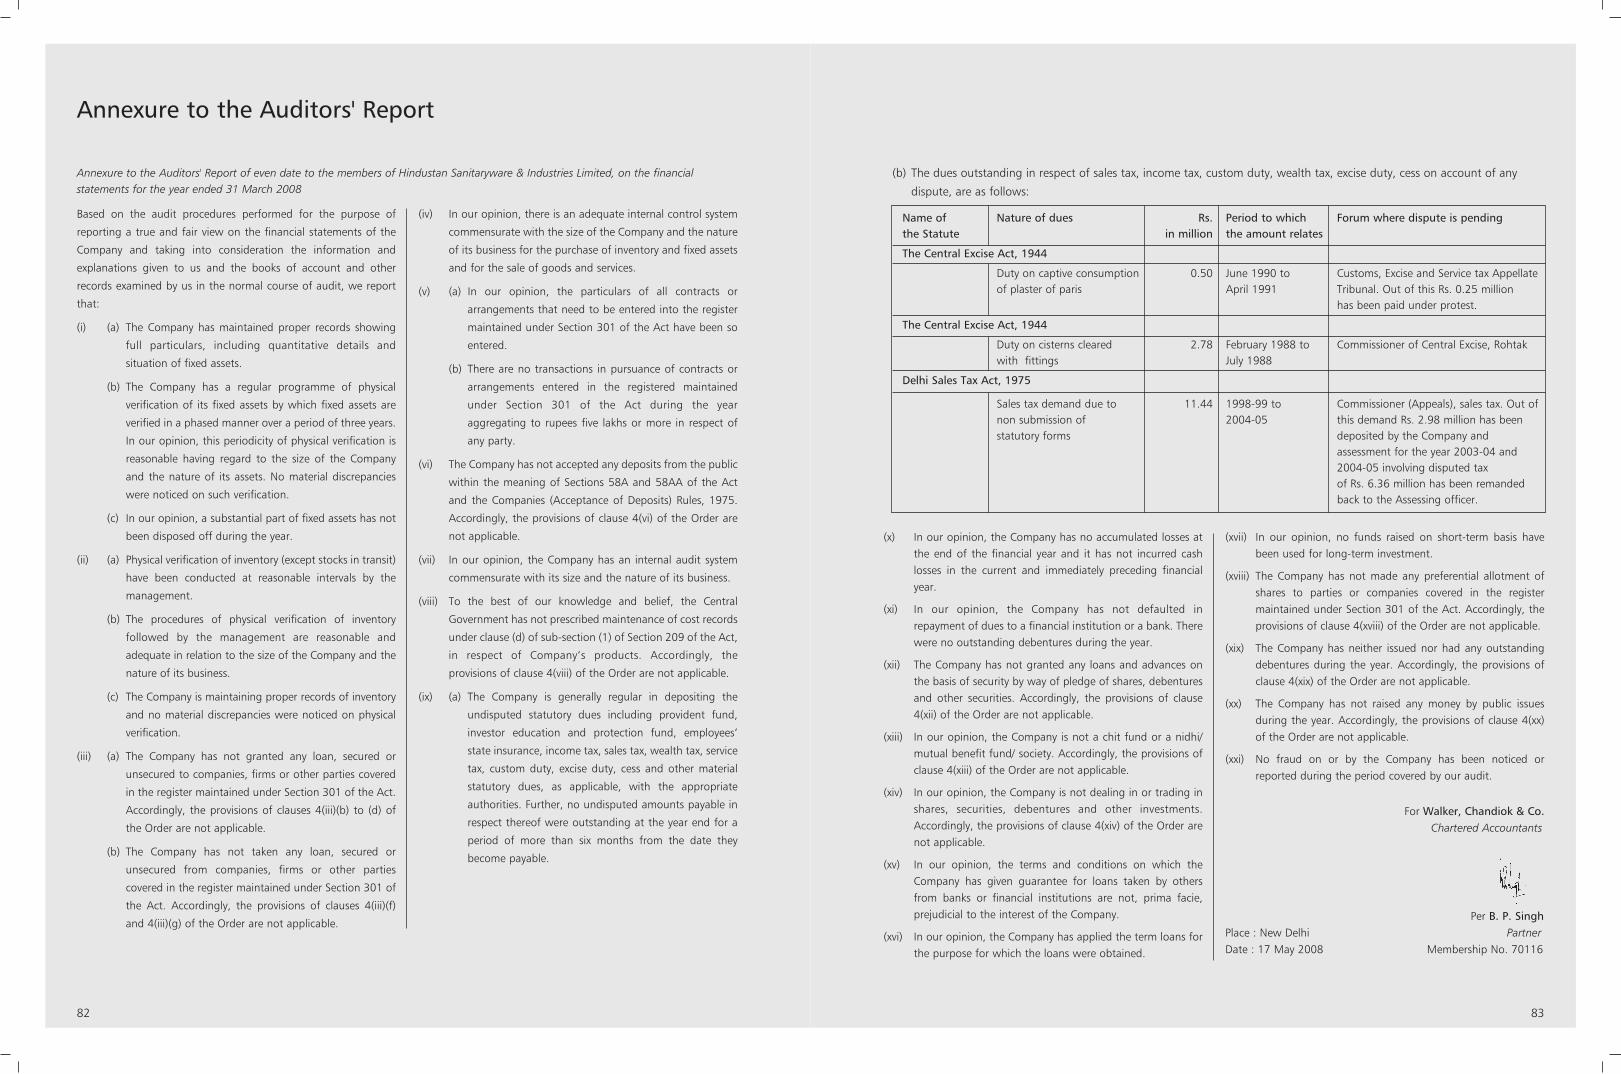
8382
Name of Nature of dues Rs. Period to which Forum where dispute is pendingthe Statute in million the amount relates
The Central Excise Act, 1944
Duty on captive consumption 0.50 June 1990 to Customs, Excise and Service tax Appellate of plaster of paris April 1991 Tribunal. Out of this Rs. 0.25 million
has been paid under protest.
The Central Excise Act, 1944
Duty on cisterns cleared 2.78 February 1988 to Commissioner of Central Excise, Rohtakwith fittings July 1988
Delhi Sales Tax Act, 1975
Sales tax demand due to 11.44 1998-99 to Commissioner (Appeals), sales tax. Out of non submission of 2004-05 this demand Rs. 2.98 million has been statutory forms deposited by the Company and
assessment for the year 2003-04 and 2004-05 involving disputed tax of Rs. 6.36 million has been remanded back to the Assessing officer.
(b) The dues outstanding in respect of sales tax, income tax, custom duty, wealth tax, excise duty, cess on account of any
dispute, are as follows:
(x) In our opinion, the Company has no accumulated losses atthe end of the financial year and it has not incurred cashlosses in the current and immediately preceding financialyear.
(xi) In our opinion, the Company has not defaulted inrepayment of dues to a financial institution or a bank. Therewere no outstanding debentures during the year.
(xii) The Company has not granted any loans and advances onthe basis of security by way of pledge of shares, debenturesand other securities. Accordingly, the provisions of clause4(xii) of the Order are not applicable.
(xiii) In our opinion, the Company is not a chit fund or a nidhi/mutual benefit fund/ society. Accordingly, the provisions ofclause 4(xiii) of the Order are not applicable.
(xiv) In our opinion, the Company is not dealing in or trading inshares, securities, debentures and other investments.Accordingly, the provisions of clause 4(xiv) of the Order arenot applicable.
(xv) In our opinion, the terms and conditions on which theCompany has given guarantee for loans taken by othersfrom banks or financial institutions are not, prima facie,prejudicial to the interest of the Company.
(xvi) In our opinion, the Company has applied the term loans forthe purpose for which the loans were obtained.
(xvii) In our opinion, no funds raised on short-term basis havebeen used for long-term investment.
(xviii) The Company has not made any preferential allotment ofshares to parties or companies covered in the registermaintained under Section 301 of the Act. Accordingly, theprovisions of clause 4(xviii) of the Order are not applicable.
(xix) The Company has neither issued nor had any outstandingdebentures during the year. Accordingly, the provisions ofclause 4(xix) of the Order are not applicable.
(xx) The Company has not raised any money by public issuesduring the year. Accordingly, the provisions of clause 4(xx)of the Order are not applicable.
(xxi) No fraud on or by the Company has been noticed orreported during the period covered by our audit.
For Walker, Chandiok & Co.Chartered Accountants
Per B. P. SinghPlace : New Delhi Partner Date : 17 May 2008 Membership No. 70116
Annexure to the Auditors' Report
Annexure to the Auditors' Report of even date to the members of Hindustan Sanitaryware & Industries Limited, on the financialstatements for the year ended 31 March 2008
Based on the audit procedures performed for the purpose of
reporting a true and fair view on the financial statements of the
Company and taking into consideration the information and
explanations given to us and the books of account and other
records examined by us in the normal course of audit, we report
that:
(i) (a) The Company has maintained proper records showing
full particulars, including quantitative details and
situation of fixed assets.
(b) The Company has a regular programme of physical
verification of its fixed assets by which fixed assets are
verified in a phased manner over a period of three years.
In our opinion, this periodicity of physical verification is
reasonable having regard to the size of the Company
and the nature of its assets. No material discrepancies
were noticed on such verification.
(c) In our opinion, a substantial part of fixed assets has not
been disposed off during the year.
(ii) (a) Physical verification of inventory (except stocks in transit)
have been conducted at reasonable intervals by the
management.
(b) The procedures of physical verification of inventory
followed by the management are reasonable and
adequate in relation to the size of the Company and the
nature of its business.
(c) The Company is maintaining proper records of inventory
and no material discrepancies were noticed on physical
verification.
(iii) (a) The Company has not granted any loan, secured or
unsecured to companies, firms or other parties covered
in the register maintained under Section 301 of the Act.
Accordingly, the provisions of clauses 4(iii)(b) to (d) of
the Order are not applicable.
(b) The Company has not taken any loan, secured or
unsecured from companies, firms or other parties
covered in the register maintained under Section 301 of
the Act. Accordingly, the provisions of clauses 4(iii)(f)
and 4(iii)(g) of the Order are not applicable.
(iv) In our opinion, there is an adequate internal control system
commensurate with the size of the Company and the nature
of its business for the purchase of inventory and fixed assets
and for the sale of goods and services.
(v) (a) In our opinion, the particulars of all contracts or
arrangements that need to be entered into the register
maintained under Section 301 of the Act have been so
entered.
(b) There are no transactions in pursuance of contracts or
arrangements entered in the registered maintained
under Section 301 of the Act during the year
aggregating to rupees five lakhs or more in respect of
any party.
(vi) The Company has not accepted any deposits from the public
within the meaning of Sections 58A and 58AA of the Act
and the Companies (Acceptance of Deposits) Rules, 1975.
Accordingly, the provisions of clause 4(vi) of the Order are
not applicable.
(vii) In our opinion, the Company has an internal audit system
commensurate with its size and the nature of its business.
(viii) To the best of our knowledge and belief, the Central
Government has not prescribed maintenance of cost records
under clause (d) of sub-section (1) of Section 209 of the Act,
in respect of Company’s products. Accordingly, the
provisions of clause 4(viii) of the Order are not applicable.
(ix) (a) The Company is generally regular in depositing the
undisputed statutory dues including provident fund,
investor education and protection fund, employees’
state insurance, income tax, sales tax, wealth tax, service
tax, custom duty, excise duty, cess and other material
statutory dues, as applicable, with the appropriate
authorities. Further, no undisputed amounts payable in
respect thereof were outstanding at the year end for a
period of more than six months from the date they
become payable.
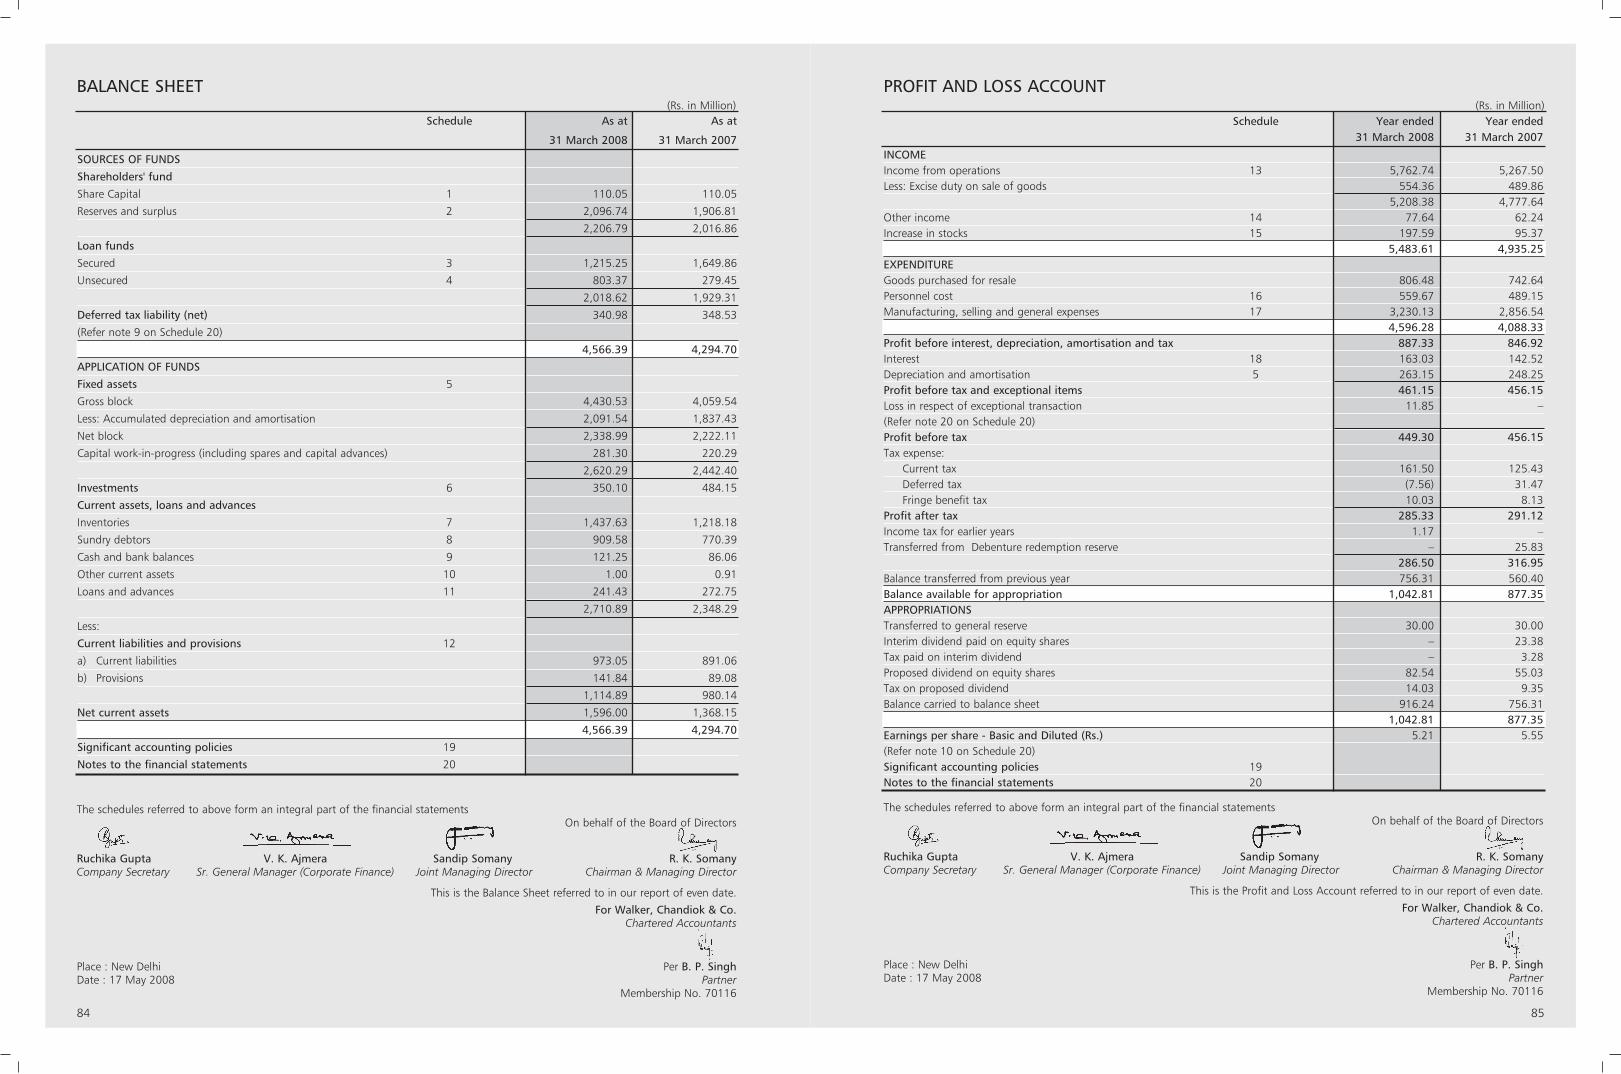
BALANCE SHEET
The schedules referred to above form an integral part of the financial statementsOn behalf of the Board of Directors
Ruchika Gupta V. K. Ajmera Sandip Somany R. K. SomanyCompany Secretary Sr. General Manager (Corporate Finance) Joint Managing Director Chairman & Managing Director
This is the Balance Sheet referred to in our report of even date.
For Walker, Chandiok & Co.Chartered Accountants
Place : New Delhi Per B. P. SinghDate : 17 May 2008 Partner
Membership No. 70116
(Rs. in Million)Schedule As at As at
31 March 2008 31 March 2007
SOURCES OF FUNDS
Shareholders' fund
Share Capital 1 110.05 110.05
Reserves and surplus 2 2,096.74 1,906.81
2,206.79 2,016.86
Loan funds
Secured 3 1,215.25 1,649.86
Unsecured 4 803.37 279.45
2,018.62 1,929.31
Deferred tax liability (net) 340.98 348.53
(Refer note 9 on Schedule 20)
4,566.39 4,294.70
APPLICATION OF FUNDS
Fixed assets 5
Gross block 4,430.53 4,059.54
Less: Accumulated depreciation and amortisation 2,091.54 1,837.43
Net block 2,338.99 2,222.11
Capital work-in-progress (including spares and capital advances) 281.30 220.29
2,620.29 2,442.40
Investments 6 350.10 484.15
Current assets, loans and advances
Inventories 7 1,437.63 1,218.18
Sundry debtors 8 909.58 770.39
Cash and bank balances 9 121.25 86.06
Other current assets 10 1.00 0.91
Loans and advances 11 241.43 272.75
2,710.89 2,348.29
Less:
Current liabilities and provisions 12
a) Current liabilities 973.05 891.06
b) Provisions 141.84 89.08
1,114.89 980.14
Net current assets 1,596.00 1,368.15
4,566.39 4,294.70
Significant accounting policies 19
Notes to the financial statements 20
84 85
PROFIT AND LOSS ACCOUNT(Rs. in Million)
Schedule Year ended Year ended31 March 2008 31 March 2007
INCOMEIncome from operations 13 5,762.74 5,267.50Less: Excise duty on sale of goods 554.36 489.86
5,208.38 4,777.64Other income 14 77.64 62.24Increase in stocks 15 197.59 95.37
5,483.61 4,935.25EXPENDITUREGoods purchased for resale 806.48 742.64Personnel cost 16 559.67 489.15Manufacturing, selling and general expenses 17 3,230.13 2,856.54
4,596.28 4,088.33Profit before interest, depreciation, amortisation and tax 887.33 846.92Interest 18 163.03 142.52Depreciation and amortisation 5 263.15 248.25Profit before tax and exceptional items 461.15 456.15Loss in respect of exceptional transaction 11.85 –(Refer note 20 on Schedule 20)Profit before tax 449.30 456.15Tax expense:
Current tax 161.50 125.43Deferred tax (7.56) 31.47Fringe benefit tax 10.03 8.13
Profit after tax 285.33 291.12Income tax for earlier years 1.17 –Transferred from Debenture redemption reserve – 25.83
286.50 316.95Balance transferred from previous year 756.31 560.40Balance available for appropriation 1,042.81 877.35APPROPRIATIONSTransferred to general reserve 30.00 30.00Interim dividend paid on equity shares – 23.38Tax paid on interim dividend – 3.28Proposed dividend on equity shares 82.54 55.03Tax on proposed dividend 14.03 9.35Balance carried to balance sheet 916.24 756.31
1,042.81 877.35Earnings per share - Basic and Diluted (Rs.) 5.21 5.55 (Refer note 10 on Schedule 20)Significant accounting policies 19Notes to the financial statements 20
The schedules referred to above form an integral part of the financial statementsOn behalf of the Board of Directors
Ruchika Gupta V. K. Ajmera Sandip Somany R. K. SomanyCompany Secretary Sr. General Manager (Corporate Finance) Joint Managing Director Chairman & Managing Director
This is the Profit and Loss Account referred to in our report of even date.
For Walker, Chandiok & Co.Chartered Accountants
Place : New Delhi Per B. P. SinghDate : 17 May 2008 Partner
Membership No. 70116

CASH FLOW STATEMENT
86 87
CASH FLOW STATEMENT (Contd.)(Rs. in Million)
Year ended Year ended
31 March 2008 31 March 2007
C. CASH FLOW FROM FINANCING ACTIVITIES
Proceeds from long term borrowings – 400.00
Repayment of long term borrowings (net) (76.23) (259.31)
Proceeds from short term borrowings (net) 165.54 (76.32)
Interest paid (164.47) (143.71)
Dividend paid (54.84) (83.68)
Taxes on dividend (9.35) (11.81)
Net cash used in financing activities (139.35) (174.83)
Net increase in cash and cash equivalents 20.81 (39.69)
Cash and cash equivalents in the beginning 63.64 103.33
Cash and cash equivalents at the close 84.45 63.64
Note:
Cash and cash equivalents include:
Cash and cheques in hand and remittances in transit 67.33 32.73
Balances with bank 17.12 30.91
Cash and cash equivalents 84.45 63.64
Balances in fixed deposit accounts - pledged 33.76 19.58
Balances in unpaid dividend accounts 3.04 2.84
Balance in post office savings account (pledged)* – –
Balance with bank not considered as cash equivalents 36.80 22.42
Cash and bank balances as per Balance Sheet 121.25 86.06
* Rounded off to Nil
(Rs. in Million)Year ended Year ended
31 March 2008 31 March 2007
A. CASH FLOW FROM OPERATING ACTIVITIES
Net Profit before tax 449.30 456.15
Adjustments for:
Depreciation and Amortisation 263.15 248.25
(Profit)/loss on disposal of fixed assets (net) (0.21) (1.10)
Interest expense 163.03 142.52
Dividend (1.30) (10.87)
Interest income (7.62) (4.14)
(Profit)/loss on sale of investments (net) (21.18) 5.93
Dimunition in the value of current investments 0.36 -
Provision for doubtful debts and advances 2.91 9.59
Bad debts written off 0.98 2.14
Sundry balances and liabilities no longer required written back (8.16) (7.66)
Operating Profit before working capital changes 841.26 840.81
Adjustments for:
Inventories (219.45) (135.45)
Trade/other receivables (114.61) 2.83
Trade/other payables 94.99 68.32
Cash generated from operations 602.19 776.51
Direct taxes paid (153.38) (151.17)
Net cash from operating activities 448.81 625.34
B. CASH FLOW FROM INVESTING ACTIVITIES
Purchase of fixed assets including capital work in progress (449.67) (613.77)
Proceeds from sale of fixed assets 8.83 11.40
Purchase of investments (95.00) (248.69)
Sale proceeds of investments 249.87 336.57
Movement in restricted cash (14.36) (1.83)
Interest received 8.38 15.12
Dividend received 1.30 10.87
Loans and advances recovered 2.00 0.13
Net cash used in investing activities (288.65) (490.20)
On behalf of the Board of Directors
Ruchika Gupta V. K. Ajmera Sandip Somany R. K. SomanyCompany Secretary Sr. General Manager (Corporate Finance) Joint Managing Director Chairman & Managing Director
This is the Cash Flow Statement referred to in our report of even date.
For Walker, Chandiok & Co.Chartered Accountants
Place : New Delhi Per B. P. SinghDate : 17 May 2008 Partner
Membership No. 70116
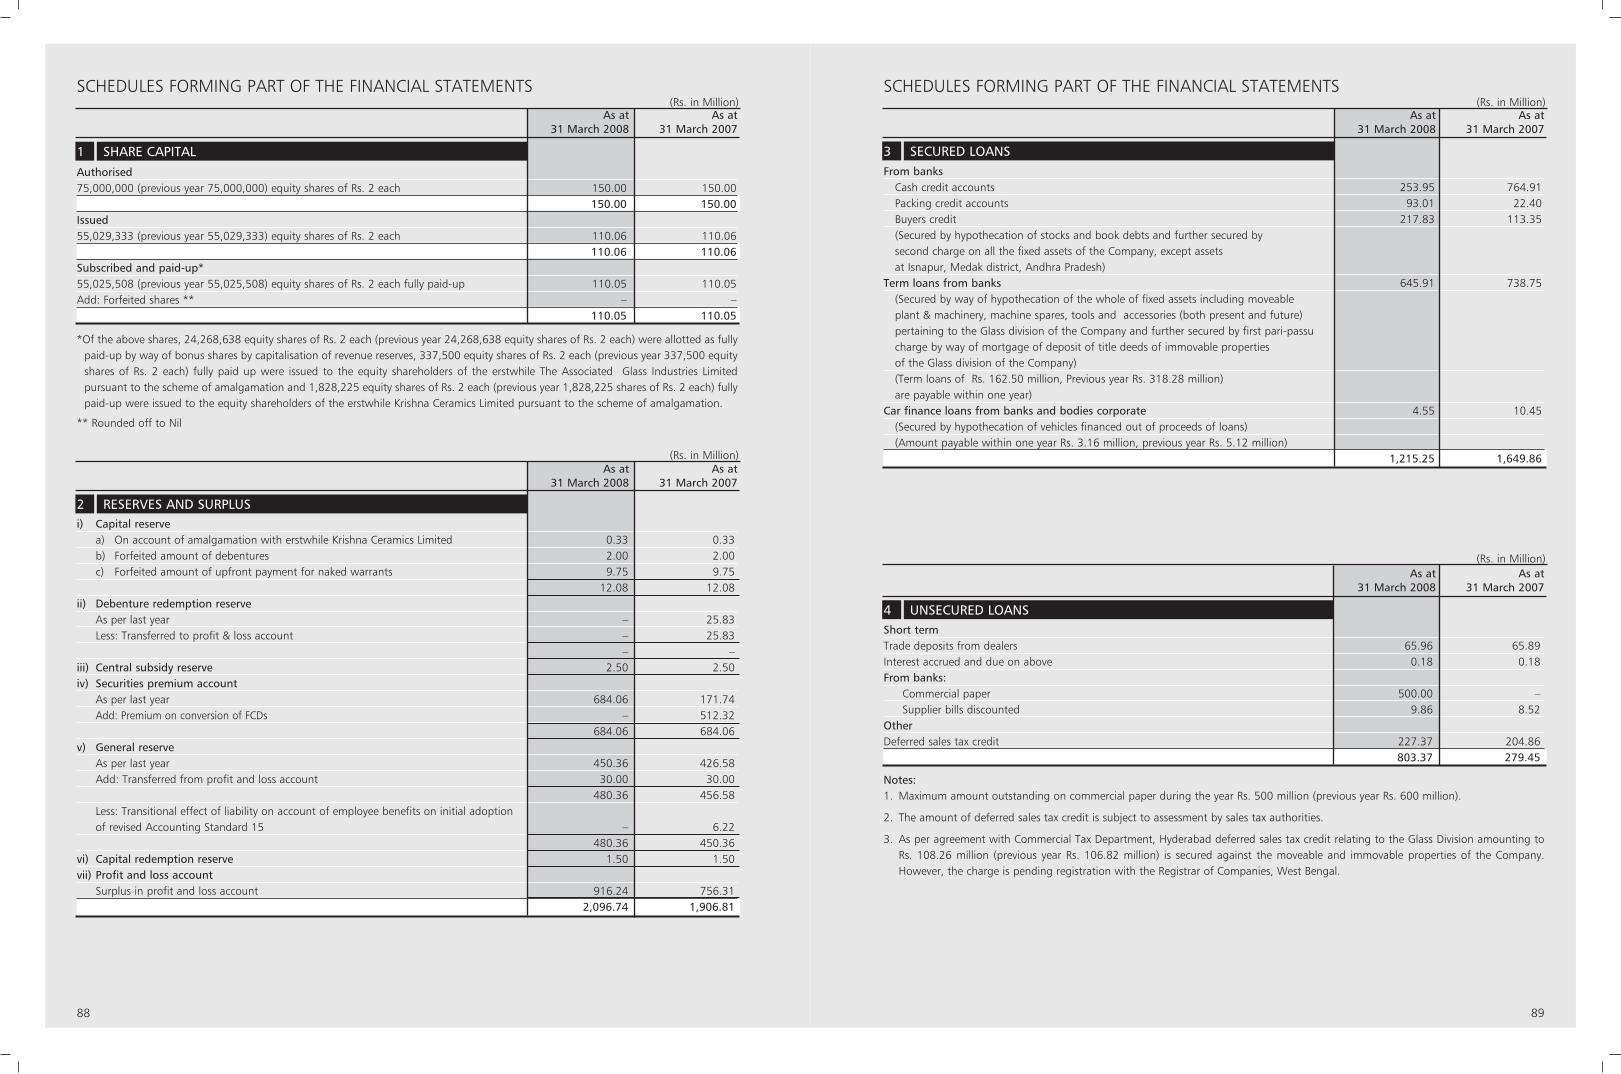
SCHEDULES FORMING PART OF THE FINANCIAL STATEMENTS(Rs. in Million)
As at As at31 March 2008 31 March 2007
Authorised75,000,000 (previous year 75,000,000) equity shares of Rs. 2 each 150.00 150.00
150.00 150.00Issued 55,029,333 (previous year 55,029,333) equity shares of Rs. 2 each 110.06 110.06
110.06 110.06 Subscribed and paid-up*55,025,508 (previous year 55,025,508) equity shares of Rs. 2 each fully paid-up 110.05 110.05 Add: Forfeited shares ** – –
110.05 110.05
*Of the above shares, 24,268,638 equity shares of Rs. 2 each (previous year 24,268,638 equity shares of Rs. 2 each) were allotted as fullypaid-up by way of bonus shares by capitalisation of revenue reserves, 337,500 equity shares of Rs. 2 each (previous year 337,500 equityshares of Rs. 2 each) fully paid up were issued to the equity shareholders of the erstwhile The Associated Glass Industries Limitedpursuant to the scheme of amalgamation and 1,828,225 equity shares of Rs. 2 each (previous year 1,828,225 shares of Rs. 2 each) fullypaid-up were issued to the equity shareholders of the erstwhile Krishna Ceramics Limited pursuant to the scheme of amalgamation.
** Rounded off to Nil
1 SHARE CAPITAL
(Rs. in Million)As at As at
31 March 2008 31 March 2007
Short termTrade deposits from dealers 65.96 65.89 Interest accrued and due on above 0.18 0.18 From banks:
Commercial paper 500.00 –Supplier bills discounted 9.86 8.52
OtherDeferred sales tax credit 227.37 204.86
803.37 279.45
4 UNSECURED LOANS
(Rs. in Million)As at As at
31 March 2008 31 March 2007
From banksCash credit accounts 253.95 764.91Packing credit accounts 93.01 22.40Buyers credit 217.83 113.35(Secured by hypothecation of stocks and book debts and further secured by second charge on all the fixed assets of the Company, except assets at Isnapur, Medak district, Andhra Pradesh)
Term loans from banks 645.91 738.75(Secured by way of hypothecation of the whole of fixed assets including moveable plant & machinery, machine spares, tools and accessories (both present and future) pertaining to the Glass division of the Company and further secured by first pari-passu charge by way of mortgage of deposit of title deeds of immovable properties of the Glass division of the Company)(Term loans of Rs. 162.50 million, Previous year Rs. 318.28 million) are payable within one year)
Car finance loans from banks and bodies corporate 4.55 10.45(Secured by hypothecation of vehicles financed out of proceeds of loans)(Amount payable within one year Rs. 3.16 million, previous year Rs. 5.12 million)
1,215.25 1,649.86
Notes:1. Maximum amount outstanding on commercial paper during the year Rs. 500 million (previous year Rs. 600 million).
2. The amount of deferred sales tax credit is subject to assessment by sales tax authorities.
3. As per agreement with Commercial Tax Department, Hyderabad deferred sales tax credit relating to the Glass Division amounting to Rs. 108.26 million (previous year Rs. 106.82 million) is secured against the moveable and immovable properties of the Company.However, the charge is pending registration with the Registrar of Companies, West Bengal.
3 SECURED LOANS
(Rs. in Million)As at As at
31 March 2008 31 March 2007
i) Capital reservea) On account of amalgamation with erstwhile Krishna Ceramics Limited 0.33 0.33b) Forfeited amount of debentures 2.00 2.00 c) Forfeited amount of upfront payment for naked warrants 9.75 9.75
12.08 12.08 ii) Debenture redemption reserve
As per last year – 25.83 Less: Transferred to profit & loss account – 25.83
– –iii) Central subsidy reserve 2.50 2.50 iv) Securities premium account
As per last year 684.06 171.74 Add: Premium on conversion of FCDs – 512.32
684.06 684.06 v) General reserve
As per last year 450.36 426.58 Add: Transferred from profit and loss account 30.00 30.00
480.36 456.58 Less: Transitional effect of liability on account of employee benefits on initial adoptionof revised Accounting Standard 15 – 6.22
480.36 450.36 vi) Capital redemption reserve 1.50 1.50vii) Profit and loss account
Surplus in profit and loss account 916.24 756.31 2,096.74 1,906.81
2 RESERVES AND SURPLUS
SCHEDULES FORMING PART OF THE FINANCIAL STATEMENTS
88 89
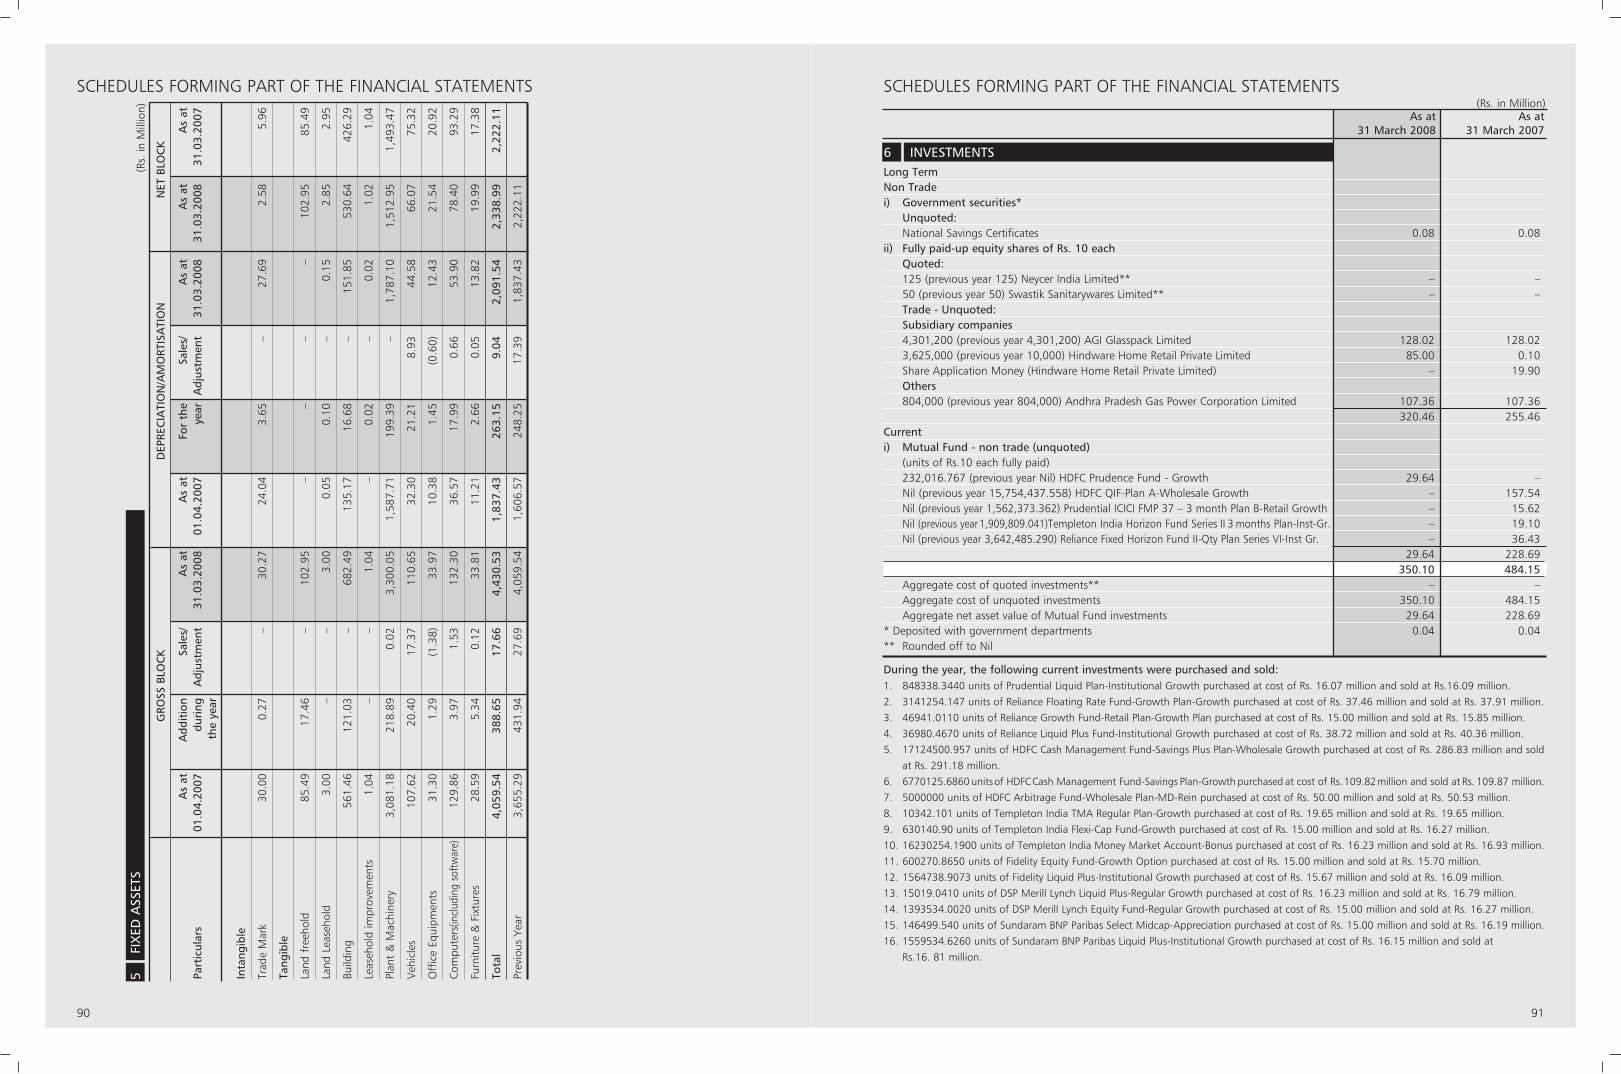
SCHEDULES FORMING PART OF THE FINANCIAL STATEMENTS SCHEDULES FORMING PART OF THE FINANCIAL STATEMENTS
90 91
(Rs.
in M
illio
n)
GRO
SS B
LOC
KD
EPRE
CIA
TIO
N/A
MO
RTIS
ATI
ON
NET
BLO
CK
As
atA
ddit
ion
Sale
s/A
s at
As
at
For
the
Sale
s/A
s at
As
atA
s at
Part
icul
ars
01.0
4.20
07du
ring
Adj
ustm
ent
31.0
3.20
0801
.04.
2007
year
Adj
ustm
ent
31.0
3.20
0831
.03.
2008
31.0
3.20
07th
e ye
ar
Inta
ngib
le
Trad
e M
ark
30.0
00.
27–
30
.27
24.0
43.
65–
27
.69
2.58
5.96
Tang
ible
Land
fre
ehol
d85
.49
17.4
6–
10
2.95
–
–
–
–
102.
9585
.49
Land
Lea
seho
ld
3.00
–
–
3.00
0.05
0.10
–
0.15
2.85
2.95
Build
ing
561.
4612
1.03
–
682.
4913
5.17
16.6
8–
15
1.85
530.
6442
6.29
Leas
ehol
d im
prov
emen
ts1.
04–
–
1.
04–
0.
02–
0.
021.
021.
04
Plan
t &
Mac
hine
ry3,
081.
1821
8.89
0.02
3,30
0.05
1,58
7.71
199.
39–
1,
787.
101,
512.
951,
493.
47
Veh
icle
s10
7.62
20.4
017
.37
110.
6532
.30
21.2
18.
9344
.58
66.0
775
.32
Off
ice
Equi
pmen
ts31
.30
1.29
(1.3
8)33
.97
10.3
81.
45(0
.60)
12.4
321
.54
20.9
2
Com
pute
rs(in
clud
ing
softw
are)
129.
863.
971.
5313
2.30
36.5
717
.99
0.66
53.9
078
.40
93.2
9
Furn
iture
& F
ixtu
res
28.5
95.
340.
1233
.81
11.2
12.
660.
0513
.82
19.9
917
.38
Tota
l4,
059.
5438
8.65
17.6
64,
430.
531,
837.
4326
3.15
9.04
2,09
1.54
2,33
8.99
2,22
2.11
Prev
ious
Yea
r3,
655.
2943
1.94
27.6
94,
059.
541,
606.
5724
8.25
17.3
91,
837.
432,
222.
11
5FI
XED
ASS
ETS
(Rs. in Million)As at As at
31 March 2008 31 March 2007
Long TermNon Tradei) Government securities*
Unquoted:National Savings Certificates 0.08 0.08
ii) Fully paid-up equity shares of Rs. 10 eachQuoted:125 (previous year 125) Neycer India Limited** – –50 (previous year 50) Swastik Sanitarywares Limited** – –Trade - Unquoted: Subsidiary companies4,301,200 (previous year 4,301,200) AGI Glasspack Limited 128.02 128.02 3,625,000 (previous year 10,000) Hindware Home Retail Private Limited 85.00 0.10Share Application Money (Hindware Home Retail Private Limited) – 19.90 Others804,000 (previous year 804,000) Andhra Pradesh Gas Power Corporation Limited 107.36 107.36
320.46 255.46 Currenti) Mutual Fund - non trade (unquoted)
(units of Rs.10 each fully paid)232,016.767 (previous year Nil) HDFC Prudence Fund - Growth 29.64 –Nil (previous year 15,754,437.558) HDFC QIF-Plan A-Wholesale Growth – 157.54Nil (previous year 1,562,373.362) Prudential ICICI FMP 37 – 3 month Plan B-Retail Growth – 15.62 Nil (previous year1,909,809.041)Templeton India Horizon Fund Series II 3 months Plan-Inst-Gr. – 19.10 Nil (previous year 3,642,485.290) Reliance Fixed Horizon Fund II-Qty Plan Series VI-Inst Gr. – 36.43
29.64 228.69 350.10 484.15
Aggregate cost of quoted investments** – –Aggregate cost of unquoted investments 350.10 484.15 Aggregate net asset value of Mutual Fund investments 29.64 228.69
* Deposited with government departments 0.04 0.04** Rounded off to Nil
During the year, the following current investments were purchased and sold:1. 848338.3440 units of Prudential Liquid Plan-Institutional Growth purchased at cost of Rs. 16.07 million and sold at Rs.16.09 million.
2. 3141254.147 units of Reliance Floating Rate Fund-Growth Plan-Growth purchased at cost of Rs. 37.46 million and sold at Rs. 37.91 million.
3. 46941.0110 units of Reliance Growth Fund-Retail Plan-Growth Plan purchased at cost of Rs. 15.00 million and sold at Rs. 15.85 million.
4. 36980.4670 units of Reliance Liquid Plus Fund-Institutional Growth purchased at cost of Rs. 38.72 million and sold at Rs. 40.36 million.
5. 17124500.957 units of HDFC Cash Management Fund-Savings Plus Plan-Wholesale Growth purchased at cost of Rs. 286.83 million and sold
at Rs. 291.18 million.
6. 6770125.6860 unitsof HDFCCash Management Fund-Savings Plan-Growth purchased at cost of Rs.109.82million and sold at Rs. 109.87 million.
7. 5000000 units of HDFC Arbitrage Fund-Wholesale Plan-MD-Rein purchased at cost of Rs. 50.00 million and sold at Rs. 50.53 million.
8. 10342.101 units of Templeton India TMA Regular Plan-Growth purchased at cost of Rs. 19.65 million and sold at Rs. 19.65 million.
9. 630140.90 units of Templeton India Flexi-Cap Fund-Growth purchased at cost of Rs. 15.00 million and sold at Rs. 16.27 million.
10. 16230254.1900 units of Templeton India Money Market Account-Bonus purchased at cost of Rs. 16.23 million and sold at Rs. 16.93 million.
11. 600270.8650 units of Fidelity Equity Fund-Growth Option purchased at cost of Rs. 15.00 million and sold at Rs. 15.70 million.
12. 1564738.9073 units of Fidelity Liquid Plus-Institutional Growth purchased at cost of Rs. 15.67 million and sold at Rs. 16.09 million.
13. 15019.0410 units of DSP Merill Lynch Liquid Plus-Regular Growth purchased at cost of Rs. 16.23 million and sold at Rs. 16.79 million.
14. 1393534.0020 units of DSP Merill Lynch Equity Fund-Regular Growth purchased at cost of Rs. 15.00 million and sold at Rs. 16.27 million.
15. 146499.540 units of Sundaram BNP Paribas Select Midcap-Appreciation purchased at cost of Rs. 15.00 million and sold at Rs. 16.19 million.
16. 1559534.6260 units of Sundaram BNP Paribas Liquid Plus-Institutional Growth purchased at cost of Rs. 16.15 million and sold at
Rs.16. 81 million.
6 INVESTMENTS
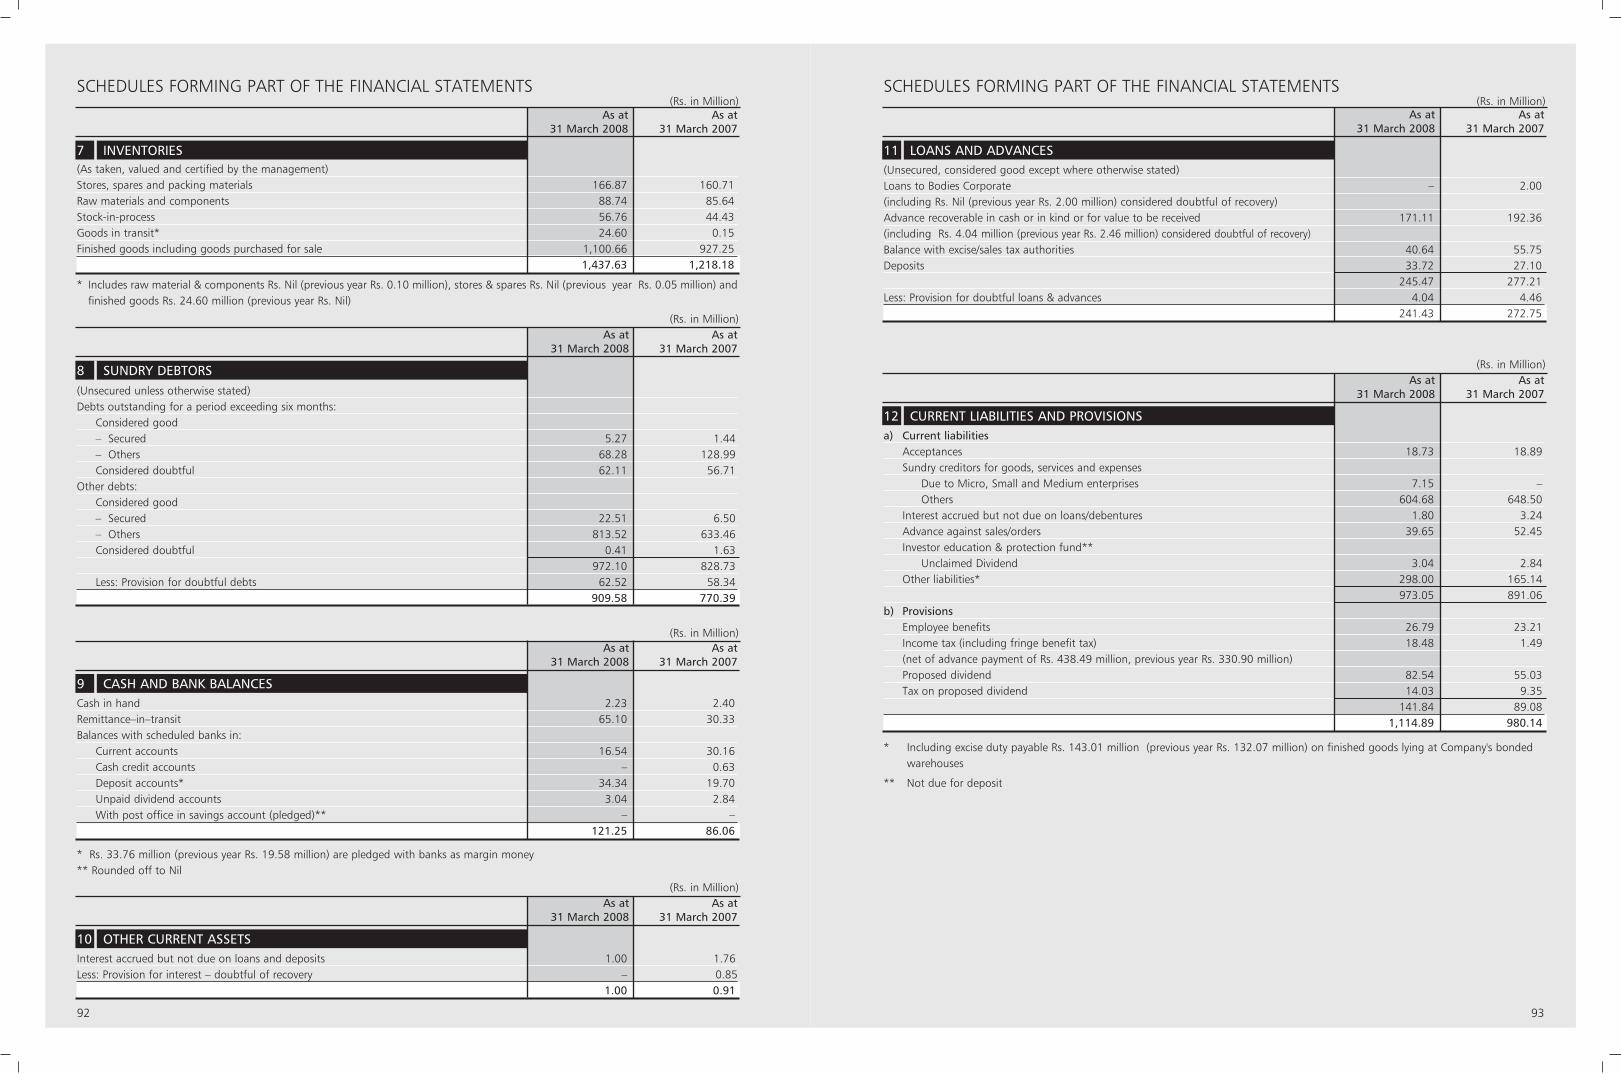
SCHEDULES FORMING PART OF THE FINANCIAL STATEMENTS SCHEDULES FORMING PART OF THE FINANCIAL STATEMENTS
92 93
(Rs. in Million)As at As at
31 March 2008 31 March 2007
(As taken, valued and certified by the management)Stores, spares and packing materials 166.87 160.71 Raw materials and components 88.74 85.64Stock-in-process 56.76 44.43 Goods in transit* 24.60 0.15 Finished goods including goods purchased for sale 1,100.66 927.25
1,437.63 1,218.18
* Includes raw material & components Rs. Nil (previous year Rs. 0.10 million), stores & spares Rs. Nil (previous year Rs. 0.05 million) andfinished goods Rs. 24.60 million (previous year Rs. Nil)
7 INVENTORIES
(Rs. in Million)As at As at
31 March 2008 31 March 2007
(Unsecured, considered good except where otherwise stated)Loans to Bodies Corporate – 2.00(including Rs. Nil (previous year Rs. 2.00 million) considered doubtful of recovery)Advance recoverable in cash or in kind or for value to be received 171.11 192.36(including Rs. 4.04 million (previous year Rs. 2.46 million) considered doubtful of recovery)Balance with excise/sales tax authorities 40.64 55.75Deposits 33.72 27.10
245.47 277.21Less: Provision for doubtful loans & advances 4.04 4.46
241.43 272.75
11 LOANS AND ADVANCES
(Rs. in Million)As at As at
31 March 2008 31 March 2007
(Unsecured unless otherwise stated)Debts outstanding for a period exceeding six months:
Considered good– Secured 5.27 1.44 – Others 68.28 128.99 Considered doubtful 62.11 56.71
Other debts:Considered good– Secured 22.51 6.50 – Others 813.52 633.46 Considered doubtful 0.41 1.63
972.10 828.73 Less: Provision for doubtful debts 62.52 58.34
909.58 770.39
8 SUNDRY DEBTORS
(Rs. in Million)As at As at
31 March 2008 31 March 2007
Cash in hand 2.23 2.40 Remittance–in–transit 65.10 30.33 Balances with scheduled banks in:
Current accounts 16.54 30.16 Cash credit accounts – 0.63 Deposit accounts* 34.34 19.70 Unpaid dividend accounts 3.04 2.84 With post office in savings account (pledged)** – –
121.25 86.06
* Rs. 33.76 million (previous year Rs. 19.58 million) are pledged with banks as margin money** Rounded off to Nil
9 CASH AND BANK BALANCES
(Rs. in Million)As at As at
31 March 2008 31 March 2007
Interest accrued but not due on loans and deposits 1.00 1.76 Less: Provision for interest – doubtful of recovery – 0.85
1.00 0.91
10 OTHER CURRENT ASSETS
(Rs. in Million)As at As at
31 March 2008 31 March 2007
a) Current liabilitiesAcceptances 18.73 18.89Sundry creditors for goods, services and expenses
Due to Micro, Small and Medium enterprises 7.15 – Others 604.68 648.50
Interest accrued but not due on loans/debentures 1.80 3.24Advance against sales/orders 39.65 52.45Investor education & protection fund**
Unclaimed Dividend 3.04 2.84Other liabilities* 298.00 165.14
973.05 891.06b) Provisions
Employee benefits 26.79 23.21Income tax (including fringe benefit tax) 18.48 1.49(net of advance payment of Rs. 438.49 million, previous year Rs. 330.90 million)Proposed dividend 82.54 55.03Tax on proposed dividend 14.03 9.35
141.84 89.081,114.89 980.14
* Including excise duty payable Rs. 143.01 million (previous year Rs. 132.07 million) on finished goods lying at Company's bonded warehouses
** Not due for deposit
12 CURRENT LIABILITIES AND PROVISIONS
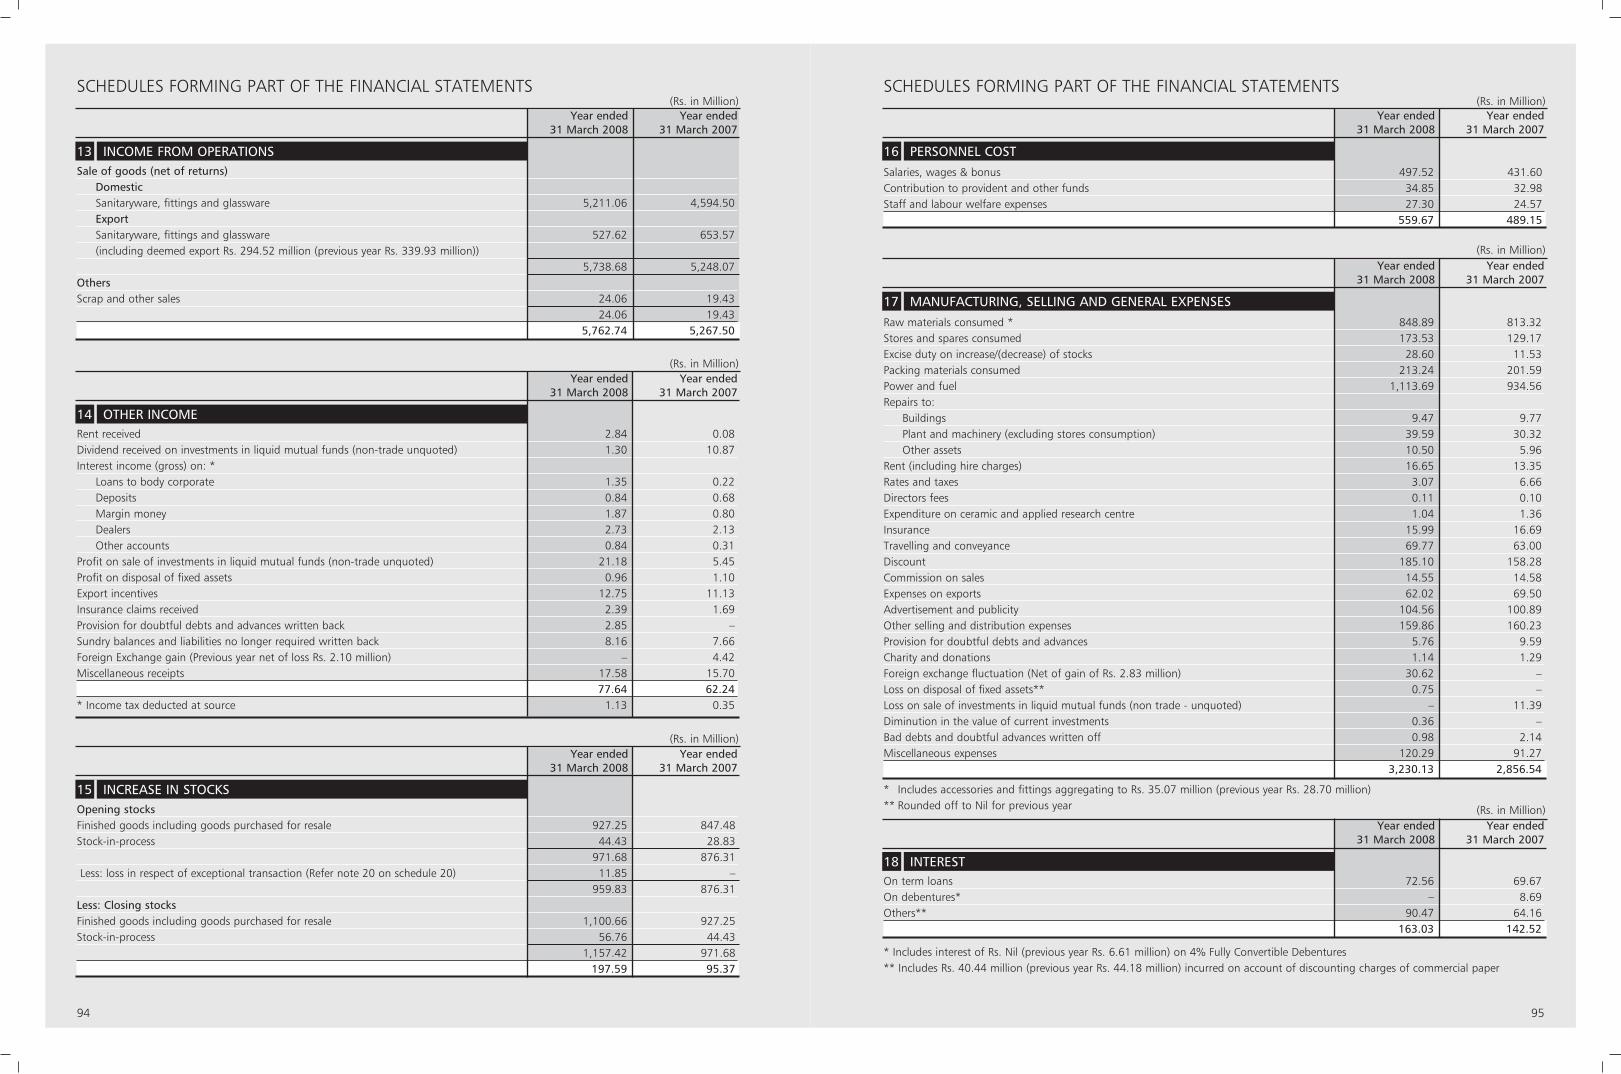
SCHEDULES FORMING PART OF THE FINANCIAL STATEMENTS SCHEDULES FORMING PART OF THE FINANCIAL STATEMENTS
94 95
(Rs. in Million)Year ended Year ended
31 March 2008 31 March 2007
Sale of goods (net of returns)DomesticSanitaryware, fittings and glassware 5,211.06 4,594.50 ExportSanitaryware, fittings and glassware 527.62 653.57 (including deemed export Rs. 294.52 million (previous year Rs. 339.93 million))
5,738.68 5,248.07 OthersScrap and other sales 24.06 19.43
24.06 19.435,762.74 5,267.50
13 INCOME FROM OPERATIONS
(Rs. in Million)Year ended Year ended
31 March 2008 31 March 2007
Opening stocksFinished goods including goods purchased for resale 927.25 847.48 Stock-in-process 44.43 28.83
971.68 876.31Less: loss in respect of exceptional transaction (Refer note 20 on schedule 20) 11.85 –
959.83 876.31Less: Closing stocksFinished goods including goods purchased for resale 1,100.66 927.25 Stock-in-process 56.76 44.43
1,157.42 971.68 197.59 95.37
15 INCREASE IN STOCKS
(Rs. in Million)Year ended Year ended
31 March 2008 31 March 2007
Rent received 2.84 0.08 Dividend received on investments in liquid mutual funds (non-trade unquoted) 1.30 10.87 Interest income (gross) on: *
Loans to body corporate 1.35 0.22 Deposits 0.84 0.68 Margin money 1.87 0.80 Dealers 2.73 2.13 Other accounts 0.84 0.31
Profit on sale of investments in liquid mutual funds (non-trade unquoted) 21.18 5.45 Profit on disposal of fixed assets 0.96 1.10 Export incentives 12.75 11.13 Insurance claims received 2.39 1.69 Provision for doubtful debts and advances written back 2.85 –Sundry balances and liabilities no longer required written back 8.16 7.66 Foreign Exchange gain (Previous year net of loss Rs. 2.10 million) – 4.42Miscellaneous receipts 17.58 15.70
77.64 62.24 * Income tax deducted at source 1.13 0.35
14 OTHER INCOME
(Rs. in Million)Year ended Year ended
31 March 2008 31 March 2007
Salaries, wages & bonus 497.52 431.60 Contribution to provident and other funds 34.85 32.98 Staff and labour welfare expenses 27.30 24.57
559.67 489.15
16 PERSONNEL COST
(Rs. in Million)Year ended Year ended
31 March 2008 31 March 2007
On term loans 72.56 69.67 On debentures* – 8.69 Others** 90.47 64.16
163.03 142.52
* Includes interest of Rs. Nil (previous year Rs. 6.61 million) on 4% Fully Convertible Debentures** Includes Rs. 40.44 million (previous year Rs. 44.18 million) incurred on account of discounting charges of commercial paper
* Includes accessories and fittings aggregating to Rs. 35.07 million (previous year Rs. 28.70 million)** Rounded off to Nil for previous year
18 INTEREST
(Rs. in Million)Year ended Year ended
31 March 2008 31 March 2007
Raw materials consumed * 848.89 813.32Stores and spares consumed 173.53 129.17Excise duty on increase/(decrease) of stocks 28.60 11.53Packing materials consumed 213.24 201.59Power and fuel 1,113.69 934.56Repairs to:
Buildings 9.47 9.77Plant and machinery (excluding stores consumption) 39.59 30.32Other assets 10.50 5.96
Rent (including hire charges) 16.65 13.35Rates and taxes 3.07 6.66Directors fees 0.11 0.10Expenditure on ceramic and applied research centre 1.04 1.36Insurance 15.99 16.69Travelling and conveyance 69.77 63.00Discount 185.10 158.28Commission on sales 14.55 14.58Expenses on exports 62.02 69.50Advertisement and publicity 104.56 100.89Other selling and distribution expenses 159.86 160.23Provision for doubtful debts and advances 5.76 9.59Charity and donations 1.14 1.29Foreign exchange fluctuation (Net of gain of Rs. 2.83 million) 30.62 – Loss on disposal of fixed assets** 0.75 –Loss on sale of investments in liquid mutual funds (non trade - unquoted) – 11.39Diminution in the value of current investments 0.36 – Bad debts and doubtful advances written off 0.98 2.14Miscellaneous expenses 120.29 91.27
3,230.13 2,856.54
17 MANUFACTURING, SELLING AND GENERAL EXPENSES
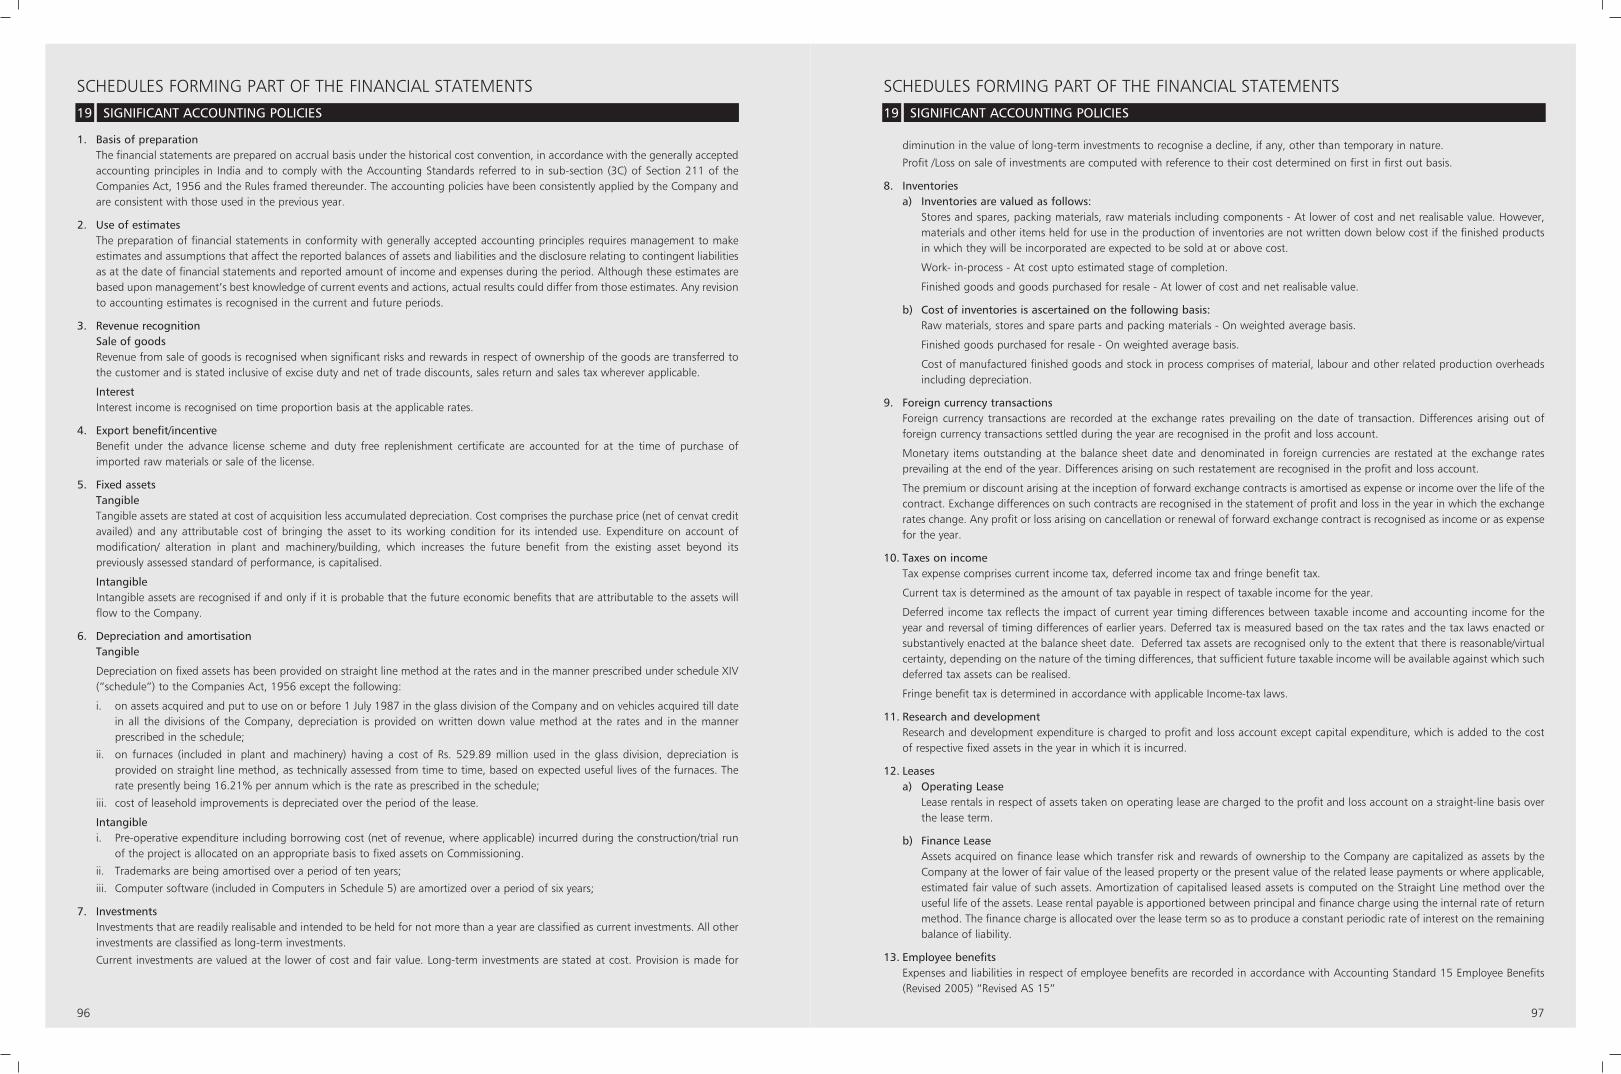
diminution in the value of long-term investments to recognise a decline, if any, other than temporary in nature.
Profit /Loss on sale of investments are computed with reference to their cost determined on first in first out basis.
8. Inventoriesa) Inventories are valued as follows:
Stores and spares, packing materials, raw materials including components - At lower of cost and net realisable value. However,materials and other items held for use in the production of inventories are not written down below cost if the finished productsin which they will be incorporated are expected to be sold at or above cost.
Work- in-process - At cost upto estimated stage of completion.
Finished goods and goods purchased for resale - At lower of cost and net realisable value.
b) Cost of inventories is ascertained on the following basis: Raw materials, stores and spare parts and packing materials - On weighted average basis.
Finished goods purchased for resale - On weighted average basis.
Cost of manufactured finished goods and stock in process comprises of material, labour and other related production overheadsincluding depreciation.
9. Foreign currency transactionsForeign currency transactions are recorded at the exchange rates prevailing on the date of transaction. Differences arising out offoreign currency transactions settled during the year are recognised in the profit and loss account.
Monetary items outstanding at the balance sheet date and denominated in foreign currencies are restated at the exchange ratesprevailing at the end of the year. Differences arising on such restatement are recognised in the profit and loss account.
The premium or discount arising at the inception of forward exchange contracts is amortised as expense or income over the life of thecontract. Exchange differences on such contracts are recognised in the statement of profit and loss in the year in which the exchangerates change. Any profit or loss arising on cancellation or renewal of forward exchange contract is recognised as income or as expensefor the year.
10. Taxes on incomeTax expense comprises current income tax, deferred income tax and fringe benefit tax.
Current tax is determined as the amount of tax payable in respect of taxable income for the year.
Deferred income tax reflects the impact of current year timing differences between taxable income and accounting income for theyear and reversal of timing differences of earlier years. Deferred tax is measured based on the tax rates and the tax laws enacted orsubstantively enacted at the balance sheet date. Deferred tax assets are recognised only to the extent that there is reasonable/virtualcertainty, depending on the nature of the timing differences, that sufficient future taxable income will be available against which suchdeferred tax assets can be realised.
Fringe benefit tax is determined in accordance with applicable Income-tax laws.
11. Research and developmentResearch and development expenditure is charged to profit and loss account except capital expenditure, which is added to the costof respective fixed assets in the year in which it is incurred.
12. Leasesa) Operating Lease
Lease rentals in respect of assets taken on operating lease are charged to the profit and loss account on a straight-line basis overthe lease term.
b) Finance LeaseAssets acquired on finance lease which transfer risk and rewards of ownership to the Company are capitalized as assets by theCompany at the lower of fair value of the leased property or the present value of the related lease payments or where applicable,estimated fair value of such assets. Amortization of capitalised leased assets is computed on the Straight Line method over theuseful life of the assets. Lease rental payable is apportioned between principal and finance charge using the internal rate of returnmethod. The finance charge is allocated over the lease term so as to produce a constant periodic rate of interest on the remainingbalance of liability.
13. Employee benefitsExpenses and liabilities in respect of employee benefits are recorded in accordance with Accounting Standard 15 Employee Benefits(Revised 2005) “Revised AS 15”
SCHEDULES FORMING PART OF THE FINANCIAL STATEMENTSSCHEDULES FORMING PART OF THE FINANCIAL STATEMENTS
96 97
1. Basis of preparationThe financial statements are prepared on accrual basis under the historical cost convention, in accordance with the generally acceptedaccounting principles in India and to comply with the Accounting Standards referred to in sub-section (3C) of Section 211 of theCompanies Act, 1956 and the Rules framed thereunder. The accounting policies have been consistently applied by the Company andare consistent with those used in the previous year.
2. Use of estimates The preparation of financial statements in conformity with generally accepted accounting principles requires management to makeestimates and assumptions that affect the reported balances of assets and liabilities and the disclosure relating to contingent liabilitiesas at the date of financial statements and reported amount of income and expenses during the period. Although these estimates arebased upon management’s best knowledge of current events and actions, actual results could differ from those estimates. Any revisionto accounting estimates is recognised in the current and future periods.
3. Revenue recognitionSale of goodsRevenue from sale of goods is recognised when significant risks and rewards in respect of ownership of the goods are transferred tothe customer and is stated inclusive of excise duty and net of trade discounts, sales return and sales tax wherever applicable.
InterestInterest income is recognised on time proportion basis at the applicable rates.
4. Export benefit/incentiveBenefit under the advance license scheme and duty free replenishment certificate are accounted for at the time of purchase ofimported raw materials or sale of the license.
5. Fixed assetsTangibleTangible assets are stated at cost of acquisition less accumulated depreciation. Cost comprises the purchase price (net of cenvat creditavailed) and any attributable cost of bringing the asset to its working condition for its intended use. Expenditure on account ofmodification/ alteration in plant and machinery/building, which increases the future benefit from the existing asset beyond itspreviously assessed standard of performance, is capitalised.
IntangibleIntangible assets are recognised if and only if it is probable that the future economic benefits that are attributable to the assets willflow to the Company.
6. Depreciation and amortisationTangible
Depreciation on fixed assets has been provided on straight line method at the rates and in the manner prescribed under schedule XIV(“schedule”) to the Companies Act, 1956 except the following:
i. on assets acquired and put to use on or before 1 July 1987 in the glass division of the Company and on vehicles acquired till datein all the divisions of the Company, depreciation is provided on written down value method at the rates and in the mannerprescribed in the schedule;
ii. on furnaces (included in plant and machinery) having a cost of Rs. 529.89 million used in the glass division, depreciation isprovided on straight line method, as technically assessed from time to time, based on expected useful lives of the furnaces. Therate presently being 16.21% per annum which is the rate as prescribed in the schedule;
iii. cost of leasehold improvements is depreciated over the period of the lease.
Intangiblei. Pre-operative expenditure including borrowing cost (net of revenue, where applicable) incurred during the construction/trial run
of the project is allocated on an appropriate basis to fixed assets on Commissioning.
ii. Trademarks are being amortised over a period of ten years;
iii. Computer software (included in Computers in Schedule 5) are amortized over a period of six years;
7. Investments Investments that are readily realisable and intended to be held for not more than a year are classified as current investments. All otherinvestments are classified as long-term investments.
Current investments are valued at the lower of cost and fair value. Long-term investments are stated at cost. Provision is made for
19 SIGNIFICANT ACCOUNTING POLICIES 19 SIGNIFICANT ACCOUNTING POLICIES
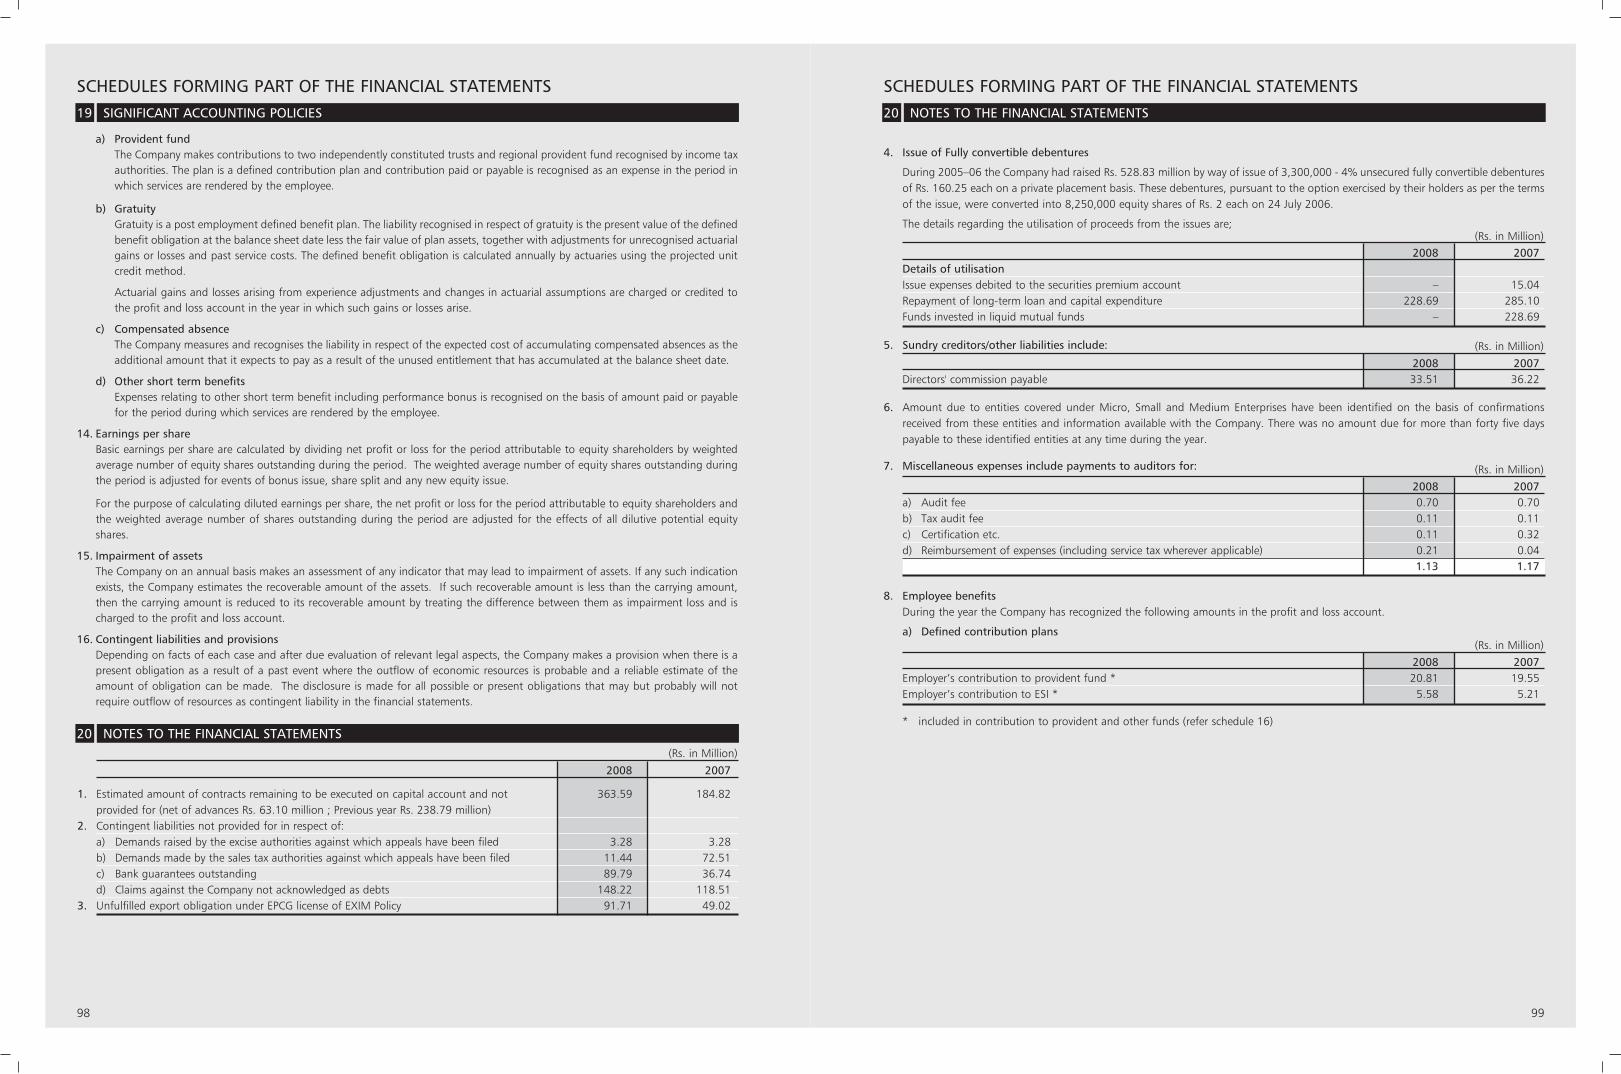
SCHEDULES FORMING PART OF THE FINANCIAL STATEMENTS
a) Provident fundThe Company makes contributions to two independently constituted trusts and regional provident fund recognised by income taxauthorities. The plan is a defined contribution plan and contribution paid or payable is recognised as an expense in the period inwhich services are rendered by the employee.
b) GratuityGratuity is a post employment defined benefit plan. The liability recognised in respect of gratuity is the present value of the definedbenefit obligation at the balance sheet date less the fair value of plan assets, together with adjustments for unrecognised actuarialgains or losses and past service costs. The defined benefit obligation is calculated annually by actuaries using the projected unitcredit method.
Actuarial gains and losses arising from experience adjustments and changes in actuarial assumptions are charged or credited tothe profit and loss account in the year in which such gains or losses arise.
c) Compensated absenceThe Company measures and recognises the liability in respect of the expected cost of accumulating compensated absences as theadditional amount that it expects to pay as a result of the unused entitlement that has accumulated at the balance sheet date.
d) Other short term benefitsExpenses relating to other short term benefit including performance bonus is recognised on the basis of amount paid or payablefor the period during which services are rendered by the employee.
14. Earnings per shareBasic earnings per share are calculated by dividing net profit or loss for the period attributable to equity shareholders by weightedaverage number of equity shares outstanding during the period. The weighted average number of equity shares outstanding duringthe period is adjusted for events of bonus issue, share split and any new equity issue.
For the purpose of calculating diluted earnings per share, the net profit or loss for the period attributable to equity shareholders andthe weighted average number of shares outstanding during the period are adjusted for the effects of all dilutive potential equityshares.
15. Impairment of assetsThe Company on an annual basis makes an assessment of any indicator that may lead to impairment of assets. If any such indicationexists, the Company estimates the recoverable amount of the assets. If such recoverable amount is less than the carrying amount,then the carrying amount is reduced to its recoverable amount by treating the difference between them as impairment loss and ischarged to the profit and loss account.
16. Contingent liabilities and provisionsDepending on facts of each case and after due evaluation of relevant legal aspects, the Company makes a provision when there is apresent obligation as a result of a past event where the outflow of economic resources is probable and a reliable estimate of theamount of obligation can be made. The disclosure is made for all possible or present obligations that may but probably will notrequire outflow of resources as contingent liability in the financial statements.
SCHEDULES FORMING PART OF THE FINANCIAL STATEMENTS
98 99
(Rs. in Million)
2008 2007
1. Estimated amount of contracts remaining to be executed on capital account and not 363.59 184.82provided for (net of advances Rs. 63.10 million ; Previous year Rs. 238.79 million)
2. Contingent liabilities not provided for in respect of:a) Demands raised by the excise authorities against which appeals have been filed 3.28 3.28b) Demands made by the sales tax authorities against which appeals have been filed 11.44 72.51c) Bank guarantees outstanding 89.79 36.74 d) Claims against the Company not acknowledged as debts 148.22 118.51
3. Unfulfilled export obligation under EPCG license of EXIM Policy 91.71 49.02
4. Issue of Fully convertible debentures
During 2005–06 the Company had raised Rs. 528.83 million by way of issue of 3,300,000 - 4% unsecured fully convertible debenturesof Rs. 160.25 each on a private placement basis. These debentures, pursuant to the option exercised by their holders as per the termsof the issue, were converted into 8,250,000 equity shares of Rs. 2 each on 24 July 2006.
The details regarding the utilisation of proceeds from the issues are;
6. Amount due to entities covered under Micro, Small and Medium Enterprises have been identified on the basis of confirmationsreceived from these entities and information available with the Company. There was no amount due for more than forty five dayspayable to these identified entities at any time during the year.
8. Employee benefitsDuring the year the Company has recognized the following amounts in the profit and loss account.
a) Defined contribution plans
(Rs. in Million)
(Rs. in Million)
2008 2007Details of utilisationIssue expenses debited to the securities premium account – 15.04 Repayment of long-term loan and capital expenditure 228.69 285.10 Funds invested in liquid mutual funds – 228.69
2008 2007Directors' commission payable 33.51 36.22
5. Sundry creditors/other liabilities include:
2008 2007a) Audit fee 0.70 0.70b) Tax audit fee 0.11 0.11c) Certification etc. 0.11 0.32d) Reimbursement of expenses (including service tax wherever applicable) 0.21 0.04
1.13 1.17
7. Miscellaneous expenses include payments to auditors for: (Rs. in Million)
2008 2007Employer’s contribution to provident fund * 20.81 19.55Employer’s contribution to ESI * 5.58 5.21
* included in contribution to provident and other funds (refer schedule 16)
(Rs. in Million)
19 SIGNIFICANT ACCOUNTING POLICIES 20 NOTES TO THE FINANCIAL STATEMENTS
20 NOTES TO THE FINANCIAL STATEMENTS
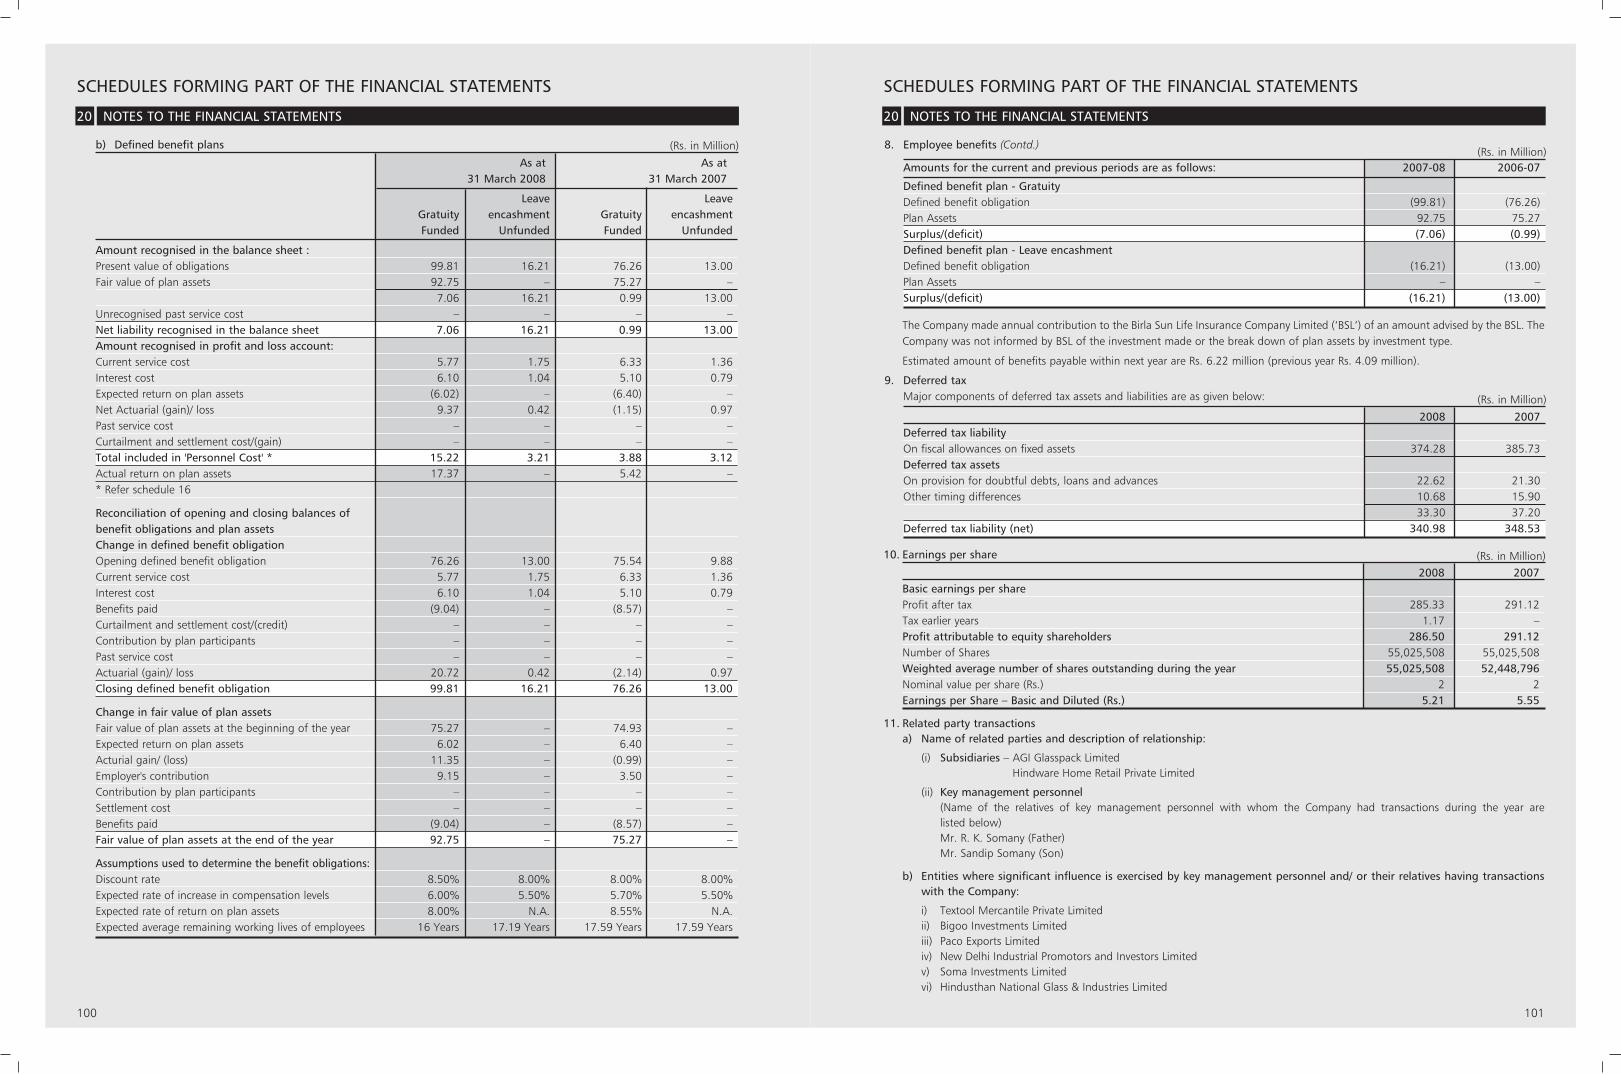
SCHEDULES FORMING PART OF THE FINANCIAL STATEMENTSSCHEDULES FORMING PART OF THE FINANCIAL STATEMENTS
100 101
As at As at31 March 2008 31 March 2007
Leave LeaveGratuity encashment Gratuity encashment Funded Unfunded Funded Unfunded
Amount recognised in the balance sheet :Present value of obligations 99.81 16.21 76.26 13.00 Fair value of plan assets 92.75 – 75.27 –
7.06 16.21 0.99 13.00 Unrecognised past service cost – – – –Net liability recognised in the balance sheet 7.06 16.21 0.99 13.00 Amount recognised in profit and loss account:Current service cost 5.77 1.75 6.33 1.36 Interest cost 6.10 1.04 5.10 0.79 Expected return on plan assets (6.02) – (6.40) – Net Actuarial (gain)/ loss 9.37 0.42 (1.15) 0.97 Past service cost – – – –Curtailment and settlement cost/(gain) – – – – Total included in 'Personnel Cost' * 15.22 3.21 3.88 3.12Actual return on plan assets 17.37 – 5.42 –* Refer schedule 16
Reconciliation of opening and closing balances of benefit obligations and plan assetsChange in defined benefit obligationOpening defined benefit obligation 76.26 13.00 75.54 9.88 Current service cost 5.77 1.75 6.33 1.36 Interest cost 6.10 1.04 5.10 0.79 Benefits paid (9.04) – (8.57) –Curtailment and settlement cost/(credit) – – – – Contribution by plan participants – – – –Past service cost – – – –Actuarial (gain)/ loss 20.72 0.42 (2.14) 0.97 Closing defined benefit obligation 99.81 16.21 76.26 13.00
Change in fair value of plan assetsFair value of plan assets at the beginning of the year 75.27 – 74.93 – Expected return on plan assets 6.02 – 6.40 – Acturial gain/ (loss) 11.35 – (0.99) –Employer's contribution 9.15 – 3.50 –Contribution by plan participants – – – –Settlement cost – – – – Benefits paid (9.04) – (8.57) – Fair value of plan assets at the end of the year 92.75 – 75.27 –
Assumptions used to determine the benefit obligations:Discount rate 8.50% 8.00% 8.00% 8.00%Expected rate of increase in compensation levels 6.00% 5.50% 5.70% 5.50%Expected rate of return on plan assets 8.00% N.A. 8.55% N.A.Expected average remaining working lives of employees 16 Years 17.19 Years 17.59 Years 17.59 Years
b) Defined benefit plans (Rs. in Million)
Amounts for the current and previous periods are as follows: 2007-08 2006-07
Defined benefit plan - GratuityDefined benefit obligation (99.81) (76.26)Plan Assets 92.75 75.27 Surplus/(deficit) (7.06) (0.99)Defined benefit plan - Leave encashmentDefined benefit obligation (16.21) (13.00)Plan Assets – –Surplus/(deficit) (16.21) (13.00)
8. Employee benefits (Contd.)(Rs. in Million)
2008 2007Deferred tax liabilityOn fiscal allowances on fixed assets 374.28 385.73Deferred tax assetsOn provision for doubtful debts, loans and advances 22.62 21.30Other timing differences 10.68 15.90
33.30 37.20Deferred tax liability (net) 340.98 348.53
9. Deferred taxMajor components of deferred tax assets and liabilities are as given below: (Rs. in Million)
(Rs. in Million)2008 2007
Basic earnings per shareProfit after tax 285.33 291.12Tax earlier years 1.17 –Profit attributable to equity shareholders 286.50 291.12Number of Shares 55,025,508 55,025,508Weighted average number of shares outstanding during the year 55,025,508 52,448,796Nominal value per share (Rs.) 2 2Earnings per Share – Basic and Diluted (Rs.) 5.21 5.55
The Company made annual contribution to the Birla Sun Life Insurance Company Limited (‘BSL’) of an amount advised by the BSL. TheCompany was not informed by BSL of the investment made or the break down of plan assets by investment type.
Estimated amount of benefits payable within next year are Rs. 6.22 million (previous year Rs. 4.09 million).
11. Related party transactionsa) Name of related parties and description of relationship:
(i) Subsidiaries – AGI Glasspack LimitedHindware Home Retail Private Limited
(ii) Key management personnel (Name of the relatives of key management personnel with whom the Company had transactions during the year are listed below)Mr. R. K. Somany (Father)Mr. Sandip Somany (Son)
b) Entities where significant influence is exercised by key management personnel and/ or their relatives having transactions with the Company:
i) Textool Mercantile Private Limitedii) Bigoo Investments Limitediii) Paco Exports Limitediv) New Delhi Industrial Promotors and Investors Limitedv) Soma Investments Limitedvi) Hindusthan National Glass & Industries Limited
10. Earnings per share
20 NOTES TO THE FINANCIAL STATEMENTS 20 NOTES TO THE FINANCIAL STATEMENTS
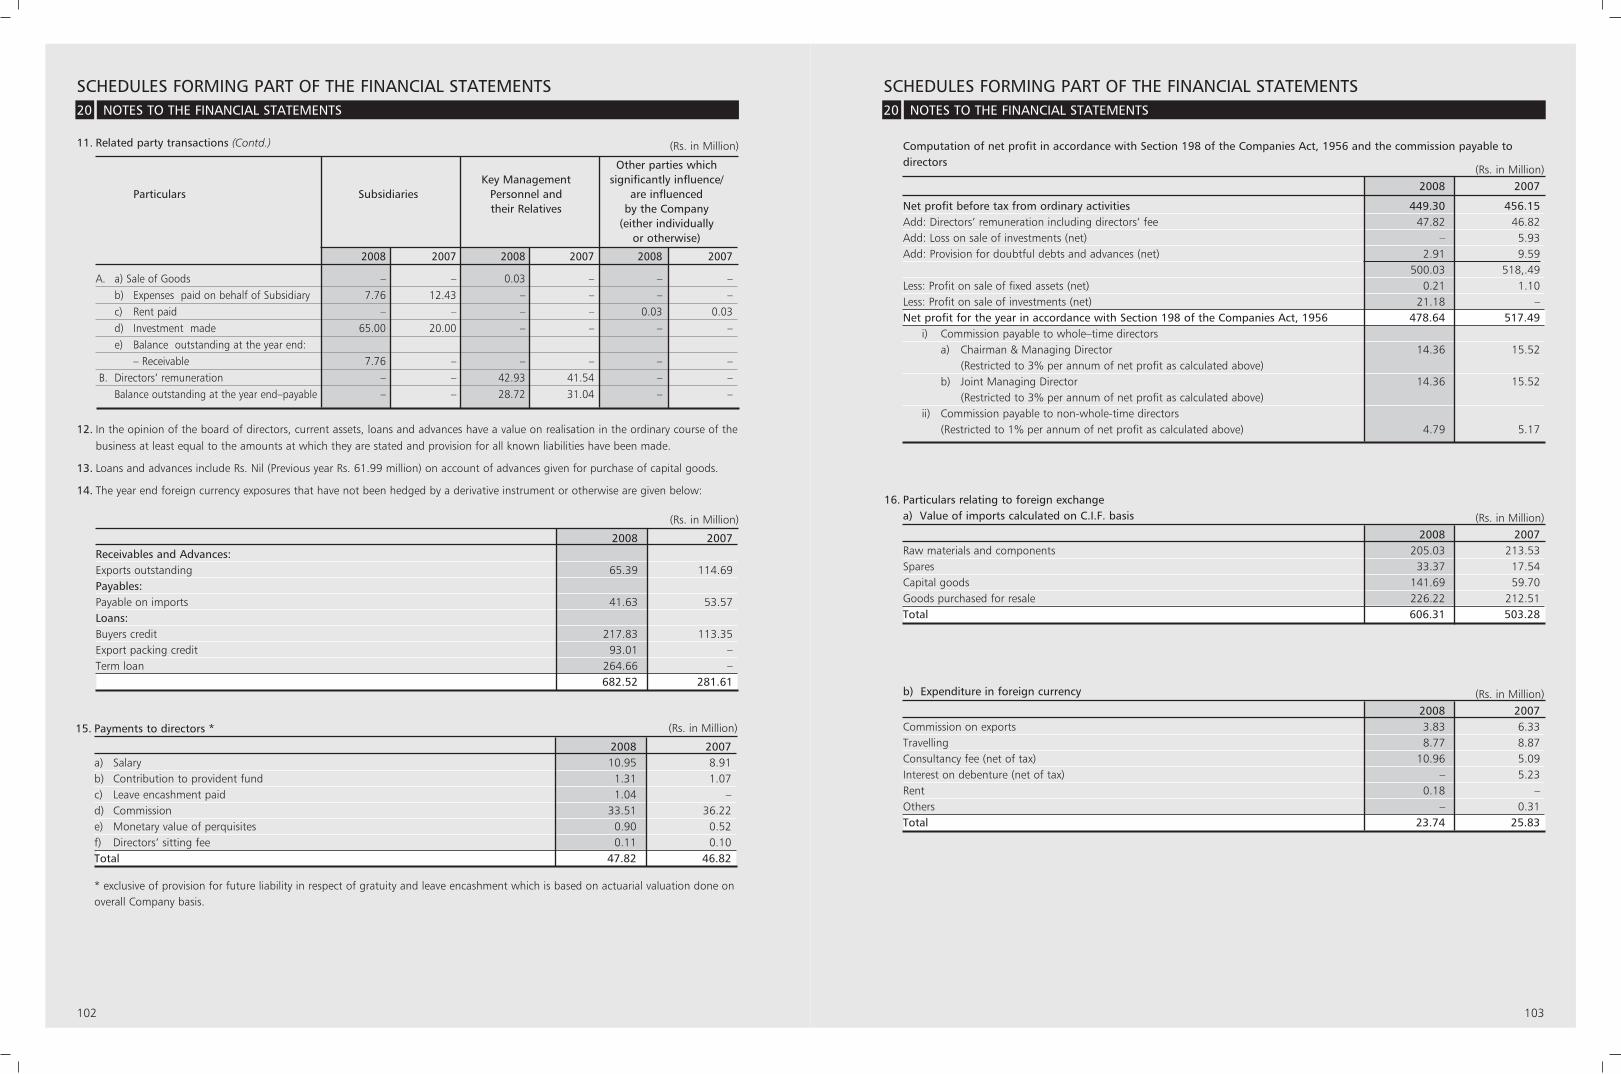
SCHEDULES FORMING PART OF THE FINANCIAL STATEMENTSSCHEDULES FORMING PART OF THE FINANCIAL STATEMENTS
102 103
(Rs. in Million)2008 2007
Raw materials and components 205.03 213.53Spares 33.37 17.54Capital goods 141.69 59.70Goods purchased for resale 226.22 212.51Total 606.31 503.28
16. Particulars relating to foreign exchangea) Value of imports calculated on C.I.F. basis
(Rs. in Million)2008 2007
Net profit before tax from ordinary activities 449.30 456.15Add: Directors’ remuneration including directors’ fee 47.82 46.82Add: Loss on sale of investments (net) – 5.93Add: Provision for doubtful debts and advances (net) 2.91 9.59
500.03 518,.49Less: Profit on sale of fixed assets (net) 0.21 1.10Less: Profit on sale of investments (net) 21.18 –Net profit for the year in accordance with Section 198 of the Companies Act, 1956 478.64 517.49
i) Commission payable to whole–time directorsa) Chairman & Managing Director 14.36 15.52
(Restricted to 3% per annum of net profit as calculated above)b) Joint Managing Director 14.36 15.52
(Restricted to 3% per annum of net profit as calculated above)ii) Commission payable to non-whole-time directors
(Restricted to 1% per annum of net profit as calculated above) 4.79 5.17
Computation of net profit in accordance with Section 198 of the Companies Act, 1956 and the commission payable to directors
(Rs. in Million)2008 2007
Commission on exports 3.83 6.33Travelling 8.77 8.87Consultancy fee (net of tax) 10.96 5.09Interest on debenture (net of tax) – 5.23Rent 0.18 –Others – 0.31Total 23.74 25.83
b) Expenditure in foreign currency
Other parties whichKey Management significantly influence/
Particulars Subsidiaries Personnel and are influencedtheir Relatives by the Company
(either individuallyor otherwise)
2008 2007 2008 2007 2008 2007
A. a) Sale of Goods – – 0.03 – – –b) Expenses paid on behalf of Subsidiary 7.76 12.43 – – – –c) Rent paid – – – – 0.03 0.03 d) Investment made 65.00 20.00 – – – –e) Balance outstanding at the year end:
– Receivable 7.76 – – – – –B. Directors’ remuneration – – 42.93 41.54 – –
Balance outstanding at the year end–payable – – 28.72 31.04 – –
11. Related party transactions (Contd.)
12. In the opinion of the board of directors, current assets, loans and advances have a value on realisation in the ordinary course of thebusiness at least equal to the amounts at which they are stated and provision for all known liabilities have been made.
13. Loans and advances include Rs. Nil (Previous year Rs. 61.99 million) on account of advances given for purchase of capital goods.
14. The year end foreign currency exposures that have not been hedged by a derivative instrument or otherwise are given below:
20 NOTES TO THE FINANCIAL STATEMENTS 20 NOTES TO THE FINANCIAL STATEMENTS
(Rs. in Million)
(Rs. in Million)
2008 2007Receivables and Advances:Exports outstanding 65.39 114.69Payables:Payable on imports 41.63 53.57Loans:Buyers credit 217.83 113.35Export packing credit 93.01 –Term loan 264.66 –
682.52 281.61
(Rs. in Million)
2008 2007a) Salary 10.95 8.91b) Contribution to provident fund 1.31 1.07c) Leave encashment paid 1.04 –d) Commission 33.51 36.22e) Monetary value of perquisites 0.90 0.52f) Directors’ sitting fee 0.11 0.10Total 47.82 46.82
* exclusive of provision for future liability in respect of gratuity and leave encashment which is based on actuarial valuation done onoverall Company basis.
15. Payments to directors *
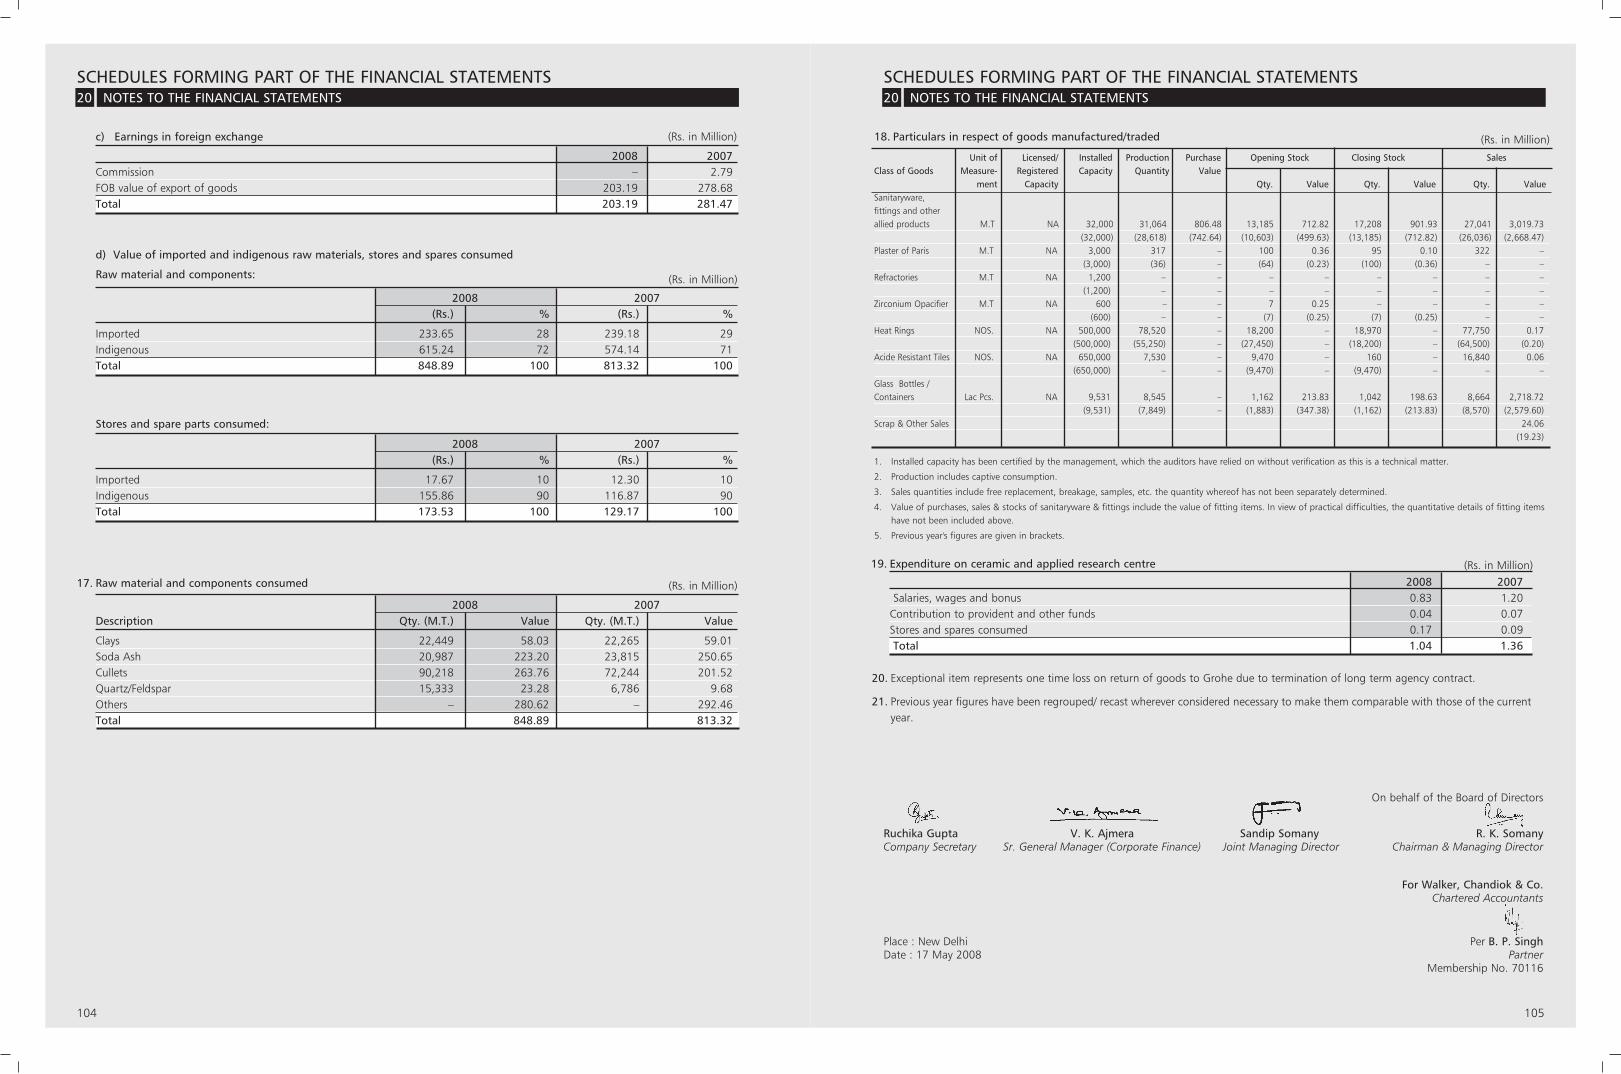
SCHEDULES FORMING PART OF THE FINANCIAL STATEMENTSSCHEDULES FORMING PART OF THE FINANCIAL STATEMENTS
104 105
20 NOTES TO THE FINANCIAL STATEMENTS 20 NOTES TO THE FINANCIAL STATEMENTS
2008 2007(Rs.) % (Rs.) %
Imported 233.65 28 239.18 29 Indigenous 615.24 72 574.14 71 Total 848.89 100 813.32 100
d) Value of imported and indigenous raw materials, stores and spares consumed
Raw material and components:
2008 2007Description Qty. (M.T.) Value Qty. (M.T.) Value
Clays 22,449 58.03 22,265 59.01Soda Ash 20,987 223.20 23,815 250.65Cullets 90,218 263.76 72,244 201.52Quartz/Feldspar 15,333 23.28 6,786 9.68Others – 280.62 – 292.46Total 848.89 813.32
17. Raw material and components consumed
2008 2007(Rs.) % (Rs.) %
Imported 17.67 10 12.30 10 Indigenous 155.86 90 116.87 90 Total 173.53 100 129.17 100
Stores and spare parts consumed:
(Rs. in Million)
(Rs. in Million)
2008 2007Commission – 2.79FOB value of export of goods 203.19 278.68Total 203.19 281.47
c) Earnings in foreign exchange (Rs. in Million)
Unit of Licensed/ Installed Production Purchase Opening Stock Closing Stock SalesClass of Goods Measure- Registered Capacity Quantity Value
ment Capacity Qty. Value Qty. Value Qty. ValueSanitaryware, fittings and other allied products M.T NA 32,000 31,064 806.48 13,185 712.82 17,208 901.93 27,041 3,019.73
(32,000) (28,618) (742.64) (10,603) (499.63) (13,185) (712.82) (26,036) (2,668.47)Plaster of Paris M.T NA 3,000 317 – 100 0.36 95 0.10 322 –
(3,000) (36) – (64) (0.23) (100) (0.36) – – Refractories M.T NA 1,200 – – – – – – – –
(1,200) – – – – – – – – Zirconium Opacifier M.T NA 600 – – 7 0.25 – – – –
(600) – – (7) (0.25) (7) (0.25) – – Heat Rings NOS. NA 500,000 78,520 – 18,200 – 18,970 – 77,750 0.17
(500,000) (55,250) – (27,450) – (18,200) – (64,500) (0.20)Acide Resistant Tiles NOS. NA 650,000 7,530 – 9,470 – 160 – 16,840 0.06
(650,000) – – (9,470) – (9,470) – – – Glass Bottles /Containers Lac Pcs. NA 9,531 8,545 – 1,162 213.83 1,042 198.63 8,664 2,718.72
(9,531) (7,849) – (1,883) (347.38) (1,162) (213.83) (8,570) (2,579.60)Scrap & Other Sales 24.06
(19.23)
1. Installed capacity has been certified by the management, which the auditors have relied on without verification as this is a technical matter.
2. Production includes captive consumption.
3. Sales quantities include free replacement, breakage, samples, etc. the quantity whereof has not been separately determined.
4. Value of purchases, sales & stocks of sanitaryware & fittings include the value of fitting items. In view of practical difficulties, the quantitative details of fitting items have not been included above.
5. Previous year's figures are given in brackets.
18. Particulars in respect of goods manufactured/traded (Rs. in Million)
20. Exceptional item represents one time loss on return of goods to Grohe due to termination of long term agency contract.
21. Previous year figures have been regrouped/ recast wherever considered necessary to make them comparable with those of the currentyear.
(Rs. in Million)2008 2007
Salaries, wages and bonus 0.83 1.20Contribution to provident and other funds 0.04 0.07Stores and spares consumed 0.17 0.09Total 1.04 1.36
19. Expenditure on ceramic and applied research centre
On behalf of the Board of Directors
Ruchika Gupta V. K. Ajmera Sandip Somany R. K. SomanyCompany Secretary Sr. General Manager (Corporate Finance) Joint Managing Director Chairman & Managing Director
For Walker, Chandiok & Co.Chartered Accountants
Place : New Delhi Per B. P. SinghDate : 17 May 2008 Partner
Membership No. 70116
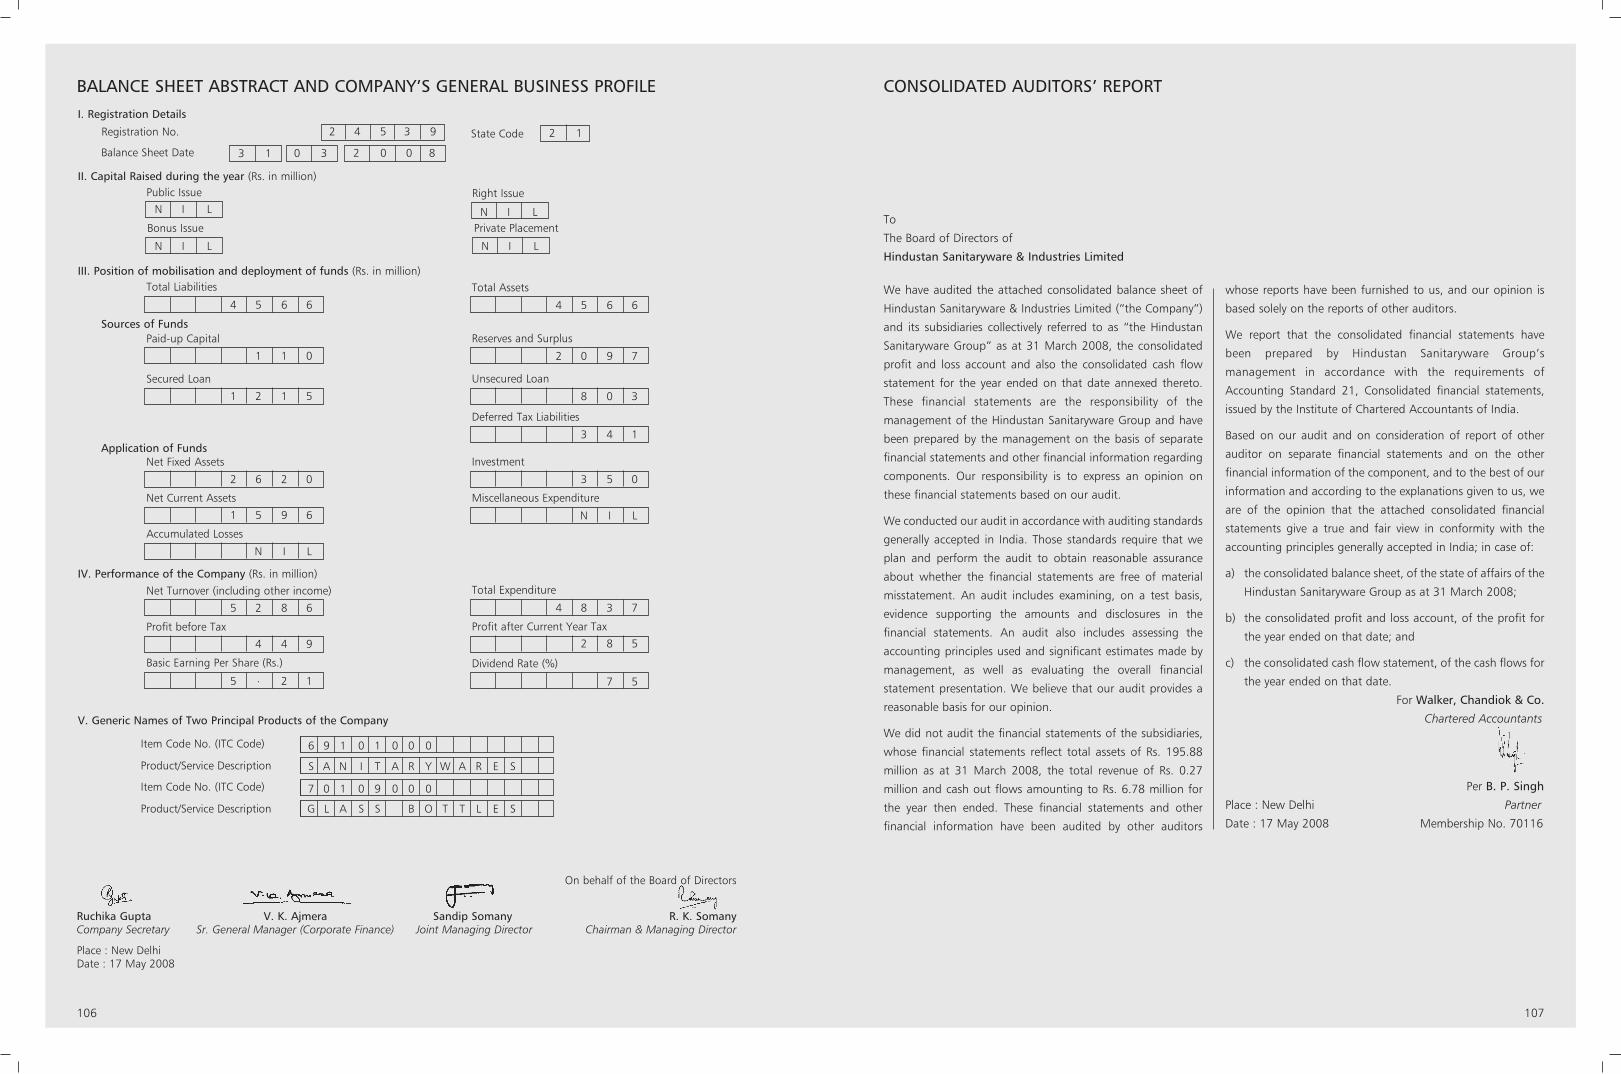
BALANCE SHEET ABSTRACT AND COMPANY’S GENERAL BUSINESS PROFILE
106 107
Public Issue
2 4 5 3 9
N I L
N I L
Bonus Issue
N I L
Private Placement
Right Issue
N I L
3 1 0 3
Registration No. State Code
Balance Sheet Date
I. Registration Details
II. Capital Raised during the year (Rs. in million)
Total Liabilities
4 5 6 6
III. Position of mobilisation and deployment of funds (Rs. in million)
2 0 0 8
2 1
Total Assets
4 5 6 6
Paid-up CapitalSources of Funds
1 1 0
Reserves and Surplus
2 0 9 7
Secured Loan
1 2 1 5
Unsecured Loan
8 0 3
Deferred Tax Liabilities
3 4 1
Net Fixed AssetsApplication of Funds
2 6 2 0
Investment
3 5 0
Net Current Assets
1 5 9 6
Miscellaneous Expenditure
N I L
Accumulated Losses
N I L
IV. Performance of the Company (Rs. in million)
Item Code No. (ITC Code)
Product/Service Description
V. Generic Names of Two Principal Products of the Company
Net Turnover (including other income)
5 2 8 6
Total Expenditure
4 8 3 7
Profit before Tax
4 4 9
Profit after Current Year Tax
2 8 5
Basic Earning Per Share (Rs.)
5 . 2 1
Dividend Rate (%)
7 5
6 9 1 0 1 0 0 0
S A N I T A R Y W A R E S
Item Code No. (ITC Code)
Product/Service Description
7 0 1 0 9 0 0 0
G L A S S B O T T L E S
CONSOLIDATED AUDITORS’ REPORT
We have audited the attached consolidated balance sheet of
Hindustan Sanitaryware & Industries Limited (“the Company”)
and its subsidiaries collectively referred to as “the Hindustan
Sanitaryware Group” as at 31 March 2008, the consolidated
profit and loss account and also the consolidated cash flow
statement for the year ended on that date annexed thereto.
These financial statements are the responsibility of the
management of the Hindustan Sanitaryware Group and have
been prepared by the management on the basis of separate
financial statements and other financial information regarding
components. Our responsibility is to express an opinion on
these financial statements based on our audit.
We conducted our audit in accordance with auditing standards
generally accepted in India. Those standards require that we
plan and perform the audit to obtain reasonable assurance
about whether the financial statements are free of material
misstatement. An audit includes examining, on a test basis,
evidence supporting the amounts and disclosures in the
financial statements. An audit also includes assessing the
accounting principles used and significant estimates made by
management, as well as evaluating the overall financial
statement presentation. We believe that our audit provides a
reasonable basis for our opinion.
We did not audit the financial statements of the subsidiaries,
whose financial statements reflect total assets of Rs. 195.88
million as at 31 March 2008, the total revenue of Rs. 0.27
million and cash out flows amounting to Rs. 6.78 million for
the year then ended. These financial statements and other
financial information have been audited by other auditors
whose reports have been furnished to us, and our opinion is
based solely on the reports of other auditors.
We report that the consolidated financial statements have
been prepared by Hindustan Sanitaryware Group’s
management in accordance with the requirements of
Accounting Standard 21, Consolidated financial statements,
issued by the Institute of Chartered Accountants of India.
Based on our audit and on consideration of report of other
auditor on separate financial statements and on the other
financial information of the component, and to the best of our
information and according to the explanations given to us, we
are of the opinion that the attached consolidated financial
statements give a true and fair view in conformity with the
accounting principles generally accepted in India; in case of:
a) the consolidated balance sheet, of the state of affairs of the
Hindustan Sanitaryware Group as at 31 March 2008;
b) the consolidated profit and loss account, of the profit for
the year ended on that date; and
c) the consolidated cash flow statement, of the cash flows for
the year ended on that date.
For Walker, Chandiok & Co.
Chartered Accountants
Per B. P. Singh
Place : New Delhi Partner
Date : 17 May 2008 Membership No. 70116
To
The Board of Directors of
Hindustan Sanitaryware & Industries Limited
On behalf of the Board of Directors
Ruchika Gupta V. K. Ajmera Sandip Somany R. K. SomanyCompany Secretary Sr. General Manager (Corporate Finance) Joint Managing Director Chairman & Managing Director
Place : New DelhiDate : 17 May 2008

108 109
CONSOLIDATED BALANCE SHEET(Rs. in Million)
Schedule As at As at31 March 2008 31 March 2007
SOURCES OF FUNDSShareholders' fundShare Capital 1 110.05 110.05
Reserves and surplus 2 2,065.62 1,894.16
2,175.67 2,004.21
Loan fundsSecured 3 1,229.96 1,649.86
Unsecured 4 803.37 279.45
2,033.33 1,929.31
Deferred tax liability (net) (Refer note 9 on Schedule 21) 331.58 348.53
4,540.58 4,282.05 APPLICATION OF FUNDSFixed assets 5
Gross block 4,571.99 4,187.12
Less: Accumulated depreciation and amortisation 2,092.58 1,837.44
Net block 2,479.41 2,349.68
Capital work-in-progress (including spares and capital advances) 294.77 220.29
2,774.18 2,569.97
Investments 6 137.24 336.27
Current assets, loans and advancesInventories 7 1,470.44 1,218.18
Sundry debtors 8 909.58 770.39
Cash and bank balances 9 122.05 93.66
Other current assets 10 1.00 0.91
Loans and advances 11 249.68 272.76
2,752.75 2,355.90
Less:
Current liabilities and provisions 12
a) Current liabilities 981.15 891.06
b) Provisions 142.44 89.08
1,123.59 980.14
Net current assets 1,629.16 1,375.76
Miscellaneous expenditure (To the extent not written off or adjusted) 13 – 0.05
4,540.58 4,282.05 Significant accounting policies 20
Notes to the financial statements 21
CONSOLIDATED PROFIT AND LOSS ACCOUNT(Rs. in Million)
Schedule Year ended Year ended31 March 2008 31 March 2007
INCOMEIncome from operations 14 5,762.77 5,267.50 Less: Excise duty on sale of goods 554.36 489.86
5,208.41 4,777.64 Other income 15 77.88 62.26 Increase in stocks 16 230.40 95.37
5,516.69 4,935.27 EXPENDITUREGoods purchased for resale 839.31 742.64 Personnel cost 17 574.30 494.76 Manufacturing, selling and general expenses 18 3,242.02 2,863.53
4,655.63 4,100.93 Profit before interest, depreciation, amortisation and tax 861.06 834.34 Interest 19 163.37 142.54 Depreciation and amortisation 5 264.18 248.25 Profit before tax and exceptional items 433.51 443.55 Loss in respect of exceptional transaction 11.85 – (Refer note 15 on Schedule 21)Profit before tax 421.66 443.55 Tax expense
Current tax 161.50 125.43 Deferred tax (16.96) 31.47 Fringe benefit tax 10.26 8.13
Profit after tax 266.86 278.52 Income tax for earlier years 1.17 – Transferred from Debenture redemption reserve – 25.83
268.03 304.35 Balance transferred from previous year 743.63 560.32 Balance available for appropriation 1,011.66 864.67 APPROPRIATIONSTransferred to general reserve 30.00 30.00 Interim dividend paid on equity shares – 23.38 Tax paid on interim dividend – 3.28 Proposed dividend on equity shares 82.54 55.03 Tax on proposed dividend 14.03 9.35 Balance carried to balance sheet 885.09 743.63
1,011.66 864.67 Earnings per share - Basic and Diluted (Rs.) 4.87 5.31 (Refer note 12 on Schedule 21)Significant accounting policies 20Notes to the financial statements 21
The schedules referred to above form an integral part of the Consolidated financial statementsOn behalf of the Board of Directors
Ruchika Gupta V. K. Ajmera Sandip Somany R. K. SomanyCompany Secretary Sr. General Manager (Corporate Finance) Joint Managing Director Chairman & Managing Director
This is the Consolidated Balance Sheet referred to in our report of even date.
For Walker, Chandiok & Co.Chartered Accountants
Place : New Delhi Per B. P. SinghDate : 17 May 2008 Partner
Membership No. 70116
The schedules referred to above form an integral part of the Consolidated financial statementsOn behalf of the Board of Directors
Ruchika Gupta V. K. Ajmera Sandip Somany R. K. SomanyCompany Secretary Sr. General Manager (Corporate Finance) Joint Managing Director Chairman & Managing Director
This is the Consolidated Profit and Loss Account referred to in our report of even date.
For Walker, Chandiok & Co.Chartered Accountants
Place : New Delhi Per B. P. SinghDate : 17 May 2008 Partner
Membership No. 70116

110 111
CONSOLIDATED CASH FLOW STATEMENT CONSOLIDATED CASH FLOW STATEMENT (Contd.)(Rs. in Million)
Year ended Year ended
31 March 2008 31 March 2007
C. CASH FLOW FROM FINANCING ACTIVITIES
Proceeds from long term borrowings – 400.00
Repayment of long term borrowings (76.23) (259.31)
Proceeds from short term borrowings (net) 180.25 (76.32)
Interest paid (164.75) (143.73)
Dividend paid (54.84) (83.68)
Taxes on dividend (9.35) (11.81)
Net cash from financing activities (124.92) (174.85)
Net increase in cash and cash equivalents 14.01 (32.31)
Cash and cash equivalents in the beginning 71.24 103.47
Cash and cash equivalents on acquisition of subsidiary – 0.08
Cash and cash equivalents at the close 85.25 71.24
Note:
Cash and cash equivalents include:
Cash and cheques in hand and remittances in transit 67.35 40.27
Balances with bank 17.90 30.97
Cash and cash equivalents 85.25 71.24
Balances in fixed deposit accounts – pledged 33.76 19.58
Balances in unpaid dividend accounts 3.04 2.84
Balance in post office savings account (pledged)* – –
Balance with bank not considered as cash equivalents 36.80 22.42
Cash and bank balances as per Balance Sheet 122.05 93.66
* Rounded off to Nil
(Rs. in Million)Year ended Year ended
31 March 2008 31 March 2007
A. CASH FLOW FROM OPERATING ACTIVITIES
Net Profit before tax 421.66 443.55
Adjustments for:
Depreciation and amortisation 264.18 248.25
Miscellaneous expenditure 0.05 0.06
(Profit)/loss on fixed assets discarded/sold (net) (0.21) (1.10)
Interest expense 163.37 142.54
Dividend (1.30) (10.90)
Interest income (7.65) (4.14)
(Profit)/loss on sale of investments (net) (21.39) 5.93
Sundry balances and liabilities no longer required written back (8.16) (7.66)
Dimunition in the value of current investments 0.36 –
Bad debts written off 0.98 2.14
Provision for doubtful debts and advances 2.91 9.69
Operating Profit before working capital changes 814.81 828.36
Adjustments for :
Inventories (252.26) (135.45)
Trade/other receivables (122.77) 2.83
Trade/other payables 103.54 68.32
Cash generated from operations 543.31 764.06
Direct taxes paid (153.53) (151.17)
Net cash from operating activities 389.78 612.89
B. CASH FLOW FROM INVESTING ACTIVITIES
Purchase of fixed assets including capital work in progress (477.03) (613.77)
Proceeds from sale of fixed assets 8.83 11.40
Purchase of investments (37.55) (228.87)
Sale proceeds of investments 257.61 336.57
Movement in restricted cash equivalent (14.36) (1.83)
Interest received 8.41 15.12
Dividend received 1.30 10.90
Loans and advances recovered 1.94 0.13
Net cash used in investing activities (250.85) (470.35)
On behalf of the Board of Directors
Ruchika Gupta V. K. Ajmera Sandip Somany R. K. SomanyCompany Secretary Sr. General Manager (Corporate Finance) Joint Managing Director Chairman & Managing Director
This is the Consolidated Cash Flow Statement referred to in our report of even date.
For Walker, Chandiok & Co.Chartered Accountants
Place : New Delhi Per B. P. SinghDate : 17 May 2008 Partner
Membership No. 70116
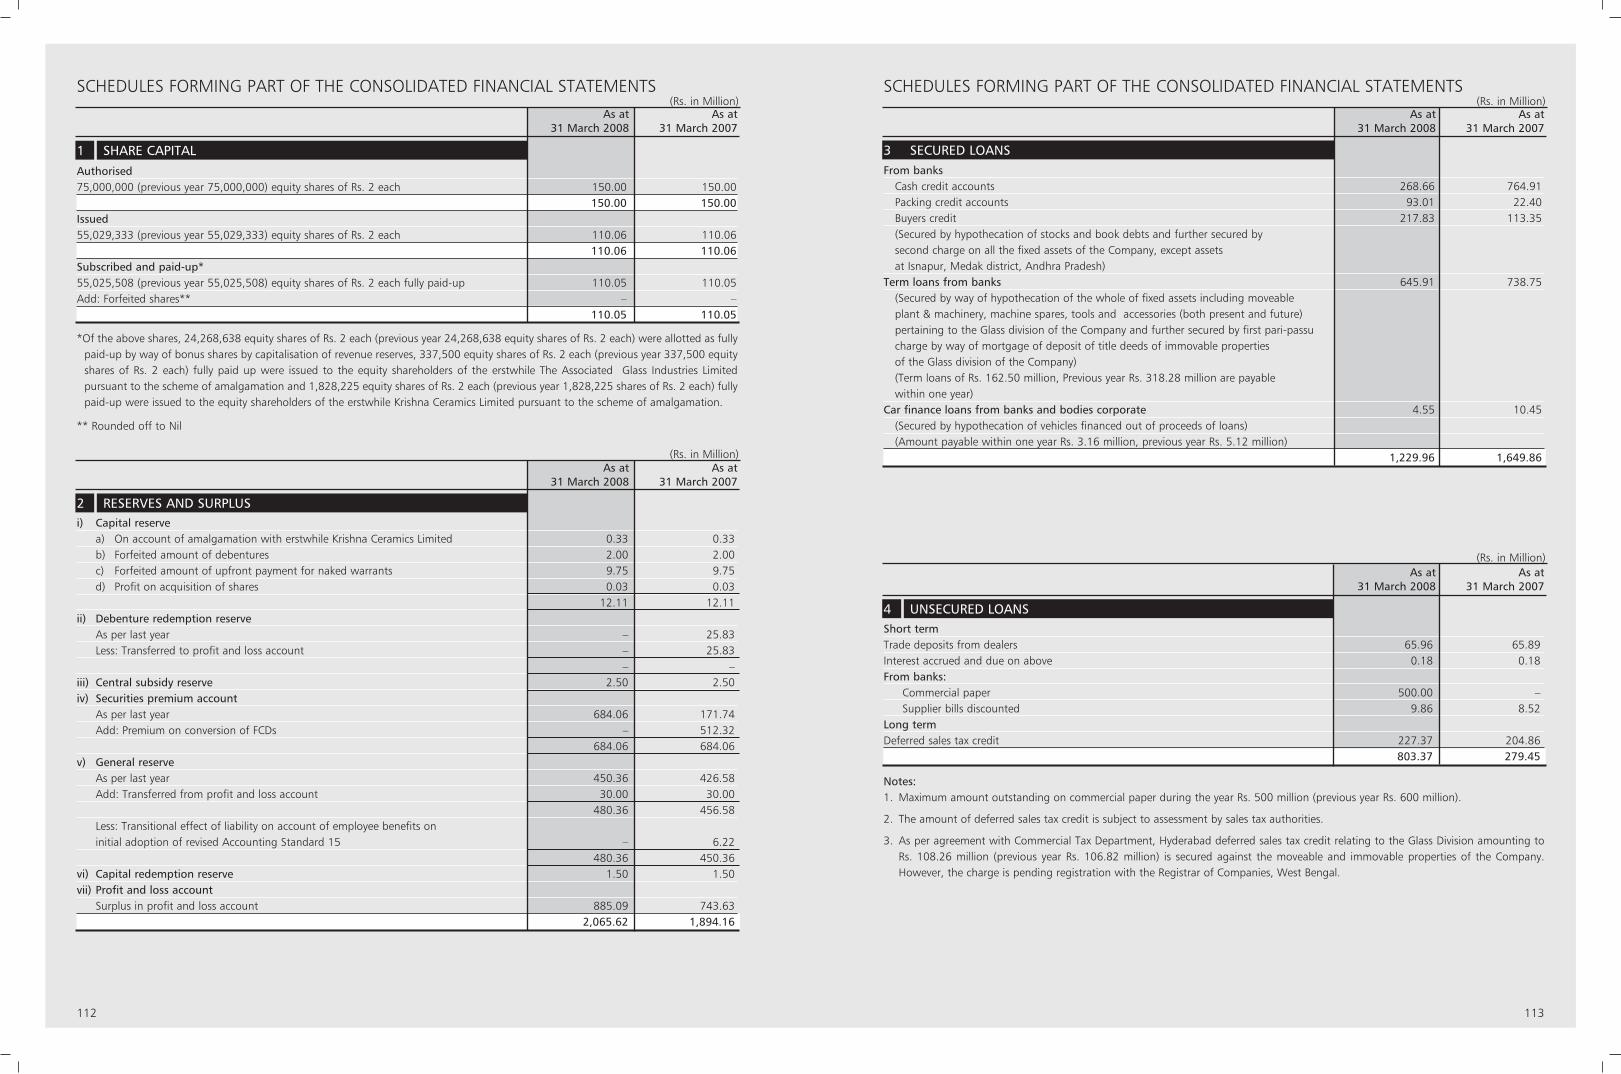
112 113
SCHEDULES FORMING PART OF THE CONSOLIDATED FINANCIAL STATEMENTS SCHEDULES FORMING PART OF THE CONSOLIDATED FINANCIAL STATEMENTS(Rs. in Million)
As at As at31 March 2008 31 March 2007
Authorised75,000,000 (previous year 75,000,000) equity shares of Rs. 2 each 150.00 150.00
150.00 150.00Issued 55,029,333 (previous year 55,029,333) equity shares of Rs. 2 each 110.06 110.06
110.06 110.06 Subscribed and paid-up*55,025,508 (previous year 55,025,508) equity shares of Rs. 2 each fully paid-up 110.05 110.05 Add: Forfeited shares** – –
110.05 110.05
*Of the above shares, 24,268,638 equity shares of Rs. 2 each (previous year 24,268,638 equity shares of Rs. 2 each) were allotted as fullypaid-up by way of bonus shares by capitalisation of revenue reserves, 337,500 equity shares of Rs. 2 each (previous year 337,500 equityshares of Rs. 2 each) fully paid up were issued to the equity shareholders of the erstwhile The Associated Glass Industries Limitedpursuant to the scheme of amalgamation and 1,828,225 equity shares of Rs. 2 each (previous year 1,828,225 shares of Rs. 2 each) fullypaid-up were issued to the equity shareholders of the erstwhile Krishna Ceramics Limited pursuant to the scheme of amalgamation.
** Rounded off to Nil
1 SHARE CAPITAL
(Rs. in Million)As at As at
31 March 2008 31 March 2007
Short termTrade deposits from dealers 65.96 65.89 Interest accrued and due on above 0.18 0.18 From banks:
Commercial paper 500.00 –Supplier bills discounted 9.86 8.52
Long termDeferred sales tax credit 227.37 204.86
803.37 279.45
4 UNSECURED LOANS
(Rs. in Million)As at As at
31 March 2008 31 March 2007
From banksCash credit accounts 268.66 764.91Packing credit accounts 93.01 22.40Buyers credit 217.83 113.35(Secured by hypothecation of stocks and book debts and further secured by second charge on all the fixed assets of the Company, except assets at Isnapur, Medak district, Andhra Pradesh)
Term loans from banks 645.91 738.75(Secured by way of hypothecation of the whole of fixed assets including moveable plant & machinery, machine spares, tools and accessories (both present and future) pertaining to the Glass division of the Company and further secured by first pari-passu charge by way of mortgage of deposit of title deeds of immovable properties of the Glass division of the Company)(Term loans of Rs. 162.50 million, Previous year Rs. 318.28 million are payable within one year)
Car finance loans from banks and bodies corporate 4.55 10.45(Secured by hypothecation of vehicles financed out of proceeds of loans)(Amount payable within one year Rs. 3.16 million, previous year Rs. 5.12 million)
1,229.96 1,649.86
Notes:1. Maximum amount outstanding on commercial paper during the year Rs. 500 million (previous year Rs. 600 million).
2. The amount of deferred sales tax credit is subject to assessment by sales tax authorities.
3. As per agreement with Commercial Tax Department, Hyderabad deferred sales tax credit relating to the Glass Division amounting to Rs. 108.26 million (previous year Rs. 106.82 million) is secured against the moveable and immovable properties of the Company.However, the charge is pending registration with the Registrar of Companies, West Bengal.
3 SECURED LOANS
(Rs. in Million)As at As at
31 March 2008 31 March 2007
i) Capital reservea) On account of amalgamation with erstwhile Krishna Ceramics Limited 0.33 0.33 b) Forfeited amount of debentures 2.00 2.00 c) Forfeited amount of upfront payment for naked warrants 9.75 9.75 d) Profit on acquisition of shares 0.03 0.03
12.11 12.11 ii) Debenture redemption reserve
As per last year – 25.83 Less: Transferred to profit and loss account – 25.83
– – iii) Central subsidy reserve 2.50 2.50 iv) Securities premium account
As per last year 684.06 171.74 Add: Premium on conversion of FCDs – 512.32
684.06 684.06 v) General reserve
As per last year 450.36 426.58 Add: Transferred from profit and loss account 30.00 30.00
480.36 456.58 Less: Transitional effect of liability on account of employee benefits on initial adoption of revised Accounting Standard 15 – 6.22
480.36 450.36 vi) Capital redemption reserve 1.50 1.50 vii) Profit and loss account
Surplus in profit and loss account 885.09 743.63 2,065.62 1,894.16
2 RESERVES AND SURPLUS
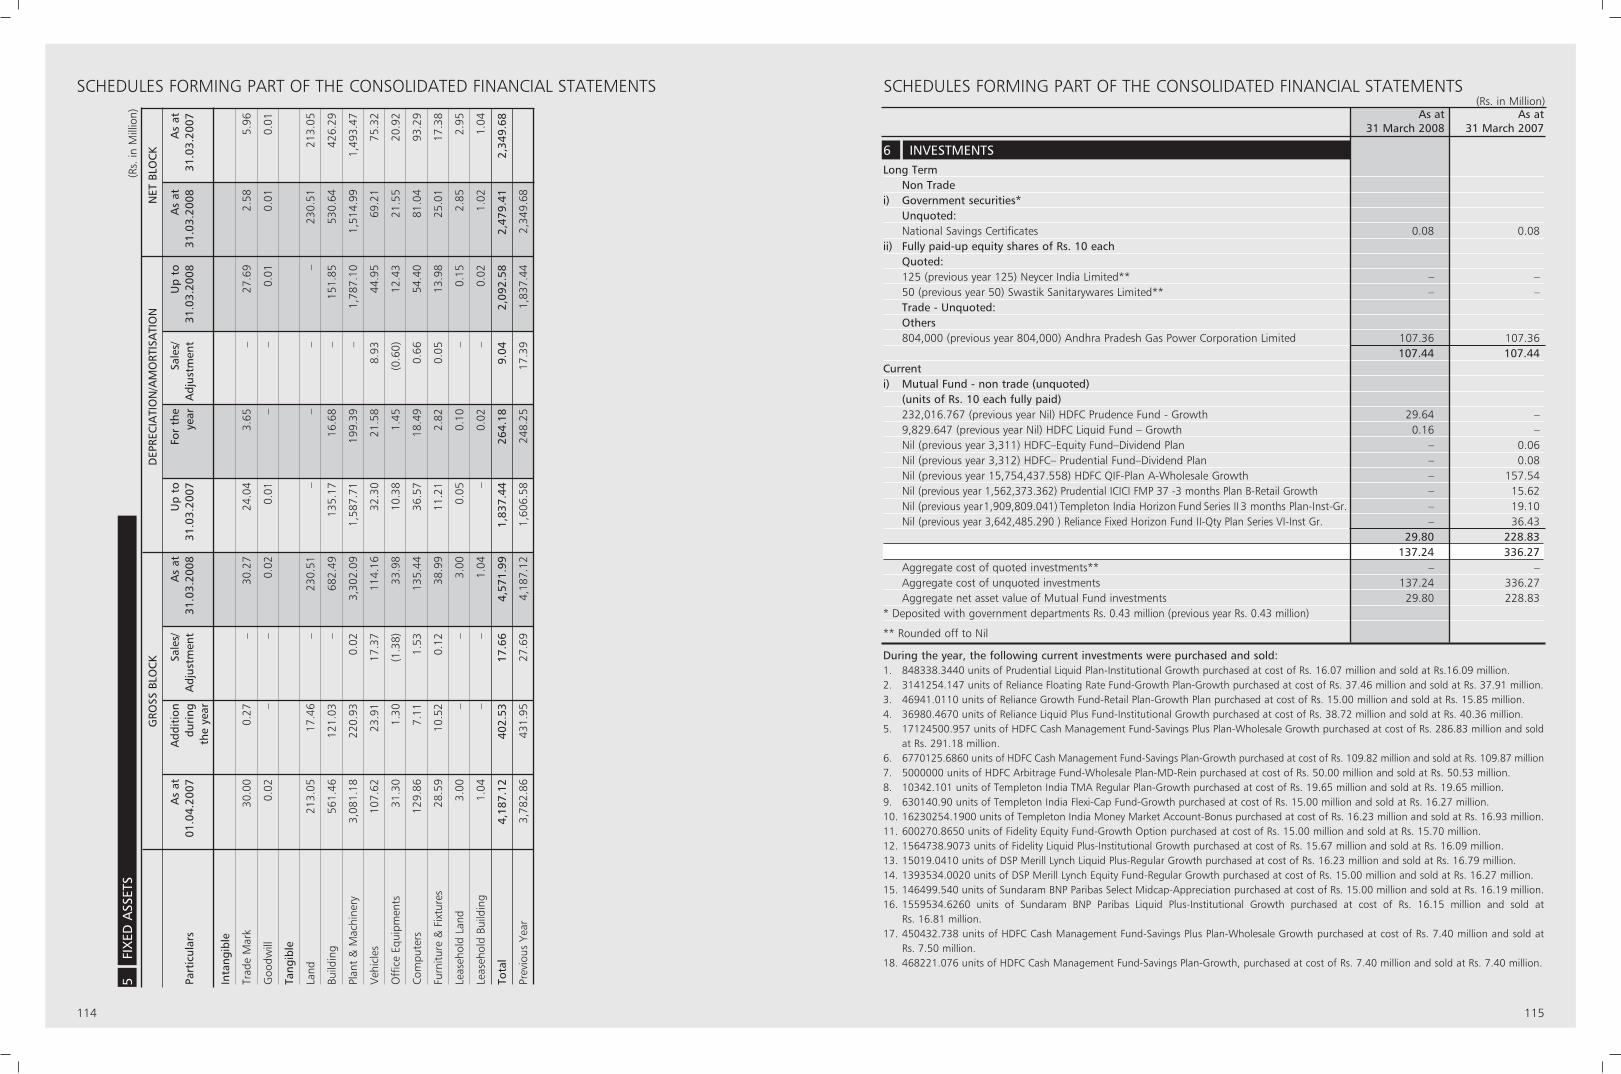
114 115
SCHEDULES FORMING PART OF THE CONSOLIDATED FINANCIAL STATEMENTS SCHEDULES FORMING PART OF THE CONSOLIDATED FINANCIAL STATEMENTS
(Rs.
in M
illio
n)
GRO
SS B
LOC
KD
EPRE
CIA
TIO
N/A
MO
RTIS
ATI
ON
NET
BLO
CK
As
atA
ddit
ion
Sale
s/A
s at
Up
to
For
the
Sale
s/U
p to
As
atA
s at
Part
icul
ars
01.0
4.20
07du
ring
Adj
ustm
ent
31.0
3.20
0831
.03.
2007
year
Adj
ustm
ent
31.0
3.20
0831
.03.
2008
31.0
3.20
07th
e ye
ar
Inta
ngib
le
Trad
e M
ark
30.0
0 0.
27
–
30.2
7 24
.04
3.65
–
27
.69
2.58
5.
96
Goo
dwill
0.02
–
–
0.
02
0.01
–
–
0.
01
0.01
0.
01
Tang
ible
Land
213.
05
17.4
6 –
23
0.51
–
–
–
–
23
0.51
21
3.05
Build
ing
561.
46
121.
03
–
682.
49
135.
17
16.6
8 –
15
1.85
53
0.64
42
6.29
Plan
t &
Mac
hine
ry3,
081.
18
220.
93
0.02
3,
302.
09
1,58
7.71
19
9.39
–
1,
787.
10
1,51
4.99
1,
493.
47
Veh
icle
s10
7.62
23
.91
17.3
7 11
4.16
32
.30
21.5
8 8.
93
44.9
5 69
.21
75.3
2
Off
ice
Equi
pmen
ts31
.30
1.30
(1
.38)
33.9
8 10
.38
1.45
(0
.60)
12.4
3 21
.55
20.9
2
Com
pute
rs
129.
86
7.11
1.
53
135.
44
36.5
7 18
.49
0.66
54
.40
81.0
4 93
.29
Furn
iture
& F
ixtu
res
28.5
9 10
.52
0.12
38
.99
11.2
1 2.
82
0.05
13
.98
25.0
1 17
.38
Leas
ehol
d La
nd3.
00
–
–
3.00
0.
05
0.10
–
0.
15
2.85
2.
95
Leas
ehol
d Bu
ildin
g1.
04
–
–
1.04
–
0.
02
–
0.02
1.
02
1.04
Tota
l4,
187.
12
402.
53
17.6
6 4,
571.
99
1,83
7.44
26
4.18
9.
04
2,09
2.58
2,
479.
41
2,34
9.68
Prev
ious
Yea
r3,
782.
86
431.
95
27.6
9 4,
187.
12
1,60
6.58
24
8.25
17
.39
1,83
7.44
2,
349.
68
5FI
XED
ASS
ETS
(Rs. in Million)As at As at
31 March 2008 31 March 2007
Long TermNon Trade
i) Government securities*Unquoted:National Savings Certificates 0.08 0.08
ii) Fully paid-up equity shares of Rs. 10 each Quoted:125 (previous year 125) Neycer India Limited** – –50 (previous year 50) Swastik Sanitarywares Limited** – –Trade - Unquoted:Others804,000 (previous year 804,000) Andhra Pradesh Gas Power Corporation Limited 107.36 107.36
107.44 107.44 Currenti) Mutual Fund - non trade (unquoted)
(units of Rs. 10 each fully paid)232,016.767 (previous year Nil) HDFC Prudence Fund - Growth 29.64 – 9,829.647 (previous year Nil) HDFC Liquid Fund – Growth 0.16 – Nil (previous year 3,311) HDFC–Equity Fund–Dividend Plan – 0.06 Nil (previous year 3,312) HDFC– Prudential Fund–Dividend Plan – 0.08 Nil (previous year 15,754,437.558) HDFC QIF-Plan A-Wholesale Growth – 157.54 Nil (previous year 1,562,373.362) Prudential ICICI FMP 37 -3 months Plan B-Retail Growth – 15.62 Nil (previous year1,909,809.041) Templeton India Horizon Fund Series II 3 months Plan-Inst-Gr. – 19.10 Nil (previous year 3,642,485.290 ) Reliance Fixed Horizon Fund II-Qty Plan Series VI-Inst Gr. – 36.43
29.80 228.83137.24 336.27
Aggregate cost of quoted investments** – –Aggregate cost of unquoted investments 137.24 336.27 Aggregate net asset value of Mutual Fund investments 29.80 228.83
* Deposited with government departments Rs. 0.43 million (previous year Rs. 0.43 million)
** Rounded off to Nil
During the year, the following current investments were purchased and sold:1. 848338.3440 units of Prudential Liquid Plan-Institutional Growth purchased at cost of Rs. 16.07 million and sold at Rs.16.09 million.2. 3141254.147 units of Reliance Floating Rate Fund-Growth Plan-Growth purchased at cost of Rs. 37.46 million and sold at Rs. 37.91 million.3. 46941.0110 units of Reliance Growth Fund-Retail Plan-Growth Plan purchased at cost of Rs. 15.00 million and sold at Rs. 15.85 million.4. 36980.4670 units of Reliance Liquid Plus Fund-Institutional Growth purchased at cost of Rs. 38.72 million and sold at Rs. 40.36 million.5. 17124500.957 units of HDFC Cash Management Fund-Savings Plus Plan-Wholesale Growth purchased at cost of Rs. 286.83 million and sold
at Rs. 291.18 million.6. 6770125.6860 units of HDFC Cash Management Fund-Savings Plan-Growth purchased at cost of Rs. 109.82 million and sold at Rs. 109.87 million7. 5000000 units of HDFC Arbitrage Fund-Wholesale Plan-MD-Rein purchased at cost of Rs. 50.00 million and sold at Rs. 50.53 million.8. 10342.101 units of Templeton India TMA Regular Plan-Growth purchased at cost of Rs. 19.65 million and sold at Rs. 19.65 million.9. 630140.90 units of Templeton India Flexi-Cap Fund-Growth purchased at cost of Rs. 15.00 million and sold at Rs. 16.27 million.10. 16230254.1900 units of Templeton India Money Market Account-Bonus purchased at cost of Rs. 16.23 million and sold at Rs. 16.93 million.11. 600270.8650 units of Fidelity Equity Fund-Growth Option purchased at cost of Rs. 15.00 million and sold at Rs. 15.70 million.12. 1564738.9073 units of Fidelity Liquid Plus-Institutional Growth purchased at cost of Rs. 15.67 million and sold at Rs. 16.09 million.13. 15019.0410 units of DSP Merill Lynch Liquid Plus-Regular Growth purchased at cost of Rs. 16.23 million and sold at Rs. 16.79 million.14. 1393534.0020 units of DSP Merill Lynch Equity Fund-Regular Growth purchased at cost of Rs. 15.00 million and sold at Rs. 16.27 million.15. 146499.540 units of Sundaram BNP Paribas Select Midcap-Appreciation purchased at cost of Rs. 15.00 million and sold at Rs. 16.19 million.16. 1559534.6260 units of Sundaram BNP Paribas Liquid Plus-Institutional Growth purchased at cost of Rs. 16.15 million and sold at
Rs. 16.81 million.17. 450432.738 units of HDFC Cash Management Fund-Savings Plus Plan-Wholesale Growth purchased at cost of Rs. 7.40 million and sold at
Rs. 7.50 million.18. 468221.076 units of HDFC Cash Management Fund-Savings Plan-Growth, purchased at cost of Rs. 7.40 million and sold at Rs. 7.40 million.
6 INVESTMENTS

116 117
SCHEDULES FORMING PART OF THE CONSOLIDATED FINANCIAL STATEMENTS SCHEDULES FORMING PART OF THE CONSOLIDATED FINANCIAL STATEMENTS(Rs. in Million)
As at As at31 March 2008 31 March 2007
(As taken, valued and certified by the management)Stores, spares and packing materials 166.87 160.71 Raw materials and components 88.74 85.64Stock–in–process 56.76 44.43 Goods in transit* 24.60 0.15 Finished goods including goods purchased for sale 1,133.47 927.25
1,470.44 1,218.18
* Includes raw material & components Rs. Nil (previous year Rs. 0.10 million), stores & spares Rs. Nil (previous year Rs. 0.05 million) andfinished goods Rs. 24.60 million (previous year Rs. Nil)
7 INVENTORIES
(Rs. in Million)As at As at
31 March 2008 31 March 2007
(Unsecured, considered good except where otherwise stated)Loans to Bodies Corporate – 2.00(including Rs. Nil (previous year Rs. 2.00 million) considered doubtful of recovery)Advance recoverable in cash or in kind or for value to be received 172.41 192.36(including Rs. 4.04 million (previous year Rs. 2.46 million) considered doubtful of recovery)Balance with excise/sales tax authorities 41.65 55.75Deposits 39.66 27.11
253.72 277.22Less: Provision for doubtful loans & advances 4.04 4.46
249.68 272.76
11 LOANS AND ADVANCES
(Rs. in Million)As at As at
31 March 2008 31 March 2007
(Unsecured unless otherwise stated)Debts outstanding for a period exceeding six months:
Considered good– Secured 5.27 1.44 – Others 68.28 128.99 Considered doubtful 62.11 56.71
Other debts:Considered good– Secured 22.51 6.50 – Others 813.52 633.46 Considered doubtful 0.41 1.63
972.10 828.73 Less: Provision for doubtful debts 62.52 58.34
909.58 770.39
8 SUNDRY DEBTORS
(Rs. in Million)As at As at
31 March 2008 31 March 2007
Cash in hand 2.25 9.89Remittance–in–transit 65.10 30.38 Balances with scheduled banks in:
Current accounts 17.30 30.22 Cash credit accounts – 0.63 Fixed deposit accounts 34.36 19.70Rs. 33.76 million (previous year Rs. 19.58 million) are pledged with banks as margin moneyUnpaid dividend accounts 3.04 2.84 With post office in savings account (pledged)* – –
122.05 93.66
* Rounded off to Nil
9 CASH AND BANK BALANCES
(Rs. in Million)As at As at
31 March 2008 31 March 2007
Interest accrued but not due on loans and deposits 1.00 1.76 Less: Provision for interest – doubtful of recovery – 0.85
1.00 0.91
10 OTHER CURRENT ASSETS
(Rs. in Million)As at As at
31 March 2008 31 March 2007
a) Current liabilitiesAcceptances 18.73 18.89Sundry creditors for goods, services and expenses
Due to Micro, Small and Medium enterprises 7.15 – Others 611.19 648.50
Interest accrued but not due on loans/debentures 1.80 3.24Advance against sales/orders 39.65 52.45Investor education & protection fund**
Unclaimed Dividend 3.04 2.84Other liabilities* 299.59 165.14
981.15 891.06b) Provisions
Employee benefits 27.30 23.21Income tax (including fringe benefit tax) 18.57 1.49(net of advance payment of Rs. 438.50 million, previous year Rs. 330.90 million)Proposed dividend 82.54 55.03Tax on proposed dividend 14.03 9.35
142.44 89.081,123.59 980.14
* Including excise duty payable Rs. 143.01 million (previous year Rs. 132.07 million) on finished goods lying at Company's bonded warehouses.
** Not due for deposit
12 CURRENT LIABILITIES AND PROVISIONS
(Rs. in Million)As at As at
31 March 2008 31 March 2007
Preliminary expenses 0.05 0.11 Less: Written off during the year 0.05 0.06
– 0.05
13 MISCELLANEOUS EXPENDITURE
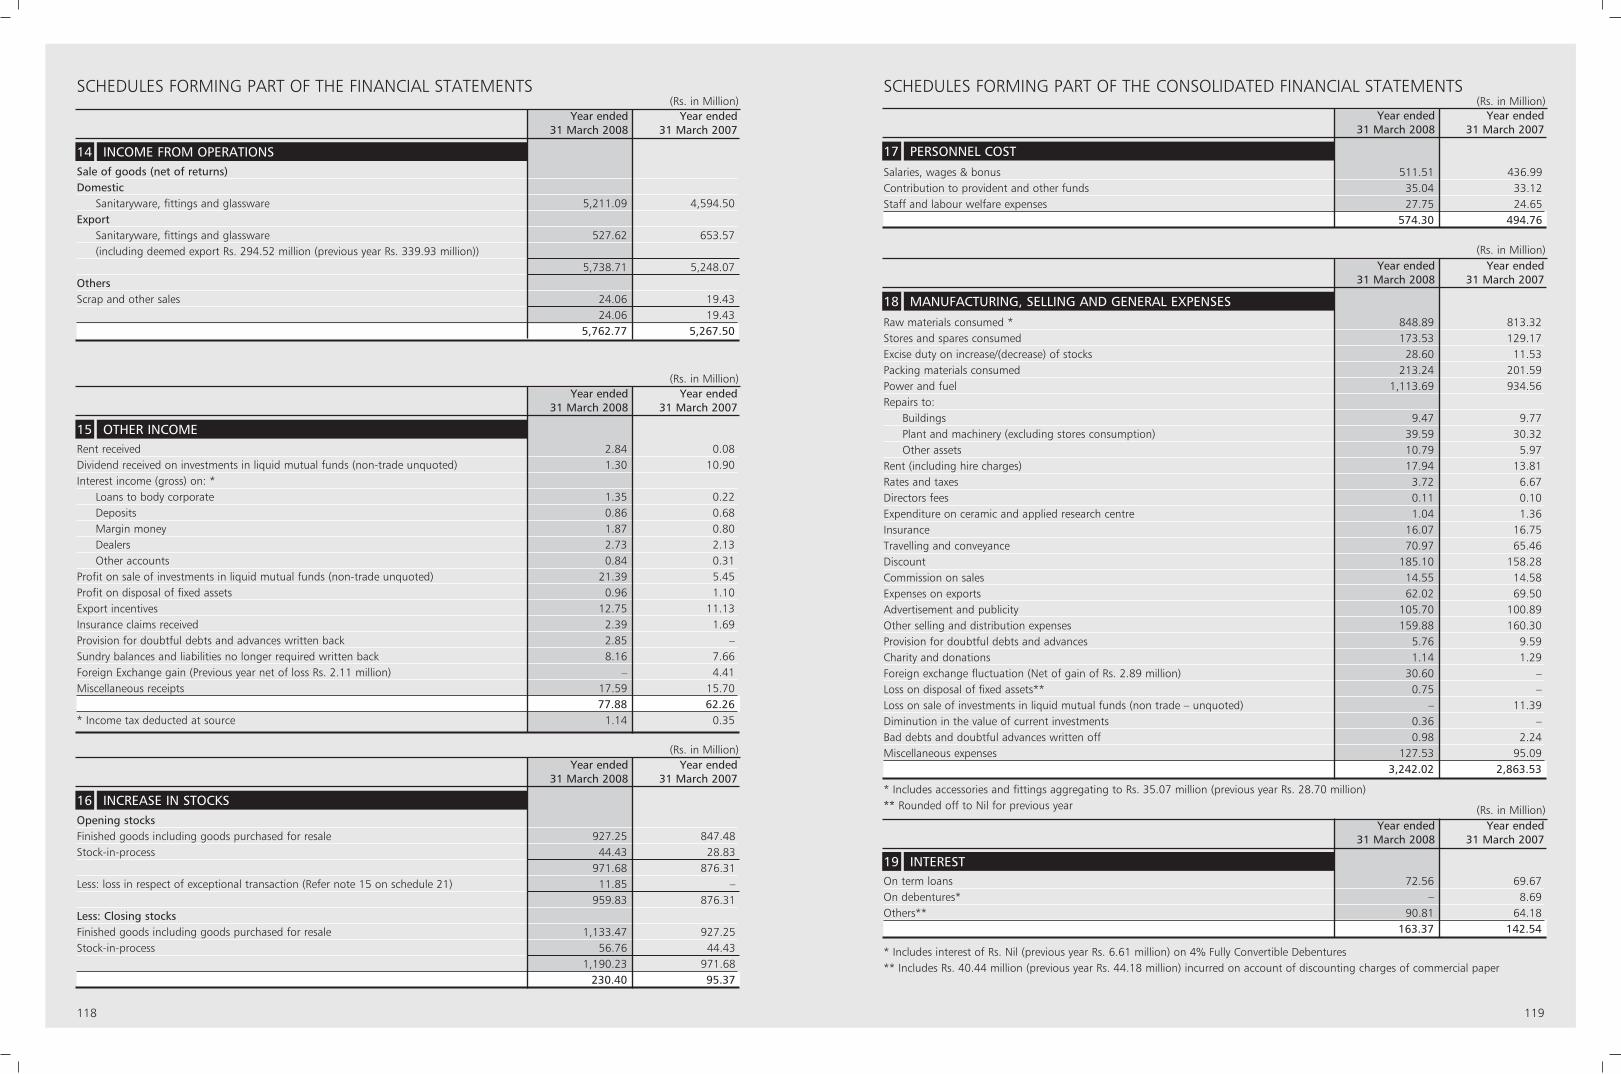
118 119
SCHEDULES FORMING PART OF THE CONSOLIDATED FINANCIAL STATEMENTSSCHEDULES FORMING PART OF THE FINANCIAL STATEMENTS
(Rs. in Million)Year ended Year ended
31 March 2008 31 March 2007
Opening stocksFinished goods including goods purchased for resale 927.25 847.48 Stock-in-process 44.43 28.83
971.68 876.31Less: loss in respect of exceptional transaction (Refer note 15 on schedule 21) 11.85 –
959.83 876.31Less: Closing stocksFinished goods including goods purchased for resale 1,133.47 927.25 Stock-in-process 56.76 44.43
1,190.23 971.68 230.40 95.37
16 INCREASE IN STOCKS
(Rs. in Million)Year ended Year ended
31 March 2008 31 March 2007
Sale of goods (net of returns)Domestic
Sanitaryware, fittings and glassware 5,211.09 4,594.50 Export
Sanitaryware, fittings and glassware 527.62 653.57 (including deemed export Rs. 294.52 million (previous year Rs. 339.93 million))
5,738.71 5,248.07 OthersScrap and other sales 24.06 19.43
24.06 19.43 5,762.77 5,267.50
14 INCOME FROM OPERATIONS
(Rs. in Million)Year ended Year ended
31 March 2008 31 March 2007
Rent received 2.84 0.08 Dividend received on investments in liquid mutual funds (non-trade unquoted) 1.30 10.90 Interest income (gross) on: *
Loans to body corporate 1.35 0.22 Deposits 0.86 0.68 Margin money 1.87 0.80 Dealers 2.73 2.13 Other accounts 0.84 0.31
Profit on sale of investments in liquid mutual funds (non-trade unquoted) 21.39 5.45 Profit on disposal of fixed assets 0.96 1.10 Export incentives 12.75 11.13 Insurance claims received 2.39 1.69 Provision for doubtful debts and advances written back 2.85 –Sundry balances and liabilities no longer required written back 8.16 7.66 Foreign Exchange gain (Previous year net of loss Rs. 2.11 million) – 4.41Miscellaneous receipts 17.59 15.70
77.88 62.26 * Income tax deducted at source 1.14 0.35
15 OTHER INCOME
(Rs. in Million)Year ended Year ended
31 March 2008 31 March 2007
Salaries, wages & bonus 511.51 436.99 Contribution to provident and other funds 35.04 33.12 Staff and labour welfare expenses 27.75 24.65
574.30 494.76
17 PERSONNEL COST
(Rs. in Million)Year ended Year ended
31 March 2008 31 March 2007
On term loans 72.56 69.67 On debentures* – 8.69 Others** 90.81 64.18
163.37 142.54
* Includes interest of Rs. Nil (previous year Rs. 6.61 million) on 4% Fully Convertible Debentures** Includes Rs. 40.44 million (previous year Rs. 44.18 million) incurred on account of discounting charges of commercial paper
* Includes accessories and fittings aggregating to Rs. 35.07 million (previous year Rs. 28.70 million)** Rounded off to Nil for previous year
19 INTEREST
(Rs. in Million)Year ended Year ended
31 March 2008 31 March 2007
Raw materials consumed * 848.89 813.32Stores and spares consumed 173.53 129.17Excise duty on increase/(decrease) of stocks 28.60 11.53Packing materials consumed 213.24 201.59Power and fuel 1,113.69 934.56Repairs to:
Buildings 9.47 9.77Plant and machinery (excluding stores consumption) 39.59 30.32Other assets 10.79 5.97
Rent (including hire charges) 17.94 13.81Rates and taxes 3.72 6.67Directors fees 0.11 0.10Expenditure on ceramic and applied research centre 1.04 1.36Insurance 16.07 16.75Travelling and conveyance 70.97 65.46Discount 185.10 158.28Commission on sales 14.55 14.58Expenses on exports 62.02 69.50Advertisement and publicity 105.70 100.89Other selling and distribution expenses 159.88 160.30Provision for doubtful debts and advances 5.76 9.59Charity and donations 1.14 1.29Foreign exchange fluctuation (Net of gain of Rs. 2.89 million) 30.60 – Loss on disposal of fixed assets** 0.75 –Loss on sale of investments in liquid mutual funds (non trade – unquoted) – 11.39Diminution in the value of current investments 0.36 – Bad debts and doubtful advances written off 0.98 2.24Miscellaneous expenses 127.53 95.09
3,242.02 2,863.53
18 MANUFACTURING, SELLING AND GENERAL EXPENSES
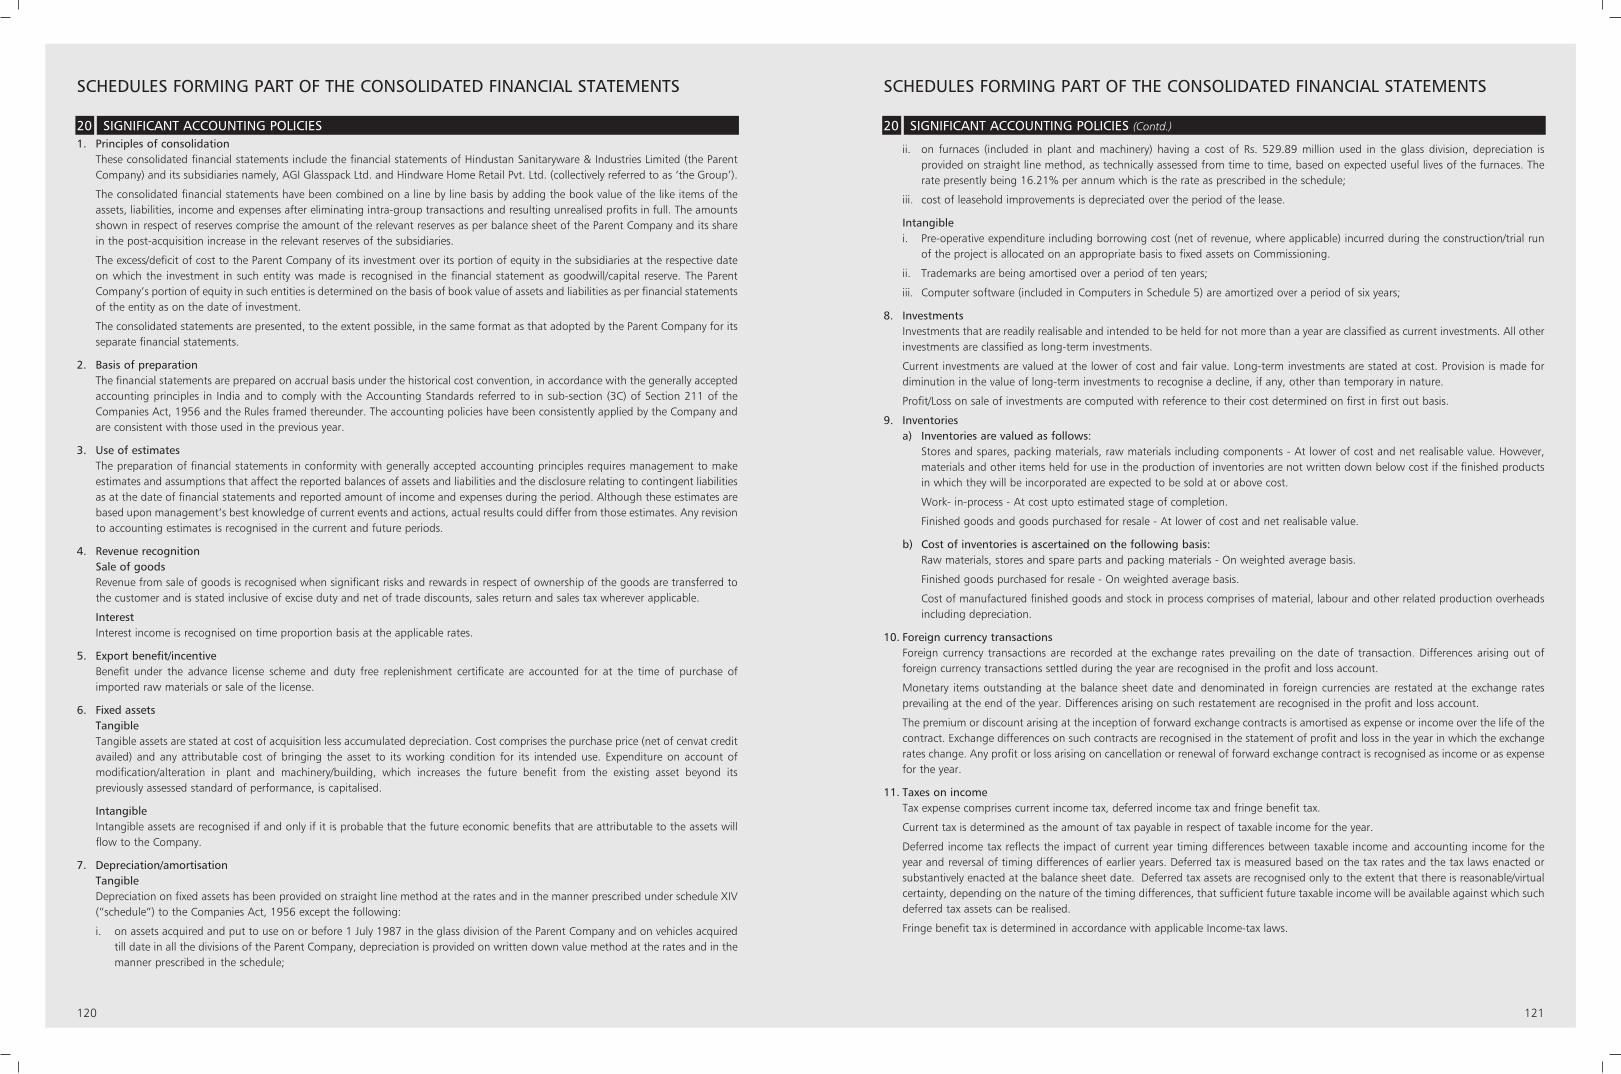
120 121
SCHEDULES FORMING PART OF THE CONSOLIDATED FINANCIAL STATEMENTSSCHEDULES FORMING PART OF THE CONSOLIDATED FINANCIAL STATEMENTS
1. Principles of consolidationThese consolidated financial statements include the financial statements of Hindustan Sanitaryware & Industries Limited (the ParentCompany) and its subsidiaries namely, AGI Glasspack Ltd. and Hindware Home Retail Pvt. Ltd. (collectively referred to as ‘the Group’).
The consolidated financial statements have been combined on a line by line basis by adding the book value of the like items of theassets, liabilities, income and expenses after eliminating intra-group transactions and resulting unrealised profits in full. The amountsshown in respect of reserves comprise the amount of the relevant reserves as per balance sheet of the Parent Company and its sharein the post-acquisition increase in the relevant reserves of the subsidiaries.
The excess/deficit of cost to the Parent Company of its investment over its portion of equity in the subsidiaries at the respective dateon which the investment in such entity was made is recognised in the financial statement as goodwill/capital reserve. The ParentCompany’s portion of equity in such entities is determined on the basis of book value of assets and liabilities as per financial statementsof the entity as on the date of investment.
The consolidated statements are presented, to the extent possible, in the same format as that adopted by the Parent Company for itsseparate financial statements.
2. Basis of preparationThe financial statements are prepared on accrual basis under the historical cost convention, in accordance with the generally acceptedaccounting principles in India and to comply with the Accounting Standards referred to in sub-section (3C) of Section 211 of theCompanies Act, 1956 and the Rules framed thereunder. The accounting policies have been consistently applied by the Company andare consistent with those used in the previous year.
3. Use of estimates The preparation of financial statements in conformity with generally accepted accounting principles requires management to makeestimates and assumptions that affect the reported balances of assets and liabilities and the disclosure relating to contingent liabilitiesas at the date of financial statements and reported amount of income and expenses during the period. Although these estimates arebased upon management’s best knowledge of current events and actions, actual results could differ from those estimates. Any revisionto accounting estimates is recognised in the current and future periods.
4. Revenue recognitionSale of goodsRevenue from sale of goods is recognised when significant risks and rewards in respect of ownership of the goods are transferred tothe customer and is stated inclusive of excise duty and net of trade discounts, sales return and sales tax wherever applicable.
InterestInterest income is recognised on time proportion basis at the applicable rates.
5. Export benefit/incentiveBenefit under the advance license scheme and duty free replenishment certificate are accounted for at the time of purchase ofimported raw materials or sale of the license.
6. Fixed assetsTangibleTangible assets are stated at cost of acquisition less accumulated depreciation. Cost comprises the purchase price (net of cenvat creditavailed) and any attributable cost of bringing the asset to its working condition for its intended use. Expenditure on account ofmodification/alteration in plant and machinery/building, which increases the future benefit from the existing asset beyond itspreviously assessed standard of performance, is capitalised.
Intangible Intangible assets are recognised if and only if it is probable that the future economic benefits that are attributable to the assets willflow to the Company.
7. Depreciation/amortisationTangibleDepreciation on fixed assets has been provided on straight line method at the rates and in the manner prescribed under schedule XIV(“schedule”) to the Companies Act, 1956 except the following:
i. on assets acquired and put to use on or before 1 July 1987 in the glass division of the Parent Company and on vehicles acquiredtill date in all the divisions of the Parent Company, depreciation is provided on written down value method at the rates and in themanner prescribed in the schedule;
ii. on furnaces (included in plant and machinery) having a cost of Rs. 529.89 million used in the glass division, depreciation isprovided on straight line method, as technically assessed from time to time, based on expected useful lives of the furnaces. Therate presently being 16.21% per annum which is the rate as prescribed in the schedule;
iii. cost of leasehold improvements is depreciated over the period of the lease.
Intangiblei. Pre-operative expenditure including borrowing cost (net of revenue, where applicable) incurred during the construction/trial run
of the project is allocated on an appropriate basis to fixed assets on Commissioning.
ii. Trademarks are being amortised over a period of ten years;
iii. Computer software (included in Computers in Schedule 5) are amortized over a period of six years;
8. Investments Investments that are readily realisable and intended to be held for not more than a year are classified as current investments. All otherinvestments are classified as long-term investments.
Current investments are valued at the lower of cost and fair value. Long-term investments are stated at cost. Provision is made fordiminution in the value of long-term investments to recognise a decline, if any, other than temporary in nature.
Profit/Loss on sale of investments are computed with reference to their cost determined on first in first out basis.
9. Inventoriesa) Inventories are valued as follows:
Stores and spares, packing materials, raw materials including components - At lower of cost and net realisable value. However,materials and other items held for use in the production of inventories are not written down below cost if the finished productsin which they will be incorporated are expected to be sold at or above cost.
Work- in-process - At cost upto estimated stage of completion.
Finished goods and goods purchased for resale - At lower of cost and net realisable value.
b) Cost of inventories is ascertained on the following basis: Raw materials, stores and spare parts and packing materials - On weighted average basis.
Finished goods purchased for resale - On weighted average basis.
Cost of manufactured finished goods and stock in process comprises of material, labour and other related production overheadsincluding depreciation.
10. Foreign currency transactionsForeign currency transactions are recorded at the exchange rates prevailing on the date of transaction. Differences arising out offoreign currency transactions settled during the year are recognised in the profit and loss account.
Monetary items outstanding at the balance sheet date and denominated in foreign currencies are restated at the exchange ratesprevailing at the end of the year. Differences arising on such restatement are recognised in the profit and loss account.
The premium or discount arising at the inception of forward exchange contracts is amortised as expense or income over the life of thecontract. Exchange differences on such contracts are recognised in the statement of profit and loss in the year in which the exchangerates change. Any profit or loss arising on cancellation or renewal of forward exchange contract is recognised as income or as expensefor the year.
11. Taxes on incomeTax expense comprises current income tax, deferred income tax and fringe benefit tax.
Current tax is determined as the amount of tax payable in respect of taxable income for the year.
Deferred income tax reflects the impact of current year timing differences between taxable income and accounting income for theyear and reversal of timing differences of earlier years. Deferred tax is measured based on the tax rates and the tax laws enacted orsubstantively enacted at the balance sheet date. Deferred tax assets are recognised only to the extent that there is reasonable/virtualcertainty, depending on the nature of the timing differences, that sufficient future taxable income will be available against which suchdeferred tax assets can be realised.
Fringe benefit tax is determined in accordance with applicable Income-tax laws.
20 SIGNIFICANT ACCOUNTING POLICIES 20 SIGNIFICANT ACCOUNTING POLICIES (Contd.)
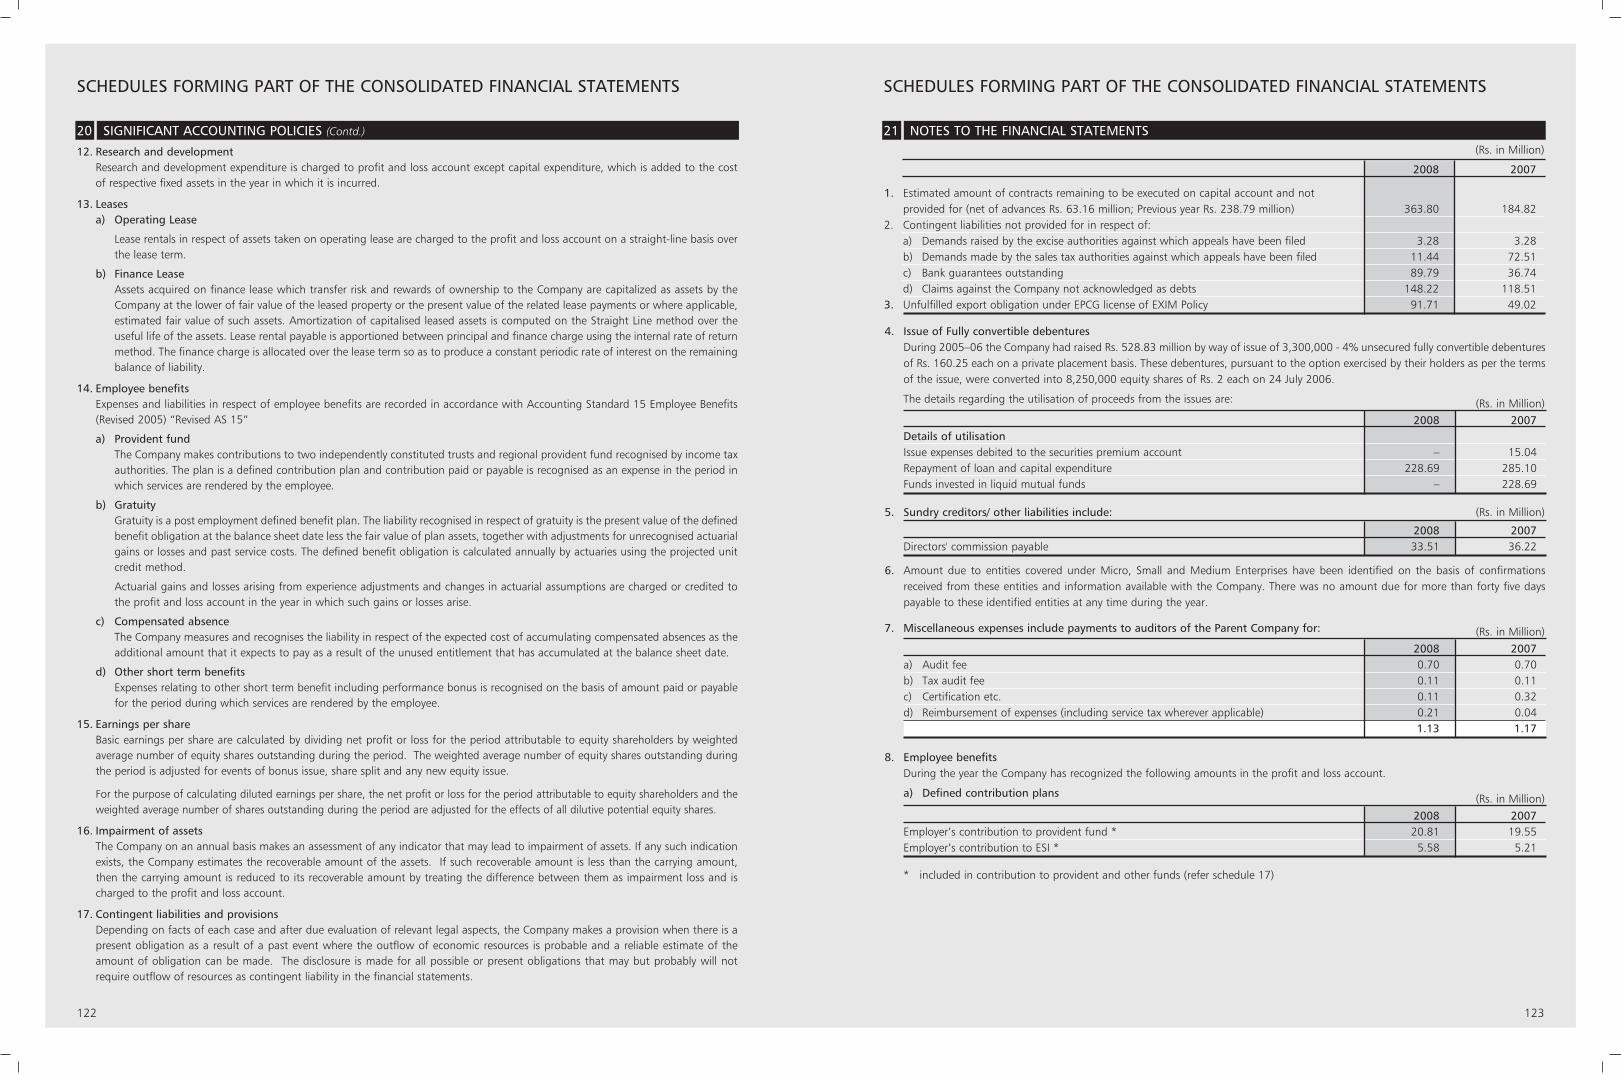
122 123
SCHEDULES FORMING PART OF THE CONSOLIDATED FINANCIAL STATEMENTS
12. Research and developmentResearch and development expenditure is charged to profit and loss account except capital expenditure, which is added to the costof respective fixed assets in the year in which it is incurred.
13. Leasesa) Operating Lease
Lease rentals in respect of assets taken on operating lease are charged to the profit and loss account on a straight-line basis overthe lease term.
b) Finance LeaseAssets acquired on finance lease which transfer risk and rewards of ownership to the Company are capitalized as assets by theCompany at the lower of fair value of the leased property or the present value of the related lease payments or where applicable,estimated fair value of such assets. Amortization of capitalised leased assets is computed on the Straight Line method over theuseful life of the assets. Lease rental payable is apportioned between principal and finance charge using the internal rate of returnmethod. The finance charge is allocated over the lease term so as to produce a constant periodic rate of interest on the remainingbalance of liability.
14. Employee benefitsExpenses and liabilities in respect of employee benefits are recorded in accordance with Accounting Standard 15 Employee Benefits(Revised 2005) “Revised AS 15”
a) Provident fundThe Company makes contributions to two independently constituted trusts and regional provident fund recognised by income taxauthorities. The plan is a defined contribution plan and contribution paid or payable is recognised as an expense in the period inwhich services are rendered by the employee.
b) GratuityGratuity is a post employment defined benefit plan. The liability recognised in respect of gratuity is the present value of the definedbenefit obligation at the balance sheet date less the fair value of plan assets, together with adjustments for unrecognised actuarialgains or losses and past service costs. The defined benefit obligation is calculated annually by actuaries using the projected unitcredit method.
Actuarial gains and losses arising from experience adjustments and changes in actuarial assumptions are charged or credited tothe profit and loss account in the year in which such gains or losses arise.
c) Compensated absenceThe Company measures and recognises the liability in respect of the expected cost of accumulating compensated absences as theadditional amount that it expects to pay as a result of the unused entitlement that has accumulated at the balance sheet date.
d) Other short term benefitsExpenses relating to other short term benefit including performance bonus is recognised on the basis of amount paid or payablefor the period during which services are rendered by the employee.
15. Earnings per shareBasic earnings per share are calculated by dividing net profit or loss for the period attributable to equity shareholders by weightedaverage number of equity shares outstanding during the period. The weighted average number of equity shares outstanding duringthe period is adjusted for events of bonus issue, share split and any new equity issue.
For the purpose of calculating diluted earnings per share, the net profit or loss for the period attributable to equity shareholders and theweighted average number of shares outstanding during the period are adjusted for the effects of all dilutive potential equity shares.
16. Impairment of assetsThe Company on an annual basis makes an assessment of any indicator that may lead to impairment of assets. If any such indicationexists, the Company estimates the recoverable amount of the assets. If such recoverable amount is less than the carrying amount,then the carrying amount is reduced to its recoverable amount by treating the difference between them as impairment loss and ischarged to the profit and loss account.
17. Contingent liabilities and provisionsDepending on facts of each case and after due evaluation of relevant legal aspects, the Company makes a provision when there is apresent obligation as a result of a past event where the outflow of economic resources is probable and a reliable estimate of theamount of obligation can be made. The disclosure is made for all possible or present obligations that may but probably will notrequire outflow of resources as contingent liability in the financial statements.
SCHEDULES FORMING PART OF THE CONSOLIDATED FINANCIAL STATEMENTS
(Rs. in Million)
2008 2007
1. Estimated amount of contracts remaining to be executed on capital account and not provided for (net of advances Rs. 63.16 million; Previous year Rs. 238.79 million) 363.80 184.82
2. Contingent liabilities not provided for in respect of:a) Demands raised by the excise authorities against which appeals have been filed 3.28 3.28b) Demands made by the sales tax authorities against which appeals have been filed 11.44 72.51c) Bank guarantees outstanding 89.79 36.74d) Claims against the Company not acknowledged as debts 148.22 118.51
3. Unfulfilled export obligation under EPCG license of EXIM Policy 91.71 49.02
4. Issue of Fully convertible debenturesDuring 2005–06 the Company had raised Rs. 528.83 million by way of issue of 3,300,000 - 4% unsecured fully convertible debenturesof Rs. 160.25 each on a private placement basis. These debentures, pursuant to the option exercised by their holders as per the termsof the issue, were converted into 8,250,000 equity shares of Rs. 2 each on 24 July 2006.
The details regarding the utilisation of proceeds from the issues are:
6. Amount due to entities covered under Micro, Small and Medium Enterprises have been identified on the basis of confirmationsreceived from these entities and information available with the Company. There was no amount due for more than forty five dayspayable to these identified entities at any time during the year.
(Rs. in Million)
(Rs. in Million)
2008 2007Details of utilisationIssue expenses debited to the securities premium account – 15.04 Repayment of loan and capital expenditure 228.69 285.10 Funds invested in liquid mutual funds – 228.69
2008 2007Directors' commission payable 33.51 36.22
5. Sundry creditors/ other liabilities include:
2008 2007a) Audit fee 0.70 0.70b) Tax audit fee 0.11 0.11c) Certification etc. 0.11 0.32d) Reimbursement of expenses (including service tax wherever applicable) 0.21 0.04
1.13 1.17
7. Miscellaneous expenses include payments to auditors of the Parent Company for: (Rs. in Million)
2008 2007Employer’s contribution to provident fund * 20.81 19.55Employer’s contribution to ESI * 5.58 5.21
* included in contribution to provident and other funds (refer schedule 17)
8. Employee benefitsDuring the year the Company has recognized the following amounts in the profit and loss account.
a) Defined contribution plans (Rs. in Million)
20 SIGNIFICANT ACCOUNTING POLICIES (Contd.) 21 NOTES TO THE FINANCIAL STATEMENTS
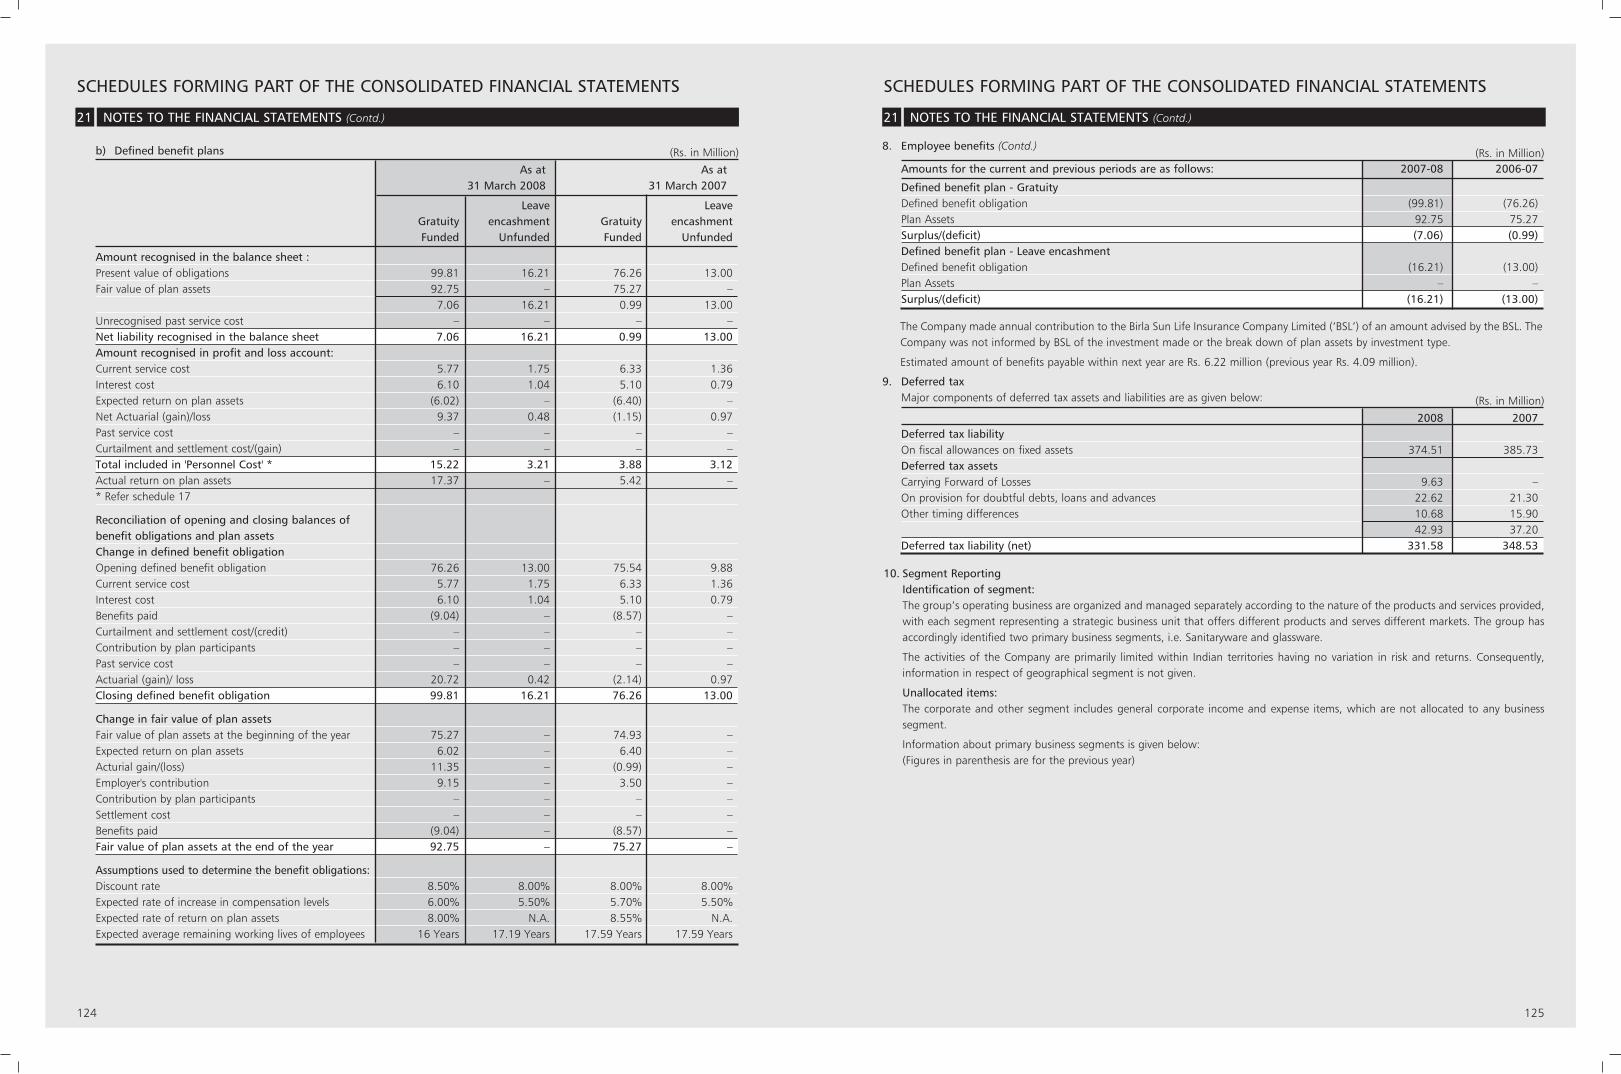
124 125
SCHEDULES FORMING PART OF THE CONSOLIDATED FINANCIAL STATEMENTSSCHEDULES FORMING PART OF THE CONSOLIDATED FINANCIAL STATEMENTS
21 NOTES TO THE FINANCIAL STATEMENTS (Contd.) 21 NOTES TO THE FINANCIAL STATEMENTS (Contd.)
As at As at31 March 2008 31 March 2007
Leave LeaveGratuity encashment Gratuity encashment Funded Unfunded Funded Unfunded
Amount recognised in the balance sheet :Present value of obligations 99.81 16.21 76.26 13.00 Fair value of plan assets 92.75 – 75.27 –
7.06 16.21 0.99 13.00 Unrecognised past service cost – – – –Net liability recognised in the balance sheet 7.06 16.21 0.99 13.00 Amount recognised in profit and loss account:Current service cost 5.77 1.75 6.33 1.36 Interest cost 6.10 1.04 5.10 0.79 Expected return on plan assets (6.02) – (6.40) – Net Actuarial (gain)/loss 9.37 0.48 (1.15) 0.97 Past service cost – – – –Curtailment and settlement cost/(gain) – – – – Total included in 'Personnel Cost' * 15.22 3.21 3.88 3.12Actual return on plan assets 17.37 – 5.42 –* Refer schedule 17
Reconciliation of opening and closing balances of benefit obligations and plan assetsChange in defined benefit obligationOpening defined benefit obligation 76.26 13.00 75.54 9.88 Current service cost 5.77 1.75 6.33 1.36 Interest cost 6.10 1.04 5.10 0.79 Benefits paid (9.04) – (8.57) –Curtailment and settlement cost/(credit) – – – – Contribution by plan participants – – – –Past service cost – – – –Actuarial (gain)/ loss 20.72 0.42 (2.14) 0.97 Closing defined benefit obligation 99.81 16.21 76.26 13.00
Change in fair value of plan assetsFair value of plan assets at the beginning of the year 75.27 – 74.93 – Expected return on plan assets 6.02 – 6.40 – Acturial gain/(loss) 11.35 – (0.99) –Employer's contribution 9.15 – 3.50 –Contribution by plan participants – – – –Settlement cost – – – – Benefits paid (9.04) – (8.57) – Fair value of plan assets at the end of the year 92.75 – 75.27 –
Assumptions used to determine the benefit obligations:Discount rate 8.50% 8.00% 8.00% 8.00%Expected rate of increase in compensation levels 6.00% 5.50% 5.70% 5.50%Expected rate of return on plan assets 8.00% N.A. 8.55% N.A.Expected average remaining working lives of employees 16 Years 17.19 Years 17.59 Years 17.59 Years
b) Defined benefit plans (Rs. in Million)Amounts for the current and previous periods are as follows: 2007-08 2006-07
Defined benefit plan - GratuityDefined benefit obligation (99.81) (76.26)Plan Assets 92.75 75.27 Surplus/(deficit) (7.06) (0.99)Defined benefit plan - Leave encashmentDefined benefit obligation (16.21) (13.00)Plan Assets – –Surplus/(deficit) (16.21) (13.00)
8. Employee benefits (Contd.)(Rs. in Million)
2008 2007Deferred tax liabilityOn fiscal allowances on fixed assets 374.51 385.73Deferred tax assetsCarrying Forward of Losses 9.63 –On provision for doubtful debts, loans and advances 22.62 21.30Other timing differences 10.68 15.90
42.93 37.20Deferred tax liability (net) 331.58 348.53
9. Deferred taxMajor components of deferred tax assets and liabilities are as given below: (Rs. in Million)
The Company made annual contribution to the Birla Sun Life Insurance Company Limited (‘BSL’) of an amount advised by the BSL. TheCompany was not informed by BSL of the investment made or the break down of plan assets by investment type.
Estimated amount of benefits payable within next year are Rs. 6.22 million (previous year Rs. 4.09 million).
10. Segment ReportingIdentification of segment:The group’s operating business are organized and managed separately according to the nature of the products and services provided,with each segment representing a strategic business unit that offers different products and serves different markets. The group hasaccordingly identified two primary business segments, i.e. Sanitaryware and glassware.
The activities of the Company are primarily limited within Indian territories having no variation in risk and returns. Consequently,information in respect of geographical segment is not given.
Unallocated items:The corporate and other segment includes general corporate income and expense items, which are not allocated to any businesssegment.
Information about primary business segments is given below:(Figures in parenthesis are for the previous year)
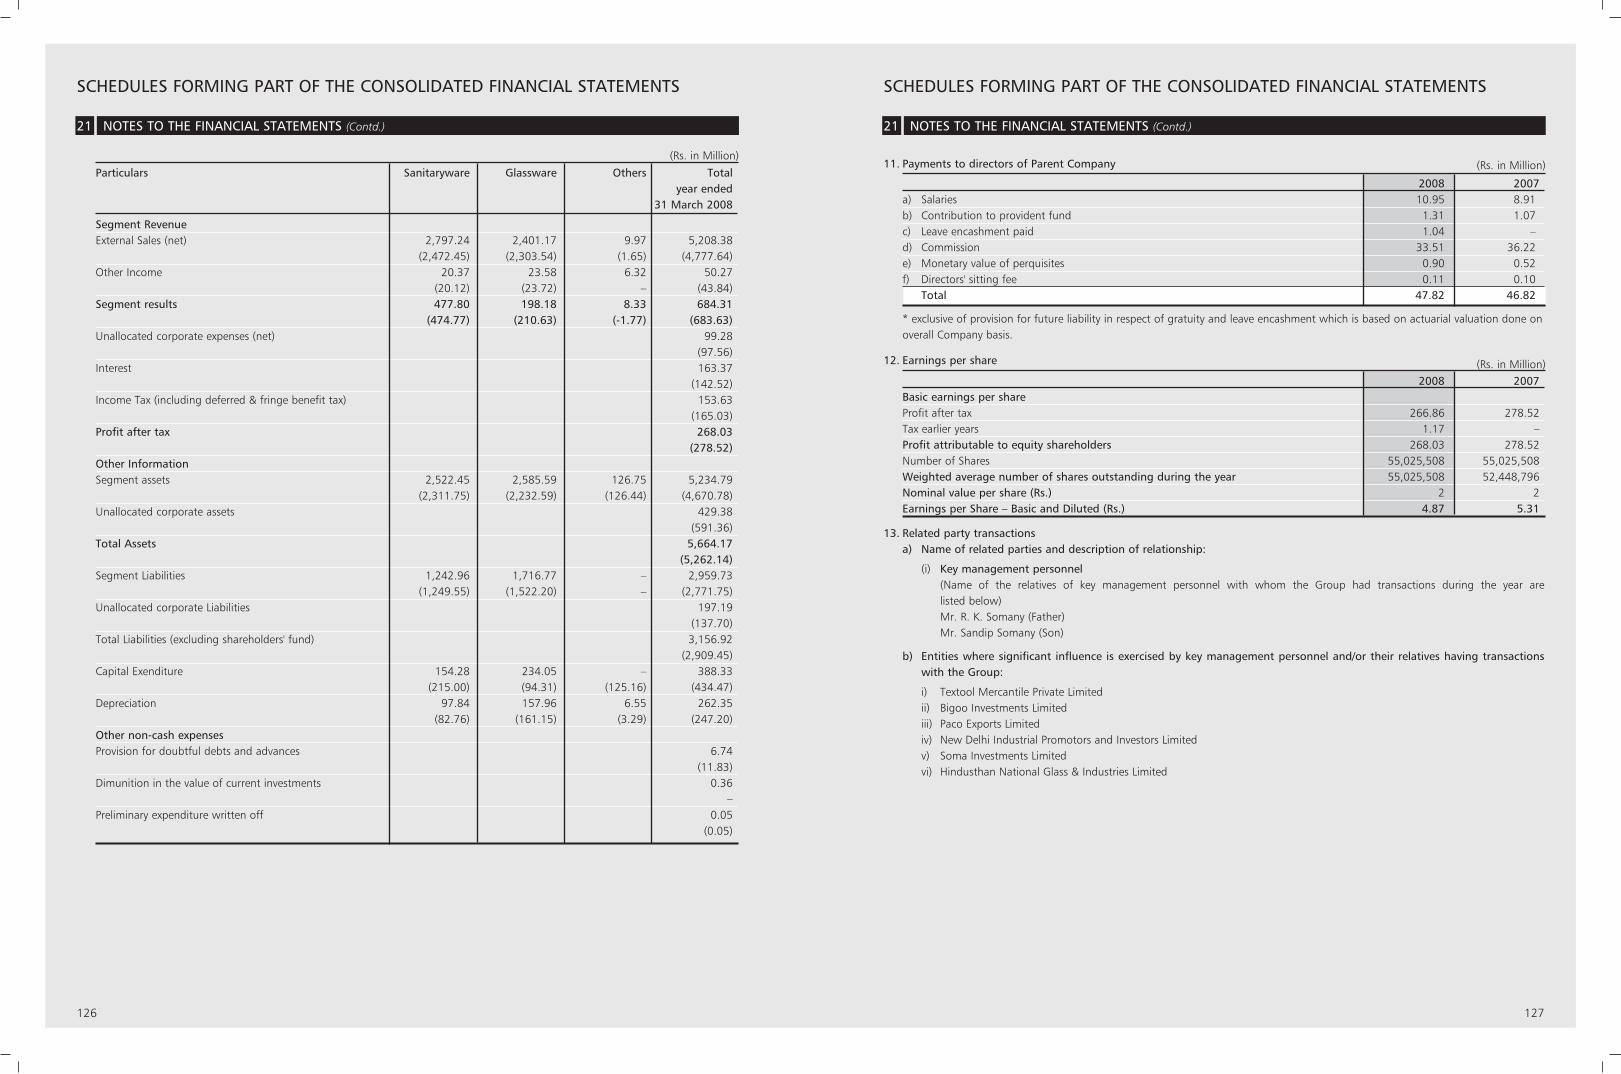
126 127
SCHEDULES FORMING PART OF THE CONSOLIDATED FINANCIAL STATEMENTSSCHEDULES FORMING PART OF THE CONSOLIDATED FINANCIAL STATEMENTS
21 NOTES TO THE FINANCIAL STATEMENTS (Contd.) 21 NOTES TO THE FINANCIAL STATEMENTS (Contd.)
(Rs. in Million)
2008 2007a) Salaries 10.95 8.91b) Contribution to provident fund 1.31 1.07c) Leave encashment paid 1.04 –d) Commission 33.51 36.22e) Monetary value of perquisites 0.90 0.52f) Directors' sitting fee 0.11 0.10
Total 47.82 46.82
* exclusive of provision for future liability in respect of gratuity and leave encashment which is based on actuarial valuation done onoverall Company basis.
11. Payments to directors of Parent Company
(Rs. in Million)2008 2007
Basic earnings per shareProfit after tax 266.86 278.52Tax earlier years 1.17 –Profit attributable to equity shareholders 268.03 278.52Number of Shares 55,025,508 55,025,508Weighted average number of shares outstanding during the year 55,025,508 52,448,796Nominal value per share (Rs.) 2 2Earnings per Share – Basic and Diluted (Rs.) 4.87 5.31
12. Earnings per share
13. Related party transactionsa) Name of related parties and description of relationship:
(i) Key management personnel (Name of the relatives of key management personnel with whom the Group had transactions during the year are listed below)Mr. R. K. Somany (Father)Mr. Sandip Somany (Son)
b) Entities where significant influence is exercised by key management personnel and/or their relatives having transactions with the Group:
i) Textool Mercantile Private Limitedii) Bigoo Investments Limitediii) Paco Exports Limitediv) New Delhi Industrial Promotors and Investors Limitedv) Soma Investments Limitedvi) Hindusthan National Glass & Industries Limited
Particulars Sanitaryware Glassware Others Totalyear ended
31 March 2008
Segment RevenueExternal Sales (net) 2,797.24 2,401.17 9.97 5,208.38
(2,472.45) (2,303.54) (1.65) (4,777.64)Other Income 20.37 23.58 6.32 50.27
(20.12) (23.72) – (43.84)Segment results 477.80 198.18 8.33 684.31
(474.77) (210.63) (-1.77) (683.63)Unallocated corporate expenses (net) 99.28
(97.56)Interest 163.37
(142.52)Income Tax (including deferred & fringe benefit tax) 153.63
(165.03)Profit after tax 268.03
(278.52)Other InformationSegment assets 2,522.45 2,585.59 126.75 5,234.79
(2,311.75) (2,232.59) (126.44) (4,670.78)Unallocated corporate assets 429.38
(591.36)Total Assets 5,664.17
(5,262.14)Segment Liabilities 1,242.96 1,716.77 – 2,959.73
(1,249.55) (1,522.20) – (2,771.75)Unallocated corporate Liabilities 197.19
(137.70)Total Liabilities (excluding shareholders' fund) 3,156.92
(2,909.45)Capital Exenditure 154.28 234.05 – 388.33
(215.00) (94.31) (125.16) (434.47)Depreciation 97.84 157.96 6.55 262.35
(82.76) (161.15) (3.29) (247.20)Other non-cash expensesProvision for doubtful debts and advances 6.74
(11.83)Dimunition in the value of current investments 0.36
–Preliminary expenditure written off 0.05
(0.05)
(Rs. in Million)
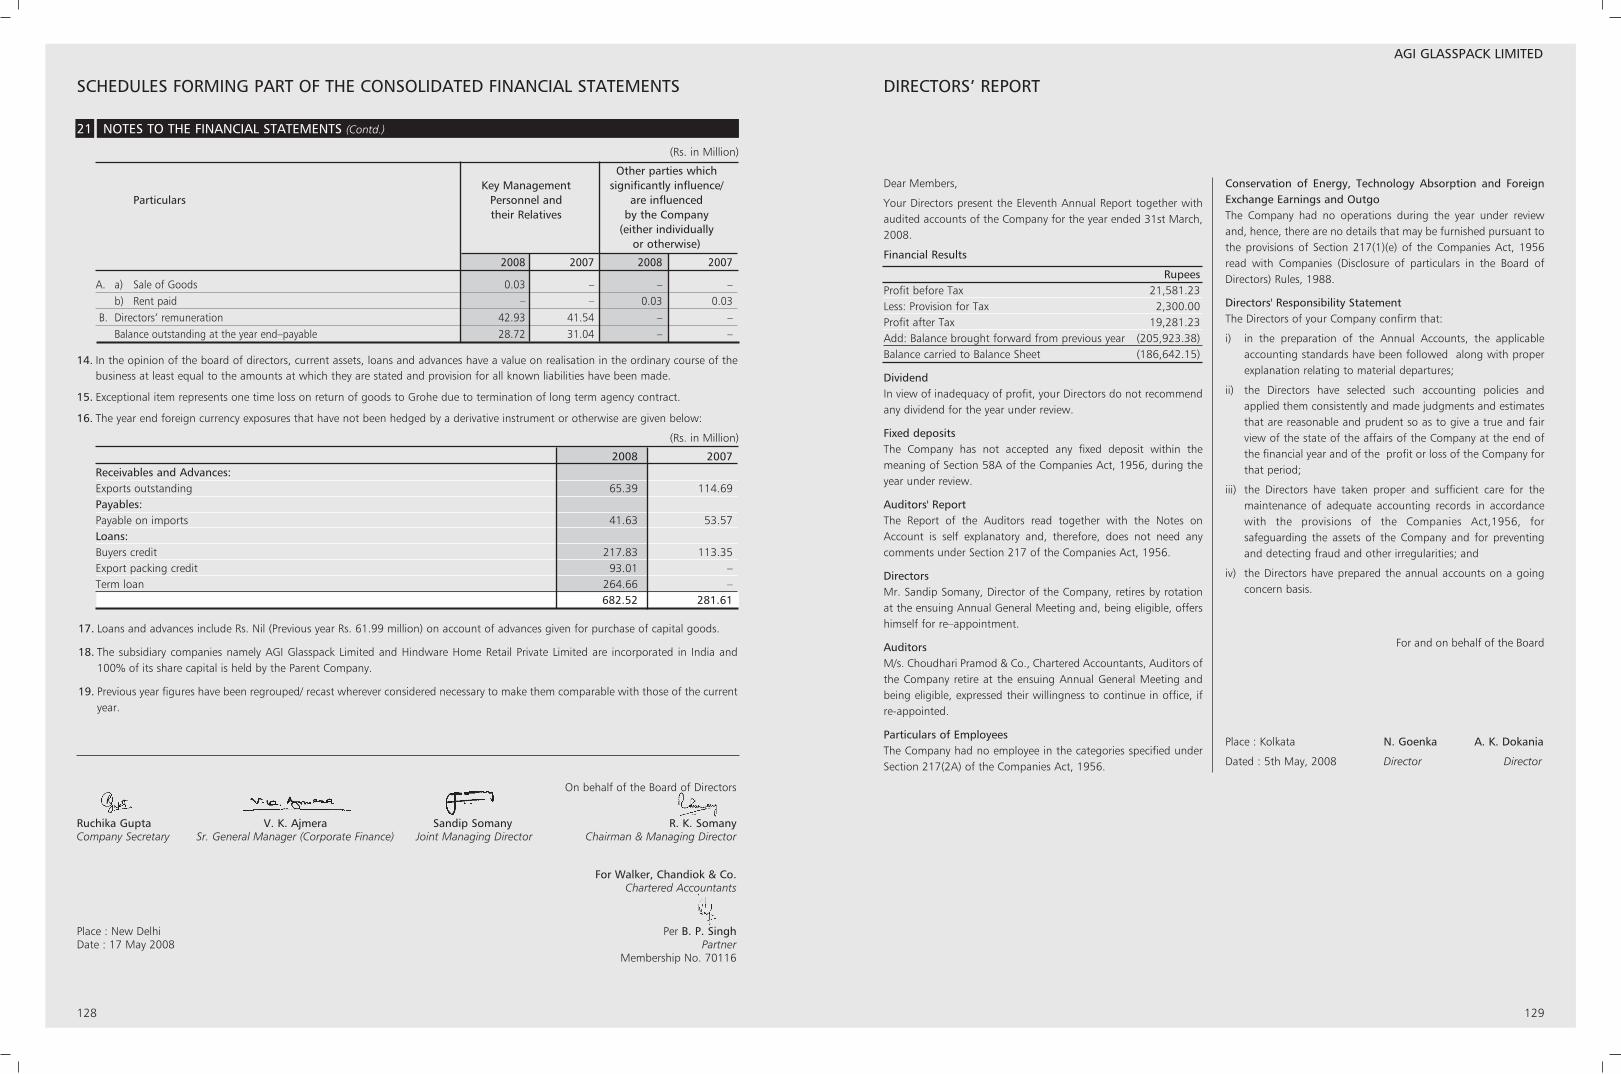
128 129
SCHEDULES FORMING PART OF THE CONSOLIDATED FINANCIAL STATEMENTS
17. Loans and advances include Rs. Nil (Previous year Rs. 61.99 million) on account of advances given for purchase of capital goods.
18. The subsidiary companies namely AGI Glasspack Limited and Hindware Home Retail Private Limited are incorporated in India and100% of its share capital is held by the Parent Company.
19. Previous year figures have been regrouped/ recast wherever considered necessary to make them comparable with those of the currentyear.
21 NOTES TO THE FINANCIAL STATEMENTS (Contd.)
DIRECTORS’ REPORT
AGI GLASSPACK LIMITED
Dear Members,
Your Directors present the Eleventh Annual Report together withaudited accounts of the Company for the year ended 31st March,2008.
Financial Results
RupeesProfit before Tax 21,581.23Less: Provision for Tax 2,300.00Profit after Tax 19,281.23Add: Balance brought forward from previous year (205,923.38)Balance carried to Balance Sheet (186,642.15)
DividendIn view of inadequacy of profit, your Directors do not recommendany dividend for the year under review.
Fixed depositsThe Company has not accepted any fixed deposit within themeaning of Section 58A of the Companies Act, 1956, during theyear under review.
Auditors' ReportThe Report of the Auditors read together with the Notes onAccount is self explanatory and, therefore, does not need anycomments under Section 217 of the Companies Act, 1956.
DirectorsMr. Sandip Somany, Director of the Company, retires by rotationat the ensuing Annual General Meeting and, being eligible, offershimself for re–appointment.
AuditorsM/s. Choudhari Pramod & Co., Chartered Accountants, Auditors ofthe Company retire at the ensuing Annual General Meeting andbeing eligible, expressed their willingness to continue in office, ifre-appointed.
Particulars of EmployeesThe Company had no employee in the categories specified underSection 217(2A) of the Companies Act, 1956.
Conservation of Energy, Technology Absorption and ForeignExchange Earnings and OutgoThe Company had no operations during the year under reviewand, hence, there are no details that may be furnished pursuant tothe provisions of Section 217(1)(e) of the Companies Act, 1956read with Companies (Disclosure of particulars in the Board ofDirectors) Rules, 1988.
Directors' Responsibility StatementThe Directors of your Company confirm that:
i) in the preparation of the Annual Accounts, the applicableaccounting standards have been followed along with properexplanation relating to material departures;
ii) the Directors have selected such accounting policies andapplied them consistently and made judgments and estimatesthat are reasonable and prudent so as to give a true and fairview of the state of the affairs of the Company at the end ofthe financial year and of the profit or loss of the Company forthat period;
iii) the Directors have taken proper and sufficient care for themaintenance of adequate accounting records in accordancewith the provisions of the Companies Act,1956, forsafeguarding the assets of the Company and for preventingand detecting fraud and other irregularities; and
iv) the Directors have prepared the annual accounts on a goingconcern basis.
For and on behalf of the Board
Place : Kolkata N. Goenka A. K. Dokania
Dated : 5th May, 2008 Director Director
Other parties whichKey Management significantly influence/
Particulars Personnel and are influencedtheir Relatives by the Company
(either individuallyor otherwise)
2008 2007 2008 2007
A. a) Sale of Goods 0.03 – – –b) Rent paid – – 0.03 0.03
B. Directors’ remuneration 42.93 41.54 – –Balance outstanding at the year end–payable 28.72 31.04 – –
14. In the opinion of the board of directors, current assets, loans and advances have a value on realisation in the ordinary course of thebusiness at least equal to the amounts at which they are stated and provision for all known liabilities have been made.
15. Exceptional item represents one time loss on return of goods to Grohe due to termination of long term agency contract.
16. The year end foreign currency exposures that have not been hedged by a derivative instrument or otherwise are given below:
(Rs. in Million)
(Rs. in Million)
2008 2007Receivables and Advances:Exports outstanding 65.39 114.69Payables:Payable on imports 41.63 53.57Loans:Buyers credit 217.83 113.35Export packing credit 93.01 –Term loan 264.66 –
682.52 281.61
On behalf of the Board of Directors
Ruchika Gupta V. K. Ajmera Sandip Somany R. K. SomanyCompany Secretary Sr. General Manager (Corporate Finance) Joint Managing Director Chairman & Managing Director
For Walker, Chandiok & Co.Chartered Accountants
Place : New Delhi Per B. P. SinghDate : 17 May 2008 Partner
Membership No. 70116
130 131
AGI GLASSPACK LIMITED AGI GLASSPACK LIMITED
We have audited the attached Balance Sheet of AGI GLASSPACKLIMITED as at 31st March, 2008 and the Profit and Loss Accountfor the year ended on that date annexed thereto. These financialstatements are the responsibility of the Company’s management.Our responsibility is to express an opinion on these financialstatements based on our audit.
We conducted our auditing in accordance with auditing standardsgenerally accepted in India. Those standards require that we planand perform the audit to obtain reasonable assurance aboutwhether the financial statements are free of materialmisstatement. An audit includes examining, on a test basis,evidence supporting the amounts and disclosures in the financialstatement presentation. We believe that our audit provides areasonable basis for our opinion.
As required by the Companies (Auditors’ Report) Order, 2003 andas amended by Companies (Auditors’ Report) (Amendment Order),2004 issued by the Central Government of India in terms of sub-section (4A) of Section 227 of the Companies Act, 1956, enclosein the Annexure a statement on the matters specified in paragraph4 and 5 of the said order.
Further to our comments in the Annexure referred to above, wereport that:
1. We have obtained all the information and explanations, whichto the best of our knowledge and belief were necessary for thepurpose of our audit.
2. In our opinion proper books of accounts as required by lawhave been kept by the Company so far as appears from ourexamination of such books.
3. The Balance Sheet and Profit & Loss Account are in agreementwith the Books of Accounts.
4. In our opinion, the Profit and Loss account and the Balance
Sheet dealt with by this report comply with the accountingstandards referred to in sub-section (3C) of Section 211 of theCompanies Act, 1956.
5. During the course of our Audit, we have not come across withany such observation which has any adverse effect on thefunctioning of the Company.
6. Pursuant to the provisions of sub-section (1) (g) of Section 274of the Companies Act, 1956, we report as under:
On the basis of written representation received from thedirectors, as on 31st March, 2008 and taken on record by theBoard of directors, we report that none of the Director isdisqualified as on 31st March, 2008 from being appointed asa Director in terms of clause (g) of sub-section (1) of Section274 of the Companies Act, 1956.
7. In our opinion and to the best of our information andaccording to the explanation given to us, the said accountsgive the information required by the Companies Act, 1956 inthe manner as required and give a true and fair view inconformity with the accounting principles generally acceptedin India:
a) In the case of Balance Sheet, of the state of affairs of theCompany as at 31st March, 2008; and
b) In the case of Profit & Loss Account of the Profit for theperiod ended on that date.
For Choudhari Pramod & Co.Chartered Accountants
Place : Kolkata D. PandaDate : 5th May, 2008 Partner
Membership No. 66197
To
The Members of
AGI Glasspack Limited
AUDITORS’ REPORT ANNEXURE REFERRED TO IN PARAGRAPH 3 OF OUR REPORT OF EVEN DATE TO THEMEMBERS OF AGI GLASSPACK LIMITED1. a) The Company is maintaining proper records showing full
particulars, including quantitative details and situation offixed assets.
b) As explained to us, the management has physically verifiedthe fixed assets during the year and there is a regularprogramme of verification which, in our opinion, isreasonable having regard to the size of the Company andthe nature of the assets. No material discrepancies werenoticed on such verification.
c) The Company has not disposed off any fixed assets duringthe year and hence, it has not affected the going concernstatus of the Company.
2. The Company does not have any inventory during the year.
3. As inform to us, the Company has not granted loans securedor unsecured to/from companies, firms or other partiescovered in the register maintained under Section 301 of theCompanies Act, 1956.
4. As inform to us, the Company has not taken loans secured orunsecured to/from companies, firms or other parties covered inthe register maintained under Section 301 of the CompaniesAct, 1956.
5. The Company has adequate internal control procedurescommensurate with the size of Company and the nature of itsbusiness.
6. Based on the audit procedure applied by us and according tothe information and explanations provided by themanagement, the Company does not have such transactionswhich need to be entered into the register maintained underSection 301 of the Companies Act, 1956.
7. The Company has not accepted any deposits from public.
8. In our opinion, the Company has an internal audit systemcommensurate with size of the Company and the nature of itsbusiness.
9. According to the records of the Company, the Company isregular in depositing undisputed statutory dues applicable tothe Company among Provident Fund, Investor Education andProtection Fund, Employee’s State Insurance, Income Tax,Sales Tax, Customs duty and excise duty, cess and otherstatutory dues with appropriate authorities. According to theinformation and explanations given to us, there are noundisputed amounts payable in respect of income tax, wealthtax, service tax, sales tax, custom duty and excise duty whichhave remained outstanding as at 31st March, 2008 for aperiod of more than six months from the date they becamepayable.
10. The Company has accumulated losses at the end of thefinancial year 31st March, 2008. The Company has notincurred cash losses in the current financial year 31st March,
2008 but incurred cash losses of Rs. 5092.07 immediatelypreceding financial year 31st March, 2007.
11. Based on the audit procedure and on the information andexplanations provided by the management, the Company hasnot borrowed any loan from financial institution or bank ordebenture holders.
12. According to the information and explanations given to us andbased on the documents and records produced to us, theCompany has not granted any loans and advances on the basisof security by way of pledge of shares, debentures and othersecurities.
13. In our opinion and according to the information andexplanations given to us, the nature of the activities of theCompany does not attract any special statute applicable to chitfund and nidhi/mutual fund/societies.
14. The Company is dealing and trading in shares, securities,debentures and other Investments and maintaining properrecords of the transactions and contracts with timely entriestherein: also held shares, securities, debentures and othersecurities in its own name.
15. According to the information and explanations given to us, theCompany has not given any guarantee for loans taken byothers from bank or financial institutions.
16. Based on information and explanations given to us by themanagement, no term loans have taken from any Banks orFinancial Institution.
17. According to the informations & explanations given to us andan overall examination of the balance sheet of the Company,we report that short term funds have not been used to financelong term investments and vice versa as the Company has notavailed any financial facilities during the year.
18. The Company has not made any allotment of equity sharesduring the year.
19. During the year, since the Company has not issued anydebentures, paragraph 4(xix) of the Order is not applicable.
20. During the year, since the Company has not raised any moneyby way of public issue, paragraph 4(xx) of the Order is notapplicable.
21.Based upon the audit procedures performed and informationand explanations given by the management, we report that nofraud on or by the Company has been noticed or reportedduring the course of our audit.
For Choudhari Pramod & Co.Chartered Accountants
Place : Kolkata D. PandaDate : 5th May, 2008 Partner
Membership No. 66197
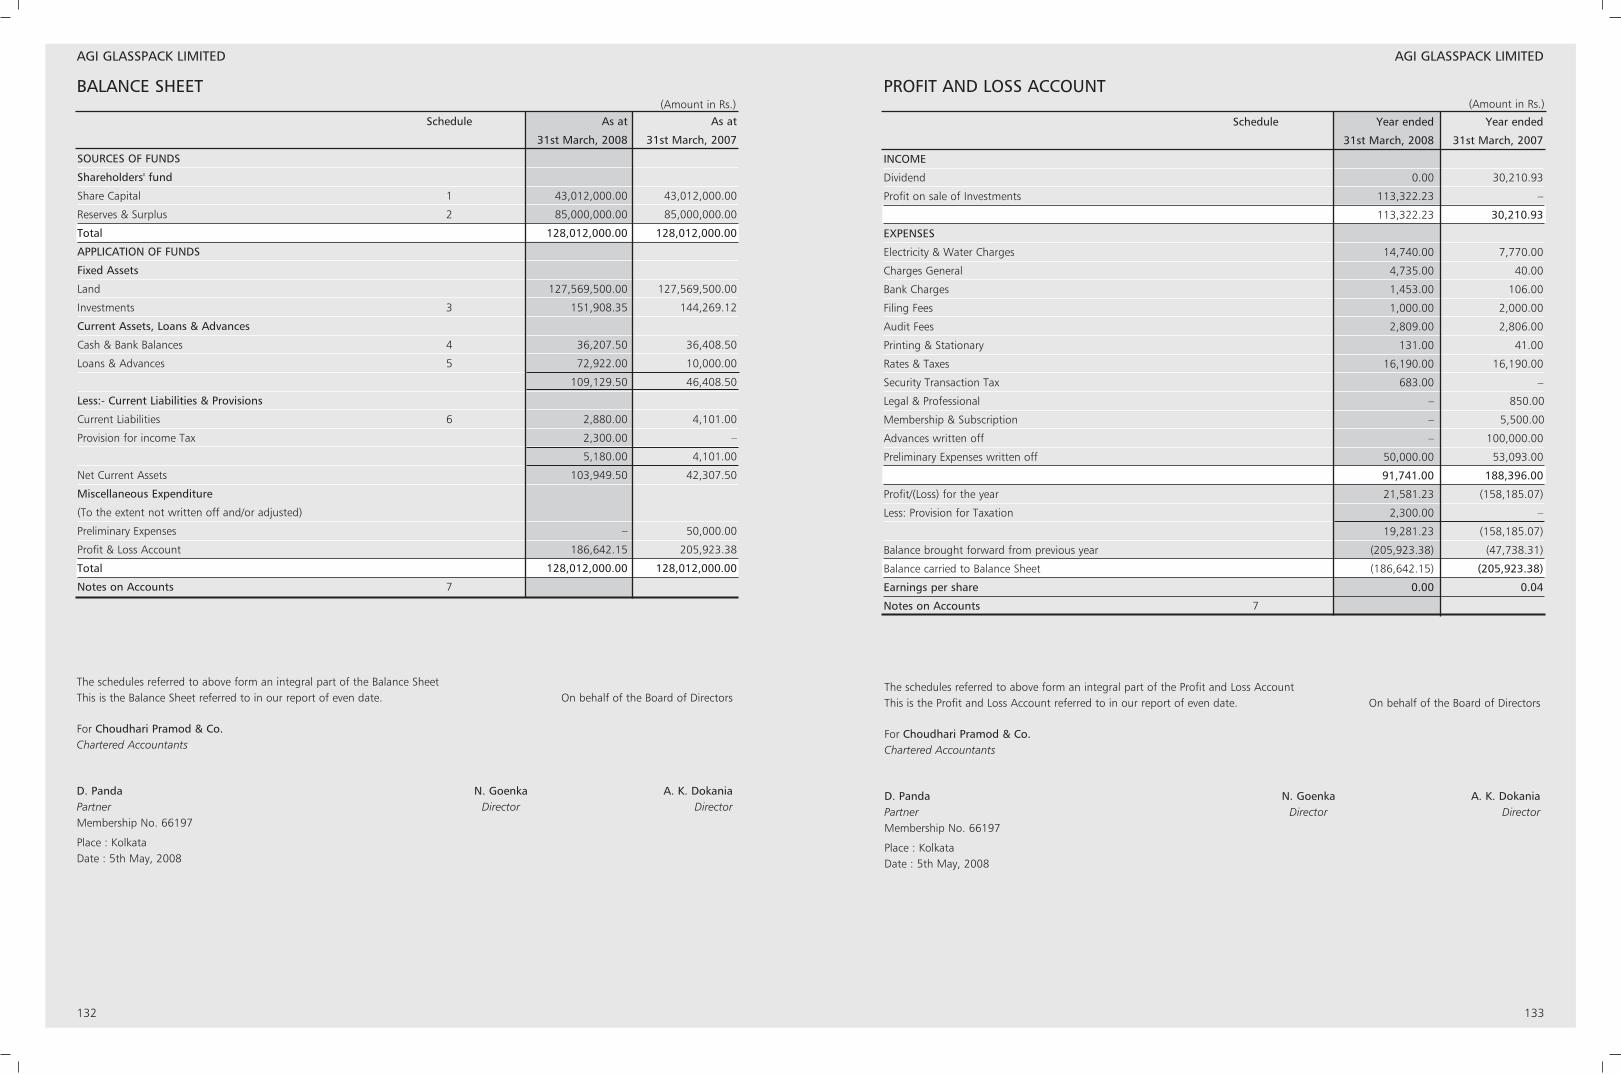
132 133
BALANCE SHEET
The schedules referred to above form an integral part of the Balance SheetThis is the Balance Sheet referred to in our report of even date. On behalf of the Board of Directors
For Choudhari Pramod & Co.Chartered Accountants
D. Panda N. Goenka A. K. DokaniaPartner Director DirectorMembership No. 66197
Place : KolkataDate : 5th May, 2008
(Amount in Rs.)
Schedule As at As at
31st March, 2008 31st March, 2007
SOURCES OF FUNDS
Shareholders' fund
Share Capital 1 43,012,000.00 43,012,000.00
Reserves & Surplus 2 85,000,000.00 85,000,000.00
Total 128,012,000.00 128,012,000.00
APPLICATION OF FUNDS
Fixed Assets
Land 127,569,500.00 127,569,500.00
Investments 3 151,908.35 144,269.12
Current Assets, Loans & Advances
Cash & Bank Balances 4 36,207.50 36,408.50
Loans & Advances 5 72,922.00 10,000.00
109,129.50 46,408.50
Less:- Current Liabilities & Provisions
Current Liabilities 6 2,880.00 4,101.00
Provision for income Tax 2,300.00 –
5,180.00 4,101.00
Net Current Assets 103,949.50 42,307.50
Miscellaneous Expenditure
(To the extent not written off and/or adjusted)
Preliminary Expenses – 50,000.00
Profit & Loss Account 186,642.15 205,923.38
Total 128,012,000.00 128,012,000.00
Notes on Accounts 7
AGI GLASSPACK LIMITED
PROFIT AND LOSS ACCOUNT(Amount in Rs.)
Schedule Year ended Year ended
31st March, 2008 31st March, 2007
INCOME
Dividend 0.00 30,210.93
Profit on sale of Investments 113,322.23 –
113,322.23 30,210.93
EXPENSES
Electricity & Water Charges 14,740.00 7,770.00
Charges General 4,735.00 40.00
Bank Charges 1,453.00 106.00
Filing Fees 1,000.00 2,000.00
Audit Fees 2,809.00 2,806.00
Printing & Stationary 131.00 41.00
Rates & Taxes 16,190.00 16,190.00
Security Transaction Tax 683.00 –
Legal & Professional – 850.00
Membership & Subscription – 5,500.00
Advances written off – 100,000.00
Preliminary Expenses written off 50,000.00 53,093.00
91,741.00 188,396.00
Profit/(Loss) for the year 21,581.23 (158,185.07)
Less: Provision for Taxation 2,300.00 –
19,281.23 (158,185.07)
Balance brought forward from previous year (205,923.38) (47,738.31)
Balance carried to Balance Sheet (186,642.15) (205,923.38)
Earnings per share 0.00 0.04
Notes on Accounts 7
The schedules referred to above form an integral part of the Profit and Loss AccountThis is the Profit and Loss Account referred to in our report of even date. On behalf of the Board of Directors
For Choudhari Pramod & Co.Chartered Accountants
D. Panda N. Goenka A. K. DokaniaPartner Director DirectorMembership No. 66197
Place : KolkataDate : 5th May, 2008
AGI GLASSPACK LIMITED
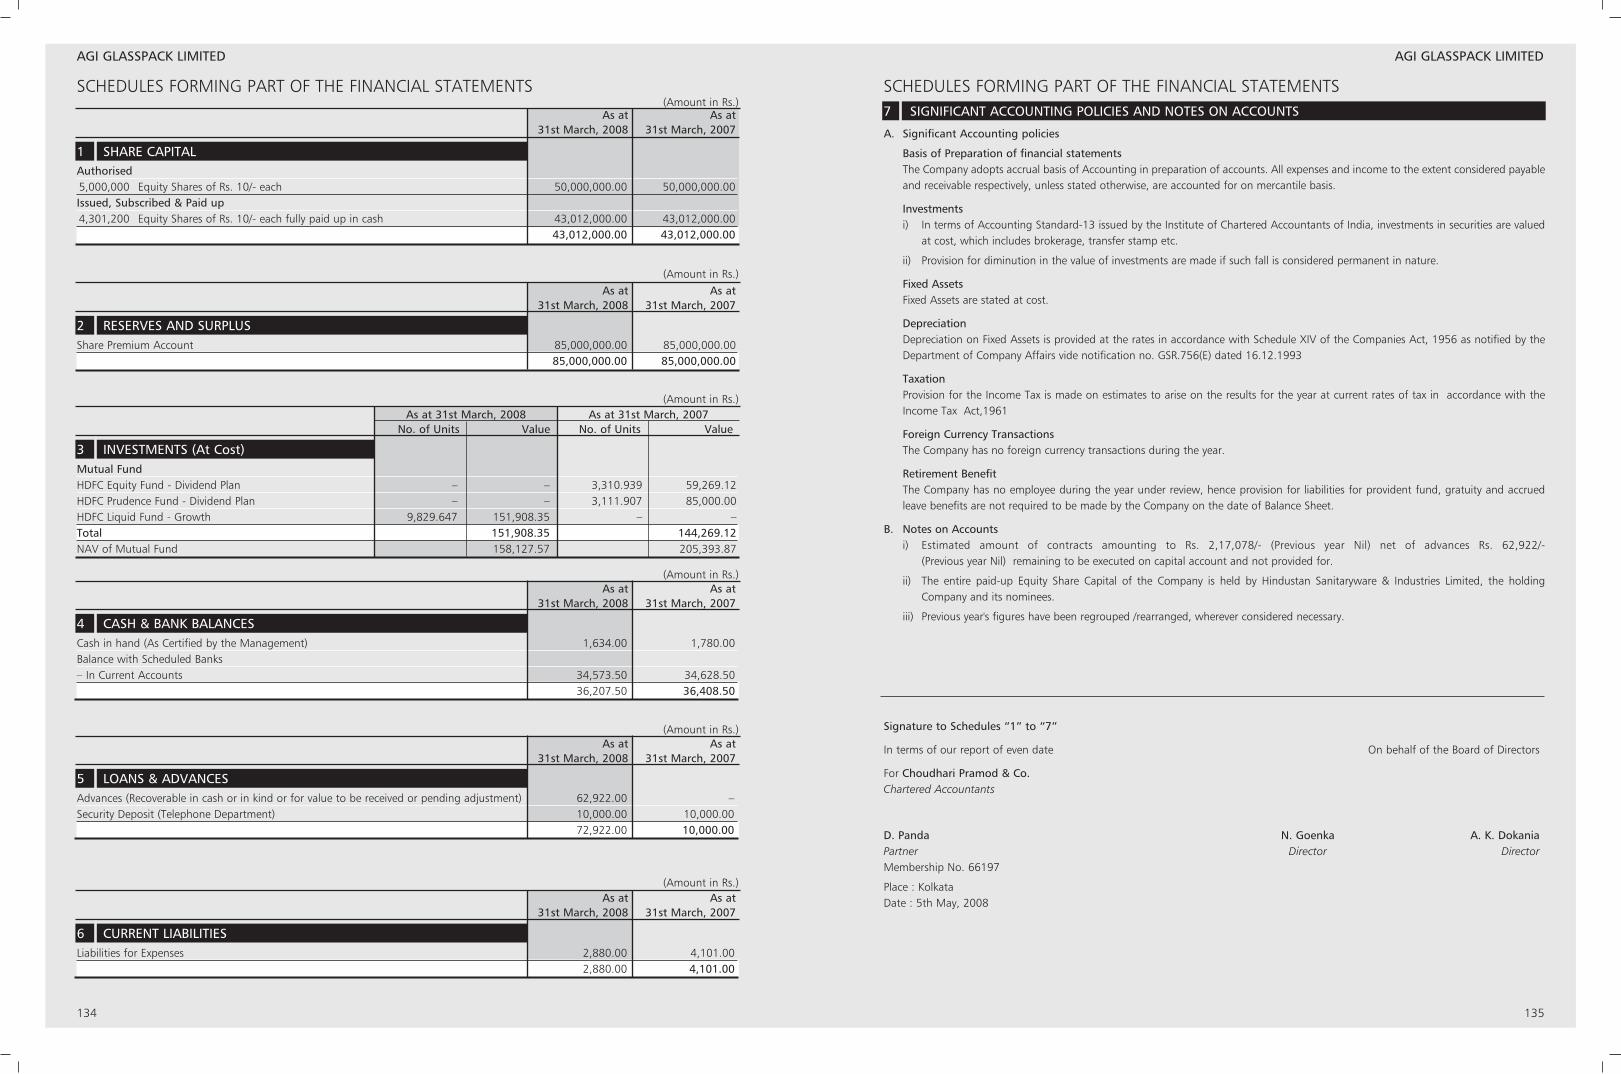
134 135
SCHEDULES FORMING PART OF THE FINANCIAL STATEMENTS(Amount in Rs.)
As at As at31st March, 2008 31st March, 2007
Authorised5,000,000 Equity Shares of Rs. 10/- each 50,000,000.00 50,000,000.00Issued, Subscribed & Paid up4,301,200 Equity Shares of Rs. 10/- each fully paid up in cash 43,012,000.00 43,012,000.00
43,012,000.00 43,012,000.00
1 SHARE CAPITAL
7 SIGNIFICANT ACCOUNTING POLICIES AND NOTES ON ACCOUNTS
(Amount in Rs.)As at As at
31st March, 2008 31st March, 2007
Share Premium Account 85,000,000.00 85,000,000.0085,000,000.00 85,000,000.00
2 RESERVES AND SURPLUS
(Amount in Rs.)As at As at
31st March, 2008 31st March, 2007
Cash in hand (As Certified by the Management) 1,634.00 1,780.00Balance with Scheduled Banks– In Current Accounts 34,573.50 34,628.50
36,207.50 36,408.50
4 CASH & BANK BALANCES
(Amount in Rs.)As at As at
31st March, 2008 31st March, 2007
Advances (Recoverable in cash or in kind or for value to be received or pending adjustment) 62,922.00 –Security Deposit (Telephone Department) 10,000.00 10,000.00
72,922.00 10,000.00
5 LOANS & ADVANCES
(Amount in Rs.)As at As at
31st March, 2008 31st March, 2007
Liabilities for Expenses 2,880.00 4,101.002,880.00 4,101.00
6 CURRENT LIABILITIES
(Amount in Rs.)As at 31st March, 2008 As at 31st March, 2007
No. of Units Value No. of Units Value
Mutual FundHDFC Equity Fund - Dividend Plan – – 3,310.939 59,269.12HDFC Prudence Fund - Dividend Plan – – 3,111.907 85,000.00HDFC Liquid Fund - Growth 9,829.647 151,908.35 – –Total 151,908.35 144,269.12NAV of Mutual Fund 158,127.57 205,393.87
3 INVESTMENTS (At Cost)
SCHEDULES FORMING PART OF THE FINANCIAL STATEMENTS
AGI GLASSPACK LIMITED
A. Significant Accounting policies
Basis of Preparation of financial statementsThe Company adopts accrual basis of Accounting in preparation of accounts. All expenses and income to the extent considered payableand receivable respectively, unless stated otherwise, are accounted for on mercantile basis.
Investmentsi) In terms of Accounting Standard-13 issued by the Institute of Chartered Accountants of India, investments in securities are valued
at cost, which includes brokerage, transfer stamp etc.
ii) Provision for diminution in the value of investments are made if such fall is considered permanent in nature.
Fixed AssetsFixed Assets are stated at cost.
DepreciationDepreciation on Fixed Assets is provided at the rates in accordance with Schedule XIV of the Companies Act, 1956 as notified by theDepartment of Company Affairs vide notification no. GSR.756(E) dated 16.12.1993
TaxationProvision for the Income Tax is made on estimates to arise on the results for the year at current rates of tax in accordance with theIncome Tax Act,1961
Foreign Currency TransactionsThe Company has no foreign currency transactions during the year.
Retirement BenefitThe Company has no employee during the year under review, hence provision for liabilities for provident fund, gratuity and accruedleave benefits are not required to be made by the Company on the date of Balance Sheet.
B. Notes on Accountsi) Estimated amount of contracts amounting to Rs. 2,17,078/- (Previous year Nil) net of advances Rs. 62,922/-
(Previous year Nil) remaining to be executed on capital account and not provided for.
ii) The entire paid-up Equity Share Capital of the Company is held by Hindustan Sanitaryware & Industries Limited, the holdingCompany and its nominees.
iii) Previous year's figures have been regrouped /rearranged, wherever considered necessary.
Signature to Schedules “1” to “7”
In terms of our report of even date On behalf of the Board of Directors
For Choudhari Pramod & Co.Chartered Accountants
D. Panda N. Goenka A. K. DokaniaPartner Director DirectorMembership No. 66197
Place : KolkataDate : 5th May, 2008
AGI GLASSPACK LIMITED
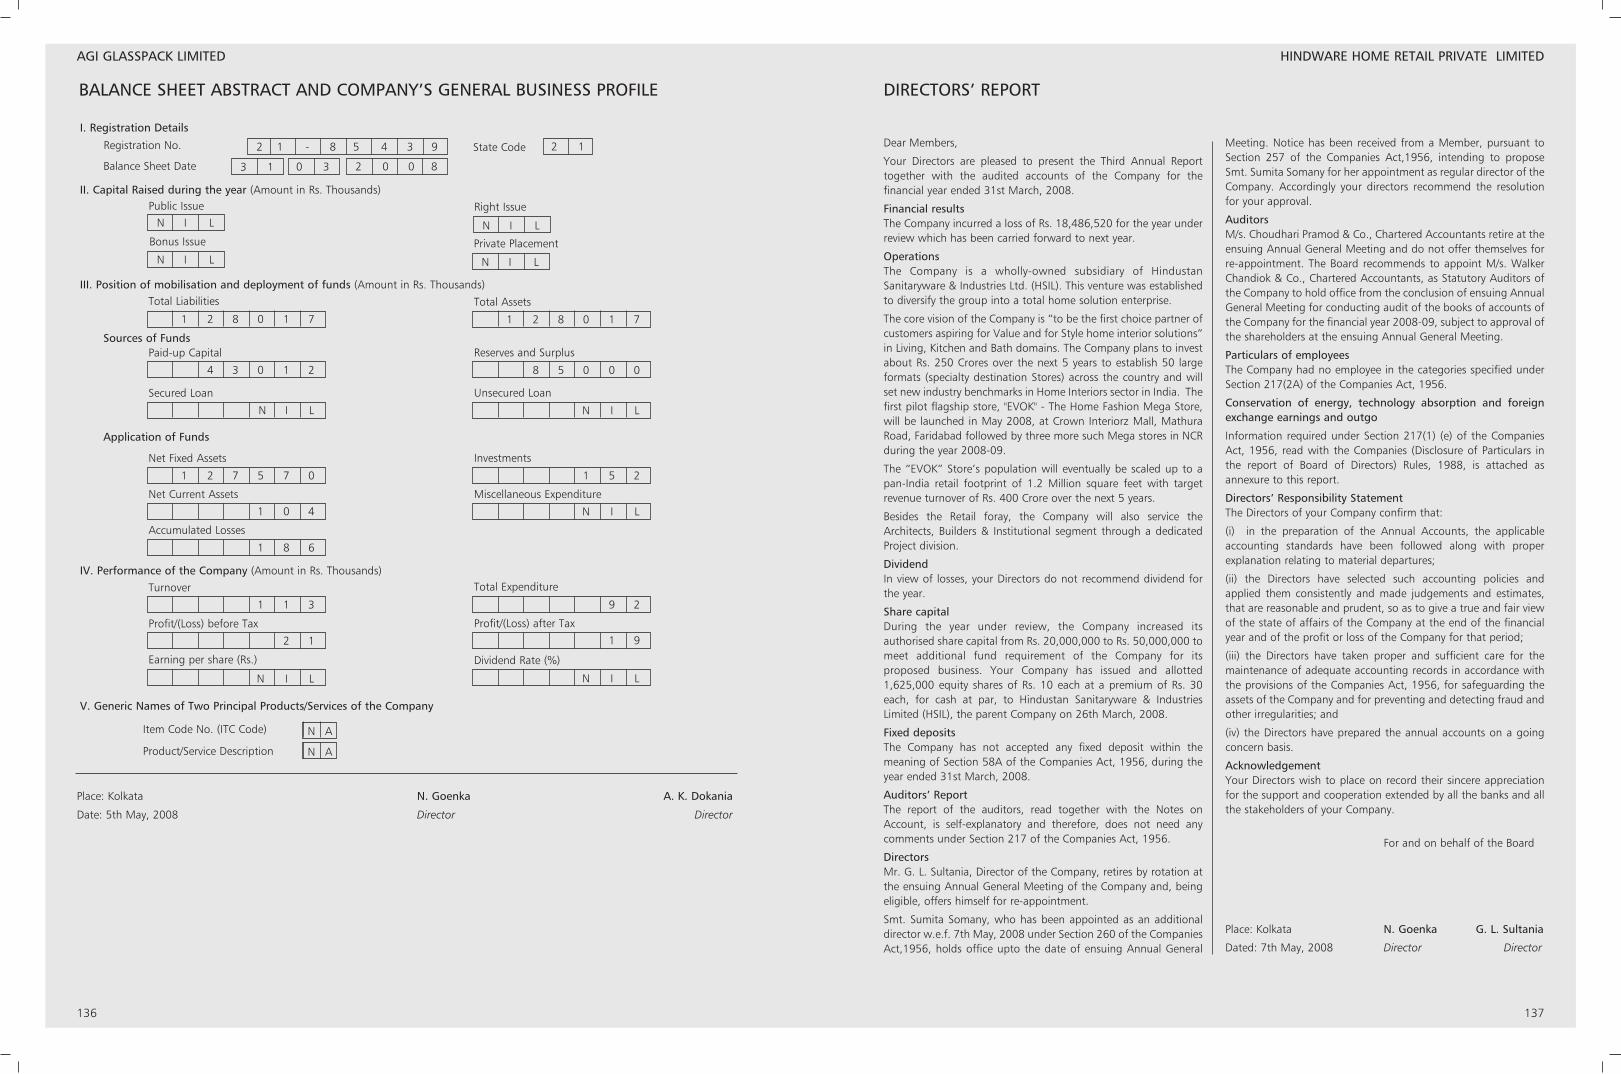
136 137
AGI GLASSPACK LIMITED
BALANCE SHEET ABSTRACT AND COMPANY’S GENERAL BUSINESS PROFILE DIRECTORS’ REPORT
Public IssueN I L
N I L
Bonus Issue
Right Issue
N I L
Private Placement
3 1 0 3
Registration No. State Code
Balance Sheet Date
I. Registration Details
II. Capital Raised during the year (Amount in Rs. Thousands)
Total Liabilities
1 2 8 0 1 7
III. Position of mobilisation and deployment of funds (Amount in Rs. Thousands)
2 0 0 8
2 1
Total Assets
1 2 8 0 1 7
Paid-up CapitalSources of Funds
4 3 0 1 2
Reserves and Surplus
8 5 0 0 0
Secured Loan
N I L
Unsecured Loan
N I L
Net Fixed Assets
Application of Funds
1 2 7 5 7 0
Investments
1 5 2
Net Current Assets
1 0 4
Miscellaneous Expenditure
N I L
Accumulated Losses
1 8 6
N I L
IV. Performance of the Company (Amount in Rs. Thousands)
Item Code No. (ITC Code)
Product/Service Description
V. Generic Names of Two Principal Products/Services of the Company
Turnover
1 1 3
Total Expenditure
9 2
Profit/(Loss) before Tax
2 1
Profit/(Loss) after Tax
1 9
Earning per share (Rs.)
N I L
Dividend Rate (%)
N I L
N A
N A
2 1 - 8 5 4 3 9
Place: Kolkata N. Goenka A. K. Dokania
Date: 5th May, 2008 Director Director
HINDWARE HOME RETAIL PRIVATE LIMITED
Dear Members,
Your Directors are pleased to present the Third Annual Reporttogether with the audited accounts of the Company for thefinancial year ended 31st March, 2008.
Financial results The Company incurred a loss of Rs. 18,486,520 for the year underreview which has been carried forward to next year.
Operations The Company is a wholly-owned subsidiary of HindustanSanitaryware & Industries Ltd. (HSIL). This venture was establishedto diversify the group into a total home solution enterprise.
The core vision of the Company is “to be the first choice partner ofcustomers aspiring for Value and for Style home interior solutions”in Living, Kitchen and Bath domains. The Company plans to investabout Rs. 250 Crores over the next 5 years to establish 50 largeformats (specialty destination Stores) across the country and willset new industry benchmarks in Home Interiors sector in India. Thefirst pilot flagship store, "EVOK" - The Home Fashion Mega Store,will be launched in May 2008, at Crown Interiorz Mall, MathuraRoad, Faridabad followed by three more such Mega stores in NCRduring the year 2008-09.
The “EVOK” Store’s population will eventually be scaled up to apan-India retail footprint of 1.2 Million square feet with targetrevenue turnover of Rs. 400 Crore over the next 5 years.
Besides the Retail foray, the Company will also service theArchitects, Builders & Institutional segment through a dedicatedProject division.
DividendIn view of losses, your Directors do not recommend dividend forthe year.
Share capitalDuring the year under review, the Company increased itsauthorised share capital from Rs. 20,000,000 to Rs. 50,000,000 tomeet additional fund requirement of the Company for itsproposed business. Your Company has issued and allotted1,625,000 equity shares of Rs. 10 each at a premium of Rs. 30each, for cash at par, to Hindustan Sanitaryware & IndustriesLimited (HSIL), the parent Company on 26th March, 2008.
Fixed depositsThe Company has not accepted any fixed deposit within themeaning of Section 58A of the Companies Act, 1956, during theyear ended 31st March, 2008.
Auditors’ ReportThe report of the auditors, read together with the Notes onAccount, is self-explanatory and therefore, does not need anycomments under Section 217 of the Companies Act, 1956.
DirectorsMr. G. L. Sultania, Director of the Company, retires by rotation atthe ensuing Annual General Meeting of the Company and, beingeligible, offers himself for re-appointment.
Smt. Sumita Somany, who has been appointed as an additionaldirector w.e.f. 7th May, 2008 under Section 260 of the CompaniesAct,1956, holds office upto the date of ensuing Annual General
Meeting. Notice has been received from a Member, pursuant toSection 257 of the Companies Act,1956, intending to proposeSmt. Sumita Somany for her appointment as regular director of theCompany. Accordingly your directors recommend the resolutionfor your approval.
AuditorsM/s. Choudhari Pramod & Co., Chartered Accountants retire at theensuing Annual General Meeting and do not offer themselves forre-appointment. The Board recommends to appoint M/s. WalkerChandiok & Co., Chartered Accountants, as Statutory Auditors ofthe Company to hold office from the conclusion of ensuing AnnualGeneral Meeting for conducting audit of the books of accounts ofthe Company for the financial year 2008-09, subject to approval ofthe shareholders at the ensuing Annual General Meeting.
Particulars of employeesThe Company had no employee in the categories specified underSection 217(2A) of the Companies Act, 1956.
Conservation of energy, technology absorption and foreignexchange earnings and outgo
Information required under Section 217(1) (e) of the CompaniesAct, 1956, read with the Companies (Disclosure of Particulars inthe report of Board of Directors) Rules, 1988, is attached asannexure to this report.
Directors’ Responsibility StatementThe Directors of your Company confirm that:
(i) in the preparation of the Annual Accounts, the applicableaccounting standards have been followed along with properexplanation relating to material departures;
(ii) the Directors have selected such accounting policies andapplied them consistently and made judgements and estimates,that are reasonable and prudent, so as to give a true and fair viewof the state of affairs of the Company at the end of the financialyear and of the profit or loss of the Company for that period;
(iii) the Directors have taken proper and sufficient care for themaintenance of adequate accounting records in accordance withthe provisions of the Companies Act, 1956, for safeguarding theassets of the Company and for preventing and detecting fraud andother irregularities; and
(iv) the Directors have prepared the annual accounts on a goingconcern basis.
AcknowledgementYour Directors wish to place on record their sincere appreciationfor the support and cooperation extended by all the banks and allthe stakeholders of your Company.
For and on behalf of the Board
Place: Kolkata N. Goenka G. L. Sultania
Dated: 7th May, 2008 Director Director

138 139
ANNEXURE TO THE DIRECTORS’ REPORT
Additional information given as required under the Companies (Disclosure of the Particulars in the report of the Board of Directors) Rules,
1988.
A) Conservation Of Energy
a) Energy conservation measures taken:
• Synchronised and balanced running of equipments and machinery
• Creating awareness in workmen and implementing discipline of switching off fans, lights and other equipments immediately
after work to eliminate all kinds of power wastages
b) Additional investments and proposals, if any, being implemented for reduction of consumption of energy:
The Company has installed energy efficient equipments to save consumption of energy.
c) Impact of measures (a) and (b) above for reduction of energy consumption and consequent impact on the cost of production of
goods:
Not applicable, since this being the first year of operations in the Company.
d) Total energy consumption and energy consumption per unit of production:
Not applicable in case of our Company.
B) Technology Absorption
Research and Development (R&D)
1) Specific areas in which R&D was carried out by the Company: Not applicable
2) Benefits derived, as a result of the above R&D: Not applicable
3) Future plan of action and expenditure on R&D: Not applicable
Technology absorption, adaptation and innovation
Efforts made and benefit arrived: Not applicable
C) Foreign Exchange Earnings And Outgo: (Rs. in thousands)
a. Foreign exchange outgo - 16,716
b. Foreign currency earned - Nil
For and on behalf of the Board
Place: Kolkata N. Goenka G. L. Sultania
Dated: 7th May, 2008 Director Director
We have audited the attached Balance Sheet of HINDWARE HOMERETAIL PRIVATE LIMITED as at 31st March, 2008 and the Profit andLoss Account for the year ended on that date annexed thereto.These financial statements are the responsibility of the Company’smanagement. Our responsibility is to express an opinion on thesefinancial statements based on our audit.
We conducted our auditing in accordance with auditing standardsgenerally accepted in India. Those standards require that we planand perform the audit to obtain reasonable assurance aboutwhether the financial statements are free of materialmisstatement. An audit includes examining, on a test basis,evidence supporting the amounts and disclosures in the financialstatement presentation. We believe that our audit provides areasonable basis for our opinion.
As required by the Companies (Auditors’ Report) Order, 2003 andas amended by Companies (Auditors’ Report) (Amendment Order),2004 issued by the Central Government of India in terms of sub-section (4A) of Section 227 of the Companies Act, 1956, weenclose in the Annexure a statement on the matters specified inparagraph 4 and 5 of the said order.
Further to our comments in the Annexure referred to above, wereport that:
1. We have obtained all the information and explanations, whichto the best of our knowledge and belief were necessary for thepurpose of our audit.
2. In our opinion proper books of accounts as required by lawhave been kept by the Company so far as appears from ourexamination of such books.
3. The Balance Sheet and Profit & Loss Account are in agreementwith the Books of Accounts.
4. In our opinion, the Profit and Loss account and the BalanceSheet dealt with by this report comply with the accounting
standards referred to in sub-section (3C) of Section 211 of theCompanies Act, 1956.
5. During the course of our Audit, we have not come across withany such observation which has any adverse effect on thefunctioning of the Company.
6. Pursuant to the provisions of sub-section (1) (g) of Section274 of the Companies Act, 1956, we report as under:
On the basis of written representation received from thedirectors, as on 31st March, 2008 and taken on record by theBoard of directors, we report that none of the Director isdisqualified as on 31st March, 2008 from being appointed asa Director in terms of clause (g) of sub-section (1) of Section274 of the Companies Act, 1956.
7. In our opinion and to the best of our information andaccording to the explanation given to us, the said accountsgive the information required by the Companies Act, 1956 inthe manner as required and give a true and fair view inconformity with the accounting principles generally acceptedin India:
a) In the case of Balance Sheet, of the state of affairs of theCompany as at 31st March, 2008; and
b) In the case of Profit & Loss Account of the Loss for theperiod ended on that date.
c) In the case of Cash Flow Statement of the Cash Flows forthe year ended on that date.
For Choudhari Pramod & Co.Chartered Accountants
D. PandaPlace : Kolkata PartnerDate : 7th May, 2008 Membership No. 66197
To
The Members of
Hindware Home Retail Private Limited
AUDITORS’ REPORT
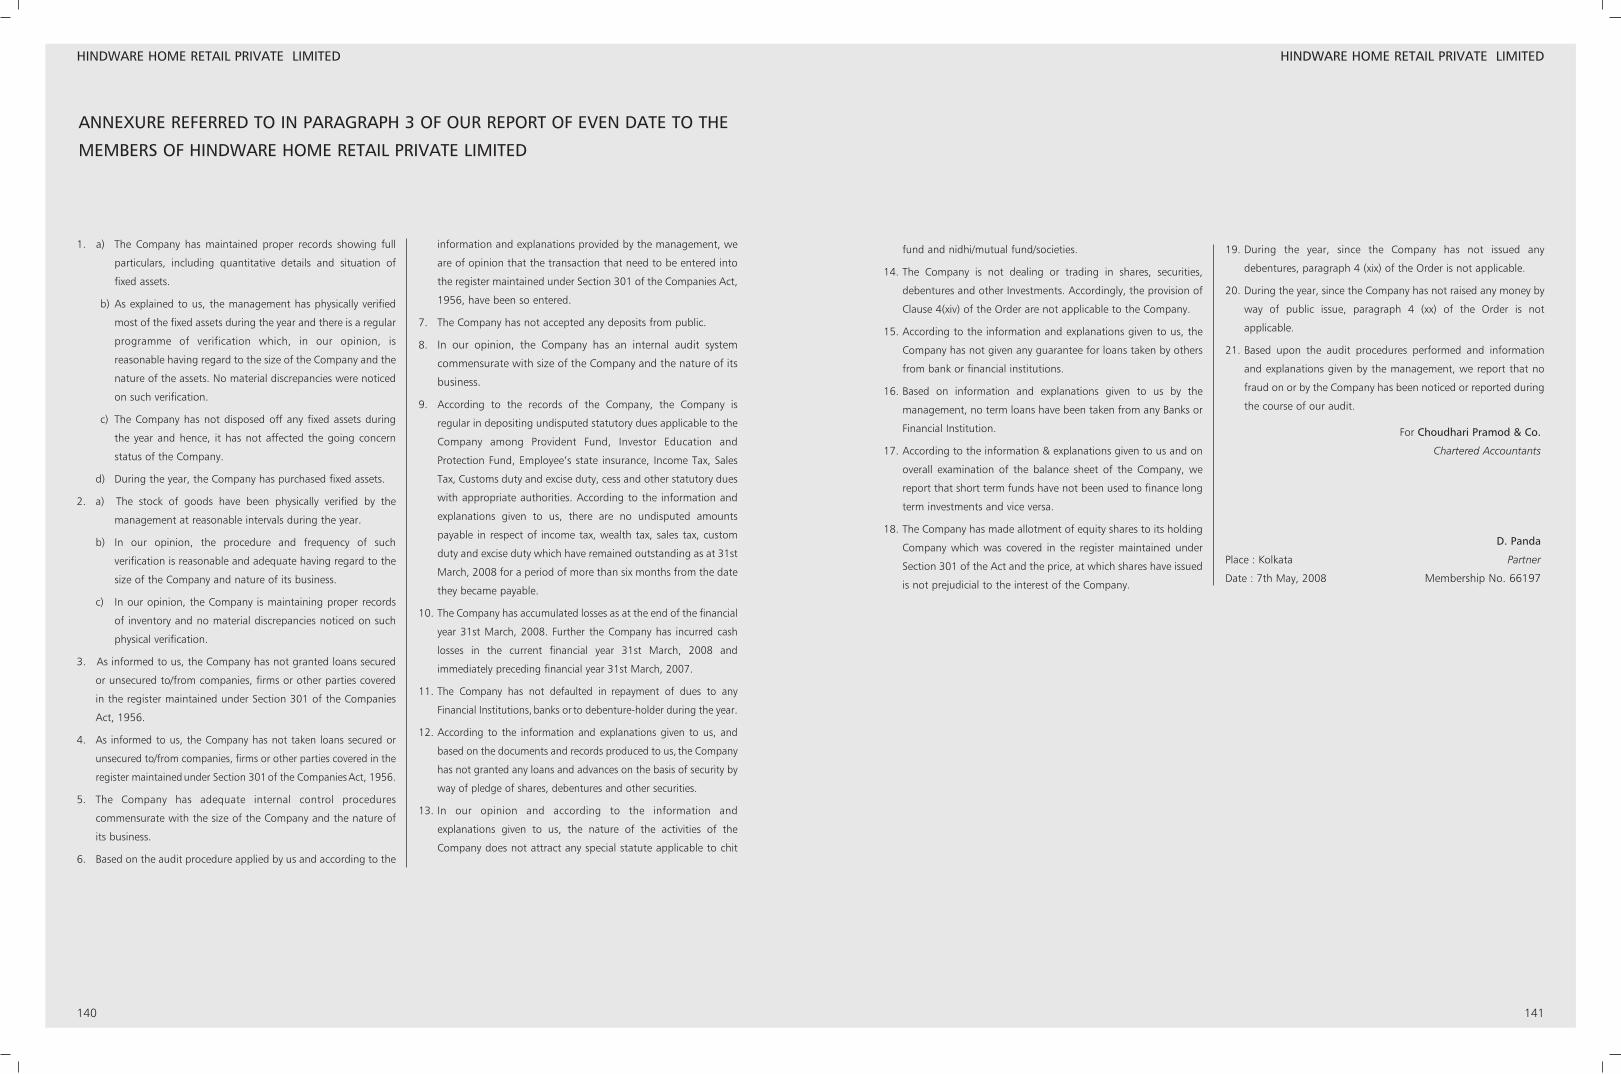
140 141
HINDWARE HOME RETAIL PRIVATE LIMITED
ANNEXURE REFERRED TO IN PARAGRAPH 3 OF OUR REPORT OF EVEN DATE TO THE
MEMBERS OF HINDWARE HOME RETAIL PRIVATE LIMITED
1. a) The Company has maintained proper records showing full
particulars, including quantitative details and situation of
fixed assets.
b) As explained to us, the management has physically verified
most of the fixed assets during the year and there is a regular
programme of verification which, in our opinion, is
reasonable having regard to the size of the Company and the
nature of the assets. No material discrepancies were noticed
on such verification.
c) The Company has not disposed off any fixed assets during
the year and hence, it has not affected the going concern
status of the Company.
d) During the year, the Company has purchased fixed assets.
2. a) The stock of goods have been physically verified by the
management at reasonable intervals during the year.
b) In our opinion, the procedure and frequency of such
verification is reasonable and adequate having regard to the
size of the Company and nature of its business.
c) In our opinion, the Company is maintaining proper records
of inventory and no material discrepancies noticed on such
physical verification.
3. As informed to us, the Company has not granted loans secured
or unsecured to/from companies, firms or other parties covered
in the register maintained under Section 301 of the Companies
Act, 1956.
4. As informed to us, the Company has not taken loans secured or
unsecured to/from companies, firms or other parties covered in the
register maintained under Section 301 of the Companies Act, 1956.
5. The Company has adequate internal control procedures
commensurate with the size of the Company and the nature of
its business.
6. Based on the audit procedure applied by us and according to the
information and explanations provided by the management, we
are of opinion that the transaction that need to be entered into
the register maintained under Section 301 of the Companies Act,
1956, have been so entered.
7. The Company has not accepted any deposits from public.
8. In our opinion, the Company has an internal audit system
commensurate with size of the Company and the nature of its
business.
9. According to the records of the Company, the Company is
regular in depositing undisputed statutory dues applicable to the
Company among Provident Fund, Investor Education and
Protection Fund, Employee’s state insurance, Income Tax, Sales
Tax, Customs duty and excise duty, cess and other statutory dues
with appropriate authorities. According to the information and
explanations given to us, there are no undisputed amounts
payable in respect of income tax, wealth tax, sales tax, custom
duty and excise duty which have remained outstanding as at 31st
March, 2008 for a period of more than six months from the date
they became payable.
10. The Company has accumulated losses as at the end of the financial
year 31st March, 2008. Further the Company has incurred cash
losses in the current financial year 31st March, 2008 and
immediately preceding financial year 31st March, 2007.
11. The Company has not defaulted in repayment of dues to any
Financial Institutions,banks or to debenture-holder during the year.
12. According to the information and explanations given to us, and
based on the documents and records produced to us, the Company
has not granted any loans and advances on the basis of security by
way of pledge of shares, debentures and other securities.
13. In our opinion and according to the information and
explanations given to us, the nature of the activities of the
Company does not attract any special statute applicable to chit
fund and nidhi/mutual fund/societies.
14. The Company is not dealing or trading in shares, securities,
debentures and other Investments. Accordingly, the provision of
Clause 4(xiv) of the Order are not applicable to the Company.
15. According to the information and explanations given to us, the
Company has not given any guarantee for loans taken by others
from bank or financial institutions.
16. Based on information and explanations given to us by the
management, no term loans have been taken from any Banks or
Financial Institution.
17. According to the information & explanations given to us and on
overall examination of the balance sheet of the Company, we
report that short term funds have not been used to finance long
term investments and vice versa.
18. The Company has made allotment of equity shares to its holding
Company which was covered in the register maintained under
Section 301 of the Act and the price, at which shares have issued
is not prejudicial to the interest of the Company.
19. During the year, since the Company has not issued any
debentures, paragraph 4 (xix) of the Order is not applicable.
20. During the year, since the Company has not raised any money by
way of public issue, paragraph 4 (xx) of the Order is not
applicable.
21. Based upon the audit procedures performed and information
and explanations given by the management, we report that no
fraud on or by the Company has been noticed or reported during
the course of our audit.
For Choudhari Pramod & Co.
Chartered Accountants
D. Panda
Place : Kolkata Partner
Date : 7th May, 2008 Membership No. 66197
HINDWARE HOME RETAIL PRIVATE LIMITED
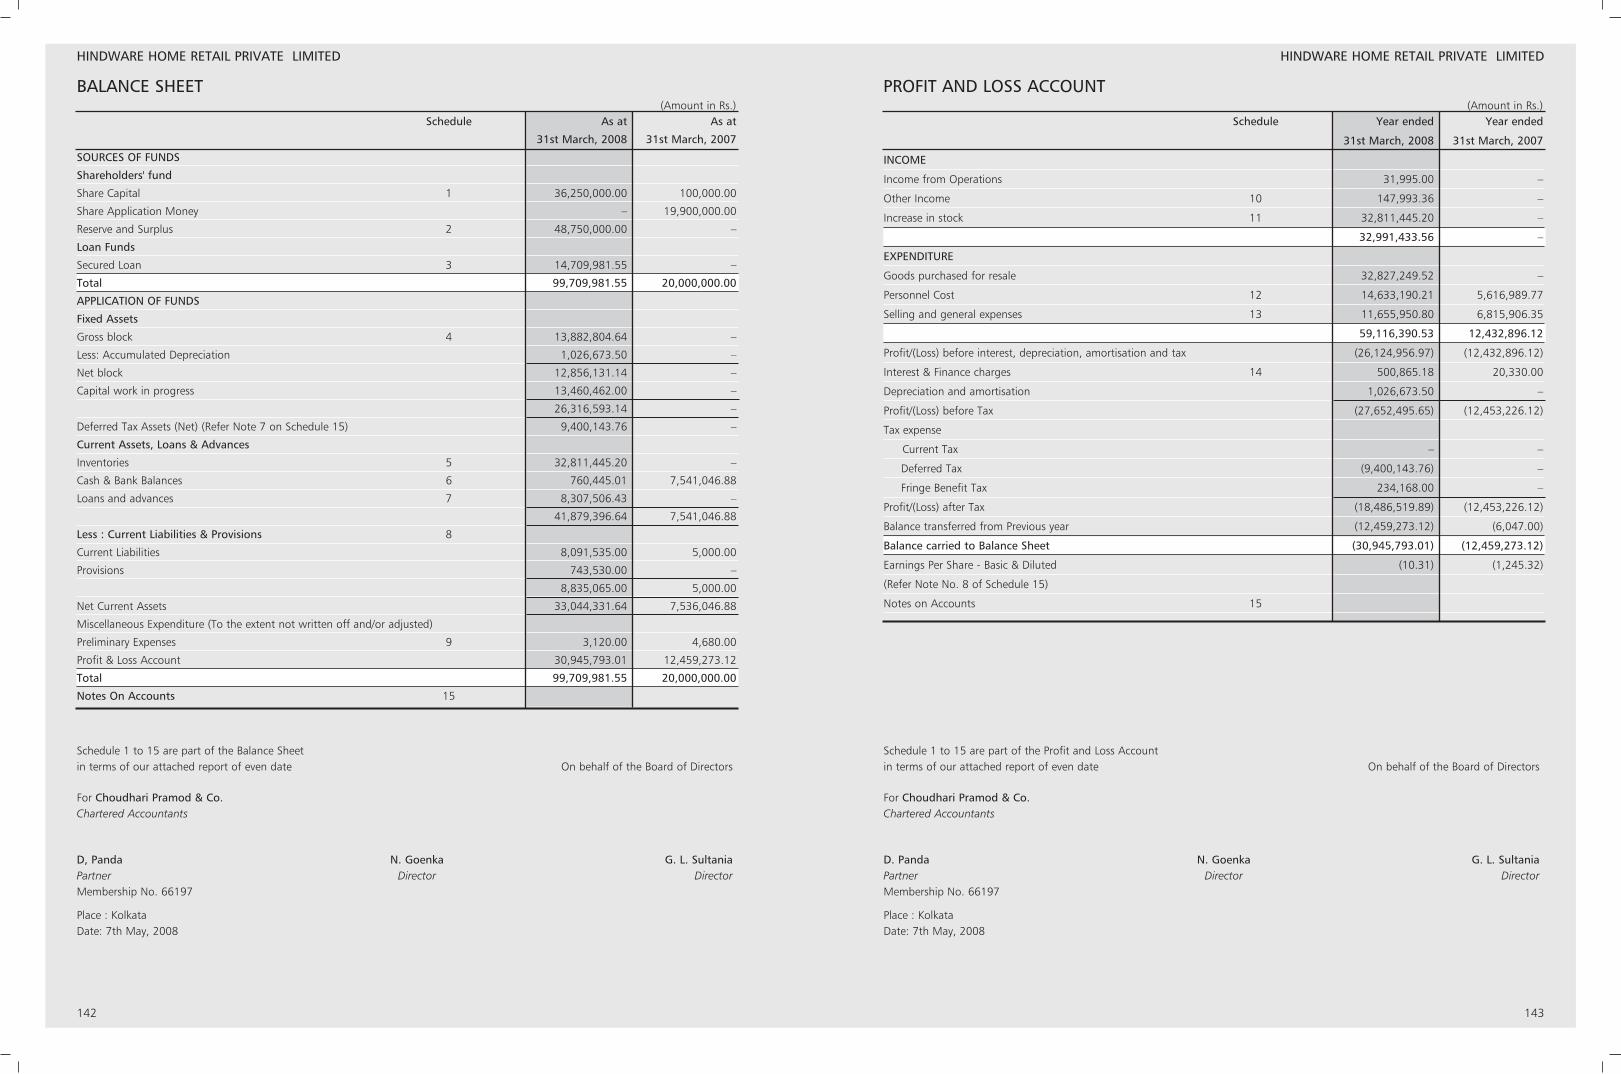
142 143
HINDWARE HOME RETAIL PRIVATE LIMITED
BALANCE SHEET
Schedule 1 to 15 are part of the Balance Sheetin terms of our attached report of even date On behalf of the Board of Directors
For Choudhari Pramod & Co.Chartered Accountants
D, Panda N. Goenka G. L. SultaniaPartner Director DirectorMembership No. 66197
Place : KolkataDate: 7th May, 2008
(Amount in Rs.)Schedule As at As at
31st March, 2008 31st March, 2007
SOURCES OF FUNDS
Shareholders' fund
Share Capital 1 36,250,000.00 100,000.00
Share Application Money – 19,900,000.00
Reserve and Surplus 2 48,750,000.00 –
Loan Funds
Secured Loan 3 14,709,981.55 –
Total 99,709,981.55 20,000,000.00
APPLICATION OF FUNDS
Fixed Assets
Gross block 4 13,882,804.64 –
Less: Accumulated Depreciation 1,026,673.50 –
Net block 12,856,131.14 –
Capital work in progress 13,460,462.00 –
26,316,593.14 –
Deferred Tax Assets (Net) (Refer Note 7 on Schedule 15) 9,400,143.76 –
Current Assets, Loans & Advances
Inventories 5 32,811,445.20 –
Cash & Bank Balances 6 760,445.01 7,541,046.88
Loans and advances 7 8,307,506.43 –
41,879,396.64 7,541,046.88
Less : Current Liabilities & Provisions 8
Current Liabilities 8,091,535.00 5,000.00
Provisions 743,530.00 –
8,835,065.00 5,000.00
Net Current Assets 33,044,331.64 7,536,046.88
Miscellaneous Expenditure (To the extent not written off and/or adjusted)
Preliminary Expenses 9 3,120.00 4,680.00
Profit & Loss Account 30,945,793.01 12,459,273.12
Total 99,709,981.55 20,000,000.00
Notes On Accounts 15
Schedule 1 to 15 are part of the Profit and Loss Accountin terms of our attached report of even date On behalf of the Board of Directors
For Choudhari Pramod & Co.Chartered Accountants
D. Panda N. Goenka G. L. SultaniaPartner Director DirectorMembership No. 66197
Place : KolkataDate: 7th May, 2008
(Amount in Rs.)Schedule Year ended Year ended
31st March, 2008 31st March, 2007
INCOME
Income from Operations 31,995.00 –
Other Income 10 147,993.36 –
Increase in stock 11 32,811,445.20 –
32,991,433.56 –
EXPENDITURE
Goods purchased for resale 32,827,249.52 –
Personnel Cost 12 14,633,190.21 5,616,989.77
Selling and general expenses 13 11,655,950.80 6,815,906.35
59,116,390.53 12,432,896.12
Profit/(Loss) before interest, depreciation, amortisation and tax (26,124,956.97) (12,432,896.12)
Interest & Finance charges 14 500,865.18 20,330.00
Depreciation and amortisation 1,026,673.50 –
Profit/(Loss) before Tax (27,652,495.65) (12,453,226.12)
Tax expense
Current Tax – –
Deferred Tax (9,400,143.76) –
Fringe Benefit Tax 234,168.00 –
Profit/(Loss) after Tax (18,486,519.89) (12,453,226.12)
Balance transferred from Previous year (12,459,273.12) (6,047.00)
Balance carried to Balance Sheet (30,945,793.01) (12,459,273.12)
Earnings Per Share - Basic & Diluted (10.31) (1,245.32)
(Refer Note No. 8 of Schedule 15)
Notes on Accounts 15
PROFIT AND LOSS ACCOUNT
HINDWARE HOME RETAIL PRIVATE LIMITED
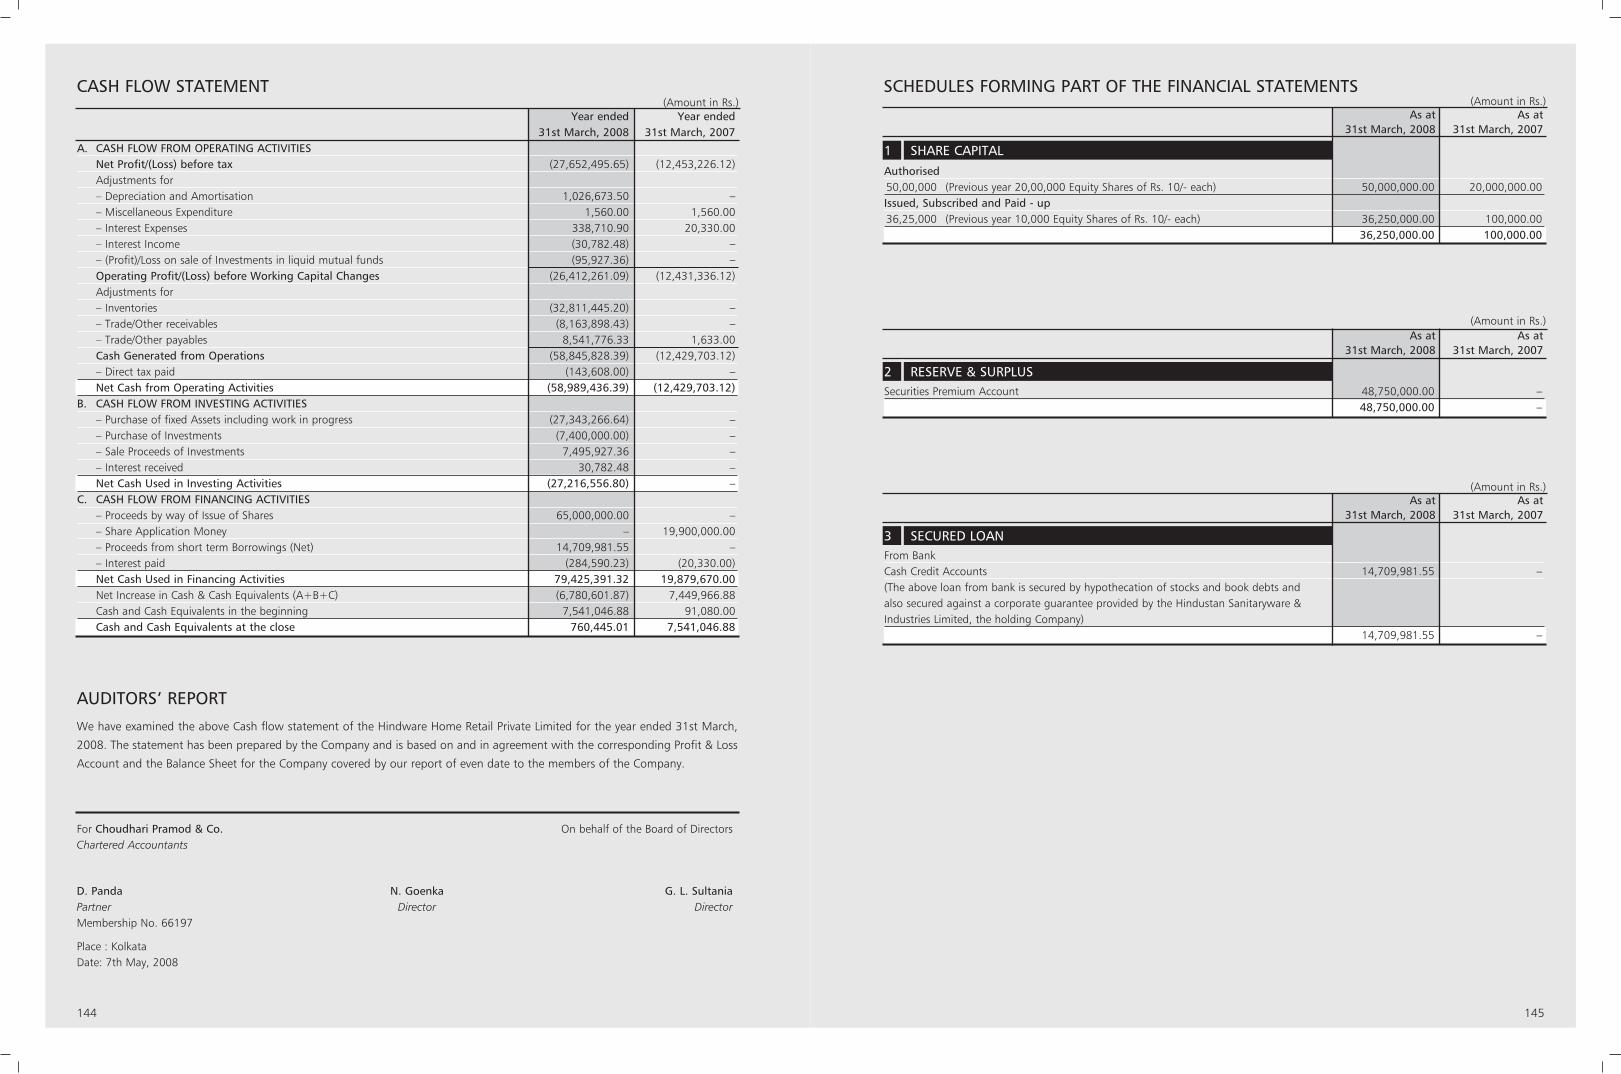
SCHEDULES FORMING PART OF THE FINANCIAL STATEMENTS
144 145
CASH FLOW STATEMENT(Amount in Rs.)
Year ended Year ended31st March, 2008 31st March, 2007
A. CASH FLOW FROM OPERATING ACTIVITIESNet Profit/(Loss) before tax (27,652,495.65) (12,453,226.12)Adjustments for – Depreciation and Amortisation 1,026,673.50 –– Miscellaneous Expenditure 1,560.00 1,560.00 – Interest Expenses 338,710.90 20,330.00 – Interest Income (30,782.48) –– (Profit)/Loss on sale of Investments in liquid mutual funds (95,927.36) –Operating Profit/(Loss) before Working Capital Changes (26,412,261.09) (12,431,336.12)Adjustments for– Inventories (32,811,445.20) –– Trade/Other receivables (8,163,898.43) –– Trade/Other payables 8,541,776.33 1,633.00 Cash Generated from Operations (58,845,828.39) (12,429,703.12)– Direct tax paid (143,608.00) –Net Cash from Operating Activities (58,989,436.39) (12,429,703.12)
B. CASH FLOW FROM INVESTING ACTIVITIES– Purchase of fixed Assets including work in progress (27,343,266.64) –– Purchase of Investments (7,400,000.00) –– Sale Proceeds of Investments 7,495,927.36 –– Interest received 30,782.48 –Net Cash Used in Investing Activities (27,216,556.80) –
C. CASH FLOW FROM FINANCING ACTIVITIES– Proceeds by way of Issue of Shares 65,000,000.00 –– Share Application Money – 19,900,000.00 – Proceeds from short term Borrowings (Net) 14,709,981.55 –– Interest paid (284,590.23) (20,330.00)Net Cash Used in Financing Activities 79,425,391.32 19,879,670.00Net Increase in Cash & Cash Equivalents (A+B+C) (6,780,601.87) 7,449,966.88 Cash and Cash Equivalents in the beginning 7,541,046.88 91,080.00 Cash and Cash Equivalents at the close 760,445.01 7,541,046.88
For Choudhari Pramod & Co. On behalf of the Board of DirectorsChartered Accountants
D. Panda N. Goenka G. L. SultaniaPartner Director DirectorMembership No. 66197
Place : KolkataDate: 7th May, 2008
AUDITORS’ REPORT
We have examined the above Cash flow statement of the Hindware Home Retail Private Limited for the year ended 31st March,
2008. The statement has been prepared by the Company and is based on and in agreement with the corresponding Profit & Loss
Account and the Balance Sheet for the Company covered by our report of even date to the members of the Company.
(Amount in Rs.)As at As at
31st March, 2008 31st March, 2007
Authorised50,00,000 (Previous year 20,00,000 Equity Shares of Rs. 10/- each) 50,000,000.00 20,000,000.00Issued, Subscribed and Paid - up36,25,000 (Previous year 10,000 Equity Shares of Rs. 10/- each) 36,250,000.00 100,000.00
36,250,000.00 100,000.00
1 SHARE CAPITAL
(Amount in Rs.)As at As at
31st March, 2008 31st March, 2007
Securities Premium Account 48,750,000.00 –48,750,000.00 –
2 RESERVE & SURPLUS
(Amount in Rs.)As at As at
31st March, 2008 31st March, 2007
From BankCash Credit Accounts 14,709,981.55 –(The above loan from bank is secured by hypothecation of stocks and book debts and also secured against a corporate guarantee provided by the Hindustan Sanitaryware & Industries Limited, the holding Company)
14,709,981.55 –
3 SECURED LOAN
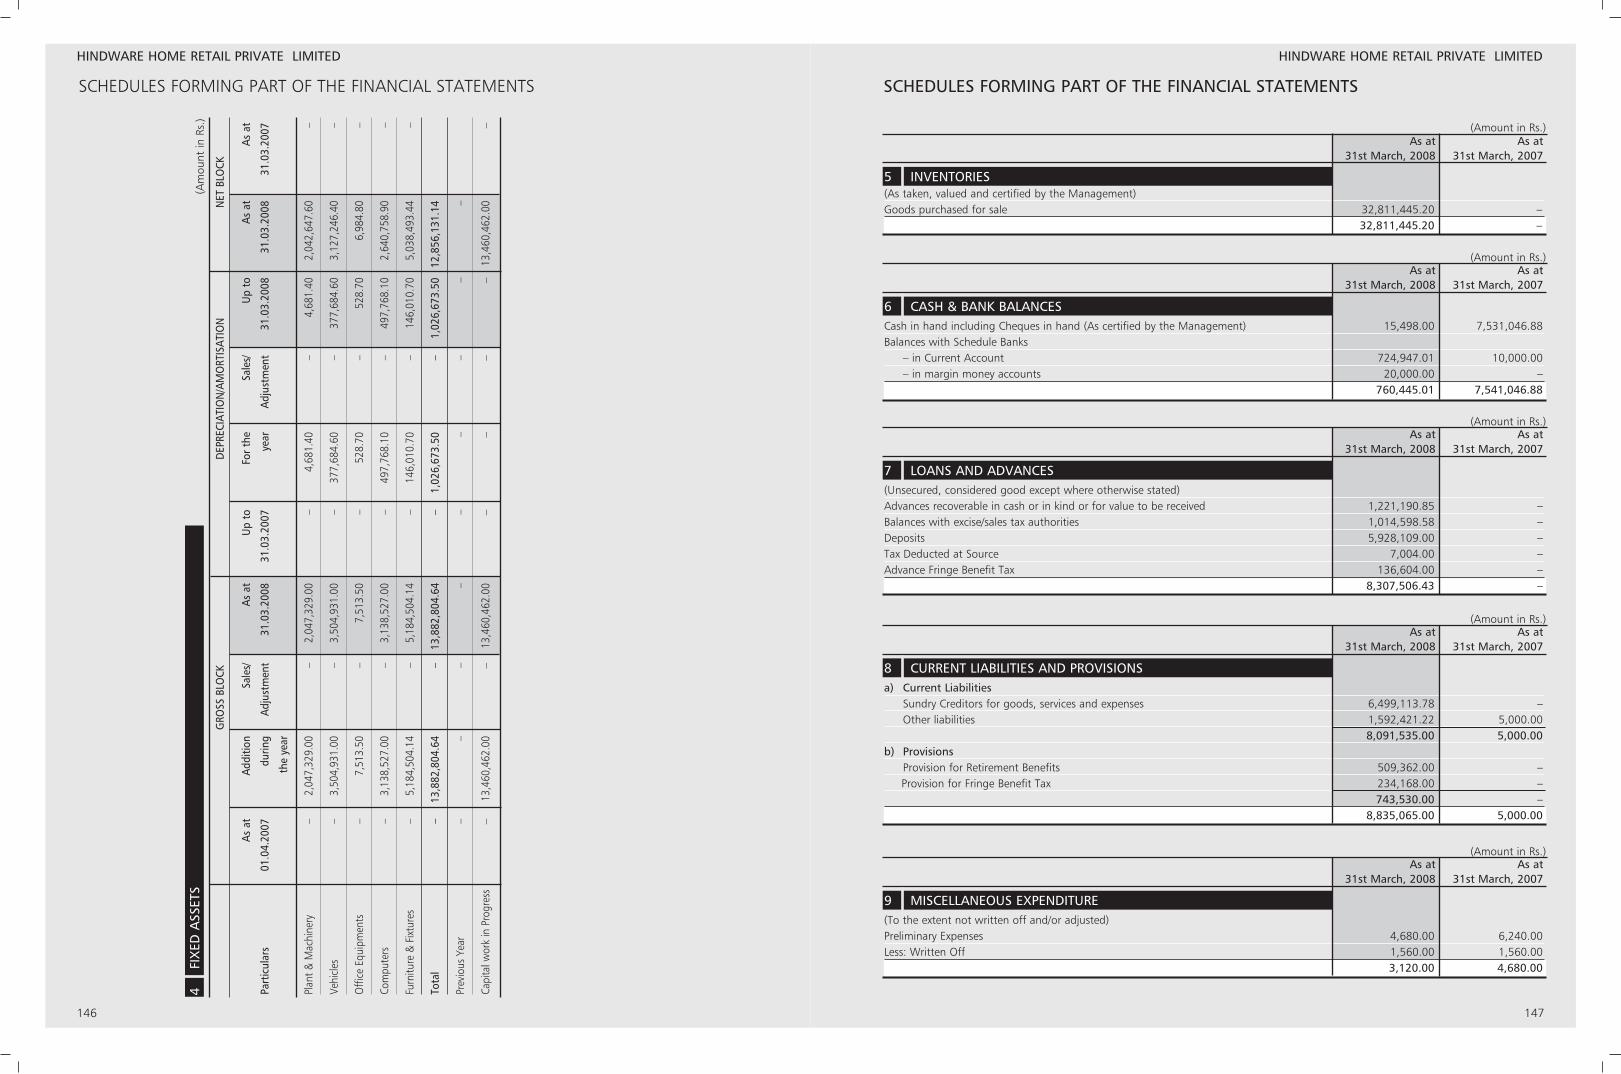
146 147
SCHEDULES FORMING PART OF THE FINANCIAL STATEMENTS
HINDWARE HOME RETAIL PRIVATE LIMITED
SCHEDULES FORMING PART OF THE FINANCIAL STATEMENTS
HINDWARE HOME RETAIL PRIVATE LIMITED
(Am
ount
in R
s.)
GRO
SS B
LOCK
DEP
RECI
ATIO
N/A
MO
RTIS
ATIO
NN
ET B
LOCK
As a
tAd
ditio
nSa
les/
As a
tU
p to
Fo
r th
e Sa
les/
Up
toAs
at
As a
t
Part
icul
ars
01.0
4.20
07du
ring
Adju
stm
ent
31.0
3.20
0831
.03.
2007
year
Adju
stm
ent
31.0
3.20
0831
.03.
2008
31.0
3.20
07
the
year
Plan
t & M
achi
nery
–
2,04
7,32
9.00
–
2,
047,
329.
00
–
4,68
1.40
–
4,
681.
40
2,04
2,64
7.60
–
Vehi
cles
–
3,50
4,93
1.00
–
3,
504,
931.
00
–
377,
684.
60
–
377,
684.
60
3,12
7,24
6.40
–
Offi
ce E
quip
men
ts–
7,
513.
50
–
7,51
3.50
–
52
8.70
–
52
8.70
6,
984.
80
–
Com
pute
rs
–
3,13
8,52
7.00
–
3,
138,
527.
00
–
497,
768.
10
–
497,
768.
10
2,64
0,75
8.90
–
Furn
iture
& F
ixtur
es–
5,
184,
504.
14
–
5,18
4,50
4.14
–
14
6,01
0.70
–
14
6,01
0.70
5,
038,
493.
44
–
Tota
l–
13
,882
,804
.64
–
13,8
82,8
04.6
4 –
1,
026,
673.
50
–
1,02
6,67
3.50
12
,856
,131
.14
Prev
ious
Yea
r–
–
–
–
–
–
–
–
–
Capi
talw
ork
in P
rogr
ess
–13
,460
,462
.00
–13
,460
,462
.00
––
––
13,4
60,4
62.0
0–
4FI
XED
ASS
ETS
(Amount in Rs.)As at As at
31st March, 2008 31st March, 2007
(As taken, valued and certified by the Management)Goods purchased for sale 32,811,445.20 –
32,811,445.20 –
5 INVENTORIES
(Amount in Rs.)As at As at
31st March, 2008 31st March, 2007
Cash in hand including Cheques in hand (As certified by the Management) 15,498.00 7,531,046.88Balances with Schedule Banks
– in Current Account 724,947.01 10,000.00– in margin money accounts 20,000.00 –
760,445.01 7,541,046.88
6 CASH & BANK BALANCES
(Amount in Rs.)As at As at
31st March, 2008 31st March, 2007
(Unsecured, considered good except where otherwise stated)Advances recoverable in cash or in kind or for value to be received 1,221,190.85 –Balances with excise/sales tax authorities 1,014,598.58 –Deposits 5,928,109.00 –Tax Deducted at Source 7,004.00 –Advance Fringe Benefit Tax 136,604.00 –
8,307,506.43 –
7 LOANS AND ADVANCES
(Amount in Rs.)As at As at
31st March, 2008 31st March, 2007
(To the extent not written off and/or adjusted) Preliminary Expenses 4,680.00 6,240.00Less: Written Off 1,560.00 1,560.00
3,120.00 4,680.00
9 MISCELLANEOUS EXPENDITURE
(Amount in Rs.)As at As at
31st March, 2008 31st March, 2007
a) Current LiabilitiesSundry Creditors for goods, services and expenses 6,499,113.78 –Other liabilities 1,592,421.22 5,000.00
8,091,535.00 5,000.00b) Provisions
Provision for Retirement Benefits 509,362.00 –Provision for Fringe Benefit Tax 234,168.00 –
743,530.00 –8,835,065.00 5,000.00
8 CURRENT LIABILITIES AND PROVISIONS
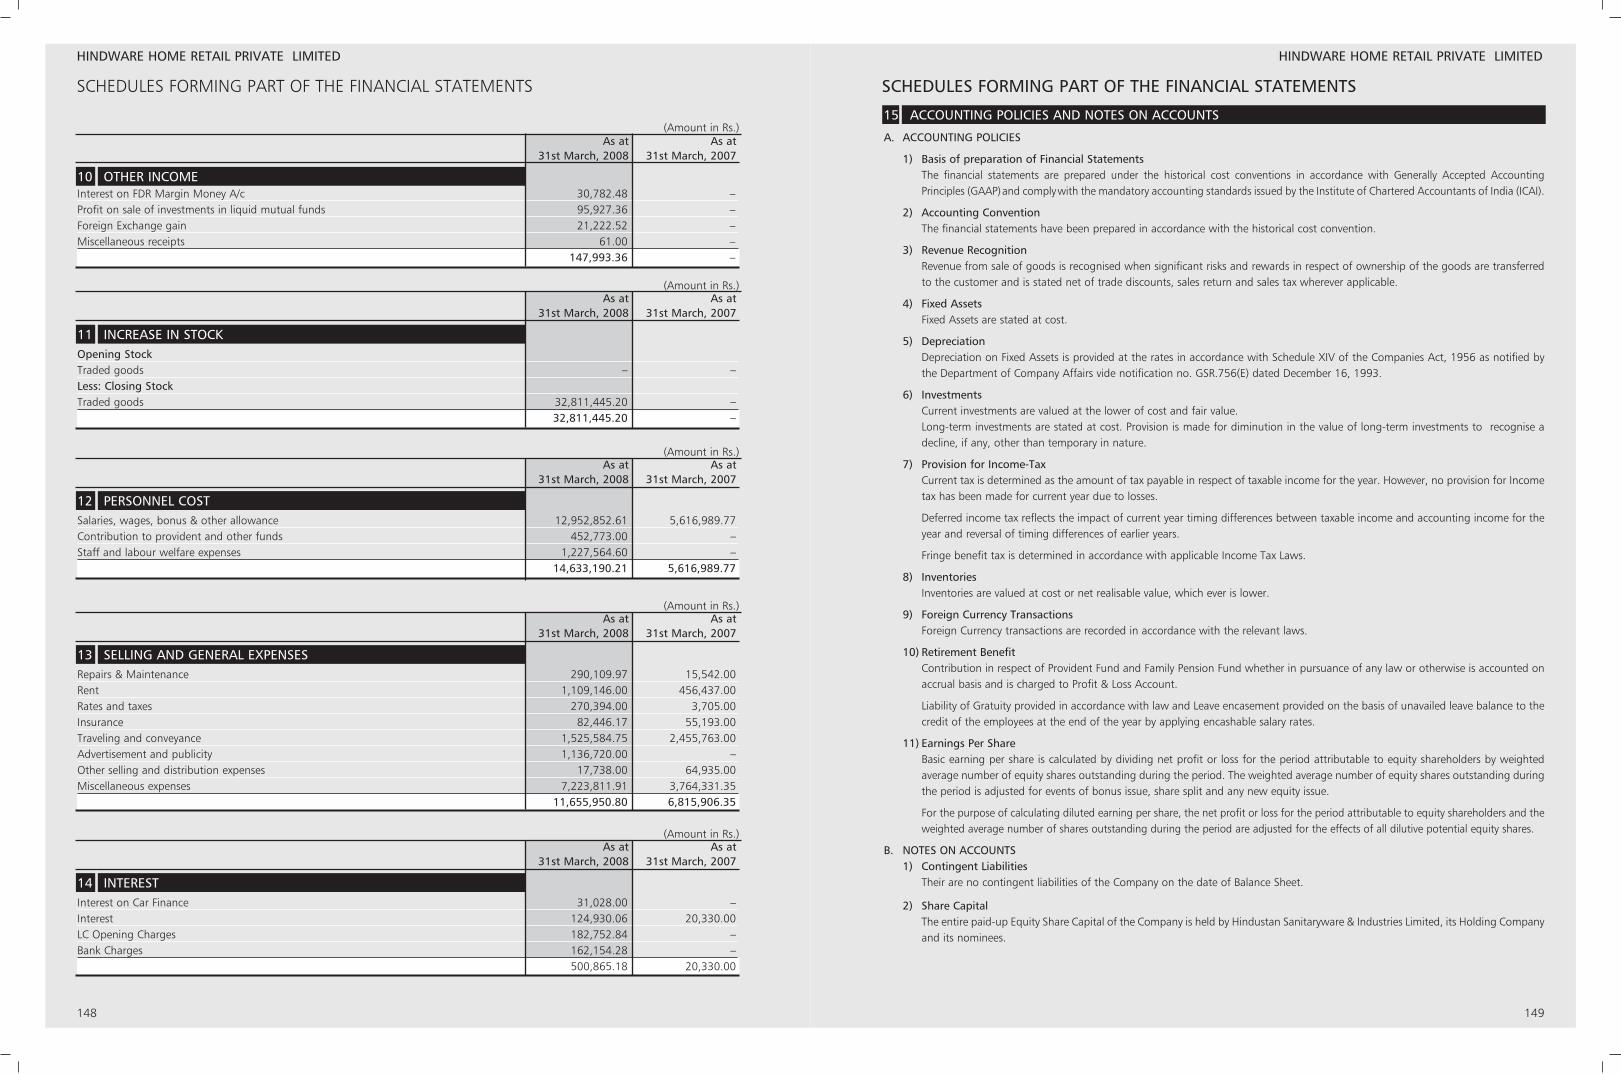
148 149
SCHEDULES FORMING PART OF THE FINANCIAL STATEMENTS
HINDWARE HOME RETAIL PRIVATE LIMITED
SCHEDULES FORMING PART OF THE FINANCIAL STATEMENTS
HINDWARE HOME RETAIL PRIVATE LIMITED
(Amount in Rs.)As at As at
31st March, 2008 31st March, 2007
Interest on FDR Margin Money A/c 30,782.48 –Profit on sale of investments in liquid mutual funds 95,927.36 –Foreign Exchange gain 21,222.52 –Miscellaneous receipts 61.00 –
147,993.36 –
10 OTHER INCOME
(Amount in Rs.)As at As at
31st March, 2008 31st March, 2007
Opening StockTraded goods – –Less: Closing StockTraded goods 32,811,445.20 –
32,811,445.20 –
11 INCREASE IN STOCK
(Amount in Rs.)As at As at
31st March, 2008 31st March, 2007
Salaries, wages, bonus & other allowance 12,952,852.61 5,616,989.77Contribution to provident and other funds 452,773.00 –Staff and labour welfare expenses 1,227,564.60 –
14,633,190.21 5,616,989.77
12 PERSONNEL COST
(Amount in Rs.)As at As at
31st March, 2008 31st March, 2007
Interest on Car Finance 31,028.00 –Interest 124,930.06 20,330.00LC Opening Charges 182,752.84 –Bank Charges 162,154.28 –
500,865.18 20,330.00
14 INTEREST
(Amount in Rs.)As at As at
31st March, 2008 31st March, 2007
Repairs & Maintenance 290,109.97 15,542.00Rent 1,109,146.00 456,437.00Rates and taxes 270,394.00 3,705.00Insurance 82,446.17 55,193.00Traveling and conveyance 1,525,584.75 2,455,763.00Advertisement and publicity 1,136,720.00 –Other selling and distribution expenses 17,738.00 64,935.00Miscellaneous expenses 7,223,811.91 3,764,331.35
11,655,950.80 6,815,906.35
13 SELLING AND GENERAL EXPENSES
A. ACCOUNTING POLICIES
1) Basis of preparation of Financial StatementsThe financial statements are prepared under the historical cost conventions in accordance with Generally Accepted AccountingPrinciples (GAAP)and complywith the mandatory accounting standards issued by the Institute of Chartered Accountants of India (ICAI).
2) Accounting ConventionThe financial statements have been prepared in accordance with the historical cost convention.
3) Revenue RecognitionRevenue from sale of goods is recognised when significant risks and rewards in respect of ownership of the goods are transferredto the customer and is stated net of trade discounts, sales return and sales tax wherever applicable.
4) Fixed AssetsFixed Assets are stated at cost.
5) Depreciation Depreciation on Fixed Assets is provided at the rates in accordance with Schedule XIV of the Companies Act, 1956 as notified bythe Department of Company Affairs vide notification no. GSR.756(E) dated December 16, 1993.
6) InvestmentsCurrent investments are valued at the lower of cost and fair value.Long-term investments are stated at cost. Provision is made for diminution in the value of long-term investments to recognise adecline, if any, other than temporary in nature.
7) Provision for Income-TaxCurrent tax is determined as the amount of tax payable in respect of taxable income for the year. However, no provision for Incometax has been made for current year due to losses.
Deferred income tax reflects the impact of current year timing differences between taxable income and accounting income for theyear and reversal of timing differences of earlier years.
Fringe benefit tax is determined in accordance with applicable Income Tax Laws.
8) InventoriesInventories are valued at cost or net realisable value, which ever is lower.
9) Foreign Currency TransactionsForeign Currency transactions are recorded in accordance with the relevant laws.
10) Retirement BenefitContribution in respect of Provident Fund and Family Pension Fund whether in pursuance of any law or otherwise is accounted onaccrual basis and is charged to Profit & Loss Account.
Liability of Gratuity provided in accordance with law and Leave encasement provided on the basis of unavailed leave balance to thecredit of the employees at the end of the year by applying encashable salary rates.
11) Earnings Per ShareBasic earning per share is calculated by dividing net profit or loss for the period attributable to equity shareholders by weightedaverage number of equity shares outstanding during the period. The weighted average number of equity shares outstanding duringthe period is adjusted for events of bonus issue, share split and any new equity issue.
For the purpose of calculating diluted earning per share, the net profit or loss for the period attributable to equity shareholders and theweighted average number of shares outstanding during the period are adjusted for the effects of all dilutive potential equity shares.
B. NOTES ON ACCOUNTS1) Contingent Liabilities
Their are no contingent liabilities of the Company on the date of Balance Sheet.
2) Share CapitalThe entire paid-up Equity Share Capital of the Company is held by Hindustan Sanitaryware & Industries Limited, its Holding Companyand its nominees.
15 ACCOUNTING POLICIES AND NOTES ON ACCOUNTS
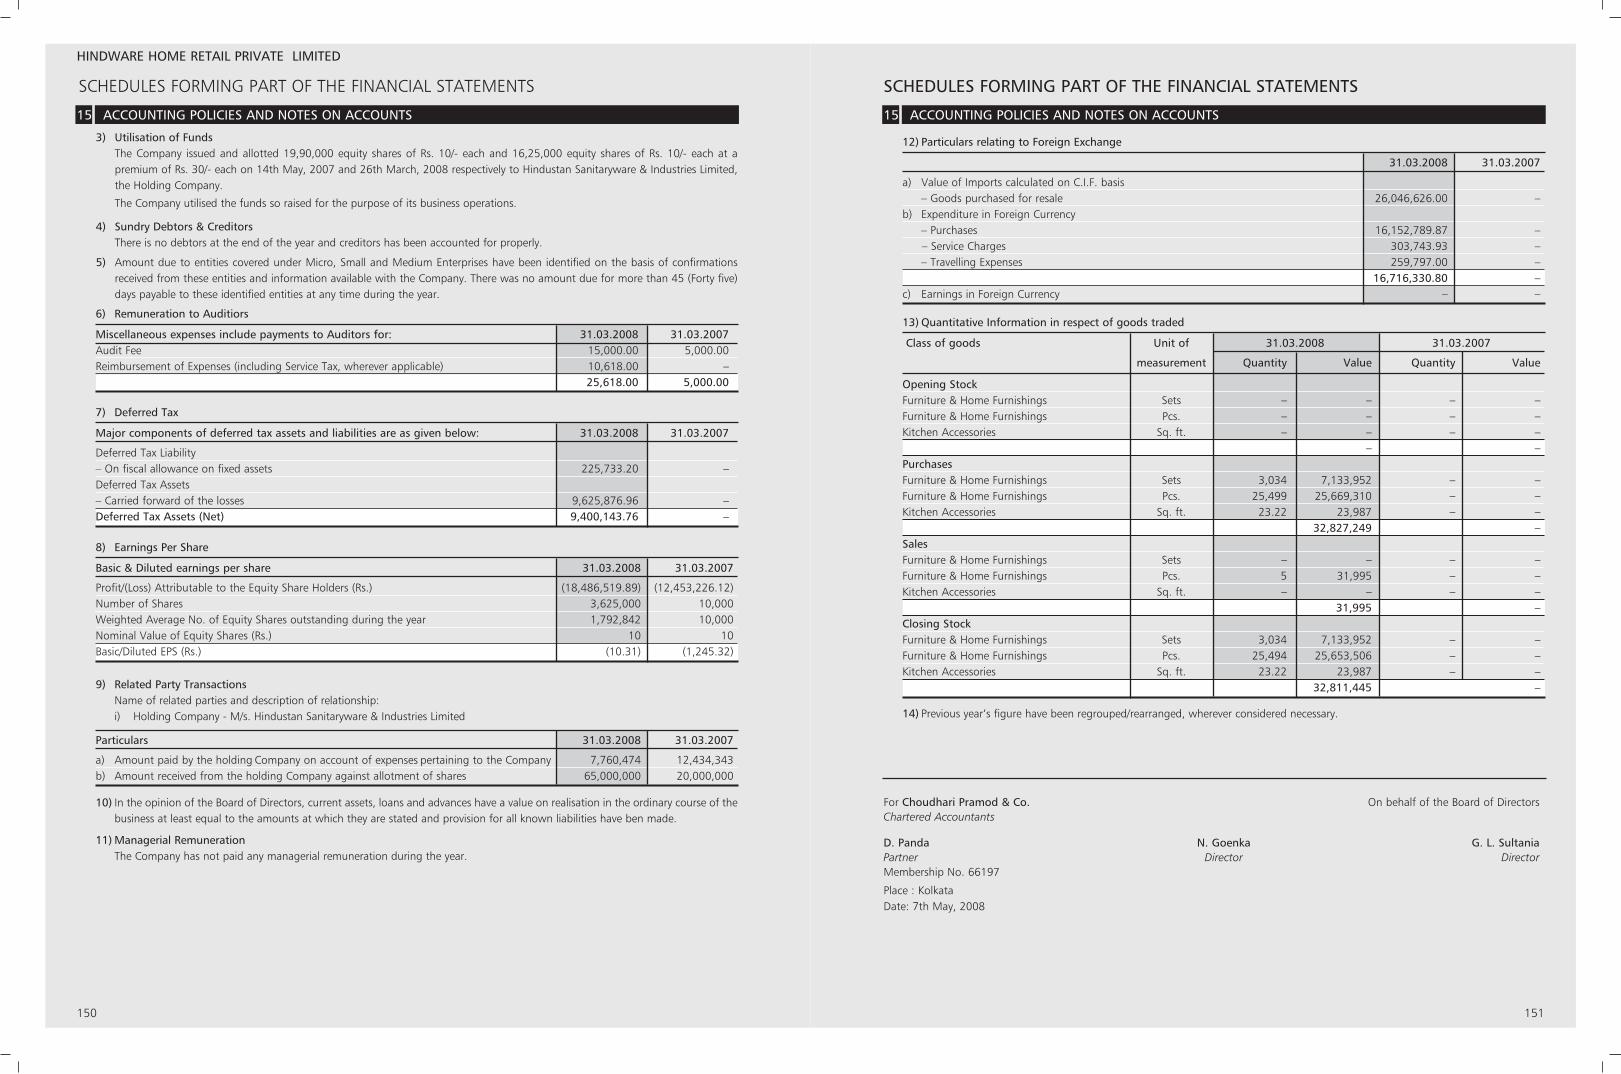
SCHEDULES FORMING PART OF THE FINANCIAL STATEMENTS
150 151
HINDWARE HOME RETAIL PRIVATE LIMITED
SCHEDULES FORMING PART OF THE FINANCIAL STATEMENTS
3) Utilisation of FundsThe Company issued and allotted 19,90,000 equity shares of Rs. 10/- each and 16,25,000 equity shares of Rs. 10/- each at apremium of Rs. 30/- each on 14th May, 2007 and 26th March, 2008 respectively to Hindustan Sanitaryware & Industries Limited,the Holding Company.
The Company utilised the funds so raised for the purpose of its business operations.
4) Sundry Debtors & CreditorsThere is no debtors at the end of the year and creditors has been accounted for properly.
5) Amount due to entities covered under Micro, Small and Medium Enterprises have been identified on the basis of confirmationsreceived from these entities and information available with the Company. There was no amount due for more than 45 (Forty five)days payable to these identified entities at any time during the year.
15 ACCOUNTING POLICIES AND NOTES ON ACCOUNTS15 ACCOUNTING POLICIES AND NOTES ON ACCOUNTS
Miscellaneous expenses include payments to Auditors for: 31.03.2008 31.03.2007Audit Fee 15,000.00 5,000.00Reimbursement of Expenses (including Service Tax, wherever applicable) 10,618.00 –
25,618.00 5,000.00
6) Remuneration to Auditiors
Major components of deferred tax assets and liabilities are as given below: 31.03.2008 31.03.2007
Deferred Tax Liability– On fiscal allowance on fixed assets 225,733.20 –Deferred Tax Assets– Carried forward of the losses 9,625,876.96 –Deferred Tax Assets (Net) 9,400,143.76 –
7) Deferred Tax
Basic & Diluted earnings per share 31.03.2008 31.03.2007
Profit/(Loss) Attributable to the Equity Share Holders (Rs.) (18,486,519.89) (12,453,226.12)Number of Shares 3,625,000 10,000 Weighted Average No. of Equity Shares outstanding during the year 1,792,842 10,000 Nominal Value of Equity Shares (Rs.) 10 10Basic/Diluted EPS (Rs.) (10.31) (1,245.32)
8) Earnings Per Share
Particulars 31.03.2008 31.03.2007
a) Amount paid by the holding Company on account of expenses pertaining to the Company 7,760,474 12,434,343b) Amount received from the holding Company against allotment of shares 65,000,000 20,000,000
9) Related Party TransactionsName of related parties and description of relationship:i) Holding Company - M/s. Hindustan Sanitaryware & Industries Limited
10) In the opinion of the Board of Directors, current assets, loans and advances have a value on realisation in the ordinary course of thebusiness at least equal to the amounts at which they are stated and provision for all known liabilities have ben made.
11) Managerial RemunerationThe Company has not paid any managerial remuneration during the year.
For Choudhari Pramod & Co. On behalf of the Board of DirectorsChartered Accountants
D. Panda N. Goenka G. L. SultaniaPartner Director DirectorMembership No. 66197
Place : KolkataDate: 7th May, 2008
31.03.2008 31.03.2007
a) Value of Imports calculated on C.I.F. basis– Goods purchased for resale 26,046,626.00 –
b) Expenditure in Foreign Currency– Purchases 16,152,789.87 –– Service Charges 303,743.93 –– Travelling Expenses 259,797.00 –
16,716,330.80 –c) Earnings in Foreign Currency – –
12) Particulars relating to Foreign Exchange
Class of goods Unit of 31.03.2008 31.03.2007
measurement Quantity Value Quantity Value
Opening StockFurniture & Home Furnishings Sets – – – –Furniture & Home Furnishings Pcs. – – – –Kitchen Accessories Sq. ft. – – – –
– –PurchasesFurniture & Home Furnishings Sets 3,034 7,133,952 – –Furniture & Home Furnishings Pcs. 25,499 25,669,310 – –Kitchen Accessories Sq. ft. 23.22 23,987 – –
32,827,249 –SalesFurniture & Home Furnishings Sets – – – –Furniture & Home Furnishings Pcs. 5 31,995 – –Kitchen Accessories Sq. ft. – – – –
31,995 –Closing StockFurniture & Home Furnishings Sets 3,034 7,133,952 – –Furniture & Home Furnishings Pcs. 25,494 25,653,506 – –Kitchen Accessories Sq. ft. 23.22 23,987 – –
32,811,445 –
13) Quantitative Information in respect of goods traded
14) Previous year’s figure have been regrouped/rearranged, wherever considered necessary.
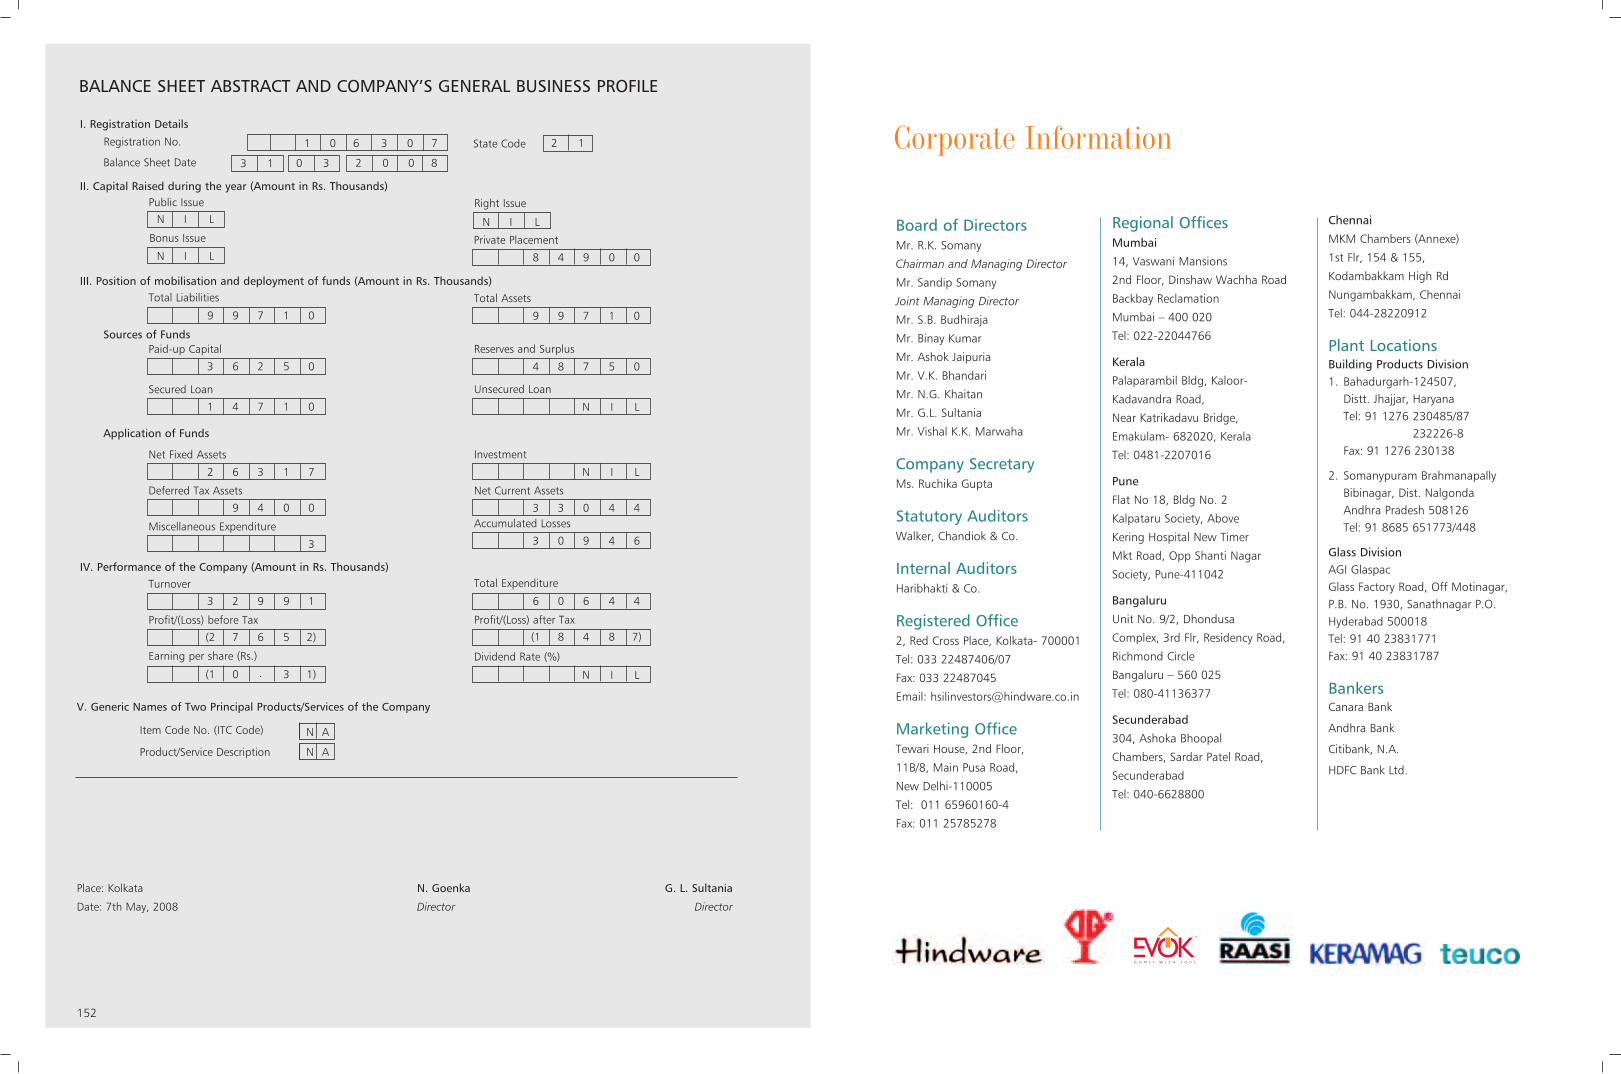
152
BALANCE SHEET ABSTRACT AND COMPANY’S GENERAL BUSINESS PROFILE
Public IssueN I L
N I L
Bonus Issue
Right Issue
N I L
Private Placement
3 1 0 3
Registration No. State Code
Balance Sheet Date
I. Registration Details
II. Capital Raised during the year (Amount in Rs. Thousands)
Total Liabilities
9 9 7 1 0
III. Position of mobilisation and deployment of funds (Amount in Rs. Thousands)
2 0 0 8
2 1
Total Assets
9 9 7 1 0
8 4 9 0 0
Paid-up CapitalSources of Funds
3 6 2 5 0
Reserves and Surplus
4 8 7 5 0
Secured Loan
1 4 7 1 0
Unsecured Loan
N I L
Net Fixed Assets
Application of Funds
2 6 3 1 7
Investment
N I L
Deferred Tax Assets
9 4 0 0
Net Current Assets
3 3 0 4 4Accumulated Losses
3 0 9 4 6Miscellaneous Expenditure
3
IV. Performance of the Company (Amount in Rs. Thousands)Turnover
3 2 9 9 1
Total Expenditure
6 0 6 4 4
Profit/(Loss) before Tax
(2 7 6 5 2)
Profit/(Loss) after Tax
(1 8 4 8 7)
Earning per share (Rs.)
(1 0 . 3 1)
Dividend Rate (%)
N I L
1 0 6 3 0 7
Place: Kolkata N. Goenka G. L. Sultania
Date: 7th May, 2008 Director Director
Item Code No. (ITC Code)
Product/Service Description
V. Generic Names of Two Principal Products/Services of the Company
N A
N A
Corporate Information
Board of DirectorsMr. R.K. Somany
Chairman and Managing Director
Mr. Sandip Somany
Joint Managing Director
Mr. S.B. Budhiraja
Mr. Binay Kumar
Mr. Ashok Jaipuria
Mr. V.K. Bhandari
Mr. N.G. Khaitan
Mr. G.L. Sultania
Mr. Vishal K.K. Marwaha
Company SecretaryMs. Ruchika Gupta
Statutory AuditorsWalker, Chandiok & Co.
Internal AuditorsHaribhakti & Co.
Registered Office2, Red Cross Place, Kolkata- 700001
Tel: 033 22487406/07
Fax: 033 22487045
Email: [email protected]
Marketing OfficeTewari House, 2nd Floor,
11B/8, Main Pusa Road,
New Delhi-110005
Tel: 011 65960160-4
Fax: 011 25785278
Regional OfficesMumbai
14, Vaswani Mansions
2nd Floor, Dinshaw Wachha Road
Backbay Reclamation
Mumbai – 400 020
Tel: 022-22044766
Kerala
Palaparambil Bldg, Kaloor-
Kadavandra Road,
Near Katrikadavu Bridge,
Emakulam- 682020, Kerala
Tel: 0481-2207016
Pune
Flat No 18, Bldg No. 2
Kalpataru Society, Above
Kering Hospital New Timer
Mkt Road, Opp Shanti Nagar
Society, Pune-411042
Bangaluru
Unit No. 9/2, Dhondusa
Complex, 3rd Flr, Residency Road,
Richmond Circle
Bangaluru – 560 025
Tel: 080-41136377
Secunderabad
304, Ashoka Bhoopal
Chambers, Sardar Patel Road,
Secunderabad
Tel: 040-6628800
Chennai
MKM Chambers (Annexe)
1st Flr, 154 & 155,
Kodambakkam High Rd
Nungambakkam, Chennai
Tel: 044-28220912
Plant LocationsBuilding Products Division1. Bahadurgarh-124507,
Distt. Jhajjar, HaryanaTel: 91 1276 230485/87
232226-8Fax: 91 1276 230138
2. Somanypuram BrahmanapallyBibinagar, Dist. NalgondaAndhra Pradesh 508126Tel: 91 8685 651773/448
Glass DivisionAGI GlaspacGlass Factory Road, Off Motinagar,P.B. No. 1930, Sanathnagar P.O.Hyderabad 500018Tel: 91 40 23831771Fax: 91 40 23831787
BankersCanara Bank
Andhra Bank
Citibank, N.A.
HDFC Bank Ltd.

www.hindwarebathrooms.com APR
OD
UC
T in
fo@
tris
ysco
m.c
om