ate strategies, public policies d system performancfj … · ate strategies, public policies d...
TRANSCRIPT
ATE STRATEGIES, PUBLIC POLICIES D SYSTEM PERFORMANCfj
WP-4
An Exploratory Modeling of The Decision Process of New Product
Selection by Supermarket Buyers
by
Edward W. McLaughlin and Vithala R. Rao
September 1987
WORKING PAPER SERIES
A Joint USDA Land Grant University Research Project
87
WP-4
An Exploratory Modeling of The Decision Process of New Product
Selection by Supermarket Buyers
by
Edward W. McLaughlin and Vithala R. Rao
September 1987
This paper was presented at The American Agricultural Economics Association Annual Meeting in East Lansing, Michigan, August 1987.
The authors respectively are Assistant Professor of Food Marketing, Department of Agricultural Economics and Professor of Marketing and Quantitative Methods,
. Johnson Graduate School of Management, Cornell University, Ithaca, NY 14853.
"
~ EXPLORATORY KDEUt-ll OF THE DECISIOO PROCESS OF NEW PROOJCT SELECTIOO BY SUPEmA.RKET BUYERS
Each year the U.S. grocery distribution system is buffeted by an outpouring of new
products. Although definitions differ, estimates of the number of new products--either
fundalrenta lly new products (e.g., deri ved fran new technology) or li ne extens ions (e. g. ,
new flavor or package size)--introduced into grocery distribution channels in 1985 vary
fran 2,560 (1) to 7,214 (2). The systetWide resources required to support this annual
influx of new products are enormous. In a recent extreme example, the Procter & Gamble
~y was reported to have spent $1.5 billion to introduce its Ultra-Panper diaper to
U.S. supermarkets (3).
~ile many food industry practitioners point to the vital role played by new products
in the increasingly caq:>etitive and dynamic grocery industry, researchers and policy
makers have raised questions regarding their iJ11)c1ct on other grocery system participants,
including conslJters, and on total grocery industry performance. M extensive literature
examines new product introductions or, alternatively, product proliferation. Although a
variety of approaches has been EIl1Jloyed, the nDst COOI1DI1 conceptual therre has been the
structure-conduct-performance paradign of industrial organization ecol1OO1ics; slJllTlaries of
this Y«>rk are found in (4), (5) and (6). Public performance consequences, including
supplier and conslJter welfare, have been the thrust of ouch of this past Y«>rk. Strategic
considerations for the key interlocking decisions of channel intenrediaries, such as
di stri butor-buyers, have recei ved 1 itt 1 e attention.
The few past attEll1Jts to exami ne supermarket buyer deci si ons have re 1 i ed ei ther on
secondary data (7), silllllated experiJrents (8) or buyer reaction to small ntJTbers of
hypothetical new products (9). Instead, this paper makes use of extensive primary data,
collected fran a major food chain, for all grocery products and categ:>ries over a thirty
seven week period in 1986-87. The research here is an initial attEll1Jt to describe the new

2
product selection process for supennarket buyers by mxie1ing the factors explaining an
intervening variable that effectively serves as a proxy for buyers ' ultimate selection
decision, narre1y, buyers I judgrents regarding the expected profitability of the neN
product.
lliE PROOLEM
Nati anal brand manufacturers c1 te a nl.llber of reasons for the pro 1i ferati on of new
products: to maintain interest of channel intenrediaries and conSlJIlers, to take advantage
of new technologies, to counter coopetitive thrusts, to transfonn a cCltlTDdity to a higher
margin value-added item, to partially ensure against new product failure rates as high as
90 percent, and others. While these new products undeniably can create profit
opportunities, they also incur substantial systenwfde costs for the changes they require
in handling, inventory, warehouse and store slotting, shelf signs, price maintenance, etc.
The human capital required, too, is substantial: supennarket procurarent staffs often
evaluate several hundred new products each week and are under continuous pressure for
quick decisions (10). Yet the carp1ex decision calculus EJIl)loyed by these gatekeepers to
the s~nnarket shelves is not well understood. While various pre-test market mxie1s
attEJll)ting to predict sales perfonnance of neN products allude to the irrportance of
distribution, these mxie1s treat the variable in an ad hoc manner or do not consider it at
all (11).
COCEPllW. f1W.1E.\tK)RK
The marketer of a new product seeki ng access to conSlJllers RUst fi rst present the
product to the supennarket buyer. Si nee the product is new, the buyer has no data on
historical sales of the product and cannot easily gauge its profit potential. tbt.'ever, he
makes a judgrent on profit potential utilizing various cues fran the large CI1DUJ1t of
infonnation presented to him.
3
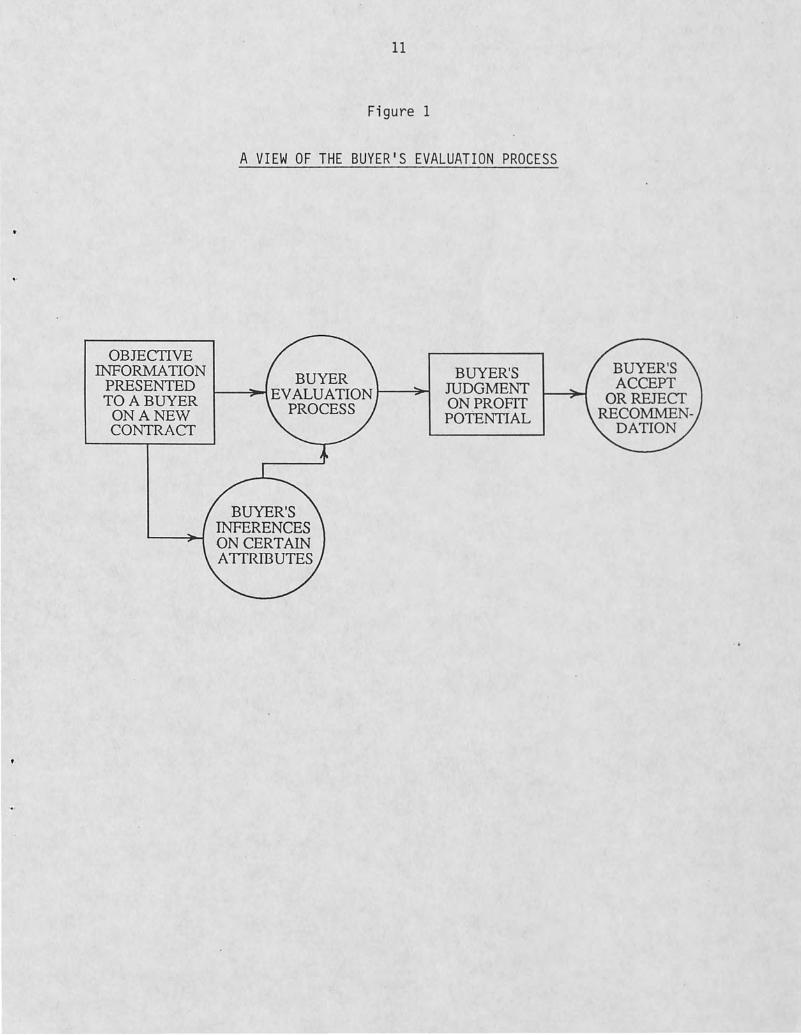
The product presentation is made to the buyer by the manufacturer representative or a
broker. The jl.ldgrental process may be conceptualized as shcf..m belCJ!ll. The information
presented to the buyer generally includes a physical item description or a 5a11Jle, details
of overall marketing strategy and support given to the item including data on price,
various tenns of trade, prarotional plans, and results of marketing research. After
receiving this information, the buyer infers certain attributes and evaluates the item's
long tenn potential. The product may be reccmrended for acceptance to the buying
ccmnittee if the judged profit potential exceeds a certain threshold value. About 90
percent of buyer's reccmrendations are accepted by the buying ccmnittee.
I INSERT FIGURE 1 HERE I
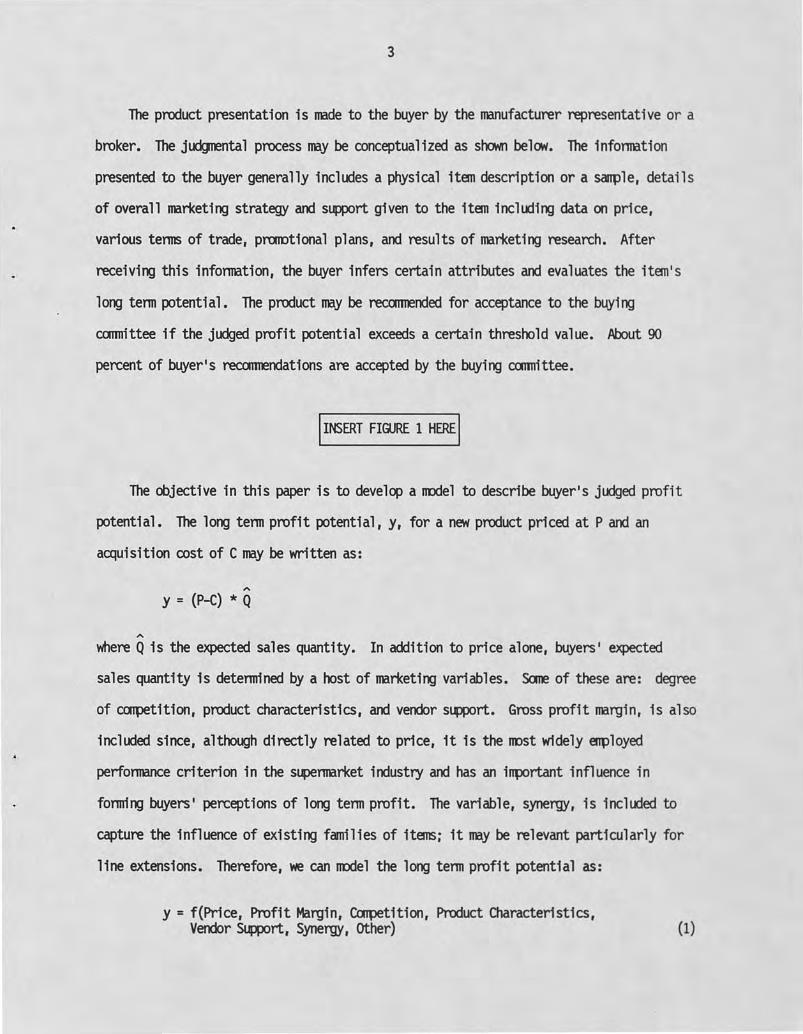
The objective in this paper is to develop a J1Ddel to describe buyer's judged profit
potential. The long tenn profit potential, y, for a new product priced at P and an
acquisition cost of C may be written as:
'" y = (P-C) * Q
'" \'Alere Q is the expected sales quantity. In addition to price alone, buyers I expected
sales quantity is detennined by a host of marketing variables. Serre of these are: degree
of caJl)etition, product characteristics, and vendor support. Gross profit margin, is also
included since, although directly related to price, it is the nnst widely errp10yed
perfonnance criterion in the sLqJermarket industry and has an irrportant influence in
fonning buyers' perceptions of long tenn profit. The variable, synergy, is included to
capture the influence of existing families of items; it may be relevant particularly for
line extensions. Therefore, we can J1Ddel the long tenn profit potential as:
y = f(Price, Profit Margin, CaIl>etition, Product Characteristics, Verxior SUWort f Synergy f Other) (1)

4
To estimate this model, each variable must be measured on the same scale across products
and categories. In this paper, we have utilized judgrents of buyers on a camn scale for
the different variables to ensure caJllclrability and to enable aggregation across product
categori es.
MTA
The data for our model were developed fran three primary sources: (i) a new product
information fonn filled out by the vendor (broker or manufacturer representative) of the
new product; (ii) a one-page questionnaire completed by the buyer to provide his own
judgrents of the new product regarding a mlrber of variables; and (iii) a packet of
additional vendor supplied materials. The last source was not unifonnly cOOl>lete or
available for every product; it consisted largely of test market results, marketing
research data, sanple point of purchase materials, and advertising and pranotion
schedu 1 es. Experi enced coders evaluated thi slatter source to develop a seri es of
measures on the overall quality of presentation and marketing plan for the new item.
ESTIw\TIOO
The specific model estimated here is a linear version of the model (1) using the
judgrents of six d1fferent buyers. Although data were collected on over 2,000 different
products, analysis for this paper is limited to only 730 products in six distinct product
categories, each containing over 100 products (beverages; canned fruits, vegetables,
ju1ces and drinks; dairy and refr1gerated foods; frozen foods; household supplies; and
sauces, spices, condiments, oils and dressing). Analysis was thus restricted in an
attE!l1llt to minimize the heterogene1ty present 1n w1dely different product categories.
Buyer dllTllff var1ables are included in the model to account for the different decision
processes of the vari ous buyers.
5
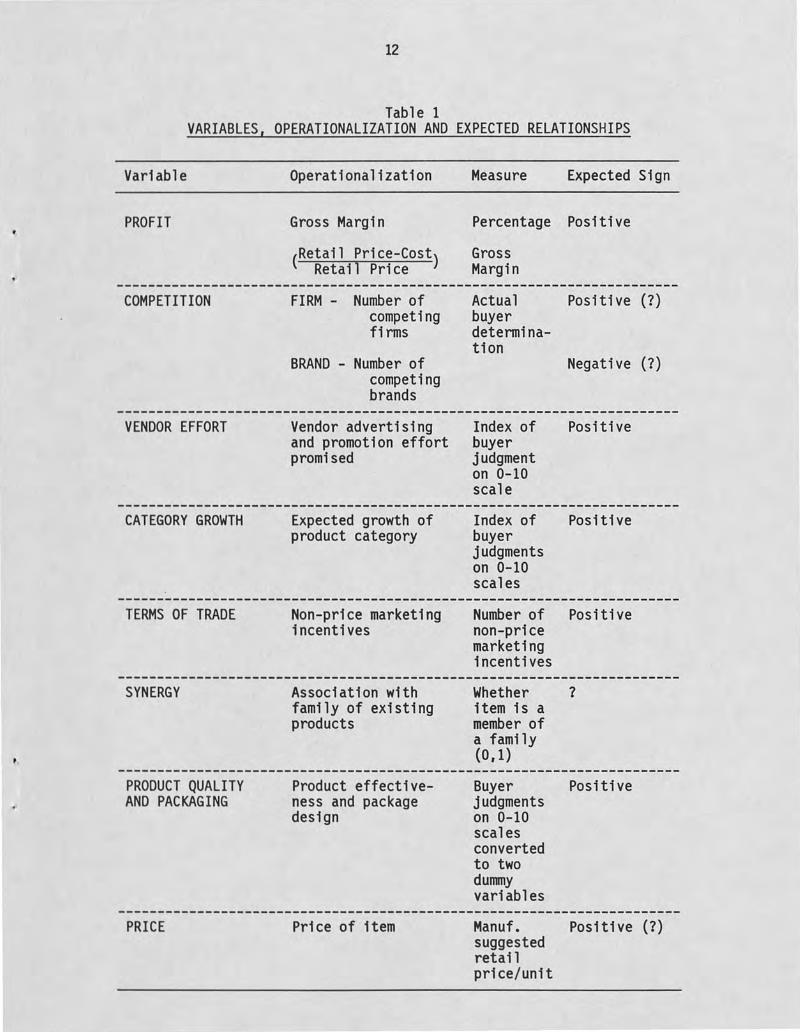
The operationalization of the variables along with direction of the relationships
expected are shotrm in Table 1. The dependent variable, long tenn profit potential, is
judged on a 0-10 scale. We expect positive relationship between judged profit potential
and gross margi n, vendor effort, category gl'Ut'lth, tenns of trade and product qual i ty and
packaging. The relationships with c:aq:>etition, synergy, and price are less clearcut.
ITable 1 Here I
The IlEthod of ordinary least squares is erployed for estimating the parallEters. Separate
regressions were estimated for all the items and three subgroups of items with suggested
retail price ranges of under $1.00, $1.00-$2.00, and over $2.00.
RESULTS
Table 2 reports the regression results of one particular specification 'lttlere behavior
of the dependent variable, buyer judcJrent regarding long run product profitability, is
explained through a series of quantitative, qualitative (judcJrents) and d~ variables.
Fit: In the collJlll labelled (ALL), ~ere all data were included in the estimation, a
large proportion (R-square of 70 percent) of the variability in buyers' expectations
regarding long run profitability is explained by the JTDdel. Further, six of the seven
variables ererged as highly significant with acc:aq:>anying signs as expected. The details
for each variable are discussed belON for the ALL regression foll~ by caI1TEnts on the
subgT'Ol4> analyses.
Profit Measure: The effect of gross margin percentage, the profit llEasure ITDst
widely used by food industry executives, on buyer predictions of long run profitability
was positive and significant.

6
Coopetition: The rreasure of nl.l1ber of caJl)eting finns sJn..oed a positive effect on
buyers' evaluation of profitability. A buyer may judge that profitability is likely to be
higher for a product that has already been positively evaluated and placed on store
shelves by other buyers in caJl)eting finns. The second rreasure of caJl)etition, the mlTber
of other brands against \'A'lich the new item might caJl)ete, was not Significant, although
1ts sign was in the direction expected. 01e explanation is that with the cont1nuing
proliferation of new products, an addition to a category that is already crOOed might be
evaluated as having relatively low profit potential.
Vendor Effort: The qualitative rreasure of overall vendor's marketing effort
(including promotional materials, availability of test marketing results, etc.) was
positively and significantly associated with the jucignent of long tenn profit potential of
the item, as expected.
category Gl"C1trth: The expectations of the likely gl"C1trth of the category to \'A'lich the
product belonged, as expected, was positive and significant.
Tenns of Trade: The availability of other non-price tenns of trade (e.g., off
invoice provisions, free gocxJs, etc.) turned out to be significant in the expected
direction.
Synergy: The synergy rreasure was significant but with a negative influence. While
there was no expectation for the sign of this variable, it might be argued that those
items that sirrply extend an already successful line are nnre likely to be profitable, thus
a positive influence. tQ.4ever, it may equally be argued that as CXJIl)etition for fixed
shelf space intens1fies a buyer may perceive an extended ftln1ly nsrber as a "rre-too" item,
unlikely to make Significant additions to profit.

7
Product Quality and Packaging: The 00 dl.ll1lff variables Jreasuril'YJ prcduct uniqueness
(e.g., taste, effectiveness) and package design proved not to be significant.
Price: In order to facilitate aggregation across prcducts priced differently, the
absolute per unit price of an item was converted to 00 dl.ll1lff variables for the three
price gJ'Ol4lS. The effects of these variables were negative and insignificant.
Buyer Effects: Differences in the decision processes of the six individual buyers
were captured by the coefficients of the five buyer dl.ll1lff variables. Buyers 1 and 2, for
exaJl1)le, exhibited optimism about a prcduct's potential profitability relative to Buyer 4.
SUbg!'Ol4? Analysis: Although the JlDdels fit slightly better for 00 of the three
subgrol.4>S based on unit price, several of the parcureter estimates were different across
these JJDdels, iJqJlyil'YJ interactions. The effect of the profit variable, for exal1l>le,
lessens as the price of the prcduct increases. This may arise due to the positive buyer
iJqJression fonred by a large gross margin accoopanyil'YJ a lC7tl price prcduct, resultil'YJ in
high volure and subsequent attractive profit. The effect on profit may actually be
reversed, hcftr.tever, if the price of the prcduct is so high (say, over $2.00) that demand is
sufficiently datrpened. These results may be indicative of risk aversion by the buyers.
The SanE reasonil'YJ may apply to the coopetil'YJ finns variable.
fobreover, although the relationship is not nonoton1c, it appears that when a lCfrl
price item is included as part of a family, it has a greater chance of receivil'YJ a
positive buyer evaluation than when it is an expensive item. This may again be related to
buyers I jlXlgrents regardil'YJ the limited mrrber of high priced items than an individual
category, or depart:rrent, can support.

8
CCKLUSlOOS Nf) IMPLICATIOOS FOR RESEAROi
The exploratory JTDde1 developed in this paper of the carp1ex decision processes of
s\4)ermarket buyers offers pronfse. Generally, the statistical results are significant and
the explanatory variables behaved as predicted. Such results, especially ~ refined and
validated with subsequent ana1yses--now in progress--shou1d prove useful to both finn
managers and pub 1i c po 1i cy makers.
Grocery product marketers, in particular, are regularly forced to make resource
allocation decisions with little information regarding the probabilities of likely
outcanes. ~rating under limited budgets, for exarrp1e, a marketing manager of a packaged
constJrer goods finn might need information regarding the expected payoff for additional
inves1lrent in marketing effort, say couponing or T.V. advertising, for a proposed new
product or to extending the line or family of an existing product or category. The
analysis here suggests that the appropriate response to such a question depends inter alia
on the product's price. Specifically, there appears to be a large positive irrpact on
buyer profit perception \ttten a 1Cftti price item (under $1.(0) is evaluated as part of a
family; the ~site result seems to hold \ttten the item is priced over $1.00.
Several limitations of these results should be recognized. These arise due to the
quality of the data, incompleteness of data, inability to include actual promotional
variables (e.g., Point-of-Sa1e effort) and aggregation across several categories.
Although all data and sl4Jporting materials for each product presented to the buyers were
collected, information on a substantial nLllDer of variables was sil11l1y not available.
ttlreover, often, even when the appropriate information was present, wide variances in the
standard merchandising requirerents for different product categories roup1ed with the
seri ous 1 ack of uni fonn vendor presentati on format, resulted in J1OI'1C(JI'J)Clrabl1i ty of
information across products. The use here of buyer juctgnents regarding product
characteri sti cs and performance vari ab 1 es was an attenpt to COTTeCt for thi s di ffi cu 1 ty,
~ver, with an accoopanying loss of precision in the measurerents.

9
Experflllmtal research is cUTTent1y underway in an attffillt to adjust for these data
limitations. Buyers' judgrents on synthetic products, defined on a set of attributes,
should cmpensate for ITlIch of the data inCOOl'leteness described above. \I.tlen aJTbined with
actual data already collected, these buyer judgrents should all~ accurate predictions of
decisions on new products.
As better data are developed, calculation of the marginal returns associated with
manufacturer investJrents in marketing mix e1errents is straightforward. Anred with these
e1ast1cities, food manufacturers should be able to make irrproved decisions regarding the
all ocat i on of new product deve 1 oprent resources. Pub 11c po 1i cy makers, too, should fi nd
these results useful for their potential to increase syste.nwide efficiencies as nore
efficient decisions are made regarding introduction of new products into distribution
channels. Increased profits for food manufacturers and distrfbutors or 1CN1'er food prices
for consurers are the likely systetW1de perfoTTlBllce consequences.

10
REFERENCES
1. Nielsen, A.C., Nielsen Early Intelligence Systems, Chicago, IL, 1986.
2. DFS-IXlrland, New Product News, Gonnan Publishing, Chicago, IL, 1986.
3. Fortune, "The King of Suds Reigns Again," 1986.
4. Pacberg, Daniel I., and Randall E. Westgren, "Product Coopetition and ConsLJrer Behavi or in the Fcxx:I Industri es," JIlrerican Journal of Agri cu 1 tura 1 Ecol'lOO1i cs 61 (1979): 620-25.
5. Connor, John M., "Food Product Proliferation: A Market Structure Analysis," JIlrerican Journal of Agricultural Ecol'lOO1ics 63 (1981): 607-17.
6. Connor, John M., et al., The Food Manufacturing Industries, Lexington, ~, Lexington Books, 1985.
7. Heeler, Roger M., Michael J. Kearney, and Bruce J. Mehaffey, "ttx:teling Supennarket Product Selection," Journal of Marketing Research 10 (1973): 34-7.
8. Grashof, John F., "SUpennarket Chain Product Mix Decision Criteria: A SilTlllation ExperiJrent," Journal of Marketing Research 7 (1970): 235-42.
9. t-bntgarery, Oavi d B., "New Product Di stri buti on: An Ana lysi s of SUpennarket Buyer Decisions," Journal of Marketing Research 12 (1973): 255-64.
10. Hanm, Lany G., "Food Distributor Procul"E!l'rent Practices: Their IlllJlictions for Fcxx:I Systen Structure and Coordination," unpublished Ph.D. dissertation, Michigan State University, East Lansing, MI, 1981.
11. Robinson, Patrick, J., "CClqJarison of Pre-Test Market New-Product Forecasting ttx:tels," in Y. Wind, V. Mahajan and R.N. cardozo (ed.), New-Product Forecasting, Lexington, ~, Lexington Books, 1981: 181-204.
OBJECTIVE INFORMATION
PRESENTED TO A BUYER
ONANEW CONTRACT
11
Figure 1
A VIEW OF THE BUYER'S EVALUATION PROCESS
BUYER'S JUDGMENT ON PROFIT POTENTIAL
BUYER'S ACCEPT
OR REJECT RECOMMEN
DATION
12
Table 1 VARIABLES, OPERATIONALIZATION AND EXPECTED RELATIONSHIPS
Variable
PROFIT
COMPETITION
VENDOR EFFORT
CATEGORY GROWTH
TERMS OF TRADE
SYNERGY
PRODUCT QUALITY AND PACKAGING
PRICE
Operationalization
Gross Margi n
(Retail Price-Cost) Retail Price
FIRM - Number of competing firms
BRAND - Number of competing brands
Vendor advertising and promotion effort promi sed
Expected growth of product category
Non-price marketing incentives
Assoc1ation with family of existing products
Product effectiveness and package design
Price of item
Measure Expected Sign
Percentage Positive
Gross Margin
Actual buyer detennina-tion
Index of buyer judgment on 0-10 scale
Positive (1)
Negative (1)
Positive
Index of Positive buyer judgments on 0-10 scales
Number of Positive non-price marketing incentives
Whether ? item is a member of a family (0,1)
Buyer Positive judgments on 0-10 scales converted to two dummy variables
Manuf. Positive (1) suggested retail price/unit

13
Table 2
RESULTS OF REGRESSION OF PROFIT POTENTIAL JUDGMENTS
RETAIL PRICE PER UNIT Group of Items +
UNDER $1.00- OVER Variable ~ ALL $1.00 $2.00 $2.00
INTERCEPT 3.12* 2.40 3.37 3.90 (15.16) (7.36) (10.08) (8.05)
PROFIT .02 .04 .02 -.01 (5.28) (7.07) (2.33) (-.82)
-------------------- ---------- ---------- ----------- ---------NUMBER OF .03 .08 .04 -.03
COMPETING FIRMS (2.39) (3.71) (2.11) (-1.36) NUMBER OF -.01 -.03 -.01 .01
COMPETING BRANDS (-1.71) (-3.71) (-1.3) (.92) -------------------- ---------- ---------- ----------- ---------VENDOR EFFORT .08 .03 .07 .09
(5.46) (1.20) (3.93) (2.12) EXPECTED CATEGORY .13 .25 .15 ' .12
GROWTH (5.33) (5.26) (3.98) (2.49) TERMS OF TRADE .07 .13 .07 -.04
(2.21) (2.12) (1.66) (-.51) SYNERGY (DUMMY) -.14 .47 -.28 -.17
(-2.35) (3.73) (-3.23) (-1.39) -------------------- ---------- ---------- ----------- ---------DUMMY 1 FOR -.25 -.79 .38 -.39
LOW QUALITY (-1.18) (-2.48) (.74) (- .64) DUMMY 2 FOR -.02 -.28 -.13 .05
MEDIUM QUALITY (-.34) ( -1.62) ( -1.42) (.34) -------------------- ---------- ---------- ----------- ---------DUMMY 1 FOR -.01
LOW PRICE (-.10) DUMMY 2 FOR -.11
MEDIUM PRICE ( -1.6) -------------------- ---------- ---------- ----------- ---------BUYER DUMMY 1 1.8 1.65 1.60 2.02
(18.04) (8.90) (11.14) (7.94) BUYER DUMMY 2 1.06 .95 .39
(7.76) (4.95) (1. 93) BUYER DUMMY 3 .05 -.33 .22 -.23
(.38) ( -1.08) (1.14) (-1.01) BUYER DUMMY 4 -.33 1.11 -.63 -.81
( -1.67) (2.17) (-2.83) (- .86) BUYER DUMMY 5 .77 .78 .68 .75
(7.12) (3.84 ) (4.57) (2.89) -------------------- ---------- ---------- ----------- ---------R-SQUARE .70 .79 .67 .74 ADJ. R-SQUARE .69 .78 .66 .72 F-RATIO 104.46 51.48 46.87 38.55 -------------------- ---------- ---------- ----------- ---------SAMPLE SIZE 731 204 336 191
*These entries are the regression coefficients and the associated t-values.

NE-165
PRIVATE STRATEGIES, PUBLIC POLICIES & FOOD SYSTEM PERFORMANCE
---------- Working Paper Series
Purpose: The NE-165 Working Paper Series provides access to and facilitates research on food and agricultural marketing questions. It is intended to be a publication vehicle for interim and completed research efforts of high quality. A working paper can take many forms. It may be a paper that was delivered at a conference or symposium but not published. It may be a research report that ultimately appears in full or abbreviated form as a journal article or chapter in a book. Using the working paper series enables a researcher to distribute the report more quickly and in more extensive detail to key research users. A working paper may also be an end product in itself, for example, papers that collate data, report descriptive results, explore new research methodologies, or stimulate thought on research questions . . '
Procedures: Working papers may address any issues in the food and agricultural marketing area as described in the NE-165: Private Strategies, Public Policy and Food System Performance, project statement. This research agenda is available from Professor Ronald Cotterill, Executive Director of NE-165 at the address given below. A prospective working paper should be forwarded to the Executive Director who will coordinate a review of the paper by two research peers. Alternatively authors may submit two independent peer reviews with their paper. Based upon independent reviewer comments the Executive Director may accept, accept with revisions, or reject the submission. If accepted the Executive Director will issue working paper covers, and a mailing list to the author who shall have responsibility for preparing and distributing copies to all persons and organizations on the mailing list. Additional copies of working papers are available from the author or from the office of the Executive Director at The University of Connecticut.
Professor Ronald W. Cotterill, Executive Director NE-165 Department of Agricultural Economics and Rural Sociology Box U-21 The University of Connecticut Storrs, Connecticut 06268

I'