athletics program evaluation - ccisd believe that athletics is a microcosm of society ... programs...
TRANSCRIPT
Athletics
Program Evaluation
2010-11 to 2014-15
Office of Assessment and Evaluation Clear Creek Independent School District

Office of Assessment and Evaluation
Athletics Program Evaluation
Presented to Board of Trustees on October 10, 2016
2016-2017 Board of Trustees Program Evaluation Team Laura DuPont, Ph.D., President Page Rander, Vice President Charles Pond, Secretary Ken Baliker, Trustee Jay Cunnigham, Trustee Ann Hammond, Trustee Win Weber, Trustee Greg Smith, Ph.D., Superintendent
Steven Ebell, Ed.D., Deputy Superintendent, Curriculum & Instruction Debbie Fuchs, Director, Athletics Jimmy Grier, Assistant Athletics Director/Coordinator of Physical Education Jonathan Maxwell, Ph.D., Executive Director, Assessment and Evaluation Laura Gaffey, Data Analyst, Assessment and Evaluation Pat McKenna, Data Analyst, Assessment and Evaluation

Athletics Program Evaluation 2010-11 to 2014-15
Page | 1
Executive Summary
As part of CCISD’s program evaluation process, the Office of Assessment and Evaluation has completed a program evaluation for the Athletics program encompassing the five-year period from the 2010-11 through 2014-15 school years.
The mission of CCISD Athletics is stated in the CCISD Coaches Handbook: “It is the mission of CCISD Athletics to promote and provide opportunities for each student athlete to develop into a productive citizen through work ethic, discipline and competition. We will create an environment that fosters humility, character, sportsmanship, making positive life choices and accept the idea that all deserve the right to be Champions.”
The philosophy of CCISD Athletics “is dedicated to giving all students the opportunity to participate in a highly competitive, comprehensive, accelerated athletic program by employing dedicated professionals and providing appropriate funding through fairly administered and conducted activities.
We believe that athletics is a microcosm of society and that through participation in our athletic program, student athletes will inherently learn life skills enabling them to be productive members of society capable of managing time, striving to set and obtain goals, and developing an enhanced self-discipline.”
Students in grades 7-8 tryout for athletics. Once they have been selected, students are enrolled in an Athletics class and tryout for individual sports as those seasons begin. Students in grades 9-12 have usually participated in intermediate athletics or on an outside of CCISD team. The following list includes the sports which are available for students to participate:
Girls: Basketball, Cross Country, Golf, Soccer, Softball, *Swimming, Tennis, Track, Volleyball, Wrestling
Boys: Baseball, Basketball, Cross Country, Football, Golf, Soccer, *Swimming, Tennis, Track, Wrestling
Co-Ed: Cheerleading, *Swimming, Trainer (*Water Polo and Diving are included in the Swim course)
The Athletics program was evaluated through seven questions:
1. What is the participation rate of students in the various Athletic programs?
At both the intermediate and high school level, students may enroll in more than one sport. For example, an intermediate student could be enrolled in volleyball, basketball, and tennis in the same grade level. During the five year period of this study, approximately 30% of boys in grades 7 and 8 participated in at least one athletic sport while 30% of girls in grade 7 participated in at least one athletic sport and about 25% of grade 8 girls participated in at least one sport. Approximately 47% of boys and 30% of girls in grade 9 participated in at least one athletic sport. The data also showed there was a decline for boys in participation through grade 12 for an average of about 27%. For girls, the data shows there is a decline in participation through grade 12 for an average of nearly 15%.
Based on students’ survey results conducted in January 2016, the number of sports which students participate declines from grade 7 through grade 12, with the greatest change occurring during the progression from grade 8 to grade 9. Many students who participated in the focus groups also spoke about their decision to focus on one sport. Some of this was due to the demands of participation outside of CCISD athletics, commonly referred to as club teams. This decline was also apparent in the data from the student surveys, where a large decline was with girls from their 7th grade to their 8th grade year.
Due to the nature of some sports participation restrictions, there is a usually a decline in the number of students returning to participate in a sport the next year. There is a feeder pattern from one level to the next level. Most sports will have one or two freshmen teams, one junior varsity (JV) team, and one varsity team. There are other sports where the participation rate is limited due to facilities, uniforms, and the number of coaches.

Athletics Program Evaluation 2010-11 to 2014-15
Page | 2
From the student survey results (based on a 1-Strongly Disagree to 4-Strongly Agree Likert Scale), the lowest results came in the following areas:
I have adequate time for outside activities in which I am involved (3.08).
The Athletic program in my school has the support of the community (3.08). The highest result from the student survey came from the following:
I would recommend the Athletic program to other students (3.38). From the parent survey results, the lowest results came in the following areas:
My student is satisfied with their experience in the Athletic program (2.86).
CCISD Athletic programs promotes involvement in more than one sport (2.89). The highest results from the parent survey came from the following:
My student has adequate time for Athletic activities in which they are involved (3.19).
My student has adequate time for outside activities in which they are involved (3.11). From the teacher survey results, the lowest results came in the following areas:
My students have adequate time for outside activities in which they are involved (3.30).
The athletic program in my school has the support of the community (3.34). The highest results from the teacher survey came from the following:
Participation in athletics is a positive experience (3.75).
All students are given an equal opportunity to participate in athletic programs (3.65).
A demographic comparison, which compares the enrollment of students in athletics to all students in CCISD was conducted for each grade band:
2014-2015 F M AS BL HI WH ED LEP SPED GT AR Total
Intermediate Athletes
46.3% 53.7% 6.0% 10.5% 23.1% 56.0% 16.9% 1.4% 5.4% 12.1% 32.2% 1991
Intermediate Students
48.9% 51.1% 10.2% 8.2% 27.4% 50.3% 25.0% 5.5% 10.4% 13.2% 40.1% 9370
High School Athletes
39.9% 60.1% 5.5% 13.0% 24.1% 53.9% 16.2% 1.5% 5.1% 8.4% 32.9% 4308
High School Students
49.1% 50.9% 9.8% 9.0% 25.2% 52.4% 19.8% 2.4% 8.3% 9.5% 37.9% 12658
Student athletes participate in a variety of activities other than athletics as well. According to the student athlete survey conducted in January 2016, 27.2% are enrolled in advanced academic courses; 8.9% have a job; 18.2% are involved in National Honor Society/National Junior Honor Society; 0.9% are on the Debate team; 18.1% are enrolled in a VPA course; and 39.5% are involved in another school functions.
2. What are the academic achievements of students who participate in Athletics?
Based on the compiled coaches program evaluations completed at the end of each year, all CCISD coaches performed grade checks during the mandatory three week period and many have weekly grade checks. All coaches encouraged students to attend tutorials on Tuesdays and Thursdays.
In late September/early October of 2015, January and May of 2016, students were selected from each sport to be part of focus group discussions. Students from each group stated they had to be very organized and plan ahead with respect to balancing their academic and athletic schedules. Most students stated they found it challenging to be on top of their school work as well as practice, although some responses varied by sport. Many of the students in the focus groups were enrolled in Pre-AP or AP courses. Many of the student athletes stated they managed their time well and prioritized what school work needed their attention and knew what assignments were due when. Most students emphasized

Athletics Program Evaluation 2010-11 to 2014-15
Page | 3
their coaches allowed for some flexibility for completing assignments and/or attending tutorials to catch up on classwork.
Academic Achievements of Athletes 2010-11 2011-12 2012-13 2013-14 2014-15
% of Athletes in AP Courses 35.3% 37.2% 42.6% 41.0% 40.2%
% of Athletes Earning Superintendent Scholar 20.0% 23.4% 39.4% 46.1% 54.7%
% of Athletes Earning National Merit 12.8% 23.7% 33.0% 41.9% 22.6%
During the five year period of this study, 17.4% of the students who graduated either Valedictorian or Salutatorian from the five comprehensive high schools participated in athletics while enrolled in CCISD during high school.
From the student survey results (based on a 1-Strongly Disagree to 4-Strongly Agree Likert Scale), the lowest results came in the following areas:
The Athletic program curriculum effectively incorporates the use of technology (2.61).
Study skills (2.77). The highest result from the student survey came from the following:
The Athletic program teachers/coaches show interest in my academic success (3.40).
My attendance has improved since my involvement in the Athletic program (3.00). From the parent survey results, the lowest results came in the following areas:
My student’s grades have improved since their involvement in the Athletic program (2.49).
Study skills (2.55). The highest results from the parent survey came from the following:
The Athletic program teachers/coaches show interest in my student’s academic success (3.14).
My student’s attendance has improved since their involvement in the Athletic program (2.60). From the teacher survey results, the lowest results came in the following areas:
My students’ grades have improved since their involvement in the Athletic program (2.78).
The Athletic program curriculum effectively incorporates the use of technology (2.97). The highest results from the teacher survey came from the following:
I show interest in my students’ academic success (3.83).
My students’ attendance has improved since their involvement in the Athletic program (3.36).
3. What benefits, beyond academic achievements, do students receive from being in Athletics?
Based on the compiled coaches program evaluations completed at the end of each year, most athletic programs in CCISD indicated they spent time on character development as well as leadership skills. The coaching staff believes it is important to develop their student athletes into outstanding young men and women who show leadership, integrity, high ethics, and community involvement.
Based on student focus group discussions, many students felt they have learned many skills outside of their sport. Many students spoke about developing skills such as time management, hard work, perseverance, self-motivation, and work ethic.
Students involved in Athletics often carry out at many community functions. A sampling of community events which students participated in 2014-15 are listed on pages 68-69.
From the student survey results (based on a 1-Strongly Disagree to 4-Strongly Agree Likert Scale), the lowest result came in the following areas:
Organizational skills (3.02). The highest result from the student survey came from the following:
I feel actively engaged in learning and improving my talent level in the Athletic program (3.48).
Responsibility & Performance skills (3.45). From the parent survey results, the lowest results came in the following areas:
Organizational skills (2.79).

Athletics Program Evaluation 2010-11 to 2014-15
Page | 4
Problem solving (2.82). The highest results from the parent survey came from the following:
My student feels actively engaged in learning and improving their talent level in the Athletic program (3.12).
Responsibility (3.12). From the teacher survey results, the lowest results came in the following areas:
I believe that additional support/expenditures is necessary for my students to be successful in the Athletic program (3.09).
Organizational skills (3.37). The highest results from the teacher survey came from the following:
My expectations about the athletic program are clear (3.77).
I am valuable to my students’ success in the Athletic program & I am aware of my students’ strengths and weaknesses with respect to the Athletic program (3.76).
4. What type of awards and distinctions are earned by students in Athletics?
Since 2013-14, the Athletic department in CCISD hosts a reception for all student athletes who have
signed a Letter of Intent to participate at the collegiate level. In 2013-14, there were a total of 90
student athletes who signed a Letter of Intent to participate at the collegiate level while there were 94
students who signed a Letter of Intent in 2014-15.
Of the 1270 student athletes who began their CCISD high school careers in 2010-11, 7.1% signed a Letter
of Intent. Of the 615 senior student athletes in 2013-14, 14.6% signed a Letter of Intent to participate at
the collegiate level.
5. What are the post-secondary outcomes for students who have participated in Athletics?
The National Student Clearinghouse has more than 3,600 participating colleges and universities. Those participants enroll 98% of all students in public and private U.S. institutions. The data is based on a student enrolling in college at any point after they graduate from high school. Students who graduated in 2011 have more opportunities to enroll in college than students who have recently graduated from high school in 2015.
The percentage of athletes who have enrolled in college after high school graduation range from 79.8% to 90.9% during the five year period of this study with an overall average of 87.0%. From the survey results (based on a 1-Strongly Disagree to 4-Strongly Agree Likert Scale), the lowest results came in the following areas:
Parents o My student’s experience in the Athletic program has contributed to their growth in
developing future college and/or career goals (2.80) – Wrestling (2.23) & Cheer (2.49).
Students o My experience in the Athletic program has contributed to my growth in developing
future college and/or career goals – Swimming (2.84) & Cheer (2.96). The highest result from the surveys came from the following:
Parents o My student’s experience in the Athletic program has contributed to their growth in
developing future college and/or career goals – Trainer (3.38).
Students o My experience in the Athletic program has contributed to my growth in developing
future college and/or career goals – Wrestling (3.55).

Athletics Program Evaluation 2010-11 to 2014-15
Page | 5
6. What professional learning opportunities and accolades/distinctions are received by Athletics
staff?
A sampling of awards and distinctions earned by the coaches in CCISD can be found on pages 92-93. From the teacher survey results, the lowest results came in the following areas:
The Athletic professional learning program supports classroom instruction – Wrestling (2.89).
The Athletics professional learning program improves classroom instruction – Wrestling (2.78). The highest results from the teacher survey came from the following:
The Athletic professional learning program supports classroom instruction – Softball (3.86).
The Athletics professional learning program improves classroom instruction – Softball (3.86).
7. What are revenues and expenditures for the Athletics program?
Based on revenues and expenditures provided by the CCISD Finance Department, the cost per student is calculated for intermediate student activity funds, high school student activity funds, and for all students enrolled in the Athletics program the expenses from general funds.
General fund expenditures include supplies, furniture, equipment and equipment repair, travel, membership dues, food, insurance, and extra duty pay. Salaries and stipends are not included as part of the activity fund expenses.
The total revenues and expenditures by gender for Intermediate and High School athletics during the five year period of this study were:
Intermediate Boys Girls Co-Ed Total
Revenue $411,920 $484,670 $629,432 $896,589
Expenses $407,445 $480,989 $615,308 $888,433
N 5156 4686 9842
Expenditure per Student $79.02 $102.64 $90.27
High School Boys Girls Co-Ed Total
Revenue $2,578,634 $1,244,762 $2,188,684 $6,012,081
Expenses $2,549,732 $1,244,375 $2,134,832 $5,928,939
N 11881 6872 1477 18753
Expenditure per Student $214.61 $181.08 $1,445.38 $316.16
General fund expenditures include supplies, furniture, equipment and equipment repair, travel, membership dues, food, insurance, and extra duty pay. General funds ranged from $1,621,719 to $1,749,590. Salaries ranged from $2,877,631 to $3,035,339.
During the 2011-12 year, athletic stipends at the intermediate level ranged from $1,850 to $4,800 with Campus Coordinators receiving an additional $500. During the 2014-15 year, athletic stipends at the intermediate level ranged from $1,850 to $4,800 with Campus Coordinators receiving an additional $1,050. See page 97 for details.
During the 2011-12 year, athletic stipends at the high school level ranged from $2,000 to $16,250 with Campus Coordinators receiving an additional $8,500. During the 2014-15 year, athletic stipends at the intermediate level ranged from $2,200 to $10,375. Head football coaches and Campus Coordinators receive additional contract days with no additional stipend. Please see pages 98-99 for details.

Athletics Program Evaluation 2010-11 to 2014-15
Page | 6
Background Information on Athletics
The purpose of evaluating programs in CCISD shall be multi-faceted and shall result in findings, recommendations, and/or conclusions that:
Ensure program alignment with the District strategic plan;
Assess strengths and weaknesses of the program;
Measure the success of the program in meeting its expressed goals; and/or
Result in improvements in, revisions to, or discontinuation of the program.
As part of CCISD’s program evaluation process, the Office of Assessment and Evaluation has completed a program evaluation for the Athletics program encompassing the five-year period from the 2010-11 through 2014-15 school years.
CCISD’s Strategic Plan includes the following seven strategies, and the Athletics Program aligns with each strategy as detailed below:
I. We will inspire learning through an array of personalized opportunities and experiences. Students are required to take physical education classes in elementary school through two semesters of high. Students may begin to enroll and tryout for athletic teams in grade 7. Students who meet the athletic class requirements experience personalized learning opportunities in order to maximize their learning, which is tailored to their interests in Athletics, including team and individual sports.
II. We will provide student support to meet the needs and aspirations of each student. As conveyed in the student focus groups, coaches support students’ needs and aspirations through the relationships they build with their student athletes and the sense of community in which coaches and students create. Along with the student focus groups, the student, parent, and teacher survey results revealed students have acquired lifelong skills, which will help them be successful in everyday life, including, but not limited to skills such as teamwork, collaboration, persistence, and problem-solving.
III. We will ensure safe and nurturing learning environments. Coaches are required to be CPR certified and maintain their certification. High school athletic programs employee two certified athletic trainers to provide treatment and rehabilitation should an athlete become injured.
IV. We will ensure each student understands and assumes his or her role as a productive citizen. As evident in the student focus groups, the development of skills such as time management, hard work, perseverance, self-motivation, and work ethic are examples of the character traits student athletes exhibit.
V. We will broaden and strengthen connections within our communities. Throughout student athletes’ high school enrollment, they participate in many community and school service events. PK-12 communities participate in events such as homecoming, which helps strengthen the bond between and among students of all ages. There are many community events and performances in which student athletes participate, they learn how to interact with community members in order to support the district and the community as a productive citizen.

Athletics Program Evaluation 2010-11 to 2014-15
Page | 7
Background Information on Athletics
VI. We will ensure mutual understanding and support through effective communication.
Through the student athletes’ experiences in athletics, they learn effective communication skills as they collaborate with one another and their coaches through practice, games, events, and matches.
VII. We will build capacity for organizational change.
Head coaches mentor assistant coaches to become future head coaches. Coaches are provided with various Professional Learning opportunities within and outside of CCISD. Opportunities present themselves on a daily basis for coaches and student athletes to develop their leadership skills.
University Interscholastic League (UIL)
The UIL is the governing body which oversees how athletics is administered throughout the state. The UIL is “the largest inter-school organization of its kind in the world” (UIL, 2016a).
The UIL exists to provide opportunities for middle and high school age students to participate in educational extracurricular academic, athletic, and music contests. “The purpose of the UIL is to organize and properly supervise contests that assist in preparing students for citizenship. It aims to provide healthy, character building, educational activities carried out under rules providing for good sportsmanship and fair play for all participants” (UIL, 2016b).
Over the years, administrators from across the state have served on various UIL committees to assist with writing the rules and administrative guidelines for athletics in the state of Texas. Each sport has an individual plan and schedule for each school year. There are overarching rules and regulations for student conduct, eligibility, coaches’ code of conduct, contests, officials, and school practice and game restrictions along with rule violations and penalties.
CCISD Athletics
The mission of CCISD Athletics is stated in the CCISD Coaches Handbook “It is the mission of CCISD Athletics to promote and provide opportunities for each student athlete to develop into a productive citizen through work ethic, discipline and competition. We will create an environment that fosters humility, character, sportsmanship, making positive life choices and accept the idea that all deserve the right to be Champions.”
The philosophy of CCISD Athletics “is dedicated to giving all students the opportunity to participate in a highly competitive, comprehensive, accelerated athletic program by employing dedicated professionals and providing appropriate funding through fairly administered and conducted activities. We believe that athletics is a microcosm of society and that through participation in our athletic program, student athletes will inherently learn life skills enabling them to be productive members of society capable of managing time, striving to set and obtain goals, and developing an enhanced self-discipline.”
Three main themes are apparent in all successful athletic programs: integrity, character, and honesty, and these themes must be exhibited first by the coach, who is held accountable for passing these characteristics on to each student athlete.

Athletics Program Evaluation 2010-11 to 2014-15
Page | 8
Background
“Participation in the athletic program at CCISD is a privilege and as such, the student athlete is held to a much higher standard than that of the general school population; therefore, the guidelines and rules that each coach sets for the team will be stricter in nature than those delineated in the Student Code of Conduct” (CCISD Coaches Handbook).There are limited high school athletic program evaluations publicly available to compare against CCISD athletics. The state of Connecticut has a set of defined standards which each member school will measure how they compare to the standards as well as identify areas for improvement. The five areas which the Connecticut Interscholastic Athletic Conference (CIAC) standards are based on include: guiding principles, curriculum, resources and equity, administration, and program and player evaluation. There are indicators within each of the five standards for schools to measure themselves against. Surveys are conducted with parents, students, and the coaching staff. The evaluation is completed with findings, commendations, and recommendations. The CIAC program evaluation is a process for continuous improvement, similar to CCISD’s program evaluation process. Appendix C shows the five standards with the embedded indicators. (The Connecticut Association of Schools, 2015)

Athletics Program Evaluation 2010-11 to 2014-15
Page | 9
Background Information on Athletics
Intermediate School Athletics
According to the Intermediate student CCISD Educational Planning Guide (EPG), students are required to complete a minimum of four semesters of Health Fitness within grade levels 6-8. Students may select additional units in Health Fitness. Students in grade 7 and 8 must successfully complete a tryout process in order to be placed in the Athletic period and obtain their required Health Fitness credits. A physical examination is required every year before participation is allowed and must be completed by the start of tryouts. Students are enrolled in an Athletics class and tryout for individual sports as those seasons begin. Students may compete in football, basketball, volleyball, track, tennis, cross-country, and golf. Boys and girls soccer competes on a club basis at all campuses.
High School Athletics
High school students must complete two semesters of high school physical education. Athletics, cheerleading, and participation as an athletic trainer may substitute for the required physical education credits. Students are enrolled after receiving approval from the coach of the athletic activity. According to the CCISD student Educational Planning Guide (EPG) following list includes the sports which are available for students to participate:
Girls Athletics Boys Athletics Co-Ed Athletics
Basketball - Freshmen Baseball - Freshmen/Sophomore
Cheerleading
Basketball - Jr Varsity Baseball - Jr Varsity / Varsity Swimming - Jr Varsity
Basketball - Varsity Basketball - Freshmen Trainer - I
Cross Country Basketball - Jr Varsity Trainer - II
Golf Basketball - Varsity Trainer - III
Soccer - Freshmen Cross Country Trainer - IV
Soccer - Jr Varsity Football - Freshmen/Sophomore
Soccer - Varsity Football - Jr Varsity /Varsity
Softball Golf
Softball - Varsity Soccer - Freshmen
Swimming* Soccer - Jr Varsity
Tennis - Freshmen Soccer - Varsity
Tennis - Jr Varsity Swimming*
Tennis - Varsity Tennis - Freshmen
Track Tennis - Jr Varsity
Volleyball - Freshmen Tennis - Varsity
Volleyball - Jr Varsity Track
Volleyball - Varsity Wrestling
Wrestling *Water Polo and Diving are included in the Swim course
Athletics Program Evaluation 2010-11 to 2014-15
Page | 10
Background Information on Athletics
High School Athletics
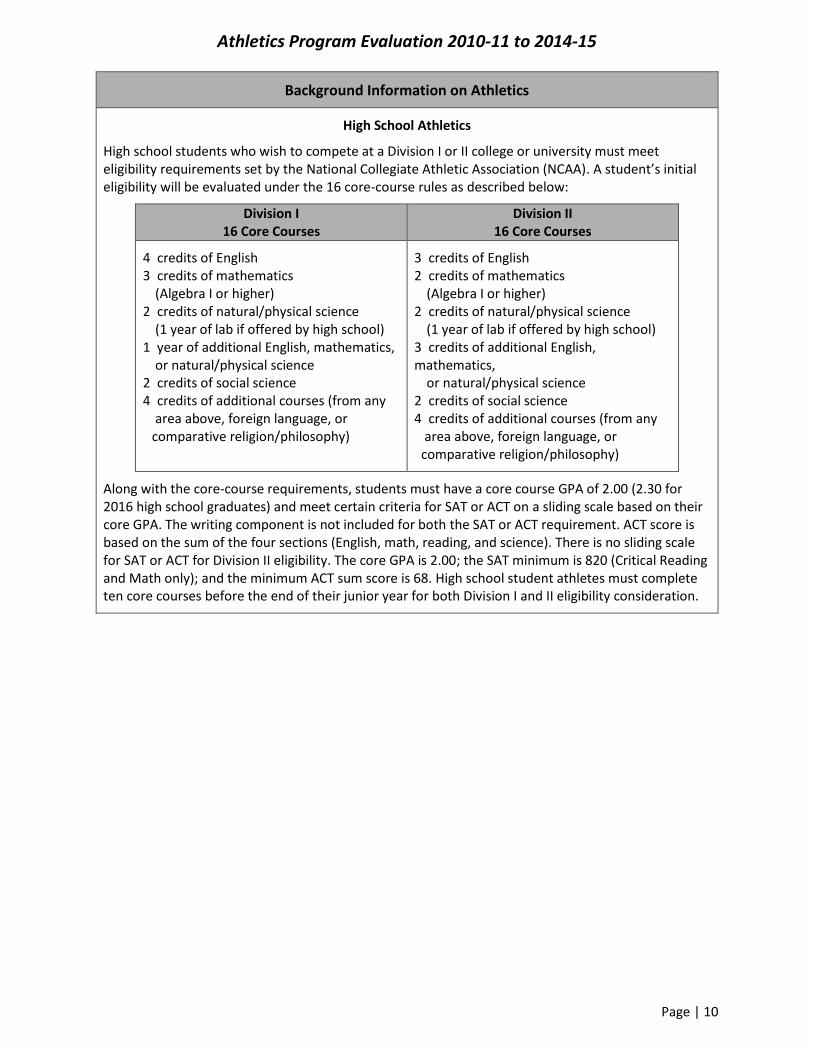
High school students who wish to compete at a Division I or II college or university must meet eligibility requirements set by the National Collegiate Athletic Association (NCAA). A student’s initial eligibility will be evaluated under the 16 core-course rules as described below:
Division I 16 Core Courses
Division II 16 Core Courses
4 credits of English 3 credits of mathematics
(Algebra I or higher) 2 credits of natural/physical science
(1 year of lab if offered by high school) 1 year of additional English, mathematics,
or natural/physical science 2 credits of social science 4 credits of additional courses (from any
area above, foreign language, or comparative religion/philosophy)
3 credits of English 2 credits of mathematics
(Algebra I or higher) 2 credits of natural/physical science
(1 year of lab if offered by high school) 3 credits of additional English, mathematics,
or natural/physical science 2 credits of social science 4 credits of additional courses (from any
area above, foreign language, or comparative religion/philosophy)
Along with the core-course requirements, students must have a core course GPA of 2.00 (2.30 for 2016 high school graduates) and meet certain criteria for SAT or ACT on a sliding scale based on their core GPA. The writing component is not included for both the SAT or ACT requirement. ACT score is based on the sum of the four sections (English, math, reading, and science). There is no sliding scale for SAT or ACT for Division II eligibility. The core GPA is 2.00; the SAT minimum is 820 (Critical Reading and Math only); and the minimum ACT sum score is 68. High school student athletes must complete ten core courses before the end of their junior year for both Division I and II eligibility consideration.

Athletics Program Evaluation 2010-11 to 2014-15
Page | 11
Program Evaluation Questions
The following questions were determined by this program evaluation team to evaluate Athletics:
1. What is the participation rate of students in the various Athletic programs?
2. What are the academic achievements of students who participate in Athletics?
3. What benefits, beyond academic achievements, do students receive from being in Athletics?
4. What type of awards and distinctions are earned by students in Athletics?
5. What are the post-secondary outcomes for students who have participated in Athletics?
6. What professional learning opportunities and accolades/distinctions are received by Athletics staff?
7. What are revenues and expenditures for the Athletics program?

Athletics Program Evaluation 2010-11 to 2014-15
Page | 12
1. What is the participation rate of students in the various Athletic programs?
The following charts depict the number and percentage of students who are enrolled in each content area within the Athletic program at each level based on the overall enrollment at such level. At both the intermediate and high school level, students may enroll in more than one sport. For example, an intermediate student could be enrolled in volleyball, basketball, and tennis in the same grade level. High school students could be enrolled in multiple sports.
Participation in Intermediate Athletics
Percentages are based on unique students Based on students enrolled on Snapshot day and the last day in March
Approximately 30% of boys in grades 7 and 8 participated in at least one athletic sport while attending intermediate school during the five year period of this study. Approximately 30% of girls in grade 7 participated in at least one athletic sport while attending intermediate school during the five year period of this study, and about 25% of grade 8 girls participated in at least one sport while attending intermediate school.
0%
10%
20%
30%
40%
50%
2010-11 2011-12 2012-13 2013-14 2014-15
32.8% 31.5% 30.9% 32.7% 33.3%32.3% 31.7%29.6% 29.6% 31.5%
Intermediate Boys Athletic Participation
07 08
0%
10%
20%
30%
40%
50%
2010-11 2011-12 2012-13 2013-14 2014-15
31.2%
37.1%32.9% 31.3%
33.3%
26.2% 27.1% 27.0% 26.4% 24.9%
Intermediate Girls Athletic Participation
07 08

Athletics Program Evaluation 2010-11 to 2014-15
Page | 13
1. What is the participation rate of students in the various Athletic programs?
Participation in High School Athletics
Percentages are based on unique students Students include co-ed athletics (cheerleaders, trainers, and JV swimmers) Based on students enrolled on Snapshot day and the last day in March
Approximately 47% of boys in grade 9 participated in at least one athletic sport while attending high school during the five year period of this study. The data shows there is a decline in participation through grade 12 during the same time frame for an average of about 27%.
Approximately 30% of girls in grade 9 participated in at least one athletic sport while attending high school during the five year period of this study. The data shows there is a decline in participation through grade 12 during the same time frame for an average of nearly 15%.
0%
10%
20%
30%
40%
50%
2010-11 2011-12 2012-13 2013-14 2014-15
High School Boys Athletic Participation
09 10 11 12
0%
10%
20%
30%
40%
50%
2010-11 2011-12 2012-13 2013-14 2014-15
High School Girls Athletic Participation
09 10 11 12

Athletics Program Evaluation 2010-11 to 2014-15
Page | 14
1. What is the participation rate of students in the various Athletic programs?
Students in grades 1 through 5 take one hour of physical education each week. Most elementary students are required to take physical education; therefore, the demographics of the art and music students reflect the district elementary demographics.
Intermediate Student Athlete Participation
Boys 2010-11 2011-12 2012-13 2013-14 2014-15
Grade 7 CCISD Total 1582 1661 1615 1653 1671
Athletes 32.8% 31.5% 30.9% 32.7% 33.3%
Grade 8 CCISD Total 1639 1597 1640 1600 1658
Athletes 32.3% 31.7% 29.6% 29.6% 31.5%
Girls 2010-11 2011-12 2012-13 2013-14 2014-15
Grade 7 CCISD Total 1537 1584 1589 1565 1583
Athletes 31.2% 37.1% 32.9% 31.3% 33.3%
Grade 8 CCISD Total 1583 1541 1596 1581 1602
Athletes 26.2% 27.1% 27.0% 26.4% 24.9% Based on students enrolled on Snapshot day and the last day in March
High School Student Athlete Participation
Boys 2010-11 2011-12 2012-13 2013-14 2014-15
Grade 9 CCISD Total 1776 1789 1801 1815 1794
Athletes 45.7% 48.8% 48.3% 46.9% 47.2%
Grade 10 CCISD Total 1623 2047 2086 1878 1747
Athletes 39.5% 32.2% 34.5% 36.6% 40.3%
Grade 11 CCISD Total 1598 1617 1887 1843 1633
Athletes 32.3% 34.0% 29.7% 31.6% 34.2%
Grade 12 CCISD Total 1436 1505 1546 1497 1590
Athletes 26.9% 27.2% 28.5% 26.6% 28.4%
Girls 2010-11 2011-12 2012-13 2013-14 2014-15
Grade 9 CCISD Total 1606 1692 1667 1660 1679
Athletes 28.5% 30.4% 31.2% 30.2% 29.2%
Grade 10 CCISD Total 1507 1849 1858 1696 1663
Athletes 24.4% 23.1% 22.7% 24.4% 24.5%
Grade 11 CCISD Total 1442 1543 1775 1702 1592
Athletes 19.0% 20.7% 17.7% 18.7% 20.4%
Grade 12 CCISD Total 1350 1395 1452 1493 1536
Athletes 14.5% 14.1% 16.0% 14.5% 15.6% Based on students enrolled on Snapshot day and the last day in March
This data is reflected and summarized in the charts on the previous two pages.

Athletics Program Evaluation 2010-11 to 2014-15
Page | 15
1. What is the participation rate of students in the various Athletic programs?
Number of Sports Student Athletes Participate
Grade Level
1 2 3 4 5 6 7 Total
7 48.0% 33.1% 10.9% 5.7% 1.2% 0.8% 0.4% 513
8 33.0% 39.4% 19.2% 4.9% 1.8% 1.1% 0.7% 449
9 75.3% 22.5% 1.6% 0.5% 182
10 81.9% 18.1% 216
11 79.8% 19.6% 0.6% 168
12 88.8% 11.3% 80
Total 913 469 146 52 14 9 5 1608 Data is based on responses from Student Athletic Survey
Based on students’ survey results conducted in January 2016, the number of sports which students participate declines from grade 7 through grade 12, with the greatest change occurring during the progression from grade 8 to grade 9. Many students who participated in the focus groups also spoke about their decision to focus on one sport. Some of this was due to the demands of participation outside of CCISD athletics, commonly referred to as club teams.

Athletics Program Evaluation 2010-11 to 2014-15
Page | 16
1. What is the participation rate of students in the various Athletic programs?
Demographics for all student athletes is based on information in the student information system on Snapshot day (last Friday of October).
A demographic comparison is illustrated above, which compares the enrollment of intermediate boys in athletics to all intermediate boys. The data shows a higher percentage of black and white boys who participate in athletics as compared to the district. There is a lower percentage of Asian, Limited English Proficient (LEP), and Special Education (SPED) boys who participate in athletics.
0%
10%
20%
30%
40%
50%
60%
70%
AS BL HI WH Eco Dis LEP SPED GT At Risk
Intermediate Boys Grades 7 and 8 Athletics
2010-11 2011-12 2012-13 2013-14 2014-15
0%
10%
20%
30%
40%
50%
60%
70%
AS BL HI WH ECO LEP SPED GT At Risk
Intermediate Boys Grades 7 and 8 District Demographics
2010-11 2011-12 2012-13 2013-14 2014-15
Athletics Program Evaluation 2010-11 to 2014-15
Page | 17
1. What is the participation rate of students in the various Athletic programs?
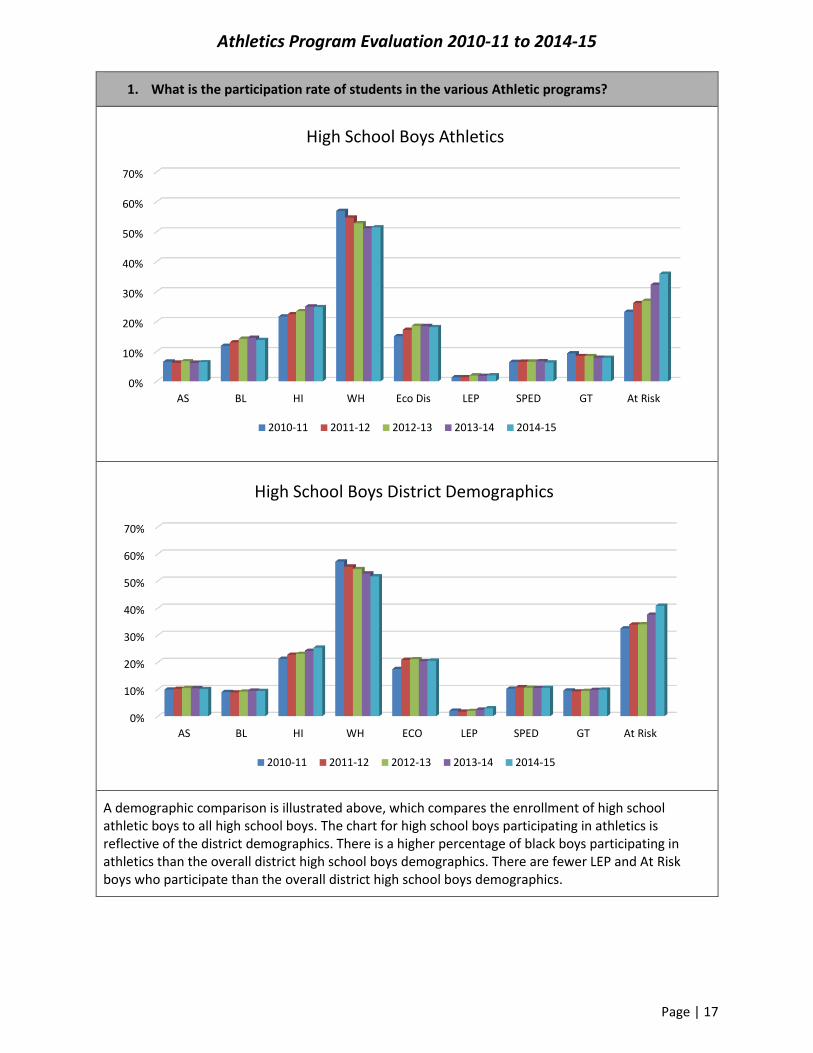
A demographic comparison is illustrated above, which compares the enrollment of high school athletic boys to all high school boys. The chart for high school boys participating in athletics is reflective of the district demographics. There is a higher percentage of black boys participating in athletics than the overall district high school boys demographics. There are fewer LEP and At Risk boys who participate than the overall district high school boys demographics.
0%
10%
20%
30%
40%
50%
60%
70%
AS BL HI WH Eco Dis LEP SPED GT At Risk
High School Boys Athletics
2010-11 2011-12 2012-13 2013-14 2014-15
0%
10%
20%
30%
40%
50%
60%
70%
AS BL HI WH ECO LEP SPED GT At Risk
High School Boys District Demographics
2010-11 2011-12 2012-13 2013-14 2014-15

Athletics Program Evaluation 2010-11 to 2014-15
Page | 18
1. What is the participation rate of students in the various Athletic programs?
A demographic comparison is illustrated above, which compares the enrollment of intermediate athletic girls to all intermediate girls. The data shows a higher percentage of black and white girls who participate in athletics as compared to the district. There is a lower percentage of Asian, LEP, SPED, At-Risk girls who participate in athletics.
0%
10%
20%
30%
40%
50%
60%
70%
AS BL HI WH Eco Dis LEP SPED GT At Risk
Intermediate Girls Grades 7 and 8 Athletics
2010-11 2011-12 2012-13 2013-14 2014-15
0%
10%
20%
30%
40%
50%
60%
70%
AS BL HI WH ECO LEP SPED GT At Risk
Intermediate Girls Grades 7 and 8 District Demographics
2010-11 2011-12 2012-13 2013-14 2014-15

Athletics Program Evaluation 2010-11 to 2014-15
Page | 19
1. What is the participation rate of students in the various Athletic programs?
A demographic comparison is illustrated above, which compares the enrollment of high school athletic girls to all high school girls. The chart for high school girls participating in athletics is reflective of the district demographics. There is a higher percentage of black and GT girls participating in athletics than the overall district high school girls demographics. There are fewer Asian, Economically Disadvantaged, SPED and At Risk girls who participate than the overall district high school girls demographics.
0%
10%
20%
30%
40%
50%
60%
70%
AS BL HI WH Eco Dis LEP SPED GT At Risk
High School Girls Athletics
2010-11 2011-12 2012-13 2013-14 2014-15
0%
10%
20%
30%
40%
50%
60%
70%
AS BL HI WH ECO LEP SPED GT At Risk
High School Girls District Demographics
2010-11 2011-12 2012-13 2013-14 2014-15

Athletics Program Evaluation 2010-11 to 2014-15
Page | 20
1. What is the participation rate of students in the various Athletic programs?
A demographic comparison is illustrated above, which compares the enrollment of high school athletic co-eds to all high school co-eds. The chart for high school co-eds participating in athletics is reflective of the district demographics. There is a higher percentage of females and White co-eds participating in athletics than the overall district high school co-ed demographics. There are fewer males, Asians, Hispanic, Economically Disadvantaged, SPED, and At-Risk students who participate in a co-ed activity than the overall district high school co-ed demographics.
0%
10%
20%
30%
40%
50%
60%
70%
80%
90%
F M AS BL HI WH Eco Dis LEP SPED GT At Risk
High School Co-Ed Athletics
2010-11 2011-12 2012-13 2013-14 2014-15
0%
10%
20%
30%
40%
50%
60%
70%
80%
90%
F M AS BL HI Wh Eco Dis LEP SPED GT At Risk
High School District Demographics
2010-11 2011-12 2012-13 2013-14 2014-15

Athletics Program Evaluation 2010-11 to 2014-15
Page | 21
1. What is the participation rate of students in the various Athletic programs?
A demographic comparison is illustrated above, which compares the enrollment of intermediate athletic students to all intermediate students. The data shows a higher percentage of males and black students who participate in athletics as compared to the district. There is a lower percentage of Asian, Hispanic, Economically Disadvantaged, SPED, At-Risk students who participate in athletics at the intermediate level.
0%
10%
20%
30%
40%
50%
60%
70%
F M AS BL HI WH Eco Dis LEP SPED GT At Risk
All Intermediate Grades 7 and 8 Athletics
2010-11 2011-12 2012-13 2013-14 2014-15
0%
10%
20%
30%
40%
50%
60%
70%
F M AS BL HI Wh Eco Dis LEP SPED GT At Risk
Intermediate Grade 7 and 8 District Demographics
2010-11 2011-12 2012-13 2013-14 2013-14

Athletics Program Evaluation 2010-11 to 2014-15
Page | 22
1. What is the participation rate of students in the various Athletic programs?
A demographic comparison is illustrated above, which compares the enrollment of high school athletic students to all high school students. The data shows a higher percentage of males and Black students who participate in athletics as compared to the district. There is a lower percentage of Asian, Economically Disadvantaged, SPED, and At-Risk students who participate in athletics at the high school level.
0%
10%
20%
30%
40%
50%
60%
70%
F M AS BL HI WH Eco Dis LEP SPED GT At Risk
All High School Athletics
2010-11 2011-12 2012-13 2013-14 2014-15
0%
10%
20%
30%
40%
50%
60%
70%
F M AS BL HI Wh Eco Dis LEP SPED GT At Risk
High School District Demographics
2010-11 2011-12 2012-13 2013-14 2014-15

Athletics Program Evaluation 2010-11 to 2014-15
Page | 23
1. What is the participation rate of students in the various Athletic programs?
Student athletes participate in a variety of activities other than athletics. According to the student athlete survey conducted in January 2016, 27.2% are enrolled in advanced academic courses; 8.9% have a job; 18.2% are involved in National Honor Society/National Junior Honor Society; 0.9% are on the Debate team; 18.1% are enrolled in a VPA course; and 39.5% are involved in another school functions.
Athletics Program Evaluation 2010-11 to 2014-15
Page | 24
1. What is the participation rate of students in the various Athletic programs?
Number of Coaches and Players by Sport and Campus - Boys
Basketball Football Soccer Tennis Baseball
Coaches Players Coaches Players Coaches Players Coaches Players Coaches Players
CCHS
12-13 5 53 14 200 3 49 2 22 5 55
13-14 5 53 14 200 3 52 1 25 5 50
14-15 5 62 12 166 3 49 1 20 4 48
CLHS
12-13 5 52 13 228 3 53 1 43 4 55
13-14 5 56 13 179 3 49 1 52 5 46
14-15 5 56 13 212 3 49 1 44 4 50
CBHS
12-13 5 57 n/a n/a 3 54 1 47 6 49
13-14 4 51 14 194 4 57 2 57 4 50
14-15 5 56 14 186 3 69 2 49 4 54
CSHS
12-13 5 63 14 168 3 52 1 30 4 51
13-14 5 52 14 219 3 54 1 33 5 62
14-15 5 71 11 229 3 54 1 36 4 56
CFHS
12-13 5 68 14 191 3 50 2 29 4 58
13-14 5 61 14 203 3 55 2 60 4 54
14-15 5 n/a 14 208 3 40 2 23 4 50
Average 4.9 57.9 13.4 198.8 3.1 52.4 1.4 38.0 4.4 52.5
Track/Field & CC Swimming Golf Wrestling
Coaches Players Coaches Players Coaches Players Coaches Players
CCHS
12-13 4 77 2 48 1 22 2 43
13-14 4 70 2 34 1 20 2 42
14-15 3 85 2 33 1 25 1 40
CLHS
12-13 4 69 2 22 1 15 2 53
13-14 4 79 2 28 1 16 2 44
14-15 4 143 2 22 1 11 2 46
CBHS
12-13 4 81 2 63 1 14 2 41
13-14 4 48 n/a n/a 1 15 2 36
14-15 4 59 2 20 1 14 2 37
CSHS
12-13 4 42 2 23 1 15 2 40
13-14 3 92 2 21 1 15 3 39
14-15 4 85 2 22 1 15 2 66
CFHS
12-13 3 32 2 17 1 19 2 78
13-14 4 60 2 41 1 17 2 46
14-15 3 60 1 66 1 14 2 67
Average 3.7 72.1 1.9 32.9 1.0 16.5 2.0 47.9 Data provided by Athletic Department *n/a – data not available
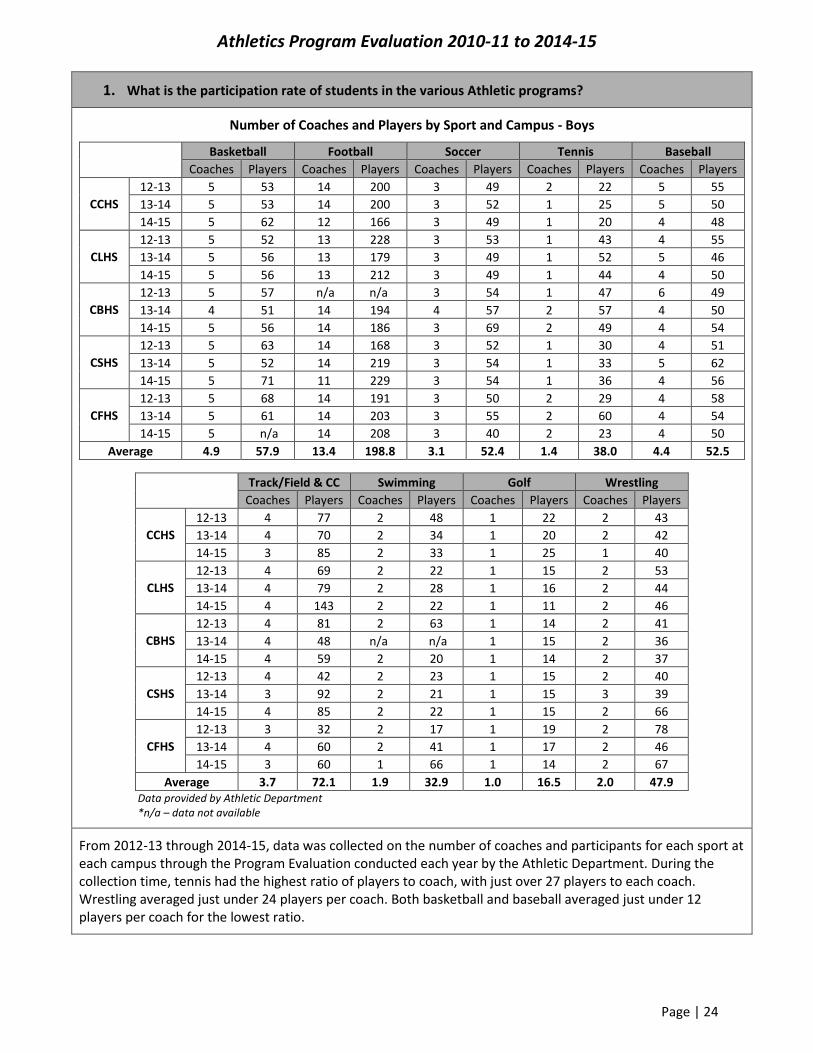
From 2012-13 through 2014-15, data was collected on the number of coaches and participants for each sport at each campus through the Program Evaluation conducted each year by the Athletic Department. During the collection time, tennis had the highest ratio of players to coach, with just over 27 players to each coach. Wrestling averaged just under 24 players per coach. Both basketball and baseball averaged just under 12 players per coach for the lowest ratio.

Athletics Program Evaluation 2010-11 to 2014-15
Page | 25
1. What is the participation rate of students in the various Athletic programs?
Number of Coaches and Players by Sport and Campus - Girls
Basketball Volleyball Soccer Tennis
Coaches Players Coaches Players Coaches Players Coaches Players
CCHS
12-13 4 37 4 45 2 43 2 21
13-14 4 46 4 45 3 40 1 33
14-15 4 43 4 45 2 40 1 31
CLHS
12-13 3 39 4 31 3 39 1 42
13-14 4 39 4 41 3 44 1 39
14-15 4 43 4 42 2 42 1 35
CBHS
12-13 4 38 4 45 3 44 n/a n/a
13-14 4 39 4 40 3 45 2 57
14-15 4 36 4 41 2 41 2 19
CSHS
12-13 4 45 4 59 3 52 1 36
13-14 4 45 4 55 3 49 1 34
14-15 4 48 4 52 1 60 1 34
CFHS
12-13 4 45 4 53 3 63 1 60
13-14 4 43 4 57 3 62 2 60
14-15 4 52 4 56 3 53 1 52
Average 3.9 42.5 4.0 47.1 2.6 47.8 1.3 39.5
Softball Track/Field & CC Swimming Golf
Coaches Players Coaches Players Coaches Players Coaches Players
CCHS
12-13 3 28 3 46 2 48 1 16
13-14 3 30 3 40 2 32 1 27
14-15 3 30 3 34 2 43 1 31
CLHS
12-13 3 26 3 58 2 27 1 14
13-14 3 30 3 70 2 27 1 15
14-15 3 25 3 76 2 25 1 14
CBHS
12-13 3 30 3 56 2 63 1 14
13-14 3 26 3 47 2 52 1 8
14-15 3 27 3 58 1 36 1 16
CSHS
12-13 3 31 3 55 2 41 1 15
13-14 3 32 3 60 2 34 1 11
14-15 3 33 3 70 2 26 1 14
CFHS
12-13 3 30 3 77 2 84 1 19
13-14 3 31 3 50 2 76 1 20
14-15 3 34 4 45 2 46 1 14
Average 3.0 29.5 3.1 56.1 1.9 44.0 1.0 16.5 Data provided by Athletic Department *n/a – data not available
From 2012-13 through 2014-15, data was collected on the number of coaches and participants for each sport at each campus through the Program Evaluation conducted each year by the Athletic Department. During the collection time, tennis had the highest ratio of players to coach, with just over 30 players to each coach. Track and Field/Cross Country averaged just over 18 players per coach. Basketball averaged just under 11 players per coach for the lowest ratio.
Athletics Program Evaluation 2010-11 to 2014-15
Page | 26
1. What is the participation rate of students in the various Athletic programs?
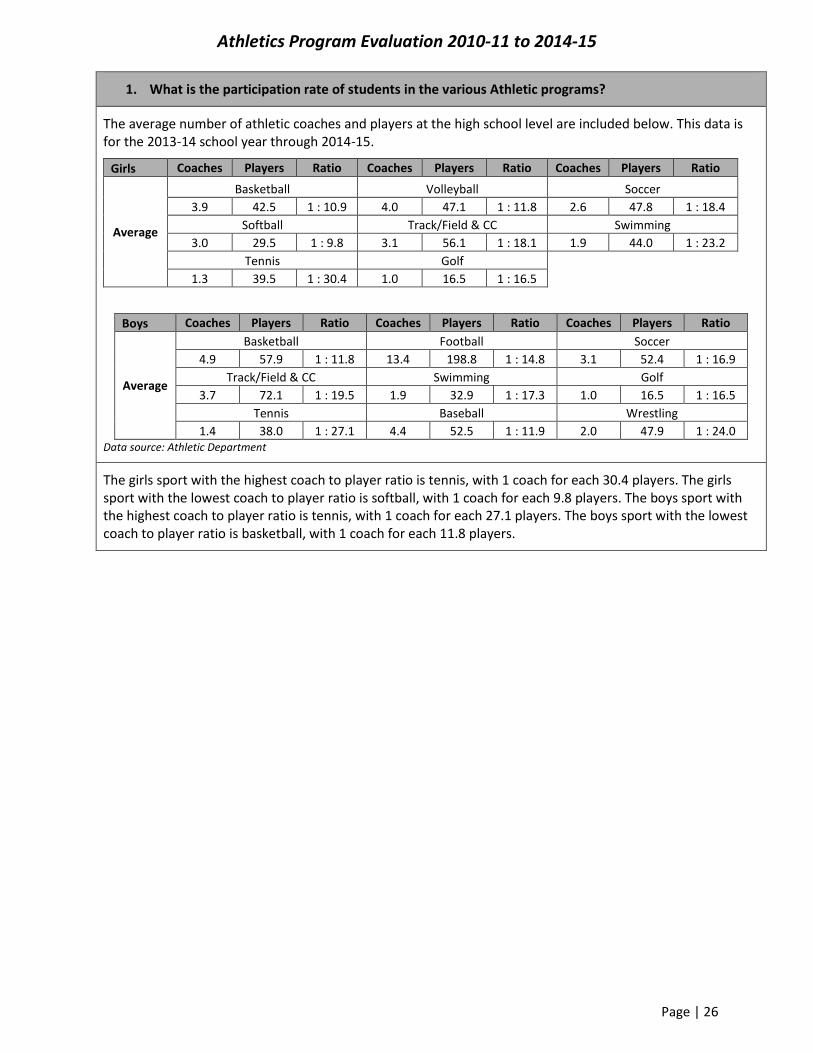
The average number of athletic coaches and players at the high school level are included below. This data is for the 2013-14 school year through 2014-15.
Girls Coaches Players Ratio Coaches Players Ratio Coaches Players Ratio
Average
Basketball Volleyball Soccer
3.9 42.5 1 : 10.9 4.0 47.1 1 : 11.8 2.6 47.8 1 : 18.4
Softball Track/Field & CC Swimming
3.0 29.5 1 : 9.8 3.1 56.1 1 : 18.1 1.9 44.0 1 : 23.2
Tennis Golf
1.3 39.5 1 : 30.4 1.0 16.5 1 : 16.5
Boys Coaches Players Ratio Coaches Players Ratio Coaches Players Ratio
Average
Basketball Football Soccer
4.9 57.9 1 : 11.8 13.4 198.8 1 : 14.8 3.1 52.4 1 : 16.9
Track/Field & CC Swimming Golf
3.7 72.1 1 : 19.5 1.9 32.9 1 : 17.3 1.0 16.5 1 : 16.5
Tennis Baseball Wrestling
1.4 38.0 1 : 27.1 4.4 52.5 1 : 11.9 2.0 47.9 1 : 24.0 Data source: Athletic Department
The girls sport with the highest coach to player ratio is tennis, with 1 coach for each 30.4 players. The girls sport with the lowest coach to player ratio is softball, with 1 coach for each 9.8 players. The boys sport with the highest coach to player ratio is tennis, with 1 coach for each 27.1 players. The boys sport with the lowest coach to player ratio is basketball, with 1 coach for each 11.8 players.
Athletics Program Evaluation 2010-11 to 2014-15
Page | 27
1. What is the participation rate of students in the various Athletic programs?
Student Survey (1611, 30.2% Response Rate)
Grade Level
7 8 9 10 11 12
32.0% 27.9% 11.3% 13.4% 10.4% 5.0%
Football Basketball Volleyball Soccer Softball Tennis Golf
34.1% 26.8% 19.4% 8.4% 1.4% 9.9% 7.0%
Track & Field
Cross Country
Baseball Wrestling Swimming Cheer Trainer
20.2% 21.8% 3.8% 1.9% 7.1% 3.5% 1.5%
Bayside IS Brookside IS Clear Creek IS Clear Lake IS Creekside IS
2.0% 8.5% 0.6% 2.5% 2.9%
League City IS Seabrook IS Space Center IS Victory Lakes IS Westbrook IS
8.4% 5.1% 11.2% 9.0% 9.6%
Clear Brook HS Clear Creek HS Clear Falls HS Clear Lake HS Clear Springs HS
12.7% 4.8% 7.1% 7.0% 8.5%
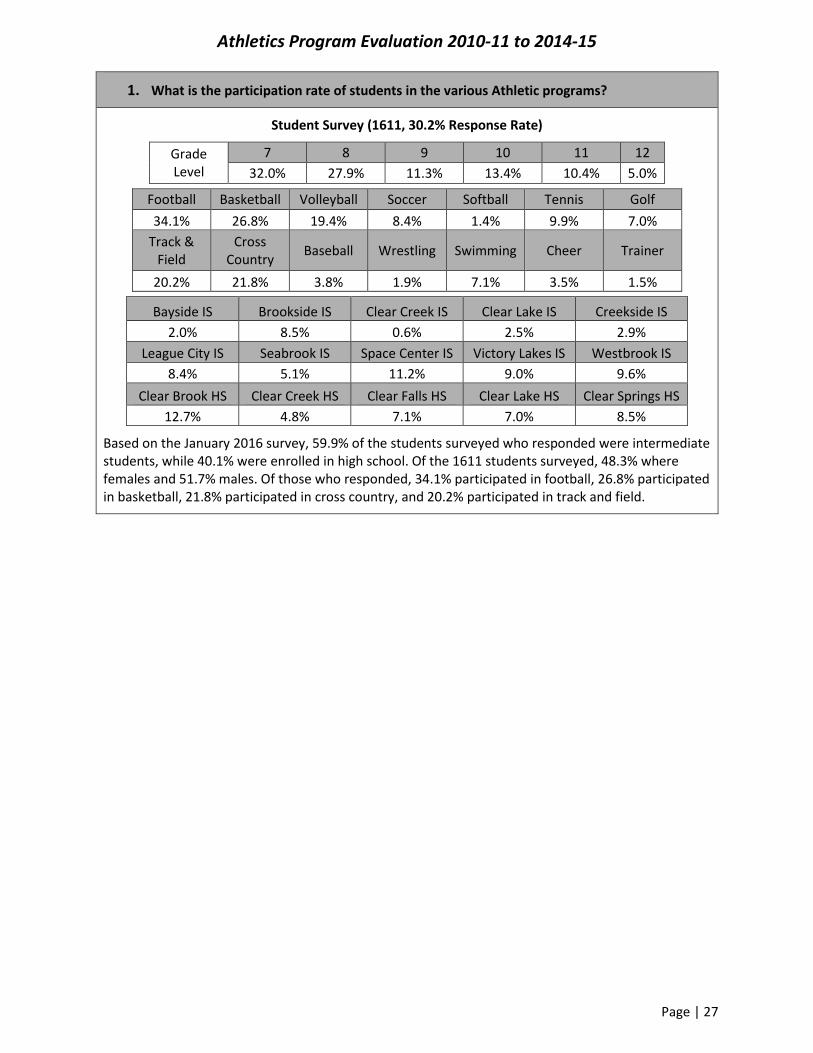
Based on the January 2016 survey, 59.9% of the students surveyed who responded were intermediate students, while 40.1% were enrolled in high school. Of the 1611 students surveyed, 48.3% where females and 51.7% males. Of those who responded, 34.1% participated in football, 26.8% participated in basketball, 21.8% participated in cross country, and 20.2% participated in track and field.
Athletics Program Evaluation 2010-11 to 2014-15
Page | 28
1. What is the participation rate of students in the various Athletic programs?
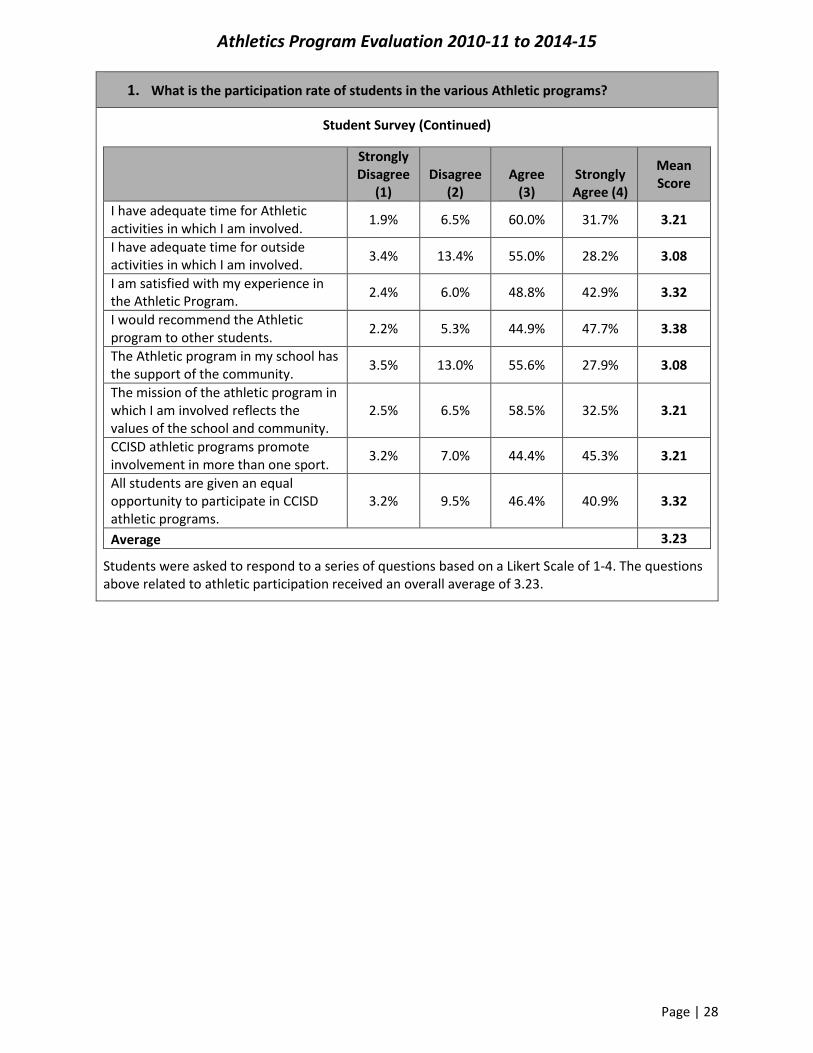
Student Survey (Continued)
Strongly Disagree
(1) Disagree
(2) Agree
(3) Strongly Agree (4)
Mean Score
I have adequate time for Athletic activities in which I am involved.
1.9% 6.5% 60.0% 31.7% 3.21
I have adequate time for outside activities in which I am involved.
3.4% 13.4% 55.0% 28.2% 3.08
I am satisfied with my experience in the Athletic Program.
2.4% 6.0% 48.8% 42.9% 3.32
I would recommend the Athletic program to other students.
2.2% 5.3% 44.9% 47.7% 3.38
The Athletic program in my school has the support of the community.
3.5% 13.0% 55.6% 27.9% 3.08
The mission of the athletic program in which I am involved reflects the values of the school and community.
2.5% 6.5% 58.5% 32.5% 3.21
CCISD athletic programs promote involvement in more than one sport.
3.2% 7.0% 44.4% 45.3% 3.21
All students are given an equal opportunity to participate in CCISD athletic programs.
3.2% 9.5% 46.4% 40.9% 3.32
Average 3.23
Students were asked to respond to a series of questions based on a Likert Scale of 1-4. The questions above related to athletic participation received an overall average of 3.23.

Athletics Program Evaluation 2010-11 to 2014-15
Page | 29
1. What is the participation rate of students in the various Athletic programs?
Student Survey (Continued)
1 Year
2 – 4 Years
5 – 6 Years
How many years, including this year, have you participated in the CCISD Athletic programs you indicated in the previous question, beginning in grade 6? (If multiple programs, use the one you have been involved with the longest.)
37.2% 52.6% 10.2%
0 Hours
Less than or equal
to 5 hours
More than 5 but less than or equal to 10 hours
More than 10 but less
than or equal to 15 hours
More than 15 hours
I have participated in _____ hours after school per week this school year with respect to the CCISD Athletic program referenced in the previous question (at school).
7.7% 20.0% 36.6% 20.7% 14.9%
0 Years 1 Year
2 – 4 Years
5 – 7 Years
8 – 10 Years
More than 10 Years
How many years, including this year, have you participated in the non-CCISD Athletic programs you indicated in the previous question? (If multiple programs, use the one you have been involved with the longest.)
23.3% 11.4% 21.7% 18.5% 13.2% 11.9%
N/A 30 minutes
or less
More than 30 minutes
but less than 2 hours
2 hours to less than 4
hours
4 hours to less than 10
hours More than 10 hours
I have participated in _____ minutes/hours of private instruction/club practice per week this school year with respect to the non-CCISD athletic program referenced in the previous question.
31.2% 7.5% 14.5% 15.8% 18.8% 12.2%
There were 62.8% of the students who have been involved in CCISD athletics for 2-6 years. Most students (72.3%) stated they participated in at least five hours of after school time in their primary sport, with 35.6% participating in more than 10 hours a week.
There were 56.4% of the student athletes who have been involved in an athletic program outside of CCISD for 0-4 years. There were 43.6% of the student athletes who have been involved in an athletic program outside of CCISD for five or more years. There were 11.9% of the student athletes who have been involved in an athletic program outside of CCISD for more than ten years. Most students (46.8%) stated they participated in at least two hours of after school time in their primary sport, with 22.0% participating in less than two hours a week.

Athletics Program Evaluation 2010-11 to 2014-15
Page | 30
1. What is the participation rate of students in the various Athletic programs?
Parent Survey (1159 surveys, 26.7% response rate)
Parent Response
7 8 9 10 11 12
18.6% 18.6% 16.7% 18.2% 16.5% 11.3%
Football Basketball Volleyball Soccer Softball Tennis Golf
32.8% 29.6% 13.6% 7.5% 4.1% 7.3% 6.6%
Track & Field
Cross Country
Baseball Wrestling Swimming Cheer Trainer
16.0% 14.4% 5.5% 3.0% 9.3% 3.7% 0.7%
Bayside IS Brookside IS Clear Creek IS Clear Lake IS Creekside IS
3.4% 1.4% 2.2% 2.6% 4.6%
League City IS Seabrook IS Space Center IS Victory Lakes IS Westbrook IS
6.0% 2.4% 4.6% 6.9% 3.4%
Clear Brook HS Clear Creek HS Clear Falls HS Clear Lake HS Clear Springs HS
19.3% 14.4% 10.2% 9.7% 9.1%
Based on the January 2016 survey, 37.2% of the parents surveyed who responded had intermediate students, while 62.8% had students enrolled in high school. Of the 1159 parents surveyed, 39.3% had female athletes and 60.7% had male athletes. Of those who responded, 32.8% had students who participated in football and 29.6% participated in basketball.

Athletics Program Evaluation 2010-11 to 2014-15
Page | 31
1. What is the participation rate of students in the various Athletic programs?
Parent Survey (Continued)
Strongly Disagree
(1) Disagree
(2) Agree
(3)
Strongly Agree
(4)
Mean Score
My student has adequate time for Athletic activities in which they are involved.
1.6% 6.1% 63.4% 28.8% 3.19
My student has adequate time for outside activities in which they are involved.
1.5% 10.4% 64.1% 24.1% 3.11
My student is satisfied with their experience in the Athletic Program.
13.4% 15.5% 42.9% 28.2% 2.86
I would recommend the Athletic program to other parents.
10.6% 12.6% 45.5% 31.3% 2.98
The Athletic program in my student’s school has the support of the community.
5.3% 13.5% 56.0% 25.2% 3.01
The mission of the athletic program in which my student is involved reflects the values of the school and community.
6.1% 10.7% 58.0% 25.2% 3.02
CCISD athletic programs promote involvement in more than one sport.
8.4% 18.9% 48.5% 24.2% 2.89
All students are given an equal opportunity to participate in CCISD athletic programs.
9.6% 11.0% 55.5% 24.0% 2.94
Participation in CCISD athletics is a positive experience.
7.9% 11.4% 46.2% 34.5% 3.07
Average 3.01
Parents were asked to respond to a series of questions based on a Likert Scale of 1-4. The questions above related to athletic participation received an overall average of 3.01.

Athletics Program Evaluation 2010-11 to 2014-15
Page | 32
1. What is the participation rate of students in the various Athletic programs?
Parent Survey (Continued)
1 Year 2 – 4 Years 5 – 6 Years
How many years, including this year, has your student participated in the CCISD Athletic programs you indicated in the previous question, beginning in grade 6? (If multiple programs, use the one you have been involved with the longest.)
25.3% 58.1% 16.7%
0 Hours
Less than or equal to
5 hours
More than 5 but less than or equal to
10 hours
More than 10 but less
than or equal to 15 hours
More than 15 hours
My student has participated in _____ hours after school per week this school year with respect to the CCISD Athletic program referenced in the previous question (at school).
2.1% 13.3% 43.0% 23.8% 17.9%
0 Years 1 Year 2 – 4 Years 5 – 7 Years
8 – 10 Years
More than
10 Years
How many years, including this year, has your student participated in the non-CCISD Athletic programs you indicated in the previous question? (If multiple programs, use the one they have been involved with the longest.)
23.2% 5.0% 21.2% 21.4% 17.3% 11.9%
N/A 30 minutes
or less
More than 30 minutes
but less than 2 hours
2 hours to less than 4
hours
4 hours to less
than 10 hours
More than
10 hours
My student has participated in _____ minutes/hours of private instruction/club practice per week this school year with respect to the non-CCISD athletic program referenced in the previous question.
32.8% 5.6% 9.1% 15.3% 24.2% 13.0%

Athletics Program Evaluation 2010-11 to 2014-15
Page | 33
1. What is the participation rate of students in the various Athletic programs?
There were 74.8% of the parents who have students who have been involved in CCISD athletics for 2-6 years. Most parents (84.7%) stated their student participated in at least five hours of after school time in their primary sport, with 41.7% participating in more than 10 hours a week.
There were 49.4% of the parents who have students who have been involved in an athletic program outside of CCISD for 0-4 years. There were 50.6% of the parents of student athletes who have been involved in an athletic program outside of CCISD for five or more years. There were 11.9% of the parents of student athletes who have been involved in an athletic program outside of CCISD for more than ten years. Most parents (52.5%) stated their student participated in at least two hours of after school time in their primary sport, with 14.7% participating in less than two hours a week.
Athletics Program Evaluation 2010-11 to 2014-15
Page | 34
1. What is the participation rate of students in the various Athletic programs?
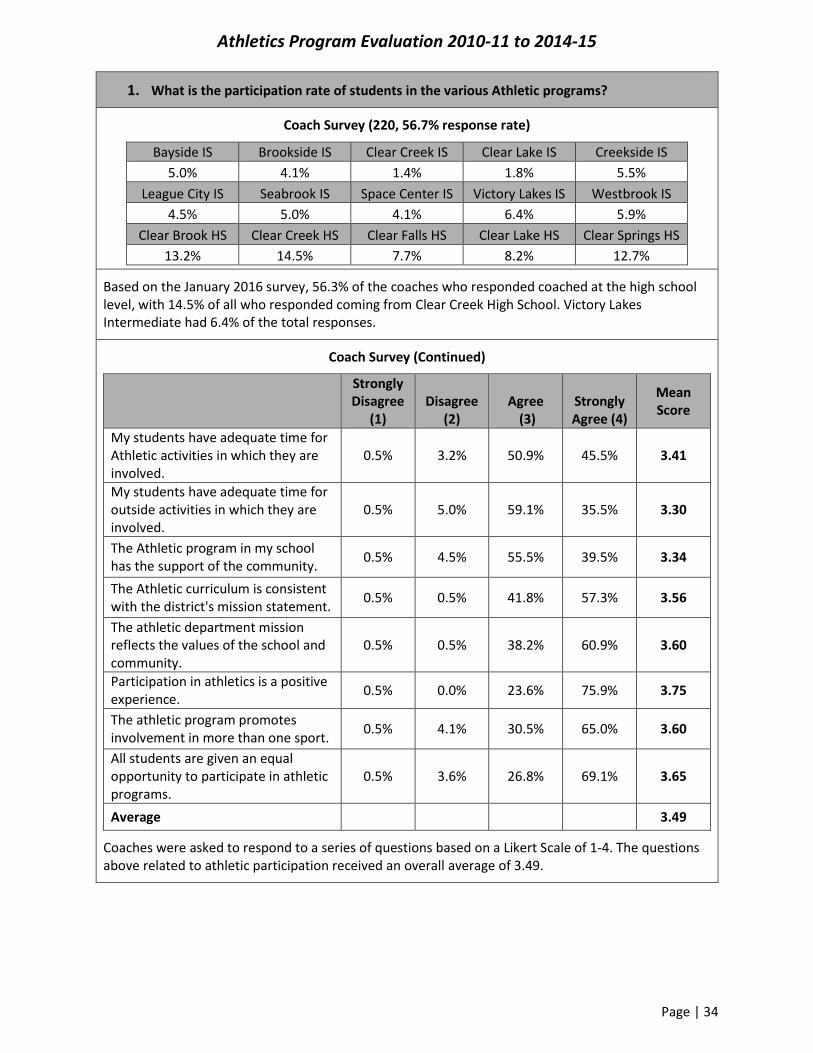
Coach Survey (220, 56.7% response rate)
Bayside IS Brookside IS Clear Creek IS Clear Lake IS Creekside IS
5.0% 4.1% 1.4% 1.8% 5.5%
League City IS Seabrook IS Space Center IS Victory Lakes IS Westbrook IS
4.5% 5.0% 4.1% 6.4% 5.9%
Clear Brook HS Clear Creek HS Clear Falls HS Clear Lake HS Clear Springs HS
13.2% 14.5% 7.7% 8.2% 12.7%
Based on the January 2016 survey, 56.3% of the coaches who responded coached at the high school level, with 14.5% of all who responded coming from Clear Creek High School. Victory Lakes Intermediate had 6.4% of the total responses.
Coach Survey (Continued)
Strongly Disagree
(1) Disagree
(2) Agree
(3) Strongly Agree (4)
Mean Score
My students have adequate time for Athletic activities in which they are involved.
0.5% 3.2% 50.9% 45.5% 3.41
My students have adequate time for outside activities in which they are involved.
0.5% 5.0% 59.1% 35.5% 3.30
The Athletic program in my school has the support of the community.
0.5% 4.5% 55.5% 39.5% 3.34
The Athletic curriculum is consistent with the district's mission statement.
0.5% 0.5% 41.8% 57.3% 3.56
The athletic department mission reflects the values of the school and community.
0.5% 0.5% 38.2% 60.9% 3.60
Participation in athletics is a positive experience.
0.5% 0.0% 23.6% 75.9% 3.75
The athletic program promotes involvement in more than one sport.
0.5% 4.1% 30.5% 65.0% 3.60
All students are given an equal opportunity to participate in athletic programs.
0.5% 3.6% 26.8% 69.1% 3.65
Average 3.49
Coaches were asked to respond to a series of questions based on a Likert Scale of 1-4. The questions above related to athletic participation received an overall average of 3.49.

Athletics Program Evaluation 2010-11 to 2014-15
Page | 35
1. What is the participation rate of students in the various Athletic programs?
Survey Results – Comparison of Means
Student Parent Coach
Level Int HS
Sign.
Int HS
Sign.
Int HS
Sign. N 965 646 432 727 96 124
Mean Mean Mean Mean Mean Mean
I have adequate time for Athletic activities in which I am involved.
3.26 3.14 No 3.23 3.17 No 3.34 3.47 No
I have adequate time for outside activities in which I am involved.
3.17 3.00 No 3.16 3.08 No 3.24 3.34 No
I am satisfied with my experience in the Athletic Program.
3.41 3.19 No 3.04 2.76 Yes
I would recommend the Athletic program to other students.
3.46 3.26 No 3.15 2.87 Yes
The Athletic program in my school has the support of the community.
3.11 3.03 No 3.17 2.92 Yes 3.37 3.32 No
The mission of the athletic program in which I am involved, reflects the values of the school and community.
3.23 3.18 No 3.13 2.96 Yes 3.56 3.62 No
CCISD athletic programs promotes involvement in more than one sport.
3.52 3.02 Yes 3.30 2.64 Yes 3.72 3.51 No
All students are given an equal opportunity to participate in CCISD athletic programs.
3.30 3.18 No 3.09 2.85 Yes 3.71 3.60 Yes
A comparison of the means of the survey results for questions pertaining to student participation in CCISD athletics was conducted between levels of secondary grades. For students there was a significant difference for promotion of participation in more than one sport. Based on the parent survey results, all questions had a significant difference with the exception of students having adequate time for the athletic activities they are involved in and adequate time for outside activities. Coach responses had no significant differences in their response except to the question that all students are given an equal opportunity to participate in CCISD athletic programs.
Athletics Program Evaluation 2010-11 to 2014-15
Page | 36
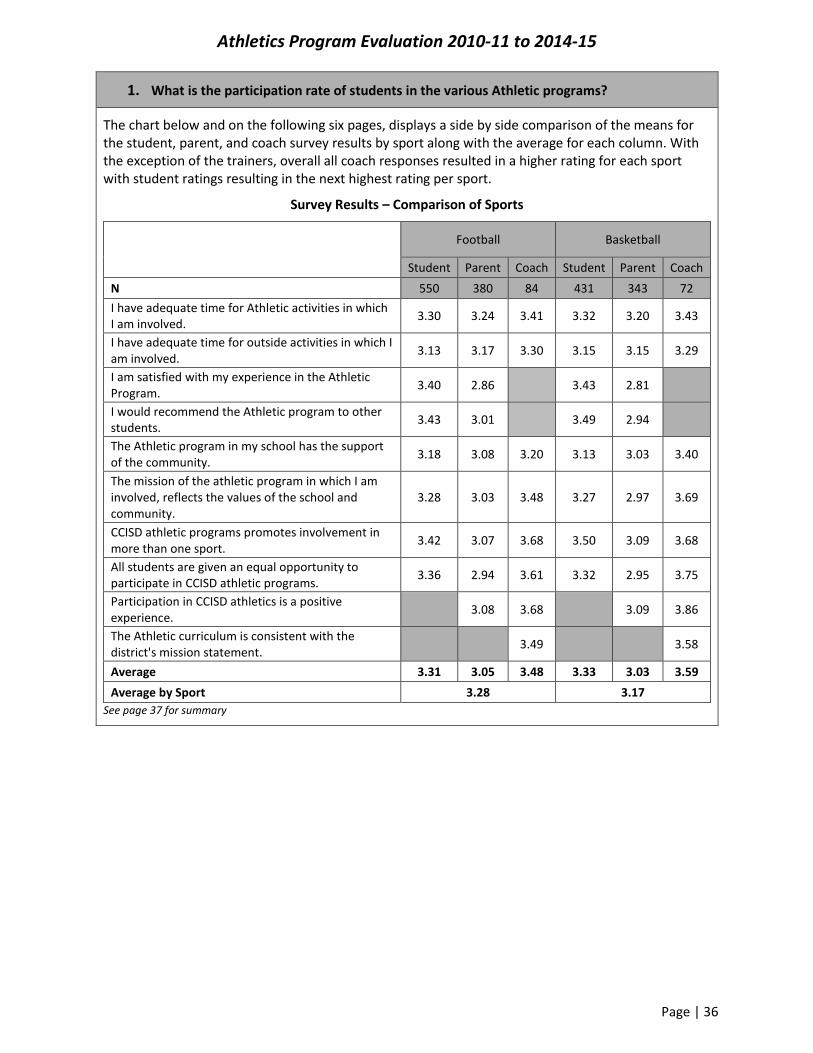
1. What is the participation rate of students in the various Athletic programs?
The chart below and on the following six pages, displays a side by side comparison of the means for the student, parent, and coach survey results by sport along with the average for each column. With the exception of the trainers, overall all coach responses resulted in a higher rating for each sport with student ratings resulting in the next highest rating per sport.
Survey Results – Comparison of Sports
Football Basketball
Student Parent Coach Student Parent Coach
N 550 380 84 431 343 72
I have adequate time for Athletic activities in which I am involved.
3.30 3.24 3.41 3.32 3.20 3.43
I have adequate time for outside activities in which I am involved.
3.13 3.17 3.30 3.15 3.15 3.29
I am satisfied with my experience in the Athletic Program.
3.40 2.86 3.43 2.81
I would recommend the Athletic program to other students.
3.43 3.01 3.49 2.94
The Athletic program in my school has the support of the community.
3.18 3.08 3.20 3.13 3.03 3.40
The mission of the athletic program in which I am involved, reflects the values of the school and community.
3.28 3.03 3.48 3.27 2.97 3.69
CCISD athletic programs promotes involvement in more than one sport.
3.42 3.07 3.68 3.50 3.09 3.68
All students are given an equal opportunity to participate in CCISD athletic programs.
3.36 2.94 3.61 3.32 2.95 3.75
Participation in CCISD athletics is a positive experience.
3.08 3.68 3.09 3.86
The Athletic curriculum is consistent with the district's mission statement.
3.49 3.58
Average 3.31 3.05 3.48 3.33 3.03 3.59
Average by Sport 3.28 3.17
See page 37 for summary

Athletics Program Evaluation 2010-11 to 2014-15
Page | 37
1. What is the participation rate of students in the various Athletic programs?
Survey Results – Comparison of Sports
Volleyball Soccer
Student Parent Coach Student Parent Coach
N 312 157 33 135 87 24
I have adequate time for Athletic activities in which I am involved.
3.16 3.20 3.30 3.20 3.18 3.42
I have adequate time for outside activities in which I am involved.
3.14 3.08 3.15 3.07 3.13 3.21
I am satisfied with my experience in the Athletic Program.
3.35 3.00 3.33 2.89
I would recommend the Athletic program to other students.
3.45 3.08 3.44 3.03
The Athletic program in my school has the support of the community.
3.05 3.08 3.42 3.08 2.98 3.50
The mission of the athletic program in which I am involved, reflects the values of the school and community.
3.16 3.12 3.67 3.26 3.06 3.75
CCISD athletic programs promotes involvement in more than one sport.
3.55 3.20 3.70 3.33 2.90 3.5
All students are given an equal opportunity to participate in CCISD athletic programs.
3.22 3.01 3.70 3.32 2.87 3.71
Participation in CCISD athletics is a positive experience.
3.22 3.82 3.15 3.75
The Athletic curriculum is consistent with the district's mission statement.
3.55 3.75
Average 3.26 3.11 3.54 3.25 3.02 3.57
Average by Sport 3.30 3.28
See page 37 for summary
Athletics Program Evaluation 2010-11 to 2014-15
Page | 38
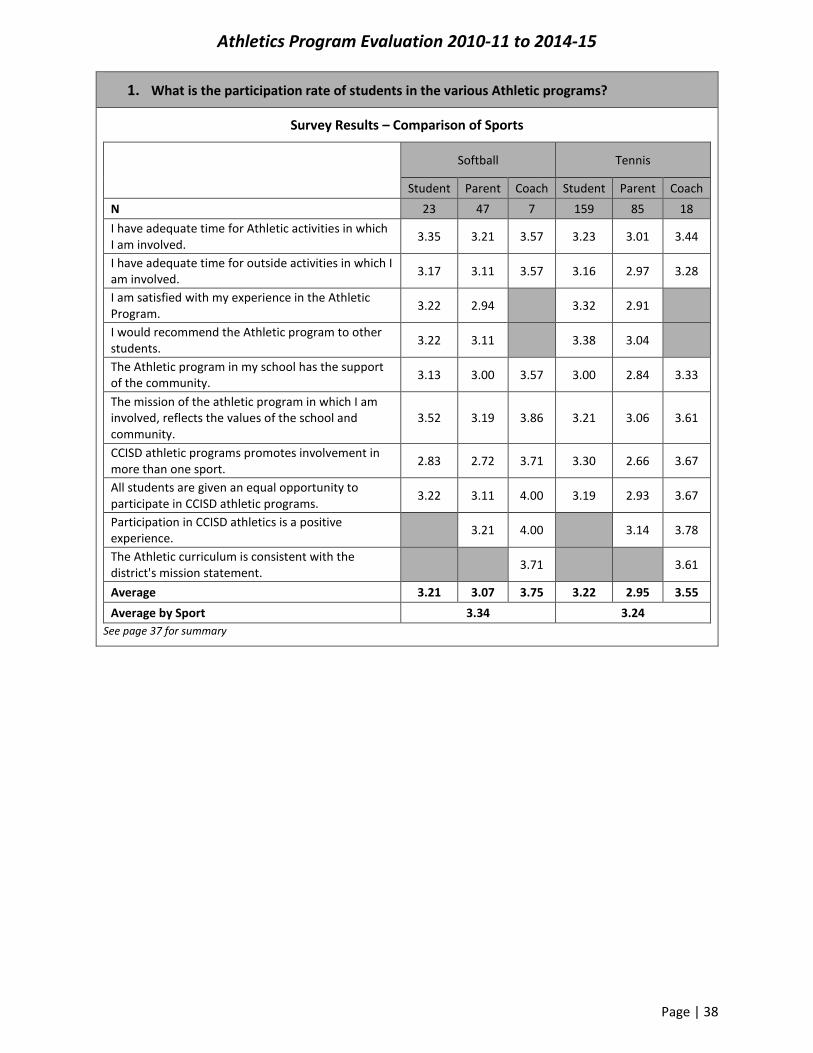
1. What is the participation rate of students in the various Athletic programs?
Survey Results – Comparison of Sports
Softball Tennis
Student Parent Coach Student Parent Coach
N 23 47 7 159 85 18
I have adequate time for Athletic activities in which I am involved.
3.35 3.21 3.57 3.23 3.01 3.44
I have adequate time for outside activities in which I am involved.
3.17 3.11 3.57 3.16 2.97 3.28
I am satisfied with my experience in the Athletic Program.
3.22 2.94 3.32 2.91
I would recommend the Athletic program to other students.
3.22 3.11 3.38 3.04
The Athletic program in my school has the support of the community.
3.13 3.00 3.57 3.00 2.84 3.33
The mission of the athletic program in which I am involved, reflects the values of the school and community.
3.52 3.19 3.86 3.21 3.06 3.61
CCISD athletic programs promotes involvement in more than one sport.
2.83 2.72 3.71 3.30 2.66 3.67
All students are given an equal opportunity to participate in CCISD athletic programs.
3.22 3.11 4.00 3.19 2.93 3.67
Participation in CCISD athletics is a positive experience.
3.21 4.00 3.14 3.78
The Athletic curriculum is consistent with the district's mission statement.
3.71 3.61
Average 3.21 3.07 3.75 3.22 2.95 3.55
Average by Sport 3.34 3.24
See page 37 for summary

Athletics Program Evaluation 2010-11 to 2014-15
Page | 39
1. What is the participation rate of students in the various Athletic programs?
Survey Results – Comparison of Sports
Golf Track and Field
Student Parent Coach Student Parent Coach
N 112 76 23 325 185 49
I have adequate time for Athletic activities in which I am involved.
3.21 3.25 3.44 3.29 3.28 3.31
I have adequate time for outside activities in which I am involved.
3.07 3.12 3.30 3.15 3.15 3.25
I am satisfied with my experience in the Athletic Program.
3.33 3.11 3.45 3.02
I would recommend the Athletic program to other students.
3.29 3.18 3.50 3.06
The Athletic program in my school has the support of the community.
3.04 3.01 3.52 3.18 3.08 3.29
The mission of the athletic program in which I am involved, reflects the values of the school and community.
3.19 3.16 3.74 3.30 3.11 3.45
CCISD athletic programs promotes involvement in more than one sport.
3.25 2.87 3.70 3.51 3.23 3.63
All students are given an equal opportunity to participate in CCISD athletic programs.
3.17 3.05 3.65 3.36 3.07 3.67
Participation in CCISD athletics is a positive experience.
3.33 3.83 3.23 3.78
The Athletic curriculum is consistent with the district's mission statement.
3.65 3.51
Average 3.19 3.12 3.60 3.34 3.14 3.49
Average by Sport 3.30 3.23
See page 37 for summary
Athletics Program Evaluation 2010-11 to 2014-15
Page | 40
1. What is the participation rate of students in the various Athletic programs?
Survey Results – Comparison of Sports
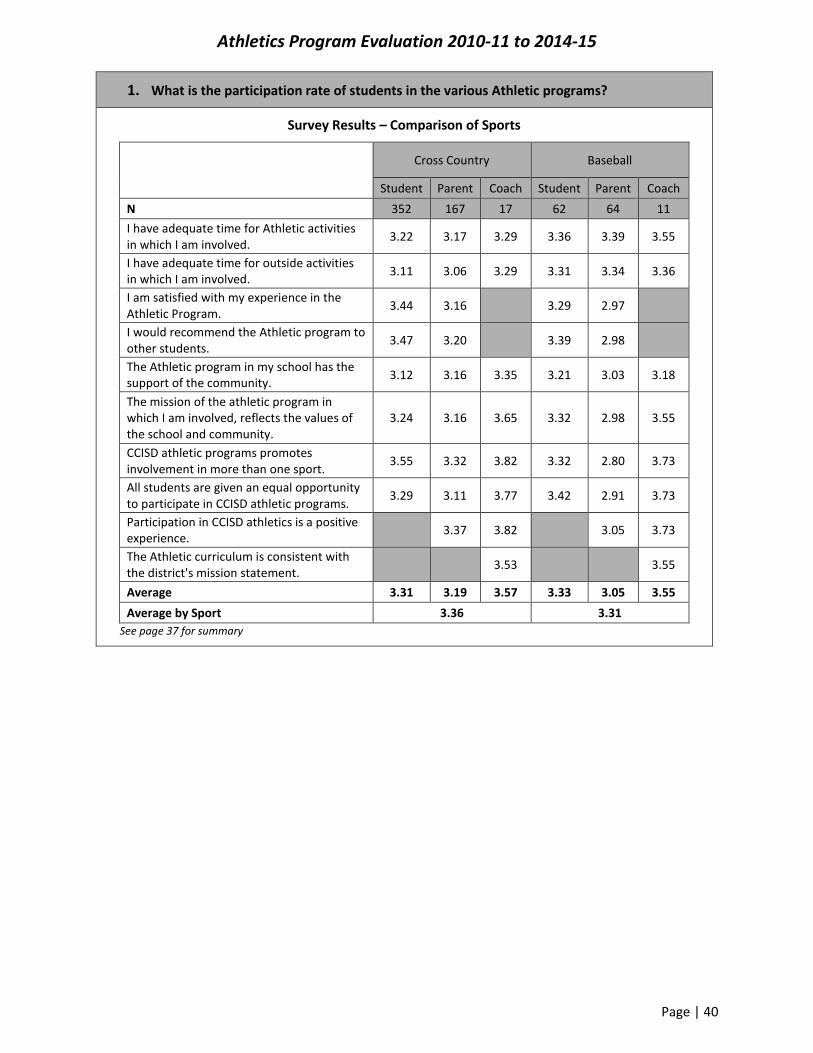
Cross Country Baseball
Student Parent Coach Student Parent Coach
N 352 167 17 62 64 11
I have adequate time for Athletic activities in which I am involved.
3.22 3.17 3.29 3.36 3.39 3.55
I have adequate time for outside activities in which I am involved.
3.11 3.06 3.29 3.31 3.34 3.36
I am satisfied with my experience in the Athletic Program.
3.44 3.16 3.29 2.97
I would recommend the Athletic program to other students.
3.47 3.20 3.39 2.98
The Athletic program in my school has the support of the community.
3.12 3.16 3.35 3.21 3.03 3.18
The mission of the athletic program in which I am involved, reflects the values of the school and community.
3.24 3.16 3.65 3.32 2.98 3.55
CCISD athletic programs promotes involvement in more than one sport.
3.55 3.32 3.82 3.32 2.80 3.73
All students are given an equal opportunity to participate in CCISD athletic programs.
3.29 3.11 3.77 3.42 2.91 3.73
Participation in CCISD athletics is a positive experience.
3.37 3.82 3.05 3.73
The Athletic curriculum is consistent with the district's mission statement.
3.53 3.55
Average 3.31 3.19 3.57 3.33 3.05 3.55
Average by Sport 3.36 3.31
See page 37 for summary

Athletics Program Evaluation 2010-11 to 2014-15
Page | 41
1. What is the participation rate of students in the various Athletic programs?
Survey Results – Comparison of Sports
Wrestling Swimming
Student Parent Coach Student Parent Coach
N 31 35 9 115 108 6
I have adequate time for Athletic activities in which I am involved.
3.42 3.09 3.00 2.89 3.14 3.30
I have adequate time for outside activities in which I am involved.
3.29 3.17 2.89 2.57 2.97 3.17
I am satisfied with my experience in the Athletic Program.
3.52 2.11 2.94 2.81
I would recommend the Athletic program to other students.
3.45 2.20 2.99 2.86
The Athletic program in my school has the support of the community.
3.23 2.71 2.89 2.53 2.73 3.50
The mission of the athletic program in which I am involved, reflects the values of the school and community.
3.55 2.66 3.22 2.90 2.88 3.67
CCISD athletic programs promotes involvement in more than one sport.
3.32 2.63 3.33 2.66 2.69 3.5
All students are given an equal opportunity to participate in CCISD athletic programs.
3.55 2.74 3.33 2.91 3.07 3.67
Participation in CCISD athletics is a positive experience.
2.37 3.33 2.94 3.83
The Athletic curriculum is consistent with the district's mission statement.
3.33 3.67
Average 3.42 2.63 3.17 2.80 2.90 3.54
Average by Sport 3.07 3.08
See page 37 for summary

Athletics Program Evaluation 2010-11 to 2014-15
Page | 42
1. What is the participation rate of students in the various Athletic programs?
Survey Results – Comparison of Sports
Cheer Trainer
Student Parent Coach Student Parent Coach
N 56 43 5 24 8 8
I have adequate time for Athletic activities in which I am involved.
3.02 2.86 3.00 3.42 3.38 3.38
I have adequate time for outside activities in which I am involved.
2.84 2.81 3.00 3.13 3.25 3.13
I am satisfied with my experience in the Athletic Program.
2.88 2.30 3.38 3.38
I would recommend the Athletic program to other students.
3.07 2.49 3.29 3.50
The Athletic program in my school has the support of the community.
2.89 2.98 3.40 3.33 3.5 2.88
The mission of the athletic program in which I am involved, reflects the values of the school and community.
3.00 2.77 3.40 3.42 3.38 3.25
CCISD athletic programs promotes involvement in more than one sport.
2.93 2.14 3.20 3.50 3.38 3.13
All students are given an equal opportunity to participate in CCISD athletic programs.
2.88 2.56 3.20 3.33 3.25 3.25
Participation in CCISD athletics is a positive experience.
2.56 3.80 3.13 3.38
The Athletic curriculum is consistent with the district's mission statement.
3.40 3.25
Average 2.94 2.61 3.30 3.35 3.35 3.21
Average by Sport 2.95 3.30
The sport with the highest combined response rate for students, parents, and coaches was track and field with an average rating of 3.32. The sport with the lowest combined response rate for students, parents, and coaches was cheerleading with an average rating of 2.95.
The sport with the highest combined response rate for students was wrestling with a 3.42. The sport with the lowest combined response rate for students was swimming with a 2.90. The sport with the highest combined response rate for parents was training with a 3.35. The sport with the lowest combined response rate for parents was cheerleading with a 2.61. The sport with the highest combined response rate for coaches was softball with a 3.75. The sport with the lowest combined response rate for coaches was wrestling with a 3.17.

Athletics Program Evaluation 2010-11 to 2014-15
Page | 43
1. What is the participation rate of students in the various Athletic programs?
Student Survey Results – Comparison of Sports
How many years, including this year, have you participated in the CCISD Athletic programs you indicated in the previous question, beginning in grade 6? (If multiple programs, use the one you have been involved with the longest.)
N 1 2 - 4 5 - 6
Football 550 34.5% 53.3% 12.2%
Basketball 431 44.1% 50.8% 5.1%
Volleyball 312 40.7% 54.8% 4.5%
Soccer 135 27.4% 60.0% 12.6%
Softball 23 30.4% 52.2% 17.4%
Tennis 159 27.7% 62.9% 9.4%
Golf 112 26.8% 60.7% 12.5%
T&F 325 32.9% 59.7% 7.4%
Cross Country 352 54.3% 44.3% 1.4%
Baseball 62 24.2% 58.1% 17.7%
Wrestling 31 32.3% 41.9% 25.8%
Swimming 115 27.0% 60.9% 12.2%
Cheer 56 39.3% 57.1% 3.6%
Trainer 24 54.2% 45.8% 0.0%
Students were asked about the number of years which they have participated in a CCISD athletic program. Students could respond selecting multiple sports which could result in some percentages for certain sports being skewed. When comparing student survey results by the number of years of participation in CCISD athletics, 54.3% were participating for the first time in cross country. There were 62.9% of the tennis players who have participated 2-4 years, and 25.8% of the wrestlers who responded they have participated 5-6 years.

Athletics Program Evaluation 2010-11 to 2014-15
Page | 44
1. What is the participation rate of students in the various Athletic programs?
Student Survey Results – Comparison of Sports
I have participated in _____ hours after school per week this school year with respect to the CCISD Athletic program referenced in the previous question (at school).
0 Less than or equal
to 5
More than 5 but less than or equal to
10
More than 10 but less
than or equal to 15
More than 15
Football 3.6% 15.5% 33.1% 25.6% 22.2%
Basketball 8.1% 18.8% 32.0% 25.3% 15.8%
Volleyball 10.6% 21.5% 33.3% 21.8% 12.8%
Soccer 7.4% 20.7% 37.0% 23.0% 11.9%
Softball 0.0% 21.7% 39.1% 26.1% 13.0%
Tennis 8.2% 26.4% 35.2% 19.5% 10.7%
Golf 8.9% 12.5% 55.4% 10.7% 12.5%
T&F 8.9% 23.7% 31.1% 20.3% 16.0%
Cross Country 6.3% 28.7% 39.8% 11.9% 13.4%
Baseball 8.1% 19.4% 32.3% 14.5% 25.8%
Wrestling 0.0% 3.2% 71.0% 16.1% 9.7%
Swimming 6.1% 7.0% 47.0% 27.0% 13.0%
Cheer 14.3% 25.0% 37.5% 16.1% 7.1%
Trainer 8.3% 20.8% 33.3% 20.8% 16.7%
Students were asked about the number of hours which they have participated in a CCISD athletic program. Students could respond selecting multiple sports which could result in some percentages for certain sports being skewed. The survey was administered in January of 2016 and some sports had not yet begun their season or their season was finished. When comparing student results by the number of hours of participation in CCISD athletics, 28.7% of cross country athletes participated for less than or equal to five hours per week. There were 55.4% of the golfers who have participated in more than 5 hours but less than or equal to ten hours per week. There were 27.0% of swimmers who responded they have participated in more than ten but less than or equal to 15 hours. There were 25.8% of the baseball players who participate in more than 15 hours per week.
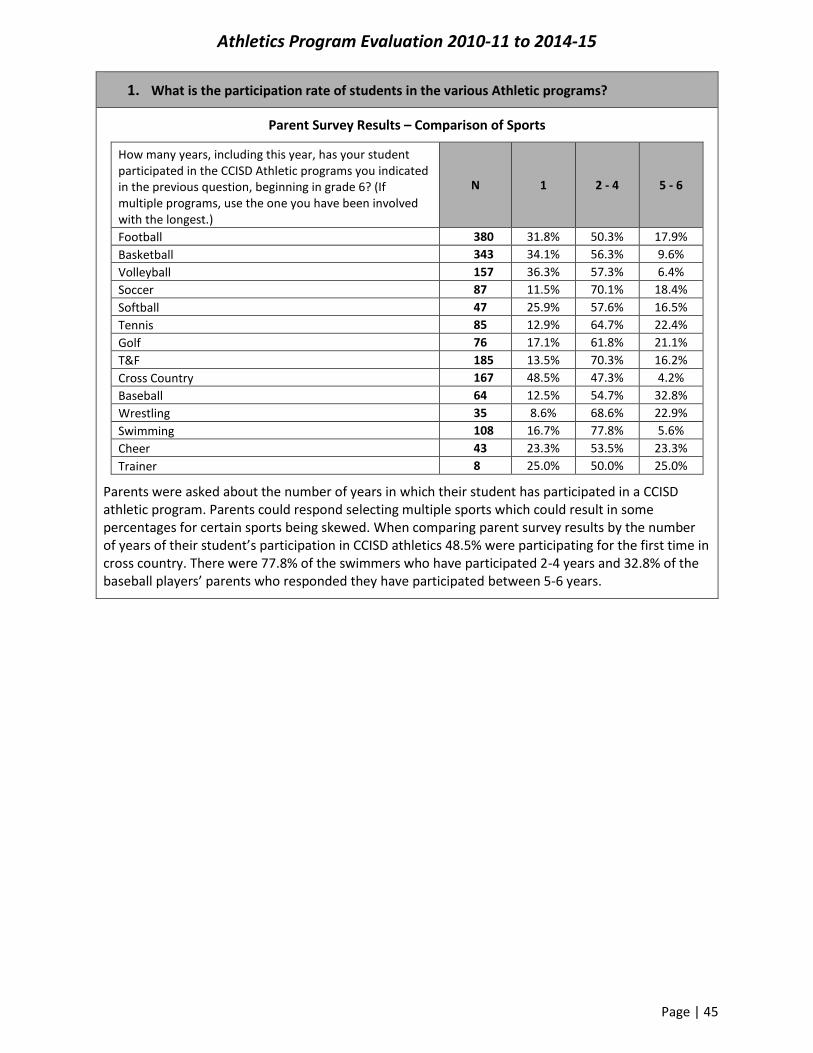
Athletics Program Evaluation 2010-11 to 2014-15
Page | 45
1. What is the participation rate of students in the various Athletic programs?
Parent Survey Results – Comparison of Sports
How many years, including this year, has your student participated in the CCISD Athletic programs you indicated in the previous question, beginning in grade 6? (If multiple programs, use the one you have been involved with the longest.)
N 1 2 - 4 5 - 6
Football 380 31.8% 50.3% 17.9%
Basketball 343 34.1% 56.3% 9.6%
Volleyball 157 36.3% 57.3% 6.4%
Soccer 87 11.5% 70.1% 18.4%
Softball 47 25.9% 57.6% 16.5%
Tennis 85 12.9% 64.7% 22.4%
Golf 76 17.1% 61.8% 21.1%
T&F 185 13.5% 70.3% 16.2%
Cross Country 167 48.5% 47.3% 4.2%
Baseball 64 12.5% 54.7% 32.8%
Wrestling 35 8.6% 68.6% 22.9%
Swimming 108 16.7% 77.8% 5.6%
Cheer 43 23.3% 53.5% 23.3%
Trainer 8 25.0% 50.0% 25.0%
Parents were asked about the number of years in which their student has participated in a CCISD athletic program. Parents could respond selecting multiple sports which could result in some percentages for certain sports being skewed. When comparing parent survey results by the number of years of their student’s participation in CCISD athletics 48.5% were participating for the first time in cross country. There were 77.8% of the swimmers who have participated 2-4 years and 32.8% of the baseball players’ parents who responded they have participated between 5-6 years.

Athletics Program Evaluation 2010-11 to 2014-15
Page | 46
1. What is the participation rate of students in the various Athletic programs?
Parent Survey Results – Comparison of Sports
My student has participated in _____ hours after school per week this school year with respect to the CCISD Athletic program referenced in the previous question (at school).
0 Less than or equal
to 5
More than 5 but less than or equal to
10
More than 10 but less
than or equal to 15
More than 15
Football 6.1% 43.7% 27.9% 22.4%
Basketball 2.9% 8.5% 47.5% 25.1% 16.0%
Volleyball 4.5% 14.0% 40.1% 21.0% 20.4%
Soccer 8.0% 41.4% 35.6% 14.9%
Softball 12.8% 19.1% 38.3% 19.1% 10.6%
Tennis 2.4% 22.4% 45.9% 18.8% 10.6%
Golf 11.8% 50.0% 22.4% 15.8%
T&F 1.6% 14.1% 38.4% 28.1% 17.8%
Cross Country 1.2% 16.8% 56.9% 18.6% 6.6%
Baseball 6.3% 21.9% 32.8% 23.4% 15.6%
Wrestling 5.7% 51.4% 17.1% 25.7%
Swimming 0.9% 13.9% 38.9% 27.8% 18.5%
Cheer 16.3% 44.2% 16.3% 23.3%
Trainer 25.0% 25.0% 50.0%
Parents were asked about the number of hours in which their student has participated in a CCISD athletic program per week. Parents could respond selecting multiple sports which could result in some percentages for certain sports being skewed. The survey was administered in January of 2016 and some sports had not yet begun their season or their season was finished. When comparing parent survey results by the number of hours their students participated in CCISD athletics, 22.4% of tennis players participated for less than or equal to five hours per week. There were 56.9% of the parents of cross country athletes who said their child did participate in more than 5 hours but less than or equal to ten hours per week. There were 35.6% of the parents of soccer players who responded their child has participated in more than ten but less than or equal to 15 hours. There were 50.0% of the parents of trainers who stated their child participated in more than 15 hours per week.

Athletics Program Evaluation 2010-11 to 2014-15
Page | 47
1. What is the participation rate of students in the various Athletic programs?
Student Survey Results – Comparison of Sports
How many years, including this year, have you participated in the non-CCISD Athletic programs you indicated in the previous question? (If multiple programs, use the one you have been involved with the longest.)
N 0 1 2 - 4 5 - 7 8 - 10 More than
10
Football 193 16.1% 13.5% 26.9% 21.8% 7.8% 14.0%
Basketball 306 5.9% 11.1% 26.8% 22.5% 17.3% 16.3%
Volleyball 228 7.9% 11.4% 31.1% 25.9% 15.8% 7.9%
Soccer 187 5.9% 7.5% 20.3% 18.2% 24.1% 24.1%
Softball 65 7.7% 0.0% 16.9% 21.5% 27.7% 26.2%
Tennis 123 4.1% 11.4% 25.2% 32.5% 12.2% 14.6%
Golf 110 6.4% 16.4% 19.1% 20.0% 22.7% 15.5%
Track and Field 93 14.0% 4.3% 36.6% 16.1% 7.5% 21.5%
Cross Country 49 6.1% 10.2% 24.5% 16.3% 22.4% 20.4%
Baseball 171 2.3% 7.0% 12.8% 22.7% 23.8% 31.4%
Wrestling 22 4.5% 13.6% 31.8% 4.5% 22.7% 22.7%
Swimming 192 3.1% 6.8% 22.4% 27.6% 24.5% 15.6%
Cheer 69 1.4% 17.4% 26.1% 18.8% 14.5% 21.7%
Trainer 0
Students were asked about the number of years which they have participated in an athletic program outside of CCISD. Students could respond selecting multiple sports which could result in some percentages for certain sports being skewed. When comparing student survey results by the number of years of participation in non-CCISD football, 40.4% have participated in 1-4 years and 43.6% for over five years; participation in non-CCISD basketball, 37.9% have participated in 1-4 years and 56.1% for over five years; participation in non-CCISD volleyball, 42.5% have participated in 1-4 years and 49.6% for over five years; participation in non-CCISD soccer, 27.8% have participated in 1-4 years and 66.4% for over five years; participation in non-CCISD softball, 16.9% have participated in 1-4 years and 75.4% for over five years; participation in non-CCISD tennis, 36.6% have participated in 1-4 years and 59.3% for over five years; participation in non-CCISD golf, 35.5% have participated in 1-4 years and 58.2% for over five years; participation in non-CCISD track and field, 40.9% have participated in 1-4 years and 45.1% for over five years; participation in non-CCISD cross country, 34.7% have participated in 1-4 years and 59.1% for over five years; participation in non-CCISD baseball, 19.8% have participated in 1-4 years and 77.9% for over five years; participation in non-CCISD wrestling, 45.4% have participated in 1-4 years and 49.9% for over five years; participation in non-CCISD swimming, 29.2% have participated in 1-4 years and 67.7% for over five years; and participation in non-CCISD cheerleading, 43.5% have participated in 1-4 years and 55.0% for over five years.

Athletics Program Evaluation 2010-11 to 2014-15
Page | 48
1. What is the participation rate of students in the various Athletic programs?
Student Survey Results – Comparison of Sports
I have participated in _____ minutes/hours of private instruction/club practice per week this school year with respect to the non-CCISD athletic program referenced in the previous question.
N/A 30
minutes or less
More than 30 minutes
but less than 2 hours
2 hours to less than 4 hours
4 hours to less
than 10 hours
More than 10 hours
Football 24.2% 12.1% 12.6% 17.9% 13.7% 19.5%
Basketball 15.5% 7.6% 19.7% 25.3% 16.1% 15.8%
Volleyball 11.0% 3.1% 14.1% 21.6% 34.8% 15.4%
Soccer 13.0% 4.3% 17.8% 20.5% 26.5% 17.8%
Softball 9.2% 3.1% 12.3% 27.7% 20.0% 27.7%
Tennis 9.1% 5.0% 27.3% 18.2% 20.7% 19.8%
Golf 7.5% 9.4% 23.6% 19.8% 23.6% 16.0%
T&F 20.4% 4.3% 14.0% 26.9% 14.0% 20.4%
Cross Country 14.3% 8.2% 10.2% 30.6% 18.4% 18.4%
Baseball 18.7% 7.0% 18.1% 20.5% 18.1% 17.5%
Wrestling 13.6% 0.0% 4.5% 31.8% 45.5% 4.5%
Swimming 19.9% 2.6% 15.2% 20.4% 24.1% 17.8%
Cheer 10.1% 1.4% 20.3% 18.8% 34.8% 14.5%
Trainer
Students were asked about the number of hours per week which they have participated in private instruction/club practice outside of CCISD. Students could respond selecting multiple sports which could result in some percentages for certain sports being skewed. When comparing student survey results by the number of hours of participation per week in non-CCISD football, 24.7% have participated in less than two hours years and 51.1% more than two hours per week; participation in non-CCISD basketball, 27.3% have participated in less than two hours years and 57.2% more than two hours per week; participation in non-CCISD volleyball, 17.2% have participated in less than two hours years and 71.8% more than two hours per week; participation in non-CCISD soccer, 22.1% have participated in less than two hours years and 64.8% more than two hours per week; participation in non-CCISD softball, 15.4% have participated in less than two hours years and 75.4% more than two hours per week; participation in non-CCISD tennis, 32.3% have participated in less than two hours years and 58.7% more than two hours per week; participation in non-CCISD golf, 33.0% have participated in less than two hours years and 59.4% more than two hours per week; participation in non-CCISD track and field, 18.3% have participated in less than two hours years and 61.3% more than two hours per week; participation in non-CCISD cross country, 18.4% have participated in less than two hours years and 67.4% more than two hours per week; participation in non-CCISD baseball, 25.1% have participated in less than two hours years and 56.1% more than two hours per week; participation in non-CCISD wrestling, 4.5% have participated in less than two hours years and 81.8% more than two hours per week; participation in non-CCISD swimming, 17.8% have participated in less than two hours years and 62.3% more than two hours per week; and participation in non-CCISD cheerleading, 21.7% have participated in less than two hours years and 68.1% more than two hours per week.

Athletics Program Evaluation 2010-11 to 2014-15
Page | 49
1. What is the participation rate of students in the various Athletic programs?
Parent Survey Results – Comparison of Sports
How many years, including this year, have your student participated in the non-CCISD Athletic programs you indicated in the previous question? (If multiple programs, use the one you have been involved with the longest.)
N 0 1 2 - 4 5 - 7 8 - 10 More than
10
Football 107 7.5% 9.3% 28.0% 28.0% 16.8% 10.3%
Basketball 211 3.8% 7.1% 28.9% 28.0% 21.3% 10.9%
Volleyball 102 2.0% 6.9% 38.2% 35.3% 11.8% 5.9%
Soccer 113 3.5% 1.8% 16.8% 26.5% 27.4% 23.9%
Softball 49 4.1% 10.2% 20.4% 34.7% 30.6%
Tennis 61 1.6% 1.6% 41.0% 18.0% 21.3% 16.4%
Golf 53 1.9% 37.7% 24.5% 26.4% 9.4%
T&F 24 14.7% 38.2% 17.6% 14.7% 14.7%
Cross Country 14 7.1% 7.1% 28.6% 14.3% 14.3% 28.6%
Baseball 137 0.7% 10.2% 23.4% 37.2% 28.5%
Wrestling 18 5.6% 27.8% 38.9% 16.7% 11.1%
Swimming 113 0.9% 23.9% 37.2% 23.0% 15.0%
Cheer 37 2.6% 15.4% 23.1% 30.8% 28.2%
Trainer 0
Parents were asked about the number of years which their student has participated in an athletic program outside of CCISD. Parents could respond selecting multiple sports which could result in some percentages for certain sports being skewed. When comparing parent survey results by the number of years of participation in non-CCISD football, 37.3% have participated in 1-4 years and 55.1% for over five years; participation in non-CCISD basketball, 36.0% have participated in 1-4 years and 60.2% for over five years; participation in non-CCISD volleyball, 45.1% have participated in 1-4 years and 53.0% for over five years; participation in non-CCISD soccer, 18.6% have participated in 1-4 years and 77.8% for over five years; participation in non-CCISD softball, 10.2% have participated in 1-4 years and 85.7% for over five years; participation in non-CCISD tennis, 42.6% have participated in 1-4 years and 55.7% for over five years; participation in non-CCISD golf, 39.6% have participated in 1-4 years and 60.3% for over five years; participation in non-CCISD track and field, 52.9% have participated in 1-4 years and 47.0% for over five years; participation in non-CCISD cross country, 35.7% have participated in 1-4 years and 57.2% for over five years; participation in non-CCISD baseball, 10.2% have participated in 1-4 years and 89.1% for over five years; participation in non-CCISD wrestling, 33.4% have participated in 1-4 years and 66.7% for over five years; participation in non-CCISD swimming, 24.8% have participated in 1-4 years and 75.2% for over five years; and participation in non-CCISD cheerleading, 18.0% have participated in 1-4 years and 82.1% for over five years.
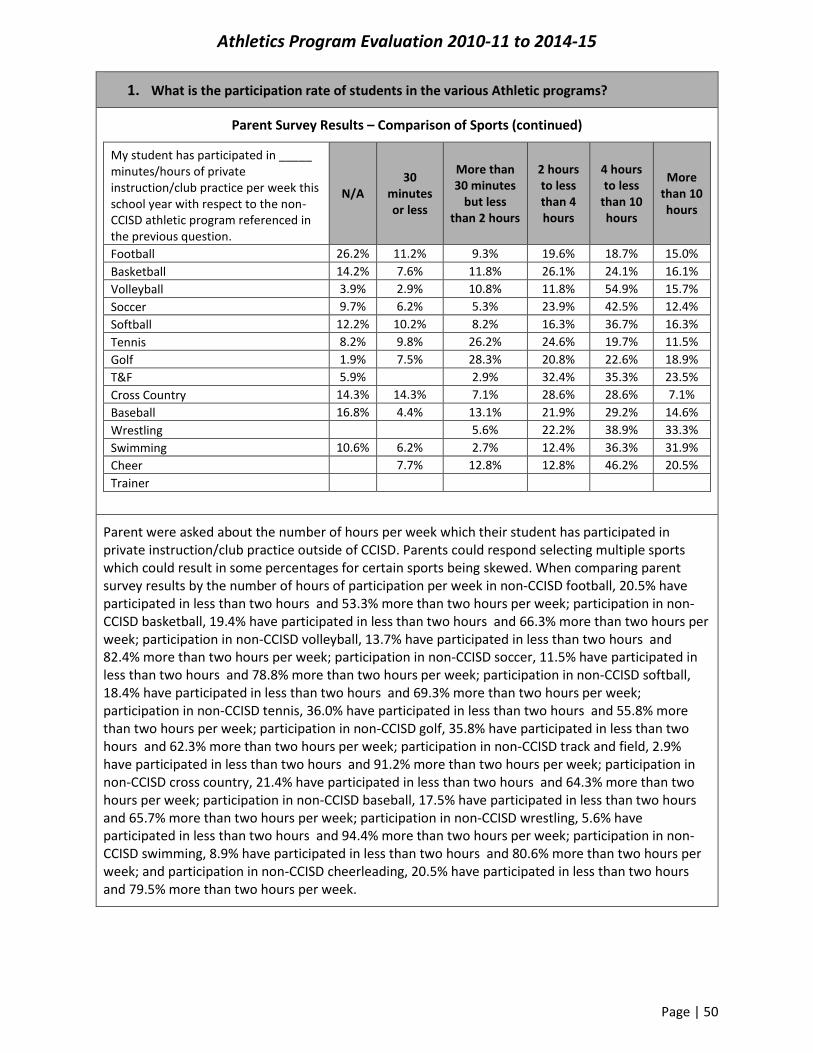
Athletics Program Evaluation 2010-11 to 2014-15
Page | 50
1. What is the participation rate of students in the various Athletic programs?
Parent Survey Results – Comparison of Sports (continued)
My student has participated in _____ minutes/hours of private instruction/club practice per week this school year with respect to the non-CCISD athletic program referenced in the previous question.
N/A 30
minutes or less
More than 30 minutes
but less than 2 hours
2 hours to less than 4 hours
4 hours to less
than 10 hours
More than 10 hours
Football 26.2% 11.2% 9.3% 19.6% 18.7% 15.0%
Basketball 14.2% 7.6% 11.8% 26.1% 24.1% 16.1%
Volleyball 3.9% 2.9% 10.8% 11.8% 54.9% 15.7%
Soccer 9.7% 6.2% 5.3% 23.9% 42.5% 12.4%
Softball 12.2% 10.2% 8.2% 16.3% 36.7% 16.3%
Tennis 8.2% 9.8% 26.2% 24.6% 19.7% 11.5%
Golf 1.9% 7.5% 28.3% 20.8% 22.6% 18.9%
T&F 5.9% 2.9% 32.4% 35.3% 23.5%
Cross Country 14.3% 14.3% 7.1% 28.6% 28.6% 7.1%
Baseball 16.8% 4.4% 13.1% 21.9% 29.2% 14.6%
Wrestling 5.6% 22.2% 38.9% 33.3%
Swimming 10.6% 6.2% 2.7% 12.4% 36.3% 31.9%
Cheer 7.7% 12.8% 12.8% 46.2% 20.5%
Trainer
Parent were asked about the number of hours per week which their student has participated in private instruction/club practice outside of CCISD. Parents could respond selecting multiple sports which could result in some percentages for certain sports being skewed. When comparing parent survey results by the number of hours of participation per week in non-CCISD football, 20.5% have participated in less than two hours and 53.3% more than two hours per week; participation in non-CCISD basketball, 19.4% have participated in less than two hours and 66.3% more than two hours per week; participation in non-CCISD volleyball, 13.7% have participated in less than two hours and 82.4% more than two hours per week; participation in non-CCISD soccer, 11.5% have participated in less than two hours and 78.8% more than two hours per week; participation in non-CCISD softball, 18.4% have participated in less than two hours and 69.3% more than two hours per week; participation in non-CCISD tennis, 36.0% have participated in less than two hours and 55.8% more than two hours per week; participation in non-CCISD golf, 35.8% have participated in less than two hours and 62.3% more than two hours per week; participation in non-CCISD track and field, 2.9% have participated in less than two hours and 91.2% more than two hours per week; participation in non-CCISD cross country, 21.4% have participated in less than two hours and 64.3% more than two hours per week; participation in non-CCISD baseball, 17.5% have participated in less than two hours and 65.7% more than two hours per week; participation in non-CCISD wrestling, 5.6% have participated in less than two hours and 94.4% more than two hours per week; participation in non-CCISD swimming, 8.9% have participated in less than two hours and 80.6% more than two hours per week; and participation in non-CCISD cheerleading, 20.5% have participated in less than two hours and 79.5% more than two hours per week.

Athletics Program Evaluation 2010-11 to 2014-15
Page | 51
1. What is the participation rate of students in the various Athletic programs?
Coach Survey Results – Comparison of Sports
My students have participated in _____ hours after school per week this school year with respect to the CCISD Athletic program referenced in the previous question (at school).
N 0 Less than or equal
to 5
More than 5 but less than
or equal to 10
More than 10 but less than or equal to
15
Football 62 4.8% 4.8% 82.1% 8.1%
Basketball 55 3.6% 7.2% 76.4% 12.7%
Volleyball 21 2.9% 7.9% 77.4% 11.6%
Soccer 19 3.6% 7.1% 76.4% 12.9%
Softball 3 33.3% 66.7%
Tennis 13 15.4% 69.2% 15.4%
Golf 20 35.0% 65.0%
T&F 29 10.4% 68.8% 20.8%
Cross Country 11 91.9% 9.1%
Baseball 8 37.5% 12.5% 37.5% 12.5%
Wrestling 8 12.5% 12.5% 62.5% 12.5%
Swimming 6 83.3% 16.7%
Cheer 4 100.0%
Trainer 5 20.0% 20.0% 60.0%
Coaches were asked about the number of hours per week which their student has participated in a CCISD athletic program. Coaches could respond selecting multiple sports which could result in some percentages for certain sports being skewed. UIL rules prohibit practice time to eight hours Monday through the end of school Thursday during a five day school week. Responses could have included game time, travel time, and staying to watch other teams compete. When comparing coach survey results by the number of hours of participation in CCISD football, 9.6% have participated in less than or equal to five hours and 90.2% more than five hours per week; participation in CCISD basketball, 10.8% have participated in less than or equal to five hours and 89.1% more than five hours per week; participation in CCISD volleyball, 10.8% have participated in less than or equal to five hours and 89.0% more than five hours per week; participation in CCISD soccer, 10.7% have participated in less than or equal to five hours and 89.3% more than five hours per week; participation in CCISD softball, 33.3% have participated in less than or equal to five hours and 66.7% more than five hours per week; participation in CCISD tennis, 15.4% have participated in less than or equal to five hours and 84.6% more than five hours per week; participation in CCISD golf, 35.0% have participated in less than or equal to five hours and 65.0% more than five hours per week; participation in CCISD track and field, 10.4% have participated in less than or equal to five hours and 89.6% more than five hours per week; participation in CCISD cross country, 0.0% have participated in less than or equal to five hours and 100.0% more than five hours per week; participation in CCISD baseball, 50.0% have participated in less than or equal to five hours and 50.0% more than five hours per week; participation in CCISD wrestling, 25.0 % have participated in less than or equal to five hours and 75.0% more than five hours per week; participation in CCISD swimming, 0.0% have participated in less than or equal to five hours and 100.0% more than five hours per week; participation in CCISD cheerleading, 0.0% have participated in less than or equal to five hours and 100.0% more than five hours per week; and participation in CCISD athletic training, 20.0% have participated in less than or equal to five hours and 80.0% more than five hours per week.

Athletics Program Evaluation 2010-11 to 2014-15
Page | 52
1. What is the participation rate of students in the various Athletic programs?
Retention Rate
Due to the nature of some sports participation restrictions, there is a usually a decline in the number of students returning to participate in a sport the next year. There is a feeder pattern from one level to the next level. Most sports will have one or two freshmen teams, one junior varsity (JV) team, and one varsity team. For example, in girls basketball there are two freshmen teams (A and B) and is limited to only freshmen participants. The JV team can have freshmen through juniors on the team. The varsity team can have freshmen through seniors participate; however, there are a limited number of places for each participant. If a freshmen has the skill to compete against the upper classmen, there will be fewer spots available for those upper classmen. Since there can only be five players on the court at one time, a varsity coach will usually limit the number of players on the roster so that players can get playing time during practice and games.
There are other sports where the participation rate is limited due to facilities, uniforms, and the number of coaches. For example, many football teams will keep most if not all participants who tryout from the freshmen squad through varsity. There are many more opportunities for players to participate in a football game even though there are only eleven players on the field at one time. For example, there are opportunities to play on offense, defense, and special teams.

Athletics Program Evaluation 2010-11 to 2014-15
Page | 53
1. What is the participation rate of students in the various Athletic programs?
During the 2011-12 school year, there were 479 seventh grade female student athletes who were enrolled in an athletic course. Of the 479 female student athletes, 41.2% were still enrolled in an athletic course during their senior year. Overall, about 70% of seventh grade female student athletes remain in the athletic program during the next school year.
During the 2013-14 school year, there were 318 eleventh grade female student athletes who were enrolled in an athletic course. Of the 318 female student athletes, 66.8% were still enrolled in an athletic course during their senior year. Overall, about 70% of eleventh grade female student athletes remain in the athletic program during their senior year.
There is a rise in the number of freshmen female student athletes each year. This is due to more choices in sports (soccer, softball, wrestling, and watersports).
Retention Rate for Girls in Athletics
Girls 2010-11 2011-12 2012-13 2013-14 2014-15 2015-16
07 479 73.7% 75.4% 60.6% 50.0% 41.2%
08 414 76.3% 64.7% 50.1% 40.4% -
09 458 74.5% 54.6% 44.0% - -
10 367 73.5% 58.4% - - -
11 274 66.1% - - - -
Girls 2011-12 2012-13 2013-14 2014-15 2015-16
07 588 63.2% 60.6% 53.4% 41.0%
08 418 80.7% 66.4% 55.5% 44.4%
09 514 73.6% 54.6% 42.7% -
10 427 65.8% 50.0% - -
11 320 72.9% - - -
Girls 2012-13 2013-14 2014-15 2015-16
07 497 69.0% 65.5% 55.1%
08 407 74.0% 64.2% 51.5%
09 482 73.7% 55.4% 44.0%
10 394 67.3% 53.0% -
11 292 67.8% - -
Girls 2013-14 2014-15 2015-16
07 490 73.7% 69.1%
08 418 76.6% 61.6%
09 502 73.2% 58.2%
10 413 70.5% 55.2%
11 318 66.8% - Data source: CCISD Student Information System
Girls 2014-15 2015-16
07 527 65.3%
08 399 78.4%
09 491 71.8%
10 407 73.0%
11 325 71.9%
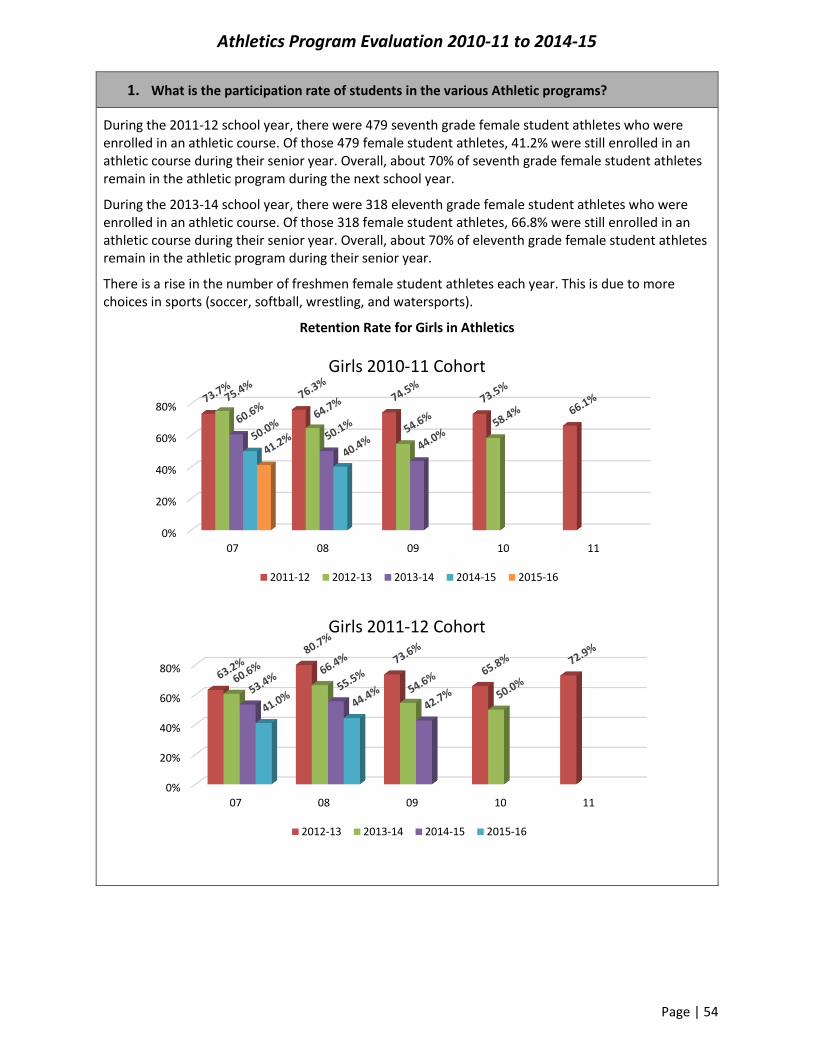
Athletics Program Evaluation 2010-11 to 2014-15
Page | 54
1. What is the participation rate of students in the various Athletic programs?
During the 2011-12 school year, there were 479 seventh grade female student athletes who were enrolled in an athletic course. Of those 479 female student athletes, 41.2% were still enrolled in an athletic course during their senior year. Overall, about 70% of seventh grade female student athletes remain in the athletic program during the next school year.
During the 2013-14 school year, there were 318 eleventh grade female student athletes who were enrolled in an athletic course. Of those 318 female student athletes, 66.8% were still enrolled in an athletic course during their senior year. Overall, about 70% of eleventh grade female student athletes remain in the athletic program during their senior year.
There is a rise in the number of freshmen female student athletes each year. This is due to more choices in sports (soccer, softball, wrestling, and watersports).
Retention Rate for Girls in Athletics
0%
20%
40%
60%
80%
07 08 09 10 11
Girls 2010-11 Cohort
2011-12 2012-13 2013-14 2014-15 2015-16
0%
20%
40%
60%
80%
07 08 09 10 11
Girls 2011-12 Cohort
2012-13 2013-14 2014-15 2015-16

Athletics Program Evaluation 2010-11 to 2014-15
Page | 55
1. What is the participation rate of students in the various Athletic programs?
Retention Rate for Girls in Athletics Continued
0%
20%
40%
60%
80%
07 08 09 10 11
Girls 2012-13 Cohort
2013-14 2014-15 2015-16
0%
20%
40%
60%
80%
07 08 09 10 11
Girls 2013-14 Cohort
2014-15 2015-16
0%
20%
40%
60%
80%
07 08 09 10 11
Girls 2014-15 Cohort

Athletics Program Evaluation 2010-11 to 2014-15
Page | 56
1. What is the participation rate of students in the various Athletic programs?
During the 2011-12 school year, there were 519 seventh grade male student athletes who were enrolled in an athletic course. Of those 519 male student athletes, 52.7% were still enrolled in an athletic course during their senior year. Overall, about 78% of seventh grade male student athletes remain in the athletic program during the next school year.
During the 2013-14 school year, there were 583 eleventh grade male student athletes who were enrolled in an athletic course. Of those 583 male student athletes, 76.0% were still enrolled in an athletic course during their senior year. Overall, about 77% of eleventh grade male student athletes remain in the athletic program during their senior year.
There is a rise in the number of freshmen male student athletes each year. This is due to more choices in sports (soccer, baseball, wrestling, and watersports).
Retention Rate for Boys in Athletics
Boys 2010-11 2011-12 2012-13 2013-14 2014-15 2015-16
07 519 79.4% 81.7% 71.7% 61.4% 52.7%
08 530 87.1% 77.5% 64.2% 56.5% -
09 812 77.7% 64.7% 51.9% - -
10 641 78.1% 66.7% - - -
11 516 78.6% - - - -
Boys 2011-12 2012-13 2013-14 2014-15 2015-16
07 523 76.6% 81.6% 73.7% 65.5%
08 507 90.1% 78.6% 66.0% 57.3%
09 873 77.3% 62.2% 52.2% -
10 660 77.3% 61.3% - -
11 549 78.2% - - -
Boys 2012-13 2013-14 2014-15 2015-16
07 499 79.0% 82.5% 71.3%
08 485 85.7% 77.7% 66.8%
09 870 74.8% 59.9% 50.0%
10 720 74.0% 60.6% -
11 561 73.9% - -
Boys 2013-14 2014-15 2015-16
07 541 78.4% 81.3%
08 473 90.1% 77.0%
09 851 77.0% 63.4%
10 687 75.8% 62.8%
11 583 76.0% - Data source: CCISD Student Information System
Boys 2014-15 2015-16
07 557 75.9%
08 522 85.5%
09 847 75.5%
10 704 77.6%
11 557 77.1%

Athletics Program Evaluation 2010-11 to 2014-15
Page | 57
1. What is the participation rate of students in the various Athletic programs?
During the 2011-12 school year, there were 519 seventh grade male student athletes who were enrolled in an athletic course. Of those 519 male student athletes, 52.7% were still enrolled in an athletic course during their senior year. Overall, about 78% of seventh grade male student athletes remain in the athletic program during the next school year.
During the 2013-14 school year, there were 583 eleventh grade male student athletes who were enrolled in an athletic course. Of those 583 male student athletes, 76.0% were still enrolled in an athletic course during their senior year. Overall, about 77% of eleventh grade male student athletes remain in the athletic program during their senior year.
There is a rise in the number of freshmen male student athletes each year. This is due to more choices in sports (soccer, baseball, wrestling, and watersports).
Retention Rate for Boys in Athletics
0%
20%
40%
60%
80%
100%
07 08 09 10 11
Boys 2010-11 Cohort
2011-12 2012-13 2013-14 2014-15 2015-16
0%
20%
40%
60%
80%
100%
07 08 09 10 11
Boys 2011-12 Cohort
2012-13 2013-14 2014-15 2015-16

Athletics Program Evaluation 2010-11 to 2014-15
Page | 58
1. What is the participation rate of students in the various Athletic programs?
Retention Rate for Boys in Athletics Continued
0%
20%
40%
60%
80%
100%
07 08 09 10 11
Boys 2012-13 Cohort
2013-14 2014-15 2015-16
0%
20%
40%
60%
80%
100%
07 08 09 10 11
Boys 2013-14 Cohort
2014-15 2015-16
0%
20%
40%
60%
80%
100%
07 08 09 10 11
Boys 2014-15 Cohort

Athletics Program Evaluation 2010-11 to 2014-15
Page | 59
1. What is the participation rate of students in the various Athletic programs?
During the 2011-12 school year, there were 94 ninth grade student athletes who were enrolled in a co-ed athletic course. Of those 94 ninth student athletes, 42.7% were still enrolled in an athletic course during their senior year. Overall, about 75% of ninth grade student athletes remain in the athletic program during the next school year.
During the 2013-14 school year, there were 62 eleventh grade student athletes who were enrolled in an athletic course. Of those 62 student athletes, 70.7% were still enrolled in an athletic course during their senior year. Overall, about 63% of eleventh grade student athletes remain in the athletic program during their senior year.
There are no co-ed athletic courses in the intermediate grades. Co-ed courses at the high school level include: cheerleading, swimming, and student trainers.
Retention Rate for Co-Ed Athletics
Co-Ed 2010-11 2011-12 2012-13 2013-14
09 94 74.2% 53.9% 42.7%
10 91 71.6% 43.9% -
11 55 64.6% - -
Co-Ed 2011-12 2012-13 2013-14 2014-15
09 110 70.2% 55.9% 42.3%
10 77 65.3% 51.5% -
11 64 50.0% - -
Co-Ed 2012-13 2013-14 2014-15 2015-16
09 136 76.9% 56.9% 46.3%
10 94 66.3% 48.1% -
11 78 66.2% - -
Co-Ed 2013-14 2014-15 2015-16
09 90 77.6% 52.4%
10 104 62.0% 48.0%
11 62 70.7% -
Co-Ed 2014-15 2015-16
09 96 79.6%
10 98 63.5%
11 68 65.1%
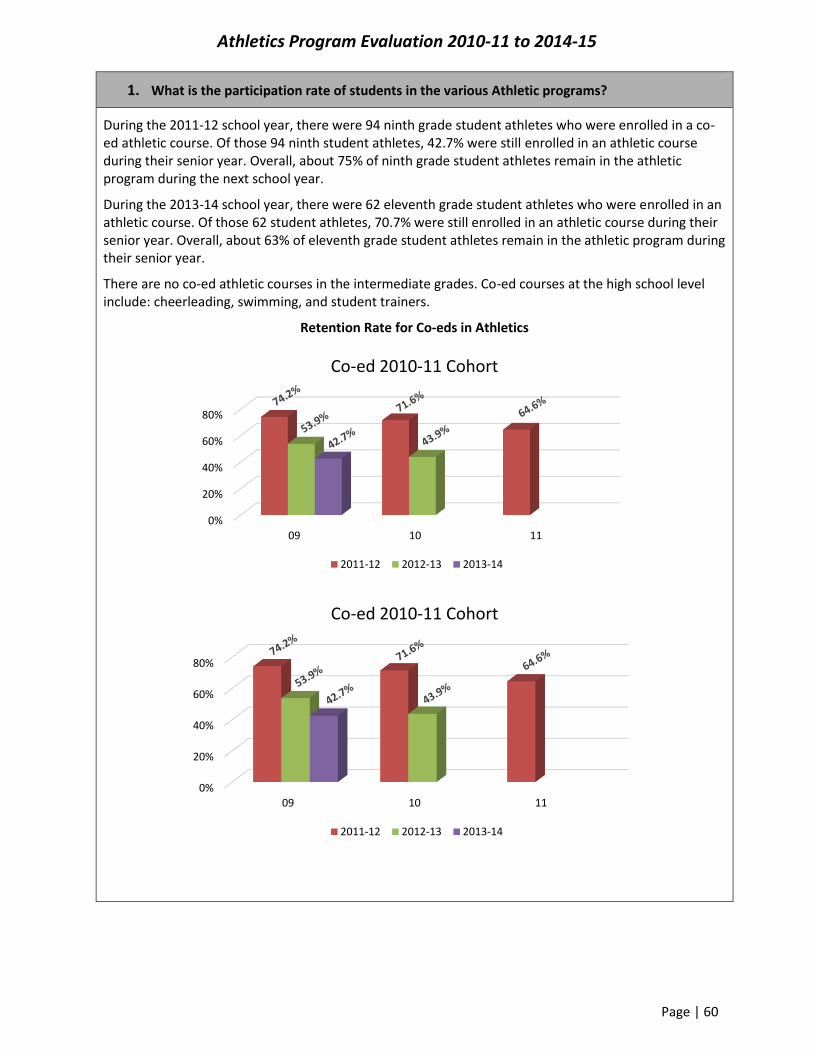
Athletics Program Evaluation 2010-11 to 2014-15
Page | 60
1. What is the participation rate of students in the various Athletic programs?
During the 2011-12 school year, there were 94 ninth grade student athletes who were enrolled in a co-ed athletic course. Of those 94 ninth student athletes, 42.7% were still enrolled in an athletic course during their senior year. Overall, about 75% of ninth grade student athletes remain in the athletic program during the next school year.
During the 2013-14 school year, there were 62 eleventh grade student athletes who were enrolled in an athletic course. Of those 62 student athletes, 70.7% were still enrolled in an athletic course during their senior year. Overall, about 63% of eleventh grade student athletes remain in the athletic program during their senior year.
There are no co-ed athletic courses in the intermediate grades. Co-ed courses at the high school level include: cheerleading, swimming, and student trainers.
Retention Rate for Co-eds in Athletics
0%
20%
40%
60%
80%
09 10 11
Co-ed 2010-11 Cohort
2011-12 2012-13 2013-14
0%
20%
40%
60%
80%
09 10 11
Co-ed 2010-11 Cohort
2011-12 2012-13 2013-14
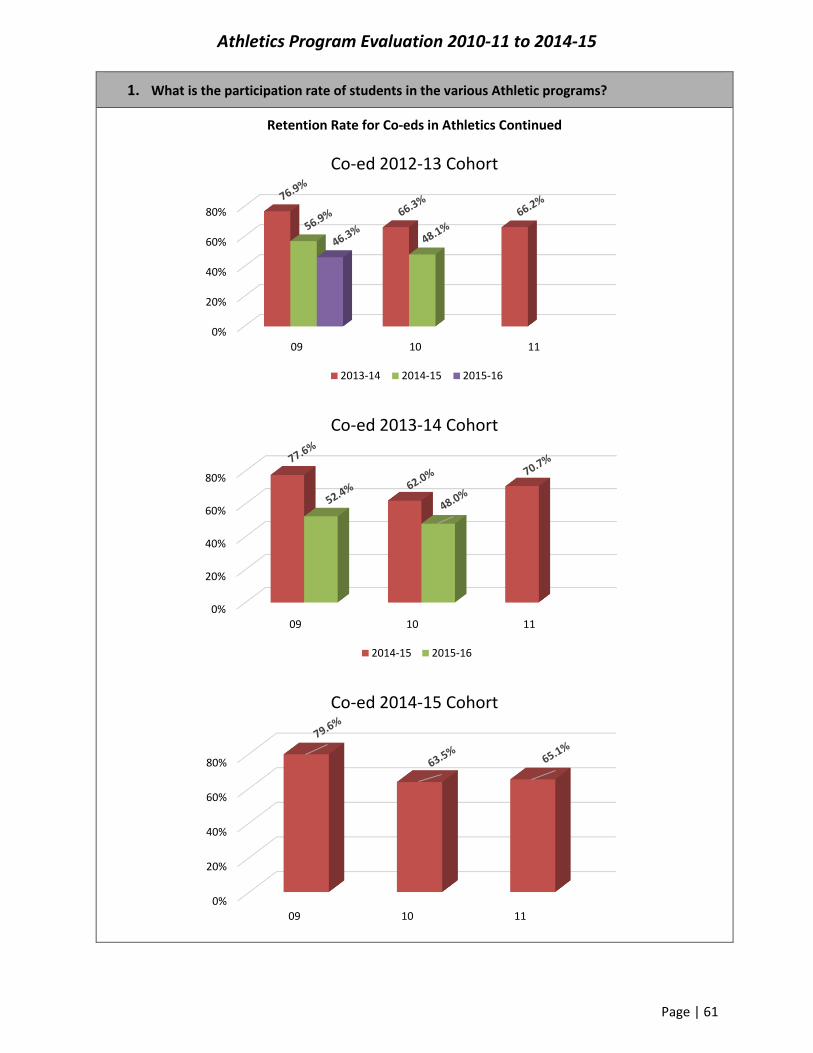
Athletics Program Evaluation 2010-11 to 2014-15
Page | 61
1. What is the participation rate of students in the various Athletic programs?
Retention Rate for Co-eds in Athletics Continued
0%
20%
40%
60%
80%
09 10 11
Co-ed 2012-13 Cohort
2013-14 2014-15 2015-16
0%
20%
40%
60%
80%
09 10 11
Co-ed 2013-14 Cohort
2014-15 2015-16
0%
20%
40%
60%
80%
09 10 11
Co-ed 2014-15 Cohort

Athletics Program Evaluation 2010-11 to 2014-15
Page | 62
2. What are the academic achievements of students who participate in Athletics?
In 1984, the passing of House Bill 72 (HB 72) included a provision known as No Pass, No Play. HB 72 set the standard for students to participate in athletics as well as all extra-curricular activities by stating that students must be passing all courses in order to continue their participation. At the time, if a student was failing a course, they could not continue to participate in practice or competition and had to sit out until they passed on the next grading cycle (six weeks). Currently, the law states students are suspended from participation in competition but may still practice. Coaches check grades every three weeks until the student is passing.
From the UIL website: Students must be eligible under no-pass, no-play. Extracurricular activities include public
performances, contests, demonstrations, displays, and club activities. An activity would be considered extracurricular if: o the activity is competitive; o the activity is held in conjunction with another activity that is considered extracurricular; o the activity is held off campus, except in a case in which adequate facilities do not exist on
campus; o the general public is invited; o an admission price is charged.
Exception: If a student is enrolled in a state-approved course in which he or she must demonstrate mastery of the essential knowledge and skills in a public performance, then he or she may participate so long as the activity is not competitive; it is not held in conjunction with another activity that is competitive; and an admission price is not charged.
Basics of No Pass, No Play Must be passing all courses (except identified advanced classes). Students lose eligibility for a three-week period, which is defined as 15 class days. Exception: one,
but only one, of the three school weeks may consist of only three or four class days, provided the school has been dismissed for a scheduled holiday period. Two class days does not constitute a school week. Exception: Thanksgiving if schools are on holiday Wednesday, Thursday, and Friday.
School week begins at 12:01 a.m. on the first instructional day of the calendar week and ends at the close of instruction on the last instructional day of the calendar week (excluding holidays).
Ineligible students must wait seven (7) calendar days after a three-week evaluation period and the grading period to regain eligibility.
Students may regain eligibility an unlimited number of times throughout the school year. Passing means a minimum grade of 70 on all courses (except identified advanced classes).
Note: Spring break can't be part of the 3-week evaluation process. All students are eligible during spring break.
Advanced and Honors Classes The following courses are identified as advanced and, as such, eligible for exemption as noted in
section 33.081 of the Texas Education Code: o Any College Board Advanced Placement (AP) Course or International Baccalaureate (IB) Course
and; o Honors* and high school/college concurrent enrollment classes (that are included in Part One
of the “Community College General Academic Course Guide Manual”) in the subject areas of English Language Arts, Mathematics, Science, Social Studies, Economics or language other than English.
* Districts may identify honors courses only in the subject areas of English language arts, mathematics, science, social
studies, economics, or a language other than English as eligible for exemption. However, districts must identify such
courses prior to the semester in which any exemptions related to extracurricular activities occur.

Athletics Program Evaluation 2010-11 to 2014-15
Page | 63
2. What are the academic achievements of students who participate in Athletics?
Student Survey
Strongly Disagree
(1) Disagree
(2) Agree
(3)
Strongly Agree
(4)
Mean Score
The Athletic program coaches show interest in my academic success.
2.2% 4.5% 44.2% 49.1% 3.40
My grades have improved since my involvement in the Athletic program.
4.8% 26.8% 49.3% 19.3% 2.83
My attendance has improved since my involvement in the Athletic program.
3.8% 22.1% 44.8% 29.4% 3.00
The Athletic program has helped me increase my proficiency in:
Study skills 6.0% 29.8% 45.3% 19.0% 2.77
Average 3.00
Students were asked survey questions linked to academics and athletics. The overall average of those five questions is 2.92. There were 93.3% of the students who responded with either Agree or Strongly Agree that the athletic program coaches show interest in their academic success. This reflected what student athletes said during the focus group discussions as coaches let athletes go to tutorials even during practice time and coaches allowed for study hall time during the athletic period when their sport was in season for student athletes to catch up on their academic work.
Parent Survey
Strongly Disagree
(1) Disagree
(2) Agree
(3)
Strongly Agree
(4)
Mean Score
The Athletic program coaches show interest in my academic success.
7.0% 9.3% 46.3% 37.4% 3.14
My grades have improved since my involvement in the Athletic program.
9.4% 43.5% 35.8% 11.3% 2.49
My attendance has improved since my involvement in the Athletic program.
7.8% 39.4% 37.9% 14.9% 2.60
The Athletic program has helped my student increase their proficiency in:
Study skills 7.3% 42.5% 38.3% 11.8% 2.55
Average 2.70
Parents were asked survey questions linked to academics and athletics. The overall average of those five questions is 2.67. There were 83.7% of the parents who responded with either Agree or Strongly Agree that the athletic program coaches show interest in their academic success.

Athletics Program Evaluation 2010-11 to 2014-15
Page | 64
2. What are the academic achievements of students who participate in Athletics?
Coach Survey
Strongly Disagree
(1) Disagree
(2) Agree
(3) Strongly Agree (4)
Mean Score
I show interest in my students' academic success.
2.3% 5.0% 9.1% 88.2% 3.83
My students' grades have improved since their involvement in the Athletic program.
0.5% 3.6% 63.6% 32.3% 2.78
My students' attendance has improved since their involvement in the Athletic program.
0.5% 1.8% 58.6% 39.1% 3.36
The Athletic program has helped my students increase their proficiency in:
Study skills 1.4% 5.0% 53.2% 40.5% 3.33
Average 3.33
Coaches were asked survey questions linked to academics and athletics. The overall average of those five questions is 3.25. There were 97.3% of the coaches who responded with either Agree or Strongly Agree that the athletic program coaches show interest in their students’ academic success.

Athletics Program Evaluation 2010-11 to 2014-15
Page | 65
2. What are the academic achievements of students who participate in Athletics?
Survey Results – Comparison of Means
Student Parent Coach
Level Int HS
Sign.*
Int HS
Sign.*
Int HS
Sign.* N 965 646 432 727 96 124
Mean Mean Mean Mean Mean Mean
The Athletic program coaches show interest in my academic success.
3.46 3.31 Yes 3.30 3.05 Yes 3.88 3.80 Yes
My grades have improved since my involvement in the Athletic program.
2.90 2.73 Yes 2.56 2.45 No 3.22 3.32 Yes
My attendance has improved since my involvement in the Athletic program.
3.02 2.96 No 2.68 2.55 Yes 3.29 3.42 Yes
The Athletic program has helped my increase my proficiency in:
Study skills 2.82 2.71 Yes 2.63 2.50 Yes 3.25 3.39 No
*Sign – Significant Difference
A comparison of the means of the survey results for questions regarding coaches’ interest in their students’ academic success was conducted between levels of secondary grades. For students there was a significant difference for coaches showing interest in their academic success and students’ grades improving since being involved in athletics. Based on the parent survey results, all questions had a significant difference with the exception of students’ grades improving since being involved in athletics. Coach responses displayed significant differences in all their responses.

Athletics Program Evaluation 2010-11 to 2014-15
Page | 66
2. What are the academic achievements of students who participate in Athletics?
Results from the academic survey questions was compared across means for students, parents, and coaches. Coach results for each sport was higher than student or parent results due to high self-efficacy. Overall results ranged from 2.34 to 3.54.
Each sport and group rated the question regarding coaches’ interest in their students’ academic success the highest. Overall results ranged from 2.88 to 4.00. The question with the lowest rating for each sport and group was regarding students’ grades improving since their involvement in the athletic program. Overall results ranged from 2.30 to 3.50.
The sport with the highest combined response rate for students, parents, and coaches was softball with a 3.13. The sport with the lowest combined response rate for students, parents, and coaches was cheerleading with a 2.81.
The following four pages displays the results of the means for each sport by student, parent, and coach.
Survey Results – Mean Comparison Across Sports
Football Basketball Volleyball
Student Parent Coach Student Parent Coach Student Parent Coach
N 550 380 84 431 343 72 312 157 33
The Athletic program coaches show interest in my academic success.
3.46 3.21 3.87 3.49 3.14 3.86 3.40 3.27 3.88
My grades have improved since my involvement in the Athletic program.
2.95 2.56 3.29 2.93 2.42 3.25 2.77 2.50 3.21
My attendance has improved since my involvement in the Athletic program.
3.15 2.72 3.31 3.13 2.59 3.35 2.88 2.54 3.33
The Athletic program has helped my student increase their proficiency in:
Study skills 2.93 2.62 3.29 2.89 2.51 3.39 2.68 2.60 3.24
Average 3.12 2.78 3.44 3.11 2.67 3.46 2.93 2.73 3.42
Average by Sport 3.11 3.08 3.03

Athletics Program Evaluation 2010-11 to 2014-15
Page | 67
2. What are the academic achievements of students who participate in Athletics?
Survey Results – Mean Comparison Across Sports
Soccer Softball Tennis
Student Parent Coach Student Parent Coach Student Parent Coach
N 135 87 24 23 47 7 159 85 18
The Athletic program coaches show interest in my academic success.
3.50 3.14 3.88 3.44 3.32 4.00 3.27 3.00 3.78
My grades have improved since my involvement in the Athletic program.
2.90 2.46 3.29 2.74 2.70 3.29 2.83 2.41 3.28
My attendance has improved since my involvement in the Athletic program.
3.13 2.55 3.46 3.17 2.77 3.57 2.85 2.45 3.33
The Athletic program has helped my student increase their proficiency in:
Study skills 2.87 2.46 3.29 2.78 2.81 3.86 2.77 2.46 3.39
Average 3.10 2.65 3.48 3.03 2.90 3.68 2.93 2.58 3.45
Average by Sport 3.08 3.20 2.99
Golf T&F Cross Country
Student Parent Coach Student Parent Coach Student Parent Coach
N 112 76 23 325 185 49 352 167 17
The Athletic program coaches show interest in my academic success.
3.35 3.34 3.91 3.49 3.29 3.88 3.47 3.26 3.77
My grades have improved since my involvement in the Athletic program.
2.89 2.47 3.35 2.98 2.57 3.18 2.86 2.53 3.29
My attendance has improved since my involvement in the Athletic program.
2.98 2.59 3.48 3.11 2.67 3.27 2.99 2.60 3.29
The Athletic program has helped my student increase their proficiency in:
Study skills 2.82 2.50 3.48 2.95 2.63 3.08 2.77 2.56 2.94
Average 3.01 2.73 3.56 3.13 2.79 3.35 3.02 2.74 3.32
Average by Sport 3.10 3.09 3.03

Athletics Program Evaluation 2010-11 to 2014-15
Page | 68
2. What are the academic achievements of students who participate in Athletics?
Survey Results – Mean Comparison Across Sports
Baseball Wrestling Swimming
Student Parent Coach Student Parent Coach Student Parent Coach
N 62 64 11 31 35 9 115 108 6
The Athletic program coaches show interest in my academic success.
3.32 3.20 3.91 3.71 2.71 3.56 3.07 3.00 4.00
My grades have improved since my involvement in the Athletic program.
2.95 2.53 3.36 3.03 2.29 2.89 2.37 2.48 3.50
My attendance has improved since my involvement in the Athletic program.
3.15 2.70 3.55 3.23 2.46 2.89 2.64 2.56 3.33
The Athletic program curriculum effectively incorporates the use of technology.
3.00 2.70 3.36 3.07 2.06 3.00 2.35 2.40 3.33
The Athletic program has helped my student increase their proficiency in:
Study skills 3.02 2.50 3.36 3.03 2.20 3.00 2.27 2.53 3.50
Average 3.11 2.73 3.55 3.25 2.42 3.09 2.59 2.64 3.58
Average by Sport 3.13 2.92 2.94
Cheer Trainer
Student Parent Coach Student Parent Coach
N 56 43 5 24 8 8
The Athletic program coaches show interest in my academic success.
3.21 2.88 3.80 3.50 3.00 3.88
My grades have improved since my involvement in the Athletic program.
2.63 2.30 3.00 3.13 2.75 3.25
My attendance has improved since my involvement in the Athletic program.
2.80 2.37 3.20 3.08 2.75 3.25
The Athletic program curriculum effectively incorporates the use of technology.
2.46 2.37 3.00 3.21 3.25 2.88
The Athletic program has helped my student increase their proficiency in:
Study skills 2.63 2.42 3.00 2.96 2.88 3.00
Average 2.82 2.49 3.25 3.17 2.85 3.35
Average by Sport 2.85 3.12

Athletics Program Evaluation 2010-11 to 2014-15
Page | 69
2. What are the academic achievements of students who participate in Athletics?
Based on the compiled coaches program evaluations completed at the end of each year, all CCISD coaches perform grade checks during the mandatory three week period, and many have weekly grade checks. All coaches encourage students to attend tutorials on Tuesdays and Thursdays. Many coaches require student athletes with any grade below 80 to attend tutorials in that subject. Some coaches have policies that if a student athlete is not passing a course, they must sit out of practice/games until they are in good standing even if the student athlete was passing during the required three week grade check.
Student Focus Group
In late September/early October of 2015, and January and May 2016, students were selected from each sport to be part of a focus group discussion. Students from each group stated they had to be very organized and plan ahead with respect to balancing their academic and athletic schedules. Most students stated they found it challenging to be on top of their school work as well as practice, although some responses varied by sport. Many of the students in the focus groups were enrolled in Pre-AP or AP courses. Many of the student athletes stated they managed their time well and prioritized what school work needed their attention and knew what assignments were due when.
Most students emphasized their coaches allowed for some flexibility for completing assignments and/or attending tutorials to catch up on classwork.
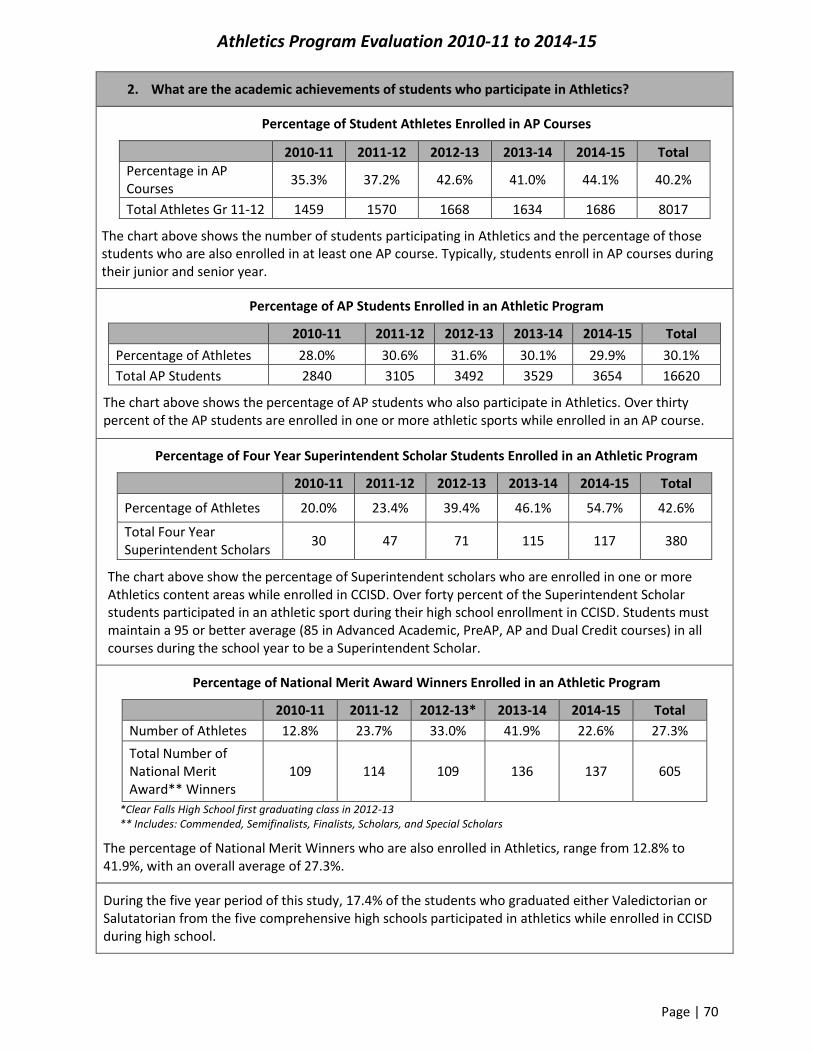
Athletics Program Evaluation 2010-11 to 2014-15
Page | 70
2. What are the academic achievements of students who participate in Athletics?
Percentage of Student Athletes Enrolled in AP Courses
2010-11 2011-12 2012-13 2013-14 2014-15 Total
Percentage in AP Courses
35.3% 37.2% 42.6% 41.0% 44.1% 40.2%
Total Athletes Gr 11-12 1459 1570 1668 1634 1686 8017
The chart above shows the number of students participating in Athletics and the percentage of those students who are also enrolled in at least one AP course. Typically, students enroll in AP courses during their junior and senior year.
Percentage of AP Students Enrolled in an Athletic Program
2010-11 2011-12 2012-13 2013-14 2014-15 Total
Percentage of Athletes 28.0% 30.6% 31.6% 30.1% 29.9% 30.1%
Total AP Students 2840 3105 3492 3529 3654 16620
The chart above shows the percentage of AP students who also participate in Athletics. Over thirty percent of the AP students are enrolled in one or more athletic sports while enrolled in an AP course.
Percentage of Four Year Superintendent Scholar Students Enrolled in an Athletic Program
2010-11 2011-12 2012-13 2013-14 2014-15 Total
Percentage of Athletes 20.0% 23.4% 39.4% 46.1% 54.7% 42.6%
Total Four Year Superintendent Scholars
30 47 71 115 117 380
The chart above show the percentage of Superintendent scholars who are enrolled in one or more Athletics content areas while enrolled in CCISD. Over forty percent of the Superintendent Scholar students participated in an athletic sport during their high school enrollment in CCISD. Students must maintain a 95 or better average (85 in Advanced Academic, PreAP, AP and Dual Credit courses) in all courses during the school year to be a Superintendent Scholar.
Percentage of National Merit Award Winners Enrolled in an Athletic Program
2010-11 2011-12 2012-13* 2013-14 2014-15 Total
Number of Athletes 12.8% 23.7% 33.0% 41.9% 22.6% 27.3%
Total Number of National Merit Award** Winners
109 114 109 136 137 605
*Clear Falls High School first graduating class in 2012-13 ** Includes: Commended, Semifinalists, Finalists, Scholars, and Special Scholars
The percentage of National Merit Winners who are also enrolled in Athletics, range from 12.8% to 41.9%, with an overall average of 27.3%.
During the five year period of this study, 17.4% of the students who graduated either Valedictorian or Salutatorian from the five comprehensive high schools participated in athletics while enrolled in CCISD during high school.

Athletics Program Evaluation 2010-11 to 2014-15
Page | 71
3. What benefits, beyond academic achievements, do students receive from being in Athletics?
House Bill 5 requires that each campus is evaluated on eight areas of community and student engagement:
1. Fine Arts 2. Wellness and Physical Education 3. Community and Parental Involvement 4. 21st Century Workforce Development Program 5. Second Language Acquisition Program 6. Digital Learning Environment 7. Dropout Prevention Strategies 8. Educational Programs for Gifted and Talented Students
For the 2013-14 ratings, CCISD developed a rating system based on the number of community and student engagement opportunities available. If a district has four or more measures, they receive 4 points for a rating of Exemplary; three measures equals 3 points for a rating of Recognized; two measures equals 1 point for a rating of Acceptable; and zero to one measure equals 0 points for a rating of Unacceptable.
The table below shows many of the indicators that were included in the 2014-15 Community and Student Engagement report for Athletics. These activities were opportunities for CCISD students and/or the community to be involved within the Athletic program during the year.
2. W
elln
ess
an
d P
hys
ica
l Ed
uca
tio
n
Biggest Loser Bike Rodeo Blood Drive Breast Cancer
Awareness
Exemplary
First Tee FIT Week Fitness Gram
Food Services: Focus on Healthy
Nutrition
Jump Rope for Heart
Kick for the Kids Mammograms Marathon Kids
Project Self-Respect
Relay for Life Running Club Rusty Putter
St. Judes Drive St. Judes
Marathon Staff Wellness
Activities Student Physicals
Walk on the Wild Side
Field Days Immunizations Play 360
Faculty Wellness
Committee
Growth and Development
Classes
Penny Drive for Leukemia
Special Olympics Participation
Drug and Prescription
Give Back Fun Runs
Nutrition Education
Classes
School Walk for Diabetes
Crazy Krewe Run/Walk
Fruit of the Month
Mud/Grit Run School Dance
Sports Camps Vision & Hearing
Exams Train Like an
Astro Tiger's Den

Athletics Program Evaluation 2010-11 to 2014-15
Page | 72
3. What benefits, beyond academic achievements, do students receive from being in Athletics?
Based on the compiled coaches program evaluations completed at the end of each year, most athletic programs in CCISD indicated they spent time on character development as well as leadership skills. The coaching staff believes it is important to develop their student athletes into outstanding young men and women who show leadership, integrity, high ethics, and community involvement.
Coaches may show videos which demonstrate great character, provide discussions involving character development, integrity, hard work in practice and games as well as in the classroom. Coaches uphold the CCISD Student Honor Code and many programs have their own set of rules and expectations which are explained to the student athletes as well as the parents. One program has only one rule: Do Not Dishonor the Program.
Student Focus Groups
Based on student focus group discussions, many students felt they have learned many skills outside of their sport. Many students spoke about developing skills such as time management, hard work, perseverance, self-motivation, and work ethic.
Community Events
Students involved in Athletics often participate in many community functions. A sampling of community events which students participated in 2014-15 are listed below which were extracted from the annual end of the year evaluation the coaches complete.
Boys Basketball: worked the intermediate tournament; Character Court at Clear Lake City Elementary; elementary campus basketball clinic.
Football: Autism walk; food drive; Relay for Life; Toys for Tots; worked the elementary school carnival.
Boys Soccer: Special Olympics; worked the elementary school carnival.
Boys Tennis: Autism walk.
Baseball: Challenger baseball games; League City Christmas Parade; elementary Fit Night; Homerun for the Holidays; Little League Night; Adopt a Student for Christmas.
Boys Track and Field/Cross Country: volunteered to work at fun runs; ran with elementary school running clubs.
Water Sports: worked with Special Olympic athletes; provided a swim clinic; Splash out Lupus; worked at the elementary school carnival; provided clinics; Thanksgiving basket for a family in need.
Golf: performed golf course repairs (divots, litter pick up); worked at the driving range; worked a tournament at South Shore Harbour.
Wrestling: community cleanup.
Girls Basketball: Cancer Awareness event; worked with elementary school physical education classes; Silver Angels; Stocking stuffer for elderly; Wildcat reading at elementary school; collected 300+ items for Harbour House.
Volleyball: Breast Cancer Awareness event; 2000+ items for Harbour House; Fight Cancer night; clean the beach; clean up at the Houston Zoo; Santa’s Helpers; collected personal items for ‘Nook’.
Girls Soccer: TOPSoccer with adaptive physical education students; worked the elementary school carnival; Kick Cancer Night.
Girls Tennis: Autism walk.
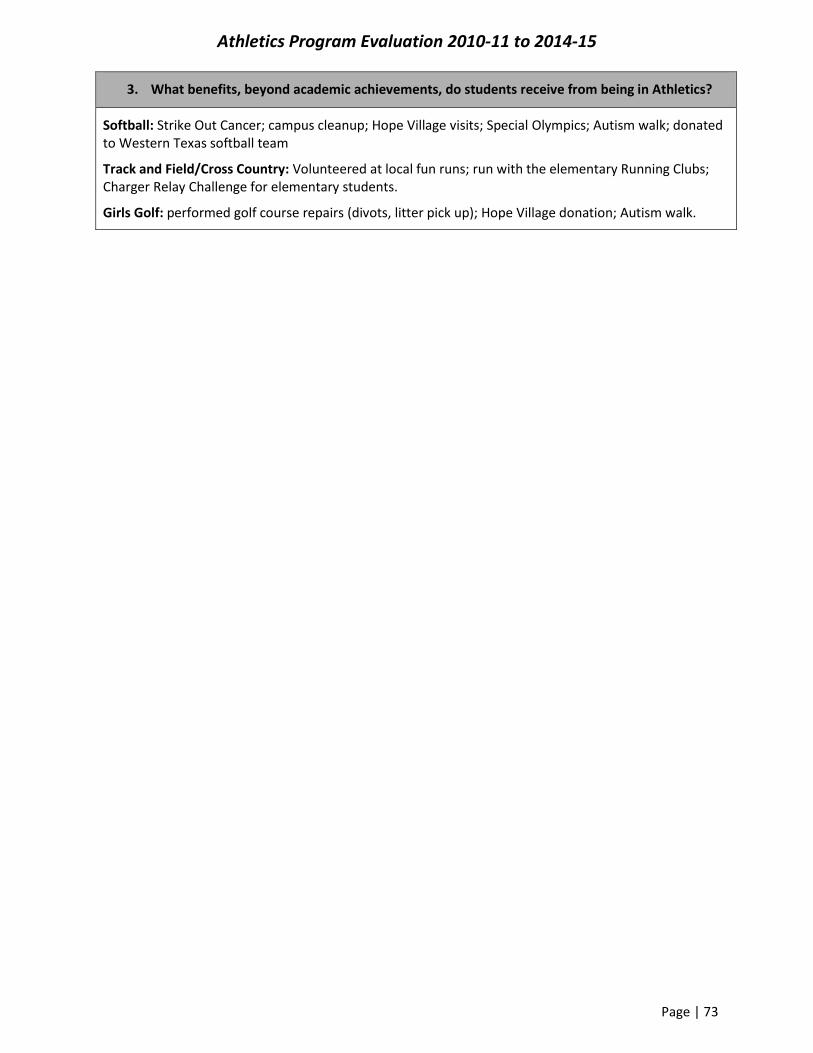
Athletics Program Evaluation 2010-11 to 2014-15
Page | 73
3. What benefits, beyond academic achievements, do students receive from being in Athletics?
Softball: Strike Out Cancer; campus cleanup; Hope Village visits; Special Olympics; Autism walk; donated to Western Texas softball team
Track and Field/Cross Country: Volunteered at local fun runs; run with the elementary Running Clubs; Charger Relay Challenge for elementary students.
Girls Golf: performed golf course repairs (divots, litter pick up); Hope Village donation; Autism walk.

Athletics Program Evaluation 2010-11 to 2014-15
Page | 74
3. What benefits, beyond academic achievements, do students receive from being in Athletics?
Students benefit from participating in extracurricular activities which cannot be measured through an assessment or displayed on a scale. “By participating in extracurricular activities students learn lessons in leadership, teamwork, organization, analytical thinking, problem solving, time management, learning to juggle many tasks at once and it allows them to discover their talents” (Massoni, 2011, p.3).
A series of questions was asked of students, parents, and coaches as part of the survey administered in January 2016, which relate to those skills learned outside of the sport in which they participate. The following tables show the survey results.
Student Survey
Strongly Disagree
(1) Disagree
(2) Agree
(3)
Strongly Agree
(4) Mean Score
I feel actively engaged in learning and improving my talent level in the Athletic program.
2.4% 4.2% 36.3% 57.2% 3.48
The coaches/directors who are participating in the Athletic program are valuable to my success in the Athletic program.
2.5% 5.2% 48.3% 44.0% 3.34
The Athletic coaches are aware of my strengths and weaknesses with respect to the Athletic program.
1.8% 9.1% 53.3% 35.8% 3.23
The Athletic program coaches’/coaches’ expectations are clear.
1.3% 4.4% 44.5% 49.8% 3.43
I have access to the resources and materials I need in order to improve my talent with respect to the Athletic program.
1.7% 4.8% 49.8% 4.3.6% 3.35
The Athletic program has helped me increase my proficiency in:
Time management 3.4% 13.6% 52.3% 30.8% 3.11
Collaboration 2.0% 6.1% 55.6% 36.3% 3.26
Initiative/self-direction 1.7% 6.3% 52.8% 39.3% 3.30
Organizational skills 3.7% 19.7% 47.1% 29.5% 3.02
Problem solving 2.8% 15.0% 50.5% 31.8% 3.11
Responsibility 1.6% 3.8% 43.0% 51.6% 3.45
Leadership 2.0% 7.8% 43.5% 46.7% 3.35
Performance skills 1.8% 3.8% 42.3% 52.0% 3.45
Average 3.30

Athletics Program Evaluation 2010-11 to 2014-15
Page | 75
3. What benefits, beyond academic achievements, do students receive from being in Athletics?
Student Survey (Continued)
38. Why did you choose to participate in the Athletics program?
For the love of sports; enjoy playing sports; and to be part of a team
To be a better athlete; to become stronger; and to prepare for the future
To become a part of the Athletics program (team involvement; to be challenged; and to
experience success)
39. What is one aspect you like best about the Athletics program?
Coaches’ support and encouragement
Teamwork, collaboration, and discipline; opportunities for success; and the competitiveness
Friendships
Being pushed to the limit by the coaches and team
40. What is one aspect you would like to change about the Athletics program?
Wouldn’t change anything
Diversity of conditioning/workouts
Time (Some students would like more practice and conditioning time while others would like
less practice time and more time for homework. Some students would also like the opportunity
to practice multiple sports without interference).
Coaches (Students would like coaches to be more involved by participating in the
practice/training with them; students also would like coaches to have more experience/training
in the particular sport for which they are responsible).
Current student athletes in grades 7-12 completed an Athletics student survey in January 2016. Questions were measured with a Likert scale of 1-4 with 1 being “Strongly Disagree” and 4 being “Strongly Agree.” For questions relating to benefits beyond academics, Likert scale scores were averaged to determine a mean score per question and an overall average for those questions.
Average Likert scale scores for students ranged from 3.02 to 3.48. Overall average Likert scale score was 3.30.

Athletics Program Evaluation 2010-11 to 2014-15
Page | 76
3. What benefits, beyond academic achievements, do students receive from being in Athletics?
Parent Survey
Strongly Disagree
(1) Disagree
(2) Agree
(3) Strongly Agree (4)
Mean Score
My student feels actively engaged in learning and improving their talent level in the Athletic program.
8.1% 12.2% 39.3% 40.5% 3.12
The coaches/directors who are participating in the Athletic program are valuable to my student's success in the Athletic program.
11.7% 13.5% 37.6% 37.1% 3.00
The Athletic coaches are aware of my student's strengths and weaknesses with respect to the Athletic program.
9.6% 16.2% 44.7% 29.5% 2.94
The Athletic program coaches’/coaches’ expectations are clear.
9.6% 14.3% 43.7% 32.4% 2.99
My student has access to the resources and materials they need in order to improve their talent with respect to the Athletic program.
9.8% 17.8% 48.3% 24.1% 2.87
I believe that additional support/expenditures (outside of what is provided by CCISD) is necessary for my student to be successful in the athletic program.
3.9% 20.5% 41.7% 33.9% 3.06
The Athletic program promotes my student's understanding and respect for other cultures and people.
6.4% 15.4% 54.9% 23.3% 2.95
The Athletic program has helped my student increase their proficiency in:
Time management 5.4% 18.3% 56.3% 20.0% 2.91
Collaboration 4.8% 14.3% 58.2% 22.7% 2.99
Initiative/self-direction 4.7% 15.3% 55.3% 24.8% 3.00
Organizational skills 5.4% 26.1% 52.2% 16.2% 2.79
Problem solving 5.4% 23.0% 56.1% 15.4% 2.82
Responsibility 4.5% 8.5% 57.1% 29.9% 3.12
Leadership 5.8% 15.8% 49.7% 28.7% 3.01
Performance skills 8.2% 13.1% 52.1% 26.6% 2.97
Average 2.97

Athletics Program Evaluation 2010-11 to 2014-15
Page | 77
3. What benefits, beyond academic achievements, do students receive from being in Athletics?
Parent Survey (Continued)
38. Why did your student choose to participate in the Athletics program?
They love to play sports.
They wanted to be actively involved in school activities and wanted to be part of a team.
They would like to play at the collegiate level.
39. What is one aspect you like best about the Athletics program?
Coaching staff (confidence-building experiences; interaction with students; and their encouragement)
Team-building opportunities; teamwork; support; and team spirit (camaraderie and sense of belonging)
The program has been a positive influence.
40. What is one aspect you would like to change about the Athletics program?
Coaches (more experience and fair guidelines for all students to have an opportunity to play)
More involvement and communication with parents; more funding aside from parents and
booster clubs
Parents of current student athletes in grades 7-12 completed an Athletics parent survey in January 2016. Questions were measured with a Likert scale of 1-4 with 1 being “Strongly Disagree” and 4 being “Strongly Agree.” For questions relating to benefits beyond academics, Likert scale scores were averaged to determine a mean score per question and an overall average for those questions.
Average Likert scale scores for students ranged from 2.79 to 3.12. Overall average Likert scale score was 2.97.

Athletics Program Evaluation 2010-11 to 2014-15
Page | 78
3. What benefits, beyond academic achievements, do students receive from being in Athletics?
Coach Survey
Strongly Disagree
(1) Disagree
(2) Agree
(3) Strongly Agree (4)
Mean Score
My students feel actively engaged in learning and improving their talent level in the Athletic program.
1.4% 0.5% 35.5% 62.7% 3.60
I am valuable to my students' success in the Athletic program.
0.5% 0.9% 21.4% 77.3% 3.76
I am aware of my students' strengths and weaknesses with respect to the Athletic program.
0.5% 0.0% 22.7% 76.8% 3.76
My expectations about the athletic program are clear.
0.5% 0.5% 19.5% 95.5% 3.77
My students have access to the resources and materials they need in order to improve their talent with respect to the Athletic program.
0.5% 7.7% 42.3% 49.5% 3.41
I believe that additional support/expenditures (outside of what is provided by CCISD) is necessary for my students to be successful in the Athletic program.
1.4% 21.4% 44.1% 33.2% 3.09
The Athletic program promotes students' understanding and respect for other cultures and people.
0.5% 0.9% 38.6% 60.0% 3.58
The Athletic program has helped my students increase their proficiency in:
Time management 1.4% 2.3% 38.6% 57.7% 3.53
Collaboration 1.4% 0.5% 39.1% 59.1% 3.56
Initiative/self-direction 1.4% 0.0% 41.4% 57.3% 3.55
Organizational skills 1.4% 5.0% 49.1% 44.5% 3.37
Problem solving 1.4% 0.9% 45.9% 51.8% 3.48
Responsibility 1.4% 0.0% 29.5% 69.1% 3.66
Leadership 1.4% 0.9% 32.7% 65.0% 3.61
Performance skills 0.9% 0.5% 36.4% 62.3% 3.60
Average 3.55

Athletics Program Evaluation 2010-11 to 2014-15
Page | 79
3. What benefits, beyond academic achievements, do students receive from being in Athletics?
Coach Survey (Continued)
33. What is one aspect you like best about the Athletics program?
The athletes (the relationships built; ensuring success for all; the sense of community; and teaching them life lessons)
The support of the athletics program among coaches of different sports, other programs, campuses, the district, and the community
34. What is one aspect you would like to change about the Athletics program?
Coaches (more coaching staff needed during athletic period; more physical training ideas and
sport-specific professional learning opportunities; more communication between intermediate
and high school coaches; the ability to share athletes between and among sports; and the
creation of a sense of community among sports)
Improvement of facilities
Coaches who currently coach student athletes in grades 7-12 completed an Athletics coach survey in January 2016. Questions were measured with a Likert scale of 1-4 with 1 being “Strongly Disagree” and 4 being “Strongly Agree.” For questions relating to benefits beyond academics, Likert scale scores were averaged to determine a mean score per question and an overall average for those questions.
Average Likert scale scores for students ranged from 3.09 to 3.77. Overall average Likert scale score was 3.55.

Athletics Program Evaluation 2010-11 to 2014-15
Page | 80
3. What benefits, beyond academic achievements, do students receive from being in Athletics?
A comparison of the means of the survey results for questions pertaining to the benefits of athletics beyond academic achievements was conducted between levels of secondary grades. For students there was a significant difference for 4 of the 15 questions. Based on the parent survey results, there were 12 of the 15 questions with a significant difference. Based on the coaches’ survey results, there were 2 of the 15 questions with a significant difference.
Survey Results – Comparison of Means
Student Parent Coach
Level Int HS
Significant
Int HS
Significant
Int HS
Significant N 965 646 432 727 96 124
Mean Mean Mean Mean Mean Mean
I feel actively engaged in learning and improving my talent level in the Athletic program.
3.56 3.38 Yes 3.22 3.06 Yes 3.54 3.64 No
The coaches/directors who are participating in the Athletic program are valuable to my success in the Athletic program.
3.42 3.22 Yes 3.13 2.94 Yes 3.73 3.77 No
The Athletic coaches are aware of my strengths and weaknesses with respect to the Athletic program.
3.27 3.18 No 3.02 2.89 Yes 3.74 3.77 No
The Athletic program coaches’/coaches’ expectations are clear.
3.47 3.36 Yes 3.13 2.90 Yes 3.74 3.80 No
I have access to the resources and materials I need in order to improve my talent with respect to the Athletic program.
3.39 3.29 No 2.97 2.81 Yes 3.45 3.38 No
I believe that additional support/expenditures (outside of what is provided by CCISD) is necessary for me to be successful in the athletic program.
3.02 3.05 No 2.95 3.12 No 2.97 3.19 Yes
The Athletic program promotes my understanding and respect for other cultures and people.
3.16 3.08 No 3.06 2.89 Yes 3.48 3.66 No

Athletics Program Evaluation 2010-11 to 2014-15
Page | 81
3. What benefits, beyond academic achievements, do students receive from being in Athletics?
Survey Results – Comparison of Means Continued
Student Parent Coach
Level Int HS
Significant
Int HS
Significant
Int HS
Significant N 965 646 432 727 96 124
Mean Mean Mean Mean Mean Mean
The Athletic program has helped me increase my proficiency in:
Time management 3.13 3.07 No 2.98 2.87 Yes 3.39 3.64 No
Collaboration 3.30 3.20 No 3.05 2.95 Yes 3.54 3.57 No
Initiative/self-direction 3.32 3.26 No 3.07 2.96 No 3.50 3.58 No
Organizational skills 3.04 3.00 No 2.85 2.76 Yes 3.30 3.42 No
Problem solving 3.12 3.09 No 2.90 2.76 Yes 3.45 3.51 No
Responsibility 3.49 3.39 No 3.19 3.09 Yes 3.56 3.74 Yes
Leadership 3.40 3.27 No 3.07 2.98 Yes 3.63 3.61 No
Performance skills 3.52 3.34 Yes 3.05 2.92 Yes 3.56 3.63 No
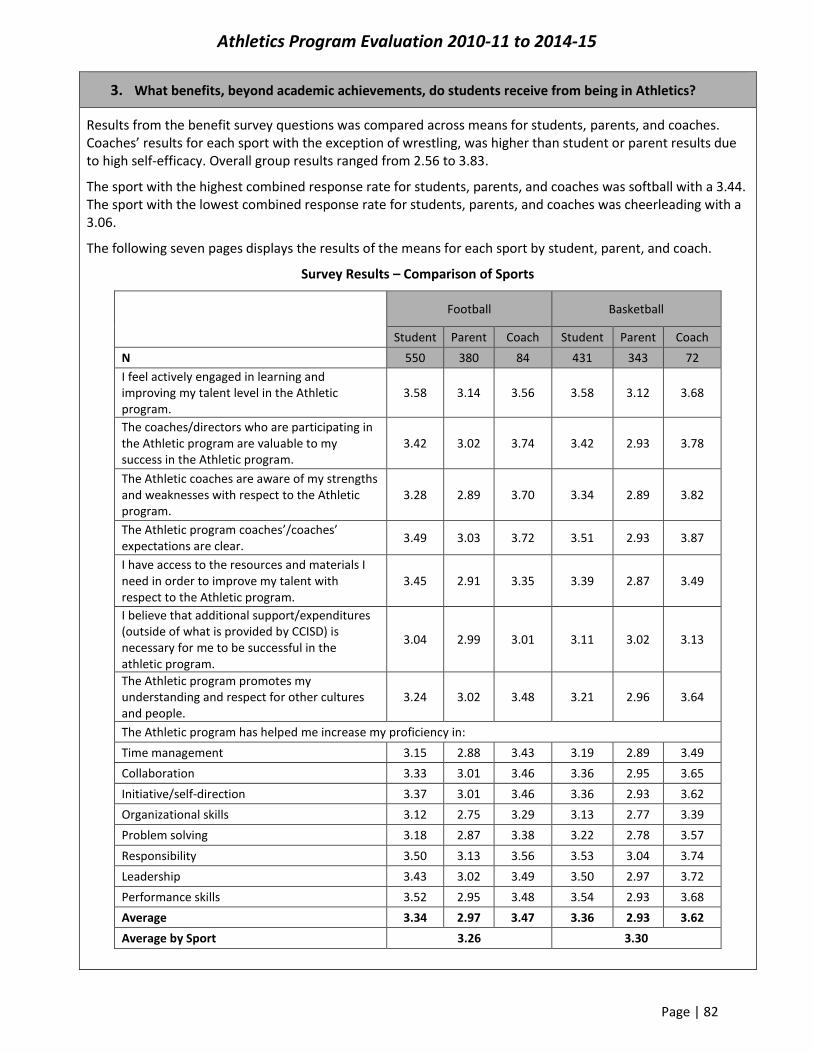
Athletics Program Evaluation 2010-11 to 2014-15
Page | 82
3. What benefits, beyond academic achievements, do students receive from being in Athletics?
Results from the benefit survey questions was compared across means for students, parents, and coaches. Coaches’ results for each sport with the exception of wrestling, was higher than student or parent results due to high self-efficacy. Overall group results ranged from 2.56 to 3.83.
The sport with the highest combined response rate for students, parents, and coaches was softball with a 3.44. The sport with the lowest combined response rate for students, parents, and coaches was cheerleading with a 3.06.
The following seven pages displays the results of the means for each sport by student, parent, and coach.
Survey Results – Comparison of Sports
Football Basketball
Student Parent Coach Student Parent Coach
N 550 380 84 431 343 72
I feel actively engaged in learning and improving my talent level in the Athletic program.
3.58 3.14 3.56 3.58 3.12 3.68
The coaches/directors who are participating in the Athletic program are valuable to my success in the Athletic program.
3.42 3.02 3.74 3.42 2.93 3.78
The Athletic coaches are aware of my strengths and weaknesses with respect to the Athletic program.
3.28 2.89 3.70 3.34 2.89 3.82
The Athletic program coaches’/coaches’ expectations are clear.
3.49 3.03 3.72 3.51 2.93 3.87
I have access to the resources and materials I need in order to improve my talent with respect to the Athletic program.
3.45 2.91 3.35 3.39 2.87 3.49
I believe that additional support/expenditures (outside of what is provided by CCISD) is necessary for me to be successful in the athletic program.
3.04 2.99 3.01 3.11 3.02 3.13
The Athletic program promotes my understanding and respect for other cultures and people.
3.24 3.02 3.48 3.21 2.96 3.64
The Athletic program has helped me increase my proficiency in:
Time management 3.15 2.88 3.43 3.19 2.89 3.49
Collaboration 3.33 3.01 3.46 3.36 2.95 3.65
Initiative/self-direction 3.37 3.01 3.46 3.36 2.93 3.62
Organizational skills 3.12 2.75 3.29 3.13 2.77 3.39
Problem solving 3.18 2.87 3.38 3.22 2.78 3.57
Responsibility 3.50 3.13 3.56 3.53 3.04 3.74
Leadership 3.43 3.02 3.49 3.50 2.97 3.72
Performance skills 3.52 2.95 3.48 3.54 2.93 3.68
Average 3.34 2.97 3.47 3.36 2.93 3.62
Average by Sport 3.26 3.30

Athletics Program Evaluation 2010-11 to 2014-15
Page | 83
3. What benefits, beyond academic achievements, do students receive from being in Athletics?
Survey Results – Comparison of Sports
Volleyball Soccer
Student Parent Coach Student Parent Coach
N 312 157 33 135 87 24
I feel actively engaged in learning and improving my talent level in the Athletic program.
3.49 3.20 3.58 3.57 3.10 3.58
The coaches/directors who are participating in the Athletic program are valuable to my success in the Athletic program.
3.38 3.10 3.70 3.39 2.98 3.71
The Athletic coaches are aware of my strengths and weaknesses with respect to the Athletic program.
3.22 3.04 3.76 3.34 3.00 3.79
The Athletic program coaches’/coaches’ expectations are clear.
3.48 3.12 3.75 3.50 3.10 3.74
I have access to the resources and materials I need in order to improve my talent with respect to the Athletic program.
3.37 2.95 3.46 3.34 2.91 3.42
I believe that additional support/expenditures (outside of what is provided by CCISD) is necessary for me to be successful in the athletic program.
3.08 3.09 2.91 3.09 3.03 3.13
The Athletic program promotes my understanding and respect for other cultures and people.
3.05 3.00 3.52 3.24 2.97 3.75
The Athletic program has helped me increase my proficiency in:
Time management 3.14 3.02 3.46 3.13 3.00 3.63
Collaboration 3.27 3.02 3.46 3.30 3.06 3.67
Initiative/self-direction 3.30 3.06 3.36 3.33 3.00 3.63
Organizational skills 2.99 2.93 3.33 3.19 2.82 3.38
Problem solving 3.11 2.90 3.36 3.19 2.85 3.50
Responsibility 3.49 3.20 3.52 3.50 3.10 3.75
Leadership 3.43 3.10 3.49 3.44 3.08 3.63
Performance skills 3.52 3.12 3.55 3.50 2.99 3.67
Average 3.29 3.06 3.48 3.34 3.00 3.60
Average by Sport 3.28 3.31

Athletics Program Evaluation 2010-11 to 2014-15
Page | 84
3. What benefits, beyond academic achievements, do students receive from being in Athletics?
Survey Results – Comparison of Sports
Softball Tennis
Student Parent Coach Student Parent Coach
N 23 47 7 159 85 18
I feel actively engaged in learning and improving my talent level in the Athletic program.
3.30 3.28 3.71 3.45 3.11 3.56
The coaches/directors who are participating in the Athletic program are valuable to my success in the Athletic program.
3.30 3.15 4.00 3.22 2.87 3.83
The Athletic coaches are aware of my strengths and weaknesses with respect to the Athletic program.
3.22 3.13 3.86 3.20 2.78 3.72
The Athletic program coaches’/coaches’ expectations are clear.
3.57 3.28 4.00 3.30 2.93 3.72
I have access to the resources and materials I need in order to improve my talent with respect to the Athletic program.
3.44 3.09 3.86 3.37 2.86 3.50
I believe that additional support/expenditures (outside of what is provided by CCISD) is necessary for me to be successful in the athletic program.
3.04 3.17 3.71 3.05 3.05 2.89
The Athletic program promotes my understanding and respect for other cultures and people.
3.17 3.15 3.86 3.15 2.95 3.50
The Athletic program has helped me increase my proficiency in:
Time management 3.39 3.02 4.00 3.09 2.91 3.56
Collaboration 3.35 3.15 3.71 3.31 3.00 3.56
Initiative/self-direction 3.35 3.19 3.86 3.30 3.00 3.44
Organizational skills 3.13 3.02 3.57 3.02 2.81 3.44
Problem solving 3.17 2.98 3.57 3.13 2.78 3.61
Responsibility 3.61 3.32 4.00 3.43 3.07 3.78
Leadership 3.57 3.15 3.86 3.35 2.97 3.61
Performance skills 3.48 3.11 3.86 3.46 2.98 3.67
Average 3.33 3.15 3.83 3.26 2.94 3.56
Average by Sport 3.44 3.25

Athletics Program Evaluation 2010-11 to 2014-15
Page | 85
3. What benefits, beyond academic achievements, do students receive from being in Athletics?
Survey Results – Comparison of Sports
Golf T&F
Student Parent Coach Student Parent Coach
N 112 76 23 325 185 49
I feel actively engaged in learning and improving my talent level in the Athletic program.
3.44 3.37 3.70 3.57 3.28 3.55
The coaches/directors who are participating in the Athletic program are valuable to my success in the Athletic program.
3.33 3.24 3.83 3.43 3.12 3.76
The Athletic coaches are aware of my strengths and weaknesses with respect to the Athletic program.
3.18 3.17 3.87 3.31 3.06 3.71
The Athletic program coaches’/coaches’ expectations are clear.
3.34 3.15 3.70 3.52 3.14 3.69
I have access to the resources and materials I need in order to improve my talent with respect to the Athletic program.
3.32 2.95 3.57 3.42 3.01 3.27
I believe that additional support/expenditures (outside of what is provided by CCISD) is necessary for me to be successful in the athletic program.
3.08 3.15 3.17 3.06 3.04 2.86
The Athletic program promotes my understanding and respect for other cultures and people.
3.13 3.01 3.61 3.23 3.08 3.39
The Athletic program has helped me increase my proficiency in:
Time management 3.13 2.99 3.52 3.20 2.96 3.41
Collaboration 3.22 3.15 3.83 3.33 3.05 3.49
Initiative/self-direction 3.30 3.24 3.78 3.34 3.02 3.41
Organizational skills 3.06 2.91 3.57 3.15 2.81 3.12
Problem solving 3.17 2.99 3.74 3.21 2.87 3.25
Responsibility 3.44 3.30 3.74 3.50 3.15 3.45
Leadership 3.40 3.16 3.74 3.47 3.09 3.49
Performance skills 3.40 3.22 3.74 3.52 3.09 3.41
Average 3.26 3.13 3.67 3.35 3.05 3.42
Average by Sport 3.35 3.27

Athletics Program Evaluation 2010-11 to 2014-15
Page | 86
3. What benefits, beyond academic achievements, do students receive from being in Athletics?
Survey Results – Comparison of Sports
Cross Country Baseball
Student Parent Coach Student Parent Coach
N 352 167 17 62 64 11
I feel actively engaged in learning and improving my talent level in the Athletic program.
3.53 3.29 3.53 3.53 3.28 3.91
The coaches/directors who are participating in the Athletic program are valuable to my success in the Athletic program.
3.42 3.20 3.82 3.39 3.17 3.82
The Athletic coaches are aware of my strengths and weaknesses with respect to the Athletic program.
3.27 3.13 3.71 3.37 3.05 3.91
The Athletic program coaches’/coaches’ expectations are clear.
3.44 3.13 3.29 3.47 3.13 3.82
I have access to the resources and materials I need in order to improve my talent with respect to the Athletic program.
3.36 2.97 3.71 3.44 2.94 3.64
I believe that additional support/expenditures (outside of what is provided by CCISD) is necessary for me to be successful in the athletic program.
2.93 2.83 3.18 3.23 3.20 2.91
The Athletic program promotes my understanding and respect for other cultures and people.
3.14 3.07 3.65 3.27 2.91 3.64
The Athletic program has helped me increase my proficiency in:
Time management 3.12 2.98 3.41 3.21 2.81 3.64
Collaboration 3.31 3.08 3.41 3.31 2.98 3.55
Initiative/self-direction 3.31 3.08 3.35 3.34 3.02 3.55
Organizational skills 3.00 2.82 3.06 3.10 2.70 3.55
Problem solving 3.10 2.83 3.29 3.21 2.78 3.64
Responsibility 3.45 3.21 3.47 3.39 3.20 3.73
Leadership 3.34 3.10 3.53 3.34 3.16 3.64
Performance skills 3.49 3.09 3.53 3.44 3.03 3.64
Average 3.28 3.05 3.46 3.34 3.02 3.64
Average by Sport 3.26 3.33

Athletics Program Evaluation 2010-11 to 2014-15
Page | 87
3. What benefits, beyond academic achievements, do students receive from being in Athletics?
Survey Results – Comparison of Sports
Wrestling Swimming
Student Parent Coach Student Parent Coach
N 31 35 9 115 108 6
I feel actively engaged in learning and improving my talent level in the Athletic program.
3.65 2.69 3.33 3.04 2.92 4.00
The coaches/directors who are participating in the Athletic program are valuable to my success in the Athletic program.
3.68 2.40 3.44 3.01 2.86 4.00
The Athletic coaches are aware of my strengths and weaknesses with respect to the Athletic program.
3.42 2.43 3.56 3.04 2.98 4.00
The Athletic program coaches’/coaches’ expectations are clear.
3.61 2.34 3.71 3.16 2.85 4.00
I have access to the resources and materials I need in order to improve my talent with respect to the Athletic program.
3.52 2.23 2.56 3.04 2.63 3.33
I believe that additional support/expenditures (outside of what is provided by CCISD) is necessary for me to be successful in the athletic program.
3.16 3.20 2.78 3.02 3.23 3.33
The Athletic program promotes my understanding and respect for other cultures and people.
3.26 2.74 3.56 2.75 2.78 3.83
The Athletic program has helped me increase my proficiency in:
Time management 3.42 2.43 3.11 2.78 2.97 3.67
Collaboration 3.48 2.63 3.22 2.90 2.94 3.50
Initiative/self-direction 3.52 2.63 3.22 3.01 3.07 3.67
Organizational skills 3.13 2.34 2.89 2.63 2.87 3.67
Problem solving 3.16 2.51 3.11 2.76 2.82 3.33
Responsibility 3.70 2.71 3.44 3.10 3.17 3.83
Leadership 3.65 2.63 3.22 2.97 3.03 3.83
Performance skills 3.61 2.54 3.33 3.12 2.93 3.83
Average 3.46 2.56 3.23 2.96 2.94 3.72
Average by Sport 3.08 3.21
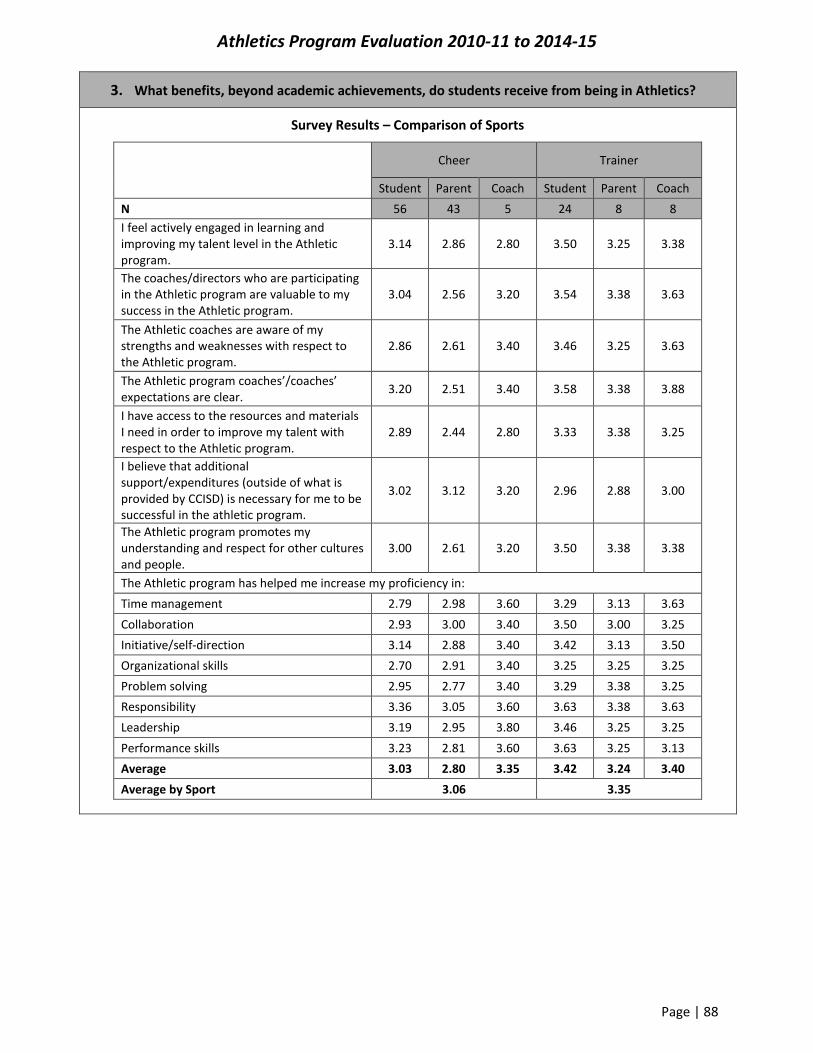
Athletics Program Evaluation 2010-11 to 2014-15
Page | 88
3. What benefits, beyond academic achievements, do students receive from being in Athletics?
Survey Results – Comparison of Sports
Cheer Trainer
Student Parent Coach Student Parent Coach
N 56 43 5 24 8 8
I feel actively engaged in learning and improving my talent level in the Athletic program.
3.14 2.86 2.80 3.50 3.25 3.38
The coaches/directors who are participating in the Athletic program are valuable to my success in the Athletic program.
3.04 2.56 3.20 3.54 3.38 3.63
The Athletic coaches are aware of my strengths and weaknesses with respect to the Athletic program.
2.86 2.61 3.40 3.46 3.25 3.63
The Athletic program coaches’/coaches’ expectations are clear.
3.20 2.51 3.40 3.58 3.38 3.88
I have access to the resources and materials I need in order to improve my talent with respect to the Athletic program.
2.89 2.44 2.80 3.33 3.38 3.25
I believe that additional support/expenditures (outside of what is provided by CCISD) is necessary for me to be successful in the athletic program.
3.02 3.12 3.20 2.96 2.88 3.00
The Athletic program promotes my understanding and respect for other cultures and people.
3.00 2.61 3.20 3.50 3.38 3.38
The Athletic program has helped me increase my proficiency in:
Time management 2.79 2.98 3.60 3.29 3.13 3.63
Collaboration 2.93 3.00 3.40 3.50 3.00 3.25
Initiative/self-direction 3.14 2.88 3.40 3.42 3.13 3.50
Organizational skills 2.70 2.91 3.40 3.25 3.25 3.25
Problem solving 2.95 2.77 3.40 3.29 3.38 3.25
Responsibility 3.36 3.05 3.60 3.63 3.38 3.63
Leadership 3.19 2.95 3.80 3.46 3.25 3.25
Performance skills 3.23 2.81 3.60 3.63 3.25 3.13
Average 3.03 2.80 3.35 3.42 3.24 3.40
Average by Sport 3.06 3.35
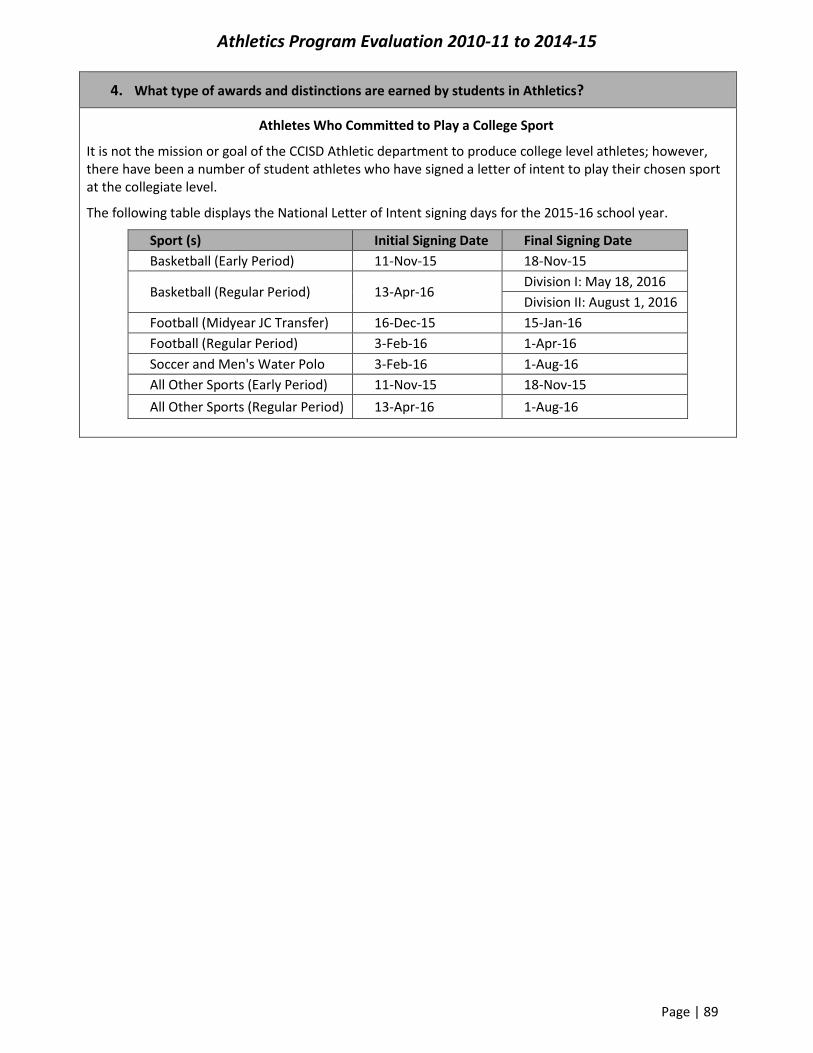
Athletics Program Evaluation 2010-11 to 2014-15
Page | 89
4. What type of awards and distinctions are earned by students in Athletics?
Athletes Who Committed to Play a College Sport
It is not the mission or goal of the CCISD Athletic department to produce college level athletes; however, there have been a number of student athletes who have signed a letter of intent to play their chosen sport at the collegiate level.
The following table displays the National Letter of Intent signing days for the 2015-16 school year.
Sport (s) Initial Signing Date Final Signing Date
Basketball (Early Period) 11-Nov-15 18-Nov-15
Basketball (Regular Period) 13-Apr-16 Division I: May 18, 2016
Division II: August 1, 2016
Football (Midyear JC Transfer) 16-Dec-15 15-Jan-16
Football (Regular Period) 3-Feb-16 1-Apr-16
Soccer and Men's Water Polo 3-Feb-16 1-Aug-16
All Other Sports (Early Period) 11-Nov-15 18-Nov-15
All Other Sports (Regular Period) 13-Apr-16 1-Aug-16

Athletics Program Evaluation 2010-11 to 2014-15
Page | 90
4. What type of awards and distinctions are earned by students in Athletics?
The CCISD Athletic Department annually recognizes all the student athletes who have signed a Letter of Intent prior to the student athlete’s high school graduation date. The following table displays the data for student athletes who signed during their sport’s designated signing period.
CCISD Student Athlete Collegiate Signings
Sport 2013-14 2014-15
Total F M Total F M Total
Baseball 0 8 8 0 12 12 20
Basketball 2 4 6 3 5 8 14
Cross Country 1 0 1 0 0 0 1
Football 0 27 27 0 28 28 55
Golf 1 5 6 2 3 5 11
Soccer 12 4 16 3 3 6 22
Softball 8 0 8 9 0 9 17
Swim 0 0 0 2 4 6 6
Swimming 0 1 1 0 0 0 1
Tennis 0 1 1 1 0 1 2
Track 4 2 6 6 2 8 14
Volleyball 8 0 8 7 0 7 15
Water Polo 0 1 1 1 0 1 2
Wrestling 1 0 1 2 1 3 4
Total 37 53 90 36 58 94 184
Grade 9 2010-11 2011-12 Total
Freshmen Year Athletic Counts 458 812 1270 574 873 1447 2717
Percent of Freshmen Who Signed a College Athletic Commitment
8.1% 6.5% 7.1% 6.3% 6.6% 6.5% 6.8%
Grade 12 2013-14 2014-15 Total
Senior Year Athletic Counts 217 398 615 239 452 691 1306
Percent of Seniors Who Signed a College Athletic Commitment
17.1% 13.3% 14.6% 15.1% 12.8% 13.6% 14.1%
Since 2013-14, the Athletic department in CCISD hosts a reception for all student athletes who have signed a Letter of Intent to participate at the collegiate level. In 2013-14, there were a total of 90 student athletes who signed a Letter of Intent to participate at the collegiate level while there were 94 students who signed a Letter of Intent in 2014-15.
Of the 1270 student athletes who began their CCISD high school careers in 2010-11, 7.1% signed a Letter of Intent. Of the 615 senior student athletes in 2013-14, 14.6% signed a Letter of Intent to participate at the collegiate level.

Athletics Program Evaluation 2010-11 to 2014-15
Page | 91
5. What are the post-secondary outcomes for students who have participated in Athletics?
Results from the post-secondary readiness question was compared for students, parents, and coaches. The coaches’ results was higher than both students and parents with a 3.64 as compared to a 3.22 and 2.80, respectively.
The combined average for the three groups was a 3.22.
My experience in the Athletic program has contributed to my growth in developing future college and/or career goals.
Strongly Disagree
(1) Disagree
(2) Agree
(3) Strongly Agree (4)
Mean Score
Students Results 2.4% 11.4% 48.0% 38.1% 3.22
Parents Result 11.6% 21.4% 42.3% 24.8% 2.80
Coaches Results 0.5% 0.5% 34.1% 65.0% 3.64
Average 3.22
Survey Result – Comparison of Means
Student Parent Coach
Level Int HS
Significant
Int HS
Significant
Int HS
Significant N 965 646 432 727 96 124
Mean Mean Mean Mean Mean Mean
My experience in the Athletic program has contributed to my growth in developing future college and/or career goals.
3.28 3.13 No 2.91 2.74 Yes 3.60 3.66 No
A comparison of the means for the post-secondary readiness question was conducted between levels of secondary grades. There was not a significant difference in both student and coaches groups. There was a significant difference among the intermediate and high school student athlete’s parents.

Athletics Program Evaluation 2010-11 to 2014-15
Page | 92
5. What are the post-secondary outcomes for students who have participated in Athletics?
The chart below and on the following page, displays a side by side comparison of the means for the student, parent, and coach survey results by sport. All coach responses resulted in a higher rating for each sport with student ratings resulting in the next highest rating per sport.
The sport with the highest combined response rate for students, parents, and coaches was the trainers with a 3.45. The sport with the lowest combined response rate for students, parents, and coaches was cheerleading with a 2.88.
The sport in which the coaches felt they had the biggest impact on their students becoming college and career ready was softball at 4.00. The sport in which the coaches felt they had the least impact on their students becoming college and career ready was wrestling at 3.00.
Survey Results – Comparison of Sports
Football Basketball Volleyball
Student Parent Coach Student Parent Coach Student Parent Coach
N 550 380 84 431 343 72 312 157 33
My experience in the Athletic program has contributed to my growth in developing future college and/or career goals.
3.35 2.88 3.56 3.35 2.77 3.67 3.26 2.89 3.70
Average by Sport 3.26 3.26 3.28
I have an impact on my students becoming college and career ready.
3.56
3.65
3.52
Soccer Softball Tennis
Student Parent Coach Student Parent Coach Student Parent Coach
N 135 87 24 23 47 7 159 85 18
My experience in the Athletic program has contributed to my growth in developing future college and/or career goals.
3.22 2.78 3.54 3.13 2.92 3.71 3.11 2.82 3.61
Average by Sport 3.18 3.25 3.18
I have an impact on my students becoming college and career ready.
3.71
4.00
3.56

Athletics Program Evaluation 2010-11 to 2014-15
Page | 93
5. What are the post-secondary outcomes for students who have participated in Athletics?
Survey Results – Comparison of Sports Continued
Golf Track and Field Cross Country
Student Parent Coach Student Parent Coach Student Parent Coach
N 112 76 23 325 185 49 352 167 17
My experience in the Athletic program has contributed to my growth in developing future college and/or career goals.
3.17 3.05 3.74 3.32 2.94 3.61 3.24 2.98 3.29
Average by Sport 3.32 3.29 3.17
I have an impact on my students becoming college and career ready.
3.57
3.57
3.47
Baseball Wrestling Swimming
Student Parent Coach Student Parent Coach Student Parent Coach
N 62 64 11 31 35 9 115 108 6
My experience in the Athletic program has contributed to my growth in developing future college and/or career goals.
3.29 2.86 3.73 3.55 2.23 3.11 2.84 2.74 3.83
Average by Sport 3.29 2.96 3.14
I have an impact on my students becoming college and career ready.
3.64
3.00
3.83
Cheer Trainer
Student Parent Coach Student Parent Coach
N 56 43 5 24 8 8
My experience in the Athletic program has contributed to my growth in developing future college and/or career goals.
2.96 2.49 3.20 3.33 3.38 3.63
Average by Sport 2.88 3.45
I have an impact on my students becoming college and career ready.
3.40
3.25

Athletics Program Evaluation 2010-11 to 2014-15
Page | 94
5. What are the post-secondary outcomes for students who have participated in Athletics?
Percent of Athletes Enrolled in College
2010-11 2011-12 2012-13 2013-14 2014-15* Total
Percent Entered in College 90.9% 88.8% 87.6% 88.8% 79.8% 87.0%
Number of Seniors in Athletics 634 642 711 669 734 3390 Data sources: Student information system, National Student Clearinghouse
* Based on college enrollment in the fall of 2015
The table above displays the number of senior athletes during the course of this study and the percent who enrolled in at least one semester of college since graduating from high school. The number of senior athletes includes all sports, cheerleaders, and trainers. The National Student Clearinghouse has more than 3,600 participating colleges and universities. Those participants enroll 98% of all students in public and private U.S. institutions. The data is based on a student enrolling in college at any point after they graduate from high school. Students who graduated in 2011 have more opportunities to enroll in college than students who have recently graduated from high school in 2015.
The percentage of athletes who have enrolled in college after high school graduation range from 79.8% to 90.9% during the five year period of this study with an overall average of 87.0%.
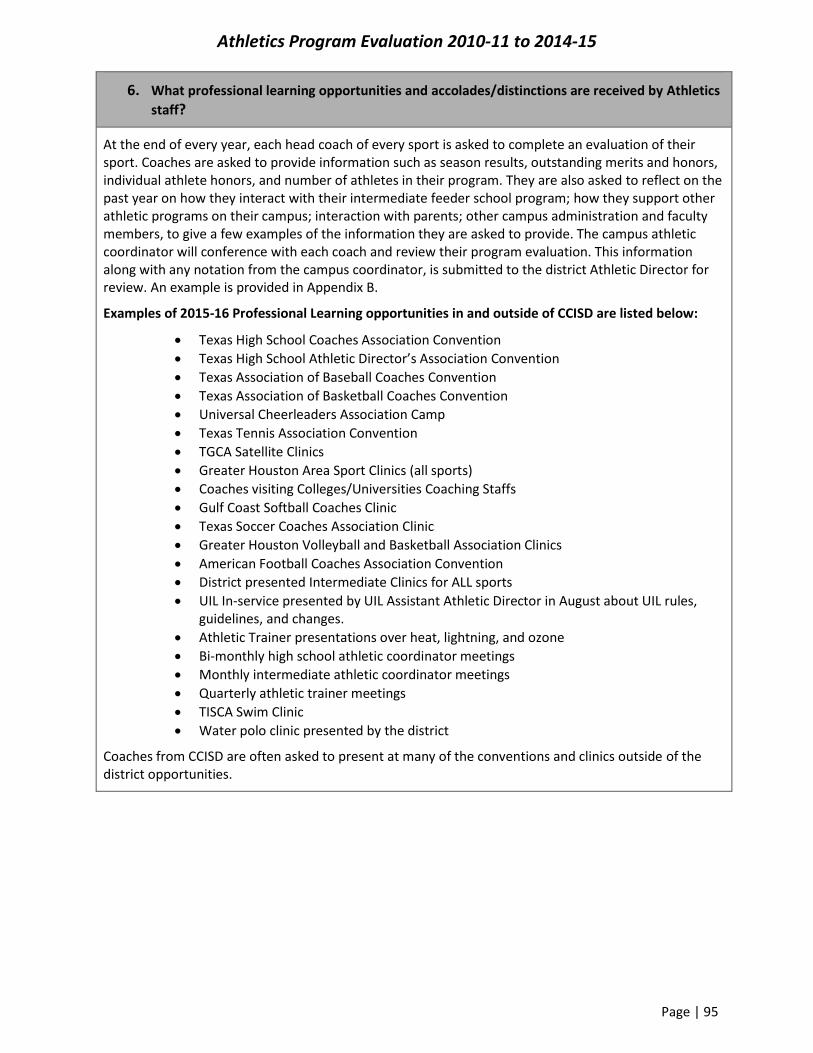
Athletics Program Evaluation 2010-11 to 2014-15
Page | 95
6. What professional learning opportunities and accolades/distinctions are received by Athletics
staff?
At the end of every year, each head coach of every sport is asked to complete an evaluation of their sport. Coaches are asked to provide information such as season results, outstanding merits and honors, individual athlete honors, and number of athletes in their program. They are also asked to reflect on the past year on how they interact with their intermediate feeder school program; how they support other athletic programs on their campus; interaction with parents; other campus administration and faculty members, to give a few examples of the information they are asked to provide. The campus athletic coordinator will conference with each coach and review their program evaluation. This information along with any notation from the campus coordinator, is submitted to the district Athletic Director for review. An example is provided in Appendix B.
Examples of 2015-16 Professional Learning opportunities in and outside of CCISD are listed below:
Texas High School Coaches Association Convention
Texas High School Athletic Director’s Association Convention
Texas Association of Baseball Coaches Convention
Texas Association of Basketball Coaches Convention
Universal Cheerleaders Association Camp
Texas Tennis Association Convention
TGCA Satellite Clinics
Greater Houston Area Sport Clinics (all sports)
Coaches visiting Colleges/Universities Coaching Staffs
Gulf Coast Softball Coaches Clinic
Texas Soccer Coaches Association Clinic
Greater Houston Volleyball and Basketball Association Clinics
American Football Coaches Association Convention
District presented Intermediate Clinics for ALL sports
UIL In-service presented by UIL Assistant Athletic Director in August about UIL rules, guidelines, and changes.
Athletic Trainer presentations over heat, lightning, and ozone
Bi-monthly high school athletic coordinator meetings
Monthly intermediate athletic coordinator meetings
Quarterly athletic trainer meetings
TISCA Swim Clinic
Water polo clinic presented by the district
Coaches from CCISD are often asked to present at many of the conventions and clinics outside of the district opportunities.

Athletics Program Evaluation 2010-11 to 2014-15
Page | 96
6. What professional learning opportunities and accolades/distinctions are received by Athletics
staff?
A sampling of awards and distinctions earned by the coaches in CCISD:
Baseball:
Coached the Houston Area Baseball Coaches
Association All-Star Game 2015.
Greater Houston Area All Star coach
Basketball:
Demonstrator for Hands Only CPR for coaches/faculty.
Biggest award is the relationships & success of my athletes is better than any award.
I have two former athletes headed to law school and one that will be a coach... These are more important to me than the trophy!
Coach of the Year/Creekside
Houston Area Basketball Coaches Association Coach in 2015. Spoke at Lee College's Grow the Game clinic in July 2015.
Cheerleading:
Thanks from many students and/or parents - the best accolades ever!
Football:
Spoke at the Greyhound football clinic
All Star Football Team Coach
Greater Houston Area All Star coach
Back to Back Bi-District Champions
2015 Houston Touchdown Coach of the Year Finalist
2015 UIL Sponsor Excellence Award Nominee Soccer:
County Coach of the Year
Galveston County Coach of the Year 2015
Golf:
Facilitate Intermediate Coaches day
Speaker and leader at FCA Golf Camp in Abilene Texas
The High School coaches have an opportunity to give the Intermediate coaches a clinic each year.
Athletes/Team:
2014 Regional Medalist Qualifier
2015 District Team Runner-up
2015 Regional Team Qualifier

Athletics Program Evaluation 2010-11 to 2014-15
Page | 97
6. What professional learning opportunities and accolades/distinctions are received by Athletics
staff?
Swimming:
State Coach of the Year Water Polo
Regional Boy Coach of the Year Water Polo
Coach at Junior Olympics, Coach of local club
Boys Regional Swimming Coach of the Year-2014 and 2015
Girls Regional Water Polo Coach of the Year-2015 (co- w/Baytown)
Tennis:
District Coach of the year 2012, 2014
Speaker at TTCA convention 2012
Trainers:
My students referred to me as "Dad" when we were at the GHATS workshop and that is a great honor.
2014-Greater Houston Athletic Trainers' Society, Hall of Honor Inaugural Inductee, and recipient of the Logan Wood Award for Lifetime Meritorious Service to Athletic Training
2015-Southwest Athletic Trainers' Association. (Texas & Arkansas AT group) Hall of Fame Inductee
2013-present; Board Secretary for State of Texas, Advisory Board of Athletic Trainers, appointee of Governor
Volleyball:
Co-District Coach of the Year, GHVCA All Star Coach, Speaker at the GHVCA clinic
2015 24-6A - Co-Coach of the year
2015 Galveston County Coach of the Year

Athletics Program Evaluation 2010-11 to 2014-15
Page | 98
6. What professional learning opportunities and accolades/distinctions are received by Athletics
staff?
Coaches were asked about the professional learning opportunities they receive with respect to whether it supports and improves their classroom instruction. There was a 95% response rate who agreed or strongly agreed that it supports classroom instruction with an overall mean of 3.46. There was a 91.8% response rate who agreed or strongly agreed that it improves classroom instruction with an overall mean of 3.30.
Coach Survey
Strongly Disagree
(1) Disagree
(2) Agree (3) Strongly Agree (4)
Mean Score
The Athletic professional learning program supports classroom instruction.
0.9% 4.1% 43.6% 51.4% 3.46
The Athletics professional learning program improves classroom instruction.
0.9% 7.3% 52.7% 39.1% 3.30
Coach Survey – Comparison Across Sports
Football Basketball Volleyball Soccer Softball Tennis Golf
N 84 72 33 24 7 18 23
Mean Mean Mean Mean Mean Mean Mean
The Athletic professional learning program supports classroom instruction.
3.38 3.60 3.52 3.50 3.86 3.44 3.65
The Athletics professional learning program improves classroom instruction.
3.20 3.42 3.36 3.38 3.86 3.39 3.44
Average 3.29 3.51 3.44 3.44 3.86 3.42 3.55
T&F
Cross Country
Baseball Wrestling Swimming Cheer Trainer
N 49 17 11 9 6 5 8
Mean Mean Mean Mean Mean Mean Mean
The Athletic professional learning program supports classroom instruction.
3.31 3.24 3.64 2.89 3.50 3.40 2.88
The Athletics professional learning program improves classroom instruction.
3.16 3.00 3.36 2.78 3.33 3.20 3.00
Average 3.24 3.12 3.50 2.84 3.42 3.30 2.94
The sport with the highest combined response rate was softball with an average rating of 3.86. The sport with the lowest combined response rate was wrestling with an average rating of 2.84.

Athletics Program Evaluation 2010-11 to 2014-15
Page | 99
7. What are revenues and expenditures for the Athletics program?
Class and Extracurricular Fees Fees for classes range from $0 to $60 for the year. Extracurricular fees for intermediate students is $30 for the first student and $20 for each additional family member up to three additional members. High school student fees are $50 for the first student and $30 for each family member up to three additional members. Economically disadvantaged students have fees reduced or waived. Extracurricular fees began in 2012-13 in CCISD and ended in 2015-16.
The CCISD Finance Department has provided data for the intermediate student and high school student activity funds. The chart below shows the revenue and expenses each year for both levels and includes boys, girls, and co-ed activity accounts.
Intermediate and High School Athletic Activity Fund Revenues and Expenditures
High School Intermediate
2010-11 Revenue $1,056,721 $274,207
Expenses $957,136 $244,561
2011-12 Revenue $1,149,030 $316,468
Expenses $1,262,998 $315,675
2012-13 Revenue $1,204,092 $272,132
Expenses $1,118,127 $276,089
2013-14 Revenue $1,261,463 $295,715
Expenses $1,284,830 $286,053
2014-15 Revenue $1,340,774 $367,500
Expenses $1,305,848 $381,363
Total Revenue $6,012,081 $1,526,022
Expenses $5,928,939 $1,503,742
Financial data provided by CCISD Finance Department
The revenues per year for high school activity accounts ranged from $1,056,721 to $1,340,774, with a total of $6,012,081. The revenues per year for intermediate activity accounts ranged from $272,132 to $367,500, with a total of $1,526,022. The expenditures per year for high school activity accounts ranged from $957,136 to $1,305,848, with a total of $5,928,939. The expenditures per year for intermediate activity accounts ranged from $244,561 to $381,363, with a total of $1,503,742.

Athletics Program Evaluation 2010-11 to 2014-15
Page | 100
7. What are revenues and expenditures for the Athletics program?
District Level Athletics General Fund Expenditures
General Fund 2011 2012 2013 2014 2015 Total
Supplies and Miscellaneous $628,804 $552,114 $561,832 $600,429 $579,791 $2,922,969
District Buses $328,601 $332,271 $336,697 $302,337 $286,360 $1,586,267
Student Travel $72,650 $68,340 $93,013 $80,152 $111,375 $425,530
Student Travel - Tennis Boys $1,170 $1,460 $1,720 $1,545 $1,630 $7,525
Student Travel - Tennis Girls $1,320 $1,750 $1,700 $1,766 $1,680 $8,216
Student Travel Baseball $1,204 $1,503 $1,623 $1,875 $1,300 $7,505
Student Travel Bask Boys $1,240 $1,315 $1,670 $1,640 $1,620 $7,485
Student Travel Bask Girls $1,470 $1,730 $2,474 $1,750 $1,765 $9,189
Student Travel Golf Boys* $28,415 $29,185 $26,475 $26,494 $26,290 $136,859
Student Travel Golf Girls* $22,074 $25,443 $27,016 $25,052 $24,770 $124,355
Student Travel Soccer Boys $1,035 $1,385 $1,290 $1,665 $1,690 $7,065
Student Travel Soccer Girls $1,160 $1,735 $2,135 $1,710 $1,720 $8,460
Student Travel Softball $1,530 $1,120 $1,720 $1,560 $1,640 $7,570
Student Trvl - Track Boys $2,375 $2,284 $2,580 $1,920 $2,490 $11,649
Student Trvl - Track Girls $3,155 $2,695 $2,370 $2,750 $3,172 $14,142
Student Trvl - Volleyball $1,690 $1,760 $1,900 $1,940 $1,900 $9,190
Student Trvl - Watersport $5,937 $3,559 $1,566 $3,236 $2,998 $17,296
Student Trvl - Wrest Boys - - - $4,050 $4,600 $8,650
Student Trvl - Wrest Girls - - - $2,825 $4,250 $7,075
Student Trvl - Wrestling $3,505 $3,105 $3,230 - - $9,840
Student Travel Total $478,531 $480,640 $509,179 $464,268 $481,250 $2,413,868
Financial data provided by CCISD Finance Department *Golf travel expenses include entry fees to tournaments and van rentals to participate in tournaments

Athletics Program Evaluation 2010-11 to 2014-15
Page | 101
7. What are revenues and expenditures for the Athletics program?
District Level Athletics General Fund Expenditures Continued
General Fund 2011 2012 2013 2014 2015 Total
Supplies - Baseball $23,778 $22,106 $21,753 $21,935 $72,071* $161,643
Supplies - Basket Boys $39,150 $39,352 $49,346** $35,961 $53,887** $217,695
Supplies - Basket Girls $38,862 $35,495 $39,287 $39,063 $39,515 $192,222
Supplies – Cheerleaders - - - - $269 $269
Supplies - Football $143,249 $134,820 $133,029 $133,710 $141,482 $686,289
Supplies - Golf Boys $4,200 $2,867 $4,287 $4,822 $5,239 $21,415
Supplies - Golf Girls $9,471 $6,101 $3,990 $4,817 $6,393 $30,771
Supplies - Postage $67 $111 - $10 - $188
Supplies - Soccer Boys $19,590 $18,185 $17,865 $15,705 $17,965 $89,310
Supplies - Soccer Girls $19,178 $18,431 $18,563 $17,973 $18,505 $92,650
Supplies - Softball $21,849 $20,541 $21,541 $20,674 $20,489 $105,094
Supplies - Tennis Boys $15,840 $15,115 $15,652 $15,036 $14,611 $76,254
Supplies - Tennis Girls $18,605 $14,324 $17,149 $14,189 $14,632 $78,898
Supplies - Track Boys $36,985 $31,449 $29,307 $30,470 $29,838 $158,048
Supplies - Track Girls $35,436 $31,202 $31,034 $30,415 $32,654 $160,742
Supplies - Trainers $46,686 $44,318 $45,775 $45,103 $45,007 $226,889
Supplies - Volleyball $39,344 $35,613 $35,248 $36,969 $37,032 $184,207
Supplies - Watersports $15,643 $14,538 $12,130 $14,425 $13,651 $70,387
Supplies - Wrestling $18,065 $20,245 $19,644 $23,029 $21,695 $102,678
Misc Expenses Track Girls - $635 $2,018 $697 - $3,350
Misc Expenses - Track Boys - - $930 $1,298 - $2,228
Supplies by Sport $545,997 $505,448 $518,549 $506,300 $584,937 $2,661,230
Total Expenses $1,653,331 $1,538,201 $1,589,559 $1,570,997 $1,645,978 $7,998,067
Financial data provided by CCISD Finance Department * each high school campus received additional funding for new infield dirt more suitable for baseball and softball ** each campus was supplied with additional funding for equipment to be used by boys and girls basketball programs
2011 2012 2013 2014 2015 Total
Payroll Related Expenses $2,973,890 $3,085,488 $3,117,355 $3,038,493 $3,170,442 $15,385,668
Financial data provided by CCISD Finance Department
General fund supplies and miscellaneous expenditures include supplies, furniture, equipment and equipment repair, travel, membership dues, food, and insurance. Cheerleading has become a sanctioned UIL sport in 2014-15 with their first state competition held in 2015-16. Funding has come through the campus prior to the 2015-16 school year. General fund expenditures ranged from $1,538,201 to $1,653,331.
Payroll related expenses include salaries, extra duty pay, overtime, and related expenses. Payroll expenses include workers for games and tournaments such as time keepers, bookkeepers, ticket takers, as well as officials’ fees. Payroll expenses ranged from $2,973,890 to $3,170,442.

Athletics Program Evaluation 2010-11 to 2014-15
Page | 102
7. What are revenues and expenditures for the Athletics program?
Athletics Secondary Stipends
Intermediate 2011-12 2012-13 2013-14 2014-15
Football Head Coach $4,800 $4,800 $4,800 $4,800
Assistant Coach $3,000 $3,000 $3,000 $3,200
Basketball Head Coach $2,500 $2,500 $2,500 $2,500
Assistant Coach $1,850 $1,850 $1,850 $1,850
Volleyball Head Coach $2,500 $2,500 $2,500 $2,500
Assistant Coach $1,850 $1,850 $1,850 $1,850
All Sports Campus Coordinator $500 $500 $500 $1,050
Track Head Coach $2,300 $2,300 $2,300 $2,300
Assistant Coach $1,850 $1,850 $1,850 $1,850
Cross Country
Head Coach $2,300 $2,300 $2,300 $2,300
Assistant Coach $1,850 $1,850 $1,850 $1,850
Tennis Head Coach $2,300 $2,300 $2,300 $2,300
Assistant Coach $1,850 $1,850 $1,850 $1,850
Golf Head Coach $2,300 $2,300 $2,300 $2,300
Assistant Coach $1,850 $1,850 $1,850 $1,850 Data source: CCISD Benefits Department
During the 2011-12 year, athletic stipends at the intermediate level ranged from $1,850 to $4,800 with Campus Coordinators receiving an additional $500. During the 2014-15 year, athletic stipends at the intermediate level ranged from $1,850 to $4,800 with Campus Coordinators receiving an additional $1,050.

Athletics Program Evaluation 2010-11 to 2014-15
Page | 103
7. What are revenues and expenditures for the Athletics program?
Athletics Secondary Stipends Continued
High School 2011-12 2012-13 2013-14 2014-15
Football
Head Coach $16,250 $16,250 - -
Campus Coordinator $8,500 $8,500 - -
Offensive/Defensive Coordinator
$7,850 $7,850 $7,850 $8,000
Varsity Assistant Coach $6,700 $6,700 $6,700 $6,700
Jr. Varsity Assistant Coach $5,900 $5,900 $5,900 $6,300
Sophomore Assistant Coach $5,900 $5,900 $5,900 $6,300
Freshman Assistant Coach $5,900 $5,900 $5,900 $6,300
Basketball
Head Coach $8,000 $8,000 $8,000 $8,250
Varsity Assistant/JV Coach $5,000 $5,000 $5,000 $5,000
Sophomore Assistant Coach $2,850 $2,850 $2,850 $2,900
Freshman Assistant Coach $2,850 $2,850 $2,850 $2,900
Volleyball
Head Coach $7,000 $7,000 $7,000 $7,200
Varsity Assistant/JV Coach $4,450 $4,450 $4,450 $4,600
Freshman Assistant Coach $4,450 $4,450 $4,450 $3,600
Swimming Head Coach $5,750 $5,750 $5,750 $5,750
Assistant Coach $2,650 $2,650 $2,650 $2,650
Diving Head Coach - District Wide $4,000 $4,000 $4,000 $4,190
Water Polo Head Coach $3,500 $3,500 $3,500 $3,500
Assistant Coach $2,650 $2,650 $2,650 $2,650
All Sports
Campus Coordinator $8,500 $8,500 $8,500 $8,500
Trainer $10,250 $10,250 $10,250 $10,375
Open Gym $2,000 $2,000 $2,000 $2,000
Track Head Coach $4,500 $4,500 $4,500 $4,800
Assistant Coach $3,000 $3,000 $3,000 $3,200
Cross Country Head Coach $4,000 $4,000 $4,000 $4,200
Assistant Coach $3,000 $3,000 $3,000 $3,000
Soccer Head Coach $6,000 $6,000 $6,000 $6,050
Assistant Coach $3,000 $3,000 $3,000 $3,200
Tennis Head Coach $5,750 $5,750 $5,750 $6,000
Assistant Coach $2,650 $2,650 $2,650 $2,850
Baseball
Head Coach $5,000 $5,000 $5,000 $5,400
Varsity Assistant Coach $3,200 $3,200 $3,200 $3,350
Jr. Varsity Assistant Coach $3,200 $3,200 $3,200 $3,250
Sophomore Assistant Coach $3,200 $3,200 $3,200 $3,250 Data source: CCISD Benefits Department - Head Football Coach and Campus Coordinators no longer receive a stipend. They have extended contract days.

Athletics Program Evaluation 2010-11 to 2014-15
Page | 104
7. What are revenues and expenditures for the Athletics program?
Athletics Secondary Stipends Continued
High School 2011-12 2012-13 2013-14 2014-15
Softball
Head Coach $5,000 $5,000 $5,000 $5,400
Varsity Assistant Coach $3,200 $3,200 $3,200 $3,350
Jr. Varsity Assistant Coach $3,200 $3,200 $3,200 $3,250
Golf Head Coach $5,200 $5,200 $5,200 $5,200
Weightlifting Head Coach $2,250 $2,250 $2,250 $2,500
Wrestling Head Coach $4,250 $4,250 $4,250 $4,750
Assistant Coach $2,000 $2,000 $2,000 $2,200 Data source: CCISD Benefits Department
During the 2011-12 year, athletic stipends at the high school level ranged from $2,000 to $16,250 with Campus Coordinators receiving an additional $8,500. During the 2014-15 year, athletic stipends at the intermediate level ranged from $2,200 to $10,375. Head football coaches and Campus Coordinators receive additional contract days with no additional stipend.

Athletics Program Evaluation 2010-11 to 2014-15
Page | 105
Appendix A
CCISD 2014-15 Coaches Campus Sport Evaluation
Campus:
Sport:
Head Coach:
# of Years:
Varsity Assistant(s):
Freshman Assistant:
Season results:
Merits and Honors:
Individual Honors:
# of athletes by grade level:
Increase/decrease in #’s:
Intermediate program involvement:
Shared athlete:
Character development Program:
Community Service:
Discipline Problems:
Handling discipline problems:
Preventing parent issues:
Parent issues:
Describe parent issues this year:
Eligibility Strategies
Relationship with campus staff:
Supporting other campus programs:
1 year – Program:
1 year- Athletes:
1 year Professionally:
3 year – Program:
3 year- Athletes:
3 year Professionally:
Program needs:
Self rating:
Rating explanation

Athletics Program Evaluation 2010-11 to 2014-15
Page | 106
Appendix B
The Connecticut Interscholastic Athletic Conference Standards
Standard I Program Guiding Principles
The athletic program has developed a mission statement that clearly defines what the school/program is seeking to achieve and delineates the expectations of the program for student athletes, coaches, school administration, parents, and the community. The expectations of the athletic program are the fundamental goals by which the school assesses the effectiveness of the athletic program and services provided.
1. The athletic program mission statement and expectations shall be developed by all stakeholders in the program including, but not limited to, coaches, student-athletes, parents, board of education, community members, coaches, and school administrators. The mission is to be clearly linked to the academic mission of the school and district.
2. The mission shall reflect the core values, beliefs, and goals of the athletic program.
3. The athletic program shall define expectations as they relate to the athletic program for coaches, student-athletes, school administrators, parents, board of education, and the community.
4. The mission and expectations of the athletic program shall be the basis upon which all decisions are made relative to program.
5. The athletic mission and expectations shall be reviewed, revised/reaffirmed bi-annually to assure they reflect the needs of the student athlete, the school and the community.
6. The athletic mission and expectations shall be published and distributed throughout the school community in a manner that ensures that all stakeholders are aware of athletic department’s goals.
Standard II Program Curriculum
The athletic program has developed and implemented programs, activities and curricula that enable the school to achieve its athletic mission and expectations. Embedded in this standard, in addition to sport specific skill development and the promotion of academic achievement, are the teaching and endorsement of sportsmanship, character development, ethics, values, living a healthy and drug free lifestyle and appropriate behavior for all student-athletes, coaches, parents, and spectators.
1. Curricula shall be developed and instituted that advance sport specific training, conditioning, and skill development in all sports.
2. Curriculum units/modules shall be developed and taught to all student-athletes and coaches in a formal setting on the following topics: Sportsmanship, appropriate behavior, ethics, values, character development, leadership, and development of healthy lifestyles.
3. Specific programs and activities shall be developed and implemented by each school and athletic department to address the proper behavior of all student-athletes, coaches, parents and spectators at athletic contests.
4. The athletic program shall support and monitor the academic achievement of each student-athlete throughout the high school years.

Athletics Program Evaluation 2010-11 to 2014-15
Page | 107
Appendix B
5. The athletic department promotes a program that is safe, positive, respectful, and supportive and fosters the benefits of multi-sports athletics and the disadvantages of sports specialization.
6. The athletic department provides leadership training to all captains and team leaders.
Standard III Program Resources and Equity The athletic program is provided sufficient support and resources by its governing body and the community to assure the achievement of the athletic mission and expectations. Equitable resources, facilities, and opportunities are afforded to all student-athletes and sports programs including intramural programs for students not involved in interscholastic sports. The athletic program is in compliance with all state and federal mandates.
1. The athletic program shall be provided sufficient funding to assure the program provides and maintains quality athletic opportunities, personnel, services, facilities, equipment, transportation, uniforms, teaching materials and supplies to support each sport offering.
2. All athletic equipment including uniforms shall be adequate, properly maintained, refurbished or replaced on a prescribed schedule for all teams.
3. The athletic program shall allocate resources, programs and services for all sports equitably.
4. The athletic program shall be in compliance with all state and federal mandates including coaching certification and Title IX.
5. The athletic program provides athletic opportunities to all interested students including special needs students.
6. The athletic program provides equal opportunities for male and female athletes.
7. Athletic programs and activities exist for those students not involved in competitive interscholastic athletics.
8. Funding parity shall exist among all sports programs and support from sources such as booster clubs is considered when allocations are determined.
9. All athletic facilities are properly maintained to ensure the safety of student-athletes and the school shall have a long-range facilities plan to upgrade, improve and to add to existing facilities as necessary.
Standard IV Program Administration The athletic program has the administrative structure, policies, procedures, and personnel in place to allow for the attainment of the athletic mission and expectations. The program encourages the active involvement of coaches, student-athletes, parents, booster clubs, and the community in decision-making to promote an atmosphere of participation and ownership. The accomplishments of the program, the student-athletes and the coaches are regularly acknowledged and celebrated. The program has a clearly defined formative and summative personnel evaluation plan in place which is designed to enhance the professional growth of all coaches. The athletic program promotes and supports all CIAC regulations and by-laws including those of the national Federation of State High Schools and is in compliance with all state and federal statutes.
Athletics Program Evaluation 2010-11 to 2014-15
Page | 108
Appendix B
1. The school/district shall provide appropriate personnel with adequate time and resources to assure the effective administration of the athletic program.
2. The athletic program has clearly defined policies and procedures in place for the effective administration of the program.
3. The athletic program has a student-athlete/parent handbook and contract that clearly defines all expectations for student-athletes including, but not limited to, policies on sportsmanship, hazing, taunting, substance use and abuse, and is provided to all student-athletes and their parents.
4. The athletic department provides to all coaches, including volunteer coaches, a handbook which outlines all expectations and procedures including CIAC rules and regulations and the responsibility of the coach to promote and model good sportsmanship.
5. The athletic program shall have written guidelines for all booster clubs explaining their role in the program.
6. The athletic program shall have written guidelines and procedures for all athletic events including emergency evacuation measures in line with the CIAC Manual for Tournament Operations and Guidelines for Crowd Control and Security.
7. The athletic program shall have programs in place to educate players, coaches, students, parents and spectators on sportsmanship and proper behavior at all sporting events.
8. The athletic program shall have a formal evaluation plan for all coaches including assistant and volunteer coaches that promote the professional growth and competence of all coaches.
Standard V Program And Player Evaluation The athletic program has an ongoing program evaluation procedure in place designed to measure the department’s success in achieving its mission and expectations and the developmental skill growth of each student-athlete. The skill growth of athletes is formally assessed at the end of each season and improvement plans are co-developed by the coach and athlete. The athletic department reports its progress in meeting its mission and expectations to the school administration and develops action plans for improvement.
1. The athletic program shall have a formalized process in place to assess the achievement of its mission and expectations. Data collection and review procedures shall be in place to support the department’s findings.
2. The athletic department shall periodically employ surveys and focus groups to garner information from parents, students, and coaches regarding the success of the athletic department in meeting its mission.
3. The athletic department shall report the results of its efforts to meet the mission and expectations annually.
4. The athletic department shall develop action plans for improvement or enhancement of the program on an annual basis.
5. The athletic department shall develop and implement a player assessment program that is designed to set and evaluate individual performance goals for each student-athlete on a seasonal basis.

Athletics Program Evaluation 2010-11 to 2014-15
Page | 109
References
Massoni, Erin (2011). Positive Effects of Extra Curricular Activities on Students, ESSAI: Vol. 9, (27), pages 1-4.
About the UIL. (n.d.) retrieved July 18, 2016, from http://www.uiltexas.org/about/about (a)
Purpose the UIL. (n.d.) retrieved July 18, 2016, from http://www.uiltexas.org/about/purpose (b)
The Connecticut Association of Schools, the Connecticut Interscholastic Athletic Conference. Standards of an Exemplary Interscholastic High School Athletic Program and Program Evaluation Model. Retrieved on May 28, 2015, from https://docs.google.com/viewer?a=v&pid=sites&srcid= Y2xpbnRvbnB1YmxpYy5uZXR8bW9yZ2FufGd4OjY2NmZkOTRiNWUwODgyNzk

Athletics Program Evaluation 2010-11 to 2014-15
Page | 110
Superintendent’s Recommendations
1. We will investigate additional professional learning opportunities for all coaches by August 2017.
2. We will explore the possibility of splitting Swimming/Water Polo Coach into two separate coaching positions in order to alleviate the time commitments of this position and enhance the ability to recruit and retain coaches for each sport.