ati ditibtiactive distribution management workshop - …smartgrid.epri.com/doc/active distribution...
TRANSCRIPT

A ti Di t ib tiActive Distribution ManagementWorkshopWorkshop
CIGRE Canada 2009 Symposium
Mark McGranaghan - EPRIR D EPRIRoger Dugan – EPRIChad Abbey - IREQ
October 4, 2009Toronto

Agenda
•Active Distribution Management Overview
•Modeling Considerations and OpenDSS
•Examples of Active Distribution Management and•Examples of Active Distribution Management and CIGRE C6.11 Activities
IEEE Di t ib ti A t ti W ki G• IEEE Distribution Automation Working Group
•Demonstrations
2© 2007 Electric Power Research Institute, Inc. All rights reserved.
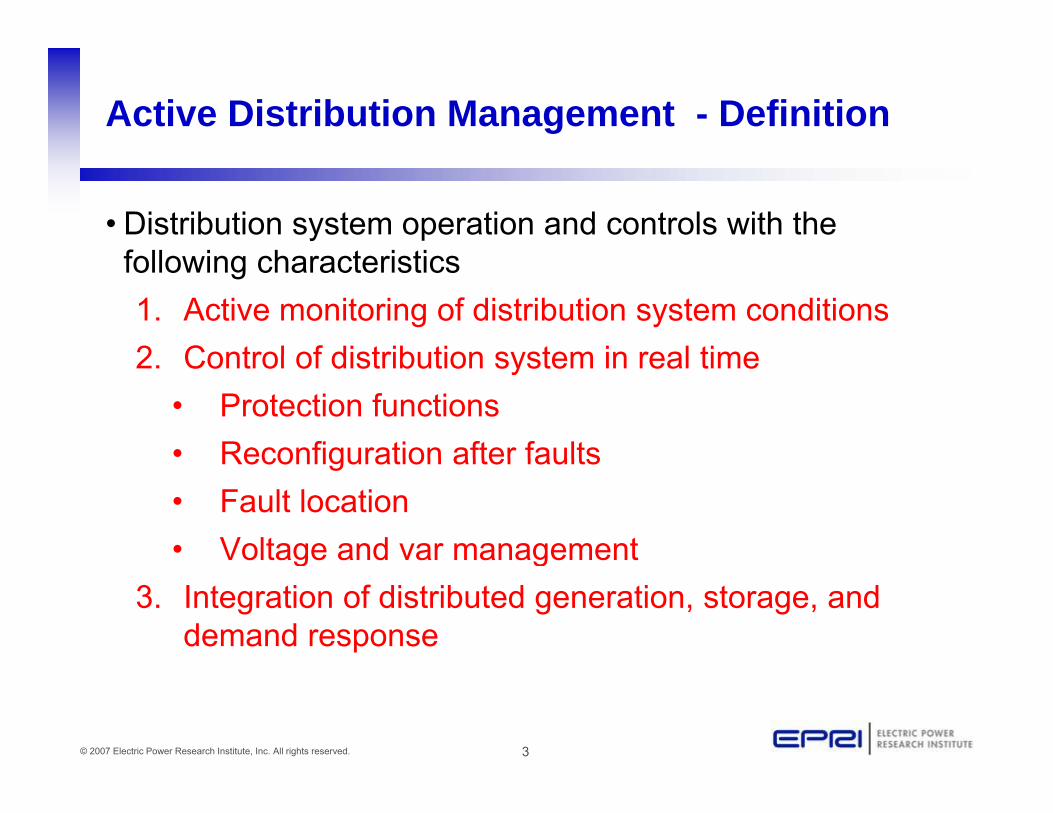
Active Distribution Management - Definition
• Distribution system operation and controls with the f ll i h t i tifollowing characteristics1. Active monitoring of distribution system conditions2 Control of distribution system in real time2. Control of distribution system in real time
• Protection functions• Reconfiguration after faultsReconfiguration after faults• Fault location• Voltage and var managementg g
3. Integration of distributed generation, storage, and demand response
3© 2007 Electric Power Research Institute, Inc. All rights reserved.

Developing a Roadmap for Active Distribution Managementg
System Topologies(Configuration protection control)(Configuration, protection, control)
Communication architectureand information model developmentp
New technologies(power electronics, IUT, etc.) ADA
Sensors and monitoring systems(intelligent monitoring)
Advanced distribution controls(coordinated distributed intelligence)
4© 2007 Electric Power Research Institute, Inc. All rights reserved.
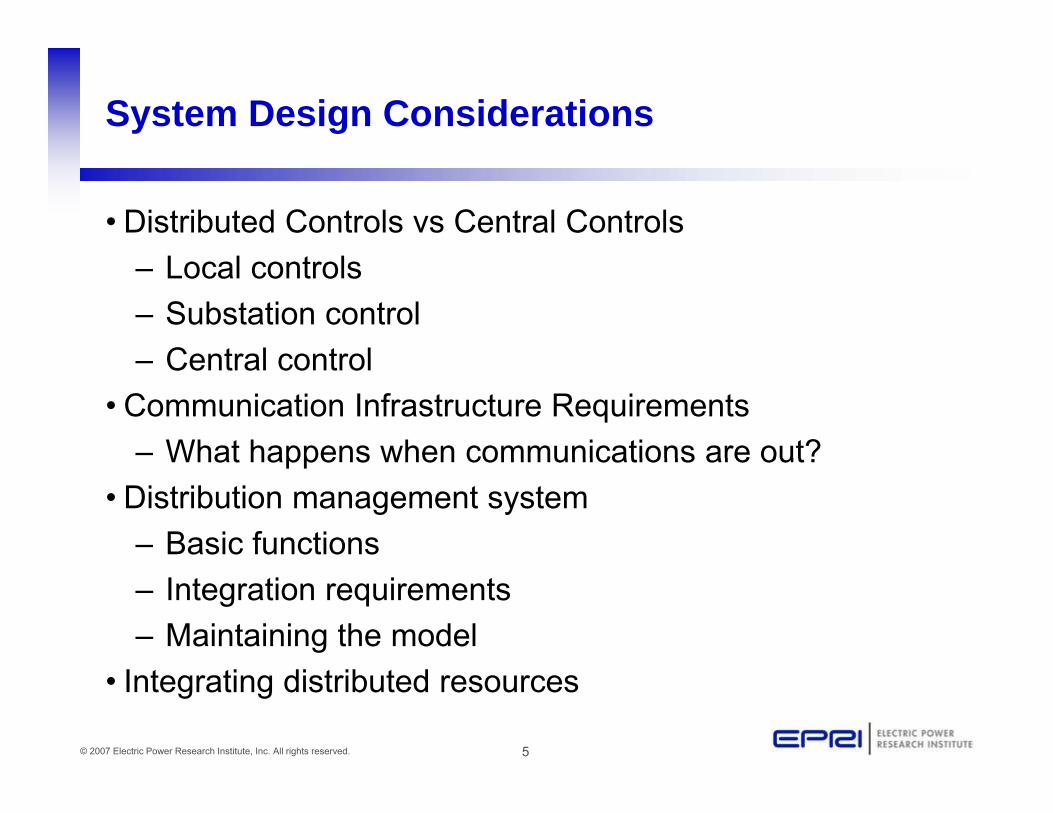
System Design Considerations
• Distributed Controls vs Central Controls– Local controls– Substation control
Central control– Central control• Communication Infrastructure Requirements
– What happens when communications are out?What happens when communications are out?• Distribution management system
– Basic functions– Integration requirements– Maintaining the model
5© 2007 Electric Power Research Institute, Inc. All rights reserved.
• Integrating distributed resources

Before Distribution Automation (courtesy of Alabama Power)( y )
6© 2007 Electric Power Research Institute, Inc. All rights reserved.

General flow of Distribution Automation Implementation
DistributionDistribution
Substation Automation
Feeder Automation andIntegration of DER
Customer SystemIntegrationg
Automation benefits and costs can be evaluated in stages but consider infrastructure requirements for each stage
d j i t b fit f th i f t t
7© 2007 Electric Power Research Institute, Inc. All rights reserved.
and joint benefits for the infrastructure

More detailed flow of implementation -roadmapp
Information System Infrastructure for Managing Data and Providing Basis for Applications
Communication Infrastructure to the
Substations
Communication Infrastructure to the
Feeders
Communication Infrastructure to the
Customers
Substation Monitoring Feeder Monitoring Customer Systemand Applications (SCADA, Fault
Location, Equipment
Feeder Monitoring and Automation
(SCADA, Automatic Reconfiguration,
Optimization)
Customer System Integration (AMI,
Demand Response, DER,
Energy Efficiency)
8© 2007 Electric Power Research Institute, Inc. All rights reserved.
Diagnostics, etc.) Optimization) Energy Efficiency)

Substation Automation and Substation Integrationg
• Most significant implementation of automation today• Many different communication technologies and protocols –
migration to UCA/IEC 61850• Significant improvement inSignificant improvement in
operations and reliability is possible from substation automation alone.
9© 2007 Electric Power Research Institute, Inc. All rights reserved.

10© 2007 Electric Power Research Institute, Inc. All rights reserved.

Using substation monitoring for fault location
Single-Phase Fault Evolves into Two-Phase
0
20
tage
(kV
)
Va Vb Vc Ia Ib Ic
-20
0
5
Vol
nt (k
A)
17.5
Single-Phase Fault Evolves into Two-Phase
V)
Va Vb Vc Ia Ib Ic XTF
-5
0
0.00 0.05 0.10 0.15
Cur
ren
Time (s)
10.012.515.0
3
Vol
tage
(kV
(kA
)
EPRI/Electrotek PQView®( )
1
2
5 0
7.5
10.0
Cur
rent
nc
e (o
hms)
11© 2007 Electric Power Research Institute, Inc. All rights reserved.
1B 2AB2.195 2.2162.5
5.0
0.05 0.10 0.15
Rea
cta
Time (s)

Automating Distribution Feeder Circuits –Benefits
• More flexible operation of distribution systemdistribution system
• Automated system response to disturbances and outages
• Improved reliability with multiple options for supplying load
• Optimized asset management and system efficiencyy
• Integration of DER to improve system performance and allow integration with
12© 2007 Electric Power Research Institute, Inc. All rights reserved.
and allow integration with energy management systems
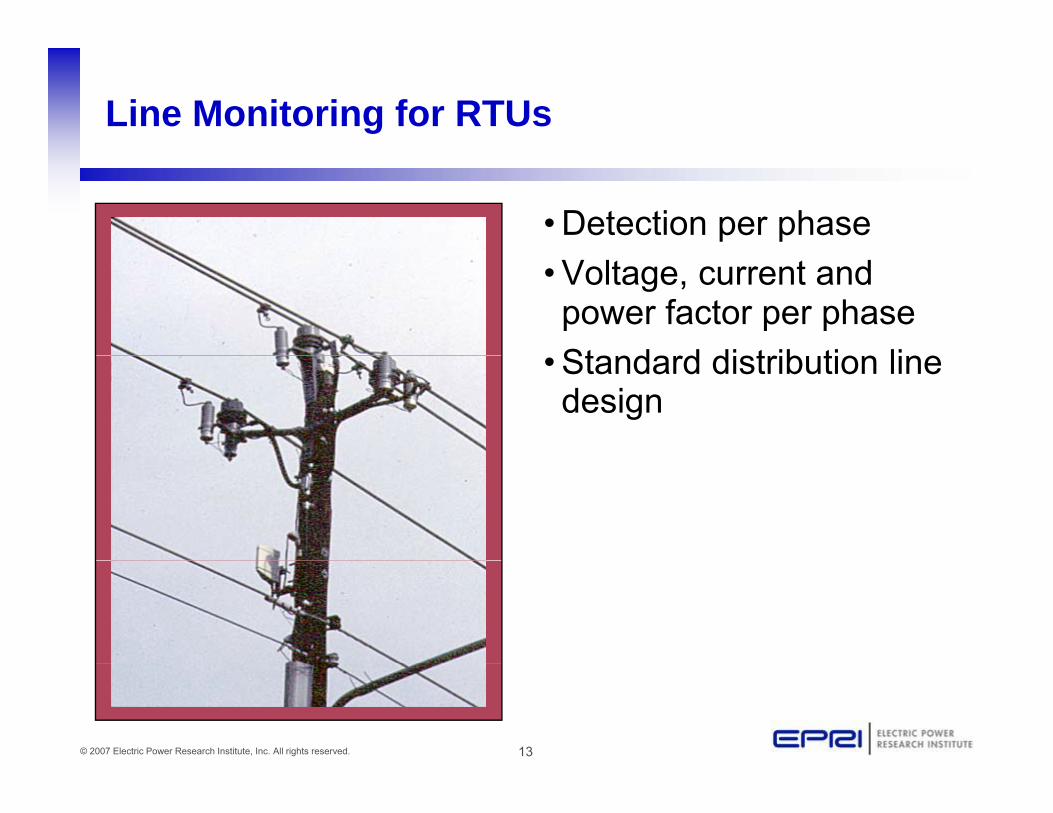
Line Monitoring for RTUs
• Detection per phase• Voltage, current and power factor per phaseSt d d di t ib ti li• Standard distribution line design
13© 2007 Electric Power Research Institute, Inc. All rights reserved.

Fault Isolation & Restoration
• Primary Systems– Traditional utility first line of defense– Protective Relays & Reclosing Relays
Distribution Line Reclosers– Distribution Line Reclosers• Secondary Systems
– Operates after feeders have locked outOperates after feeders have locked out– Gathers granular fault data from field devices– Determines fault location– Automatically isolate the faulted feeder section (if
possible)A t ti ll t f lt d f d ti (i
14© 2007 Electric Power Research Institute, Inc. All rights reserved.
– Automatically restore unfaulted feeder sections (i.e., customer load)
Automatic Sectionalizing& Restoration (ASR)( )
• ASR is a generic term for secondary fault isolation and service restorationservice restoration
• Three types of ASR– Switch basedSwitch based– Distributed ASR (DASR)– Centralized ASR (CASR)( )
15© 2007 Electric Power Research Institute, Inc. All rights reserved.
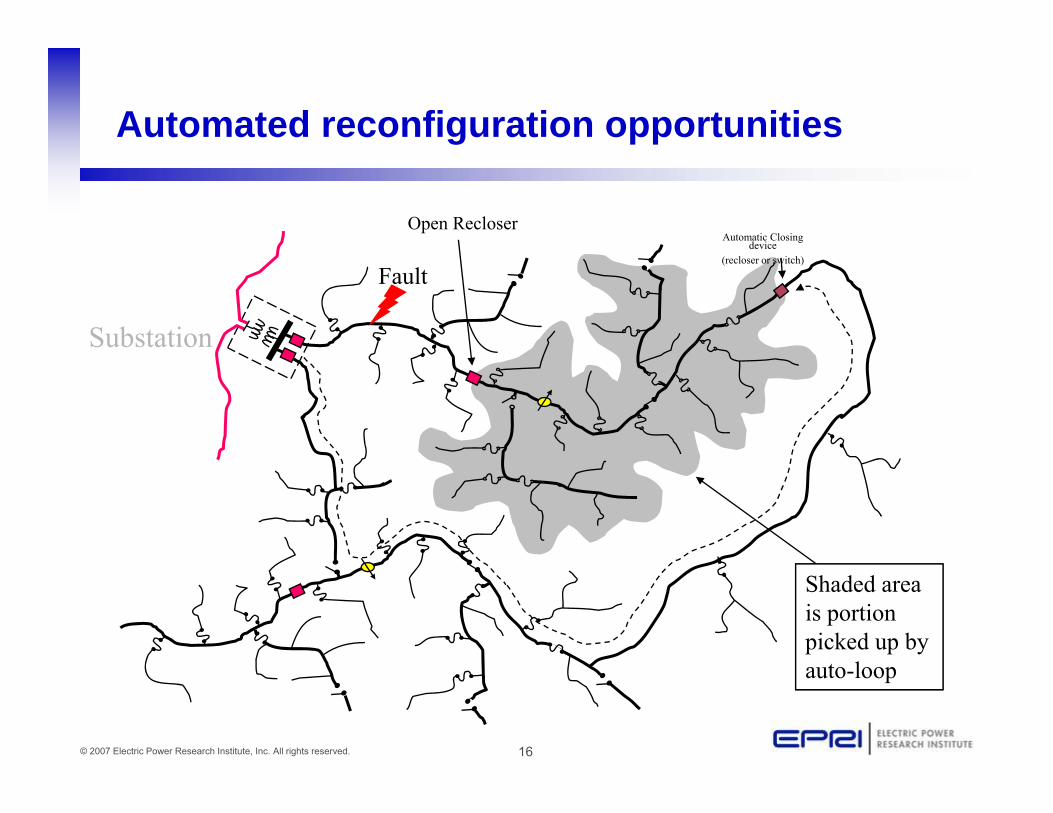
Automated reconfiguration opportunities
Automatic Closing device
Open Recloser
(recloser or switch)
Fault
Substation
Shaded area is portion picked up by
l
16© 2007 Electric Power Research Institute, Inc. All rights reserved.
auto-loop
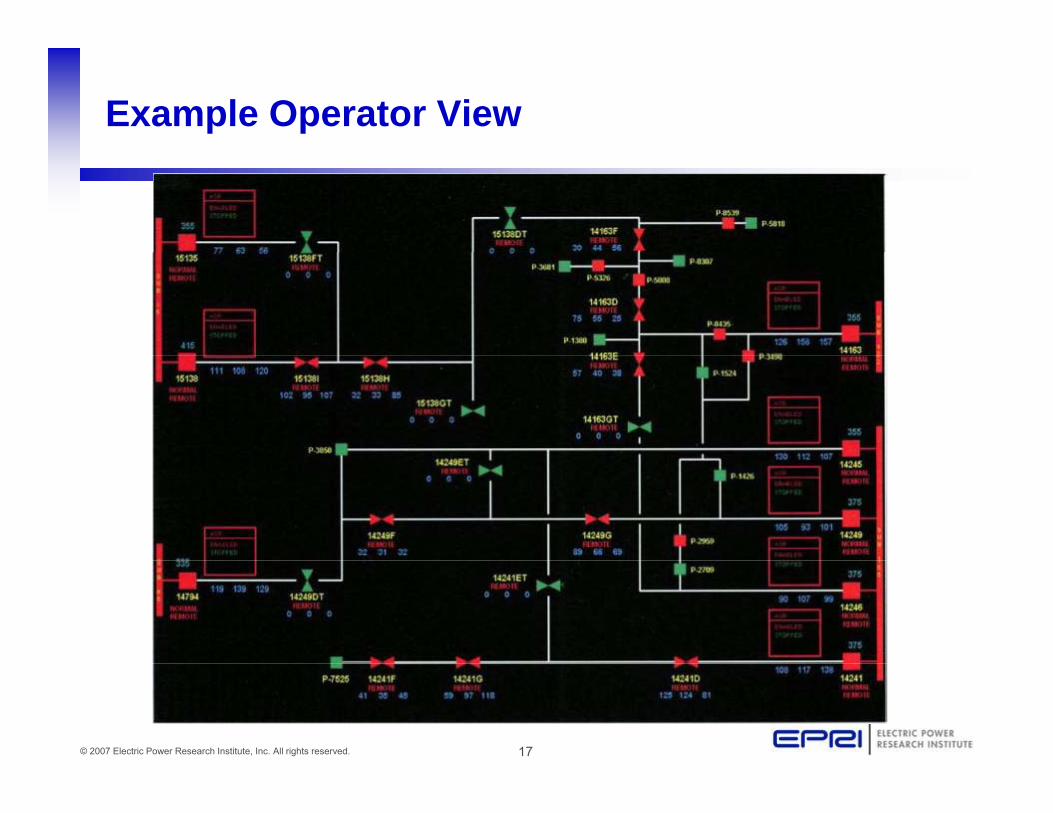
Example Operator View
17© 2007 Electric Power Research Institute, Inc. All rights reserved.

S&C Omni Rupter flat planeOmni-Rupter flat-plane switch with Cleaveland/Price motor operator
18© 2007 Electric Power Research Institute, Inc. All rights reserved.

Pole-Mounted Recloser
MAS remote antenna
19© 2007 Electric Power Research Institute, Inc. All rights reserved.

SCADAMate Switch
20© 2007 Electric Power Research Institute, Inc. All rights reserved.
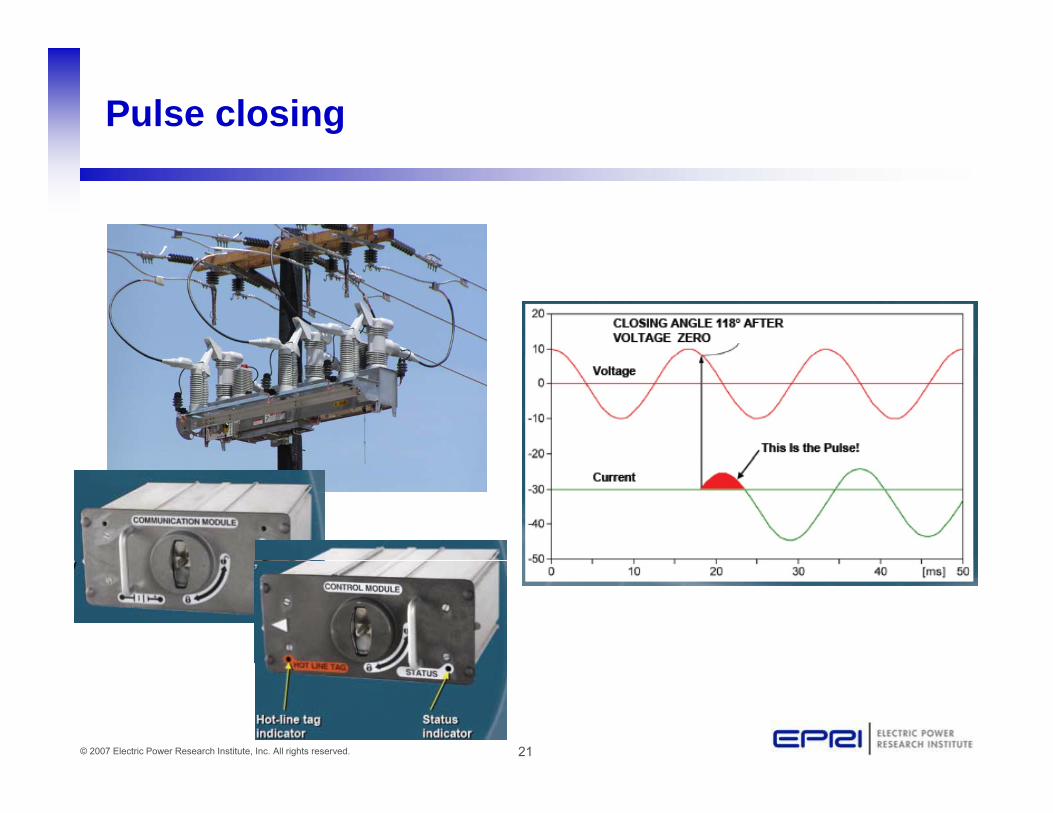
Pulse closing
21© 2007 Electric Power Research Institute, Inc. All rights reserved.
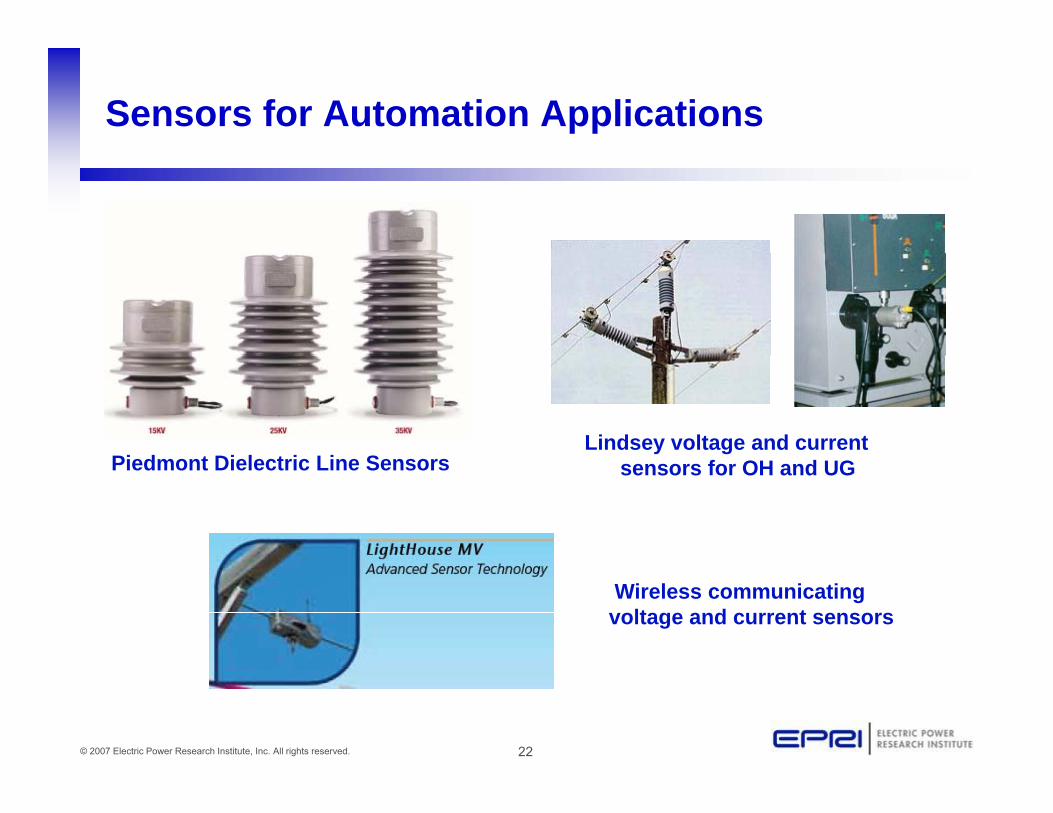
Sensors for Automation Applications
Lindsey voltage and current Pi d t Di l t i Li S sensors for OH and UGPiedmont Dielectric Line Sensors
Wireless communicating voltage and current sensors
22© 2007 Electric Power Research Institute, Inc. All rights reserved.

Hydro Quebec –$188M 6 year plan for automation (3750 switches)
• T• T • T
•T
•T
DATA(Using what?)
Applications(How?)
Voltage Control
Business needs(Why?)
Voltage Fault CurrentsLoad CurrentsTemperature
Voltage ControlOptimised Load Flow
Fault Location Faulty Equipment
Energy EfficiencyReliability
Distributed ResourcesPower Quality
23© 2007 Electric Power Research Institute, Inc. All rights reserved.
TemperatureNumber of Operations
Alarms…
Power Quality Evaluation…
Power QualityCustomer Satisfaction

What Else?
• Proactive load management• Adaptive Volt/VAR control• Demand response Integration• AMI Integration• AMI Integration• Distributed generation integration
24© 2007 Electric Power Research Institute, Inc. All rights reserved.
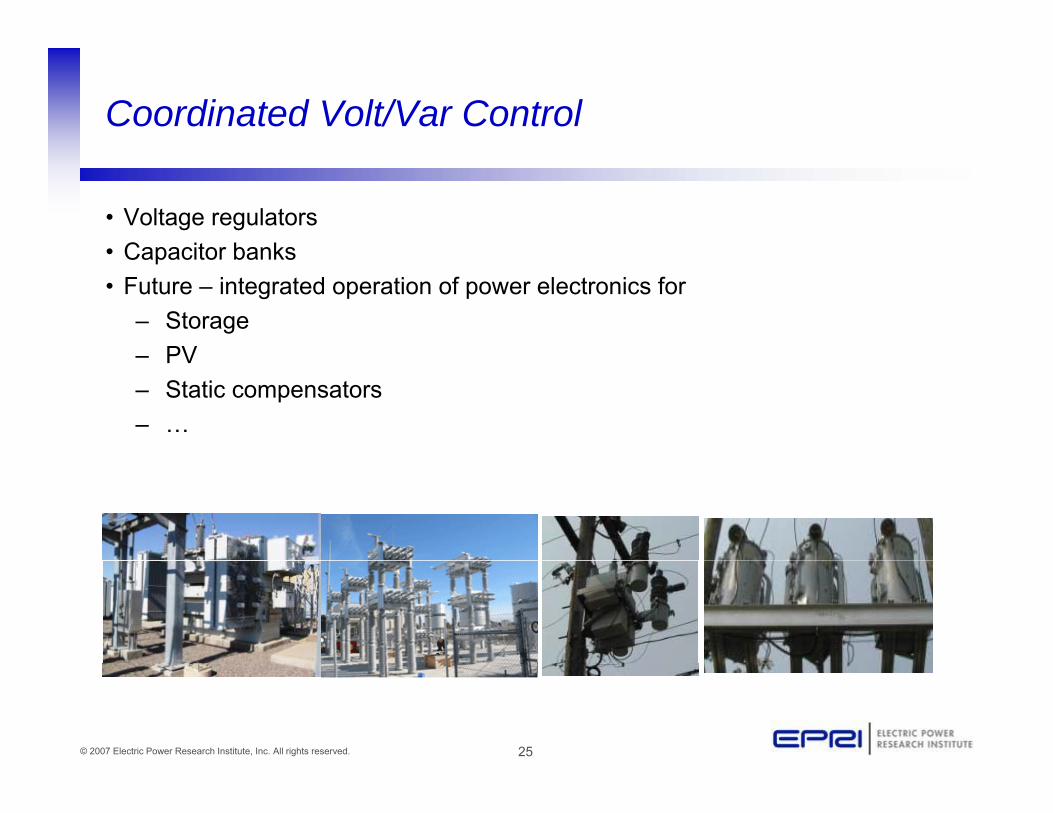
Coordinated Volt/Var Control
• Voltage regulators• Capacitor banks• Capacitor banks• Future – integrated operation of power electronics for
– StoragePV– PV
– Static compensators– …
25© 2007 Electric Power Research Institute, Inc. All rights reserved.

Traditional Volt-VAR Control
Current/VoltageSensor
Distribution Primary LineCurrent/Voltage
Sensor
CapacitorBank
Distribution Primary Line
"Local" Current/Voltage
M
Voltage Regulator
"Local" Current/Voltage
M
Standalone Controller
Measurements On/Off Control Command
Signal Standalone Controller
Measurements On/Off Control Command
Signal
• Volt-VAR flows managed by individual, independent, standalone volt-VAR regulating devices:devices:
– Substation transformer load tap changers (LTCs)– Line voltage regulators– Fixed and switched capacitor banks
26© 2007 Electric Power Research Institute, Inc. All rights reserved.

“SCADA” Controlled Volt-VAR
• Volt-VAR power apparatus monitored and controlled by SCADA
• Volt and VAR Control typically handled by two separate (independent) systems:Volt and VAR Control typically handled by two separate (independent) systems:– VAR Dispatch – controls capacitor banks to improve power factor, reduce electrical losses– Voltage Control – controls LTCs and/or voltage regulators to reduce demand and/or energy
consumption (aka, Conservation Voltage Reduction)
O i f h i i il b d d f d i d l ( “if• Operation of these systems is primarily based on a stored set of predetermined rules (e.g., “if power factor is less than 0.95, then switch capacitor bank #1 off”)
VAR DispatchProcessor Radio
Contains rules for capacitor
switching One-way
SubstationRTU
Processor
Measures real and reactive power at substation end of
the feeder
switching ycommunication link for capacitor bank
control
SubstationCapacitor
Bank Controller
Radio
OO
Capacitor Switch Reactive Power (MVAR)
Real Power (MW)
the feeder
27© 2007 Electric Power Research Institute, Inc. All rights reserved.
Capacitor Bank (Deenergized)
Controllerp(Off Position)

Integrated Volt-VAR Control (IVVC) System Configurationy g
Temp Changes
MDMSAMI Line Switch
Distribution System Model
Geographic Information
System (GIS)
Perm Changes
Dynamic Changes
Switched Cap
Bank
Distribution SCADA
On-Line Power Flow (OLPF)
IVVC Optimizing
Engine
Line Voltage
RegulatorDevelops a coordinated
“optimal”Substation RTU
Substation Transformer with TCUL
Substation Capacitor
B k
optimal switching plan for all voltage control
devices and executes the plan
28© 2007 Electric Power Research Institute, Inc. All rights reserved.
with TCUL Bankexecutes the plan
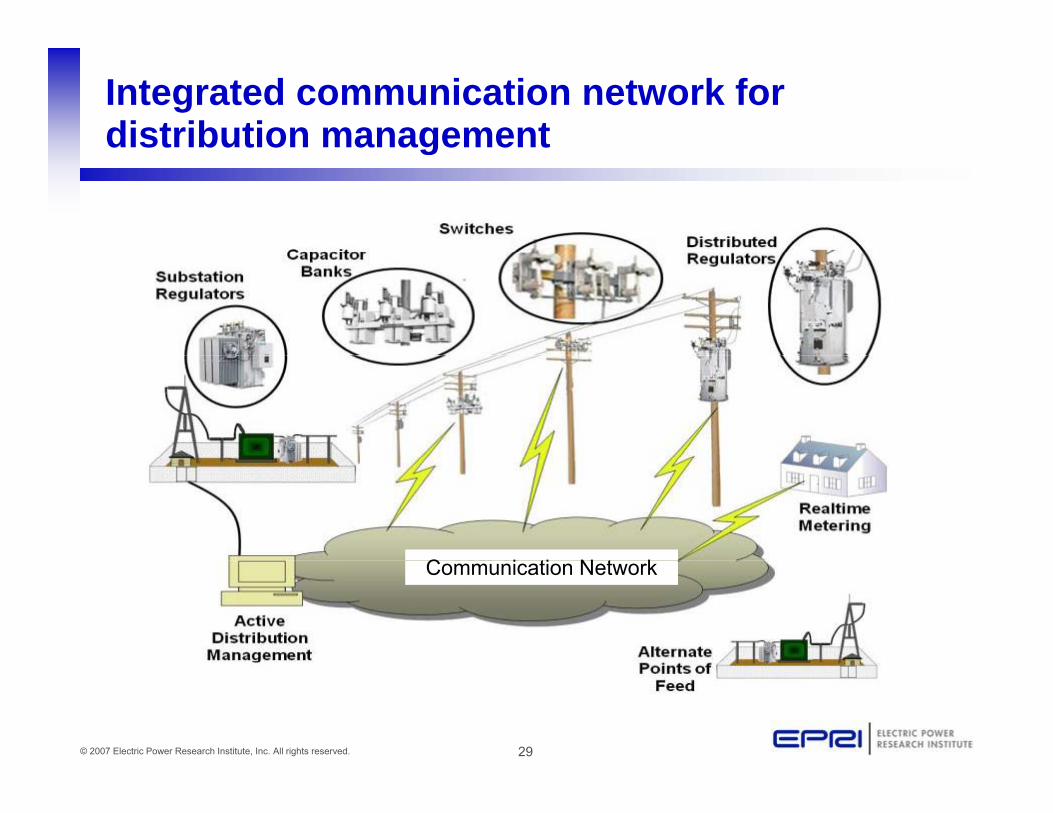
Integrated communication network for distribution managementg
C i ti N t kCommunication Network
29© 2007 Electric Power Research Institute, Inc. All rights reserved.

Integrated Volt VAR Control – DG Included
PV Inverter PV
PV Inverter PV
SUBSTATIONSupplementary
RegulatorsSupplementary
Regulators
Inverter
Rotating DG
SUBSTATIONSupplementary
RegulatorsSupplementary
Regulators
Inverter
Rotating DG
Rotating DG
FEEDER
gg
Capacitor ControlLTC Control
RotatingPV
Inverter PV
FEEDER
gg
Capacitor ControlLTC Control
RotatingRotatingPV
Inverter PV
Rotating DG
PF Capacitor
Rotating DG
Rotating DG
Inverter PV Inverter
Rotating DG
Rotating DG
PF Capacitor
Rotating DG
Rotating DG
Rotating DG
Rotating DG
Inverter PV Inverter
Voltage and VAR Regulation
Manages tap changer settings, inverter and rotating machine Communication Link
Voltage and VAR Regulation
Manages tap changer settings, inverter and rotating machine Communication Link
30© 2007 Electric Power Research Institute, Inc. All rights reserved.
Regulation Coordination
Algorithm
VAR levels, and capacitors to regulate voltage, reduce losses, conserve energy, and system resources
Regulation Coordination
Algorithm
VAR levels, and capacitors to regulate voltage, reduce losses, conserve energy, and system resources
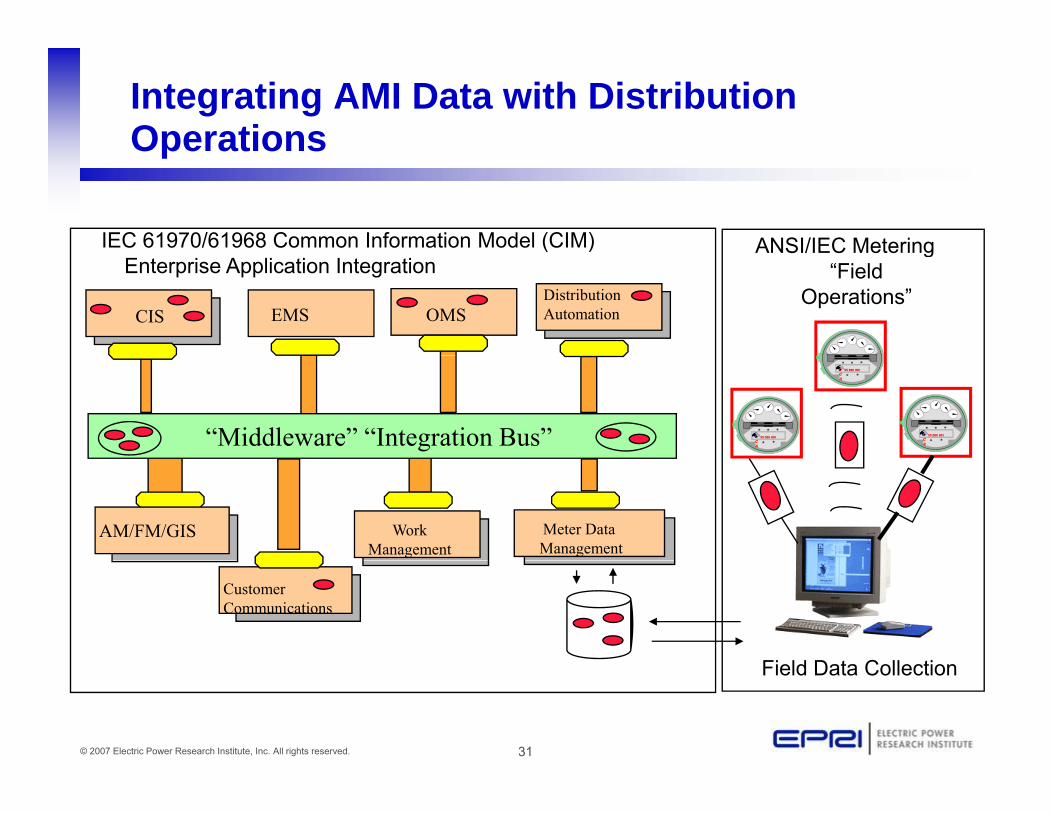
Integrating AMI Data with Distribution OperationsOperations
ANSI/IEC Metering IEC 61970/61968 Common Information Model (CIM)
OMSCISDistributionAutomationEMS
S / C ete g“Field
Operations” Enterprise Application Integration
“Middleware” “Integration Bus” UUCCAA
TM
UUCCAA
TM
UUCCAA
TM
WorkManagement
Meter Data Management
AM/FM/GIS
Customer Communications
Fi ld D t C ll ti
31© 2007 Electric Power Research Institute, Inc. All rights reserved.
Field Data Collection
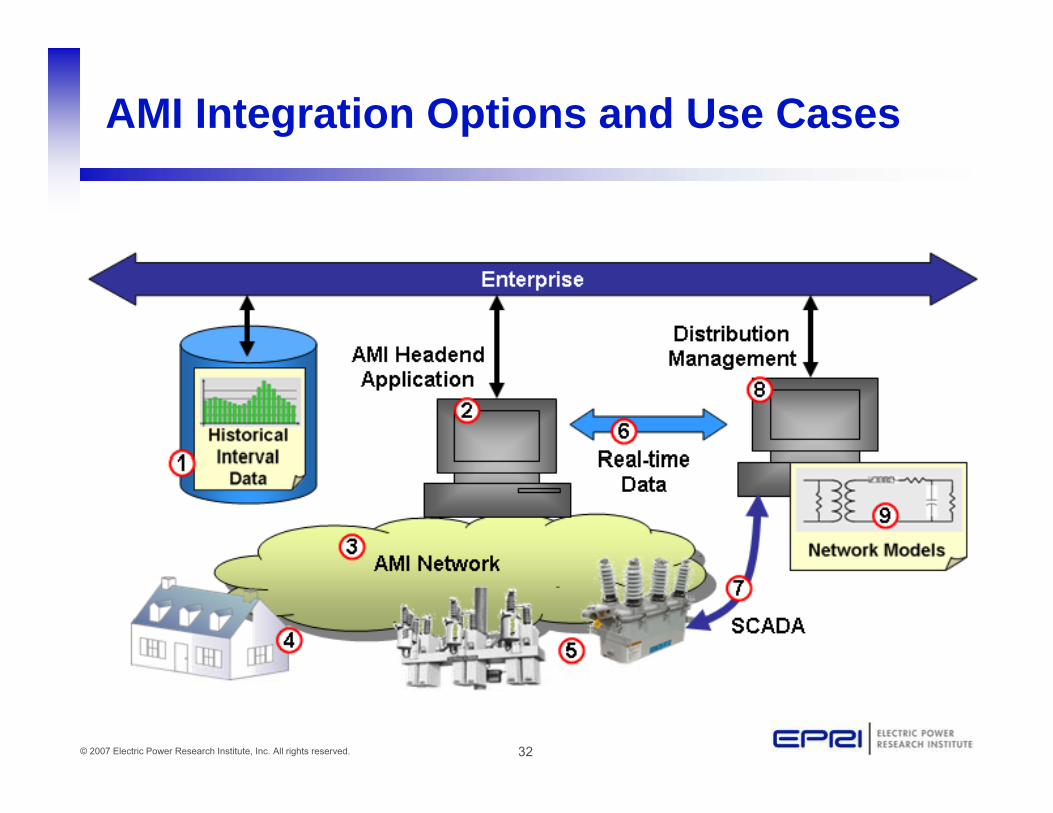
AMI Integration Options and Use Cases
32© 2007 Electric Power Research Institute, Inc. All rights reserved.
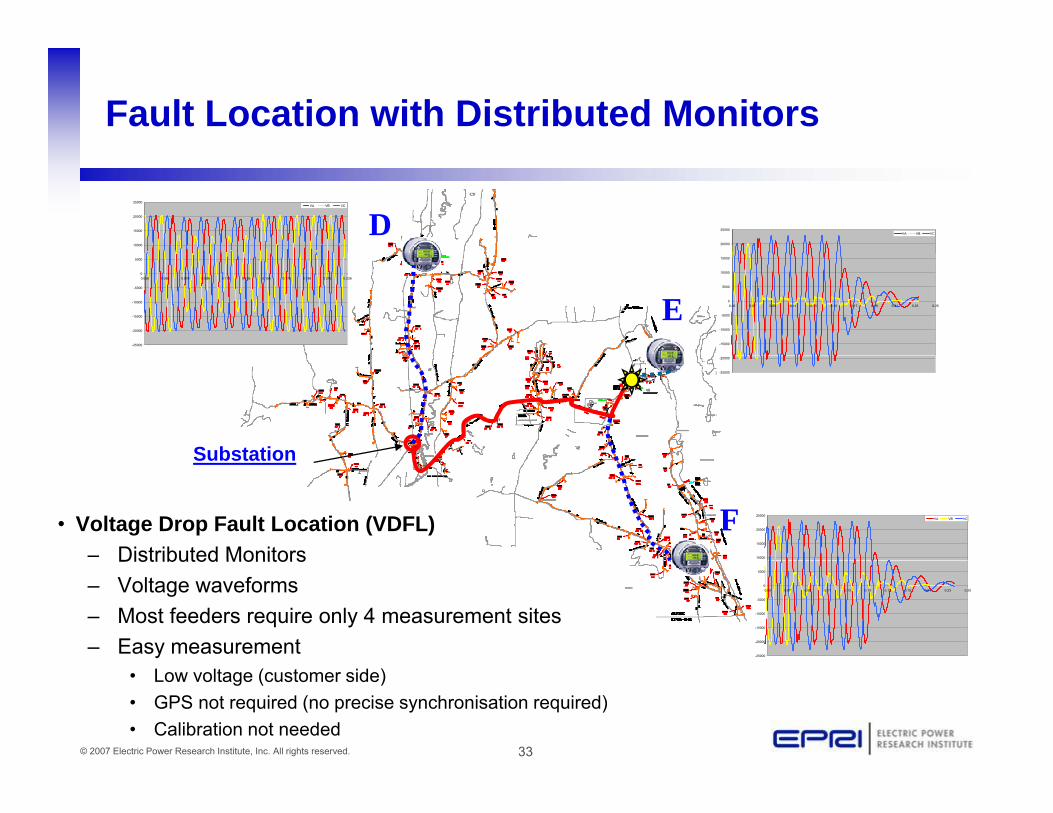
Fault Location with Distributed Monitors
10000
15000
20000
25000VA VB VC
20000
25000VA VB VCD
-25000
-20000
-15000
-10000
-5000
0
5000
0.036 0.056 0.076 0.096 0.116 0.136 0.156 0.176 0.196 0.216 0.236
-15000
-10000
-5000
0
5000
10000
15000
0.05 0.07 0.09 0.11 0.13 0.15 0.17 0.19 0.21 0.23 0.25E
-25000
-20000
Substation
• Voltage Drop Fault Location (VDFL) – Distributed Monitors 10000
15000
20000
25000VA VB VC
Substation
FDistributed Monitors
– Voltage waveforms– Most feeders require only 4 measurement sites– Easy measurement
-25000
-20000
-15000
-10000
-5000
0
5000
0.05 0.07 0.09 0.11 0.13 0.15 0.17 0.19 0.21 0.23 0.25
33© 2007 Electric Power Research Institute, Inc. All rights reserved.
• Low voltage (customer side)• GPS not required (no precise synchronisation required)• Calibration not needed
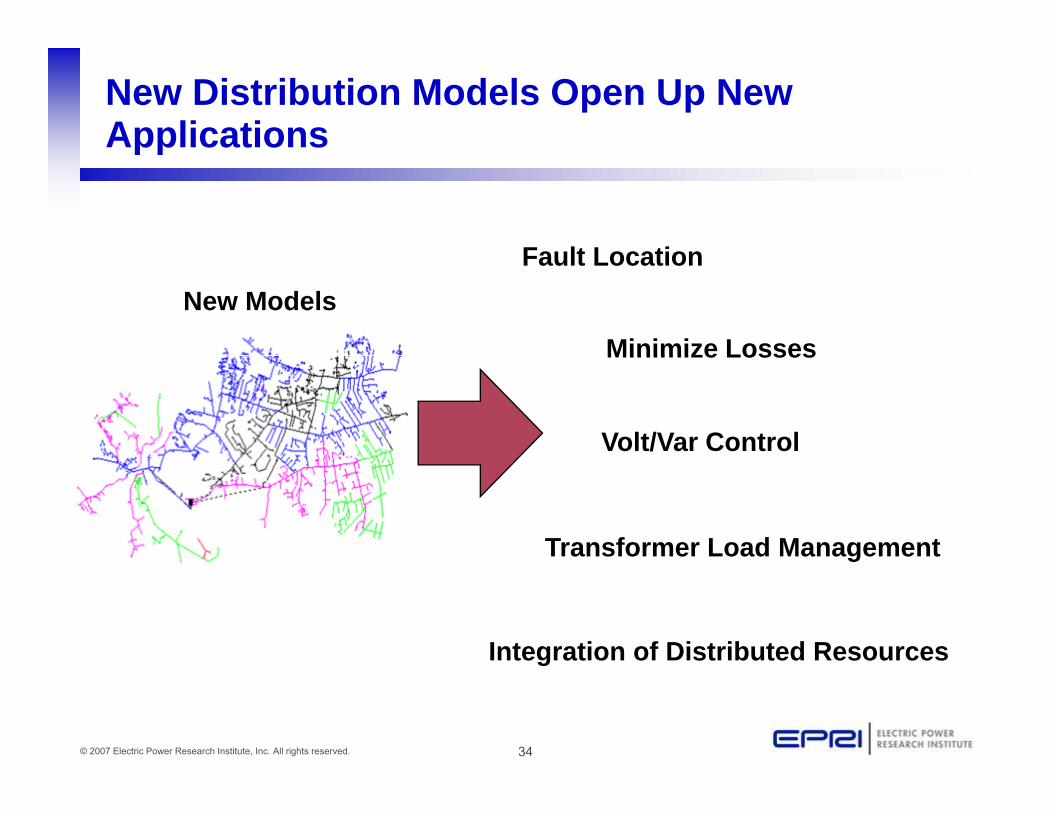
New Distribution Models Open Up New Applicationspp
Fault LocationNew Models
Minimize Losses
Fault Location
Volt/Var Control
Minimize Losses
Transformer Load Management
Integration of Distributed Resources
g
34© 2007 Electric Power Research Institute, Inc. All rights reserved.
g
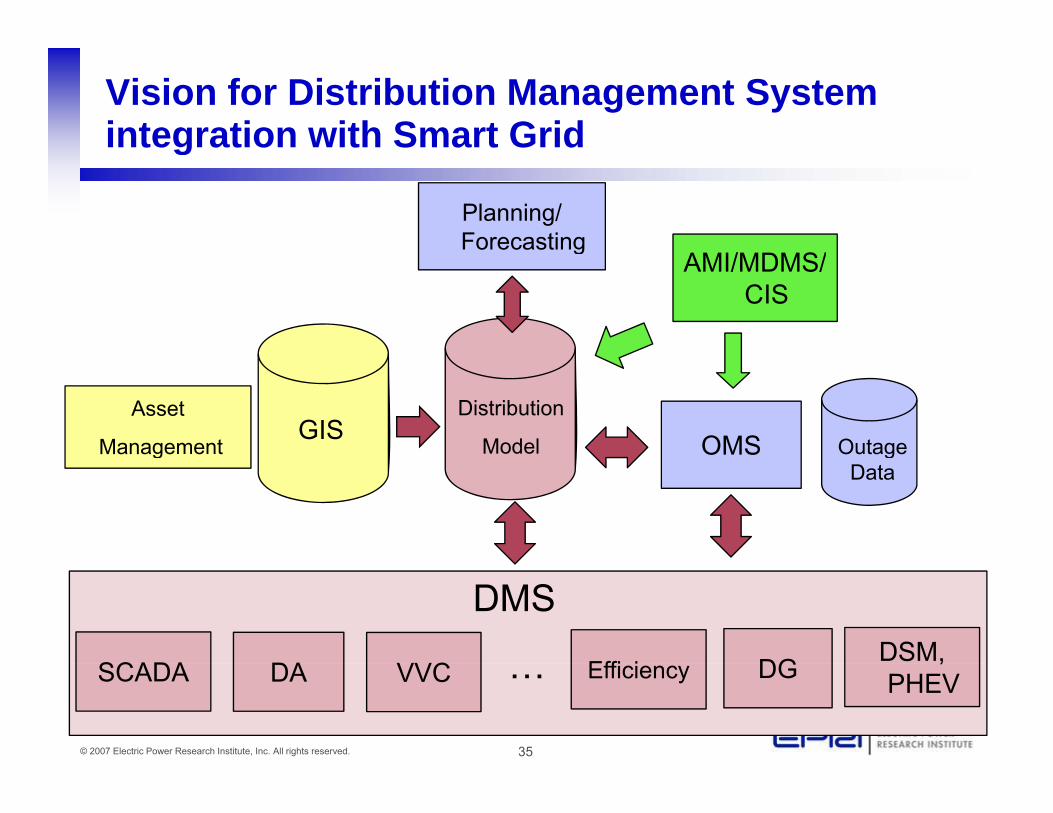
Vision for Distribution Management System integration with Smart Gridg
AMI/MDMS/
Planning/ Forecasting
AMI/MDMS/CIS
g
Distribution
ModelGIS OMS Outage
Asset
Management gData
g
SCADA DA VVC Effi i DG DSM,
DMS
35© 2007 Electric Power Research Institute, Inc. All rights reserved.
SCADA DA VVC Efficiency DG ,PHEV…

Discussion of DMS Issues
• DMS Applications • Distributed vs Central processing considerations– Volt Var Control
– Loss Management– Reliability/reconfiguration
considerations
• Model management and complexity
– Asset management– Fault location/fault
management
• State estimators
• Operator interface requirements• Important Interfaces
– GIS– OMS
• Operator interface requirements
• Cost/benefit assessment approachesOMS
– Asset Management– Distribution Models
MDMS
pp
• Integration of distributed resources
36© 2007 Electric Power Research Institute, Inc. All rights reserved.
– MDMS– CIS
Questions?
37© 2007 Electric Power Research Institute, Inc. All rights reserved.
Agenda
•Active Distribution Management Overview
•Modeling Considerations and OpenDSS
•Examples of Active Distribution Management and•Examples of Active Distribution Management and CIGRE C6.11 Activities
IEEE Di t ib ti A t ti W ki G• IEEE Distribution Automation Working Group
•Demonstrations
38© 2007 Electric Power Research Institute, Inc. All rights reserved.
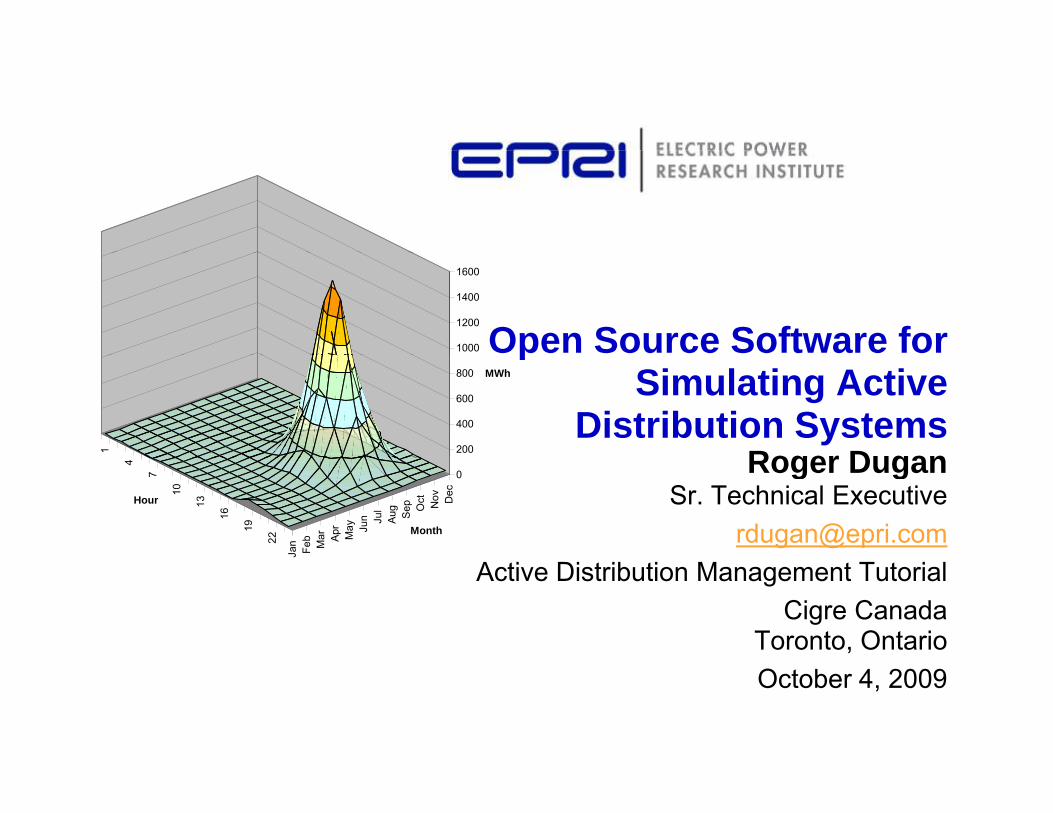
Open Source Software for 1000
1200
1400
1600
pSimulating Active
Distribution Systems Roger Dugan1 200
400
600
800 MWh
Roger DuganSr. Technical Executive
4
7
10
13
16
19
22
Jan
Feb
Mar Ap
rM
ay Jun Ju
lAu
gSe
p Oct Nov Dec
0
Hour
Month
Active Distribution Management TutorialCigre Canada
Toronto, OntarioOctober 4, 2009
OpenDSS
• EPRI released its Distribution System Simulator (DSS) program as open source In Sept 2008program as open source In Sept 2008– Source code is available to public– BSD License – basically no limitationsBSD License basically no limitations
• Called “OpenDSS”p
• Can be found at:
– WWW.SOURCEFORGE.NET(S h f O DSS)
40© 2007 Electric Power Research Institute, Inc. All rights reserved.
(Search for OpenDSS)

History
• DSS development was started at Electrotek Concepts in 1997 to provide1997 to provide – a very flexible and expandable research platform– a foundation for special distribution analysis
li iapplications • In particular, DG analysis
• Fills many of the gaps left by more conventional distribution system analysis toolsF d l i h t di t ib ti t• For developing new approaches to distribution system analysis
• Acquired by EPRI in 2004
41© 2007 Electric Power Research Institute, Inc. All rights reserved.
Time- and Location-Specific Benefits
• The DSS was designed from the beginning to capture both Time and Location specific benefits ofboth Time- and Location-specific benefits of – DG or other proposed capacity enhancements
• Most traditional distribution system analysis programs:Most traditional distribution system analysis programs:– Capture only some location-specific benefits– Ignores time; Assumes resource is availableg– This gets the wrong answer for many DG and energy
efficiency analysesM t d ti l i• Must do time sequence analysis– Over distribution planning area
42© 2007 Electric Power Research Institute, Inc. All rights reserved.
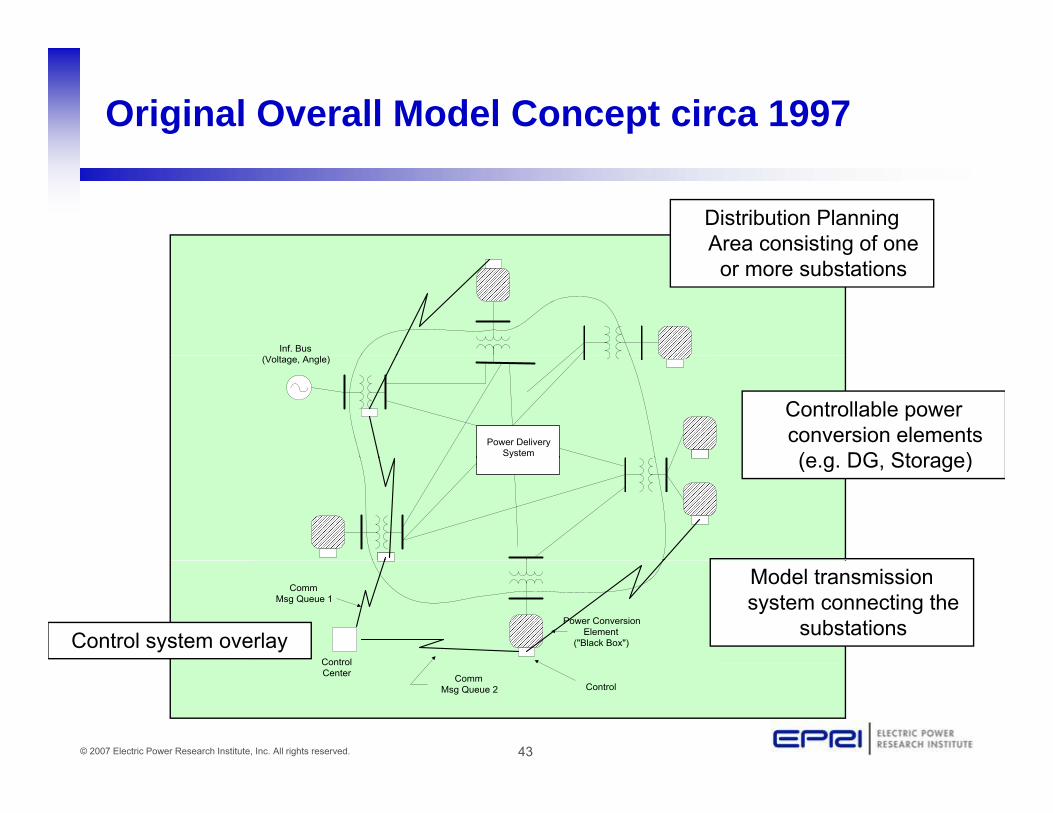
Original Overall Model Concept circa 1997
Distribution Planning Area consisting of one
Inf. Bus
gor more substations
(Voltage, Angle)
Power DeliverySystem
Controllable power conversion elements (e g DG Storage)(e.g. DG, Storage)
Control
Power ConversionElement
("Black Box")
CommMsg Queue 1
Model transmission system connecting the
substationsControl system overlay
43© 2007 Electric Power Research Institute, Inc. All rights reserved.
ControlCenter
ControlComm
Msg Queue 2

Why Did We Make it Open Source?
• EPRI has made the DSS open source to:– Cooperate with other open source efforts in the USA in
Smart Grid research• Gridlab-D at PNL for exampleGridlab D at PNL, for example
– To encourage new advancements in distribution system analysis• We’ve already seen proof of this
– To provide Smart Grid researchers a tool for testing and developing distribution control algorithmsand developing distribution control algorithms
44© 2007 Electric Power Research Institute, Inc. All rights reserved.

Example DSS Applications (the more exotic ones)( )
• Neutral-to-earth (stray) voltage simulations.
• Distribution automation control algorithm assessment.s u at o s
• Loss evaluations due to unbalanced loading.
• Development of DG models for
a go t assess e t• Impact of tankless water heaters
on flicker and distribution transformers.p
the IEEE Radial Test Feeders.• High-frequency harmonic and
interharmonic interference.
• Wind farm collector simulation.• Wind farm impact on local
transmission.• Losses, impedance, and
circulating currents in unusual transformer bank configurations.
f f
• Wind generation and other DG impact on switched capacitors and voltage regulators.O f• Transformer frequency response
analysis.• Open-conductor fault conditions
with a variety of single-phase and three-phase transformer connections.
45© 2007 Electric Power Research Institute, Inc. All rights reserved.
connections.
What Can It Do?
Examples of Results

Power Flow Visualization
47© 2007 Electric Power Research Institute, Inc. All rights reserved.

Power Flow Visualization
Voltage Profile Plot
1 06
1.04
1.05
1.06
1.02
1.03
Volta
ge
V1V2
1
1.01
Per U
nit V2
V3
0 97
0.98
0.99
48© 2007 Electric Power Research Institute, Inc. All rights reserved.
0.970 1 2 3 4 5 6 7 8 9 10
Distance from Substation
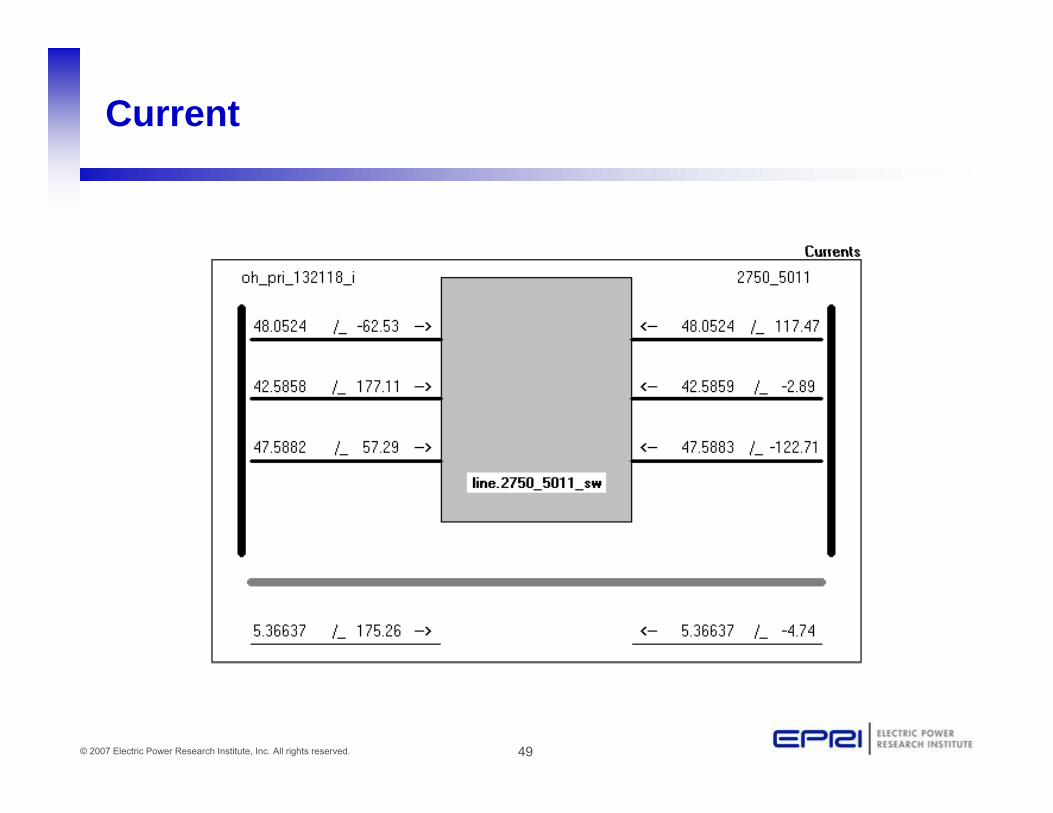
Current
49© 2007 Electric Power Research Institute, Inc. All rights reserved.
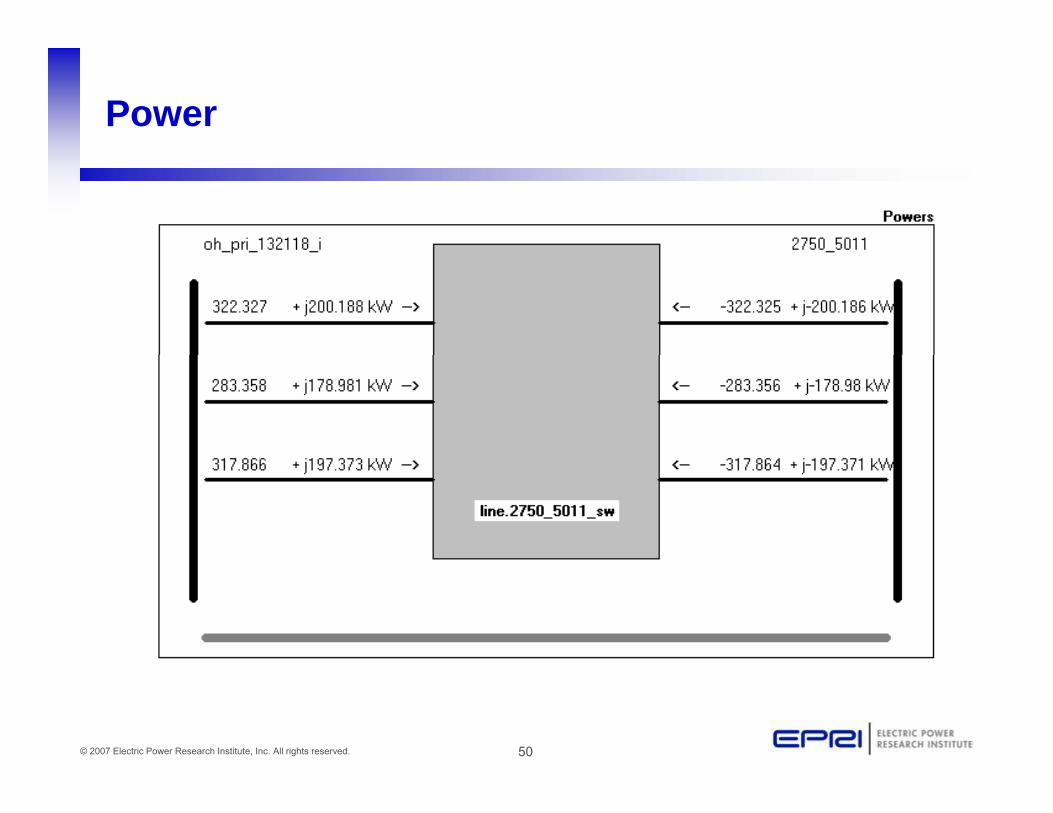
Power
50© 2007 Electric Power Research Institute, Inc. All rights reserved.
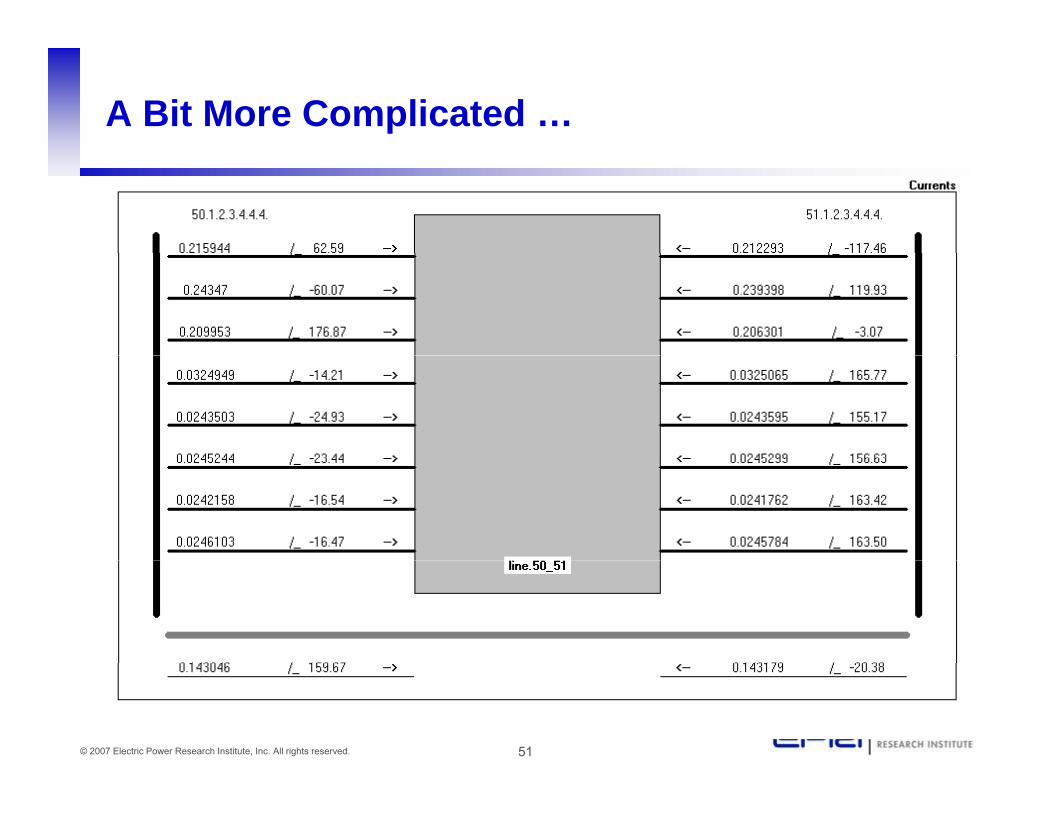
A Bit More Complicated …
51© 2007 Electric Power Research Institute, Inc. All rights reserved.
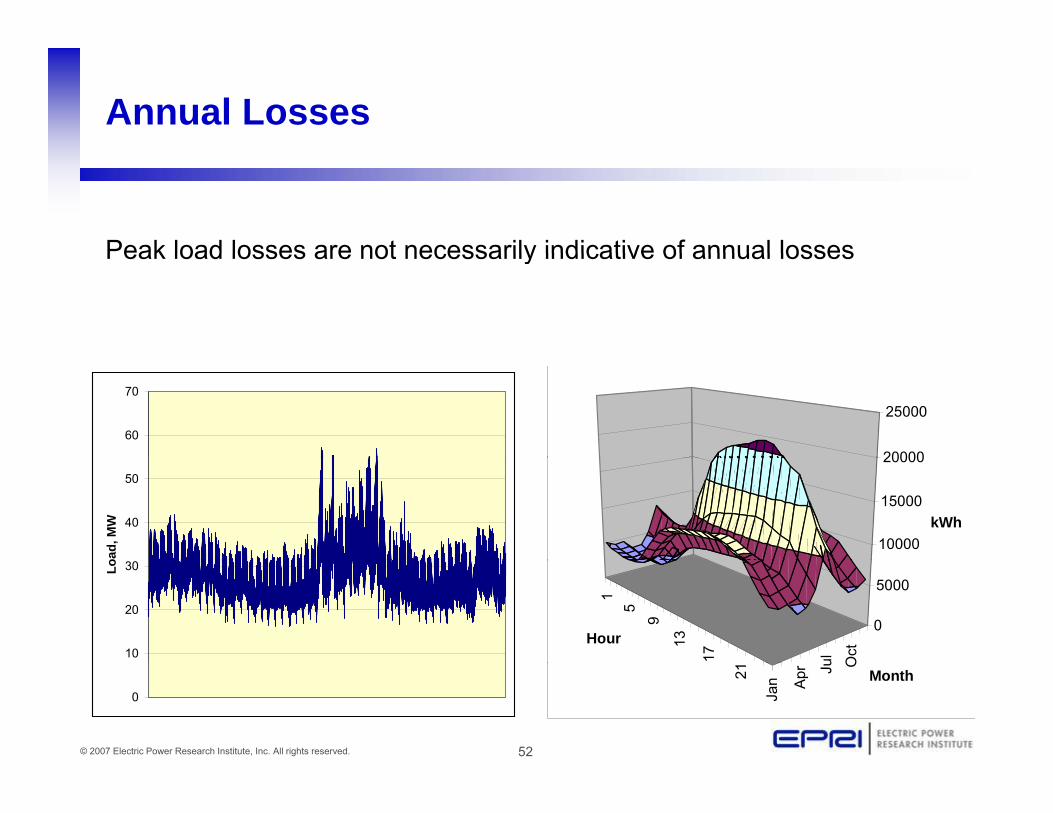
Annual Losses
Peak load losses are not necessarily indicative of annual lossesPeak load losses are not necessarily indicative of annual losses
60
70
20000
25000
40
50
oad,
MW
10000
15000
20000
kWh
10
20
30Lo
15
9
13
17 ul Oct
0
5000
Hour
52© 2007 Electric Power Research Institute, Inc. All rights reserved.
0
21
Jan Apr Ju O
Month

Power Distribution Efficiency (EPRI Green Circuits Project)( j )
250
300
350
Total Losses
50
100
150
200
Loss
es, k
W
No-Load Losses
350
Peak Load Week
0
50
0 50 100 150
Hour (1 Week)
Load Losses
150
200
250
300
sses
, kW
Total Losses
0
50
100
150
5200 5250 5300 5350
Los
Load Losses
No-Load Losses
Light Load Week
53© 2007 Electric Power Research Institute, Inc. All rights reserved.
5200 5250 5300 5350
Hour (1 Week)

Solar PV Simulation
5 5
4 4
Without PV With PV
Difference
3 3
, MW
1
2MW
1
2
Diff
eren
ce,
0 0
54© 2007 Electric Power Research Institute, Inc. All rights reserved.
-1
2 Weeks-1
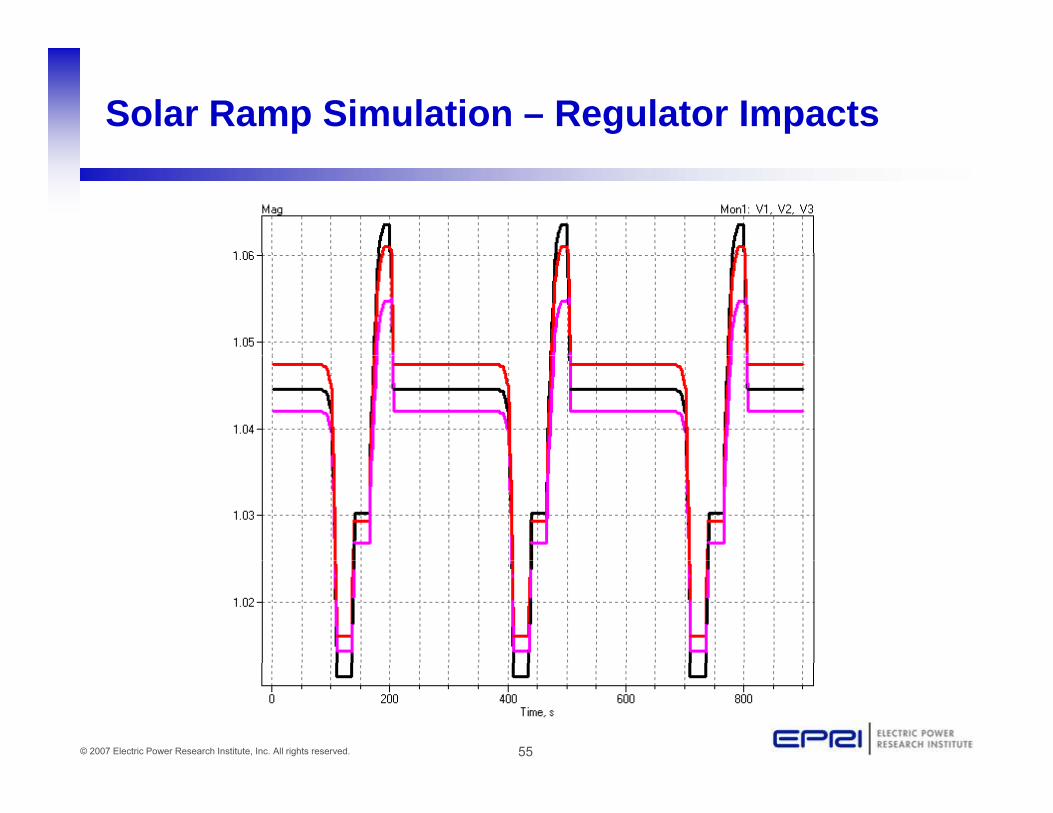
Solar Ramp Simulation – Regulator Impacts
55© 2007 Electric Power Research Institute, Inc. All rights reserved.
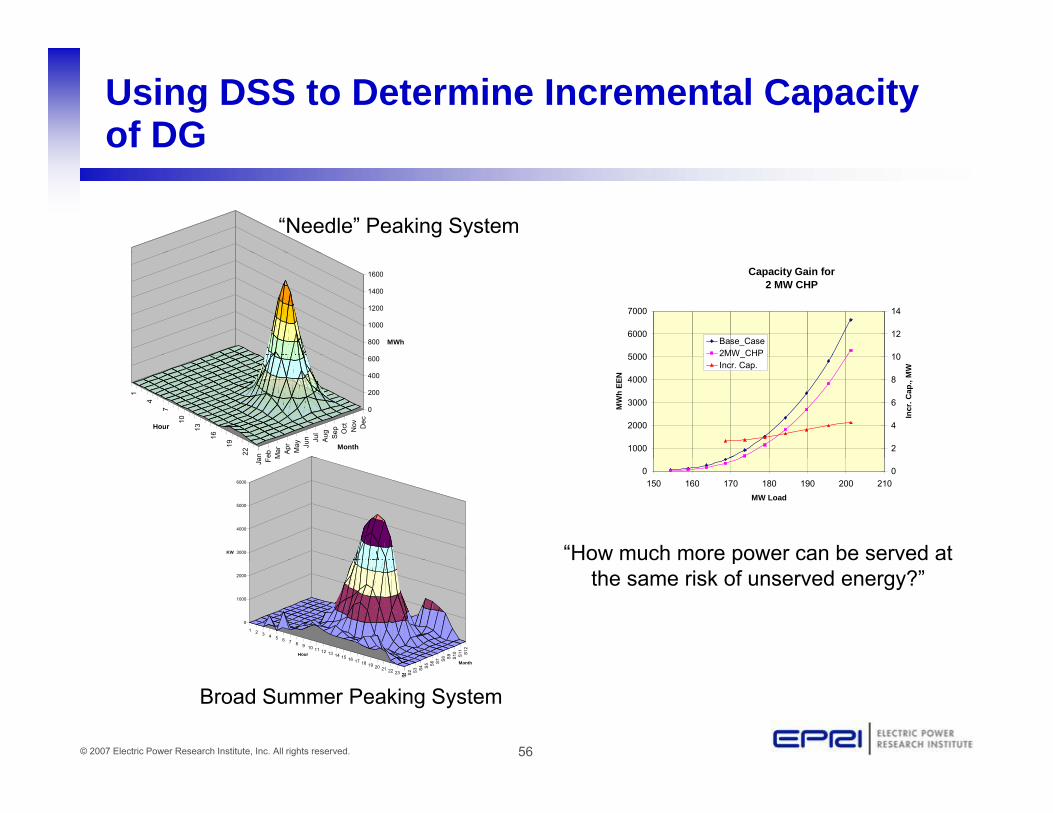
Using DSS to Determine Incremental Capacity of DG
“Needle” Peaking System
800
1000
1200
1400
1600
MWh
Capacity Gain for 2 MW CHP
5000
6000
7000
10
12
14
Base_Case2MW CHP
1
4
7
10
13
16
19
22
an eb Mar Ap
rM
ay Jun Ju
lAu
gSe
p Oct Nov Dec
0
200
400
600
Hour
Month 1000
2000
3000
4000
5000
MW
h EE
N
2
4
6
8
10
Incr
. Cap
., M
W
2MW_CHPIncr. Cap.
Ja F M
3000
4000
5000
6000
KW
0150 160 170 180 190 200 210
MW Load
0
“How much more power can be served at
1 2 3 4 5 6 7 8 9 10 11 12 13 14 15 16 17 18 6 S7 S8 S9
S10 S1
1S1
2
0
1000
2000
Hour
Month
pthe same risk of unserved energy?”
56© 2007 Electric Power Research Institute, Inc. All rights reserved.
18 19 20 21 22 23 24S1 S2 S3 S4 S5 S S Month
Broad Summer Peaking System
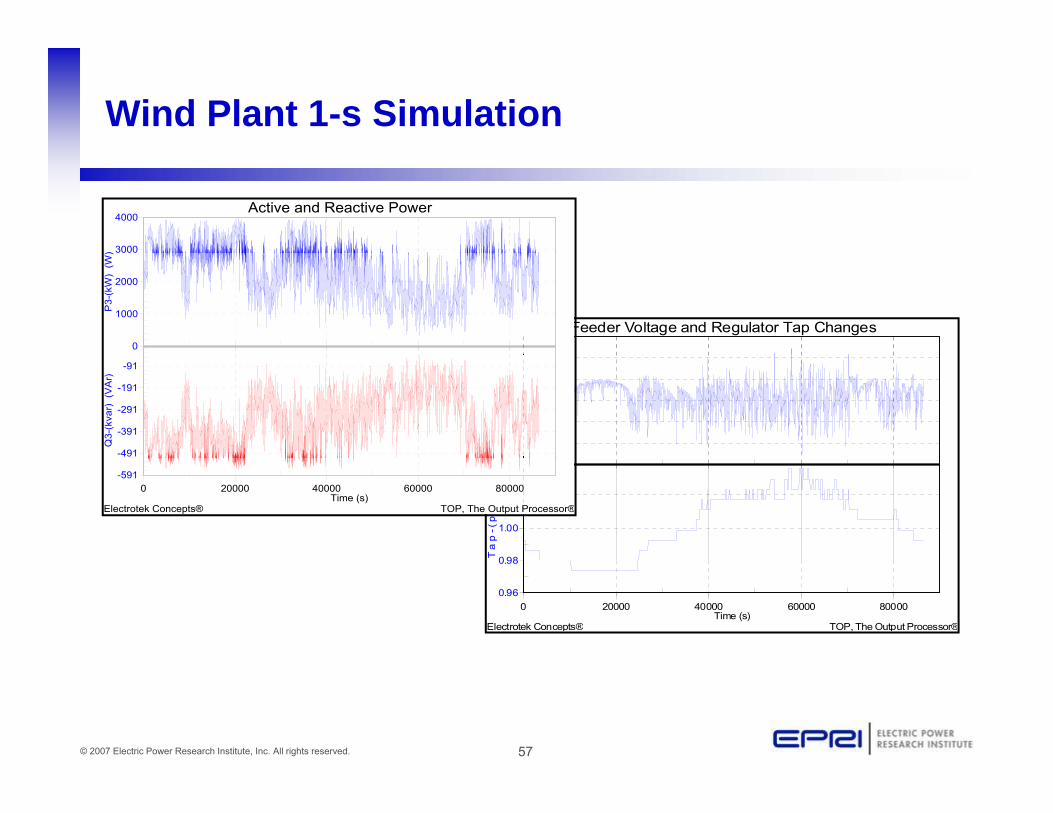
Wind Plant 1-s Simulation
3000
4000Active and Reactive Power
)
1 02
1.03Feeder Voltage and Regulator Tap Changes
0
1000
2000
P3-
(kW
) (W
)
0.98
0.99
1.00
1.01
1.02
-491
-391
-291
-191
-91
Q3-
(kva
r) (
VA
r)
0.97
0 98
1.00
1.02T
ap
-(p
u)
(V
)-5910 20000 40000 60000 80000
Electrotek Concepts® TOP, The Output Processor®Time (s)
0.96
0.98
0 20000 40000 60000 80000
Electrotek Concepts® TOP, The Output Processor®Time (s)
57© 2007 Electric Power Research Institute, Inc. All rights reserved.

DG Dispatch
5000 2500
4000
4500
1500
2000
kvar
2500
3000
3500
wer
, kW
0
500
1000
Pow
er, k
var
1500
2000
Pow
-1000
-500
Rea
ctiv
e
kW
0
500
1000
-2500
-2000
-1500
58© 2007 Electric Power Research Institute, Inc. All rights reserved.
127
053
980
810
7713
4616
1518
8421
5324
2226
9129
6032
2934
9837
6740
3643
0545
7448
4351
1253
8156
5059
1961
8864
5767
2669
9572
6475
3378
0280
7183
4086
09
Hour
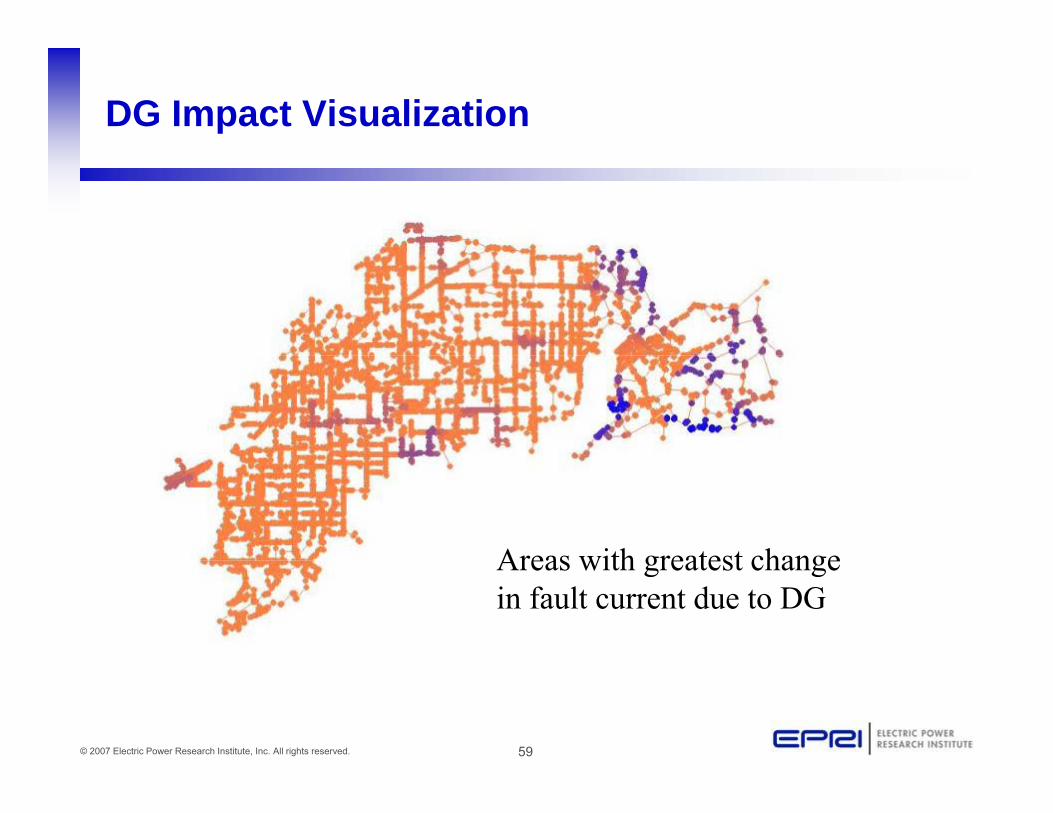
DG Impact Visualization
Areas with greatest changeAreas with greatest change in fault current due to DG
59© 2007 Electric Power Research Institute, Inc. All rights reserved.

Broadband Driving Point Admittance
0.035
0.025
0.03
0 015
0.02
Siem
ens
|Y|
0.01
0.015S
0
0.005
60© 2007 Electric Power Research Institute, Inc. All rights reserved.
0 100000 200000 300000 400000 500000Frequency, Hz
Where Can I Find It?
http://sourceforge.net/projects/electricdss/develop
(Or go to Sourceforge.net and search for “OpenDSS”)( g g p )
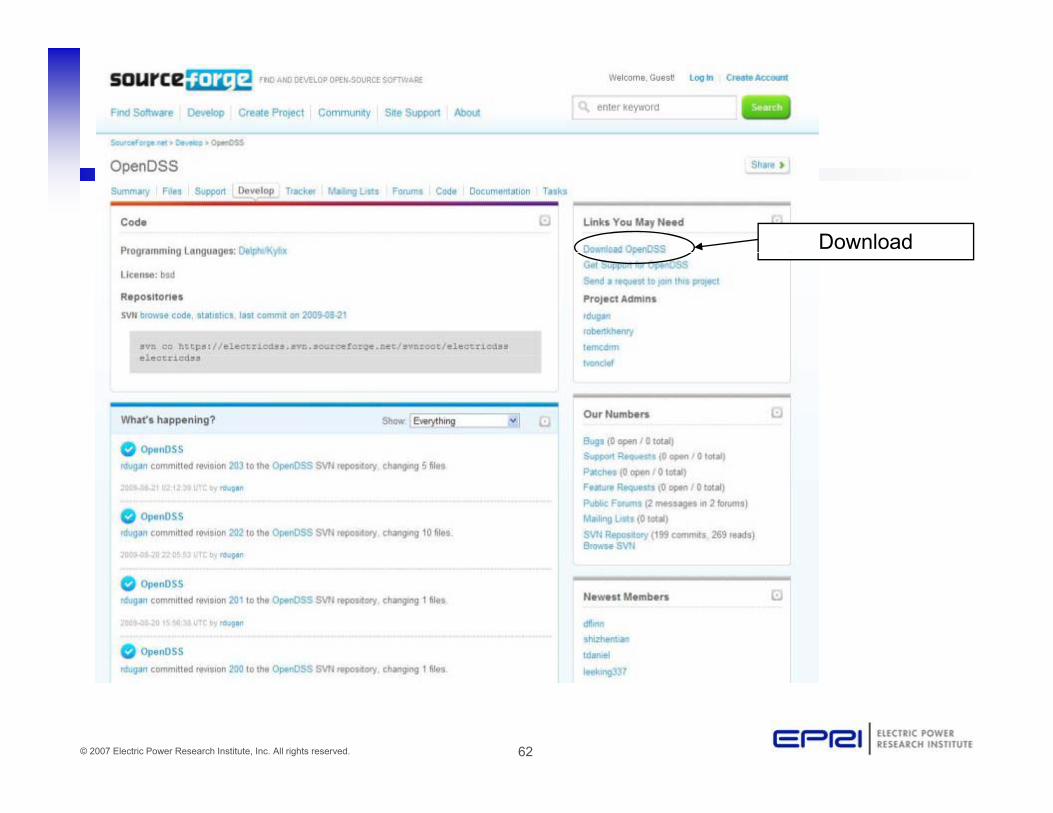
Download
62© 2007 Electric Power Research Institute, Inc. All rights reserved.

Number of Downloads Since May Release
63© 2007 Electric Power Research Institute, Inc. All rights reserved.
Installation files on SourceForge.Net

Known Active* Users Outside EPRI
• Strathclyde UniversityU i it f T
• Cal TechE N• University of Tennessee
• Tennessee Tech / NES• GE
• EnerNex• IEEE Test Feeders WG
GE• KEMA• (Student in Poland)
(B d i b t )• PNNL• Arizona State Univ
(Based on queries about program usage)
* - Active includes those using OpenDSS to benchmark their own tools
64© 2007 Electric Power Research Institute, Inc. All rights reserved.

EPRI Usage
• Green CircuitsPHEV Impacts• PHEV Impacts
• Wind plant and solar power simulations• DG interconnection studies• Harmonics studies• Stray voltage/NEV• As basis for renewable DG screening apps (e.g., P174)g pp ( g , )• Support for Smart Grid Demos (P124)• Distribution State Estimator development (w/ EDF)• Lab support• Lab support• General studies
– Distribution power flow, Loss evalution, etc.At i l f lt t f ti t
65© 2007 Electric Power Research Institute, Inc. All rights reserved.
– Atypical faults, transformer connections, etc.
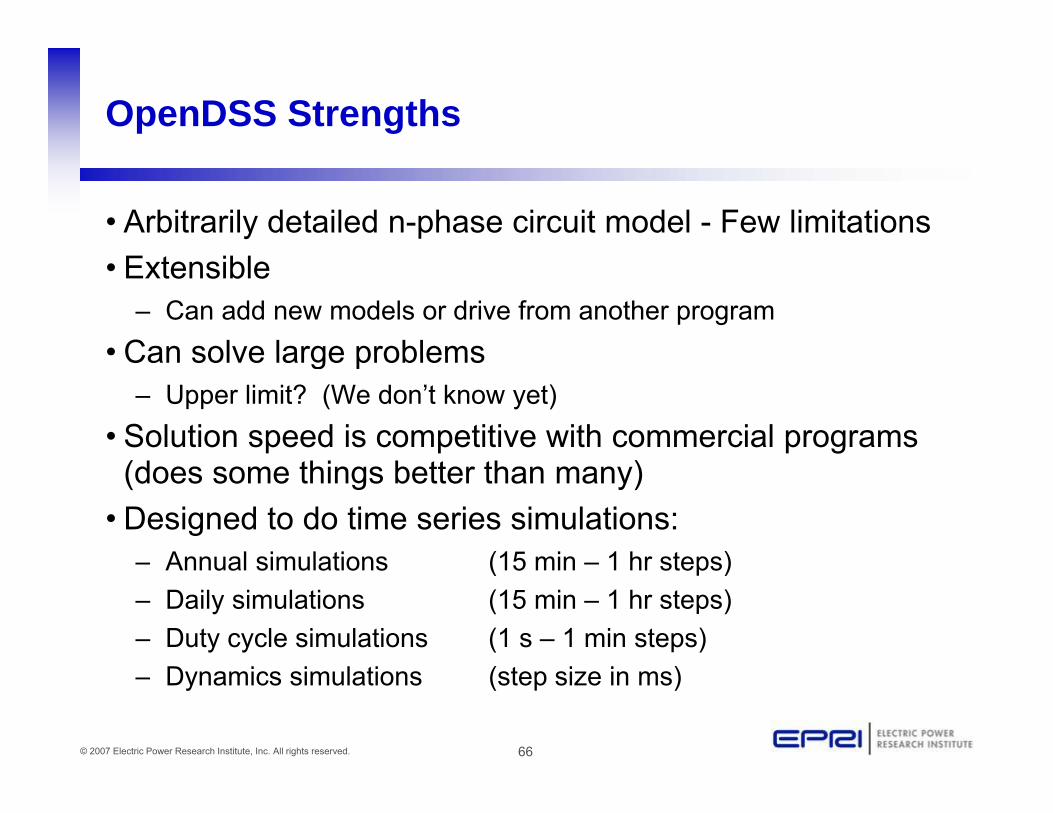
OpenDSS Strengths
• Arbitrarily detailed n-phase circuit model - Few limitations• Extensible
– Can add new models or drive from another program• Can solve large problemsCan solve large problems
– Upper limit? (We don’t know yet)• Solution speed is competitive with commercial programs
(does some things better than many)• Designed to do time series simulations:
Annual simulations (15 min 1 hr steps)– Annual simulations (15 min – 1 hr steps)– Daily simulations (15 min – 1 hr steps)– Duty cycle simulations (1 s – 1 min steps)
66© 2007 Electric Power Research Institute, Inc. All rights reserved.
– Dynamics simulations (step size in ms)

OpenDSS Limitations
• Frequency domain only– Does not currently do electromagnetic transients
• There have been several requests to add itSufficient for >90% of its intended purpose supporting– Sufficient for >90% of its intended purpose supporting distribution planning
• Is a solution engine, not a complete distribution planning g p p gsupport system– Sufficient for research and consulting environment
O i l ft d l• Or a commercial software developer– Lacks graphical circuit data editor and database
• Relies on commercial vendors for that function
67© 2007 Electric Power Research Institute, Inc. All rights reserved.
• Relies on commercial vendors for that function
DSS Architecture
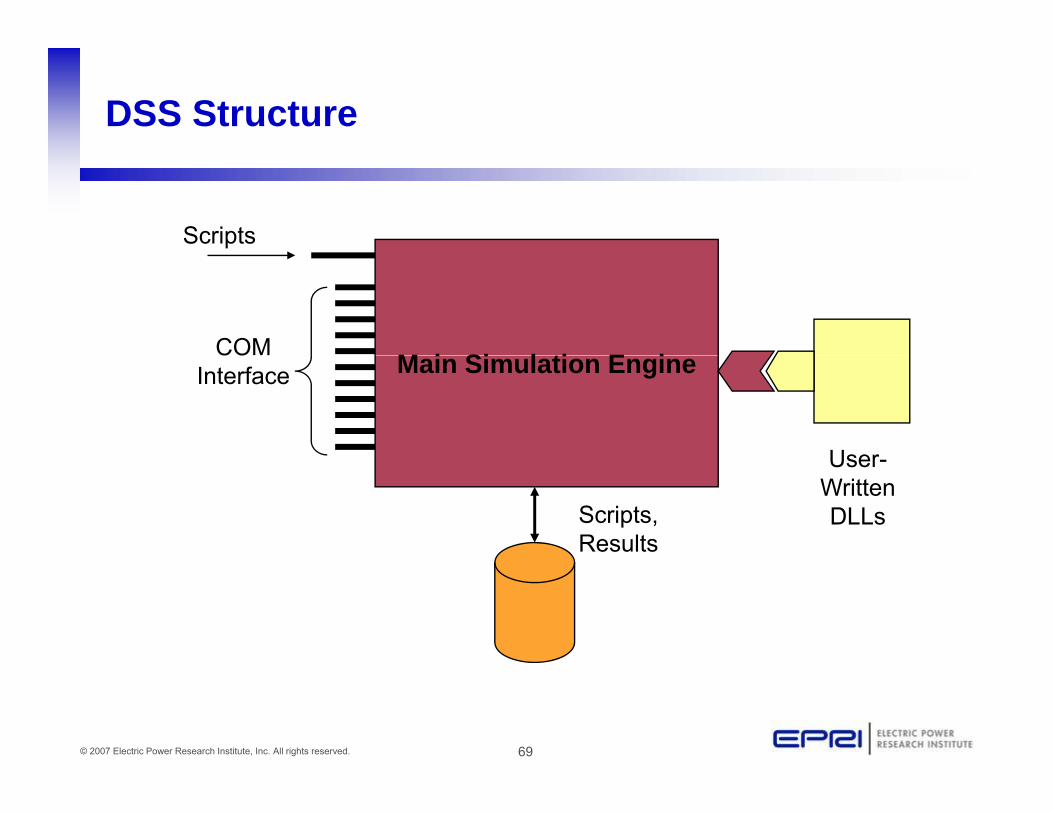
DSS Structure
Scripts
M i Si l ti E iCOM Main Simulation EngineCOInterface
User
Scripts, Results
User-Written DLLs
69© 2007 Electric Power Research Institute, Inc. All rights reserved.
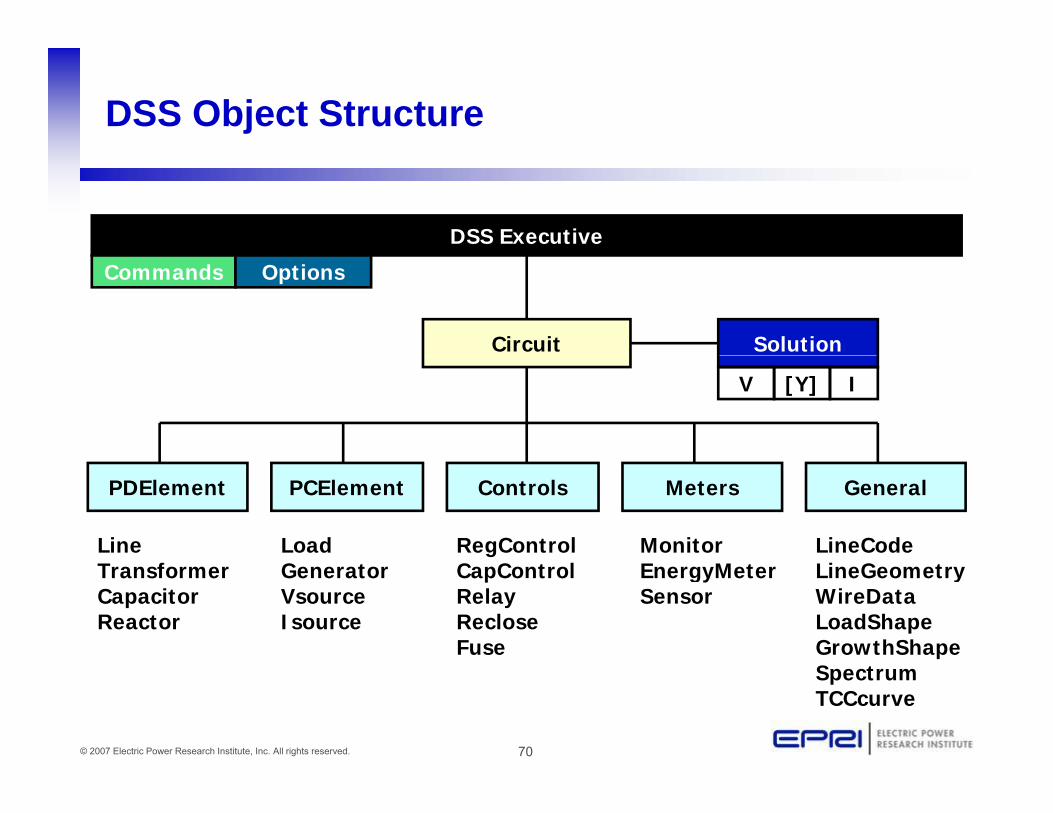
DSS Object Structure
DSS Executive
Circuit
Commands Options
Solution
V [Y] I
PDElement PCElement Controls Meters General
Line Load RegControl Monitor LineCodeTransformerCapacitorReactor
GeneratorVsourceIsource
CapControlRelayRecloseFuse
EnergyMeterSensor
LineGeometryWireDataLoadShapeGrowthShape
70© 2007 Electric Power Research Institute, Inc. All rights reserved.
SpectrumTCCcurve

DSS Object Structure
DSS Executive
Circuit
Commands Options
Solution
V [Y] I
PDElement PCElement Controls Meters General
Line Load RegControl Monitor LineCodeTransformerCapacitorReactor
GeneratorVsourceIsourceStorage
CapControlRelayRecloseFuse
EnergyMeterSensor
LineGeometryWireDataLoadShapeGrowthShape
71© 2007 Electric Power Research Institute, Inc. All rights reserved.
StoreControl SpectrumTCCcurveNEW 11/09
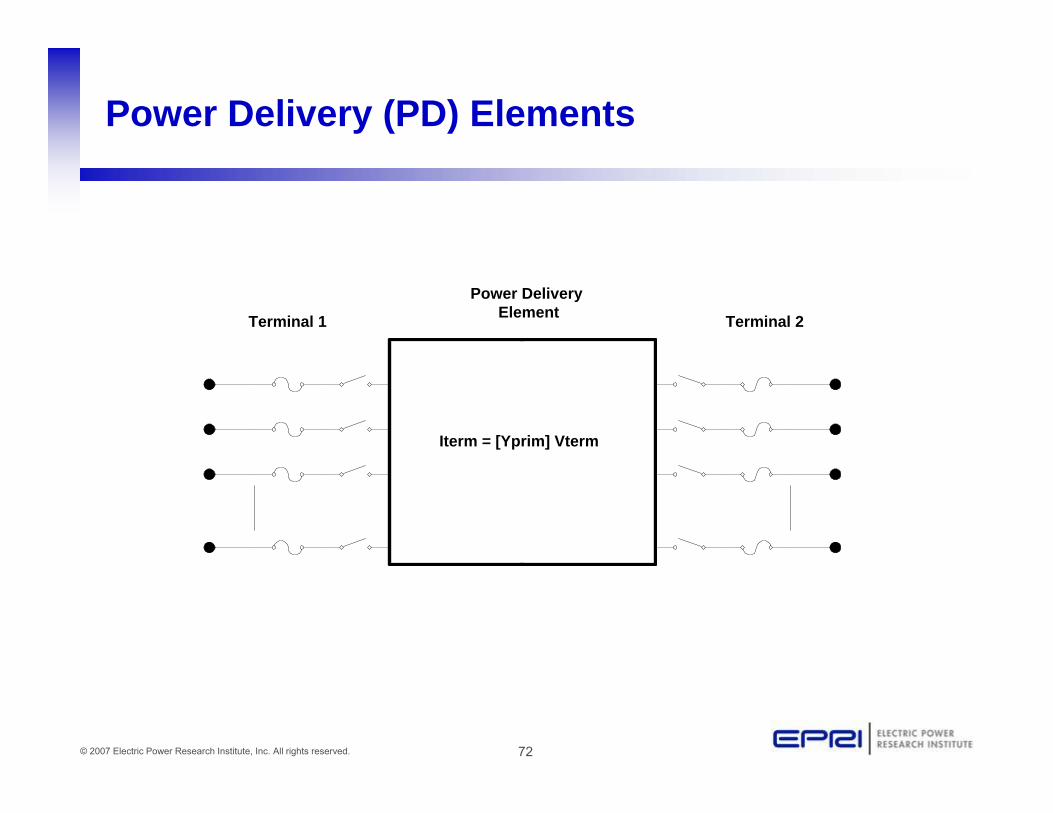
Power Delivery (PD) Elements
Power Delivery Element Terminal 2Terminal 1
Iterm = [Yprim] Vterm
72© 2007 Electric Power Research Institute, Inc. All rights reserved.
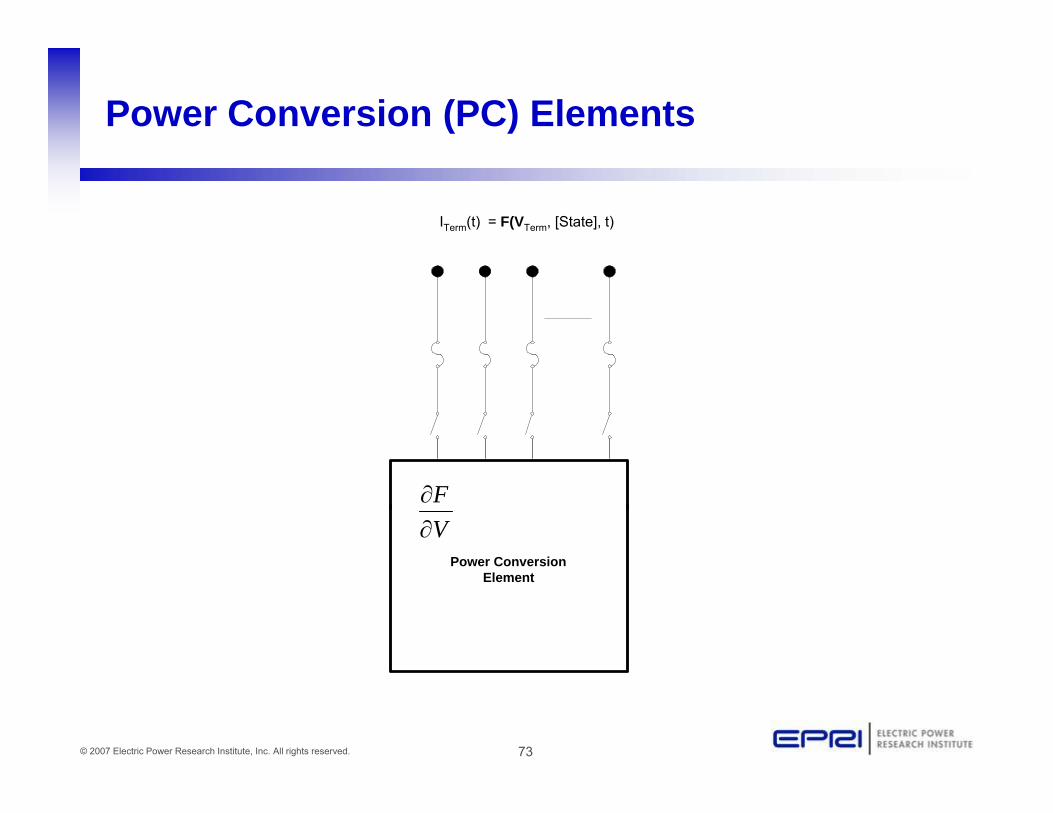
Power Conversion (PC) Elements
ITerm(t) = F(VTerm, [State], t)
Power Conversion
VF∂∂
Power ConversionElement
73© 2007 Electric Power Research Institute, Inc. All rights reserved.

Load (a PC Element)
YprimCompensation CurrentYprimCompensation Current
Non-Linear Part
(One-Line Diagram)Linear Part
74© 2007 Electric Power Research Institute, Inc. All rights reserved.

Putting it All Together
ALL Elements
Yprim 1 Yprim 2 Yprim 3 Yprim n
PC ElementsC ti
I1
Compensation Currents
(Linear Part)
(non-Linear Part)
Y=IinjI2
V Node
Voltages
Im
75© 2007 Electric Power Research Institute, Inc. All rights reserved.
Iteration Loop
Questions I Get …

What Kind of Power Flow does OpenDSS Use?
• The DSS is not a traditional power flow as power engineers tend to think of power flowsengineers tend to think of power flows– It is a Simulator
• Its heritage is harmonics analysis and dynamics analysis– It is a power flow in the sense that you can model loads
connected to buses and get a solution that matches traditional power flow programsp f p g
• The “Normal” solution mode is a fixed point iterative solution that works fine for >90% of distribution systems
• There is a “Newton” solution method for circuits that are• There is a Newton solution method for circuits that are difficult to converge with the Normal method.– Not to be confused with the traditional Newton-Raphson
method in power flow programs
77© 2007 Electric Power Research Institute, Inc. All rights reserved.
method in power flow programs
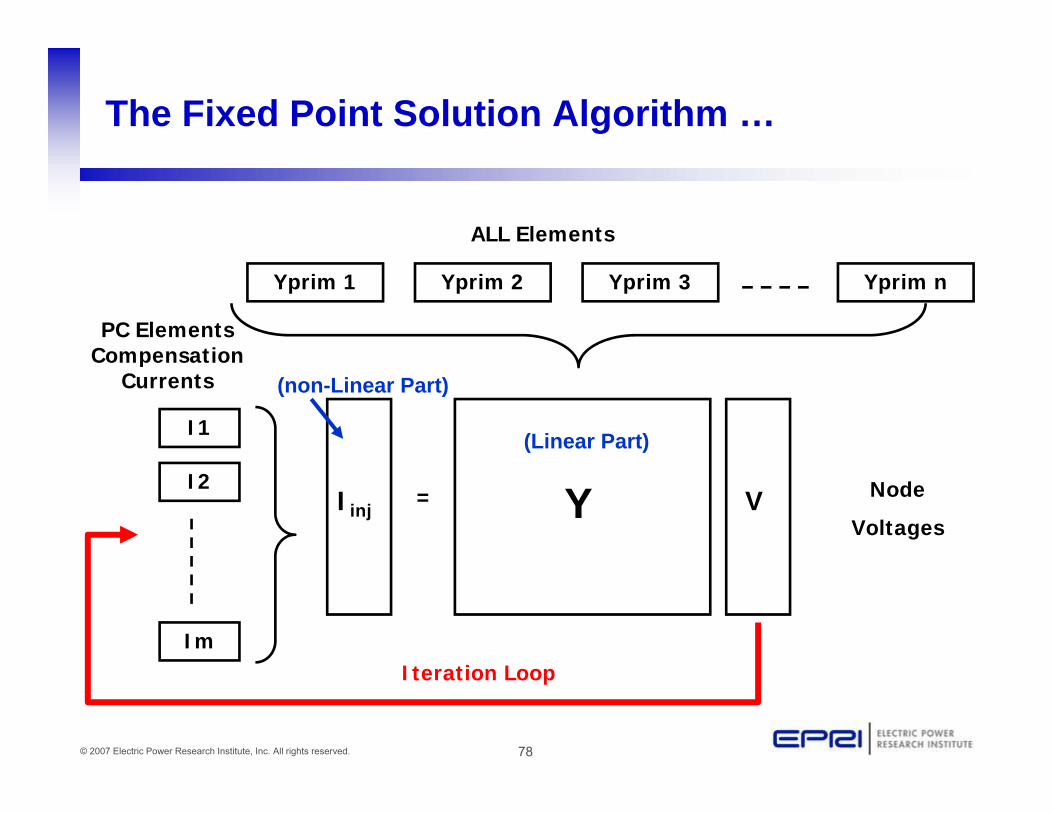
The Fixed Point Solution Algorithm …
ALL Elements
Yprim 1 Yprim 2 Yprim 3 Yprim n
PC ElementsCompensation
I1
Compensation Currents (non-Linear Part)
(Linear Part)
Y=IinjI2
V Node
Voltages
Im
78© 2007 Electric Power Research Institute, Inc. All rights reserved.
Iteration Loop
Solution Speed
• Distribution systems generally converge quite rapidly with y g y g q p ythis method.
• The OpenDSS program seems to be on par with the faster commercial programs or fasterfaster commercial programs – or faster
• It is set up to run annual simulations easily– Our recommendation: Ou eco e dat o
• Err on the side of running more power flow simulations
• That is, don’t worry about the solution time until it proves to be a constraint
• This reveals more information about the problem
79© 2007 Electric Power Research Institute, Inc. All rights reserved.
This reveals more information about the problem.

How Do You Get Currents and Power If You Only Solve for Node Voltages?y g
• One thing that troubles some users who are accustomed to other ways of solving power flows is how the branch currents (and powers) are determined when only the ( p ) yNode voltages and “Compensation” currents are known.
• If the Y matrix is properly formed, and convergence is achieved, the currents will be correct – Trust Kirchoff’s Current Law at nodes!!Trust Kirchoff s Current Law at nodes!!
80© 2007 Electric Power Research Institute, Inc. All rights reserved.
Where Does OpenDSS include Mutual Coupling?p g
• It Always Includes mutual coupling!• It Always Includes mutual coupling!– All circuit element models provide the DSS executive
with an Admittance MATRIX• That is, every model may have coupled phases
– Units on admittance matrix are actual siemens (S)• OpenDSS may report values in per unit, but
internally works in actual volts, amps, siemens• A necessity to model unbalances e gA necessity to model unbalances, e.g,
– 120/240V split-phase distribution transformer– Fault where 69 kV falls on 12.47 kV
81© 2007 Electric Power Research Institute, Inc. All rights reserved.
Can it solve network systems as well as radial?
• The use of the word “Distribution” in the name of the program conjures up ideas of radial circuit solvers inprogram conjures up ideas of radial circuit solvers in North America – (but not necessarily in Europe)( y p )
• The DSS circuit solver is completely general– It has no idea whether the circuit is radial or not.
• Stemming from its harmonics analysis heritage
• The EnergyMeter class is presently the only class that cares about radiality.
82© 2007 Electric Power Research Institute, Inc. All rights reserved.
cares about radiality.
Load and Buses
• There is a subtle difference in the way the DSS treats loads that is confusing to many power engineers:loads that is confusing to many power engineers:
• Traditional power flow programs– “A Bus has load”A Bus has load
• OpenDSS– “A Load has a bus”
• This allows connection of a multitude of different loads and load types to the same busM h fl ibl d f l• Much more flexible and powerful
83© 2007 Electric Power Research Institute, Inc. All rights reserved.
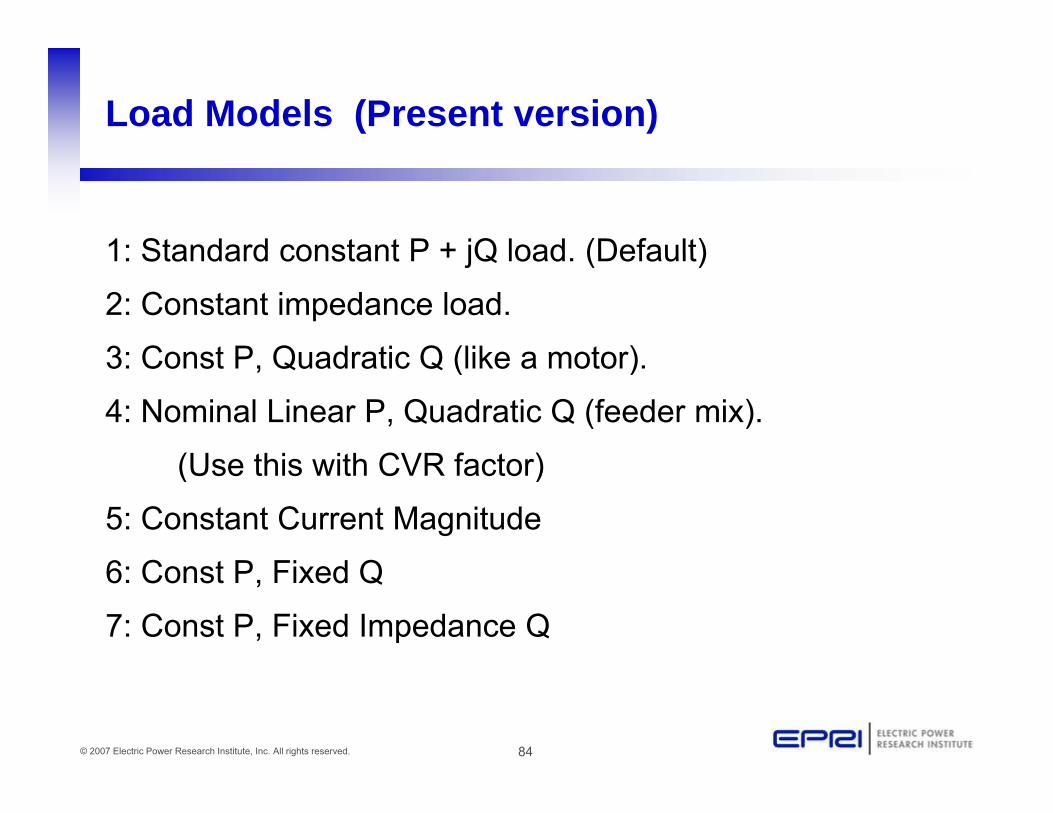
Load Models (Present version)
1: Standard constant P + jQ load (Default)1: Standard constant P + jQ load. (Default)
2: Constant impedance load.
3: Const P Quadratic Q (like a motor)3: Const P, Quadratic Q (like a motor).
4: Nominal Linear P, Quadratic Q (feeder mix).
(U thi ith CVR f t )(Use this with CVR factor)
5: Constant Current Magnitude
6 C P Fi d Q6: Const P, Fixed Q
7: Const P, Fixed Impedance Q
84© 2007 Electric Power Research Institute, Inc. All rights reserved.
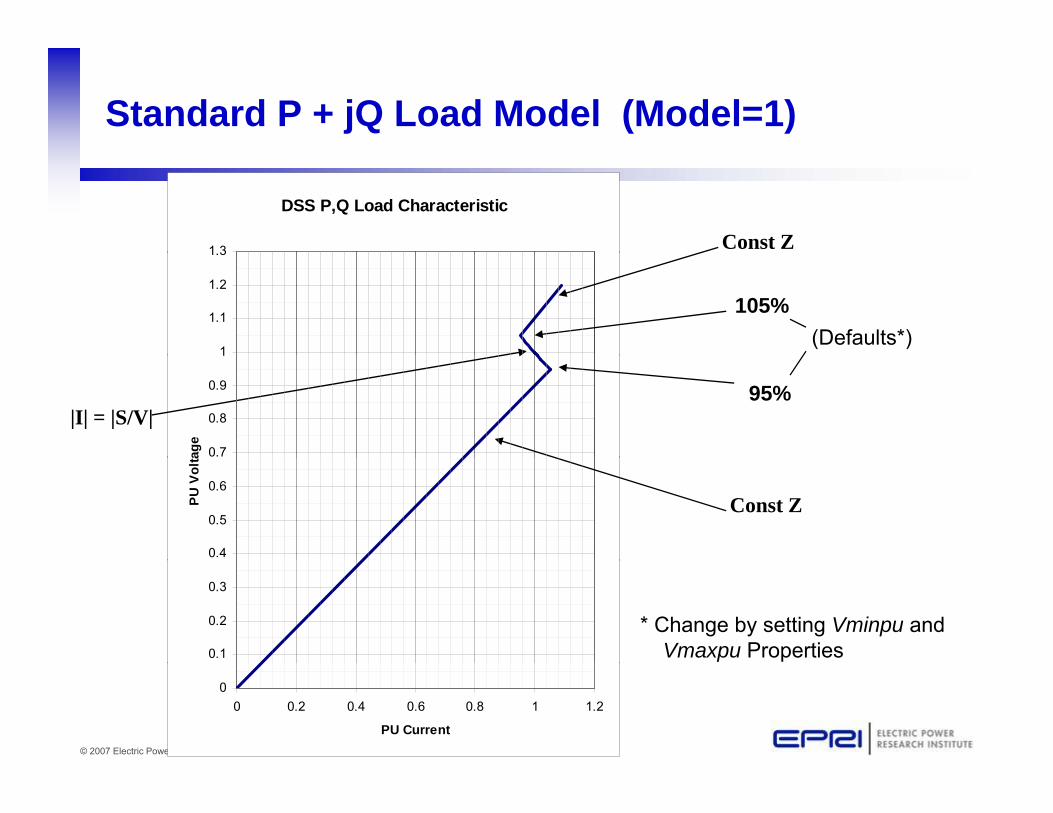
Standard P + jQ Load Model (Model=1)
DSS P,Q Load Characteristic
1 3 Const Z
1
1.1
1.2
1.3
105%(Defaults*)
0.7
0.8
0.9
1
age
95%|I| = |S/V|
0.4
0.5
0.6
PU V
olta
Const Z
0.1
0.2
0.3
* Change by setting Vminpu and Vmaxpu Properties
85© 2007 Electric Power Research Institute, Inc. All rights reserved.
00 0.2 0.4 0.6 0.8 1 1.2
PU Current
Why Do I Need This Kind of Load Model?
• So annual simulations can be executed with less concern for lack of convergencefor lack of convergence
• What happens when the DG trips off and the voltage pp p gdrops really low because the regulators are bucking?– Solution does not break
S l ti t b t b t ill b h th– Solution may not be correct, but will be when the regulators bring the voltage back to normal
• Faults can be simulated during a run and the solution will still converge
Gi th DSS th bilit t l diffi lt bl
86© 2007 Electric Power Research Institute, Inc. All rights reserved.
– Gives the DSS the ability to solve difficult problems

Where is the P-V bus type?
• Buses do not have special types in OpenDSS– Buses are simply connection points for circuit elements
• A Generator can control (or attempt to) power and voltageA Generator can control (or attempt to) power and voltage
• This question usually arises with regard to modeling DG on d bdistribution systems– Fortunately, one seldom needs this model unless the DG is
quite large with respect to system capacityquite large with respect to system capacity– Most DG is controlled by Power and Power Factor while
interconnected
87© 2007 Electric Power Research Institute, Inc. All rights reserved.
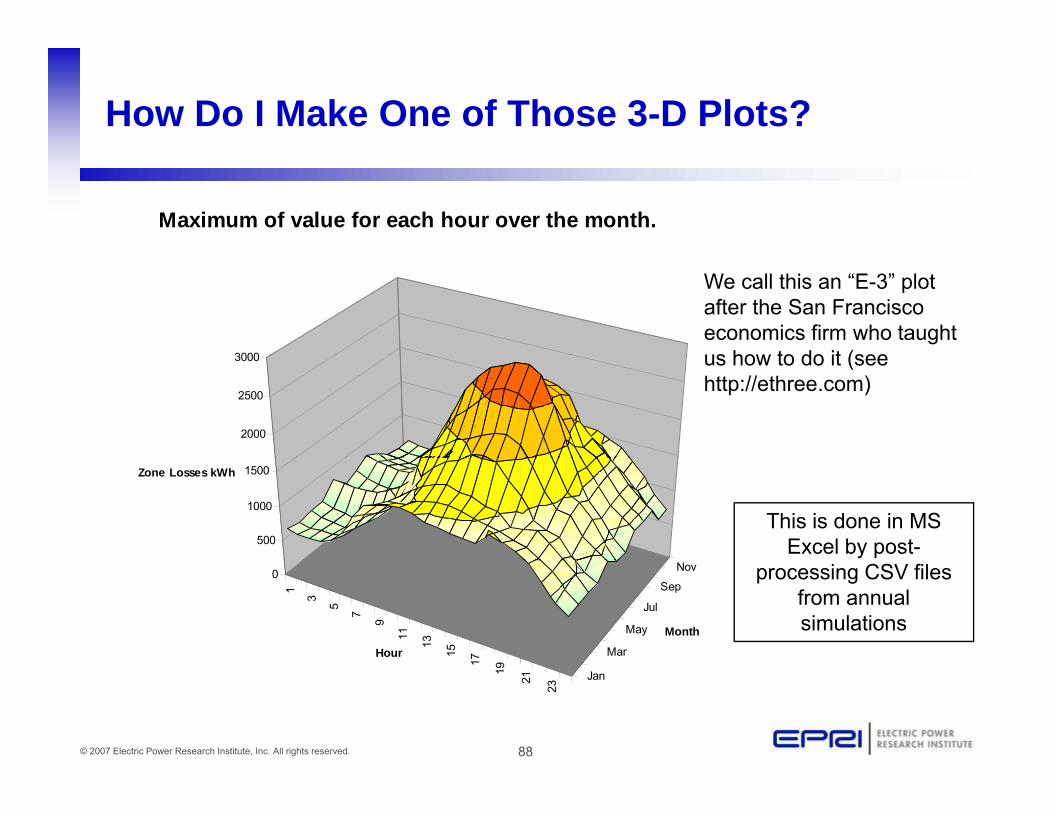
How Do I Make One of Those 3-D Plots?
Maximum of value for each hour over the month.
3000
We call this an “E-3” plot after the San Francisco economics firm who taught us how to do it (see
2000
2500
3000 us how to do it (see http://ethree.com)
500
1000
1500Zone Losses kWh
This is done in MS Excel by post-
1
3
5
7
9
11
13
15
17 9
Mar
May
Jul
Sep
Nov0
Hour
Month
processing CSV files from annual simulations
88© 2007 Electric Power Research Institute, Inc. All rights reserved.
1
19
21
23
Jan
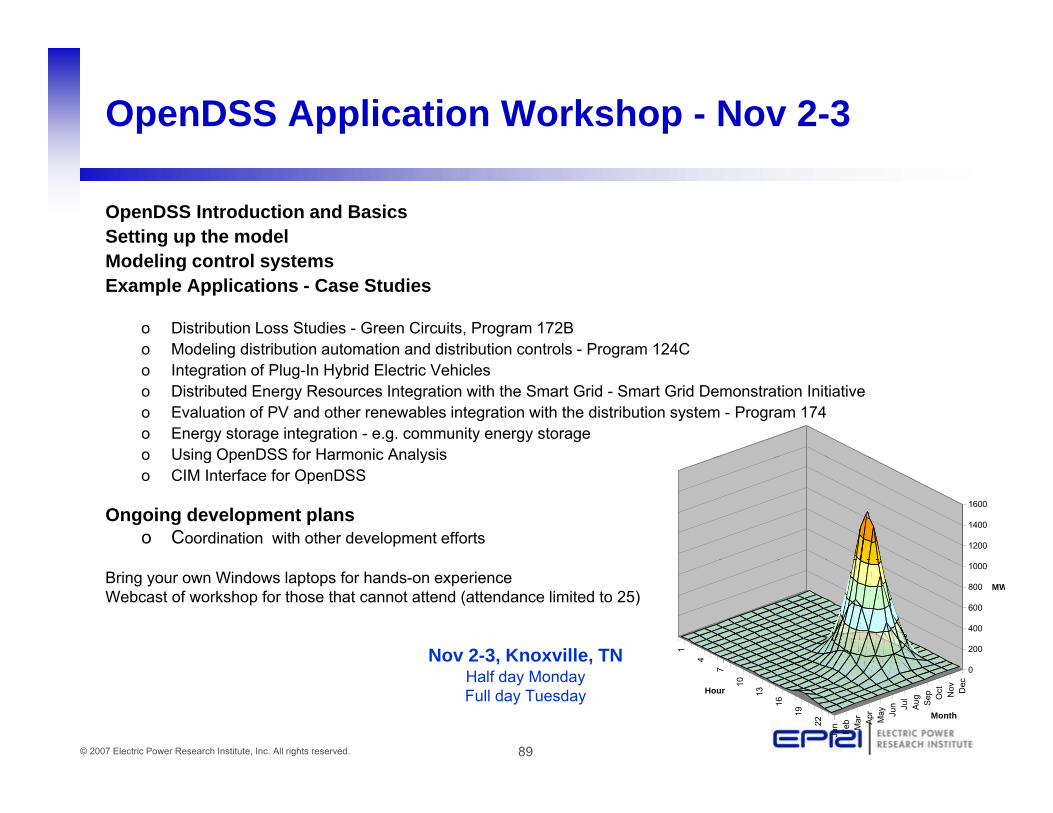
OpenDSS Application Workshop - Nov 2-3
OpenDSS Introduction and Basics Setting up the model Modeling control systems Example Applications - Case Studies
o Distribution Loss Studies - Green Circuits, Program 172B o Modeling distribution automation and distribution controls - Program 124C g go Integration of Plug-In Hybrid Electric Vehicles o Distributed Energy Resources Integration with the Smart Grid - Smart Grid Demonstration Initiative o Evaluation of PV and other renewables integration with the distribution system - Program 174 o Energy storage integration - e.g. community energy storage o Using OpenDSS for Harmonic Analysis
1200
1400
1600
o Using OpenDSS for Harmonic Analysis o CIM Interface for OpenDSS
Ongoing development plans o Coordination with other development efforts
1
4
200
400
600
800
1000
MWBring your own Windows laptops for hands-on experienceWebcast of workshop for those that cannot attend (attendance limited to 25)
Nov 2-3, Knoxville, TN
89© 2007 Electric Power Research Institute, Inc. All rights reserved.
7
10
13
16
19
22
Jan
Feb
Mar Apr May Ju
n Jul
Aug
Sep Oct Nov Dec
0
Hour
Month
, ,Half day Monday Full day Tuesday
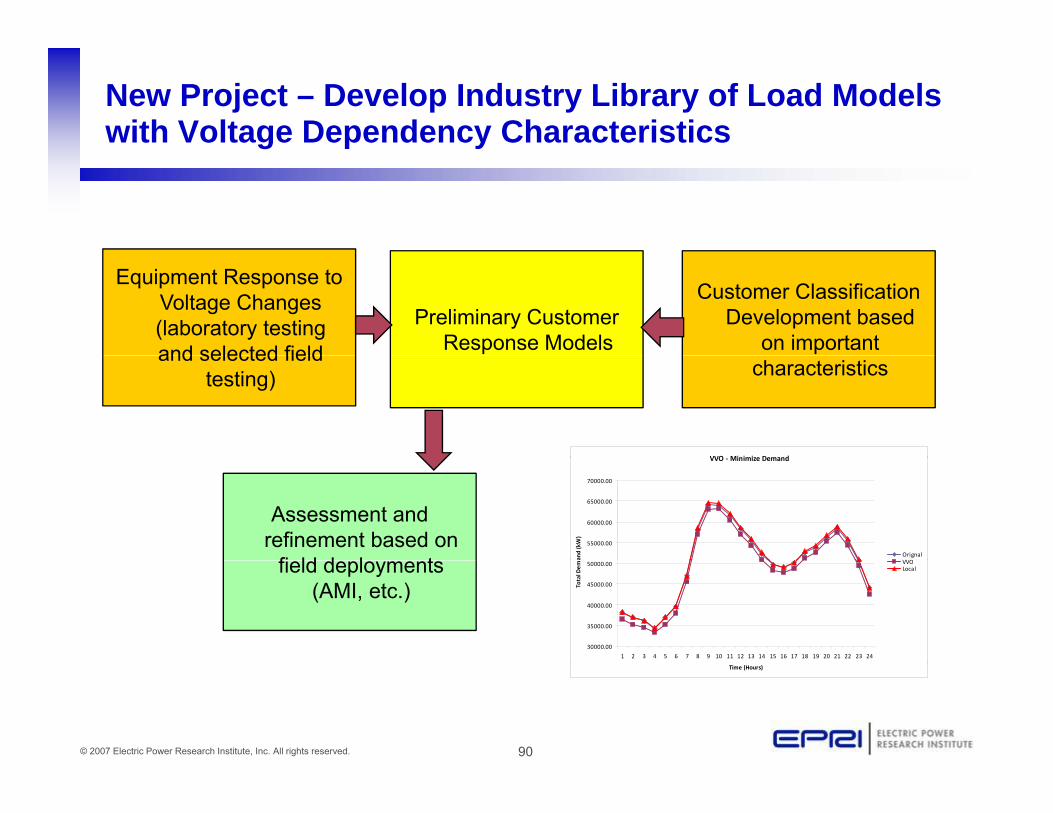
New Project – Develop Industry Library of Load Models with Voltage Dependency Characteristics
Equipment Response to Voltage Changes (laboratory testing and selected field
Customer Classification Development based
on important Preliminary Customer
Response Modelsand selected field testing) characteristics
VVO Minimize Demand
Assessment and refinement based on
fi ld d l t
VVO ‐ Minimize Demand
55000.00
60000.00
65000.00
70000.00
and (kW)
OrignalVVOfield deployments
(AMI, etc.)
30000.00
35000.00
40000.00
45000.00
50000.00
1 2 3 4 5 6 7 8 9 10 11 12 13 14 15 16 17 18 19 20 21 22 23 24
Total D
em
VVOLocal
90© 2007 Electric Power Research Institute, Inc. All rights reserved.
Time (Hours)
Questions?
Agenda
•Active Distribution Management Overview
•Modeling Considerations and OpenDSS
•Examples of Active Distribution Management and•Examples of Active Distribution Management and CIGRE C6.11 Activities
IEEE Di t ib ti A t ti W ki G• IEEE Distribution Automation Working Group
•Demonstrations
92© 2007 Electric Power Research Institute, Inc. All rights reserved.
Summary of CIGRE and Canadian Activities
EPRI Active Distribution Network Workshop
Activities
p
Chad AbbeyChad AbbeyOctober 4, 2009
Overview
CIGRE ti iti> CIGRE activities
> Canadian Initiatives• Utility projects
• Industry collaborations
• NRCan activities
• Testing facilities
> Summary
Groupe – Technologie94
C6.11 Development and operation of active distribution networksactive distribution networks
Overview of activities
C6.11 Achievements
P ti f ti di t ib ti > Preparation of a survey on active distribution networks
• Define Active distribution network concept and Define Active distribution network concept and main features
• Review actual status of implementation and barriers
• Review actual operational rules for DG
> Definition of 5 sub-WG and review of questionnaire responsesquestionnaire responses
> Published survey result in Electra and at CIRED
Groupe – Technologie96
Active Distribution Network Definition
A ti t k di t ib ti t k ith Active networks are distribution networks with Distributed Energy Resources (generators and storage) and flexible loads subject to control. g ) j
DERs and participating loads take some degree of responsibility for system support, which will depend on a suitable regulatory environment and connection agreements. The DSO may also and connection agreements. The DSO may also have the possibility to manage electricity flows using a flexible network topology.
Groupe – Technologie97
Future Activities
> Summarize results from EPRI events> Summarize results from EPRI events> Document innovative pilot projects using
standard templatep> Classify active distribution network projects
• Objectives and driversb d d• Distribution system operator, private producer, and
societal benefits• Enabling technologies• Barriers, catalysts / triggers • Research needs
H l d t EPRI di t ib ti d
Groupe – Technologie98
> Help update EPRI distribution roadmap

Sources of Information
> Inte national e ents EPRI Wo kshops > International events – EPRI Workshops, conferences
> EU projects - More Microgrids > EU projects - More Microgrids, ADDRESS, ADINE
> Smart Grid Demos> Smart Grid Demos> Other National Programs
• Australia, Canada, Korea, Japan• Australia, Canada, Korea, Japan
> Active Network Management database• http://cimphony org/cimphony/anm/
Groupe – Technologie99
• http://cimphony.org/cimphony/anm/
Technical Report Outlinep
I t d ti> Introduction
> Survey results and definition
> Present level of development of ADN• Methodology
• Pilot project results
> The way to the futuree ay to t e utu e• Conclusions
• Recommendations
Groupe – Technologie100
• Recommendations
Active Distribution Networks in CanadaCanada
Overview
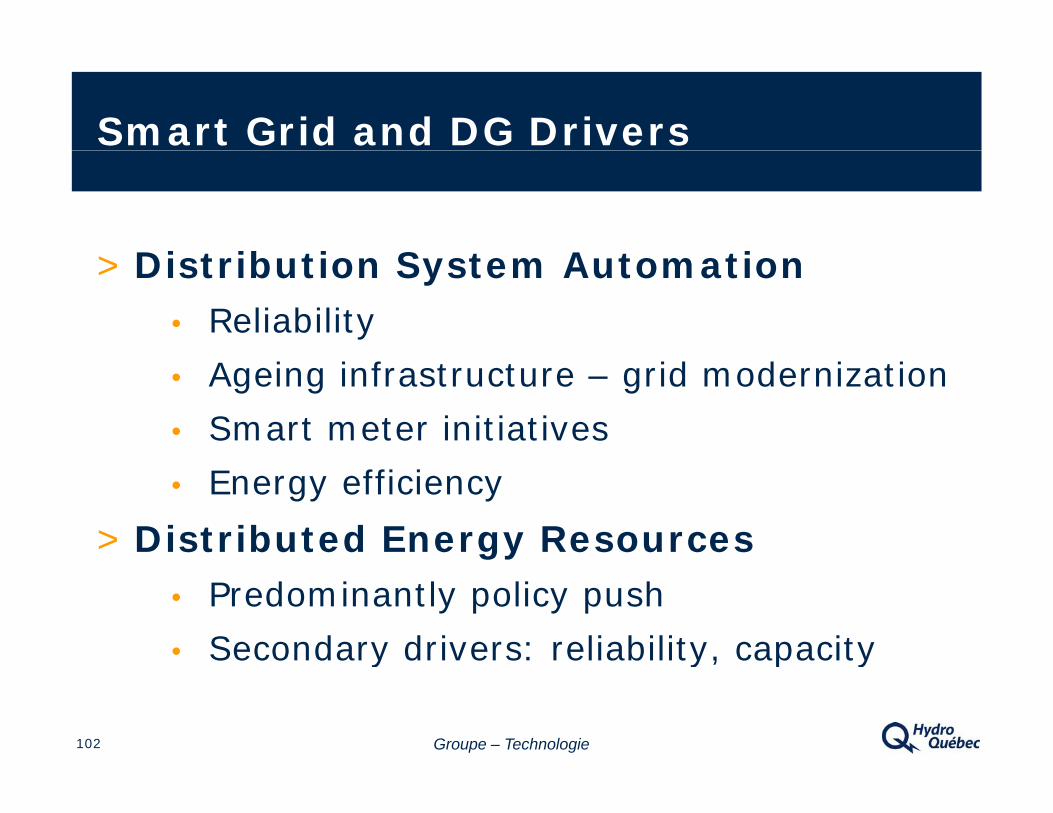
Smart Grid and DG Drivers
Di t ib ti S t A t ti> Distribution System Automation• Reliability
• Ageing infrastructure – grid modernization
• Smart meter initiatives
• Energy efficiency
> Distributed Energy Resources• Predominantly policy push
• Secondary drivers: reliability, capacity
Groupe – Technologie102
y y, p y
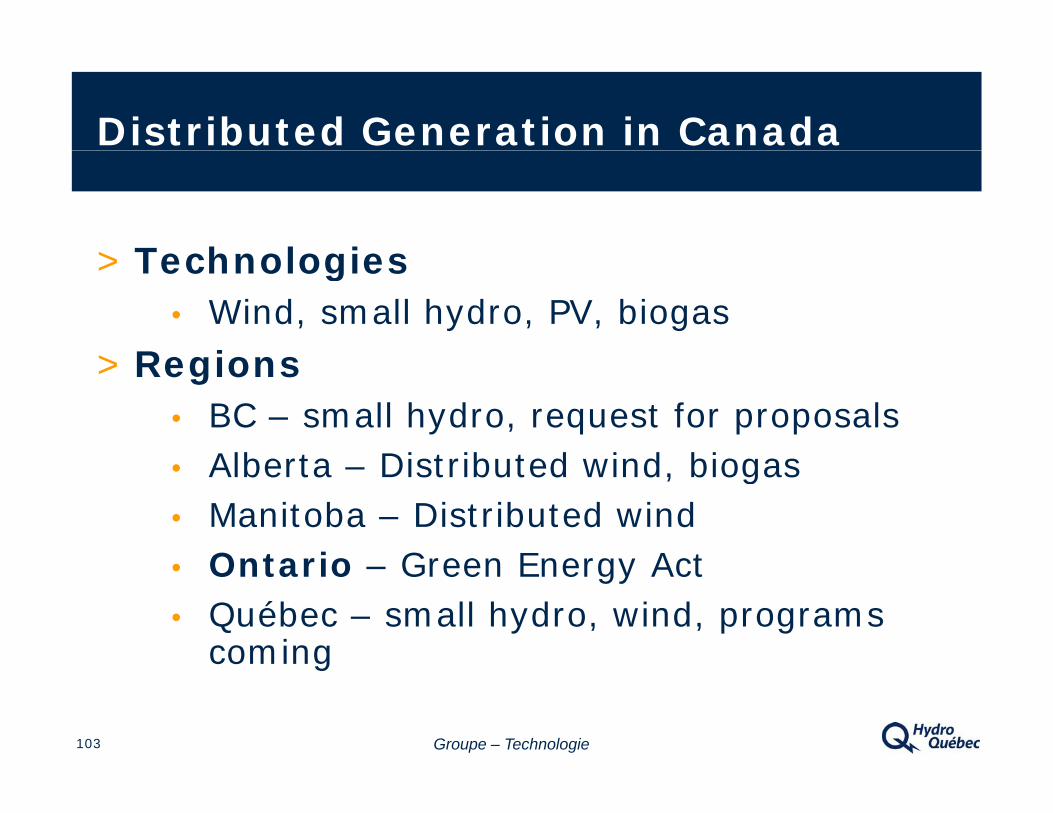
Distributed Generation in Canada
> Technologies> Technologies• Wind, small hydro, PV, biogas
> R i> Regions• BC – small hydro, request for proposals
Albe ta Dist ib ted ind biogas• Alberta – Distributed wind, biogas• Manitoba – Distributed wind
Ontario Green Energy Act• Ontario – Green Energy Act• Québec – small hydro, wind, programs
coming
Groupe – Technologie103
coming

Example - Impact of SOP West of Toronto (2005)
Groupe – Technologie104Source: M. Dang, Hydro One

Example - Impact of SOP West of Toronto (2007)
Orangevilleg
Goderich
Groupe – Technologie105Source: M. Dang, Hydro One
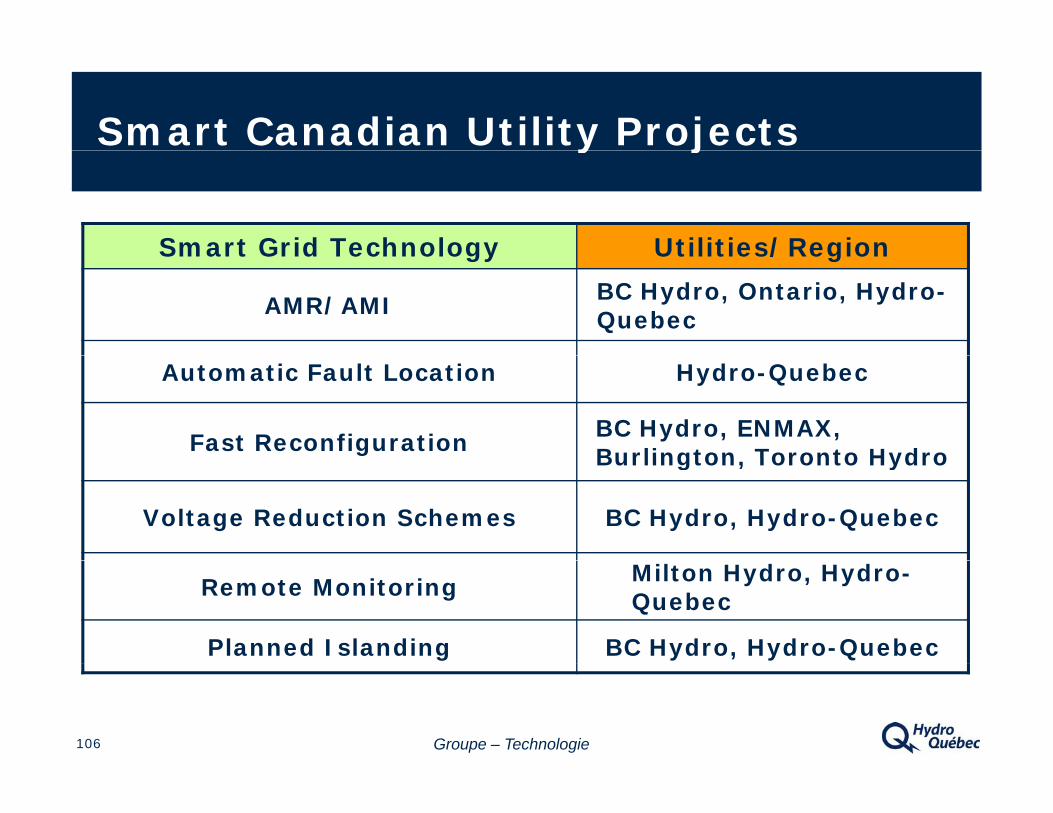
Smart Canadian Utility Projectsy j
Smart Grid Technology Utilities/RegionSmart Grid Technology Utilities/Region
AMR/AMI BC Hydro, Ontario, Hydro-Quebec
Automatic Fault Location Hydro-Quebec
Fast Reconfiguration BC Hydro, ENMAX, Burlington Toronto HydroBurlington, Toronto Hydro
Voltage Reduction Schemes BC Hydro, Hydro-Quebec
Remote Monitoring Milton Hydro, Hydro-Quebec
Planned Islanding BC Hydro, Hydro-Quebec
Groupe – Technologie106
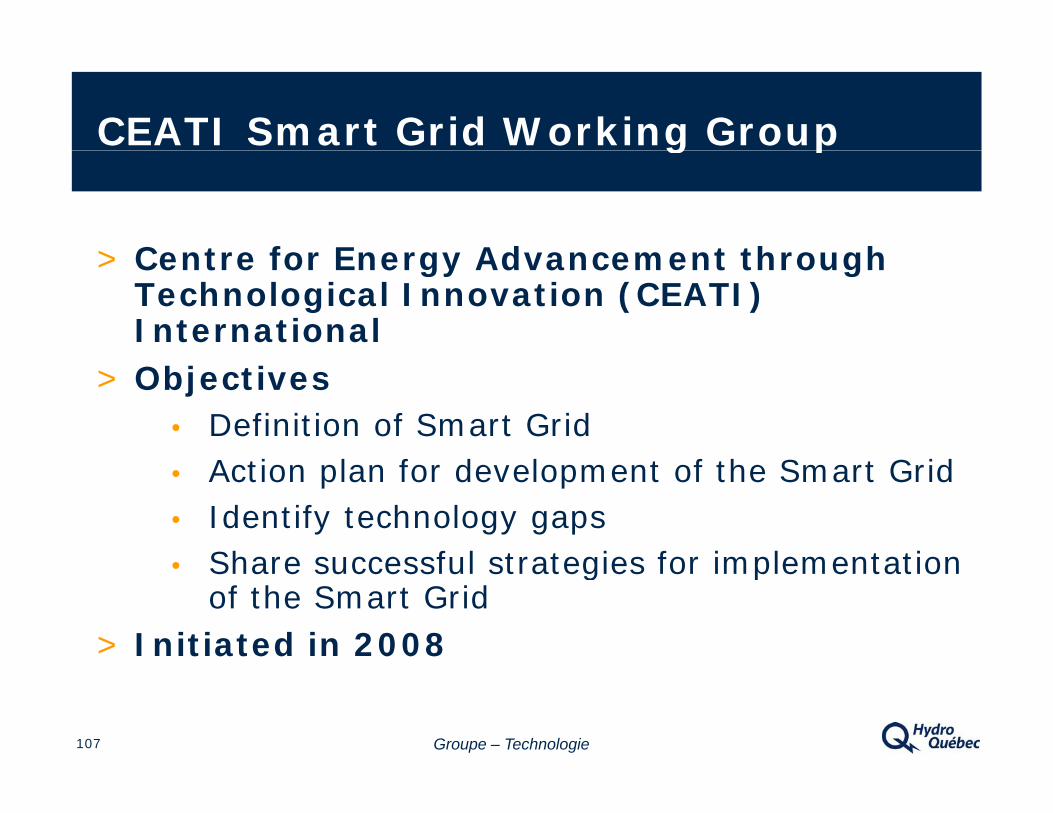
CEATI Smart Grid Working Groupg p
> Centre for Energy Advancement through > Centre for Energy Advancement through Technological Innovation (CEATI) International
> Objectives• Definition of Smart Grid
l f d l f h d• Action plan for development of the Smart Grid• Identify technology gaps
Share successful strategies for implementation • Share successful strategies for implementation of the Smart Grid
> Initiated in 2008
Groupe – Technologie107
Ontario Smart Grid Forum
> Participation> Participation
• Led by IESO• Utilities, suppliers, government, pp , g
> Objectives
• Develop a high level vision of Ontario Smart Grid• Educate industry leaders on drivers, technologies• Identify enablers and barriers
> Outputs> Outputs
• Report on findings and recommendations• Website:
h / b/ k d / d
Groupe – Technologie108
www.theimo.com/imoweb/marketsandprograms/smart_grid.asp
Ontario – Encouraging Smart Grid and RenewablesRenewables
> Smart Grid Forum releases its finding – February 2009> Smart Grid Forum releases its finding – February 2009> Green Energy Act created – feed-in tariffs for
renewables – May 14, 2009> Ontario Energy Board (OEB) - draft guidelines on > Ontario Energy Board (OEB) - draft guidelines on
planning for smart grid architecture - June 16, 2009> Important elements:
• Creation of new deferral accounts for capital investments • Creation of new deferral accounts for capital investments incurred related to the development of a smart grid or the accommodation of new renewables.
• Introduction of a mechanism to provide advance funding for expenditures to accommodate new renewables or develop a smart grid.
• Initial guidance to distributors on planning to accommodate new renewables and a smart grid
Groupe – Technologie109
accommodate new renewables and a smart grid.
NRCan DG Study Groupy p
> Membership> Membership• Utilities: BC Hydro, Hydro Quebec, NB Power• Manufacturers: GE Multilink, SEL• Private producers
> Activities• Review of utility interconnection guidelines (Hydro • Review of utility interconnection guidelines (Hydro
One)• Provide advice on cost effective DG interconnection
technologygy• Linking Smart Grid with DG
– Remote monitoring and control, advanced protection
Groupe – Technologie110

NRCan Clean Energy Fundgy
> Rene able Ene g and Clean Ene g > Renewable Energy and Clean Energy Systems Demonstration Projects
• Deadline – September 14 2009• Deadline September 14, 2009• Project selection - mid-November
> Large Scale CCS Demonstration Projects > Large Scale CCS Demonstration Projects > Research and Development Projects
• Integration of renewable energy• Integration of renewable energy• Multi-stakeholder and Canada-US
collaborations encouraged
Groupe – Technologie111
g

Canadian Test Facilities
> Low voltage test facility (CanmetENERGY):
Multiple inverters and interconnection testing• Multiple inverters and interconnection testing
> 120-kVA, 3ph Grid simulator
> 5kW/15kW Solar Simulator
> Adjustable RLC loads
> Medium voltage test facility (IREQ-HQ):
• Distribution automation network testing
A di l 25 kV f d (35 > A radial 25-kV feeder (35 poles, 370m)
> 300-kW, 600 V, resistive, inductive and motor loads
Groupe – Technologie112
> Induction and synchronous generators

IREQ Feeder LayoutQ y
> 3 feede s (common so ce)> 3 feeders (common source)> Dedicated 47-MVA 25-kV
transformer at the substation transformer at the substation Completely independent from the distribution network
> 2 x 3 167-kVA transformers - 14.4 kV/347 V
> Internet and phone lines to all equipmentA ili 3 120 V
Groupe – Technologie113
> Auxiliary power 3 x 120 V

3 Small buildings : LoadC l d i i iControl and acquisitionDistributed generation
IREQ’s test line
Distribution Automation Equipmentq p
25 kV l b k> 25 kV reclosers, breakers
> Automation equipment• Remote monitoring
• Smart meters
> Switchable capacitor banks
> 25 kV in-line voltage regulator5 e o tage egu ato
Groupe – Technologie115

CL-6A regulator control
Voltage regulator – 3 phasesCooper VWVE recloser
CL-6A regulator control
25 kV measuring station (voltage and current)Schweitzer SEL-351R for Recloser
Map of line

Acquisition computer
25-kV voltage and current transformers
DC measurementsVoltage and current
Acquisition and storage unit 600-V current measurements
Load Banks
3 h i ti /i d ti l d> 3-phase resistive/inductive loads• (DELTA or/and STAR)
• (Independently controllable phases, distortion, PF adjustment)
T t l f 400 kW i ti• Total of 400 kW resistive
> Induction motor• AC drive, variable load of 150 kW
• Drives DC alternator
Groupe – Technologie118

Resistive and inductive loadsLoad for motor
AC induction motor and DC generator
AC Drive for induction motor
Load and acquisition control room

Distributed Energy Resourcesgy
> DG technologies> DG technologies
• Induction machine
• Synchronous machine 3PH+
Synchronous GeneratorDC Motor
VDCDC
y– Diesel generator
– Motor driven synchronous
+Supply ACDCVS
IF(dc) F(ac)Iy
generator
> Future considerations
• Inverter interfaced AC
InductionMotor
VACSupply
Synchronous Generator
3PH• Inverter interfaced
• Wind turbine nacelle
ACSupply
F(ac)
AC
I
fsmV
Groupe – Technologie120
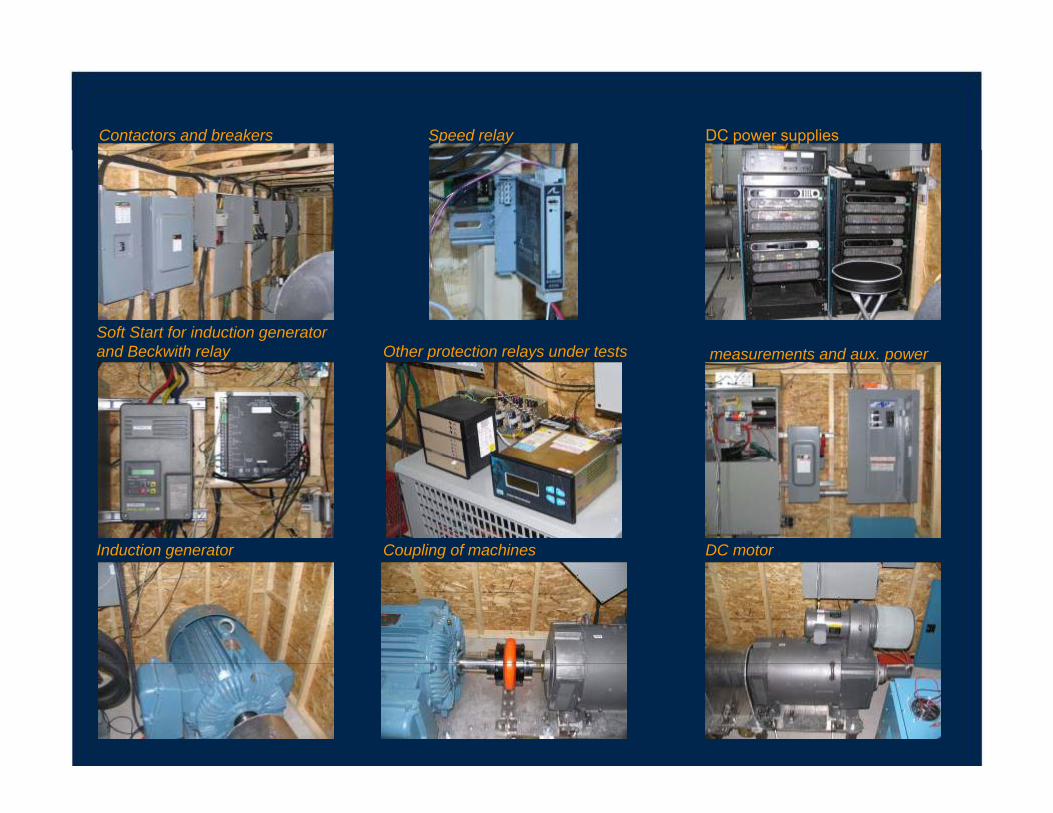
Contactors and breakers Speed relay DC power supplies
Soft Start for induction generator and Beckwith relay Other protection relays under tests measurements and aux powerand Beckwith relay Other protection relays under tests measurements and aux. power
Induction generator DC motorCoupling of machines
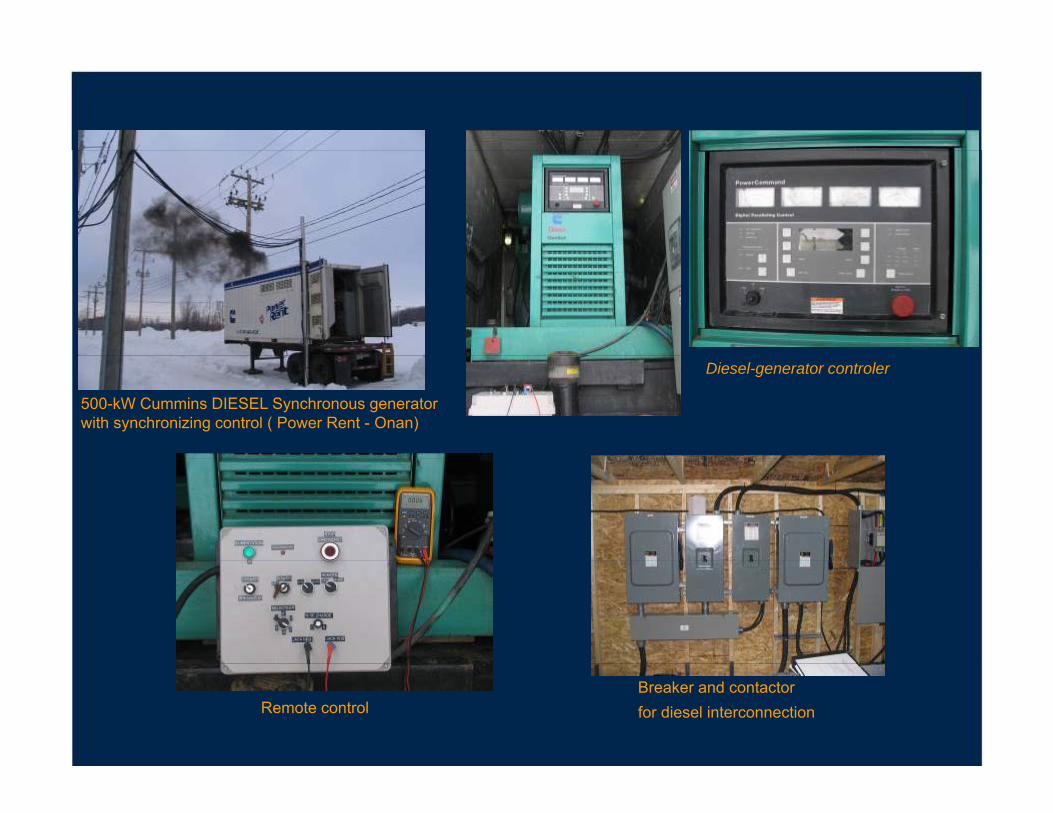
500-kW Cummins DIESEL Synchronous generatorwith synchronizing control ( Power Rent - Onan)
Diesel-generator controler
Remote controlBreaker and contactor for diesel interconnection

Testing Capabilitiesg p
> Capacitor switching> Capacitor switching> Reverse power flow characteristics of
distribution transformers> Evaluation of protection relays for anti-
islanding• Diesel synchronous generator • Asynchronous machine to emulate a
Wind generator> Behavior of DG in a remote gridg> Testing of reclosers during faults> Operation of in-line voltage regulator in the
presence of distributed generation
Groupe – Technologie123
presence of distributed generation

Feeder Configurationsg
R di l
120 kV /25 kVҮ-Δ
47 MVA
> Radial or meshed
Adj t bl li RC2RC1Z = 7.5 Ω
> Adjustable line impedance
M lti l Generation X1
> Multiple feeders Control
Centre
3-200 kVA14 A
VR
600 V/25 kV3-167 kVA
F1
Loads600 V / 25 kV
3-167 kVA
Groupe – Technologie124
X2
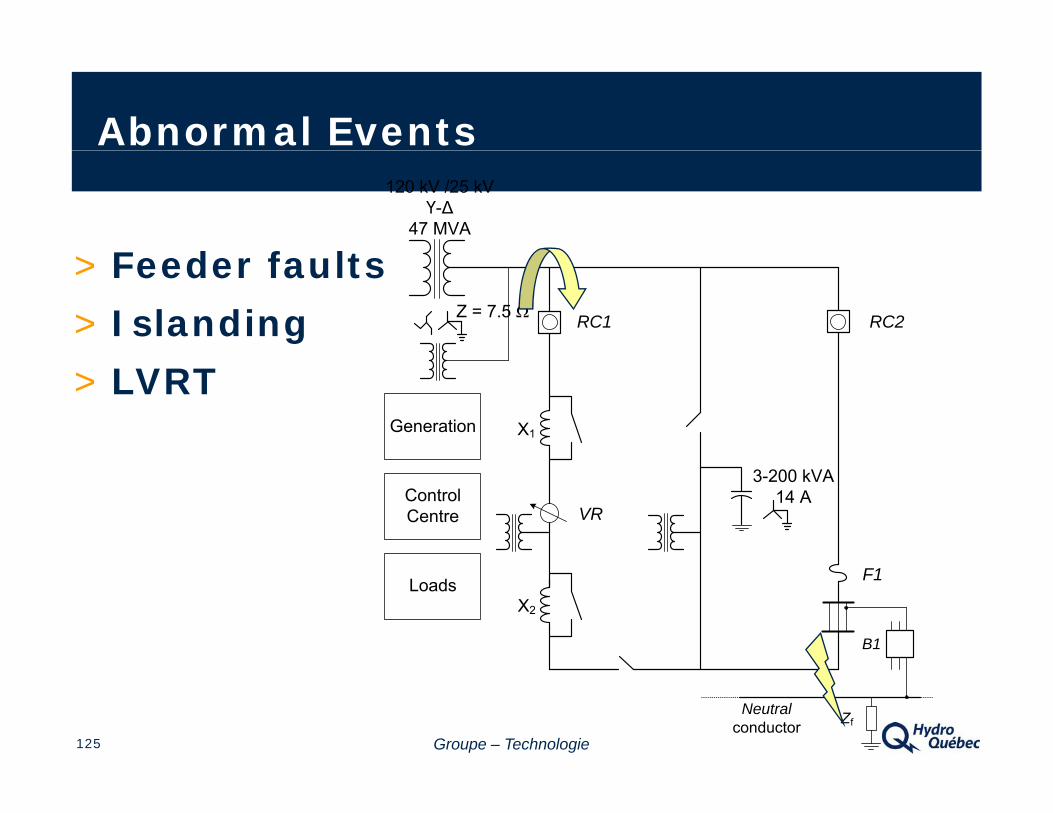
Abnormal Events120 kV /25 kV
Ү-Δ47 MVA
F d f ltRC2RC1Z = 7.5 Ω
> Feeder faults
> Islanding
Generation X1
> LVRT
Control Centre
3-200 kVA14 A
VR
F1LoadsX2
B1
Groupe – Technologie125
ZfNeutral
conductor

Emulation of Distribution System Loady
C t ll bl
120/25 kV47 MVA
> Controllable loads for basic tests
RC2RC1
tests
> Phase-shifter to emulate larger
Generation
VR
X1
emulate larger loads (future) 0.6/25 kV
3-167 kVA0.6/25 kV3-167 kVA
Control Centre
Loads
VR
Loads
X2
Groupe – Technologie126
Phase-shiftingtransformer

Summaryy
> CIGRE C6 11 collaboration on active > CIGRE C6.11 - collaboration on active distribution networks
> Investments in Canada’s power systemsp y• Maintain / improve reliability• Improve energy efficiency• Integration of renewable energy
> Coordinated research and demonstration projectsprojects
• Test facilities – CanmetENERGY, IREQ test line• Demonstration projects
Groupe – Technologie127
• Demonstration projects

Contact Information
Ch d Abb IREQChad Abbey - IREQ
E-mail: [email protected]
Tel. +1 450-652-8499 ext 2188
David Beauvais – CanmetENERGY, NRCan
E-mail: dbeauvai@nrcan gc caE mail: [email protected]
Tel. +1 450-652-5995
Groupe – Technologie128
Agenda
•Active Distribution Management Overview
•Modeling Considerations and OpenDSS
•Examples of Active Distribution Management and•Examples of Active Distribution Management and CIGRE C6.11 Activities
IEEE Di t ib ti A t ti W ki G• IEEE Distribution Automation Working Group
•Demonstrations
129© 2007 Electric Power Research Institute, Inc. All rights reserved.
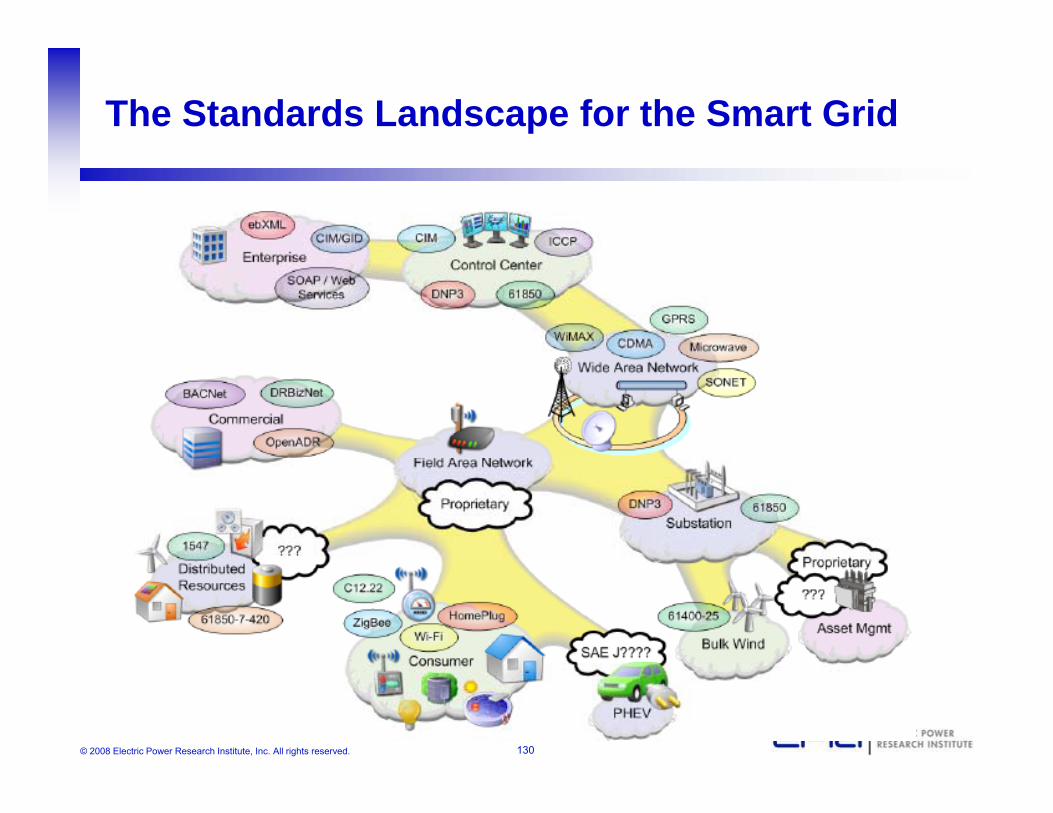
The Standards Landscape for the Smart Grid
130© 2008 Electric Power Research Institute, Inc. All rights reserved.

Application Guide for Smart Distribution
• Joint development with IEEE Distribution Automation Working GroupWorking Group
• Wiki.powerdistributionresearch.com
131© 2008 Electric Power Research Institute, Inc. All rights reserved.
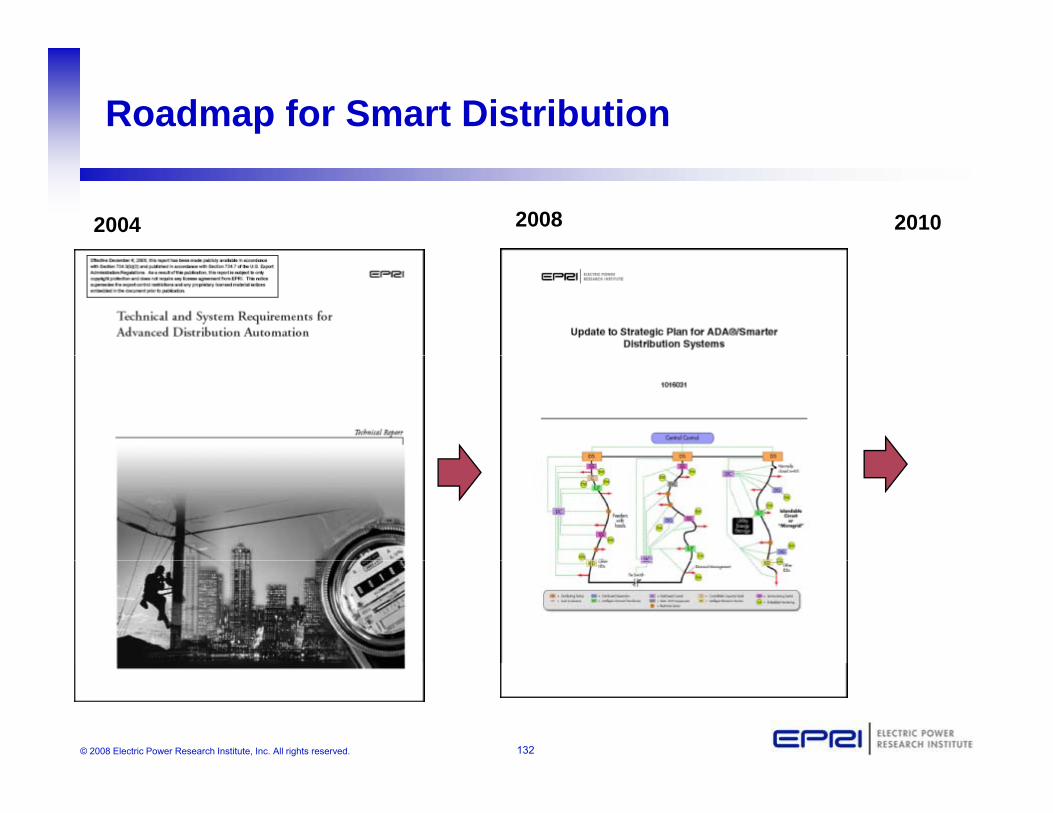
Roadmap for Smart Distribution
2004 2008 2010
132© 2008 Electric Power Research Institute, Inc. All rights reserved.
Other developments with IEEE Distribution Automation Working Groupg p
• Volt and Var Control Task Force formed in 2009, 1st meeting in January 2010meeting in January 2010
• Other groups in discussion– Task Force on Distribution Communications for SmartTask Force on Distribution Communications for Smart
Distribution Systems– DMS Interest Group
• DAWG Web sitehtt // i / /td/di t/d /http://grouper.ieee.org/groups/td/dist/da/
133© 2008 Electric Power Research Institute, Inc. All rights reserved.
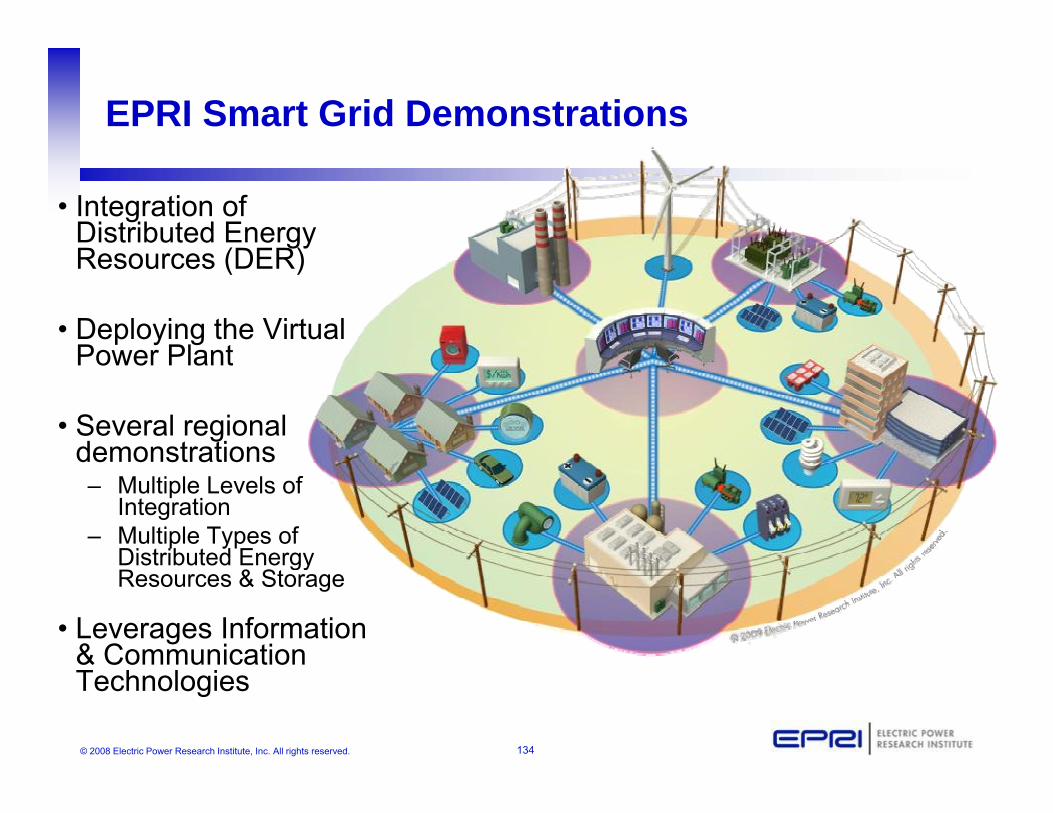
EPRI Smart Grid Demonstrations
• Integration of Distributed Energy R (DER)Resources (DER)
• Deploying the Virtual Power PlantPower Plant
• Several regional demonstrationsdemonstrations– Multiple Levels of
Integration– Multiple Types of
Distributed EnergyDistributed Energy Resources & Storage
• Leverages Information & Communication
134© 2008 Electric Power Research Institute, Inc. All rights reserved.
& Communication Technologies
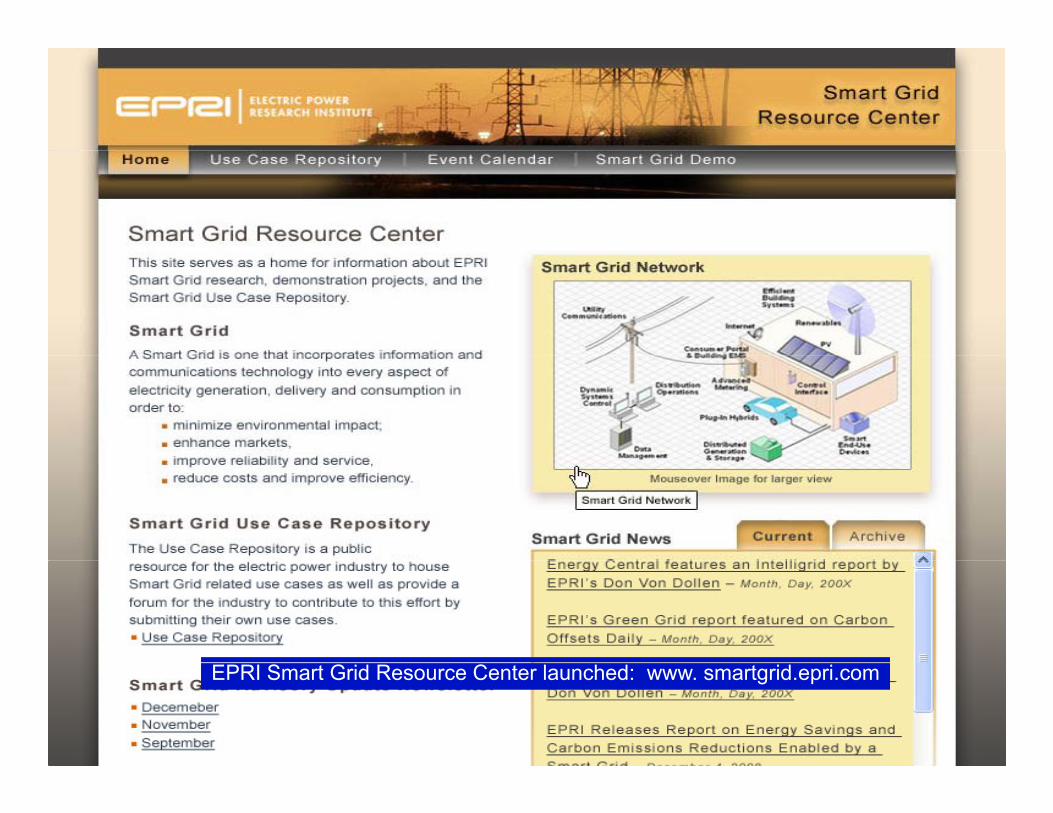
135© 2008 Electric Power Research Institute, Inc. All rights reserved.
EPRI Smart Grid Resource Center launched: www. smartgrid.epri.com

Questions and Discussion
136© 2008 Electric Power Research Institute, Inc. All rights reserved.