atlanta, georgia cincinnati, ohio - annualreports.com€¦ · drives earnings, and until the...
TRANSCRIPT

Great Living–It’s What We Do
Associated Estates 2009 Annual ReportGreat LivingIt’s What We Do
1 AEC Parkway Richmond Heights, OH 44143 800-440-2372 AssociatedEstates.com
AEC12010ARColumbus, Ohio Dublin, Ohio
Orlando, Florida
Cincinnati, OhioAtlanta, Georgia
OffIcErsJeffrey I. Friedman Chairman, President and Chief Executive Officer
John T. Shannon Senior Vice President of Operations
Lou Fatica Vice President, Chief Financial Officer and Treasurer
Martin A. Fishman Vice President, General Counsel and Secretary
Michelle B. Creger Vice President, Associate General Counsel
Patrick J. Duffy Vice President of Strategic Marketing
Jason A. Friedman Vice President of Construction and Development
Daniel E. Gold Vice President of Human Resources
Miria C. Rabideau Vice President of Operations
Beth L. Stoll Vice President of Operations
Board of Directors and Officers
BOArD Of DIrEctOrsAlbert T. Adams Partner Baker & Hostetler LLP
James M. Delaney Consultant AON Risk Services
Jeffrey I. Friedman Chairman, President and Chief Executive Officer of the Company
Michael E. Gibbons Senior Managing Director and Principal Brown Gibbons Lang and Company L.P.
Mark L. Milstein Project Manager J. Holden Construction
James A. Schoff Special Advisor to the Chairman Developers Diversified Realty Corporation
Richard T. Schwarz 1
Limited Partner Edgewater Capital Partners
1 Lead Independent Director
Officers from left to right: Martin A. Fishman, John T. Shannon, Patrick J. Duffy, Beth L. Stoll, Jeffrey I. Friedman, Jason A. Friedman, Daniel E. Gold, Miria C. Rabideau, Michelle B. Creger and Lou Fatica
Asso
ciate
d E
state
s 20
09
An
nu
al R
ep
ort
®
®

Associated Estates Realty Corporation (NYSE: AEC, NASDAQ: AEC) is a real
estate investment trust (REIT) headquartered in Richmond Heights, Ohio, and
is a leading owner and operator of apartment communities. The Company’s origins
go back more than 40 years, when its predecessors first began developing apart-
ment communities. As of March 22, 2010, Associated Estates directly or indirectly
owned, managed or was a joint venture partner in 49 multifamily communities in
eight states containing a total of 12,366 units.
We believe Associated Estates is well positioned to continue its sector-leading performance because of our strategy of measured growth and financial discipline, combined with the favorable fundamentals of the apartment business.®

ToTal ReTuRn PeRfoRmance
The line graph below compares the
cumulative total return of a hypothetical
investment in the Company’s common
shares with the cumulative total return of
a hypothetical investment in each of the
indices defined below. The comparison is
based on the respective market prices of
each investment on the dates shown below,
assuming an initial investment of $100 on
December 31, 2004, and the reinvestment
of dividends.
This annual report contains forward-looking statements based on current judgments and current knowledge of management, which are subject to certain risks, trends and uncertainties that could cause actual results to vary from those projected, including, but not limited to, preliminary expectations regarding our 2010 performance, which are based on certain assumptions. accordingly, readers are cautioned not to place undue reliance on forward-looking statements, which speak only as of the date of the document. These forward-looking statements are intended to be covered by the safe harbor provisions of the Private Securities litigation Reform act of 1995. The words “expects,” “projects,” “believes,” “plans,” “anticipates” and similar expressions are intended to identify forward-looking statements. Investors are cautioned that our forward-looking statements involve risks and uncertainty that could cause our actual results to differ from estimates or projections contained in these forward-looking statements. for a discussion of these risks and uncertainties, see the “Risk factors” section of the enclosed annual financial report.
Great PerformanceIt’s What We Do
Index 12/31/04 12/31/05 12/31/06 12/31/07 12/31/08 12/31/09
Associated Estates Realty Corporation $100.00 $96.73 $152.93 $110.02 $113.94 $155.81
Russell 3000 100.00 106.12 122.80 129.11 80.94 103.88
NAREIT All Equity REIT Index 100.00 112.16 151.49 127.72 79.53 101.79
Custom Peer Group* 100.00 113.59 158.62 115.31 85.50 111.40
*Custom peer group includes: Apartment Investment and Management Company (AIV), AvalonBay Communities (AVB), BRE Properties, Inc. (BRE), Camden Property Trust (CPT), Colonial Properties Trust (CLP), Equity Residential (EQR), Essex Property Trust, Inc. (ESS), Home Properties, Inc. (HME), Mid-America Apartment Communities, Inc. (MAA), Post Properties, Inc. (PPS), and UDR, Inc. (UDR).
Source : SNL Financial LC, Charlottesville, VA
50
100
150
$200
12/31/04 12/31/05
Associated Estates Realty Corporation
Russell 3000
NAREIT All Equity REIT Index
Custom Peer Group*
Index Value
12/31/06 12/31/07 12/31/08 12/31/09
Duluth, Georgia

The near-cataclysmic events of the past
two years shook every business and
caused many of us to question our own
better judgment. Yet in many respects at
Associated Estates it was like a bad dream
that you awake from and realize that
everything is all right.
Of course what happened in the capital
markets was very real and very scary.
The problems are far from over, and there
are certainly lessons to be learned from
these events that none of us should ever
forget. But for Associated Estates, it’s
business as usual as we enter 2010 and
look to the future.
I’ve been asked a number of times how we
made it through as well as we did. It goes
back to 2003 and 2005, when we developed
and refined our strategic plan. Although
the planning was intense, the strategy
was simple:
› We would focus on improving our
balance sheet and managing risk.
› We would invest in our people
and systems.
› We would sell properties mainly in
the Midwest at low cap rates and use
the proceeds to pay down debt, buy
back stock and invest in our properties.
› We would also selectively buy properties
in faster-growing markets, but we would
not overpay in the pursuit of growth.
When the crisis hit, we were prepared.
When the credit markets seized, we had
adequate capital available and manageable
debt maturities. When apartment leasing
became highly competitive, our proper-
ties were in top shape. When the hottest
markets were exposed as overbuilt, we had
only minimal exposure. When things got
scary, we had an experienced, dedicated
and committed management team in place.
It’s who we are. It’s what we do.
I wish I could say I was smart enough to
have seen the trouble coming and that,
knowing what was about to unfold, we
took defensive steps to protect ourselves.
I didn’t see it coming, but it didn’t matter
because we were prepared. Despite
everything, we once again generated
top-tier 2009 operating performance,
and as of December 31, 2009, our total
return to our shareholders for the past
3- and 5-year periods was the best of
all the apartment REITs.
InvestIng In Our POrtfOlIO
One thing we didn’t do in 2009 was buy
anything – not because we didn’t want
to, but because we had the discipline not
to overpay. So the number of units we
own didn’t increase, but don’t think for
a minute we weren’t focused on growing
what we had. Our operations team
appreciated, more than ever, the impor-
tance of well-maintained properties. As
many of our competitors appeared to
cut back on property-level expenses, we
maintained our recurring, non-recurring
and revenue-enhancing capital expen-
ditures at historically high levels. This
paid off, as many of our properties
command some of the highest rents in
their respective markets.
favOrable trenDs fOreseen
The primary driver of apartment demand
is household formation. Never have the
numbers and trends been more compelling
for sustained strong occupancy. Potential
Dear fellow Shareholders:
Jeffrey I. friedman, chairman, President and ceo

Great LocationsIt’s What We Do
5-Year ToTal ShareholDer reTurn
CPT
4.1%
AEC
55.
0%
Avg. 11.0%
MA
A 5
3.2%
HM
E 49
.0%
AVB
31.
5%
ESS
20.
6%
EQ
R 18
.1%
BRE
0.6
%
-5.6
% U
DR
-21.
7% A
IV
-29.
3% P
PS
-43.
6% C
LP
aurora, ohio Columbus, ohio Duluth, Georgia
atlanta, Georgia
Source: KeyBanc capital markets, data as of December 31, 2009

apartment dwellers that historically con-
sidered buying are now choosing to hold
off purchasing and are renting. However,
even with strong demand, given the weak
job market, we continue to struggle to
raise rents. Like most businesses, pricing
drives earnings, and until the economy
begins to add jobs, apartment operators
will trade pricing for occupancy. Current
expectations for our portfolio are for
noticeable improvement in the second
half of 2010, and we should begin to see
the results from increasing rents in the
first half of 2011.
As for acquisitions, we expect to see more
apartment properties coming to market in
2010. With our current financial flexibility,
we are well positioned to move quickly
and capitalize on opportunities as we
find them, but we don’t feel compelled to
buy anything. We believe our proven track
record and our “franchise value” have
positioned us to get a good look when
the deals do start to happen.
fInancIal flexIbIlIty
Perhaps the toughest lesson many compa-
nies learned in 2009 was the risk of exces-
sive debt and short-term debt maturities.
We addressed our modest 2009 maturities
early last year. We entered 2010 with ample
availability on our $150 million unsecured
credit facility. Our long-term maturities are
well laddered and the majority of our debt
is at fixed rates. We have only $21 million
of remaining debt maturities in 2010, and
very manageable debt maturities in 2011
and 2012.
In January 2010, we further strengthened
our balance sheet with a $55 million equity
offering. As another measure of our finan-
cial flexibility, we now have 22 unencum-
bered properties with an estimated market
value of approximately $320 million. Our
debt to the undepreciated cost of our real
estate is now at 51 percent, in line with the
average of the other apartment REITs. We
continue to focus on improving our debt
service and fixed charge coverage ratios.
Our dividend continues to be attractive.
Our FFO payout ratio is in line with most
of the other apartment REITs. While
more than half of our peers reduced their
dividend in 2009, we maintained ours.
Moreover, given today’s market conditions
and our expectations for this year, our
Board is prepared to draw on our ample
liquidity to continue the current dividend
level in the event our dividend exceeds
our funds available for distribution in 2010.
unlOckIng sharehOlDer value
In addition to our dividend yield and
increased financial strength, another
primary attraction of Associated Estates
as an investment is that, by most measures,
our stock trades at a substantial discount
to our net asset value (“NAV”) per share.
We define NAV per share as the current elizabeth Junco, assistant Property Manager,
Windsor Pines (Pembroke Pines, Fl)
It is because of our people that we are
able to say Great Living – It’s What We Do.®
Each quarter, we honor one All-Star
employee selected from nominations
submitted by co-workers, residents,
prospects and vendors. These employees
go above and beyond what’s expected to
make every interaction “great,” and we’re
honored to feature them in this year’s
annual report.

Property Image
Great PeopleIt’s What We Do
DebT To Gr0SS real eSTaTe aSSeTS
PPS
36.3
%
Avg. 50.9%
AVB
47.
8%
CPT
48.1
%
CLP
48.5
%
ESS
50.1
%
AEC
50.
6%
EQR
50.9
%
MA
A 5
1.6%
UD
R 54
.3%
BRE
54.
3% HM
E 58
.8%
AIV
58.
9%
Source: company 2009 financials except aec, which is as of march 15, 2010
richmond, Virginia
norfolk, Virginia
richmond, Virginia
West Palm beach, Florida
Carly buresti, Property Manager, Saw Mill Village (Columbus, oh)
Shawn McClendon, Service Technician, Perimeter lakes (Dublin, oh)
value of our assets less our liabilities,
divided by the total shares outstanding.
Some of the principal factors that analysts
tell us account for that discount are: 1) our
small market cap; 2) our leverage; and 3)
our concentration in the Midwest markets.
We believe we have taken the right steps
to address these issues. Our recent equity
offering, our first since 1997, reduced our
leverage, increased our float and enabled
a number of dedicated REIT investors to
take a new position in our stock.
As to our property portfolio, perceptions
often lag reality. Since 2005 we have
disposed of 31 properties (mostly in the
Midwest) with an average age of 24 years.
We acquired six properties (all outside the
Midwest) averaging six years in age. We
have one of the youngest portfolios in the
industry. The percentage of NOI we derive
from the Midwest has declined to 57 per-
cent. We also like to think that the recent
volatility in apartment fundamentals has
given REIT investors a new appreciation
for the stability, or said another way, the
lack of volatility associated with our well-
chosen suburban apartment properties
located in high barrier to entry submarkets
in the “no-boom, no-bust” Midwest.
PeOPle, PrOcess, POrtfOlIO
In the past I have often talked about the
three P’s – People, Process and Portfolio.
But 2009 was really the story of the two
P’s – our People and our Plan. We had a
well-thought-out strategic plan in place
and a seasoned management team to im-
plement it. The apartment business is more
than capital allocation and positive-spread
investing. It is management-intensive and
requires a hands-on approach to have the
best chance of success. This is where we
see an advantage for Associated Estates
over the next few years.
Our commitment to building a strong team
of professionals goes back many years.
Our investment in the Associated Estates
Academy for Career Development began
in 2006. We have continually added to
the curriculum and staff, and we regularly
evaluate how this program impacts prop-
erty level performance and our bottom
line. We supplemented this people-centric
focus with a sophisticated compensation
structure that emphasizes pay for perfor-
mance and aligns every employee’s goals
with our strategic objectives. We believe
this has paid off for our shareholders and
our employees.
I am proud of our team, and I thank them
for their hard work and dedication. Their
efforts truly helped Associated Estates not
only survive the most difficult economic
environment in recent history, but emerge
even stronger. They are the ones who turn
our brand statement into reality every day:
Great Living – It’s What We Do.®
We know that as we keep raising the bar,
expectations will be higher. We have
established aggressive goals, but we know
we have the right team, a strong and com-
petitive portfolio, a proven strategy, and
best-in-class systems to deliver top-tier
results once again.
Thank you for your continued interest in
Associated Estates.
Sincerely,
Jeffrey I. Friedman
Chairman, President and
Chief Executive Officer
March 22, 2010
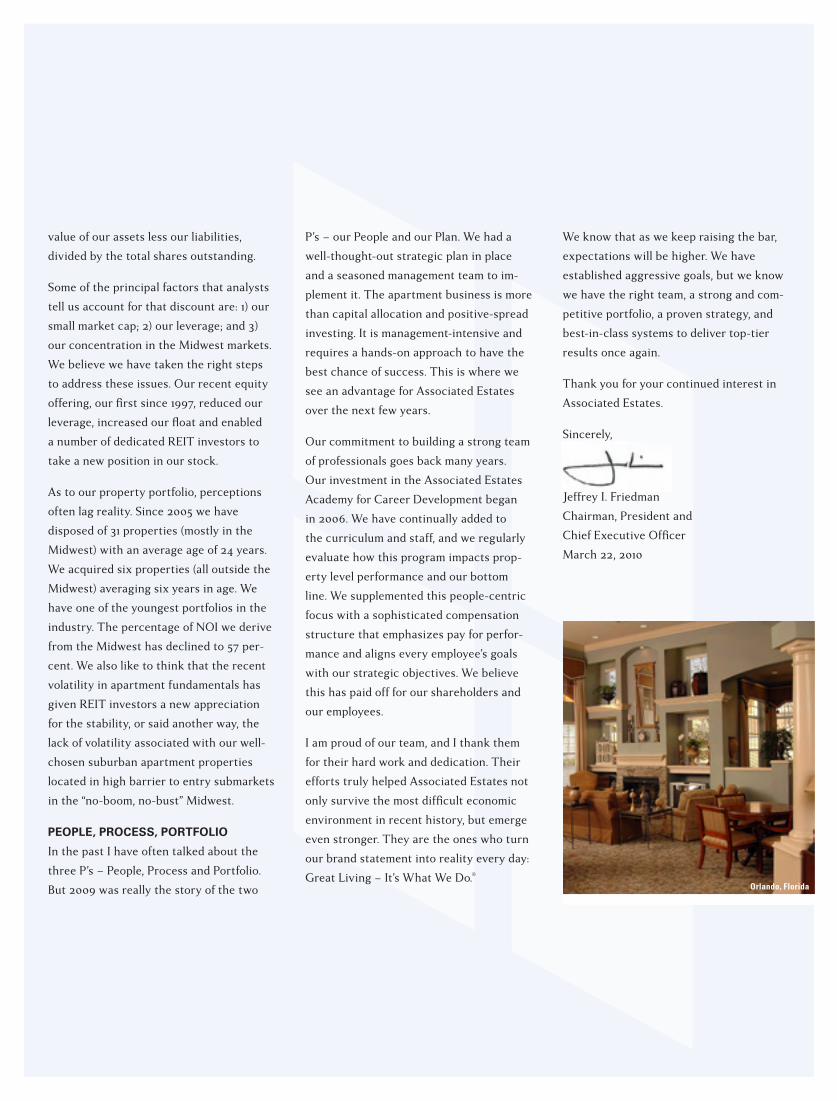
orlando, Florida

Great LivingIt’s What We Do
aVeraGe annual noI GroWTh, 2004-2010
AEC
2.5
%
HM
E 2.
4%
UD
R 1.
9%
ESS
1.8%
MA
A 1
.6%
AIV
1.6
%
CLP
1.6%
BRE
0.9
%
CPT
0.4%
-0.1
% P
PSAvg. 1.5%AV
B 1
.4%
EQR
1.4%
Same-store noI performance is the average of as-reported figures for the respective periods from 2004 to 2009 and midpoint of 2010 guidance.
Source: company financials, Green Street advisors
battle Creek, Michigan orlando, Florida
Indianapolis, Indiana
Gahanna, ohio
®

cOrPOrate heaDquarters
1 AEC Parkway
Richmond Heights, Ohio 44143-1500
216-261-5000
Toll Free: 800-440-2372
annual MeetIng
The annual meeting of shareholders of
Associated Estates Realty Corporation
will be held on May 5, 2010, at 10:00 a.m.
Eastern Daylight Time at:
Renaissance Cleveland Hotel
24 Public Square
Cleveland, Ohio 44113
InDePenDent accOuntants
PricewaterhouseCoopers LLP
Cleveland, Ohio
legal cOunsel
Baker & Hostetler LLP
Cleveland, Ohio
transfer agent, regIstrar anD DIvIDenD DIsbursIng agent
Wells Fargo Bank
Shareowner Services
161 N. Concord Exchange
South St. Paul, MN 55075-1139
Phone: 800-468-9716
cOrPOrate gOvernance
Information regarding the guidelines, poli-
cies and charters that govern the Company’s
Board of Directors, the committees of its
Board of Directors and its executive officers
can be found on the Company’s Web site at
AssociatedEstates.com. From the Company’s
home page, click on Investors, then Corporate
Governance.
DIvIDenD reInvestMent anD stOck Purchase Plan
The Company maintains a Dividend
Reinvestment and Stock Purchase Plan
for registered shareholders. Details of
the Plan are available by contacting the
Company or the transfer agent.
cOPy Of fOrM 10-k
Additional information, including a copy of the
Company’s Form 10-K filed with the Securities
and Exchange Commission, may be obtained
by contacting Investor Relations in writing
or by phone at the corporate headquarters
address or telephone number listed on this
page, or through the Company’s Web site on
the Internet at AssociatedEstates.com.
InvestOr relatIOns
As a service to our shareholders and prospec-
tive investors, automatic e-mail notification
of press releases, SEC filings and Associated
Estates’ daily closing stock price are available
by enrolling in these services through the
Investors section of AssociatedEstates.com.
stOck lIstIng
New York Stock Exchange (NYSE)
National Association of Securities Dealers
Automated Quotations (NASDAQ)
Symbols: AEC (Common Shares)
AECPRB (Class B Cumulative Redeemable
Preferred Shares)
The number of holders of record of the
Company’s common shares at March 15, 2010,
was 872. The high and low closing sale prices
of the Company’s common shares for each
quarter in 2009 and 2008, as reported by
the New York Stock Exchange, and quarterly
dividends paid, are shown below.
Dividends Declared 2009 high low Per Share
1st Quarter $ 8.75 $ 4.87 $ 0.172nd Quarter $ 6.71 $ 5.08 $ 0.173rd Quarter $10.21 $ 5.16 $ 0.174th Quarter $11.27 $ 8.98 $ 0.17
$ 0.68
Dividends Declared 2008 high low Per Share
1st Quarter $12.16 $ 8.30 $ 0.172nd Quarter $13.47 $10.71 $ 0.173rd Quarter $14.88 $10.97 $ 0.174th Quarter $13.06 $ 6.35 $ 0.17
$ 0.68
Shareholder Information
Annual Financial ReportYear Ended December 31, 2009
Table of Contents
Management’s Discussion and Analysis of Financial Condition and Results of Operations………………..
Report of Independent Registered Public Accounting Firm.....…………………………………………………
Consolidated Financial Statements.....………………………………………………...………………………….
Consolidated Balance Sheets…………………………………………………………………….………
Consolidated Statements of Operations…………………………………………………………………
Consolidated Statements of Shareholders’ Equity……………………………………………………..
Consolidated Statements of Cash Flows………………………………………………………………..
Notes to Consolidated Financial Statements……………………………………………………………
Historical (Selected Financial) Data………...……………………………………………………………………..
2
17
18
18
19
20
21
22
48

2
Management's Discussion and Analysis of Financial Condition and Results of Operations
The following discussion should be read in conjunction with the consolidated financial statements and notes thereto included in this report. This discussion may contain forward-looking statements based on current judgments and current knowledge of management, which are subject to certain risks, trends and uncertainties that could cause actual results to vary from those projected, including but not limited to, expectations regarding our 2010 performance that are based on certain assumptions. Accordingly, readers are cautioned not to place undue reliance on forward-looking statements which speak only as of the date of the document. These forward-looking statements are intended to be covered by the safe harbor provisions of the Private Securities Litigation Reform Act of 1995. The words "expects," "projects," "believes," "plans," "anticipates" and similar expressions are intended to identify forward-looking statements. Investors are cautioned that these forward-looking statements involve risks and uncertainty that could cause actual results to differ from estimates or projections contained in these forward-looking statements. For a discussion of these risks and uncertainties, see "Risk Factors" on page 12.
Overview. We are engaged primarily in the ownership and operation of multifamily residential units. We also provide asset and property management services to third party owners of multifamily residential units for which we are paid fees. Our primary source of cash and revenue from operations is rents from the leasing of owned apartment units, which represented 98.1% of our consolidated revenue for the year ended December 31, 2009.
The operating performance of our properties is affected by general economic trends including, but not limited to, factors such as household formation, job growth, unemployment rates, population growth, immigration, the supply of new multifamily rental communities and in certain markets the supply of other housing alternatives, such as condominiums, single and multifamily rental homes and owner occupied single and multifamily homes. Additionally, our performance may be affected by the access to and cost of debt and equity.
Rental revenue collections are a combination of rental rates, occupancy levels and rent concessions. We attempt to adjust these factors to adapt to changing market conditions, thus allowing us to maximize rental revenue. Indicators that we use in measuring these factors include physical occupancy and net collected rent per unit. These indicators are more fully described in the Results of Operations comparison. Additionally, we consider property NOI and FFO to be important indicators of our overall performance. Property NOI (property operating revenue less property operating and maintenance expenses) is a measure of the profitability of our properties and has the largest impact on our financial condition and operating results. FFO is used in the real estate industry as a supplemental measure of the operating performance of real estate companies because it excludes charges, such as real estate depreciation, that are generally considered not to be reflective of the actual value of real estate assets over time. Additionally, gains and losses from the sale of most real estate assets and certain other items are also excluded from FFO. See Selected Financial Data presented in this report for reconciliations of NOI and FFO to consolidated net income attributable to AERC in accordance with accounting principles generally accepted in the United States ("GAAP").
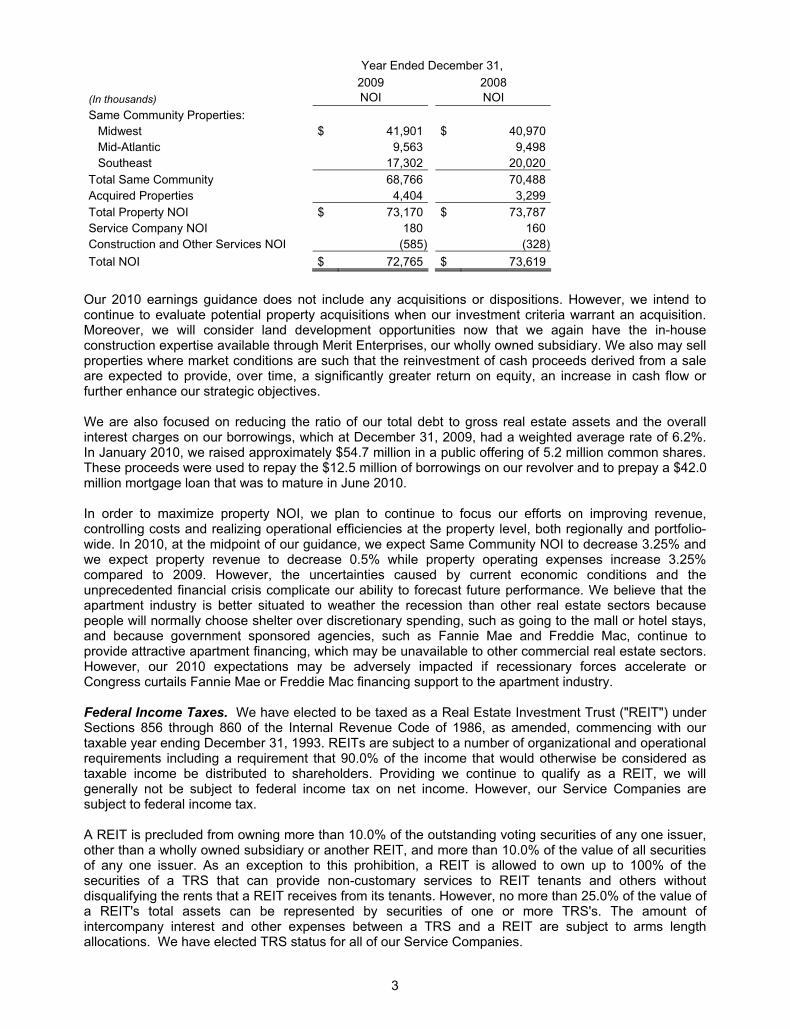
Our Same Community portfolio for the years 2008 and 2009 consists of 46 properties containing 11,572 units and accounted for 93.1% of total revenue in 2009 and 94.0% of our property NOI. Same Community NOI decreased 2.4% in 2009 compared to 2008 primarily as a result of a $2.7 million or 13.6% reduction in NOI from our Southeast portfolio. Our Midwest portfolio, however, increased NOI $931,000 or 2.3%, while our Mid-Atlantic portfolio remained relatively flat in 2009. The following table presents NOI results for 2009 and 2008:
3
Our 2010 earnings guidance does not include any acquisitions or dispositions. However, we intend to continue to evaluate potential property acquisitions when our investment criteria warrant an acquisition. Moreover, we will consider land development opportunities now that we again have the in-house construction expertise available through Merit Enterprises, our wholly owned subsidiary. We also may sell properties where market conditions are such that the reinvestment of cash proceeds derived from a sale are expected to provide, over time, a significantly greater return on equity, an increase in cash flow or further enhance our strategic objectives. We are also focused on reducing the ratio of our total debt to gross real estate assets and the overall interest charges on our borrowings, which at December 31, 2009, had a weighted average rate of 6.2%. In January 2010, we raised approximately $54.7 million in a public offering of 5.2 million common shares. These proceeds were used to repay the $12.5 million of borrowings on our revolver and to prepay a $42.0 million mortgage loan that was to mature in June 2010. In order to maximize property NOI, we plan to continue to focus our efforts on improving revenue, controlling costs and realizing operational efficiencies at the property level, both regionally and portfolio-wide. In 2010, at the midpoint of our guidance, we expect Same Community NOI to decrease 3.25% and we expect property revenue to decrease 0.5% while property operating expenses increase 3.25% compared to 2009. However, the uncertainties caused by current economic conditions and the unprecedented financial crisis complicate our ability to forecast future performance. We believe that the apartment industry is better situated to weather the recession than other real estate sectors because people will normally choose shelter over discretionary spending, such as going to the mall or hotel stays, and because government sponsored agencies, such as Fannie Mae and Freddie Mac, continue to provide attractive apartment financing, which may be unavailable to other commercial real estate sectors. However, our 2010 expectations may be adversely impacted if recessionary forces accelerate or Congress curtails Fannie Mae or Freddie Mac financing support to the apartment industry. Federal Income Taxes. We have elected to be taxed as a Real Estate Investment Trust ("REIT") under Sections 856 through 860 of the Internal Revenue Code of 1986, as amended, commencing with our taxable year ending December 31, 1993. REITs are subject to a number of organizational and operational requirements including a requirement that 90.0% of the income that would otherwise be considered as taxable income be distributed to shareholders. Providing we continue to qualify as a REIT, we will generally not be subject to federal income tax on net income. However, our Service Companies are subject to federal income tax. A REIT is precluded from owning more than 10.0% of the outstanding voting securities of any one issuer, other than a wholly owned subsidiary or another REIT, and more than 10.0% of the value of all securities of any one issuer. As an exception to this prohibition, a REIT is allowed to own up to 100% of the securities of a TRS that can provide non-customary services to REIT tenants and others without disqualifying the rents that a REIT receives from its tenants. However, no more than 25.0% of the value of a REIT's total assets can be represented by securities of one or more TRS's. The amount of intercompany interest and other expenses between a TRS and a REIT are subject to arms length allocations. We have elected TRS status for all of our Service Companies.
Year Ended December 31, 2009 2008
(In thousands) NOI NOI Same Community Properties:
Midwest $ 41,901 $ 40,970 Mid-Atlantic 9,563 9,498 Southeast 17,302 20,020
Total Same Community 68,766 70,488 Acquired Properties 4,404 3,299 Total Property NOI $ 73,170 $ 73,787 Service Company NOI 180 160 Construction and Other Services NOI (585) (328)Total NOI $ 72,765 $ 73,619

4
LIQUIDITY AND CAPITAL RESOURCES Cash Flows and Liquidity. Significant sources and uses of cash in the past three years are summarized as follows: Significant Cash Sources (Uses):
Our primary sources of liquidity are cash flow provided by operations, short-term borrowings on the unsecured revolver, our secured credit facility or project-specific loans. We believe that we are well positioned to weather the recent turmoil in the financial markets. Our debt repayment obligations are relatively modest. Six mortgage loans totaling approximately $78.3 million were scheduled to mature in 2010. We have already repaid $42.0 million of those debt obligations, and we expect to repay the $36.3 million balance with proceeds from our unsecured revolver or with proceeds from other secured loans. In December 2009, we entered into a credit facility agreement with Wells Fargo Multifamily Corporation on behalf of Freddie Mac. Pursuant to the terms of the facility, we have the potential to borrow up to $100.0 million over a two-year period with obligations being secured by nonrecourse, non cross-collateralized fixed or variable rate mortgages having terms of five, seven or ten years. Our $150.0 million unsecured revolver, which matures March 20, 2011, provides us additional financial flexibility. Our ability to reenter the capital markets affords us additional liquidity as demonstrated by our recent successful sale to the public markets of 5,175,000 of our common shares resulting in net proceeds of approximately $54.7 million. Cash flow provided by operations increased during 2009 compared to 2008 primarily due to changes in accounts payable and accrued expenses. These changes were primarily the result of an increase in the fair value of deferred compensation, the payment of real estate taxes in 2008 related to the sale of 15 properties and the payment of other liabilities in 2008 related to funds held for managed properties and our exit from the affordable housing management business. Cash flow provided by operations decreased in 2008 compared to 2007 primarily due to the payment of real estate taxes in 2008 related to the sale of 15 properties and the payment of other liabilities in 2008 related to funds held for managed properties and our exit from the affordable housing management business. This decrease was partially offset by increased cash flow from property operations in 2008 when compared to 2007. Shelf Availability. We have a shelf registration statement that became effective in May 2009. This registration statement relates to possible offerings, from time to time, of debt securities, preferred shares, depositary shares, common shares and common share warrants. This registration statement will expire in May 2012. In January 2010, we issued $57.4 million of new common shares under this registration statement. Securities offerings up to $157.2 million are available under this shelf registration statement, after giving effect to the January 2010 common share offering. However, before any debt securities could be issued under this shelf registration, major modifications to the debt covenants contained in the indenture currently in place would be necessary.
Year Ended December 31, (In thousands) 2009 2008 2007 Net cash provided by operations $ 31,300 $ 24,665 $ 28,962 Fixed assets:
Property/land acquisitions and development expenditures, net (4,526) (34,604) (70,547)Net property/land disposition proceeds 32,746 88,347 46,478 Recurring, revenue enhancing and non-recurring capital expenditures (12,629) (12,692) (12,300)
Debt: Decrease in mortgage notes (22,645) (45,716) (3,939)(Decrease) increase in revolving credit facility borrowings (9,000) 1,500 20,000
Cash dividends and operating partnership distributions paid (15,529) (15,813) (16,554)Purchase of preferred and/or treasury shares (179) (4,882) (16,861)
5
Liquidity: Normal Business Operations. We anticipate that we will meet our normal business operations and liquidity requirements for the upcoming year generally through net cash provided by operations. We believe that if net cash provided by operations is below projections, other sources, such as the unsecured revolver, secured and unsecured borrowings are or can be made available and should be sufficient to meet our normal business operations and liquidity requirements. Liquidity: Non-Operational Activities. Sources of cash available for repayment of debt, completing our 60-unit expansion project at our River Forest property, any property acquisitions and funding other capital expenditures are expected to be provided primarily by proceeds from the refinancing of debt borrowings, our unsecured revolver and possibly the sale of common shares.
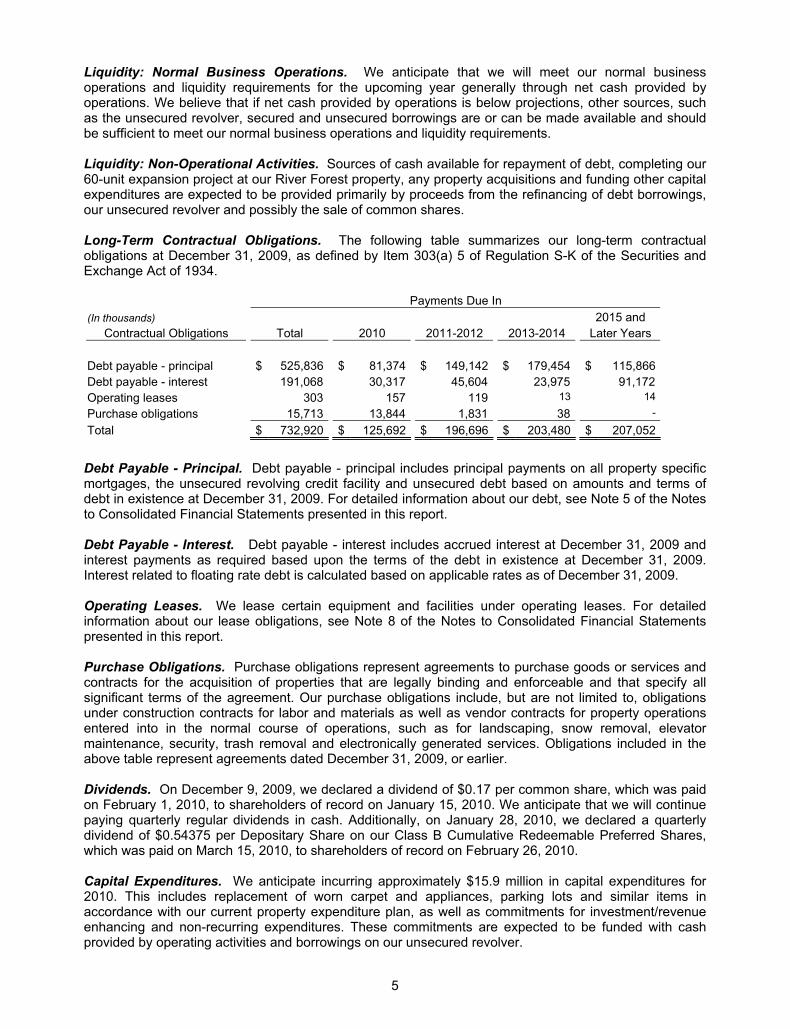
Long-Term Contractual Obligations. The following table summarizes our long-term contractual obligations at December 31, 2009, as defined by Item 303(a) 5 of Regulation S-K of the Securities and Exchange Act of 1934.
Debt Payable - Principal. Debt payable - principal includes principal payments on all property specific mortgages, the unsecured revolving credit facility and unsecured debt based on amounts and terms of debt in existence at December 31, 2009. For detailed information about our debt, see Note 5 of the Notes to Consolidated Financial Statements presented in this report.
Debt Payable - Interest. Debt payable - interest includes accrued interest at December 31, 2009 and interest payments as required based upon the terms of the debt in existence at December 31, 2009. Interest related to floating rate debt is calculated based on applicable rates as of December 31, 2009. Operating Leases. We lease certain equipment and facilities under operating leases. For detailed information about our lease obligations, see Note 8 of the Notes to Consolidated Financial Statements presented in this report. Purchase Obligations. Purchase obligations represent agreements to purchase goods or services and contracts for the acquisition of properties that are legally binding and enforceable and that specify all significant terms of the agreement. Our purchase obligations include, but are not limited to, obligations under construction contracts for labor and materials as well as vendor contracts for property operations entered into in the normal course of operations, such as for landscaping, snow removal, elevator maintenance, security, trash removal and electronically generated services. Obligations included in the above table represent agreements dated December 31, 2009, or earlier. Dividends. On December 9, 2009, we declared a dividend of $0.17 per common share, which was paid on February 1, 2010, to shareholders of record on January 15, 2010. We anticipate that we will continue paying quarterly regular dividends in cash. Additionally, on January 28, 2010, we declared a quarterly dividend of $0.54375 per Depositary Share on our Class B Cumulative Redeemable Preferred Shares, which was paid on March 15, 2010, to shareholders of record on February 26, 2010. Capital Expenditures. We anticipate incurring approximately $15.9 million in capital expenditures for 2010. This includes replacement of worn carpet and appliances, parking lots and similar items in accordance with our current property expenditure plan, as well as commitments for investment/revenue enhancing and non-recurring expenditures. These commitments are expected to be funded with cash provided by operating activities and borrowings on our unsecured revolver.
Payments Due In (In thousands) 2015 and
Contractual Obligations Total 2010 2011-2012 2013-2014 Later Years
Debt payable - principal $ 525,836 $ 81,374 $ 149,142 $ 179,454 $ 115,866 Debt payable - interest 191,068 30,317 45,604 23,975 91,172 Operating leases 303 157 119 13 14 Purchase obligations 15,713 13,844 1,831 38 -
Total $ 732,920 $ 125,692 $ 196,696 $ 203,480 $ 207,052
6
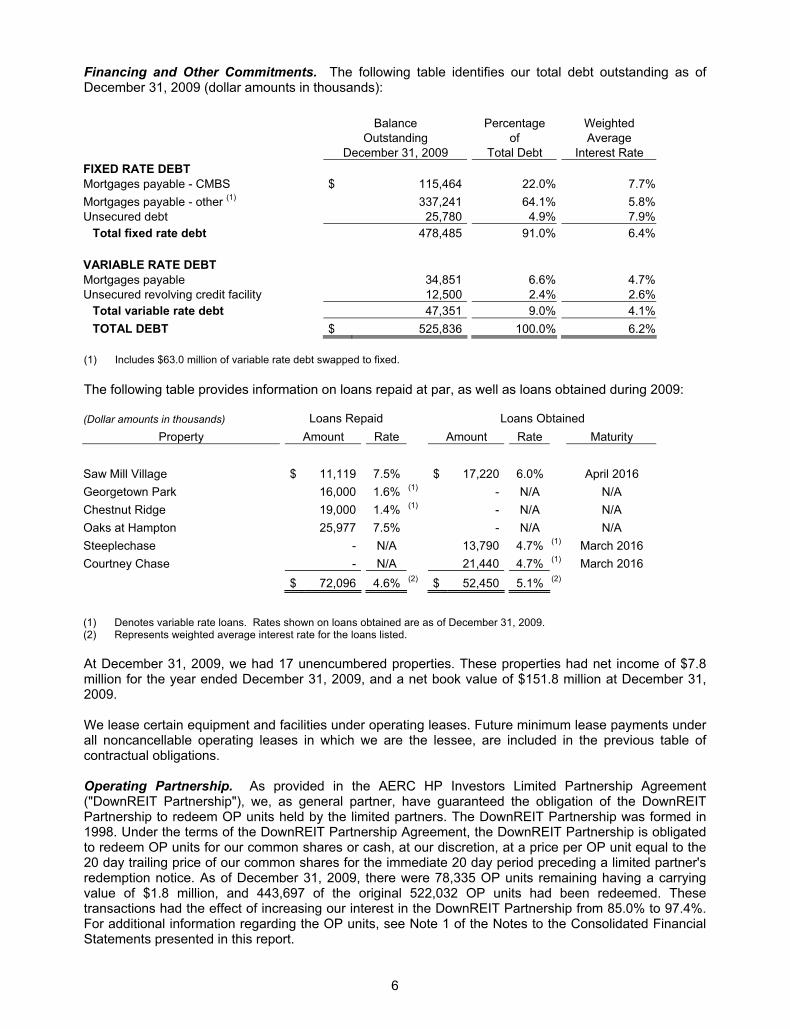
Financing and Other Commitments. The following table identifies our total debt outstanding as of December 31, 2009 (dollar amounts in thousands):
(1) Includes $63.0 million of variable rate debt swapped to fixed.
The following table provides information on loans repaid at par, as well as loans obtained during 2009:
At December 31, 2009, we had 17 unencumbered properties. These properties had net income of $7.8 million for the year ended December 31, 2009, and a net book value of $151.8 million at December 31, 2009. We lease certain equipment and facilities under operating leases. Future minimum lease payments under all noncancellable operating leases in which we are the lessee, are included in the previous table of contractual obligations. Operating Partnership. As provided in the AERC HP Investors Limited Partnership Agreement ("DownREIT Partnership"), we, as general partner, have guaranteed the obligation of the DownREIT Partnership to redeem OP units held by the limited partners. The DownREIT Partnership was formed in 1998. Under the terms of the DownREIT Partnership Agreement, the DownREIT Partnership is obligated to redeem OP units for our common shares or cash, at our discretion, at a price per OP unit equal to the 20 day trailing price of our common shares for the immediate 20 day period preceding a limited partner's redemption notice. As of December 31, 2009, there were 78,335 OP units remaining having a carrying value of $1.8 million, and 443,697 of the original 522,032 OP units had been redeemed. These transactions had the effect of increasing our interest in the DownREIT Partnership from 85.0% to 97.4%. For additional information regarding the OP units, see Note 1 of the Notes to the Consolidated Financial Statements presented in this report.
Balance Percentage Weighted Outstanding of Average December 31, 2009 Total Debt Interest Rate FIXED RATE DEBT Mortgages payable - CMBS $ 115,464 22.0% 7.7%Mortgages payable - other (1) 337,241 64.1% 5.8%Unsecured debt 25,780 4.9% 7.9%
Total fixed rate debt 478,485 91.0% 6.4%
VARIABLE RATE DEBT Mortgages payable 34,851 6.6% 4.7%Unsecured revolving credit facility 12,500 2.4% 2.6%
Total variable rate debt 47,351 9.0% 4.1%TOTAL DEBT $ 525,836 100.0% 6.2%
(Dollar amounts in thousands) Loans Repaid Loans Obtained Property Amount Rate Amount Rate Maturity
Saw Mill Village $ 11,119 7.5% $ 17,220 6.0% April 2016 Georgetown Park 16,000 1.6% (1) - N/A N/A Chestnut Ridge 19,000 1.4% (1) - N/A N/A Oaks at Hampton 25,977 7.5% - N/A N/A Steeplechase - N/A 13,790 4.7% (1) March 2016 Courtney Chase - N/A 21,440 4.7% (1) March 2016 $ 72,096 4.6% (2) $ 52,450 5.1% (2) (1) Denotes variable rate loans. Rates shown on loans obtained are as of December 31, 2009. (2) Represents weighted average interest rate for the loans listed.
7
Acquisitions and Development. On April 21, 2008, we acquired two apartment communities located in the Richmond, Virginia metropolitan area totaling 536 units for a purchase price of $75.0 million and additional closing costs of $540,000. The acquisition also included a 5.9 acre land parcel adjacent to one of the properties on which we are constructing an additional 60 units. We expect to complete this construction during 2010.
We intend to continue to evaluate land and property acquisitions. Any future acquisitions or developments would be financed with the most appropriate sources of capital, which may include the assumption of mortgage indebtedness, bank and other institutional borrowings, the exchange of properties, undistributed earnings, secured or unsecured debt financings, or the issuance of shares or units exchangeable into common shares.
Dispositions. During 2009, we sold two properties for net cash proceeds of $32.7 million. The operating results of these properties, along with the gains of $15.4 million that we recognized, are included in "Income from discontinued operations."
Management and Service Operations. Revenues from our management and service operations were significantly reduced in 2008 and 2009 as a result of our exit from the Affordable Housing business at the end of 2007. As of December 31, 2009, we managed one property and asset managed one residential property and one commercial property for third party owners.
General Contractor/Construction. Our subsidiary, Merit Enterprises, Inc., is engaged as a general contractor and construction manager that will act as our in-house construction division, as well as provide general contracting and construction management services to third parties. Merit intends to concentrate its efforts on rehabilitation and ground-up construction projects.
RESULTS OF OPERATIONS FOR 2009 COMPARED WITH 2008 AND 2008 COMPARED WITH 2007
In the following discussion of the comparison of the year ended December 31, 2009 to the year ended December 31, 2008 and the year ended December 31, 2008 to the year ended December 31, 2007, Same Community properties represent 44 wholly owned properties that were owned during all of 2007, 2008 and 2009. Acquired properties represent two properties acquired in April 2008 and two properties acquired in June 2007.
The net loss from continuing operations decreased $384,000 during 2009 compared to 2008 primarily as a result of a decrease of $1.4 million in interest expense and a gain on insurance recoveries of $665,000 during 2009. Offsetting these items was the fact that 2008 included net income from joint ventures of $1.5 million due to the sale of our last joint venture property. The net loss from continuing operations decreased $6.1 million in 2008 compared to 2007 primarily as a result of a $3.1 million decrease in interest expense, which was primarily due to decreased debt defeasance/prepayment costs, and an increase in equity in net income (loss) of joint ventures of $1.8 million primarily resulting from the above referenced sale of our last joint venture property in 2008.
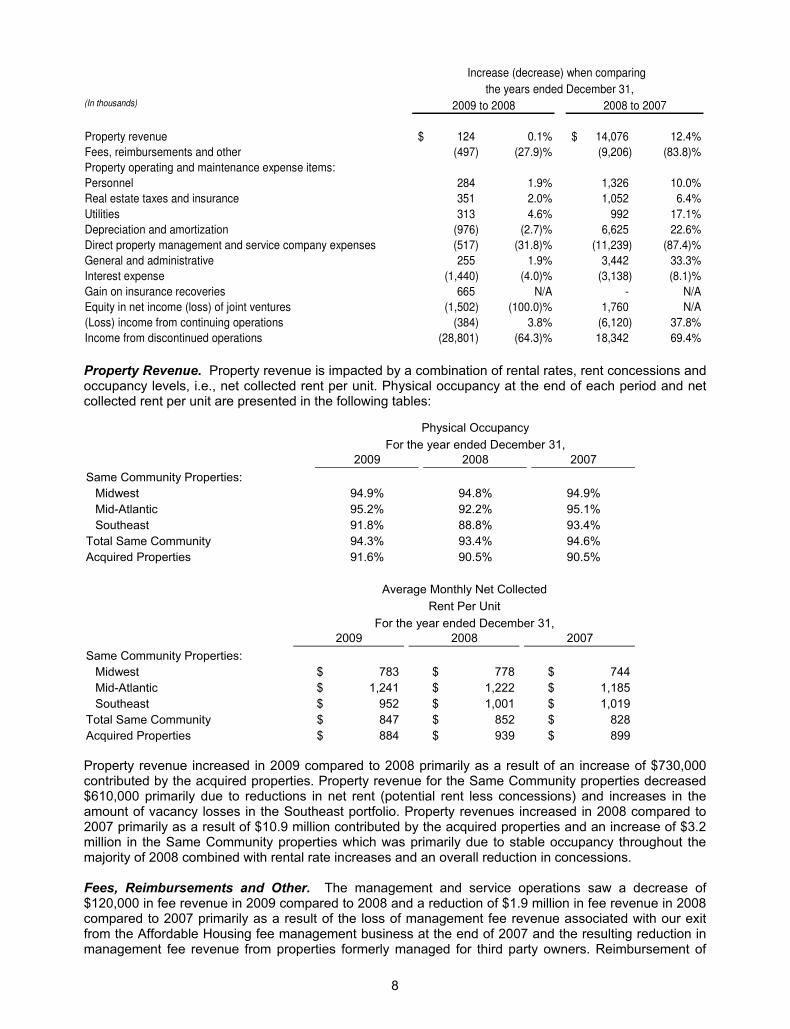
The following chart is intended to reflect the amount and percentage change in line items that are relevant to the changes in overall operating performance:
8
Property Revenue. Property revenue is impacted by a combination of rental rates, rent concessions and occupancy levels, i.e., net collected rent per unit. Physical occupancy at the end of each period and net collected rent per unit are presented in the following tables:
Property revenue increased in 2009 compared to 2008 primarily as a result of an increase of $730,000 contributed by the acquired properties. Property revenue for the Same Community properties decreased $610,000 primarily due to reductions in net rent (potential rent less concessions) and increases in the amount of vacancy losses in the Southeast portfolio. Property revenues increased in 2008 compared to 2007 primarily as a result of $10.9 million contributed by the acquired properties and an increase of $3.2 million in the Same Community properties which was primarily due to stable occupancy throughout the majority of 2008 combined with rental rate increases and an overall reduction in concessions. Fees, Reimbursements and Other. The management and service operations saw a decrease of $120,000 in fee revenue in 2009 compared to 2008 and a reduction of $1.9 million in fee revenue in 2008 compared to 2007 primarily as a result of the loss of management fee revenue associated with our exit from the Affordable Housing fee management business at the end of 2007 and the resulting reduction in management fee revenue from properties formerly managed for third party owners. Reimbursement of
(In thousands) 2009 to 2008 2008 to 2007
Property revenue 124$ 0.1% 14,076$ 12.4%Fees, reimbursements and other (497) (27.9)% (9,206) (83.8)%Property operating and maintenance expense items:Personnel 284 1.9% 1,326 10.0%Real estate taxes and insurance 351 2.0% 1,052 6.4%Utilities 313 4.6% 992 17.1%Depreciation and amortization (976) (2.7)% 6,625 22.6%Direct property management and service company expenses (517) (31.8)% (11,239) (87.4)%General and administrative 255 1.9% 3,442 33.3%Interest expense (1,440) (4.0)% (3,138) (8.1)%Gain on insurance recoveries 665 N/A - N/AEquity in net income (loss) of joint ventures (1,502) (100.0)% 1,760 N/A(Loss) income from continuing operations (384) 3.8% (6,120) 37.8%Income from discontinued operations (28,801) (64.3)% 18,342 69.4%
the years ended December 31,Increase (decrease) when comparing
Physical Occupancy For the year ended December 31, 2009 2008 2007
Same Community Properties: Midwest 94.9% 94.8% 94.9% Mid-Atlantic 95.2% 92.2% 95.1% Southeast 91.8% 88.8% 93.4%
Total Same Community 94.3% 93.4% 94.6% Acquired Properties 91.6% 90.5% 90.5% Average Monthly Net Collected
Rent Per Unit For the year ended December 31, 2009 2008 2007
Same Community Properties: Midwest $ 783 $ 778 $ 744 Mid-Atlantic $ 1,241 $ 1,222 $ 1,185 Southeast $ 952 $ 1,001 $ 1,019
Total Same Community $ 847 $ 852 $ 828 Acquired Properties $ 884 $ 939 $ 899

9
expense from managed properties decreased $400,000 in 2009 compared to 2008 and $7.3 million in 2008 compared to 2007 also as a result of the reduction of the number of properties managed. This reduction had no impact to the net loss from continuing operations as these reimbursements are also included in "Direct property management expenses."
Property Operating and Maintenance Expenses. Property operating and maintenance expenses remained flat for the Same Community properties in 2009 compared to 2008 as well as in 2008 compared to 2007. However, total property operating and maintenance expenses for the entire portfolio increased during both comparison periods because of the additional expenses related to the acquired properties.
Depreciation and Amortization. Depreciation and amortization expenses decreased in 2009 compared to 2008 and increased in 2008 compared to 2007 primarily as a result of the 12-month to 16-month amortization periods of intangible assets recorded in connection with the acquired properties.
Direct Property Management and Service Company Expenses. Direct property management and service company expenses decreased in 2009 compared to 2008 and in 2008 compared to 2007 as a result of the reduction in the number of properties managed for third party owners. The reimbursement of expenses from the managed properties decreased in both comparison periods as previously noted. However, this reduction had no impact to the net loss from continuing operations as these reimbursements are also included in "Fees, reimbursements and other" revenue. Additionally, service company expenses, which represent the portion of general and administrative expense that relates to the management of third party owned properties, decreased $4.0 million in 2008 compared to 2007 due to the reduction in the number of properties managed.
General and Administrative Expenses. General and administrative expense increased in 2009 primarily as a result of an increase in directors' deferred compensation in 2009 compared to 2008. This was primarily a result of valuation adjustments of the directors’ deferred compensation based upon the closing price of our common shares at the end of each period. This increase was partially offset by a reduction to payroll expenses in 2009 compared to 2008. General and administrative expense decreased in 2008 compared to 2007 primarily as a result of the reduction in costs allocated to "Direct property management and service company expenses," as noted above, an increase in 2008 of $560,000 related to pre-acquisition and other project costs, and an increase in deferred directors' compensation expense in 2008 of $470,000. These increases were partially offset by decreases in payroll related costs in 2008 of $600,000 primarily as a result of our exit from the Affordable Housing fee management business in 2008. The director's deferred compensation plan was modified effective January 1, 2010, to provide that all distributions under the plan will be in the form of our common shares instead of cash. As a result, the value of the deferred compensation will no longer be adjusted based upon the closing price of our common shares. Distributions with a commencement date of December 31, 2010 or earlier will continue to be made in cash, however the value of these units was fixed as of December 31, 2009, in accordance with the original terms of the plan.
Interest Expense. Interest expense decreased in 2009 compared to 2008 primarily due to the receipt in the first quarter of 2009 of refunds totaling $563,000 of defeasance costs in connection with certain previously defeased loans and decreased interest expense of $310,000 for borrowings on our revolver. Interest expense decreased in 2008 compared to 2007 primarily due to a reduction of $4.2 million in defeasance/prepayment costs that were included in income from continuing operations. Interest expense, including defeasance/prepayment costs that are associated with discontinued operations are included in "Income from discontinued operations," as discussed below.
Gain on Insurance Recoveries. During 2009, we settled a wind storm damage insurance claim involving 13 of our central Ohio properties for the aggregate sum of $906,000, net of our deductible. Also included in this category was a settlement of $271,000, net of our deductible in connection with a clubhouse fire at one of our Ohio properties. The gain on insurance recoveries recorded during 2009 represents insurance proceeds to be received net of the carrying value of the assets written off and costs incurred to make repairs.

10
Equity in Net Income (Loss) of Joint Ventures. On December 31, 2008, the joint venture in which we were a 50.0% partner sold the Affordable Housing property that it owned. Our proportionate share of the gain recognized in 2008 was $1.6 million.
Income from Discontinued Operations. Included in discontinued operations for the years ended December 31, 2009, 2008 and 2007, are the operating results and the gains related to two wholly owned properties that were sold in 2009, 15 wholly owned properties that were sold in 2008, and three wholly owned properties that were sold in 2007. The operating loss from discontinued operations in 2008 was primarily due to costs incurred to defease loans that were secured by properties that were sold. For further details on "Income from discontinued operations," see Note 2 of the Notes to the Consolidated Financial Statements presented in this report.
Discount/(Premium) on Preferred Share Repurchase. In 2008 and 2007, we repurchased 278,000 and 111,500, respectively, of our preferred depositary shares, which each represent 1/10th of a share of our 8.70% Class B Series II Cumulative Redeemable Preferred Shares. The depositary shares have a recorded value of $25.00 per share. The average price that we paid per share for the 2008 repurchases was $16.77, and we therefore recognized a total discount of $2.3 million. The average price that we paid per share for the 2007 repurchases was $26.02, and we therefore recognized a premium of $114,000.
Inflation. We believe that the effects of inflation only minimally impacts our operational performance because our leases are mostly for 12-month terms, which allows us the opportunity to increase our new lease and lease renewal rents to account for inflationary price increases.
Critical Accounting Estimates
Our consolidated financial statements include accounts of all subsidiaries, the Service Companies and the Operating Partnership structured as a DownREIT. The preparation of the consolidated financial statements in conformity with GAAP requires us to make estimates and assumptions in certain circumstances that affect amounts reported in the consolidated financial statements and related notes. In preparing these consolidated financial statements, we have utilized information available including industry practice and our own past history in forming estimates and judgments of certain amounts included in the consolidated financial statements, giving due consideration to materiality. It is possible that the ultimate outcome that we anticipated in formulating the estimates inherent in these consolidated financial statements may not materialize. However, application of the accounting policies below involves the exercise of judgment and use of assumptions as to future uncertainties and, as a result, actual results could differ from these estimates. In addition, other companies may utilize different estimates that may impact comparability of our results of operations to those of companies in similar businesses.
We assess the recoverability of the carrying value of long-lived assets when an event of impairment has occurred. In performing this analysis, we estimate holding periods of the assets, changes in fair market value of the assets and cash flows related to the operations of the assets to determine the range of potential alternatives and assign a probability to the various alternatives under consideration by management. Should the estimates used to determine alternatives or the probabilities of the occurrence thereof change, impairment may result which could materially impact our results of operations.
We review goodwill annually and whenever there is an impairment indicator. In performing this analysis, we use a multiple of revenues to the range of potential alternatives and assign a probability to the various alternatives we consider. Should estimates used to determine the alternatives considered or the probabilities of the occurrence thereof change, impairment may result which could materially impact our results of operations.
We estimate the fair value of share-based compensation awarded. We use the Black-Scholes option-pricing model to estimate the fair value of the stock options, and the Monte Carlo method to estimate the fair value of restricted share awards in which the number of shares that will ultimately vest are subject to market conditions. The use of judgment and/or estimates is required in determining certain of the assumptions used by these valuation models. If we had used different judgment and/or estimates, different valuations would have been produced that may have resulted in a material change to our results

11
of operations. We also estimate future performance results related to certain share-based awards. If the results vary from our estimate, it may require us to make a material adjustment to our results of operations. We estimate the amount of real estate taxes for which we will be liable based upon assumptions relating to possible changes in millage rates and property value reassessments. In most circumstances, the actual millage rates or reassessment values are not available until the following reporting period and consequently these rates or values could differ from assumptions and require material adjustments to the liabilities recorded. Quantitative and Qualitative Disclosures About Market Risk Interest Rate Risk. Based on our variable rate debt outstanding at December 31, 2009 and 2008, an interest rate change of 100 basis points would impact interest expense by approximately $475,000 and $565,000 on an annual basis, respectively. Additionally, we have interest rate risk associated with fixed rate debt at maturity. We have, and will continue to manage, interest rate risk as follows: (i) maintain what we believe to be a conservative ratio of fixed rate, long-term debt to total debt such that variable rate exposure is kept at an acceptable level; (ii) consider hedges for certain long term variable and/or fixed rate debt through the use of interest rate swaps or interest rate caps; and (iii) consider the use of treasury locks where appropriate to hedge rates on anticipated debt transactions. We use various financial models and advisors to assist us in analyzing opportunities to achieve those objectives. For additional information related to interest rate hedge agreements, see "Derivative Instruments and Hedging Activities" in Note 1 of the Notes to Consolidated Financial Statements presented in this report. The table below provides information about our financial instruments that are sensitive to change in interest rates. For debt obligations, the table below presents principal cash flows and related weighted average interest rates based on expected maturity dates.
CONTINGENCIES Environmental. We have reviewed tangible long-lived assets and other agreements for associated asset retirement obligations ("AROs") and have determined that we do not have any material AROs that would require recognition as a liability or disclosure in our financial statements at December 31, 2009. Phase I environmental audits were obtained at the time of the IPO, property acquisition or property refinancing, as the case may be, on all of our wholly owned properties. Future claims for environmental liabilities are not measurable given the uncertainties surrounding whether there exists a basis for any such claims to be asserted, and if so, whether any claims will, in fact, be asserted. Pending Litigation. For a discussion of pending litigation, see Note 8 of the Notes to Consolidated Financial Statements presented in this report.
December 31, 2009 December 31, 2008
(Dollar amounts in thousands) Fair Market Fair Market
Long term debt 2010 2011 2012 2013 2014 Thereafter Total Value Total Value
Fixed:
Fixed rate mortgage debt $ 78,310 $ 54,570 $ 81,584 $ 132,209 $ 44,538 $ 87,274 $ 478,485 $ 470,393 $ 500,981 $ 492,525
Weighted average interest rate 6.0% 7.6% 7.0% 6.1% 5.6% 6.4% 6.4%
Variable:
Variable rate mortgage debt - - - - - 34,851 34,851 37,360 35,000 34,813
Weighted average interest rate - - - - - 4.7% 4.7%
LIBOR based revolving credit facility (1) - 12,500 - - - - 12,500 12,309 21,500 21,552
Total variable rate debt - 12,500 - - - 34,851 47,351 49,669 56,500 56,365
Total long term debt $ 78,310 $ 67,070 $ 81,584 $ 132,209 $ 44,538 $ 122,125 $ 525,836 $ 520,062 $ 557,481 $ 548,890
(1) Our unsecured revolving credit facility matures in March 2011 and had a weighted average interest rate of 2.6% at December
31, 2009.

12
Controls and Procedures Disclosure Controls and Procedures. We evaluated the design and operation of our disclosure controls and procedures to determine whether they are effective in ensuring that the disclosure of required information is made timely in accordance with the Securities Exchange Act of 1934 ("Exchange Act") and the rules and forms of the Securities and Exchange Commission. This evaluation was made under the supervision and with the participation of management, including our Chief Executive Officer ("CEO") and Chief Financial Officer ("CFO") as of the end of the period covered by this annual report. The CEO and CFO have concluded, based on their review, that our disclosure controls and procedures, as defined in Exchange Act Rules 13a-15(e) and 15d-15(e), are effective to ensure that information required to be disclosed in reports that we file under the Exchange Act is (i) recorded, processed, summarized and reported within the time periods specified in Securities and Exchange Commission rules and forms, and (ii) accumulated and communicated to management, including the principal executive and principal financial officers, as appropriate, to allow timely decisions regarding disclosure. Management's Report on Internal Control Over Financial Reporting. We are responsible for establishing and maintaining adequate internal control over financial reporting as defined in Rule 13a-15(f) under the Exchange Act. We assessed the effectiveness of our internal control over financial reporting using the criteria set forth by the Committee of Sponsoring Organizations of the Treadway Commission (COSO) in "Internal Control - Integrated Framework." Based on that assessment and those criteria, we concluded that our internal control over financial reporting is effective as of December 31, 2009. Our independent registered public accounting firm, PricewaterhouseCoopers LLP, has issued an audit report on the effectiveness of our internal control over financial reporting, which is included in the "Report of Independent Registered Public Accounting Firm" in this annual report. Changes in Internal Control Over Financial Reporting. There were no changes in our internal control over financial reporting during the fourth quarter of 2009 that materially affected or are reasonably likely to materially affect our internal control over financial reporting. We believe that because of its inherent limitations, internal control over financial reporting may not prevent or detect misstatements. Also, projections of any evaluation of effectiveness to future periods are subject to the risk that controls may become inadequate because of changes in conditions, or that the degree of compliance with the policies or procedures may deteriorate. Risk Factors We are subject to certain risks and uncertainties as described below. These risks and uncertainties are not the only ones we face, and there may be additional risks that we do not presently know of or that we currently consider immaterial. All of these risks could adversely affect our business, financial condition, results of operations and cash flows. Our ability to pay dividends on, and the market price of, our equity securities may be adversely affected if any of such risks are realized. We are subject to risks inherent in the real estate business and operation of a REIT. We own and manage multifamily apartment communities that are subject to varying degrees of risk generally incident to the ownership of real estate. Our financial condition, the value of our properties and our ability to make distributions to our shareholders will be dependent upon our continued access to the debt and equity markets and our ability to operate our properties in a manner sufficient to generate income in excess of operating expenses and debt service charges, which may be affected by the following risks, some of which are discussed in more detail below:
� Changes in the economic climate in the markets in which we own and manage properties, including interest rates, the overall level of economic activity, the availability of consumer credit and mortgage financing, unemployment rates and other factors;
� Our ability to refinance debt on favorable terms at maturity; � Risks of a lessening of demand for the multifamily units that we own or manage; � Competition from other available multifamily units and changes in market rental rates; � Increases in property and liability insurance costs;

13
� Unanticipated increases in real estate taxes and other operating expenses; � Weather conditions that adversely affect operating expenses; � Expenditures that cannot be anticipated, such as utility rate and usage increases,
unanticipated repairs and real estate tax valuation reassessments or millage rate increases; � Inability to control operating expenses or achieve increases in revenue; � Ownership limitations on our common and preferred shares that may discourage a takeover
otherwise considered favorably by shareholders; � The results of litigation filed or to be filed against us; � Changes in tax legislation; � Risks of personal injury claims and property damage related to mold claims because of
diminished insurance coverage; � Catastrophic property damage losses that are not covered by our insurance; � Our ability to acquire properties at prices consistent with our investment criteria; � Risks associated with property acquisitions, such as environmental liabilities, among others; � Changes in or termination of contracts relating to third party management and advisory
business; � Risks related to the perception of residents and prospective residents as to the
attractiveness, convenience and safety of our properties or the neighborhoods in which they are located; and
� Construction business risks.
We are dependent on rental income from our multifamily apartment communities. If we are unable to attract and retain residents or if our residents are unable to pay their rental obligations, our financial condition and funds available for distribution to our shareholders may be adversely affected.
Our multifamily apartment communities are subject to competition. Our apartment communities are located in developed areas that include other apartment communities and compete with other housing alternatives, such as condominiums, single and multifamily rental homes and owner occupied single and multifamily homes. In certain markets, such as Florida, failed condominium conversions or properties originally developed as condominiums are reverting to apartment rentals, creating increasing competition in those markets. Moreover, rentals resulting from bank foreclosures may create additional competition in certain of our markets. Such competition may affect our ability to attract and retain residents and to increase or maintain rental rates.
The properties we own are concentrated in Ohio, Michigan, Georgia, Florida, Indiana, Virginia and Maryland. As of December 31, 2009, approximately 32%, 24%, 14%, 10%, 7%, 7% and 6% of the units in properties we own were located in Ohio, Michigan, Georgia, Florida, Indiana, Virginia and Maryland, respectively. Our performance, therefore, is linked to economic conditions and the market for available rental housing in the sub-markets in which we operate. Deteriorating economic conditions, such as continued high unemployment and competition from unsold or foreclosed homes or condominiums in the various sub-markets in Ohio and Michigan, where 56% of our units are located, or to a lesser extent the sub-markets in the other states, may adversely affect our financial condition, results of operations and ability to make distributions to our shareholders.
Our insurance may not be adequate to cover certain risks. There are certain types of risks, generally of a catastrophic nature, such as earthquakes, floods, windstorms, acts of war and terrorist attacks that may be uninsurable, are not economically insurable, or are not fully covered by insurance. Moreover, certain risks, such as mold and environmental exposures, generally are not covered by our insurance. Other risks are subject to various limits, sublimits, deductibles and self insurance retentions, which help to control insurance costs, but which may result in increased exposures to uninsured loss. Any such uninsured loss could have a material adverse effect on our business, financial condition and results of operations.

14
Secured debt financing could adversely affect our performance. At December 31, 2009, thirty-one of our 48 properties were encumbered by project specific, non-recourse, and except for five properties, non-cross-collateralized mortgage debt. There is a risk that these properties may not have sufficient cash flow from operations to pay required principal and interest. We may not be able to refinance these loans at an amount equal to the loan balance and the terms of any refinancing may not be as favorable as the terms of existing indebtedness. If we are unable to make required payments on indebtedness that is secured by a mortgage, the property securing the mortgage may be foreclosed with a consequent loss of income and value to us. Although Fannie Mae and Freddie Mac continue to provide needed financing to qualified borrowers, such as ourselves, there is no assurance that those alternatives will remain available.
Real estate investments are generally illiquid, and we may not be able to sell our properties when it is economically or strategically advantageous to do so. Real estate investments generally cannot be sold quickly, and our ability to sell properties may be affected by market conditions. We may not be able to further diversify or vary our portfolio in accordance with our strategies or in response to economic or other conditions. In addition, provisions of the Internal Revenue Code of 1986, as amended (the "Code"), limit the ability of a REIT to sell its properties in some situations when it may be economically advantageous to do so, thereby potentially adversely affecting our ability to make distributions to our shareholders.
Our access to corporate public bond markets is limited. Substantially all of our current debt either is secured property-specific mortgages or bank debt under our unsecured revolving credit facility. In order to access the corporate public bond markets, we would need major modifications to the shelf registration debt covenants contained in the indenture currently in place.
Litigation may result in unfavorable outcomes. Like many real estate operators, we are frequently involved in lawsuits involving premises liability claims, housing discrimination claims and alleged violations of landlord-tenant laws, which may give rise to class action litigation or governmental investigations. Any material litigation not covered by insurance, such as a class action, could result in substantial costs being incurred.
The costs of complying with laws and regulations could adversely affect our cash flow. Our properties must comply with Title III of the Americans with Disabilities Act (the "ADA") to the extent that they are "public accommodations" or "commercial facilities" as defined in the ADA. The ADA does not consider apartment communities to be public accommodations or commercial facilities, except for portions of such communities that are open to the public. In addition, the Fair Housing Amendments Act of 1988 (the "FHAA") requires apartment communities first occupied after March 13, 1990 to be accessible to the handicapped. Other laws also require apartment communities to be handicap accessible. Noncompliance with these laws could result in the imposition of fines or an award of damages to private litigants. We have been subject to lawsuits alleging violations of handicap design laws in connection with certain of our developments.
Under various federal, state and local laws, an owner or operator of real estate may be liable for the costs of removal or remediation of certain hazardous or toxic substances on, under or in the property. This liability may be imposed without regard to whether the owner or operator knew of, or was responsible for, the presence of the substances. Other laws impose on owners and operators certain requirements regarding conditions and activities that may affect human health or the environment. Failure to comply with applicable requirements could complicate our ability to lease or sell an affected property and could subject us to monetary penalties, costs required to achieve compliance and potential liability to third parties. We are not aware of any material noncompliance, liability or claim relating to hazardous or toxic substances or other environmental matters in connection with any of our properties. Nonetheless, it is possible that material environmental contamination or conditions exist, or could arise in the future in the apartment communities or on the land upon which they are located.
We are subject to risks associated with development, acquisition and expansion of multifamily apartment communities. Development projects, acquisitions and expansions of apartment communities are subject to a number of risks, including:
15
� Availability of acceptable financing; � Competition with other entities for investment opportunities; � Failure by our properties to achieve anticipated operating results; � Construction costs of a property exceeding original estimates; � Delays in construction; and � Expenditure of funds on, and the devotion of management time to, transactions that may
not come to fruition.
We impose stock ownership limitations that may discourage a takeover otherwise considered favorable by shareholders. With certain limited exceptions, our Second Amended and Restated Articles of Incorporation, as amended and supplemented to date, prohibit the ownership of more than 4.0% of our outstanding common shares and more than 9.8% of the shares of any series of any class of our preferred shares by any person, unless we grant a waiver. Absent such a waiver, any shares owned in excess of such ownership limit are subject to repurchase by us and to other consequences as set forth in our Second Amended and Restated Articles of Incorporation. All shares of stock issued by our company are subject to the following restrictions, whether such shares are in certificated or uncertificated form:
"The Common Shares represented by this certificate are subject to restrictions on transfer for the purpose of preserving the Corporation’s status as a Real Estate Investment Trust under the Internal Revenue Code of 1986, as amended. Subject to certain provisions of the Corporation’s Amended and Restated Articles of Incorporation, no Person may Beneficially Own Common Shares in excess of 4.0% of the outstanding Common Shares of the Corporation (unless such Person is an Existing Holder) and no Person (other than an Existing Holder who Constructively Owns in excess of 9.8% of the Common Shares immediately following the consummation of the Initial Public Offering) may Constructively Own Common Shares in excess of 9.8% of the outstanding Common Shares of the Corporation. Any Person who attempts to Beneficially Own or Constructively Own Common Shares in excess of the above limitations must immediately notify the Corporation. All capitalized terms in this legend have the meanings defined in the Corporation’s Second Amended and Restated Articles of Incorporation, a copy of which, including the restrictions of transfer, will be sent without charge to each shareholder who so requests. If the restrictions on transfer are violated, certain of the Common Shares represented may be subject to repurchase by the Corporation on the terms and conditions set forth in the Corporation’s Second Amended and Restated Articles of Incorporation."
We have a shareholders rights plan which would delay or prevent a change in control. We also have a shareholders rights plan, which may be triggered if any person or group becomes the beneficial owner of, or announces an offer to acquire 15.0% or more of our common shares. We are domiciled in the State of Ohio, where various state statutes place certain restrictions on takeover activity. Our shareholders rights plan and these restrictions are likely to have the effect of precluding acquisition of control of us without our consent even if a change in control is in the interests of shareholders. All shares of stock issued by our company include the following reference to such shareholders rights agreement whether such shares are in certificated or uncertificated form:
"This certificate also evidences and entitles the holder hereof to certain Rights as set forth in a Second Amended and Restated Shareholder Rights Agreement between Associated Estates Realty Corporation, an Ohio corporation (the "Company"), and Wells Fargo Shareowner Services, a division of Wells Fargo Bank, N.A. as rights agent (the "Rights Agent"), dated as of December 30, 2008 (as amended, supplemented or otherwise modified from time to time, the "Rights Agreement"), the terms of which are incorporated by reference herein and a copy of which is on file at the principal offices of the Company and the stock transfer administration office of the Rights Agent. The Company will mail a copy of the Rights Agreement without charge to the holder of this certificate within five days after the receipt of a written request therefore. Under certain circumstances, as set forth in the Rights Agreement, the Rights will be evidenced by separate certificates and will no longer be evidenced by this certificate. The Company may redeem the Rights at a redemption price of $0.01 per Right, subject to adjustment, under the terms of the Rights Agreement. Under certain circumstances, Rights issued to or held by Acquiring Persons or by any Affiliates or Associates thereof (as defined in the Rights Agreement), and any subsequent holder of such Rights, may become null and void. The Rights are not exercisable, and are void so long as held, by a holder in any jurisdiction where the requisite qualification to the issuance to such holder, or the exercise by such holder, of the Rights in such jurisdiction has not been obtained."
16
We may fail to qualify as a REIT and our shareholders may incur tax liability as a result.Commencing with our taxable year ending December 31, 1993, we have operated in a manner so as to permit us to qualify as a REIT under the Code, and we intend to continue to operate in such a manner. Although we believe that we will continue to operate as a REIT, no assurance can be given that we will remain qualified as a REIT. If we were to fail to qualify as a REIT in any taxable year, we would not be allowed a deduction for distributions to our shareholders in computing our taxable income and would be subject to federal income tax (including any applicable alternative minimum tax) on our taxable income at regular corporate rates. Unless we are entitled to relief under certain Code provisions, we also would be disqualified from treatment as a REIT for the four taxable years following the year during which REIT qualification was lost. As a result, the cash available for distribution to our shareholders could be reduced or eliminated for each of the years involved.
We are subject to control by our directors and officers. Our directors and executive officers and some members of their respective families owned approximately 15.0% of our outstanding common shares as of December 31, 2009. Accordingly, those persons have substantial influence over us and the outcome of matters submitted to our shareholders for approval.
We depend on our key personnel. Our success depends, to a significant degree, upon the continued contribution of key members of our management team, who may be difficult to replace. The loss of services of these executives could have a material adverse effect on us. There can be no assurance that the services of such personnel will continue to be available to us. Our Chairman of the Board, President and Chief Executive Officer, Mr. Jeffrey I. Friedman, is a party to an employment agreement with us. Other than Mr. Friedman, we do not have employment agreements with key personnel. We do not hold key-man life insurance on any of our key personnel.
We may be exposed to construction business risk. Our subsidiary, Merit Enterprises, Inc., is engaged in the construction business as a general contractor. Inherent risks of those operations include the following:
� Fixed price contracts can be adversely affected by a number of factors that cause actual results to exceed the cost estimates at the time of original bid, resulting in increased project costs and possible losses;
� Penalties for late completion; � Adverse weather conditions; � Continuing difficulties in the development and construction industries; � Continuing difficulties in obtaining financing for development and construction; � Failure of subcontractors to perform as anticipated; and � Bonding indemnification obligations for which the parent company is responsible.

17
Report of Independent Registered Public Accounting Firm
To the Board of Directors and Shareholders of Associated Estates Realty Corporation:
In our opinion, the consolidated financial statements listed in the accompanying index appearing under Item 15 (1) present fairly, in all material respects, the financial position of Associated Estates Realty Corporationand its subsidiaries (the "Company") at December 31, 2009 and December 31, 2008, and the results of their operations and their cash flows for each of the three years in the period ended December 31, 2009 inconformity with accounting principles generally accepted in the United States of America. In addition, in our opinion, the financial statement schedules listed in the accompanying index under Item 15(2) present fairly, in all material respects, the information set forth therein when read in conjunction with the related consolidated financial statements. Also in our opinion, the Company maintained, in all material respects, effective internal control over financial reporting as of December 31, 2009, based on criteria established in Internal Control - Integrated Framework issued by the Committee of Sponsoring Organizations of the Treadway Commission (COSO). The Company's management is responsible for these financial statements and financial statement schedules, for maintaining effective internal control over financial reporting and for its assessment of the effectiveness of internal control over financial reporting, included in Management's Report on Internal Controls Over Financial Reporting included in the accompanying Item 9A. Our responsibility is to express opinions on these financial statements, on the financial statement schedules, and on the Company's internal control over financial reporting based on our integrated audits. We conducted our audits in accordance with the standards of the Public Company Accounting Oversight Board (United States). Those standards require that we plan and perform the audits to obtain reasonable assurance about whether the financial statements are free of material misstatement and whether effective internal control over financial reporting was maintained in all material respects. Our audits of the financial statements included examining, on a test basis, evidence supporting the amounts and disclosures in the financial statements, assessing the accounting principles used and significant estimates made by management, and evaluating the overall financial statement presentation. Our audit of internal control over financial reporting included obtaining an understanding of internal control over financial reporting, assessing the risk that a material weakness exists, and testing and evaluating the design and operating effectiveness of internal control based on the assessed risk. Our audits also included performing such other procedures as we considered necessary in the circumstances. We believe that our audits provide a reasonable basis for our opinions.
As discussed in Note 13 to the consolidated financial statements, the Company changed the manner in which it computes earnings per share effective January 1, 2009.
A company’s internal control over financial reporting is a process designed to provide reasonable assurance regarding the reliability of financial reporting and the preparation of financial statements for external purposes in accordance with generally accepted accounting principles. A company’s internal control over financial reporting includes those policies and procedures that (i) pertain to the maintenance of records that, in reasonable detail, accurately and fairly reflect the transactions and dispositions of the assets of the company; (ii) provide reasonable assurance that transactions are recorded as necessary to permit preparation of financial statements in accordance with generally accepted accounting principles, and that receipts and expenditures of the company are being made only in accordance with authorizations of management and directors of the company; and (iii) provide reasonable assurance regarding prevention or timely detection of unauthorized acquisition, use, or disposition of the company’s assets that could have a material effect on the financial statements.
Because of its inherent limitations, internal control over financial reporting may not prevent or detect misstatements. Also, projections of any evaluation of effectiveness to future periods are subject to the risk that controls may become inadequate because of changes in conditions, or that the degree of compliance with the policies or procedures may deteriorate.
Cleveland, Ohio February 25, 2010
17
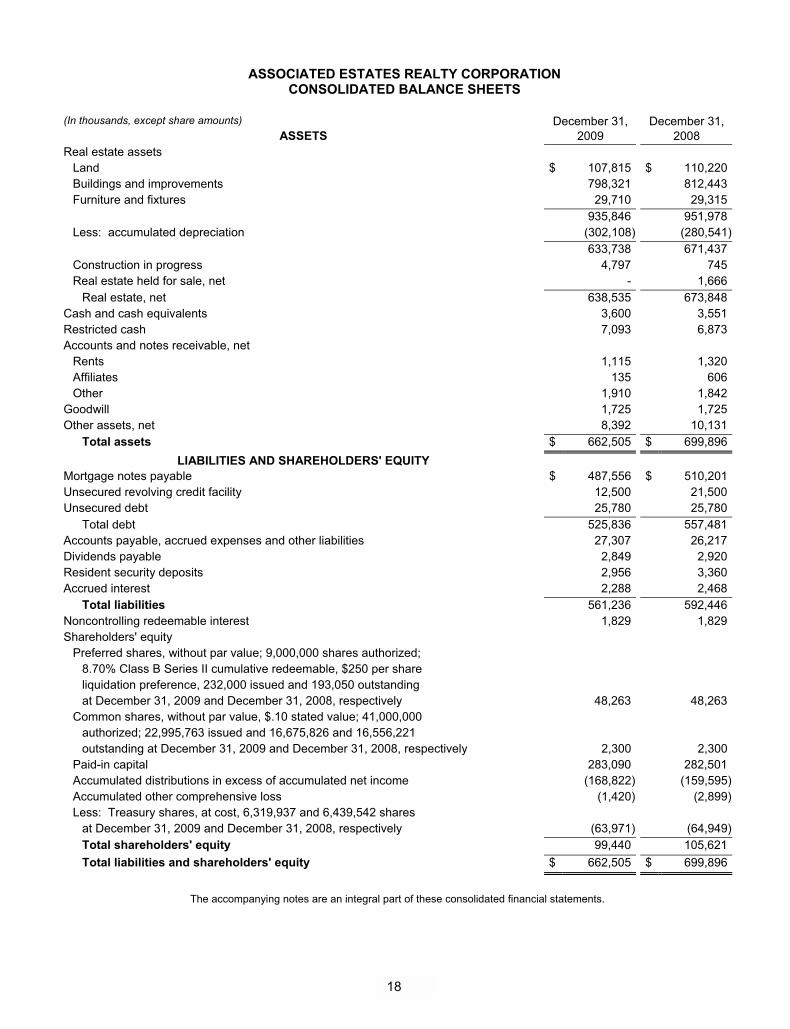
18
ASSOCIATED ESTATES REALTY CORPORATION CONSOLIDATED BALANCE SHEETS
18
(In thousands, except share amounts) December 31, December 31,
ASSETS 2009 2008 Real estate assets
Land $ 107,815 $ 110,220 Buildings and improvements 798,321 812,443 Furniture and fixtures 29,710 29,315
935,846 951,978 Less: accumulated depreciation (302,108) (280,541)
633,738 671,437 Construction in progress 4,797 745 Real estate held for sale, net - 1,666
Real estate, net 638,535 673,848 Cash and cash equivalents 3,600 3,551 Restricted cash 7,093 6,873 Accounts and notes receivable, net
Rents 1,115 1,320 Affiliates 135 606 Other 1,910 1,842
Goodwill 1,725 1,725 Other assets, net 8,392 10,131
Total assets $ 662,505 $ 699,896 LIABILITIES AND SHAREHOLDERS' EQUITY
Mortgage notes payable $ 487,556 $ 510,201 Unsecured revolving credit facility 12,500 21,500 Unsecured debt 25,780 25,780
Total debt 525,836 557,481 Accounts payable, accrued expenses and other liabilities 27,307 26,217 Dividends payable 2,849 2,920 Resident security deposits 2,956 3,360 Accrued interest 2,288 2,468
Total liabilities 561,236 592,446 Noncontrolling redeemable interest 1,829 1,829 Shareholders' equity
Preferred shares, without par value; 9,000,000 shares authorized; 8.70% Class B Series II cumulative redeemable, $250 per share liquidation preference, 232,000 issued and 193,050 outstanding at December 31, 2009 and December 31, 2008, respectively 48,263 48,263
Common shares, without par value, $.10 stated value; 41,000,000 authorized; 22,995,763 issued and 16,675,826 and 16,556,221 outstanding at December 31, 2009 and December 31, 2008, respectively 2,300 2,300
Paid-in capital 283,090 282,501 Accumulated distributions in excess of accumulated net income (168,822) (159,595)Accumulated other comprehensive loss (1,420) (2,899)Less: Treasury shares, at cost, 6,319,937 and 6,439,542 shares
at December 31, 2009 and December 31, 2008, respectively (63,971) (64,949)Total shareholders' equity 99,440 105,621 Total liabilities and shareholders' equity $ 662,505 $ 699,896
The accompanying notes are an integral part of these consolidated financial statements.
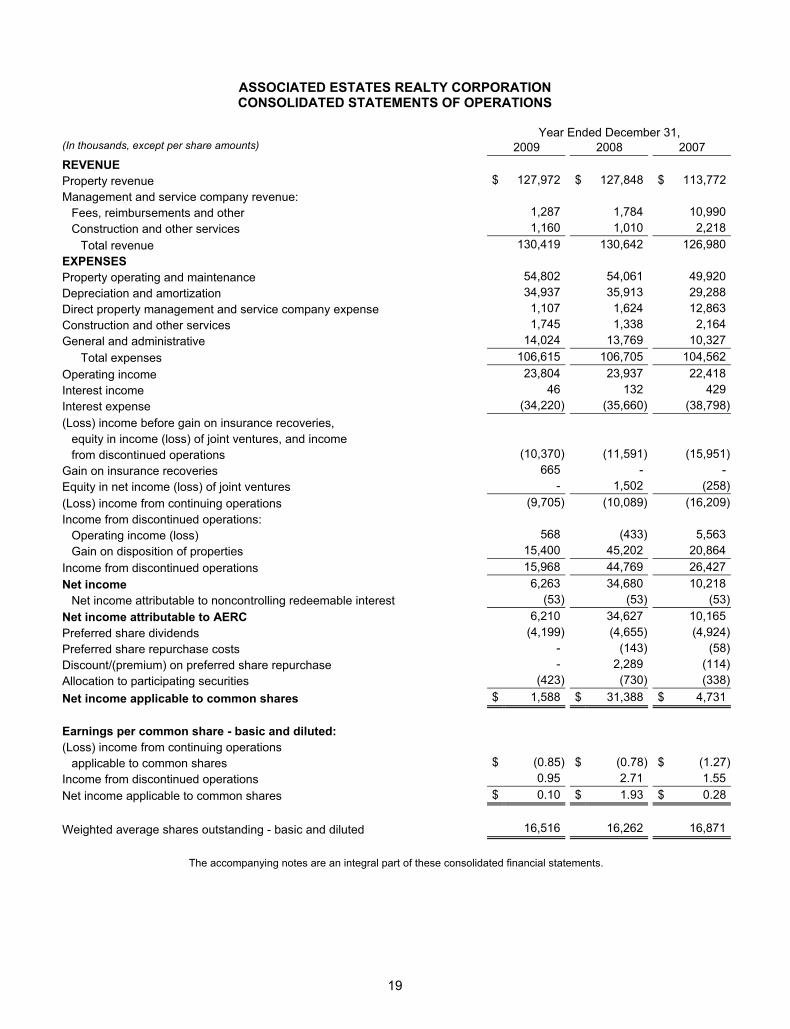
19
ASSOCIATED ESTATES REALTY CORPORATION CONSOLIDATED STATEMENTS OF OPERATIONS
Year Ended December 31, (In thousands, except per share amounts) 2009 2008 2007 REVENUE Property revenue $ 127,972 $ 127,848 $ 113,772 Management and service company revenue:
Fees, reimbursements and other 1,287 1,784 10,990 Construction and other services 1,160 1,010 2,218
Total revenue 130,419 130,642 126,980 EXPENSES Property operating and maintenance 54,802 54,061 49,920 Depreciation and amortization 34,937 35,913 29,288 Direct property management and service company expense 1,107 1,624 12,863 Construction and other services 1,745 1,338 2,164 General and administrative 14,024 13,769 10,327
Total expenses 106,615 106,705 104,562 Operating income 23,804 23,937 22,418 Interest income 46 132 429 Interest expense (34,220) (35,660) (38,798)(Loss) income before gain on insurance recoveries,
equity in income (loss) of joint ventures, and income from discontinued operations (10,370) (11,591) (15,951)
Gain on insurance recoveries 665 - - Equity in net income (loss) of joint ventures - 1,502 (258)(Loss) income from continuing operations (9,705) (10,089) (16,209)Income from discontinued operations:
Operating income (loss) 568 (433) 5,563 Gain on disposition of properties 15,400 45,202 20,864
Income from discontinued operations 15,968 44,769 26,427 Net income 6,263 34,680 10,218
Net income attributable to noncontrolling redeemable interest (53) (53) (53)Net income attributable to AERC 6,210 34,627 10,165 Preferred share dividends (4,199) (4,655) (4,924)Preferred share repurchase costs - (143) (58)Discount/(premium) on preferred share repurchase - 2,289 (114)Allocation to participating securities (423) (730) (338)Net income applicable to common shares $ 1,588 $ 31,388 $ 4,731 Earnings per common share - basic and diluted: (Loss) income from continuing operations
applicable to common shares $ (0.85) $ (0.78) $ (1.27)Income from discontinued operations 0.95 2.71 1.55 Net income applicable to common shares $ 0.10 $ 1.93 $ 0.28 Weighted average shares outstanding - basic and diluted 16,516 16,262 16,871
The accompanying notes are an integral part of these consolidated financial statements.

20
ASSOCIATED ESTATES REALTY CORPORATION
CONSOLIDATED STATEMENTS OF SHAREHOLDERS' EQUITY
20
Year Ended December 31, (In thousands, except share data) 2009 2008 2007 Common shares outstanding Balance outstanding at beginning of period 16,556,221 16,353,700 17,261,224 Shares purchased (33,515) (21,003) (1,045,346)Shares issued from treasury for stock option exercises 47,500 180,021 22,479 Restricted share activity, net 105,620 43,503 115,343 Balance outstanding at end of period 16,675,826 16,556,221 16,353,700 Preferred shares outstanding Balance outstanding at beginning of period 193,050 220,850 232,000 Purchase and retirement of Class B Cumulative Redeemable Preferred Shares - (27,800) (11,150)Balance outstanding at end of period 193,050 193,050 220,850
Noncontrolling redeemable interest Balance outstanding at beginning of period $ 1,829 $ 1,829 $ 1,829 Balance outstanding at end of period $ 1,829 $ 1,829 $ 1,829
Preferred shares Balance outstanding at beginning of period $ 48,263 $ 55,213 $ 58,000 Purchase and retirement of Class B Cumulative Redeemable Preferred Shares - (6,950) (2,787)Balance outstanding at end of period 48,263 48,263 55,213
Common shares (at $.10 stated value) Balance outstanding at beginning and end of period 2,300 2,300 2,300 Paid-in capital Balance outstanding at beginning of period 282,501 281,152 280,369 Share based compensation 538 1,294 786 Shares issued from treasury for stock option exercises 51 (88) (60)Purchase and retirement of Class B Cumulative Redeemable Preferred Shares - 143 57 Balance outstanding at end of period 283,090 282,501 281,152 Accumulated distributions in excess of accumulated net income Balance outstanding at beginning of period (159,595) (180,436) (173,962)Net income 6,263 34,680 10,218 Net income attributable to noncontrolling redeemable interest (53) (53) (53)Share based compensation 6 8 10 Purchase and retirement of Class B Cumulative Redeemable Preferred Shares - 2,146 (172)Common share dividends declared (11,244) (11,285) (11,553)Preferred share dividends declared (4,199) (4,655) (4,924)Balance outstanding at end of period (168,822) (159,595) (180,436) Accumulated other comprehensive loss Balance outstanding at beginning of period (2,899) (1,050) (71)Change in fair value of hedge instruments 1,479 (1,849) (979)Balance outstanding at end of period (1,420) (2,899) (1,050) Treasury shares (at cost) Balance outstanding at beginning of period (64,949) (67,393) (54,585)Purchase of common shares (179) (221) (13,959)Share based compensation 807 734 890 Shares issued from treasury for stock option exercises 350 1,931 261 Balance outstanding at end of period (63,971) (64,949) (67,393)Total shareholders' equity $ 99,440 $ 105,621 $ 89,786
The accompanying notes are an integral part of these consolidated financial statements.
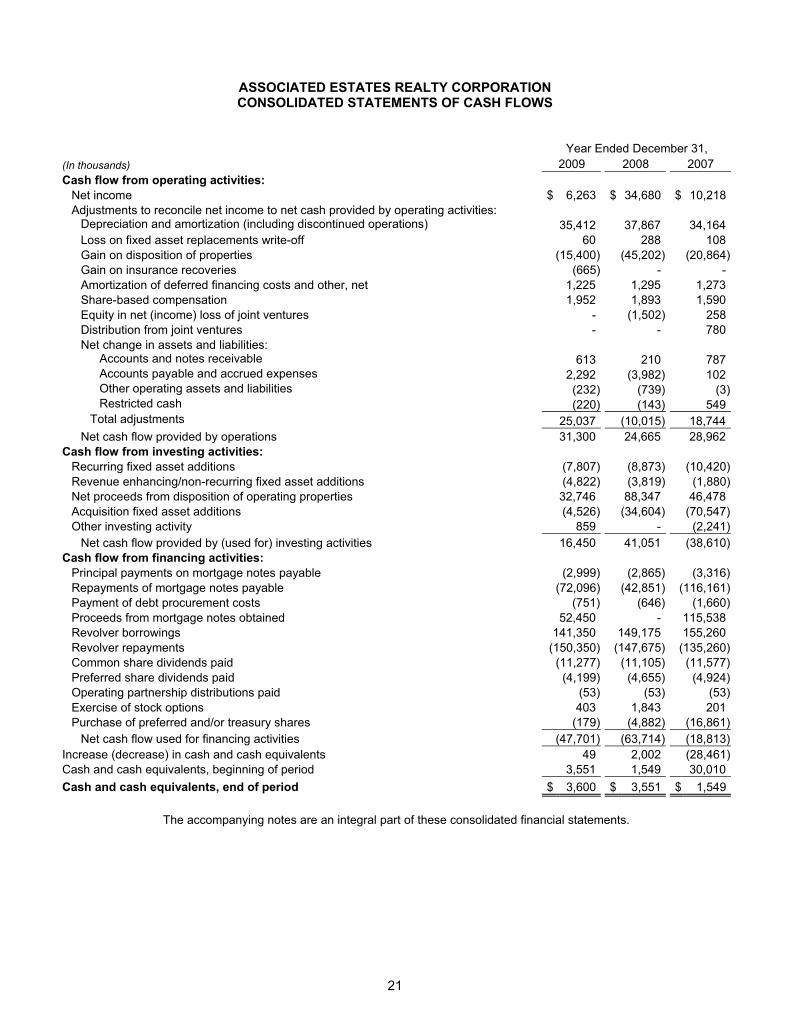
21
ASSOCIATED ESTATES REALTY CORPORATION CONSOLIDATED STATEMENTS OF CASH FLOWS
Year Ended December 31, (In thousands) 2009 2008 2007 Cash flow from operating activities:
Net income $ 6,263 $ 34,680 $ 10,218 Adjustments to reconcile net income to net cash provided by operating activities:
Depreciation and amortization (including discontinued operations) 35,412 37,867 34,164 Loss on fixed asset replacements write-off 60 288 108 Gain on disposition of properties (15,400) (45,202) (20,864)Gain on insurance recoveries (665) - - Amortization of deferred financing costs and other, net 1,225 1,295 1,273 Share-based compensation 1,952 1,893 1,590 Equity in net (income) loss of joint ventures - (1,502) 258 Distribution from joint ventures - - 780 Net change in assets and liabilities:
Accounts and notes receivable 613 210 787 Accounts payable and accrued expenses 2,292 (3,982) 102 Other operating assets and liabilities (232) (739) (3)Restricted cash (220) (143) 549
Total adjustments 25,037 (10,015) 18,744 Net cash flow provided by operations 31,300 24,665 28,962
Cash flow from investing activities: Recurring fixed asset additions (7,807) (8,873) (10,420)Revenue enhancing/non-recurring fixed asset additions (4,822) (3,819) (1,880)Net proceeds from disposition of operating properties 32,746 88,347 46,478 Acquisition fixed asset additions (4,526) (34,604) (70,547)Other investing activity 859 - (2,241)
Net cash flow provided by (used for) investing activities 16,450 41,051 (38,610)Cash flow from financing activities:
Principal payments on mortgage notes payable (2,999) (2,865) (3,316)Repayments of mortgage notes payable (72,096) (42,851) (116,161)Payment of debt procurement costs (751) (646) (1,660)Proceeds from mortgage notes obtained 52,450 - 115,538 Revolver borrowings 141,350 149,175 155,260 Revolver repayments (150,350) (147,675) (135,260)Common share dividends paid (11,277) (11,105) (11,577)Preferred share dividends paid (4,199) (4,655) (4,924)Operating partnership distributions paid (53) (53) (53)Exercise of stock options 403 1,843 201 Purchase of preferred and/or treasury shares (179) (4,882) (16,861)
Net cash flow used for financing activities (47,701) (63,714) (18,813)Increase (decrease) in cash and cash equivalents 49 2,002 (28,461)Cash and cash equivalents, beginning of period 3,551 1,549 30,010 Cash and cash equivalents, end of period $ 3,600 $ 3,551 $ 1,549
The accompanying notes are an integral part of these consolidated financial statements.

22
ASSOCIATED ESTATES REALTY CORPORATION NOTES TO CONSOLIDATED FINANCIAL STATEMENTS
1. BASIS OF PRESENTATION AND ACCOUNTING POLICIES
Business
We are a self-administered and self-managed equity real estate investment trust ("REIT") specializing in multifamily property management, advisory, development, construction, acquisition, disposition, operation and ownership activities. In addition to rental revenue, we receive certain property and asset management fees, acquisition, disposition, incentive and consultation fees. Our MIG subsidiary is a registered investment advisor and serves as a real estate advisor to pension funds. We own two taxable REIT subsidiaries (the "Service Companies") that provide management and other services to us and to third parties.
As of December 31, 2009, our owned and non-owned property portfolio consisted of: (i) 48 owned apartment communities containing 12,108 units in seven states, (ii) one apartment community that we manage for third party owners consisting of 258 units; and (iii) a 186-unit apartment community and a commercial property containing approximately 145,000 square feet that we asset manage.
Principles of Consolidation
The accompanying consolidated financial statements include the accounts of all subsidiaries and qualified REIT subsidiaries, the Service Companies (which are taxed as Taxable REIT Subsidiaries ("TRS") under the REIT Modernization Act ("RMA") implemented in 1999) and an Operating Partnership structured as a DownREIT in which we own an aggregate 97.4% as of December 31, 2009 and 2008. We have evaluated all subsequent events through February 25, 2010, which is the date the financial statements were issued.
Limited partnership interests held by others in the real estate partnership controlled by us are reflected as "Noncontrolling redeemable interest" in the Consolidated Balance Sheets. Capital contributions, distributions and profits and losses are allocated to noncontrolling interests in accordance with the terms of the Operating Partnership agreement. The DownREIT structure enabled us to acquire multifamily real estate assets in an operating partnership entity that is separate from other properties that we own. In the DownREIT structure, the limited partners originally contributed two real estate assets to the operating partnership and, in return, received partnership units entitling them to a share of the profits, based on the number of operating partnership units. One of the properties was sold in October 2005. The operating partnership units entitle the holder to exchange their partnership units at some future time for common shares or to redeem partnership units for cash (at our option). We are the DownREIT general partner. All significant intercompany balances and transactions have been eliminated in consolidation.
We own 100% of the common stock of all REIT subsidiaries included in our consolidated financial statements.
Segment Reporting
All of our properties are multifamily communities that have similar economic characteristics. Management evaluates the performance of our properties on an individual basis. Our multifamily properties provided 98.1% of our consolidated revenue for 2009. Consequently, we have only one reportable segment, which is multifamily properties.
Use of Estimates
The preparation of the consolidated financial statements in accordance with accounting principles generally accepted in the United States of America ("GAAP") requires management to make estimates and assumptions that affect the reported amounts of assets and liabilities, disclosure of contingent assets and liabilities at the date of the consolidated financial statements and reported amounts of revenues and expenses during the reporting periods. Actual results could differ from these estimates.

23
Cash Equivalents
Highly liquid investments with an original maturity of three months or less when purchased are considered to be cash equivalents.
Real Estate and Depreciation
Real estate assets are stated at cost less accumulated depreciation. Depreciation is provided on a straight-line basis over the estimated useful lives of the assets as follows:
� Buildings and improvements 5 - 30 years � Furniture, fixtures and equipment 5 - 10 years
We capitalize replacements and improvements, such as HVAC equipment, structural replacements, windows, appliances, flooring, carpeting and kitchen/bath replacements and renovations. Ordinary repairs and maintenance, such as unit cleaning, painting and appliance repairs are expensed when incurred.
We capitalize interest costs on funds used in construction, real estate taxes and insurance from the commencement of development activity through the time the property is ready for leasing.
We discontinue the depreciation of assets that we have specifically identified as held for sale. There were no properties classified as held for sale at December 31, 2009, and one property was classified as held for sale at December 31, 2008.
Classification of Fixed Asset Additions
We define recurring fixed asset additions to a property to be capital expenditures made to replace worn out assets to maintain the property's value. Revenue enhancing/non-recurring fixed asset additions are defined as capital expenditures that increase the value of the property and/or enable us to increase rents. Acquisition/development fixed asset additions are defined as capital expenditures for the purchase or construction of new properties to be added to our portfolio, or fixed asset additions identified at the time of purchase that are not made until subsequent periods.
Impairment of Long-Lived Assets
We evaluate the recoverability of the carrying value of our real estate assets when a triggering event occurs using the methodology prescribed by GAAP. Factors we consider in evaluating impairment of existing real estate assets held for investment include significant declines in property operating profits, recurring property operating losses and other significant adverse changes in general market conditions that are considered permanent in nature. Under GAAP, a real estate asset held for investment is not considered impaired if the undiscounted, estimated future cash flows of the asset (both the annual estimated cash flow from future operations and the estimated cash flow from the theoretical sale of the asset) over its estimated holding period are in excess of the asset's net book value at the balance sheet date. If any real estate asset held for investment is considered impaired, a loss is recorded to reduce the carrying value of the asset to its fair value. We periodically classify real estate assets as held for sale. See Note 2 for a discussion of our policy regarding classification of a property as held for sale. Upon the classification of a real estate asset as held for sale, the carrying value of the asset is reduced to the lower of its net book value or its fair value, less costs to sell. Subsequent to the classification of assets as held for sale, no further depreciation expense is recorded. No impairment was recorded in connection with our owned real estate assets for the years ended December 31, 2009, 2008 and 2007.
Deferred Financing Costs
Costs incurred in obtaining long-term financing are deferred and amortized over the life of the associated instrument using the effective interest method.

24
Intangible Assets and Goodwill
GAAP requires that intangible assets not subject to amortization and goodwill are tested for impairment annually or more frequently if events or changes in circumstances indicate that the carrying value may not be recoverable. See Note 4 for additional information related to intangible assets and goodwill.
Property Revenue Recognition
Our residential property leases are for terms of generally one year or less. Rental income is recognized on the straight-line basis.
Rent concessions, including free rent, incurred in connection with residential property leases, are capitalized and amortized on a straight-line basis over the terms of the related leases (generally one year) and are charged as a reduction of rental revenue.
Property Management Revenue Recognition
Acquisition, management and disposition fees and other fees are recognized when the related services are performed and the earnings process is complete.
We are reimbursed for expenses incurred in connection with the management of properties for third parties. We are the primary obligor for these expenses, which are primarily salaries and benefits relating to employees at these properties, and therefore we record these reimbursements as management and service company revenue (included in "Fees, reimbursements and other") and as expenses (included in "Direct property management and service company expense"). For the years ended December 31, 2009, 2008 and 2007, the reimbursements shown as revenue were equivalent to the expenses, which were $663,000, $1.1 million and $8.3 million, respectively.
Advertising Costs
We recognize advertising costs as expense when incurred. The total amount charged to advertising expense for the years ended December 31, 2009, 2008 and 2007, were $1.6 million, $1.7 million and $1.8 million, respectively. There were no advertising costs reported as assets for the years ended December 31, 2009 and 2008.
Share-Based Compensation
We account for share based compensation using the fair value method to recognized compensation cost. See Note 15 for information about share-based compensation and our equity based award plans.
Noncontrolling Redeemable Interest
In 1998, in conjunction with the acquisition of an operating partnership that owned two apartment communities, one of which was sold in October 2005, we issued a total of 522,032 operating partnership units ("OP units"). Holders of OP units are entitled to receive cumulative distributions per OP unit equal to the per share distributions on our common shares. If and when the OP units are presented for redemption, we have the option to redeem, in certain circumstances, the OP units for common shares exchangeable on a one-for-one basis, or the cash equivalent amount. As of December 31, 2009, all units presented for redemption were redeemed for cash. The difference between the cash paid and the recorded value of the units reduced the recorded amount of the underlying real estate. There were 78,335 OP units remaining as of December 31, 2009.
The following table identifies the effect of OP unit redemptions (in thousands, except units redeemed):
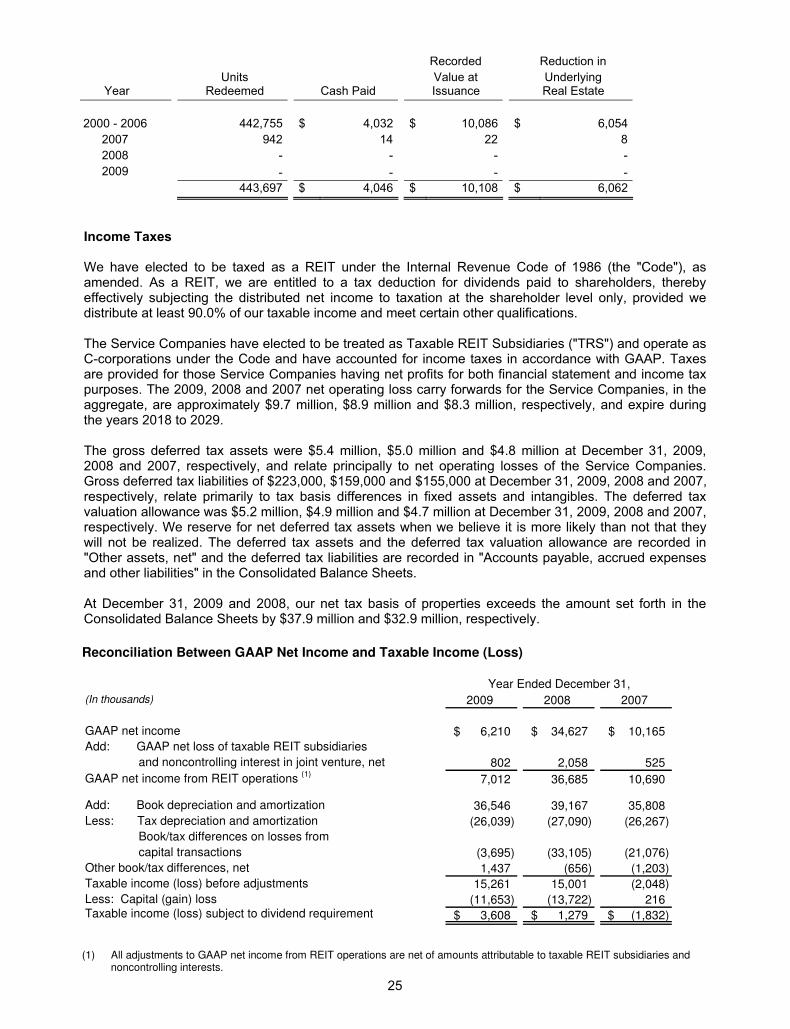
25
Income Taxes We have elected to be taxed as a REIT under the Internal Revenue Code of 1986 (the "Code"), as amended. As a REIT, we are entitled to a tax deduction for dividends paid to shareholders, thereby effectively subjecting the distributed net income to taxation at the shareholder level only, provided we distribute at least 90.0% of our taxable income and meet certain other qualifications. The Service Companies have elected to be treated as Taxable REIT Subsidiaries ("TRS") and operate as C-corporations under the Code and have accounted for income taxes in accordance with GAAP. Taxes are provided for those Service Companies having net profits for both financial statement and income tax purposes. The 2009, 2008 and 2007 net operating loss carry forwards for the Service Companies, in the aggregate, are approximately $9.7 million, $8.9 million and $8.3 million, respectively, and expire during the years 2018 to 2029. The gross deferred tax assets were $5.4 million, $5.0 million and $4.8 million at December 31, 2009, 2008 and 2007, respectively, and relate principally to net operating losses of the Service Companies. Gross deferred tax liabilities of $223,000, $159,000 and $155,000 at December 31, 2009, 2008 and 2007, respectively, relate primarily to tax basis differences in fixed assets and intangibles. The deferred tax valuation allowance was $5.2 million, $4.9 million and $4.7 million at December 31, 2009, 2008 and 2007, respectively. We reserve for net deferred tax assets when we believe it is more likely than not that they will not be realized. The deferred tax assets and the deferred tax valuation allowance are recorded in "Other assets, net" and the deferred tax liabilities are recorded in "Accounts payable, accrued expenses and other liabilities" in the Consolidated Balance Sheets. At December 31, 2009 and 2008, our net tax basis of properties exceeds the amount set forth in the Consolidated Balance Sheets by $37.9 million and $32.9 million, respectively.
Recorded Reduction in Units Value at Underlying
Year Redeemed Cash Paid Issuance Real Estate
2000 - 2006 442,755 $ 4,032 $ 10,086 $ 6,054 2007 942 14 22 8 2008 - - - - 2009 - - - -
443,697 $ 4,046 $ 10,108 $ 6,062
Reconciliation Between GAAP Net Income and Taxable Income (Loss)
Year Ended December 31,(In thousands) 2009 2008 2007
GAAP net income 6,210$ 34,627$ 10,165$ Add: GAAP net loss of taxable REIT subsidiaries
and noncontrolling interest in joint venture, net 802 2,058 525 GAAP net income from REIT operations (1) 7,012 36,685 10,690
Add: Book depreciation and amortization 36,546 39,167 35,808 Less: Tax depreciation and amortization (26,039) (27,090) (26,267)
Book/tax differences on losses from capital transactions (3,695) (33,105) (21,076)
Other book/tax differences, net 1,437 (656) (1,203) Taxable income (loss) before adjustments 15,261 15,001 (2,048) Less: Capital (gain) loss (11,653) (13,722) 216 Taxable income (loss) subject to dividend requirement 3,608$ 1,279$ (1,832)$
(1) All adjustments to GAAP net income from REIT operations are net of amounts attributable to taxable REIT subsidiaries and
noncontrolling interests.

26
Dividends Per Share Total dividends per common share and the related components for the years ended December 31, 2009, 2008 and 2007, as reported for income tax purposes, were as follows:
Preferred dividends of $4.2 million, $4.7 million and $4.9 million were paid for the years ended December 31, 2009, 2008 and 2007, respectively, of which $3.0 million, $4.0 million, and zero were designated as a capital gain dividend, respectively.
Reconciliation Between Cash Dividends Paid and Dividends Paid Deduction Year Ended December 31, (In thousands) 2009 2008 2007 Cash dividends paid $ 15,476 $ 15,760 $ 16,501 Less: Dividends designated to prior year - - - Less: Portion designated as capital gain distribution (11,654) (13,721) - Less: Return of capital (214) (760) (16,501)Dividends paid deduction $ 3,608 $ 1,279 $ -
Year Ended December 31, 2009
Non-Taxable 20% Rate Unrecaptured Ordinary Return of Capital Section 1250
Date Paid Income Capital Gain Gain Dividends 2/2/2009 $ 0.047816 $ - $ 0.122184 $ 0.087891 $ 0.170000 5/1/2009 0.047816 - 0.122184 0.087891 0.170000 8/3/2009 0.047816 - 0.122184 0.087891 0.170000 11/2/2009 0.047816 - 0.122184 0.087891 0.170000
$ 0.191264 $ - $ 0.488736 $ 0.351564 $ 0.680000
Year Ended December 31, 2008
Non-Taxable 20% Rate Unrecaptured Ordinary Return of Capital Section 1250
Date Paid Income Capital Gain Gain Dividends 2/1/2008 $ 0.021811 $ 0.023652 $ 0.124537 $ 0.123605 $ 0.170000 5/1/2008 0.021811 0.023652 0.124537 0.123605 0.170000 8/1/2008 0.021811 0.023652 0.124537 0.123605 0.170000 11/3/2008 0.021811 0.023652 0.124537 0.123605 0.170000
$ 0.087244 $ 0.094608 $ 0.498148 $ 0.494420 $ 0.680000
Year Ended December 31, 2007
Non-Taxable 20% Rate Unrecaptured Ordinary Return of Capital Section 1250
Date Paid Income Capital Gain Gain Dividends 2/2/2007 $ - $ 0.170000 $ - $ - $ 0.170000 5/1/2007 - 0.170000 - - 0.170000 8/1/2007 - 0.170000 - - 0.170000 11/1/2007 - 0.170000 - - 0.170000
$ - $ 0.680000 $ - $ - $ 0.680000
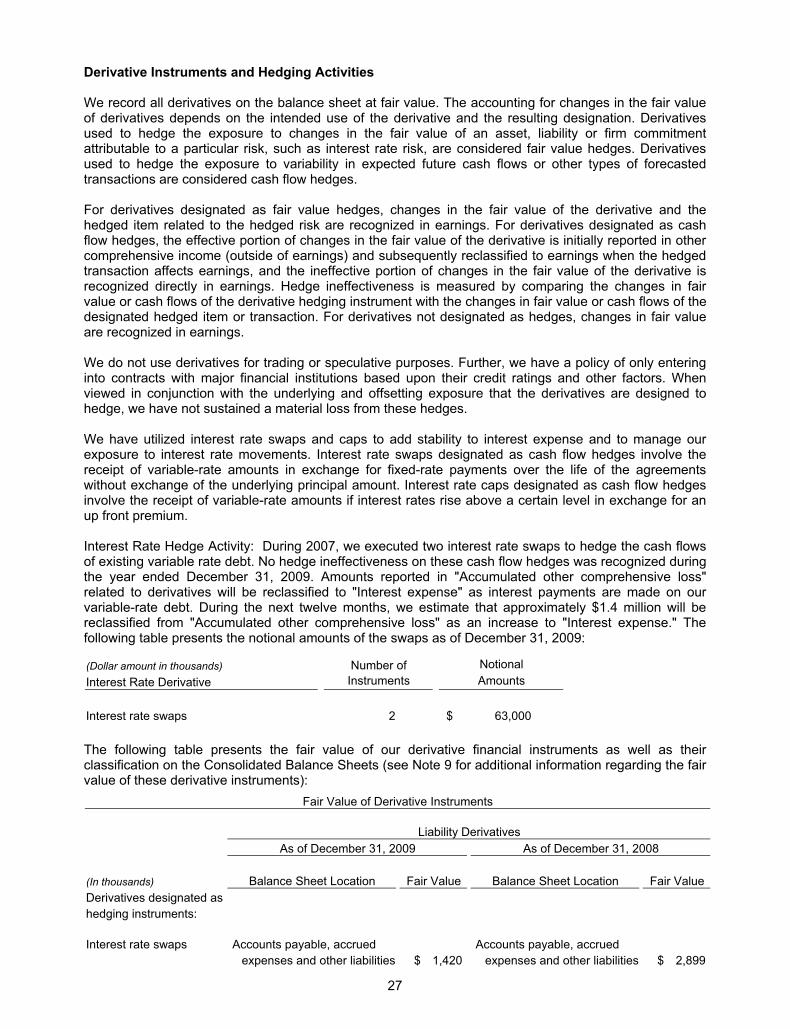
27
Derivative Instruments and Hedging Activities We record all derivatives on the balance sheet at fair value. The accounting for changes in the fair value of derivatives depends on the intended use of the derivative and the resulting designation. Derivatives used to hedge the exposure to changes in the fair value of an asset, liability or firm commitment attributable to a particular risk, such as interest rate risk, are considered fair value hedges. Derivatives used to hedge the exposure to variability in expected future cash flows or other types of forecasted transactions are considered cash flow hedges. For derivatives designated as fair value hedges, changes in the fair value of the derivative and the hedged item related to the hedged risk are recognized in earnings. For derivatives designated as cash flow hedges, the effective portion of changes in the fair value of the derivative is initially reported in other comprehensive income (outside of earnings) and subsequently reclassified to earnings when the hedged transaction affects earnings, and the ineffective portion of changes in the fair value of the derivative is recognized directly in earnings. Hedge ineffectiveness is measured by comparing the changes in fair value or cash flows of the derivative hedging instrument with the changes in fair value or cash flows of the designated hedged item or transaction. For derivatives not designated as hedges, changes in fair value are recognized in earnings. We do not use derivatives for trading or speculative purposes. Further, we have a policy of only entering into contracts with major financial institutions based upon their credit ratings and other factors. When viewed in conjunction with the underlying and offsetting exposure that the derivatives are designed to hedge, we have not sustained a material loss from these hedges. We have utilized interest rate swaps and caps to add stability to interest expense and to manage our exposure to interest rate movements. Interest rate swaps designated as cash flow hedges involve the receipt of variable-rate amounts in exchange for fixed-rate payments over the life of the agreements without exchange of the underlying principal amount. Interest rate caps designated as cash flow hedges involve the receipt of variable-rate amounts if interest rates rise above a certain level in exchange for an up front premium. Interest Rate Hedge Activity: During 2007, we executed two interest rate swaps to hedge the cash flows of existing variable rate debt. No hedge ineffectiveness on these cash flow hedges was recognized during the year ended December 31, 2009. Amounts reported in "Accumulated other comprehensive loss" related to derivatives will be reclassified to "Interest expense" as interest payments are made on our variable-rate debt. During the next twelve months, we estimate that approximately $1.4 million will be reclassified from "Accumulated other comprehensive loss" as an increase to "Interest expense." The following table presents the notional amounts of the swaps as of December 31, 2009:
The following table presents the fair value of our derivative financial instruments as well as their classification on the Consolidated Balance Sheets (see Note 9 for additional information regarding the fair value of these derivative instruments):
(Dollar amount in thousands) Number of Notional Interest Rate Derivative Instruments Amounts Interest rate swaps 2 $ 63,000
Fair Value of Derivative Instruments Liability Derivatives As of December 31, 2009 As of December 31, 2008 (In thousands) Balance Sheet Location Fair Value Balance Sheet Location Fair ValueDerivatives designated as hedging instruments: Interest rate swaps Accounts payable, accrued Accounts payable, accrued expenses and other liabilities $ 1,420 expenses and other liabilities $ 2,899
28
The following table presents the effect of our derivative financial instruments on the Consolidated Statements of Operations (see Note 17 for additional information regarding the effect of these derivative instruments on total comprehensive income):
We have agreements with each of our derivative counterparties that contain a provision where if we either default or are capable of being declared in default on any of our indebtedness, then such counterparty can declare us to be in default on our derivative obligations. We have an agreement with a derivative counterparty that incorporates the loan covenant provisions of our indebtedness with a lender affiliate of the derivative counterparty. Failure to comply with the loan covenant provisions would result in our being in default on any derivative instrument obligations covered by the agreement. As of December 31, 2009, the fair value of derivatives in a net liability position, which includes accrued interest but excludes any adjustment for nonperformance risk, related to these agreements was $1.7 million. As of December 31, 2009, we have not posted any collateral related to these agreements. If we had breached any of these provisions at December 31, 2009, we would have been required to settle our obligations under the agreements at their termination value of $1.7 million. Treasury Shares We record the purchase of Treasury shares at cost. From time to time, we may reissue these shares. When shares are reissued, we account for the issuance based on the "First in, first out" method. For additional information regarding treasury shares, see Note 12. Reclassifications Certain reclassifications have been made to the 2008 and 2007 consolidated financial statements to conform to the 2009 presentation. 2. ACQUISITION, DEVELOPMENT, CONSTRUCTION AND DISPOSITION ACTIVITY Acquisition Activity On April 21, 2008, we acquired two apartment communities located in the Richmond, Virginia metropolitan area totaling 536 units for a purchase price of $75.0 million and additional closing costs of $541,000. The acquisition also included a 5.92 acre future development land parcel, adjacent to one of the properties. This purchase was funded with the assumption of mortgage loans on the acquired properties, Section 1031 exchange cash proceeds received from the disposition of a property that we sold on March 19, 2008, and borrowings on our revolving credit facility.
The Effect of Derivative Instruments on the Consolidated Statements of Operations Amount of Gain or Amount of Gain or (Loss) Reclassified (Loss) Recognized from Accumulated in OCI on Derivative Location of Gain OCI into Income (In thousands) (Effective Portion) or (Loss) (Effective Portion) Twelve Months Reclassified from Twelve Months Derivatives in Cash Ended Accumulated OCI Ended Flow Hedging December 31, into Income December 31, Relationships 2009 (Effective Portion) 2009 Interest rate swaps $ (772) Interest expense $ 2,251

29
The following pro forma financial information is presented as if these acquisitions had occurred at the beginning of each period presented. This information is presented for informational purposes only and is not necessarily indicative of what our actual results of operations would have been had the acquisitions occurred at such times:
The purchase price allocation for the two properties and land parcel acquired on April 21, 2008 was as follows:
On June 29, 2007, we acquired our joint venture partner’s 51.0% interest in Idlewylde Apartments, an 843-unit property located in Atlanta, Georgia. We previously owned a 49.0% interest in this partnership and had accounted for this investment under the equity method of accounting. We paid our partner $21.6 million in cash. Commencing June 29, 2007, the results of operations, financial condition (including the existing $42.0 million nonrecourse mortgage loan), and cash flows of this property are included in our consolidated financial statements. On June 8, 2007, we acquired a 268-unit property located in Norfolk, Virginia for a purchase price of $48.3 million. The purchase was funded primarily by 1031 proceeds from the disposition of a property which we sold on May 30, 2007, and with borrowings from our unsecured revolving credit facility. Development Activity During 2009, we commenced construction of a 60-unit expansion of the existing 240-unit River Forest apartment community located in the Richmond, Virginia metropolitan market area. Construction in progress related to this development was $4.1 million at December 31, 2009, and includes capitalized real estate taxes, insurance and interest costs on funds used in construction. Capitalized interest was $119,000 for the year ended December 31, 2009. Construction Activity Our subsidiary, Merit Enterprises, Inc., is engaged as a general contractor and construction manager that will also act as our in-house construction division as well as provide general contracting and construction management services to third parties. Merit intends to concentrate its efforts on rehabilitation and ground-up construction projects. We account for construction contracts using the percentage-of-completion method. Under this method, we recognize revenue in the ratio of costs incurred to total estimated costs, with any changes in estimates recognized in the period in which they are known on a prospective basis. We recognized $393,000 in revenue under this method during the twelve months ended December 31, 2009. The total costs incurred and revenue recognized on uncompleted contracts in excess of related
Year Ended December 31,
(Unaudited; in thousands, except per share data) 2008 2007 Pro forma revenue $ 137,067 $ 137,621
Pro forma net income applicable to common shares 31,215 1,165 Earnings per common share - basic and diluted:
Pro forma net income applicable to common shares $ 1.92 $ 0.07
(In thousands) 2008 Land $ 10,698 Buildings and improvements 55,002 Furniture and fixtures 6,458 Existing leases and tenant relationships (Other assets)(1) 3,383
Total $ 75,541 (1) See Note 4 for additional information related to intangible assets identified as existing leases and tenant
relationships.

30
billings are included in "Other assets, net," and the total billings on uncompleted contracts in excess of revenue recognized is included in "Accounts payable, accrued expenses and other liabilities." Total costs and total billings for the twelve months ended December 31, 2009 were $107,000 and $333,000, respectively. Disposition Activity We report the results of operations and gain/loss related to the sale of real estate assets as discontinued operations. Real estate assets that are classified as held for sale are reported as discontinued operations for the current and all prior periods. We classify properties as held for sale when all significant contingencies surrounding the closing have been resolved. In most transactions, these contingencies are not satisfied until the actual closing of the transaction. Properties held for sale are measured at the lower of the carrying amount or the fair value less the cost to sell. Subsequent to classification of a property as held for sale, no further depreciation is recorded. Interest expense included in discontinued operations is limited to interest and any defeasance/prepayment costs on mortgage debt specifically associated with properties sold or classified as held for sale. During 2009, we completed the sale of two properties for a total sales price of $33.9 million. One of these properties was located in Ohio and the other in Pennsylvania. We recognized total gains of $15.4 million related to these sales, which are included in "Income from discontinued operations." During 2008, we completed the sale of four properties and our entire wholly owned Affordable Housing portfolio of 11 properties, for a total sales price of $91.8 million. These 15 properties represented a total of 2,206 units and were all located in Ohio. We recognized total gains of $45.2 million related to these sales, which are included in "Income from discontinued operations." During 2007, we completed the sale of three properties containing a total of 1,173 units for a total sales price of $49.0 million. Two of these properties were located in Ohio and one was located in Texas. We recognized total gains of $20.9 million related to these sales, which are included in "Income from discontinued operations." The following chart summarizes "Income from discontinued operations" for the years ended December 31, 2009, 2008 and 2007, respectively:
3. RESTRICTED CASH Restricted cash, some of which is required by our lenders, includes residents' security deposits, reserve funds for replacements and other escrows held for the future payment of real estate taxes and insurance. The reserve funds for replacements are intended to provide cash to defray future costs that may be incurred to maintain the associated property.
(In thousands) 2009 2008 2007 Property revenue(1) $ 2,021 $ 9,147 $ 28,353 Property operating and maintenance expense (948) (4,427) (14,919)Depreciation and amortization (475) (1,954) (4,876)Interest income 1 6 31
Interest expense(2) (31) (3,205) (3,026) Operating income (loss) 568 (433) 5,563 Gain on disposition of properties 15,400 45,202 20,864 Income from discontinued operations $ 15,968 $ 44,769 $ 26,427
(1) Includes non-recurring rental revenue of $1.6 million received in 2007 as a result of a settlement of a lawsuit with HUD relating to past due rents at some of the Affordable Housing properties that we previously owned.
(2) Includes $2.0 million of defeasance/prepayment costs associated with the prepayment of mortgage loans in 2008.
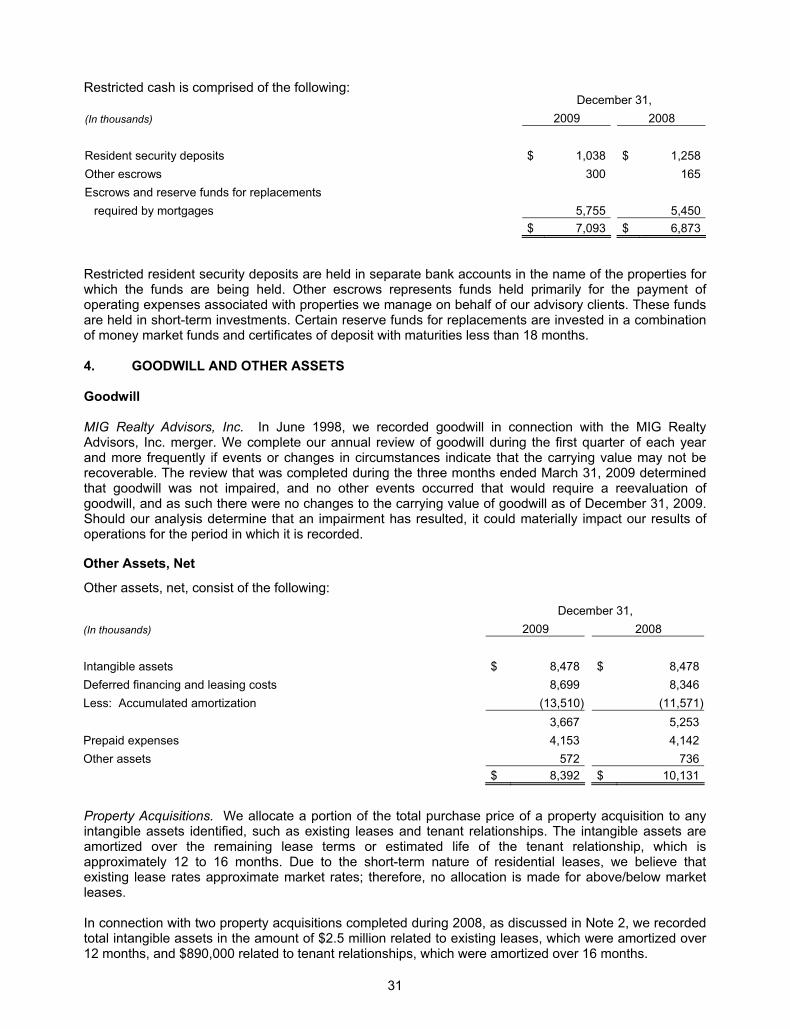
31
Restricted cash is comprised of the following:
Restricted resident security deposits are held in separate bank accounts in the name of the properties for which the funds are being held. Other escrows represents funds held primarily for the payment of operating expenses associated with properties we manage on behalf of our advisory clients. These funds are held in short-term investments. Certain reserve funds for replacements are invested in a combination of money market funds and certificates of deposit with maturities less than 18 months. 4. GOODWILL AND OTHER ASSETS Goodwill MIG Realty Advisors, Inc. In June 1998, we recorded goodwill in connection with the MIG Realty Advisors, Inc. merger. We complete our annual review of goodwill during the first quarter of each year and more frequently if events or changes in circumstances indicate that the carrying value may not be recoverable. The review that was completed during the three months ended March 31, 2009 determined that goodwill was not impaired, and no other events occurred that would require a reevaluation of goodwill, and as such there were no changes to the carrying value of goodwill as of December 31, 2009. Should our analysis determine that an impairment has resulted, it could materially impact our results of operations for the period in which it is recorded.
Property Acquisitions. We allocate a portion of the total purchase price of a property acquisition to any intangible assets identified, such as existing leases and tenant relationships. The intangible assets are amortized over the remaining lease terms or estimated life of the tenant relationship, which is approximately 12 to 16 months. Due to the short-term nature of residential leases, we believe that existing lease rates approximate market rates; therefore, no allocation is made for above/below market leases. In connection with two property acquisitions completed during 2008, as discussed in Note 2, we recorded total intangible assets in the amount of $2.5 million related to existing leases, which were amortized over 12 months, and $890,000 related to tenant relationships, which were amortized over 16 months.
December 31, (In thousands) 2009 2008 Resident security deposits $ 1,038 $ 1,258 Other escrows 300 165 Escrows and reserve funds for replacements
required by mortgages 5,755 5,450 $ 7,093 $ 6,873
Other Assets, Net
Other assets, net, consist of the following: December 31, (In thousands) 2009 2008 Intangible assets $ 8,478 $ 8,478 Deferred financing and leasing costs 8,699 8,346 Less: Accumulated amortization (13,510) (11,571) 3,667 5,253 Prepaid expenses 4,153 4,142 Other assets 572 736 $ 8,392 $ 10,131

32
Information related to intangible assets at December 31, 2009 is as follows:
The aggregate intangible asset amortization expense for the years ended December 31, 2009, 2008 and 2007 was $1.2 million, $3.9 million and $1.5 million, respectively. Deferred Financing and Leasing Costs Amortization expense for deferred financing and leasing costs, including amortization classified in income from discontinued operations, was $1.2 million, $1.3 million and $1.1 million for the years ended December 31, 2009, 2008 and 2007, respectively. 5. DEBT The following table identifies our total debt outstanding and weighted average interest rates as of December 31, 2009 and 2008:
Real estate assets pledged as collateral for all debt had a net book value of $475.6 million and $511.5 million at December 31, 2009 and 2008, respectively. As of December 31, 2009, the scheduled debt maturities for each of the next five years, and thereafter, are as follows (in thousands):
In Place Tenant (In thousands) Leases Relationships Gross carrying amount $ 6,571 $ 1,907 Less: Accumulated amortization (6,571) (1,907)Balance as of December 31, 2009 $ - $ -
December 31, 2009 December 31, 2008
Balance Weighted Average Balance
Weighted Average
(Dollar amounts in thousands) Outstanding Interest Rate Outstanding Interest Rate FIXED RATE DEBT Mortgages payable - CMBS $ 115,464 7.7% $ 154,685 7.7% Mortgages payable - other (1) 337,241 5.8% 320,516 5.8% Unsecured borrowings 25,780 7.9% 25,780 7.9%
Total fixed rate debt 478,485 6.4% 500,981 6.5%
VARIABLE RATE DEBT Mortgages payable 34,851 4.7% 35,000 1.6% Unsecured revolving credit facility 12,500 2.6% 21,500 3.7%
Total variable rate debt 47,351 4.1% 56,500 2.4% Total debt $ 525,836 6.2% $ 557,481 6.1%
(1) Includes $63.0 million of variable rate debt swapped to fixed.
2010 $ 78,310 2011 67,070 2012 81,584 2013 132,209 2014 44,538 Thereafter 122,125 $ 525,836

33
Cash paid for interest was $33.8 million, $37.8 million and $41.0 million for the years ended December 31, 2009, 2008 and 2007, respectively. Included in cash paid for interest are $2.0 million and $3.8 million of defeasance and other prepayment costs that were paid during the years ended December 31, 2008 and 2007, respectively. During 2008, 2007 and 2006, we defeased 21 CMBS loans. These loans were defeased pursuant to the terms of the underlying loan documents. In accordance with GAAP, we removed those financial assets and the mortgage loans from our financial records. All risk of loss associated with these defeasances have been transferred from us to the successor borrower and any ongoing relationship between the successor borrower and us was deemed inconsequential at the time of completion of the respective transfers. However, we subsequently learned that for certain defeasance transactions completed prior to June 2007, the successor borrower may be able to prepay the loans thus enabling us to receive a refund of a portion of the costs incurred in connection with the transaction. During 2009, we received refunds of $563,000, which were included as a reduction to interest expense. It is possible that we may receive additional refunds in the future, however such amounts cannot be estimated due to the uncertainty of future payments, and we believe that any amounts we may receive would not be material to our consolidated financial position, cash flow or results of operations. The following table provides information on loans repaid at par as well as loans obtained during 2009:
In 2008, we repaid or prepaid/defeased eight mortgage loans totaling $42.9 million, obtained two mortgage loans totaling $45.0 million and paid $2.0 million in defeasance/prepayment costs that are recognized in interest expense. These costs were included in "Income from discontinued operations." In 2007, we recognized in interest expense defeasance/prepayment costs totaling $4.2 million of which $3.8 million was paid during 2007 and $400,000 was deferred financing costs that were charged to expense. All of these costs were included in "Income from continuing operations." Mortgage Notes Payable At December 31, 2009, mortgage notes payable consisted of:
� 24 project-specific loans that are each collateralized by the respective real estate and resident leases;
� Five cross-collateralized, cross-defaulted loans that are secured by the real estate and resident leases at five properties and include a collateral substitution feature; and
� Two fixed-rate mortgages that are insured by the Federal Housing Administration ("FHA"). At December 31, 2008, mortgage notes payable consisted of:
� 25 project-specific loans that are each collateralized by the respective real estate and resident leases;
� Five cross-collateralized, cross-defaulted loans that are secured by the real estate and resident leases at five properties and include a collateral substitution feature; and
� Two fixed-rate mortgages that are insured by the FHA.
(Dollar amounts in thousands) Loans Repaid Loans Obtained Property Amount Rate Amount Rate Maturity
Saw Mill Village $ 11,119 7.5% $ 17,220 6.0% April 2016 Georgetown Park 16,000 1.6% (1) - N/A N/A Chestnut Ridge 19,000 1.4% (1) - N/A N/A Oaks at Hampton 25,977 7.5% - N/A N/A Steeplechase - N/A 13,790 4.7% (1) March 2016 Courtney Chase - N/A 21,440 4.7% (1) March 2016 $ 72,096 4.6% (2) $ 52,450 5.1% (2)
(1) Denotes variable rate loans. Variable rates on loans obtained are as of December 31, 2009. (2) Represents weighted average interest rate for the loans listed.
34
Mortgages payable generally require monthly installments of principal and/or interest and mature at various dates through April 2016, except for the FHA loans which mature in 2046. Under certain of the mortgage agreements, we are required to make escrow deposits for taxes, insurance and replacement of project assets. The two FHA insured loans were assumed in connection with the April 2008 acquisition of two properties. Both of these loans require monthly installments of principal and interest and mature in 2046. Under agreements with the FHA, we are required to make monthly escrow deposits for taxes, insurance and replacement of project assets. See Note 2 for additional information regarding these acquisitions.
In December 2009, we entered into a credit facility agreement with Wells Fargo Multifamily Capital, on behalf of the Federal Home Loan Mortgage Corporation, or Freddie Mac. Pursuant to the terms of the facility, we have the potential to borrow up to $100 million over a two-year period with obligations being secured by project specific, nonrecourse, non cross-collateralized fixed or variable rate mortgages having terms of five, seven or ten years.
Unsecured Revolving Credit Facility
Our unsecured revolving credit facility has a borrowing capacity of $150.0 million and matures March 20, 2011. From time to time, we have the option to choose either a LIBOR-based or Prime-based variable interest rate on this facility. As of December 31, 2009, the LIBOR-based rate is LIBOR plus 1.6% and the Prime-based rate is the prime rate plus 0.6%. There were outstanding borrowings of $12.5 million and $21.5 million on this facility at December 31, 2009 and 2008, respectively, with a weighted average interest rate of 2.6% and 3.7%, respectively.
Unsecured Debt
On March 15, 2005, AERC Delaware Trust (the "Trust"), a wholly owned subsidiary, sold trust preferred securities for an aggregate amount of $25.8 million. Associated Estates Realty Corporation ("AERC") owns all of the common securities of the Trust. The Trust used the proceeds to purchase AERC's junior subordinated note due March 30, 2035, which represents all of the Trust's assets. The terms of the trust preferred securities are substantially the same as the terms of the junior subordinated note. Interest on the junior subordinated note is payable at a fixed rate equal to 7.9% per annum through the interest rate payment date in March 2015 and thereafter at a variable rate equal to LIBOR plus 3.25% per annum. AERC may redeem the junior subordinated note at par at any time on or after March 30, 2010. To the extent that AERC redeems the junior subordinated note, the Trust is required to redeem a corresponding amount of trust preferred securities.
6. INVESTMENTS IN AND ADVANCES TO JOINT VENTURES
On December 31, 2008, the joint venture in which we were a 50.0% partner sold the Affordable Housing property that it owned. We accounted for our investment in this unconsolidated joint venture under the equity method of accounting as we exercised significant influence, but did not control this entity and were not required to consolidate it in accordance with GAAP. This investment was initially recorded at cost as investment in joint ventures and subsequently adjusted for equity in earnings, cash contributions and distributions, and the gain recognized upon the sale of the property. The debt associated with this property was assumed by the buyer.
On June 29, 2007, we acquired our joint venture partner’s 51.0% interest in Idlewylde Apartments, an 843-unit property located in Atlanta, Georgia. We previously owned a 49.0% interest in this partnership and had accounted for this investment under the equity method of accounting. See Note 2 for additional information regarding this acquisition.
The following tables represent summarized financial information at 100% for the joint ventures in which we have been an investor during the years presented.

35
Revenue from property and asset management fees charged to joint ventures aggregated zero, $46,000 and $270,000 for the years ended December 31, 2009, 2008 and 2007, respectively. The corresponding expenses are included in the operating and maintenance expenses of the joint ventures, as set forth above. 7. TRANSACTIONS WITH AFFILIATES AND JOINT VENTURES We previously provided management and other services to (and were reimbursed for certain expenses incurred on behalf of) certain non-owned properties in which our Chief Executive Officer ("CEO") and/or other related parties had varying ownership interests. The entities which owned these properties, as well as other related parties, are referred to as "affiliates." We also provided similar services to joint venture properties. Management fees received from affiliates and joint ventures during the years ended December 31, 2009, 2008 and 2007, were $38,000, $109,000 and $365,000, respectively. Merit Enterprises, Inc. ("Merit"), a subsidiary of ours, has provided services to JAS Construction, Inc. ("JAS") related to property rehabilitation and other work from time to time. JAS is owned by Jason A. Friedman, a son of our CEO. In September 2009, Mr. Friedman joined our company as Vice President, Construction and Development and President of Merit. Reported revenue related to work performed by Merit for JAS was $368,000, $209,000 and $1.4 million for the years ended December 31, 2009, 2008 and 2007, respectively. Accounts receivable owing from JAS to Merit at December 31, 2009 and 2008, respectively were $51,000 and $157,000. The $51,000 owing at December 31, 2009 was subsequently paid in February 2010. In April 2008, we executed a $2.0 million contract with JAS that was approved by our Board of Directors, under which JAS provided general contractor services for the interior rehabilitation of one of our properties. This project was completed and paid for during 2008. Merit also provided services in 2008 to certain non-owned properties in which our CEO and/or other related parties have varying ownership interests. Reported revenue related to the services performed in 2008 was $185,000. 8. COMMITMENTS AND CONTINGENCIES Leases We had no equipment leased under capital leases at December 31, 2009 and 2008. We lease certain equipment and facilities under operating leases. Future minimum lease payments under all noncancellable operating leases in which we are the lessee are immaterial.
Year ended December 31, (In thousands) 2008 2007 Operating data Property revenue $ - $ 4,029 Operating and maintenance expenses - (1,761)Depreciation and amortization - (1,068)Interest expense - (1,485)(Loss) income from continuing operations - (285)Income (loss) from discontinued operations:
Operating (loss) income (207) (222)Gain on disposition of properties 3,206 -
Income (loss) from discontinued operations 2,999 (222)Net income (loss) $ 2,999 $ (507) Equity in net income (loss) of joint ventures $ 1,502 $ (258)

36
Legal Proceedings
We are subject to legal proceedings, lawsuits and other claims, including proceedings by government authorities (collectively "Litigation"). Litigation is subject to uncertainties, and outcomes are difficult to predict. Consequently, we are unable to estimate ultimate aggregate monetary liability or financial impact with respect to the Litigation matter described in the following paragraph as of December 31, 2009, and no accrual has been made for this matter. We believe that other Litigation will not have a material adverse impact on us after final disposition. However, because of the uncertainties of Litigation, one or more lawsuits could ultimately result in a material obligation.
Pending Lawsuits
On or about April 14, 2002, Melanie and Kyle Kopp commenced an action against us in the Franklin County, Ohio Court of Common Pleas seeking undetermined damages, injunctive relief and class action certification. This case arose out of our Suredeposit program. This program allowed cash short prospective residents to purchase a bond in lieu of paying a security deposit. The bond serves as a fund to pay those resident obligations that would otherwise have been funded by the security deposit. Plaintiffs allege that the nonrefundable premium paid for the bond is a disguised form of security deposit, which is otherwise required to be refundable in accordance with Ohio's Landlord-Tenant Act. Plaintiffs further allege that certain pet deposits and other nonrefundable deposits required by us are similarly security deposits that must be refundable in accordance with Ohio's Landlord-Tenant Act. On or about January 15, 2004, the Plaintiffs filed a motion for class certification. We subsequently filed a motion for summary judgment. On or about September 3, 2008, the court granted our motion for summary judgment thereby dismissing all Plaintiff claims against us. However, Plaintiff subsequently appealed the court’s ruling to the Ohio Court of Appeals for the 10th District, which dismissed the appeal on technical grounds. The technical issues have now been resolved, Plaintiff has refiled its appeal, and we are now awaiting the Court of Appeals decision.
Guarantees
In November 2009, Merit posted a performance and payment bond in the amount of $2.7 million to guaranty its performance under a construction contract. Merit has certain indemnification obligations owing to the bonding company that issued the bond and those obligations have been guaranteed by the Company. The Company, from time to time, may also guaranty other Merit obligations.
We routinely guaranty mortgage debt of our wholly owned subsidiaries and some subsidiaries that own unencumbered property guaranty the Company's obligations under the unsecured revolver. In the normal course of business, we may enter into contractual arrangements under which we may agree to indemnify the third party to such arrangements from any losses incurred relating to the services they perform on behalf of AERC or for losses arising from certain events as defined within the particular contract, which may include, for example, litigation or claims relating to past performance. Such indemnification obligations may not be subject to maximum loss clauses. Historically, payments made related to these indemnifications have not been material.
9. FAIR VALUE
Fair value determined in accordance with GAAP should be based on the assumptions that market participants would use when pricing certain assets or liabilities. Inputs used in determining fair value should be from the highest level available in the following hierarchy:
• Level 1 inputs utilize quoted prices (unadjusted) in active markets for identical assets or liabilities that we have the ability to access;
• Level 2 inputs may include quoted prices for similar assets and liabilities in active markets, as well as interest rates and yield curves that are observable at commonly quoted intervals; and
• Level 3 inputs are unobservable inputs for the asset or liability that are typically based on an entity’s own assumptions as there is little, if any, related market activity.
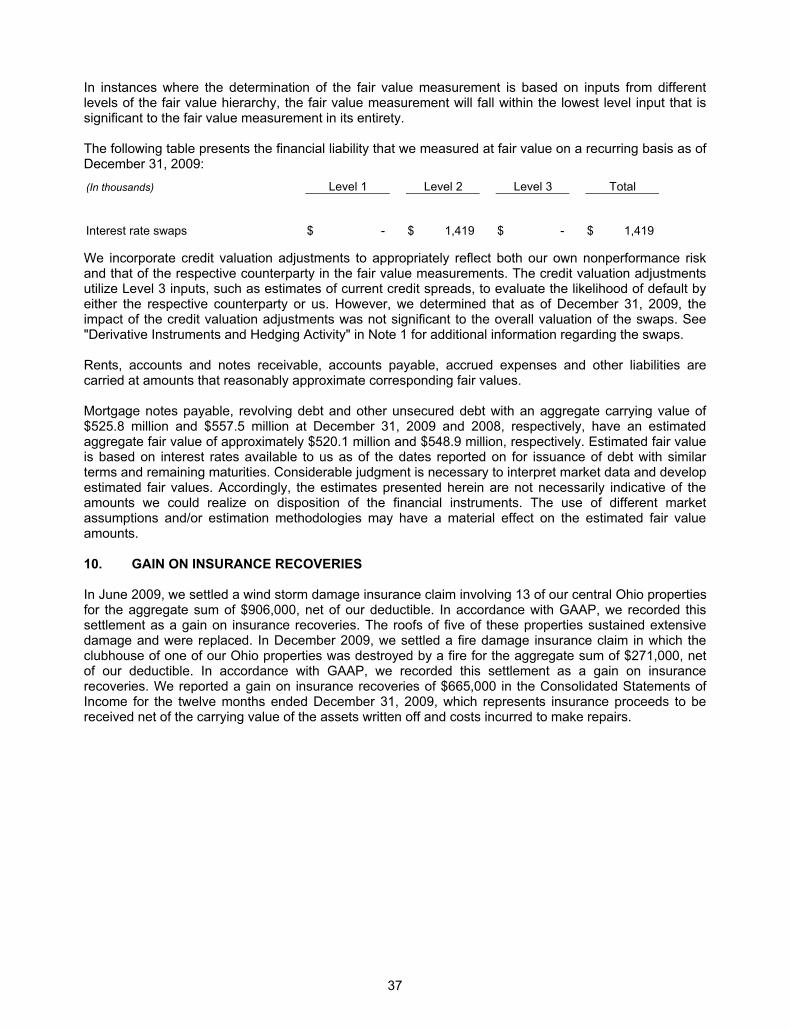
37
In instances where the determination of the fair value measurement is based on inputs from different levels of the fair value hierarchy, the fair value measurement will fall within the lowest level input that is significant to the fair value measurement in its entirety. The following table presents the financial liability that we measured at fair value on a recurring basis as of December 31, 2009:
We incorporate credit valuation adjustments to appropriately reflect both our own nonperformance risk and that of the respective counterparty in the fair value measurements. The credit valuation adjustments utilize Level 3 inputs, such as estimates of current credit spreads, to evaluate the likelihood of default by either the respective counterparty or us. However, we determined that as of December 31, 2009, the impact of the credit valuation adjustments was not significant to the overall valuation of the swaps. See "Derivative Instruments and Hedging Activity" in Note 1 for additional information regarding the swaps. Rents, accounts and notes receivable, accounts payable, accrued expenses and other liabilities are carried at amounts that reasonably approximate corresponding fair values. Mortgage notes payable, revolving debt and other unsecured debt with an aggregate carrying value of $525.8 million and $557.5 million at December 31, 2009 and 2008, respectively, have an estimated aggregate fair value of approximately $520.1 million and $548.9 million, respectively. Estimated fair value is based on interest rates available to us as of the dates reported on for issuance of debt with similar terms and remaining maturities. Considerable judgment is necessary to interpret market data and develop estimated fair values. Accordingly, the estimates presented herein are not necessarily indicative of the amounts we could realize on disposition of the financial instruments. The use of different market assumptions and/or estimation methodologies may have a material effect on the estimated fair value amounts. 10. GAIN ON INSURANCE RECOVERIES In June 2009, we settled a wind storm damage insurance claim involving 13 of our central Ohio properties for the aggregate sum of $906,000, net of our deductible. In accordance with GAAP, we recorded this settlement as a gain on insurance recoveries. The roofs of five of these properties sustained extensive damage and were replaced. In December 2009, we settled a fire damage insurance claim in which the clubhouse of one of our Ohio properties was destroyed by a fire for the aggregate sum of $271,000, net of our deductible. In accordance with GAAP, we recorded this settlement as a gain on insurance recoveries. We reported a gain on insurance recoveries of $665,000 in the Consolidated Statements of Income for the twelve months ended December 31, 2009, which represents insurance proceeds to be received net of the carrying value of the assets written off and costs incurred to make repairs.
(In thousands) Level 1 Level 2 Level 3 Total
Interest rate swaps
$ -
$ 1,419
$ -
$ 1,419
38
11. SUPPLEMENTAL DISCLOSURE OF CASH FLOW INFORMATION The following table summarizes our non-cash investing and financing activities which are not reflected in the Consolidated Statements of Cash Flows:
12. COMMON, TREASURY AND PREFERRED SHARES Treasury Shares Our Board of Directors has authorized the repurchase of up to $75.0 million of our common and/or preferred shares. As of December 31, 2009, we had repurchased 3,825,125 common shares under this plan at a cost of $41.1 million and 389,500 preferred depositary shares at a cost of $7.6 million. During the year ended December 31, 2009, a total of 111,148 restricted shares had vested and were issued from treasury shares. Preferred Shares We are authorized to issue a total of 9,000,000 Preferred Shares, designated as follows:
� 3,000,000 Class A Cumulative Preferred Shares, of which 225,000 have been designated as 9.75% Class A Cumulative Redeemable Preferred Shares and were redeemed in 2005.
� 3,000,000 Class B Cumulative Preferred Shares, of which 400,000 have been designated as Class B Series I Cumulative Preferred Shares and 232,000 have been designated as 8.70% Class B Series II Cumulative Redeemable Preferred Shares and are discussed below.
� 3,000,000 Noncumulative Preferred Shares. 8.70% Class B Series II Cumulative Redeemable Preferred Shares. In December 2004, we issued 2,320,000 depositary shares, each representing 1/10th of a share of our 8.70% Class B Series II Cumulative Redeemable Preferred Shares, for $58.0 million and incurred costs of approximately $1.2 million related to the issuance. The liquidation preference for each Class B Preferred Shares is $250.00 (equivalent to $25.00 per depositary share), plus accrued and unpaid dividends. Dividends on the Class B Preferred Shares are cumulative from the date of issue and are payable quarterly. Except in certain circumstances relating to the preservation of our status as a REIT, the Class B Preferred Shares are not redeemable prior to December 15, 2009. On or after December 15, 2009, the Class B Preferred Shares are redeemable for cash at our option. The net proceeds from this offering were used to redeem the outstanding 9.75% Class A Cumulative Redeemable Preferred Shares. During 2008 and 2007, we repurchased a total of 389,500 depositary shares under our $50.0 million share repurchase authorization, leaving 1,930,500 depositary shares outstanding as of December 31, 2009.
Year Ended December 31, (In thousands) 2009 2008 2006 Dividends declared but not paid $ 2,849 $ 2,920 $ 2,848 Assumption of debt in connection with property acquisition - 45,002 42,000 Reclassification of original issuance costs related to repurchase
of preferred shares and related discount/(premium), net - 2,146 (172)Net change in accounts payable related to recurring fixed
asset additions (203) 558 599 Fixed asset adjustment for purchase of operating
partnership units - - 8
39
Shareholder Rights Plan
In January 1999, we adopted a Shareholder Rights Plan. To implement the Plan, the Board of Directors declared a distribution of one Right for each of our outstanding common shares. Each Right entitles the holder to purchase from us 1/1,000th of a Class B Series I Cumulative Preferred Share (a "Preferred Share") at a purchase price of $40 per Right, subject to adjustment. One one-thousandth of a Preferred Share is intended to be approximately the economic equivalent of one common share.
The Rights are not currently exercisable and are traded with our common shares. The Rights will become exercisable if a person or group becomes the beneficial owner of, or announces an offer to acquire, 15.0% or more of the then outstanding common shares.
If a person or group acquires 15.0% or more of our outstanding common shares, then each Right not owned by the acquiring person or its affiliates will entitle its holder to purchase, at the Right's then-current exercise price, fractional preferred shares that are approximately the economic equivalent of common shares (or, in certain circumstances, common shares, cash, property or other securities) having a market value equal to twice the then-current exercise price. In addition, if, after the rights become exercisable, we are acquired in a merger or other business combination transaction with an acquiring person or its affiliates or sell 50.0% or more of our assets or earning power to an acquiring person or its affiliates, each Right will entitle its holder to purchase, at the Right’s then-current exercise price, a number of the acquiring common shares having a market value of twice the Right’s exercise price. The Board of Directors may redeem the Rights, in whole, but not in part, at a price of $.01 per Right.
The distribution was made on January 29, 1999, to shareholders of record on that date. The initial distribution of Rights was not taxable to shareholders.
On December 30, 2008, we entered into an Amended and Restated Shareholder Rights Agreement that, among other matters, extended the Plan to December 30, 2018 and revised the Plan definition of "beneficial ownership" to include certain derivative or synthetic arrangements having characteristics of a long position in the Company’s common shares.
13. EARNINGS PER SHARE
In June 2008, the FASB issued guidance which clarifies that nonvested awards containing nonforfeitable dividend rights are participating securities and are therefore required to be included in the computations of basic and diluted earnings per share. This guidance was effective for us January 1, 2009, and requires retrospective application to all periods presented.
There were 1.4 million, 1.4 million and 1.6 million options to purchase common shares outstanding at December 31, 2009, 2008 and 2007, respectively. The dilutive effect of these options were not included in the calculation of diluted earnings per share for the years presented as their inclusion would be antidilutive to the net loss applicable to common shares from continuing operations.
The exchange of operating partnership noncontrolling redeemable interest into common shares was not included in the computation of diluted EPS because we plan to settle these OP units in cash.

40
14. EMPLOYEE BENEFIT PLANS We offer medical, dental, vision and life insurance benefits to those employees who have completed their 90-day introductory period. Employees who have completed six months of service are eligible for educational assistance program and to participate in the 401(k) plan and employees who have completed one year of service are provided with long-term disability coverage. Additionally, we offer a variety of supplemental benefits to employees at their own cost. We sponsor a defined contribution plan pursuant to Section 401(k) of the Internal Revenue Code, whereby eligible employees may elect to contribute up to 25.0% of their gross wages. After one year of participation, we match such contributions at a rate of 25.0% up to a maximum participant contribution of 6.0% of their wages. We recorded expense in relation to this plan of approximately $85,000, $116,000 and $151,000 for the years ended December 31, 2009, 2008 and 2007, respectively. Supplemental Executive Retirement Plan Our Supplemental Executive Retirement Plan (the "SERP") was adopted by the Board of Directors on January 1, 1997. This Plan was implemented to provide competitive retirement benefits for officers and to act as a retention incentive. This non-qualified, unfunded, defined contribution plan extends to certain named officers nominated by the Chief Executive Officer and approved by the Executive Compensation Committee of the Board. The SERP provides for us to make a contribution to the account of each of the participating officers at the end of each plan year. The contribution, which is a percentage of eligible earnings (including base salary and payments under the Annual Incentive Plan), is set by the Committee at the beginning of each SERP year. Contributions will not be taxable to the participant (other than social security and federal unemployment taxes once vested) until distribution. The account balances earn interest each year at a rate determined by the Executive Compensation Committee of the Board. In January 2007, the Executive Compensation Committee revised the annual contributions such that the accounts of participants not vested as of January 1, 2007, would no longer receive annual contributions, however their accounts will continue to receive interest. The Executive Compensation Committee approves the interest rate at the beginning of the year. The following table summarizes the changes in SERP balances for the years ended December 31, 2009, 2008 and 2007:
Year Ended December 31, (In thousands) 2009 2008 2007 Numerator - basic and diluted: (Loss) income from continuing operations $ (9,705) $ (10,089) $ (16,209)
Net income attributable to noncontrolling redeemable interest (53) (53) (53)Preferred share dividends (4,199) (4,655) (4,924)Preferred share repurchase costs - (143) (58)Discount/(premium) on preferred share repurchase - 2,289 (114)
(Loss) income from continuing operations applicable to common shares $ (13,957) $ (12,651) $ (21,358)
Income from discontinued operations $ 15,968 $ 44,769 $ 26,427
Allocation to participating securities (423) (730) (338)Income from discontinued operations applicable to common shares $ 15,545 $ 44,039 $ 26,089 Denominator - basic and diluted: 16,516 16,262 16,871 Net income applicable to common shares - basic and diluted: (Loss) income from continuing operations applicable to common shares $ (0.85) $ (0.78) $ (1.27)Income from discontinued operations 0.95 2.71 1.55 Net income applicable to common shares - basic and diluted $ 0.10 $ 1.93 $ 0.28

41
15. EQUITY BASED AWARD PLANS 2008 Equity Based Award Plan On May 7, 2008, our shareholders approved the 2008 Equity Based Award Plan (the "Plan") which previously had been adopted by our Board of Directors (the "Board") on March 14, 2008, subject to shareholder approval. Subsequent to receiving shareholder approval on May 7, 2008, the Board adopted amended language to the Plan consistent with the additional proxy materials filed by the Company on May 1, 2008. Under the Plan, a total of 750,000 common shares are available for awards. The Plan provides for the grant to our officers, other employees and directors of options to purchase our common shares, rights to receive the appreciation in value of common shares, awards of common shares subject to vesting and restrictions on transfer, awards of common shares issuable in the future upon satisfaction of certain conditions and other awards based on common shares. At December 31, 2009, no awards had been issued under this plan. Year 2001 Equity Incentive Plan Our Year 2001 Equity Incentive Plan (the "EIP") was adopted by the Board on December 8, 2000. On May 4, 2005, our shareholders approved the Amended and Restated 2001 Equity-Based Award Plan (the "Plan"). The Plan was amended to (i) allow for the shares reserved for issuance to be listed on the New York Stock Exchange pursuant to the rules of the exchange, (ii) allow us to grant options that qualify as incentive stock options under the Internal Revenue Code of 1986, as amended, (iii) allow compensation attributable to equity based awards under the Plan to qualify as "performance-based compensation," as defined in the Internal Revenue Code, and (iv) increase the number of common shares available for awards by 750,000 common shares. The Plan provides for equity award grants to our officers, employees and directors. Equity awards available under the Plan include stock options, share appreciation rights, restricted shares, deferred shares and other awards based on common shares. The aggregate number of common shares subject to awards under the Plan was increased to 2,250,000 from 1,500,000. At December 31, 2009, we had 130,052 common shares available for awards under this plan. There were 1,098,364 options outstanding under this plan, of which 1,020,364 were exercisable, at December 31, 2009. Equity-Based Incentive Compensation Plan The Equity-Based Incentive Compensation Plan (the "Omnibus Equity Plan") expired February 20, 2005, and therefore no additional shares/awards will be granted under this plan. At December 31, 2009, there were 262,000 shares outstanding and exercisable under this plan. These awards will remain in effect according to the original terms and conditions of the plan. This plan provided key employees equity or equity based incentives under which 1.4 million of our common shares had been reserved for awards of share options and restricted shares. Options were granted at per share prices not less than fair market value at the date of grant and must be exercised within ten years thereof.
Supplemental Executive Retirement Plan Benefit for the year ended December 31, (In thousands) 2009 2008 2007 Balance at beginning of period $ 1,545 $ 1,337 $ 1,164 Service cost 101 97 76 Interest cost 128 111 97 Balance at end of period $ 1,774 $ 1,545 $ 1,337

42
AERC Share Option Plan The AERC Share Option Plan expired September 30, 2003, and therefore no additional options will be granted under this plan. At December 31, 2009, there were 5,000 options outstanding and exercisable under this plan. These options will remain in effect according to the original terms and conditions of the plan. Under this plan, 543,093 of our common shares had been reserved for awards of share options to eligible key employees. Options were granted at per share prices not less than fair market value at the date of grant and must be exercised within ten years thereof. Share-Based Compensation Our share-based compensation awards consist primarily of restricted shares. We award share-based compensation to our officers and employees as a performance incentive and to align individual goals with those of the Company. Certain of our share-based awards require only continued service with the company to vest. These awards vest either at the end of the specified service period or in equal increments during the service period on each anniversary of the grant date. We recognize compensation cost on these awards on a straight-line basis. In addition to awards containing only service conditions, we issue certain awards in which the number of shares that will ultimately vest and the date at which they will vest is dependant upon the achievement of specified performance goals and/or market conditions. Compensation cost for awards with performance conditions is recognized based on our best estimate of the number of awards that will vest and the period of time in which they will vest. Compensation cost for awards with market conditions is recognized based on the estimated fair market value of the award on the date granted, as described below, and the vesting period. We estimate the amount of expected forfeitures when calculating compensation costs. The forfeiture rates we use were calculated based on our historical forfeiture activity, which was adjusted for activity that we believe is not representative of expected future activity. During the year ended December 31, 2009, 2008 and 2007, we recognized total share-based compensation cost of $2.0 million, $1.9 million and $1.5 million in "General and administrative expense." Stock Options. We use the Black-Scholes option pricing model to estimate the fair value of share-based awards. There were 58,000, zero and 4,000 options granted in 2009, 2008 and 2007, respectively. The weighted average Black-Scholes assumptions and fair value for 2009 and 2007 were as follows:
The expected volatility was based upon the historical volatility of our weekly share closing prices over a period equal to the expected life of the options granted. The risk-free interest rate used was the yield from U.S. Treasury zero-coupon bonds on the date of grant with a maturity equal to the expected life of the options. For options awarded during 2009, the expected life was derived using our historical experience for similar awards. For options awarded during 2007, we used the "simplified" method, as allowed at that time under the provisions of the Securities and Exchange Commission's Staff Accounting Bulletin No. 107, to derive the expected life of the options. The dividend yield was derived using our annual dividend rate as a percentage of the price of our shares on the date of grant.
Year Ended December 31, 2009 2007 Expected volatility 39.1% 27.5%Risk-free interest rate 2.6% 4.5%Expected life of options (in years) 6.4 7.0 Dividend yield 8.4% 4.3%Grant-date fair value $ 1.38 $ 3.45

43
The following table represents stock option activity for the year ended December 31, 2009:
The aggregate intrinsic value of stock options outstanding and stock options exercisable at December 31, 2009, was $2.6 million and $2.4 million, respectively. The aggregate intrinsic value of stock options exercised during the years ended December 31, 2009, 2008 and 2007 was $79,000, $697,000 and $119,000, respectively. Restricted Shares. Restricted shares generally have the same rights as our common shares, except for transfer restrictions and forfeiture provisions. Cash distributions paid during the period of restriction on shares that are expected to vest are recorded as a charge to "Accumulated distributions in excess of accumulated net income." Cash distributions paid during the period of restriction on shares that are expected to be forfeited are recorded as a charge to expense. The following table represents restricted share activity for the year ended December 31, 2009:
During June 2007, we implemented the Associated Estates Realty Corporation Elective Deferred Compensation Program. Under this plan, certain of our officers elected to defer the receipt of a portion of the restricted shares that had been granted during 2009, 2008 and 2007. See Note 16 for additional information regarding this program. A portion of the restricted shares granted during 2007 were awards in which the number of shares that will ultimately vest are subject to market conditions. The total estimated grant-date fair value of these awards, including the awards that were deferred, as noted above, was $1.4 million. We used the Monte Carlo method to estimate the fair value of these awards. The Monte Carlo method, which is similar to the binomial analysis, evaluates the award for changing stock prices over the term of vesting and uses random situations that are averaged based on past stock characteristics. There were one million simulation paths used to estimate the fair value of these awards. The expected volatility was based upon the historical volatility of our daily share closing prices over a period equal to the market condition performance periods. The risk-free interest rate used was based on a yield curve derived from U.S. Treasury zero-coupon bonds on the date of grant with a maturity equal to the market condition performance periods. The expected life used was the market condition performance periods.
Weighted-Average Number of Weighted-Average Remaining Stock Options Exercise Price Contract Life Outstanding at beginning of period 1,378,364 $ 9.41 Granted 58,000 $ 8.34 Exercised 47,500 $ 8.44 Forfeited 23,500 $ 11.11 Outstanding at end of period 1,365,364 $ 9.37 3.8 years Exercisable at end of period 1,287,364 $ 9.41 3.5 years
Weighted Average Number of Grant-Date Shares Fair Value Nonvested at beginning of period 189,867 $ 11.33 Granted 184,070 $ 5.37 Vested 111,148 $ 9.24 Forfeited 78,450 $ 15.82 Nonvested at end of period 184,339 $ 7.15
44
The following table represents the assumption ranges used in the Monte Carlo method during 2007:
The weighted average grant-date fair value of restricted shares granted during the years ended December 31, 2009, 2008 and 2007 was $5.37, $10.45 and $11.77, respectively. The total fair value of restricted shares vested during the years ended December 31, 2009, 2008 and 2007 was $1.0 million, $583,000 and $1.2 million, respectively. At December 31, 2009, there was $1.8 million of unrecognized compensation cost related to nonvested restricted share awards that we expect to recognize over a weighted average period of 1.8 years. 16. DIRECTOR/EXECUTIVE COMPENSATION Elective Deferred Compensation Program In June 2007, we implemented The Associated Estates Realty Corporation Elective Deferred Compensation Program. This plan is an unfunded, non-qualified deferred compensation program that is subject to the provisions of Section 409A of the Internal Revenue code, which strictly regulates the timing of elections and payment. This plan was developed in lieu of updating our Executive Deferred Compensation Plan, which was initially adopted by the Board of Directors on July 1, 1999. Eligibility under the plan shall be determined by the Executive Compensation Committee or its designee, and initially consists of each of our appointed and/or elected officers. This plan permits deferral of up to 90.0% of base salary and up to 100% of any incentive payment. An individual bookkeeping account will be maintained for each participant. Participants are provided a number of measurement funds from which they may select to determine earnings, which may be, but are not required to be, the same as those offered under our 401(k) Savings Plan. Deferrals of base salary and incentive payments (other than restricted shares, discussed below) are fully vested. The plan also permits the deferral of the receipt of restricted shares granted under the Equity-Based Award Plan, which also will be reflected in a separate bookkeeping account for each individual as share equivalent units. Dividend credits shall be made to such account in the form of share equivalent units. Distribution of amounts reflected by such share equivalents will be made in the form of shares. The vesting of share equivalent units occurs on the same schedule as the restricted shares that had been deferred. The plan allows for in-service and separation sub-accounts to permit election of distribution at either a specified date or following separation. Payment of each deferral under the plan will be made in the form specified in the participant's election, and may be in the form of a lump sum or annual installment payments over a period not to exceed four years. Payment of each deferral under the plan will be made on account of separation from service, death, or disability, or at a time specified by the participant, within the parameters set forth in the plan. Redeferral elections are permitted within the parameters set forth in the plan. Accounts will be distributed upon a change of control, and distribution due to unforeseen financial hardship is also possible. At December 31, 2009 and 2008, there were 311,583 and 187,000 share equivalent units, respectively, deferred under this plan.
2007
Expected volatility 25.7% to 27.7%
Risk-free interest rate 4.5% to 5.1%
Expected life (performance period) One to three years

45
Directors’ Deferred Compensation Plan
The Directors' Deferred Compensation Plan was adopted by our Board of Directors on August 22, 1996. This plan was implemented to allow persons serving as Independent Directors the option of deferring receipt of compensation otherwise payable to them for their services as Directors and to create an opportunity for appreciation of the amount deferred based upon appreciation of our Common Shares.
Prior to January 1 of each year, any eligible Director may elect to defer all or a portion of the fees otherwise payable to that Director for that year and such amount will be credited to a deferral account maintained on behalf of the Director. Fees for each period are credited to the deferral account as they are earned. Amounts credited to the deferral account are converted to "share units" which are valued based upon the closing price of our common shares at the end of each reporting period. This plan also permits the deferral of the receipt of restricted shares granted, which also will be reflected in a separate bookkeeping account for each individual as share equivalent units. Each deferral account is increased when we pay a dividend on our common shares by the number of share units that represent the dividend paid per share multiplied by the number of share units in the account on the date of record for the related dividend payment. Share units representing deferred fees and dividend units are vested at all times. Share units representing deferred restricted shares vest on the same schedule as the restricted shares that were deferred. At the end of each reporting period, the total value of the deferred compensation had been adjusted for increases in share units and for changes in our common share price. In December 2009 and effective on January 1, 2010, this plan was modified such that all future distributions from the plan will be in the form of our common shares instead of cash, except for distributions with a commencement date of December 31, 2010 or prior, which will be made in cash. As a result, the value of the deferred compensation will no longer be adjusted based upon the closing price of our common shares. The total amount of deferred compensation relating to this plan is included in "Accounts payable and accrued expenses" in the Consolidated Balance Sheets. Adjustments to the total value of the plan are reflected in "General and administrative expenses" in the Consolidated Statements of Operations. Distributions of $24,000 were made from this account during both 2009 and 2008. At December 31, 2009 and 2008, deferred director compensation totaled $2.5 million and $1.5 million, respectively.
Executive Compensation and Employment Agreements
We have a three-year employment agreement with the Chairman, President and Chief Executive Officer dated January 1, 1996, that is automatically extended for an additional year at the end of each year of the agreement, subject to the right of either party to terminate by giving one year's prior written notice. Additionally, we have severance arrangements with certain other executive officers.
Annual Incentive Plan
In February 2009, the Executive Compensation Committee (the "Committee") approved the terms of the Annual Incentive Plan for Officers. Annual incentives emphasize pay for performance and serve as a key means of driving current objectives and priorities. The Committee determines specific compensation levels for the five most highly compensated officers ("Officers"), which includes our four "Named Executive Officers." Officers are rewarded for accomplishing our short-term financial and business unit objectives. In 2009, annual incentive opportunities for the Officers were determined at the discretion of the Committee. The Committee based its determination on one or more of the following measures of corporate performance: same property net operating income; physical occupancy; property operating margins; fixed charge coverage; interest coverage; total shareholder return (actual and relative); financing activity; performance against budget; execution of strategic objectives; leverage ratios; funds available for distribution and adjusted funds from operations. Business unit and individual performance were also considered. The Committee reviewed our earnings results each quarter and assessed management's performance. No specific targets or weightings amongst the aforementioned performance metrics were established. The Officers earned annual incentives of approximately $1.3 million, $1.4 million and $1.3 million in cash in 2009, 2008 and 2007, respectively.

46
Long-Term Incentive Plan In February 2007, the Committee established the terms of the Company's 2007 Long-Term Incentive Plan ("LTIP") that is intended to create a stronger link to shareholder returns, reward long-term performance and foster retention of the executives. The Committee determines specific compensation levels for the five most highly compensated officers ("Officers"), which includes our four "Named Executive Officers." Each Officer had threshold, target and maximum award opportunities established that are expressed as a percentage of base salary. The framework of the LTIP includes a single-year and multi-year component. Single-year component. Objectives under the single-year LTIP are established annually at the beginning of the year and evaluated at the conclusion of the year. If one or all of the objectives is met, a grant of restricted shares will be issued. One-third of the issued shares will vest immediately and the remaining two-thirds will vest in equal, annual installments. Restricted shares, if issued, have voting rights and dividends will be paid on them during the restricted period. In February 2009, the Committee approved the terms of the 2009 single-year component of the LTIP. This component focused primarily on interest coverage and fixed charge coverage financial ratios and same property NOI over a one-year period, however the level of achievement under this component was determined at the discretion of the Committee. Officers earned approximately $1.1 million under the 2009 single-year LTIP. In February 2008, the Committee approved the terms of the 2008 single-year component of the LTIP. This component focused on interest coverage and fixed charge coverage financial ratios and same property NOI over a one-year period. Officers earned approximately $1.3 million under the 2008 single-year LTIP. In 2007, the single-year component of the LTIP focused on total shareholder return, our strategic objectives and property NOI over a one year period. Officers earned approximately $780,000 under the 2007 single-year LTIP. Multi-year component. The multi-year component focused on performance over a three-year measurement period. When established in 2007, this component comprised approximately 50.0% of the total LTIP on an annualized basis over the three-year period. The multi-year long-term component focused on cumulative total shareholder return over the three-year period and continued employment with the Company. Any shares vesting under this plan will vest during the first quarter of 2011. Total shareholder return threshold, target and maximum objectives were established and a grant of restricted shares was issued in February 2007 with a value of $3.3 million. The TSR objectives under the 2007 plan were not met and only the shares that are attributable to continued employment with the Company are eligible for vesting at the end of the service period, which had a value of $403,000 when granted. Restricted shares have voting rights and dividends accrue and earn interest at a rate determined by the Executive Compensation Committee during the restricted period. Only the dividends and accrued interest attributable to shares that vest will be paid when such shares vest. Grants under the multi-year component are issued and metrics and objectives are established every three years. 17. COMPREHENSIVE INCOME The following chart identifies our total comprehensive income for the years ended December 31, 2009, 2008 and 2007:
For information regarding the change in fair value of hedge instruments, see “Derivative Instruments and Hedging Activity” in Note 1.
Year Ended December 31, (In thousands) 2009 2008 2007 Comprehensive income: Net income attributable to AERC $ 6,210 $ 34,627 $ 10,165 Other comprehensive income (loss):
Change in fair value of hedge instruments 1,479 (1,849) (979)Total comprehensive income $ 7,689 $ 32,778 $ 9,186
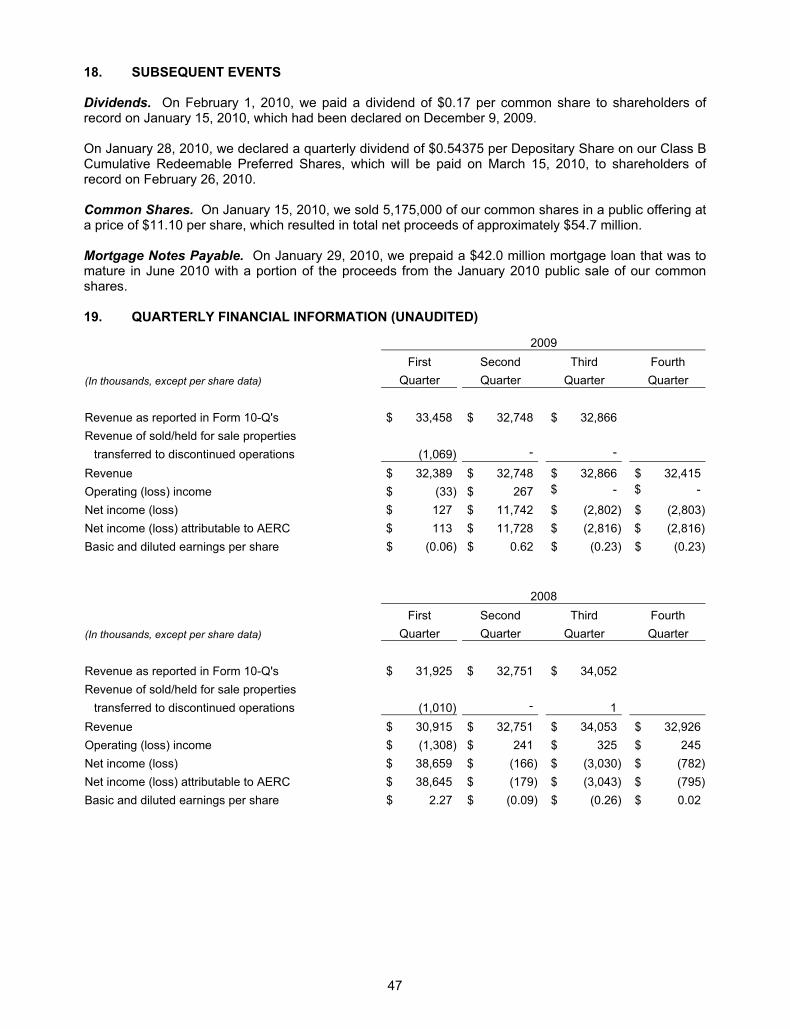
47
18. SUBSEQUENT EVENTS Dividends. On February 1, 2010, we paid a dividend of $0.17 per common share to shareholders of record on January 15, 2010, which had been declared on December 9, 2009. On January 28, 2010, we declared a quarterly dividend of $0.54375 per Depositary Share on our Class B Cumulative Redeemable Preferred Shares, which will be paid on March 15, 2010, to shareholders of record on February 26, 2010. Common Shares. On January 15, 2010, we sold 5,175,000 of our common shares in a public offering at a price of $11.10 per share, which resulted in total net proceeds of approximately $54.7 million. Mortgage Notes Payable. On January 29, 2010, we prepaid a $42.0 million mortgage loan that was to mature in June 2010 with a portion of the proceeds from the January 2010 public sale of our common shares. 19. QUARTERLY FINANCIAL INFORMATION (UNAUDITED)
2009 First Second Third Fourth (In thousands, except per share data) Quarter Quarter Quarter Quarter Revenue as reported in Form 10-Q's $ 33,458 $ 32,748 $ 32,866 Revenue of sold/held for sale properties
transferred to discontinued operations (1,069) - - Revenue $ 32,389 $ 32,748 $ 32,866 $ 32,415 Operating (loss) income $ (33) $ 267 $ - $ -
Net income (loss) $ 127 $ 11,742 $ (2,802) $ (2,803)Net income (loss) attributable to AERC $ 113 $ 11,728 $ (2,816) $ (2,816)Basic and diluted earnings per share $ (0.06) $ 0.62 $ (0.23) $ (0.23)
2008 First Second Third Fourth (In thousands, except per share data) Quarter Quarter Quarter Quarter Revenue as reported in Form 10-Q's $ 31,925 $ 32,751 $ 34,052 Revenue of sold/held for sale properties
transferred to discontinued operations (1,010) - 1 Revenue $ 30,915 $ 32,751 $ 34,053 $ 32,926 Operating (loss) income $ (1,308) $ 241 $ 325 $ 245 Net income (loss) $ 38,659 $ (166) $ (3,030) $ (782)Net income (loss) attributable to AERC $ 38,645 $ (179) $ (3,043) $ (795)Basic and diluted earnings per share $ 2.27 $ (0.09) $ (0.26) $ 0.02

48
The following tables set forth selected financial and other data for us on a consolidated basis. The historical financial information contained in the tables has been derived from and should be read in conjunction with (i) our Consolidated Financial Statements and Notes thereto and (ii) Management's Discussion and Analysis of Financial Condition and Results of Operations both included elsewhere herein.
(In thousands, except per share, unit count and net collected rent amounts) Year Ended December 31, 2009 2008 2007 2006 2005 Operating Data: Revenue
Property revenue $ 127,972 $ 127,848 $ 113,772 $ 102,771 $ 95,245 Management and service operations:
Fees, reimbursements and other 1,287 1,784 10,990 11,689 11,723 Construction and other services 1,160 1,010 2,218 1,078 1,094 Total revenue 130,419 130,642 126,980 115,538 108,062
Total expenses (106,615) (106,705) (104,562) (96,068) (90,158)
Interest income 46 132 429 650 627 Interest expense (34,220) (35,660) (38,798) (45,660) (34,111)
(Loss) income before gain on disposition of investment, gain on insurance recoveries, equity in net income (loss) of joint ventures, and income from discontinued operations (10,370) (11,591) (15,951) (25,540) (15,580)
Gain on disposition of investment - - - - 150 Gain on insurance recoveries 665 - - - - Equity in net income (loss) of joint ventures - 1,502 (258) (462) (644)(Loss) income from continuing operations (9,705) (10,089) (16,209) (26,002) (16,074)Income from discontinued operations:
Operating income (loss) 568 (433) 5,563 (1,009) 3,807 Gain on disposition of properties 15,400 45,202 20,864 54,093 48,536
Income from discontinued operations 15,968 44,769 26,427 53,084 52,343 Net income 6,263 34,680 10,218 27,082 36,269 Net income attributable to noncontrolling redeemable interest (53) (53) (53) (61) (63)Net income attributable to AERC 6,210 34,627 10,165 27,021 36,206 Preferred share dividends (4,199) (4,655) (4,924) (5,046) (5,130)Preferred share repurchase costs - (143) (58) - (2,163)Discount/(premium) on preferred share repurchase - 2,289 (114) - - Allocation to participating securities (423) (730) (338) (770) (623)Net income applicable to common shares $ 1,588 $ 31,388 $ 4,731 $ 21,205 $ 28,290 Earnings per common share - Basic and Diluted:
(Loss) income from continuing operations applicable to common shares $ (0.85) $ (0.78) $ (1.27) $ (1.83) $ (1.22)
Income from discontinued operations 0.95 2.71 1.55 3.07 2.70 Net income applicable to common shares $ 0.10 $ 1.93 $ 0.28 $ 1.24 $ 1.48 Weighted average number of common shares outstanding 16,516 16,262 16,871 17,023 19,162
Dividends declared per common share $ 0.68 $ 0.68 $ 0.68 $ 0.68 $ 0.68
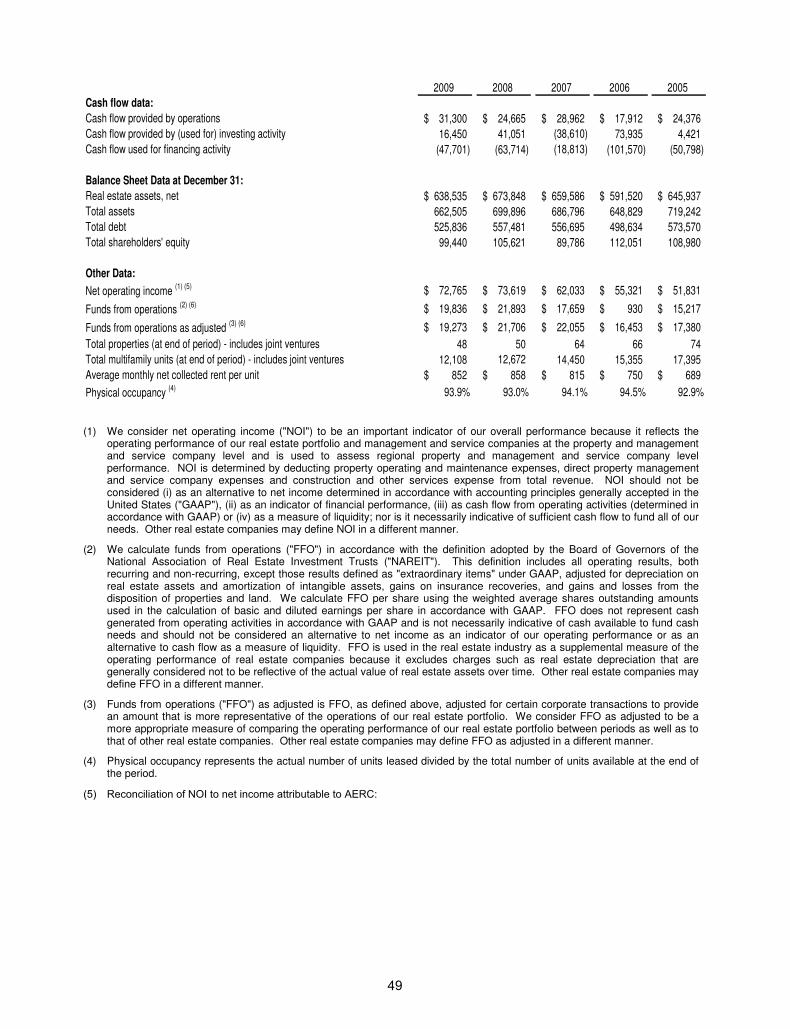
49
2009 2008 2007 2006 2005Cash flow data:Cash flow provided by operations 31,300$ 24,665$ 28,962$ 17,912$ 24,376$ Cash flow provided by (used for) investing activity 16,450 41,051 (38,610) 73,935 4,421 Cash flow used for financing activity (47,701) (63,714) (18,813) (101,570) (50,798)
Balance Sheet Data at December 31:Real estate assets, net 638,535$ 673,848$ 659,586$ 591,520$ 645,937$ Total assets 662,505 699,896 686,796 648,829 719,242 Total debt 525,836 557,481 556,695 498,634 573,570 Total shareholders' equity 99,440 105,621 89,786 112,051 108,980
Other Data:Net operating income (1) (5) 72,765$ 73,619$ 62,033$ 55,321$ 51,831$
Funds from operations (2) (6) 19,836$ 21,893$ 17,659$ 930$ 15,217$
Funds from operations as adjusted (3) (6) 19,273$ 21,706$ 22,055$ 16,453$ 17,380$ Total properties (at end of period) - includes joint ventures 48 50 64 66 74 Total multifamily units (at end of period) - includes joint ventures 12,108 12,672 14,450 15,355 17,395 Average monthly net collected rent per unit 852$ 858$ 815$ 750$ 689$
Physical occupancy (4) 93.9% 93.0% 94.1% 94.5% 92.9%
(1) We consider net operating income ("NOI") to be an important indicator of our overall performance because it reflects the operating performance of our real estate portfolio and management and service companies at the property and management and service company level and is used to assess regional property and management and service company level performance. NOI is determined by deducting property operating and maintenance expenses, direct property management and service company expenses and construction and other services expense from total revenue. NOI should not be considered (i) as an alternative to net income determined in accordance with accounting principles generally accepted in the United States ("GAAP"), (ii) as an indicator of financial performance, (iii) as cash flow from operating activities (determined in accordance with GAAP) or (iv) as a measure of liquidity; nor is it necessarily indicative of sufficient cash flow to fund all of our needs. Other real estate companies may define NOI in a different manner.
(2) We calculate funds from operations ("FFO") in accordance with the definition adopted by the Board of Governors of the National Association of Real Estate Investment Trusts ("NAREIT"). This definition includes all operating results, both recurring and non-recurring, except those results defined as "extraordinary items" under GAAP, adjusted for depreciation on real estate assets and amortization of intangible assets, gains on insurance recoveries, and gains and losses from the disposition of properties and land. We calculate FFO per share using the weighted average shares outstanding amounts used in the calculation of basic and diluted earnings per share in accordance with GAAP. FFO does not represent cash generated from operating activities in accordance with GAAP and is not necessarily indicative of cash available to fund cash needs and should not be considered an alternative to net income as an indicator of our operating performance or as an alternative to cash flow as a measure of liquidity. FFO is used in the real estate industry as a supplemental measure of the operating performance of real estate companies because it excludes charges such as real estate depreciation that are generally considered not to be reflective of the actual value of real estate assets over time. Other real estate companies may define FFO in a different manner.
(3) Funds from operations ("FFO") as adjusted is FFO, as defined above, adjusted for certain corporate transactions to provide an amount that is more representative of the operations of our real estate portfolio. We consider FFO as adjusted to be a more appropriate measure of comparing the operating performance of our real estate portfolio between periods as well as to that of other real estate companies. Other real estate companies may define FFO as adjusted in a different manner.
(4) Physical occupancy represents the actual number of units leased divided by the total number of units available at the end of the period.
(5) Reconciliation of NOI to net income attributable to AERC:
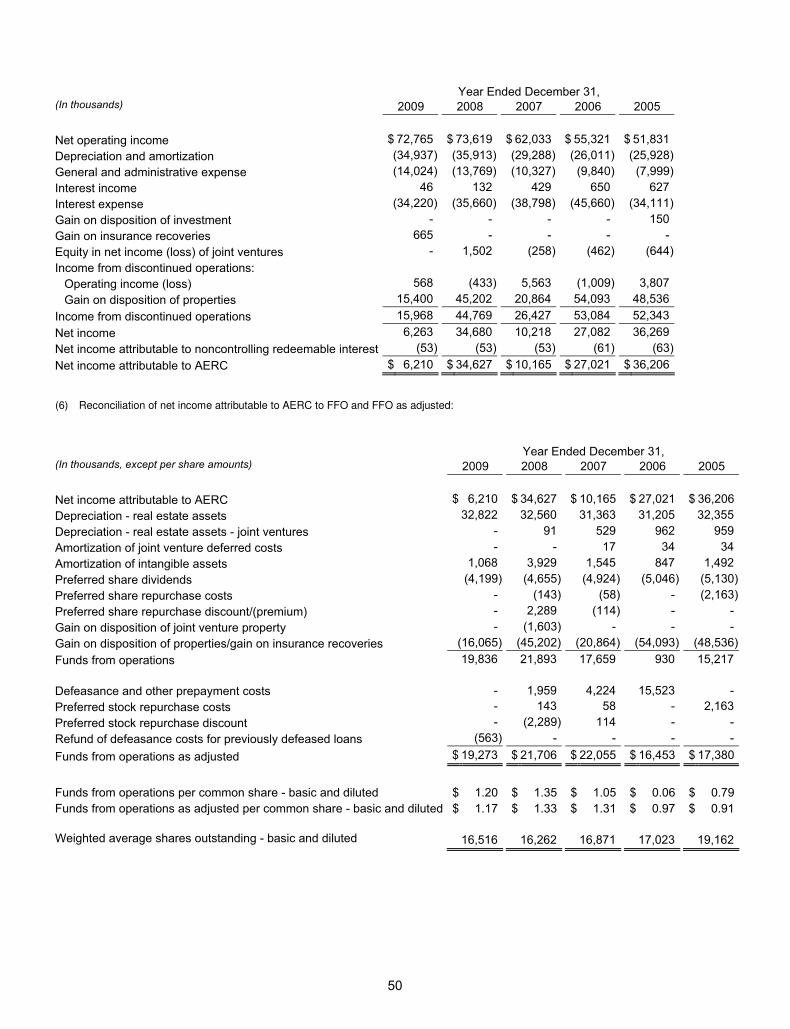
50
Year Ended December 31, (In thousands) 2009 2008 2007 2006 2005
Net operating income $ 72,765 $ 73,619 $ 62,033 $ 55,321 $ 51,831 Depreciation and amortization (34,937) (35,913) (29,288) (26,011) (25,928)General and administrative expense (14,024) (13,769) (10,327) (9,840) (7,999)Interest income 46 132 429 650 627 Interest expense (34,220) (35,660) (38,798) (45,660) (34,111)Gain on disposition of investment - - - - 150 Gain on insurance recoveries 665 - - - - Equity in net income (loss) of joint ventures - 1,502 (258) (462) (644)Income from discontinued operations:
Operating income (loss) 568 (433) 5,563 (1,009) 3,807 Gain on disposition of properties 15,400 45,202 20,864 54,093 48,536
Income from discontinued operations 15,968 44,769 26,427 53,084 52,343 Net income 6,263 34,680 10,218 27,082 36,269 Net income attributable to noncontrolling redeemable interest (53) (53) (53) (61) (63)Net income attributable to AERC $ 6,210 $ 34,627 $ 10,165 $ 27,021 $ 36,206
Year Ended December 31, (In thousands, except per share amounts) 2009 2008 2007 2006 2005
Net income attributable to AERC $ 6,210 $ 34,627 $ 10,165 $ 27,021 $ 36,206 Depreciation - real estate assets 32,822 32,560 31,363 31,205 32,355 Depreciation - real estate assets - joint ventures - 91 529 962 959 Amortization of joint venture deferred costs - - 17 34 34 Amortization of intangible assets 1,068 3,929 1,545 847 1,492 Preferred share dividends (4,199) (4,655) (4,924) (5,046) (5,130)Preferred share repurchase costs - (143) (58) - (2,163)Preferred share repurchase discount/(premium) - 2,289 (114) - - Gain on disposition of joint venture property - (1,603) - - - Gain on disposition of properties/gain on insurance recoveries (16,065) (45,202) (20,864) (54,093) (48,536)Funds from operations 19,836 21,893 17,659 930 15,217 Defeasance and other prepayment costs - 1,959 4,224 15,523 - Preferred stock repurchase costs - 143 58 - 2,163 Preferred stock repurchase discount - (2,289) 114 - - Refund of defeasance costs for previously defeased loans (563) - - - - Funds from operations as adjusted $ 19,273 $ 21,706 $ 22,055 $ 16,453 $ 17,380 Funds from operations per common share - basic and diluted $ 1.20 $ 1.35 $ 1.05 $ 0.06 $ 0.79 Funds from operations as adjusted per common share - basic and diluted $ 1.17 $ 1.33 $ 1.31 $ 0.97 $ 0.91 Weighted average shares outstanding - basic and diluted 16,516 16,262 16,871 17,023 19,162
(6) Reconciliation of net income attributable to AERC to FFO and FFO as adjusted:

OfficersJeffrey I. Friedman Chairman, President and Chief Executive Officer
John T. Shannon Senior Vice President of Operations
Lou Fatica Vice President, Chief Financial Officer and Treasurer
Martin A. Fishman Vice President, General Counsel and Secretary
Michelle B. Creger Vice President, Associate General Counsel
Patrick J. Duffy Vice President of Strategic Marketing
Jason A. Friedman Vice President of Construction and Development
Daniel E. Gold Vice President of Human Resources
Miria C. Rabideau Vice President of Operations
Beth L. Stoll Vice President of Operations
Board of Directors and Officers
BOard Of directOrsAlbert T. Adams Partner Baker & Hostetler LLP
James M. Delaney Consultant AON Risk Services
Jeffrey I. Friedman Chairman, President and Chief Executive Officer of the Company
Michael E. Gibbons Senior Managing Director and Principal Brown Gibbons Lang and Company L.P.
Mark L. Milstein Project Manager J. Holden Construction
James A. Schoff Special Advisor to the Chairman Developers Diversified Realty Corporation
Richard T. Schwarz 1
Limited Partner Edgewater Capital Partners
1 Lead Independent Director
Officers from left to right: Martin A. Fishman, John T. Shannon, Patrick J. Duffy, Beth L. Stoll, Jeffrey I. Friedman, Jason A. Friedman, Daniel E. Gold, Miria C. Rabideau, Michelle B. Creger and Lou Fatica

Great Living–It’s What We Do
Associated Estates 2009 Annual ReportGreat LivingIt’s What We Do
1 AEC Parkway Richmond Heights, OH 44143 800-440-2372 AssociatedEstates.com
AEC12010ARColumbus, Ohio Dublin, Ohio
Orlando, Florida
Cincinnati, OhioAtlanta, Georgia
OffIcErsJeffrey I. Friedman Chairman, President and Chief Executive Officer
John T. Shannon Senior Vice President of Operations
Lou Fatica Vice President, Chief Financial Officer and Treasurer
Martin A. Fishman Vice President, General Counsel and Secretary
Michelle B. Creger Vice President, Associate General Counsel
Patrick J. Duffy Vice President of Strategic Marketing
Jason A. Friedman Vice President of Construction and Development
Daniel E. Gold Vice President of Human Resources
Miria C. Rabideau Vice President of Operations
Beth L. Stoll Vice President of Operations
Board of Directors and Officers
BOArD Of DIrEctOrsAlbert T. Adams Partner Baker & Hostetler LLP
James M. Delaney Consultant AON Risk Services
Jeffrey I. Friedman Chairman, President and Chief Executive Officer of the Company
Michael E. Gibbons Senior Managing Director and Principal Brown Gibbons Lang and Company L.P.
Mark L. Milstein Project Manager J. Holden Construction
James A. Schoff Special Advisor to the Chairman Developers Diversified Realty Corporation
Richard T. Schwarz 1
Limited Partner Edgewater Capital Partners
1 Lead Independent Director
Officers from left to right: Martin A. Fishman, John T. Shannon, Patrick J. Duffy, Beth L. Stoll, Jeffrey I. Friedman, Jason A. Friedman, Daniel E. Gold, Miria C. Rabideau, Michelle B. Creger and Lou Fatica
Asso
ciate
d E
state
s 20
09
An
nu
al R
ep
ort
®
®