atlantic american corporation
TRANSCRIPT

TABLE OF CONTENTS
UNITED STATESSECURITIES AND EXCHANGE COMMISSION
WASHINGTON, D.C. 20549
FORM 10-K☒ ANNUAL REPORT PURSUANT TO SECTION 13 OR 15(d) OF THE SECURITIES EXCHANGE ACT OF 1934
For the fiscal year ended December 31, 2019or
o TRANSITION REPORT PURSUANT TO SECTION 13 OR 15(d) OF THE SECURITIES EXCHANGE ACT OF 1934
Commission file number 0-3722
ATLANTIC AMERICAN CORPORATION(Exact name of registrant as specified in its charter)
Georgia 58-1027114(State or other jurisdiction of incorporation or organization) (I.R.S. Employer Identification No.)
4370 Peachtree Road, N.E.,Atlanta, Georgia 30319
(Address of principal executive offices) (Zip Code)(Registrant’s telephone number, including area code) (404) 266-5500
Securities registered pursuant to section 12(b) of the Act:Title of each class Trading Symbol(s) Name of each exchange on which registered
Common Stock, par value$1.00 per share
AAME NASDAQ Global Market
Securities registered pursuant to Section 12(g) of the Act:None
Indicate by check mark if the registrant is a well-known seasoned issuer, as defined in Rule 405 of the Securities Act. Yes o No ☒
Indicate by check mark if the registrant is not required to file reports pursuant to Section 13 or Section 15(d) of the Act. Yes o No ☒Indicate by check mark whether the registrant (1) has filed all reports required to be filed by Section 13 or 15(d) of the Securities
Exchange Act of 1934 during the preceding 12 months (or for such shorter period that the registrant was required to file such reports), and(2) has been subject to such filing requirements for the past 90 days. Yes ☒ No o
Indicate by check mark whether the registrant has submitted electronically every Interactive Data File required to be submittedpursuant to Rule 405 of Regulation S-T (§ 232.405 of this chapter) during the preceding 12 months (or for such shorter period that theregistrant was required to submit and post such files). Yes ☒ No o
Indicate by check mark whether the registrant is a large accelerated filer, an accelerated filer, a non-accelerated filer, or a smallerreporting company. See definitions of “large accelerated filer,” “accelerated filer,” “smaller reporting company,” and “emerging growthcompany”in Rule 12b-2 of the Exchange Act. (Check one):Large accelerated filer o Accelerated filer o Non-accelerated filer o Smaller reporting company ☒ (Do not check if a smaller reporting company) Emerging growth company o
If an emerging growth company, indicate by check mark if the registrant has elected not to use the extended transition period forcomplying with any new or revised financial accounting standards provided pursuant to Section 13(a) of the Exchange Act. o
Indicate by check mark whether the registrant is a shell company (as defined in Rule 12b-2 of the Exchange Act). Yes o No ☒The aggregate market value of common stock held by non-affiliates of the registrant as of June 30, 2019, the last business day of the
registrant’s most recently completed second fiscal quarter, was $10,800,070. For purposes hereof, beneficial ownership is determined underrules adopted pursuant to Section 13 of the Securities Exchange Act of 1934, and the foregoing excludes value ascribed to common stockthat may be deemed beneficially owned by the directors and executive officers, and 10% or greater stockholders, of the registrant, some ofwhom may not be deemed to be affiliates upon judicial determination. On March 13, 2020 there were 20,472,162 shares of the registrant’scommon stock, par value $1.00 per share, outstanding.
DOCUMENTS INCORPORATED BY REFERENCE1.Portions of the registrant’s Proxy Statement for the 2020 Annual Meeting of Shareholders, to be filed with the Securities and
Exchange Commission within 120 days of the registrant’s fiscal year end, have been incorporated by reference in Items 10, 11, 12, 13 and14 of Part III of this Form 10-K.
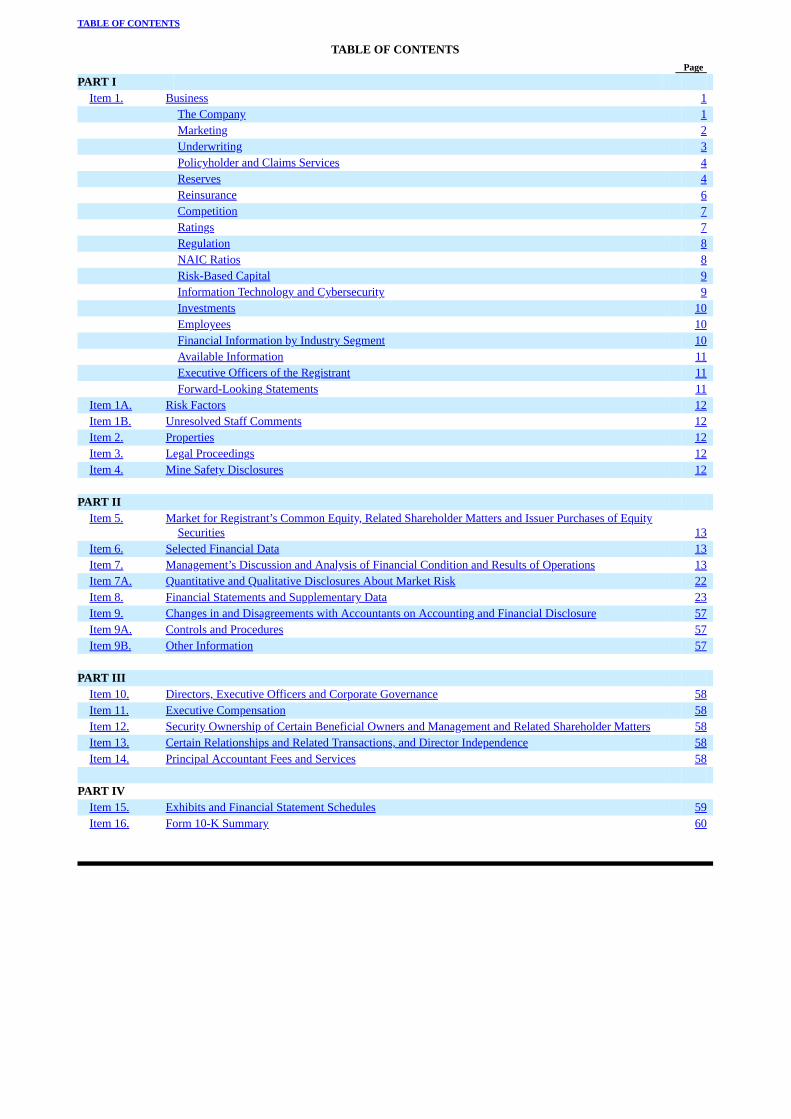
TABLE OF CONTENTS
TABLE OF CONTENTS PagePART I
Item 1. Business 1 The Company 1 Marketing 2 Underwriting 3 Policyholder and Claims Services 4 Reserves 4 Reinsurance 6 Competition 7 Ratings 7 Regulation 8 NAIC Ratios 8 Risk-Based Capital 9 Information Technology and Cybersecurity 9 Investments 10 Employees 10 Financial Information by Industry Segment 10 Available Information 11 Executive Officers of the Registrant 11 Forward-Looking Statements 11
Item 1A. Risk Factors 12 Item 1B. Unresolved Staff Comments 12 Item 2. Properties 12 Item 3. Legal Proceedings 12 Item 4. Mine Safety Disclosures 12
PART II
Item 5. Market for Registrant’s Common Equity, Related Shareholder Matters and Issuer Purchases of EquitySecurities 13
Item 6. Selected Financial Data 13 Item 7. Management’s Discussion and Analysis of Financial Condition and Results of Operations 13 Item 7A. Quantitative and Qualitative Disclosures About Market Risk 22 Item 8. Financial Statements and Supplementary Data 23 Item 9. Changes in and Disagreements with Accountants on Accounting and Financial Disclosure 57 Item 9A. Controls and Procedures 57 Item 9B. Other Information 57
PART III
Item 10. Directors, Executive Officers and Corporate Governance 58 Item 11. Executive Compensation 58 Item 12. Security Ownership of Certain Beneficial Owners and Management and Related Shareholder Matters 58 Item 13. Certain Relationships and Related Transactions, and Director Independence 58 Item 14. Principal Accountant Fees and Services 58
PART IV
Item 15. Exhibits and Financial Statement Schedules 59 Item 16. Form 10-K Summary 60
TABLE OF CONTENTS
PART I
Item 1. Business
The Company
Atlantic American Corporation, a Georgia corporation incorporated in 1968 (the “Parent” or “Company”), is a holdingcompany that operates through its subsidiaries in well-defined specialty markets within the life and health and property and casualtyinsurance industries. The Parent’s principal operating subsidiaries are American Southern Insurance Company and American SafetyInsurance Company (together known as “American Southern”) within the property and casualty insurance industry and BankersFidelity Life Insurance Company and Bankers Fidelity Assurance Company (together known as “Bankers Fidelity”) within the lifeand health insurance industry. Each of American Southern and Bankers Fidelity is managed separately based upon the type ofproducts it offers, and is evaluated on its individual performance. The Company’s strategy is to focus on well-defined geographic,demographic and/or product niches within the insurance marketplace. Each of American Southern and Bankers Fidelity operateswith relative autonomy, which structure is designed to allow for quick reaction to market opportunities.
The Parent has no significant business operations of its own and relies on fees, dividends and other distributions from itsoperating subsidiaries as the principal source of cash flow to meet its obligations. Additional information regarding the cash flowand liquidity needs of the Parent can be found in the Liquidity and Capital Resources section of Management’s Discussion andAnalysis of Financial Condition and Results of Operations.
Property and Casualty Operations
American Southern comprises the Company’s property and casualty operations and its primary product lines are as follows:
Business Automobile Insurance policies provide bodily injury and/or property damage liability coverage, uninsuredmotorist coverage and physical damage coverage for commercial accounts.
General Liability Insurance policies cover bodily injury and property damage liability for both premises and completedoperations exposures for general classes of business.
Surety Bonds are contracts under which one party, the insurance company issuing the surety bond, guarantees to a thirdparty that the primary party will fulfill an obligation in accordance with a contractual agreement. This obligation may involvemeeting a contractual commitment, paying a debt or performing certain duties.
American Southern provides tailored business automobile insurance coverage, on a multi-year contract basis, to stategovernments, local municipalities and other large motor pools and fleets (“block accounts”) that can be specifically rated andunderwritten. The size of the block accounts insured by American Southern are generally such that individual class experience canbe determined, which allows for customized policy terms and rates. American Southern is licensed to do business in 32 states andthe District of Columbia. While the majority of American Southern’s premiums are derived from its automobile lines of business,American Southern also offers inland marine and general liability coverages. Additionally, American Southern directly providessurety bond coverage for school bus transportation and subdivision construction, as well as performance and payment bonds.
1

Year Ended December 31, 2019 2018 (In thousands)Automobile liability $ 30,649 $ 28,840 Automobile physical damage 15,309 11,922 General liability 3,309 2,920 Surety 6,319 7,170 Other lines 3,094 2,955
Total $ 58,680 $ 53,807
Year Ended December 31, 2019 2018 (In thousands)Life insurance $ 8,427 $ 8,921 Medicare supplement 107,001 102,658 Other accident and health 7,817 7,545
Total health insurance 114,818 110,203 Total $ 123,245 $ 119,124
TABLE OF CONTENTS
The following table summarizes, for the periods indicated, the allocation of American Southern’s net earned premiums fromeach of its principal product lines:
Life and Health Operations
Bankers Fidelity comprises the life and health operations of the Company and offers a variety of life and supplemental healthproducts. Products offered by Bankers Fidelity include ordinary and term life insurance, Medicare supplement and other accidentand health insurance products. Health insurance products, primarily Medicare supplement insurance, accounted for 93% of BankersFidelity’s net earned premiums in 2019 while life insurance, including both whole and term life insurance policies, accounted for thebalance. In terms of the number of policies written in 2019, 87% were health insurance policies and 13% were life insurancepolicies.
The following table summarizes, for the periods indicated, the allocation of Bankers Fidelity’s net earned premiums from eachof its principal product lines followed by a brief description of the principal products:
Life Insurance products include non-participating term, individual and group whole life insurance policies with a varietyof riders and options. Policy premiums are dependent upon a number of factors, including issue age, level of coverage andselected riders or options.
Medicare Supplement Insurance includes 8 of the 11 standardized Medicare supplement policies created under theMedicare Improvements for Patients and Providers Act of 2008 (“MIPPA”), which are designed to provide insurance coveragefor certain expenses not covered by the Medicare program, including copayments and deductibles.
Other Accident and Health Insurance coverages include several individual and group policies providing for the paymentof standard benefits in connection with the treatment of diagnosed cancer and other critical illnesses, as well as a number ofother policies providing nursing facility care, accident expense, hospital indemnity and disability coverages.
Marketing
Property and Casualty Operations
A portion of American Southern’s business is marketed through a small number of specialized, experienced independentagents. American Southern’s agent selection process is actively managed by internal marketing personnel with oversight frommanagement. Senior management carefully reviews all new programs prior to acceptance. Most of American Southern’s agents arepaid an up-front commission with the potential for additional commissions by participating in a profit sharing arrangement that isdirectly linked to the profitability
2

TABLE OF CONTENTS
of the underlying business. American Southern also solicits business from governmental entities. As an experienced writer ofinsurance policies for certain governmental programs, the company actively pursues this market on a direct basis. Much of thisbusiness is priced by means of competitive bid situations and there can be no assurance with respect to ultimate profitability or thatthe company can obtain or retain such business at the time of a specific contract renewal.
Life and Health Operations
Bankers Fidelity acquires its clientele through three distribution channels spread across 46 different states and two businessdivisions, all of which utilize commissioned, independent agents. The three distribution channels include traditional independentagents, brokers typically interested in a specific product of Bankers Fidelity and brokers who focus on sales within thegroup/employer benefits arena of BankersWorksite, all of which are responsible for their own marketing and sales activities.Contracting as independent agents enables Bankers Fidelity to effectively expand or contract its sales force without incurringsignificant expense.
Bankers Fidelity had 5,783 licensed agents contracted in both senior market and worksite divisions as of December 31, 2019.During 2019, approximately 1,465 of these licensed agents wrote policies on behalf of Bankers Fidelity.
Bankers Fidelity’s marketing and distribution strategy revolves around five pillars: Diversification, Differentiation, Quality,Retention and Profitability.
Diversification. Through unique product offerings such as the Vantage Recovery®, short-term care product and a group wholelife product featuring a chronic illness rider, the Company is able to offer its distributors an array of products to sell that stand outfrom the competition. As the Company continues to expand its geographical footprint with agents and products, one of its mainobjectives is to have a healthy mix of all of its product lines nationwide.
Differentiation. Bankers Fidelity prides itself on the quality of Customer Service it offers to policyholders and agents. Adedicated agent support team is available to the field to support them on administration, underwriting, sales training, productquestions and a plethora of other services which differentiates the Company from other carriers. Additionally, a customer loyaltyteam is available solely to serve insureds for any of their insurance needs. Unlike larger carriers, Bankers Fidelity prides itself onbeing agile which helps to quickly execute senior management’s initiatives.
Quality. Bankers Fidelity is focused on being a niche carrier that delivers superior service, quality products and innovativesolutions. Sophisticated technology and reporting allows the home office teams to work with the sales force to deliver a tailoredexperience and phenomenal customer service.
Retention. Through seasonal campaigns and customer outreach, the Company is focused on client retention and servicing itspolicyholder’s through various stages in their life. By providing its agents with an innovative product portfolio they are able to meetthe needs of our policyholders at all stages of their lives.
Profitability. In an effort to be sustainable in the marketplace as a long-term partner, senior management is focused ondiversification, differentiation, quality and retention to ultimately service its policyholders and agents and provide security to homeoffice employees.
Underwriting
Property and Casualty Operations
American Southern specializes in underwriting various risks that are sufficiently large enough to establish separate classexperience, relying upon the underwriting expertise of its agents.
During the course of the policy life, extensive use is made of risk management representatives to assist commercialunderwriters in identifying and correcting potential loss exposures and to physically inspect new accounts. The underwriting resultsfrom each insured are reviewed on an individual basis periodically. When results are below expectations, management takescorrective action which may include adjusting rates, revising underwriting standards, adjusting commissions paid to agents, and/oraltering or declining to renew accounts at expiration.
3
TABLE OF CONTENTS
Life and Health Operations
Bankers Fidelity issues a variety of products that span from the worksite markets to the senior markets for both life and healthinsurance. Products offered by Bankers Fidelity include life insurance, typically with small face amounts, Medicare supplement andother accident and health insurance. Bankers Fidelity also provides an array of worksite products such as accident, cancer, criticalillness, hospital indemnity and life insurance that is offered to employers who are looking to provide coverage for their employeesand have the related premiums deducted through payroll deductions.
The majority of the products are underwritten on a non-medical basis using a simplified issue approach by which anapplication containing a variety of health related questions is submitted. Applications for insurance are reviewed to determine theface amount, age, medical history and any other necessary information. Bankers Fidelity utilizes information obtained directly fromthe insured, the medical claims data, prescription utilization reports as well as telephone interviews to determine whether anapplicant meets the company’s underwriting criteria. Bankers Fidelity may also utilize medical records and investigative services tosupplement and substantiate information, as necessary.
Policyholder and Claims Services
The Company believes that prompt, efficient policyholder and claims services are essential to its continued success inmarketing its insurance products (see “Competition”). Additionally, the Company believes that its insureds are particularly sensitiveto claims processing time and to the accessibility of qualified staff to answer inquiries. Accordingly, the Company’s policyholderand claims services seek to offer expeditious disposition of service requests by providing toll-free access for all customers, 24-hourclaim reporting services, and direct computer links with some of its largest accounts. The Company also utilizes an automatic calldistribution system to ensure that inbound calls to customer service support groups are processed efficiently. Operational datagenerated from this system allows management to further refine ongoing client service programs and service representative trainingmodules.
Property and Casualty Operations
American Southern controls its claims costs by utilizing an in-house staff of claims supervisors to investigate, verify, negotiateand settle claims. Upon notification of an occurrence purportedly giving rise to a claim, a claim file is established. The claimsdepartment then conducts a preliminary investigation, determines whether an insurable event has occurred and, if so, updates the filefor the findings and any required reserve adjustments. Frequently, independent adjusters and appraisers are utilized to service claimswhich require on-site inspections.
Life and Health Operations
Insureds may obtain claim forms by calling the claims department customer service group or through Bankers Fidelity’swebsite. To shorten claim processing time, a letter detailing all supporting documents that are required to complete a claim for aparticular policy is sent to the customer along with the correct claim form. With respect to life policies, the claim is entered intoBankers Fidelity’s claims system when the proper documentation is received. Properly documented claims are generally paid withinfive business days of receipt. With regard to Medicare supplement policies, the claim is either directly billed to Bankers Fidelity bythe provider or sent electronically through a Medicare clearing house.
Reserves
Reserves are set by line of business within each of the subsidiaries. At December 31, 2019, approximately 64% of the reservesrelated to property and casualty losses and approximately 36% related to life and health losses. The Company’s property andcasualty operations incur losses which may take extended periods of time to evaluate and settle. Issues with respect to legal liability,actual loss quantification, legal discovery and ultimate subrogation, among other factors, may influence the initial and subsequentestimates of loss. In the property and casualty operations, the Company’s general practice is to reserve at the higher end of thedetermined reasonable range of loss if no other value within the range is determined to be more probable. The Company’s life andhealth operations generally incur losses which are more readily quantified. Medical claims received are recorded in case reservesbased on contractual terms using the submitted billings as a basis for determination. Life claims
4
TABLE OF CONTENTS
are recorded based on contract value at the time of notification to the Company; although policy reserves related to such contractshave been previously established. Individual case reserves are established by a claims processor on each individual claim and areperiodically reviewed and adjusted as new information becomes known during the course of handling a claim. Regular internalperiodic reviews are also performed by management to ensure that loss reserves are established and revised timely relative to thereceipt of new or additional information. Lines of business for which loss data (e.g. paid losses and case reserves) emerge over along period of time are referred to as long-tail lines of business. Lines of business for which loss data emerge more quickly arereferred to as short-tail lines of business. The Company’s long-tail line of business generally consists of its general liability coveragewhile the short-tail lines of business generally consist of property and automobile coverages.
The Company’s actuaries regularly review reserves for both current and prior accident years using the most current claims data.These reviews incorporate a variety of actuarial methods (discussed in Critical Accounting Policies) and judgments and involve adisciplined analysis. For most lines of business, certain actuarial methods and specific assumptions are deemed more appropriatebased on the current circumstances affecting that line of business. These selections incorporate input from claims personnel andoperating management on reported loss cost trends and other factors that could affect the reserve estimates.
For long-tail lines of business, the emergence of paid losses and case reserves is less credible in the early periods, andaccordingly may not be indicative of ultimate losses. For these lines, methods which incorporate a development pattern assumptionare given less weight in calculating incurred but not reported (“IBNR”) reserves for the early periods of loss emergence becausesuch a low percentage of ultimate losses are reported in that time frame. Accordingly, for any given accident year, the rate at whichlosses on long-tail lines of business emerge in the early periods is generally not as reliable an indication of ultimate losses as itwould be for shorter-tail lines of business. The estimation of reserves for these lines of business in the early periods of lossemergence is therefore largely influenced by statistical analyses and application of prior accident years’ loss ratios, after consideringchanges to earned pricing, loss costs, mix of business, ceded reinsurance and other factors that are expected to affect the estimatedultimate losses. For later periods of loss emergence, methods which incorporate a development pattern assumption are given moreweight in estimating ultimate losses. For short-tail lines of business, the emergence of paid loss and case reserves is more credible inthe early periods and is more likely to be indicative of ultimate losses. The method used to set reserves for these lines of business isbased upon utilization of a historical development pattern for reported losses. IBNR reserves for the current year are set as thedifference between the estimated fully developed ultimate losses for each year, less the established, related case reserves andcumulative related payments. IBNR reserves for prior accident years are similarly determined, again relying on an indicated,historical development pattern for reported losses.
Based on the results of regular reserve estimate reviews, the Company determines the appropriate reserve adjustment, if any, torecord in each period. If necessary, recorded reserve estimates are changed after consideration of numerous factors, including, butnot limited to, the magnitude of the difference between the actuarial indication and the recorded reserves, improvement ordeterioration of actuarial indication in the period, the maturity of the accident year, trends observed over the recent past and the levelof volatility within a particular line of business. In general, changes are made more quickly to recognize changes in estimates toultimate losses in mature accident years and less volatile lines of business.
Estimating case reserves and ultimate losses involves various considerations which differ according to the line of business. Inaddition, changes in legislative and regulatory environments may impact loss estimates. General liability claims may have a longpattern of loss emergence. Given the broad nature of potential general liability coverages, investigative time periods may beextended and questions of coverage may exist. Such uncertainties create greater imprecision in estimating required levels of lossreserves. The property and automobile lines of business generally have less variable reserve estimates than other lines. This islargely due to the coverages having relatively shorter periods of loss emergence. Estimates, however, can still vary due to a numberof factors, including interpretations of frequency and severity trends. Severity trends can be impacted by changes in internal claimhandling and reserving practices in addition to changes in the external environment. These changes in claim practices increase theuncertainty in the interpretation of case reserve data, which increases the uncertainty in recorded reserve levels.
The Company’s policy is to record reserves for losses and claims in amounts which approximate actuarial best estimates ofultimate values. Actuarial best estimates do not necessarily represent the midpoint value determined using the various actuarialmethods; however, such estimates will fall between the estimated low and
5
TABLE OF CONTENTS
high end reserve values. The range of estimates developed in connection with the December 31, 2019 actuarial review indicated thatreserves could be as much as 8.5% lower or as much as 4.2% higher. In the opinion of management, recorded reserves represent thebest estimate of outstanding losses, although significant judgments are made in the derivation of reserve estimates and revisions tosuch estimates are expected to be made in future periods. Any such revisions could be material, and may materially adversely affectthe Company’s financial condition and results of operations in any future period.
Property and Casualty Operations
American Southern maintains loss reserves representing estimates of amounts necessary for payment of losses and lossadjustment expense (“LAE”), and which are not discounted. IBNR reserves are also maintained for future development. These lossreserves are estimates, based on known facts and circumstances at a given date, of amounts the Company expects to pay on incurredclaims. All balances are reviewed periodically by the Company’s independent consulting actuary. Reserves for LAE are intended tocover the ultimate costs of settling claims, including investigation and defense of any lawsuits resulting from such claims. Lossreserves for reported claims are based on a case-by-case evaluation of the type of claim involved, the circumstances surrounding theclaim, and the policy provisions relating to the type of loss along with anticipated future development. The LAE for claims reportedand claims not reported is based on historical statistical data and anticipated future development. Inflation and other factors whichmay affect claim payments are implicitly reflected in the reserving process through analysis and consideration of cost trends andreviews of historical reserve results.
American Southern establishes reserves for claims based upon: (a) management’s estimate of ultimate liability and claimsadjusters’ evaluations of unpaid claims reported prior to the close of the accounting period, (b) estimates of IBNR claims based onpast experience, and (c) estimates of LAE. If no value is determined to be more probable in estimating a loss after considering allfactors, the Company’s general practice is to reserve at the higher end of the determined reasonable range of loss. The estimatedliability is periodically reviewed and updated, and changes to the estimated liability are recorded in the statement of operations inthe period in which such changes become known.
Life and Health Operations
Bankers Fidelity establishes liabilities for future policy benefits to meet projected future obligations under outstanding policies.These reserves are calculated to satisfy policy and contract obligations as they mature. The amount of reserves for insurance policiesis calculated using assumptions for interest rates, mortality and morbidity rates, expenses, and withdrawals. Reserves are adjustedperiodically based on published actuarial tables with modifications to reflect actual experience. The use of significantly differentassumptions, or actual results that differ significantly from our estimates, could materially adversely affect our liquidity, results ofoperations or financial condition.
See Note 5 of Notes to Consolidated Financial Statements for more information on insurance reserves and policyholder funds.
Reinsurance
The Company’s insurance subsidiaries from time to time purchase reinsurance from unaffiliated insurers and reinsurers toreduce their potential liability on individual risks and to protect against catastrophic losses. In a reinsurance transaction, aninsurance company transfers, or “cedes,” a portion or all of its exposure on insurance policies to a reinsurer. The reinsurer assumesthe exposure in return for a portion of the premiums. The ceding of insurance does not legally discharge the insurer from primaryliability for the full amount of the policies written by it, and the ceding company will incur a loss if the reinsurer fails to meet itsobligations under the reinsurance agreement.
Property and Casualty Operations
American Southern’s basic reinsurance treaties generally cover all claims in excess of specified per occurrence limitations.Limits per occurrence within the reinsurance treaties are as follows: Inland marine and commercial automobile physical damage -$175,000 excess of $100,000 retention; and automobile liability and general liability - excess coverage of $2.0 million lessretentions that may vary from $100,000 to $200,000
6

TABLE OF CONTENTS
depending on the account. American Southern maintains a property catastrophe treaty with a $5.7 million limit excess of $300,000retention. American Southern also issues individual surety bonds with face amounts generally up to $1.5 million, and limited to $5.0million in aggregate per account, that are not reinsured.
Life and Health Operations
Bankers Fidelity has entered into reinsurance contracts ceding the excess of its life retention. Maximum retention by BankersFidelity on any one individual in the case of life insurance policies is $100,000. At December 31, 2019, $11.4 million of the $257.7million of life insurance in force at Bankers Fidelity was reinsured under a mix of coinsurance and yearly renewable termagreements. Certain prior year reinsurance agreements also remain in force although they no longer provide reinsurance for newbusiness.
Bankers Fidelity has also entered into a reinsurance contract ceding excess new Medicare supplement business to General ReLife Corporation. Ceding thresholds are set annually. During 2019, the liability of the reinsurer was 50% of all new Medicaresupplement business issued by the Company on amounts up to a maximum retention of $15.0 million of annualized premium.Accordingly, $8.0 million of the company’s $16.0 million of new annualized Medicare supplement premium was ceded.
Competition
Competition for insurance products is based on many factors including premiums charged, terms and conditions of coverage,service provided, financial ratings assigned by independent rating agencies, claims services, reputation, perceived financial strengthand the experience of the organization in the line of business being written.
Property and Casualty Operations
The businesses in which American Southern engages are highly competitive. The principal areas of competition are pricing andservice. Many competing property and casualty companies, which have been in business longer than American Southern, offer morediversified lines of insurance and have substantially greater financial resources. Management believes, however, that the policies itsells are competitive with those providing similar benefits offered by other insurers doing business in the states in which AmericanSouthern operates. American Southern attempts to develop strong relationships with its agents and, consequently, believes it isbetter positioned for new opportunities and programs with those agents.
Life and Health Operations
The life and health insurance business remains highly competitive and includes a large number of insurance companies, manyof which are new entrants to the business of providing Medicare supplement and other accident and health insurance products.Bankers Fidelity has established itself as a trusted carrier of choice for its customers providing quality and sustainability for nearly65 years.
In order to compete, Bankers Fidelity actively seeks opportunities in niche markets, developing long-term relationships with aselect number of independent marketing organizations. Additionally, Bankers Fidelity actively promotes BankersWorksite, thegroup benefits division, as well as selective association partnerships. It competes with other insurers to attract and retain theallegiance of its independent agents through commission and sales incentive arrangements, accessibility and marketing assistance,lead programs, reputation and market expertise. Bankers Fidelity successfully competes in its chosen markets by establishingrelationships with independent agents and providing proprietary marketing initiatives as well as providing outstanding service topolicyholders.
Ratings
Ratings of insurance companies are not designed for investors and do not constitute recommendations to buy, sell, or hold anysecurity. Ratings are important measures within the insurance industry, and higher ratings should have a favorable impact on theability of a company to compete in the marketplace.
Each year A.M. Best Company, Inc. (“A.M. Best”) publishes Best’s Insurance Reports, which includes assessments and ratingsof all insurance companies. A.M. Best’s ratings, which may be revised or revoked at any time, follow a graduated scale of ratingcategories and notches ranging from A++ (Superior) to F (in liquidation). A.M. Best’s ratings are based on a detailed analysis of thestatutory financial condition and operations of an insurance company compared to the industry in general.
7

TABLE OF CONTENTS
American Southern. American Southern Insurance Company and its wholly-owned subsidiary, American Safety InsuranceCompany, are each, as of the date of this report, rated “A” (Excellent) by A.M. Best.
Bankers Fidelity. Bankers Fidelity Life Insurance Company and its wholly-owned subsidiary, Bankers Fidelity AssuranceCompany, are each, as of the date of this report, rated “A-” (Excellent) by A.M. Best.
Regulation
In common with all domestic insurance companies, the Company’s insurance subsidiaries are subject to regulation andsupervision in the jurisdictions in which they do business. Statutes typically delegate regulatory, supervisory, and administrativepowers to state insurance commissioners. The method of such regulation varies, but regulation relates generally to the licensing ofinsurers and their agents, the nature of and limitations on investments, approval of policy forms, reserve requirements, the standardsof solvency to be met and maintained, deposits of securities for the benefit of policyholders, and periodic examinations of insurersand trade practices, among other things. The Company’s products generally are subject to rate regulation by state insurancecommissions, which require that certain minimum loss ratios be maintained. Certain states also have insurance holding companylaws which require registration and periodic reporting by insurance companies controlled by other corporations licensed to transactbusiness within their respective jurisdictions. The Company’s insurance subsidiaries are subject to such legislation and areregistered as controlled insurers in those jurisdictions in which such registration is required. Such laws vary from state to state, buttypically require periodic disclosure concerning the corporation which controls the registered insurers and all subsidiaries of suchcorporations, as well as prior notice to, or approval by, the state insurance commissioners of intercorporate transfers of assets(including payments of dividends by the insurance subsidiaries in excess of specified amounts) within the holding company system.The Company believes it is in compliance with all such requirements.
Most states require that rate schedules and other information be filed with the state’s insurance regulatory authority, eitherdirectly or through a ratings organization with which the insurer is affiliated. The regulatory authority may disapprove a rate filing ifit determines that the rates are inadequate, excessive, or discriminatory. The Company has historically experienced no significantregulatory resistance to its applications for rate adjustments; however, the Company cannot provide any assurance that it will notreceive any objections to any applications in the future.
A state may require that acceptable securities be deposited for the protection either of policyholders located in those states or ofall policyholders. As of December 31, 2019, the Company was in compliance with all such requirements, and securities with anamortized cost of $10.7 million were on deposit either directly with various state authorities or with third parties pursuant to variouscustodial agreements on behalf of the Company’s insurance subsidiaries.
Virtually all of the states in which the Company’s insurance subsidiaries are licensed to transact business require participationin their respective guaranty funds designed to cover claims against insolvent insurers. Insurers authorized to transact business inthese jurisdictions are generally subject to assessments of up to 4% of annual direct premiums written in that jurisdiction to pay suchclaims, if any. The likelihood and amount of any future assessments cannot be estimated until an insolvency has occurred.
NAIC Ratios
The National Association of Insurance Commissioners (the “NAIC”) was established to, among other things, provideguidelines to assess the financial strength of insurance companies for state regulatory purposes. The NAIC conducts annual reviewsof the financial data of insurance companies primarily through the application of financial ratios prepared on a statutory basis.Annual statements are required to be submitted to state insurance departments to assist them in monitoring insurance companies intheir state and to allow such states to determine a desirable range for each such ratio with which companies should comply.
The NAIC developed the Insurance Regulatory Information System (“IRIS”) to help state regulators identify companies thatmay require regulatory attention. Financial examiners review annual financial statements and the results of key financial ratiosbased on year-end data with the goal of identifying insurers that appear to require immediate regulatory attention. Each ratio has anestablished “usual range” of results. A ratio result falling outside the usual range, however, is not necessarily considered adverse;rather, unusual values are used as part of the regulatory early monitoring system. Furthermore, in some years, it may not be unusualfor financially
8

TABLE OF CONTENTS
sound companies to have several ratios with results outside the usual ranges. Generally, an insurance company may become subjectto regulatory scrutiny or, depending on the company’s financial condition, regulatory action if certain of its key IRIS ratios falloutside the usual ranges and the insurer’s financial condition is trending downward.
For the year ended December 31, 2019, Bankers Fidelity Life Insurance Company had two ratios outside the usual range,primarily as a result of a decline in net income and net change in surplus before considering paid in amounts. However, afterconsidering paid in amounts, the gross change in surplus would result in a value within the usual range. Bankers Fidelity AssuranceCompany had three ratios outside the usual range, primarily as a result of net loss for the year and certain surplus ratios. The net lossat Bankers Fidelity Assurance Company is primarily related to federal income taxes incurred which resulted in a correspondingdecrease in surplus levels for the year. American Southern Insurance Company and American Safety Insurance Company had noIRIS ratios outside the usual ranges. Management does not anticipate regulatory action as a result of the 2019 IRIS ratio results forthe insurance subsidiaries.
Risk-Based Capital
Risk-based capital (“RBC”) is a metric used by ratings agencies and regulators as an early warning tool to identify weaklycapitalized companies for the purpose of initiating further regulatory action. The RBC calculation determines the amount of adjustedcapital needed by a company to avoid regulatory action. “Authorized Control Level Risk-Based Capital” (“ACL”) is calculated, andif a company’s adjusted capital is 200% or lower than ACL, it is subject to regulatory action. At December 31, 2019, the Company’sinsurance subsidiaries’ RBC levels exceeded the required regulatory levels.
Information Technology and Cybersecurity
The Company’s operations rely on the secure processing, storage, and transmission of confidential and personal identifiableinformation within technology platforms. Cybersecurity is a high priority and the Company has made significant investments inorder to prevent, detect, and respond to cyber threats. In recent years, the Company has enhanced intrusion protection and detectiontechnology, infrastructure and application firewalls, and network monitoring. The Company has also installed advanced endpointthreat protection technology and implemented a mandatory security awareness training program for all employees.
The Company has a sophisticated technology environment that supports the replication of data across multiple secure datacenters. It is a comprehensive disaster recovery plan that is continually tested to ensure capabilities to resume business in the eventof a disaster. The Company’s technology environment is managed by an experienced team of professionals who follow an extensiveset of policies and procedures related to data security. Through recurring internal and external audits, controls are regularlyreviewed, tested, and enhanced to ensure best practices. The Company has augmented the information security program through apartnership with a leading global cybersecurity provider to review and implement additional services such as Security EventMonitoring, Advanced Endpoint Threat Detection, Incident Management Retainer Services, and Strategic Advisory Servicesfocused on Chief Information Security Officer (CISO) duties such as counter-threat intelligence.
The information security program also includes a cybersecurity Incident Response Plan (“IRP”) that was established to helpprotect the integrity, availability and confidentiality of information, prevent loss of service, and comply with legal requirements. TheIRP specifies the process for identifying and reporting an incident, initial investigation, risk classification, documentation andcommunication of incidents, responder procedures, incident reporting, and ongoing training. Additionally, the IRP specifies thenotification to directors, officers, and other corporate insiders to not trade the Company’s securities while in possession ofpotentially material nonpublic information about the incident.
The Audit Committee of the Board of Directors has oversight of the Company’s information security program. The Company’ssenior officers, including its Chief Information Officer, are responsible for the operation of the information security program andregularly communicate with the Audit Committee on the state of the program.
The Company also maintains dedicated cyber liability insurance for breach event costs including post breach event remediationcosts; cyber crime coverage (including financial fraud, telecommunications fraud, and phishing attacks); and coverage for systemfailure, bricking loss, and physical damage. The policy also provides coverage for lost revenue due to a damaged reputation from acyber breach.
9

Year Ended December 31, 2019 2018 (Dollars in thousands)Average investments(1) $ 253,467 $ 252,480 Net investment income 8,979 9,549 Average yield on investments 3.5% 3.8%Realized investment gains, net 1,574 5,154
TABLE OF CONTENTS
Investments
Investment income represents a significant portion of the Company’s operating and total income. Insurance companyinvestments are subject to state insurance laws and regulations which limit the concentration and types of investments. Thefollowing table provides information on the Company’s investments as of the dates indicated. December 31, 2019 2018 Amount Percent Amount Percent (Dollars in thousands)Fixed maturities:
U.S. Treasury securities and obligations of U.S. Government agencies andauthorities $ 20,259 7.5% $ 27,422 11.3%
States, municipalities and political subdivisions 11,940 4.5 8,364 3.5 Public utilities 11,449 4.3 13,524 5.6 All other corporate bonds 188,574 70.2 160,884 66.5 Redeemable preferred stock 250 0.1 192 0.1
Total fixed maturities(1) 232,472 86.6 210,386 87.0 Common and non-redeemable preferred stocks(2) 22,922 8.5 20,758 8.6 Policy loans(3) 2,007 0.7 2,085 0.9 Other invested assets(4) 9,960 3.7 7,424 3.0 Real estate 38 0.0 38 0.0 Investments in unconsolidated trusts 1,238 0.5 1,238 0.5
Total investments $ 268,637 100.0% $ 241,929 100.0%
(1) Fixed maturities are carried on the balance sheet at estimated fair value. Certain fixed maturities do not have publicly quoted prices, and are carried atestimated fair value as determined by management. Total adjusted cost of fixed maturities was $219.2 million as of December 31, 2019 and $219.9million as of December 31, 2018.
(2) Equity securities are carried on the balance sheet at estimated fair value. Total adjusted cost of equity securities was $7.2 million as of December 31,2019 and $10.5 million as of December 31, 2018.
(3) Policy loans are valued at unpaid principal balances.(4) Other invested assets are accounted for using the equity method. Total adjusted cost of other invested assets was $9.9 million as of December 31, 2019
and $6.9 million as of December 31, 2018.
Estimated fair values are determined as discussed in Note 1 of Notes to Consolidated Financial Statements.
Results of the Company’s investment portfolio for periods shown were as follows:
(1) Calculated as the average of cash and investment balances (at amortized cost) at the beginning of the year and at the end of each of the succeeding fourquarters.
During 2019, the Company engaged a global investment management firm serving the insurance industry to manage theCompany’s investment portfolios. Management’s recent investment strategy has been a continued focus on quality anddiversification, while improving the overall risk versus return profile of the portfolio.
Employees
The Company and its subsidiaries employed 155 people at December 31, 2019. Of the 155 people employed at December 31,2019, 151 were full-time.
Financial Information by Industry Segment
Each of American Southern and Bankers Fidelity operate with relative autonomy and each company is evaluated on itsindividual performance. American Southern operates in the property and casualty insurance
10
TABLE OF CONTENTS
market, while Bankers Fidelity operates in the life and health insurance market. Each segment derives revenue from the collection ofpremiums, as well as from investment income. Substantially all revenue other than that in the corporate and other segment is fromexternal sources. See Note 15 of Notes to Consolidated Financial Statements.
Available Information
The Company files annual reports on Form 10-K, quarterly reports on Form 10-Q, current reports on Form 8-K, amendments tothose reports and other information with the Securities and Exchange Commission (the “SEC”). The public can read and obtaincopies of those materials by visiting the SEC’s Public Reference Room at 100 F Street, NE, Washington, DC 20549. The public mayobtain information on the operation of the Public Reference Room by calling the SEC at 1-800-SEC-0330. The SEC maintains awebsite that contains reports, proxy and information statements and other information regarding issuers like the Company that fileelectronically with the SEC. The address of the SEC’s web site is www.sec.gov. In addition, as soon as reasonably practicable aftersuch materials are filed with or furnished to the SEC by the Company, the Company makes copies available to the public, free ofcharge, on or through its web site at www.atlam.com. Neither the Company’s website, nor the information appearing on the website,is included, incorporated into, or a part of, this report.
Executive Officers of the Registrant
The table below and the information following the table set forth, for each executive officer of the Company as of December31, 2019, his name, age, positions with the Company and business experience for the past five years, as well as any prior service tothe Company.
Name Age Positions with the CompanyDirector or
Officer SinceHilton H. Howell, Jr. 57 Chairman of the Board, President & CEO 1992J. Ross Franklin 42 Vice President, CFO and Corporate Secretary 2017
Officers are elected annually and serve at the discretion of the board of directors.
Mr. Howell has been President and Chief Executive Officer of the Company since May 1995, and prior thereto served asExecutive Vice President of the Company from October 1992 to May 1995. He has been a Director of the Company since October1992 and effective February 24, 2009, began serving as Chairman of the board of directors. He is also Executive Chairman andChief Executive Officer of Gray Television, Inc.
Mr. Franklin has been Vice President, Chief Financial Officer and Corporate Secretary of the Company since November 2017,and prior thereto served as Interim Chief Financial Officer from August 2017 to November 2017. Since 2000 he has held variousroles of increasing responsibility with Atlantic American and its subsidiaries, previously serving as Vice President, Accounting andTreasurer of Bankers Fidelity since 2009.
Forward-Looking Statements
Certain of the statements contained or incorporated by reference herein are forward-looking statements within the meaning ofthe federal securities laws. These forward-looking statements are made pursuant to the safe harbor provisions of the PrivateSecurities Litigation Reform Act of 1995, Section 27A of the Securities Exchange Act of 1933, and Section 21E of the SecuritiesAct of 1934, and include estimates and assumptions related to, among other things, general economic, competitive, operational andlegislative developments. Forward-looking statements are subject to changes and uncertainties which are, in many instances, beyondthe Company’s control and have been made based upon management’s current expectations and beliefs concerning futuredevelopments and their potential effect upon the Company. There can be no assurance that future developments will be inaccordance with management’s expectations or that the effect of future developments on the Company will be those anticipated bymanagement. Actual results could differ materially from those expected by the Company, depending on the occurrence or outcomeof various factors. These factors include, among others: significant changes in general economic conditions; the possible occurrenceof terrorist attacks; unexpected developments in the health care or insurance industries affecting providers or individuals, includingthe cost or availability of services, or the tax consequences related thereto; disruption to the financial markets; unanticipatedincreases in the rate, number and amounts of claims outstanding; the level of performance of
11
TABLE OF CONTENTS
reinsurance companies under reinsurance contracts and the availability, pricing and adequacy of reinsurance to protect the Companyagainst losses; changes in the stock markets, interest rates or other financial markets, including the potential effect on theCompany’s statutory capital levels; the uncertain effect on the Company of regulatory and market-driven changes in practicesrelating to the payment of incentive compensation to brokers, agents and other producers; the incidence and severity of catastrophes,both natural and man-made; stronger than anticipated competitive activity; unfavorable judicial or legislative developments; thepotential effect of regulatory developments, including those which could increase the Company’s business costs and required capitallevels; the Company’s ability to distribute its products through distribution channels, both current and future; the uncertain effect ofemerging claim and coverage issues; the effect of assessments and other surcharges for guaranty funds and other mandatory poolingarrangements; and risks related to cybersecurity matters, such as breaches of our computer network or the loss of unauthorizedaccess to the data we maintain. Many of such factors are beyond the Company’s ability to control or predict. As a result, theCompany’s actual financial condition and results of operations could differ materially from those expressed in any forward-lookingstatements made by the Company. Undue reliance should not be placed upon forward-looking statements. The Company does notintend to publicly update any forward-looking statements that may be made from time to time by, or on behalf of, the Company.
Item 1A. Risk Factors
As a smaller reporting company as defined by Rule 12b-2 of the Exchange Act and in Item 10(f)(1) of Regulation S-K (a“smaller reporting company”), we have elected to comply with certain scaled disclosure reporting obligations, and therefore are notproviding the information required by this Item.
Item 1B. Unresolved Staff Comments
Not applicable.
Item 2. Properties
Leased Properties. The Company leases space for its principal offices and for some of its insurance operations in an officebuilding located in Atlanta, Georgia, from Delta Life Insurance Company under a lease which continues until either party provideswritten notice of cancellation at least twelve months in advance of the actual termination date. The lease, which commenced onNovember 1, 2007, provides for rent adjustments on every fifth anniversary of the commencement date. Under the current terms ofthe lease, the Company occupies approximately 49,586 square feet of office space. Delta Life Insurance Company, the owner of thebuilding, is controlled by an affiliate of the Company. The terms of the lease are believed by Company management to becomparable to terms which could be obtained by the Company from unrelated parties for comparable rental property.
American Southern leases space for its office in a building located in Atlanta, Georgia. The lease term expires September 30,2026. Under the terms of the lease, American Southern occupies approximately 17,014 square feet.
The Company believes that its current properties are in good condition, and are sufficient for the operations of its business.
Item 3. Legal Proceedings
From time to time, the Company and its subsidiaries are, and expect to continue to be, involved in various claims and lawsuitsarising in the ordinary course of business, both as a liability insurer defending third-party claims brought against insureds and as aninsurer defending coverage claims brought against it. The Company accounts for such exposures through the establishment of lossand loss adjustment expense reserves. We do not expect that the ultimate liability, if any, with respect to such ordinary-course claimslitigation, after consideration of provisions made for probable losses and costs of defense, will be material to the Company’sconsolidated financial condition, although the results of such litigation could be material to the consolidated results of operations forany given period.
Item 4. Mine Safety Disclosures
Not applicable.
12

TABLE OF CONTENTS
PART II
Item 5. Market for Registrant’s Common Equity, Related Shareholder Matters and Issuer Purchases of Equity Securities
The Company’s common stock is quoted on the Nasdaq Global Market (Symbol: AAME). As of March 13, 2020, there were2,436 shareholders of record.
Issuer Purchases of Equity Securities
On October 31, 2016, the Board of Directors of the Company approved a plan that allows for the repurchase of up to 750,000shares of the Company's common stock (the "Repurchase Plan") on the open market or in privately negotiated transactions, asdetermined by an authorized officer of the Company. Any such repurchases can be made from time to time in accordance withapplicable securities laws and other requirements.
Other than pursuant to the Repurchase Plan, no purchases of common stock of the Company were made by or on behalf of theCompany during the periods described below.
The table below sets forth information regarding repurchases by the Company of shares of its common stock on a monthlybasis during the three month period ended December 31, 2019.
Period
TotalNumber of
SharesPurchased
AveragePrice Paidper Share
TotalNumber of
SharesPurchasedas Part ofPublicly
AnnouncedPlans or
Programs
MaximumNumber ofShares thatMay Yet bePurchasedUnder thePlans or
ProgramsOctober 1 – October 31, 2019 — $ — — 325,129 November 1 – November 30, 2019 — — — 325,129 December 1 – December 31, 2019 — — — 325,129
Total — $ — —
Stock Performance Graph
As a smaller reporting company, we have elected to comply with certain scaled disclosure reporting obligations, and thereforeare not providing the information required by this Item.
Item 6. Selected Financial Data
As a smaller reporting company, we have elected to comply with certain scaled disclosure reporting obligations, and thereforeare not providing the information required by this Item.
Item 7. Management’s Discussion and Analysis of Financial Condition and Results of Operations
The following is management’s discussion and analysis of the financial condition and results of operations of AtlanticAmerican Corporation (“Atlantic American” or the “Parent”) and its subsidiaries (collectively with the Parent, the “Company”) forthe years ended December 31, 2019 and 2018. This discussion should be read in conjunction with the consolidated financialstatements and notes thereto included elsewhere herein.
Atlantic American is an insurance holding company whose operations are conducted primarily through its insurancesubsidiaries: American Southern Insurance Company and American Safety Insurance Company (together known as “AmericanSouthern”) in the property and casualty insurance industry, and Bankers Fidelity Life Insurance Company and Bankers FidelityAssurance Company (together known as “Bankers Fidelity”) in the life and health insurance industry. Each operating company ismanaged separately, offers different products and is evaluated on its individual performance.
13
TABLE OF CONTENTS
Critical Accounting Policies
The accounting and reporting policies of the Company are in accordance with accounting principles generally accepted in theUnited States of America (“GAAP”) and, in management’s belief, conform to general practices within the insurance industry. Thefollowing is an explanation of the Company’s accounting policies and the resultant estimates considered most significant bymanagement. These accounting policies inherently require significant judgment and assumptions and actual operating results coulddiffer significantly from management’s estimates determined using these policies. Atlantic American does not expect that changes inthe estimates determined using these policies will have a material effect on the Company’s financial condition or liquidity, althoughchanges could have a material effect on its consolidated results of operations.
Unpaid loss and loss adjustment expenses comprised 31% of the Company’s total liabilities at December 31, 2019. Thisliability includes estimates for: 1) unpaid losses on claims reported prior to December 31, 2019, 2) future development on thosereported claims, 3) unpaid ultimate losses on claims incurred prior to December 31, 2019 but not yet reported and 4) unpaid lossadjustment expenses for reported and unreported claims incurred prior to December 31, 2019. Quantification of loss estimates foreach of these components involves a significant degree of judgment and estimates may vary, materially, from period to period.Estimated unpaid losses on reported claims are developed based on historical experience with similar claims by the Company.Development on reported claims, estimates of unpaid ultimate losses on claims incurred prior to December 31, 2019 but not yetreported, and estimates of unpaid loss adjustment expenses are developed based on the Company’s historical experience, usingactuarial methods to assist in the analysis. The Company’s actuaries develop ranges of estimated development on reported andunreported claims as well as loss adjustment expenses using various methods, including the paid-loss development method, thereported-loss development method, the paid Bornhuetter-Ferguson method and the reported Bornhuetter-Ferguson method. Anysingle method used to estimate ultimate losses has inherent advantages and disadvantages due to the trends and changes affectingthe business environment and the Company’s administrative policies. Further, external factors, such as legislative changes, medicalcost inflation, and others may directly or indirectly impact the relative adequacy of liabilities for unpaid losses and loss adjustmentexpenses. The Company’s approach is to select an estimate of ultimate losses based on comparing results of a variety of reservingmethods, as opposed to total reliance on any single method. Unpaid loss and loss adjustment expenses are reviewed periodically forsignificant lines of business, and when current results differ from the original assumptions used to develop such estimates, theamount of the Company’s recorded liability for unpaid loss and loss adjustment expenses is adjusted. In the event the Company’sactual reported losses in any period are materially in excess of the previously estimated amounts, such losses, to the extentreinsurance coverage does not exist, could have a material adverse effect on the Company’s results of operations.
Future policy benefits comprised 36% of the Company’s total liabilities at December 31, 2019. These liabilities relate primarilyto life insurance products and are based upon assumed future investment yields, mortality rates, and withdrawal rates after givingeffect to possible risks of adverse deviation. The assumed mortality and withdrawal rates are based upon the Company’s experience.If actual results differ from the initial assumptions, the amount of the Company’s recorded liability could require adjustment.
Deferred acquisition costs comprised 10% of the Company’s total assets at December 31, 2019. Deferred acquisition costs arecommissions, premium taxes, and other incremental direct costs of contract acquisition that results directly from and are essential tothe contract transaction(s) and would not have been incurred by the Company had the contract transaction(s) not occurred. Thedeferred amounts are recorded as an asset on the balance sheet and amortized to expense in a systematic manner. Traditional lifeinsurance and long-duration health insurance deferred policy acquisition costs are amortized over the estimated premium-payingperiod of the related policies using assumptions consistent with those used in computing the related liability for policy benefitreserves. Deferred acquisition costs for property and casualty insurance and short-duration health insurance are amortized over theeffective period of the related insurance policies. Deferred policy acquisition costs are expensed when such costs are deemed not tobe recoverable from future premiums (for traditional life and long-duration health insurance) and from the related unearnedpremiums and investment income (for property and casualty and short-duration health insurance). Assessments of recoverability forproperty and casualty and short-duration health insurance are extremely sensitive to the estimates of a subsequent year’s projectedlosses related to the unearned premiums. Projected loss estimates for a current block of business for which unearned premiumsremain to be earned may vary significantly from the indicated losses incurred in any previous calendar year.
14
TABLE OF CONTENTS
Receivables are amounts due from reinsurers, insureds and agents, and any sales of investment securities not yet settled, andcomprised 12% of the Company’s total assets at December 31, 2019. Insured and agent balances are evaluated periodically forcollectibility. Annually, the Company performs an analysis of the creditworthiness of the reinsurers with whom the Companycontracts using various data sources. Failure of reinsurers to meet their obligations due to insolvencies, disputes or otherwise couldresult in uncollectible amounts and losses to the Company. Allowances for uncollectible amounts are established, as and when a losshas been determined probable, against the related receivable. Losses are recognized by the Company when determined on a specificaccount basis and a general provision for loss is made based on the Company’s historical experience.
Cash and investments comprised 75% of the Company’s total assets at December 31, 2019. Substantially all of the Company’sinvestments are in bonds and common and preferred stocks, the values of which are subject to significant market fluctuations. TheCompany carries all fixed maturities, which includes bonds and redeemable preferred stocks, and equity securities, which includescommon and non-redeemable preferred stocks, as available for sale and, accordingly, at their estimated fair values. On occasion, thevalue of a fixed maturity investment may decline to a value below its amortized purchase price and remain at such value for anextended period of time. When a fixed maturity investment’s indicated fair value has declined below its cost basis for a period oftime, the Company evaluates such investment for an other than temporary impairment. The evaluation for an other than temporaryimpairment is a quantitative and qualitative process, which is subject to risks and uncertainties in the determination of whetherdeclines in the fair value of investments are other than temporary. Potential risks and uncertainties include, among other things,changes in general economic conditions, an issuer’s financial condition or near term recovery prospects and the effects of changes ininterest rates. In evaluating a potential impairment, the Company considers, among other factors, management’s intent and ability tohold the securities until price recovery, the nature of the investment and the expectation of prospects for the issuer and its industry,the status of an issuer’s continued satisfaction of its obligations in accordance with their contractual terms, and management’sexpectation as to the issuer’s ability and intent to continue to do so, as well as ratings actions that may affect the issuer’s creditstatus. If an other than temporary impairment is deemed to exist, then the Company will write down the amortized cost basis of theinvestment to its estimated fair value. While any such write down does not impact the reported value of the investment in theCompany’s balance sheet, it is reflected as a realized investment loss in the Company’s net income or other comprehensive income,depending upon the nature of the loss, in the period incurred.
The Company determines the fair values of certain financial instruments based on the fair value hierarchy established inAccounting Standards Codification (“ASC”) 820-10-20, Fair Value Measurements and Disclosures (“ASC 820-10-20”). The fairvalues of fixed maturities and equity securities are largely determined by either independent methods prescribed by the NationalAssociation of Insurance Commissioners, which do not differ materially from nationally quoted market prices, when available, orindependent broker quotations. See Note 2 and Note 3 of Notes to Consolidated Financial Statements with respect to assets andliabilities carried at fair value and information about the inputs used to value those financial instruments, by hierarchy level, inaccordance with ASC 820-10-20.
Deferred income taxes reflect the effect of temporary differences between assets and liabilities that are recognized for financialreporting purposes and the amounts that are recognized for tax purposes. These deferred income taxes are measured by applyingcurrently enacted tax laws and rates. Valuation allowances are recognized to reduce the deferred tax asset to the amount that isdeemed more likely than not to be realized. In assessing the likelihood of realization, management considers estimates of futuretaxable income and tax planning strategies.
Share-based transactions include employee and director share-based compensation awards. The Company determines a grantdate fair value based on the price of our publicly-traded common stock and recognize the related compensation expense, adjustedfor actual forfeitures, in the consolidated statement of operations on a straight-line basis over the requisite service period for theentire award. For non-employee share-based compensation awards, the Company recognizes the impact during the period ofperformance, and the fair value of the award is measured as of the date performance is complete, which is the vesting date.
Refer to Note 1 of “Notes to Consolidated Financial Statements” for details regarding the Company’s significant accountingpolicies.
15
Year Ended December 31, 2019 2018 (In thousands)Revenue Property and Casualty:
American Southern $ 62,402 $ 59,254 Life and Health:
Bankers Fidelity 131,611 127,005 Corporate and Other 4,166 (706)Total revenue $ 198,179 $ 185,553
Income (loss) before income taxes Property and Casualty:
American Southern $ 5,729 $ 5,661 Life and Health:
Bankers Fidelity (3,646) 896 Corporate and Other (2,490) (7,528)Loss before income taxes $ (407) $ (971)
Net loss $ (386) $ (704)
Year Ended December 31, 2019 2018 (In thousands)Reconciliation of Non-GAAP Financial Measure Net loss $ (386) $ (704)Income tax benefit (21) (267)Realized investment gains, net (1,574) (5,154)Unrealized (gains) losses on equity securities, net (5,511) 2,194 Non-GAAP operating loss $ (7,492) $ (3,931)
TABLE OF CONTENTS
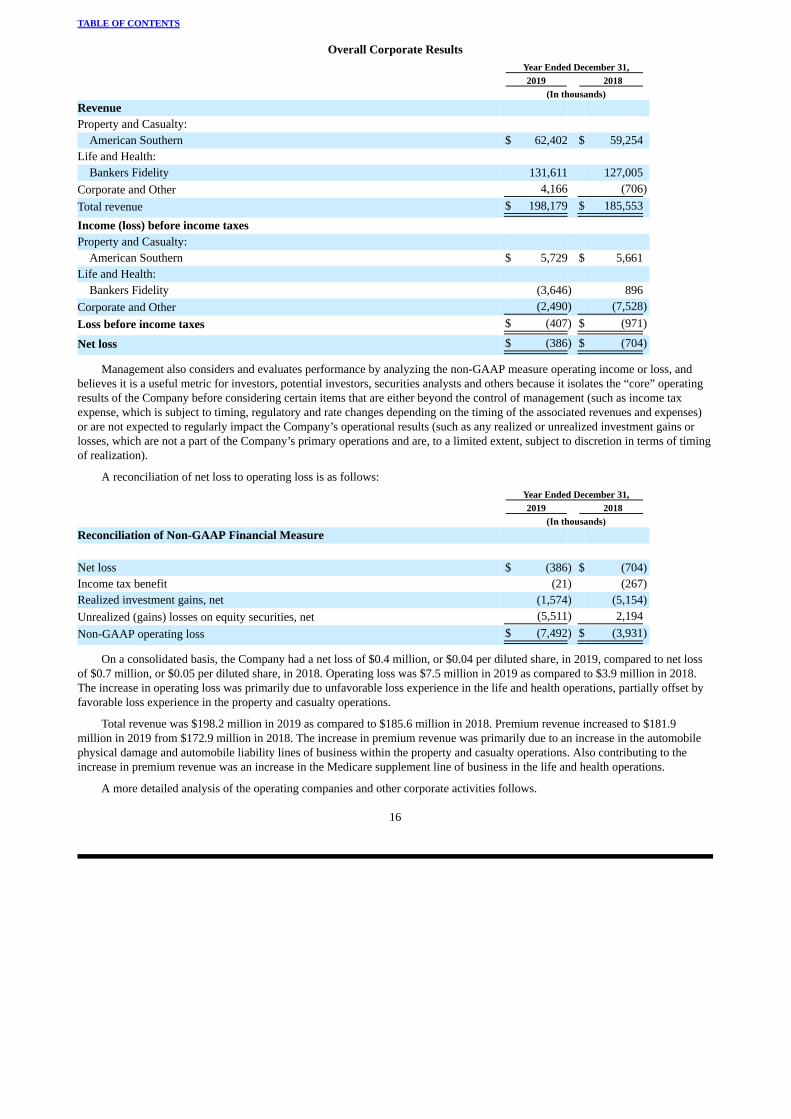
Overall Corporate Results
Management also considers and evaluates performance by analyzing the non-GAAP measure operating income or loss, andbelieves it is a useful metric for investors, potential investors, securities analysts and others because it isolates the “core” operatingresults of the Company before considering certain items that are either beyond the control of management (such as income taxexpense, which is subject to timing, regulatory and rate changes depending on the timing of the associated revenues and expenses)or are not expected to regularly impact the Company’s operational results (such as any realized or unrealized investment gains orlosses, which are not a part of the Company’s primary operations and are, to a limited extent, subject to discretion in terms of timingof realization).
A reconciliation of net loss to operating loss is as follows:
On a consolidated basis, the Company had a net loss of $0.4 million, or $0.04 per diluted share, in 2019, compared to net lossof $0.7 million, or $0.05 per diluted share, in 2018. Operating loss was $7.5 million in 2019 as compared to $3.9 million in 2018.The increase in operating loss was primarily due to unfavorable loss experience in the life and health operations, partially offset byfavorable loss experience in the property and casualty operations.
Total revenue was $198.2 million in 2019 as compared to $185.6 million in 2018. Premium revenue increased to $181.9million in 2019 from $172.9 million in 2018. The increase in premium revenue was primarily due to an increase in the automobilephysical damage and automobile liability lines of business within the property and casualty operations. Also contributing to theincrease in premium revenue was an increase in the Medicare supplement line of business in the life and health operations.
A more detailed analysis of the operating companies and other corporate activities follows.
16

Year Ended December 31, 2019 2018 (Dollars in thousands)Gross written premiums $ 65,848 $ 59,485 Ceded premiums (5,520) (5,075)
Net written premiums $ 60,328 $ 54,410
Net earned premiums $ 58,680 $ 53,807 Net losses and loss adjustment expenses 39,541 38,829 Commissions and underwriting expenses 17,132 14,764
Underwriting income $ 2,007 $ 214
Loss ratio 67.4% 72.2%Expense ratio 29.2 27.4
Combined ratio 96.6% 99.6%
Year Ended December 31, 2019 2018 (In thousands)Automobile liability $ 30,649 $ 28,840 Automobile physical damage 15,309 11,922 General liability 3,309 2,920 Surety 6,319 7,170 Other lines 3,094 2,955
Total $ 58,680 $ 53,807
TABLE OF CONTENTS
UNDERWRITING RESULTS
American Southern
The following table summarizes, for the periods indicated, American Southern’s premiums, losses, expenses and underwritingratios:
Gross written premiums at American Southern increased $6.4 million, or 10.7%, during 2019 as compared to 2018. Theincrease in gross written premiums was primarily attributable to an increase in premiums written in the automobile physical damageand automobile liability lines of business due to increased writings from certain agencies and additional writings from a new agencyrelationship that began in the second half of 2018. Also contributing to the increase in gross written premiums was an increase inpremiums written in the general liability line of business and rate increases on certain programs. Partially offsetting the increase ingross written premiums was a decline in premiums written in the surety line of business as a result of increased competition.
Ceded premiums increased $0.4 million, or 8.8%, during 2019 as compared to 2018. The increase in ceded premiums wasprimarily due to an increase in earned premiums in certain accounts within the automobile physical damage and general liabilitylines of business, which are subject to reinsurance.
The following table summarizes, for the periods indicated, American Southern’s net earned premiums by line of business:
Net earned premiums increased $4.9 million, or 9.1%, during 2019 as compared to 2018. The increase in net earned premiumswas primarily attributable to an increase in automobile physical damage coverage resulting from additional writings from the newagency relationship mentioned previously. Also contributing to the increase in net earned premiums was an increase in premiumsearned in the automobile liability line of business due to rate increases in various programs. Premiums are earned ratably over theirrespective policy terms, and therefore premiums earned in the current year are related to policies written during both the current yearand immediately preceding year.
The performance of an insurance company is often measured by its combined ratio. The combined ratio represents thepercentage of losses, loss adjustment expenses and other expenses that are incurred for each dollar
17

TABLE OF CONTENTS
of premium earned by the company. A combined ratio of under 100% represents an underwriting profit while a combined ratio ofover 100% indicates an underwriting loss. The combined ratio is divided into two components, the loss ratio (the ratio of losses andloss adjustment expenses incurred to premiums earned) and the expense ratio (the ratio of expenses incurred to premiums earned).
Net losses and loss adjustment expenses at American Southern increased $0.7 million, or 1.8%, during 2019 as compared to2018. As a percentage of premiums, net losses and loss adjustment expenses were 67.4% in 2019 as compared to 72.2% in 2018.The decrease in the loss ratio was primarily due to more favorable loss experience in the automobile liability line of business as aresult of additional writings in 2019 and rate increases on existing business.
Commissions and underwriting expenses increased $2.4 million, or 16.0%, during 2019 as compared to 2018. As a percentageof premiums, these expenses were 29.2% in 2019 as compared to 27.4% in 2018. The increase in the expense ratio was primarilydue to American Southern’s use of a variable commission structure with certain agents, which compensates the participating agentsin relation to the loss ratios of the business they write. In 2019, variable commissions at American Southern increased $1.6 millionas compared to 2018 due to improved loss ratios from certain accounts subject to variable commissions.
In establishing reserves, American Southern initially reserves for losses at the higher end of the reasonable range if no othervalue within the range is determined to be more probable. Selection of such an initial loss estimate is an attempt by management togive recognition that initial claims information received generally is not conclusive with respect to legal liability, is generally notcomprehensive with respect to magnitude of loss and generally, based on historical experience, will develop more adversely as timepasses and more information becomes available. However, as a result, American Southern generally experiences reserveredundancies when analyzing the development of prior year losses in a current period. At December 31, 2019, the range of estimatesdeveloped in connection with the loss reserves for American Southern indicated that reserves could be as much as 10.4% lower or asmuch as 4.0% higher. Development from prior years’ reserves has historically reduced the current year loss ratio; however, suchreduction in the current year loss ratio is generally offset by the reserves established in the current year for current period losses.American Southern’s estimated net reserve redundancies for the years ended December 31, 2019 and 2018 were $0.8 million and$0.9 million, respectively. To the extent reserve redundancies vary between years, there is an incremental impact on the results ofoperations of American Southern and the Company. The indicated redundancy in 2019 was $0.1 million less than in 2018. Afterconsidering the impact on contingent commissions and other related accruals, the $0.1 million decrease in the redundancy resultedin an estimated decrease in income from operations before tax of approximately $0.1 million in 2019 as compared to 2018.Management believes that such differences will continue in future periods but is unable to determine if or when incrementalredundancies will increase or decrease, until the underlying losses are ultimately settled.
Contingent commissions, if contractually applicable, are ultimately payable to participating agents based on the underlyingprofitability of a particular insurance contract or a group of insurance contracts, and are periodically evaluated and accrued asearned. In 2019, approximately 44% of American Southern’s earned premium provides for contractual commission arrangementswhich compensate the company’s agents in relation to the loss ratios of the business they write, compared to 47% in 2018. Bystructuring its business in this manner, American Southern provides its agents with an economic incentive to place profitablebusiness with American Southern. In periods in which loss reserves reflect favorable development from prior years’ reserves, thereis generally a highly correlated increase in commission expense also related to the prior year business. Accordingly, favorable lossdevelopment from prior years, while anticipated to continue in future periods, is not an indicator of significant additionalprofitability in the current year.
18

Year Ended December 31, 2019 2018 (Dollars in thousands)Medicare supplement $ 179,180 $ 164,074 Other health products 7,817 7,545 Life insurance 8,509 8,964
Gross earned premiums 195,506 180,583 Ceded premiums (72,261) (61,459)
Net earned premiums 123,245 119,124 Insurance benefits and losses 99,684 93,821 Commissions and underwriting expenses 35,573 32,288
Total expenses 135,257 126,109 Underwriting loss $ (12,012) $ (6,985)
Loss ratio 80.9% 78.8%Expense ratio 28.9 27.1
Combined ratio 109.8% 105.9%
TABLE OF CONTENTS
Bankers Fidelity
The following summarizes, for the periods indicated, Bankers Fidelity’s premiums, losses and expenses:
Net earned premium revenue at Bankers Fidelity increased $4.1 million, or 3.5%, during 2019 as compared to 2018. Grossearned premiums from the Medicare supplement line of business increased $15.1 million, or 9.2%, in 2019 as compared to 2018,due primarily to the implementation of rate increases on renewal business, as appropriate. Other health product premiums increased$0.3 million, or 3.6%, during 2019 as compared to 2018, primarily as a result of new sales of the company’s group health products.Gross earned premiums from the life insurance line of business decreased $0.5 million, or 5.1%, in 2019 from 2018 due to theredemption and settlement of existing policy obligations exceeding the level of new sales activity. Premiums ceded increased $10.8million, or 17.6%, in 2019 from 2018. The increase in ceded premiums was due to an increase in Medicare supplement premiumssubject to the reinsurance agreement.
Benefits and losses increased $5.9 million, or 6.2%, during 2019 as compared to 2018. As a percentage of premiums, benefitsand losses were 80.9% in 2019 as compared to 78.8% in 2018. Throughout 2018 and continuing into 2019, Bankers Fidelityexperienced a higher than expected level of claims in the Medicare supplement line of business which had an unfavorable effect onthe company’s loss patterns and increased the resultant loss ratio.
Commissions and underwriting expenses increased $3.3 million, or 10.2%, during 2019 as compared to 2018. As a percentageof earned premiums, these expenses were 28.9% in 2019 as compared to 27.1% in 2018. The increase in the expense ratio wasprimarily due to a decrease in the net amount of deferred acquisition costs (“DAC”) for the years ending 2019 versus 2018. Thedecrease in the net change in DAC during 2019 is primarily due to a lower volume of new business sales in the Medicaresupplement line of business. Also contributing to the increase in the expense ratio was an increase in expenses related to servicingthe Medicare supplement line of business.
Net Investment Income and Realized Gains (Losses)
Investment income decreased $0.6 million, or 6.0%, in 2019 as compared to 2018. The decrease in investment income wasprimarily attributable to a decrease in the equity in earnings from investments in real estate partnerships of $0.4 million.
The Company had net realized investment gains of $1.6 million in 2019 as compared to net realized investment gains of $5.2million in 2018. The net realized investment gains in 2019 resulted from the disposition of certain of the Company’s investments inequity and fixed maturities. The net realized investment gains in 2018 were primarily attributable to gains of $5.8 million from thesale of property held within the Company’s
19
TABLE OF CONTENTS
real estate partnership investments as well as gains from the sale of a number of the Company’s investments in fixed maturities.Management continually evaluates the Company’s investment portfolio and, as may be determined to be appropriate, makesadjustments for impairments and/or will divest investments. See Note 2 of Notes to Consolidated Financial Statements.
Unrealized Gains (Losses) on Equity Securities
As described in Note 1 of Notes to Consolidated Financial Statements, on January 1, 2018 the Company adopted ASU No.2016-01, which requires, among other things, investments in equity securities to be measured at fair value at the end of the reportingperiod, with any changes in fair value reported in net income during the period, with certain exceptions. As a result of the adoptionof ASU No. 2016-01, the Company recognized net unrealized gains on equity securities still held of $5.5 million and unrealizedlosses on equity securities still held of $2.2 million during the years ended December 31, 2019 and 2018, respectively.
Interest Expense
Interest expense increased $0.1 million, or 4.6%, in 2019 as compared to 2018 due to an increase in the average LondonInterbank Offered Rate (“LIBOR”) during the years ending 2019 and 2018, respectively, as the interest rates on the Company’soutstanding junior subordinated deferrable interest debentures (“Junior Subordinated Debentures”) are directly related to LIBOR.
Income Taxes
The primary differences between the effective tax rate and the federal statutory income tax rate for 2019 resulted frompermanent differences related to meals & entertainment and vested stock grants. Also contributing to differences between theeffective tax rate and the federal statutory income tax rate was the Dividends Received Deduction (“DRD”). The current estimatedDRD is adjusted as underlying factors change and can vary from estimates based on, but not limited to, actual distributions frominvestments as well as the amount of the Company’s taxable income.
The primary differences between the effective tax rate and the federal statutory income tax rate for 2018 resulted fromprovision-to-filed return adjustments that are generally updated at the completion of the third quarter of each fiscal year and were$0.1 million in the year ended December 31, 2018.
Liquidity and Capital Resources
The primary cash needs of the Company are for the payment of claims and operating expenses, maintaining adequate statutorycapital and surplus levels, and meeting debt service requirements. Current and expected patterns of claim frequency and severitymay change from period to period but generally are expected to continue within historical ranges. The Company’s primary sourcesof cash are written premiums, investment income and proceeds from the sale and maturity of its invested assets. The Companybelieves that, within each operating company, total invested assets will be sufficient to satisfy all policy liabilities and that cashinflows from investment earnings, future premium receipts and reinsurance collections will be adequate to fund the payment ofclaims and expenses as needed.
Cash flows at the Parent are derived from dividends, management fees, and tax-sharing payments, as described below, from thesubsidiaries. The principal cash needs of the Parent are for the payment of operating expenses, the acquisition of capital assets anddebt service requirements, as well as the repurchase of shares and payments of any dividends as may be authorized and approved bythe Company’s board of directors from time to time. At December 31, 2019, the Parent had approximately $5.3 million ofunrestricted cash and investments.
Dividend payments to a parent corporation by its wholly owned insurance subsidiaries are subject to annual limitations and arerestricted to 10% of statutory surplus or statutory earnings before recognizing realized investment gains of the individual insurancesubsidiaries. At December 31, 2019, the Parent’s insurance subsidiaries had an aggregate statutory surplus of $81.4 million.Dividends were paid to Atlantic American by its subsidiaries totaling $4.8 million in each of the years ended in 2019 and 2018.
The Parent provides certain administrative, purchasing and other services to each of its subsidiaries. The amount charged toand paid by the subsidiaries for these services was $7.2 million and $8.0 million in 2019
20

TABLE OF CONTENTS
and 2018, respectively. In addition, the Parent has a formal tax-sharing agreement with each of its insurance subsidiaries. A net totalof $3.3 million and $3.4 million were paid to the Parent under the tax sharing agreement in 2019 and 2018, respectively.
The Company has two statutory trusts which exist for the exclusive purpose of issuing trust preferred securities representingundivided beneficial interests in the assets of the trusts and investing the gross proceeds of the trust preferred securities in JuniorSubordinated Debentures. The outstanding $18.0 million and $15.7 million of Junior Subordinated Debentures mature on December4, 2032 and May 15, 2033, respectively, are callable quarterly, in whole or in part, only at the option of the Company, and have aninterest rate of three-month LIBOR plus an applicable margin. The margin ranges from 4.00% to 4.10%. At December 31, 2019, theeffective interest rate was 5.96%. The obligations of the Company with respect to the issuances of the trust preferred securitiesrepresent a full and unconditional guarantee by the Parent of each trust’s obligations with respect to the trust preferred securities.Subject to certain exceptions and limitations, the Company may elect from time to time to defer Junior Subordinated Debentureinterest payments, which would result in a deferral of distribution payments on the related trust preferred securities. The Companyhas not made such an election.
The Company intends to pay its obligations under the Junior Subordinated Debentures using existing cash balances, dividendand tax-sharing payments from the operating subsidiaries, or from potential future financing arrangements.
At December 31, 2019, the Company had 55,000 shares of Series D preferred stock (“Series D Preferred Stock”) outstanding.All of the shares of Series D Preferred Stock are held by an affiliate of the Company’s controlling shareholder. The outstandingshares of Series D Preferred Stock have a redemption value of $100 per share; accrue annual dividends at a rate of $7.25 per share(payable in cash or shares of the Company’s common stock at the option of the board of directors of the Company) and arecumulative. In certain circumstances, the shares of the Series D Preferred Stock may be convertible into an aggregate ofapproximately 1,378,000 shares of the Company’s common stock, subject to certain adjustments and provided that such adjustmentsdo not result in the Company issuing more than approximately 2,703,000 shares of common stock without obtaining priorshareholder approval; and are redeemable solely at the Company’s option. The Series D Preferred Stock is not currently convertible.The Company had accrued, but unpaid, dividends, on the Series D Preferred Stock of $17,722 at December 31, 2019 and 2018.During each of 2019 and 2018, the Company paid Series D Preferred Stock dividends of $0.4 million.
Cash and cash equivalents increased from $12.6 million at December 31, 2018 to $12.9 million at December 31, 2019. Theincrease in cash and cash equivalents during 2019 was primarily attributable to $3.1 million of net investment sales and maturity ofsecurities exceeding purchases of securities. Partially offsetting the increase in cash and cash equivalents was the net cash usedoperations of $1.8 million during 2019. Also partially offsetting the increase were dividends paid on the Company’s common stockand Series D Preferred Stock of $0.8 million, and the net acquisition of treasury stock for $0.2 million.
The Company believes that existing cash balances as well as the dividends, fees, and tax-sharing payments it expects to receivefrom its subsidiaries and, if needed, additional borrowings from financial institutions, will enable the Company to meet its liquidityrequirements for the foreseeable future. Management is not aware of any current recommendations by regulatory authorities, which,if implemented, would have a material adverse effect on the Company’s liquidity, capital resources or operations.
Coronavirus Disease 2019
On January 30, 2020, the World Health Organization declared that the recent coronavirus disease 2019 (“COVID-19”) outbreakwas a global health emergency. On March 11, 2020, the World Health Organization raised the COVID-19 outbreak to “pandemic”status. The spread of COVID-19 may negatively impact the Company’s business, investments and results of operations. See Note 17of Notes to Consolidated Financial Statements for more information.
New Accounting Pronouncements
See “Recently Issued Accounting Standards” in Note 1 of Notes to Consolidated Financial Statements.
21
TABLE OF CONTENTS
Impact of Inflation
Insurance premiums are established before the amount of losses and loss adjustment expenses, or the extent to which inflationmay affect such losses and expenses, are known. Consequently, the Company attempts, in establishing its premiums, to anticipatethe potential impact of inflation. If, for competitive reasons, premiums cannot be increased to anticipate inflation, this cost would beabsorbed by the Company. Inflation also affects the rate of investment return on the Company’s investment portfolio with acorresponding effect on investment income. To date, inflation has not had a material effect on the Company’s results of operations inany of the periods presented.
Off-Balance Sheet Arrangements
In the normal course of business, the Company has structured borrowings that, in accordance with accounting principlesgenerally accepted in the United States of America, are recorded on the Company’s balance sheet at an amount that differs from theultimate contractual obligation. See Note 8 of Notes to Consolidated Financial Statements.
Contractual Obligations
As a smaller reporting company, we have elected to comply with certain scaled disclosure reporting obligations, and thereforeare not providing the table of contractual obligations required by this Item.
Item 7A. Quantitative and Qualitative Disclosures About Market Risk
As a smaller reporting company, we have elected to comply with certain scaled disclosure reporting obligations, and thereforeare not providing the information required by this Item.
22

TABLE OF CONTENTS
Item 8. Financial Statements and Supplementary Data
INDEX TO FINANCIAL STATEMENTS PageATLANTIC AMERICAN CORPORATION Report of Independent Registered Public Accounting Firm 24 Consolidated Balance Sheets as of December 31, 2019 and 2018 25 Consolidated Statements of Operations for the years ended December 31, 2019 and 2018 26 Consolidated Statements of Comprehensive Income (Loss) for the years ended December 31, 2019 and 2018 27 Consolidated Statements of Shareholders’ Equity for the years ended December 31, 2019 and 2018 28 Consolidated Statements of Cash Flows for the years ended December 31, 2019 and 2018 29 Notes to Consolidated Financial Statements 30
23
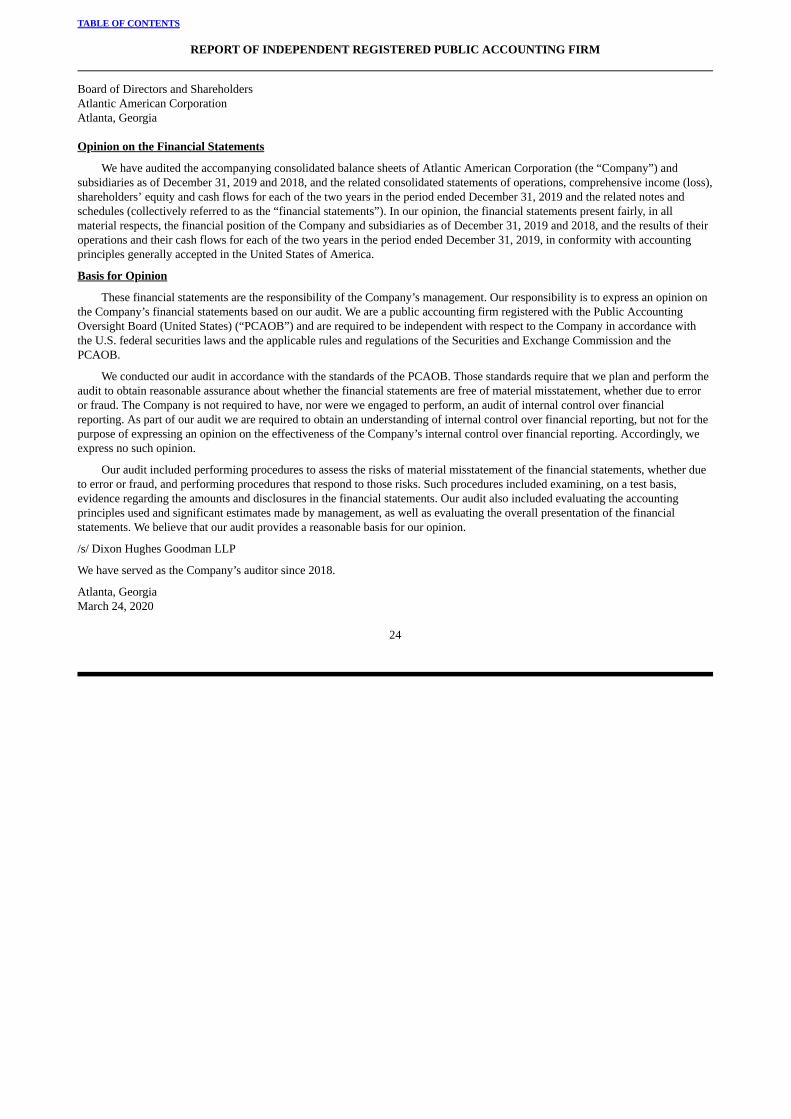
TABLE OF CONTENTS
REPORT OF INDEPENDENT REGISTERED PUBLIC ACCOUNTING FIRM
Board of Directors and ShareholdersAtlantic American CorporationAtlanta, Georgia
Opinion on the Financial Statements
We have audited the accompanying consolidated balance sheets of Atlantic American Corporation (the “Company”) andsubsidiaries as of December 31, 2019 and 2018, and the related consolidated statements of operations, comprehensive income (loss),shareholders’ equity and cash flows for each of the two years in the period ended December 31, 2019 and the related notes andschedules (collectively referred to as the “financial statements”). In our opinion, the financial statements present fairly, in allmaterial respects, the financial position of the Company and subsidiaries as of December 31, 2019 and 2018, and the results of theiroperations and their cash flows for each of the two years in the period ended December 31, 2019, in conformity with accountingprinciples generally accepted in the United States of America.
Basis for Opinion
These financial statements are the responsibility of the Company’s management. Our responsibility is to express an opinion onthe Company’s financial statements based on our audit. We are a public accounting firm registered with the Public AccountingOversight Board (United States) (“PCAOB”) and are required to be independent with respect to the Company in accordance withthe U.S. federal securities laws and the applicable rules and regulations of the Securities and Exchange Commission and thePCAOB.
We conducted our audit in accordance with the standards of the PCAOB. Those standards require that we plan and perform theaudit to obtain reasonable assurance about whether the financial statements are free of material misstatement, whether due to erroror fraud. The Company is not required to have, nor were we engaged to perform, an audit of internal control over financialreporting. As part of our audit we are required to obtain an understanding of internal control over financial reporting, but not for thepurpose of expressing an opinion on the effectiveness of the Company’s internal control over financial reporting. Accordingly, weexpress no such opinion.
Our audit included performing procedures to assess the risks of material misstatement of the financial statements, whether dueto error or fraud, and performing procedures that respond to those risks. Such procedures included examining, on a test basis,evidence regarding the amounts and disclosures in the financial statements. Our audit also included evaluating the accountingprinciples used and significant estimates made by management, as well as evaluating the overall presentation of the financialstatements. We believe that our audit provides a reasonable basis for our opinion.
/s/ Dixon Hughes Goodman LLP
We have served as the Company’s auditor since 2018.
Atlanta, GeorgiaMarch 24, 2020
24
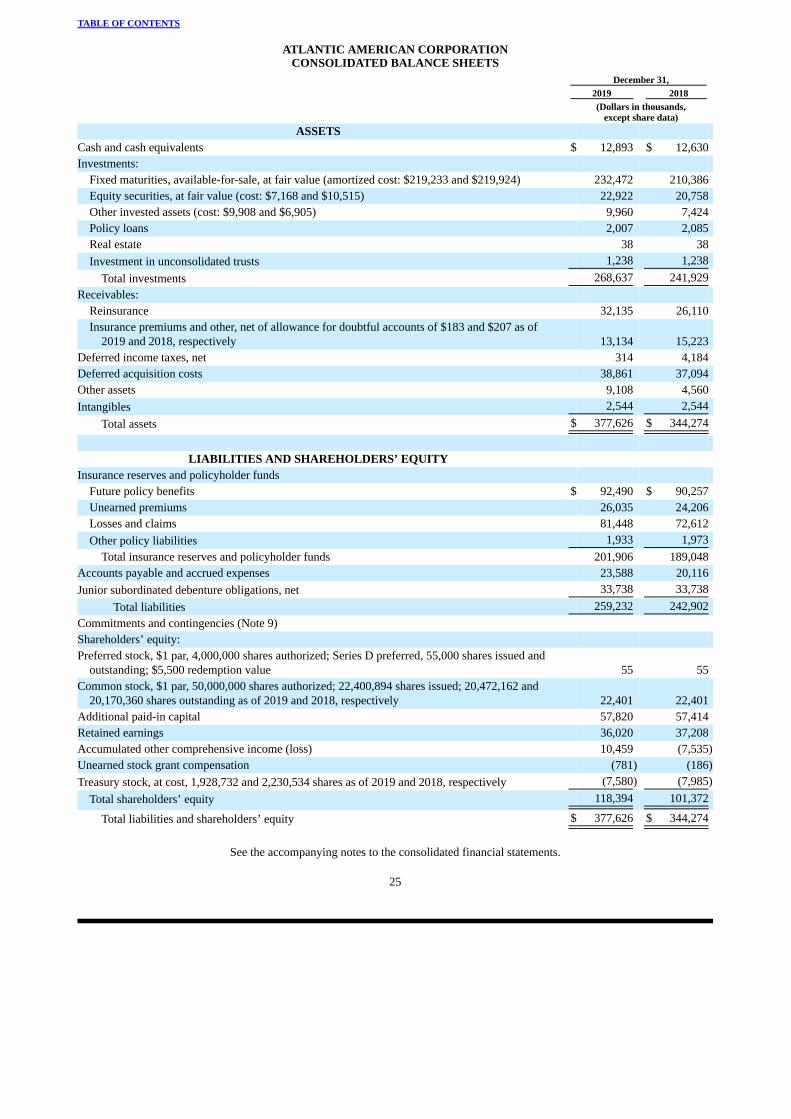
TABLE OF CONTENTS
ATLANTIC AMERICAN CORPORATIONCONSOLIDATED BALANCE SHEETS
December 31, 2019 2018
(Dollars in thousands,
except share data)ASSETS
Cash and cash equivalents $ 12,893 $ 12,630 Investments:
Fixed maturities, available-for-sale, at fair value (amortized cost: $219,233 and $219,924) 232,472 210,386 Equity securities, at fair value (cost: $7,168 and $10,515) 22,922 20,758 Other invested assets (cost: $9,908 and $6,905) 9,960 7,424 Policy loans 2,007 2,085 Real estate 38 38 Investment in unconsolidated trusts 1,238 1,238
Total investments 268,637 241,929 Receivables:
Reinsurance 32,135 26,110 Insurance premiums and other, net of allowance for doubtful accounts of $183 and $207 as of
2019 and 2018, respectively 13,134 15,223 Deferred income taxes, net 314 4,184 Deferred acquisition costs 38,861 37,094 Other assets 9,108 4,560 Intangibles 2,544 2,544
Total assets $ 377,626 $ 344,274
LIABILITIES AND SHAREHOLDERS’ EQUITY
Insurance reserves and policyholder funds Future policy benefits $ 92,490 $ 90,257 Unearned premiums 26,035 24,206 Losses and claims 81,448 72,612 Other policy liabilities 1,933 1,973
Total insurance reserves and policyholder funds 201,906 189,048 Accounts payable and accrued expenses 23,588 20,116 Junior subordinated debenture obligations, net 33,738 33,738
Total liabilities 259,232 242,902 Commitments and contingencies (Note 9) Shareholders’ equity: Preferred stock, $1 par, 4,000,000 shares authorized; Series D preferred, 55,000 shares issued and
outstanding; $5,500 redemption value 55 55 Common stock, $1 par, 50,000,000 shares authorized; 22,400,894 shares issued; 20,472,162 and
20,170,360 shares outstanding as of 2019 and 2018, respectively 22,401 22,401 Additional paid-in capital 57,820 57,414 Retained earnings 36,020 37,208 Accumulated other comprehensive income (loss) 10,459 (7,535)Unearned stock grant compensation (781) (186)Treasury stock, at cost, 1,928,732 and 2,230,534 shares as of 2019 and 2018, respectively (7,580) (7,985)
Total shareholders’ equity 118,394 101,372
Total liabilities and shareholders’ equity $ 377,626 $ 344,274
See the accompanying notes to the consolidated financial statements.
25
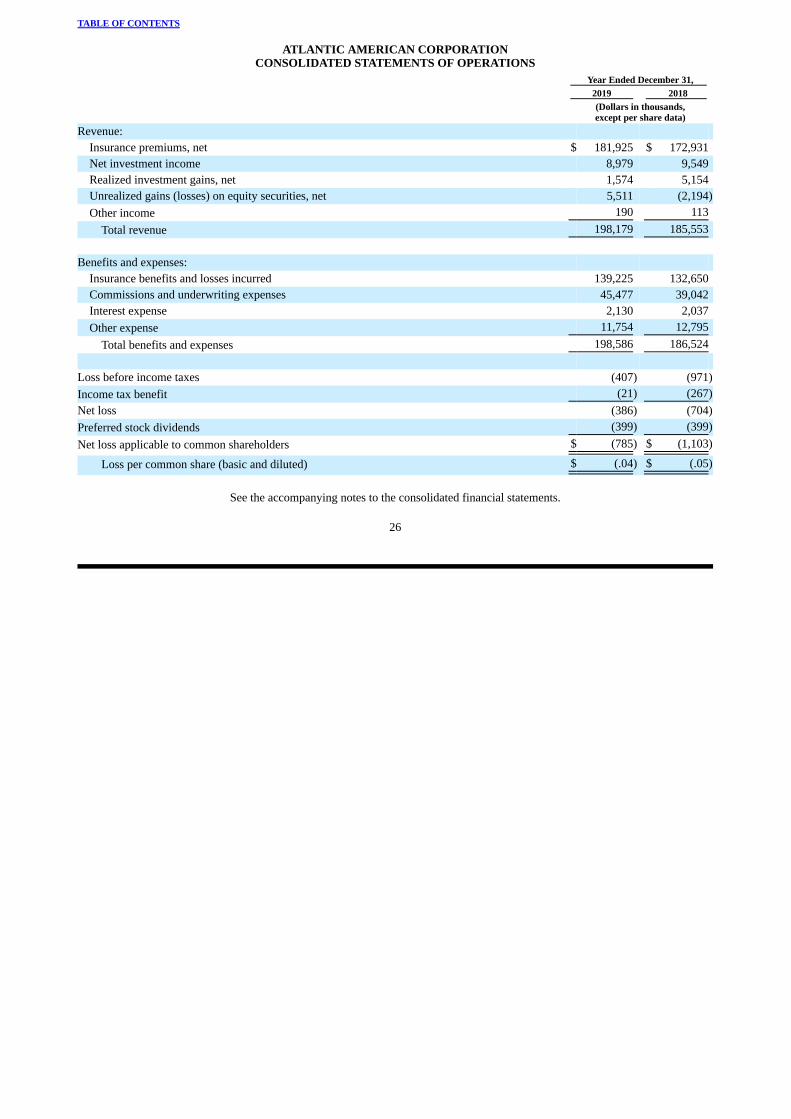
TABLE OF CONTENTS
ATLANTIC AMERICAN CORPORATIONCONSOLIDATED STATEMENTS OF OPERATIONS
Year Ended December 31, 2019 2018
(Dollars in thousands,except per share data)
Revenue: Insurance premiums, net $ 181,925 $ 172,931 Net investment income 8,979 9,549 Realized investment gains, net 1,574 5,154 Unrealized gains (losses) on equity securities, net 5,511 (2,194)Other income 190 113
Total revenue 198,179 185,553 Benefits and expenses:
Insurance benefits and losses incurred 139,225 132,650 Commissions and underwriting expenses 45,477 39,042 Interest expense 2,130 2,037 Other expense 11,754 12,795
Total benefits and expenses 198,586 186,524 Loss before income taxes (407) (971)Income tax benefit (21) (267)Net loss (386) (704)Preferred stock dividends (399) (399)Net loss applicable to common shareholders $ (785) $ (1,103)
Loss per common share (basic and diluted) $ (.04) $ (.05)
See the accompanying notes to the consolidated financial statements.
26
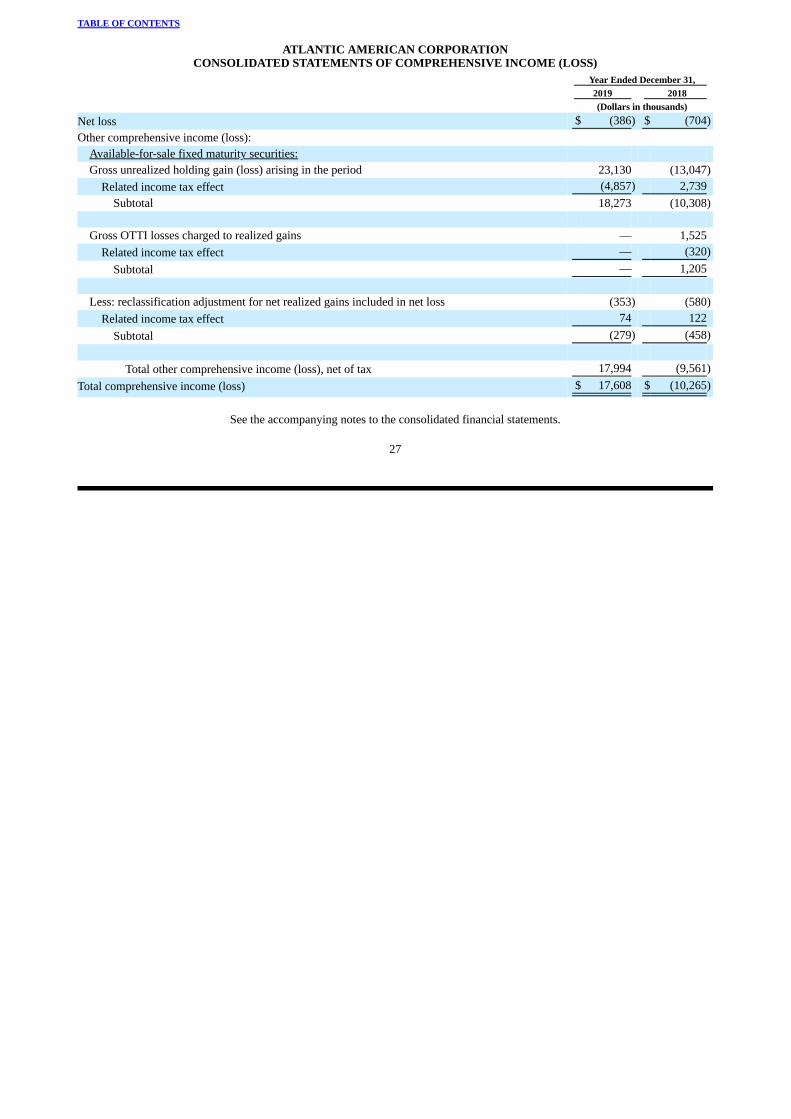
TABLE OF CONTENTS
ATLANTIC AMERICAN CORPORATIONCONSOLIDATED STATEMENTS OF COMPREHENSIVE INCOME (LOSS)
Year Ended December 31, 2019 2018 (Dollars in thousands)Net loss $ (386) $ (704)Other comprehensive income (loss):
Available-for-sale fixed maturity securities: Gross unrealized holding gain (loss) arising in the period 23,130 (13,047)
Related income tax effect (4,857) 2,739 Subtotal 18,273 (10,308)
Gross OTTI losses charged to realized gains — 1,525
Related income tax effect — (320)Subtotal — 1,205
Less: reclassification adjustment for net realized gains included in net loss (353) (580)
Related income tax effect 74 122 Subtotal (279) (458)
Total other comprehensive income (loss), net of tax 17,994 (9,561)
Total comprehensive income (loss) $ 17,608 $ (10,265)
See the accompanying notes to the consolidated financial statements.
27
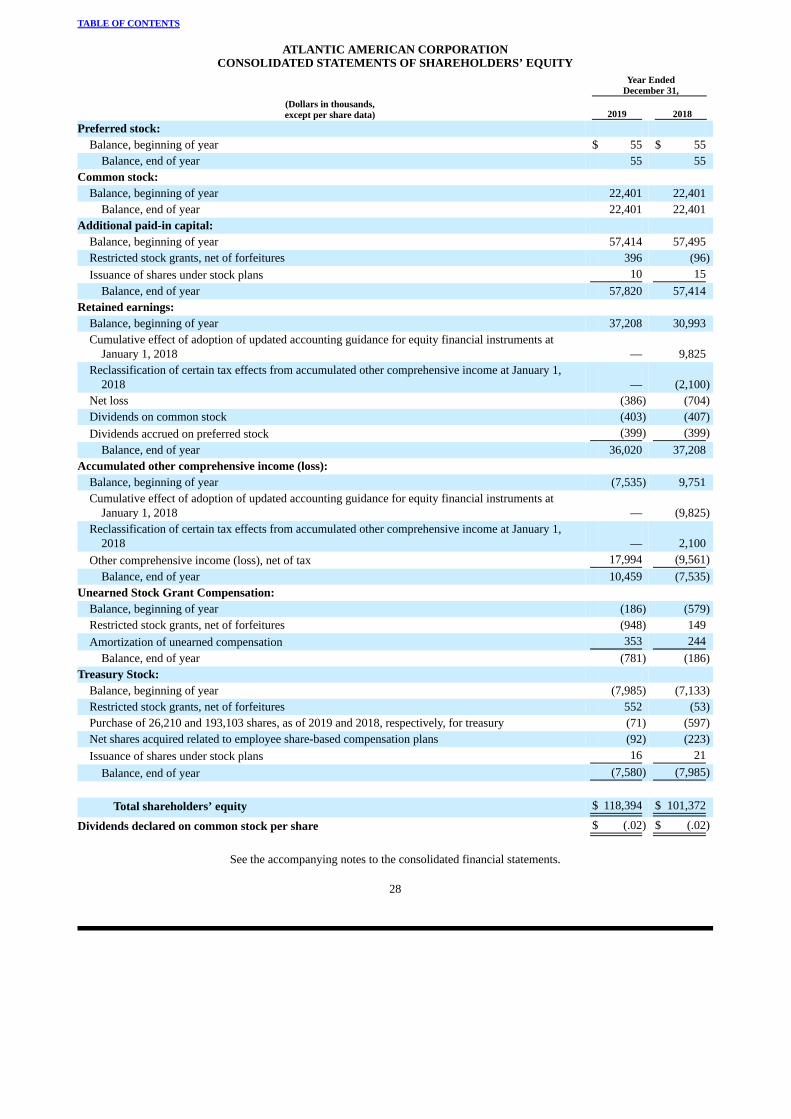
TABLE OF CONTENTS
ATLANTIC AMERICAN CORPORATIONCONSOLIDATED STATEMENTS OF SHAREHOLDERS’ EQUITY
Year Ended
December 31,(Dollars in thousands,except per share data) 2019 2018
Preferred stock: Balance, beginning of year $ 55 $ 55
Balance, end of year 55 55 Common stock:
Balance, beginning of year 22,401 22,401 Balance, end of year 22,401 22,401
Additional paid-in capital: Balance, beginning of year 57,414 57,495 Restricted stock grants, net of forfeitures 396 (96)Issuance of shares under stock plans 10 15
Balance, end of year 57,820 57,414 Retained earnings:
Balance, beginning of year 37,208 30,993 Cumulative effect of adoption of updated accounting guidance for equity financial instruments at
January 1, 2018 — 9,825 Reclassification of certain tax effects from accumulated other comprehensive income at January 1,
2018 — (2,100)Net loss (386) (704)Dividends on common stock (403) (407)Dividends accrued on preferred stock (399) (399)
Balance, end of year 36,020 37,208 Accumulated other comprehensive income (loss):
Balance, beginning of year (7,535) 9,751 Cumulative effect of adoption of updated accounting guidance for equity financial instruments at
January 1, 2018 — (9,825)Reclassification of certain tax effects from accumulated other comprehensive income at January 1,
2018 — 2,100 Other comprehensive income (loss), net of tax 17,994 (9,561)
Balance, end of year 10,459 (7,535)Unearned Stock Grant Compensation:
Balance, beginning of year (186) (579)Restricted stock grants, net of forfeitures (948) 149 Amortization of unearned compensation 353 244
Balance, end of year (781) (186)Treasury Stock:
Balance, beginning of year (7,985) (7,133)Restricted stock grants, net of forfeitures 552 (53)Purchase of 26,210 and 193,103 shares, as of 2019 and 2018, respectively, for treasury (71) (597)Net shares acquired related to employee share-based compensation plans (92) (223)Issuance of shares under stock plans 16 21
Balance, end of year (7,580) (7,985)
Total shareholders’ equity $ 118,394 $ 101,372
Dividends declared on common stock per share $ (.02) $ (.02)
See the accompanying notes to the consolidated financial statements.
28
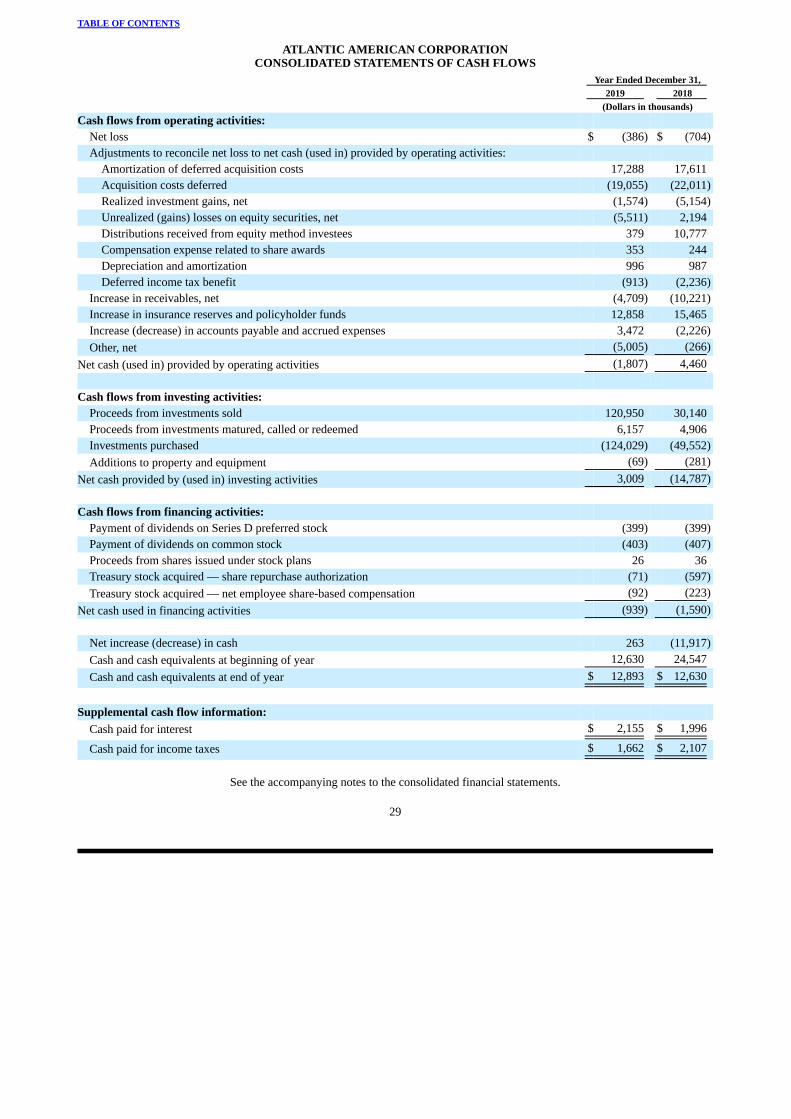
TABLE OF CONTENTS
ATLANTIC AMERICAN CORPORATIONCONSOLIDATED STATEMENTS OF CASH FLOWS
Year Ended December 31, 2019 2018 (Dollars in thousands)Cash flows from operating activities:
Net loss $ (386) $ (704)Adjustments to reconcile net loss to net cash (used in) provided by operating activities:
Amortization of deferred acquisition costs 17,288 17,611 Acquisition costs deferred (19,055) (22,011)Realized investment gains, net (1,574) (5,154)Unrealized (gains) losses on equity securities, net (5,511) 2,194 Distributions received from equity method investees 379 10,777 Compensation expense related to share awards 353 244 Depreciation and amortization 996 987 Deferred income tax benefit (913) (2,236)
Increase in receivables, net (4,709) (10,221)Increase in insurance reserves and policyholder funds 12,858 15,465 Increase (decrease) in accounts payable and accrued expenses 3,472 (2,226)Other, net (5,005) (266)
Net cash (used in) provided by operating activities (1,807) 4,460 Cash flows from investing activities:
Proceeds from investments sold 120,950 30,140 Proceeds from investments matured, called or redeemed 6,157 4,906 Investments purchased (124,029) (49,552)Additions to property and equipment (69) (281)
Net cash provided by (used in) investing activities 3,009 (14,787) Cash flows from financing activities:
Payment of dividends on Series D preferred stock (399) (399)Payment of dividends on common stock (403) (407)Proceeds from shares issued under stock plans 26 36 Treasury stock acquired — share repurchase authorization (71) (597)Treasury stock acquired — net employee share-based compensation (92) (223)
Net cash used in financing activities (939) (1,590)
Net increase (decrease) in cash 263 (11,917)Cash and cash equivalents at beginning of year 12,630 24,547 Cash and cash equivalents at end of year $ 12,893 $ 12,630
Supplemental cash flow information:
Cash paid for interest $ 2,155 $ 1,996
Cash paid for income taxes $ 1,662 $ 2,107
See the accompanying notes to the consolidated financial statements.
29

TABLE OF CONTENTS
NOTES TO CONSOLIDATED FINANCIAL STATEMENTS(Dollars in thousands, except per share amounts)
Note 1. Summary of Significant Accounting Policies
Principles of Consolidation
The accompanying consolidated financial statements have been prepared in conformity with accounting principles generallyaccepted in the United States of America (“GAAP”) which, for insurance companies, differ in some respects from the statutoryaccounting practices prescribed or permitted by regulatory authorities. These financial statements include the accounts of AtlanticAmerican Corporation (“Atlantic American” or the “Parent”) and its subsidiaries (collectively with the Parent, the “Company”). Allsignificant intercompany accounts and transactions have been eliminated in consolidation. Operating results achieved in anyhistorical period are not necessarily indicative of results to be expected in any future period.
At December 31, 2019, the Parent owned four insurance subsidiaries, Bankers Fidelity Life Insurance Company and its wholly-owned subsidiary, Bankers Fidelity Assurance Company (together known as “Bankers Fidelity”), and American Southern InsuranceCompany and its wholly-owned subsidiary, American Safety Insurance Company (together known as “American Southern”), inaddition to one non-insurance subsidiary, xCalibre Risk Services, Inc. The Parent has issued a guarantee of all liabilities of BankersFidelity.
Premium Revenue and Cost Recognition
Life insurance premiums are recognized as revenue when due; accident and health insurance premiums are recognized asrevenue over the premium paying period and property and casualty insurance premiums are recognized as revenue over the periodof the contract in proportion to the amount of insurance protection provided. Losses, benefits and expenses are accrued as incurredand are associated with premiums as they are earned so as to result in recognition of profits over the lives of the contracts. Fortraditional life insurance and long-duration health insurance, this association is accomplished by the provision of a future policybenefits reserve and the deferral and subsequent amortization of the costs of acquiring business, which are referred to as “deferredpolicy acquisition costs” (principally commissions, premium taxes, and other incremental direct costs of issuing policies). Deferredpolicy acquisition costs (“DAC”) are amortized over the estimated premium-paying period of the related policies using assumptionsconsistent with those used in computing the policy benefits reserve. The Company provides for insurance benefits and losses onaccident, health, and property-casualty claims based upon estimates of projected ultimate losses. DAC for property and casualtyinsurance and short-duration health insurance is amortized over the effective period of the related insurance policies. Contingentcommissions, if contractually applicable, are ultimately payable to agents based on the underlying profitability of a particularinsurance contract or a group of insurance contracts, and are periodically evaluated and accrued as earned. In periods in whichrevisions are made to the estimated loss reserves related to the particular insurance contract or group of insurance contracts subjectto such commissions, corresponding adjustments are also made to the related accruals. DAC is expensed when such costs aredeemed not to be recoverable from future premiums (for traditional life and long-duration health insurance) and from the relatedunearned premiums and investment income (for property and casualty and short-duration health insurance).
Intangibles
Intangibles consist of goodwill and other indefinite-lived intangible assets. Goodwill represents the excess of cost over the fairvalue of net assets acquired and is not amortized. Other indefinite-lived intangibles represent the value of licenses and are notamortized. The Company periodically reviews its goodwill and other indefinite-lived intangibles to determine if any adverseconditions exist that could indicate impairment. Conditions that could trigger impairment include, but are not limited to, asignificant change in business climate that could affect the value of the related asset, an adverse action, or an assessment by aregulator. No impairment of the Company’s recorded intangibles was identified during any of the periods presented.
Investments
The Company’s investments in fixed maturities, which include bonds and redeemable preferred stocks, are classified as“available-for-sale” and, accordingly, are carried at fair value with the after-tax difference from amortized cost, as adjusted ifapplicable, reflected in shareholders’ equity as a component of accumulated other
30

TABLE OF CONTENTS
comprehensive income or loss. Effective January 1, 2018, upon adoption of new accounting guidance, the Company’s equitysecurities, which include common and non-redeemable preferred stocks, are carried at fair value with changes in fair value reportedin net income. Prior to January 1, 2018, changes in fair value were reported in other comprehensive income. The fair values of fixedmaturities and equity securities are largely determined by either independent methods prescribed by the NAIC, which do not differmaterially from publicly quoted market prices, when available, or independent broker quotations. As of December 31, 2018, theCompany owned certain fixed maturities in the amount of $1,066, with valuations that were derived from techniques in which oneor more of the significant inputs are unobservable. As of December 31, 2019, all fixed maturities were valued using publicly quotedmarket prices or techniques with observable inputs. Values that are not determined using quoted market prices inherently involve agreater degree of judgment and uncertainty and therefore ultimately greater price volatility than the value of securities with publiclyquoted market prices. Policy loans are carried at unpaid principal balance and real estate is carried at historical cost. Other investedassets are comprised of investments in limited partnerships, limited liability companies, and real estate joint ventures, and areaccounted for using the equity method. If the value of a fixed maturity security or other invested asset declines below its cost oramortized cost, as applicable, and the decline is considered to be other than temporary, a realized loss is recorded to reduce thecarrying value of the investment to its estimated fair value, which becomes the new cost basis.
Premiums and discounts related to investments are amortized or accreted over the life of the related investment as anadjustment to yield using the effective interest method. Dividends and interest income are recognized when earned or declared. Thecost of securities sold is based on specific identification. Unrealized gains (losses) in the value of fixed maturities are accounted foras a direct increase (decrease) in accumulated other comprehensive income in shareholders’ equity, net of deferred tax and,accordingly, have no effect on net income.
Income Taxes
Deferred income taxes represent the expected future tax consequences when the reported amounts of assets and liabilities arerecovered or paid. They arise from differences between the financial reporting and tax basis of assets and liabilities and are adjustedfor changes in tax laws and tax rates as those changes are enacted. The provision for income taxes represents the total amount ofincome taxes due related to the current year, plus the change in deferred income taxes during the year. A valuation allowance isrecognized if, based on management’s assessment of the relevant facts, it is more likely than not that some portion of a deferred taxasset will not be realized.
Earnings Per Common Share
Basic earnings per common share are based on the weighted average number of common and participating shares outstandingduring the relevant period. Diluted earnings per common share are based on the weighted average number of common andparticipating shares outstanding during the relevant period, plus options outstanding, if applicable, using the treasury stock methodand the assumed conversion of the Series D preferred stock, if dilutive. Unless otherwise indicated, earnings per common shareamounts are presented on a diluted basis.
Cash and Cash Equivalents
Cash and cash equivalents consist of cash on hand and investments in short-term, highly liquid securities with originalmaturities of three months or less from date of purchase.
Reinsurance
The Company enters into reinsurance agreements with other companies in the normal course of business. For each reinsuranceagreement, the Company determines if the agreement provides indemnification against loss or liability relating to insurance risk inaccordance with applicable accounting standards. Reinsurance premiums and benefits paid or provided are accounted for on basesconsistent with those used in accounting for the original policies issued and the terms of the reinsurance contracts. Premiums,benefits and DAC are reported net of insurance ceded.
31

TABLE OF CONTENTS
Share-Based Transactions
For employee and director share-based compensation awards, the Company determines a grant date fair value based on theprice of our publicly-traded common stock and recognize the related compensation expense, adjusted for actual forfeitures, in theconsolidated statement of operations on a straight-line basis over the requisite service period for the entire award. For non-employeeshare-based compensation awards, the Company recognizes the impact during the period of performance, and the fair value of theaward is measured as of the date performance is complete, which is the vesting date.
Treasury Stock
Treasury stock is reflected as a reduction of shareholders' equity at cost. The Company uses the first-in-first-out (“FIFO”)purchase cost to determine the cost of treasury stock that is reissued. The Company includes any gains and losses in additional paid-in capital when treasury stock is reissued.
Immaterial Error Correction
During the year ended December 31, 2019, the Company corrected a prior period immaterial error to the consolidatedstatement of comprehensive income (loss) for the year ended December 31, 2018. The correction resulted in an increase to grossunrealized holding loss arising during 2018 of $6,099 before taxes ($4,818 after taxes), with an offsetting decrease to thereclassification adjustment for net realized gains of $6,099 before taxes ($4,818 after taxes). The correction had no impact toshareholders’ equity, net loss, total other comprehensive loss, total comprehensive loss, or cash flows.
Recently Issued Accounting Standards
Adoption of New Accounting Standards
Reclassification of Effect of Tax Rate Change from AOCI to Retained Earnings. In February 2018, the FinancialAccounting Standards Board (“FASB”) issued Accounting Standards Update (“ASU”) No. 2018-02, Income Statement – ReportingComprehensive Income (Topic 220): Reclassification of Certain Tax Effects from Accumulated Other Comprehensive Income(“ASU 2018-02”). The FASB issued this guidance for the effect on deferred tax assets and liabilities related to items recorded inaccumulated other comprehensive income (“AOCI”) resulting from legislated tax reform enacted on December 22, 2017. The taxreform reduced the federal tax rate applied to the Company’s deferred tax balances from 35% to 21% on enactment. The Companyrecorded the total effect of the change in enacted tax rates on deferred tax balances in the income tax expense component of netincome. ASU 2018-02 permits the Company to reclassify out of AOCI and into retained earnings the “stranded” tax effects thatresulted from recording the tax effects of unrealized investment gains at a 35% tax rate because the 14% reduction in tax rate wasrecognized in net income instead of other comprehensive income. The Company adopted ASU 2018-02 as of January 1, 2018. As aresult, on January 1, 2018, the Company reclassified $2,100 of stranded tax effects related to continuing operations which increasedAOCI and reduced retained earnings.
Classification of Certain Cash Receipts and Cash Payments. In August 2016, the FASB issued ASU No. 2016-15,Statement of Cash Flows (Topic 230): Classification of Certain Cash Receipts and Cash Payments (“ASU 2016-15”). ASU 2016-15is intended to reduce diversity in practice in how certain transactions are classified in the statement of cash flows. The issuesaddressed in ASU 2016-15 are: 1) debt prepayment or debt extinguishment costs, 2) settlement of zero-coupon debt instruments, 3)contingent consideration payments made after a business combination, 4) proceeds from the settlement of insurance claims, 5)proceeds from the settlement of corporate-owned life insurance policies, including bank-owned life insurance policies, 6)distributions received from equity method investees, 7) beneficial interests in securitization transactions and 8) separatelyidentifiable cash flows and application of the predominance principle. The Company adopted ASU 2016-15 as of January 1, 2018,which impacted the classification of distributions from equity method investees. The Company made the election to use the natureof distributions approach. For the years ended December 31, 2019 and 2018, the Company classified distributions from equitymethod investees of $379 and $10,777, respectively, as cash flows from operating activities.
Financial Instruments – Recognition and Measurement of Financial Assets and Financial Liabilities. In January 2016, theFASB issued ASU No. 2016-01, Financial Instruments – Overall (Subtopic 825-10)
32

TABLE OF CONTENTS
(“ASU 2016-01”). ASU 2016-01 provides updated guidance for the recognition and measurement of financial instruments. Theguidance requires investments in equity securities to be measured at fair value with any changes in valuation reported in net incomeexcept for investments that are consolidated or are accounted for under the equity method of accounting. The guidance also requiresa deferred tax asset resulting from net unrealized losses on available-for-sale (“AFS”) fixed maturities that are recognized in AOCIto be evaluated for recoverability in combination with the Company’s other deferred tax assets. Under previous guidance, theCompany measured investments in equity securities at fair value with any changes in fair value reported in other comprehensiveincome. The Company adopted ASU 2016-01 as of January 1, 2018. The adoption of this guidance resulted in the recognition of$9,825 of net after tax unrealized gains on equity securities as a cumulative effect adjustment that increased retained earnings as ofJanuary 1, 2018 and decreased AOCI by the same amount. The Company elected to report changes in the fair value of equitysecurities in a separate line item on the Company’s consolidated statements of operations. At December 31, 2017, equity securitieswere classified as AFS in the Company’s consolidated balance sheets. However, upon adoption, the updated guidance eliminated theAFS balance sheet classification for equity securities.
Leases. On January 1, 2019, the Company adopted the requirements of Accounting Standards Update (“ASU”) No. 2016-02,Leases (Topic 842). The objective of this ASU, along with several related ASUs issued subsequently, is to increase transparency andcomparability between organizations that enter into lease agreements. For lessees, the key difference of the new standard from theprevious guidance (Topic 840) is the recognition of a right-of-use (“ROU”) asset and lease liability on the balance sheet. The mostsignificant change is the requirement to recognize ROU assets and lease liabilities for leases classified as operating leases. The newstandard requires disclosures to meet the objective of enabling users of financial statements to assess the amount, timing, anduncertainty of cash flows arising from leases.
As part of the transition to the new standard, the Company was required to measure and recognize leases that existed at January1, 2019 and elected to use a modified retrospective approach. For leases that existed at the effective date, the Company elected thepackage of three transition practical expedients and therefore did not reassess any of the following: (i) whether an arrangement is orcontains a lease, (ii) lease classification, or (iii) what qualifies as an initial direct cost.
The adoption of this ASU resulted in the Company recognizing a ROU asset of $6,088 as part of other assets and a leaseliability of $6,088 as part of accounts payable and accrued expenses in the consolidated balance sheet. The adoption of this ASU didnot have a material effect on the Company’s results of operations or liquidity.
Revenue from Contracts with Customers. In May 2014, the FASB issued ASU No. 2014-09, Revenue from Contracts withCustomers (Topic 606) (“ASU 2014-09”). ASU 2014-09, as modified, provides guidance for recognizing revenue which excludesinsurance contracts and financial instruments. Revenue is to be recognized when, or as, goods or services are transferred tocustomers in an amount that reflects the consideration that an entity is expected to be entitled in exchange for those goods orservices. The Company adopted ASU No. 2014-09 as of January 1, 2018. For the year ended December 31, 2019, approximately$190, or approximately one-tenth of 1% of the Company's total revenues, were within the scope of this updated guidance. Theadoption of this ASU did not have an impact on the Company’s consolidated financial statements.
Future Adoption of New Accounting Standards
Income Taxes – Simplifying the Accounting for Income Taxes. In December 2019, the FASB issued ASU No. 2019-12,Income Taxes (Topic 740): Simplifying the Accounting for Income Taxes (“ASU 2019-12”). This updated guidance is intended tosimplify the accounting for income taxes by removing several exceptions contained in existing guidance and amending otherexisting guidance to simplify several other income tax accounting matters. The updated guidance is effective for interim and annualreporting periods beginning after December 15, 2020, although earlier adoption is permitted. The Company expects to adopt theupdated guidance January 1, 2021, and does not expect the adoption of this ASU to have a material impact on its consolidatedfinancial statements.
Fair Value Measurement – Changes to the Disclosure Requirements for Fair Value Measurement. In August 2018, theFASB issued ASU No. 2018-13, Fair Value Measurement (Topic 820): Disclosure Framework – Changes to the DisclosureRequirements for Fair Value Measurement (“ASU 2018-13”). This guidance removes the following disclosure requirements fromTopic 820: (1) the amount of and reasons for transfers
33
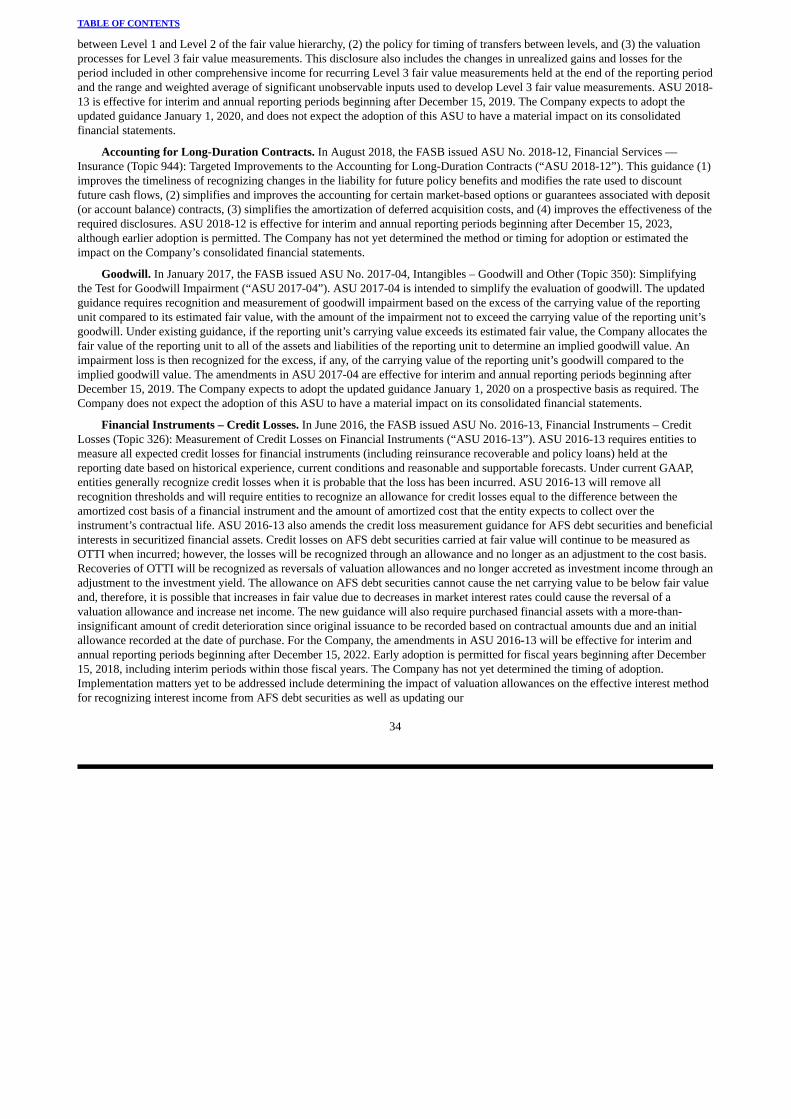
TABLE OF CONTENTS
between Level 1 and Level 2 of the fair value hierarchy, (2) the policy for timing of transfers between levels, and (3) the valuationprocesses for Level 3 fair value measurements. This disclosure also includes the changes in unrealized gains and losses for theperiod included in other comprehensive income for recurring Level 3 fair value measurements held at the end of the reporting periodand the range and weighted average of significant unobservable inputs used to develop Level 3 fair value measurements. ASU 2018-13 is effective for interim and annual reporting periods beginning after December 15, 2019. The Company expects to adopt theupdated guidance January 1, 2020, and does not expect the adoption of this ASU to have a material impact on its consolidatedfinancial statements.
Accounting for Long-Duration Contracts. In August 2018, the FASB issued ASU No. 2018-12, Financial Services —Insurance (Topic 944): Targeted Improvements to the Accounting for Long-Duration Contracts (“ASU 2018-12”). This guidance (1)improves the timeliness of recognizing changes in the liability for future policy benefits and modifies the rate used to discountfuture cash flows, (2) simplifies and improves the accounting for certain market-based options or guarantees associated with deposit(or account balance) contracts, (3) simplifies the amortization of deferred acquisition costs, and (4) improves the effectiveness of therequired disclosures. ASU 2018-12 is effective for interim and annual reporting periods beginning after December 15, 2023,although earlier adoption is permitted. The Company has not yet determined the method or timing for adoption or estimated theimpact on the Company’s consolidated financial statements.
Goodwill. In January 2017, the FASB issued ASU No. 2017-04, Intangibles – Goodwill and Other (Topic 350): Simplifyingthe Test for Goodwill Impairment (“ASU 2017-04”). ASU 2017-04 is intended to simplify the evaluation of goodwill. The updatedguidance requires recognition and measurement of goodwill impairment based on the excess of the carrying value of the reportingunit compared to its estimated fair value, with the amount of the impairment not to exceed the carrying value of the reporting unit’sgoodwill. Under existing guidance, if the reporting unit’s carrying value exceeds its estimated fair value, the Company allocates thefair value of the reporting unit to all of the assets and liabilities of the reporting unit to determine an implied goodwill value. Animpairment loss is then recognized for the excess, if any, of the carrying value of the reporting unit’s goodwill compared to theimplied goodwill value. The amendments in ASU 2017-04 are effective for interim and annual reporting periods beginning afterDecember 15, 2019. The Company expects to adopt the updated guidance January 1, 2020 on a prospective basis as required. TheCompany does not expect the adoption of this ASU to have a material impact on its consolidated financial statements.
Financial Instruments – Credit Losses. In June 2016, the FASB issued ASU No. 2016-13, Financial Instruments – CreditLosses (Topic 326): Measurement of Credit Losses on Financial Instruments (“ASU 2016-13”). ASU 2016-13 requires entities tomeasure all expected credit losses for financial instruments (including reinsurance recoverable and policy loans) held at thereporting date based on historical experience, current conditions and reasonable and supportable forecasts. Under current GAAP,entities generally recognize credit losses when it is probable that the loss has been incurred. ASU 2016-13 will remove allrecognition thresholds and will require entities to recognize an allowance for credit losses equal to the difference between theamortized cost basis of a financial instrument and the amount of amortized cost that the entity expects to collect over theinstrument’s contractual life. ASU 2016-13 also amends the credit loss measurement guidance for AFS debt securities and beneficialinterests in securitized financial assets. Credit losses on AFS debt securities carried at fair value will continue to be measured asOTTI when incurred; however, the losses will be recognized through an allowance and no longer as an adjustment to the cost basis.Recoveries of OTTI will be recognized as reversals of valuation allowances and no longer accreted as investment income through anadjustment to the investment yield. The allowance on AFS debt securities cannot cause the net carrying value to be below fair valueand, therefore, it is possible that increases in fair value due to decreases in market interest rates could cause the reversal of avaluation allowance and increase net income. The new guidance will also require purchased financial assets with a more-than-insignificant amount of credit deterioration since original issuance to be recorded based on contractual amounts due and an initialallowance recorded at the date of purchase. For the Company, the amendments in ASU 2016-13 will be effective for interim andannual reporting periods beginning after December 15, 2022. Early adoption is permitted for fiscal years beginning after December15, 2018, including interim periods within those fiscal years. The Company has not yet determined the timing of adoption.Implementation matters yet to be addressed include determining the impact of valuation allowances on the effective interest methodfor recognizing interest income from AFS debt securities as well as updating our
34
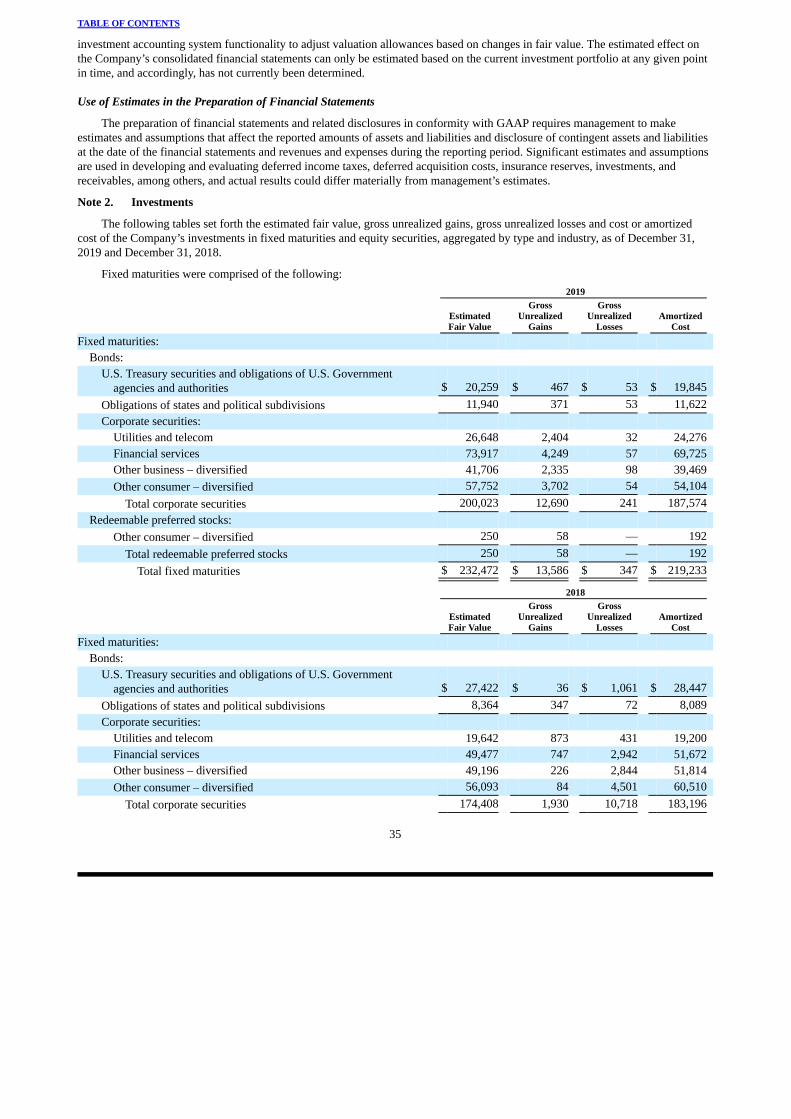
TABLE OF CONTENTS
investment accounting system functionality to adjust valuation allowances based on changes in fair value. The estimated effect onthe Company’s consolidated financial statements can only be estimated based on the current investment portfolio at any given pointin time, and accordingly, has not currently been determined.
Use of Estimates in the Preparation of Financial Statements
The preparation of financial statements and related disclosures in conformity with GAAP requires management to makeestimates and assumptions that affect the reported amounts of assets and liabilities and disclosure of contingent assets and liabilitiesat the date of the financial statements and revenues and expenses during the reporting period. Significant estimates and assumptionsare used in developing and evaluating deferred income taxes, deferred acquisition costs, insurance reserves, investments, andreceivables, among others, and actual results could differ materially from management’s estimates.
Note 2. Investments
The following tables set forth the estimated fair value, gross unrealized gains, gross unrealized losses and cost or amortizedcost of the Company’s investments in fixed maturities and equity securities, aggregated by type and industry, as of December 31,2019 and December 31, 2018.
Fixed maturities were comprised of the following: 2019
EstimatedFair Value
GrossUnrealized
Gains
GrossUnrealized
LossesAmortized
CostFixed maturities:
Bonds: U.S. Treasury securities and obligations of U.S. Government
agencies and authorities $ 20,259 $ 467 $ 53 $ 19,845 Obligations of states and political subdivisions 11,940 371 53 11,622 Corporate securities:
Utilities and telecom 26,648 2,404 32 24,276 Financial services 73,917 4,249 57 69,725 Other business – diversified 41,706 2,335 98 39,469 Other consumer – diversified 57,752 3,702 54 54,104
Total corporate securities 200,023 12,690 241 187,574 Redeemable preferred stocks:
Other consumer – diversified 250 58 — 192 Total redeemable preferred stocks 250 58 — 192
Total fixed maturities $ 232,472 $ 13,586 $ 347 $ 219,233
2018
EstimatedFair Value
GrossUnrealized
Gains
GrossUnrealized
LossesAmortized
CostFixed maturities:
Bonds: U.S. Treasury securities and obligations of U.S. Government
agencies and authorities $ 27,422 $ 36 $ 1,061 $ 28,447 Obligations of states and political subdivisions 8,364 347 72 8,089 Corporate securities:
Utilities and telecom 19,642 873 431 19,200 Financial services 49,477 747 2,942 51,672 Other business – diversified 49,196 226 2,844 51,814 Other consumer – diversified 56,093 84 4,501 60,510
Total corporate securities 174,408 1,930 10,718 183,196
35

TABLE OF CONTENTS
2018
EstimatedFair Value
GrossUnrealized
Gains
GrossUnrealized
LossesAmortized
CostRedeemable preferred stocks:
Other consumer – diversified 192 — — 192 Total redeemable preferred stocks 192 — — 192
Total fixed maturities $ 210,386 $ 2,313 $ 11,851 $ 219,924
Bonds having an amortized cost of $10,669 and $10,452 and included in the tables above were on deposit with insuranceregulatory authorities at December 31, 2019 and 2018, respectively, in accordance with statutory requirements. 2019
EstimatedFair Value
GrossUnrealized
Gains
GrossUnrealized
Losses
Cost orAmortized
CostEquity securities:
Common and non-redeemable preferred stocks: Financial services 3,159 624 — 2,535 Other business – diversified 19,763 15,130 — 4,633
Total equity securities $ 22,922 $ 15,754 $ — $ 7,168
2018
EstimatedFair Value
GrossUnrealized
Gains
GrossUnrealized
Losses
Cost orAmortized
CostEquity securities:
Common and non-redeemable preferred stocks: Utilities and telecom 1,686 722 — 964 Financial services 4,552 172 — 4,380 Other business – diversified 306 259 — 47 Other consumer – diversified 14,214 9,090 — 5,124
Total equity securities $ 20,758 $ 10,243 $ — $ 10,515
The carrying value and amortized cost of the Company’s investments in fixed maturities at December 31, 2019 and 2018 bycontractual maturity were as follows. Actual maturities may differ from contractual maturities because issuers may call or prepayobligations with or without call or prepayment penalties. 2019 2018
Carrying
ValueAmortized
CostCarrying
ValueAmortized
CostDue in one year or less $ — $ — $ 3,150 $ 3,150 Due after one year through five years 14,664 14,280 19,787 19,699 Due after five years through ten years 77,934 73,521 127,617 133,863 Due after ten years 130,680 122,313 43,823 46,338 Asset backed securities 9,194 9,111 16,009 16,874
Totals $ 232,472 $ 219,233 $ 210,386 $ 219,924
36
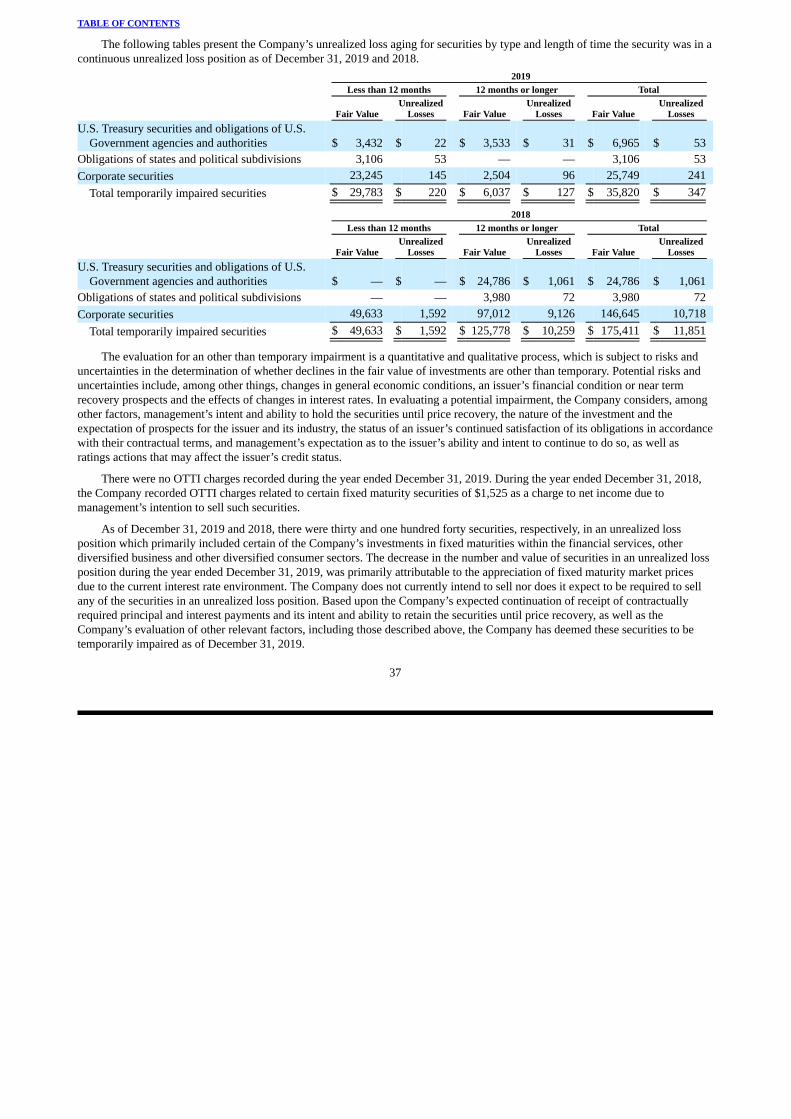
TABLE OF CONTENTS
The following tables present the Company’s unrealized loss aging for securities by type and length of time the security was in acontinuous unrealized loss position as of December 31, 2019 and 2018. 2019 Less than 12 months 12 months or longer Total
Fair ValueUnrealized
Losses Fair ValueUnrealized
Losses Fair ValueUnrealized
LossesU.S. Treasury securities and obligations of U.S.
Government agencies and authorities $ 3,432 $ 22 $ 3,533 $ 31 $ 6,965 $ 53 Obligations of states and political subdivisions 3,106 53 — — 3,106 53 Corporate securities 23,245 145 2,504 96 25,749 241
Total temporarily impaired securities $ 29,783 $ 220 $ 6,037 $ 127 $ 35,820 $ 347
2018 Less than 12 months 12 months or longer Total
Fair ValueUnrealized
Losses Fair ValueUnrealized
Losses Fair ValueUnrealized
LossesU.S. Treasury securities and obligations of U.S.
Government agencies and authorities $ — $ — $ 24,786 $ 1,061 $ 24,786 $ 1,061 Obligations of states and political subdivisions — — 3,980 72 3,980 72 Corporate securities 49,633 1,592 97,012 9,126 146,645 10,718
Total temporarily impaired securities $ 49,633 $ 1,592 $ 125,778 $ 10,259 $ 175,411 $ 11,851
The evaluation for an other than temporary impairment is a quantitative and qualitative process, which is subject to risks anduncertainties in the determination of whether declines in the fair value of investments are other than temporary. Potential risks anduncertainties include, among other things, changes in general economic conditions, an issuer’s financial condition or near termrecovery prospects and the effects of changes in interest rates. In evaluating a potential impairment, the Company considers, amongother factors, management’s intent and ability to hold the securities until price recovery, the nature of the investment and theexpectation of prospects for the issuer and its industry, the status of an issuer’s continued satisfaction of its obligations in accordancewith their contractual terms, and management’s expectation as to the issuer’s ability and intent to continue to do so, as well asratings actions that may affect the issuer’s credit status.
There were no OTTI charges recorded during the year ended December 31, 2019. During the year ended December 31, 2018,the Company recorded OTTI charges related to certain fixed maturity securities of $1,525 as a charge to net income due tomanagement’s intention to sell such securities.
As of December 31, 2019 and 2018, there were thirty and one hundred forty securities, respectively, in an unrealized lossposition which primarily included certain of the Company’s investments in fixed maturities within the financial services, otherdiversified business and other diversified consumer sectors. The decrease in the number and value of securities in an unrealized lossposition during the year ended December 31, 2019, was primarily attributable to the appreciation of fixed maturity market pricesdue to the current interest rate environment. The Company does not currently intend to sell nor does it expect to be required to sellany of the securities in an unrealized loss position. Based upon the Company’s expected continuation of receipt of contractuallyrequired principal and interest payments and its intent and ability to retain the securities until price recovery, as well as theCompany’s evaluation of other relevant factors, including those described above, the Company has deemed these securities to betemporarily impaired as of December 31, 2019.
37

TABLE OF CONTENTS
Investment income was earned from the following sources: 2019 2018Fixed maturities $ 8,485 $ 8,432 Equity securities 282 440 Other 319 677 9,086 9,549 Investment expenses 107 —
Net investment income $ 8,979 $ 9,549
A summary of realized investment gains (losses) follows: 2019
Fixed
MaturitiesEquity
Securities
OtherInvestedAssets Total
Gains $ 2,003 $ 1,221 $ — $ 3,224 Losses (1,650) — — (1,650)Realized investment gains (losses), net $ 353 $ 1,221 $ — $ 1,574
2018
Fixed
MaturitiesEquity
Securities
OtherInvestedAssets Total
Gains $ 884 $ 272 $ 5,827 $ 6,983 Losses (1,829) — — (1,829)Realized investment gains, net $ (945) $ 272 $ 5,827 $ 5,154
Proceeds from the sales of available-for-sale fixed maturities were as follows: 2019 2018Sales proceeds $ 117,530 $ 30,078 Gross gains 2,003 884 Gross losses (1,650) (1,829)
Sales of available-for-sale securities in 2019 were primarily a result of improving the overall risk versus return profile of theportfolio. 2019 2018Net realized and unrealized gains (losses) recognized during the period on equity securities $ 6,732 $ (1,922)Less: Net realized gains (losses) recognized during the period on equity securities sold during the
period 1,221 272 Unrealized gains (losses) on equity securities, net $ 5,511 $ (2,194)
The Company’s bond portfolio included 98% investment grade securities, as defined by the NAIC, at December 31, 2019.
Variable Interest Entities
The Company holds passive interests in a number of entities that are considered to be Variable Interest Entities (VIEs) underGAAP guidance. The Company's VIE interests principally consist of interests in limited partnerships and limited liability companiesformed for the purpose of achieving diversified equity returns. The Company's VIE interests, carried as a part of other investedassets, totaled $9,960 and $7,424 at December 31, 2019 and 2018, respectively. The Company's VIE interests, carried as a part ofinvestment in unconsolidated subsidiaries, totaled $1,238 at December 31, 2019 and 2018.
38

TABLE OF CONTENTS
The Company does not have power over the activities that most significantly impact the economic performance of these VIEsand thus is not the primary beneficiary. Therefore, the Company has not consolidated these VIEs. The Company’s involvement witheach VIE is limited to its direct ownership interest in the VIE. The Company has no arrangements with any of the VIEs to provideother financial support to or on behalf of the VIE. The Company’s maximum loss exposure relative to these investments was limitedto the carrying value of the Company’s investment in the VIEs, which amount to $11,198 and $8,662, at December 31, 2019 and2018, respectively. As of December 31, 2019 and 2018, the Company has outstanding commitments totaling $1,997 and $0,respectively, whereby the Company is committed to fund these investments and may be called by such VIEs during the commitmentperiod to fund the purchase of new investments and partnership expenses.
Note 3. Disclosures About Fair Value of Financial Instruments
The estimated fair values have been determined by the Company using available market information from various marketsources and appropriate valuation methodologies as of the respective dates. However, considerable judgment is necessary tointerpret market data and to develop the estimates of fair value. Although management is not aware of any factors that wouldsignificantly affect the estimated fair value amounts, the estimates presented herein are not necessarily indicative of the amountswhich the Company could realize in a current market exchange. The use of different market assumptions and/or estimationmethodologies may have a material effect on the estimated fair value amounts.
The following describes the fair value hierarchy and provides information as to the extent to which the Company uses fairvalue to measure the value of its financial instruments and information about the inputs used to value those financial instruments.The fair value hierarchy prioritizes the inputs in the valuation techniques used to measure fair value into three broad levels.
Level 1 Observable inputs that reflect quoted prices for identical assets or liabilities in active markets that the Company hasthe ability to access at the measurement date. The Company’s financial instruments valued using Level 1 criteriainclude cash equivalents and exchange traded common stocks.
Level 2 Observable inputs, other than quoted prices included in Level 1, for an asset or liability or prices for similar assetsor liabilities. The Company’s financial instruments valued using Level 2 criteria include significantly most of itsfixed maturities, which consist of U.S. Treasury securities, U.S. Government securities, obligations of states andpolitical subdivisions, and certain corporate fixed maturities, as well as its non-redeemable preferred stocks. Indetermining fair value measurements of its fixed maturities and non-redeemable preferred stocks using Level 2criteria, the Company utilizes data from outside sources, including nationally recognized pricing services andbroker/dealers. Prices for the majority of the Company’s Level 2 fixed maturities and non-redeemable preferredstocks were determined using unadjusted prices received from pricing services that utilize models where thesignificant inputs are observable (e.g. interest rates, yield curves, prepayment speeds, default rates, loss severities)or can be corroborated by observable market data.
Level 3 Valuations that are derived from techniques in which one or more of the significant inputs are unobservable(including assumptions about risk). Fair value is based on criteria that use assumptions or other data that are notreadily observable from objective sources. The Company’s financial instruments valued using Level 3 criteriaconsist of a limited number of fixed maturities. The use of different criteria or assumptions regarding data may haveyielded materially different valuations.
Recurring Fair Value Measurements
Cash Equivalents. The carrying amount approximates fair value due to the short-term nature of the instruments.
Fixed Maturities and Common and Non-Redeemable Preferred Stocks. The carrying amount is determined in accordance withmethods prescribed by the NAIC, which do not differ materially from publicly quoted market prices. Certain fixed maturities do nothave publicly quoted values and consist solely of issuances of pooled debt
39

TABLE OF CONTENTS
obligations of multiple, smaller financial services companies. They are not actively traded and valuation techniques used to measurefair value are based on future estimated cash flows discounted at reasonable estimated rates of interest. Other qualitative andquantitative information received from the original underwriter of the pooled offerings is also considered, as applicable.
Nonrecurring Fair Value Measurements
Non-publicly Traded Invested Assets. The fair value of investments in certain limited partnerships which are included in otherinvested assets on the consolidated balance sheet were determined by officers of those limited partnerships.
Policy Loans. Policy loans, which are categorized as Level 2 fair value measurements, are carried at the unpaid principal balances.
Junior Subordinated Debentures. The fair value is estimated based on observable interest rates and yields for debt instrumentshaving similar characteristics.
As of December 31, 2019, financial instruments carried at fair value were measured on a recurring basis as summarized below:
Assets:
Quoted Prices inActive Markets
for IdenticalAssets
(Level 1)
SignificantOther
ObservableInputs
(Level 2)
SignificantUnobservable
Inputs(Level 3) Total
Fixed maturities $ — $ 232,472 $ — $232,472 Equity securities 22,922 — — 22,922 Cash equivalents 7,173 — — 7,173
Total $ 30,095 $ 232,472 $ — $262,567
As of December 31, 2018, financial instruments carried at fair value were measured on a recurring basis as summarized below:
Assets:
QuotedPrices inActive
Marketsfor Identical
Assets(Level 1)
SignificantOther
ObservableInputs
(Level 2)
SignificantUnobservable
Inputs(Level 3) Total
Fixed maturities $ 11,413 $197,907 $ 1,066(1) $ 210,386 Equity securities 16,398 4,360(1) — 20,758 Cash equivalents 8,250 — — 8,250
Total $ 36,061 $202,267 $ 1,066 $ 239,394
(1) All underlying securities are financial service industry related.
The following is a roll-forward of the Company’s fixed maturities measured at fair value on a recurring basis using significantunobservable inputs (Level 3) from January 1, 2018 to December 31, 2019.
Fixed
MaturitiesBalance, January 1, 2018 $ 1,369 Total realized gains included in earnings 208 Total unrealized losses included in other comprehensive loss (28)Settlements (483)Balance, December 31, 2018 1,066 Total transferred out of level 3 (1,066)Balance, December 31, 2019 $ —
40

TABLE OF CONTENTS
The Company’s fixed maturities valued using Level 3 inputs consist solely of issuances of pooled debt obligations of multiple,smaller financial services companies that are not actively traded. There are no assumed prepayments and/or default probabilityassumptions as a majority of these instruments contain certain U.S. government agency strips to support repayment of the principal.Other qualitative and quantitative information received from the original underwriter of the pooled offerings is also considered, asapplicable. Transfer out of Level 3 were the result of valuing those securites using Level 2 criteria.
The following table sets forth the carrying amount, estimated fair value and level within the fair value hierarchy of theCompany’s financial instruments as of December 31, 2019 and 2018. 2019 2018
Level in FairValue
Hierarchy(1)CarryingAmount
EstimatedFair Value
CarryingAmount
EstimatedFair Value
Assets: Cash and cash equivalents Level 1 $ 12,893 $ 12,893 $ 12,630 $ 12,630 Fixed maturities (1) 232,472 232,472 210,386 210,386 Equity securities (1) 22,922 22,922 20,758 20,758 Other invested assets Level 3 9,960 9,960 7,424 7,424 Policy loans Level 2 2,007 2,007 2,085 2,085 Real estate Level 2 38 38 38 38 Investments in unconsolidated trusts Level 2 1,238 1,238 1,238 1,238
Liabilities:
Junior Subordinated Debentures, net Level 2 33,738 35,977 33,738 33,738 (1) See the aforementioned information for a description of the fair value hierarchy as well as a disclosure of levels for classes of these financial assets.
Note 4. Deferred Policy Acquisition Costs
The following table presents a rollforward of deferred policy acquisition costs by segment for the years ended December 31. 2019 2018
AmericanSouthern
BankersFidelity
AmericanSouthern
BankersFidelity
Deferred policy acquisition costs: Balance, beginning of year $ 2,047 $ 35,047 $ 2,075 $ 30,619 Capitalization 8,761 10,294 7,893 14,118 Amortization (8,829) (8,459) (7,921) (9,690)
Balance, end of year $ 1,979 $ 36,882 $ 2,047 $ 35,047
41

TABLE OF CONTENTS
Note 5. Insurance Reserves and Policyholder Funds
The following table presents the Company’s reserves for life, accident and health, and property and casualty losses, claims andloss adjustment expenses at December 31, 2019 and 2018.
Amount of Insurance
In Force, Net 2019 2018 2019 2018Future policy benefits
Life insurance policies: Ordinary life and annuities $ 55,403 $ 55,965 $ 212,774 $ 219,955 Group life 93 37 33,508(1) 93
55,496 56,002 $ 246,282 $ 220,048
Accident and health insurance policies 36,994 34,255 92,490 90,257 Unearned premiums 26,035 24,206 Losses, claims and loss adjustment expenses 81,448 72,612 Other policy liabilities 1,933 1,973
Total insurance reserves and policyholder funds $ 201,906 $ 189,048 (1) The group life in force amounts increased significantly during 2019. However, the impact on future policy benefits is not significant.
Annualized premiums for accident and health insurance policies were $112,734 and $116,404 at December 31, 2019 and 2018,respectively.
Future Policy Benefits
Liabilities for life insurance future policy benefits are based upon assumed future investment yields, mortality rates, andwithdrawal rates after giving effect to possible risks of unexpected claim experience. The assumed mortality and withdrawal ratesare based upon the Company’s experience. The interest rates assumed for life, accident and health future policy benefits aregenerally: (i) 2.5% to 5.5% for issues prior to 1977, (ii) 7% graded to 5.5% for 1977 through 1979 issues, (iii) 9% for 1980 through1987 issues, (iv) 5% to 7% for 1988 through 2009 issues, (v) 4% for 2010 through 2012 issues, and (vi) 3.5% to 4.0% for 2013through 2019 issues.
Loss and Claim Reserves
Loss and claim reserves represent estimates of projected ultimate losses and are based upon: (a) management’s estimate ofultimate liability and claims adjusters’ evaluations for unpaid claims reported prior to the close of the accounting period, (b)estimates of IBNR claims based on past experience, and (c) estimates of loss adjustment expenses. The estimated liability isperiodically reviewed by management and updated, with changes to the estimated liability recorded in the statement of operations inthe year in which such changes are known.
42
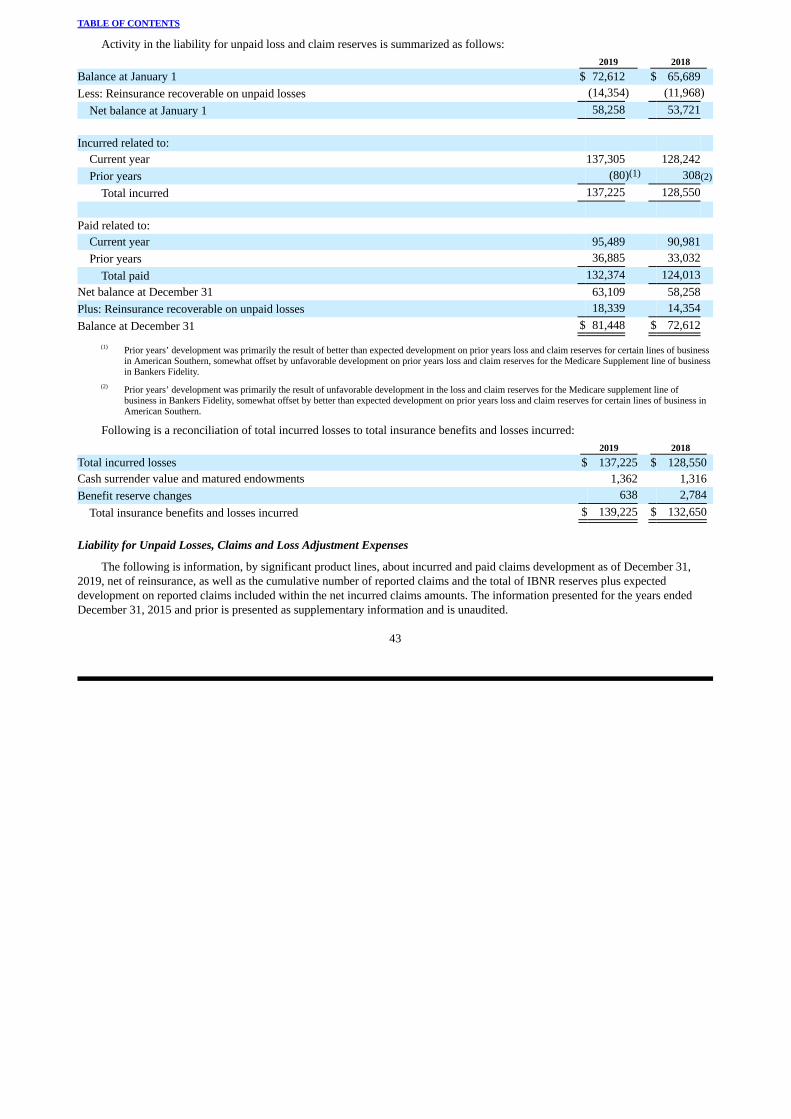
TABLE OF CONTENTS
Activity in the liability for unpaid loss and claim reserves is summarized as follows: 2019 2018Balance at January 1 $ 72,612 $ 65,689 Less: Reinsurance recoverable on unpaid losses (14,354) (11,968)
Net balance at January 1 58,258 53,721 Incurred related to:
Current year 137,305 128,242 Prior years (80)(1) 308(2)
Total incurred 137,225 128,550 Paid related to:
Current year 95,489 90,981 Prior years 36,885 33,032
Total paid 132,374 124,013 Net balance at December 31 63,109 58,258 Plus: Reinsurance recoverable on unpaid losses 18,339 14,354 Balance at December 31 $ 81,448 $ 72,612
(1) Prior years’ development was primarily the result of better than expected development on prior years loss and claim reserves for certain lines of businessin American Southern, somewhat offset by unfavorable development on prior years loss and claim reserves for the Medicare Supplement line of businessin Bankers Fidelity.
(2) Prior years’ development was primarily the result of unfavorable development in the loss and claim reserves for the Medicare supplement line ofbusiness in Bankers Fidelity, somewhat offset by better than expected development on prior years loss and claim reserves for certain lines of business inAmerican Southern.
Following is a reconciliation of total incurred losses to total insurance benefits and losses incurred: 2019 2018Total incurred losses $ 137,225 $ 128,550 Cash surrender value and matured endowments 1,362 1,316 Benefit reserve changes 638 2,784
Total insurance benefits and losses incurred $ 139,225 $ 132,650
Liability for Unpaid Losses, Claims and Loss Adjustment Expenses
The following is information, by significant product lines, about incurred and paid claims development as of December 31,2019, net of reinsurance, as well as the cumulative number of reported claims and the total of IBNR reserves plus expecteddevelopment on reported claims included within the net incurred claims amounts. The information presented for the years endedDecember 31, 2015 and prior is presented as supplementary information and is unaudited.
43

Cumulative Paid Losses, Claims and Allocated Loss Adjustment Expenses, Net of ReinsuranceAccidentYear 2010 2011 2012 2013 2014 2015 2016 2017 2018 2019
2010 $ 29,127 $ 34,328 $ 34,323 $ 34,303 $ 34,282 $ 34,272 $ 34,268 $ 34,265 $ 34,264 $ 34,264 2011 31,720 38,296 38,360 38,327 38,316 38,302 38,299 38,297 38,297 2012 42,267 50,996 51,021 50,998 50,989 50,987 50,985 50,984 2013 47,770 56,970 57,034 57,023 57,021 57,016 57,015 2014 48,024 56,938 56,981 56,981 56,976 56,977 2015 45,430 54,876 54,993 54,990 54,984 2016 49,165 59,747 63,226 63,225 2017 57,696 69,517 69,643 2018 66,565 80,222 2019 72,333
$ 577,944 Liabilities for losses, claims and loss adjustment expenses, net of reinsurance $ 16,614
TABLE OF CONTENTS
Medicare Supplement For the Years Ended December 31, As of December 31, 2019
Incurred Losses, Claims and Allocated Loss Adjustment Expenses, Net of ReinsuranceIBNR
Reserves
CumulativeNumber ofReportedClaims
AccidentYear 2010 2011 2012 2013 2014 2015 2016 2017 2018 2019
2010 $34,849 $34,328 $34,323 $34,303 $34,282 $34,272 $34,268 $34,265 $34,264 $$34,264 $ — 625,699 2011 38,188 38,296 38,360 38,327 38,316 38,302 38,299 38,297 38,297 — 664,057 2012 50,021 50,996 51,021 50,998 50,989 50,987 50,985 50,984 — 867,052 2013 56,974 56,970 57,034 57,023 57,021 57,016 57,015 — 957,369 2014 57,179 56,938 56,981 56,981 56,976 56,977 — 939,482 2015 55,482 54,939 54,993 54,990 54,984 — 898,387 2016 58,849 59,851 63,226 63,225 — 1,036,885 2017 67,960 69,655 69,643 — 1,512,117 2018 79,140 80,404 182 2,049,554 2019 88,765 16,432 1,976,968
$594,558
The cumulative number of reported claims for the Medicare supplement line of business is the number of distinct claimsincurred and submitted to Medicare for payment in the given year. Multiple payments on the same claim are not counted in thefrequency information. Estimated ultimate claims incurred, using claims data reported during each month of any given year, arecalculated using the chain ladder method modified to use seasonality and trend-adjusted expected claims for the final two months.Additional adjustments to the estimated ultimate claims incurred are then applied to account for seasonal changes in billing andpayment frequencies. The IBNR reserve is calculated as estimated ultimate claims less paid claims and claims in course ofsettlement. Thirty-six months of loss data are used to develop the estimated ultimate incurred claims. Similar approaches are usedfor other less significant health products, subject to modifications to account for unique aspects of the product.
44

Cumulative Paid Losses, Claims and Allocated Loss Adjustment Expenses, Net of ReinsuranceAccidentYear 2010 2011 2012 2013 2014 2015 2016 2017 2018 2019
2010 $ 3,211 $ 6,274 $ 8,291 $ 9,382 $ 9,725 $ 10,056 $ 10,090 $ 10,206 $ 10,210 $ 10,215 2011 4,205 7,934 9,858 12,071 13,039 13,106 13,199 13,330 13,329 2012 4,627 8,791 11,507 12,932 13,197 13,211 13,288 13,373 2013 5,144 12,193 16,782 19,407 20,382 20,982 20,972 2014 6,822 13,807 17,554 20,177 20,878 21,735 2015 6,226 11,878 14,938 17,612 19,557 2016 6,796 13,141 16,397 19,613 2017 7,401 16,317 20,221 2018 6,989 15,647 2019 7,305
$ 161,967 Liabilities for losses, claims and loss adjustment expenses, net of reinsurance $ 35,165
TABLE OF CONTENTS
Automobile Liability For the Years Ended December 31, As of December 31, 2019
Incurred Losses, Claims and Allocated Loss Adjustment Expenses, Net of ReinsuranceIBNR
Reserves
CumulativeNumber ofReportedClaims
AccidentYear 2010 2011 2012 2013 2014 2015 2016 2017 2018 2019
2010 $10,752 $10,818 $10,547 $ 9,937 $10,068 $10,185 $10,202 $10,201 $10,209 $ 10,215 $ — 1,947 2011 12,263 13,802 13,235 13,289 13,281 13,495 13,385 13,330 13,329 — 2,132 2012 12,980 15,007 14,108 13,707 13,313 13,343 13,357 13,373 — 2,343 2013 18,664 20,702 21,096 21,823 21,352 21,020 20,972 — 3,267 2014 20,812 21,881 22,041 22,353 21,682 22,080 57 3,543 2015 18,521 19,857 20,017 20,007 20,086 88 3,528 2016 20,549 21,275 21,846 22,388 1,106 3,846 2017 22,179 24,212 23,766 1,413 3,777 2018 24,284 25,682 3,991 3,524 2019 25,241 8,649 3,205
$197,132
Automobile Physical Damage For the Years Ended December 31, As of December 31, 2019
Incurred Losses, Claims and Allocated Loss Adjustment Expenses, Net of ReinsuranceIBNR
Reserves
CumulativeNumber ofReportedClaimsAccident Year 2015 2016 2017 2018 2019
2015 $ 8,287 $ 7,955 $ 7,887 $ 7,896 $ $7,884 $ — 1,588 2016 6,877 6,386 6,352 6,289 — 1,269 2017 6,257 5,933 5,857 — 1,321 2018 7,805 7,530 1 1,449 2019 8,526 202 1,355
$ 36,086
45

Cumulative Paid Losses, Claims and Allocated Loss Adjustment Expenses, Net of ReinsuranceAccident Year 2015 2016 2017 2018 2019
2015 $ $6,745 $ 7,937 $ 7,885 $ 7,895 $ $7,884 2016 5,804 6,353 6,349 6,289 2017 5,215 5,914 5,856 2018 6,344 7,510 2019 6,360
$ 33,899 All outstanding liabilities before 2015, net of reinsurance —
Liabilities for losses, claims and loss adjustment expenses, net of reinsurance $ 2,187
Cumulative Paid Losses, Claims and Allocated Loss Adjustment Expenses, Net of ReinsuranceAccident Year 2010 2011 2012 2013 2014 2015 2016 2017 2018 2019
2010 $ 284 $ 678 $ 1,374 $ 1,542 $ 2,037 $ 2,368 $ 2,382 $ 2,457 $ 2,463 $ 2,490 2011 295 412 582 835 1,161 1,169 1,278 1,285 1,325 2012 371 707 847 1,034 1,113 1,219 1,260 1,269 2013 104 339 579 811 791 803 805 2014 171 299 331 369 373 493 2015 98 259 464 664 863 2016 116 203 568 608 2017 75 136 365 2018 65 90 2019 41
$ 8,349 All outstanding liabilities before 2010, net of reinsurance 441
Liabilities for losses, claims and loss adjustment expenses, net of reinsurance $ 3,038
TABLE OF CONTENTS
General Liability For the Years Ended December 31, As of December 31, 2019
Incurred Losses, Claims and Allocated Loss Adjustment Expenses, Net of ReinsuranceIBNR
Reserves
CumulativeNumber ofReportedClaimsAccident Year 2010 2011 2012 2013 2014 2015 2016 2017 2018 2019
2010 $4,114 $ 2,699 $ 2,269 $ 2,337 $ 2,258 $ 2,400 $ 2,423 $ 2,473 $ 2,480 $ 2,490 $ 0 289 2011 3,022 1,723 1,452 1,338 1,174 1,242 1,327 1,335 1,400 18 208 2012 4,055 1,305 1,269 1,270 1,214 1,333 1,344 1,377 25 159 2013 3,461 728 926 817 865 820 945 33 195 2014 3,744 501 557 476 406 497 1 193 2015 4,421 1,037 1,227 1,044 867 1 146 2016 3,119 1,148 736 608 0 85 2017 1,490 488 513 70 77 2018 1,656 333 127 73 2019 1,916 1,598 61
$10,946
46
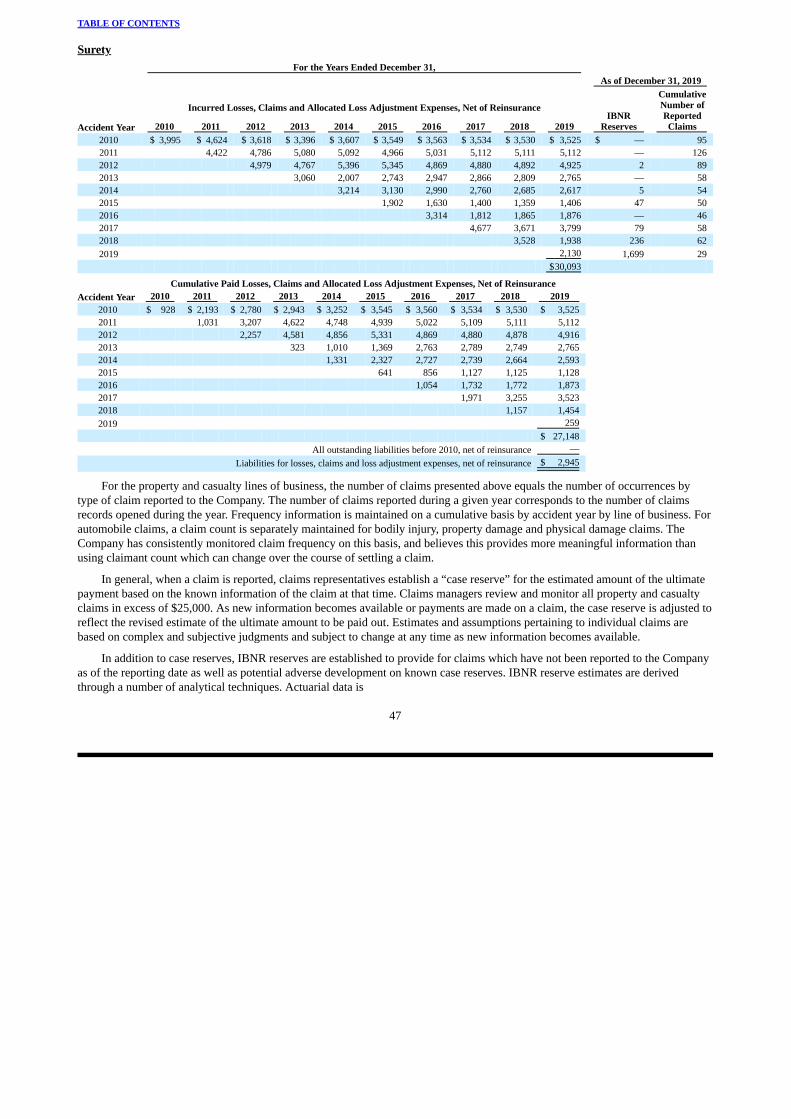
Cumulative Paid Losses, Claims and Allocated Loss Adjustment Expenses, Net of ReinsuranceAccident Year 2010 2011 2012 2013 2014 2015 2016 2017 2018 2019
2010 $ 928 $ 2,193 $ 2,780 $ 2,943 $ 3,252 $ 3,545 $ 3,560 $ 3,534 $ 3,530 $ 3,525 2011 1,031 3,207 4,622 4,748 4,939 5,022 5,109 5,111 5,112 2012 2,257 4,581 4,856 5,331 4,869 4,880 4,878 4,916 2013 323 1,010 1,369 2,763 2,789 2,749 2,765 2014 1,331 2,327 2,727 2,739 2,664 2,593 2015 641 856 1,127 1,125 1,128 2016 1,054 1,732 1,772 1,873 2017 1,971 3,255 3,523 2018 1,157 1,454 2019 259
$ 27,148 All outstanding liabilities before 2010, net of reinsurance —
Liabilities for losses, claims and loss adjustment expenses, net of reinsurance $ 2,945
TABLE OF CONTENTS
Surety For the Years Ended December 31, As of December 31, 2019
Incurred Losses, Claims and Allocated Loss Adjustment Expenses, Net of ReinsuranceIBNR
Reserves
CumulativeNumber ofReportedClaimsAccident Year 2010 2011 2012 2013 2014 2015 2016 2017 2018 2019
2010 $ 3,995 $ 4,624 $ 3,618 $ 3,396 $ 3,607 $ 3,549 $ 3,563 $ 3,534 $ 3,530 $ 3,525 $ — 95 2011 4,422 4,786 5,080 5,092 4,966 5,031 5,112 5,111 5,112 — 126 2012 4,979 4,767 5,396 5,345 4,869 4,880 4,892 4,925 2 89 2013 3,060 2,007 2,743 2,947 2,866 2,809 2,765 — 58 2014 3,214 3,130 2,990 2,760 2,685 2,617 5 54 2015 1,902 1,630 1,400 1,359 1,406 47 50 2016 3,314 1,812 1,865 1,876 — 46 2017 4,677 3,671 3,799 79 58 2018 3,528 1,938 236 62 2019 2,130 1,699 29
$30,093
For the property and casualty lines of business, the number of claims presented above equals the number of occurrences bytype of claim reported to the Company. The number of claims reported during a given year corresponds to the number of claimsrecords opened during the year. Frequency information is maintained on a cumulative basis by accident year by line of business. Forautomobile claims, a claim count is separately maintained for bodily injury, property damage and physical damage claims. TheCompany has consistently monitored claim frequency on this basis, and believes this provides more meaningful information thanusing claimant count which can change over the course of settling a claim.
In general, when a claim is reported, claims representatives establish a “case reserve” for the estimated amount of the ultimatepayment based on the known information of the claim at that time. Claims managers review and monitor all property and casualtyclaims in excess of $25,000. As new information becomes available or payments are made on a claim, the case reserve is adjusted toreflect the revised estimate of the ultimate amount to be paid out. Estimates and assumptions pertaining to individual claims arebased on complex and subjective judgments and subject to change at any time as new information becomes available.
In addition to case reserves, IBNR reserves are established to provide for claims which have not been reported to the Companyas of the reporting date as well as potential adverse development on known case reserves. IBNR reserve estimates are derivedthrough a number of analytical techniques. Actuarial data is
47

TABLE OF CONTENTS
analyzed by line of business, coverage and accident year. Qualitative factors are also considered in determining IBNR reserves andinclude such factors as judicial decisions, general economic trends such as inflation, changes in policy forms, and underwritingchanges. Reserves are reviewed quarterly and any indicated adjustments are made.
Because of the inherent uncertainties in establishing both case and IBNR reserves, ultimate loss experience may prove better orworse than indicated by the combined claim reserves. Adjustments to claim reserves are reflected in the period recognized and couldincrease or decrease earnings for the period.
The following is supplementary information about average historical claims duration as of December 31, 2019.Average Annual Percentage Payout of Incurred Claims by Age, Net of Reinsurance
(Unaudited)
Reserve Line1st
Year 2nd Year 3rd Year 4th Year 5th Year 6th Year 7th Year 8th Year 9th Year10th
YearMedicare Supplement 83.0% 16.8% 0.1% 0.0% 0.0% 0.0% 0.0% 0.0% 0.0% 0.0%Automobile Liability 30.2% 31.3% 17.4% 12.9% 5.0% 2.1% 0.4% 0.9% 0.0% 0.0%Automobile Physical Damage 85.1% 12.8% -0.6% -0.4% -0.1% 0.0% 0.0% 0.0% 0.0% 0.0%General Liability 17.1% 16.8% 26.3% 14.3% 11.8% 9.4% 2.9% 1.4% 1.5% 1.1%Surety 38.0% 32.1% 13.3% 10.4% 0.2% 1.2% 0.7% 0.0% 0.0% -0.1%
The reconciliation of the net incurred and paid claims development tables to the liability for losses, claims and loss adjustmentexpenses is as follows:
December 31,
2019Net outstanding liabilities:
Medicare Supplement $ 16,614 Automobile Liability 35,165 Automobile Physical Damage 2,187 General Liability 3,038 Surety 2,945 Other short-duration insurance lines 1,043
Liabilities for unpaid losses, claims and loss adjustment expenses, net of reinsurance 60,992 Reinsurance recoverable on unpaid losses:
Medicare Supplement 10,620 Automobile Liability 5,566 Automobile Physical Damage 143 General Liability 2,010
Total reinsurance recoverable on unpaid losses 18,339 Unallocated claims adjustment expenses 2,117 Total gross liability for unpaid losses, claims and loss adjustment expenses $ 81,448
48

TABLE OF CONTENTS
Note 6. Reinsurance
In accordance with general practice in the insurance industry, portions of the life, property and casualty insurance written bythe Company are reinsured; however, the Company remains liable with respect to reinsurance ceded should any reinsurer be unableor unwilling to meet its obligations. Approximately 99.7% of the Company’s reinsurance recoverables were due from a singlereinsurer as of December 31, 2019. Reinsurance recoverables of $32,035 were due from General Re Corporation, rated “AA+” byStandard & Poor’s and “A++” (Superior) by A.M. Best. Allowances for uncollectible amounts are established against reinsurancerecoverables, if appropriate.
The effects of reinsurance on premiums written, premiums earned and insurance benefits and losses incurred were as follows: 2019 2018Direct premiums written $ 237,973 $ 220,415 Assumed premiums written 23,275 20,093 Ceded premiums written (77,750) (66,845)
Net premiums written $ 183,498 $ 173,663
Direct premiums earned $ 237,361 $ 219,785 Assumed premiums earned 22,345 19,680 Ceded premiums earned (77,781) (66,534)
Net premiums earned $ 181,925 $ 172,931
Provision for benefits and losses incurred $ 206,390 $ 188,275 Reinsurance loss recoveries (67,165) (55,625)
Insurance benefits and losses incurred $ 139,225 $ 132,650
Components of reinsurance receivables at December 31, 2019 and 2018 were as follows: 2019 2018Recoverable on unpaid losses $ 18,339 $ 14,354 Recoverable on unpaid benefits 10,772 9,355 Recoverable on paid losses 1,538 992 Ceded unearned premiums 1,155 1,185 Ceded advanced premiums 331 224
Total reinsurance receivables $ 32,135 $ 26,110
Note 7. Income Taxes
Total income taxes were allocated as follows: 2019 2018Total tax benefit on income $ (21) $ (267) Tax benefit on components of shareholders’ equity:
Net unrealized gains (losses) on investment securities (4,783) (2,541)Total tax benefit $ (4,804) $ (2,808)
49
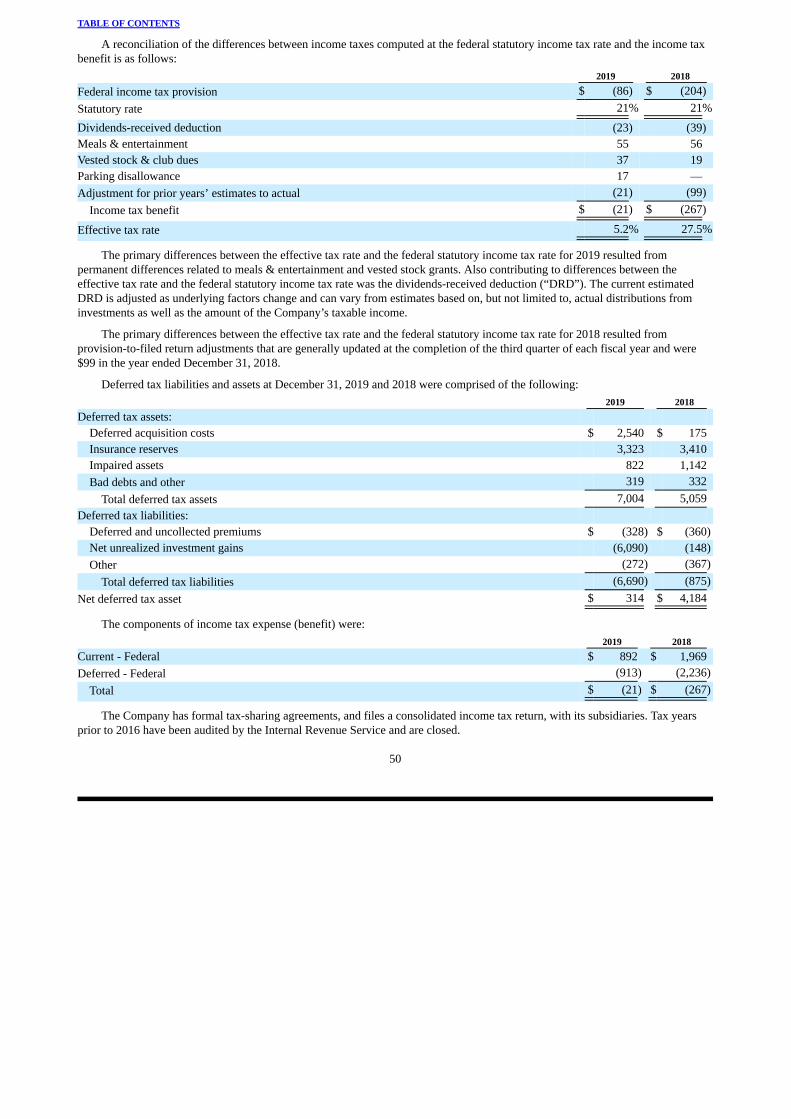
TABLE OF CONTENTS
A reconciliation of the differences between income taxes computed at the federal statutory income tax rate and the income taxbenefit is as follows: 2019 2018
Federal income tax provision $ (86) $ (204)Statutory rate 21% 21%
Dividends-received deduction (23) (39)Meals & entertainment 55 56 Vested stock & club dues 37 19 Parking disallowance 17 — Adjustment for prior years’ estimates to actual (21) (99)
Income tax benefit $ (21) $ (267)
Effective tax rate 5.2% 27.5%
The primary differences between the effective tax rate and the federal statutory income tax rate for 2019 resulted frompermanent differences related to meals & entertainment and vested stock grants. Also contributing to differences between theeffective tax rate and the federal statutory income tax rate was the dividends-received deduction (“DRD”). The current estimatedDRD is adjusted as underlying factors change and can vary from estimates based on, but not limited to, actual distributions frominvestments as well as the amount of the Company’s taxable income.
The primary differences between the effective tax rate and the federal statutory income tax rate for 2018 resulted fromprovision-to-filed return adjustments that are generally updated at the completion of the third quarter of each fiscal year and were$99 in the year ended December 31, 2018.
Deferred tax liabilities and assets at December 31, 2019 and 2018 were comprised of the following: 2019 2018Deferred tax assets:
Deferred acquisition costs $ 2,540 $ 175 Insurance reserves 3,323 3,410 Impaired assets 822 1,142 Bad debts and other 319 332
Total deferred tax assets 7,004 5,059 Deferred tax liabilities:
Deferred and uncollected premiums $ (328) $ (360)Net unrealized investment gains (6,090) (148)Other (272) (367)
Total deferred tax liabilities (6,690) (875)Net deferred tax asset $ 314 $ 4,184
The components of income tax expense (benefit) were: 2019 2018Current - Federal $ 892 $ 1,969 Deferred - Federal (913) (2,236)
Total $ (21) $ (267)
The Company has formal tax-sharing agreements, and files a consolidated income tax return, with its subsidiaries. Tax yearsprior to 2016 have been audited by the Internal Revenue Service and are closed.
50

TABLE OF CONTENTS
Note 8. Junior Subordinated Debentures
The Company has two unconsolidated Connecticut statutory business trusts, which exist for the exclusive purposes of: (i)issuing trust preferred securities (“Trust Preferred Securities”) representing undivided beneficial interests in the assets of the trusts;(ii) investing the gross proceeds of the Trust Preferred Securities in junior subordinated deferrable interest debentures (“JuniorSubordinated Debentures”) of Atlantic American; and (iii) engaging in those activities necessary or incidental thereto. At December31, 2019, the effective interest rate was 5.96%.
The financial structure of each of Atlantic American Statutory Trust I and II, as of December 31, 2019 and 2018, was asfollows:
Atlantic AmericanStatutory Trust I
Atlantic AmericanStatutory Trust II
JUNIOR SUBORDINATED DEBENTURES(1)(2) Balance December 31, 2019 $18,042 $23,196Less: Treasury debt(3) — (7,500)Net balance December 31, 2019 $18,042 $15,696Net balance December 31, 2018 $18,042 $15,696Coupon rate LIBOR + 4.00% LIBOR + 4.10%Interest payable Quarterly QuarterlyMaturity date December 4, 2032 May 15, 2033Redeemable by issuer Yes YesTRUST PREFERRED SECURITIES Issuance date December 4, 2002 May 15, 2003Securities issued 17,500 22,500Liquidation preference per security $1 $1Liquidation value $17,500 $22,500Coupon rate LIBOR + 4.00% LIBOR + 4.10%Distribution payable Quarterly QuarterlyDistribution guaranteed by(4) Atlantic Atlantic American American Corporation Corporation
(1) For each of the respective debentures, the Company has the right at any time, and from time to time, to defer payments of interest on the JuniorSubordinated Debentures for a period not exceeding 20 consecutive quarters up to the debentures’ respective maturity dates. During any such period,interest will continue to accrue and the Company may not declare or pay any cash dividends or distributions on, or purchase, the Company’s commonstock nor make any principal, interest or premium payments on or repurchase any debt securities that rank equally with or junior to the JuniorSubordinated Debentures. The Company has the right at any time to dissolve each of the trusts and cause the Junior Subordinated Debentures to bedistributed to the holders of the Trust Preferred Securities.
(2) The Junior Subordinated Debentures are unsecured and rank junior and subordinate in right of payment to all senior debt of the Parent and are effectivelysubordinated to all existing and future liabilities of its subsidiaries.
(3) In 2014, the Company acquired $7,500 of the Junior Subordinated Debentures.(4) The Parent has guaranteed, on a subordinated basis, all of the obligations under the Trust Preferred Securities, including payment of the redemption price
and any accumulated and unpaid distributions to the extent of available funds and upon dissolution, winding up or liquidation.
51

TABLE OF CONTENTS
Note 9. Leases
The Company has two operating lease agreements, each for the use of office space in the ordinary course of business. The firstlease renews annually on an automatic basis and based on original assumptions, management is reasonably certain to exercise therenewal option for an additional eight years from the January 1, 2019 effective date of the new lease guidance. The original term ofthe second lease was ten years and amended in January 2017 to provide for an additional seven years, with a termination date onSeptember 30, 2026. The rate used in determining the present value of lease payments is based upon an estimate of the Company’sincremental secured borrowing rate commensurate with the term of the underlying lease.
These leases are accounted for as operating leases, whereby lease expense is recognized on a straight-line basis over the term ofthe lease. Lease expense reported for the year ended December 31, 2019 was $1,014. See the “Adoption of New AccountingStandards – Leases” section of Note 1 of Notes to Consolidated Financial Statements for additional information regarding theaccounting for leases.
Additional information regarding the Company’s real estate operating leases is as follows:
YearEnded
December31,
2019Other information on operating leases: Cash payments included in the measurement of lease liabilities reported in operating cash
flows $815Right-of-use assets included in other assets on the consolidated balance sheet 5,476Weighted average discount rate 6.8%Weighted average remaining lease term in years 6.9 years
The following table presents maturities and present value of the Company’s lease liabilities:
Lease
Liability2020 $ 978 2021 1,015 2022 1,031 2023 1,048 2024 1,065 Thereafter 2,025
Total undiscounted lease payments 7,162 Less: present value adjustment 1,487
Operating lease liability included in accounts payable and accrued expenses on theconsolidated balance sheet $ 5,675
As of December 31, 2019, the Company has no operating leases that have not yet commenced.
52
TABLE OF CONTENTS
Note 10. Benefit Plans
Equity Incentive Plan
On May 1, 2012, the Company’s shareholders approved the 2012 Equity Incentive Plan (the “2012 Plan”). The 2012 Planauthorizes the grant of up to 2,000,000 stock options, stock appreciation rights, restricted shares, restricted stock units, performanceshares, performance units and other awards for the purpose of providing the Company’s non-employee directors, consultants,officers and other employees incentives and rewards for superior performance. In 2019, a total of 355,000 restricted shares, with anestimated fair value of $948, were issued under the 2012 Plan. In 2018, a total of 30,000 restricted shares, with an estimated fairvalue of $87, were issued under the 2012 Plan and 64,000 restricted shares, with an estimated fair value of $236, were forfeitedunder such plan. The estimated fair value of the restricted shares issued under the 2012 Plan for 2019 and 2018 was based on thecommon stock price at date of grant. Stock grants are generally issued from treasury shares. Vesting of restricted shares generallyoccurs after a one to three year period. The Company accounts for forfeitures as they occur. There were no stock options granted oroutstanding under the 2012 Plan in 2019 or 2018. Shares available for future grant at December 31, 2019 and 2018 were 920,200and 1,275,200, respectively.
401(k) Plan
The Company initiated an employees’ savings plan (the “Plan”) qualified under Section 401(k) of the Internal Revenue Code inMay 1995. The Plan covers substantially all of the Company’s employees. Effective January 1, 2009, the Company modified thePlan such that the Plan would operate on a safe harbor basis. Under the Plan, employees may defer up to 50% of their compensation,not to exceed the annual deferral limit. The Company’s total matching contribution for 2019 and 2018 was $230 and $233,respectively, and consisted of a contribution equal to 35% of up to the first 6% of each participant’s contributions. In addition to thematching contribution, the Company also provided a 3% safe harbor non-elective contribution in 2019 and 2018 of $524 and $491,respectively. All contributions were made in cash. Participants are 100% vested in their own contributions and the vested percentageattributable to certain employer contributions is based on a five year graded schedule.
Agent Stock Purchase Plan
The Company initiated a nonqualified stock purchase plan (the “Agent Stock Purchase Plan”) in May 2012. The purpose of theAgent Stock Purchase Plan is to promote and advance the interests of the Company and its shareholders by providing independentagents who qualify as participants with an opportunity to purchase the common stock of the Company. Under the Agent StockPurchase Plan, payment for shares of common stock of the Company is made by either deduction from an agent’s commissionpayment or a direct cash payment. Stock purchases are made at the end of each calendar quarter at the then current market value.
Note 11. Preferred Stock
The Company had 55,000 shares of Series D preferred stock (“Series D Preferred Stock”) outstanding at December 31, 2019and 2018, respectively. All of the shares of Series D Preferred Stock are held by an affiliate of the Company’s controllingshareholder. The outstanding shares of Series D Preferred Stock have a par value of $1 per share and a redemption value of $100 pershare; accrue annual dividends at a rate of $7.25 per share (payable in cash or shares of the Company’s common stock at the optionof the board of directors of the Company) and are cumulative. In certain circumstances, the shares of the Series D Preferred Stockmay be convertible into an aggregate of approximately 1,378,000 shares of the Company’s common stock, subject to certainadjustments and provided that such adjustments do not result in the Company issuing more than approximately 2,703,000 shares ofcommon stock without obtaining prior shareholder approval; and are redeemable solely at the Company’s option. The Series DPreferred Stock is not currently convertible. The Company had accrued, but unpaid, dividends, on the Series D Preferred Stock of$18 at December 31, 2019 and 2018. During each of 2019 and 2018, the Company paid Series D Preferred Stock dividends of $399.
53
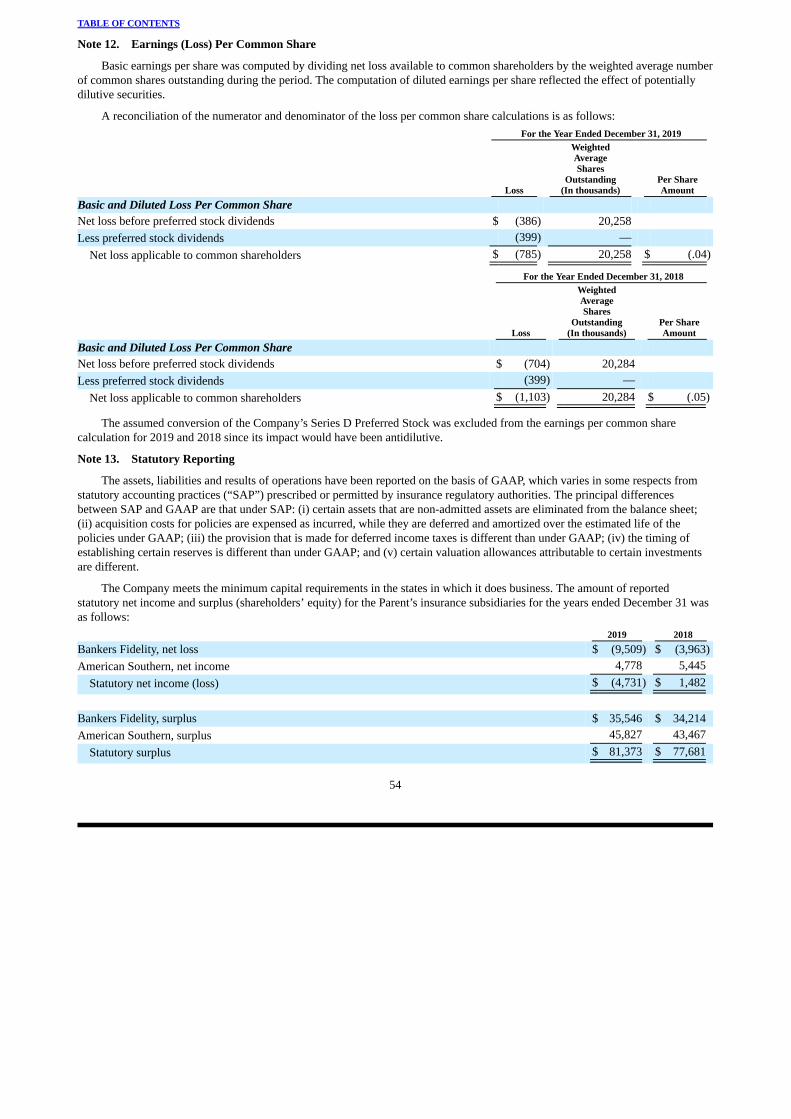
TABLE OF CONTENTS
Note 12. Earnings (Loss) Per Common Share
Basic earnings per share was computed by dividing net loss available to common shareholders by the weighted average numberof common shares outstanding during the period. The computation of diluted earnings per share reflected the effect of potentiallydilutive securities.
A reconciliation of the numerator and denominator of the loss per common share calculations is as follows: For the Year Ended December 31, 2019
Loss
WeightedAverageShares
Outstanding(In thousands)
Per ShareAmount
Basic and Diluted Loss Per Common Share Net loss before preferred stock dividends $ (386) 20,258 Less preferred stock dividends (399) —
Net loss applicable to common shareholders $ (785) 20,258 $ (.04)
For the Year Ended December 31, 2018
Loss
WeightedAverageShares
Outstanding(In thousands)
Per ShareAmount
Basic and Diluted Loss Per Common Share Net loss before preferred stock dividends $ (704) 20,284 Less preferred stock dividends (399) —
Net loss applicable to common shareholders $ (1,103) 20,284 $ (.05)
The assumed conversion of the Company’s Series D Preferred Stock was excluded from the earnings per common sharecalculation for 2019 and 2018 since its impact would have been antidilutive.
Note 13. Statutory Reporting
The assets, liabilities and results of operations have been reported on the basis of GAAP, which varies in some respects fromstatutory accounting practices (“SAP”) prescribed or permitted by insurance regulatory authorities. The principal differencesbetween SAP and GAAP are that under SAP: (i) certain assets that are non-admitted assets are eliminated from the balance sheet;(ii) acquisition costs for policies are expensed as incurred, while they are deferred and amortized over the estimated life of thepolicies under GAAP; (iii) the provision that is made for deferred income taxes is different than under GAAP; (iv) the timing ofestablishing certain reserves is different than under GAAP; and (v) certain valuation allowances attributable to certain investmentsare different.
The Company meets the minimum capital requirements in the states in which it does business. The amount of reportedstatutory net income and surplus (shareholders’ equity) for the Parent’s insurance subsidiaries for the years ended December 31 wasas follows: 2019 2018Bankers Fidelity, net loss $ (9,509) $ (3,963)American Southern, net income 4,778 5,445
Statutory net income (loss) $ (4,731) $ 1,482
Bankers Fidelity, surplus $ 35,546 $ 34,214 American Southern, surplus 45,827 43,467
Statutory surplus $ 81,373 $ 77,681
54
TABLE OF CONTENTS
Under the insurance code of the state in which each insurance subsidiary is domiciled, dividend payments to the Parent by itsinsurance subsidiaries are subject to certain limitations without the prior approval of the applicable state’s Insurance Commissioner.The Parent received dividends of $4,800 in each of the years ended 2019 and 2018, respectively, from its subsidiaries. In 2020,dividend payments to the Parent by the insurance subsidiaries in excess of $4,583 would require prior approval.
Note 14. Related Party Transactions
In the normal course of business the Company has engaged in transactions with entities affiliated with the controllingshareholder of the Company. These transactions include the leasing of office space as well as certain investing and financingactivities. At December 31, 2019, two members of the Company’s board of directors, including the Company’s chairman, presidentand chief executive officer, were considered to be affiliates of the majority shareholder.
The Company leases approximately 49,586 square feet of office and covered garage space from one such controlled entity.During the years ended December 31, 2019 and 2018, the Company paid $908 and $781, respectively, under this lease.
Certain financing for the Company has also been provided by this entity in the form of an investment in the Series D PreferredStock (See Note 11). During the years ended December 31, 2019 and 2018, the Company paid this entity $399 in dividends on theSeries D Preferred Stock.
Certain members of the Company’s management and board of directors are shareholders and on the board of directors of GrayTelevision, Inc. (“Gray”). As of December 31, 2019 and 2018, the Company owned 880,272 shares of Gray Class A common stockand 106,000 shares of Gray common stock. The aggregate carrying value of these investments in Gray at December 31, 2019 and2018 was $19,764 and $13,226, respectively.
During the years ended December 31, 2019 and 2018, Gray paid the Company approximately $1,022 and $783, respectively, ininsurance premiums related to certain voluntary employee benefit plans.
During the year ended December 31, 2019, the Company transferred its remaining fractional interest in an aircraft arrangementto Gray Television, Inc. for $151.
55

TABLE OF CONTENTS
Note 15. Segment Information
The Parent’s primary insurance subsidiaries operate with relative autonomy and each company is evaluated based on itsindividual performance. American Southern operates in the property and casualty insurance market, while Bankers Fidelity operatesin the life and health insurance market. Each segment derives revenue from the collection of premiums, as well as from investmentincome. Substantially all revenue other than that in the corporate and other segment is from external sources. For the Year Ended December 31, 2019
AmericanSouthern
BankersFidelity
Corporate& Other
Adjustments& Eliminations Consolidated
Insurance premiums, net $ 58,680 $ 123,245 $ — $ — $ 181,925 Insurance benefits and losses incurred 39,541 99,684 — — 139,225 Expenses deferred (8,761) (10,294) — — (19,055)Amortization and depreciation expense 9,024 8,709 551 — 18,284 Other expenses 16,869 37,158 15,939 (9,834) 60,132 Total expenses 56,673 135,257 16,490 (9,834) 198,586 Underwriting income (loss) 2,007 (12,012) Net investment income 3,689 5,317 2,597 (2,624) 8,979 Other income 75 18 7,307 (7,210) 190 Operating income (loss) 5,771 (6,677) (6,586) — (7,492)Net realized gains (losses) (386) 840 1,120 — 1,574 Unrealized gains on equity securities 344 2,191 2,976 — 5,511 Income (loss) before income taxes $ 5,729 $ (3,646) $ (2,490) $ — $ (407)
Total revenues $ 62,402 $ 131,611 $ 14,000 $ (9,834) $ 198,179
Intangibles $ 1,350 $ 1,194 $ — $ — $ 2,544
Total assets $ 141,524 $ 224,122 $ 154,687 $ (142,707) $ 377,626
For the Year Ended December 31, 2018
AmericanSouthern
BankersFidelity
Corporate& Other
Adjustments& Eliminations Consolidated
Insurance premiums, net $ 53,807 $ 119,124 $ — $ — $ 172,931 Insurance benefits and losses incurred 38,829 93,821 — — 132,650 Expenses deferred (7,893) (14,118) — — (22,011)Amortization and depreciation expense 7,991 9,892 715 — 18,598 Other expenses 14,666 36,514 16,613 (10,506) 57,287 Total expenses 53,593 126,109 17,328 (10,506) 186,524 Underwriting income (loss) 214 (6,985) Net investment income 3,783 5,382 2,895 (2,511) 9,549 Other income 8 7 8,093 (7,995) 113 Operating income (loss) 4,005 (1,596) (6,340) — (3,931)Net realized gains 1,876 3,006 272 — 5,154 Unrealized losses on equity securities (220) (514) (1,460) — (2,194)Income (loss) before income taxes $ 5,661 $ 896 $ (7,528) $ — $ (971)
Total revenues $ 59,254 $ 127,005 $ 9,800 $ (10,506) $ 185,553
Intangibles $ 1,350 $ 1,194 $ — $ — $ 2,544
Total assets $ 122,724 $ 195,663 $ 134,643 $ (108,756) $ 344,274
Note 16. Commitments and Contingencies
Litigation
From time to time, the Company is, and expects to continue to be, involved in various claims and lawsuits incidental to and inthe ordinary course of its business. In the opinion of management, any such known claims are not expected to have a material effecton the financial condition or results of operations of the Company.
56
TABLE OF CONTENTS
Note 17. Subsequent Events
On January 30, 2020, the World Health Organization declared that the recent coronavirus disease 2019 (“COVID-19”) outbreakwas a global health emergency. On March 11, 2020, the World Health Organization raised the COVID-19 outbreak to “pandemic”status. The Company can experience increased risk of loss any time unforeseen infectious diseases impact large portions of apopulation. Specifically, the Company’s Life and Health business could experience significant loss due to increased claims volumearising from COVID-19. As a result of a pandemic, the Company could also experience losses in its investment portfolio as a resultof volatile markets. Due to the recentness of these events, the Company is unable to estimate the amount of losses at this time.However, the Company anticipates that the losses from these events will adversely impact first quarter 2020 financial statementsand potentially beyond.
Item 9. Changes in and Disagreements with Accountants on Accounting and Financial Disclosure
None.
Item 9A. Controls and Procedures
As of the end of the period covered by this report, an evaluation was performed under the supervision and with theparticipation of our management, including the Chief Executive Officer and Chief Financial Officer, of the effectiveness of thedesign and operation of the Company’s disclosure controls and procedures (as defined in Rules 13a-15(e) and 15d-15(e) of theSecurities Exchange Act of 1934). Based on that evaluation, management, including the Chief Executive Officer and ChiefFinancial Officer, concluded that disclosure controls and procedures were effective as of that date.
Management of the Company is responsible for establishing and maintaining adequate internal control over financial reportingfor the Company. The Company’s internal control over financial reporting system has been designed to provide reasonableassurance regarding the reliability and the preparation of financial statements for external purposes in accordance with generallyaccepted accounting principles. Management recognizes that there are inherent limitations in the effectiveness of any internalcontrol system. Because of its inherent limitations, internal control over financial reporting may not prevent or detect allmisstatements. Furthermore, the application of any evaluations of effectiveness on future periods are subject to the risk that controlsmay become inadequate because of changes in conditions, or that the degree of compliance with the policies or procedures maydeteriorate. Therefore, even those systems determined to be effective can provide only reasonable assurance with respect to financialstatement preparation and presentation.
Management assessed the effectiveness of the Company’s internal control over financial reporting as of December 31, 2019based upon the criteria set forth by the Committee of Sponsoring Organizations of the Treadway Commission (COSO) in theupdated 2013 Internal Control – Integrated Framework. Based on that evaluation, management believes that internal control overfinancial reporting as such term is defined in Exchange Act Rule 13a-15(f) was effective as of December 31, 2019.
There were no changes in our internal control over financial reporting that occurred during the fourth quarter of 2019 that havematerially affected, or are reasonably likely to materially affect, our internal control over financial reporting.
This Annual Report does not include an attestation report of the Company’s independent registered public accounting firmregarding internal control over financial reporting. Management’s report was not subject to attestation by the Company’sindependent registered public accounting firm pursuant to certain rules of the Securities and Exchange Commission that exemptsmaller reporting companies, including the Company, from such requirement.
Item 9B. Other Information
None.
57
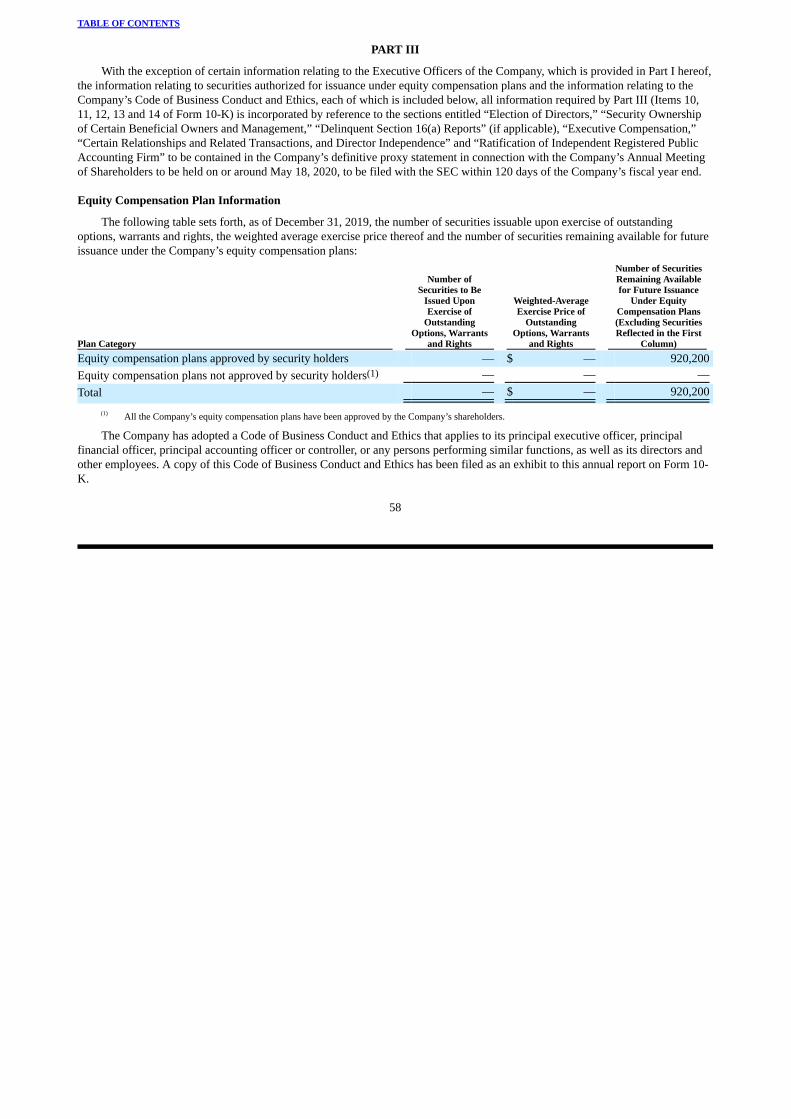
TABLE OF CONTENTS
PART III
With the exception of certain information relating to the Executive Officers of the Company, which is provided in Part I hereof,the information relating to securities authorized for issuance under equity compensation plans and the information relating to theCompany’s Code of Business Conduct and Ethics, each of which is included below, all information required by Part III (Items 10,11, 12, 13 and 14 of Form 10-K) is incorporated by reference to the sections entitled “Election of Directors,” “Security Ownershipof Certain Beneficial Owners and Management,” “Delinquent Section 16(a) Reports” (if applicable), “Executive Compensation,”“Certain Relationships and Related Transactions, and Director Independence” and “Ratification of Independent Registered PublicAccounting Firm” to be contained in the Company’s definitive proxy statement in connection with the Company’s Annual Meetingof Shareholders to be held on or around May 18, 2020, to be filed with the SEC within 120 days of the Company’s fiscal year end.
Equity Compensation Plan Information
The following table sets forth, as of December 31, 2019, the number of securities issuable upon exercise of outstandingoptions, warrants and rights, the weighted average exercise price thereof and the number of securities remaining available for futureissuance under the Company’s equity compensation plans:
Plan Category
Number ofSecurities to Be
Issued UponExercise of
OutstandingOptions, Warrants
and Rights
Weighted-AverageExercise Price of
OutstandingOptions, Warrants
and Rights
Number of SecuritiesRemaining Availablefor Future Issuance
Under EquityCompensation Plans(Excluding SecuritiesReflected in the First
Column)Equity compensation plans approved by security holders — $ — 920,200 Equity compensation plans not approved by security holders(1) — — — Total — $ — 920,200
(1) All the Company’s equity compensation plans have been approved by the Company’s shareholders.
The Company has adopted a Code of Business Conduct and Ethics that applies to its principal executive officer, principalfinancial officer, principal accounting officer or controller, or any persons performing similar functions, as well as its directors andother employees. A copy of this Code of Business Conduct and Ethics has been filed as an exhibit to this annual report on Form 10-K.
58
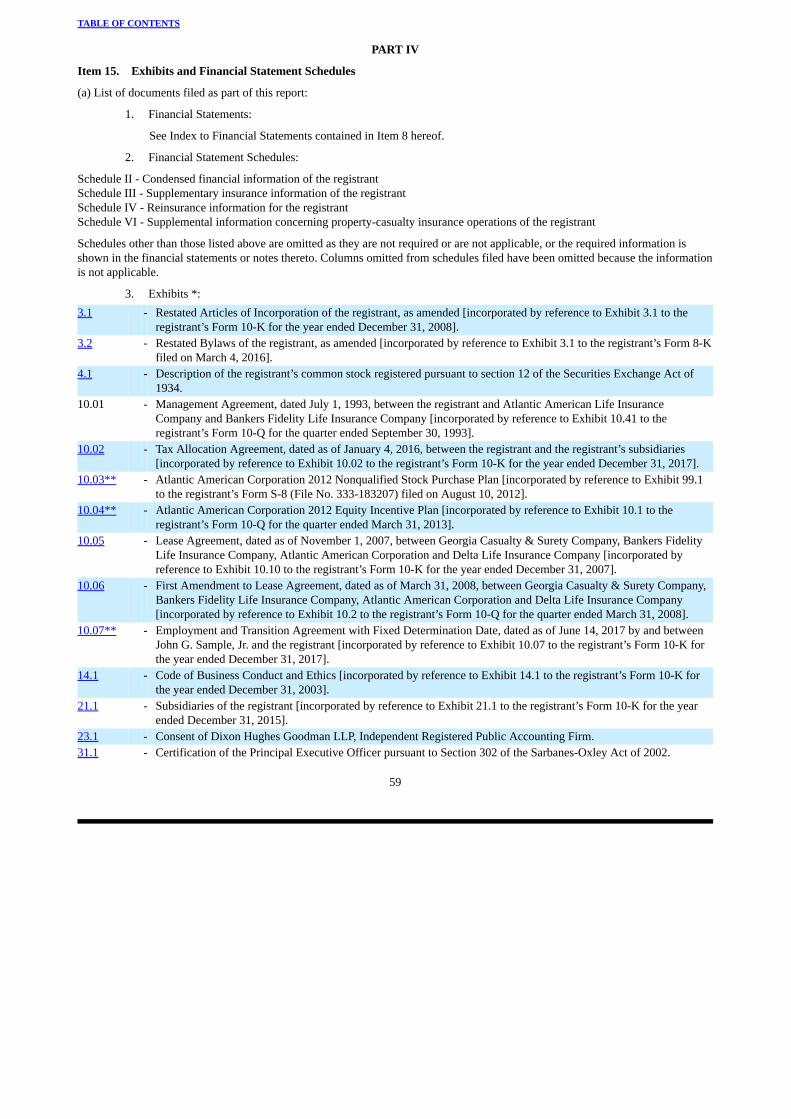
TABLE OF CONTENTS
PART IV
Item 15. Exhibits and Financial Statement Schedules
(a) List of documents filed as part of this report:
1. Financial Statements:
See Index to Financial Statements contained in Item 8 hereof.
2. Financial Statement Schedules:
Schedule II - Condensed financial information of the registrantSchedule III - Supplementary insurance information of the registrantSchedule IV - Reinsurance information for the registrantSchedule VI - Supplemental information concerning property-casualty insurance operations of the registrant
Schedules other than those listed above are omitted as they are not required or are not applicable, or the required information isshown in the financial statements or notes thereto. Columns omitted from schedules filed have been omitted because the informationis not applicable.
3. Exhibits *:3.1 - Restated Articles of Incorporation of the registrant, as amended [incorporated by reference to Exhibit 3.1 to the
registrant’s Form 10-K for the year ended December 31, 2008].3.2 - Restated Bylaws of the registrant, as amended [incorporated by reference to Exhibit 3.1 to the registrant’s Form 8-K
filed on March 4, 2016].4.1 - Description of the registrant’s common stock registered pursuant to section 12 of the Securities Exchange Act of
1934.10.01 - Management Agreement, dated July 1, 1993, between the registrant and Atlantic American Life Insurance
Company and Bankers Fidelity Life Insurance Company [incorporated by reference to Exhibit 10.41 to theregistrant’s Form 10-Q for the quarter ended September 30, 1993].
10.02 - Tax Allocation Agreement, dated as of January 4, 2016, between the registrant and the registrant’s subsidiaries[incorporated by reference to Exhibit 10.02 to the registrant’s Form 10-K for the year ended December 31, 2017].
10.03** - Atlantic American Corporation 2012 Nonqualified Stock Purchase Plan [incorporated by reference to Exhibit 99.1to the registrant’s Form S-8 (File No. 333-183207) filed on August 10, 2012].
10.04** - Atlantic American Corporation 2012 Equity Incentive Plan [incorporated by reference to Exhibit 10.1 to theregistrant’s Form 10-Q for the quarter ended March 31, 2013].
10.05 - Lease Agreement, dated as of November 1, 2007, between Georgia Casualty & Surety Company, Bankers FidelityLife Insurance Company, Atlantic American Corporation and Delta Life Insurance Company [incorporated byreference to Exhibit 10.10 to the registrant’s Form 10-K for the year ended December 31, 2007].
10.06 - First Amendment to Lease Agreement, dated as of March 31, 2008, between Georgia Casualty & Surety Company,Bankers Fidelity Life Insurance Company, Atlantic American Corporation and Delta Life Insurance Company[incorporated by reference to Exhibit 10.2 to the registrant’s Form 10-Q for the quarter ended March 31, 2008].
10.07** - Employment and Transition Agreement with Fixed Determination Date, dated as of June 14, 2017 by and betweenJohn G. Sample, Jr. and the registrant [incorporated by reference to Exhibit 10.07 to the registrant’s Form 10-K forthe year ended December 31, 2017].
14.1 - Code of Business Conduct and Ethics [incorporated by reference to Exhibit 14.1 to the registrant’s Form 10-K forthe year ended December 31, 2003].
21.1 - Subsidiaries of the registrant [incorporated by reference to Exhibit 21.1 to the registrant’s Form 10-K for the yearended December 31, 2015].
23.1 - Consent of Dixon Hughes Goodman LLP, Independent Registered Public Accounting Firm.31.1 - Certification of the Principal Executive Officer pursuant to Section 302 of the Sarbanes-Oxley Act of 2002.
59

TABLE OF CONTENTS
31.2 - Certification of the Principal Financial Officer pursuant to Section 302 of the Sarbanes-Oxley Act of 2002.32.1 - Certifications pursuant to Section 906 of the Sarbanes-Oxley Act of 2002.101.INS - XBRL Instance Document.101.SCH - XBRL Taxonomy Extension Schema.101.CAL - XBRL Taxonomy Extension Calculation Linkbase.101.DEF - XBRL Taxonomy Extension Definition Linkbase.101.LAB - XBRL Taxonomy Extension Label Linkbase.101.PRE - XBRL Taxonomy Extension Presentation Linkbase.
* The registrant agrees to furnish to the Commission upon request a copy of any instruments defining the rights of security holders of the registrant thatmay be omitted from filing in accordance with the Commission’s rules and regulations.
** Management contract, compensatory plan or arrangement required to be filed pursuant to Part IV, Item 15(c) of Form 10-K and Item 601 of RegulationS-K.
Item 16. Form 10-K Summary
None.
60
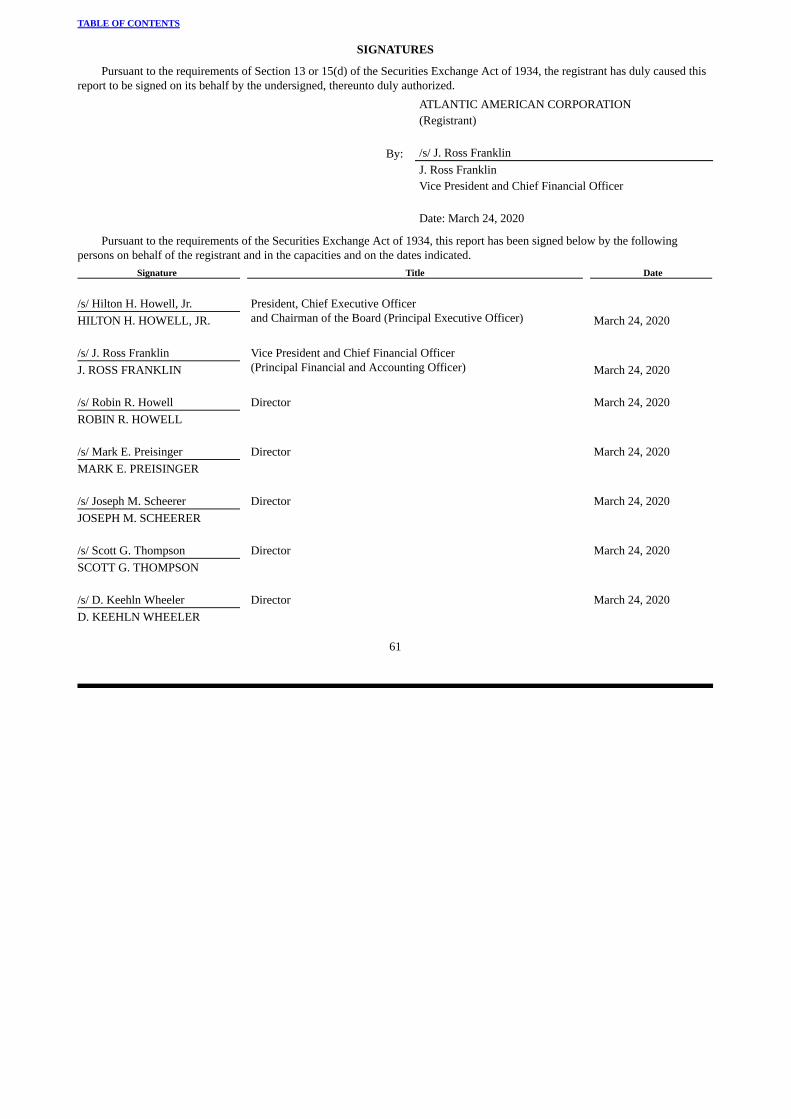
TABLE OF CONTENTS
SIGNATURES
Pursuant to the requirements of Section 13 or 15(d) of the Securities Exchange Act of 1934, the registrant has duly caused thisreport to be signed on its behalf by the undersigned, thereunto duly authorized. ATLANTIC AMERICAN CORPORATION (Registrant) By: /s/ J. Ross Franklin J. Ross Franklin Vice President and Chief Financial Officer Date: March 24, 2020
Pursuant to the requirements of the Securities Exchange Act of 1934, this report has been signed below by the followingpersons on behalf of the registrant and in the capacities and on the dates indicated.
Signature Title Date /s/ Hilton H. Howell, Jr. President, Chief Executive Officer
and Chairman of the Board (Principal Executive Officer) March 24, 2020HILTON H. HOWELL, JR. /s/ J. Ross Franklin Vice President and Chief Financial Officer
(Principal Financial and Accounting Officer) March 24, 2020J. ROSS FRANKLIN /s/ Robin R. Howell Director March 24, 2020ROBIN R. HOWELL /s/ Mark E. Preisinger Director March 24, 2020MARK E. PREISINGER /s/ Joseph M. Scheerer Director March 24, 2020JOSEPH M. SCHEERER /s/ Scott G. Thompson Director March 24, 2020SCOTT G. THOMPSON /s/ D. Keehln Wheeler Director March 24, 2020D. KEEHLN WHEELER
61
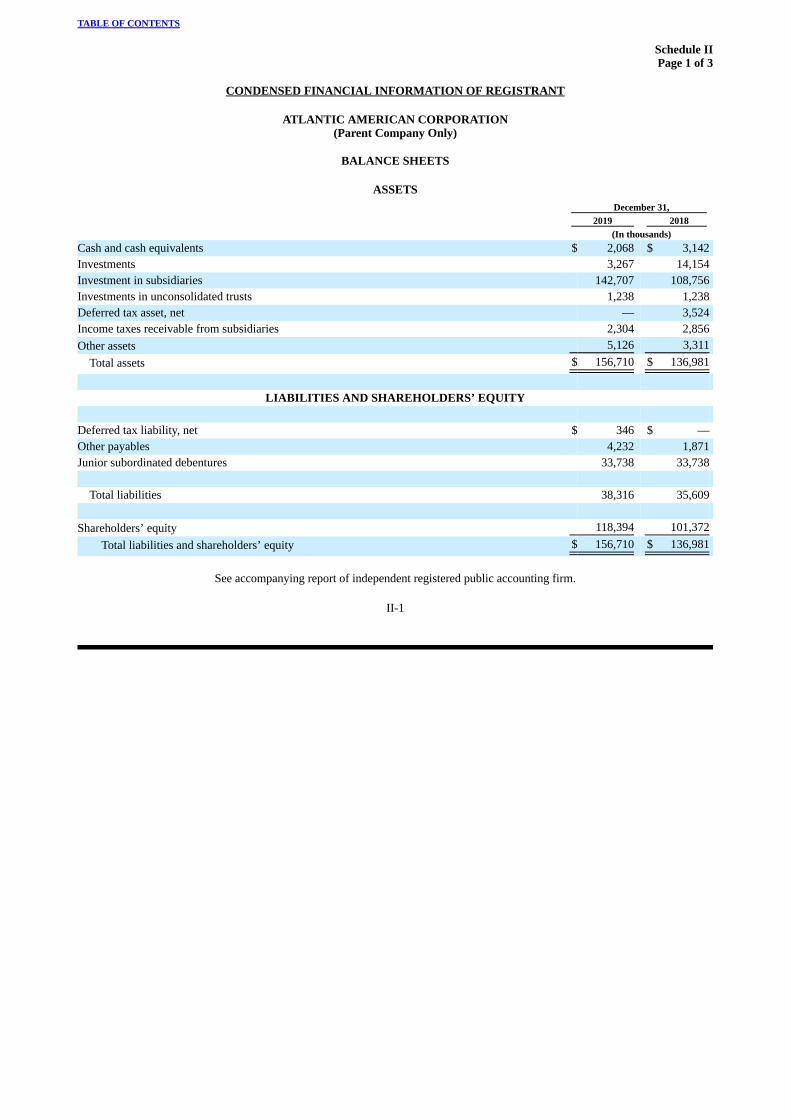
TABLE OF CONTENTS
Schedule IIPage 1 of 3
CONDENSED FINANCIAL INFORMATION OF REGISTRANT
ATLANTIC AMERICAN CORPORATION(Parent Company Only)
BALANCE SHEETS
ASSETS December 31, 2019 2018 (In thousands)Cash and cash equivalents $ 2,068 $ 3,142 Investments 3,267 14,154 Investment in subsidiaries 142,707 108,756 Investments in unconsolidated trusts 1,238 1,238 Deferred tax asset, net — 3,524 Income taxes receivable from subsidiaries 2,304 2,856 Other assets 5,126 3,311
Total assets $ 156,710 $ 136,981
LIABILITIES AND SHAREHOLDERS’ EQUITY
Deferred tax liability, net $ 346 $ — Other payables 4,232 1,871 Junior subordinated debentures 33,738 33,738
Total liabilities 38,316 35,609 Shareholders’ equity 118,394 101,372
Total liabilities and shareholders’ equity $ 156,710 $ 136,981
See accompanying report of independent registered public accounting firm.
II-1

TABLE OF CONTENTS
Schedule IIPage 2 of 3
CONDENSED FINANCIAL INFORMATION OF REGISTRANT
ATLANTIC AMERICAN CORPORATION(Parent Company Only)
STATEMENTS OF OPERATIONS Year Ended December 31, 2019 2018 (In thousands)REVENUE
Fee income from subsidiaries $ 7,210 $ 7,995 Distributed earnings from subsidiaries 4,800 4,800 Unrealized losses on equity securities, net 2,976 (1,460)Other 1,190 752
Total revenue 16,176 12,087 GENERAL AND ADMINISTRATIVE EXPENSES 11,731 12,764 INTEREST EXPENSE 2,130 2,037 2,315 (2,714)INCOME TAX BENEFIT(1) (2,035) (3,544) 4,350 830 EQUITY IN UNDISTRIBUTED EARNINGS OF SUBSIDIARIES, NET (4,736) (1,534)
NET LOSS $ (386) $ (704)
(1) Under the terms of a tax-sharing agreement, income tax provisions for the subsidiary companies are computed on a separate company basis. Accordingly,the Company’s income tax benefit results from the utilization of the Parent’s separate return loss to reduce the consolidated taxable income of theCompany.
See accompanying report of independent registered public accounting firm.
II-2

TABLE OF CONTENTS
Schedule IIPage 3 of 3
CONDENSED FINANCIAL INFORMATION OF REGISTRANT
ATLANTIC AMERICAN CORPORATION(Parent Company Only)
STATEMENTS OF CASH FLOWS Year Ended December 31, 2019 2018 (In thousands)CASH FLOWS FROM OPERATING ACTIVITIES:
Net loss $ (386) $ (704)Adjustments to reconcile net loss to net cash provided by operating activities:
Realized investment gains, net (1,120) (272)Unrealized (gains) losses on equity securities, net (2,976) 1,460 Depreciation and amortization 552 715 Compensation expense related to share awards 353 244 Distributions received from equity method investees 51 183 Equity in undistributed earnings of consolidated subsidiaries 4,736 1,534 Decrease in intercompany taxes 551 24 Deferred income tax benefit (913) (2,236)
Increase (decrease) in accounts payable and accrued expenses 2,360 (214)Other, net (2,314) (190)Net cash provided by operating activities 894 544
CASH FLOWS FROM INVESTING ACTIVITIES:
Proceeds from investments sold, called or matured 3,574 675 Investments purchased (1,060) — Capital contribution to subsidiaries (3,500) (6,000)Additions to property and equipment (44) (219)Net cash used in investing activities (1,030) (5,544)
CASH FLOWS FROM FINANCING ACTIVITIES:
Payment of dividends on Series D preferred stock (399) (399)Payment of dividends on common stock (403) (407)Proceeds from shares issued under stock plans 27 36 Treasury stock acquired — share repurchase authorization (71) (597)Treasury stock acquired — net employee share-based compensation (92) (223)Net cash used in financing activities (938) (1,590)
Net decrease in cash (1,074) (6,590)
Cash and cash equivalents at beginning of year 3,142 9,732 Cash and cash equivalents at end of year $ 2,068 $ 3,142
Supplemental disclosure:
Cash paid for interest $ 2,155 $ 1,996
Cash paid for income taxes $ 1,662 $ 2,107
Intercompany tax settlement from subsidiaries $ 3,335 $ 3,439
See accompanying report of independent registered public accounting firm.
II-3

TABLE OF CONTENTS
Schedule IIIPage 1 of 2
ATLANTIC AMERICAN CORPORATION AND SUBSIDIARIESSUPPLEMENTARY INSURANCE INFORMATION
Segment
DeferredAcquisition
Costs
Future PolicyBenefits,Losses,
Claims andLoss
ReservesUnearnedPremiums
Other PolicyClaims and
BenefitsPayable
(In thousands)December 31, 2019:
Bankers Fidelity $ 36,882 $ 121,657 $ 4,606 $ 1,933 American Southern 1,979 52,281 21,429 —
$ 38,861 $ 173,938(1) $ 26,035 $ 1,933
December 31, 2018:
Bankers Fidelity $ 35,047 $ 113,515 $ 4,712 $ 1,973 American Southern 2,047 49,354 19,494 —
$ 37,094 $ 162,869(2) $ 24,206 $ 1,973
(1) Includes future policy benefits of $92,490 and losses and claims of $81,448.(2) Includes future policy benefits of $90,257 and losses and claims of $72,612.
See accompanying report of independent registered public accounting firm.
III-1
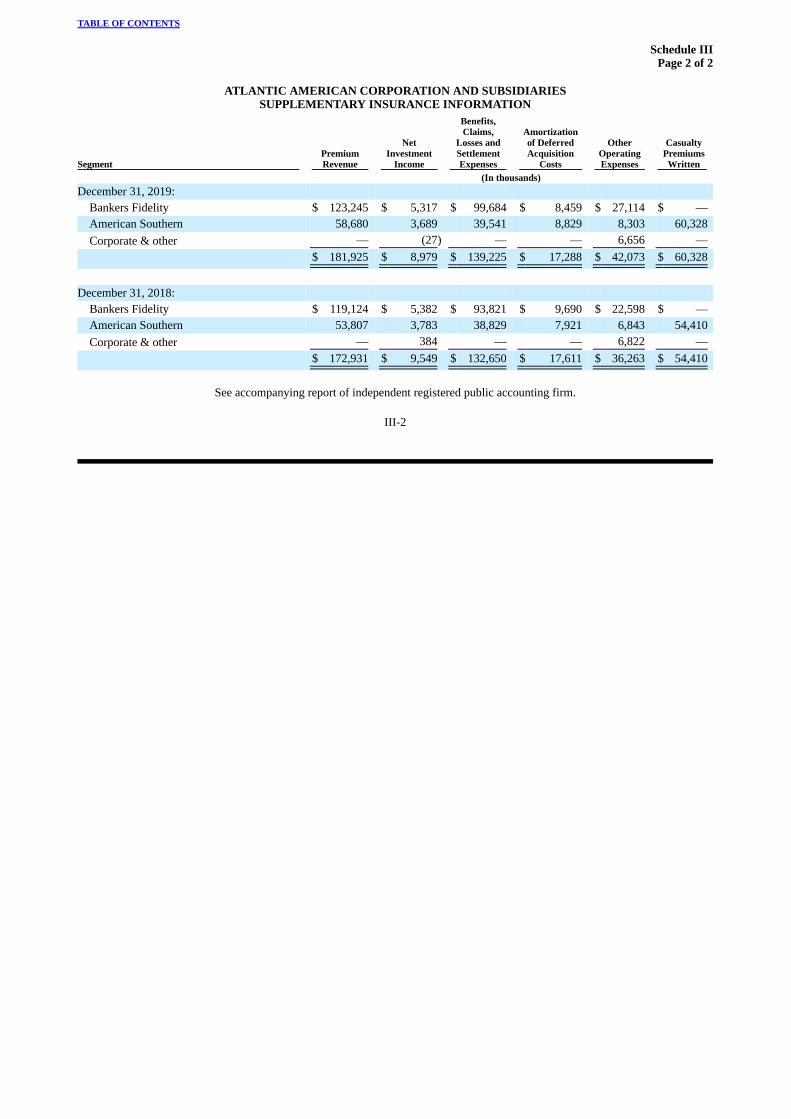
TABLE OF CONTENTS
Schedule IIIPage 2 of 2
ATLANTIC AMERICAN CORPORATION AND SUBSIDIARIESSUPPLEMENTARY INSURANCE INFORMATION
SegmentPremiumRevenue
NetInvestment
Income
Benefits,Claims,
Losses andSettlementExpenses
Amortizationof DeferredAcquisition
Costs
OtherOperatingExpenses
CasualtyPremiumsWritten
(In thousands)December 31, 2019:
Bankers Fidelity $ 123,245 $ 5,317 $ 99,684 $ 8,459 $ 27,114 $ — American Southern 58,680 3,689 39,541 8,829 8,303 60,328 Corporate & other — (27) — — 6,656 —
$ 181,925 $ 8,979 $ 139,225 $ 17,288 $ 42,073 $ 60,328
December 31, 2018:
Bankers Fidelity $ 119,124 $ 5,382 $ 93,821 $ 9,690 $ 22,598 $ — American Southern 53,807 3,783 38,829 7,921 6,843 54,410 Corporate & other — 384 — — 6,822 —
$ 172,931 $ 9,549 $ 132,650 $ 17,611 $ 36,263 $ 54,410
See accompanying report of independent registered public accounting firm.
III-2
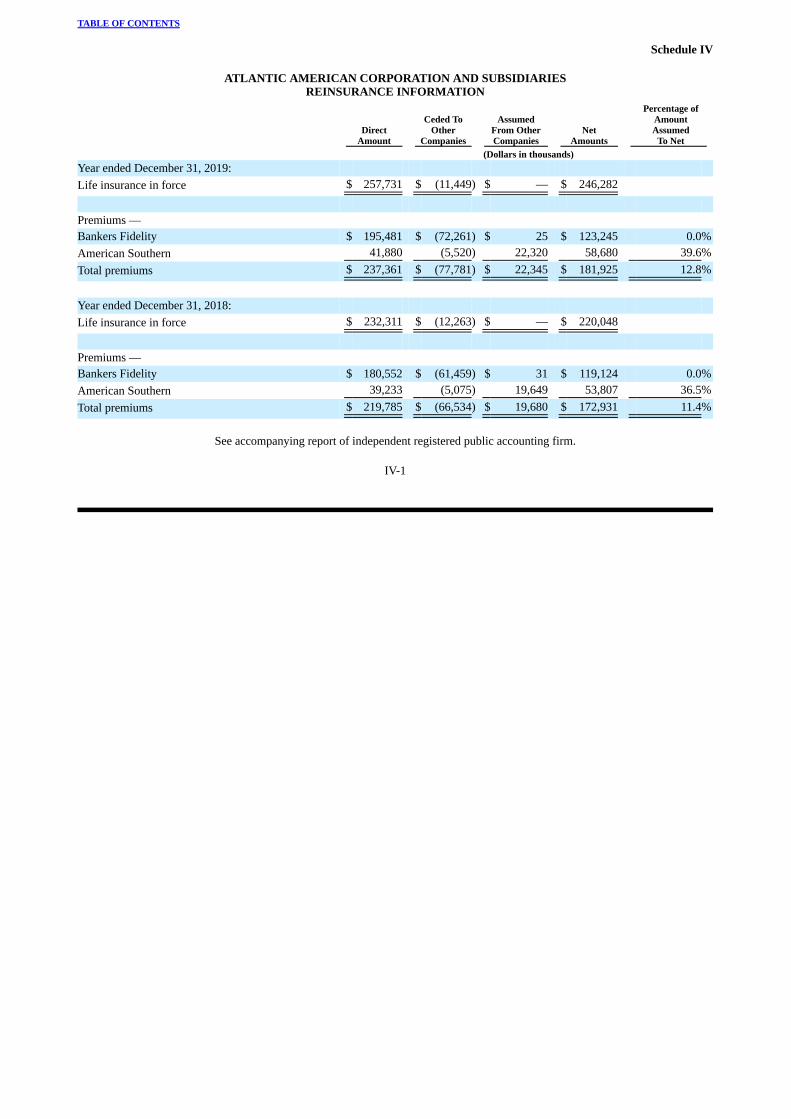
TABLE OF CONTENTS
Schedule IV
ATLANTIC AMERICAN CORPORATION AND SUBSIDIARIESREINSURANCE INFORMATION
Direct
Amount
Ceded ToOther
Companies
AssumedFrom OtherCompanies
NetAmounts
Percentage ofAmountAssumed
To Net (Dollars in thousands)Year ended December 31, 2019: Life insurance in force $ 257,731 $ (11,449) $ — $ 246,282 Premiums — Bankers Fidelity $ 195,481 $ (72,261) $ 25 $ 123,245 0.0%American Southern 41,880 (5,520) 22,320 58,680 39.6%Total premiums $ 237,361 $ (77,781) $ 22,345 $ 181,925 12.8%
Year ended December 31, 2018: Life insurance in force $ 232,311 $ (12,263) $ — $ 220,048 Premiums — Bankers Fidelity $ 180,552 $ (61,459) $ 31 $ 119,124 0.0%American Southern 39,233 (5,075) 19,649 53,807 36.5%Total premiums $ 219,785 $ (66,534) $ 19,680 $ 172,931 11.4%
See accompanying report of independent registered public accounting firm.
IV-1

TABLE OF CONTENTS
Schedule VI
ATLANTIC AMERICAN CORPORATION AND SUBSIDIARIESSUPPLEMENTAL INFORMATION CONCERNING
PROPERTY-CASUALTY INSURANCE OPERATIONS
Year Ended
DeferredPolicy
AcquisitionCosts Reserves
UnearnedPremiums
EarnedPremiums
NetInvestment
Income
Claims and ClaimAdjustment
Expenses IncurredRelated To Amortization
of DeferredAcquisition
Costs
Paid Claimsand Claim
AdjustmentExpenses
PremiumsWritten
CurrentYear
PriorYears
(In thousands)December 31, 2019 $ 1,979 $ 52,281 $ 21,429 $ 58,680 $ 3,689 $ 40,361 $ (820) $ 8,829 $ 37,905 $ 60,328
December 31, 2018 $ 2,047 $ 49,354 $ 19,494 $ 53,807 $ 3,783 $ 39,735 $ (906) $ 7,921 $ 36,680 $ 54,410
See accompanying report of independent registered public accounting firm.
VI-1

EXHIBIT 4.1
DESCRIPTION OF THE REGISTRANT’S COMMON STOCKREGISTERED PURSUANT TO SECTION 12 OF THE SECURITIES EXCHANGE ACT OF 1934
The following description of the common stock of Atlantic American Corporation (the “Company,” “we,” or “our,”) is asummary and does not purport to be complete. This summary is subject to and qualified in its entirety by reference to theBusiness Corporation Code of the State of Georgia (the “GBCC”) the complete text of the Company’s Restated Articles ofIncorporation (the “Charter”), and Restated Bylaws (the “Bylaws”), which are filed as Exhibits 3.1 and 3.2, respectively, to ourAnnual Report on Form 10-K of which this Exhibit 4.1 is a part. We encourage you to read those materials carefully.
Authorized Capital Stock
The Company has one class of securities, our common stock, par value $1.00 per share, registered under Section 12 of theSecurities Exchange Act of 1934, as amended. Our authorized capital stock consists of 50,000,000 shares of common stock and4,000,000 shares of preferred stock, par value $1.00 per share, of which (i) 30,000 shares of preferred stock have been designatedas Series A Convertible Preferred Stock; (ii) 134,000 shares of preferred stock have been designated as Series B Preferred Stock;(iii) 100,000 shares of preferred stock have been designated as Series C Preferred Stock; and (iv) 10,000 shares of preferred stockhave been designated as Series D Preferred Stock.
Common Stock
Voting rights. Holders of our common stock are entitled to one vote for each share on all matters voted on by ourstockholders. The Bylaws provide that directors are elected by the vote of the plurality of the votes cast with respect to thatdirector’s election at any meeting for the election of directors at which a quorum is present. All directors are elected at eachannual meeting of stockholders for a one-year term and until his or her successor shall have been duly elected and qualified,unless he or she shall cease to serve by reason of death, resignation or other cause. Holders of our common stock do not havecumulative voting rights in the election of directors.
For all other matters, the affirmative vote of a majority of the votes present at the meeting of stockholders and entitled tovote on the matter presented shall be the act of the stockholders.
Subscription, Redemption or Conversion Privileges. Holders of our common stock do not have any subscription,redemption or conversion privileges. Holders of our common stock do not have any pre-emptive right to purchase, subscribe foror otherwise acquire stock of any class of the Company or any security convertible into, or any warrant, option or right topurchase, subscribe for or otherwise acquire stock of any class of the Company, whether now or hereafter authorized. Alloutstanding shares of common stock are validly issued, fully paid and non-assessable.

Dividends. Subject to the preferences or other rights of any preferred stock that may be issued from time to time, holdersof our common stock are entitled to participate ratably in dividends on our common stock as declared by our board of directors(our “Board”).
Liquidation. Holders of our common stock are entitled to share ratably in all assets available for distribution tostockholders in the event of our liquidation or dissolution, subject to distribution of any accrued but unpaid dividends and thepreferential amount, if any, to be distributed to holders of our preferred stock.
Stock Exchange Listing
Our common stock is listed on the Nasdaq Stock Market under the symbol “AAME.”
Certain Factors Affecting Control of the Company
General. Certain provisions of the Charter, the Bylaws and the GBCC described in this section may delay or make moredifficult acquisitions or changes of control of the Company not approved by our Board. In addition, our officers, directors andtheir families, directly and indirectly, own approximately 75% of the outstanding common stock of the Company. Accordingly,on significantly all matters requiring a majority or greater shareholder vote, our officers, directors and their families effectivelycontrol the vote. Such ownership effectively precludes any other shareholder from acquiring any number of shares in an attemptto exercise any degree of control over the Company. Together, the provisions discussed below and the concentration of ownershipof our common stock could have the effect of discouraging third parties from making proposals involving an acquisition orchange of control of the Company, although these kinds of proposals, if made, might be considered desirable by individualstockholders. These provisions may also have the effect of making it more difficult for third parties to cause the replacement ofour current management without the concurrence of our Board.
Number of Directors; Removal; Vacancies. The Bylaws provide that the number of directors shall be not less than fiveand not more than fifteen, with the exact number to be fixed from time to time by our board of directors. The Bylaws also providethat newly created directorships resulting from any increase in the authorized number of directors or any vacancies in the Boardresulting from death, resignation or other cause may be filled only by a majority vote of the directors then in office, though lessthan a quorum, or by a sole remaining director. This provision could have the effect of discouraging a potential acquiror fromattempting to obtain control of the Company.
Stockholder Action by Written Consent; Special Meetings. The Bylaws provide that stockholder action can be taken at anannual or special meeting of stockholders. Stockholders can also be taken by unanimous written consent.
The Bylaws provide that special meetings of the stockholders may be called by the chairman of the Board, the Board orthe president of the Company or upon the written request of stockholders representing in the aggregate at least 25% of theoutstanding voting stock of the Company entitled to vote at an election of directors. Due to the substantial ownership stake ourdirectors and officers hold in the Company, these provisions could delay a stockholder vote on certain matters, such as businesscombinations and removal of directors, and could have the effect of discouraging a potential acquiror from making a tender offer.
2
Amendment of the Certificate of Incorporation. Any proposal to amend, alter, change or repeal any provision of theCharter requires, except in special circumstances, a recommendation by our Board and the affirmative vote of a majority vote ofthe voting power of all of the shares of our capital stock entitled to vote on such change.
Preferred Stock and Additional Common Stock. Under the Charter, our Board has the authority to provide by resolutionfor the issuance of shares of one or more classes or series of preferred stock. Our Board is authorized to fix by resolution theterms and conditions of each such other class or series. The authorized shares of our preferred stock, as well as authorized butunissued shares of our common stock, are available for issuance without further action by our stockholders, unless stockholderaction is required by applicable law or the rules of Nasdaq or any other stock exchange on which any class or series of our stockmay then be listed. These provisions give our Board the power to approve the issuance of a class or series of our preferred capitalstock, or additional shares of our common stock, that could, depending on the terms of the stock, either impede or facilitate thecompletion of a merger, tender offer or other takeover attempt. For example, the issuance of new shares might impede a businesscombination if the terms of those shares include voting rights which would enable a holder to block business combinations.Alternatively, the issuance of new shares might facilitate a business combination if those shares have general voting rightssufficient to cause an applicable percentage vote requirement to be satisfied.
Georgia Business Combination Statute. The Company is subject to the “business combination” provisions of Section 203of the GBCC. In general, such provisions prohibit a Georgia corporation from engaging in various “business combination”transactions with any interested stockholder for a period of five years after the date of the transaction in which the person becamean interested stockholder, unless the business combination is approved in a prescribed manner. The statute could prohibit or delaymergers or other takeover or change in control attempts with respect to the Company and, accordingly, may discourage attemptsto acquire the Company even though such a transaction may offer the Company’s shareowners the opportunity to sell their stockat a price above the prevailing market price.
Exclusive Forum
Our Bylaws provide that, unless we consent in writing to the selection of another forum, a state or federal court locatedwithin the State of Georgia shall be the exclusive forum for (i) any derivative action or proceeding brought on behalf of theCompany, (ii) any action asserting a claim of breach of a fiduciary duty owed by any director, officer or other employee of theCompany to the Company or the Company’s stockholders, (iii) any action asserting a claim arising pursuant to any provision ofthe GBCC, the Charter or the Bylaws, or (iv) any action asserting a claim governed by the internal affairs doctrine. Although webelieve this provision benefits us by providing increased consistency in the application of Georgia law in the types of lawsuits towhich it applies, the provision may have the effect of discouraging lawsuits against our directors and officers. The enforceabilityof similar choice of forum provisions in other companies’ bylaws and certificates of incorporation has been challenged in legalproceedings, and it is possible that, in connection with any action, a court could find the choice of forum provisions contained inour Bylaws to be inapplicable or unenforceable in such action.
3

EXHIBIT 23.1
CONSENT OF DIXON HUGHES GOODMAN LLPINDEPENDENT REGISTERED PUBLIC ACCOUNTING FIRM
Board of Directors and ShareholdersAtlantic American CorporationAtlanta, Georgia
We consent to the incorporation by reference in the registration statements (Nos. 333-183207 and 333-183210) on Form S-8 ofAtlantic American Corporation of our report dated March 24, 2020, with respect to the consolidated financial statements andschedules of Atlantic American Corporation as of and for the year ended December 31, 2019, which report appears in AtlanticAmerican Corporation’s Annual Report on Form 10-K.
/s/ Dixon Hughes Goodman LLPAtlanta, GeorgiaMarch 24, 2020

Date: March 24, 2020 /s/ Hilton H. Howell, Jr. Hilton H. Howell, Jr. President and Chief Executive Officer
EXHIBIT 31.1
CERTIFICATION OF THE PRINCIPAL EXECUTIVE OFFICERPURSUANT TO SECTION 302 OF THE SARBANES-OXLEY ACT OF 2002
I, Hilton H. Howell, Jr., certify that:
1. I have reviewed this annual report on Form 10-K of Atlantic American Corporation;
2. Based on my knowledge, this report does not contain any untrue statement of a material fact or omit to state a material factnecessary to make the statements made, in light of the circumstances under which such statements were made, notmisleading with respect to the period covered by this report;
3. Based on my knowledge, the financial statements, and other financial information included in this report, fairly present inall material respects the financial condition, results of operations and cash flows of the registrant as of, and for, the periodspresented in this report;
4. The registrant’s other certifying officer and I are responsible for establishing and maintaining disclosure controls andprocedures (as defined in Exchange Act Rules 13a-15(e) and 15d-15(e)) and internal control over financial reporting (asdefined in Exchange Act Rules 13a-15(f) and 15d-15(f)) for the registrant and have:
a) designed such disclosure controls and procedures, or caused such disclosure controls and procedures to be designedunder our supervision, to ensure that material information relating to the registrant, including its consolidatedsubsidiaries, is made known to us by others within those entities, particularly during the period in which this report isbeing prepared;
b) designed such internal control over financial reporting, or caused such internal control over financial reporting to bedesigned under our supervision, to provide reasonable assurance regarding the reliability of financial reporting andthe preparation of financial statements for external purposes in accordance with generally accepted accountingprinciples;
c) evaluated the effectiveness of the registrant’s disclosure controls and procedures and presented in this report ourconclusions about the effectiveness of the disclosure controls and procedures, as of the end of the period covered bythis report based on such evaluation; and
d) disclosed in this report any change in the registrant’s internal control over financial reporting that occurred during theregistrant’s most recent fiscal quarter (the registrant’s fourth fiscal quarter in the case of an annual report) that hasmaterially affected, or is reasonably likely to materially affect, the registrant’s internal control over financialreporting; and
5. The registrant’s other certifying officer and I have disclosed, based on our most recent evaluation of internal control overfinancial reporting, to the registrant’s auditors and the audit committee of registrant’s board of directors (or personsperforming the equivalent functions):
a) all significant deficiencies and material weaknesses in the design or operation of internal control over financialreporting which are reasonably likely to adversely affect the registrant’s ability to record, process, summarize andreport financial information; and
b) any fraud, whether or not material, that involves management or other employees who have a significant role in theregistrant’s internal control over financial reporting.
Date: March 24, 2020 /s/ J. Ross Franklin J. Ross Franklin Vice President and Chief Financial Officer
EXHIBIT 31.2
CERTIFICATION OF THE PRINCIPAL FINANCIAL OFFICERPURSUANT TO SECTION 302 OF THE SARBANES-OXLEY ACT OF 2002
I, J. Ross Franklin, certify that:
1. I have reviewed this annual report on Form 10-K of Atlantic American Corporation;
2. Based on my knowledge, this report does not contain any untrue statement of a material fact or omit to state a material factnecessary to make the statements made, in light of the circumstances under which such statements were made, notmisleading with respect to the period covered by this report;
3. Based on my knowledge, the financial statements, and other financial information included in this report, fairly present inall material respects the financial condition, results of operations and cash flows of the registrant as of, and for, the periodspresented in this report;
4. The registrant’s other certifying officer and I are responsible for establishing and maintaining disclosure controls andprocedures (as defined in Exchange Act Rules 13a-15(e) and 15d-15(e)) and internal control over financial reporting (asdefined in Exchange Act Rules 13a-15(f) and 15d-15(f)) for the registrant and have:
a) designed such disclosure controls and procedures, or caused such disclosure controls and procedures to be designedunder our supervision, to ensure that material information relating to the registrant, including its consolidatedsubsidiaries, is made known to us by others within those entities, particularly during the period in which this report isbeing prepared;
b) designed such internal control over financial reporting, or caused such internal control over financial reporting to bedesigned under our supervision, to provide reasonable assurance regarding the reliability of financial reporting andthe preparation of financial statements for external purposes in accordance with generally accepted accountingprinciples;
c) evaluated the effectiveness of the registrant’s disclosure controls and procedures and presented in this report ourconclusions about the effectiveness of the disclosure controls and procedures, as of the end of the period covered bythis report based on such evaluation; and
d) disclosed in this report any change in the registrant’s internal control over financial reporting that occurred during theregistrant’s most recent fiscal quarter (the registrant’s fourth fiscal quarter in the case of an annual report) that hasmaterially affected, or is reasonably likely to materially affect, the registrant’s internal control over financialreporting; and
5. The registrant’s other certifying officer and I have disclosed, based on our most recent evaluation of internal control overfinancial reporting, to the registrant’s auditors and the audit committee of registrant’s board of directors (or personsperforming the equivalent functions):
a) all significant deficiencies and material weaknesses in the design or operation of internal control over financialreporting which are reasonably likely to adversely affect the registrant’s ability to record, process, summarize andreport financial information; and
b) any fraud, whether or not material, that involves management or other employees who have a significant role in theregistrant’s internal control over financial reporting.

Date: March 24, 2020 /s/ Hilton H. Howell, Jr. Hilton H. Howell, Jr. President and Chief Executive Officer Date: March 24, 2020 /s/ J. Ross Franklin J. Ross Franklin Vice President and Chief Financial Officer
EXHIBIT 32.1
Certifications Pursuant to §906 of the Sarbanes-Oxley Act of 2002
Pursuant to 18 U.S.C. §1350, as adopted pursuant to §906 of the Sarbanes-Oxley Act of 2002, in connection with the filing ofthe Annual Report on Form 10-K of Atlantic American Corporation (the “Company”) for the year ended December 31, 2019, asfiled with the Securities and Exchange Commission on the date hereof (the “Report”), each of the undersigned officers of theCompany certifies, that, to such officer’s knowledge:
(1) The Report fully complies with the requirements of Section 13 (a) or 15 (d) of the Securities Exchange Act of 1934; and
(2) The information contained in the Report fairly presents, in all material respects, the financial condition and results ofoperations of the Company as of the dates and for the periods expressed in the Report.
A signed original of this written statement required by Section 906 has been provided to the Company and will be retained bythe Company and furnished to the Securities and Exchange Commission or its staff upon request.