atlantic city · atlantic city, new jersey, was a popular beach resort that attracted tourists from...
TRANSCRIPT

ATLANTIC CITY: PAST AS PROLOGUE
Ten Independence Mall Philadelphia, PA 19106-1574
www.philadelphiafed.org
ATLANTIC CITY: PAST AS PROLOGUEA Special Report by the Community Affairs Department

ACKNOWLEDGMENTS
Many people contributed to this report. In particular, we owe a debt of gratitude to the Atlantic City residents and the Atlantic City stakehold-
ers from public, private, and nonprofit institutions whose willingness to speak with us about their community was critical to our understanding of
the city. We also want to acknowledge Sally Burke’s work in editing the report and Ashlan Portas’s work in preparing it for print. Edward Ellers
offered valuable comments on a number of sections of the report. Christine Quinn and Katherine Toran provided excellent research assistance.
ATLANTIC CITY: PAST AS PROLOGUE
Harriet NewburgerFederal Reserve Bank of Philadelphia
With
Anita SandsARI Planning & Research, Inc.
and
John WackesFederal Reserve Bank of Philadelphia
ATLANTIC CITY: PAST AS PROLOGUE III
TABLE OF CONTENTS
Executive Summary ........................................................................................ v
Introduction ................................................................................................... 1
The Beach Resort: From Establishment to Decline ........................................ 3
Origins and Growth ................................................................................ 3
Underpinnings of the Resort City: The Resident Labor Force ................. 5
Discrimination and Segregation .............................................................. 8
Decline of the Beach Resort .................................................................... 9
Atlantic City’s Recovery: The Role Envisioned for Legalized Gambling ....... 11
Key Provisions of the Casino Control Act ............................................. 11
Meeting the Goals of the Casino Control Act: An Overview ................ 12
Trends in Atlantic City Since the Advent of Gambling ................................ 15
Demographic Changes .......................................................................... 15
Changes in Private-Sector Economic Activity ...................................... 18
Trends in Resident Employment and Income ........................................ 21
Atlantic City as Residence: Trends in Housing ..................................... 28
A Note on Local Government Post-Gambling ...................................... 32
The Gambling Industry as a Unique Tool of Urban Redevelopment ............. 35
The Labor Force Paradox ...................................................................... 36
Questions for Policymakers Considering the Introduction
or Expansion of Gaming Activity .......................................................... 37
Atlantic City’s Future: A Brief Note ............................................................ 41
Appendix A: The Atlantic City Gambling Industry ..................................... 43
Appendix B: Atlantic County in the Post-Casino Era .................................. 53
References .................................................................................................... 63
ATLANTIC CITY: PAST AS PROLOGUE V
From the mid-19th to the mid-20th century,
Atlantic City, New Jersey, was a popular beach resort
that attracted tourists from all walks of life. Statistics
give us some idea of how the city blossomed during
the resort’s heyday. In 1858, the city registered 3,000
visitors; by 1910, it was welcoming 3 million visitors
annually. This number peaked at 16 million visitors
a year in 1939. Over these years, the city also saw
a concomitant rise in its population, individuals
attracted to the area because of the jobs created by
the burgeoning tourist industry. In 1860, Atlantic
City had 687 residents; by 1915, it was boasting a
population of 56,000; and the 1930 census recorded
a peak of just over 66,000 residents.
Atlantic City residents differed economically
and demographically from residents in other New
Jersey cities and the state as a whole. Service-
sector jobs and seasonal employment characterized
the city’s tourist industry. Given the city’s climate,
the summer months drew the most tourists, and
consequently, unemployment rose in the first and
last quarters of the year. As early as 1881, the city
council started to set aside funds to help the poor
in the off-season. In addition, a large proportion of
Atlantic City’s workforce was African-American,
related to the large increase in the supply of black
labor available for hire after the Civil War. By 1915,
21 percent of the city’s population was black. The
seasonal nature of the city’s employment, which
consisted of mostly low-paying service-sector jobs,
and the large number of low-paid African Americans
in the workforce likely contributed to Atlantic City’s
having very low household incomes compared with
the rest of the state.
Despite its long run as a popular seaside
vacation town, Atlantic City’s success in attracting
tourists fell after World War II. Among other
things, more affordable airfare and an expanded
interstate highway system gave tourists more
options for spending both their leisure time and
their discretionary income. In addition, new resorts
such as Disneyland overshadowed Atlantic City’s
attractions.
The postwar decline was steep. Between
1960 and 1980 the city’s population dropped from
more than 59,000 to just over 40,000; it was mostly
the white population that exited. As tourism and
the resident population declined, many businesses
closed and much of the city’s housing stock became
dilapidated and was abandoned.
In the early 1970s, an idea took hold that
legalized gambling could reverse the city’s fortunes.
In 1976, New Jersey voters passed a referendum
to bring the gaming industry to the city, and in
1977, the New Jersey legislature passed the Casino
Control Act (CCA). The CCA’s key provisions
included revitalizing tourism and using gambling
as a “unique tool” to support Atlantic City’s urban
ATLANTIC CITY: PAST AS PROLOGUEEXECUTIVE SUMMARY

VI ATLANTIC CITY: PAST AS PROLOGUE
redevelopment. The efforts supported by the
CCA would also maintain the “existing tone of
the hospitality industry” and strict regulation and
control would “maintain and retain integrity, public
confidence, and trust” in casino operations.
Initially, the CCA required casinos to
reinvest part of their revenues in projects that would
improve the health and well-being of the city and
the state at large. But a loophole in the law also
allowed the casinos to ignore this requirement,
and by 1984, the CCA had not engendered any
significant reinvestment in the city. That same year
state lawmakers amended the CCA to establish
the Casino Reinvestment Development Authority
(CRDA), whose stated purpose was to redevelop
blighted areas in Atlantic City and elsewhere in the
state, with a focus on low- and moderate-income
households. This amendment required casinos
to invest a portion of their revenues in CRDA-
sponsored projects for the first 30 years of their
existence. Subsequent amendments to the CCA
expanded the range of allowable CRDA activities
to encompass economic development projects,
including some that directly benefit casinos, and
expanded the length of the CRDA obligation to 50
years.
The first casino to open under the CCA
was Resorts, in 1978. By 1987, the number of
casinos had increased to 12 and stayed there until
2006, when one of the casinos closed. The number
has remained at 11 since then. More casinos are
scheduled to open in the future, although the
timetable for doing so has been delayed by the
current credit crisis.
The casinos have rejuvenated Atlantic City’s
tourist industry and, to some extent, its employment.
The number of visitors has soared from 7 million in
1978 to between 30 and 35 million annually since
1988, the first full year that all 12 casinos were in
operation. The casinos have also provided more
than 40,000 jobs. In addition, a new convention
center opened in 1997, and several high-end
retailers and restaurants have also set up shop
catering to the tourist trade.
Although these numbers are impressive, we
have to look beyond them to see what has actually
happened in Atlantic City. In most years since
1988, the casinos have provided jobs for more than
10,000 city residents, more than half of the city’s
employed residents. In 2000, casinos provided 80
percent of the property tax collected by the city, a
factor that allows the city’s school district to spend
$1500 more per pupil than the state average. But
many of the problems that legalized gambling was
supposed to alleviate remain severe. Atlantic City’s
unemployment and poverty rates are considerably
higher than those in the rest of New Jersey and the
nation. The 2000 census reported that 19 percent of
the population lived in census tracts that meet the
definition of extreme poverty neighborhoods; that
is, they had poverty rates of at least 40 percent. Per
capita income in the city is among the lowest in the
state.
Compounding the situation are a high
crime rate, an active drug trade, and gang activity.
Also, despite the city’s high per pupil spending,
the graduation rate for Atlantic City students is
considerably lower than that for the state as a
whole. Vacant houses and lots are a common sight,
residents have access to few retail outlets, and the
city has no supermarket. Furthermore, the level of
noncasino employment has declined significantly.
Many questions arise as to why legalized
gambling has not fully lived up to its promise as a
“unique tool” for Atlantic City’s urban redevelopment.
These questions apply not just to Atlantic City and
New Jersey but to other cities and states considering
legalized gambling as an urban redevelopment or
ATLANTIC CITY: PAST AS PROLOGUE VII
general economic development tool. Among the
questions policymakers should ask are:
• To what extent do high rates of unemploy-
ment and low levels of labor force participa-
tion stem from a failure to provide workers
with the training necessary to take advan-
tage of jobs in the gaming industry?
• Would support services increase the likeli-
hood that workers from low-income house-
holds and neighborhoods could obtain and
maintain jobs in the gaming industry?
• Does the framework for regulating the casino
industry have unintended effects on employ-
ment opportunities for residents of the local
community?
• Can gambling-financed redevelopment
agencies, such as New Jersey’s CRDA, be
designed to be more effective tools of urban
redevelopment?
• To what extent can a state’s gaming legislation
be designed to encourage better coordination
among government agencies, residents, and
other stakeholders — while discouraging cor-
ruption — so that tax revenues raised by gam-
bling are more effective in achieving commu-
nity and economic development objectives?
The following report offers data and analysis
that may help policymakers in New Jersey and
elsewhere answer these and other questions when
they consider inviting legalized gambling to their
precincts. The report starts with a brief history
of Atlantic City, then examines the context in
which legalized gambling came to town and the
socio-economic trends that have characterized
the city since gambling’s advent. These sections
provide background for considering the paradox
that Atlantic City presents today as a place where
plentiful jobs are juxtaposed with high levels of
poverty and unemployment. The conclusion briefly
outlines issues that may affect the balance between
Atlantic City as place of residence and Atlantic City
as gambling mecca in the future.
The report’s two appendices present (1)
detailed information on Atlantic City’s gambling
industry and (2) economic and socio-demographic
trends in Atlantic County, where Atlantic City is
located, since the casinos arrived. A case study
on concentrated poverty in Atlantic City that is a
forerunner to the current report is available at http://
www.frbsf.org/cpreport/docs/atlantic_city_nj.pdf.

ATLANTIC CITY: PAST AS PROLOGUE 1
Atlantic City, located on a barrier island
off the coast of New Jersey, is best known today as
a gambling destination.1 In 2005, the city attracted
35 million visitors, a number surpassed among
U.S. cities only by Orlando, New York City, and
Las Vegas.2 In the same year, the city’s 12 casinos
provided more than 40,000 jobs,3 a number about
the same as the size of the city’s population reported
in the 2000 census. Yet despite the scale of the
casino industry, the city suffers from high poverty
and high unemployment rates. The 2000 census
reported these rates at 23.6 percent and 12.9
percent, respectively, much higher than for the U.S.
as a whole.4
1 From the late 1970s through the late 1980s, Atlantic City was the only U.S. jurisdiction outside of Nevada that had legalized commer-cial casino gambling. Currently, although an additional 10 states have commercial casinos in operation, Atlantic City continues to rank second, after Nevada, in commercial casino revenues. (Penn-sylvania has one commercial casino, which opened in Monroe County at the end of 2007.) Twelve states, including Pennsylvania, New York, and Delaware, have racetrack casinos. A number of states have casinos located on Indian tribal lands; these are not classified as “commercial” casinos.(Source: American Gaming As-sociation. See http://www.americangaming.org/Industry/factsheets/general_info_detail.cfv?id=15.) 2 Official Atlantic City, New Jersey, Travel Guide. See http://www.atlanticcitynj.com/3 The 12 casinos included the Sands, which closed in November 2006. Currently, the city has 11 casinos. Data on the number of jobs come from the New Jersey Casino Control Commission’s Eco-nomic Impact Statements, which can be accessed at http://www.state.nj.us/casinos/financia/histori/.4 The corresponding percentages from the 2000 census for the U.S. as a whole were 12.4 percent and 5.8 percent. Note that poverty
Today’s gambling mecca is not Atlantic
City’s first incarnation as a popular tourist resort.
From the mid-19th to the mid-20th century, the
city was an extremely successful beach resort.
Sandwiched between its first and second lives as
a resort was a period of sharp decline. Today’s city
both recalls the days of the beach resort and retains
many of the problems associated with the years that
immediately preceded casino gambling.
In the spring and summer of 2007, members
of the Federal Reserve Bank of Philadelphia’s
Community Affairs Department studied
concentrated poverty in three Atlantic City census
tracts as part of a joint research effort on this
topic undertaken by the Federal Reserve System’s
Community Affairs offices.5 The current report,
whose focus is Atlantic City as a whole, is a follow-
up to the concentrated poverty effort, hereafter
referred to as the “concentrated poverty case study,”6
and it is aimed at providing a greater understanding
of past and present factors that influence the well-
being of the city and its residents today.
and income data are reported in the census for the preceding year, in this case, 1999.5 Findings from this research, which was conducted in collaboration with the Metropolitan Policy Program at the Brookings Institution, are reported in The Enduring Challenge of Concentrated Poverty in America: Case Studies from Communities Across the U.S., available at http://www.frbsf.org/cpreport/.6 The case study on concentrated poverty in Atlantic City is avail-able at http://www.frbsf.org/cpreport/docs/atlantic_city_nj.pdf.
ATLANTIC CITY: PAST AS PROLOGUEINTRODUCTION

2 ATLANTIC CITY: PAST AS PROLOGUE
The report starts with a brief history of the
beach resort, then examines the context in which
legalized gambling came to Atlantic City and the
socio-economic trends that have characterized
the city since gambling’s advent. These sections
provide background for consideration of the paradox
that Atlantic City today is a city where plentiful
jobs are juxtaposed with high levels of poverty and
unemployment. A concluding note briefly considers
issues that may affect the balance between Atlantic
City as place of residence and Atlantic City as
gambling mecca in the future.
The report also contains two appendices.
The first provides detailed information on the
Atlantic City gambling industry, and the second
considers economic and socio-demographic trends
in Atlantic County, where Atlantic City is located,
since the advent of casinos.
ATLANTIC CITY: PAST AS PROLOGUE 3
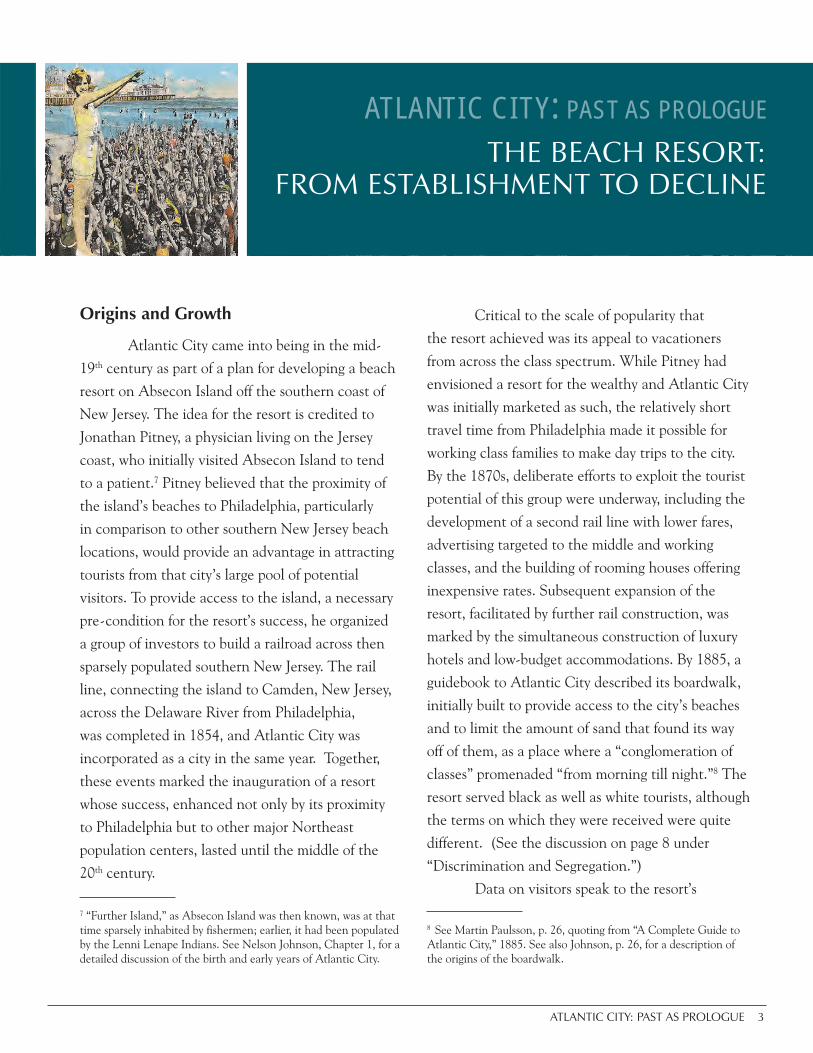
Origins and Growth
Atlantic City came into being in the mid-
19th century as part of a plan for developing a beach
resort on Absecon Island off the southern coast of
New Jersey. The idea for the resort is credited to
Jonathan Pitney, a physician living on the Jersey
coast, who initially visited Absecon Island to tend
to a patient.7 Pitney believed that the proximity of
the island’s beaches to Philadelphia, particularly
in comparison to other southern New Jersey beach
locations, would provide an advantage in attracting
tourists from that city’s large pool of potential
visitors. To provide access to the island, a necessary
pre-condition for the resort’s success, he organized
a group of investors to build a railroad across then
sparsely populated southern New Jersey. The rail
line, connecting the island to Camden, New Jersey,
across the Delaware River from Philadelphia,
was completed in 1854, and Atlantic City was
incorporated as a city in the same year. Together,
these events marked the inauguration of a resort
whose success, enhanced not only by its proximity
to Philadelphia but to other major Northeast
population centers, lasted until the middle of the
20th century.
7 “Further Island,” as Absecon Island was then known, was at that time sparsely inhabited by fishermen; earlier, it had been populated by the Lenni Lenape Indians. See Nelson Johnson, Chapter 1, for a detailed discussion of the birth and early years of Atlantic City.
Critical to the scale of popularity that
the resort achieved was its appeal to vacationers
from across the class spectrum. While Pitney had
envisioned a resort for the wealthy and Atlantic City
was initially marketed as such, the relatively short
travel time from Philadelphia made it possible for
working class families to make day trips to the city.
By the 1870s, deliberate efforts to exploit the tourist
potential of this group were underway, including the
development of a second rail line with lower fares,
advertising targeted to the middle and working
classes, and the building of rooming houses offering
inexpensive rates. Subsequent expansion of the
resort, facilitated by further rail construction, was
marked by the simultaneous construction of luxury
hotels and low-budget accommodations. By 1885, a
guidebook to Atlantic City described its boardwalk,
initially built to provide access to the city’s beaches
and to limit the amount of sand that found its way
off of them, as a place where a “conglomeration of
classes” promenaded “from morning till night.”8 The
resort served black as well as white tourists, although
the terms on which they were received were quite
different. (See the discussion on page 8 under
“Discrimination and Segregation.”)
Data on visitors speak to the resort’s
8 See Martin Paulsson, p. 26, quoting from “A Complete Guide to Atlantic City,” 1885. See also Johnson, p. 26, for a description of the origins of the boardwalk.
ATLANTIC CITY: PAST AS PROLOGUETHE BEACH RESORT:
FROM ESTABLISHMENT TO DECLINE

4 ATLANTIC CITY: PAST AS PROLOGUE
popularity over the decades following its initiation.
By 1858, there were an estimated 3,000 visitors in
Atlantic City on a summer day, and by 1872, the
number of tourists who visited over the course of the
summer topped 100,000, with 25,000 visitors in the
city on busy summer weekends.9 In 1910, the city
had over 3 million visitors,10 and in 1939, during the
resort’s heyday, the number reached 16 million.11 As
the resort grew, so did the resident population that
serviced it. In 1860, the city had 687 residents, a
number that rose to about 8,000 by 1885 and 13,000
only five years later. By 1915, 56,000 people lived in
the city, and the 1930 census reported a population
of just over 66,000.12
Atlantic City presented its family visitors
with a wide range of attractions. In addition to
the beach and the ocean, the resort provided a
range of options for vacationing families, including
amusement piers, elegant shopping, movie palaces,
and famous entertainers.13
But the resort also provided activities that
did not fit the category of “family recreation.” Its
many nightclubs were often risqué or exotic by
the standards of the first half of the 20th century.14
During Prohibition, the city was unofficially
“wet,”15 and from its earliest days, prostitutes were
available on the city’s streets and in its hotels
and bars.16 Gambling opportunities were available
in many forms. In addition to numbers games
9 See Paulsson, pp. 20-21. Estimates are based on railroad data.10 See Paulsson, p. 29, citing contemporary sources. 11 See Bryant Simon, p. 34, citing the WPA Guide to 1930s New Jersey.12 All numbers except that of the 1930 population are reported in Paulsson, p. 20, p. 24, and footnote 53 to Chapter 2.13 See Simon, Chapter 1.14 See Simon, Chapter 2, for a particularly interesting discussion of black entertainers performing for white audiences.15 See Simon, p. 58; Johnson, p. 104.16 See Simon, Chapter 2.
and betting parlors for horse races, the city had
numerous illegal casinos.17 Nelson Johnson writes
that “complimentary food and beverages were
served [in the casinos], and the management of the
casinos paid round-trip railroad fare to any player
producing a ticket showing they had come to town
that day to gamble.”18 In light of Atlantic City’s
future, it is interesting that both Johnson and Bryant
Simon suggest that the casinos were a particularly
important source of revenue for the resort.
That such activities could be conducted at
the scale and as openly as they were is attributable
in large part to the degree of municipal corruption
that characterized the resort. Between 1914 and
1971, two long-reigning political bosses,19 each with
connections to organized crime, exercised power in
Atlantic City, taking bribes for political favors and
extorting protection money from the city’s illegal
businesses.20
For many years, Atlantic City styled itself as
the “Queen of Resorts” and “America’s playground.”
But as the previous paragraph suggests, many
aspects of the resort and the city that serviced it
were neither as elegant nor as wholesome as these
names would suggest. From the vantage point of the
late 20th century and that of the 21st, other features
of the city were also extremely problematic and
perhaps predictive of problems that the city has
17 See Paulsson, Simon, and Johnson for discussions of gambling in the beach resort.18 See Johnson, p.114.19 These bosses are Enoch Johnson and Frank Farley. See the book by George Sternlieb and James Hughes. See also the book by Johnson and the one by Simon. When discussing Atlantic City corruption, most historians include a third boss, Louis Kuehnle, who was in power at the beginning of the century. Paulsson argues, however, that Kuehnle did not have the concentrated power of his successors. 20 Neither Johnson nor Farley ever served as mayor of Atlantic City. Paulsson (p. 1) notes that between 1909 and 1984, eight of the city’s mayors were indicted or arrested by state or federal authorities.

ATLANTIC CITY: PAST AS PROLOGUE 5
continued to face in its incarnation as a gambling
mecca. Chief among these were the low incomes
of the resident workforce and the patterns of racial
discrimination and segregation that persisted until
the civil rights era.
Underpinnings of the Resort City: The Resident Labor Force
Atlantic City’s resident workforce
looked very different, both economically and
demographically, from that of other New Jersey
cities and the state as a whole. The city’s tourist
industry was characterized by service-sector jobs and
seasonal unemployment. In addition, the proportion
of its workforce and of its resident population that
was African-American was considerably greater
than that in other New Jersey cities. It is likely that
each of these factors contributed to a tendency for
household incomes to be very low in comparison to
the rest of the state.
Table 1 provides decennial census data on
the share of Atlantic City’s
employed residents whose
occupation was classified as
provision of nondomestic
services for 1940, when the
resort was in its heyday,
and for 1950, when the
population was still near its
peak. Data on the share of
workers employed in the
manufacturing sector are
provided for the same years.
For comparison purposes,
data on New Jersey as a
whole and for Camden,
southern New Jersey’s major
city, are also given. These
data illustrate the importance of the service sector
for the resort economy, particularly in comparison
with the rest of the state. Other data in Table 1
emphasize the point that in Atlantic City, service
jobs were geared to the tourist industry.
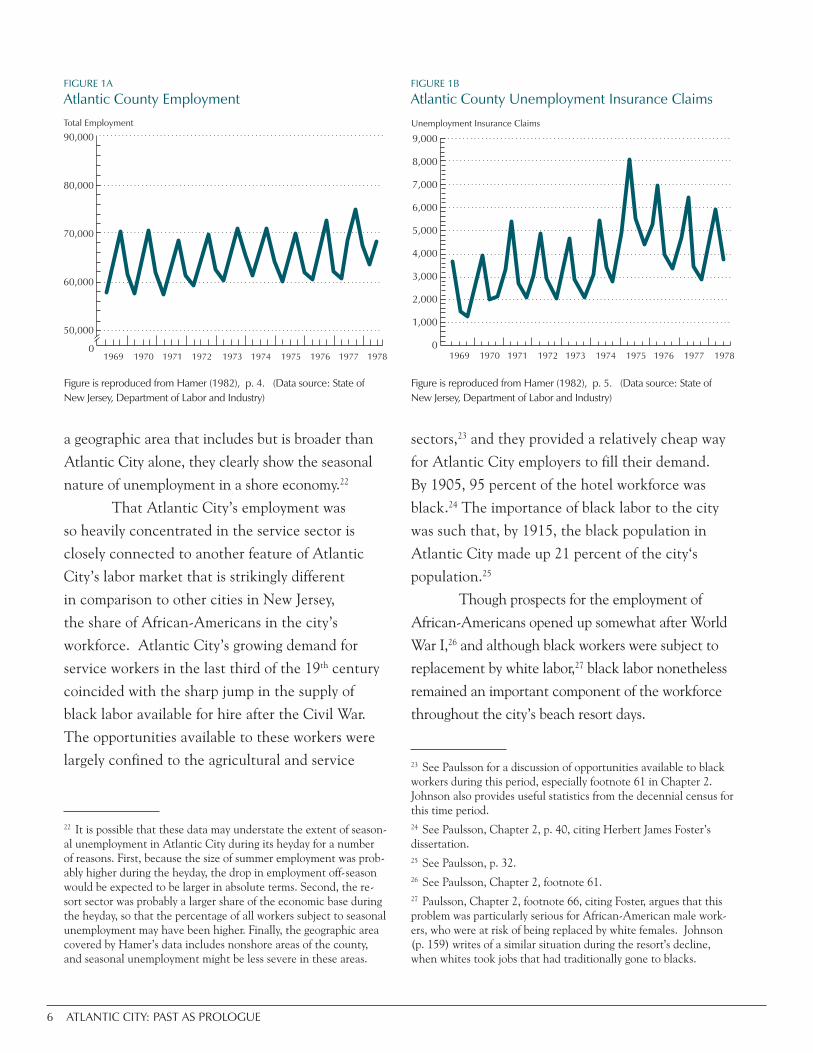
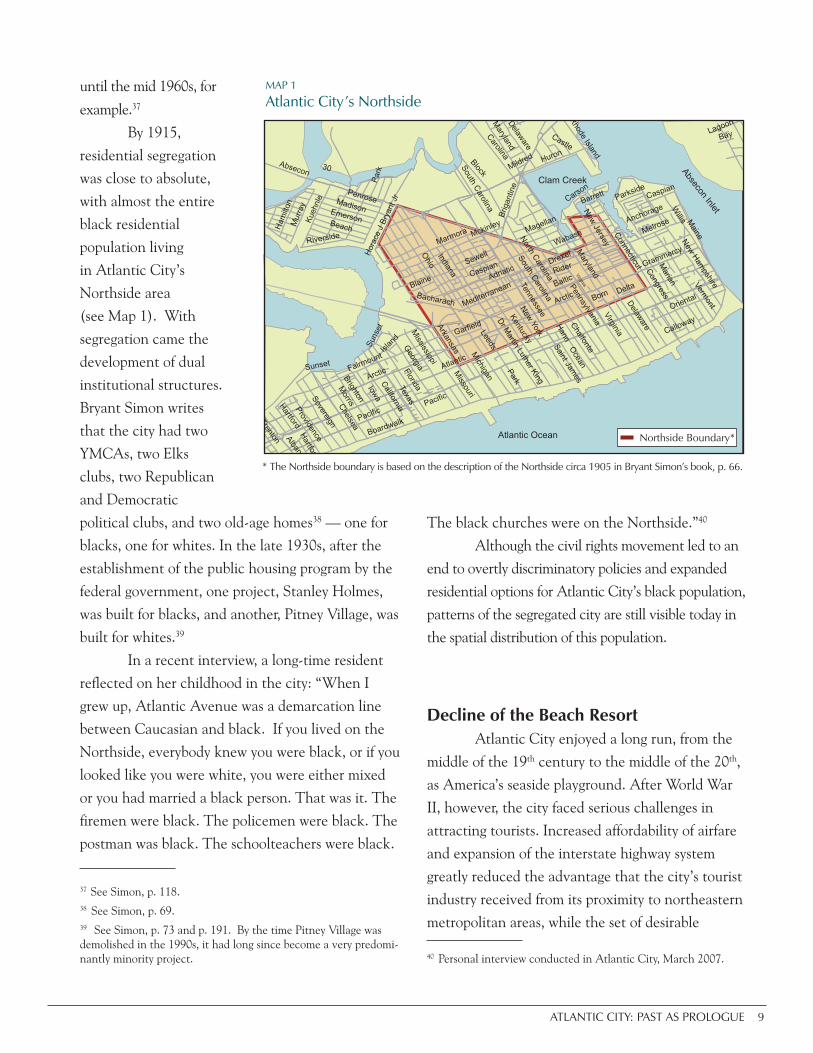
Because of Atlantic City’s climate, tourist
activity was heavily concentrated in the summer
months, and given the importance of tourism to
the economy, one would expect a sharp rise in
unemployment during the off-season. Seasonal
unemployment was recognized as a problem as early
as 1881, when the city council began to set aside
funds to help the poor in the winter.21 Data on the
number of jobs and on unemployment claims for
Atlantic County during a much later period, 1969 to
1978, are presented in Figures 1A and 1B. Although
these data represent a time period well after Atlantic
City had lost its cachet as a tourist resort and cover
21 See Paulsson, p. 41, citing minutes of the Atlantic City Common Council. Other sources cited by Paulsson indicate that problems related to seasonal unemployment were felt most severely by the black population.
11940, Census, Table 33; 1950, Census of Population, Vol. II, Part 30, Table 3521940, Census, Table A-42; 1950, Census of Population, Vol. II, Part 30, Table 3531940, Census, Table 19; 1950, Census of Population, Tables 28 and 3041940, Census, Table 19; 1950, Census of Population, Tables 28 and 30
TABLE 1
Percent of Workers Employed in the Manufacturing Industry, Accommodations Industry, and Nondomestic Service Occupations in Atlantic City, Camden, and the State in 1940 and 1950
Atlantic City1 Camden2 New Jersey (All)3
New Jersey (Urban)4
1940 1950 1940 1950 1940 1950 1940 1950
Percent employed in manufacturing industry
4.9 6.7 48.3 43.1 36.4 37.7 38.1 39.1
Percent employed inhotel/accommodation industry
18.7 19.1 0.8 0.5 1.0 0.7 1.0 0.7
Percent employed in service occupations (ex-cept domestic services)
27.7 28.4 8.5 9.0 7.7 7.1 7.8 7.2
6 ATLANTIC CITY: PAST AS PROLOGUE
a geographic area that includes but is broader than
Atlantic City alone, they clearly show the seasonal
nature of unemployment in a shore economy.22
That Atlantic City’s employment was
so heavily concentrated in the service sector is
closely connected to another feature of Atlantic
City’s labor market that is strikingly different
in comparison to other cities in New Jersey,
the share of African-Americans in the city’s
workforce. Atlantic City’s growing demand for
service workers in the last third of the 19th century
coincided with the sharp jump in the supply of
black labor available for hire after the Civil War.
The opportunities available to these workers were
largely confined to the agricultural and service
22 It is possible that these data may understate the extent of season-al unemployment in Atlantic City during its heyday for a number of reasons. First, because the size of summer employment was prob-ably higher during the heyday, the drop in employment off-season would be expected to be larger in absolute terms. Second, the re-sort sector was probably a larger share of the economic base during the heyday, so that the percentage of all workers subject to seasonal unemployment may have been higher. Finally, the geographic area covered by Hamer’s data includes nonshore areas of the county, and seasonal unemployment might be less severe in these areas.
sectors,23 and they provided a relatively cheap way
for Atlantic City employers to fill their demand.
By 1905, 95 percent of the hotel workforce was
black.24 The importance of black labor to the city
was such that, by 1915, the black population in
Atlantic City made up 21 percent of the city‘s
population.25
Though prospects for the employment of
African-Americans opened up somewhat after World
War I,26 and although black workers were subject to
replacement by white labor,27 black labor nonetheless
remained an important component of the workforce
throughout the city’s beach resort days.
23 See Paulsson for a discussion of opportunities available to black workers during this period, especially footnote 61 in Chapter 2. Johnson also provides useful statistics from the decennial census for this time period. 24 See Paulsson, Chapter 2, p. 40, citing Herbert James Foster’s dissertation. 25 See Paulsson, p. 32.26 See Paulsson, Chapter 2, footnote 61.27 Paulsson, Chapter 2, footnote 66, citing Foster, argues that this problem was particularly serious for African-American male work-ers, who were at risk of being replaced by white females. Johnson (p. 159) writes of a similar situation during the resort’s decline, when whites took jobs that had traditionally gone to blacks.
Figure is reproduced from Hamer (1982), p. 5. (Data source: State of New Jersey, Department of Labor and Industry)
Figure is reproduced from Hamer (1982), p. 4. (Data source: State of New Jersey, Department of Labor and Industry)

ATLANTIC CITY: PAST AS PROLOGUE 7
Data on the labor force in 1940 and 1950 are
provided in Table 2. Table 2A contains information
on the shares of the population and labor force
that were nonwhite for Atlantic City, Camden, and
New Jersey as a whole. In 1940, blacks comprised
24.4 percent of Atlantic City’s population and
27.0 percent of its labor force; the percentages
for 1950 are 27.3 percent of the population and
30.7 percent of the workforce. The corresponding
percentages for Camden and for the state as a whole
are considerably smaller.28 Table 2B provides more
detailed statistics on labor force activity in Atlantic
City for 1940 and 1950. The table shows that
28 In fact, in 1950, among cities with a population above 10,000, only one city, Asbury Park — another, considerably smaller, beach resort — had a higher nonwhite population share, 28.7 percent. Indeed, in addition to Asbury Park, only one other city in this group had a nonwhite share that reached 20 percent (1950 cen-sus).
11940, Census, Tables 28, 33; 1950, Census of Population, Tables 6, 33, 35, 362 1940, Census, Tables 28, A-41; 1950, Census of Population, Tables 6, 33,
35, 363 1940, Census, Table 4; 1950, Census of Population, Tables 1, 13, 274 1940, Census, Table 16; 1950, Census of Population, Tables 3, 13, 255 In 1950, population is defined as “white” or “nonwhite” rather than
B. Atlantic City Labor Force Activity, 1940 and 19506
TABLE 2
Labor Force in Atlantic City, Camden, and the State, 1940 and 1950A. Racial Composition of Labor Force for Atlantic City, Camden, and New Jersey
Atlantic City1 Camden2 New Jersey (All)3 New Jersey (Urban)4
1940 1950 1940 1950 1940 1950 1940 1950
Total population 64,094 61,657 117,536 124,555 4,160,165 4,835,329 3,394,773 4,186,207
% of population that is black5 24.4% 27.3% 10.6% 14.1% 5.5% 6.6% 5.7% 6.7%
% of labor force that is black6 27.0% 30.7% 10.0% 13.4 5.7% 7.1% 5.8% 7.1%
Male
LFPR7
(All)LFPR
(Black)Civilian
unemp. (All)Civilian unemp.
(Black)
1940 80.0% 80.7 12.5 (25.1)8 12.9 (35.5)8
1950 74.9 76.5 7.6 12.4
Female
LFPR (All)
LFPR (Black)
Civilian unemp. (All)
Civilian unemp. (Black)
37.6 49.5 14.0 (21.4)8 16.1 (26.9)8
35.4 48.8 8.6 13.8
African-Americans in Atlantic City, particularly
females, had higher labor force participation rates
than whites in these years.29 They also had higher
unemployment rates, considerably so in 1950.
(Furthermore, the data in Table 2A suggest that the
racial differences in unemployment rates in 1940
might have been much sharper had it not been for
employment provided through public emergency
work programs.) The higher unemployment rates
for blacks may reflect disproportionate employment
in sectors of the economy particularly susceptible
to seasonal unemployment30 and/or discrimination
29 This finding may reflect economic necessity, particularly in the case of women. However, in 1950, median age in Atlantic City was higher than in all but one other city in New Jersey with a popula-tion above 10,000, and to the extent that the elderly population was disproportionately white, this might also contribute to lower rates of labor force participation for white women.30 As previously noted, sources cited by Paulsson indicate that at
“white” or “black.” 6 1940, Census, Table 33; 1950, Census, Tables 35, 36 (In 1940 and 1950, the labor force is classified as persons 14 years old and over.)7 LFPR = Labor Force Participation Rate8 Numbers in parentheses give unemployment rates in 1940 if those
employed at “public emergency work,” e.g., the WPA, are not counted as employed.

8 ATLANTIC CITY: PAST AS PROLOGUE
against black workers in the labor
market.
Finally, and probably
because of the combination of
labor market features considered
above, Atlantic City households
tended to have incomes that were
considerably below those in urban
areas elsewhere in the state. Data
on income are not available for
1940, but data for 1950 indicate
that in that year, among New
Jersey cities with populations
greater than 10,000, the city had
the highest percentage of households with incomes
below $2000, 53.7 percent (Table 3).31 For the state
as a whole, the corresponding percentage was 26.1
percent and in New Jersey’s urban areas, it was
24.1 percent. Median income for both families
and households, $2428 and $1825, respectively,
lagged those of every other urban community with
a population above 10,000 in the state by several
hundred dollars, at a time when the state’s median
income was itself only $3670 for families and $3285
for households.32
the end of the 19th century and the beginning of the 20th, seasonal unemployment affected black residents most severely. 31 Only two jurisdictions in the entire state, each with a population under 10,000, had higher percentages of households with incomes below this level.32 Median family income is the preferred measure for comparing Atlantic City with the rest of New Jersey. In general, the share of households that are “nonfamily” in different communities is likely to be related to median household income, while the composition of nonfamily households may differ across communities as well. (For example, the percentage of such households made up of single individuals of working age and the percentage that is elderly are likely to vary across jurisdictions.) Both of these factors mean that a comparison of median household income across communities might have an “apples to oranges” nature. Comparison of median family income across communities probably comes closer to an “apples to apples” comparison.
Discrimination and Segregation Although Atlantic City’s black residents and
workers were not viewed as equal to whites in the city’s
early days,33 Atlantic City was not a segregated city in
the 19th century. With the turn of the century, however,
discriminatory practices that segregated blacks from
whites became a matter of public and private policy.34
Segregation extended to schools, restaurants, and rec-
reation, affecting Atlantic City’s black residents and its
black visitors.35 Blacks were not allowed into boardwalk
amusements36 or onto “white” beaches. Many of these
practices persisted until the civil rights era; segregated
seating was the rule in Atlantic City’s movie houses
33 See, for example, an 1893 quote from the Philadelphia Inquirer cited by Paulsson, p. 35.34 According to Bryant Simon, Atlantic City never formally enact-ed Jim Crow laws, as occurred in the South, but the initial timing of public policies promoting segregation in Atlantic City coincided with the enactment of these laws in southern states. Paulsson cites contemporary sources that attribute the imposition of discrimina-tory policies to an increase in southern visitors, who, businessmen believed, would be uncomfortable in an unsegregated resort. 35 Seven Atlantic City hotels were included in the 1941 guide “Di-rectory of Negro Hotels and Guest Houses,” published by the U.S. Department of the Interior. http://www.nps.gov/history/history/online_books/nj1/chap4.htm36 Paulsson writes that in 1904, police began to eject blacks from boardwalk amusements.
TABLE 3
Income: Atlantic City and New Jersey, 1950
Atlantic City New Jersey (All)
New Jersey (Urban)
New Jersey (Rural)
Nonfarm Farm
Median income1 (All households)
$1,825 $3,285 $3,372 $2,633 $2,203
% of households with income < $20001
53.7% 26.1% 24.1% 37.9% 45.6%
Median family income2
$2,428 $3,670 $3,754 $3,222 $2,550
1 1950, Census of Population, Section 1, Table 102 1950, Census of Population, Tables 32, 37
ATLANTIC CITY: PAST AS PROLOGUE 9
until the mid 1960s, for
example.37
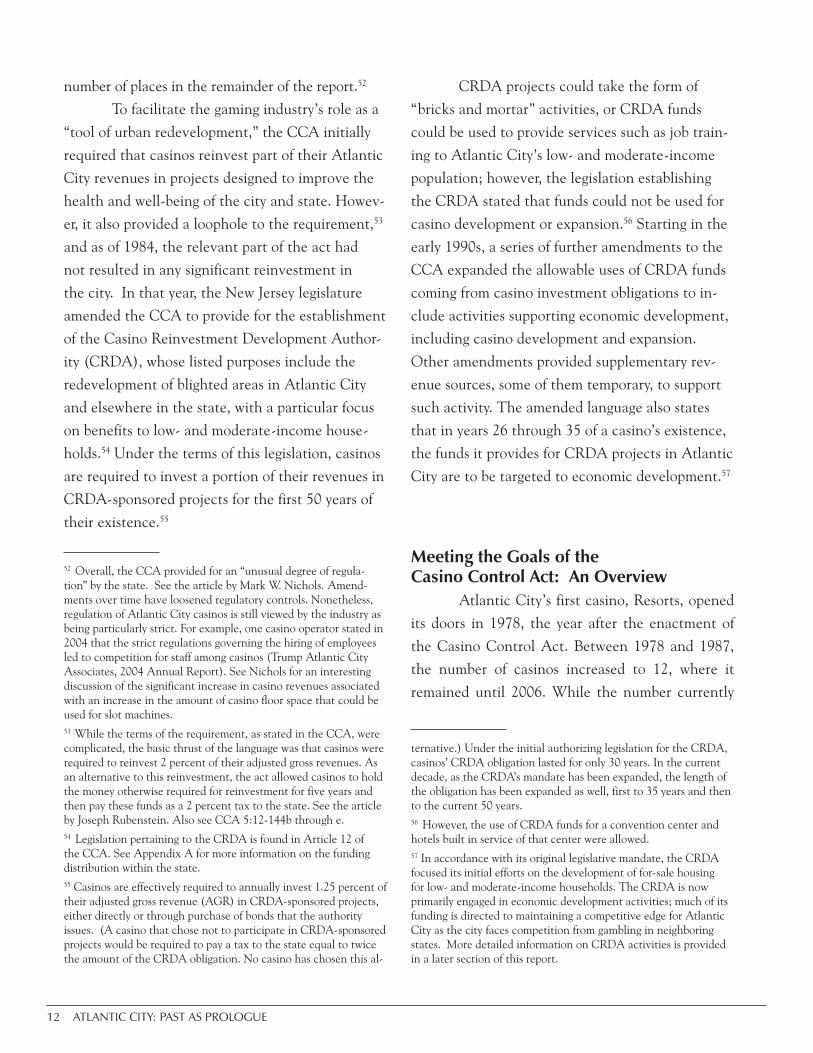
By 1915,
residential segregation
was close to absolute,
with almost the entire
black residential
population living
in Atlantic City’s
Northside area
(see Map 1). With
segregation came the
development of dual
institutional structures.
Bryant Simon writes
that the city had two
YMCAs, two Elks
clubs, two Republican
and Democratic
political clubs, and two old-age homes38 — one for
blacks, one for whites. In the late 1930s, after the
establishment of the public housing program by the
federal government, one project, Stanley Holmes,
was built for blacks, and another, Pitney Village, was
built for whites.39
In a recent interview, a long-time resident
reflected on her childhood in the city: “When I
grew up, Atlantic Avenue was a demarcation line
between Caucasian and black. If you lived on the
Northside, everybody knew you were black, or if you
looked like you were white, you were either mixed
or you had married a black person. That was it. The
firemen were black. The policemen were black. The
postman was black. The schoolteachers were black.
37 See Simon, p. 118. 38 See Simon, p. 69.39 See Simon, p. 73 and p. 191. By the time Pitney Village was demolished in the 1990s, it had long since become a very predomi-nantly minority project.
The black churches were on the Northside.”40
Although the civil rights movement led to an
end to overtly discriminatory policies and expanded
residential options for Atlantic City’s black population,
patterns of the segregated city are still visible today in
the spatial distribution of this population.
Decline of the Beach ResortAtlantic City enjoyed a long run, from the
middle of the 19th century to the middle of the 20th,
as America’s seaside playground. After World War
II, however, the city faced serious challenges in
attracting tourists. Increased affordability of airfare
and expansion of the interstate highway system
greatly reduced the advantage that the city’s tourist
industry received from its proximity to northeastern
metropolitan areas, while the set of desirable
40 Personal interview conducted in Atlantic City, March 2007.
* The Northside boundary is based on the description of the Northside circa 1905 in Bryant Simon’s book, p. 66.

10 ATLANTIC CITY: PAST AS PROLOGUE
vacation spots was enhanced by the opening of new
resorts like Disneyland.41 By the 1960s, Atlantic City
had lost its cachet as a tourist destination.
The city’s decline was very steep. Between
1960 and 1980, city population fell from 59,544 to
40,199. Most of the population outflow was white,
with data suggesting that nonelderly white families
were particularly likely to leave. As population fell
and tourism declined, many of the city’s institutions
began to close or consolidate, many retail businesses
closed, and much of Atlantic City’s housing stock
became dilapidated or abandoned. The city’s resort
infrastructure, long neglected, began to deteriorate
as the city faced “severe financial and management
difficulties.”42
41 A number of authors, including Simon and Johnson, argue that the growing suburbanization of the American population was also a factor: As Americans moved from cities to less densely populated suburbs, their new surroundings provided alternative opportunities for recreation and relaxation to those they had previously found in Atlantic City. 42 Atlantic City Master Plan, 1987, p. 2.
A range of statistics illustrates the speed and
the severity of the city’s decline. Between 1960 and
1980, the city lost 32 percent of its residents, with
the loss almost entirely concentrated in the white
population, which fell by 47 percent.43 Between
1965 and 1975, the city lost 17 percent of its jobs.44
The unemployment rate increased from 10.6 percent
in 1972 to 18.1 percent in 1977. (Comparative
national unemployment rates for these years were
5.6 percent and 7.1 percent, respectively.)45 Between
1960 and 1976, 40 percent of the city’s hotel rooms
were closed.46 Between 1950 and 1974, tourist
income shrank from more than $70 million annually
to less than $40 million.47
43 Decennial census.44 See Sternlieb and Hughes, p.178.45 See p. 6 in the report from the U.S. Government Accountability Office.46 See the 2008 article by Wayne Parry.47 See Johnson, p. 177.

ATLANTIC CITY: PAST AS PROLOGUE 11
Illegal gambling had injected large amounts
of money into the Atlantic City economy in its
heyday as a beach resort. It is perhaps unsurprising,
then, that by the early 1970s, the idea that
legalized casino gambling could reverse Atlantic
City’s fortunes had taken hold among Atlantic
City’s boosters. After a failed 1974 attempt to pass
a referendum allowing casino gambling statewide
in New Jersey,48 New Jersey gambling advocates
pushed for passage of a referendum that would
allow casinos in Atlantic City alone, arguing
that casino gambling would provide a means for
revitalizing the resort city. State voters passed this
referendum in 1976, and in 1977, the New Jersey
legislature passed the Casino Control Act, which
governs casino establishment and operation.
Key Provisions of the Casino Control Act The Casino Control Act (CCA) spoke
directly to the issue of Atlantic City’s recovery. In
its opening section, the act set out the outcomes
that it was hoped the legislation would accomplish.
Prominent among these were the revitalization
of Atlantic City’s tourism industry and the use of
48 Prior to the failure of the 1974 referendum, Atlantic City’s gambling proponents believed that a referendum was more likely to pass if gambling was presented as an option for all communities in the state. See Johnson, pp. 181-82, for a discussion of this point.
gambling as a “unique tool” to support the city’s
urban redevelopment.49
The opening section of the act also laid
out ground rules for the process by which the
revitalization of the tourist industry was to be
achieved. Development of the gambling industry
was to occur in a manner that would maintain
“the existing tone of the hospitality industry”
and strict regulation and control would be put
in place “to maintain and retain integrity, public
confidence, and trust” in casino operations. In
support of the first of these ground rules, the
legislation stipulated that gaming was restricted to
major hotels and convention facilities, defined as
establishments with at least 500 sleeping units.50 In
support of the second ground rule, the CCA stated
that individuals with criminal records could not
be hired as workers in casino hotels.51 Arguably,
these restrictions are particularly important in
understanding how the development of casinos
affected Atlantic City’s existing businesses and
its residents, an issue that will be discussed in a
49 CCA, Title 5, Chapter 12, Article 1, New Jersey Statutes, an-notated.50 CCA, 5:12-83.51 More generally, the hiring restriction applied to those deemed not to be of good character. Initially, the hiring restriction ap-plied to all employees working in facilities hosting casinos. An amendment to the act in 1995 removed the restriction from some workers, such as hotel employees who did not actually work in the casinos themselves.
ATLANTIC CITY: PAST AS PROLOGUEATLANTIC CITY’S RECOVERY:
THE ROLE ENVISIONED FOR LEGALIZED GAMBLING
12 ATLANTIC CITY: PAST AS PROLOGUE
number of places in the remainder of the report.52
To facilitate the gaming industry’s role as a
“tool of urban redevelopment,” the CCA initially
required that casinos reinvest part of their Atlantic
City revenues in projects designed to improve the
health and well-being of the city and state. Howev-
er, it also provided a loophole to the requirement,53
and as of 1984, the relevant part of the act had
not resulted in any significant reinvestment in
the city. In that year, the New Jersey legislature
amended the CCA to provide for the establishment
of the Casino Reinvestment Development Author-
ity (CRDA), whose listed purposes include the
redevelopment of blighted areas in Atlantic City
and elsewhere in the state, with a particular focus
on benefits to low- and moderate-income house-
holds.54 Under the terms of this legislation, casinos
are required to invest a portion of their revenues in
CRDA-sponsored projects for the first 50 years of
their existence.55
52 Overall, the CCA provided for an “unusual degree of regula-tion” by the state. See the article by Mark W. Nichols. Amend-ments over time have loosened regulatory controls. Nonetheless, regulation of Atlantic City casinos is still viewed by the industry as being particularly strict. For example, one casino operator stated in 2004 that the strict regulations governing the hiring of employees led to competition for staff among casinos (Trump Atlantic City Associates, 2004 Annual Report). See Nichols for an interesting discussion of the significant increase in casino revenues associated with an increase in the amount of casino floor space that could be used for slot machines. 53 While the terms of the requirement, as stated in the CCA, were complicated, the basic thrust of the language was that casinos were required to reinvest 2 percent of their adjusted gross revenues. As an alternative to this reinvestment, the act allowed casinos to hold the money otherwise required for reinvestment for five years and then pay these funds as a 2 percent tax to the state. See the article by Joseph Rubenstein. Also see CCA 5:12-144b through e.54 Legislation pertaining to the CRDA is found in Article 12 of the CCA. See Appendix A for more information on the funding distribution within the state.55 Casinos are effectively required to annually invest 1.25 percent of their adjusted gross revenue (AGR) in CRDA-sponsored projects, either directly or through purchase of bonds that the authority issues. (A casino that chose not to participate in CRDA-sponsored projects would be required to pay a tax to the state equal to twice the amount of the CRDA obligation. No casino has chosen this al-
CRDA projects could take the form of
“bricks and mortar” activities, or CRDA funds
could be used to provide services such as job train-
ing to Atlantic City’s low- and moderate-income
population; however, the legislation establishing
the CRDA stated that funds could not be used for
casino development or expansion.56 Starting in the
early 1990s, a series of further amendments to the
CCA expanded the allowable uses of CRDA funds
coming from casino investment obligations to in-
clude activities supporting economic development,
including casino development and expansion.
Other amendments provided supplementary rev-
enue sources, some of them temporary, to support
such activity. The amended language also states
that in years 26 through 35 of a casino’s existence,
the funds it provides for CRDA projects in Atlantic
City are to be targeted to economic development.57
Meeting the Goals of the Casino Control Act: An Overview
Atlantic City’s first casino, Resorts, opened
its doors in 1978, the year after the enactment of
the Casino Control Act. Between 1978 and 1987,
the number of casinos increased to 12, where it
remained until 2006. While the number currently
ternative.) Under the initial authorizing legislation for the CRDA, casinos’ CRDA obligation lasted for only 30 years. In the current decade, as the CRDA’s mandate has been expanded, the length of the obligation has been expanded as well, first to 35 years and then to the current 50 years. 56 However, the use of CRDA funds for a convention center and hotels built in service of that center were allowed.57 In accordance with its original legislative mandate, the CRDA focused its initial efforts on the development of for-sale housing for low- and moderate-income households. The CRDA is now primarily engaged in economic development activities; much of its funding is directed to maintaining a competitive edge for Atlantic City as the city faces competition from gambling in neighboring states. More detailed information on CRDA activities is provided in a later section of this report.

ATLANTIC CITY: PAST AS PROLOGUE 13
stands at 11, new casino development is planned for
the near future.58, 59
As was envisioned, the casinos have
rejuvenated Atlantic City’s tourist industry. Since
1988, the first full year in which Atlantic City’s full
complement of 12 casinos was in operation, the
casinos have directly provided more than 40,000
jobs per year. The number of annual visitors to the
city, which stood at 7 million in 1978, the year the
first casino opened, has ranged between 30 and
35 million since 1988.60 A new convention center
opened in 1997, and in recent years, there has been
an expansion in high-end restaurants and retail
stores targeted to Atlantic City visitors.
Assessing the role that the casino
industry has played as a “unique tool of urban
redevelopment” is more complex. Since the
advent of gambling, Atlantic City’s population has
stabilized at about 40,000. Since 1988, the casinos
have typically provided jobs for more than 10,000
city residents;61 since that time, a substantial
majority of the city’s employed residents worked
for the casinos.62 Casinos provide 80 percent of
property taxes collected by the city — allowing
the school district to spend about $1500 more per
pupil than the state average63 — and they also
generate revenues for the city through other taxes,
58 The particular set of casinos in operation has changed over time, even though the number of casinos was steady at 12 until the Sands closed in late 2006, dropping the number to 11. See the April 2007 article by Suzette Parmley, for a discussion of plans to expand the number of casinos.59 See Appendix A for detailed information on the performance of the Atlantic City casino industry. 60 See the 2007 report from the New Jersey Casino Control Com-mission, available on its website. 61 The number of residents employed by casinos fell in both 2006 and 2007, as did the total number of jobs provided by casinos. Reasons for this decline are discussed later in the text.62 See additional discussion of this point in footnote 86. 63 See http://www.state.nj.us/education/guide/2007/csgsearch.shtml for data on school spending.
including a “luxury” sales tax that predates legalized
gambling.64 The CRDA has replaced run-down
housing in what was formerly the city’s poorest
neighborhood with new owner-occupied units, a
portion of which were sold to low- and moderate-
income households at below-market rates. The
CRDA is also a sponsor of Atlantic City’s Hope
VI project, which will replace a part of the city’s
old public housing stock with new units on a one-
for-one-basis while also providing new market-rate
housing.
At the same time, many of the problems that
gambling was supposed to alleviate remain severe.
As in the pre-gambling era, the city’s unemployment
rate and its poverty rate are considerably higher
than those of New Jersey and the nation; in 1999,
19 percent of the city’s population lived in census
tracts meeting the definition for extreme poverty
neighborhoods, i.e., a poverty rate of at least 40
percent.65 The city’s median family income is one of
the lowest in the state.
In addition, the city suffers from high rates
of crime, an active drug trade and neighborhood
gang activity. The rate of HIV infection is high,66and
despite the school district’s high per pupil spending,
the rate of high school graduation is considerably
lower than that of the state.67 Vacant houses and
64 Property tax data provided for 2001. See the 2003 report from the New Jersey Casino Control Commission, available on its web-site, for a list of taxes paid by casinos, including property taxes. 65 2000 census. 66 In June 2006, there were a reported 811 cases of HIV/AIDS in At-lantic City. According to the New Jersey Department of Health and Senior Services, Atlantic City ranks as one of the 10 cities with the highest number of HIV/AIDS cases in New Jersey (as of December 31, 2006). Thirty-one percent of the HIV/AIDS cases in Atlantic County were in Atlantic City, although in 2000, Atlantic City’s population comprised just 16 percent of the county’s total popula-tion. New Jersey Department of Health and Senior Services website at http://www.state.nj.us/health/aids/repa/cities.shtml.67 New Jersey Department of Education (NJDOE), “Atlantic City 2006-2007 High School Report Card,” on NJDOE’s website at http://education.state.nj.us/rc/rc07/dataselect.php?datasectionper

14 ATLANTIC CITY: PAST AS PROLOGUE
vacant lots are common sights. The city’s residential
neighborhoods have few retail outlets, and the
city as a whole has no supermarket. In some of the
city’s neighborhoods, residents are concerned that
planned expansion of the casino industry, supported
to some degree by the CRDA, which has switched
its focus from housing to economic development
activities designed to benefit the casino industry,68
cent5B2percent5D=performance&c=01&d=0110&s=010<=A&st=H.68 Many recent activities are aimed at helping the industry remain competitive in the face of the expansion of gambling opportunities in nearby states.
will create new and serious problems in the form of
displacement.
In short, although the casino industry has
provided a substantial number of new jobs and new
resources to Atlantic City, a large segment of the
resident population, as in the past, faces serious
economic (and social) problems. In the remainder of
this report, we elaborate on this conclusion.

ATLANTIC CITY: PAST AS PROLOGUE 15
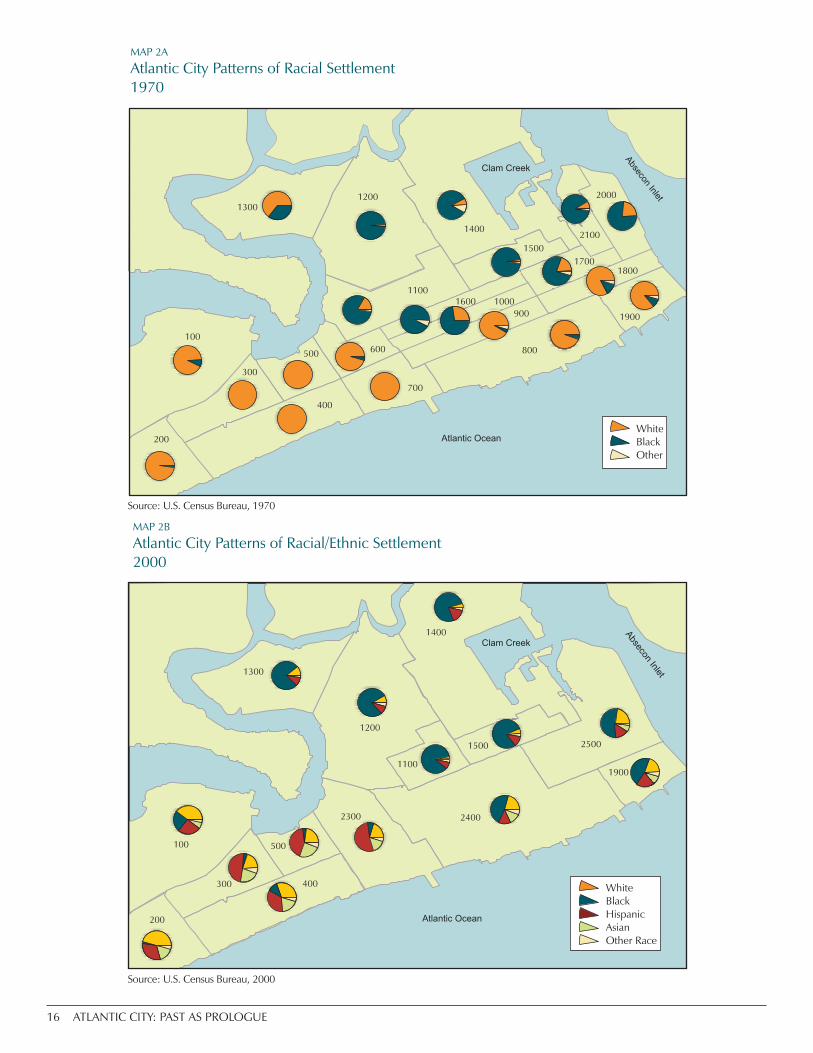
Demographic Changes Since the advent of gambling, the city’s
population has stabilized at about 40,000 residents,
its level in 1980. The white population has
continued its decline, and the black population
has also fallen, though to a much lesser degree.
However, in-migration of Hispanics and Asians
drawn by the city’s jobs partially offset these declines
in the 1980s and by 2000 had restored the city’s
population to the 1980 level (Table 4A). Estimated
population for 2005 was also about 40,000, and
projections keep it at this level through 2020.69 The
Asian and Hispanic populations have tended to
concentrate in neighborhoods that were formerly
white, so that despite the city’s changing racial and
ethnic make-up, the city’s old pattern of segregation
can still be recognized to a large extent on a map of
the city (Maps 2A and 2B).
Table 4B indicates that other components of
the city’s demographic make-up have also changed
over time. The percentage of the population over
65 years of age, close to 25 percent in 1970 and
69 The 2005 estimate was made by the New Jersey Department of Labor (see Atlantic County fact book, 2006). The 2020 projection is contained in South Jersey Transportation Planning Organization, “SJTPO 2030 Population and Employment Projections by Munici-pality,” June 2006. It should be noted that a number of residents interviewed as part of the concentrated poverty case study believe that planned expansion of the casino industry will lead to a lower residential population over the next 10 years.
1980,70 has fallen considerably and stood at 14.2
percent in 2000. (To some extent, this change may
simply reflect the natural outcome of the aging
process. However, the Casino Control Commission
suggests that the net loss of population that Atlantic
City experienced in the 1980s was in large part due
to land speculation and casino development,71 and
statistical and anecdotal evidence both suggest that
much of the impact from these phenomena was felt
70 Rubenstein comments that in the years before gambling, Atlantic City had two ghettoes: one African-American and one elderly.71 See the 1998 report from the Casino Control Commission.
ATLANTIC CITY: PAST AS PROLOGUETRENDS IN ATLANTIC CITY
SINCE THE ADVENT OF GAMBLING
TABLE 4A
Racial/Ethnic Composition, Atlantic City, 1960 to 20001
19602 19703 19804 19905 20006
Total Population 59,544 47,859 40,199 37,986 40,517
White (Non-Hispanic, 1980 on) 63.6% 54.6% 43.9% 30.8% 19.4%
Black (Non-Hispanic, 1980 on) 36.2% 43.7% 49.3% 49.7% 42.4%
Hispanic* N/A N/A 5.8% 15.3% 24.9%
Asian* N/A N/A 0.6% 3.7% 10.3%
Other 0.3% 1.6% 0.4% 0.5% 2.9%
*Prior to 1980, Hispanic and Asian were included in the “other” category.
1In some instances, percentages may not total to 100 percent due to rounding error. 21960, Census, series PHC (1)-9, Table P-131970, Census, series PHC (1)-15, Table P-1 PHC Census Tracts41980, Census, series PHC, 80-2-78 Table P-751990, Census of Population and Housing, Summary Tape File 1, Table P01062000, Census, Summary Tape File 1, Table P4
16 ATLANTIC CITY: PAST AS PROLOGUE
Source: U.S. Census Bureau, 1970
Source: U.S. Census Bureau, 2000

ATLANTIC CITY: PAST AS PROLOGUE 17
by the elderly.72) The decline in
the share of the population that
is elderly has been accompanied
by an increase in the number of
adults of prime working age, in
both relative and absolute terms.
Between 1980 and 2000, the size
of this group increased by 3929,
or 23 percent.
Table 4B also shows
that nonfamily households and
female-headed families with
children both grew as shares
of all Atlantic City households
between 1970 and 1990.
While these shares fell slightly
between 1990 and 2000, they
remain above their 1970 levels;
this is particularly true for the
share of households that are
female-headed with children,
which was almost 50 percent
higher in 2000 than in 1970.
The net growth in the shares
of nonfamily households and
female-headed households
with children is of particular
interest because the incidence of
poverty for people living in these
types of households tends to be
considerably greater than that
for the population as a whole.73
Finally, the level of educational attainment
has increased over time, consistent with the
72 Examples of elderly displacement accompanying real estate speculation associated with the development of the casino industry are supplied in a later section of this report. 73 U.S. Department of Health and Human Services, Green Book, 2004, Appendix H, Table H6.
national pattern of more years of schooling for
younger population cohorts. However, the city has
consistently lagged the state.74 In 2000, about 38
74 In 1980, census data indicate that 7.7 percent of the population 25 and over in Atlantic City had a bachelor’s degree or higher, compared with the state of New Jersey, where the percentage was 11.8. In 1990 the same was true: 9.5 percent and 24.9 percent
TABLE 4B
Selected Other Demographic Information, Atlantic City and the State, 1970 to 2000
Atlantic City New Jersey
19701 19802 19903 20004 1970 2000
% of population elderly (65+)
24.8 23.5 19.2 14.2 9.7 14.0
Population age 25 to 64 (number)
19,922 16,825 18,159 20,754 3,357,674 4,537,028
--% of population age 25 to 64
41.6 41.9 47.8 51.2 46.8 53.9
% of population foreign born
9.4 7.7 9.9 24.7 8.9 17.5
--% of foreign born arriving in U.S. fr.1990 to 2000
NA NA NA 65.4 NA 41.6
% of households that are families
59.6 55.2 52.0 54.9 82.7 70.3
% of households that are female-headed with chil-dren under 18
9.4 12.8 15.5 14.0 4.6 6.4
% of families that are female-headed with children under 18
15.7 23.3 29.8 25.5 5.6 9.1
% of population over 25 with high school diploma
35.4 48.1 58.3 61.8 52.5 82.1
% of population over 25 with a bachelor’s degree or above
3.5 7.7 9.5 10.4 11.8 29.8
11970, Census, series PHC (1)-15 Tables P-1, P-2, Census of Population Vol. I, Pt. 32, Tables 140, 148, 153, 15821980, Census, series PHC 80-2-78, Tables P-1, P-9, Census of Population, Vol. I, Pt. 32, Tables 56, 115, 117, 119, 12431990, Census of Population and Housing, Summary Tape File 1, Tables P001, P002, P003, P0011, P018; Summary Tape File 3, Tables P042, P05742000, Census, Summary Tape File 1, Tables P1, P15, P16, P31, P34, P36, PCT12; Summary Tape File 3, Tables P21, P22, P37

18 ATLANTIC CITY: PAST AS PROLOGUE
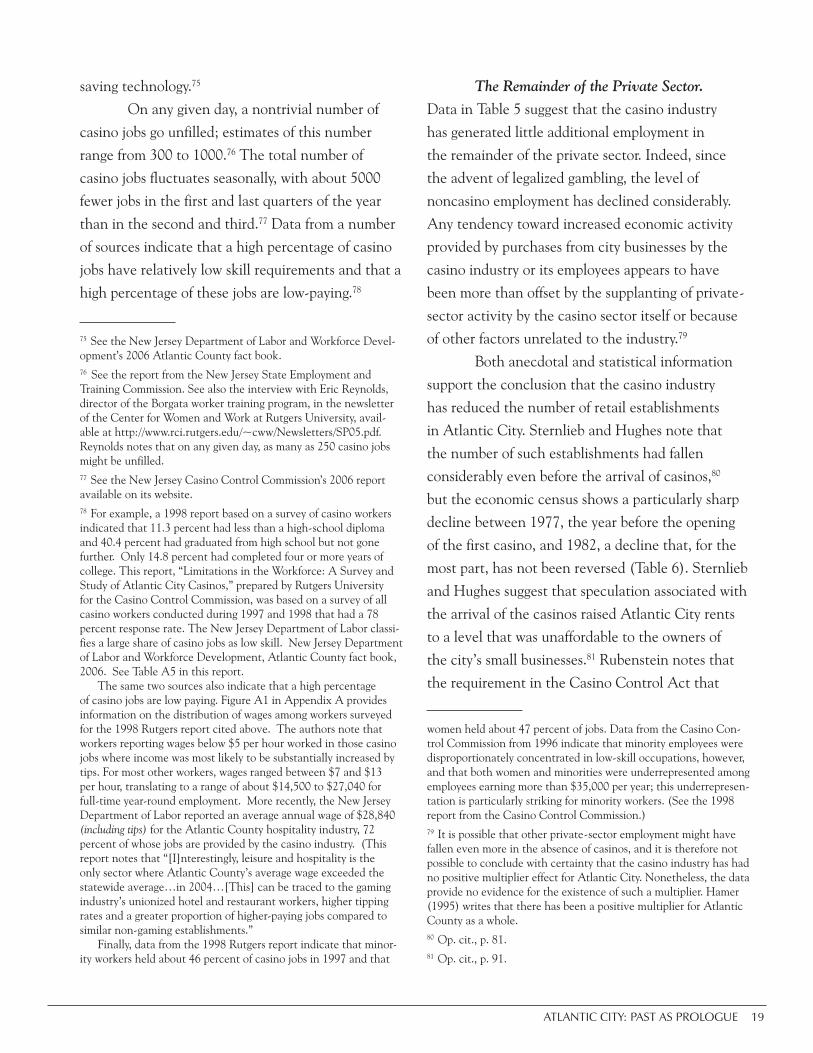
TABLE 5
Private-Sector Economic Activity, Atlantic City
Year Private-sector cov-ered employment*
(000)
Casino employment
(000)
Casino employment as % of all covered
employment
Noncasino private covered
employment (000)
1960 24.8 - - 24.8
1965 26.6 - - 26.6
1970 25.1 - - 25.1
1975 22.0 - - 22.0
1976 22.6 - - 22.6
1977 21.5 - - 21.5
1978 24.0 3.3 13.7 20.7
1979 31.5 10.1 32.1 21.4
1980 36.4 16.7 45.9 19.7
1981 46.6 27.6 59.2 19.0
1982 47.1 29.1 61.8 18.0
1983 51.2 31.7 62.0 19.5
1984 59.5 36.5 61.3 23.0
1985 60.8 40.1 66.0 20.7
1986 59.7 39.2 65.7 20.5
1987 61.9 41.5 67.1 20.4
1988 61.9 43.1 69.6 18.8
1989 62.3 42.5 68.2 19.8
1990 66.0 47.7 72.2 18.3
1991 59.3 44.5 75.1 14.8
1992 59.6 45.1 75.6 14.5
1993* 58.9 44.1 74.9 14.8
1998 62.4 48.4 79.1 13.1
1999* 60.5 46.8 80.2 12.0
2003 54.8 46.5 87.8 6.7
2004 57.8 44.2 80.2 8.4
2005 59.2 43.9 77.8 13.2
2006 60.7 44.1 74.8 15.1
2007 56.1 38.8 69.2 17.3
percent of Atlantic City’s
residents over age 25 lacked a
high school diploma, and only
10.4 percent had completed
a bachelor’s degree or higher.
For New Jersey as a whole,
only 18 percent of this age
group lacked a high school
diploma, while 29.8 percent
had completed at least a
bachelor’s degree.
Changes in Private-Sector Economic Activity The number of
private-sector jobs jumped
sharply in Atlantic City
after the arrival of casinos.
Since the early 1980s, the
casinos have provided a large
majority of Atlantic City
jobs, and the industry’s share
has tended to grow over
time (Table 5). However, the
number of casino jobs has
been fairly flat since 1990
and, indeed, has declined
somewhat in recent years, a
phenomenon that the New
Jersey Department of Labor
attributes in part to a switch
to less labor-intensive forms
of gambling (e.g., from card
games to slot machines) and
to the adoption of labor-
for Atlantic City and New Jersey, respectively.
*All numbers are provided for September of the relevant year. “Covered employment” is employment covered by unemployment and temporary disability benefit laws. The reader should note that job categories covered by these laws have not been constant over time, so that year-to-year changes in covered employ-ment may sometimes reflect changes in covered categories as well as actual employment changes. Despite this shortcoming, these data are used because they provide the most complete historical record. Data sources: For years 1960 to 1975, see Sternlieb and Hughes (1983), p. 178, Table 5. For years 1976 to 1993, see Hamer (1995), Table 4. For years 1998 to 1999 and 2003 to 2007, data can be accessed from the New Jersey Department of Labor and Workforce website at http://lwd.dol.state.nj.us/labor/lpa/employ/qcew/qcew_index.html. (City-level data are not available in tabulated form for 1994 through 1997and 2000-2002.) Casino employment comes from the New Jersey Department of Labor and Workforce’s Nonfarm Pay-roll Employment Time Series and from Hamer, Table 4, which also uses this source. All casino employment is “covered employment.” Noncasino employment is calculated as the difference between all city employment and casino employment.
ATLANTIC CITY: PAST AS PROLOGUE 19
saving technology.75
On any given day, a nontrivial number of
casino jobs go unfilled; estimates of this number
range from 300 to 1000.76 The total number of
casino jobs fluctuates seasonally, with about 5000
fewer jobs in the first and last quarters of the year
than in the second and third.77 Data from a number
of sources indicate that a high percentage of casino
jobs have relatively low skill requirements and that a
high percentage of these jobs are low-paying.78
75 See the New Jersey Department of Labor and Workforce Devel-opment’s 2006 Atlantic County fact book.76 See the report from the New Jersey State Employment and Training Commission. See also the interview with Eric Reynolds, director of the Borgata worker training program, in the newsletter of the Center for Women and Work at Rutgers University, avail-able at http://www.rci.rutgers.edu/~cww/Newsletters/SP05.pdf. Reynolds notes that on any given day, as many as 250 casino jobs might be unfilled.77 See the New Jersey Casino Control Commission’s 2006 report available on its website. 78 For example, a 1998 report based on a survey of casino workers indicated that 11.3 percent had less than a high-school diploma and 40.4 percent had graduated from high school but not gone further. Only 14.8 percent had completed four or more years of college. This report, “Limitations in the Workforce: A Survey and Study of Atlantic City Casinos,” prepared by Rutgers University for the Casino Control Commission, was based on a survey of all casino workers conducted during 1997 and 1998 that had a 78 percent response rate. The New Jersey Department of Labor classi-fies a large share of casino jobs as low skill. New Jersey Department of Labor and Workforce Development, Atlantic County fact book, 2006. See Table A5 in this report. The same two sources also indicate that a high percentage of casino jobs are low paying. Figure A1 in Appendix A provides information on the distribution of wages among workers surveyed for the 1998 Rutgers report cited above. The authors note that workers reporting wages below $5 per hour worked in those casino jobs where income was most likely to be substantially increased by tips. For most other workers, wages ranged between $7 and $13 per hour, translating to a range of about $14,500 to $27,040 for full-time year-round employment. More recently, the New Jersey Department of Labor reported an average annual wage of $28,840 (including tips) for the Atlantic County hospitality industry, 72 percent of whose jobs are provided by the casino industry. (This report notes that “[I]nterestingly, leisure and hospitality is the only sector where Atlantic County’s average wage exceeded the statewide average…in 2004…[This] can be traced to the gaming industry’s unionized hotel and restaurant workers, higher tipping rates and a greater proportion of higher-paying jobs compared to similar non-gaming establishments.” Finally, data from the 1998 Rutgers report indicate that minor-ity workers held about 46 percent of casino jobs in 1997 and that
The Remainder of the Private Sector.
Data in Table 5 suggest that the casino industry
has generated little additional employment in
the remainder of the private sector. Indeed, since
the advent of legalized gambling, the level of
noncasino employment has declined considerably.
Any tendency toward increased economic activity
provided by purchases from city businesses by the
casino industry or its employees appears to have
been more than offset by the supplanting of private-
sector activity by the casino sector itself or because
of other factors unrelated to the industry.79
Both anecdotal and statistical information
support the conclusion that the casino industry
has reduced the number of retail establishments
in Atlantic City. Sternlieb and Hughes note that
the number of such establishments had fallen
considerably even before the arrival of casinos,80
but the economic census shows a particularly sharp
decline between 1977, the year before the opening
of the first casino, and 1982, a decline that, for the
most part, has not been reversed (Table 6). Sternlieb
and Hughes suggest that speculation associated with
the arrival of the casinos raised Atlantic City rents
to a level that was unaffordable to the owners of
the city’s small businesses.81 Rubenstein notes that
the requirement in the Casino Control Act that
women held about 47 percent of jobs. Data from the Casino Con-trol Commission from 1996 indicate that minority employees were disproportionately concentrated in low-skill occupations, however, and that both women and minorities were underrepresented among employees earning more than $35,000 per year; this underrepresen-tation is particularly striking for minority workers. (See the 1998 report from the Casino Control Commission.)79 It is possible that other private-sector employment might have fallen even more in the absence of casinos, and it is therefore not possible to conclude with certainty that the casino industry has had no positive multiplier effect for Atlantic City. Nonetheless, the data provide no evidence for the existence of such a multiplier. Hamer (1995) writes that there has been a positive multiplier for Atlantic County as a whole.80 Op. cit., p. 81.81 Op. cit., p. 91.

20 ATLANTIC CITY: PAST AS PROLOGUE
gambling be confined to hotels with at least 500
guest rooms meant that gambling operations were
large enough to provide nongambling services such
as food and beverage provision for their patrons
in-house82 and they had a clear motive to do so in
order to maximize time spent on gambling activities.
This latter point suggests that much of the city’s
retail activity (and employment) may have simply
shifted venues; however, such a shift would probably
not have been neutral in terms of the well-being of
Atlantic City’s residents because of the effects on
their consumption choices and, for some residents,
on their employment opportunities, to the extent
that casino employment requirements tended to
82 Rubenstein, 1984.
be more stringent than those of businesses
that were supplanted. Moreover, the post-
1977 decline in retail establishments does
not appear to have been limited to those
businesses that served tourists but also
includes establishments that would probably
have been oriented to residents, such as
grocery stores and dry cleaners.
In the past several years, there has
been some expansion of retail activity in the
city, most notably in two tourist-oriented
retail districts, the Walk, located in the city’s
center and slated for expansion, and at the
Quarters, located in the Tropicana Hotel;
both districts were developed under the
auspices of the CRDA Urban Revitalization
Program, established by the New Jersey
legislature in 2001.83 This new retail activity
is likely a contributor to the growth in
noncasino private-sector jobs in the recent
past (see Table 5).
The CRDA’s Economic Development
Role. The support that the CRDA’s Urban
Revitalization Program provides for tourist-oriented
retail activity is only one facet of the role it plays in
fostering private-sector economic development. In
1993, the New Jersey legislature specifically directed
the CRDA to provide funding for construction of
hotel rooms, a reversal of the prohibition on using
CRDA funds for casino development included in
its authorizing legislation. Since then, additional
legislative changes to the relevant section of the
Casino Control Act have supported an increasingly
broad range of activities that directly provide
funding for casinos (e.g., funding for an IMAX
83 Casino Control Act, Article 12. See the CRDA’s website at http://www.njcrda.com/about.html for more information about the program.
TABLE 6
Selected Retail Activity, Atlantic City, New Jersey (number of establishments)*
19771 19822 19873 19924 19975 20026
All retail 760 406 456 478 NA** NA**
Furniture 10 14 5 3 5 5
Food and beverages
100 51 59 56 63 59
Eating and drinking places
243 154 146 163 151 145
Clothing and accessories
95 58 84 88 89 85
Dry cleaning, laundry
34 46 14 12 14 12
*U.S. Economic Census** In 1977, the Census Bureau switched from using SIC industry classifications to NAICS classifications. As a result, the set of business types classified as “retail” from 1997 to the present differ from the set so classified in earlier years.11977, U.S. Economic Census: Geographic Area Series, Retail Trade, Table 6; 1977 U.S. Economic Census: Geographic Area Series, Service Industries, Table 621982, U.S. Economic Census: Geographic Area Series, Retail Trade, Table 8; 1982 U.S. Economic Census: Geographic Area Series, Service Industries, Table 731987, U.S. Economic Census: Geographic Area Series, Retail Trade, Table 6; 1987 U.S. Economic Census: Geographic Area Series, Service Industries, Table 641992, U.S. Economic Census: Geographic Area Series, Retail Trade, Table 5; 1992 U.S. Economic Census: Geographic Area Series, Service Industries, Table 551997, U.S Economic Census, Geographic Area Series, Retail Trade, Sector 44; 1997, U.S. Economic Census: Geographic Area Series, Other Services, Sector 8162002, U.S Economic Census, Geographic Area Series, Retail Trade, Sector 44; 2002, U.S. Economic Census: Geographic Area Series, Other Services, Sector 81
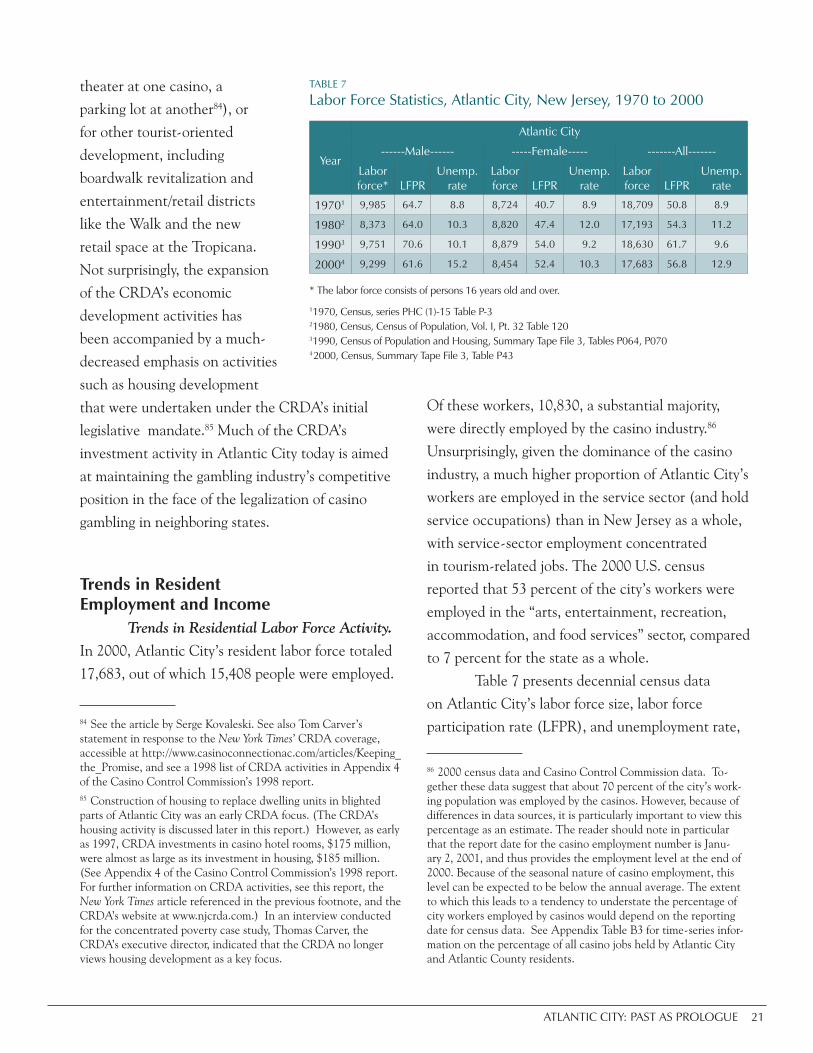
ATLANTIC CITY: PAST AS PROLOGUE 21
theater at one casino, a
parking lot at another84), or
for other tourist-oriented
development, including
boardwalk revitalization and
entertainment/retail districts
like the Walk and the new
retail space at the Tropicana.
Not surprisingly, the expansion
of the CRDA’s economic
development activities has
been accompanied by a much-
decreased emphasis on activities
such as housing development
that were undertaken under the CRDA’s initial
legislative mandate.85 Much of the CRDA’s
investment activity in Atlantic City today is aimed
at maintaining the gambling industry’s competitive
position in the face of the legalization of casino
gambling in neighboring states.
Trends in Resident Employment and Income Trends in Residential Labor Force Activity.
In 2000, Atlantic City’s resident labor force totaled
17,683, out of which 15,408 people were employed.
84 See the article by Serge Kovaleski. See also Tom Carver’s statement in response to the New York Times’ CRDA coverage, accessible at http://www.casinoconnectionac.com/articles/Keeping_the_Promise, and see a 1998 list of CRDA activities in Appendix 4 of the Casino Control Commission’s 1998 report. 85 Construction of housing to replace dwelling units in blighted parts of Atlantic City was an early CRDA focus. (The CRDA’s housing activity is discussed later in this report.) However, as early as 1997, CRDA investments in casino hotel rooms, $175 million, were almost as large as its investment in housing, $185 million. (See Appendix 4 of the Casino Control Commission’s 1998 report. For further information on CRDA activities, see this report, the New York Times article referenced in the previous footnote, and the CRDA’s website at www.njcrda.com.) In an interview conducted for the concentrated poverty case study, Thomas Carver, the CRDA’s executive director, indicated that the CRDA no longer views housing development as a key focus.
Of these workers, 10,830, a substantial majority,
were directly employed by the casino industry.86
Unsurprisingly, given the dominance of the casino
industry, a much higher proportion of Atlantic City’s
workers are employed in the service sector (and hold
service occupations) than in New Jersey as a whole,
with service-sector employment concentrated
in tourism-related jobs. The 2000 U.S. census
reported that 53 percent of the city’s workers were
employed in the “arts, entertainment, recreation,
accommodation, and food services” sector, compared
to 7 percent for the state as a whole.
Table 7 presents decennial census data
on Atlantic City’s labor force size, labor force
participation rate (LFPR), and unemployment rate,
86 2000 census data and Casino Control Commission data. To-gether these data suggest that about 70 percent of the city’s work-ing population was employed by the casinos. However, because of differences in data sources, it is particularly important to view this percentage as an estimate. The reader should note in particular that the report date for the casino employment number is Janu-ary 2, 2001, and thus provides the employment level at the end of 2000. Because of the seasonal nature of casino employment, this level can be expected to be below the annual average. The extent to which this leads to a tendency to understate the percentage of city workers employed by casinos would depend on the reporting date for census data. See Appendix Table B3 for time-series infor-mation on the percentage of all casino jobs held by Atlantic City and Atlantic County residents.
TABLE 7
Labor Force Statistics, Atlantic City, New Jersey, 1970 to 2000
Year
Atlantic City
------Male------ -----Female----- -------All-------
Labor force* LFPR
Unemp.rate
Labor force LFPR
Unemp.rate
Labor force LFPR
Unemp.rate
19701 9,985 64.7 8.8 8,724 40.7 8.9 18,709 50.8 8.9
19802 8,373 64.0 10.3 8,820 47.4 12.0 17,193 54.3 11.2
19903 9,751 70.6 10.1 8,879 54.0 9.2 18,630 61.7 9.6
20004 9,299 61.6 15.2 8,454 52.4 10.3 17,683 56.8 12.9
* The labor force consists of persons 16 years old and over.
11970, Census, series PHC (1)-15 Table P-321980, Census, Census of Population, Vol. I, Pt. 32 Table 12031990, Census of Population and Housing, Summary Tape File 3, Tables P064, P0704 2000, Census, Summary Tape File 3, Table P43
22 ATLANTIC CITY: PAST AS PROLOGUE
for all residents and by gender; Figure 2 graphs
more complete time-series data on unemployment
rates from the U.S. Bureau of Labor Statistics (BLS)
for the city, as well as for New Jersey and the U.S.
Together, these data suggest positive changes in
labor market activity between 1970, eight years
before the opening of the first casino, and 1990,
12 years after that opening. LFPRs rise for both
men and women, with especially large increases
for women. The Atlantic City unemployment rate,
which stood at about 18 percent in 1977,87 fell
almost continuously from 1978 to 1989, and, by the
mid-1980s, had fallen almost to the level of the U.S.
(see Figure 2).
This situation reverses between 1990 and
87 BLS data not presented here indicate that the Atlantic City unemployment rate had actually risen sharply in the early and mid-1970s over its rate at the start of the decade. In turn, that the 1980 unemployment rate presented in Table 7 is higher than the 1970 rate is not inconsistent with a falling unemployment rate after the arrival of legalized gambling.
2000. LFPRs for men fall below the 1970
level, and the male rate of unemployment rises
above it. Women’s LFPR also falls, and their
unemployment rate rises, though in neither
case do the rates return to their 1980 levels.
Figure 2 illustrates the sharpness with which
the trend of the previous decade reversed.
Between 1989 and 1992, unemployment in
Atlantic City shoots up88 and the gap between
this rate and those of both New Jersey and
the U.S. widens greatly. This gap stays large
in subsequent years, although it has been
somewhat smaller in the current decade than in
the 1990s. Why this large gap opened and why
it persisted are questions of some importance in
understanding how the casinos have affected
the well-being of Atlantic City’s residents. A
related question is why the reversals in the
LFPR and the unemployment rate trends were
less pronounced for women than for men. Each
question is considered below.
It seems plausible that the sharp rise in the
unemployment rate that occurred at the start of
the 1990s, both absolutely and in relation to that of
the U.S, is at least partially related to a fairly sharp
decline in noncasino private-sector employment
at about this time, which is evident in Table 5. (At
about this time, construction work associated with
the addition of new casinos would have been winding
down, and it is likely that much of the new residential
construction that occurred in the 1980s89 was being
completed as well. Data for Atlantic County show a
marked increase in construction employment over
the late 1980s, followed by a sharp decline at the
88 The New Jersey and U.S. unemployment rates also rose between 1989 and 1992, though not as sharply. 89 New residential construction in the 1980s is discussed in a later section of this report. It includes a large number of units built under the CRDA’s auspices.
Source: Figure 2 is based on figures presented in a 2000 U.S. Government Ac-countability Office (GAO) report and in the Federal Reserve Community Affairs offices’ System-wide study of concentrated poverty. Statistics come from the U.S. Bureau of Labor Statistics.*Figure shows the annual unemployment rate for all years except 2008, for which this rate was not available. For 2008, data are provided for September, the most recent month for which they are available.

ATLANTIC CITY: PAST AS PROLOGUE 23
start of the 1990s; county construction employment
did not return to its late 1980s level until the
following decade.90 A loss in construction jobs and
of employment that served the construction industry
provides a possible explanation for the decline in
noncasino private-sector employment at this time.)
If the characteristics of those residents who lost
jobs in the noncasino sector were such that they
could not easily find work in the casino sector, e.g.,
because of criminal records, one would expect the
unemployment rate to rise and — because of the
discouraged worker effect — the LFPR to decline.91
Moreover, after 1990, the number of casino jobs
stayed fairly flat, while the prime-age workforce
continued to grow. (See Tables 4B and 5 and Figure
3.) These conditions would tend to exacerbate
any rise in unemployment or decline in the LFPR
90 Data on construction employment covered by unemployment insurance from 1991 forward, and on wage and salary employment in mining, natural resources, and construction from 1990 forward are available on the New Jersey Department of Labor and Work-force Development’s website at http://lwd.dol.state.nj.us/labor/lpa/employ/emp_index.html. Data for earlier years are available in department publications.91 Goertzel and Cosby suggest a variant of this hypothesis. See pp. 62-66, especially p. 66, of their article.
associated with a loss in noncasino jobs.92
That the reversal in labor market
activity is less pronounced for women than
for men may reflect gender differences in the
ability to obtain work in the casino industry.
(This would be the case, for example, if men
were more likely than women to have criminal
records or drug problems, or if more casino
jobs were in female-dominated occupations
than in male-dominated occupations.)
Changes in state and national welfare policies,
together with training programs aimed at
supporting these policies, may be another
factor. Writing at the start of the casino era,
Sternlieb and Hughes argue that “the paucity
of job opportunities over a long period, particularly
for minorities in such a depressed area, has created
a whole generation of residents with substantial
problems in adjusting to the workplace — even
with the best job prospects.”93 Implicit in this
argument is the suggestion that residents might
need assistance in developing the basic work skills
necessary to maintain a job. Ted Goertzel and John
Cosby note that in the late 1980s and in the 1990s,
a number of relatively large-scale programs with
this purpose were developed for welfare mothers.
While they note that these programs have not been
formally evaluated, they believe that the programs,
in combination with the work requirement “stick”
that was part of federal welfare reform in 1996,
increased the likelihood that welfare mothers
would both seek jobs and be able to maintain
them. The authors further suggest that the types
of programs provided to welfare mothers were not
92 In addition, the percentage of city residents who were foreign born increased substantially in the 1990s, and a large share of the foreign born were new immigrants (see Table 4B). In turn, competi-tion for low-skill, entry-level jobs may have been particularly fierce. 93 See Sternlieb and Hughes, p. 89.
Note: According to information provided by the New Jersey Casino Control Commission, the number of hotel casino jobs reflects full-time positions.Source: New Jersey Department of Labor and New Jersey Casino Control Commission. Figure taken from 2000 GAO report, p. 18.
24 ATLANTIC CITY: PAST AS PROLOGUE
available to Atlantic City’s male residents. 94
Trends in Income, Poverty, and Use
of Public Assistance. Income of Atlantic City
94 See Goertzel and Cosby, pp. 64-65.
residents lagged that of New Jersey and the U.S. by
a considerable amount in 1950,95 near the heyday
of the beach resort, and it has continued to do so
since the arrival of gambling, as is clear from Table
8, which provides information on median household
and family income from the 1970 through the
2000 decennial censuses. On another measure, per
capita income, Atlantic City ranked 532nd out of
566 jurisdictions in New Jersey in 1989 and 543rd in
1999.96
Table 8 also shows that Atlantic City’s
poverty rate has been considerably higher than those
reported for both the U.S. and New Jersey in each
decennial census. In 1999, for example, Atlantic
City’s poverty rate was about two times that of
the U.S. and more than 2.5 times that of the state.
Atlantic City also fares poorly on other statistics
that measure economic need: The census defines
individuals living in households where income is
between 100 percent and 125 percent of the poverty
line as “near poor.” While the census itself does not
provide a definition for “low income,” federal and
state policymakers frequently define low-income
individuals as those living in households where
income is less than 200 percent of the poverty line.97
By these definitions, 30.3 percent of Atlantic City’s
population was poor or near poor, and 49.9 percent
was low income, in 1999. For the U.S., 16.5 percent
of the population was poor or near poor in that year
and 29.6 percent was low income; for New Jersey as
a whole, the corresponding percentages were 11.2
percent and 20.4 percent.
95 See Table 3.96 New Jersey State Data Center, “Money Income (1989 and 1999) and Poverty (1999): New Jersey, Counties and Municipalities, 2003,” accessible at http://www.wnjpin.net/OneStopCareerCenter/LaborMarketInformation/lmi25/pub/NJSDC-P4.pdf.97 This definition is often used in determining eligibility for public programs. For example, it is frequently used in determining eligibil-ity for the State Children’s Health Insurance Program (SCHIP).
Worker Training in the Current Decade
As is discussed later in this report, it is likely that a lack of “work readiness” continues to be a factor in the high level of unemployment and low LFPRs that characterize Atlantic City today. In interviews conducted for the concentrated poverty case study that preceded this report, a number of worker training programs aimed at improving Atlantic City residents’ “job readiness,” as well as more specific job skills, were identified. As a group, these programs target a broader range of the population than did the earlier programs discussed by Goertzel and Cosby. One particularly large-scale and recent example has been an effort sponsored by the Borgata Casino. As part of a Community Benefit Agreement, the Borgata made a commitment to train and find employment for 2000 unemployed or underemployed Atlantic City residents. By 2003, this effort was underway, and by March 2007, the casino reported that it had trained and placed 2100 residents, primarily in the gaming industry. To meet labor needs associated with an expansion that created 1600 new positions, the Borgata extended the program after meeting its original target.

ATLANTIC CITY: PAST AS PROLOGUE 25
The use of public assistance
by Atlantic City households is
considerably lower today than in
the years just prior to the advent of
legalized gambling, when the city’s
welfare caseload per 10,000 residents
was extremely high compared to both
the state and the nation (see Figure
4). The timing of the sharpest declines
in this measure — after the advent
of gambling and after the passage of
welfare reform in 1996 — suggests the
effects that these events had on welfare
receipt. While the percentage of
households receiving public assistance
has fallen greatly, it is still very high
compared to the state percentage.98
Employment and Income
Patterns Within Atlantic City. The
statistics associated with the well-
being of Atlantic City’s residents
presented earlier in this section, such
as poverty and unemployment rates,
were calculated on a citywide basis.
By their nature, they do not provide
information on how residents’ well-
being, as indicated by such measures,
varies across neighborhoods or racial/
ethnic groups. For example, the
citywide poverty rate was 24 percent in 1999; this
rate could be fairly flat across the city, or it could
capture a situation in which extremely high poverty
rates in some neighborhoods are offset by low rates
in others. Distributional information of this type
is important both in assessing the nature of the
problems faced by Atlantic City’s residents and in
98 In 1999, the percentage of Atlantic City households receiving public assistance was 2.7 times that of the state. Source: 2000 Census, Tape 3, Table 64.
developing programs to ameliorate them.99 This
chapter presents key statistics from the 2000 census
on employment and income patterns by individual
racial and ethnic group and by census tract.
Data on labor market activity, median
income, and poverty/low-income status,100 broken
99 For example, whether a high incidence of poverty is largely confined to one racial/ethnic group or one geographic area has implications for targeting anti-poverty programs.100 Low income is defined here as in the previous subsection.
TABLE 8
Income and Poverty Rates for Atlantic City, New Jersey, and the U.S., 1969 to 1999
Median family
income
Median household
income
% of population
poor
% of population
poor or near poor1
% of population
low income2
19693
Atlantic City $6,395 $4,257 22.5 24.8 48.2
New Jersey 11,403 10,371 8.1 11.5 N/A
U. S. 9,590 7,699 13.7 18.6 N/A
19794
Atlantic City 13,238 9,807 24.9 32.4 52.2
New Jersey 22,906 19,800 9.5 10.3 24.3
U. S. 19,917 16,841 12.4 17.0 31.7
19895
Atlantic City 27,804 20,309 25.0 30.8 45.8
New Jersey 47,589 40,927 7.6 10.0 18.5
U. S. 35,225 30,056 13.1 17.5 31.0
19996
Atlantic City 31,997 26,969 23.6 30.3 49.9
New Jersey 65,370 55,146 8.5 11.2 20.4
U. S. 50,046 41,994 12.4 16.5 29.6
1The U.S. Census Bureau classifies a person as near poor if he or she lives in a household whose income is at least 100 percent but less than 125 percent of the relevant poverty threshold. 2 A person is classified as low income if he or she lives in a household whose income is less than 200 percent of the relevant poverty threshold. (The U.S. Census Bureau does not define low income. The classification used here is often used by federal and state policymakers; for example, eligibility for some government programs is based on this classification.) 31970, Census of Population and Housing, Series PHC (1): Census Tracts, P-4; 1970, Census of Population, Tables 58, 94, 95, 199, 20641980, Census of Population, Vol. 1, Pt. 32 Tables 71, 72, 107, 108, 124, 12551990, Census of Population and Housing, Summary Tape File 3, Tables P080A, P107A, P12162000, Census, Summary Tape File 3, Tables P53, P77, P88. (The U.S. poverty rate reported here is somewhat higher than the 1999 rate based on CPS data, which is the rate typically reported in time-series data.)
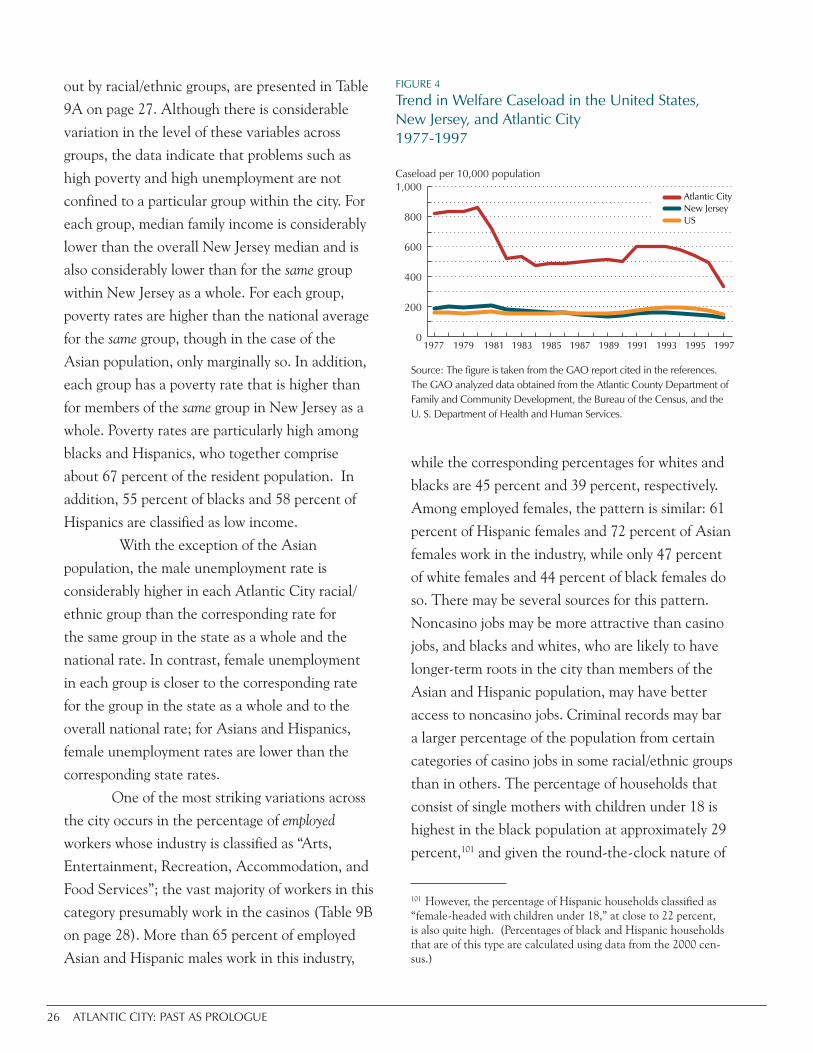
26 ATLANTIC CITY: PAST AS PROLOGUE
out by racial/ethnic groups, are presented in Table
9A on page 27. Although there is considerable
variation in the level of these variables across
groups, the data indicate that problems such as
high poverty and high unemployment are not
confined to a particular group within the city. For
each group, median family income is considerably
lower than the overall New Jersey median and is
also considerably lower than for the same group
within New Jersey as a whole. For each group,
poverty rates are higher than the national average
for the same group, though in the case of the
Asian population, only marginally so. In addition,
each group has a poverty rate that is higher than
for members of the same group in New Jersey as a
whole. Poverty rates are particularly high among
blacks and Hispanics, who together comprise
about 67 percent of the resident population. In
addition, 55 percent of blacks and 58 percent of
Hispanics are classified as low income.
With the exception of the Asian
population, the male unemployment rate is
considerably higher in each Atlantic City racial/
ethnic group than the corresponding rate for
the same group in the state as a whole and the
national rate. In contrast, female unemployment
in each group is closer to the corresponding rate
for the group in the state as a whole and to the
overall national rate; for Asians and Hispanics,
female unemployment rates are lower than the
corresponding state rates.
One of the most striking variations across
the city occurs in the percentage of employed
workers whose industry is classified as “Arts,
Entertainment, Recreation, Accommodation, and
Food Services”; the vast majority of workers in this
category presumably work in the casinos (Table 9B
on page 28). More than 65 percent of employed
Asian and Hispanic males work in this industry,
while the corresponding percentages for whites and
blacks are 45 percent and 39 percent, respectively.
Among employed females, the pattern is similar: 61
percent of Hispanic females and 72 percent of Asian
females work in the industry, while only 47 percent
of white females and 44 percent of black females do
so. There may be several sources for this pattern.
Noncasino jobs may be more attractive than casino
jobs, and blacks and whites, who are likely to have
longer-term roots in the city than members of the
Asian and Hispanic population, may have better
access to noncasino jobs. Criminal records may bar
a larger percentage of the population from certain
categories of casino jobs in some racial/ethnic groups
than in others. The percentage of households that
consist of single mothers with children under 18 is
highest in the black population at approximately 29
percent,101 and given the round-the-clock nature of
101 However, the percentage of Hispanic households classified as “female-headed with children under 18,” at close to 22 percent, is also quite high. (Percentages of black and Hispanic households that are of this type are calculated using data from the 2000 cen-sus.)
Source: The figure is taken from the GAO report cited in the references. The GAO analyzed data obtained from the Atlantic County Department of Family and Community Development, the Bureau of the Census, and the U. S. Department of Health and Human Services.

ATLANTIC CITY: PAST AS PROLOGUE 27
casino activity, such mothers may find it difficult to
meet casino schedule requirements, especially in the
absence of high-quality day care.102
Maps showing the geographic distribution
of a number of economic indicators are presented
on page 29. The maps suggest that low income and
phenomena related to it are common throughout
the city’s neighborhoods. In all but two tracts,
the percentage of the population classified as low
income, i.e., living in a household with an income
less than two times the relevant poverty line for
that household, is at least 10 percentage points
higher than in the U.S. as a whole. All tracts have
median family incomes below the U.S. median of
$50,046, with only two tracts coming within $6000
of this median; all tract medians are well below
102 Residents interviewed for the concentrated poverty case study often cited the absence of safe, affordable day care as a factor that limited parents’ ability to maintain casino employment.
the New Jersey median family income of $65,370
(Map 3). The male unemployment rate is higher
than the national rate in all tracts, and in only one
case is the tract rate within one percentage point
of the national rate.103 The female unemployment
rate is higher than that of the U.S. in all but two of
the city’s 14 tracts, and in only two of the other 12
tracts is the tract rate less than one percentage point
higher than the U.S. rate (Map 4).
At the same time, there are clear
differences across tracts. In general, problems tend
to be most severe in the northeastern part of the
city, which is predominantly black. For example,
the male unemployment rate is above 20 percent
in much of the northeastern part of the city but
typically below 12 percent elsewhere. (Female
103 Unemployment calculations using data from the 2000 U.S. census give male and female civilian unemployment rates of 5.7 percent and 5.8 percent, respectively.
TABLE 9A
Economic Indicators by Racial/Ethnic Group for Atlantic City, New Jersey, and the U.S., 2000
African-American Hispanic Asian White
Atlantic City
New Jersey U.S
Atlantic City
New Jersey U.S
Atlantic City
New Jersey U.S
Atlantic City
New Jersey U.S
Median Family Income1 27,708 44,539 33,332 29,836 40,105 34,397 47,295 78,391 59,471 39,542 73,043 54,698
Income status2
--Poor (%)3 29.6 18.5 24.8 23.1 17.9 22.6 13.0 6.8 12.6 17.4 4.7 8.1
--Poor or Near Poor (%) 38.6 23.0 31.0 29.7 23.8 30.3 14.0 8.8 16.2 21.7 6.5 11.2
--Low Income (%) 55.1 36.5 47.7 58.1 41.4 51.4 26.1 15.9 27.6 35.3 13.2 22.3
Unemploy-ment Rate: Male4 23.6 12.8 12.3 14.3 8.5 8.3 1.3 4.2 5.0 12.8 4.2 4.4
Unemploy-ment Rate: Female 13.5 10.5 10.9 9.7 10.7 10.7 3.9 5.0 5.3 6.4 4.1 4.3
12000, Census, Summary Tape File 4, Table PCT11322000, Census, Summary Tape File 4, Table PCT14232000, Census, Summary Tape File 4, Table PCT141. “Near poor” and “low income” are defined as in the footnotes to Table 8.4For both male and female unemployment statistics, the following sources were used: 2000, Census, Summary Tape File 3, Tables P150H and P150I; 2000, Census, Summary Tape File 4, Table PCT79

28 ATLANTIC CITY: PAST AS PROLOGUE
Since 1980, the year-
round housing stock has
fallen about 7 percent,
but the vacancy rate in
this stock has remained
high; it stood at about 13
percent in 2000.107 While
this number might suggest
that housing units can be
easily found, it is important to note that throughout
the gambling era, the vacancy rate has overstated
housing availability, since a high percentage of year-
round vacant units are neither for sale nor rent. In
2000, for example, 6 percent of the year-round stock
belonged to this category, which is designated “other
vacancies.”108
The large majority of the city’s households
have historically been renters, and this continues
to be the case today: 71 percent of households were
renters in 2000, compared to 34 percent for the
state as a whole. In the past 50 years, the Atlantic
City rental stock has included a large number of
subsidized units, including public housing, privately
owned HUD-subsidized developments, and low-
income housing tax credit properties; in the
early 1980s, more than 20 percent was subsidized
percent of the city’s housing units were in substandard condition (Sternlieb and Hughes, p. 113). Unfortunately, comparable statis-tics are not available for later years. However, some of the city’s worst stock was demolished and replaced by CRDA-sponsored units, suggesting that this percentage is likely lower today. 107 In comparison, the vacancy rate for year-round units for the state of New Jersey was 4 percent in 2000. However, Atlantic City’s 2000 rate of 13 percent is similar to that of Trenton (13 percent), in central New Jersey, and below that of Camden (19 percent), in the south-central part of the state. 108 In 1990, 73 percent of “other vacancies” were boarded up. (Statistics were calculated from the 1990 census. The 2000 census does not report on number of boarded-up units.) As was the case with the overall vacancy rate for year-round units for 2000, the percentage of the stock falling into the “other vacancy” category is very high compared to that of the state as a whole but similar in magnitude to that in Trenton (6 percent) and considerably below that of Camden (13 percent).
unemployment, while it is also more severe in the
northeastern census tracts, does not vary as greatly
across the city.) The 1999 poverty rate is close to
the national average of 12.4 percent in most of the
southwestern part of the city; in the northeastern
part of the city, the poverty rate is considerably
above the national rate in many tracts.
Atlantic City as Residence: Trends in Housing The Housing Stock and Its Use. Housing
statistics for Atlantic City at the start of the
gambling era reflect the city’s decline over the
previous decades. In 1980, the decennial census
year closest to the start of the gambling era, the
census reported that Atlantic City had 19,635 units
in its year-round housing stock (Table 10, page 30).
Almost 15 percent of these year-round units were
classified as vacant,104 unsurprising in a city whose
population had fallen 35 percent since 1950.105,106
104 The overall vacancy rate was considerably higher (22.2 per-cent) than the 15 percent vacancy rate for the year-round stock, reflecting the large number of seasonally vacant vacation homes that one would expect in a shore community. For example, in 1980, 8.8 percent of all housing units were classified as seasonally vacant migratory housing or vacant, held for occasional use.105 Interestingly, the 1950 and 1960 censuses indicate that the housing stock actually grew during the 1950s and maintained its level in the 1960s despite substantial population loss over this period. 106 Moreover, according to a survey of residential properties conducted by the Atlantic City Planning Department in 1979, 23
TABLE 9B
Resident Employment in Arts, Entertainment, Recreation, Accommodations, and Food Services by Race/Ethnicity and Gender, Atlantic City, 2000
Employment as percentage of employed persons*
African-American Hispanic Asian White
Male 39.1 66.4 69.9 44.7
Female 44.0 60.7 72.3 47.2
*2000, Census, Summary Tape File 4, Table PCT85

ATLANTIC CITY: PAST AS PROLOGUE 29
% POVERTY % LOW INCOMEMEDIAN FAMILY INCOME (1999)
12.8% 35.4%$44,712.00 20.4% 46.5%
$32,051.00
41% 65.5%$20,463.00
26.6% 59.8%$27,686.0040.8% 74.4%
$20.732.00
42.1% 67.2%$19,688.00
20.5% 47.8%$32,902.00
34.6% 63.7%$24,804.00
22.9% 49.6%$31,920.00
15% 39.6%$38,078.00
15.3% 42.3%$40,132.00
13.5% 40.8%$39,769.00
15.4% 42.3%$33,229.00
12.1% 26.2%$47,202.00
Source: U.S. Census, 2000
Source: U.S. Census, 2000
% POVERTY % LOW INCOMEMEDIAN FAMILY INCOME (1999)
12.8% 35.4%$44,712.00 20.4% 46.5%
$32,051.00
41% 65.5%$20,463.00
26.6% 59.8%$27,686.0040.8% 74.4%
$20.732.00
42.1% 67.2%$19,688.00
20.5% 47.8%$32,902.00
34.6% 63.7%$24,804.00
22.9% 49.6%$31,920.00
15% 39.6%$38,078.00
15.3% 42.3%$40,132.00
13.5% 40.8%$39,769.00
15.4% 42.3%$33,229.00
12.1% 26.2%$47,202.00
MALE CIVILIAN UNEMPLOYMENT RATEFEMALE CIVILIAN UNEMPLOYMENT RATE
10.1%9.7%
7.3%11.9%
6.2%4.4%
11%6.4%
12.3%8.3%
11.4%6.5%
26.5%13.5%
29.1%24.3%
11.3%13.4%
27.9%13.7%
38.7%10.1%
20.1%12.1%
14%7.5%
7.5%3.2% MALE CIVILIAN UNEMPLOYMENT RATE
FEMALE CIVILIAN UNEMPLOYMENT RATE
10.1%9.7%
7.3%11.9%
6.2%4.4%
11%6.4%
12.3%8.3%
11.4%6.5%
26.5%13.5%
29.1%24.3%
11.3%13.4%
27.9%13.7%
38.7%10.1%
20.1%12.1%
14%7.5%
7.5%3.2%

30 ATLANTIC CITY: PAST AS PROLOGUE
TABLE 10
Selected Housing Characteristics for Atlantic City, New Jersey, and the U.S., 1970 to 2000
Total housing
units
% of total units
vacant
Total units avail. for
year-round occupancy
% of year-round units
vacant
% of year- round units classified “other
vacancy”1
Renter-occupied as % of
occ. units
% of 2000 stock built post-1980
% of 2000 stock built post-1990
% of households
with >1 occupant per room
Atlantic City, 19702
24,055 18.7 22,737 14.0 1.8 68.9 NA NA 6.1
Atlantic City, 19803
21,520 22.2 19,635 14.8 4.7 69.4 NA NA 5.7
Atlantic City, 19904
21,626 27.3 19,287 18.4 5.7 69.6 NA NA 14.8
Atlantic City, 20005
20,219 21.6 18,273 13.3 5.7 71.1 20.8 5.5 12.5
New Jersey, 2000
3,310,275 7.4 3,200,954 4.3 1.5 34.4 22.8 10.5 5.0
U.S., 2000 115,904,641 9.0 112,300,425 6.1 2.0 33.8 32.8 17.0 5.7
1 Other vacancies are year-round units that are not for sale or rent (or sold or rented and waiting for occupancy).2 1970, Census, series PCH (1)-15 Tables H-1, H-83 1980, Census, series PCH 80-2-78, Tables H-14 1990, Census, Summary Tape File 1, Tables H001, H002, H003, H005, H021, H0225 2000, Census, Summary Tape File 1, Tables H3, H5, P15; 2000, Census, Summary Tape File 3, Tables H7, H20, H34
housing;109 in 2000, subsidized housing made up
19 percent of the total and 21 percent of the year-
round housing stock.110 (The subsidized stock is
disproportionately concentrated in three adjacent
census tracts that form the study area for the case
study of concentrated poverty referenced in the
introduction. These tracts contain only 19 percent of
Atlantic City’s population but hold about 46 percent
of the subsidized stock, which is, in turn, a key factor
in the concentration of poverty in these tracts.)
Overall, Atlantic City’s housing stock is
somewhat older than that of New Jersey as a whole.
In 2000, the shares of units built before 1950 in
Atlantic City and New Jersey were 37 percent and
30 percent, respectively.111 Nonetheless — and
109 See Sternlieb and Hughes, p. 113. 110 Calculated using data from the U.S. Department of Housing and Urban Development’s assisted housing database and from the 2000 census.111 2000 census, Summary File 3, Table H34.
despite the overall decline in year-round units —
the city saw a nontrivial amount of new residential
construction between 1980 and 2000. Twenty-one
percent of the city’s housing stock was built in this
20-year period, with the large majority of units built
in the 1980s, the decade immediately following
the introduction of gambling. In comparison, the
percentage of units built in New Jersey as a whole
during the two-decade period, 23 percent, is similar to
that for Atlantic City, but construction is more evenly
spread across the two decades (Table 10).
The new construction in Atlantic City in the
1980s was dominated by two large undertakings. First,
the CRDA developed new owner-occupied housing
in the city’s North Inlet neighborhood. (In total, by
2004, the CRDA had developed 1394 new housing
units for owner occupancy;112 20 percent of these were
designated for low- and moderate-income households
112 See the article by Yvonne Bonitto-Doggett.

ATLANTIC CITY: PAST AS PROLOGUE 31
City house prices lagged those
of the state considerably.
The period immediately
following legalization saw a
fast run-up in house prices
and considerable activity
by speculators. Between
1970 and 1980, house prices
increased considerably more
rapidly in Atlantic City
than in the state or nation
(Table 11). (Speculation
was accompanied by some
displacement of households;
elderly and minority
households appear to have been particularly
affected.115) Between 1980 and 2000, the rate of
house-price appreciation was considerably lower,
though the strong price run-up in the 1970s resulted
in faster overall appreciation in Atlantic City than
in either New Jersey or the U.S. over the full period
from 1970 to 2000.
The current decade has again seen consid-
erable run-up in house prices (at least until recent
115 Sternlieb and Hughes give a number of examples of the impact of the speculation on residents. For example, they cite a 1977 Temple University study that found evidence of a systematic effort to evict Hispanic, poor, and elderly residents from one city neigh-borhood, described cases where the elderly were required to leave their apartments on very short notice and a case where elderly households faced a 400 percent increase in rent with one month’s notice, and noted that the elderly population in Atlantic City receiving Social Security benefits declined 7.2 percent from 1977 to 1979. (Statistics showing the sharp decline in the elderly’s share of total population are provided in Table 4B.) They also cite the New Jersey Department of Community Affairs, which reported at that time that the lack of housing and high prices were paramount to the loss of the city’s elderly population. Sternlieb and Hughes note further that the minority population faced a particularly difficult situation as a result of post-casino speculation because “[o]ther areas [were] far less hospitable to them than Atlantic City, which historically … had a large minority population” (Chapter 7). Speculation was often accompanied by illegal activity. Ac-cording to Bryant Simon, in 1981, of 117 fires in the city’s South Inlet neighborhood, fire fighters considered 105 to be suspicious (p.184).
TABLE 11
Median House Values and Changes in Values, 1970-2000
Median House Value Percent Change
19701 19802 19903 20004 1970-1980
1980-1990
1990-2000
1970-2000
U.S. $17,000 $47,200 $78,500 $119,600 177.6 66.3 52.4 603.5
New Jersey
$23,400 $60,200 $161,200 $170,800 157.3 167.8 6.0 629.9
Atlantic City
$10,600 $40,600 $70,200 $87,500 283.0 72.9 24.6 725.5
11970, Census of Population, Vol. 1, Pt. 1, Table 5, Pt. 32, Tables 5, 102 1980, Census, series PHC 80-2-78, Table H-1; Historical Census of Housing Tables: Home Values, Table “Median Home Values: Unadjusted”; http://www.census.gov/hhes/www/housing/census/historic/values.html31990, Census of Population and Housing, Summary Tape File 3, Table H061A4 2000, Census, Summary Tape File 3, Table H76
and were subsidized to make them affordable to such
households, while the remainder were sold at market
rate.) Second, a large condominium complex was built
in the southeastern part of the city.
Since 2000, it appears that the city has
experienced an increase in the construction of
new housing. (Thus far in the current decade, the
number of residential building permits issued has
been more than 50 percent greater than for the
entire decade of the 1990s.113) New activity includes
both the construction of properties aimed at the
higher end of the housing market and a Hope VI
project that is slated to replace 213 units of public
housing on a one-for-one basis and also provide
about 300 units of market-rate housing.114
Housing Prices and Housing Affordability.
In 1970, before legalized casino gambling, Atlantic
113 Data from the website of the New Jersey Department of Labor and Workforce Development, accessed at http://lwd.dol.state.nj.us/labor/lpa/industry/bp/bp_index.html. Given current problems in the housing industry, it is not clear how well the number of permits tracks actual construction activity.114 While the CRDA is involved in the Hope VI project, the agency sees little future role for itself as a housing developer and has, for the most part, shifted its attention to economic development. Interview with CRDA executives, April 2007.
32 ATLANTIC CITY: PAST AS PROLOGUE
problems in the national housing market). In the
fourth quarter of 2004, Atlantic City had the stron-
gest one-year house-price appreciation in the North-
east for metropolitan areas tracked by the National
Association of Realtors (NAR). In the fourth quar-
ter of 2005, Atlantic City ranked 12th in the nation
on its one-year house-price appreciation rate, and it
ranked first in the nation for the corresponding rate
in 2006.116 A 2005 article in the Press of Atlantic City
discussed the impact of this appreciation on hous-
ing affordability. The article suggested that “[t]he
area’s soaring housing market has squeezed afford-
able housing in at least two ways. The prices being
paid for new housing are so high that there is little
incentive for private developers to build anything
low-income families can afford. And existing low-
cost housing is being lost as developers tear down
older buildings to replace them with expensive new
homes.”117
Information from a series of focus groups
and personal interviews in Atlantic City from March
through May of 2007 indicates that housing afford-
ability is a serious concern among Atlantic City
residents.118 House-price appreciation, along with
a planned real estate tax revaluation in 2008, has
led to fears of displacement among some of Atlan-
tic City’s elderly long-term homeowners.119 Inter-
viewees also noted that high rental costs have led to
116 Metropolitan-level house-price appreciation data for the most recent three years are available on the NAR’s website. Data for earlier years may be purchased from the NAR or located on the websites of organizations that reported on NAR statistics at the time of their release. http://www.realtor.org/research/research/reportsstatistics117 See the article by John Froonjian.118 These focus groups and personal interviews were conducted as part of the concentrated poverty case study. 119 The revaluation was completed in early 2008. While New Jersey has programs that may assist elderly and low-income homeowners affected by the revaluation, comments made by interviewees sug-gest that they were largely unaware of the programs in 2007, when the interviews were conducted.
overcrowding,120 doubling up of households, and an
increased rate of homelessness among families.
Planned expansion by the casino industry
and development pressures in general have raised
further questions about the long-term availability
of affordable rental housing. In what is known as
the Back Maryland neighborhood of Atlantic City,
for example, where housing is HUD-subsidized
but privately owned, there is concern that with
the expirations of owners’ contractual obligations
with HUD to maintain the housing for low-income
households, housing developments will be removed
from the low-income stock.121 The state of New
Jersey’s limited dividend law has provisions requiring
that low-income units built under the law’s auspices
be maintained as low-income housing after the
HUD requirement expires. However, it is not yet
clear whether steps taken under these provisions
will be effective in preserving stock for use by low-
income families.
A Note on Local Government Post-Gambling: New Resources, New Needs, Ongoing Municipal Corruption
Gambling brought new tax revenues to
Atlantic City and its school district. Local property
tax revenue, including those for the school district,
120 Data from the 2000 census suggest that overcrowding is par-ticularly severe among the city’s Asian and Hispanic households. About 34 percent of Asian dwelling units and about 30 percent of Hispanic dwelling units have more than one person per room. 121 In general, in return for HUD subsidization of privately owned properties, their owners agree to maintain them as part of the low-income stock for some period, most often 30 years. According to the National Housing Trust, this affordability requirement was due to expire in 2007 for 375 units in the privately owned subsidized stock in Back Maryland. An additional 232 units in the balance of Atlantic City have a 2009 expiration date (www.nhtinc.org). In late 2006, the four projects in Back Maryland with 2007 expiration dates were placed on the market. While no deal materialized at that time, the possibility of the sale raised serious concerns about displacement among Back Maryland residents.

ATLANTIC CITY: PAST AS PROLOGUE 33
increased 575 percent in nominal terms and 403
percent in real terms, between 1978 and 2001. The
city also saw a sharp rise in receipts from a luxury
sales tax that predated legal gambling.122
The casinos also brought new expenses to
the city. For example, while Atlantic City’s rates for
criminal activity were already higher than national
rates before the legalization of gambling, the arrival
122 See Table A3 for data on taxes paid by the casino industry to Atlantic City.
of the casinos was accompanied
by a large increase in such
criminal activity, with much
of the increase associated with
the much-expanded tourist
population123 (Table 12). In
turn, Atlantic City maintains a
police force much larger than
one might expect for a city of
its size.124 The huge number
of visitors likely adds to the
costs of maintaining the city’s
infrastructure as well.
Given the simultaneous
increase in revenues and costs
associated with the gambling
industry, an analysis of the
overall extent to which gambling
revenues have increased
the fiscal capacity of local
government to provide programs
that directly affect the quality of
life of the city’s residents is well
beyond the scope of this paper.
(However, in at least one area
related to residents’ quality of
123 Both violent and property crime rates in Atlantic City are signif-icantly higher than they are in the surrounding metropolitan area. In part, this reflects the fact that as a tourist destination, Atlantic City has a daily population that is much higher than its resident population. As noted in a 2000 GAO report examining gambling in Atlantic City, “Visitors become part of the pool who may both com-mit and become victims of crime and therefore should be added to the resident population when calculating the crime rate.” See the GAO report in the references. Even when such an adjustment is made, Atlantic City’s crime rate is higher than that of New Jersey as a whole. 124 For example, the number of police protection employees in New Brunswick, with a 2000 population about 20 percent larger than that of Atlantic City, was only 25 percent that of Atlantic City’s in 2002. Jersey City with a 2000 population almost six times that of Atlantic City had less than two times the 2002 number of employ-ees in police protection. For further examples, see Table 2 in the U.S. Census of Governments report.
TABLE 12
Total Crimes per 10,000 Population*
Year United States New Jersey Atlantic City (based on the population adjusted to in-clude visitors and nonresident workers)
Atlantic City(based on unad-
justed population)
1977 507.76 511.39 695.89 1,006.00
1978 514.03 520.72 768.66 1,336.00
1979 556.55 582.06 798.62 1,678.00
1980 595.00 640.13 1079.29 3,109.37
1981 585.82 617.98 922.29 3,132.91
1982 560.36 567.61 986.85 3,863.68
1983 517.50 516.34 947.99 4,168.01
1984 503.13 485.55 763.01 3,537.48
1985 520.71 509.44 857.61 4,203.70
1986 548.04 524.13 850.56 4,179.05
1987 555.00 526.15 749.90 3,963.67
1988 566.42 529.53 833.44 4,593.15
1989 574.10 526.94 794.57 4,323.13
1990 582.03 544.72 800.75 4,107.04
1991 589.78 543.13 808.80 4,047.54
1992 566.02 506.44 721.22 3,597.11
1993 548.44 480.08 641.31 3,144.05
1994 537.35 466.09 509.63 2,555.94
1995 527.59 470.37 538.08 2,902.93
1996 508.66 433.29 525.89 2,874.49
1997 493.00 405.70 526.49 2,776.26
Note: While the GAO shows the crime rate based on both the unadjusted and adjusted Atlantic City population, it believes that the rate based on the adjusted population, which includes visitors and non-resident workers, is the more appropriate rate calculation.Source: GAO analysis of data obtained from the FBI’s UCR, South Jersey Transportation Authority, and the Census Bureau.* Table 12 is taken from the GAO report listed in the references.

34 ATLANTIC CITY: PAST AS PROLOGUE
life — providing education — it is fair to say that
casino tax revenues have increased fiscal capacity. In
the absence of school taxes paid by casinos, Atlantic
City’s school district would likely qualify as a New
Jersey “Abbott District,” i.e., a district that received
extra funding to ensure its ability to provide an
adequate level of education spending.125) Regardless
of the net effect of casino revenues on the city’s fiscal
capacity, there is little confidence among at least
some of the city’s service providers and residents that
these revenues are spent in ways that best serve the
interests of the city and its residents. Interviewees for
the concentrated poverty case study stressed
125 A discussion of criteria for designation as an Abbott District can be accessed at http://www.state.nj.us/education/abbotts/regs/criteria.htm.
the lack of needed services, as well as the city’s
lack of attention to problems with neighborhood
infrastructure.
A number of interviewees also stressed
the strong role that political considerations play
in how local government funds are distributed.
This perception is supported by the city’s ongoing
corruption problems, which extend a trend going
back to the early years of the 20th century. An article
in the Philadelphia Inquirer noted that “[o]ne third
of last year’s city council members are either in
prison or on its [sic] way there. Four of the last eight
mayors have been arrested on corruption charges.”126
126 See the 2007 article by Wayne Parry.

ATLANTIC CITY: PAST AS PROLOGUE 35
ATLANTIC CITY: PAST AS PROLOGUETHE GAMBLING INDUSTRY
AS A UNIQUE TOOL OF URBAN REDEVELOPMENT
Ultimately, this report cannot definitively assess the net impact that legalized gambling has had on Atlantic City’s resident population. It is not possible to know with certainty how the city would have evolved in the absence of gambling — whether it would have continued its economic decline or whether it would have found another path for economic development.
Moreover, it would be no simple task to assess how gambling has affected Atlantic City’s residents, particularly because the residential population is itself not static. Casino jobs are likely to have provided some people living in the city at the advent of gambling with avenues of economic and residential mobility that eventually led to moves out of the city. For Atlantic City’s newer immigrant population, casino jobs may have provided access to the lower rungs of an economic ladder that would otherwise have been unavailable to them; they or their children may be able to move further up this ladder. A study of economic mobility — either past or future — associated with gambling is well beyond the scope of the data on which this report is based. But given the possibility that gambling has provided such opportunities for economic mobility, as well as the possibility that in the absence of gambling, the city’s decline might have continued, the benefits that gambling jobs
have brought to Atlantic City may well be greater than readily available statistical information may suggest.
Nonetheless, to the extent that the vision
of the gambling industry as a “unique tool of urban
redevelopment” for Atlantic City encompassed
the well-being of its resident population and the
revitalization of its neighborhoods, it is safe to say
that reality has fallen short of the vision. Poverty
and unemployment rates are well above the state
levels, while income is well below. City residents
face a dearth of basic retail services. Vacant lots
and vacant housing are common in some parts of
the city, overcrowding in other parts.
This conclusion raises questions for other
states or cities considering using gambling as a
tool for either urban redevelopment or for general
economic development. In particular, could the
introduction or expansion of the gaming industry
in a state or city be altered in ways that would be
more likely to lead to gains in the economic well-
being of households and neighborhoods than what
has occurred in Atlantic City? As background
for considering this question, we first explore
the factors underlying Atlantic City’s labor force
paradox: many jobs coexisting with high poverty
and unemployment.

36 ATLANTIC CITY: PAST AS PROLOGUE
The Labor Force ParadoxAtlantic City has an abundance of easily
accessible jobs, a high proportion requiring only
low skill levels, and many unfilled on any given day.
Yet the rates of unemployment and poverty in the
city are more than double the state level, and the
percentage of the population that is classified as low
income is almost 2.5 times higher than in the state
as a whole. The incidence of these problems is high
both among population groups drawn by Atlantic
City’s jobs, especially Hispanics, and among groups
whose roots in the city are more likely to pre-date
gambling, i.e., the black and white populations.
Material presented earlier in this report and
interviews conducted with Atlantic City residents
and social service providers suggest a number of
factors that contribute to this paradox. 127
One factor, suggested in interviews
conducted with staff at public and nonprofit
agencies who serve residents in the poorest city
census tracts, is a lack of the basic work skills
necessary for employment that makes some area
residents unable to obtain or maintain a job.
This lack of “work readiness” is related to limited
educational achievement, as reflected in low
high-school graduation rates among the city’s
youth. (Atlantic City’s graduation rate is about 16
percentage points lower than the state average,128
despite per pupil spending that is about $1500
higher than the state average.) Among the reasons
cited by these service providers for low graduation
rates were tensions among different factions of
young people in Atlantic City; the lure of selling
drugs; and the stigmatization that sometimes occurs
127 Interviews conducted for the concentrated poverty case study.128 New Jersey Department of Education Report Card for the Atlan-tic City school district, accessed at http://education.state.nj.us/rc/rc07/dataselect.php?datasectionpercent5B2percent5D=performance&c=01&d=0110&s=010<=A&st=H.
for high-achieving students in low-income areas.
One provider commented that area students, who
come directly from their neighborhood elementary
schools to a high school shared with students from
more affluent communities outside Atlantic City,
were unprepared for the competition they faced.129
In addition, factors specific to the casino
industry, or to the particular framework within
which it operates in Atlantic City, may affect the
ability of those who are “work ready” to obtain or
maintain a job. The round-the-clock nature of
casino work may make it difficult for employees with
children, particularly single parents, to maintain
a job; those interviewed for the concentrated
poverty case study frequently cited an absence of
inexpensive, safe child care that would make it
easier for parents to work weekend and evening
shifts. Provisions of New Jersey’s Casino Control
Act barring individuals with criminal records from
many casino jobs limit work opportunities for some
Atlantic City residents.130 Other provisions of the
act have likely had the effect of limiting noncasino
work opportunities for those who cannot find or
maintain work in the casinos. Statistics presented
in an earlier section of the report indicate that
private-sector employment outside of casinos has
fallen considerably since the advent of legalized
129 In addition, both service providers and residents identified aspects of the school program itself that they believed discouraged educational achievement. For example, one service provider com-mented that the high-school curriculum did not meet the needs of the city’s low-income students, while residents believed that students would be better able to adjust to high school if, instead of the current educational structure, which moves students directly from elementary school to high school, there was a middle-school program that provided a transition between elementary and high school. 130 These laws once applied to all employees of casinos but were relaxed for some categories of workers in 1995. The 2004 annual report by Trump Atlantic City Associates states that “requirements [related to worker character] have resulted in significant com-petition among Atlantic City casino operators for the services of qualified employees.”

ATLANTIC CITY: PAST AS PROLOGUE 37
gambling. At least some of this loss in noncasino
employment may be an unintended consequence
of the requirement in the Casino Control Act that
gambling be confined to hotels with at least 500
rooms. As noted earlier, this provision meant that
gambling operations were large enough to offer
nongambling services, such as food and beverage
provision, for their patrons in-house and were thus
able to supplant other business activity.
Finally, residents who hold casino jobs — or
jobs in other industries — may not earn enough
to escape poverty or low-income status. As in
Atlantic City’s days as a beach resort, many of the
jobs available to residents are low-skill, low-paying
service-sector positions. Employment seasonality
also persists to some degree, though it is less severe
than during the earlier period. Numerous times in
interviews conducted for the concentrated poverty
case study, respondents noted that they or someone
they knew held two or three casino jobs to make
ends meet.
That the wages paid by a service-sector in-
dustry with a large share of low-skill jobs are not high
enough to lift many of its workers out of low-income
or poverty status should not be surprising, particularly
when there is a seasonal component to the industry’s
activity. This was the situation in the heyday of the
beach resort, and it is the situation with the gambling
industry today. How and whether incomes for service-
sector workers with low-skill jobs could or should be
raised through government policies are questions bet-
ter addressed at the state and national level and are
not discussed further here. Instead, in the next sec-
tion we focus our consideration of labor market out-
comes on the nontrivial part of the prime-age working
population who have not been successful at finding or
maintaining steady work or who have dropped out of
the labor force altogether.
Questions for Policymakers Considering the Introduction or Expansion of Gaming Activity In light of New Jersey’s experience with the
introduction of casino gambling in Atlantic City,
policymakers in other states or cities contemplating
the introduction or expansion of gaming should con-
sider what, if any, changes in the circumstances asso-
ciated with casino development and operation might
have led to greater improvements in the economic
well-being of Atlantic City residents and in the qual-
ity of life offered by Atlantic City neighborhoods.
Among the questions that might be asked are the
following: 131
To what extent would providing a city’s
residents, particularly low-income
residents, with more training related to the
introduction of new casino jobs help reduce
unemployment and encourage higher levels
of labor force participation? What types of
training would be most effective? Given the
differences observed in female versus male
employment in Atlantic City, would more
emphasis on training programs that serve
the male population better help this group
make the adjustment to casino work if other
sources of employment decline?
131At first glance, these questions might appear to fall into two categories, with the first three questions related to improved labor-market outcomes and the last two related to better neighbor-hood outcomes. But improved neighborhood and improved labor market outcomes are unlikely to be independent of each other. For example, better labor market outcomes and associated increases in households’ standard of living would be expected to lead to higher household demand for high-quality housing and for public and private neighborhood-level services, as well as a higher opportu-nity cost of criminal activity for individuals that would lessen the incidence of neighborhood crime. Nor are labor market outcomes likely to be completely independent of neighborhood-level resourc-es. Neighborhoods that provide better after-school opportunities, for example, may have a lower incidence of youth crime that limits young people’s future labor-market options.

38 ATLANTIC CITY: PAST AS PROLOGUE
To what extent would various types of
support services increase the likelihood
that potential workers from low-income
households and neighborhoods can obtain
and maintain jobs in the gaming industry?
For example, would neighborhood-based
programs that provide youth with more
alternatives to gang activities decrease
the percentage of potential workers whose
criminal records limit their ability to find
casino work? Would easier and more
consistent access to drug rehabilitation
programs make it possible for more residents
to find jobs? Would the availability of
affordable day care that took account of the
round-the-clock nature of casino work make
it easier for single parents to maintain their
jobs?
To what extent will the legislative
framework within which the casino industry
is developed and within which it operates
have unintended effects on the employment
opportunities for community residents? As
has been noted, New Jersey’s Casino Control
Act mandated extremely strict standards
for employment in the casinos, while the
act’s provisions about the size of casino
hotels were likely a factor in the decline
in noncasino employment in Atlantic City
that occurred subsequent to the arrival of
casinos. On the other hand, the New Jersey
legislation did not include provisions that
might have softened the impact of real estate
speculation on Atlantic City businesses
and residents; rent increases associated
with such speculation may have led at least
some businesses to close.132 At a minimum,
the Atlantic City experience suggests the
types of issues that policymakers developing
a framework for legalized gambling must
consider before gambling is put into place.
Can gambling-financed redevelopment
agencies, such as New Jersey’s CRDA,
be designed to be more effective as tools
of urban redevelopment? New Jersey’s
1984 legislation authorizing the CRDA
stressed that the CRDA’s mandate was to
serve the needs of Atlantic City’s low- and
moderate-income households, but legislative
amendments, beginning in 1993, allowed
the CRDA to provide support for casinos
and, more generally, to use its resources
for a number of tourist-oriented economic
development activities not encompassed by
the initial legislation. An assessment of the
merits of New Jersey’s legislative changes
could be helpful for other states and cities in
deciding whether similar gambling-financed
agencies will be able to undertake projects
of a type and at a scale that substantially
improve the quality of life for residents. 133, 134
132 The loss in well-being from the loss of noncasino businesses extends beyond that due to a loss of jobs to encompass a loss in consumer choice.133 Alternatively, one might ask if New Jersey’s legislative changes were necessary to maintain the viability of the casino industry. Giv-en the flat performance of the Atlantic City casino industry between the late 1980s and the early years of the current decade discussed in Appendix A, one might hypothesize that CRDA funds were needed simply to keep the industry running in place. If so, an argument could be made that funds to maintain the industry’s viability indi-rectly supported city residents who worked in the industry. 134 In the case of New Jersey, a less obvious question about the CRDA’s effectiveness is whether the set of community develop-ment projects that the agency did support was the most effective mix for meeting the needs of its target population. (The CRDA’s initial legislative mandate was quite broad in terms of the activi-ties it could undertake in support of low- and moderate-income households and blighted neighborhoods.)

ATLANTIC CITY: PAST AS PROLOGUE 39
To what extent can a state’s gambling
legislation be designed to encourage better
coordination among government agencies,
local residents, and other stakeholders, while
discouraging corruption, so that tax revenues
raised by the introduction or expansion of
gambling are more effective in achieving
community and economic development
objectives? As noted earlier, interviews
about Atlantic City’s development after
the introduction of casino gambling suggest
that a lack of coordination among various
government agencies and local residents
hindered the city’s ability to use the funds
that the gambling industry provided as
effectively as possible. To the extent that this
is the case, the question is whether other
states could take steps that might minimize
such problems without greatly reducing local
autonomy. If so, they will be better able to
ensure that the tax revenues provided by
the introduction or expansion of gambling
will allow their cities to address problems of
urban blight and provide improved services
to their residents while at the same time
covering the additional municipal costs
associated with casinos.
The questions above are prompted by the
particular circumstances of Atlantic City, but the
basic issues they raise are by no means new for
researchers and policymakers concerned with casino
gambling as a strategy for economic recovery or,
more generally, with the economic redevelopment
of depressed communities. The relative uniqueness
of the Atlantic City situation, however, may give the
potential researcher the opportunity to delve into
these questions more deeply. Such research may
provide insights applicable to other places about the
circumstances under which economic development
activities are most effective in revitalizing
communities and furthering the well-being of
community residents.
Careful consideration of these questions may
also have real relevance for Atlantic City itself. As
the next chapter suggests, the development path
that Atlantic City and its gambling industry will
follow in the near future is not certain. One vision
is of an expanded tourist center, with more casinos
but also with more tourist attractions that appeal to
the nongambler as well. If such an expansion were
to occur, some Atlantic City residents fear that it
would be accompanied by residential displacement,
as happened during the initial phase of casino
development. But an expansion would also bring
additional jobs to the city. A careful examination of
the past might inform policies that would increase
the ability of city residents to respond to new job
opportunities and help the city avoid some of the
problems that the earlier development period
brought.

ATLANTIC CITY: PAST AS PROLOGUE 41
By many indicators, including number of
casinos, employment levels, number of visitors, and
real revenues, the Atlantic City casino industry has
presented a very constant picture over the past two
decades.135 It is by no means clear, however, that
Atlantic City will continue to travel this path, and the
direction of change, should it move off the path, is also
uncertain. Recent years have seen the expansion of
casino and “racino”136 activity to nearby states. Perhaps
most problematic for the Atlantic City industry are a
set of racinos (already in place) and planned casinos
that will stretch along the I-95 corridor where it passes
through the Philadelphia metropolitan area and may
provide more easily accessible gambling opportunities
for many of Atlantic City’s day trippers.
The Atlantic City casino industry has
recognized the competitive threat and, over the
course of the last decade, has taken steps both to limit
competition and to respond to it. The former category
included an initiative that used the proceeds of a short-
term tax on net casino income to enhance purses at
New Jersey’s Meadowlands race track, in return for an
agreement that the Meadowlands would not introduce
slot machine gambling for a specified time period.137
135 See Appendix A for a discussion of the performance of the casino industry over time. 136 Racinos are race tracks with slot machines.137 A detailed description of this initiative is available in Trump Atlantic City Associates, Annual Report, 2004.
In the longer term, the city and its gambling
industry hope to respond to competition via a strategy
that, if successful, will make Atlantic City a tourist
destination for a broader spectrum of the population
than it now attracts. For example, the industry hopes
to expand the number of nonelderly tourists who visit
the city and to attract tourists whose interests are less
narrowly focused on gambling than is the case with
the current set of visitors.
Within the Atlantic City context, the
Borgata, the city’s newest casino/hotel, serves as a
model; the Borgata projects a more glamorous aura
than do many of the city’s other gambling locations,
and it has attracted a younger group of tourists. The
Borgata more closely resembles a Las Vegas casino
than do the other Atlantic City gambling operations,
and the broader goal of the city’s casino industry is
to make Atlantic City more like Las Vegas, where a
relatively high percentage of tourist dollars are spent
on nongambling activities such as retail purchases
and big-name entertainment. Plans for new casino/
hotels offering multiple tourist attractions and the
development of new upscale retail districts are
part of this strategy. Through such efforts, casino
operators hope to avoid losing tourist dollars and,
indeed, to encourage the typical consumer to stay
ATLANTIC CITY: PAST AS PROLOGUEATLANTIC CITY’S FUTURE:
A BRIEF NOTE

42 ATLANTIC CITY: PAST AS PROLOGUE
longer and presumably spend more.138 In the most
optimistic view, members of the Atlantic City casino
industry hope that the new casinos in neighboring
states will themselves expand the customer base for
Atlantic City gambling: After a taste of gambling at
stand-alone casinos, a new population will want to
partake of the full gambling experience that Atlantic
City provides. 139
It is not clear how these efforts to deal with
new competition will play out. In the short run,
at least, the industry has faced some problems. In
late 2006 and early 2007, two racinos opened close
to the I-95 corridor in Pennsylvania, and in 2007,
nominal revenues for the Atlantic City casino
industry as a whole fell for the first time since the
gambling era began in 1978.140 Construction of new
Atlantic City casinos that are supposed to help
counter the competition has stalled because of the
current problems in credit markets.141 It is not yet
possible to know whether these are simply temporary
setbacks in a new development path that will both
expand and diversify Atlantic City’s tourist sector or
whether the current situation represents a new long-
term reality for Atlantic City, particularly in light of
plans for new casinos in the neighboring states of
Pennsylvania and New York.
In a city where the casino industry is so
138 See the article by Gary Rivlin, who cites Michael Pollock, publisher of The Gaming Industry Gazette, on the share of casino income from nongaming activity in Las Vegas (59 percent) and Atlantic City (10 percent). The executive director of the Atlantic City Convention and Visitors Authority, Jeffrey Vassar, also cited in the article, indicates that the average visitor to Las Vegas spends three to four days, while the average visitor to Atlantic City spends 24 hours.139 See, in particular, the transcript of the committee meeting of the New Jersey Senate Wagering, Tourism and Historic Preservation Committee, August 2, 2004. 140 The industry attributes some of this loss to a partial smoking ban in casinos that began in 2007 and to fallout from an attempt to unionize casino dealers in addition to the new competition. 141 See the update by Chester Sherman for the New Jersey Depart-ment of Labor and Workforce Development.
dominant, the industry’s future can be expected
to have an impact on the well-being of a large part
of Atlantic City’s resident population. Although
gambling has not proved to be a panacea for
Atlantic City’s problems, the casino industry is by far
the largest source of jobs for Atlantic City residents
and the largest source of tax revenues for the city
and its school district. Should the 2007 decline
in casino revenues be a harbinger of the future, it
seems safe to predict a negative impact on the city’s
population.
On the other hand, should the industry
succeed in reinventing itself, predictions about
the well-being of Atlantic City’s residents become
more complicated. On the one hand, an expanded
industry could provide more jobs for residents,
including, over the short run, a large number
of construction jobs. The scale of long-term
employment gains would depend on the industry’s
commitment to hire local residents, its willingness to
provide training to potential workers who currently
lack the skills necessary to obtain or maintain
employment, and the willingness of the industry
or the community to provide affordable day-care
services that would allow more parents to take on
casino work. To the extent that casino expansion
is accompanied by an expansion in noncasino-
based tourist attractions, there would also be more
job opportunities for residents for whom casino
work is not a viable option. But expansion of the
casino industry and related industries would also
have a downside if, as residents fear, it were to be
accompanied by residential displacement, as during
Atlantic City’s initial development as a gambling
resort. The net benefits and costs to Atlantic
City’s residents from an expanded industry and the
distribution of these costs and benefits across the
resident population would very much depend on
how the expansion was carried out.
ATLANTIC CITY: PAST AS PROLOGUE 43
ATLANTIC CITY: PAST AS PROLOGUEAPPENDIX A: THE ATLANTIC CITY GAMBLING INDUSTRY
I. IntroductionFollowing a statewide vote to legalize
gambling in commercial casinos in Atlantic City in 1976 and passage of the Casino Control Act in 1977, the first of Atlantic City’s casinos opened its doors in 1978. Today, Atlantic City has 11 casinos, with development of several additional casinos planned for the next few years.1 New Jersey was the second state, after Nevada, to allow casino gambling. Like Las Vegas, Atlantic City is a gambling destination, drawing the large majority of its patrons from outside its immediate area.
Although 10 other states have since introduced commercial casinos and there has been a more general proliferation of gambling facilities, including Indian casinos located on tribal lands and “racinos” — race tracks with slot machines, including several located in Delaware, Pennsylvania, and New York — New Jersey has continuously ranked second in total revenues brought in by commercial casinos, generating $5.2 billion in 2006, compared to Nevada’s $12.6 billion that same year.2 However, as the development of new gaming facilities in New York and Pennsylvania proceeds, Atlantic City is feeling competitive pressure, and over the past several years, New Jersey has taken a number of steps aimed at maintaining its competitive position.
This review examines the context in which casino gambling has developed and is developing in Atlantic City and the performance of the Atlantic City casino industry. Section II describes the legislative framework within which the industry operates. Section III presents data on the pattern of
1 See the April 2007 article by Suzette Parmley for a discussion of plans to expand the number of casinos.2 Website of the American Gaming Association at http://www.americangaming.org.
casino development and performance in the 30 years since the passage of the Casino Control Act. Section IV discusses steps that Atlantic City is taking to maintain its competitive position.
II. Legislative ContextCasino Control Act
The establishment and operation of casinos in Atlantic City is governed by the Casino Control Act (CCA), passed in 1977 and since amended multiple times. Two prominently stated purposes of the legislation indicate the outcomes it is hoped the legislation will accomplish, namely, the revitalization of Atlantic City’s tourism industry and the use of gambling as a “unique tool” to support the city’s urban redevelopment.3
Mark Nichols writes that, in general, the CCA provided for an “unusual degree of regulation” by the state.4 Much of this regulation was put in place to further two “process” goals also laid out in the purposes of the act, namely, “maintain[ing] the existing tone of the hospitality industry” and using strict regulation and control “to maintain and retain integrity, public confidence, and trust” in casino operations. In support of the first of these goals, gaming was restricted to major hotel and convention facilities, and in support of the latter, individuals with criminal records (or otherwise deemed not to be of good character) could not be hired as casino workers.5 Arguably, these regulations are particularly
3 CCA, Article 12-1.4 See the article by Mark Nichols. 5 Required size for casino/hotels and licensing of casino employees are covered in Article 6 of the CCA. Initially, the hiring restric-tion applied to all employees working in facilities hosting casinos. An amendment to the act in 1995 removed the restriction from employees such as hotel service workers whose positions were rela-

44 ATLANTIC CITY: PAST AS PROLOGUE
important in understanding how the development of casinos affected Atlantic City’s existing businesses and its residents, a topic considered in the main part of this report. Amendments over time have lessened regulatory controls.6 Nonetheless, regulation of Atlantic City casinos is still viewed by the industry as being particularly strict. For example, one casino operator stated in 2004 that the strict regulations governing the hiring of employees led to competition for staff among casinos.7
Provisions for Public Revenues Casinos provide revenues for public purposes
under several provisions of the Casino Control Act, primarily in the form of taxes and fees. These revenues can be divided into two categories: those going to the state’s Casino Revenue Fund and those paid to the Casino Reinvestment Development Authority (CRDA), an entity created in 1984 by amendment of the act. Taxes paid to the CRDA are discussed in the next section, while revenues going to the Casino Revenue Fund are discussed here.
The Casino Revenue Fund (CRF). The Casino Revenue Fund receives the large majority of all taxes and fees specified in the Casino Control Act. Revenues paid into this fund are dedicated to providing assistance to the elderly and disabled. The basic gambling tax, and the most important revenue source, is an 8 percent tax on adjusted gross casino revenues (AGR).8 This rate is at the low end for taxes levied by states on casino earnings.9 Other revenue sources include casino licensing fees; slot machine licensing fees; and a $3 tax per car in casino parking garages — shared with the CRDA.
tively low risk in terms of potential for gambling-related corruption. 6 See the article by Nichols for an interesting discussion of the significant increase in casino revenues associated with an increase in the amount of casino floor space that could be used for slot machines. 7 Trump Atlantic City Associates, Annual Report, 2004.8 Adjusted gross revenues are the difference between what a casino takes in from gamblers minus what it pays out to them, adjusted for bad gambling debts. 9 Statistics on state tax rates for commercial casinos are available from the American Gaming Organization at http://www.americangaming.org/Industry/state/statistics.cfm.
Beginning in 2004, casinos were also required to pay several other taxes,10 including a 4.25 percent tax on casino comps, such as entertainment, hotel rooms, and food and beverages; an additional $3 a day tax for each occupied hotel room (whether provided as a comp or at a charge);11 an 8 percent tax on gross revenues from progressive slot machines; and, between 2004 and 2006, a 7.5 percent tax on calendar year 2002 adjusted net income.12 (In general, the length of time over which the different taxes were to be in effect varied; for example, the tax on casino comps runs through 2009.) The tax on casino comps appears to be designed to capture tax revenues that would have been paid on the full value of casino-related sales in the absence of comps, while funds from the “net income” tax were used to help maintain the competitive position of Atlantic City’s gambling industry. (See Section IV below.)
In addition to the taxes described above and in the next section, i.e., those that are specific to the casino industry and delineated in the Casino Control Act, the gambling industry is also subject to the full array of state and local taxes that any business located in Atlantic City would face, including state unemployment insurance taxes and local property taxes, while the state’s sales tax and hotel tax are added to the relevant expenditures of casino visitors. Given the industry’s status as the second largest in New Jersey, and its dominant role in Atlantic City, these revenues represent a substantial contribution to state and local revenues. (Indeed, casinos pay 80 percent of the property taxes going to Atlantic City and its school district.13) Atlantic City also receives funds generated by the casinos in the form of a luxury sales tax and a tax on promotions.
10 2003 amendments to the Casino Control Act.11 The relevant legislation stipulated that after 2006, revenues from the hotel tax would be shared with the CRDA.12 Adjusted net income = net income + management fees. Adjusted net income is used as a basis for calculating what is ef-fectively a profits tax because differences in how casinos calculate management fees appear to affect reported net income. 13 Data for 2001, provided in “Atlantic City Gaming Economic Impact Report, 2003,” available on the New Jersey Casino Control Commission website.

ATLANTIC CITY: PAST AS PROLOGUE 45
The Casino Reinvestment Development Authority (CRDA)
As initially written, the Casino Control Act required that casinos reinvest 2 percent of their annual adjusted gross revenues in Atlantic City and other parts of New Jersey in projects designed to improve the health and well-being of the city and state. However, the act provided an alternative to this requirement, allowing casinos to hold the money otherwise required for reinvestment for five years and then pay these funds as a 2 percent tax to the state.14 As of 1984, the relevant part of the Casino Control Act had not resulted in any significant reinvestment in Atlantic City.
In response to this situation, the New Jersey legislature amended the CCA in 1984 to provide for the establishment of the CRDA, whose listed purposes include the redevelopment of blighted areas and the addressing of pressing social and economic needs of residents in Atlantic City and elsewhere in the state, with a particular focus on benefits to low- and moderate-income households;15 the use of funds to support casino development and expansion was prohibited. Under the terms of the legislation, the CRDA may issue bonds to finance its projects, and casinos are required to use 1.25 percent of their adjusted gross revenue (AGR) to buy bonds, to invest this amount directly in CRDA projects, or to pay a tax equal to 2.5 percent of their AGR to the state (over and above the 8 percent tax on AGR).16 Currently, casinos’ CRDA obligations extend through the first 50 years of operation.17 (Table A1 gives the legislative requirement for distributing CRDA funds across New Jersey over the 50-year period. As of early 2007, 80 percent of all CRDA-supported spending had occurred in Atlantic City.18)
14 See the article by Rubinstein. 15 Casino Control Act, Article 12. The actual terms of the require-ment, laid out in the CCA, 5:12-144b through e, were somewhat more complicated, but the basic thrust of the language involved the 2 percent reinvestment requirement described in the text. 16 Not surprisingly, no casino has chosen the last option. 17 Under the initial authorizing legislation for the CRDA, casinos’ CRDA obligation lasted for only 30 years, but in the current de-cade, as the CRDA’s mandate has been expanded, the length of the obligation has been expanded as well, first to 35 years and then to the current 50 years, in a bill that also provided legislative approval for an expansion of economic development projects.18 See the article by Serge Kovaleski.
In accordance with the 1984 legislative mandate, the CRDA focused its initial efforts on the development of for-sale housing, some for low- and moderate-income households, especially in the blighted North Inlet section of Atlantic City. Starting in 1993, however, a series of legislative amendments expanded the range of projects that the CRDA could fund. In that year, the CRDA was specifically directed by the New Jersey legislature to provide funding for construction of hotel rooms, a reversal of the prohibition on using CRDA funds for casino development included in its authorizing legislation. Since then, additional legislative changes to the relevant section of the Casino Control Act have supported an increasingly broad range of activities that directly provide funding for casinos or for other tourist-oriented development, including boardwalk revitalization and entertainment/retail districts like the Walk and new retail space at the Tropicana. Money from the casino investment obligations may be used to support such projects, and amendments to the CCA also provide supplementary revenue sources, some of them temporary, for this purpose. Today, the CRDA’s activities are focused on economic development.19
19 As early as 1997, CRDA investments in casino hotel rooms, $175 million, were almost as large as its investment in housing, $185 million. (New Jersey Casino Control Commission, Casino
TABLE A1
Required Disposition of Casinos’ CRDA Obligations Across Areas of New Jersey
Each casino’s required investments by years
Atlantic City
South Jersey
North Jersey
1-3 100% - -
4-5 90% 8% 2%
6-10 80% 12% 8%
11-15 50% 28% 22%
16-20 30% 43% 27%
21-25 20% 45% 35%
26-30 65% - 35%
31-35 25% 25% 50%
36-50 - 50% 50%
Source: Casino Reinvestment Development Authority, accessible at: http://www.njcrda.com/about.html

46 ATLANTIC CITY: PAST AS PROLOGUE
III. Performance of the Atlantic City Casino Industry
The first Atlantic City casino, Resorts, opened in 1978 and between 1978 and 1987, the number of casinos increased to 12. In subsequent years, there were occasional changes in the set of casinos in operation, but the number of casinos remained at 12 until November 2006, when it fell to 11. (The most recent changes include the opening of the Borgata and the closing of Claridge’s in 2003, events that kept the number of casinos at 12, and the closing of the Sands in November 2006, the source of the drop in the number of casinos.)20
Casinos’ gross revenues between 1978 and 2006 are provided in nominal terms in Table A2a and in real terms in Table A2b. As noted previously, New Jersey has continuously ranked second, after Nevada, in total revenues brought in by commercial casinos, despite an increase in the number of states that have legalized commercial casinos and a more general proliferation of gambling facilities, including Indian casinos located on tribal lands and “racinos.” (Time-series data for the 8 percent gross revenue tax paid to the state are also presented in Table A2a, while data on taxes paid to Atlantic City and Atlantic County are provided in Tables A3a through A3c on pages 48 and 49. Interestingly, while the New Jersey casinos rank second in gross revenues, they ranked only fifth in tax revenues paid to the state in 2006, reflecting the state’s relatively low tax rate for gross casino revenues.21)
Nominal revenue growth in the industry was consistently positive through 2006, though in any given year, some individual casinos may have experienced revenue declines.22 In 2007, nominal
Gambling in New Jersey: A Report to the National Gambling Impact Study Commission, Appendix 4, 1998, available on the commission’s website at www.njccc.gov. Further information on CRDA activities is available at www.njcrda.com.)20 See New Jersey Casino Control Commission Year-End Gaming Economic Impact Report, 2003, to track casino entry and exit between 1979 and 2000.21 American Gaming Association at www.americangaming.org.22 Just as positive growth in nominal revenues for the Atlantic City casino industry as a whole may mask a decline in such revenues for some casinos, a positive bottom line for the entire industry, as represented by net income, may mask net losses for some casinos. Although Table A2a shows positive net income for the industry between 2003 and 2006, three or more casinos experienced a net
TABLE A2a
Atlantic City: Casino Revenues, Tax and CRDA Obligations, and Net Income
Year Adjusted gross revenue (000s)
Adjusted gross revenue tax (000s)
1978 $134,073 $10,695
1979 325,480 34,392
1980 642,673 68,639
1981 1,099,781 86,537
1982 1,493,163 117,471
1983 1,770,944 139,544
1984 1,951,768 154,653
1985 2,138,651 169,236
1986 2,281,204 181,303
1987 2,495,674 198,221
1988 2,734,773 216,958
1989 2,807,017 222,394
1990 2,951,581 232,717
1991 2,991,559 236,253
1992 3,215,970 255,320
1993 3,301,360 262,936
1994 3,422,534 272,318
1995 3,747,578 298,278
1996 3,813,598 303,148
1997 3,906,140 310,372
1998 4,032,998 319,329
1999 4,164,199 329,824
2000 4,300,332 342,022
2001 4,302,921 342,336
2002 4,381,407 348,731
2003 4,480,738 358,459
2004 4,806,698 384,579
2005 5,018,271 401,461
2006 5,217,614 417,528
2007 4,920,787 393,707
CRDA OBLIGATIONS NET INCOME2003 $56.0 m. $82.9m.
2004 $60.1 m. $109.5m.
2005 $62.7 m. $548.2m.
2006 $65.2 m. $365.2m.
2007 $61.5 m -$59.7 m
Casinos pay an 8 percent tax on adjusted gross gaming revenue (except in the 1978 to 1983 period, when the actual or effective rate varied across years). This tax goes to support programs for the elderly and disabled. Casinos must reinvest 1.25 percent of gaming revenues into projects ap-proved by the CRDA.Sources: All numbers from the Casino Control Commission’s Year-End Gaming Economic Impact Reports, 2003-2007, available at www.njccc.gov/financia/histori.
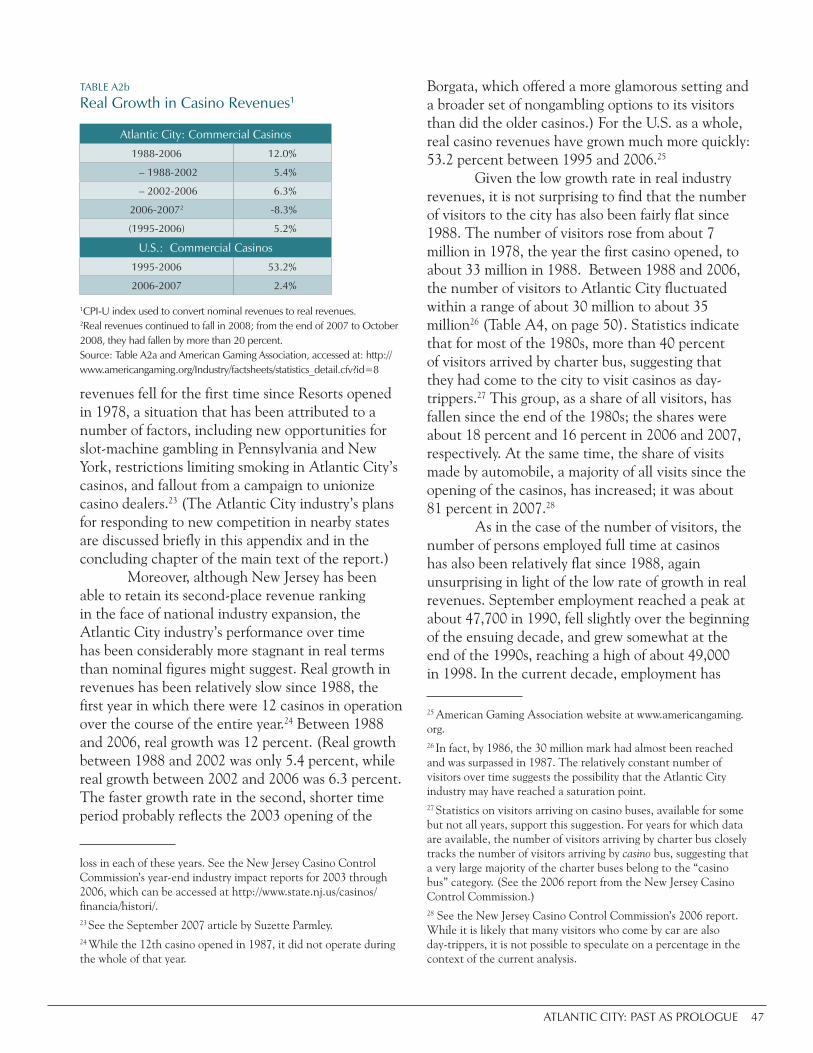
ATLANTIC CITY: PAST AS PROLOGUE 47
revenues fell for the first time since Resorts opened in 1978, a situation that has been attributed to a number of factors, including new opportunities for slot-machine gambling in Pennsylvania and New York, restrictions limiting smoking in Atlantic City’s casinos, and fallout from a campaign to unionize casino dealers.23 (The Atlantic City industry’s plans for responding to new competition in nearby states are discussed briefly in this appendix and in the concluding chapter of the main text of the report.)
Moreover, although New Jersey has been able to retain its second-place revenue ranking in the face of national industry expansion, the Atlantic City industry’s performance over time has been considerably more stagnant in real terms than nominal figures might suggest. Real growth in revenues has been relatively slow since 1988, the first year in which there were 12 casinos in operation over the course of the entire year.24 Between 1988 and 2006, real growth was 12 percent. (Real growth between 1988 and 2002 was only 5.4 percent, while real growth between 2002 and 2006 was 6.3 percent. The faster growth rate in the second, shorter time period probably reflects the 2003 opening of the
loss in each of these years. See the New Jersey Casino Control Commission’s year-end industry impact reports for 2003 through 2006, which can be accessed at http://www.state.nj.us/casinos/financia/histori/.23 See the September 2007 article by Suzette Parmley.24 While the 12th casino opened in 1987, it did not operate during the whole of that year.
Borgata, which offered a more glamorous setting and a broader set of nongambling options to its visitors than did the older casinos.) For the U.S. as a whole, real casino revenues have grown much more quickly: 53.2 percent between 1995 and 2006.25
Given the low growth rate in real industry revenues, it is not surprising to find that the number of visitors to the city has also been fairly flat since 1988. The number of visitors rose from about 7 million in 1978, the year the first casino opened, to about 33 million in 1988. Between 1988 and 2006, the number of visitors to Atlantic City fluctuated within a range of about 30 million to about 35 million26 (Table A4, on page 50). Statistics indicate that for most of the 1980s, more than 40 percent of visitors arrived by charter bus, suggesting that they had come to the city to visit casinos as day-trippers.27 This group, as a share of all visitors, has fallen since the end of the 1980s; the shares were about 18 percent and 16 percent in 2006 and 2007, respectively. At the same time, the share of visits made by automobile, a majority of all visits since the opening of the casinos, has increased; it was about 81 percent in 2007.28
As in the case of the number of visitors, the number of persons employed full time at casinos has also been relatively flat since 1988, again unsurprising in light of the low rate of growth in real revenues. September employment reached a peak at about 47,700 in 1990, fell slightly over the beginning of the ensuing decade, and grew somewhat at the end of the 1990s, reaching a high of about 49,000 in 1998. In the current decade, employment has
25 American Gaming Association website at www.americangaming.org.26 In fact, by 1986, the 30 million mark had almost been reached and was surpassed in 1987. The relatively constant number of visitors over time suggests the possibility that the Atlantic City industry may have reached a saturation point.27 Statistics on visitors arriving on casino buses, available for some but not all years, support this suggestion. For years for which data are available, the number of visitors arriving by charter bus closely tracks the number of visitors arriving by casino bus, suggesting that a very large majority of the charter buses belong to the “casino bus” category. (See the 2006 report from the New Jersey Casino Control Commission.) 28 See the New Jersey Casino Control Commission’s 2006 report. While it is likely that many visitors who come by car are also day-trippers, it is not possible to speculate on a percentage in the context of the current analysis.
TABLE A2b
Real Growth in Casino Revenues1
Atlantic City: Commercial Casinos
1988-2006 12.0%
– 1988-2002 5.4%
– 2002-2006 6.3%
2006-20072 -8.3%
(1995-2006) 5.2%
U.S.: Commercial Casinos
1995-2006 53.2%
2006-2007 2.4%
1CPI-U index used to convert nominal revenues to real revenues. 2Real revenues continued to fall in 2008; from the end of 2007 to October 2008, they had fallen by more than 20 percent.Source: Table A2a and American Gaming Association, accessed at: http://www.americangaming.org/Industry/factsheets/statistics_detail.cfv?id=8

48 ATLANTIC CITY: PAST AS PROLOGUE
tended to decline. September employment stood at 45,409 in 2006. (See Figure 3 and Table 5 in the main text.) According to the New Jersey Department of Labor and Workforce Development, the recent drop in employment mirrors an industry-wide trend29 attributed in part to the adoption of labor-saving technology and the substitution of less labor-intensive gambling activities (especially slots)
29 See the New Jersey Department of Labor and Workforce Devel-opment Atlantic County fact book for 2006.
for more labor-intensive activities (e.g., card games). Data from a number of sources indicate
that a high proportion of casino jobs have relatively low skill requirements. For example, a 1998 report based on a survey of casino workers indicated that 11.3 percent had less than a high-school diploma and 40.4 percent had graduated from high school but had not gone further. Only 14.8 percent had completed four or more years of college.30 The New
30 This report, “Limitations in the Workforce: A Survey and Study
TABLE A3a
Property Tax Information for Atlantic City, including Casino Share of Property Taxes, 1977 to 20031
YearCitywide assessed
value(thousands)
Tax rate per $100 assessed value2
Property taxes for city budget
(millions)
Property taxes for city’s school budget (millions)
Total city property taxes (millions)
% of total sum paid by casinos
1977 $308,877 $7.96 N/A N/A N/A -
1978 N/A N/A $13.70 $4.40 $18.10 9%
1979 N/A N/A 15.1 5.3 20.4 25%
1980 863,845 4.068 19.5 8.5 28 38%
1981 1,211,515 5.04 39.8 11.8 51.6 46%
1982 1,528,128 4.497 41.3 13.8 55.1 59%
1983 1,549,336 4.32 38.9 14.9 53.8 61%
1984 1,993,629 3.906 44.2 15.4 59.6 62%
1985 2,260,730 3.876 51.6 16.5 68.1 72%
1986 5,563,291 1.967 63.4 17.9 81.3 60%
1987 5,861,132 1.967 69.2 20 89.2 62%
1988 6,290,529 2.072 77.6 22.4 100 64%
1989 6,411,135 2.136 81.1 24.1 105.2 65%
1990 6,409,047 2.2 79.7 32.6 112.3 66%
1991 6,339,118 2.328 83.5 32.8 116.3 68%
1992 6,208,320 2.48 87.4 33.5 120.9 69%
1993 6,140,670 2.497 84.8 38.2 123 70%
1994 6,122,830 2.686 90 42.2 132.2 71%
1995 5,985,350 2.858 96.8 44.8 141.6 64%
1996 6,376,778 2.952 110.1 47.1 157.2 73%
1997 6,359,369 2.949 109.8 48.3 158.1 79%
1998 6,702,420 2.878 108.6 52.3 160.9 80%
1999 6,720,953 2.957 108.6 58.2 166.8 80%
2000 6,692,907 3.09 110.2 62.5 172.7 79%
2001 6,627,000 3.095 106.2 64.5 170.7 80%
2002 N/A N/A N/A N/A N/A N/A
2003 7,378,212 3.369 N/A N/A N/A 81%
1 Tables A3a and A3c are drawn, with minor adaptations, from the 2003 New Jersey Casino Gaming Economic Impact Report (year-end report), produced by the New Jersey Casino Control Commission. The commission’s data sources for the information in these tables were the Atlantic City Tax Assessor’s Office and the Atlantic County Board of Taxation. Table A3b data and definitions are drawn from the corresponding 2004 report; the commission’s source for Table A3b data is the Office of Management and Budget, NJ Department of Treasury. The 2003 report is the only one in the series in recent years that provides detailed information on property taxes paid by the casinos.2 The numbers provided in this column are a sum of the property tax rates for Atlantic City and Atlantic County.
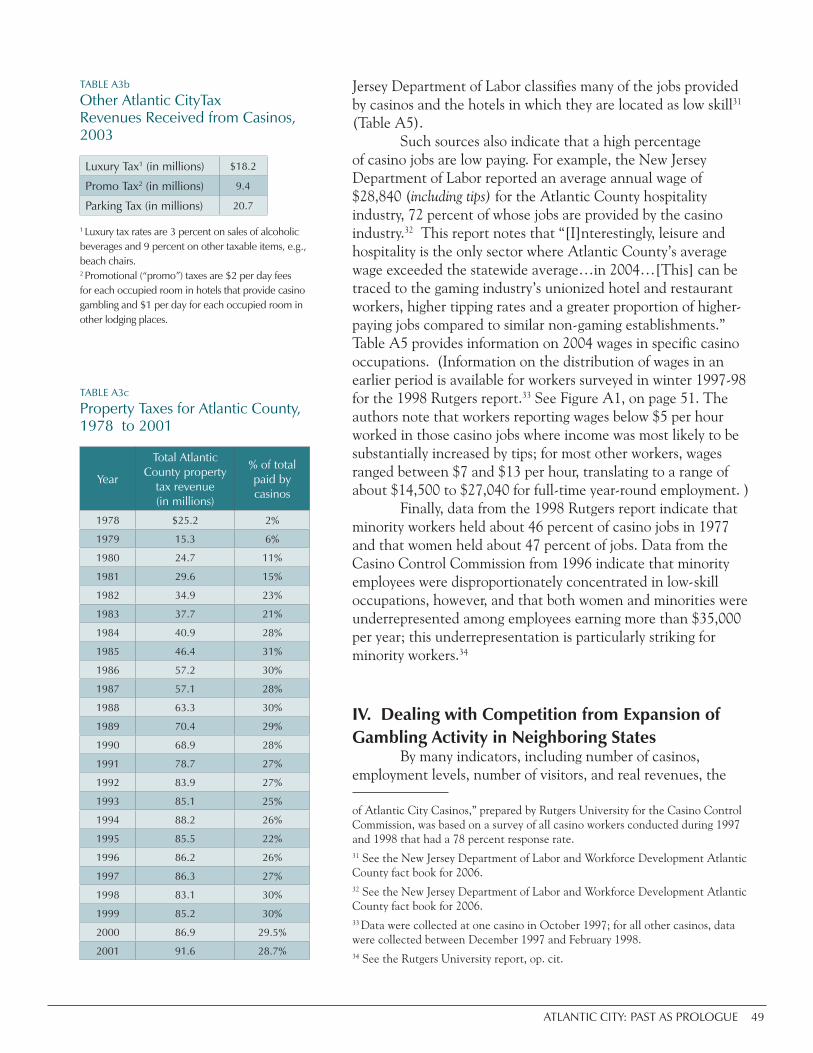
ATLANTIC CITY: PAST AS PROLOGUE 49
Jersey Department of Labor classifies many of the jobs provided by casinos and the hotels in which they are located as low skill31 (Table A5).
Such sources also indicate that a high percentage of casino jobs are low paying. For example, the New Jersey Department of Labor reported an average annual wage of $28,840 (including tips) for the Atlantic County hospitality industry, 72 percent of whose jobs are provided by the casino industry.32 This report notes that “[I]nterestingly, leisure and hospitality is the only sector where Atlantic County’s average wage exceeded the statewide average…in 2004…[This] can be traced to the gaming industry’s unionized hotel and restaurant workers, higher tipping rates and a greater proportion of higher-paying jobs compared to similar non-gaming establishments.” Table A5 provides information on 2004 wages in specific casino occupations. (Information on the distribution of wages in an earlier period is available for workers surveyed in winter 1997-98 for the 1998 Rutgers report.33 See Figure A1, on page 51. The authors note that workers reporting wages below $5 per hour worked in those casino jobs where income was most likely to be substantially increased by tips; for most other workers, wages ranged between $7 and $13 per hour, translating to a range of about $14,500 to $27,040 for full-time year-round employment. )
Finally, data from the 1998 Rutgers report indicate that minority workers held about 46 percent of casino jobs in 1977 and that women held about 47 percent of jobs. Data from the Casino Control Commission from 1996 indicate that minority employees were disproportionately concentrated in low-skill occupations, however, and that both women and minorities were underrepresented among employees earning more than $35,000 per year; this underrepresentation is particularly striking for minority workers.34
IV. Dealing with Competition from Expansion of Gambling Activity in Neighboring States By many indicators, including number of casinos, employment levels, number of visitors, and real revenues, the
of Atlantic City Casinos,” prepared by Rutgers University for the Casino Control Commission, was based on a survey of all casino workers conducted during 1997 and 1998 that had a 78 percent response rate.31 See the New Jersey Department of Labor and Workforce Development Atlantic County fact book for 2006.32 See the New Jersey Department of Labor and Workforce Development Atlantic County fact book for 2006.33 Data were collected at one casino in October 1997; for all other casinos, data were collected between December 1997 and February 1998.34 See the Rutgers University report, op. cit.
TABLE A3b Other Atlantic CityTax Revenues Received from Casinos, 2003
Luxury Tax1 (in millions) $18.2
Promo Tax2 (in millions) 9.4
Parking Tax (in millions) 20.7
1 Luxury tax rates are 3 percent on sales of alcoholic beverages and 9 percent on other taxable items, e.g., beach chairs.2 Promotional (“promo”) taxes are $2 per day fees for each occupied room in hotels that provide casino gambling and $1 per day for each occupied room in other lodging places.
TABLE A3c
Property Taxes for Atlantic County, 1978 to 2001
Year
Total Atlantic County property
tax revenue (in millions)
% of total paid by casinos
1978 $25.2 2%
1979 15.3 6%
1980 24.7 11%
1981 29.6 15%
1982 34.9 23%
1983 37.7 21%
1984 40.9 28%
1985 46.4 31%
1986 57.2 30%
1987 57.1 28%
1988 63.3 30%
1989 70.4 29%
1990 68.9 28%
1991 78.7 27%
1992 83.9 27%
1993 85.1 25%
1994 88.2 26%
1995 85.5 22%
1996 86.2 26%
1997 86.3 27%
1998 83.1 30%
1999 85.2 30%
2000 86.9 29.5%
2001 91.6 28.7%

50 ATLANTIC CITY: PAST AS PROLOGUE
Atlantic City casino industry has presented a very constant picture over the past two decades. It is by no means clear, however, that Atlantic City will continue to travel this path, and the direction of change, should it move off the path, is also uncertain. Recent years have seen the expansion of casino and racino35 activity to nearby states. Perhaps most problematic for the Atlantic City industry are a set of racinos (already in place) and planned casinos that will stretch along the I-95 corridor where it
35 Racinos are race tracks with slot machines.
passes through the Philadelphia metropolitan area and may provide a more easily accessible gambling opportunity for many of Atlantic City’s day-trippers. The Atlantic City casino industry has recognized the competitive threat and, over the course of the last decade, has taken steps both to limit competition and to respond to it. In the former category was an initiative that used the proceeds of a short-term tax on net adjusted casino income to enhance purses at New Jersey’s Meadowlands racetrack, in return for an agreement that the Meadowlands would not introduce slot machine gambling for a specified time period. In the long term, the city and its gambling industry hope to respond to competition via a strategy that, if successful, will make Atlantic City a tourist destination for a broader spectrum of the population than it now attracts. For example, the industry hopes to expand the number of nonelderly tourists who visit the city and to attract tourists whose
TABLE A4
Visitor Statistics, Atlantic City
Years Total visitors
% of visitors coming by charter bus
% of visitors coming by car
1980 13,822 23.9% 71.6%
1981 19,084 35.5 60.1
1982 22,955 39.4 57.0
1983 26,361 41.9 54.4
1984 28,466 42.3 54.3
1985 29,326 42.9 53.5
1986 29,932 41.6 54.7
1987 31,845 42.4 54.1
1988 33,138 42.8 53.6
1989 32,002 38.9 57.0
1990 31,813 35.2 60.7
1991 30,788 33.4 62.6
1992 30,705 31.8 64.3
1993 30,225 28.9 67.2
1994 31,321 26.7 69.6
1995 33,272 27.3 69.6
1996 34,042 29.4 67.6
1997 34,070 28.3 68.6
1998 34,300 28.9 67.9
1999 33,652 27.8 69.1
2000 33,184 27.2 69.8
2001 32,423 24.6 72.5
2002 33,187 22.9 74.4
2003 32,224 21.0 76.2
2004 33,313 19.7 77.5
2005 34,924 17.5 79.9
2006 34,534 17.5 79.8
2007 33,300 16.2 80.9
Source: New Jersey Casino Control Commission, Economic Impact Report, 2007, reporting data from the South Jersey Transportation Authority (re-ceived yearly)Accessed at: http://www.njccc.gov/casinos/financia/histori/docs/year_end_fourth_quarter_2007.xls
TABLE A5
Wages and Skill Levels for a Selection of Atlantic County Jobs
Occupations 2004 annual wage
Skill level
Gaming Dealers $ 15,090 Moderate
Waiters and Waitresses 16,930 Low
Cashiers 17,480 Low
Retail Salespersons 23,880 Low
Gaming Change Persons and Booth Cashiers 22,210 Low
Combined Food Preparation and Serving Workers, Including Fast Food 16,480 Low
Janitors and Cleaning, Except Maids and Housekeeping Cleaners 23,210 Low
Security Guards 23,810 Low
Office Clerks, General 24,900 Low
Maids and Housekeeping Cleaners 19,580 Low
Gaming Supervisors 47,350 Moderate
Dishwashers 18,330 Low
Food Preparation Workers 19,100 Low
Bartenders 23,650 Low
Electricians 54,060 Moderate
Supervisors/Managers of Retail Sales Workers 41,690 Moderate
Stock Clerks and Order Fillers 21,650 Low
Cooks, Restaurant 26,510 Moderate
Source: 2006 Atlantic County fact book.
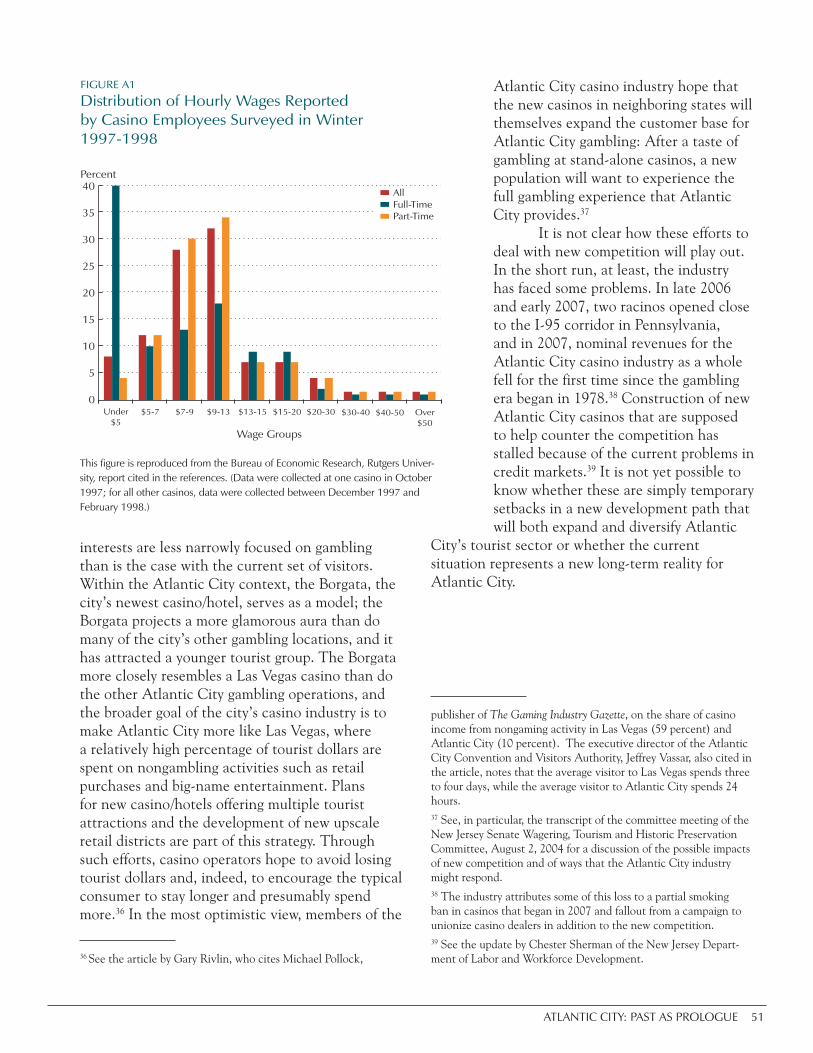
ATLANTIC CITY: PAST AS PROLOGUE 51
interests are less narrowly focused on gambling than is the case with the current set of visitors. Within the Atlantic City context, the Borgata, the city’s newest casino/hotel, serves as a model; the Borgata projects a more glamorous aura than do many of the city’s other gambling locations, and it has attracted a younger tourist group. The Borgata more closely resembles a Las Vegas casino than do the other Atlantic City gambling operations, and the broader goal of the city’s casino industry is to make Atlantic City more like Las Vegas, where a relatively high percentage of tourist dollars are spent on nongambling activities such as retail purchases and big-name entertainment. Plans for new casino/hotels offering multiple tourist attractions and the development of new upscale retail districts are part of this strategy. Through such efforts, casino operators hope to avoid losing tourist dollars and, indeed, to encourage the typical consumer to stay longer and presumably spend more.36 In the most optimistic view, members of the
36 See the article by Gary Rivlin, who cites Michael Pollock,
Atlantic City casino industry hope that the new casinos in neighboring states will themselves expand the customer base for Atlantic City gambling: After a taste of gambling at stand-alone casinos, a new population will want to experience the full gambling experience that Atlantic City provides.37 It is not clear how these efforts to deal with new competition will play out. In the short run, at least, the industry has faced some problems. In late 2006 and early 2007, two racinos opened close to the I-95 corridor in Pennsylvania, and in 2007, nominal revenues for the Atlantic City casino industry as a whole fell for the first time since the gambling era began in 1978.38 Construction of new Atlantic City casinos that are supposed to help counter the competition has stalled because of the current problems in credit markets.39 It is not yet possible to know whether these are simply temporary setbacks in a new development path that will both expand and diversify Atlantic
City’s tourist sector or whether the current situation represents a new long-term reality for Atlantic City.
publisher of The Gaming Industry Gazette, on the share of casino income from nongaming activity in Las Vegas (59 percent) and Atlantic City (10 percent). The executive director of the Atlantic City Convention and Visitors Authority, Jeffrey Vassar, also cited in the article, notes that the average visitor to Las Vegas spends three to four days, while the average visitor to Atlantic City spends 24 hours. 37 See, in particular, the transcript of the committee meeting of the New Jersey Senate Wagering, Tourism and Historic Preservation Committee, August 2, 2004 for a discussion of the possible impacts of new competition and of ways that the Atlantic City industry might respond.38 The industry attributes some of this loss to a partial smoking ban in casinos that began in 2007 and fallout from a campaign to unionize casino dealers in addition to the new competition. 39 See the update by Chester Sherman of the New Jersey Depart-ment of Labor and Workforce Development.
This figure is reproduced from the Bureau of Economic Research, Rutgers Univer-sity, report cited in the references. (Data were collected at one casino in October 1997; for all other casinos, data were collected between December 1997 and February 1998.)

ATLANTIC CITY: PAST AS PROLOGUE 53
ATLANTIC CITY: PAST AS PROLOGUEAPPENDIX B: ATLANTIC COUNTY IN THE POST-CASINO ERA
I. IntroductionThe main text of this report focuses on
economic and demographic trends in Atlantic City since the arrival of legalized gambling in 1978. But one would not expect the casino industry’s effects to be confined to the city alone. Newcomers drawn to the Atlantic City area by casino jobs would not necessarily live in the city proper, so their arrival might have implications for the size and characteristics of the population in nearby areas. Income going to households that supply labor, and to businesses that supply goods and services to the casino industry, would not all be spent in the city itself; income spent in other places would generate new economic activity in those places.1 In short, the effects of the casino industry would be expected to spill over to neighboring areas.
This appendix looks at economic and demographic change in the region surrounding Atlantic City over the past several decades. In other research that looks at regional change subsequent to casino openings, the county in which the casino is located is commonly used as the unit of analysis. That is the approach taken in this appendix, which looks at trends in Atlantic County, Atlantic City’s home county. The next section provides a statistical picture of the county, pre- and post-casino, and the one that follows focuses on the growth of noncasino employment in recent decades.
1 All other things equal, the degree to which money received by households and businesses from the casino industry is spent outside the casino jurisdiction would be expected to depend on the extent to which these households and businesses were located outside the jurisdiction.
II. Statistical Picture of Atlantic City and the Balance of Atlantic County
Tables B1 and B2 provide data on demographic and economic trends in Atlantic County, Atlantic City, the balance of Atlantic County (“county balance”), and the state of New Jersey. Discussion in this section focuses, for the most part, on the comparison of Atlantic City and the county balance before and after the advent of legalized gambling, although some countywide data are also discussed. The decision to focus on these sub-areas rather than the county as a whole is based on the very different economic and demographic characteristics of the sub-areas. Countywide statistics would lie between city and county balance numbers but would not do a good job of describing either.
The Picture in 1970In 1970, the last decennial census year prior
to casino development, the city and the balance of Atlantic County presented very different statistical profiles. Atlantic City, clearly in decline, had lost 20 percent of its population since 1960 and 6 percent of its private-sector jobs since 1965. In contrast, the balance of the county had experienced a 26 percent increase in population since 1960 and a 40 percent increase in private-sector jobs since 1965.2 The gains in the balance of the county were too large to simply reflect a suburbanization of population and employment within the metropolitan area, and on
2 Unless otherwise noted, in this appendix, the term “employment” refers to private-sector “covered employment,” which is employ-ment covered by unemployment and temporary disability benefit laws. Data on such employment are available from the New Jersey Department of Labor and Workforce Development’s publications and website. The underlying data for calculating these changes are available from the author on request.

54 ATLANTIC CITY: PAST AS PROLOGUE
net, the county as a whole experienced population and job growth.
Demographically, Atlantic City and the balance of Atlantic County looked very different as well. (With a few exceptions, noted below, the demographic characteristics of the balance of the county were quite similar to those of the state as a whole.) In the city, 46 percent of the population was nonwhite, while in the balance of the county the minority percentage was 8 percent. The foreign-born comprised 9 percent of the city’s population and only 5 percent of the population in the county balance. Twenty-five percent of Atlantic City’s population was elderly, compared to 13 percent in the remainder of the county. (This latter percentage was nonetheless considerably higher than the corresponding percentage for the state. See Table B1.) Not surprisingly given the difference in shares of elderly, the share of the population that was of prime working age — between 25 and 64 years of age — was somewhat higher in the balance of the county than in the city. The share of households that were families was considerably lower in the city than in the balance of the county (60 percent vs. 82 percent), while the share of families classified as female-headed with children was considerably higher (16 percent vs. 5 percent). The level of educational achievement was lower in the city
than in the balance of the county.3 However, the balance of the county lagged the state somewhat in
3 The higher percentage of city residents who were elderly probably contributes, in part, to the lower educational attainment.
TABLE B1
Selected Demographic Trends for Atlantic City, Atlantic County, County Balance, and New Jersey
Population 1970 1980 1990 2000
City 47,859 40,199 37,986 40,517
Balance 127,184 153,920 186,341 212,035
County 175,043 194,119 224,327 252,552
New Jersey 7,168,164 7,364,823 7,730,188 8,414,350
% change in population 1960- 1970 1970-1980 1980-1990 1990-2000
City -19.6% -16.0% -5.5% 6.7%
Balance 25.5% 21.0% 21.1% 13.8%
County 8.8% 10.1% 15.6% 12.6%
New Jersey 18.2% 2.7% 5.0% 8.9%
1970 1980 1990 2000
% elderly
City 24.8% 23.5% 19.2% 14.2%
Balance 12.9% 13.9% 13.6% 13.5%
County 16.2% 15.9% 14.5% 13.6%
New Jersey 9.7% 11.6% 13.4% 13.2%
% 25-64
City 41.6% 41.9% 47.8% 51.2%
Balance 45.4% 47.3% 52.9% 53.4%
County 44.4% 46.1% 52.1% 53.0%
New Jersey 46.8% 49.5% 53.3% 53.9%
% foreign-born*
City 9.4% 7.7% 9.9% 24.7%
Balance 5.4% 4.7% 4.9% 9.3%
County 6.5% 5.3% 5.8% 11.8%
New Jersey 8.9% 10.3% 12.5% 17.6%
% of households that are families
City 59.6% 54.8% 52.0% 54.9%
Balance 81.9% 73.6% 69.7% 68.8%
County 74.7% 69.3% 66.5% 66.5%
New Jersey 82.7% 72.6% 72.3% 70.3%
Table continued on next pageSource: U.S. Decennial Censuses*Percent of foreign-born arriving after 1990: City 65.4%, Balance 45.4%, County 52.1%, New Jersey 41.6%.

ATLANTIC CITY: PAST AS PROLOGUE 55
the percentages of the population over 25 with high-school diplomas and college degrees.
Economically, the balance of the county, while considerably better off than the city, lagged the state on key measures of household well-being, such as household and family median income and
unemployment.4 (In addition, male and female labor force participation rates were slightly lower than those of the state.) However, the balance of the county had a lower poverty rate than the state as a whole.
Post-Casino PatternsOverall Trends in Population
and Employment. Atlantic County’s population has grown quickly since the advent of casinos. Between 1970 and 2005, population increased 54.8 percent, much higher than the statewide population increase of 21.6 percent; the county ranked seventh among all New Jersey counties in population growth. For all intents and purposes, all of this growth occurred in the balance of the county, where population increased 81 percent between 1970 and 2005.5
Between 1970 and 2005, the number of private-sector “covered employment” jobs in Atlantic County grew 147 percent, a percentage much higher than the 60 percent growth in the state as a whole. (See Figure B1, on page 57, which graphically depicts growth of covered employment over the period.6) The sharpest growth occurred between 1978 and 1990. Casino employment was rising during this period (Figure B2, on page 58), and construction activity in Atlantic City also tended to be high as the casino industry grew to its long-term number of 12 casinos. (During this period, the building of CRDA-sponsored housing on a large scale also added to construction activity.) Positive job growth in the balance of the county
4 The higher level of unemployment was probably due in part to the seasonal nature of much of Atlantic County’s employment.5 Statistics in this paragraph are drawn or derived from material in the New Jersey Department of Labor and Workforce Develop-ment’s 2006 Atlantic County fact book. 6 Data on employment broken out for the city and balance of the county are not available for all years.
TABLE B1 Continued
1970 1980 1990 2000
% of families female headed with children under 18
City 15.7% 23.3% 29.8% 25.5%
Balance 5.3% 7.9% 9.5% 10.4%
County 8.0% 10.8% 12.5% 12.5%
New Jersey 5.6% 8.7% 9.5% 9.1%
% with a H.S. diploma City 35.4% 48.1% 58.3% 61.8%
Balance 48.2% 65.1% 75.9% 81.2%
County 44.4% 61.4% 72.9% 78.2%
New Jersey 52.5% 67.4% 76.7% 82.1%
% with a college degree City 3.4% 7.7% 9.5% 10.4%
Balance 7.3% 13.8% 17.8% 20.2%
County 6.2% 12.5% 16.4% 18.7%
New Jersey 11.8% 18.3% 24.9% 29.8%
% White City 54.6% 43.9% 30.8% 19.4%
Balance 92.2% 86.8% 82.4% 72.4%
County 81.9% 77.9% 73.7% 68.4%
New Jersey 88.8% 79.3% 74.0% 66.0%
% Black City 43.7% 49.3% 49.7% 42.4%
Balance 7.4% 9.0% 10.1% 12.0%
County 17.4% 17.3% 16.8% 17.6%
New Jersey 10.7% 12.3% 12.7% 13.0%
% Hispanic City NA 5.8% 15.3% 24.9%
Balance NA 3.4% 5.5% 9.7%
County NA 3.9% 7.2% 12.2%
New Jersey NA 6.7% 9.6% 13.3%
% Asian City NA 0.6% 3.7% 10.0%
Balance NA 0.5% 1.7% 4.0%
County NA 0.5% 2.0% 5.1%
New Jersey NA 3.4% 5.7%
Source: U.S. Decennial Censuses

56 ATLANTIC CITY: PAST AS PROLOGUE
TABLE B2
Selected Economic Indicators for Atlantic City, Atlantic County, the County Balance, and New Jersey
1970 1980 1990 2000Private-Sector Total Covered Employment*City 25,069 36,406 66,000 60,500**
Balance 26,512 40,522 54,300 63,400
County 51,581 76,928 120,298 123,929
New Jersey 2,095,798 2,530,556 3,036,932 3,283,702
Median Income Household City 4,257 9,807 20,309 26,969
Balance 8,236 15,000-20,000 35,000-37,500 45,000-50,000
County 6,819 15,752 33,716 43,933
New Jersey 10,371 19,800 40,927 55,146 Family City 6,395 13,238 27,804 31,997
Balance 9,595 20,000-25,000*** 42,500-45,000*** 50,000-60,000***
County 8,775 19,216 40,602 51,710
New Jersey 11,403 22,906 47,589 65,370
Poverty Rate
City 22.5% 24.9% 25.0% 23.6%
Balance 9.5% 9.4% 6.2% 8.0%
County 13.0% 12.6% 9.4% 10.5%
New Jersey 11.3% 9.5% 7.6% 8.5%
% Poor/Near Poor1
City NA 32.4% 30.8% 30.3%
Balance NA 13.6%*** 8.7% 11.0%
County NA 17.4% 12.5% 14.1%
New Jersey NA 12.9% 10.3% 11.2%
% Low Income2
City NA 52.4% 45.8% 49.9%
Balance NA 28.3%*** 18.3% 22.9%
County NA 33.2% 23.0% 27.2%
New Jersey NA 24.3% 16.3% 20.4%
further added to the number of county jobs.Subsequent to 1990, casino employment
leveled off and, more recently, has started to decline. The number of noncasino private-sector jobs in Atlantic City proper declined after 1990 (although there has been an uptick in such jobs in recent years), but the number of jobs in the balance of the county continued to grow. The net effect was a continued, albeit slower, growth in Atlantic County jobs. (A further discussion of the impact of casinos on overall economic growth in the county is contained in the next section of this appendix.)
Demographic Trends in the City and in
the County Balance. Both Atlantic City and the remainder of Atlantic County have experienced demographic change since the advent of the casino era. But as was the case in 1970, demographic characteristics of the two areas continue to differ sharply on most measures.
While the nonwhite share of the population has grown in both the city and the balance of the county, Atlantic County is still quite predominantly white, while the city is very predominantly minority (72 percent white in the balance of the county vs. 19 percent white in the city). Hispanic and Asian population shares in the city are about 2.5 times higher in the city than in the balance of the county,
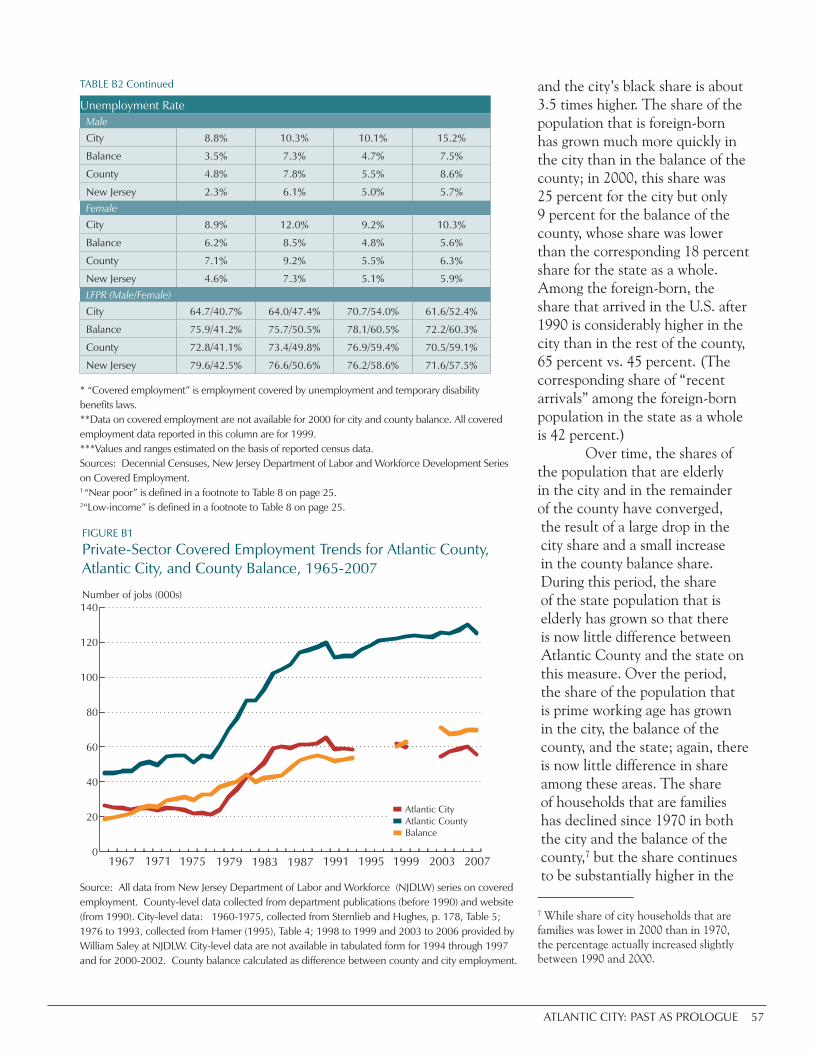
ATLANTIC CITY: PAST AS PROLOGUE 57
and the city’s black share is about 3.5 times higher. The share of the population that is foreign-born has grown much more quickly in the city than in the balance of the county; in 2000, this share was 25 percent for the city but only 9 percent for the balance of the county, whose share was lower than the corresponding 18 percent share for the state as a whole. Among the foreign-born, the share that arrived in the U.S. after 1990 is considerably higher in the city than in the rest of the county, 65 percent vs. 45 percent. (The corresponding share of “recent arrivals” among the foreign-born population in the state as a whole is 42 percent.)
Over time, the shares of the population that are elderly in the city and in the remainder of the county have converged, the result of a large drop in the city share and a small increase in the county balance share. During this period, the share of the state population that is elderly has grown so that there is now little difference between Atlantic County and the state on this measure. Over the period, the share of the population that is prime working age has grown in the city, the balance of the county, and the state; again, there is now little difference in share among these areas. The share of households that are families has declined since 1970 in both the city and the balance of the county,7 but the share continues to be substantially higher in the
7 While share of city households that are families was lower in 2000 than in 1970, the percentage actually increased slightly between 1990 and 2000.
* “Covered employment” is employment covered by unemployment and temporary disability benefits laws. **Data on covered employment are not available for 2000 for city and county balance. All covered employment data reported in this column are for 1999.***Values and ranges estimated on the basis of reported census data.Sources: Decennial Censuses, New Jersey Department of Labor and Workforce Development Series on Covered Employment. 1 “Near poor” is defined in a footnote to Table 8 on page 25.2“Low-income” is defined in a footnote to Table 8 on page 25.
TABLE B2 Continued
Unemployment RateMale City 8.8% 10.3% 10.1% 15.2%
Balance 3.5% 7.3% 4.7% 7.5%
County 4.8% 7.8% 5.5% 8.6%
New Jersey 2.3% 6.1% 5.0% 5.7%Female City 8.9% 12.0% 9.2% 10.3%
Balance 6.2% 8.5% 4.8% 5.6%
County 7.1% 9.2% 5.5% 6.3%
New Jersey 4.6% 7.3% 5.1% 5.9%LFPR (Male/Female) City 64.7/40.7% 64.0/47.4% 70.7/54.0% 61.6/52.4%
Balance 75.9/41.2% 75.7/50.5% 78.1/60.5% 72.2/60.3%
County 72.8/41.1% 73.4/49.8% 76.9/59.4% 70.5/59.1%
New Jersey 79.6/42.5% 76.6/50.6% 76.2/58.6% 71.6/57.5%
Source: All data from New Jersey Department of Labor and Workforce (NJDLW) series on covered employment. County-level data collected from department publications (before 1990) and website (from 1990). City-level data: 1960-1975, collected from Sternlieb and Hughes, p. 178, Table 5; 1976 to 1993, collected from Hamer (1995), Table 4; 1998 to 1999 and 2003 to 2006 provided by William Saley at NJDLW. City-level data are not available in tabulated form for 1994 through 1997 and for 2000-2002. County balance calculated as difference between county and city employment.

58 ATLANTIC CITY: PAST AS PROLOGUE
balance of the county, which looks like New Jersey as a whole on this characteristic. The share of families who are female-headed with children under 18 grew between 1970 and 2000 in both areas and in the state, but as in the pre-casino era, this share is still considerably higher in the city than in the balance of the county and the state.
Over time, the level of academic achievement has grown in the city, the balance, and the state. In 2000, the share of population over 25 in the balance of the county who had a high-school diploma was about the same as in the state as a whole, while the city lagged the state by about 20 percentage points. Both the city and the balance lagged the state considerably in the percentage of the population over 25 with a college degree.
Trends in the Economic Well-Being of Atlantic County Residents. In the post-casino years, Atlantic City has continued to lag both the county balance and the state as a whole on measures of economic well-being; the county balance has itself lagged the state on a number of income-related indicators8 (Table B2). Median family and household incomes were lower in the county balance than in the state in both 1990 and 2000.9 Although the county balance poverty rate has been lower than that of the state in each of the three post-casino census years, the
8 Measures of other indicators of economic well-being for the county balance show a mixed picture in comparison to the state. The male unemployment rate was higher than that of the state in two of the three post-casino census years covered by Table B2; however, the female unemployment rate was lower than the state’s rate in two out of these three years. Male and female labor force participation rates were somewhat lower than those for the state in 1980, but somewhat higher in the next two decennial census years. 9 Median household and family income in 1980 cannot be pinpoint-ed closely enough to make a comparison with state medians. The 2006 Atlantic County fact book provides additional information on the income gap between the county as a whole and the state for 2004. According to this source, the average private-sector wage in Atlantic County that year was only 70 percent of the corresponding average for the state and the county’s per capita personal income was only 78.2 percent that of the state’s.
percentage of the population classified as low income has been a bit higher.10 The high proportion — almost 40 percent — of Atlantic County jobs located in the low-paying leisure/hospitality sector is one factor contributing to a tendency for incomes in both the city and the county balance to be lower than those in the state.11 In addition, average county wages are lower than average state wages in all sectors except leisure/hospitality12(Figure B3). The bottom line seems to be that while the casinos have expanded the level of economic activity in Atlantic County, they have not changed the overall character of economic activity sufficiently to close the income gap between the county and the rest of the state.
10 As in the main text, an individual is defined as low income if he or she lives in a household whose income is less than 200 percent of the relevant poverty line.11 See p. 5 of the 2006 Atlantic County fact book. 12 See the 2006 Atlantic County fact book. The higher wage in the Atlantic County leisure/hospitality sector compared to the rest of the state is attributed to unionization of casino employees, higher tip levels in the casinos, and a greater share of relatively high-paying jobs in the casinos than in other parts of the sector (p. 7). While the average county wage in the leisure/hospitality sector is higher than the corresponding state average, the average county wage in this sector is still low compared to wages in other sectors.
Source: Data on casino employment come from the New Jersey Department of Labor and Workforce’s Nonfarm Payroll Employment Time Series and from Hamer, Table 4, which also uses this source. All casino employment is “covered employment.” Noncasino employment is calculated as the difference between county covered employment and casino employment.

ATLANTIC CITY: PAST AS PROLOGUE 59
III. Growth in the Noncasino Sector During the Casino Era
This section examines employment growth in the noncasino sector since the arrival of casino gambling. Figures B1 and B2 show that the establishment of the casino industry shifted up the overall number of private-sector jobs in Atlantic County; they also show that noncasino employment in the county was growing prior to the arrival of casinos and that it continued to grow after the major period of casino expansion. However, the impact of the casino industry on noncasino private-sector employment cannot be so easily discerned on the basis of these graphs. Although a full-scale investigation of this impact is well beyond the scope of this report, we make some preliminary observations in the context of the report.
In Figure B2, a best-fit exponential trend curve is superimposed on the graphical representation of noncasino private employment. This curve, which illustrates an annual growth rate in jobs of about 1.5 percent, fits the actual “jobs path” quite well. The exception is the period from 1978 to 1990, when the number of private-sector jobs rises well above the trend line. This is the period in which the number of casinos grew from zero to their long-term level of 12 and when the CRDA was supporting residential construction on a large scale;
time-series data on construction jobs in Atlantic County provide support for the hypothesis that construction activity is a key factor in the rise of employment above the trend line.13 One would not expect this level of job activity to be sustainable once major construction projects were complete, and after 1990, actual job growth moves back to the long-term trend path.
However, while the long-term Atlantic County growth trend is quite pronounced, it is not easy to predict how the arrival of casinos affected the location of the trend line, particularly because of the situation in Atlantic County prior to the arrival of casinos: Atlantic County was neither a rural county with relatively little economic activity, nor was it a place where the full county shared a common growth pattern. Rather, in Atlantic City proper, a previously developed economy was failing (and we do not know the extent to which city employment would have continued to decline in the absence of the casinos), while at the same time, the remainder of the county was experiencing considerable economic growth.
Nonetheless, it is not unreasonable to believe that the casino industry increased the number of private-sector jobs above the level that it would have been otherwise. Atlantic County population grew by about 30,000 between 1980 and 1990, compared to increases of about 14,000 between 1960 and 1970, and 19,000 between 1970 and 1980. It is likely that many of the newcomers in the 1980s came in response to the availability of new casino jobs. (Data in Table B3 show that in
13 Construction data are available from the New Jersey Department of Labor and Workforce Development publications (prior to 1990) and from the department’s website thereafter.
This figure is reproduced from the 2006 Atlantic County fact book.

60 ATLANTIC CITY: PAST AS PROLOGUE
1990, county residents held almost 35,000, or about 72 percent of casino jobs.) Firms that provided goods and services for these new households would have added to county employment. In addition, Atlantic County firms were the vendors for a large share of casino industry purchases.14 Since it is
14 Data on Atlantic County businesses’ share of purchases, available from the late 1980s onward, indicate that this share has typically ranged between about 40 and 50 percent of all purchases. For ex-ample, in 1989, county businesses had a 53 percent share of $1.8 bil-lion in purchases; in 1992, they had a 47 percent share of $1.9 billion in purchases; and in 1996, they had a 39 percent share of $1.5 billion in purchases. In 2003, county businesses had a 51 percent share of $3.1 billion in purchases, while in 2007 they had a 40 percent share of $4.04 billion in purchases. See the New Jersey Casino Control Commission’s year-end Economic Impact Reports for 2003 and 2007, the commission’s annual reports for 1989 and 1992, and the commis-sion’s report to the National Gambling Impact Study Commission.
likely that casino-generated business increased, rather than simply replaced, business activity that would otherwise have taken place, one would expect the casino purchases to have generated job growth. Given these factors, it seems likely that the establishment of the casino industry led to higher long-term sustainable noncasino job growth during the 1980s than would have otherwise been the case, even given the possibility that the casinos supplanted some jobs in Atlantic City proper. (See main text, pages 19-20.)
The casino industry had essentially plateaued by 1991, with the number of casino jobs stagnating and eventually declining in the years that followed. One might have expected both population growth and noncasino private-sector job growth to have
TABLE B3
Share of Casino Jobs Held by Atlantic County Residents*
Year Date of report Total casino jobs Held by Atlantic County residents
Held by Atlantic City residents
Held by county balance residents
Number % of Total Number % of Total Number % of Total
1987 9/28/1987 42,963 29,261 68.1% 9,013 21.0% 20,248 47.1%
1988 10/26/1988 44,612 30,903 69.3% 9,983 22.4% 20,920 46.9%
1989 10/18/1989 44,291 31,711 71.6% 10,261 23.2% 21,450 48.4%
1990 11/17/1990 48,152 34,738 72.1% 11,039 22.9% 23,699 49.2%
1991 12/2/1991 45,087 33,336 73.9% 10,338 22.9% 22,998 51.0%
1992 2/5/1993 44,762 33,365 74.5% 9,957 22.2% 23,408 52.3%
1993 1/1/1994 45,025 33,849 75.2% 9,951 22.1% 23,898 53.1%
1994 1/1/1995 45,489 34,476 75.8% 10,305 22.7% 24,171 53.1%
1995 N/A N/A N/A N/A N/A N/A N/A N/A
1996 11/1/1996 48,595 37,808 77.8% 10,846 22.3% 26,962 55.5%
1997 5/15/1997 48,466 37,754 77.9% 10,588 21.8% 27,166 56.1%
1998 3/2/1998 48,046 37,738 78.5% 10,655 22.2% 27,083 56.4%
1999 N/A N/A N/A N/A N/A N/A N/A N/A
2000 1/2/2001 46,771 38,110 81.5% 10,830 23.2% 27,280 58.3%
2001 1/25/2002 45,163 37,187 82.3% 10,643 23.6% 26,544 58.8%
2002 1/6/2003 44,502 36,923 83.0% 10,579 23.8% 26,344 59.2%
2003 1/1/2004 45,530 37,815 83.1% 10,788 23.7% 27,027 59.4%
2004 1/1/2005 44,823 37,463 83.6% 10,633 23.7% 26,830 59.9%
2005 1/1/2006 43,826 36,807 84.0% 10,226 23.3% 26,581 60.7%
2006 1/5/2007 41,943 35,298 84.2% 9,548 22.8% 25,750 61.4%
2007 1/1/2008 40,400 34,090 84.4% 8,787 21.8% 25,303 62.6%
Source: Data provided by staff at the New Jersey Casino Control Commission.*For each year, commission staff provided data from the monthly report that would best reflect the job picture at the end of the calendar year. This would typically be the report prepared in January of the following year. When the January report was not available, the report for the closest date available was used as a source of data; with the exception of 1997 and 1998, report dates are relatively close to the end of the relevant calendar year.

ATLANTIC CITY: PAST AS PROLOGUE 61
leveled off considerably after this point, yet county population grew by about 28,000 between 1990 and 2000 and noncasino job growth is not far off the long-term trend path shown in Figure B2.15 Interestingly, some of the noncasino employment growth almost certainly continues to be generated by economic activity associated with the casino industry itself. For example, the number of casino jobs held by Atlantic County residents grew by about 3,000 between 1990 and 2000, although the number has fallen in recent years as total casino employment has declined. (See Table B3. This table also shows that the share of jobs held by county residents has increased continuously since 1990.) More recently, major retail activity aimed at Atlantic City tourists, supported by the CRDA and thus by funds provided by the casinos, has also been a direct source of new jobs.16
15 Statistics updated to the current decade show that Atlantic County has continued to grow faster than the state on both of these measures. See the 2006 Atlantic County fact book.16 It is also possible that the opportunity to visit the casinos in Atlantic City may have increased the attractiveness of the county as a residential location (or as a location for a second home) for some households.
These factors notwithstanding, it seems unlikely that the casino industry would have supported the same amount of long-term growth in recent decades as it did during or close to its major expansion period. In turn, future work might be aimed at identifying other sources of job growth in Atlantic County. It would be interesting to identify the factors that underlie growth in the county balance prior to the arrival of casinos and to assess whether those factors continued to provide an impetus for growth after the casinos were established. Another topic that might deserve attention in future research is the extent to which new residents who commute to the Philadelphia MSA have become a source of growth for the county.

ATLANTIC CITY: PAST AS PROLOGUE 63
REFERENCES American Gaming Association. 2003. http://americangaming.org.
Atlantic City Convention and Visitors Authority. http://www.atlanticcitynj.com/.
Bonitto-Dogget, Yvonne. “Casino Reinvestment Develop-ment Authority: Playing the Right Hand in Atlantic City,” New Jersey Municipalities (November 2004); http://www.njslom.org/featart1104.html.
Bureau of Economic Research, Rutgers University. “Limi-tations in the Workplace: A Survey and Study of Atlantic City Casinos,” report to the New Jersey Casino Control Commission, New Brunswick, N.J.: Rutgers University, 1998.
Casino Reinvestment Development Authority. http://www.njcrda.com.
Federal Reserve System, Community Affairs Offices, with the Brookings Institution. The Enduring Challenge of Concentrated Poverty in America: Case Studies from Com-munities Across the U.S. (2008), accessible at http://www.frbsf.org/cpreport/.
Foster, Herbert James. “The Urban Experience of Blacks in Atlantic City, New Jersey: 1850-1915,” dissertation, Rutgers University (1981).
Froonjian, John. “Homeless Families, Shattered Lives: Ad-vocates Say Nonprofits Need to Step Up, Fill Affordable Housing Void,” Press of Atlantic City, July 18, 2005.
Goertzel, Ted G., and John W. Cosby. “Gambling on Jobs and Welfare in Atlantic City,” Society, 34:5 (May 1997), pp. 62-66.
Hamer, Thomas P., “Economic Impact of the New Jersey Casino Industry,” a study prepared for the New Jersey Casino Control Commission (September 1995).
Hamer, Thomas P. “The Casino Industry in Atlantic City: What Has It Done for the Local Economy?,” Federal Reserve Bank of Philadelphia Business Review (January/February 1982), pp. 3-16.
Johnson, Nelson. Boardwalk Empire: The Birth, High Times, and Corruption of Atlantic City. Medford, NJ: Plexus Publishing, 2003.
Klinger Kise Franks Straw. “Atlantic City Master Plan, Final Report,” prepared in association with Arthur D. Little, Inc., TAD Associates/Day and Zimmerman, D.S. Winokur Associates, inc., Kelly/Maiello, and Robert C. Leventhal, Esq., for the Atlantic City Planning Department, 1987.
Kovaleski, Serge. “Atlantic City Casinos Reap Anti-Blight Funds,” New York Times, January 28, 2007.
Librera, William. “Designation of Abbott Districts Crite-ria and Process,” New Jersey Department of Education, 2003; http://www.state.nj.us/education/abbotts/regs/criteria.htm.
National Housing Trust. http://www.nhtinc.org/index.asp.
Newburger, Harriet, Keith Rolland, John Wackes, and Anita Sands. “Atlantic City, New Jersey: The Bungalow Park/Marina District Area,” accessible at http://www.frbsf.org/cpreport/docs/atlantic_city_nj.pdf.
New Jersey Casino Control Commission. Casino Control Act, Title 5, Chapter 12, New Jersey Statutes, annotated. http://www.nj.gov/casinos/actreg/act/.
New Jersey Casino Control Commission. “Casino Gam-bling in New Jersey: A Report to the National Gambling Impact Study Commission,” January 1998. http://www.state.nj.us/casinos/about/commrepo/.
New Jersey Casino Control Commission. “New Jersey Ca-sino Year-End Gaming Economic Impact Report, 2003.” http://www.state.nj.us/casinos/financia/histori/.
New Jersey Casino Control Commission. “New Jersey Ca-sino Year-End Gaming Economic Impact Report, 2004.” http://www.state.nj.us/casinos/financia/histori/.
New Jersey Casino Control Commission. “New Jersey Ca-sino Year-End Gaming Economic Impact Report, 2005.” http://www.state.nj.us/casinos/financia/histori/.
New Jersey Casino Control Commission. “New Jersey Ca-sino Year-End Gaming Economic Impact Report, 2006.” http://www.state.nj.us/casinos/financia/histori/.
New Jersey Casino Control Commission. “New Jersey Ca-sino Year-End Gaming Economic Impact Report, 2007.” http://www.state.nj.us/casinos/financia/histori/.
New Jersey Department of Education. http://www.state.nj.us/education/guide/2007/csgsearch.shtml.
New Jersey Department of Labor and Workforce Devel-opment. The Southern Regional Community Fact Back, Atlantic County Edition, October 2006.

64 ATLANTIC CITY: PAST AS PROLOGUE
New Jersey State Employment and Training Commission. “Ready for the Job: Understanding Occupational and Skill Demand in New Jersey’s Tourism and Hospitality Indus-try,” prepared by the John J. Heldrich Center for Work-force Development at Rutgers University (Spring 2004). http://www.heldrich.rutgers.edu/uploadedFiles/Publications/Tourism.pdf.
Nichols, Mark W. “The Impact of Deregulation on Casino Win in Atlantic City,” Review of Industrial Organization 13:6, 1998, pp. 713-26.
Parmley, Suzette. “Hilton’s Plans Reflect a Larger-Scale Atlantic City,” Philadelphia Inquirer, April 25, 2007.
Parmley, Suzette. “Summer Slump,” Philadelphia Inquirer, September 11, 2007.
Parry, Wayne. “30 Years Later, Has Atlantic City Lived Up to Its Promises?,” USA Today, May 12, 2008.
Parry, Wayne. “Corruption, Atlantic City’s No. 1, Ex-Council Prez Only the Latest to Fall,” Philadelphia Inquirer, March 17, 2007.
Paulsson, Martin. The Social Anxieties of Progressive Re-form. New York: New York University Press, 1994.
Rivlin, Gary. “Atlantic City Aiming Higher as Casino Rev-enues Slip,” New York Times, March 19, 2007.
Rubenstein, Joseph. “Casino Gambling in Atlantic City: Is-sues of Development and Redevelopment,” Annals of the American Academy of Political and Social Sciences, 474:7 (1984), pp. 61-71.
Sherman, Chester. “Atlantic City Gaming Update: Sum-mer 2008,” State of New Jersey Department of Labor and Workforce Development, http://lwd.dol.state.nj.us/labor/lpa/content/gameind.html.
Simon, Bryant. Boardwalk of Dreams: Atlantic City and the Fate of Urban America. New York: Oxford University Press, 2004.
South Jersey Transportation Planning Organization. “SJPTO 2030 Population and Employment Projections by Municipality,” prepared by Richard Perniciaro and the Atlantic Cape Community College Center for Regional and Business Research, June 2006.
Sternlieb, George, and James Hughes. The Atlantic City Gamble. Cambridge, MA: Harvard University Press, 1983.
Trump Atlantic City Associates, 2004 Annual Report. http://sec-filings-exhibits.realdealdocs.com/Form-10-K-Annual-Report/1885-TRUMP-ATLANTIC-CITY-ASSOCI-ATES-10-K-834393/?qrtr=-q1_2004/. U.S. Census of Governments. “Employment of Major Local Governments,” 2002, Table 2. http://www.census.gov/govs/www/cog2002.html.
U.S. Decennial Census, 1930-2000.
U.S. Department of Housing and Urban Development. Assisted Housing Database, available at http://www.huduser.org.
U.S. Department of the Interior. A Directory of Negro Hotels and Guest Houses. Washington, D.C.: U.S. Travel Bureau, 1941. http://www.nps.gov/history/online_books/nj1/chap4.htm>.
U.S. Government Accountability Office (GAO). “Impact of Gambling: Economic Effects More Measurable Than Social Effects,” GAO/GGD-00-78 (April 2000). http://www.gao.gov/new.items/gg00078.pdf.