atlantic halibut (hippoglossus hippoglossus. brp meeti… · · 2008-05-0121.7 0.09 38.0 0.53...
TRANSCRIPT

Atlantic Halibut (Atlantic Halibut (HippoglossusHippoglossus hippoglossushippoglossus))
Laurel Col and Chris Laurel Col and Chris LegaultLegaultNortheast Fisheries Science CenterNortheast Fisheries Science Center
Draft PresentationFor Peer Review Only.
Does not represent final NOAA Decision/Policy.
5/01/08

Atlantic Halibut Commercial CatchAtlantic Halibut Commercial Catch
Year
1890 1900 1910 1920 1930 1940 1950 1960 1970 1980 1990 2000
Land
ings
and
Dis
card
s (li
ve-w
eigh
t, m
t)
0
200
400
600
800
1000
4600
4800
5000
5200
5400
5600
5800
Historic Total Catch US Discards

Atlantic Halibut US Commercial DiscardsAtlantic Halibut US Commercial Discards

Atlantic halibut US landings (mt) and discards (mt with 95% CI)from combined ratio estimation.
Year
1988 1990 1992 1994 1996 1998 2000 2002 2004 2006
US
Lan
ding
s an
d D
isca
rds
(mt)
0
20
40
60
80
Discards (mt) US Landings (mt)Discards (17% and 169%)

Atlantic Halibut Commercial CatchAtlantic Halibut Commercial Catch
Year
1950 1955 1960 1965 1970 1975 1980 1985 1990 1995 2000 2005
Tota
l Cat
ch (m
t)
0
100
200
300
400
500
600
USA US Discards Canada Other


Atlantic Halibut Biomass Trends in NEFSC SurveysAtlantic Halibut Biomass Trends in NEFSC Surveys
Year
1965 1970 1975 1980 1985 1990 1995 2000 2005
Stra
tifie
d M
ean
Wei
ght (
kg) p
er T
ow
0.0
0.1
0.2
0.3
0.4
0.5
0.6
0.7
Spring IndexAutumn Index

Total numbers of Atlantic halibut caught in NEFSC springand autumn surveys per year
Year
1965 1970 1975 1980 1985 1990 1995 2000 2005
Tota
l Num
ber o
f Hal
ibut
per
Yea
r
0
2
4
6
8
10
12
14
16
18
Spring SurveyAutumn Survey
Spring survey n=161# 0s in spring = 4
Autumn survey n=152#0s in autumn = 3
•• No age data availableNo age data available•• No door, vessel or gear conversions availableNo door, vessel or gear conversions available

IndexIndex--Based Reference Point DeterminationBased Reference Point Determination
Previous Reference PointsPrevious Reference Points•• Chose 300 Chose 300 mtmt as MSY proxy as MSY proxy
•• 18931893--1942 average landings of 480 1942 average landings of 480 mtmt not sustainablenot sustainable
•• YPR and BPR analyses used to determine reference pointsYPR and BPR analyses used to determine reference points•• Used lengthUsed length--weight equations from McCracken (1958)weight equations from McCracken (1958)•• von von BertalanffyBertalanffy growth curves (Nielson and Bowering 1989)growth curves (Nielson and Bowering 1989)
• FF0.10.1 = 0.06 for F= 0.06 for FMSYMSY
•• 60% of F60% of F0.10.1 = 0.04 for = 0.04 for FFtargettarget
•• BBMSYMSY = 5,400 = 5,400 mtmt for for BBtargettarget
•• ½½ BBMSYMSY = 2,700 = 2,700 mtmt for for BBthresholdthreshold

Figure S2. Trends in swept-area biomass indices (mt) of Atlantic halibut from NEFSC autumn bottom trawl surveys.
Year
1965 1970 1975 1980 1985 1990 1995 2000 2005
Bio
mas
s (m
t)
0
500
1000
1500
2000
2500
3000
3500
4000
4500
5000
5500
6000
5-Year Average Swept-Area Biomass
1/2 BMSY = 2700 mt
BMSY = 5400 mt

IndexIndex--Based Reference Point DeterminationBased Reference Point Determination
Methods for Revised Reference PointsMethods for Revised Reference Points•• Updated YPR and BPR analyses:Updated YPR and BPR analyses:•• NEFSC survey data to estimate lengthNEFSC survey data to estimate length--weight parametersweight parameters
• Sigourney (2002) aged halibut from NEFSC surveys and halibutSigourney (2002) aged halibut from NEFSC surveys and halibutexperimental experimental longlinelongline fisheryfishery
•• von von BertalanffyBertalanffy growth equation applied to lengthgrowth equation applied to length--weight equationweight equationto determine weightto determine weight--atat--ageage
•• Percent maturity at age (Sigourney et al. 2006)Percent maturity at age (Sigourney et al. 2006)

Atlantic Halibut Female LengthAtlantic Halibut Female Length--WeightWeight
GOM Mean Spring/FallA = 0.003917567B = 3.246485W = ALB
1992-2005Length (cm) Weight (kg)21.7 0.0938.0 0.5353.3 1.5867.5 3.4080.7 6.0793.0 9.64
104.5 14.08115.3 19.33125.3 25.32134.6 31.97143.3 39.18151.4 46.84158.9 54.87166.0 63.17172.6 71.66178.7 80.25184.4 88.89189.7 97.50194.7 106.03199.3 114.44203.7 122.68207.7 130.73211.4 138.56214.9 146.14218.2 153.47221.2 160.53224.1 167.31226.7 173.81229.2 180.02231.5 185.95
Length (cm)0 50 100 150 200 250
Wei
ght (
kg)
0
25
50
75
100
125
150
175
200NEFSC SurveyMcCracken (1958)
McCracken (1958)W = 0.0000117*L3.15

Atlantic Halibut Female Length at AgeAtlantic Halibut Female Length at Age
Pooled Data FemalesHalibut Growth Rates
AgeMean Length
(cm) LowerCI UpperCI0 -5.0 0.9 -18.71 13.1 11.4 11.42 30.0 21.4 38.83 45.8 30.9 63.74 60.5 40.0 86.35 74.2 48.6 106.96 87.0 56.7 125.77 98.9 64.5 142.78 110.0 71.9 158.29 120.3 78.9 172.3
10 130.0 85.5 185.111 139.0 91.9 196.712 147.4 97.9 207.313 155.2 103.6 217.014 162.5 109.0 225.715 169.3 114.2 233.716 175.7 119.1 240.917 181.6 123.7 247.518 187.1 128.2 253.519 192.3 132.4 258.920 197.1 136.4 263.921 201.5 140.2 268.422 205.7 143.8 272.523 209.6 147.2 276.224 213.2 150.5 279.625 216.6 153.6 282.7
von BertalanffyL(t) = Linf(1 - exp(-K(t-t0)))
Linf t0 K r2
Mean 263.2 0.27 0.07 0.878LCI 212.8 -0.08 0.051UCI 313.6 0.61 0.095
Age (years)
0 5 10 15 20 25
Leng
th (c
m)
0
50
100
150
200
250
300Sigourney (2002)Nielson and Bowering (1987)
Nielson and Bowering (1989)L(t)= 201.5(1-e-0.0852026(t-0.640041))

Atlantic Halibut Female Weight at AgeAtlantic Halibut Female Weight at AgeAge Length (cm) Weight (kg)
0 -5.0 0.0001 13.1 0.0172 30.0 0.2453 45.8 0.9654 60.5 2.3835 74.2 4.6246 87.0 7.7467 98.9 11.7528 110.0 16.6059 120.3 22.239
10 130.0 28.57311 139.0 35.51312 147.4 42.96013 155.2 50.81914 162.5 58.99415 169.3 67.39716 175.7 75.94717 181.6 84.56918 187.1 93.19719 192.3 101.77420 197.1 110.25021 201.5 118.58122 205.7 126.73223 209.6 134.67424 213.2 142.38325 216.6 149.84126 219.7 157.03527 222.7 163.95528 225.4 170.59429 228.0 176.94930 230.4 183.021
Age0 5 10 15 20 25 30
Wei
ght (
kg)
0
25
50
75
100
125
150
175
200
Proposed Weight at Age1998 YPR Weight at Age

Atlantic Halibut Female Maturity CurveAtlantic Halibut Female Maturity Curve
AgeProportion
Mature0 0.021 0.042 0.063 0.104 0.155 0.236 0.347 0.468 0.599 0.71
10 0.8011 0.8712 0.9213 0.9514 0.9715 0.9816 0.9917 0.9918 1.0019 1.0020 1.0021 1.0022 1.0023 1.0024 1.0025 1.0026 1.0027 1.0028 1.0029 1.0030 1.00
Age (years)0 2 4 6 8 10 12 14 16 18
Prop
ortio
n M
atur
e
0.0
0.2
0.4
0.6
0.8
1.0
Females S(a) = 1/(1+exp(-α-β*a))SR = A75-A25 = (2 ln3)/β L50 = -α/β
A75-A25= 4.24 α = -β*L50= -3.778β = (2 ln3)/SR= 0.518

Atlantic Halibut YPR AnalysisAtlantic Halibut YPR Analysis
Revised Reference PointsRevised Reference Points
• FF0.10.1 = 0.04 for F= 0.04 for FMSYMSY
•• 60% of F60% of F0.10.1 = 0.024 for = 0.024 for FFtargettarget
•• BBMSYMSY = 6,400 = 6,400 mtmt for for BBtargettarget
•• ½½ BBMSYMSY = 3,200 = 3,200 mtmt for for BBthresholdthreshold
Age
Selectivity on Fishing Mortality
Natural Mortality
RateFraction Mature
Mean Weight
(kg)0 0 0.06 0.01 0.001 0 0.06 0.04 0.022 0 0.06 0.06 0.253 0 0.06 0.10 0.964 1 0.06 0.15 2.385 1 0.06 0.23 4.626 1 0.06 0.34 7.757 1 0.06 0.46 11.758 1 0.06 0.59 16.609 1 0.06 0.71 22.24
10 1 0.06 0.80 28.5711 1 0.06 0.87 35.5112 1 0.06 0.92 42.9613 1 0.06 0.95 50.8214 1 0.06 0.97 58.9915 1 0.06 0.98 67.4016 1 0.06 0.99 75.9517 1 0.06 0.99 84.5718 1 0.06 1.00 93.2019 1 0.06 1.00 101.7720 1 0.06 1.00 110.2521 1 0.06 1.00 118.5822 1 0.06 1.00 126.7323 1 0.06 1.00 134.6724 1 0.06 1.00 142.3825 1 0.06 1.00 149.8426 1 0.06 1.00 157.0427 1 0.06 1.00 163.9528 1 0.06 1.00 170.5929 1 0.06 1.00 176.95
30-50 1 0.06 1.00 183.02
F0.0 0.1 0.2 0.3 0.4 0.5
Yiel
d pe
r Rec
ruit
(mt)
0
2
4
6
8
10
12
14
16
18
20
Biomass per R
ecruit (mt)
0
200
400
600
800
1000
YPRSSB/R

Year
1965 1970 1975 1980 1985 1990 1995 2000 2005
Bio
mas
s (m
t)
0
1000
2000
3000
4000
5000
6000
7000
5-Year Average Swept-Area Biomass
1/2 BMSY = 2700 mt
BMSY = 5400 mt
Proposed 1/2 BMSY = 3200 mt
Proposed BMSY = 6400 mt
IndexIndex--Based Reference PointsBased Reference Points

Atlantic Halibut Exploitation IndexAtlantic Halibut Exploitation Index
Year
1965 1970 1975 1980 1985 1990 1995 2000 2005
Cat
ch a
nd S
wep
t-Are
a B
iom
ass
(mt)
0
100
200
300
400
500
600
700
Exp
loita
tion
Inde
x
0
1
2
3
4
5
Exploitation Index5-Year Average Swept-Area Biomass
Total Catch

Replacement Yield ModelReplacement Yield Model
Methods for Replacement Yield ModelMethods for Replacement Yield Model•• Assumed a linear increase in catches from 1800Assumed a linear increase in catches from 1800--18931893
•• Biomass is estimated as:Biomass is estimated as:•• BByy = B= B yy--1 1 + R+ R yy--1 1 –– CCyy--11
• Replacement yield is estimated as:Replacement yield is estimated as:•• RRyy = = rBrByy (1(1-- BByy /K)/K)
•• Annual growth of the population as a function of how far biomasAnnual growth of the population as a function of how far biomasssis from the carrying capacityis from the carrying capacity
•• Biomass in the first year was set to KBiomass in the first year was set to K
Year1800 1825 1850 1875 1900 1925 1950 1975 2000
Tota
l Cat
ch (m
t)
0
1000
2000
3000
4000
5000
6000

Replacement Yield ModelReplacement Yield Model
Likelihood FunctionLikelihood Function•• Model was fitted to the 5Model was fitted to the 5--year moving average of the NEFSC surveyyear moving average of the NEFSC surveysweptswept--area biomass indexarea biomass index
•• Likelihood function:Likelihood function:•• --lnlnLL = log (= log (δδ) + 0.5) + 0.5∑∑(ln(I(ln(Iyy))--ln(Bln(Byyq))q)) 22//δδ22 + p+ p11 + p+ p22
Includes:Includes:•• Survey residualsSurvey residuals•• Constant standard deviation (Constant standard deviation (δδ = 0.6)= 0.6)•• Penalty for biomass going to the minimum boundary in a given yePenalty for biomass going to the minimum boundary in a given yearar•• Penalty for the difference between the modelPenalty for the difference between the model--estimated q and the estimated q and the
assumption that the NEFSC autumn survey q is roughly 0.5assumption that the NEFSC autumn survey q is roughly 0.5

Replacement Yield Model SimulationsReplacement Yield Model Simulations
Case 1 Case 2 Case 3K 50000 50000 50000r 0.353807079975544 0.353807079975545 0.353807079975546
-ln L 19201.398 141.895 198.056
Case 4 Case 5 Case 6 Case 7 Case 8 Case 9K 90000 90000 90000 90000 90000 90000r 0.16307849140 0.16307849145 0.16307849150 0.16307849155 0.16307849160 0.16307860000
-ln L 805.999 23.482 22.557 25.079 28.249 65.574
Case 10 Case 11 Case 12 Case 13 Case 14 Case 15 Case 16K 100000 100000 100000 100000 100000 100000 100000r 0.139766823 0.139766824 0.139766825 0.139766826 0.139766827 0.139766828 0.13977
-ln L 2888.269 34.087 22.373 29.172 35.703 41.399 16.912
Case 17 Case 18 Case 19 Case 20 Case 21 Case 22K 150000 150000 150000 150000 150000 150000r 0.0708170 0.0708175 0.0708180 0.0708185 0.0708190 0.0720000
-ln L 862.258 15.744 15.858 18.157 20.515 8.797
Case 23 Case 24 Case 25 Case 26 Case 27 Case 28K 200000 200000 200000 200000 200000 200000r 0.0368 0.0369 0.037 0.0371 0.0372 0.045
-ln L 168917325.973 13.800 15.152 16.674 17.078 8.782
Case 29 Case 30 Case 31 Case 32 Case 33 Case 34 Case 35K 300000 300000 300000 300000 300000 300000 300000r 0.003 0.004 0.005 0.006 0.007 0.008 0.030
-ln L 18555487.020 12.982 9.242 8.935 8.948 9.029 8.593

Biomass from Replacement Yield Model RunsBiomass from Replacement Yield Model Runs
Year
1800 1820 1840 1860 1880 1900 1920 1940 1960 1980 2000
Biom
ass
(mt)
0
50000
100000
150000
200000
250000
300000
1/2 BMSY (Case 32)= 75,000 mt
BMSY (Case 32) = 150,000 mt
CatchCase 23 Case 24 Case 25 Case 26 Case 27 Case 28 Case 29 Case 30 Case 31 Case 32 Case 33 Case 34 Case 35

Biomass from Replacement Yield Model RunsBiomass from Replacement Yield Model Runs
Year
1800 1820 1840 1860 1880 1900 1920 1940 1960 1980 2000
Bio
mas
s (m
t)
0
10000
20000
30000
40000
50000CatchCase 2Case 6Case 12Case 18Case 24Case 32

Replacement Yield from Case 32Replacement Yield from Case 32
Year
1800 1820 1840 1860 1880 1900 1920 1940 1960 1980 2000
Rep
lace
men
t Yie
ld (m
t)
0
100
200
300
400
500

Relative F from Case 32Relative F from Case 32
Year
1800 1820 1840 1860 1880 1900 1920 1940 1960 1980 2000
Rel
ative
F (C
atch
/Bio
mas
s)
0.00
0.02
0.04
0.06
0.08
0.10
0.12
0.14
FMSY = 0.003

Reference Point DeterminationReference Point Determination
Previous Index-Based Reference Points:Threshold Target Current Estimate % Threshold
Fishing mortality 0.06 0.04 none n/aStock biomass 2,700 mt 5,400 mt 252 mt 9%
Revised Index-Based Reference Points:Threshold Target Current Estimate % Threshold
Fishing mortality 0.04 0.02 none n/aStock biomass 3,200 mt 6,400 mt 252 mt 8%
Replacement Yield Model Reference Points:Threshold Target Current Estimate % Threshold
Fishing mortality 0.003 n/a 0.0022 75%Stock biomass 75,000 mt 150,000 mt 21,200 mt 28%

Atlantic Halibut Model ComparisonAtlantic Halibut Model Comparison
IndexIndex--Based Assessment StrengthsBased Assessment Strengths•• Previously accepted method Previously accepted method •• Often used in data poor situationsOften used in data poor situations•• Updated reference pointsUpdated reference points
IndexIndex--Based Assessment WeaknessesBased Assessment Weaknesses•• Started 100 years after fishery collapsedStarted 100 years after fishery collapsed•• Below Below detectabilitydetectability levels?levels?•• Little contrast/trend/trackingLittle contrast/trend/tracking•• No conversion factors (door, net, or vessel)No conversion factors (door, net, or vessel)•• No F, No F, overfishingoverfishing status status •• No conversion factors for No conversion factors for FRV Henry BigelowFRV Henry Bigelow
•• Current index end after 2008Current index end after 2008
Atlantic Halibut Model ComparisonAtlantic Halibut Model Comparison
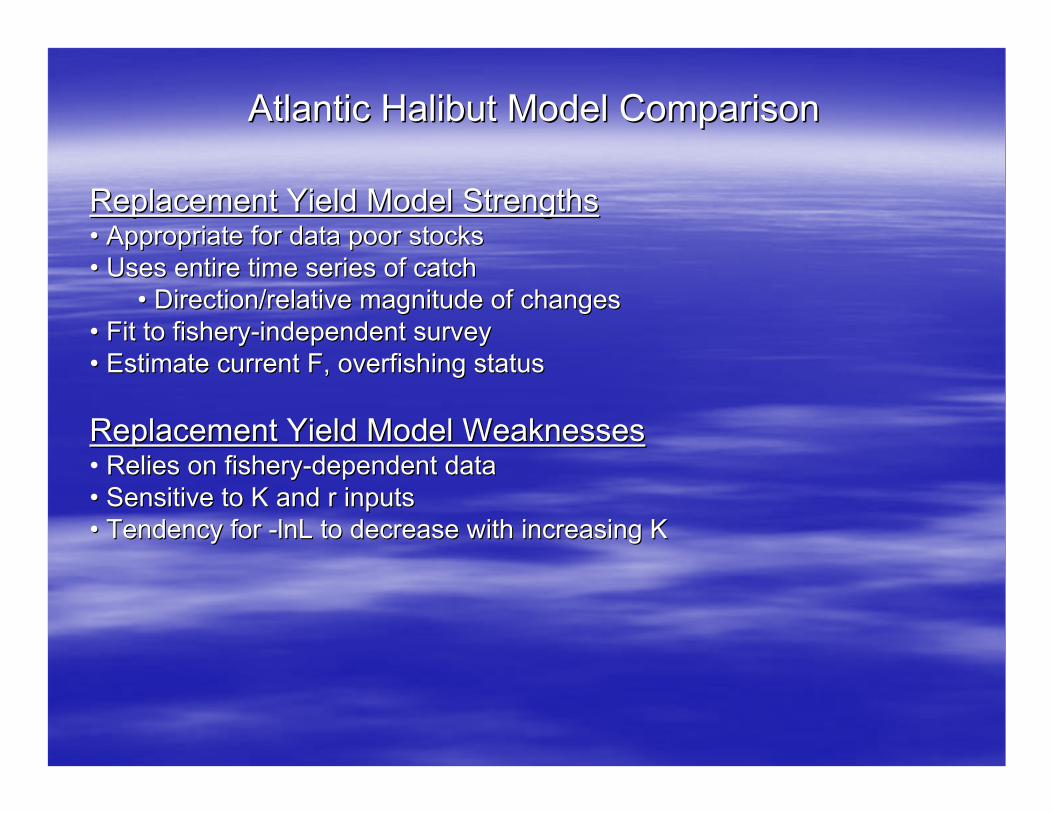
Replacement Yield Model StrengthsReplacement Yield Model Strengths•• Appropriate for data poor stocksAppropriate for data poor stocks•• Uses entire time series of catchUses entire time series of catch
•• Direction/relative magnitude of changesDirection/relative magnitude of changes•• Fit to fisheryFit to fishery--independent surveyindependent survey•• Estimate current F, Estimate current F, overfishingoverfishing statusstatus
Replacement Yield Model WeaknessesReplacement Yield Model Weaknesses• Relies on fisheryRelies on fishery--dependent datadependent data•• Sensitive to K and r inputsSensitive to K and r inputs•• Tendency for Tendency for --lnLlnL to decrease with increasing Kto decrease with increasing K

Atlantic Halibut Minimum Size LimitAtlantic Halibut Minimum Size Limit
• Sigourney (2006) estimated female L50 ~ 103 cm
Discarded halibut Kept halibut
YearMean Length
(cm) Std Err NMin. Length
(cm) YearMean Length
(cm) Std Err NMin. Length
(cm)1992 33.0 . 1 33 1990 46.6 2.0012 6 421993 31.3 13.3458 3 17 1991 92.0 . 1 921994 42.4 5.1049 5 24 1992 67.1 5.2457 11 291995 27.2 5.4858 6 18 1993 62.8 5.5333 10 421997 36.3 2.1858 3 32 1994 73.3 5.0781 16 461999 62.0 . 1 62 1995 79.6 4.6356 29 422000 57.0 4.0778 13 18 1996 69.2 10.027 5 502001 67.5 2.9518 13 48 1997 67.5 11.3893 6 442002 70.2 4.7648 13 38 2001 118.0 6 2 1122003 64.0 1.6363 91 31 2002 88.0 9.0738 6 522004 57.1 1.3502 87 26 2003 81.0 5.349 29 412005 60.4 1.3042 160 33 2004 83.9 3.9709 33 432006 63.0 1.495 107 38 2005 76.4 2.5691 80 402007 64.3 1.9969 75 24 2006 84.9 3.5611 37 50
2007 90.5 4.225 33 49Note: 1999-2007 average observed minimum size for kept halibut = 55cmMinimum size regulation from 1999 to present = 91cm

20002000--2004 Experimental Halibut Fishery2004 Experimental Halibut Fishery
• Release area in greenRelease area in green•• Black dots represent recapture locationsBlack dots represent recapture locations
• Kanwit (2007)• 1,611 retained halibut• 825 tagged and released825 tagged and released•• 92 recaptured92 recaptured•• 28%28% of recaptures inof recaptures inCanadian watersCanadian waters
•• Mean distance traveled =Mean distance traveled =151 km (1,758 km max)151 km (1,758 km max)
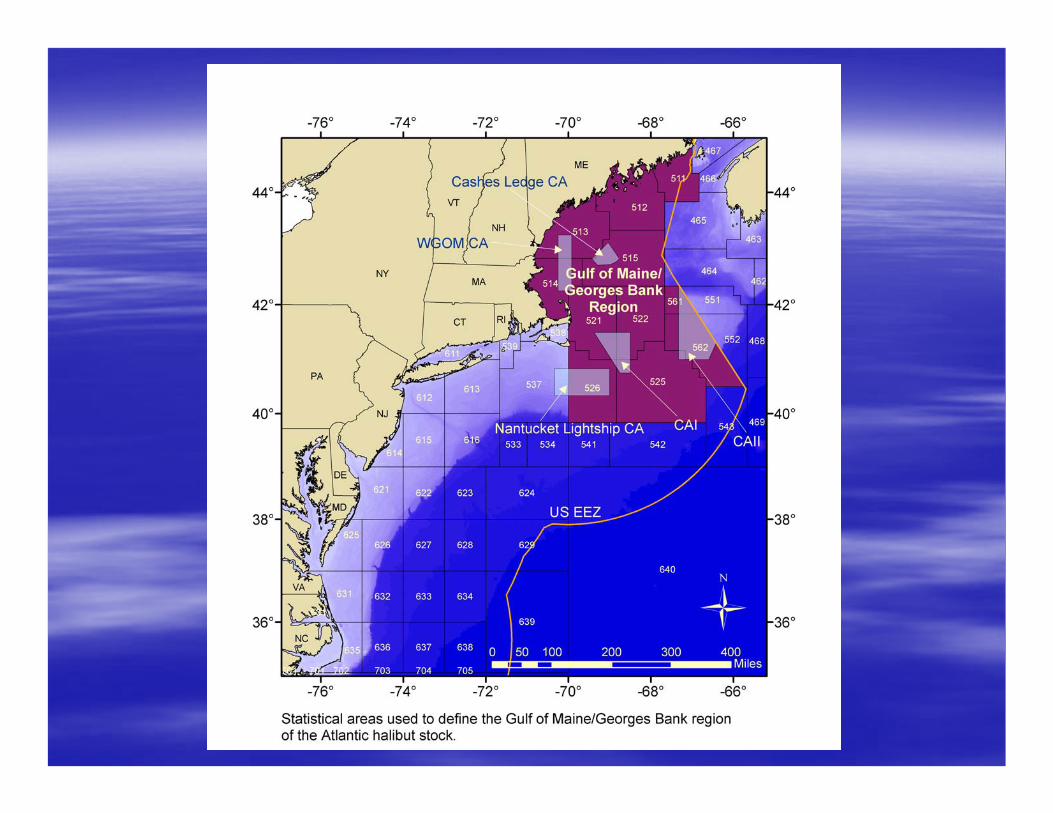
•• TransboundaryTransboundary movementmovement•• Stock area should beStock area should bereconsideredreconsidered


IndexIndex--Based Reference Point DeterminationBased Reference Point Determination
Methods for Revised Reference PointsMethods for Revised Reference Points•• Updated YPR and BPR analyses Updated YPR and BPR analyses •• Performed bootstrap analyses of NEFSC spring and autumn dataPerformed bootstrap analyses of NEFSC spring and autumn data
•• Estimated parameters for lengthEstimated parameters for length--weight equation:weight equation:•• W= W= ααLLββ
• Sigourney (2002) aged halibut from NEFSC surveys and halibutSigourney (2002) aged halibut from NEFSC surveys and halibutexperimental experimental longlinelongline fisheryfishery
•• Von Von BertalanffyBertalanffy ageage--length key (females only) applied to length key (females only) applied to lengthlength--weight equation to get weightweight equation to get weight--atat--age for YPRage for YPR
•• Percent maturity at age (Sigourney et al. 2006) used to calculaPercent maturity at age (Sigourney et al. 2006) used to calculatetematurity maturity ogiveogive::
•• S(aS(a) = (1+e() = (1+e(--αα --ββa))^a))^--11Where: a is ageWhere: a is ageββ is assumed to be equal to (2ln3)/(L75is assumed to be equal to (2ln3)/(L75--L25), estimated to be 0.518L25), estimated to be 0.518αα is assumed to be equal to is assumed to be equal to --ββLL5050, estimated to be , estimated to be --3.7783.778

IndexIndex--Based Reference Point DeterminationBased Reference Point Determination
Methods for Revised Reference Points (cont.)Methods for Revised Reference Points (cont.)•• Weight at age and maturity at age used plus group at age 30Weight at age and maturity at age used plus group at age 30
•• maximum age 50 years maximum age 50 years •• --ln(0.05)/max age used as proxy for M ~ 0.06ln(0.05)/max age used as proxy for M ~ 0.06•• assumed knife edge selectivity at age 4assumed knife edge selectivity at age 4•• Assumed MSY = 300 Assumed MSY = 300 mtmt
Revised Reference PointsRevised Reference Points• FF0.10.1 = 0.04 as proxy for FMSY= 0.04 as proxy for FMSY
•• 60% of F60% of F0.10.1 = 0.024 for = 0.024 for FFtargettarget
•• BBtargettarget = 6,400 = 6,400 mtmt as proxy for BMSYas proxy for BMSY
•• ½½ BMSY proxy = 3,200 BMSY proxy = 3,200 mtmt for for BBthresholdthreshold

Atlantic Halibut Discards from Observer DatabaseAtlantic Halibut Discards from Observer Database
YEAR COMNAME NESPP4 DISP_DESC LIVE_WT(lbs) OBS_HAULS1989 HALIBUT, ATLANTIC 1595 DISCARD 162 251990 HALIBUT, ATLANTIC 1595 DISCARD 244 221991 HALIBUT, ATLANTIC 1595 DISCARD 518 481992 HALIBUT, ATLANTIC 1595 DISCARD 144 171993 HALIBUT, ATLANTIC 1595 DISCARD 120 111994 HALIBUT, ATLANTIC 1595 DISCARD 44 81995 HALIBUT, ATLANTIC 1595 DISCARD 136.6 121996 HALIBUT, ATLANTIC 1595 DISCARD 22 41997 HALIBUT, ATLANTIC 1595 DISCARD 44 111998 HALIBUT, ATLANTIC 1595 DISCARD 6 11999 HALIBUT, ATLANTIC 1595 DISCARD 1027 42000 HALIBUT, ATLANTIC 1595 DISCARD 443 302001 HALIBUT, ATLANTIC 1595 DISCARD 430 222002 HALIBUT, ATLANTIC 1595 DISCARD 1577 442003 HALIBUT, ATLANTIC 1595 DISCARD 2604.8 1232004 HALIBUT, ATLANTIC 1595 DISCARD 3722.6 1822005 HALIBUT, ATLANTIC 1595 DISCARD 10084 5332006 HALIBUT, ATLANTIC 1595 DISCARD 5037 2432007 HALIBUT, ATLANTIC 1595 DISCARD 3952.8 1922008 HALIBUT, ATLANTIC 1595 DISCARD 151.2 19

Kept Atlantic Halibut from Observer DatabaseKept Atlantic Halibut from Observer Database
YEAR COMNAME NESPP4 DISP_DESC LIVE_WT(lbs) OBS_HAULS1989 HALIBUT, ATLANTIC 1595 KEPT 692 161990 HALIBUT, ATLANTIC 1595 KEPT 694 421991 HALIBUT, ATLANTIC 1595 KEPT 2892 1241992 HALIBUT, ATLANTIC 1595 KEPT 3360 1101993 HALIBUT, ATLANTIC 1595 KEPT 1596 581994 HALIBUT, ATLANTIC 1595 KEPT 2375.5 671995 HALIBUT, ATLANTIC 1595 KEPT 2226 481996 HALIBUT, ATLANTIC 1595 KEPT 356 241997 HALIBUT, ATLANTIC 1595 KEPT 1059.4 441998 HALIBUT, ATLANTIC 1595 KEPT 32 31999 HALIBUT, ATLANTIC 1595 KEPT 196.5 72000 HALIBUT, ATLANTIC 1595 KEPT 362 102001 HALIBUT, ATLANTIC 1595 KEPT 473 62002 HALIBUT, ATLANTIC 1595 KEPT 1249.5 172003 HALIBUT, ATLANTIC 1595 KEPT 3834.4 632004 HALIBUT, ATLANTIC 1595 KEPT 4035 812005 HALIBUT, ATLANTIC 1595 KEPT 12320.1 2372006 HALIBUT, ATLANTIC 1595 KEPT 8345.8 1032007 HALIBUT, ATLANTIC 1595 KEPT 5749.9 1162008 HALIBUT, ATLANTIC 1595 KEPT 149.85 9

Discard Reasons for Atlantic HalibutDiscard Reasons for Atlantic HalibutREASON 1989 1990 1991 1992 1993 1994 1995 1996 1997 1998 1999 2000 2001 2002 2003 2004 2005 2006 2007DISCARDED GENERAL, UNKNOWN DISCARD REASON 24 21 44 14 10 5 . . . . . . . . . 2 . . 2NO MARKET, BUT RETAINED FOR OBSERVER FOR SCIENTIFIC PURPOSES . . . . . . . . . . . . . . . 2 2 . 1NO MARKET, QUOTA FILLED . . . . . . . . . . . . . . . . . . 1NO MARKET, REASON NOT SPECIFIED. . . . . . . 1 . 3 . 1 9 2 . 19 16 48 13 13NO MARKET, TOO SMALL . . . . . 1 2 2 6 1 . 2 . 1 9 15 10 1 1NOT BROUGHT ON BOARD, FELL OUT/OFF OF GEAR . . . . . . . . . . . . . . . . 1 . .OTHER, DISCARDED . . 3 2 1 1 . . . . 1 . . . . . 1 . .POOR QUALITY, HAGFISH DAMAGE . . . . . . . . . . . . . . . . 1 . .POOR QUALITY, REASON NOT SPECIFIED . 1 1 1 . . . . . . . . . . . 2 . 1 .POOR QUALITY, SANDFLEA DAMAGE . . . . . 1 . . . . . . . . 1 1 3 3 2POOR QUALITY, SHARK DAMAGE . . . . . . . . . . . . . . 3 . 1 . .REGULATIONS PROHIBIT ANY RETENTION. . . . . . . . . . . 1 22 10 28 10 7 9 15 9REGULATIONS PROHIBIT RETENTION, NO QUOTA IN AREA. . . . . . . 5 . . . . . . 1 . 4 . . 1REGULATIONS PROHIBIT RETENTION, QUOTA FILLED. . . . . . . . . . . . 1 3 4 1 6 29 12 15REGULATIONS PROHIBIT RETENTION, REASON NOT SPECIFIED. . . . . . . . . 2 . . 5 2 1 3 6 9 4 .REGULATIONS PROHIBIT RETENTION, TOO SMALL . . . . . . 4 2 . . 1 1 6 8 75 123 419 193 148REGULATIONS PROHIBIT RETENTION, WITH EGGS. . . . . . . . . . . . . . 1 . . . . .RETAINING ONLY CERTAIN SIZE BETTER PRICE TRIP QUOTA IN EFFECT. . . . . . . . . . . . . . . 2 1 1 1 .UPGRADED . . . . . . . . . . . . . . . . 1 1 2

Replacement Yield ModelReplacement Yield Model
Methods for Replacement Yield ModelMethods for Replacement Yield Model•• Assumed a linear increase in catches from 1800Assumed a linear increase in catches from 1800--18931893•• Replacement yield model where estimated biomass is defined as:Replacement yield model where estimated biomass is defined as:
•• BByy = B= B yy--1 1 + R+ R yy--1 1 –– CCyy--11Where:Where:
BByy is the biomass at the start of year yis the biomass at the start of year yBByy--11 is the biomass at the start of the previous yearis the biomass at the start of the previous yearCCyy--11 is the total catch in the previous yearis the total catch in the previous yearRR yy--11 is the replacement yield in the previous yearis the replacement yield in the previous year
• Replacement yield is Replacement yield is definieddefinied as:as:•• RRyy = = rBrByy (1(1-- BByy /K)/K)Where:Where:
r is the intrinsic rate of growthr is the intrinsic rate of growthK is the carrying capacityK is the carrying capacity
•• Biomass in the first year was set to KBiomass in the first year was set to K

Replacement Yield ModelReplacement Yield Model
Likelihood FunctionLikelihood Function•• Model was fitted to the 5Model was fitted to the 5--year moving average of the NEFSCyear moving average of the NEFSCsweptswept--area biomass indexarea biomass index
•• Likelihood function:Likelihood function:•• --lnlnLL = log (= log (δδ) + 0.5) + 0.5∑∑(ln(I(ln(Iyy))--ln(Bln(Byyq))q)) 22//δδ22 + p+ p11 + p+ p22
Where:Where:δδ is a constantis a constantIIyy is the sweptis the swept--area biomass index in year yarea biomass index in year yq is the q is the catchabilitycatchability of the NEFSC fall survey: exponent of the average ofof the NEFSC fall survey: exponent of the average of
ln(Iln(Iyy))--ln(Bln(Byy))pp11 is the sum of the penalties for biomass going to the defined miis the sum of the penalties for biomass going to the defined minimumnimum
boundary in a given yearboundary in a given yearpp22 is a penalty for the difference between the modelis a penalty for the difference between the model--estimated q and the estimated q and the
assumption that the NEFSC autumn survey q is roughly 0.5assumption that the NEFSC autumn survey q is roughly 0.5

Reference Point DeterminationReference Point DeterminationPrevious Index-Based Reference Points:
Threshold Target Current Estimate % ThresholdFishing mortality 0.06 0.04 none n/aStock biomass 2,700 mt 5,400 mt 252 mt 9%
Revised Index-Based Reference Points:Threshold Target Current Estimate % Threshold
Fishing mortality 0.04 0.02 none n/aStock biomass 3,200 mt 6,400 mt 252 mt 8%
Replacement Yield Model (Case 32) Reference Points:Threshold Target Current Estimate % Threshold
Fishing mortality 0.003 n/a 0.0022 75%Stock biomass 75,000 mt 150,000 mt 21,200 mt 28%
Replacement Yield Model (Case 24) Reference Points:Threshold Target Current Estimate % Threshold
Fishing mortality 0.018 n/a 0.024 128%Stock biomass 50,000 mt 100,000 mt 2,009 mt 4%

Residuals for Case 32Residuals for Case 32
Year
1965 1970 1975 1980 1985 1990 1995 2000 2005
Res
idua
ls (z
-sco
re)
-3
-2
-1
0
1
2

Residuals for Case 24Residuals for Case 24
Year
1965 1970 1975 1980 1985 1990 1995 2000 2005
Res
idua
ls (z
-sco
re)
-3
-2
-1
0
1
2
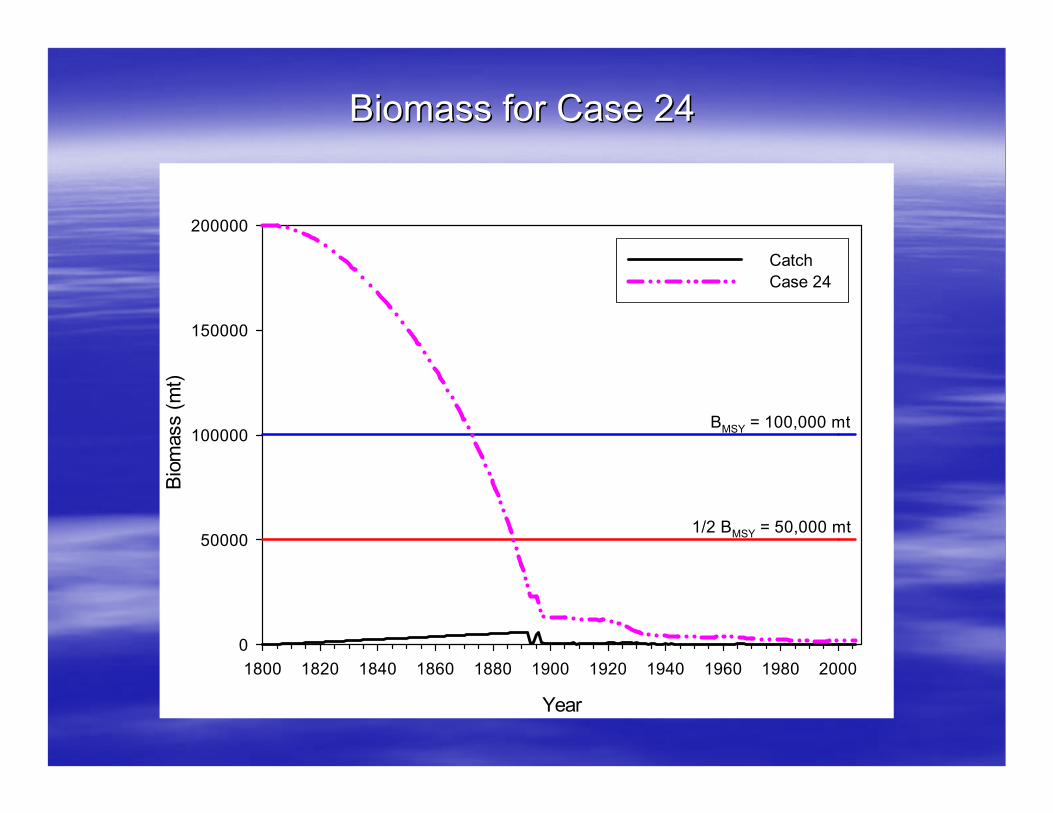
Biomass for Case 24Biomass for Case 24
Year
1800 1820 1840 1860 1880 1900 1920 1940 1960 1980 2000
Biom
ass
(mt)
0
50000
100000
150000
200000
1/2 BMSY = 50,000 mt
BMSY = 100,000 mt
CatchCase 24
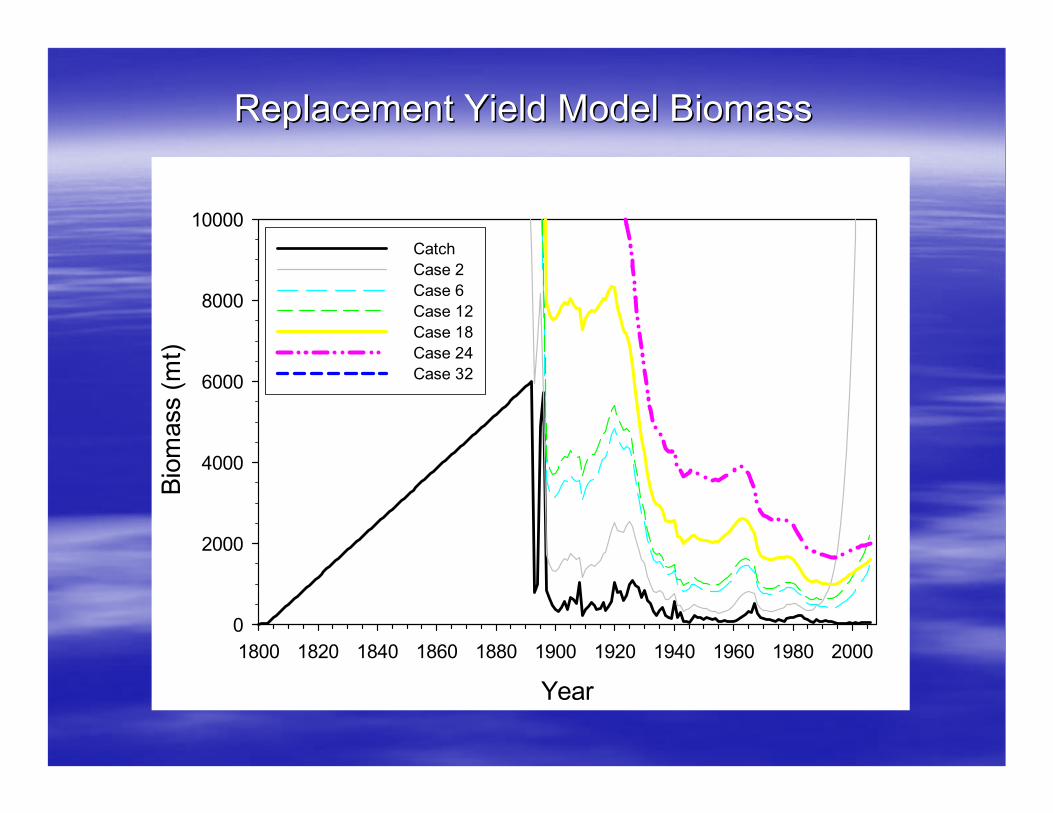
Replacement Yield Model BiomassReplacement Yield Model Biomass
Year1800 1820 1840 1860 1880 1900 1920 1940 1960 1980 2000
Biom
ass
(mt)
0
2000
4000
6000
8000
10000CatchCase 2Case 6Case 12Case 18Case 24Case 32

Replacement Yield Case 24Replacement Yield Case 24
Year1800 1820 1840 1860 1880 1900 1920 1940 1960 1980 2000
Rep
lace
men
t Yie
ld (m
t)
0
500
1000
1500
2000

Fishing Mortality Case 24Fishing Mortality Case 24
Year
1800 1820 1840 1860 1880 1900 1920 1940 1960 1980 2000
Rel
ative
F (C
atch
/Bio
mas
s)
0.00
0.05
0.10
0.15
0.20
0.25
0.30
0.35
FMSY = 0.018

Replacement Yield Model SimulationsReplacement Yield Model Simulations Case 1 Case 2 Case 3
K 50000 50000 50000r 0.353807079975544 0.353807079975545 0.353807079975546
B2006 as % of K 0.0% 55.4% 87.5%-ln L 19201.398 141.895 198.056
q 128.790 0.306 0.182sigma 0.6 0.6 0.6penalty 17508.2800 0.0376 0.1010Fmsy 0.1769 0.1769 0.1769
1/2 Bmsy 12500 12500 12500F2006/Fmsy 26907.4651 0.0097 0.0062
B2006/(1/2 Bmsy) 8.0000E-07 2.2177 3.4983
Case 4 Case 5 Case 6 Case 7 Case 8 Case 9K 90000 90000 90000 90000 90000 90000r 0.16307849140 0.16307849145 0.16307849150 0.16307849155 0.16307849160 0.16307860000
B2006 as % of K 0.0% 0.7% 1.6% 2.5% 3.4% 96.8%-ln L 805.999 23.482 22.557 25.079 28.249 65.574
q 2.089 0.547 0.439 0.380 0.341 0.011sigma 0.6 0.6 0.6 0.6 0.6 0.6penalty 202.5252 0.0022 0.0037 0.0143 0.0252 0.2392Fmsy 0.0815 0.0815 0.0815 0.0815 0.0815 0.0815
1/2 Bmsy 22500 22500 22500 22500 22500 22500F2006/Fmsy 58377.1139 0.9201 0.4010 0.2579 0.1908 0.0067
B2006/(1/2 Bmsy) 4.4444E-07 0.0282 0.0647 0.1006 0.1360 3.8731
Case 10 Case 11 Case 12 Case 13 Case 14 Case 15 Case 16K 100000 100000 100000 100000 100000 100000 100000r 0.139766823 0.139766824 0.139766825 0.139766826 0.139766827 0.139766828 0.13977
B2006 as % of K 0.0% 0.2% 2.2% 4.2% 6.1% 7.9% 98.8%-ln L 2888.269 34.087 22.373 29.172 35.703 41.399 16.912
q 22.308 0.615 0.335 0.260 0.219 0.191 0.005sigma 0.6 0.6 0.6 0.6 0.6 0.6 0.6penalty 1225.5960 0.0132 0.0272 0.0577 0.0792 0.0953 0.2451Fmsy 0.0699 0.0699 0.0699 0.0699 0.0699 0.0699 0.0699
1/2 Bmsy 25000 25000 25000 25000 25000 25000 25000F2006/Fmsy 68113.8160 3.7613 0.3085 0.1636 0.1126 0.0865 0.0069
B2006/(1/2 Bmsy) 4.0000E-07 0.0072 0.0883 0.1665 0.2420 0.3149 3.9524
Case 17 Case 18 Case 19 Case 20 Case 21 Case 22K 150000 150000 150000 150000 150000 150000r 0.0708170 0.0708175 0.0708180 0.0708185 0.0708190 0.0720000
B2006 as % of K 0.0% 1.1% 2.2% 3.3% 4.4% 96.9%-ln L 862.258 15.744 15.858 18.157 20.515 8.797
q 1.389 0.231 0.164 0.130 0.110 0.003sigma 0.6 0.6 0.6 0.6 0.6 0.6penalty 200.7897 0.0726 0.1130 0.1365 0.1524 0.2474Fmsy 0.0354 0.0354 0.0354 0.0354 0.0354 0.0360
1/2 Bmsy 37500 37500 37500 37500 37500 37500F2006/Fmsy 134431.7278 0.8406 0.4040 0.2679 0.2015 0.0091
B2006/(1/2 Bmsy) 2.6667E-07 0.0426 0.0887 0.1338 0.1779 3.8764
Case 23 Case 24 Case 25 Case 26 Case 27 Case 28K 200000 200000 200000 200000 200000 200000r 0.0368 0.0369 0.037 0.0371 0.0372 0.045
B2006 as % of K 0.0% 1.0% 7.8% 13.8% 19.0% 93.2%-ln L 168917325.973 13.800 15.152 16.674 17.078 8.782
q 12997.220 0.149 0.036 0.022 0.016 0.002sigma 0.60 0.60 0.60 0.60 0.60 0.60penalty 168916733.9256 0.1234 0.2150 0.2288 0.2346 0.2480Fmsy 0.0184 0.0185 0.0185 0.0186 0.0186 0.0225
1/2 Bmsy 50000 50000 50000 50000 50000 50000F2006/Fmsy 258697.0562 1.2845 0.1659 0.0931 0.0667 0.0113
B2006/(1/2 Bmsy) 2.0000E-07 2.0000E-07 0.3101 0.5511 0.7675 3.7295
Case 29 Case 30 Case 31 Case 32 Case 33 Case 34 Case 35K 300000 300000 300000 300000 300000 300000 300000r 0.003 0.004 0.005 0.006 0.007 0.008 0.030
B2006 as % of K 0.0% 1.1% 3.9% 7.1% 10.7% 14.8% 92.3%-ln L 18555487.020 12.982 9.242 8.935 8.948 9.029 8.593
q 4307.755 0.071 0.027 0.016 0.011 0.008 0.001sigma 0.6 0.6 0.6 0.6 0.6 0.6 0.6penalty 18554249.0505 0.1841 0.2236 0.2342 0.2391 0.2418 0.2487Fmsy 0.0015 0.0020 0.0025 0.0030 0.0035 0.0040 0.0150
1/2 Bmsy 75000 75000 75000 75000 75000 75000 75000F2006/Fmsy 3173350.5555 7.1393 1.6432 0.7478 0.4222 0.2673 0.0115
B2006/(1/2 Bmsy) 1.3333E-07 0.0444 0.1545 0.2829 0.4295 0.5936 3.6913


Atlantic Halibut Current Status and ManagementAtlantic Halibut Current Status and Management
Current StatusCurrent Status• NEFSC: NEFSC: Overfished, Overfishing can not be determinedOverfished, Overfishing can not be determined
•• NOAA: NOAA: Species of ConcernSpecies of Concern
•• American Fisheries Society: American Fisheries Society: ThreatenedThreatened
•• IUCN: IUCN: EndangeredEndangered (due to overfishing)(due to overfishing)
ManagementManagement•• Northeast Multispecies Fishery Management Plan (Amendment 9) 1Northeast Multispecies Fishery Management Plan (Amendment 9) 1999999
•• 1 fish halibut possession limit1 fish halibut possession limit per trip for commercial and per trip for commercial and recreational vesselsrecreational vessels
•• Minimum size of 36 inchesMinimum size of 36 inches (91 cm)(91 cm)

20002000--2004 Experimental Halibut Fishery2004 Experimental Halibut Fishery
Maine DMR and Maine Sea GrantMaine DMR and Maine Sea Grant• Tagged 825 halibut in coastal Maine watersTagged 825 halibut in coastal Maine waters
•• 1,611 fish retained, 1,611 fish retained, otolithsotoliths and gonad samples takenand gonad samples taken
•• 92 recaptured as of Dec. 31, 2005 (11% return rate)92 recaptured as of Dec. 31, 2005 (11% return rate)
•• 28% of recaptures in Canadian waters28% of recaptures in Canadian waters
•• Mean days at large = 431Mean days at large = 431
•• Mean distance traveled = 151 km (1,758 km max)Mean distance traveled = 151 km (1,758 km max)
•• Mean length of tagged halibut = 79 cm (all immature)Mean length of tagged halibut = 79 cm (all immature)

Basic Life History Characteristics for Atlantic HalibutBasic Life History Characteristics for Atlantic Halibut
Sigourney et. al. 2006Sigourney et. al. 2006•• Aged 530 Aged 530 otolithsotoliths from NMFS surveys and Experimental Halibut fisheryfrom NMFS surveys and Experimental Halibut fishery
•• Halibut up to ~40+ years oldHalibut up to ~40+ years old
•• LonglineLongline gear selected fish with faster growth compared to bottom trawlgear selected fish with faster growth compared to bottom trawl
•• A50 = 6.0 years for males, 7.3 years for femalesA50 = 6.0 years for males, 7.3 years for females
•• L50 = 80.2 cm for males, 103.0 cm for femalesL50 = 80.2 cm for males, 103.0 cm for females

Stock Reduction AnalysisStock Reduction Analysis
Kimura and Kimura and TagartTagart, 1982, 1982•• Uses available time series of catch data: Uses available time series of catch data: CCii (catch in year (catch in year ii))
•• For For ii = 1, = 1, ……, , nn catch equations:catch equations:CCii = = BBiiFFii(1 (1 -- exp(exp(-- FFii -- MM))/())/(FFii + + MM))BBii = = BBii--1 1 exp(exp(-- FFii--1 1 -- MM) + ) + RR for for ii>1>1
•• Provide starting estimates for: Provide starting estimates for: BB11 and and MM, solve for , solve for RR
•• Find best estimates of Find best estimates of FFii , , BBii
•• Two equations used for SRA plots:Two equations used for SRA plots:PP = = BBnn+1+1//BB11describes the decline in population biomass caused by describes the decline in population biomass caused by nn years of catchesyears of catches
•• Expected recruitment line (for varying values of Expected recruitment line (for varying values of RR and and BB11):):RR = = BB11(1 (1 –– exp(exp(-- MM))))

Stock Reduction AnalysisStock Reduction Analysis
StrengthsStrengths•• Uses entire catch time seriesUses entire catch time series
•• Does not rely on surveys (little relation to catches and high uDoes not rely on surveys (little relation to catches and high uncertainty)ncertainty)
•• Very simplistic, no age data requiredVery simplistic, no age data required
•• Provide annual estimates of F (possibly use to determine overfiProvide annual estimates of F (possibly use to determine overfishing status)shing status)
•• Immigration or emigration do not violate assumptions of modelImmigration or emigration do not violate assumptions of model•• included in apparent recruitmentincluded in apparent recruitment
•• Plots can be used to verify results in relation to other indicePlots can be used to verify results in relation to other indices/known valuess/known values•• Compare to NMFS survey indices, future inshore Maine halibutCompare to NMFS survey indices, future inshore Maine halibutlonglinelongline surveys etc.surveys etc.

Stock Reduction AnalysisStock Reduction Analysis
WeaknessesWeaknesses•• Not widely used for stock assessmentsNot widely used for stock assessments
•• Current regulations could skew catch in recent yearsCurrent regulations could skew catch in recent years•• Incorporate discards?Incorporate discards?
•• Starting estimates very rough for Starting estimates very rough for BBii, F, F11, , ……, F, Fnn, M, P, M, P
•• MM and and RR are fixed through timeare fixed through time•• RR can be variable in more complex versions of the modelcan be variable in more complex versions of the model
•• Current model assumes virgin biomass for Current model assumes virgin biomass for BBii•• might be possible include might be possible include FF in in initial biomassinitial biomass
•• Are assumptions/problems with this approach worse than the fallAre assumptions/problems with this approach worse than the fall--back?back?•• Any better alternatives?Any better alternatives?

Atlantic halibut NEFSC autumn biomass indices (stratified mean weight per tow) with 1 standard error
Year
1965 1970 1975 1980 1985 1990 1995 2000 2005
Stra
tifie
d M
ean
Wei
ght (
kg) p
er T
ow
-0.2
0.0
0.2
0.4
0.6
0.8
1.0
1.2

Atlantic halibut NEFSC spring biomass indices (stratified mean weight per tow) with 1 standard error
Year
1965 1970 1975 1980 1985 1990 1995 2000 2005
Stra
tifie
d M
ean
Wei
ght (
kg) p
er T
ow
-0.2
0.0
0.2
0.4
0.6
0.8
1.0
1.2
1.4

Figure S3. Atlantic halibut biomass indices (stratified mean weight per tow) from NEFSC spring and autumn surveys.
Year
1965 1970 1975 1980 1985 1990 1995 2000 2005
Stra
tifie
d M
ean
Wei
ght p
er T
ow
0.0
0.1
0.2
0.3
0.4
0.5
0.6
0.7
Spring IndexAutumn Index

Use of Spring v. Autumn Survey IndexUse of Spring v. Autumn Survey Index
Time SeriesTime Series• Autumn survey has longer time seriesAutumn survey has longer time series•• Autumn survey includes relatively high landings during 1963Autumn survey includes relatively high landings during 1963--1967 1967 (highest landings since 1930s)(highest landings since 1930s)
VariabilityVariability•• CVs/SE similar between surveysCVs/SE similar between surveys•• Similar number of years with 0 halibutSimilar number of years with 0 halibut•• Similar number of total halibut caughtSimilar number of total halibut caught
Temperature Correlation in Spring SurveyTemperature Correlation in Spring Survey•• Spring sweptSpring swept--area biomass neg. corr. with spring bottom waterarea biomass neg. corr. with spring bottom watertemperature anomaliestemperature anomalies
•• Water temp. influences spring distributionWater temp. influences spring distribution--Not seen in autumn surveyNot seen in autumn survey

Atlantic Halibut NEFSC Spring and Autumn Survey Indices and Swept-Area Biomass
Year
1965 1970 1975 1980 1985 1990 1995 2000 2005
Stra
tifie
d M
ean
Wei
ght p
er T
ow
0.0
0.1
0.2
0.3
0.4
0.5
0.6
0.7
5-Ye
ar A
vera
ge S
wep
t-Are
a B
iom
ass
(mt)
0
200
400
600
800
1000
1200
1400
Spring IndexAutumn Index

NMFS Fall Survey Halibut in Massachusetts Inshore Strata
Year
1980 1985 1990 1995 2000 2005
Stra
tifie
d M
ean
Wei
ght p
er T
ow (k
g)
0.0
0.2
0.4
0.6
0.8
1.0
1.2
1.4
1.6
1.8
2.0
Sw
ept A
rea
Bio
mas
s (m
t)
0
5
10
15
20
25
30
5-Year Average Swept Area Biomass

NMFS Spring Survey Halibut in Massachusetts Inshore Strata
Year
1980 1985 1990 1995 2000 2005
Stra
tifie
d M
ean
Wei
ght p
er T
ow (k
g)
0.00
0.02
0.04
0.06
0.08
0.10
0.12
0.14
0.16
0.18
Sw
ept A
rea
Bio
mas
s (m
t)
0.0
0.2
0.4
0.6
0.8
1.0
1.2
1.4
1.6
1.8
5-Year Average Swept Area Biomass

NMFS Fall Survey Scotian Shelf Halibut
Year
1965 1970 1975 1980 1985 1990 1995 2000 2005
Stra
tifie
d M
ean
Wei
ght p
er T
ow (k
g)
0.0
0.5
1.0
1.5
2.0
2.5
3.0
Sw
ept A
rea
Bio
mas
s (m
t)
0
200
400
600
800
10005-Year Average Swept Area Biomass
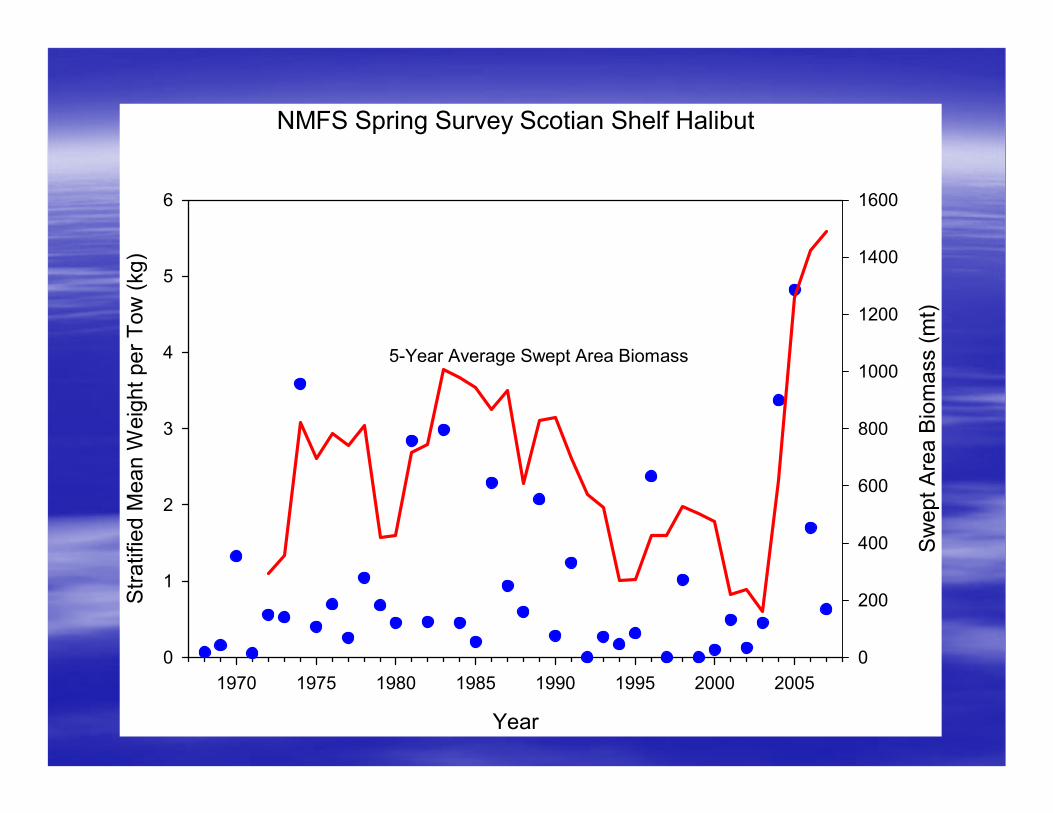
NMFS Spring Survey Scotian Shelf Halibut
Year
1970 1975 1980 1985 1990 1995 2000 2005
Stra
tifie
d M
ean
Wei
ght p
er T
ow (k
g)
0
1
2
3
4
5
6
Sw
ept A
rea
Bio
mas
s (m
t)
0
200
400
600
800
1000
1200
1400
1600
5-Year Average Swept Area Biomass

Halibut von Bertalanffy Growth CurvePooled Data Males
Age
0 5 10 15 20 25 30
Leng
th (c
m)
0
50
100
150
200
