atlantic multi-decadal oscillation covaries with agulhas leakage · the reconstructed 145-year-long...
TRANSCRIPT
ARTICLE
Received 29 Jul 2015 | Accepted 30 Oct 2015 | Published 10 Dec 2015
Atlantic multi-decadal oscillation covarieswith Agulhas leakageArne Biastoch1, Jonathan V. Durgadoo1, Adele K. Morrison2, Erik van Sebille3,4,
Wilbert Weijer5 & Stephen M. Griffies6
The interoceanic transfer of seawater between the Indian Ocean and the Atlantic, ‘Agulhas
leakage’, forms a choke point for the overturning circulation in the global ocean. Here, by
combining output from a series of high-resolution ocean and climate models with in situ and
satellite observations, we construct a time series of Agulhas leakage for the period
1870–2014. The time series demonstrates the impact of Southern Hemisphere westerlies on
decadal timescales. Agulhas leakage shows a correlation with the Atlantic Multi-decadal
Oscillation on multi-decadal timescales; the former leading by 15 years. This is relevant for
climate in the North Atlantic.
DOI: 10.1038/ncomms10082 OPEN
1 GEOMAR Helmholtz Centre for Ocean Research Kiel, Dusternbrooker Weg 20, 24105 Kiel, Germany. 2 Atmospheric and Oceanic Sciences Program,Princeton University, 300 Forrestal Road, Princeton, New Jersey 08544, USA. 3 Climate Change Research Centre & ARC Centre of Excellence for ClimateSystem Science, University of New South Wales, Sydney, New South Wales 2010, Australia. 4 Grantham Institute & Department of Physics, Imperial CollegeLondon, London SW7 2AZ, UK. 5 Los Alamos National Laboratory, Los Alamos, New Mexico 87545, USA. 6 NOAA Geophysical Fluid Dynamics Lab, 201Forrestal Road, Princeton, New Jersey 08542, USA. Correspondence and requests for materials should be addressed to A.B. (email: [email protected]).
NATURE COMMUNICATIONS | 6:10082 | DOI: 10.1038/ncomms10082 | www.nature.com/naturecommunications 1
The global overturning circulation (GOC) is key forthe oceanic redistribution of heat and carbon, andinfluences global climate1. Along its downwelling limbs,
anthropogenic trace gases are removed from the atmosphere andstored in the deep ocean on timescales of centuries to millennia.In-depth understanding of the driving mechanisms of the GOCand its temporal evolution are thus fundamental goals of climatescience research. Since the original ‘Conveyor Belt’ concept2, thescheme of the GOC has been redrawn and refined, now revealingless coherent pathways for both upper and deeper limbs3,4.Despite a more complex picture, key regions still exist wherethe GOC converges, and where regionally constrained andsmall-scale processes can have a large-scale impact. Such chokepoints include passages through the Indonesian Throughflow andthe Agulhas region for the upper branch and gaps in theGreenland–Scotland Ridge for the deeper branch.
In the Agulhas region around South Africa, part of the returnflow of surface and intermediate waters from the Indian Oceanleaks into the Atlantic, providing heat and salt that is advectedtowards the deep-water formation regions of the subpolar andsubarctic North Atlantic5. The Agulhas Current6 flows polewardas a western boundary current and abruptly turns eastward intothe Agulhas Return Current. In so-doing, Agulhas rings are shed;a process that is modulated by upstream mesoscale features,resulting in an episodic interoceanic transport7. Models suggestthat the amount of Agulhas Current waters ending up in theAtlantic Ocean, ‘Agulhas leakage’, strongly varies on inter-annualto decadal timescales8.
Despite the regional convergence of the GOC south of Africa,Agulhas leakage is not easily quantifiable with ocean observationsdue to its highly variable spatio-temporal character7. Oceanobservations of this inter-ocean flow with surface driftersand subsurface floats only provide a rough time-mean estimateof 15 Sv (1 Sv¼ 106 m3 s� 1)9. Agulhas leakage has additionallybeen estimated using surface circulation from satellite altimetryfor the past two decades10,11, and using a decade of hydrographycollected by autonomous floats12. An upward trend in eddykinetic energy based on sea surface height (SSH) in the CapeBasin has been used to argue for an increase in Agulhas leakage13.However, it has also been pointed out that the evolution of thenon-eddying component is an important contribution to Agulhasleakage; its trend is much more unclear14. Because of its climaticrelevance, a long-term time series is desirable, but cannot beobtained from the sparsely observed three-dimensional (3D)description of velocity and hydrography around southern Africa.However, while the full-depth structure of temperature is notavailable, the surface component is. Due to its easy access, fromsimple bucket to modern satellite measurements, sea surfacetemperature (SST) compilations provide one of the longestobservational records available for the global ocean.
Here we combine SST with a series of ocean and climate modelsimulations to construct a 145-year-long time series of Agulhasleakage. We show that Agulhas leakage is decadally modulated bywind-driven dynamics in the Southern Hemisphere and that theleakage covaries with a key mode of climate variability in theNorth Atlantic.
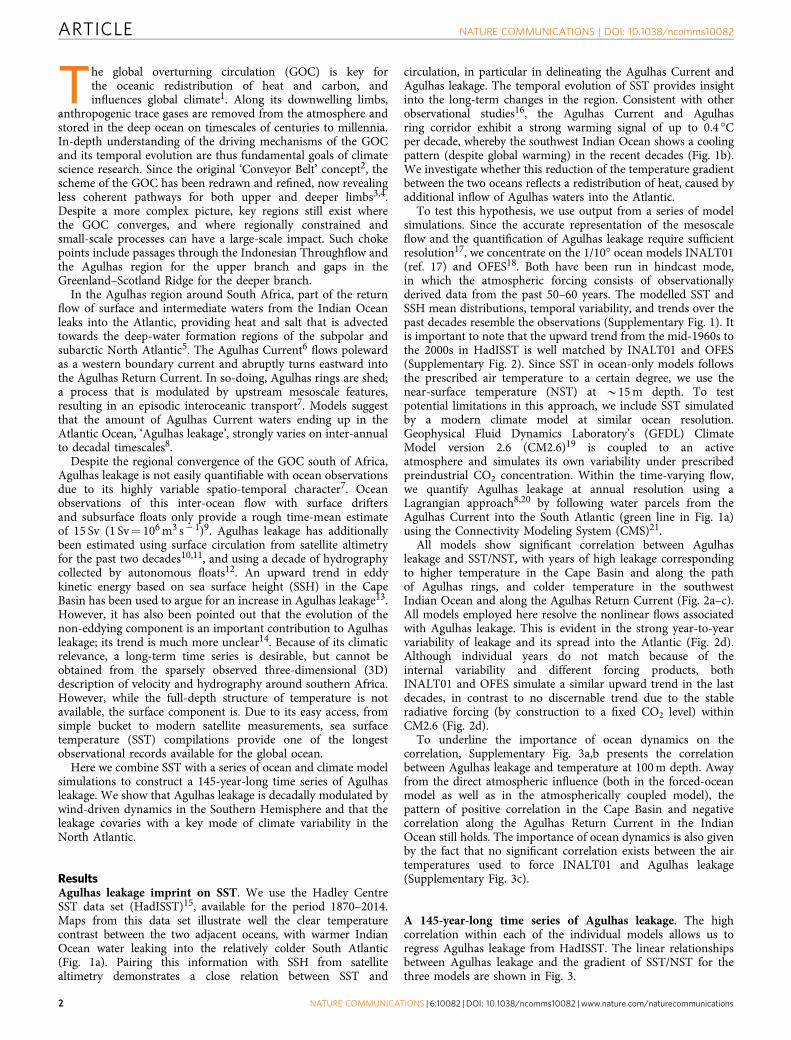
ResultsAgulhas leakage imprint on SST. We use the Hadley CentreSST data set (HadISST)15, available for the period 1870–2014.Maps from this data set illustrate well the clear temperaturecontrast between the two adjacent oceans, with warmer IndianOcean water leaking into the relatively colder South Atlantic(Fig. 1a). Pairing this information with SSH from satellitealtimetry demonstrates a close relation between SST and
circulation, in particular in delineating the Agulhas Current andAgulhas leakage. The temporal evolution of SST provides insightinto the long-term changes in the region. Consistent with otherobservational studies16, the Agulhas Current and Agulhasring corridor exhibit a strong warming signal of up to 0.4 �Cper decade, whereby the southwest Indian Ocean shows a coolingpattern (despite global warming) in the recent decades (Fig. 1b).We investigate whether this reduction of the temperature gradientbetween the two oceans reflects a redistribution of heat, caused byadditional inflow of Agulhas waters into the Atlantic.
To test this hypothesis, we use output from a series of modelsimulations. Since the accurate representation of the mesoscaleflow and the quantification of Agulhas leakage require sufficientresolution17, we concentrate on the 1/10� ocean models INALT01(ref. 17) and OFES18. Both have been run in hindcast mode,in which the atmospheric forcing consists of observationallyderived data from the past 50–60 years. The modelled SST andSSH mean distributions, temporal variability, and trends over thepast decades resemble the observations (Supplementary Fig. 1). Itis important to note that the upward trend from the mid-1960s tothe 2000s in HadISST is well matched by INALT01 and OFES(Supplementary Fig. 2). Since SST in ocean-only models followsthe prescribed air temperature to a certain degree, we use thenear-surface temperature (NST) at B15 m depth. To testpotential limitations in this approach, we include SST simulatedby a modern climate model at similar ocean resolution.Geophysical Fluid Dynamics Laboratory’s (GFDL) ClimateModel version 2.6 (CM2.6)19 is coupled to an activeatmosphere and simulates its own variability under prescribedpreindustrial CO2 concentration. Within the time-varying flow,we quantify Agulhas leakage at annual resolution using aLagrangian approach8,20 by following water parcels from theAgulhas Current into the South Atlantic (green line in Fig. 1a)using the Connectivity Modeling System (CMS)21.
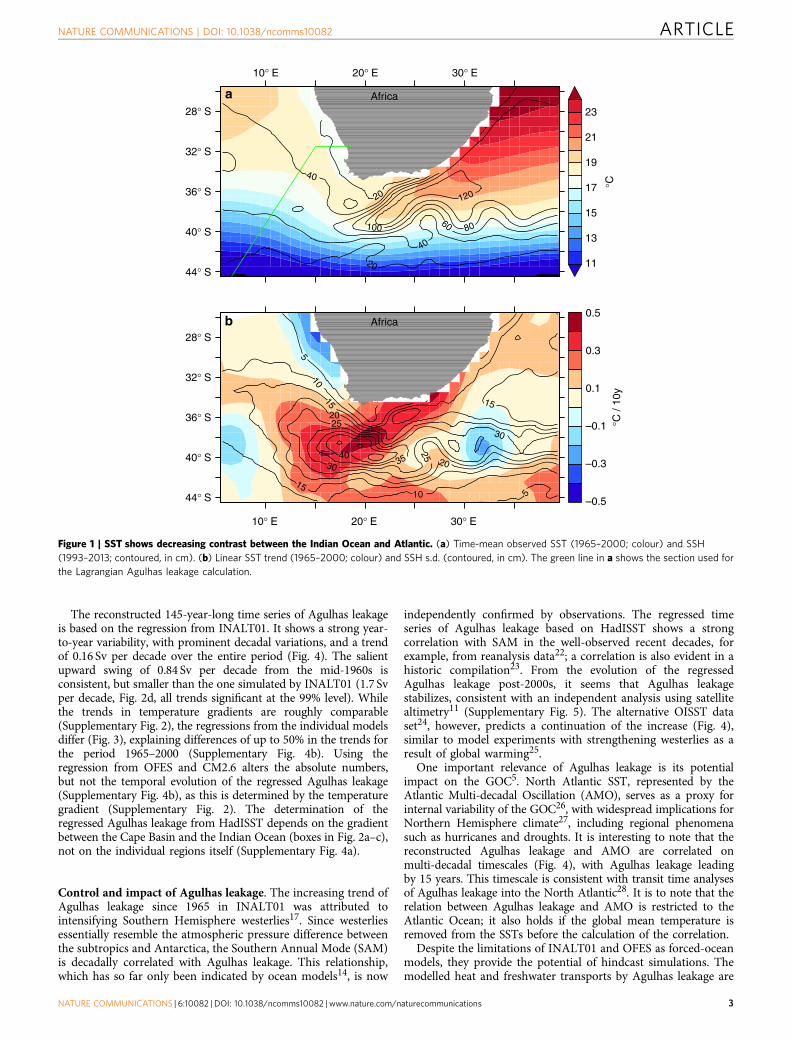
All models show significant correlation between Agulhasleakage and SST/NST, with years of high leakage correspondingto higher temperature in the Cape Basin and along the pathof Agulhas rings, and colder temperature in the southwestIndian Ocean and along the Agulhas Return Current (Fig. 2a–c).All models employed here resolve the nonlinear flows associatedwith Agulhas leakage. This is evident in the strong year-to-yearvariability of leakage and its spread into the Atlantic (Fig. 2d).Although individual years do not match because of theinternal variability and different forcing products, bothINALT01 and OFES simulate a similar upward trend in the lastdecades, in contrast to no discernable trend due to the stableradiative forcing (by construction to a fixed CO2 level) withinCM2.6 (Fig. 2d).
To underline the importance of ocean dynamics on thecorrelation, Supplementary Fig. 3a,b presents the correlationbetween Agulhas leakage and temperature at 100 m depth. Awayfrom the direct atmospheric influence (both in the forced-oceanmodel as well as in the atmospherically coupled model), thepattern of positive correlation in the Cape Basin and negativecorrelation along the Agulhas Return Current in the IndianOcean still holds. The importance of ocean dynamics is also givenby the fact that no significant correlation exists between the airtemperatures used to force INALT01 and Agulhas leakage(Supplementary Fig. 3c).
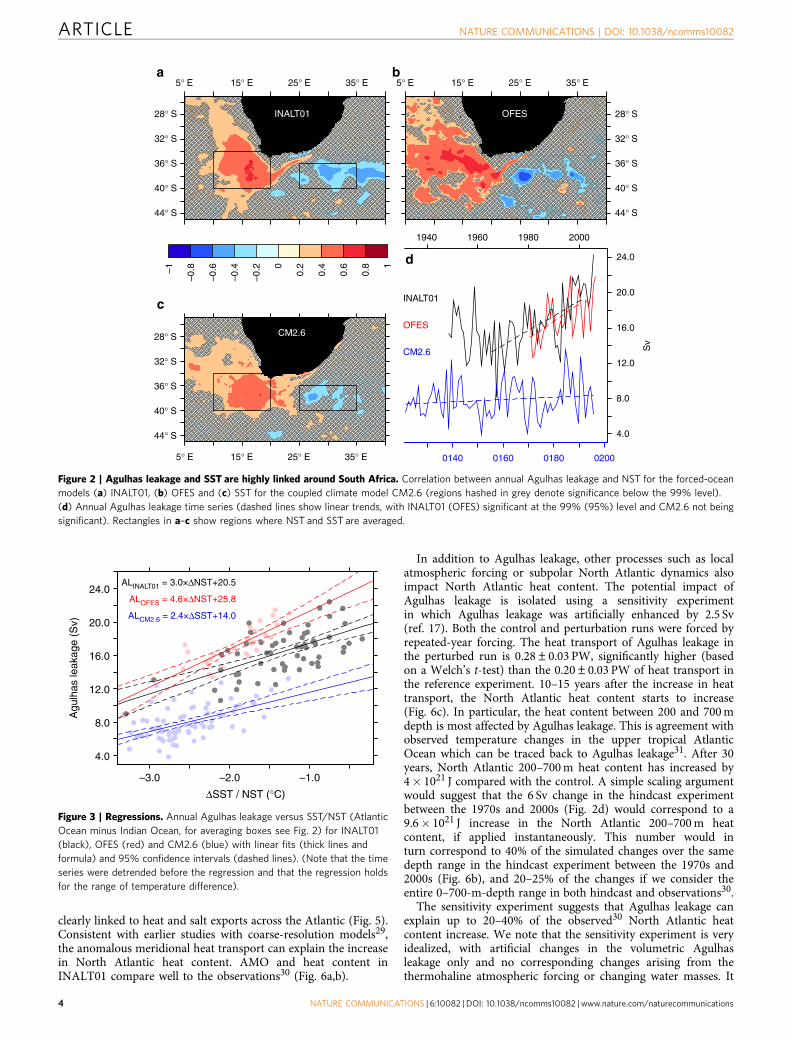
A 145-year-long time series of Agulhas leakage. The highcorrelation within each of the individual models allows us toregress Agulhas leakage from HadISST. The linear relationshipsbetween Agulhas leakage and the gradient of SST/NST for thethree models are shown in Fig. 3.
ARTICLE NATURE COMMUNICATIONS | DOI: 10.1038/ncomms10082
2 NATURE COMMUNICATIONS | 6:10082 | DOI: 10.1038/ncomms10082 | www.nature.com/naturecommunications
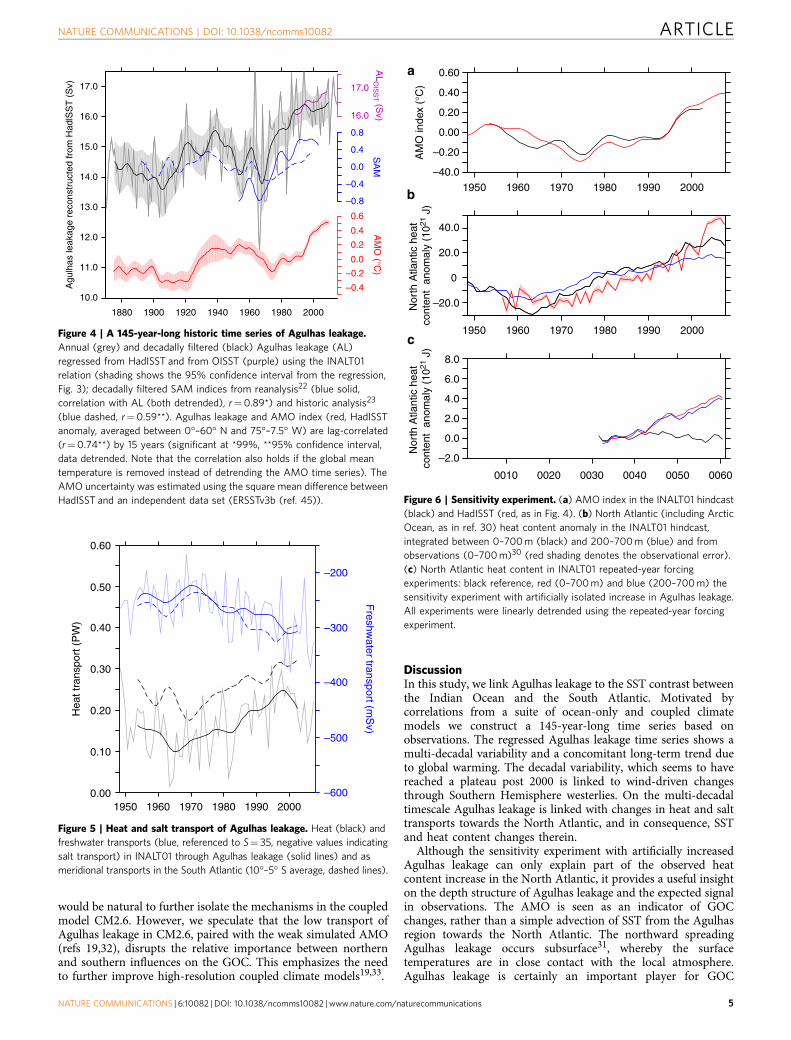
The reconstructed 145-year-long time series of Agulhas leakageis based on the regression from INALT01. It shows a strong year-to-year variability, with prominent decadal variations, and a trendof 0.16 Sv per decade over the entire period (Fig. 4). The salientupward swing of 0.84 Sv per decade from the mid-1960s isconsistent, but smaller than the one simulated by INALT01 (1.7 Svper decade, Fig. 2d, all trends significant at the 99% level). Whilethe trends in temperature gradients are roughly comparable(Supplementary Fig. 2), the regressions from the individual modelsdiffer (Fig. 3), explaining differences of up to 50% in the trends forthe period 1965–2000 (Supplementary Fig. 4b). Using theregression from OFES and CM2.6 alters the absolute numbers,but not the temporal evolution of the regressed Agulhas leakage(Supplementary Fig. 4b), as this is determined by the temperaturegradient (Supplementary Fig. 2). The determination of theregressed Agulhas leakage from HadISST depends on the gradientbetween the Cape Basin and the Indian Ocean (boxes in Fig. 2a–c),not on the individual regions itself (Supplementary Fig. 4a).
Control and impact of Agulhas leakage. The increasing trend ofAgulhas leakage since 1965 in INALT01 was attributed tointensifying Southern Hemisphere westerlies17. Since westerliesessentially resemble the atmospheric pressure difference betweenthe subtropics and Antarctica, the Southern Annual Mode (SAM)is decadally correlated with Agulhas leakage. This relationship,which has so far only been indicated by ocean models14, is now
independently confirmed by observations. The regressed timeseries of Agulhas leakage based on HadISST shows a strongcorrelation with SAM in the well-observed recent decades, forexample, from reanalysis data22; a correlation is also evident in ahistoric compilation23. From the evolution of the regressedAgulhas leakage post-2000s, it seems that Agulhas leakagestabilizes, consistent with an independent analysis using satellitealtimetry11 (Supplementary Fig. 5). The alternative OISST dataset24, however, predicts a continuation of the increase (Fig. 4),similar to model experiments with strengthening westerlies as aresult of global warming25.
One important relevance of Agulhas leakage is its potentialimpact on the GOC5. North Atlantic SST, represented by theAtlantic Multi-decadal Oscillation (AMO), serves as a proxy forinternal variability of the GOC26, with widespread implications forNorthern Hemisphere climate27, including regional phenomenasuch as hurricanes and droughts. It is interesting to note that thereconstructed Agulhas leakage and AMO are correlated onmulti-decadal timescales (Fig. 4), with Agulhas leakage leadingby 15 years. This timescale is consistent with transit time analysesof Agulhas leakage into the North Atlantic28. It is to note that therelation between Agulhas leakage and AMO is restricted to theAtlantic Ocean; it also holds if the global mean temperature isremoved from the SSTs before the calculation of the correlation.
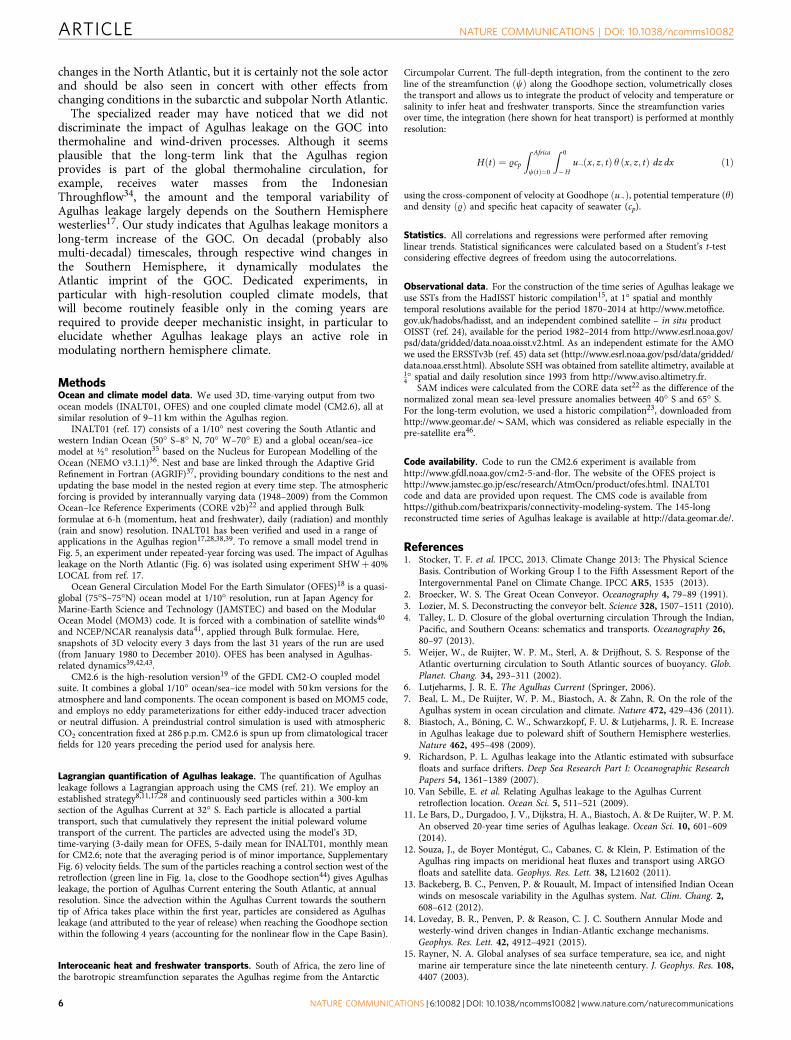
Despite the limitations of INALT01 and OFES as forced-oceanmodels, they provide the potential of hindcast simulations. Themodelled heat and freshwater transports by Agulhas leakage are
28° S
10° E 20° E
Africa
Africa
2025
40
10
35
15
30
20
5
25
40
510
15
15
30
20
20
60 80
120
40
100
30° E
23
21
19
17
15
13
11
0.5
0.3
0.1
–0.1
–0.3
–0.5
10° E 20° E 30° E
°C°C
/ 10
y
32° S
36° S
40° S
44° S
28° S
32° S
36° S
40° S
44° S
Figure 1 | SST shows decreasing contrast between the Indian Ocean and Atlantic. (a) Time-mean observed SST (1965–2000; colour) and SSH
(1993–2013; contoured, in cm). (b) Linear SST trend (1965–2000; colour) and SSH s.d. (contoured, in cm). The green line in a shows the section used for
the Lagrangian Agulhas leakage calculation.
NATURE COMMUNICATIONS | DOI: 10.1038/ncomms10082 ARTICLE
NATURE COMMUNICATIONS | 6:10082 | DOI: 10.1038/ncomms10082 | www.nature.com/naturecommunications 3
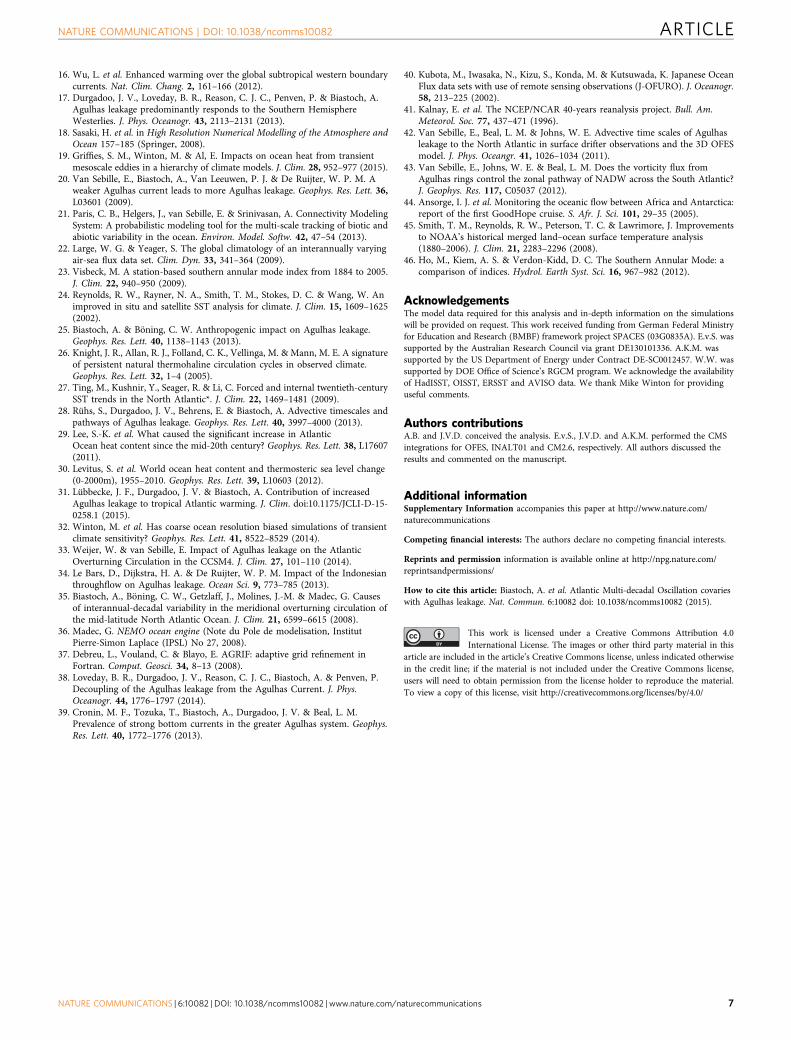
clearly linked to heat and salt exports across the Atlantic (Fig. 5).Consistent with earlier studies with coarse-resolution models29,the anomalous meridional heat transport can explain the increasein North Atlantic heat content. AMO and heat content inINALT01 compare well to the observations30 (Fig. 6a,b).
In addition to Agulhas leakage, other processes such as localatmospheric forcing or subpolar North Atlantic dynamics alsoimpact North Atlantic heat content. The potential impact ofAgulhas leakage is isolated using a sensitivity experimentin which Agulhas leakage was artificially enhanced by 2.5 Sv(ref. 17). Both the control and perturbation runs were forced byrepeated-year forcing. The heat transport of Agulhas leakage inthe perturbed run is 0.28±0.03 PW, significantly higher (basedon a Welch’s t-test) than the 0.20±0.03 PW of heat transport inthe reference experiment. 10–15 years after the increase in heattransport, the North Atlantic heat content starts to increase(Fig. 6c). In particular, the heat content between 200 and 700 mdepth is most affected by Agulhas leakage. This is agreement withobserved temperature changes in the upper tropical AtlanticOcean which can be traced back to Agulhas leakage31. After 30years, North Atlantic 200–700 m heat content has increased by4� 1021 J compared with the control. A simple scaling argumentwould suggest that the 6 Sv change in the hindcast experimentbetween the 1970s and 2000s (Fig. 2d) would correspond to a9.6� 1021 J increase in the North Atlantic 200–700 m heatcontent, if applied instantaneously. This number would inturn correspond to 40% of the simulated changes over the samedepth range in the hindcast experiment between the 1970s and2000s (Fig. 6b), and 20–25% of the changes if we consider theentire 0–700-m-depth range in both hindcast and observations30.
The sensitivity experiment suggests that Agulhas leakage canexplain up to 20–40% of the observed30 North Atlantic heatcontent increase. We note that the sensitivity experiment is veryidealized, with artificial changes in the volumetric Agulhasleakage only and no corresponding changes arising from thethermohaline atmospheric forcing or changing water masses. It
28° S
5° E 15° E 25° E 35° E
5° E 15° E 25° E 35° E
5° E 15° E 25° E 35° E
32° S
36° S
40° S
44° S
–1
–0.8
–0.6
–0.4
–0.2 0
0.2
0.4
0.6
0.8 1
28° S
32° S
36° S
40° S
44° S
28° S
32° S
36° S
40° S
44° S
1940 1960 1980 2000
Sv
24.0
20.0
16.0
12.0
8.0
4.0
0140
CM2.6
CM2.6
INALT01 OFES
OFES
INALT01
0160 0180 0200
Figure 2 | Agulhas leakage and SST are highly linked around South Africa. Correlation between annual Agulhas leakage and NST for the forced-ocean
models (a) INALT01, (b) OFES and (c) SST for the coupled climate model CM2.6 (regions hashed in grey denote significance below the 99% level).
(d) Annual Agulhas leakage time series (dashed lines show linear trends, with INALT01 (OFES) significant at the 99% (95%) level and CM2.6 not being
significant). Rectangles in a–c show regions where NST and SST are averaged.
24.0ALINALT01 = 3.0×ΔNST+20.5
ALOFES = 4.6×ΔNST+25.8
ALCM2.6 = 2.4×ΔSST+14.020.0
16.0
12.0
8.0
4.0
–3.0 –2.0 –1.0
Agu
lhas
leak
age
(Sv)
ΔSST / NST (°C)
Figure 3 | Regressions. Annual Agulhas leakage versus SST/NST (Atlantic
Ocean minus Indian Ocean, for averaging boxes see Fig. 2) for INALT01
(black), OFES (red) and CM2.6 (blue) with linear fits (thick lines and
formula) and 95% confidence intervals (dashed lines). (Note that the time
series were detrended before the regression and that the regression holds
for the range of temperature difference).
ARTICLE NATURE COMMUNICATIONS | DOI: 10.1038/ncomms10082
4 NATURE COMMUNICATIONS | 6:10082 | DOI: 10.1038/ncomms10082 | www.nature.com/naturecommunications
would be natural to further isolate the mechanisms in the coupledmodel CM2.6. However, we speculate that the low transport ofAgulhas leakage in CM2.6, paired with the weak simulated AMO(refs 19,32), disrupts the relative importance between northernand southern influences on the GOC. This emphasizes the needto further improve high-resolution coupled climate models19,33.
DiscussionIn this study, we link Agulhas leakage to the SST contrast betweenthe Indian Ocean and the South Atlantic. Motivated bycorrelations from a suite of ocean-only and coupled climatemodels we construct a 145-year-long time series based onobservations. The regressed Agulhas leakage time series shows amulti-decadal variability and a concomitant long-term trend dueto global warming. The decadal variability, which seems to havereached a plateau post 2000 is linked to wind-driven changesthrough Southern Hemisphere westerlies. On the multi-decadaltimescale Agulhas leakage is linked with changes in heat and salttransports towards the North Atlantic, and in consequence, SSTand heat content changes therein.
Although the sensitivity experiment with artificially increasedAgulhas leakage can only explain part of the observed heatcontent increase in the North Atlantic, it provides a useful insighton the depth structure of Agulhas leakage and the expected signalin observations. The AMO is seen as an indicator of GOCchanges, rather than a simple advection of SST from the Agulhasregion towards the North Atlantic. The northward spreadingAgulhas leakage occurs subsurface31, whereby the surfacetemperatures are in close contact with the local atmosphere.Agulhas leakage is certainly an important player for GOC
17.0
16.0
15.0
14.0
13.0
12.0
11.0
10.0
1880 1900 1920 1940 1960 1980 2000
0.6
0.4
0.2
0.0
–0.2
AM
O (°C
)S
AM
0.8
17.0
16.0
AL
OIS
ST (S
v)
0.4
0.0
–0.4
–0.8
–0.4Agu
lhas
leak
age
reco
nstr
ucte
d fr
om H
adlS
ST
(S
v)
Figure 4 | A 145-year-long historic time series of Agulhas leakage.
Annual (grey) and decadally filtered (black) Agulhas leakage (AL)
regressed from HadISST and from OISST (purple) using the INALT01
relation (shading shows the 95% confidence interval from the regression,
Fig. 3); decadally filtered SAM indices from reanalysis22 (blue solid,
correlation with AL (both detrended), r¼0.89*) and historic analysis23
(blue dashed, r¼0.59**). Agulhas leakage and AMO index (red, HadISST
anomaly, averaged between 0�–60� N and 75�–7.5� W) are lag-correlated
(r¼0.74**) by 15 years (significant at *99%, **95% confidence interval,
data detrended. Note that the correlation also holds if the global mean
temperature is removed instead of detrending the AMO time series). The
AMO uncertainty was estimated using the square mean difference between
HadISST and an independent data set (ERSSTv3b (ref. 45)).
0.60
0.50
0.40
0.30
0.20
0.10
0.001950 1960 1970 1980 1990 2000
–600
–500
–400
–300
–200
Freshw
ater transport (mS
v)
Hea
t tra
nspo
rt (
PW
)
Figure 5 | Heat and salt transport of Agulhas leakage. Heat (black) and
freshwater transports (blue, referenced to S¼ 35, negative values indicating
salt transport) in INALT01 through Agulhas leakage (solid lines) and as
meridional transports in the South Atlantic (10�–5� S average, dashed lines).
AM
O in
dex
(°C
)N
orth
Atla
ntic
hea
t co
nten
t an
omal
y (1
021 J
)N
orth
Atla
ntic
hea
t co
nten
t an
omal
y (1
021 J
)
8.0
40.0
–40.0
–0.20
0.00
0.20
0.40
0.60
20.0
–20.0
0
6.0
4.0
2.0
0.0
–2.0
0010
1950 1960 1970 1980 1990 2000
1950 1960 1970 1980 1990 2000
0020 0030 0040 0050 0060
Figure 6 | Sensitivity experiment. (a) AMO index in the INALT01 hindcast
(black) and HadISST (red, as in Fig. 4). (b) North Atlantic (including Arctic
Ocean, as in ref. 30) heat content anomaly in the INALT01 hindcast,
integrated between 0–700 m (black) and 200–700 m (blue) and from
observations (0–700 m)30 (red shading denotes the observational error).
(c) North Atlantic heat content in INALT01 repeated-year forcing
experiments: black reference, red (0–700 m) and blue (200–700 m) the
sensitivity experiment with artificially isolated increase in Agulhas leakage.
All experiments were linearly detrended using the repeated-year forcing
experiment.
NATURE COMMUNICATIONS | DOI: 10.1038/ncomms10082 ARTICLE
NATURE COMMUNICATIONS | 6:10082 | DOI: 10.1038/ncomms10082 | www.nature.com/naturecommunications 5
changes in the North Atlantic, but it is certainly not the sole actorand should be also seen in concert with other effects fromchanging conditions in the subarctic and subpolar North Atlantic.
The specialized reader may have noticed that we did notdiscriminate the impact of Agulhas leakage on the GOC intothermohaline and wind-driven processes. Although it seemsplausible that the long-term link that the Agulhas regionprovides is part of the global thermohaline circulation, forexample, receives water masses from the IndonesianThroughflow34, the amount and the temporal variability ofAgulhas leakage largely depends on the Southern Hemispherewesterlies17. Our study indicates that Agulhas leakage monitors along-term increase of the GOC. On decadal (probably alsomulti-decadal) timescales, through respective wind changes inthe Southern Hemisphere, it dynamically modulates theAtlantic imprint of the GOC. Dedicated experiments, inparticular with high-resolution coupled climate models, thatwill become routinely feasible only in the coming years arerequired to provide deeper mechanistic insight, in particular toelucidate whether Agulhas leakage plays an active role inmodulating northern hemisphere climate.
MethodsOcean and climate model data. We used 3D, time-varying output from twoocean models (INALT01, OFES) and one coupled climate model (CM2.6), all atsimilar resolution of 9–11 km within the Agulhas region.
INALT01 (ref. 17) consists of a 1/10� nest covering the South Atlantic andwestern Indian Ocean (50� S–8� N, 70� W–70� E) and a global ocean/sea–icemodel at ½� resolution35 based on the Nucleus for European Modelling of theOcean (NEMO v3.1.1)36. Nest and base are linked through the Adaptive GridRefinement in Fortran (AGRIF)37, providing boundary conditions to the nest andupdating the base model in the nested region at every time step. The atmosphericforcing is provided by interannually varying data (1948–2009) from the CommonOcean–Ice Reference Experiments (CORE v2b)22 and applied through Bulkformulae at 6-h (momentum, heat and freshwater), daily (radiation) and monthly(rain and snow) resolution. INALT01 has been verified and used in a range ofapplications in the Agulhas region17,28,38,39. To remove a small model trend inFig. 5, an experiment under repeated-year forcing was used. The impact of Agulhasleakage on the North Atlantic (Fig. 6) was isolated using experiment SHWþ 40%LOCAL from ref. 17.
Ocean General Circulation Model For the Earth Simulator (OFES)18 is a quasi-global (75�S–75�N) ocean model at 1/10� resolution, run at Japan Agency forMarine-Earth Science and Technology (JAMSTEC) and based on the ModularOcean Model (MOM3) code. It is forced with a combination of satellite winds40
and NCEP/NCAR reanalysis data41, applied through Bulk formulae. Here,snapshots of 3D velocity every 3 days from the last 31 years of the run are used(from January 1980 to December 2010). OFES has been analysed in Agulhas-related dynamics39,42,43.
CM2.6 is the high-resolution version19 of the GFDL CM2-O coupled modelsuite. It combines a global 1/10� ocean/sea–ice model with 50 km versions for theatmosphere and land components. The ocean component is based on MOM5 code,and employs no eddy parameterizations for either eddy-induced tracer advectionor neutral diffusion. A preindustrial control simulation is used with atmosphericCO2 concentration fixed at 286 p.p.m. CM2.6 is spun up from climatological tracerfields for 120 years preceding the period used for analysis here.
Lagrangian quantification of Agulhas leakage. The quantification of Agulhasleakage follows a Lagrangian approach using the CMS (ref. 21). We employ anestablished strategy8,11,17,28 and continuously seed particles within a 300-kmsection of the Agulhas Current at 32� S. Each particle is allocated a partialtransport, such that cumulatively they represent the initial poleward volumetransport of the current. The particles are advected using the model’s 3D,time-varying (3-daily mean for OFES, 5-daily mean for INALT01, monthly meanfor CM2.6; note that the averaging period is of minor importance, SupplementaryFig. 6) velocity fields. The sum of the particles reaching a control section west of theretroflection (green line in Fig. 1a, close to the Goodhope section44) gives Agulhasleakage, the portion of Agulhas Current entering the South Atlantic, at annualresolution. Since the advection within the Agulhas Current towards the southerntip of Africa takes place within the first year, particles are considered as Agulhasleakage (and attributed to the year of release) when reaching the Goodhope sectionwithin the following 4 years (accounting for the nonlinear flow in the Cape Basin).
Interoceanic heat and freshwater transports. South of Africa, the zero line ofthe barotropic streamfunction separates the Agulhas regime from the Antarctic
Circumpolar Current. The full-depth integration, from the continent to the zeroline of the streamfunction cð Þ along the Goodhope section, volumetrically closesthe transport and allows us to integrate the product of velocity and temperature orsalinity to infer heat and freshwater transports. Since the streamfunction variesover time, the integration (here shown for heat transport) is performed at monthlyresolution:
H tð Þ ¼ Rcp
Z Africa
c tð Þ¼0
Z 0
�Hu: x; z; tð Þ y x; z; tð Þ dz dx ð1Þ
using the cross-component of velocity at Goodhope u:ð Þ, potential temperature (y)and density Rð Þ and specific heat capacity of seawater (cp).
Statistics. All correlations and regressions were performed after removinglinear trends. Statistical significances were calculated based on a Student’s t-testconsidering effective degrees of freedom using the autocorrelations.
Observational data. For the construction of the time series of Agulhas leakage weuse SSTs from the HadISST historic compilation15, at 1� spatial and monthlytemporal resolutions available for the period 1870–2014 at http://www.metoffice.gov.uk/hadobs/hadisst, and an independent combined satellite – in situ productOISST (ref. 24), available for the period 1982–2014 from http://www.esrl.noaa.gov/psd/data/gridded/data.noaa.oisst.v2.html. As an independent estimate for the AMOwe used the ERSSTv3b (ref. 45) data set (http://www.esrl.noaa.gov/psd/data/gridded/data.noaa.ersst.html). Absolute SSH was obtained from satellite altimetry, available at14� spatial and daily resolution since 1993 from http://www.aviso.altimetry.fr.
SAM indices were calculated from the CORE data set22 as the difference of thenormalized zonal mean sea-level pressure anomalies between 40� S and 65� S.For the long-term evolution, we used a historic compilation23, downloaded fromhttp://www.geomar.de/BSAM, which was considered as reliable especially in thepre-satellite era46.
Code availability. Code to run the CM2.6 experiment is available fromhttp://www.gfdl.noaa.gov/cm2-5-and-flor. The website of the OFES project ishttp://www.jamstec.go.jp/esc/research/AtmOcn/product/ofes.html. INALT01code and data are provided upon request. The CMS code is available fromhttps://github.com/beatrixparis/connectivity-modeling-system. The 145-longreconstructed time series of Agulhas leakage is available at http://data.geomar.de/.
References1. Stocker, T. F. et al. IPCC, 2013. Climate Change 2013: The Physical Science
Basis. Contribution of Working Group I to the Fifth Assessment Report of theIntergovernmental Panel on Climate Change. IPCC AR5, 1535 (2013).
2. Broecker, W. S. The Great Ocean Conveyor. Oceanography 4, 79–89 (1991).3. Lozier, M. S. Deconstructing the conveyor belt. Science 328, 1507–1511 (2010).4. Talley, L. D. Closure of the global overturning circulation Through the Indian,
Pacific, and Southern Oceans: schematics and transports. Oceanography 26,80–97 (2013).
5. Weijer, W., de Ruijter, W. P. M., Sterl, A. & Drijfhout, S. S. Response of theAtlantic overturning circulation to South Atlantic sources of buoyancy. Glob.Planet. Chang. 34, 293–311 (2002).
6. Lutjeharms, J. R. E. The Agulhas Current (Springer, 2006).7. Beal, L. M., De Ruijter, W. P. M., Biastoch, A. & Zahn, R. On the role of the
Agulhas system in ocean circulation and climate. Nature 472, 429–436 (2011).8. Biastoch, A., Boning, C. W., Schwarzkopf, F. U. & Lutjeharms, J. R. E. Increase
in Agulhas leakage due to poleward shift of Southern Hemisphere westerlies.Nature 462, 495–498 (2009).
9. Richardson, P. L. Agulhas leakage into the Atlantic estimated with subsurfacefloats and surface drifters. Deep Sea Research Part I: Oceanographic ResearchPapers 54, 1361–1389 (2007).
10. Van Sebille, E. et al. Relating Agulhas leakage to the Agulhas Currentretroflection location. Ocean Sci. 5, 511–521 (2009).
11. Le Bars, D., Durgadoo, J. V., Dijkstra, H. A., Biastoch, A. & De Ruijter, W. P. M.An observed 20-year time series of Agulhas leakage. Ocean Sci. 10, 601–609(2014).
12. Souza, J., de Boyer Montegut, C., Cabanes, C. & Klein, P. Estimation of theAgulhas ring impacts on meridional heat fluxes and transport using ARGOfloats and satellite data. Geophys. Res. Lett. 38, L21602 (2011).
13. Backeberg, B. C., Penven, P. & Rouault, M. Impact of intensified Indian Oceanwinds on mesoscale variability in the Agulhas system. Nat. Clim. Chang. 2,608–612 (2012).
14. Loveday, B. R., Penven, P. & Reason, C. J. C. Southern Annular Mode andwesterly-wind driven changes in Indian-Atlantic exchange mechanisms.Geophys. Res. Lett. 42, 4912–4921 (2015).
15. Rayner, N. A. Global analyses of sea surface temperature, sea ice, and nightmarine air temperature since the late nineteenth century. J. Geophys. Res. 108,4407 (2003).
ARTICLE NATURE COMMUNICATIONS | DOI: 10.1038/ncomms10082
6 NATURE COMMUNICATIONS | 6:10082 | DOI: 10.1038/ncomms10082 | www.nature.com/naturecommunications
16. Wu, L. et al. Enhanced warming over the global subtropical western boundarycurrents. Nat. Clim. Chang. 2, 161–166 (2012).
17. Durgadoo, J. V., Loveday, B. R., Reason, C. J. C., Penven, P. & Biastoch, A.Agulhas leakage predominantly responds to the Southern HemisphereWesterlies. J. Phys. Oceanogr. 43, 2113–2131 (2013).
18. Sasaki, H. et al. in High Resolution Numerical Modelling of the Atmosphere andOcean 157–185 (Springer, 2008).
19. Griffies, S. M., Winton, M. & Al, E. Impacts on ocean heat from transientmesoscale eddies in a hierarchy of climate models. J. Clim. 28, 952–977 (2015).
20. Van Sebille, E., Biastoch, A., Van Leeuwen, P. J. & De Ruijter, W. P. M. Aweaker Agulhas current leads to more Agulhas leakage. Geophys. Res. Lett. 36,L03601 (2009).
21. Paris, C. B., Helgers, J., van Sebille, E. & Srinivasan, A. Connectivity ModelingSystem: A probabilistic modeling tool for the multi-scale tracking of biotic andabiotic variability in the ocean. Environ. Model. Softw. 42, 47–54 (2013).
22. Large, W. G. & Yeager, S. The global climatology of an interannually varyingair-sea flux data set. Clim. Dyn. 33, 341–364 (2009).
23. Visbeck, M. A station-based southern annular mode index from 1884 to 2005.J. Clim. 22, 940–950 (2009).
24. Reynolds, R. W., Rayner, N. A., Smith, T. M., Stokes, D. C. & Wang, W. Animproved in situ and satellite SST analysis for climate. J. Clim. 15, 1609–1625(2002).
25. Biastoch, A. & Boning, C. W. Anthropogenic impact on Agulhas leakage.Geophys. Res. Lett. 40, 1138–1143 (2013).
26. Knight, J. R., Allan, R. J., Folland, C. K., Vellinga, M. & Mann, M. E. A signatureof persistent natural thermohaline circulation cycles in observed climate.Geophys. Res. Lett. 32, 1–4 (2005).
27. Ting, M., Kushnir, Y., Seager, R. & Li, C. Forced and internal twentieth-centurySST trends in the North Atlantic*. J. Clim. 22, 1469–1481 (2009).
28. Ruhs, S., Durgadoo, J. V., Behrens, E. & Biastoch, A. Advective timescales andpathways of Agulhas leakage. Geophys. Res. Lett. 40, 3997–4000 (2013).
29. Lee, S.-K. et al. What caused the significant increase in AtlanticOcean heat content since the mid-20th century? Geophys. Res. Lett. 38, L17607(2011).
30. Levitus, S. et al. World ocean heat content and thermosteric sea level change(0-2000m), 1955–2010. Geophys. Res. Lett. 39, L10603 (2012).
31. Lubbecke, J. F., Durgadoo, J. V. & Biastoch, A. Contribution of increasedAgulhas leakage to tropical Atlantic warming. J. Clim. doi:10.1175/JCLI-D-15-0258.1 (2015).
32. Winton, M. et al. Has coarse ocean resolution biased simulations of transientclimate sensitivity? Geophys. Res. Lett. 41, 8522–8529 (2014).
33. Weijer, W. & van Sebille, E. Impact of Agulhas leakage on the AtlanticOverturning Circulation in the CCSM4. J. Clim. 27, 101–110 (2014).
34. Le Bars, D., Dijkstra, H. A. & De Ruijter, W. P. M. Impact of the Indonesianthroughflow on Agulhas leakage. Ocean Sci. 9, 773–785 (2013).
35. Biastoch, A., Boning, C. W., Getzlaff, J., Molines, J.-M. & Madec, G. Causesof interannual-decadal variability in the meridional overturning circulation ofthe mid-latitude North Atlantic Ocean. J. Clim. 21, 6599–6615 (2008).
36. Madec, G. NEMO ocean engine (Note du Pole de modelisation, InstitutPierre-Simon Laplace (IPSL) No 27, 2008).
37. Debreu, L., Vouland, C. & Blayo, E. AGRIF: adaptive grid refinement inFortran. Comput. Geosci. 34, 8–13 (2008).
38. Loveday, B. R., Durgadoo, J. V., Reason, C. J. C., Biastoch, A. & Penven, P.Decoupling of the Agulhas leakage from the Agulhas Current. J. Phys.Oceanogr. 44, 1776–1797 (2014).
39. Cronin, M. F., Tozuka, T., Biastoch, A., Durgadoo, J. V. & Beal, L. M.Prevalence of strong bottom currents in the greater Agulhas system. Geophys.Res. Lett. 40, 1772–1776 (2013).
40. Kubota, M., Iwasaka, N., Kizu, S., Konda, M. & Kutsuwada, K. Japanese OceanFlux data sets with use of remote sensing observations (J-OFURO). J. Oceanogr.58, 213–225 (2002).
41. Kalnay, E. et al. The NCEP/NCAR 40-years reanalysis project. Bull. Am.Meteorol. Soc. 77, 437–471 (1996).
42. Van Sebille, E., Beal, L. M. & Johns, W. E. Advective time scales of Agulhasleakage to the North Atlantic in surface drifter observations and the 3D OFESmodel. J. Phys. Oceangr. 41, 1026–1034 (2011).
43. Van Sebille, E., Johns, W. E. & Beal, L. M. Does the vorticity flux fromAgulhas rings control the zonal pathway of NADW across the South Atlantic?J. Geophys. Res. 117, C05037 (2012).
44. Ansorge, I. J. et al. Monitoring the oceanic flow between Africa and Antarctica:report of the first GoodHope cruise. S. Afr. J. Sci. 101, 29–35 (2005).
45. Smith, T. M., Reynolds, R. W., Peterson, T. C. & Lawrimore, J. Improvementsto NOAA’s historical merged land–ocean surface temperature analysis(1880–2006). J. Clim. 21, 2283–2296 (2008).
46. Ho, M., Kiem, A. S. & Verdon-Kidd, D. C. The Southern Annular Mode: acomparison of indices. Hydrol. Earth Syst. Sci. 16, 967–982 (2012).
AcknowledgementsThe model data required for this analysis and in-depth information on the simulationswill be provided on request. This work received funding from German Federal Ministryfor Education and Research (BMBF) framework project SPACES (03G0835A). E.v.S. wassupported by the Australian Research Council via grant DE130101336. A.K.M. wassupported by the US Department of Energy under Contract DE-SC0012457. W.W. wassupported by DOE Office of Science’s RGCM program. We acknowledge the availabilityof HadISST, OISST, ERSST and AVISO data. We thank Mike Winton for providinguseful comments.
Authors contributionsA.B. and J.V.D. conceived the analysis. E.v.S., J.V.D. and A.K.M. performed the CMSintegrations for OFES, INALT01 and CM2.6, respectively. All authors discussed theresults and commented on the manuscript.
Additional informationSupplementary Information accompanies this paper at http://www.nature.com/naturecommunications
Competing financial interests: The authors declare no competing financial interests.
Reprints and permission information is available online at http://npg.nature.com/reprintsandpermissions/
How to cite this article: Biastoch, A. et al. Atlantic Multi-decadal Oscillation covarieswith Agulhas leakage. Nat. Commun. 6:10082 doi: 10.1038/ncomms10082 (2015).
This work is licensed under a Creative Commons Attribution 4.0International License. The images or other third party material in this
article are included in the article’s Creative Commons license, unless indicated otherwisein the credit line; if the material is not included under the Creative Commons license,users will need to obtain permission from the license holder to reproduce the material.To view a copy of this license, visit http://creativecommons.org/licenses/by/4.0/
NATURE COMMUNICATIONS | DOI: 10.1038/ncomms10082 ARTICLE
NATURE COMMUNICATIONS | 6:10082 | DOI: 10.1038/ncomms10082 | www.nature.com/naturecommunications 7